Embed Size (px)
Citation preview
Epidemiological Tracking and Population Assignment ofthe Non-Clonal Bacterium, Burkholderia pseudomalleiJulia Dale1, Erin P. Price1, Heidie Hornstra1, Joseph D. Busch1, Mark Mayo2, Daniel Godoy3, Vanaporn
Wuthiekanun4, Anthony Baker5, Jeffrey T. Foster1, David M. Wagner1, Apichai Tuanyok1, Jeffrey
Warner5, Brian G. Spratt3, Sharon J. Peacock4,6,7, Bart J. Currie2, Paul Keim1,8, Talima Pearson1*
1 Center for Microbial Genetics and Genomics, Northern Arizona University, Flagstaff, Arizona, United States of America, 2 Menzies School of Health Research and
Northern Territory Clinical School, Royal Darwin Hospital, Darwin, Northern Territory, Australia, 3 Department of Infectious Disease Epidemiology, Imperial College London,
London, United Kingdom, 4 Mahidol-Oxford Tropical Medicine Research Unit, Faculty of Tropical Medicine, Mahidol University, Bangkok, Thailand, 5 Microbiology and
Immunology, School of Veterinary and Biomedical Sciences, James Cook University, Townsville, Queensland, Australia, 6 Department of Microbiology and Immunology,
Faculty of Tropical Medicine, Mahidol University, Bangkok, Thailand, 7 Department of Medicine, University of Cambridge, Cambridge, United Kingdom, 8 Pathogen
Genomics Division, Translational Genomics Research Institute, Phoenix, Arizona, United States of America
Abstract
Rapid assignment of bacterial pathogens into predefined populations is an important first step for epidemiological tracking.For clonal species, a single allele can theoretically define a population. For non-clonal species such as Burkholderiapseudomallei, however, shared allelic states between distantly related isolates make it more difficult to identify populationdefining characteristics. Two distinct B. pseudomallei populations have been previously identified using multilocus sequencetyping (MLST). These populations correlate with the major foci of endemicity (Australia and Southeast Asia). Here, we usemultiple Bayesian approaches to evaluate the compositional robustness of these populations, and provide assignmentresults for MLST sequence types (STs). Our goal was to provide a reference for assigning STs to an established populationwithout the need for further computational analyses. We also provide allele frequency results for each population to enableestimation of population assignment even when novel STs are discovered. The ability for humans and potentiallycontaminated goods to move rapidly across the globe complicates the task of identifying the source of an infection oroutbreak. Population genetic dynamics of B. pseudomallei are particularly complicated relative to other bacterial pathogens,but the work here provides the ability for broad scale population assignment. As there is currently no independentempirical measure of successful population assignment, we provide comprehensive analytical details of our comparisons toenable the reader to evaluate the robustness of population designations and assignments as they pertain to individualresearch questions. Finer scale subdivision and verification of current population compositions will likely be possible withgenotyping data that more comprehensively samples the genome. The approach used here may be valuable for other non-clonal pathogens that lack simple group-defining genetic characteristics and provides a rapid reference for epidemiologistswishing to track the origin of infection without the need to compile population data and learn population assignmentalgorithms.
Citation: Dale J, Price EP, Hornstra H, Busch JD, Mayo M, et al. (2011) Epidemiological Tracking and Population Assignment of the Non-Clonal Bacterium,Burkholderia pseudomallei. PLoS Negl Trop Dis 5(12): e1381. doi:10.1371/journal.pntd.0001381
Editor: Gary Simon, George Washington University, United States of America
Received May 30, 2011; Accepted September 16, 2011; Published December 13, 2011
Copyright: � 2011 Dale et al. This is an open-access article distributed under the terms of the Creative Commons Attribution License, which permits unrestricteduse, distribution, and reproduction in any medium, provided the original author and source are credited.
Funding: This work was supported by the U.S. Department of Homeland Security S&T CB Division Bioforensics R&D Program. VW, SJP, BGS and DG are funded byThe Wellcome Trust. The funders had no role in study design, data collection and analysis, decision to publish, or preparation of the manuscript.
Competing Interests: The authors have declared that no competing interests exist.
* E-mail: [email protected]
Introduction
Burkholderia pseudomallei, the etiologic agent of melioidosis, is
commonly isolated from soil and water in many tropical regions of
the world. Endemic foci of B. pseudomallei predominantly include
Southeast Asia (particularly Thailand) and northern Australia,
although this organism is found sporadically in other equatorial
regions such as South and Central America, Africa, and the Indian
subcontinent [1]. Since infections are most commonly acquired
from the environment, genetic differentiation is expected to occur,
leading to geographic substructure within the bacterial population.
Previous studies have demonstrated that B. pseudomallei populations
from the melioidosis-endemic regions in Southeast Asia and
Australia are not only geographically distinct but exhibit
differences in clinical presentation and genetic features [2,3,4].
For example, differences in clinical manifestations include parotid
abscesses, which are much more prevalent in Thailand (15%) than
Australia (4%). In contrast, genitourinary infections and brainstem
encephalitis are more commonly seen in Australia than Thailand
(15% vs. 2% and 2% vs. ,0.2%, respectively) [4,5]. Differences in
mortality rates also differ greatly between the two endemic regions,
with mortality rates of approximately 50% in Thailand compared
with ,20% in Australia [5]. The difference in mortality rates
could reflect differences in virulence but is probably more likely to
be due to differences in intensive care provisions between the two
regions [6]. Despite these marked differences, none are fully
diagnostic for isolates from specific geographical regions.
Multilocus sequence typing (MLST) [7] is a bacterial genotyp-
ing method that involves the comparison of ,450 bp-long
nucleotide sequences from seven housekeeping genes. An MLST
www.plosntds.org 1 December 2011 | Volume 5 | Issue 12 | e1381
scheme has been developed for B. pseudomallei [8] and 699
sequence types (STs) from isolates and multiple species (as of
November 6th, 2010) populate the public database (http://
bpseudomallei.mlst.net/). These data have shed light on the
population structure of this species. It has been previously
observed that B. pseudomallei STs from Australia and Southeast
Asia are mutually exclusive as phylogenetic analyses show
geographically correlated clusters of STs, although these analyses
failed to group all samples from either region together [9] [10].
Due to relatively low levels of sequence diversity and high levels of
lateral gene transfer among B. pseudomallei isolates [8,11], sequence
data from only seven genes are insufficient for robust phylogenetic
discrimination [11,12]. Pearson et al. therefore used a population
genetics approach to determine that B. pseudomallei STs form two
distinct populations, conforming to the geographic regions of
Southeast Asia and Australia [11]. Despite the phylogenetic
limitations of MLST data, this large public database shows
potential for population assignment using population genetic
analyses.
We further evaluate and update the previous population
assignments [11] by comparing these results with commonly used
assignment algorithms. The program Structure [13] is a Bayesian-
based clustering algorithm that has been used to infer population
structure within genetically diverse bacteria such as Helicobacter
pylori [14]. Comparison of Structure with other population
assignment software allowed us to assess the robustness of our
population assignments. The B. pseudomallei population assignment
results that we provide, along with a probability estimation of each
assignment, can be used as a practical and immediate reference for
melioidosis researchers interested in identifying geographic origins
of B. pseudomallei STs and may serve as a model for other weakly
clonal species.
Methods
MLST datasetThe data used to define populations and evaluate the robustness
of population assignments were downloaded from the B.
pseudomallei MLST database (http://bpseudomallei.mlst.net/) on
January 15th, 2009. The database consisted of 641 B. pseudomallei
STs from 1802 isolates collected over 89 years from 35 countries.
Approximately 44% of these isolates were collected in Southeast
Asia and 53% in Australia and Papua New Guinea. The data were
downloaded again on November 9th, 2010, in order to provide
more updated population assignments and population allele
frequencies for all currently known STs. These most recent data
consist of 664 STs from 1829 isolates, where 44% of these isolates
were collected in Southeast Asia and 53% of the isolates were
collected in Australia and Papua New Guinea. More detailed
information on the geographical sources of isolates representing
each ST can be found in the profiles datasheet in the MLST
database.
Population analyses using StructureThe program Structure [13] (versions 2.2–2.3.1 due to software
updates over the course of this study) was used to analyze allelic
profile data from the original 641 B. pseudomallei STs. Briefly,
Structure uses MLST datasets and a Bayesian approach to identify
population structure and to assign individuals to populations
without a priori population descriptions. A Markov Chain Monte
Carlo simulation of 100,000 iterations with a burn-in period of
30,000 was run to determine the posterior probability of the
number of populations (K). Where K = 2–4, Structure analyses were
repeated eight times and the posterior probabilities from each run
were averaged. For populations of K = 5–17, Structure analyses were
repeated three times and the posterior probabilities averaged.
Fewer repetitions were carried out for these higher K values as
previous work suggests that more populations are not well
supported [11]. The most statistically supported K value was
selected to represent the number of populations among the STs
based on the estimated log (ln) of the probability of the data (ln
P(D)), and the variance exhibited by each K value. All simulations
were carried out using both the ‘‘no admixture’’ [15] and
‘‘admixture’’ models [16] (comparison between these two models
is shown in Supplemental Data Figure S1). The posterior
probability of the data (ln P(D)) for a given value of K might be
expected to peak at the true value of K, however, in our runs there
was no definite peak as ln P(D) increased slightly with an increase
in K. This pattern, along with an increase in the variance of ln P(D)
is common and has been reported by Evanno and colleagues [17]
who suggest that measuring the changes in likelihood is a more
accurate method for estimating the true value of K. We therefore
used DK to determine the optimal K value of the B. pseudomallei
populations. The DK value corresponds with the second order rate
of change of all K values divided by the standard deviations from
each K [17]. Calculation of DK is shown in Supplemental Data
Text S1.
Population analyses using BAPSWe used both BAPS and Structure results to assess population
assignments [18]. BAPS (version 4) is another free software
package for Bayesian inference of genetic structure within a given
dataset [19,20,21,22]. Using the ‘‘clustering of linked loci’’
module, BAPS determines the log likelihood in 10% increments
of different population divisions and subsequently calculates the
most likely K value. Thus, unlike with Structure, K is not selected a
priori. The likelihood of population assignment for each ST is also
calculated by BAPS. For BAPS analyses, we used sequence data
from the seven B. pseudomallei MLST loci. The codon linkage
model and an upward bound of 20 populations were chosen for
the ‘‘clustering of linked loci’’ module. As with Structure, eight
Author Summary
Burkholderia pseudomallei is a soil-dwelling bacterium thatcan infect a large range of hosts. In humans, B.pseudomallei causes melioidosis, and typical routes ofentry include open wounds, inhalation, or ingestion.Clinical features are diverse, although pneumonia andabscess formation are common. High rates of recombina-tion within the genome of this bacterium have confound-ed attempts to match clinical samples to geographicallydefined populations. Here we provide a reference thatsimplifies source attribution issues. We applied populationassignment software to previously generated sequencedata from seven B. pseudomallei genes to define the majorgeographic populations within this species. We evaluatedthe robustness of our results by comparison with twoadditional population assignment programs. We presentthe likelihood that each variant is assigned to a particulargeographic population. This information can be used toassign novel B. pseudomallei isolates to a geographicpopulation without needing to learn and run cumbersomepopulation assignment applications. This method can alsobe used for other bacteria that are difficult to source-attribute due to high levels of genomic variation andrecombination.
Population Assignment of Burkholderia pseudomallei
www.plosntds.org 2 December 2011 | Volume 5 | Issue 12 | e1381
iterations were run where K = 2–4 and three iterations were run
where K = 5–17.
Assessment of Structure and BAPS populationassignments
As there is no empirical measure of determining the accuracy of
population assignments, we further assessed Structure and BAPS
assignments of B. pseudomallei using MLST data, by comparing
individual ST assignments made by Structure and BAPS to the
geographic information listed in the MLST database and to the
likelihood of assignment into each population as calculated by
Genetic Analysis in Excel (GenAlEx) v.6 [23]. We also used
GenAlEx to measure the degree of population differentiation
among populations defined by Structure and BAPS.
GenAlEx is a free Microsoft Excel add-in where datasets can be
analyzed and manipulated without the requirement for multiple
programs. We used the population assignment method in
GenAlEx to determine the likelihood of inclusion in each
population for each ST. Unlike Structure and BAPS, GenAlEx
requires a priori population designations to define population allele
frequencies and subsequently calculate the likelihood of population
assignment for each ST. We compared the population assignment
results from our Structure and BAPS results to the likelihood of
population assignment calculated by GenAlEx. Also, for popula-
tion defined by Structure and BAPS, we performed analyses of
molecular variance (AMOVA) to calculate the degree and
statistical significance of population differentiation.
Characterization of B. pseudomallei populationsThe number of populations supported by Structure and BAPS are
two and three respectively. We therefore used the results from the
Structure run with the highest likelihood score at K = 2 and the BAPs
run with the highest likelihood score at K = 3 to infer population
assignments for each ST. To show the extent of genetic
differentiation among these populations, we used GenAlEx [24]
to calculate WPT, using 999 permutations [23]. In assessing
assignment results, we categorized STs according to the likelihood
of assignment of each ST into a population by Structure or BAPS,
allowing us to evaluate the effect of assignment confidence on
discrepancies among programs. To be conservative in our
assignment of STs to a population, we suggest that a ST only be
considered to be from a given population if Structure or BAPS
assigned it to that population $95% of the time. As BAPS
measures likelihoods in 10% intervals, this threshold is effectively
100% for BAPS. STs assigned to either population ,95% of the
time were considered ‘‘undefined’’ even though studies using
simulated datasets suggest that in some situations, assignment
probabilities of .50% may be accurate [18].
Construction of allele frequency chartsWe wished to provide researchers interested in B. pseudomallei
population genetics with a tool for population assignment in instances
where novel STs not included in this study are encountered. To
achieve this goal, the frequencies of alleles belonging to STs from
each population for .95% of the runs were determined. We also
enumerated alleles for STs assigned to a population between 50 and
95% of the time as this measure can be useful for indicating the
reliability of an allele for population assignment.
Definition of B. pseudomallei populations with single-nucleotide polymorphisms
Performing MLST on large bacterial collections is a time-
consuming task; however, single nucleotide polymorphism (SNP)
genotyping provides a streamlined way to characterize MLST
populations even for recombining species [25,26,27]. We predict-
ed that SNPs within MLST loci could be used to distinguish
between the major B. pseudomallei ST populations. The program
‘Minimum SNPs’ [26], with incorporated Not-N algorithm [28],
was used to search for a set of highly informative characters among
the MLST alignments that could be used to distinguish between a
predefined ‘ingroup’ and the remaining ‘outgroup’ population.
The 566 B. pseudomallei STs determined by Structure to be assigned
to one of the two populations in $95% of iterations were tested
using the Not-N algorithm, where each population was alternately
considered the ‘ingroup’ and all other STs the ‘outgroup’.
Similarly, the 607 B. pseudomallei STs identified by BAPS as
belonging to any of the three populations in $90% of iterations
were tested (BAPS measures likelihood in 10% increments). In an
attempt to increase the likelihood of finding a small set of
population-defining SNPs, a second ‘Minimum SNPs’ analysis
including only the 413 STs assigned to a population in 100% of
Structure runs and a third analysis with the 560 STs assigned to a
population in 100% of BAPS runs were carried out.
Results and Discussion
Population assignment of B. pseudomallei STs usingStructure
Structure was used to identify and characterize B. pseudomallei
populations using MLST allelic profile data from 641 STs. The
existence of two B. pseudomallei populations (K = 2) was first proposed
by Pearson and coworkers [11] as higher values of K did not break
apart the two main populations and subdivisions were inconsistent
between runs. Here, we confirm that when using Structure, two
populations (K = 2) garners the most statistical support when
compared to other numbers of putative populations (K = 1, and 3
through 17). This support is based on three criteria that have been
used in other studies to justify selected K values. First, higher values
of K retained the two populations (Figure 1) [11]. Second, the
selected K value has the lowest variance of ln P(D) after K = 1 (Figure
S2) [13]. Lastly, the DK shows a peak at the selected K value (Figure
S2) [17]. We also tested both ‘admixture’ and ‘no admixture’
analyses and obtained the same results regarding the size of K and
similar results regarding population assignments for individual STs.
However, the ‘no admixture’ method provided more consistent
results than the ‘admixture’ approach, yielding lower variances. The
results presented here are from the ‘‘no admixture model’’ (see
Figure S1 for a comparison of these tests).
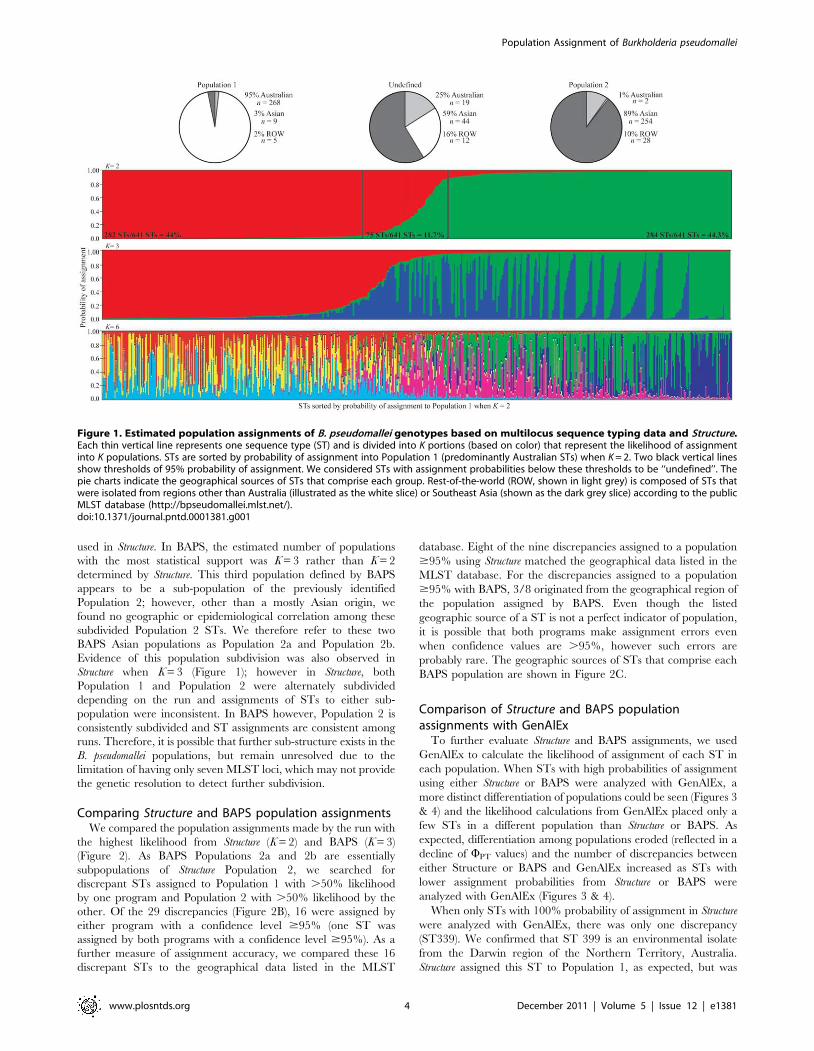
Using a K = 2 with Structure, the two populations were
significantly distinct (WPT = 0.123; P = 0.001). Structure assigned
88.3% of STs to either Population 1 or Population 2 with $95%
probability of assignment, with 44% and 44.3% of STs assigned to
Population 1 and 2, respectively (Figure 1). Population 1 is
comprised of 95% Australian (Australia and Papua New Guinea),
3% Southeast Asian, and 2% STs from the other parts of the
world. In contrast, 89% of STs in Population 2 are from Southeast
Asia, 1% from Australia, and 10% from the rest of the world
(Figure 1). Only 11.7% of STs were not assigned to a given
population based on a 95% probability of assignment threshold.
This ‘‘undefined’’ group is comprised of STs from Southeast Asia
(59%), Australia (25%), and the rest of the world (16%).
Population assignment of B. pseudomallei STs using BAPSWe also used the population-clustering program BAPS for
determining the number of B. pseudomallei populations and for
assigning STs to each population. Unlike Structure we used
concatenated MLST sequence data rather than the allelic data
Population Assignment of Burkholderia pseudomallei
www.plosntds.org 3 December 2011 | Volume 5 | Issue 12 | e1381
used in Structure. In BAPS, the estimated number of populations
with the most statistical support was K = 3 rather than K = 2
determined by Structure. This third population defined by BAPS
appears to be a sub-population of the previously identified
Population 2; however, other than a mostly Asian origin, we
found no geographic or epidemiological correlation among these
subdivided Population 2 STs. We therefore refer to these two
BAPS Asian populations as Population 2a and Population 2b.
Evidence of this population subdivision was also observed in
Structure when K = 3 (Figure 1); however in Structure, both
Population 1 and Population 2 were alternately subdivided
depending on the run and assignments of STs to either sub-
population were inconsistent. In BAPS however, Population 2 is
consistently subdivided and ST assignments are consistent among
runs. Therefore, it is possible that further sub-structure exists in the
B. pseudomallei populations, but remain unresolved due to the
limitation of having only seven MLST loci, which may not provide
the genetic resolution to detect further subdivision.
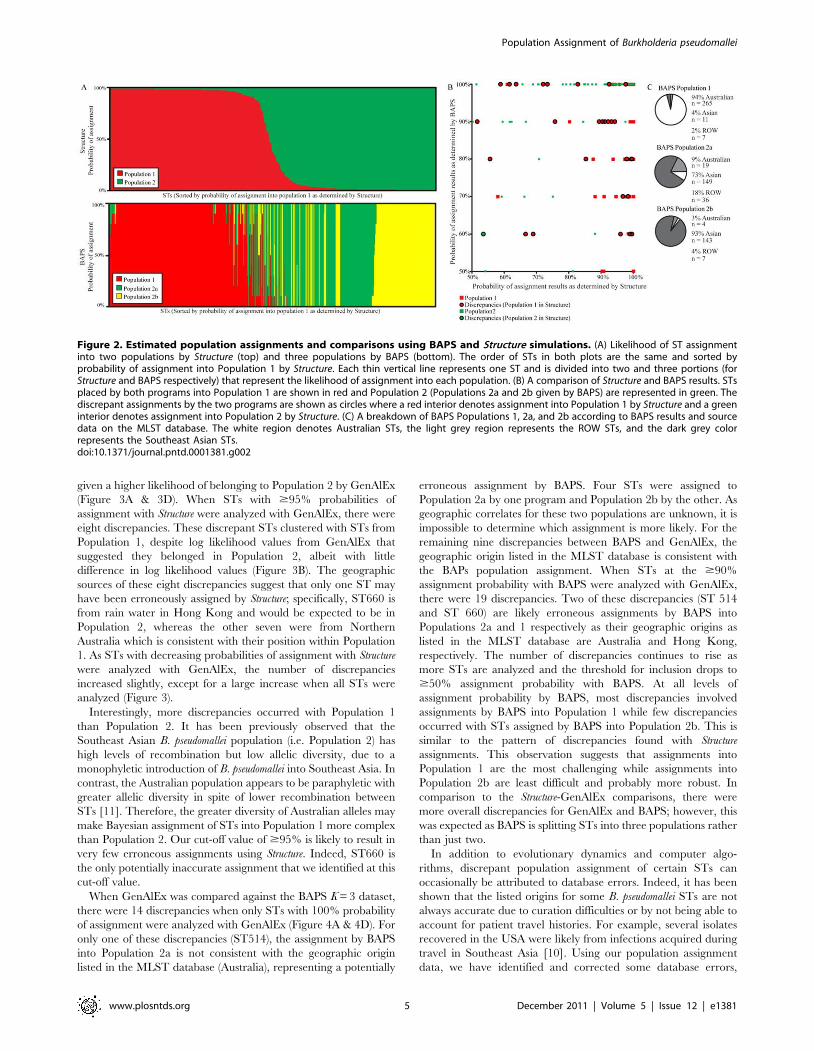
Comparing Structure and BAPS population assignmentsWe compared the population assignments made by the run with
the highest likelihood from Structure (K = 2) and BAPS (K = 3)
(Figure 2). As BAPS Populations 2a and 2b are essentially
subpopulations of Structure Population 2, we searched for
discrepant STs assigned to Population 1 with .50% likelihood
by one program and Population 2 with .50% likelihood by the
other. Of the 29 discrepancies (Figure 2B), 16 were assigned by
either program with a confidence level $95% (one ST was
assigned by both programs with a confidence level $95%). As a
further measure of assignment accuracy, we compared these 16
discrepant STs to the geographical data listed in the MLST
database. Eight of the nine discrepancies assigned to a population
$95% using Structure matched the geographical data listed in the
MLST database. For the discrepancies assigned to a population
$95% with BAPS, 3/8 originated from the geographical region of
the population assigned by BAPS. Even though the listed
geographic source of a ST is not a perfect indicator of population,
it is possible that both programs make assignment errors even
when confidence values are .95%, however such errors are
probably rare. The geographic sources of STs that comprise each
BAPS population are shown in Figure 2C.
Comparison of Structure and BAPS populationassignments with GenAlEx
To further evaluate Structure and BAPS assignments, we used
GenAlEx to calculate the likelihood of assignment of each ST in
each population. When STs with high probabilities of assignment
using either Structure or BAPS were analyzed with GenAlEx, a
more distinct differentiation of populations could be seen (Figures 3
& 4) and the likelihood calculations from GenAlEx placed only a
few STs in a different population than Structure or BAPS. As
expected, differentiation among populations eroded (reflected in a
decline of WPT values) and the number of discrepancies between
either Structure or BAPS and GenAlEx increased as STs with
lower assignment probabilities from Structure or BAPS were
analyzed with GenAlEx (Figures 3 & 4).
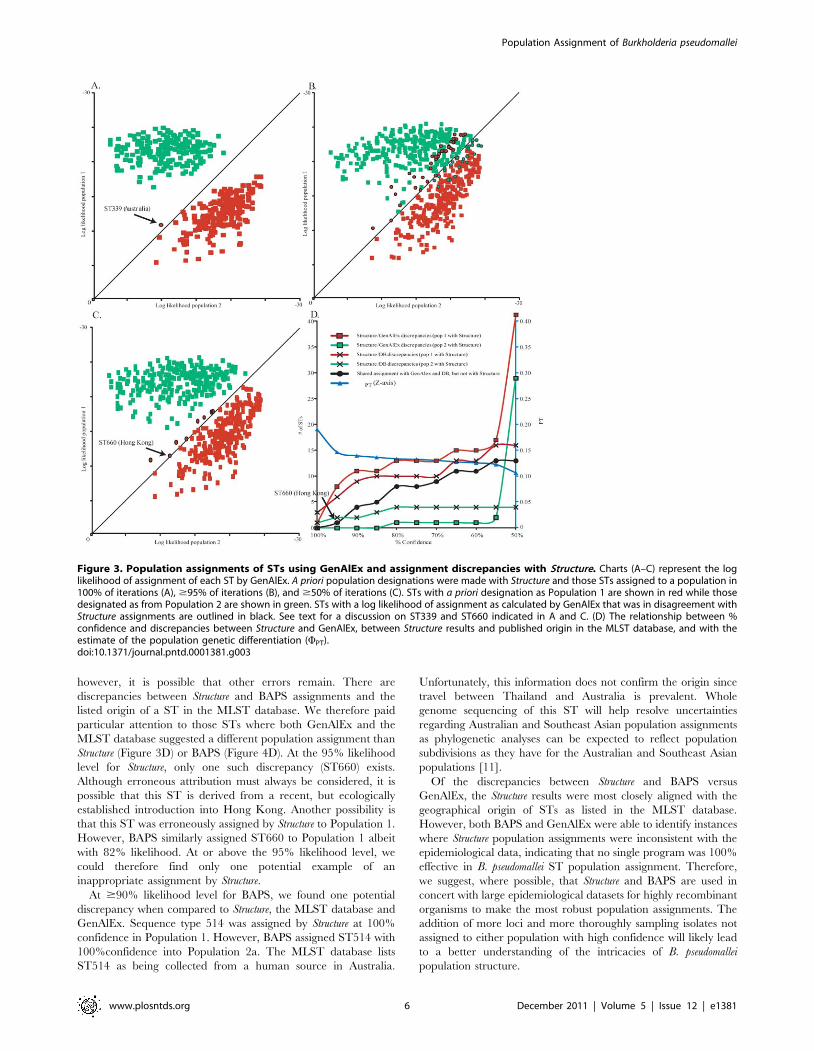
When only STs with 100% probability of assignment in Structure
were analyzed with GenAlEx, there was only one discrepancy
(ST339). We confirmed that ST 399 is an environmental isolate
from the Darwin region of the Northern Territory, Australia.
Structure assigned this ST to Population 1, as expected, but was
Figure 1. Estimated population assignments of B. pseudomallei genotypes based on multilocus sequence typing data and Structure.Each thin vertical line represents one sequence type (ST) and is divided into K portions (based on color) that represent the likelihood of assignmentinto K populations. STs are sorted by probability of assignment into Population 1 (predominantly Australian STs) when K = 2. Two black vertical linesshow thresholds of 95% probability of assignment. We considered STs with assignment probabilities below these thresholds to be ‘‘undefined’’. Thepie charts indicate the geographical sources of STs that comprise each group. Rest-of-the-world (ROW, shown in light grey) is composed of STs thatwere isolated from regions other than Australia (illustrated as the white slice) or Southeast Asia (shown as the dark grey slice) according to the publicMLST database (http://bpseudomallei.mlst.net/).doi:10.1371/journal.pntd.0001381.g001
Population Assignment of Burkholderia pseudomallei
www.plosntds.org 4 December 2011 | Volume 5 | Issue 12 | e1381
given a higher likelihood of belonging to Population 2 by GenAlEx
(Figure 3A & 3D). When STs with $95% probabilities of
assignment with Structure were analyzed with GenAlEx, there were
eight discrepancies. These discrepant STs clustered with STs from
Population 1, despite log likelihood values from GenAlEx that
suggested they belonged in Population 2, albeit with little
difference in log likelihood values (Figure 3B). The geographic
sources of these eight discrepancies suggest that only one ST may
have been erroneously assigned by Structure; specifically, ST660 is
from rain water in Hong Kong and would be expected to be in
Population 2, whereas the other seven were from Northern
Australia which is consistent with their position within Population
1. As STs with decreasing probabilities of assignment with Structure
were analyzed with GenAlEx, the number of discrepancies
increased slightly, except for a large increase when all STs were
analyzed (Figure 3).
Interestingly, more discrepancies occurred with Population 1
than Population 2. It has been previously observed that the
Southeast Asian B. pseudomallei population (i.e. Population 2) has
high levels of recombination but low allelic diversity, due to a
monophyletic introduction of B. pseudomallei into Southeast Asia. In
contrast, the Australian population appears to be paraphyletic with
greater allelic diversity in spite of lower recombination between
STs [11]. Therefore, the greater diversity of Australian alleles may
make Bayesian assignment of STs into Population 1 more complex
than Population 2. Our cut-off value of $95% is likely to result in
very few erroneous assignments using Structure. Indeed, ST660 is
the only potentially inaccurate assignment that we identified at this
cut-off value.
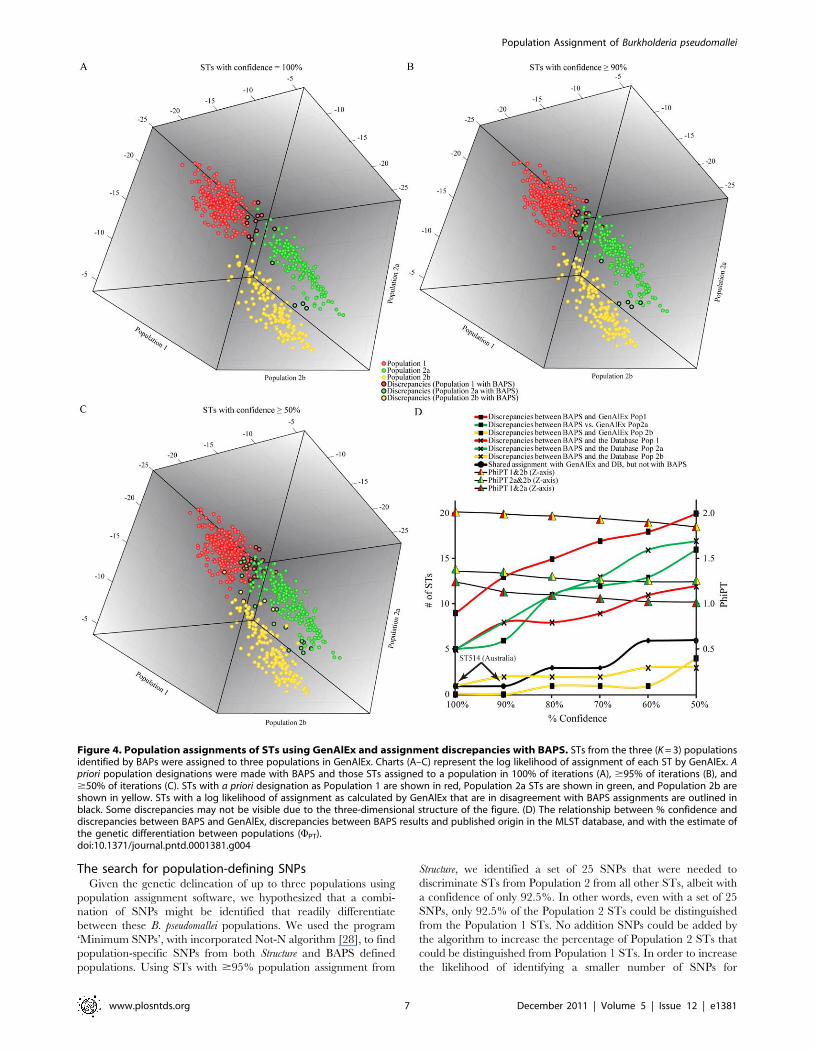
When GenAlEx was compared against the BAPS K = 3 dataset,
there were 14 discrepancies when only STs with 100% probability
of assignment were analyzed with GenAlEx (Figure 4A & 4D). For
only one of these discrepancies (ST514), the assignment by BAPS
into Population 2a is not consistent with the geographic origin
listed in the MLST database (Australia), representing a potentially
erroneous assignment by BAPS. Four STs were assigned to
Population 2a by one program and Population 2b by the other. As
geographic correlates for these two populations are unknown, it is
impossible to determine which assignment is more likely. For the
remaining nine discrepancies between BAPS and GenAlEx, the
geographic origin listed in the MLST database is consistent with
the BAPs population assignment. When STs at the $90%
assignment probability with BAPS were analyzed with GenAlEx,
there were 19 discrepancies. Two of these discrepancies (ST 514
and ST 660) are likely erroneous assignments by BAPS into
Populations 2a and 1 respectively as their geographic origins as
listed in the MLST database are Australia and Hong Kong,
respectively. The number of discrepancies continues to rise as
more STs are analyzed and the threshold for inclusion drops to
$50% assignment probability with BAPS. At all levels of
assignment probability by BAPS, most discrepancies involved
assignments by BAPS into Population 1 while few discrepancies
occurred with STs assigned by BAPS into Population 2b. This is
similar to the pattern of discrepancies found with Structure
assignments. This observation suggests that assignments into
Population 1 are the most challenging while assignments into
Population 2b are least difficult and probably more robust. In
comparison to the Structure-GenAlEx comparisons, there were
more overall discrepancies for GenAlEx and BAPS; however, this
was expected as BAPS is splitting STs into three populations rather
than just two.
In addition to evolutionary dynamics and computer algo-
rithms, discrepant population assignment of certain STs can
occasionally be attributed to database errors. Indeed, it has been
shown that the listed origins for some B. pseudomallei STs are not
always accurate due to curation difficulties or by not being able to
account for patient travel histories. For example, several isolates
recovered in the USA were likely from infections acquired during
travel in Southeast Asia [10]. Using our population assignment
data, we have identified and corrected some database errors,
Figure 2. Estimated population assignments and comparisons using BAPS and Structure simulations. (A) Likelihood of ST assignmentinto two populations by Structure (top) and three populations by BAPS (bottom). The order of STs in both plots are the same and sorted byprobability of assignment into Population 1 by Structure. Each thin vertical line represents one ST and is divided into two and three portions (forStructure and BAPS respectively) that represent the likelihood of assignment into each population. (B) A comparison of Structure and BAPS results. STsplaced by both programs into Population 1 are shown in red and Population 2 (Populations 2a and 2b given by BAPS) are represented in green. Thediscrepant assignments by the two programs are shown as circles where a red interior denotes assignment into Population 1 by Structure and a greeninterior denotes assignment into Population 2 by Structure. (C) A breakdown of BAPS Populations 1, 2a, and 2b according to BAPS results and sourcedata on the MLST database. The white region denotes Australian STs, the light grey region represents the ROW STs, and the dark grey colorrepresents the Southeast Asian STs.doi:10.1371/journal.pntd.0001381.g002
Population Assignment of Burkholderia pseudomallei
www.plosntds.org 5 December 2011 | Volume 5 | Issue 12 | e1381
however, it is possible that other errors remain. There are
discrepancies between Structure and BAPS assignments and the
listed origin of a ST in the MLST database. We therefore paid
particular attention to those STs where both GenAlEx and the
MLST database suggested a different population assignment than
Structure (Figure 3D) or BAPS (Figure 4D). At the 95% likelihood
level for Structure, only one such discrepancy (ST660) exists.
Although erroneous attribution must always be considered, it is
possible that this ST is derived from a recent, but ecologically
established introduction into Hong Kong. Another possibility is
that this ST was erroneously assigned by Structure to Population 1.
However, BAPS similarly assigned ST660 to Population 1 albeit
with 82% likelihood. At or above the 95% likelihood level, we
could therefore find only one potential example of an
inappropriate assignment by Structure.
At $90% likelihood level for BAPS, we found one potential
discrepancy when compared to Structure, the MLST database and
GenAlEx. Sequence type 514 was assigned by Structure at 100%
confidence in Population 1. However, BAPS assigned ST514 with
100%confidence into Population 2a. The MLST database lists
ST514 as being collected from a human source in Australia.
Unfortunately, this information does not confirm the origin since
travel between Thailand and Australia is prevalent. Whole
genome sequencing of this ST will help resolve uncertainties
regarding Australian and Southeast Asian population assignments
as phylogenetic analyses can be expected to reflect population
subdivisions as they have for the Australian and Southeast Asian
populations [11].
Of the discrepancies between Structure and BAPS versus
GenAlEx, the Structure results were most closely aligned with the
geographical origin of STs as listed in the MLST database.
However, both BAPS and GenAlEx were able to identify instances
where Structure population assignments were inconsistent with the
epidemiological data, indicating that no single program was 100%
effective in B. pseudomallei ST population assignment. Therefore,
we suggest, where possible, that Structure and BAPS are used in
concert with large epidemiological datasets for highly recombinant
organisms to make the most robust population assignments. The
addition of more loci and more thoroughly sampling isolates not
assigned to either population with high confidence will likely lead
to a better understanding of the intricacies of B. pseudomallei
population structure.
Figure 3. Population assignments of STs using GenAlEx and assignment discrepancies with Structure. Charts (A–C) represent the loglikelihood of assignment of each ST by GenAlEx. A priori population designations were made with Structure and those STs assigned to a population in100% of iterations (A), $95% of iterations (B), and $50% of iterations (C). STs with a priori designation as Population 1 are shown in red while thosedesignated as from Population 2 are shown in green. STs with a log likelihood of assignment as calculated by GenAlEx that was in disagreement withStructure assignments are outlined in black. See text for a discussion on ST339 and ST660 indicated in A and C. (D) The relationship between %confidence and discrepancies between Structure and GenAlEx, between Structure results and published origin in the MLST database, and with theestimate of the population genetic differentiation (WPT).doi:10.1371/journal.pntd.0001381.g003
Population Assignment of Burkholderia pseudomallei
www.plosntds.org 6 December 2011 | Volume 5 | Issue 12 | e1381
The search for population-defining SNPsGiven the genetic delineation of up to three populations using
population assignment software, we hypothesized that a combi-
nation of SNPs might be identified that readily differentiate
between these B. pseudomallei populations. We used the program
‘Minimum SNPs’, with incorporated Not-N algorithm [28], to find
population-specific SNPs from both Structure and BAPS defined
populations. Using STs with $95% population assignment from
Structure, we identified a set of 25 SNPs that were needed to
discriminate STs from Population 2 from all other STs, albeit with
a confidence of only 92.5%. In other words, even with a set of 25
SNPs, only 92.5% of the Population 2 STs could be distinguished
from the Population 1 STs. No addition SNPs could be added by
the algorithm to increase the percentage of Population 2 STs that
could be distinguished from Population 1 STs. In order to increase
the likelihood of identifying a smaller number of SNPs for
Figure 4. Population assignments of STs using GenAlEx and assignment discrepancies with BAPS. STs from the three (K = 3) populationsidentified by BAPs were assigned to three populations in GenAlEx. Charts (A–C) represent the log likelihood of assignment of each ST by GenAlEx. Apriori population designations were made with BAPS and those STs assigned to a population in 100% of iterations (A), $95% of iterations (B), and$50% of iterations (C). STs with a priori designation as Population 1 are shown in red, Population 2a STs are shown in green, and Population 2b areshown in yellow. STs with a log likelihood of assignment as calculated by GenAlEx that are in disagreement with BAPS assignments are outlined inblack. Some discrepancies may not be visible due to the three-dimensional structure of the figure. (D) The relationship between % confidence anddiscrepancies between BAPS and GenAlEx, discrepancies between BAPS results and published origin in the MLST database, and with the estimate ofthe genetic differentiation between populations (WPT).doi:10.1371/journal.pntd.0001381.g004
Population Assignment of Burkholderia pseudomallei
www.plosntds.org 7 December 2011 | Volume 5 | Issue 12 | e1381
population differentiation, we narrowed down our population
definition by including only STs assigned to each population in
100% of Structure runs. Our results showed that a set of 16 SNPs
were needed to separate the Population 2 STs from the Population
1 STs at a confidence level of 97.6%. As inaccurately assigned STs
can hamper the ability of ‘Minimum SNPs’ to find population
specific SNPs, we also used the BAPS population designations at
both the $90% and 100% thresholds for population assignment.
For STs assigned to each population in 90% of BAPS runs, the
Not-N algorithm identified a set of 26 SNPs that discriminated
Populations 2a and 2b apart from Population 1 with a confidence
of 81.1%. For STs assigned to a given population in 100% of
BAPS runs, a set of 26 SNPs discriminated Populations 2a and 2b
apart from Population 1 with 84.3% confidence. A set of 21 SNPs
discriminated Population 2a apart from Populations 1 and 2b with
95.5% confidence while a set of 13 SNPs discriminated population
2b from the others with 99.2% confidence. Finally, by analyzing
only the Population 2 STs identified at the 100% threshold with
BAPS, we found a single SNP (at position 192 in the narK locus)
that distinguishes all STs in Population 2b (C nucleotide) from all
STs in Population 2a (G or T nucleotide). These results suggest
that complete population identification of all members of all
populations by a combination of SNPs from MLST data is not
possible.
Development of reference tools for populationassignment
A more recent version of the MLST database was downloaded
and used to repeat our Structure and BAPS analyses. Once the
analyses on the updated database were complete (November 6th,
2010) these data were compared to the database originally
downloaded for this study (January 15th, 2009). This comparison
verified the consistency of Structure and BAPS results between the
temporal datasets. Of note, however, is the identification by BAPS
of a fourth population consisting of three STs, two of which were
included in the original database and were formerly placed in
Population 1. The third ST in this new population (ST698) is
novel and is a human isolate from the USA. Because this
population appears to be part of the Australian population, we
refer to it as Population 1b and the other Australian population as
Population 1a.
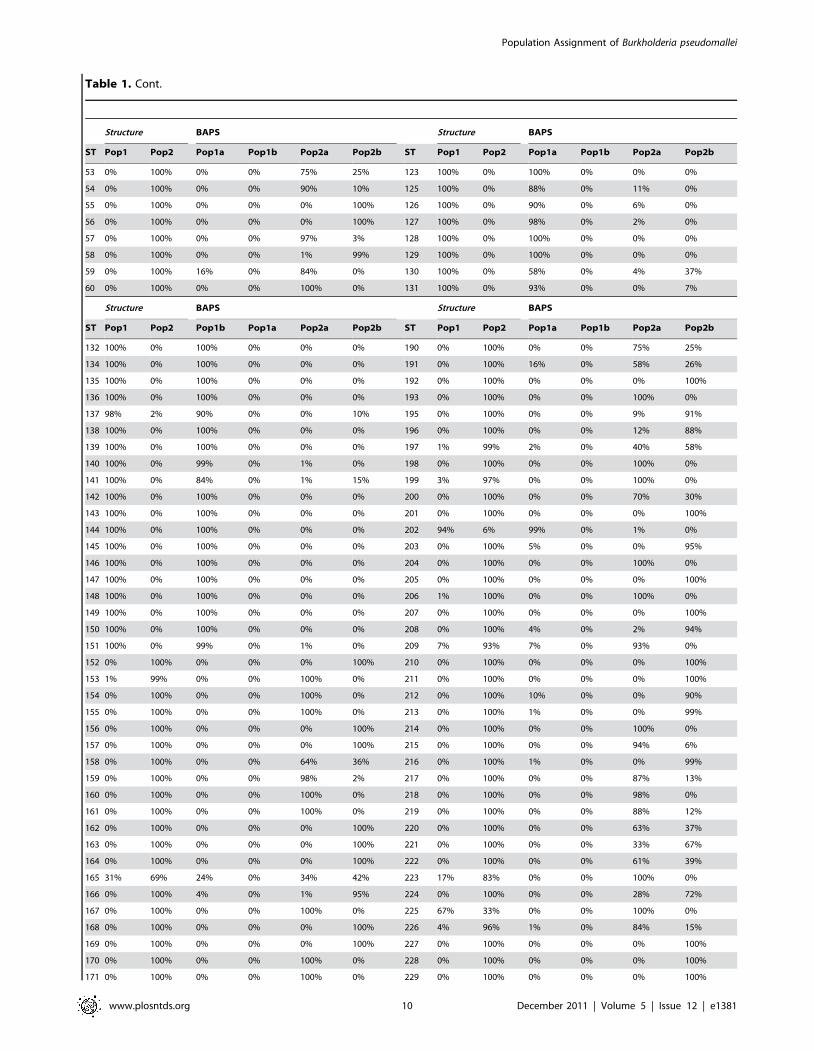
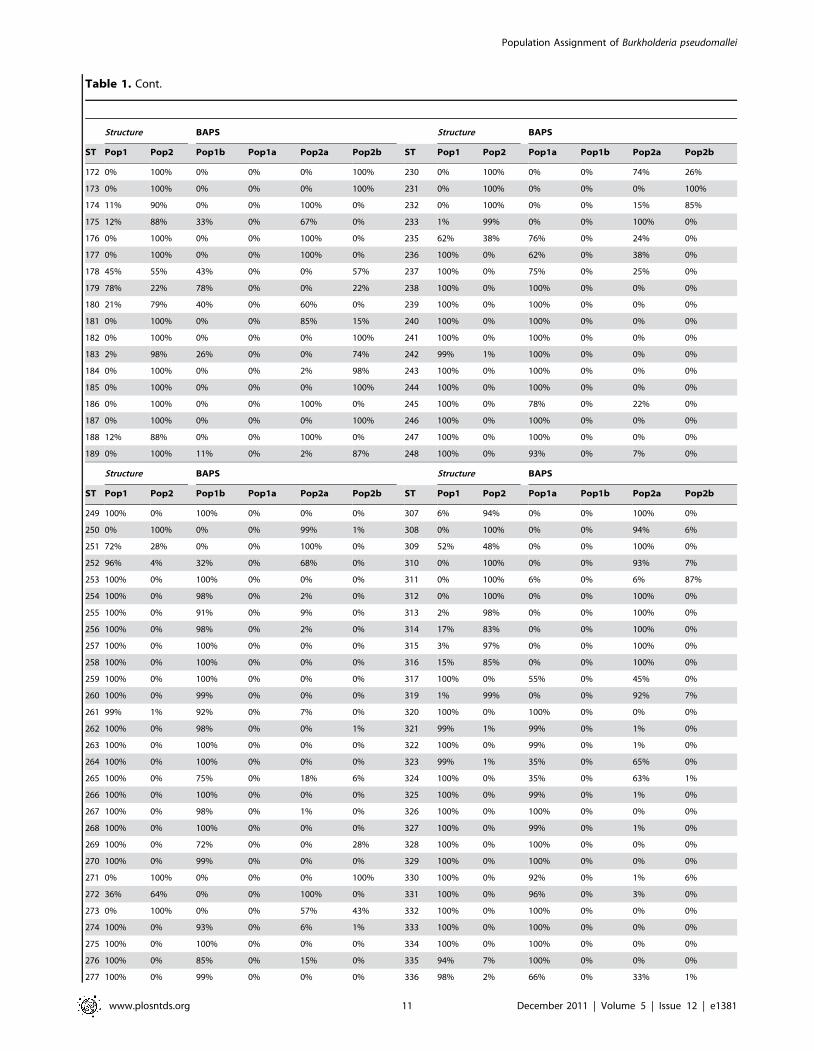
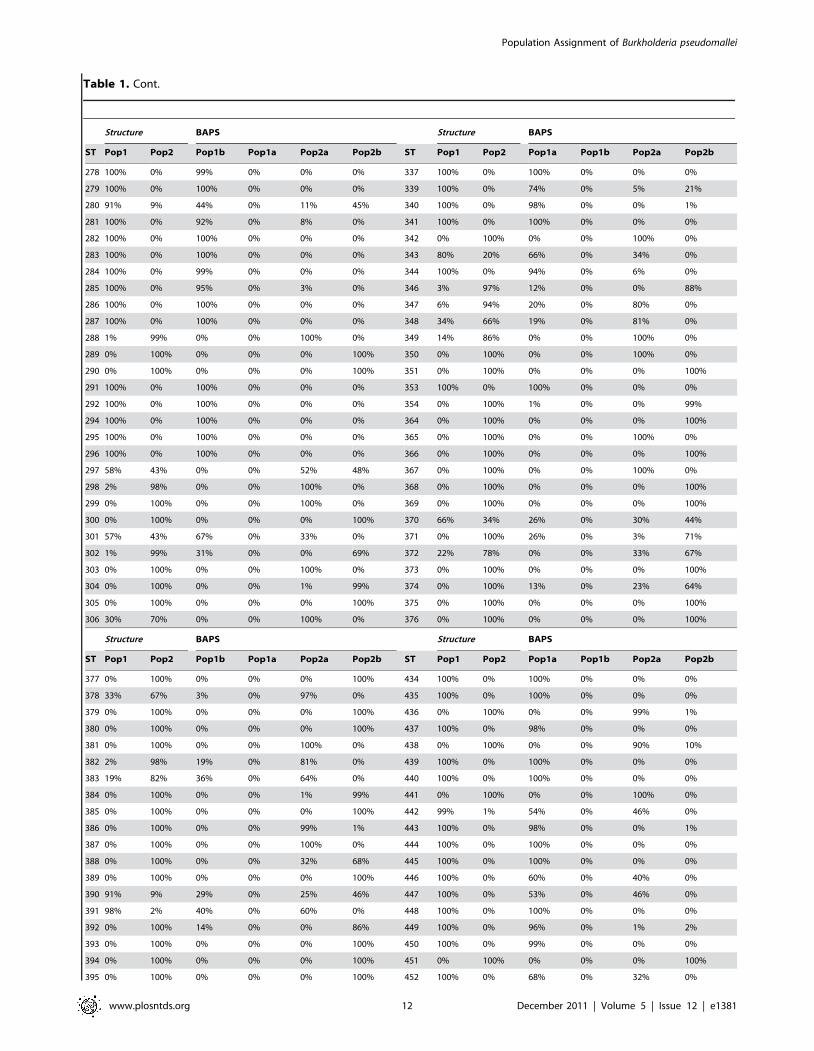
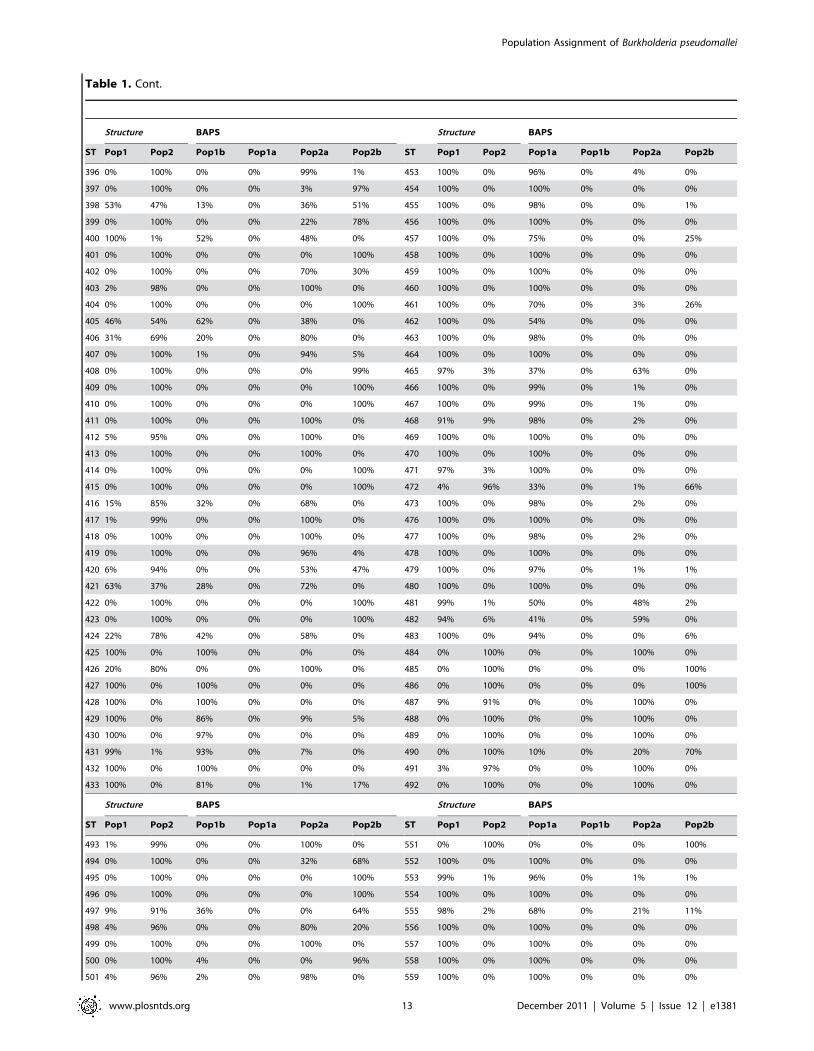
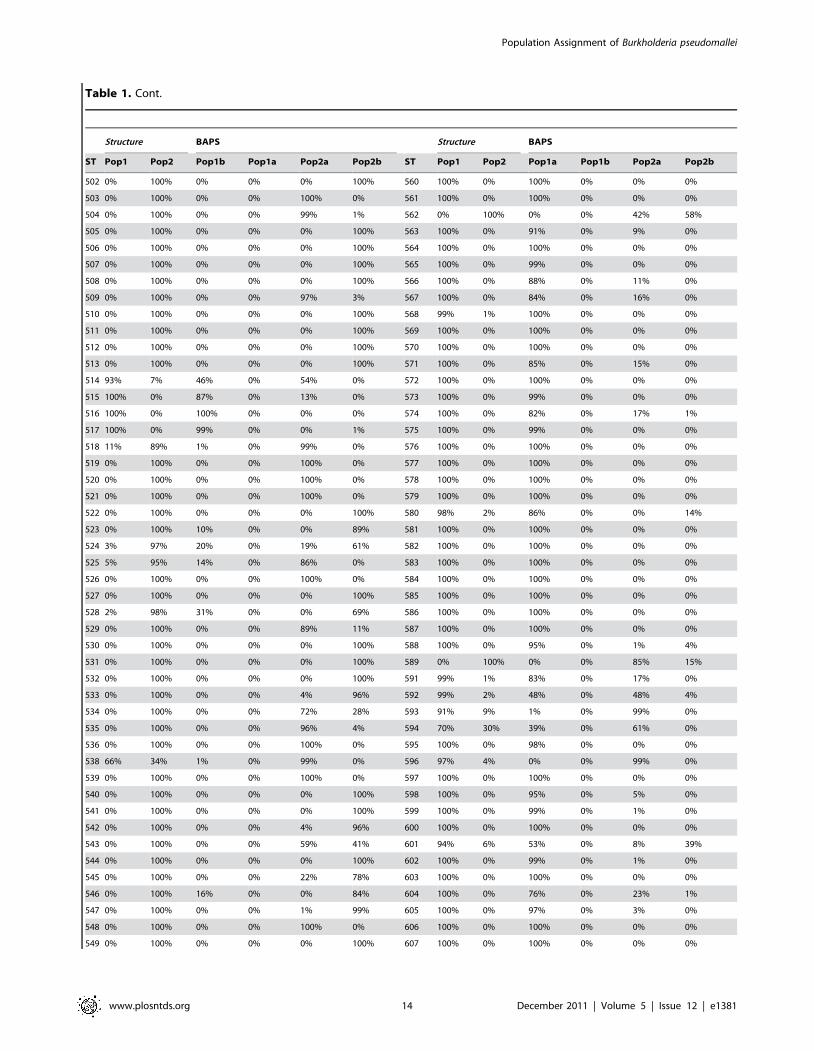
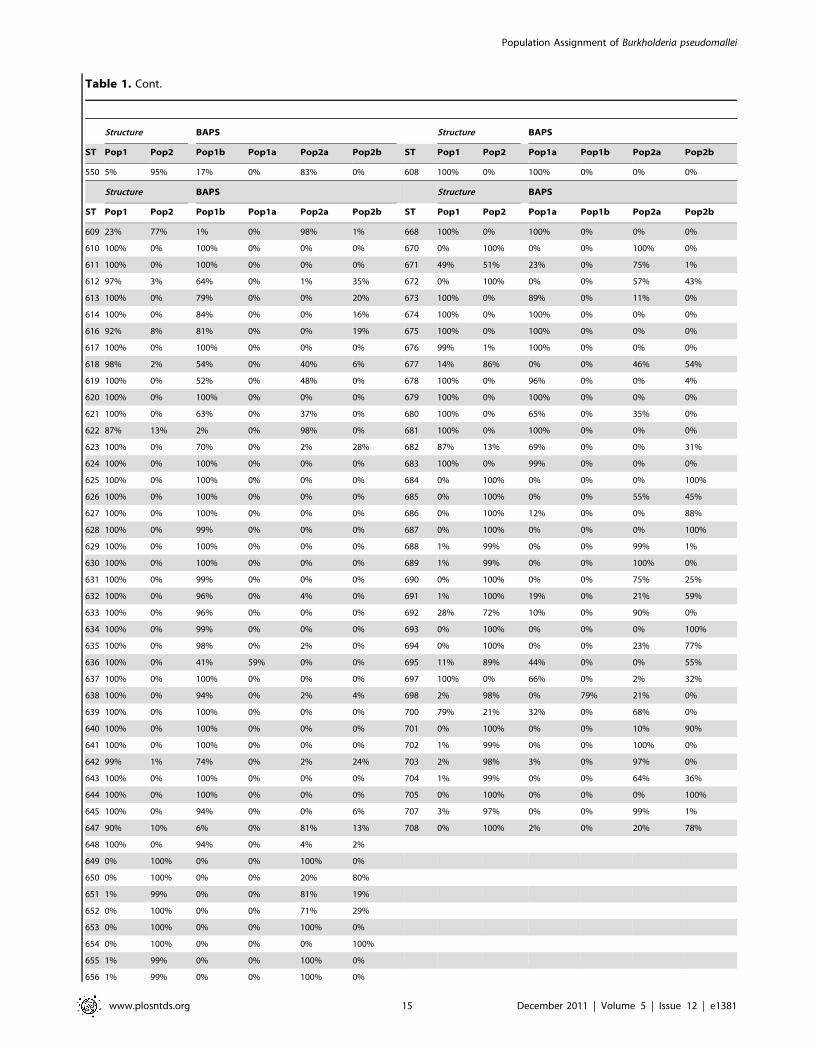
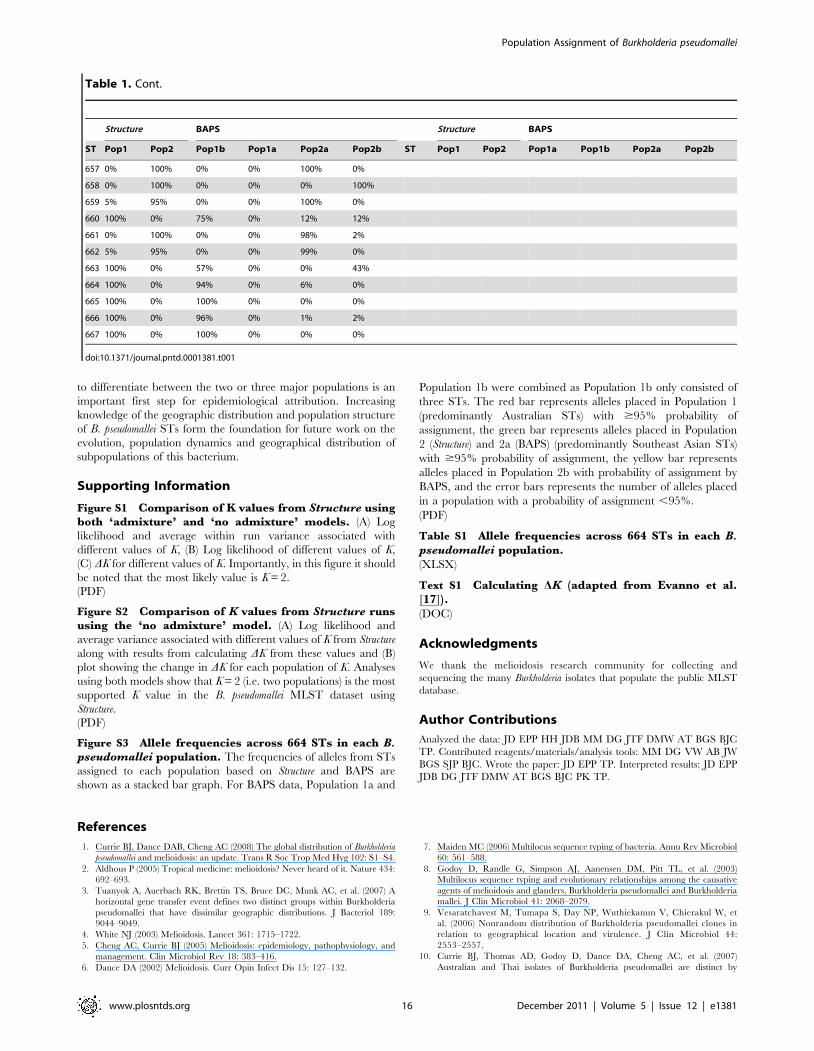
Population assignments and likelihood values for each ST based
on the updated MLST database are shown in Table 1. This table
provides a resource that can be used by researchers interested in
determining the geographic source population of B. pseudomallei
STs. Comparisons with other population assignment methods and
with geographic source information listed on the MLST database
suggest that the risk of assignment by Structure and BAPS into the
incorrect population is low when a high percentage of iterations
result in the same assignment. In addition, there appear to be
fewer potential errors with STs assigned to Population 2 by
Structure and 2a or 2b by BAPS. We therefore suggest that a cut off
value of $95% ($90% for BAPS) assignment probability can
serve as a conservative threshold above which assignment errors
are not likely and which include a large proportion (,90%) of the
entire ST populations. The threshold used by different investiga-
tors does not need to be universal, and our recommendation of
$95% is solely intended as a conservative guide. Indeed, for STs
assigned to Population 2 (or 2a/2b), which is a monophyletic
population, it is likely that a lower threshold of even $60%
assignment probability is not likely to result in erroneous
assignments.
While we present here a list of STs and the likelihood of
assignment into each population, we recognize that new STs will
be found with future sampling, limiting the long-term utility of our
analyses. However, due to the relatively low diversity and high
recombination rates relative to mutation in B. pseudomallei [11], it is
likely that many new STs will not contain novel alleles, but rather
will comprise new combinations of characterized alleles. As
population assignments with Structure are based on allele
frequencies in a population, we include this information here
with the expectation that this resource will continue to be useful
even as novel STs are discovered (Figure S3 and Table S1). We
suggest that alleles that are predominantly associated with
population 1 or population 2 can be used to estimate population
assignment for novel STs. Of 50 randomly selected STs, all but
three could be assigned based on the presence of alleles
predominantly associated with one population ($95% of their
occurrence is attributed to one population). These three STs do
not have a high affinity to either populations as all were originally
assigned with ,95% confidence by Structure and BAPS. Of the 664
B. pseudomallei STs, 80% have alleles that are exclusively found in
one of the two main populations and 93% have alleles that are
associated with one of these populations in $95% of their
occurrences. Thus for new STs, allele frequency data can shed
light on appropriate population assignments.
As lateral gene transfer is increasingly found to play an
important role in the population dynamics of a range of bacterial
species, population genetics tools such as Structure and BAPS will
become more widely used by epidemiologists. The approach
described here facilitates rapid assignment of isolates to established
populations without needing to compile data, or learn and run a
new application. Population assignment is one of the first steps in
epidemiological tracking of disease and can be used to identify and
track bacterial introductions into new regions. We have expanded
on our previous work [11] by rigorously exploring the composition
of the two major populations of B. pseudomallei. Our results suggest
that the programs Structure and BAPS are both sensitive and
accurate for population assignment of B. pseudomallei using MLST
data, as the two programs provide similar results. The relative rate
of recombination to mutation at MLST loci for B. pseudomallei is
higher than for any other bacterial species yet reported [11],
meaning that allele frequency differences among populations is an
appropriate method for determining population structure. Exam-
ining allele frequencies when deciphering population structure is
standard for eukaryotes, where high recombination rates cause
allelic frequency differences among populations through genetic
drift [29].
Population assignment is an important aspect of epidemiological
and forensic attribution. As knowledge of population dynamics
and geographical distribution of a species increases, attribution
can be attempted at an increasingly fine scale, allowing
investigators to focus their attention on a very small and well-
defined population and geographic region. For B. pseudomallei, little
is currently known about population dynamics, evolution and even
geographical distribution. High relative rates of recombination to
mutation complicate attempts to discern population structure for
this species using strictly phylogenetic approaches. MLST analyses
are popular for bacterial pathogens and the large data set collected
for B. pseudomallei has allowed for the robust identification of two
main populations that correspond to the endemic geographical
regions of Southeast Asia and Australia. While substructure within
these two populations likely exists, such as the third population
identified by BAPS, the seven MLST genes and the current set of
STs do not provide enough resolution for further robust
differentiation among subpopulations. Genotype interrogation at
more loci or great numbers of STs will increase our knowledge of
subpopulation dynamics, but in the meantime our current ability
Population Assignment of Burkholderia pseudomallei
www.plosntds.org 8 December 2011 | Volume 5 | Issue 12 | e1381
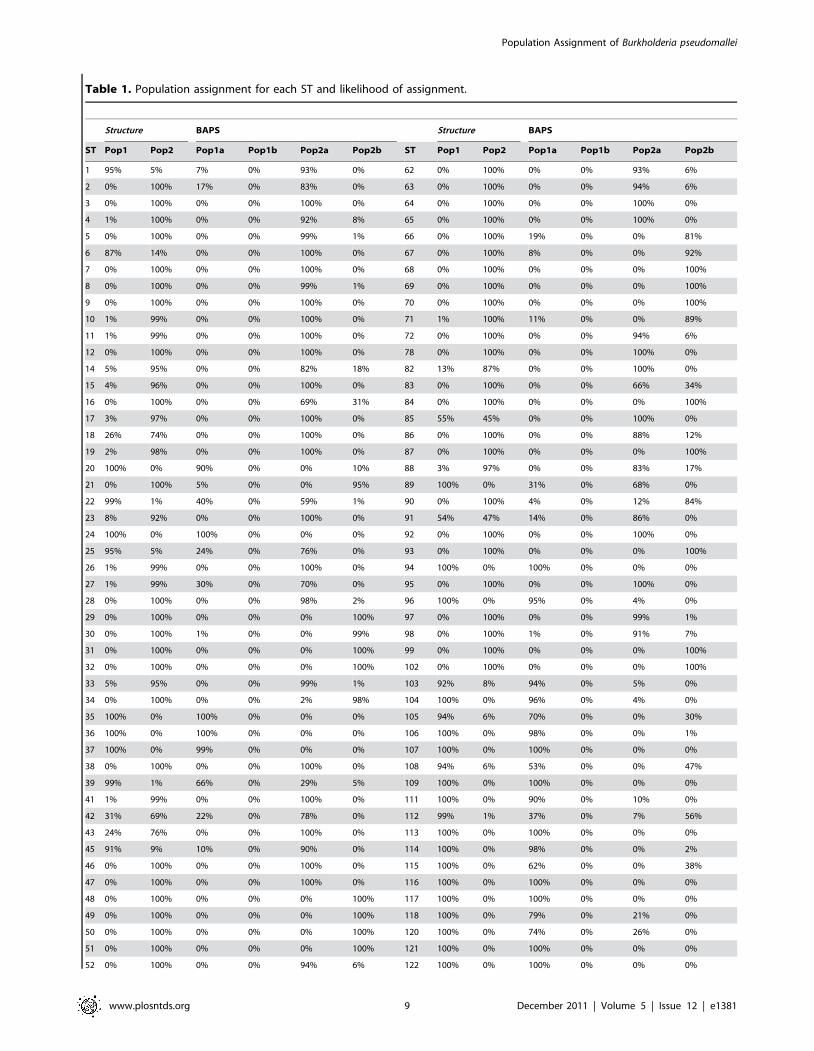
Table 1. Population assignment for each ST and likelihood of assignment.
Structure BAPS Structure BAPS
ST Pop1 Pop2 Pop1a Pop1b Pop2a Pop2b ST Pop1 Pop2 Pop1a Pop1b Pop2a Pop2b
1 95% 5% 7% 0% 93% 0% 62 0% 100% 0% 0% 93% 6%
2 0% 100% 17% 0% 83% 0% 63 0% 100% 0% 0% 94% 6%
3 0% 100% 0% 0% 100% 0% 64 0% 100% 0% 0% 100% 0%
4 1% 100% 0% 0% 92% 8% 65 0% 100% 0% 0% 100% 0%
5 0% 100% 0% 0% 99% 1% 66 0% 100% 19% 0% 0% 81%
6 87% 14% 0% 0% 100% 0% 67 0% 100% 8% 0% 0% 92%
7 0% 100% 0% 0% 100% 0% 68 0% 100% 0% 0% 0% 100%
8 0% 100% 0% 0% 99% 1% 69 0% 100% 0% 0% 0% 100%
9 0% 100% 0% 0% 100% 0% 70 0% 100% 0% 0% 0% 100%
10 1% 99% 0% 0% 100% 0% 71 1% 100% 11% 0% 0% 89%
11 1% 99% 0% 0% 100% 0% 72 0% 100% 0% 0% 94% 6%
12 0% 100% 0% 0% 100% 0% 78 0% 100% 0% 0% 100% 0%
14 5% 95% 0% 0% 82% 18% 82 13% 87% 0% 0% 100% 0%
15 4% 96% 0% 0% 100% 0% 83 0% 100% 0% 0% 66% 34%
16 0% 100% 0% 0% 69% 31% 84 0% 100% 0% 0% 0% 100%
17 3% 97% 0% 0% 100% 0% 85 55% 45% 0% 0% 100% 0%
18 26% 74% 0% 0% 100% 0% 86 0% 100% 0% 0% 88% 12%
19 2% 98% 0% 0% 100% 0% 87 0% 100% 0% 0% 0% 100%
20 100% 0% 90% 0% 0% 10% 88 3% 97% 0% 0% 83% 17%
21 0% 100% 5% 0% 0% 95% 89 100% 0% 31% 0% 68% 0%
22 99% 1% 40% 0% 59% 1% 90 0% 100% 4% 0% 12% 84%
23 8% 92% 0% 0% 100% 0% 91 54% 47% 14% 0% 86% 0%
24 100% 0% 100% 0% 0% 0% 92 0% 100% 0% 0% 100% 0%
25 95% 5% 24% 0% 76% 0% 93 0% 100% 0% 0% 0% 100%
26 1% 99% 0% 0% 100% 0% 94 100% 0% 100% 0% 0% 0%
27 1% 99% 30% 0% 70% 0% 95 0% 100% 0% 0% 100% 0%
28 0% 100% 0% 0% 98% 2% 96 100% 0% 95% 0% 4% 0%
29 0% 100% 0% 0% 0% 100% 97 0% 100% 0% 0% 99% 1%
30 0% 100% 1% 0% 0% 99% 98 0% 100% 1% 0% 91% 7%
31 0% 100% 0% 0% 0% 100% 99 0% 100% 0% 0% 0% 100%
32 0% 100% 0% 0% 0% 100% 102 0% 100% 0% 0% 0% 100%
33 5% 95% 0% 0% 99% 1% 103 92% 8% 94% 0% 5% 0%
34 0% 100% 0% 0% 2% 98% 104 100% 0% 96% 0% 4% 0%
35 100% 0% 100% 0% 0% 0% 105 94% 6% 70% 0% 0% 30%
36 100% 0% 100% 0% 0% 0% 106 100% 0% 98% 0% 0% 1%
37 100% 0% 99% 0% 0% 0% 107 100% 0% 100% 0% 0% 0%
38 0% 100% 0% 0% 100% 0% 108 94% 6% 53% 0% 0% 47%
39 99% 1% 66% 0% 29% 5% 109 100% 0% 100% 0% 0% 0%
41 1% 99% 0% 0% 100% 0% 111 100% 0% 90% 0% 10% 0%
42 31% 69% 22% 0% 78% 0% 112 99% 1% 37% 0% 7% 56%
43 24% 76% 0% 0% 100% 0% 113 100% 0% 100% 0% 0% 0%
45 91% 9% 10% 0% 90% 0% 114 100% 0% 98% 0% 0% 2%
46 0% 100% 0% 0% 100% 0% 115 100% 0% 62% 0% 0% 38%
47 0% 100% 0% 0% 100% 0% 116 100% 0% 100% 0% 0% 0%
48 0% 100% 0% 0% 0% 100% 117 100% 0% 100% 0% 0% 0%
49 0% 100% 0% 0% 0% 100% 118 100% 0% 79% 0% 21% 0%
50 0% 100% 0% 0% 0% 100% 120 100% 0% 74% 0% 26% 0%
51 0% 100% 0% 0% 0% 100% 121 100% 0% 100% 0% 0% 0%
52 0% 100% 0% 0% 94% 6% 122 100% 0% 100% 0% 0% 0%
Population Assignment of Burkholderia pseudomallei
www.plosntds.org 9 December 2011 | Volume 5 | Issue 12 | e1381
Structure BAPS Structure BAPS
ST Pop1 Pop2 Pop1a Pop1b Pop2a Pop2b ST Pop1 Pop2 Pop1a Pop1b Pop2a Pop2b
53 0% 100% 0% 0% 75% 25% 123 100% 0% 100% 0% 0% 0%
54 0% 100% 0% 0% 90% 10% 125 100% 0% 88% 0% 11% 0%
55 0% 100% 0% 0% 0% 100% 126 100% 0% 90% 0% 6% 0%
56 0% 100% 0% 0% 0% 100% 127 100% 0% 98% 0% 2% 0%
57 0% 100% 0% 0% 97% 3% 128 100% 0% 100% 0% 0% 0%
58 0% 100% 0% 0% 1% 99% 129 100% 0% 100% 0% 0% 0%
59 0% 100% 16% 0% 84% 0% 130 100% 0% 58% 0% 4% 37%
60 0% 100% 0% 0% 100% 0% 131 100% 0% 93% 0% 0% 7%
Structure BAPS Structure BAPS
ST Pop1 Pop2 Pop1b Pop1a Pop2a Pop2b ST Pop1 Pop2 Pop1a Pop1b Pop2a Pop2b
132 100% 0% 100% 0% 0% 0% 190 0% 100% 0% 0% 75% 25%
134 100% 0% 100% 0% 0% 0% 191 0% 100% 16% 0% 58% 26%
135 100% 0% 100% 0% 0% 0% 192 0% 100% 0% 0% 0% 100%
136 100% 0% 100% 0% 0% 0% 193 0% 100% 0% 0% 100% 0%
137 98% 2% 90% 0% 0% 10% 195 0% 100% 0% 0% 9% 91%
138 100% 0% 100% 0% 0% 0% 196 0% 100% 0% 0% 12% 88%
139 100% 0% 100% 0% 0% 0% 197 1% 99% 2% 0% 40% 58%
140 100% 0% 99% 0% 1% 0% 198 0% 100% 0% 0% 100% 0%
141 100% 0% 84% 0% 1% 15% 199 3% 97% 0% 0% 100% 0%
142 100% 0% 100% 0% 0% 0% 200 0% 100% 0% 0% 70% 30%
143 100% 0% 100% 0% 0% 0% 201 0% 100% 0% 0% 0% 100%
144 100% 0% 100% 0% 0% 0% 202 94% 6% 99% 0% 1% 0%
145 100% 0% 100% 0% 0% 0% 203 0% 100% 5% 0% 0% 95%
146 100% 0% 100% 0% 0% 0% 204 0% 100% 0% 0% 100% 0%
147 100% 0% 100% 0% 0% 0% 205 0% 100% 0% 0% 0% 100%
148 100% 0% 100% 0% 0% 0% 206 1% 100% 0% 0% 100% 0%
149 100% 0% 100% 0% 0% 0% 207 0% 100% 0% 0% 0% 100%
150 100% 0% 100% 0% 0% 0% 208 0% 100% 4% 0% 2% 94%
151 100% 0% 99% 0% 1% 0% 209 7% 93% 7% 0% 93% 0%
152 0% 100% 0% 0% 0% 100% 210 0% 100% 0% 0% 0% 100%
153 1% 99% 0% 0% 100% 0% 211 0% 100% 0% 0% 0% 100%
154 0% 100% 0% 0% 100% 0% 212 0% 100% 10% 0% 0% 90%
155 0% 100% 0% 0% 100% 0% 213 0% 100% 1% 0% 0% 99%
156 0% 100% 0% 0% 0% 100% 214 0% 100% 0% 0% 100% 0%
157 0% 100% 0% 0% 0% 100% 215 0% 100% 0% 0% 94% 6%
158 0% 100% 0% 0% 64% 36% 216 0% 100% 1% 0% 0% 99%
159 0% 100% 0% 0% 98% 2% 217 0% 100% 0% 0% 87% 13%
160 0% 100% 0% 0% 100% 0% 218 0% 100% 0% 0% 98% 0%
161 0% 100% 0% 0% 100% 0% 219 0% 100% 0% 0% 88% 12%
162 0% 100% 0% 0% 0% 100% 220 0% 100% 0% 0% 63% 37%
163 0% 100% 0% 0% 0% 100% 221 0% 100% 0% 0% 33% 67%
164 0% 100% 0% 0% 0% 100% 222 0% 100% 0% 0% 61% 39%
165 31% 69% 24% 0% 34% 42% 223 17% 83% 0% 0% 100% 0%
166 0% 100% 4% 0% 1% 95% 224 0% 100% 0% 0% 28% 72%
167 0% 100% 0% 0% 100% 0% 225 67% 33% 0% 0% 100% 0%
168 0% 100% 0% 0% 0% 100% 226 4% 96% 1% 0% 84% 15%
169 0% 100% 0% 0% 0% 100% 227 0% 100% 0% 0% 0% 100%
170 0% 100% 0% 0% 100% 0% 228 0% 100% 0% 0% 0% 100%
171 0% 100% 0% 0% 100% 0% 229 0% 100% 0% 0% 0% 100%
Table 1. Cont.
Population Assignment of Burkholderia pseudomallei
www.plosntds.org 10 December 2011 | Volume 5 | Issue 12 | e1381
Structure BAPS Structure BAPS
ST Pop1 Pop2 Pop1b Pop1a Pop2a Pop2b ST Pop1 Pop2 Pop1a Pop1b Pop2a Pop2b
172 0% 100% 0% 0% 0% 100% 230 0% 100% 0% 0% 74% 26%
173 0% 100% 0% 0% 0% 100% 231 0% 100% 0% 0% 0% 100%
174 11% 90% 0% 0% 100% 0% 232 0% 100% 0% 0% 15% 85%
175 12% 88% 33% 0% 67% 0% 233 1% 99% 0% 0% 100% 0%
176 0% 100% 0% 0% 100% 0% 235 62% 38% 76% 0% 24% 0%
177 0% 100% 0% 0% 100% 0% 236 100% 0% 62% 0% 38% 0%
178 45% 55% 43% 0% 0% 57% 237 100% 0% 75% 0% 25% 0%
179 78% 22% 78% 0% 0% 22% 238 100% 0% 100% 0% 0% 0%
180 21% 79% 40% 0% 60% 0% 239 100% 0% 100% 0% 0% 0%
181 0% 100% 0% 0% 85% 15% 240 100% 0% 100% 0% 0% 0%
182 0% 100% 0% 0% 0% 100% 241 100% 0% 100% 0% 0% 0%
183 2% 98% 26% 0% 0% 74% 242 99% 1% 100% 0% 0% 0%
184 0% 100% 0% 0% 2% 98% 243 100% 0% 100% 0% 0% 0%
185 0% 100% 0% 0% 0% 100% 244 100% 0% 100% 0% 0% 0%
186 0% 100% 0% 0% 100% 0% 245 100% 0% 78% 0% 22% 0%
187 0% 100% 0% 0% 0% 100% 246 100% 0% 100% 0% 0% 0%
188 12% 88% 0% 0% 100% 0% 247 100% 0% 100% 0% 0% 0%
189 0% 100% 11% 0% 2% 87% 248 100% 0% 93% 0% 7% 0%
Structure BAPS Structure BAPS
ST Pop1 Pop2 Pop1b Pop1a Pop2a Pop2b ST Pop1 Pop2 Pop1a Pop1b Pop2a Pop2b
249 100% 0% 100% 0% 0% 0% 307 6% 94% 0% 0% 100% 0%
250 0% 100% 0% 0% 99% 1% 308 0% 100% 0% 0% 94% 6%
251 72% 28% 0% 0% 100% 0% 309 52% 48% 0% 0% 100% 0%
252 96% 4% 32% 0% 68% 0% 310 0% 100% 0% 0% 93% 7%
253 100% 0% 100% 0% 0% 0% 311 0% 100% 6% 0% 6% 87%
254 100% 0% 98% 0% 2% 0% 312 0% 100% 0% 0% 100% 0%
255 100% 0% 91% 0% 9% 0% 313 2% 98% 0% 0% 100% 0%
256 100% 0% 98% 0% 2% 0% 314 17% 83% 0% 0% 100% 0%
257 100% 0% 100% 0% 0% 0% 315 3% 97% 0% 0% 100% 0%
258 100% 0% 100% 0% 0% 0% 316 15% 85% 0% 0% 100% 0%
259 100% 0% 100% 0% 0% 0% 317 100% 0% 55% 0% 45% 0%
260 100% 0% 99% 0% 0% 0% 319 1% 99% 0% 0% 92% 7%
261 99% 1% 92% 0% 7% 0% 320 100% 0% 100% 0% 0% 0%
262 100% 0% 98% 0% 0% 1% 321 99% 1% 99% 0% 1% 0%
263 100% 0% 100% 0% 0% 0% 322 100% 0% 99% 0% 1% 0%
264 100% 0% 100% 0% 0% 0% 323 99% 1% 35% 0% 65% 0%
265 100% 0% 75% 0% 18% 6% 324 100% 0% 35% 0% 63% 1%
266 100% 0% 100% 0% 0% 0% 325 100% 0% 99% 0% 1% 0%
267 100% 0% 98% 0% 1% 0% 326 100% 0% 100% 0% 0% 0%
268 100% 0% 100% 0% 0% 0% 327 100% 0% 99% 0% 1% 0%
269 100% 0% 72% 0% 0% 28% 328 100% 0% 100% 0% 0% 0%
270 100% 0% 99% 0% 0% 0% 329 100% 0% 100% 0% 0% 0%
271 0% 100% 0% 0% 0% 100% 330 100% 0% 92% 0% 1% 6%
272 36% 64% 0% 0% 100% 0% 331 100% 0% 96% 0% 3% 0%
273 0% 100% 0% 0% 57% 43% 332 100% 0% 100% 0% 0% 0%
274 100% 0% 93% 0% 6% 1% 333 100% 0% 100% 0% 0% 0%
275 100% 0% 100% 0% 0% 0% 334 100% 0% 100% 0% 0% 0%
276 100% 0% 85% 0% 15% 0% 335 94% 7% 100% 0% 0% 0%
277 100% 0% 99% 0% 0% 0% 336 98% 2% 66% 0% 33% 1%
Table 1. Cont.
Population Assignment of Burkholderia pseudomallei
www.plosntds.org 11 December 2011 | Volume 5 | Issue 12 | e1381
Structure BAPS Structure BAPS
ST Pop1 Pop2 Pop1b Pop1a Pop2a Pop2b ST Pop1 Pop2 Pop1a Pop1b Pop2a Pop2b
278 100% 0% 99% 0% 0% 0% 337 100% 0% 100% 0% 0% 0%
279 100% 0% 100% 0% 0% 0% 339 100% 0% 74% 0% 5% 21%
280 91% 9% 44% 0% 11% 45% 340 100% 0% 98% 0% 0% 1%
281 100% 0% 92% 0% 8% 0% 341 100% 0% 100% 0% 0% 0%
282 100% 0% 100% 0% 0% 0% 342 0% 100% 0% 0% 100% 0%
283 100% 0% 100% 0% 0% 0% 343 80% 20% 66% 0% 34% 0%
284 100% 0% 99% 0% 0% 0% 344 100% 0% 94% 0% 6% 0%
285 100% 0% 95% 0% 3% 0% 346 3% 97% 12% 0% 0% 88%
286 100% 0% 100% 0% 0% 0% 347 6% 94% 20% 0% 80% 0%
287 100% 0% 100% 0% 0% 0% 348 34% 66% 19% 0% 81% 0%
288 1% 99% 0% 0% 100% 0% 349 14% 86% 0% 0% 100% 0%
289 0% 100% 0% 0% 0% 100% 350 0% 100% 0% 0% 100% 0%
290 0% 100% 0% 0% 0% 100% 351 0% 100% 0% 0% 0% 100%
291 100% 0% 100% 0% 0% 0% 353 100% 0% 100% 0% 0% 0%
292 100% 0% 100% 0% 0% 0% 354 0% 100% 1% 0% 0% 99%
294 100% 0% 100% 0% 0% 0% 364 0% 100% 0% 0% 0% 100%
295 100% 0% 100% 0% 0% 0% 365 0% 100% 0% 0% 100% 0%
296 100% 0% 100% 0% 0% 0% 366 0% 100% 0% 0% 0% 100%
297 58% 43% 0% 0% 52% 48% 367 0% 100% 0% 0% 100% 0%
298 2% 98% 0% 0% 100% 0% 368 0% 100% 0% 0% 0% 100%
299 0% 100% 0% 0% 100% 0% 369 0% 100% 0% 0% 0% 100%
300 0% 100% 0% 0% 0% 100% 370 66% 34% 26% 0% 30% 44%
301 57% 43% 67% 0% 33% 0% 371 0% 100% 26% 0% 3% 71%
302 1% 99% 31% 0% 0% 69% 372 22% 78% 0% 0% 33% 67%
303 0% 100% 0% 0% 100% 0% 373 0% 100% 0% 0% 0% 100%
304 0% 100% 0% 0% 1% 99% 374 0% 100% 13% 0% 23% 64%
305 0% 100% 0% 0% 0% 100% 375 0% 100% 0% 0% 0% 100%
306 30% 70% 0% 0% 100% 0% 376 0% 100% 0% 0% 0% 100%
Structure BAPS Structure BAPS
ST Pop1 Pop2 Pop1b Pop1a Pop2a Pop2b ST Pop1 Pop2 Pop1a Pop1b Pop2a Pop2b
377 0% 100% 0% 0% 0% 100% 434 100% 0% 100% 0% 0% 0%
378 33% 67% 3% 0% 97% 0% 435 100% 0% 100% 0% 0% 0%
379 0% 100% 0% 0% 0% 100% 436 0% 100% 0% 0% 99% 1%
380 0% 100% 0% 0% 0% 100% 437 100% 0% 98% 0% 0% 0%
381 0% 100% 0% 0% 100% 0% 438 0% 100% 0% 0% 90% 10%
382 2% 98% 19% 0% 81% 0% 439 100% 0% 100% 0% 0% 0%
383 19% 82% 36% 0% 64% 0% 440 100% 0% 100% 0% 0% 0%
384 0% 100% 0% 0% 1% 99% 441 0% 100% 0% 0% 100% 0%
385 0% 100% 0% 0% 0% 100% 442 99% 1% 54% 0% 46% 0%
386 0% 100% 0% 0% 99% 1% 443 100% 0% 98% 0% 0% 1%
387 0% 100% 0% 0% 100% 0% 444 100% 0% 100% 0% 0% 0%
388 0% 100% 0% 0% 32% 68% 445 100% 0% 100% 0% 0% 0%
389 0% 100% 0% 0% 0% 100% 446 100% 0% 60% 0% 40% 0%
390 91% 9% 29% 0% 25% 46% 447 100% 0% 53% 0% 46% 0%
391 98% 2% 40% 0% 60% 0% 448 100% 0% 100% 0% 0% 0%
392 0% 100% 14% 0% 0% 86% 449 100% 0% 96% 0% 1% 2%
393 0% 100% 0% 0% 0% 100% 450 100% 0% 99% 0% 0% 0%
394 0% 100% 0% 0% 0% 100% 451 0% 100% 0% 0% 0% 100%
395 0% 100% 0% 0% 0% 100% 452 100% 0% 68% 0% 32% 0%
Table 1. Cont.
Population Assignment of Burkholderia pseudomallei
www.plosntds.org 12 December 2011 | Volume 5 | Issue 12 | e1381
Structure BAPS Structure BAPS
ST Pop1 Pop2 Pop1b Pop1a Pop2a Pop2b ST Pop1 Pop2 Pop1a Pop1b Pop2a Pop2b
396 0% 100% 0% 0% 99% 1% 453 100% 0% 96% 0% 4% 0%
397 0% 100% 0% 0% 3% 97% 454 100% 0% 100% 0% 0% 0%
398 53% 47% 13% 0% 36% 51% 455 100% 0% 98% 0% 0% 1%
399 0% 100% 0% 0% 22% 78% 456 100% 0% 100% 0% 0% 0%
400 100% 1% 52% 0% 48% 0% 457 100% 0% 75% 0% 0% 25%
401 0% 100% 0% 0% 0% 100% 458 100% 0% 100% 0% 0% 0%
402 0% 100% 0% 0% 70% 30% 459 100% 0% 100% 0% 0% 0%
403 2% 98% 0% 0% 100% 0% 460 100% 0% 100% 0% 0% 0%
404 0% 100% 0% 0% 0% 100% 461 100% 0% 70% 0% 3% 26%
405 46% 54% 62% 0% 38% 0% 462 100% 0% 54% 0% 0% 0%
406 31% 69% 20% 0% 80% 0% 463 100% 0% 98% 0% 0% 0%
407 0% 100% 1% 0% 94% 5% 464 100% 0% 100% 0% 0% 0%
408 0% 100% 0% 0% 0% 99% 465 97% 3% 37% 0% 63% 0%
409 0% 100% 0% 0% 0% 100% 466 100% 0% 99% 0% 1% 0%
410 0% 100% 0% 0% 0% 100% 467 100% 0% 99% 0% 1% 0%
411 0% 100% 0% 0% 100% 0% 468 91% 9% 98% 0% 2% 0%
412 5% 95% 0% 0% 100% 0% 469 100% 0% 100% 0% 0% 0%
413 0% 100% 0% 0% 100% 0% 470 100% 0% 100% 0% 0% 0%
414 0% 100% 0% 0% 0% 100% 471 97% 3% 100% 0% 0% 0%
415 0% 100% 0% 0% 0% 100% 472 4% 96% 33% 0% 1% 66%
416 15% 85% 32% 0% 68% 0% 473 100% 0% 98% 0% 2% 0%
417 1% 99% 0% 0% 100% 0% 476 100% 0% 100% 0% 0% 0%
418 0% 100% 0% 0% 100% 0% 477 100% 0% 98% 0% 2% 0%
419 0% 100% 0% 0% 96% 4% 478 100% 0% 100% 0% 0% 0%
420 6% 94% 0% 0% 53% 47% 479 100% 0% 97% 0% 1% 1%
421 63% 37% 28% 0% 72% 0% 480 100% 0% 100% 0% 0% 0%
422 0% 100% 0% 0% 0% 100% 481 99% 1% 50% 0% 48% 2%
423 0% 100% 0% 0% 0% 100% 482 94% 6% 41% 0% 59% 0%
424 22% 78% 42% 0% 58% 0% 483 100% 0% 94% 0% 0% 6%
425 100% 0% 100% 0% 0% 0% 484 0% 100% 0% 0% 100% 0%
426 20% 80% 0% 0% 100% 0% 485 0% 100% 0% 0% 0% 100%
427 100% 0% 100% 0% 0% 0% 486 0% 100% 0% 0% 0% 100%
428 100% 0% 100% 0% 0% 0% 487 9% 91% 0% 0% 100% 0%
429 100% 0% 86% 0% 9% 5% 488 0% 100% 0% 0% 100% 0%
430 100% 0% 97% 0% 0% 0% 489 0% 100% 0% 0% 100% 0%
431 99% 1% 93% 0% 7% 0% 490 0% 100% 10% 0% 20% 70%
432 100% 0% 100% 0% 0% 0% 491 3% 97% 0% 0% 100% 0%
433 100% 0% 81% 0% 1% 17% 492 0% 100% 0% 0% 100% 0%
Structure BAPS Structure BAPS
ST Pop1 Pop2 Pop1b Pop1a Pop2a Pop2b ST Pop1 Pop2 Pop1a Pop1b Pop2a Pop2b
493 1% 99% 0% 0% 100% 0% 551 0% 100% 0% 0% 0% 100%
494 0% 100% 0% 0% 32% 68% 552 100% 0% 100% 0% 0% 0%
495 0% 100% 0% 0% 0% 100% 553 99% 1% 96% 0% 1% 1%
496 0% 100% 0% 0% 0% 100% 554 100% 0% 100% 0% 0% 0%
497 9% 91% 36% 0% 0% 64% 555 98% 2% 68% 0% 21% 11%
498 4% 96% 0% 0% 80% 20% 556 100% 0% 100% 0% 0% 0%
499 0% 100% 0% 0% 100% 0% 557 100% 0% 100% 0% 0% 0%
500 0% 100% 4% 0% 0% 96% 558 100% 0% 100% 0% 0% 0%
501 4% 96% 2% 0% 98% 0% 559 100% 0% 100% 0% 0% 0%
Table 1. Cont.
Population Assignment of Burkholderia pseudomallei
www.plosntds.org 13 December 2011 | Volume 5 | Issue 12 | e1381
Structure BAPS Structure BAPS
ST Pop1 Pop2 Pop1b Pop1a Pop2a Pop2b ST Pop1 Pop2 Pop1a Pop1b Pop2a Pop2b
502 0% 100% 0% 0% 0% 100% 560 100% 0% 100% 0% 0% 0%
503 0% 100% 0% 0% 100% 0% 561 100% 0% 100% 0% 0% 0%
504 0% 100% 0% 0% 99% 1% 562 0% 100% 0% 0% 42% 58%
505 0% 100% 0% 0% 0% 100% 563 100% 0% 91% 0% 9% 0%
506 0% 100% 0% 0% 0% 100% 564 100% 0% 100% 0% 0% 0%
507 0% 100% 0% 0% 0% 100% 565 100% 0% 99% 0% 0% 0%
508 0% 100% 0% 0% 0% 100% 566 100% 0% 88% 0% 11% 0%
509 0% 100% 0% 0% 97% 3% 567 100% 0% 84% 0% 16% 0%
510 0% 100% 0% 0% 0% 100% 568 99% 1% 100% 0% 0% 0%
511 0% 100% 0% 0% 0% 100% 569 100% 0% 100% 0% 0% 0%
512 0% 100% 0% 0% 0% 100% 570 100% 0% 100% 0% 0% 0%
513 0% 100% 0% 0% 0% 100% 571 100% 0% 85% 0% 15% 0%
514 93% 7% 46% 0% 54% 0% 572 100% 0% 100% 0% 0% 0%
515 100% 0% 87% 0% 13% 0% 573 100% 0% 99% 0% 0% 0%
516 100% 0% 100% 0% 0% 0% 574 100% 0% 82% 0% 17% 1%
517 100% 0% 99% 0% 0% 1% 575 100% 0% 99% 0% 0% 0%
518 11% 89% 1% 0% 99% 0% 576 100% 0% 100% 0% 0% 0%
519 0% 100% 0% 0% 100% 0% 577 100% 0% 100% 0% 0% 0%
520 0% 100% 0% 0% 100% 0% 578 100% 0% 100% 0% 0% 0%
521 0% 100% 0% 0% 100% 0% 579 100% 0% 100% 0% 0% 0%
522 0% 100% 0% 0% 0% 100% 580 98% 2% 86% 0% 0% 14%
523 0% 100% 10% 0% 0% 89% 581 100% 0% 100% 0% 0% 0%
524 3% 97% 20% 0% 19% 61% 582 100% 0% 100% 0% 0% 0%
525 5% 95% 14% 0% 86% 0% 583 100% 0% 100% 0% 0% 0%
526 0% 100% 0% 0% 100% 0% 584 100% 0% 100% 0% 0% 0%
527 0% 100% 0% 0% 0% 100% 585 100% 0% 100% 0% 0% 0%
528 2% 98% 31% 0% 0% 69% 586 100% 0% 100% 0% 0% 0%
529 0% 100% 0% 0% 89% 11% 587 100% 0% 100% 0% 0% 0%
530 0% 100% 0% 0% 0% 100% 588 100% 0% 95% 0% 1% 4%
531 0% 100% 0% 0% 0% 100% 589 0% 100% 0% 0% 85% 15%
532 0% 100% 0% 0% 0% 100% 591 99% 1% 83% 0% 17% 0%
533 0% 100% 0% 0% 4% 96% 592 99% 2% 48% 0% 48% 4%
534 0% 100% 0% 0% 72% 28% 593 91% 9% 1% 0% 99% 0%
535 0% 100% 0% 0% 96% 4% 594 70% 30% 39% 0% 61% 0%
536 0% 100% 0% 0% 100% 0% 595 100% 0% 98% 0% 0% 0%
538 66% 34% 1% 0% 99% 0% 596 97% 4% 0% 0% 99% 0%
539 0% 100% 0% 0% 100% 0% 597 100% 0% 100% 0% 0% 0%
540 0% 100% 0% 0% 0% 100% 598 100% 0% 95% 0% 5% 0%
541 0% 100% 0% 0% 0% 100% 599 100% 0% 99% 0% 1% 0%
542 0% 100% 0% 0% 4% 96% 600 100% 0% 100% 0% 0% 0%
543 0% 100% 0% 0% 59% 41% 601 94% 6% 53% 0% 8% 39%
544 0% 100% 0% 0% 0% 100% 602 100% 0% 99% 0% 1% 0%
545 0% 100% 0% 0% 22% 78% 603 100% 0% 100% 0% 0% 0%
546 0% 100% 16% 0% 0% 84% 604 100% 0% 76% 0% 23% 1%
547 0% 100% 0% 0% 1% 99% 605 100% 0% 97% 0% 3% 0%
548 0% 100% 0% 0% 100% 0% 606 100% 0% 100% 0% 0% 0%
549 0% 100% 0% 0% 0% 100% 607 100% 0% 100% 0% 0% 0%
Table 1. Cont.
Population Assignment of Burkholderia pseudomallei
www.plosntds.org 14 December 2011 | Volume 5 | Issue 12 | e1381
Structure BAPS Structure BAPS
ST Pop1 Pop2 Pop1b Pop1a Pop2a Pop2b ST Pop1 Pop2 Pop1a Pop1b Pop2a Pop2b
550 5% 95% 17% 0% 83% 0% 608 100% 0% 100% 0% 0% 0%
Structure BAPS Structure BAPS
ST Pop1 Pop2 Pop1b Pop1a Pop2a Pop2b ST Pop1 Pop2 Pop1a Pop1b Pop2a Pop2b
609 23% 77% 1% 0% 98% 1% 668 100% 0% 100% 0% 0% 0%
610 100% 0% 100% 0% 0% 0% 670 0% 100% 0% 0% 100% 0%
611 100% 0% 100% 0% 0% 0% 671 49% 51% 23% 0% 75% 1%
612 97% 3% 64% 0% 1% 35% 672 0% 100% 0% 0% 57% 43%
613 100% 0% 79% 0% 0% 20% 673 100% 0% 89% 0% 11% 0%
614 100% 0% 84% 0% 0% 16% 674 100% 0% 100% 0% 0% 0%
616 92% 8% 81% 0% 0% 19% 675 100% 0% 100% 0% 0% 0%
617 100% 0% 100% 0% 0% 0% 676 99% 1% 100% 0% 0% 0%
618 98% 2% 54% 0% 40% 6% 677 14% 86% 0% 0% 46% 54%
619 100% 0% 52% 0% 48% 0% 678 100% 0% 96% 0% 0% 4%
620 100% 0% 100% 0% 0% 0% 679 100% 0% 100% 0% 0% 0%
621 100% 0% 63% 0% 37% 0% 680 100% 0% 65% 0% 35% 0%
622 87% 13% 2% 0% 98% 0% 681 100% 0% 100% 0% 0% 0%
623 100% 0% 70% 0% 2% 28% 682 87% 13% 69% 0% 0% 31%
624 100% 0% 100% 0% 0% 0% 683 100% 0% 99% 0% 0% 0%
625 100% 0% 100% 0% 0% 0% 684 0% 100% 0% 0% 0% 100%
626 100% 0% 100% 0% 0% 0% 685 0% 100% 0% 0% 55% 45%
627 100% 0% 100% 0% 0% 0% 686 0% 100% 12% 0% 0% 88%
628 100% 0% 99% 0% 0% 0% 687 0% 100% 0% 0% 0% 100%
629 100% 0% 100% 0% 0% 0% 688 1% 99% 0% 0% 99% 1%
630 100% 0% 100% 0% 0% 0% 689 1% 99% 0% 0% 100% 0%
631 100% 0% 99% 0% 0% 0% 690 0% 100% 0% 0% 75% 25%
632 100% 0% 96% 0% 4% 0% 691 1% 100% 19% 0% 21% 59%
633 100% 0% 96% 0% 0% 0% 692 28% 72% 10% 0% 90% 0%
634 100% 0% 99% 0% 0% 0% 693 0% 100% 0% 0% 0% 100%
635 100% 0% 98% 0% 2% 0% 694 0% 100% 0% 0% 23% 77%
636 100% 0% 41% 59% 0% 0% 695 11% 89% 44% 0% 0% 55%
637 100% 0% 100% 0% 0% 0% 697 100% 0% 66% 0% 2% 32%
638 100% 0% 94% 0% 2% 4% 698 2% 98% 0% 79% 21% 0%
639 100% 0% 100% 0% 0% 0% 700 79% 21% 32% 0% 68% 0%
640 100% 0% 100% 0% 0% 0% 701 0% 100% 0% 0% 10% 90%
641 100% 0% 100% 0% 0% 0% 702 1% 99% 0% 0% 100% 0%
642 99% 1% 74% 0% 2% 24% 703 2% 98% 3% 0% 97% 0%
643 100% 0% 100% 0% 0% 0% 704 1% 99% 0% 0% 64% 36%
644 100% 0% 100% 0% 0% 0% 705 0% 100% 0% 0% 0% 100%
645 100% 0% 94% 0% 0% 6% 707 3% 97% 0% 0% 99% 1%
647 90% 10% 6% 0% 81% 13% 708 0% 100% 2% 0% 20% 78%
648 100% 0% 94% 0% 4% 2%
649 0% 100% 0% 0% 100% 0%
650 0% 100% 0% 0% 20% 80%
651 1% 99% 0% 0% 81% 19%
652 0% 100% 0% 0% 71% 29%
653 0% 100% 0% 0% 100% 0%
654 0% 100% 0% 0% 0% 100%
655 1% 99% 0% 0% 100% 0%
656 1% 99% 0% 0% 100% 0%
Table 1. Cont.
Population Assignment of Burkholderia pseudomallei
www.plosntds.org 15 December 2011 | Volume 5 | Issue 12 | e1381
to differentiate between the two or three major populations is an
important first step for epidemiological attribution. Increasing
knowledge of the geographic distribution and population structure
of B. pseudomallei STs form the foundation for future work on the
evolution, population dynamics and geographical distribution of
subpopulations of this bacterium.
Supporting Information
Figure S1 Comparison of K values from Structure usingboth ‘admixture’ and ‘no admixture’ models. (A) Log
likelihood and average within run variance associated with
different values of K, (B) Log likelihood of different values of K,
(C) DK for different values of K. Importantly, in this figure it should
be noted that the most likely value is K = 2.
(PDF)
Figure S2 Comparison of K values from Structure runsusing the ‘no admixture’ model. (A) Log likelihood and
average variance associated with different values of K from Structure
along with results from calculating DK from these values and (B)
plot showing the change in DK for each population of K. Analyses
using both models show that K = 2 (i.e. two populations) is the most
supported K value in the B. pseudomallei MLST dataset using
Structure.
(PDF)
Figure S3 Allele frequencies across 664 STs in each B.pseudomallei population. The frequencies of alleles from STs
assigned to each population based on Structure and BAPS are
shown as a stacked bar graph. For BAPS data, Population 1a and
Population 1b were combined as Population 1b only consisted of
three STs. The red bar represents alleles placed in Population 1
(predominantly Australian STs) with $95% probability of
assignment, the green bar represents alleles placed in Population
2 (Structure) and 2a (BAPS) (predominantly Southeast Asian STs)
with $95% probability of assignment, the yellow bar represents
alleles placed in Population 2b with probability of assignment by
BAPS, and the error bars represents the number of alleles placed
in a population with a probability of assignment ,95%.
(PDF)
Table S1 Allele frequencies across 664 STs in each B.pseudomallei population.
(XLSX)
Text S1 Calculating DK (adapted from Evanno et al.[17]).
(DOC)
Acknowledgments
We thank the melioidosis research community for collecting and
sequencing the many Burkholderia isolates that populate the public MLST
database.
Author Contributions
Analyzed the data: JD EPP HH JDB MM DG JTF DMW AT BGS BJC
TP. Contributed reagents/materials/analysis tools: MM DG VW AB JW
BGS SJP BJC. Wrote the paper: JD EPP TP. Interpreted results: JD EPP
JDB DG JTF DMW AT BGS BJC PK TP.
References
1. Currie BJ, Dance DAB, Cheng AC (2008) The global distribution of Burkholderia
pseudomallei and melioidosis: an update. Trans R Soc Trop Med Hyg 102: S1–S4.
2. Aldhous P (2005) Tropical medicine: melioidosis? Never heard of it. Nature 434:
692–693.
3. Tuanyok A, Auerbach RK, Brettin TS, Bruce DC, Munk AC, et al. (2007) A
horizontal gene transfer event defines two distinct groups within Burkholderia
pseudomallei that have dissimilar geographic distributions. J Bacteriol 189:
9044–9049.
4. White NJ (2003) Melioidosis. Lancet 361: 1715–1722.
5. Cheng AC, Currie BJ (2005) Melioidosis: epidemiology, pathophysiology, and
management. Clin Microbiol Rev 18: 383–416.
6. Dance DA (2002) Melioidosis. Curr Opin Infect Dis 15: 127–132.
7. Maiden MC (2006) Multilocus sequence typing of bacteria. Annu Rev Microbiol
60: 561–588.
8. Godoy D, Randle G, Simpson AJ, Aanensen DM, Pitt TL, et al. (2003)
Multilocus sequence typing and evolutionary relationships among the causative
agents of melioidosis and glanders, Burkholderia pseudomallei and Burkholderia
mallei. J Clin Microbiol 41: 2068–2079.
9. Vesaratchavest M, Tumapa S, Day NP, Wuthiekanun V, Chierakul W, et
al. (2006) Nonrandom distribution of Burkholderia pseudomallei clones in
relation to geographical location and virulence. J Clin Microbiol 44:
2553–2557.
10. Currie BJ, Thomas AD, Godoy D, Dance DA, Cheng AC, et al. (2007)
Australian and Thai isolates of Burkholderia pseudomallei are distinct by
Structure BAPS Structure BAPS
ST Pop1 Pop2 Pop1b Pop1a Pop2a Pop2b ST Pop1 Pop2 Pop1a Pop1b Pop2a Pop2b
657 0% 100% 0% 0% 100% 0%
658 0% 100% 0% 0% 0% 100%
659 5% 95% 0% 0% 100% 0%
660 100% 0% 75% 0% 12% 12%
661 0% 100% 0% 0% 98% 2%
662 5% 95% 0% 0% 99% 0%
663 100% 0% 57% 0% 0% 43%
664 100% 0% 94% 0% 6% 0%
665 100% 0% 100% 0% 0% 0%
666 100% 0% 96% 0% 1% 2%
667 100% 0% 100% 0% 0% 0%
doi:10.1371/journal.pntd.0001381.t001
Table 1. Cont.
Population Assignment of Burkholderia pseudomallei
www.plosntds.org 16 December 2011 | Volume 5 | Issue 12 | e1381
multilocus sequence typing: revision of a case of mistaken identity. J Clin
Microbiol 45: 3828–3829.
11. Pearson T, Giffard P, Beckstrom-Sternberg S, Auerbach R, Hornstra H, et al.
(2009) Phylogeographic reconstruction of a bacterial species with high levels of
lateral gene transfer. BMC Biol 7: 78.
12. Turner SL, Young JP (2000) The glutamine synthetases of rhizobia:
phylogenetics and evolutionary implications. Mol Biol Evol 17: 309–319.
13. Pritchard JK, Stephens M, Donnelly P (2000) Inference of population structure
using multilocus genotype data. Genetics 155: 945–959.
14. Falush D, Wirth T, Linz B, Pritchard JK, Stephens M, et al. (2003) Traces of
human migrations in Helicobacter pylori populations. Science 299:
1582–1585.
15. Falush D, Stephens M, Pritchard JK (2003) Inference of population structure
using multilocus genotype data: linked loci and correlated allele frequencies.
Genetics 164: 1567–1587.
16. Duan J, Mu J, Thera MA, Joy D, Kosakovsky Pond SL, et al. (2008) Population
structure of the genes encoding the polymorphic Plasmodium falciparum apical
membrane antigen 1: implications for vaccine design. Proc Natl Acad Sci U S A
105: 7857–7862.
17. Evanno G, Regnaut S, Goudet J (2005) Detecting the number of clusters of
individuals using the software STRUCTURE: a simulation study. Mol Ecol 14:
2611–2620.
18. Latch E, Dharmarajan G, Glaubitz J, Rhodes OJ (2006) Relative performance
of Bayesian clustering software for inferring population substructure and
individual assignment at low levels of population differentiation. Conservation
Genetics 7: 295–302.
19. Corander J, Gyllenberg M, Koski T (2007) Random partition models and
exchangeability for Bayesian identification of population structure. Bull Math
Biol 69: 797–815.
20. Corander J, Marttinen P (2006) Bayesian identification of admixture events
using multilocus molecular markers. Mol Ecol 15: 2833–2843.21. Corander J, Marttinen P, Siren J, Tang J (2008) Enhanced Bayesian modelling
in BAPS software for learning genetic structures of populations. BMC
Bioinformatics 9: 539.22. Corrander J, Waldmann P, Marttinen P, Sillanpaa MJ (2004) BAPS 2:
enhanced possibilities for the analysis of genetic population structure.Bioinformatics 20.
23. Peakall RaSPE (2006) GENALEX 6: genetic analysis in Excel. Population
genetic software for teaching and research. Molecular Ecology Notes. pp288–295.
24. Smouse PE, Peakall R (1999) Spatial autocorrelation analysis of individualmultiallele and multilocus genetic structure. Heredity 82(Pt 5): 561–573.
25. Price EP, Thiruvenkataswamy V, Mickan L, Unicomb L, Rios RE, et al. (2006)Genotyping of Campylobacter jejuni using seven single-nucleotide polymor-
phisms in combination with flaA short variable region sequencing. J Med
Microbiol 55: 1061–1070.26. Robertson GA, Thiruvenkataswamy V, Shilling H, Price EP, Huygens F, et al.
(2004) Identification and interrogation of highly informative single nucleotidepolymorphism sets defined by bacterial multilocus sequence typing databases.
J Med Microbiol 53: 35–45.
27. Stephens AJ, Huygens F, Inman-Bamber J, Price EP, Nimmo GR, et al. (2006)Methicillin-resistant Staphylococcus aureus genotyping using a small set of
polymorphisms. J Med Microbiol 55: 43–51.28. Price EP, Inman-Bamber J, Thiruvenkataswamy V, Huygens F, Giffard PM
(2007) Computer-aided identification of polymorphism sets diagnostic for groupsof bacterial and viral genetic variants. BMC Bioinformatics 8: 278.
29. Hanage WP, Fraser C, Spratt BG (2006) The impact of homologous
recombination on the generation of diversity in bacteria. J Theor Biol 239:210–219.
Population Assignment of Burkholderia pseudomallei
www.plosntds.org 17 December 2011 | Volume 5 | Issue 12 | e1381


