Embed Size (px)
Citation preview

ORIGINAL PAPER
EPR dosimetry intercomparison using smart phone touch screenglass
Paola Fattibene • Francois Trompier • Albrecht Wieser • Maria Brai • Bartlomej Ciesielski • Cinzia De Angelis •
Sara Della Monaca • Tristan Garcia • H. Gustafsson • Eli Olag Hole • M. Juniewicz • K. Krefft • Anna Longo •
Philippe Leveque • Eva Lund • Maurizio Marrale • Barbara Michalec • Gabriela Mierzwinska • J. L. Rao •
Alexander A. Romanyukha • Hasan Tuner
Received: 5 August 2013 / Accepted: 26 February 2014
� Springer-Verlag Berlin Heidelberg 2014
Abstract This paper presents the results of an interlab-
oratory comparison of retrospective dosimetry using the
electron paramagnetic resonance method. The test material
used in this exercise was glass coming from the touch
screens of smart phones that might be used as fortuitous
dosimeters in a large-scale radiological incident. There
were 13 participants to whom samples were dispatched,
and 11 laboratories reported results. The participants
received five calibration samples (0, 0.8, 2, 4, and 10 Gy)
and four blindly irradiated samples (0, 0.9, 1.3, and
3.3 Gy). Participants were divided into two groups: for
group A (formed by three participants), samples came from
a homogeneous batch of glass and were stored in similar
setting; for group B (formed by eight participants), samples
came from different smart phones and stored in different
settings of light and temperature. The calibration curves
determined by the participants of group A had a small error
and a critical level in the 0.37–0.40-Gy dose range,
whereas the curves determined by the participants of group
B were more scattered and led to a critical level in the
1.3–3.2-Gy dose range for six participants out of eight.
Group A were able to assess the dose within 20 % for the
lowest doses (\1.5 Gy) and within 5 % for the highest
doses. For group B, only the highest blind dose could be
evaluated in a reliable way because of the high critical
values involved. The results from group A are encouraging,
whereas the results from group B suggest that the influence
of environmental conditions and the intervariability of
samples coming from different smart phones need to be
further investigated. An alongside conclusion is that the
Disclaimer: The views expressed in this paper are those of the authors
and do not necessarily reflect the official policy or position of the
Department of the Navy, Department of Defense, nor the US
Government.
P. Fattibene (&) � C. De Angelis � S. D. Monaca
Istituto Superiore di Sanita, Viale Regina Elena 299,
00161 Rome, Italy
e-mail: [email protected]
F. Trompier � J. L. Rao
Institut de Radioprotection et de Surete Nucleaire,
Fontenay-aux-Roses, France
A. Wieser
Institute of Radiation Protection, Helmholtz Zentrum Munchen -
German Research Center for Environmental Health,
85764 Neuherberg, Germany
M. Brai � A. Longo � M. Marrale
Dipartimento di Fisica e Chimica, Universita di Palermo,
Viale Delle Scienze, Edificio 18, 90128 Palermo, Italy
B. Ciesielski � M. Juniewicz � K. Krefft
Medical University of Gdansk, Gdansk, Poland
T. Garcia
CEA, LIST, Laboratoire National Henri Becquerel,
91191 Gif-sur-Yvette, France
H. Gustafsson � E. Lund
Radiation Physics, Department of Medicine and Health Sciences,
Linkoping University, 581 83 Linkoping, Sweden
E. O. Hole
Department of Physics, University of Oslo (UiO),
P.O. Box 1048, Blindern, 0316 Oslo, Norway
P. Leveque
Universite Catholique de Louvain, Louvain, Belgium
B. Michalec � G. Mierzwinska
The Henryk Niewodniczanski Institute of Nuclear Physics,
Krakow, Poland
123
Radiat Environ Biophys
DOI 10.1007/s00411-014-0533-x

protocol was easily transferred to participants making a
network of laboratories in case of a mass casualty event
potentially feasible.
Keywords EPR dosimetry � Radiological emergency �Retrospective dosimetry � Glass
Introduction
Electron paramagnetic resonance (EPR) dosimetry of for-
tuitous materials has been recognized since the 1960s, but
the increased concern about radiological accidents and
threats in the last decade has renewed the interest of the
scientific community in this topic. Among the investigated
materials, glass has always been proposed as having a great
potential for improvement. There have been a number of
valuable studies of soda-lime glass as found in windows
and wrist watches (Marrale et al. 2011; Trompier et al.
2009; Bassinet et al. 2010; Gancheva et al. 2006; Engin
et al. 2006; Teixeira et al. 2005; Wu et al. 1995; Wieser
and Regulla 1990; Griscom 1980). According to these
works, soda-lime glass is suitable for retrospective
dosimetry, because it exhibits a specific radiation-induced
signal with a linear dose response (generally ascribed to an
oxygen hole center) and has a detection limit estimated
around 1–2 Gy (mainly limited by a partially overlapping
background signal) and a 10–35 % decay at room tem-
perature during the first 24–48 h after irradiation, after
which the signal remains stable within the uncertainties.
However, windows cannot provide the individual dose to
the potentially exposed persons, and wrist watches are
more and more frequently made with materials other than
mineral glass. This is probably at least one of the reasons
why the study of this material was not developed very far.
Nowadays, glass is also found in the displays of mobile
phones and more generally in electronic portable devices,
which represent probably the most ubiquitous personal
items in a large part of the world. Such ubiquity, together
with preliminary findings (Trompier et al. 2011a, b), sug-
gests that mobile phones are the ideal item for accident
individual dosimetry. Thus, liquid crystal display (LCD)
glass was proposed as a material for dosimetric triage in
case of mass casualties events in an EC project, MULTI-
BIODOSE.1 In the first phase of the project, sixty-eight
models of mobile phones were studied (Trompier et al.
2012). In this study, the types of glass found in LCD and
touch screens were identified and their EPR properties
evaluated, such as the presence of signals before irradia-
tion, the line shape of radiation-induced signals, the post-
irradiation signal stability, and the frequency of occurrence
of each type of glass in mobile phones. In particular, one
glass type showed characteristics by far more suitable to
dosimetry and triage application than other types. This type
of glass was found only in touch screens. For most types of
smart phone models, it is commercially known as Gorilla
Glass�.2 The properties of this material were further
explored (MULTIBIODOSE 2013), and a preliminary
protocol based on this glass was implemented.
In November 2012, an interlaboratory exercise took
place, within two EC projects, MULTIBIODOSE and
RENEB,3 at the same time on five dosimetric assays: the
dicentrics; the micronucleus; the gamma-H2AX foci
assays; the optically stimulated luminescence (OSL) in
resistors extracted from portable electronic devices; and the
EPR in touch screen glass (Kulka et al. 2012). The aim was
to evaluate the provision of the implemented methods to
assess correct dose categories (low exposure \1 Gy;
intermediate exposure 1–2 Gy; high exposure[2 Gy). In a
radiological incident, this dose characterization can be used
to prioritize individuals for further clinical assessment
(and, if necessary, treatment) based on their likely magni-
tude of exposure. Since the EPR protocol with the Gorilla
Glass� (MULTIBIODOSE 2013) estimated a dose detec-
tion limit around 1 Gy, for this method, the dose categories
of low and intermediate exposure were merged, and only
two categories were used: low–intermediate exposure
\2 Gy and high exposure [2 Gy. The OSL and the EPR
tools were tested in a network of participants associated
with the European Radiation Dosimetry Group (EURA-
DOS4). This paper describes the EPR results of that
exercise.
The EPR intercomparison was carried out in parallel in
two groups of laboratories: group A received samples taken
by an approximately homogenous bulk of glass fragments
of several smart phones stored in the same conditions
before the EPR measurements; the results from this group
were expected to validate the protocol under optimal and
monitored conditions. Group B received samples irradiated
at different doses that came from different smart phones,
and shipping and storing conditions were different among
J. L. Rao
Sri Venkateswara University, Tirupati 517502, Andhra Pradesh,
India
A. A. Romanyukha
Naval Dosimetry Center, US Navy, Bethesda, MD, USA
H. Tuner
Department of Physics, Faculty of Art and Science, Balikesir
University, 10145 Cagis, Balıkesir, Turkey
1 http://www.multibiodose.eu.2 http://www.corninggorillaglass.com/.3 http://www.reneb.eu.4 http://www.eurados.org.
Radiat Environ Biophys
123

laboratories; the results from this group were expected to
evaluate the method performances in a situation with
multiple and not fully monitored or controlled variables,
close to what could likely occur in a real accidental
situation.
Materials and methods
Participants recruitment and instructions
Thirteen institutes from nine European countries and one US
institute participated in the interlaboratory comparison. The
participants were split into two groups: group A (participants
4, 11, and 13) and group B (participants 1, 2, 3, 5, 6, 7, 9, and
10). Participants 2, 4, and 5 were MULTIBIODOSE partners
(Helmholtz Zentrum Muenchen, IRSN, and ISS, respec-
tively), and they were the organizers of this exercise.
During a two-day preparatory meeting, organized at IRSN,
the participants were trained on the use of the protocol, i.e.,
sample preparation, measurement, signal evaluation, and
uncertainty assessment. This training was considered neces-
sary, because most of the participants did not have any pre-
vious expertise on EPR dosimetry with glass.
The participants received the samples that they were
asked to measure at their own laboratories with the aim to
determine the calibration curve and to assess the blind
doses. Participants were asked to report the signal ampli-
tude, the calibration curve parameters, the blind doses, the
EPR spectra, and details on storing conditions. Participants
8 and 12 received the samples, but they did not report
results because of difficulties in handling the spectra and of
serious failures of their instruments, respectively.
Sample preparation
The EPR measurements were taken with smart phone touch
screens made of Gorilla Glass�. Twenty-two smart phones
of the same model were purchased from the same supplier,
and the glasses were disassembled from the smart phones.
The main difference between the two groups was in the
sample selection: for group A, an approximately homoge-
neous batch of mixed samples was used, whereas for group B,
individual samples coming from different mobile phones were
used at each dose. Specifically, for the samples of group A,
glasses from five smart phones were crushed in pieces of the
size of approximately 1–3 mm, mixed together, and then
separated again in nine aliquots of approximately 600 mg, out
of which four aliquots were irradiated at calibration doses and
three at blind doses (as described in the next section). The two
remaining aliquots were not irradiated. Every aliquot (irradi-
ated and non-irradiated) of 600 mg was divided into three
fractions of about 200 mg. The three participants received a
whole set of calibration samples, blind dose samples, and two
non-irradiated samples. One of the two non-irradiated samples
was blind, i.e., the participant did not know that it had not been
irradiated. All samples were stored in the same conditions at
one laboratory for the first week and then shipped to the par-
ticipant laboratories. For the samples of group B, touch
screens from nine smart phones were used separately for every
dose. Seven touch screens were irradiated (as described in the
next section), and two were not irradiated. In this case, the
glass samples from different smart phones were not mixed and
every calibration and blind sample was coming from a dif-
ferent smart phone. Each of the nine touch screens was cru-
shed and divided into ten aliquots of about 200 mg, which
were distributed among the participants.
Sample irradiation
Calibration samples were irradiated with 0.8, 2, 4, and
10 Gy, and one sample was kept non-irradiated as a con-
trol. The blind doses were as follows: 0, 0.9, 1.3, and
3.3 Gy. The irradiation was performed at IRSN with a 60Co
radiation source calibrated in terms of air kerma. The dose
rate in air kerma was 2 Gy/min. A 4-mm PMMA plate was
used to insure electronic equilibrium. The dimension of the
beam was 10 9 10 cm.
EPR measurements
No detailed measurement protocol was distributed. The
participants were left free to choose the EPR acquisition
parameters within of a suggested range of modulation
amplitude (between 0.1 and 0.3 mT) and microwave power
(defined for different microwave cavities). The only
requirement was to replicate three times the EPR mea-
surement of each sample. Participants used about 100 mg
for every single measurement: an aliquot of 100 mg was
taken from the total 200 mg amount of glass for every
dose, measured, and then mixed again, and a different
aliquot was taken for the following measurement.
Sample storing
For group A, all samples were stored in the same condi-
tions for one week after irradiation at IRSN and then dis-
tributed to participants.
For group B, samples were distributed to participants on
the irradiation day and stored in the participating laboratories
in different environmental conditions. No special recom-
mendations were given to participants regarding sample
storing, except of keeping the samples exposed to light for at
least 5 days in order to speed up the decay of unstable EPR
signal components. This requisite was based on preliminary
findings where the presence of a spectrum component
Radiat Environ Biophys
123

sensitive to light was observed (MULTIBIODOSE 2013).
This component was stable up to at least one year when the
sample was stored in dark, whereas it was canceled within
5 days after irradiation if the sample was exposed in light.
Although the fading mechanism and the origin of such
component have not been elucidated, the participants agreed
to expose their samples to light for at least 5 days. Partici-
pants were asked to report details of the storing conditions.
Temperature was monitored in every laboratory and limited
in the 19–23 �C range. Light exposure conditions (artificial
or natural light) varied notably among participants: artificial
light (participants 1 and 2); natural cloudy/shadow light (3, 4,
7, 9, 11, and 13); direct bright sunlight (10); and a combi-
nation of all (5, 6). An analysis of the relation between
storing conditions (illumination and duration) and results
was tempted, but the poor statistics did not allow evidencing
any influence. The number of days between irradiation and
measurements varied within 5–70 days after exposure to
ionizing radiation.
Signal evaluation
A dedicated spectrum analysis software was provided to
participants to evaluate the EPR-dose-dependent signal. The
software ‘‘EPR dosimetry’’ (Koshta et al. 2000), which was
designed for the isolation of the EPR-radiation-induced
signal in tooth enamel EPR spectrum, had been adapted to
the EPR spectrum of Gorilla Glass� within the framework of
the MULTIBIODOSE project. EPR dosimetry is based on
the best fit of the experimental spectrum with a set of
Gaussian lines, spectrum-simulated lines, and experimental
reference spectra. The spectrum equation is as follows:
FðHÞ ¼XðAifiðHÞÞ ð1Þ
where Ai and fi(H) are the amplitude and the shape of signal
i at field value H, respectively.
In this work, the fi(H) functions were based on experi-
mental spectra measured with a non-irradiated sample and
measured with a 10-Gy exposed sample at least 5 days after
irradiation; these were used as model spectra by the par-
ticipants. In this paper, they will be called ‘‘reference
spectra.’’ The participants could either create their own
model spectra measuring the non-irradiated and the 10-Gy
samples or use a set of model spectra provided by partici-
pant 2 and acquired before the start of the intercomparison.
Some participants tested both sets of ‘‘reference spectra,’’
but no influence was evidenced on the estimated doses. The
reference spectra and the experimental spectra were taken
with the same acquisition parameters and in the same
external conditions, except that a larger number of spectrum
scans for the reference spectra were used in order to
improve signal-to-noise ratio.
Data analysis
Critical levels (CL) and detection limits (DL) were calcu-
lated from the unweighted calibration curves (Zorn et al.
1997; Wieser et al. 2008; Fattibene et al. 2011 and refer-
ences therein); DL and CL refer to two different concepts.
The critical level allows the measured signal to be distin-
guished from the background noise, and it is inherent to the
instrument. In other words, if the result of a measurement is
higher than the critical level, then the measurement is
detecting a physical effect, with a given probability a of
being false positive. The detection limit specifies the
minimum (true) value of the measurand (here the EPR
signal intensity), which can be detected with a given
probability b of error using the measuring method in
question. In other words, the detection limit allows a
decision to be made whether the method under question is
suitable for a given purpose of the measurement.
Statistical tests were carried out to identify outliers,
leverage points, and influential points of the calibration
curves. These are described in ‘‘Appendix 1.’’ The results
of the blind dose test were analyzed in two steps: firstly, the
evaluation of the ability to assess the dose; secondly, a
check on the ability of the method to assign the dose cat-
egory in case of a triage.
Results
Calibration curves
All participants determined the dose–response curve using
the calibration samples irradiated at IRSN. The calibration
curves of group A and group B laboratories are shown sep-
arately in Fig. 1. The data points are the mean value of three
replicated measurements, while the error bars represent one
standard deviation (SD) of the three measurements; the SD
values were in the 1–15 % range (within the symbols in the
figures). All curves were normalized to the 10-Gy data point.
The parameters of the linear fit and the related statistics are
shown in Table 1. The linearity of the curves was demon-
strated statistically at 5 % significance level for both groups
[A: Pearson’s r (0.998) F test (prob [ F = 0); B: F test
(prob [ F in the 0.007–4.6 9 10-10 range)]. The residuals
(not shown) followed a normal distribution for all laborato-
ries (according to Chen–Shapiro test). The distribution shape
of the residuals suggested that variance was constant
throughout the dose range. The deviation of the experimental
points from the linear fits within each laboratory, and the
interlaboratory variation of the EPR measurements at each
dose were much larger in group B than in group A. The
largest interlaboratory variation of the EPR measurements
was observed at the 0.8-Gy calibration dose.
Radiat Environ Biophys
123

CL and DL values of group A calibration curves were very
similar for all laboratories and were in the 0.37–0.40- and
0.74–0.79-Gy dose range, respectively. These values are
appropriate for detection of doses below 1 Gy. Both CL and
DL values were significantly higher for group B than for group
A, and in most cases, they were not appropriate for dose
estimation below 1 Gy. Laboratories 5 and 10 reported the
lowest slope values and the highest detection limits.
Identification of outliers and influential data points
in the calibration curves
During the analysis, all participants identified the calibra-
tion sample at 0.8 Gy as having an unusual line shape and
higher intensity. For this reason, some participants pro-
vided alongside the results obtained without the 0.8-Gy
calibration point. This remark from the participants stim-
ulated us to investigate whether the 0.8-Gy dose data point
was an influential point in the calibration curves. For this
purpose, statistical tests were carried out to identify outli-
ers, leverage points, and influential points of the calibration
curves. These tests are described in ‘‘Appendix 1.’’ The
results of these tests did not suggest that the 0.8-Gy data
point was an influential point for any participant.
Determination of blind doses
Figure 2 shows the dose obtained by all participants from
the mean value of three replicated measurements of the
blind dose samples and Table 2 reports the associated
uncertainties. The empty cells of the table are related to
data that were not reported by the participants.
The participants of group A were able to assess correctly
the three doses within 1 SD, except for two doses where the
agreement was within 2 and 3 SDs. The participants of
group B, at a first glance, were able to distinguish between
the lower and the higher irradiated samples, but not
between the low and the intermediate dose samples.
Highest reported doses were in the 2.9–4.5-Gy dose range
and were on average 2.1 ± 0.5 Gy higher than the lowest
Table 1 Linear fit parameters of the calibration curves and related statistics, critical values, and detection limits
Group Participant Y-intercept (A.U.) Slope (A.U./Gy) X-intercept (Gy) Statistics Critical
value (Gy)
Detection
limit (Gy)Value SE Value SE Adj. R2 Pearson’s r
A 4 0.018 0.008 0.096 0.002 0.187 0.998 0.996 0.40 0.79
A 11 0.029 0.007 0.097 0.002 0.299 0.998 0.997 0.37 0.74
A 13 0.040 0.008 0.096 0.002 0.417 0.998 0.996 0.40 0.79
B 1 0.098 0.028 0.088 0.006 1.122 0.944 0.974 1.57 3.10
B 2 0.087 0.028 0.092 0.006 0.946 0.950 0.976 1.49 2.94
B 3 0.101 0.041 0.088 0.008 1.153 0.885 0.945 2.33 4.61
B 5 0.322 0.079 0.070 0.016 4.609 0.560 0.769 5.60 11.91
B 6 0.176 0.054 0.083 0.011 2.123 0.802 0.903 3.20 6.38
B 7 0.125 0.026 0.087 0.005 1.440 0.958 0.981 1.35 2.67
B 9 0.099 0.027 0.089 0.005 1.114 0.950 0.977 1.48 2.92
B 10 0.190 0.053 0.079 0.012 2.403 0.756 0.880 4.16 8.46
(a)
(b)
Fig. 1 Calibration curves normalized to the amplitude of the 10-Gy
dose sample, for participants of group A (top) and group B (bottom)
Radiat Environ Biophys
123

doses for all participants, except for participants 5 and 10
(for the latter, a thorough discussion is carried out below).
Some participants provided a dose significantly lower (i.e.,
exceeding the associated uncertainty) for the 1.3-Gy irra-
diated sample than for the 0.9-Gy irradiated sample (par-
ticipants 6 and 7). The non-irradiated samples were
identified (significantly) as irradiated by one participant
(participant 10).
However, interpretation of results provided by group B
participants needs a deeper reading. Comparison between
Tables 1 and 2 suggests that for five participants (3, 5, 6, 7,
and 10), most of the values reported for the low–interme-
diate doses were below the CL. Even the lowest CL of
group B, which was obtained by participant 7, was
1.35 Gy, i.e., higher than both the lowest and the inter-
mediate blind doses. At such doses, no participant could
conclude whether these samples had been irradiated or not.
Excluding participants 5, 6, and 10, the highest blind dose
was always higher than the CL, and therefore, the partici-
pants were able to identify the highest blind sample as
irradiated. However, only for four participants (1, 2, 7, and
9), the highest dose was also higher than the DL.
The results of participant 10 were significantly higher
than those of the other participants, and the assessed dose
was more than three standard deviations higher than the
nominal dose, but the Grubbs test could not identify these
values as outliers; moreover, they turned out to fall within
the range [Q1–1.5 9 IQR: Q3 ? 1.5 9 IQR] where Q1,
Q3, and IQR are the first quartile, the third quartile, and the
interquartile range of the distribution, respectively. Only
two replicate measurements of the non-irradiated sample of
participant 10 were identified as outliers according to the
aforementioned tests. The relevant overestimation and the
large SD of the assessed doses call for a further investi-
gation of the results obtained by this participant.
Discussion and conclusions
The EPR results of the present intercomparison evidenced
a diversity in the method performances according to whe-
ther the samples were coming from a homogeneous batch
of glass (as those distributed to group A) or from different
smart phones (as those of group B). The variability of the
EPR response per unit dose and of the EPR spectrum line
shape of samples of group B, and the consequent large fit
error of the calibration curve were especially critical for the
determination of the DL. The standard error of the cali-
bration curve slope was, on average, a factor of 5 higher in
group B than in group A, which corresponds to a detection
limit that was fivefold higher in group B than in group A.
The calibration-based detection limit was 0.75 Gy for the
three participants of group A, but approximately in the
2.7–3.1-Gy dose range for four participants of group B and
(sometimes significantly) higher than 4 Gy for the other
four participants.
When looking at the results of the assessed blind doses,
those by group A were very satisfactory. Participants of
this group were able to identify correctly all blind doses
(0.9, 1.3, 3.3, and 0 Gy) within 95 % confidence interval.
The agreement between the measured and the nominal
doses was within 20 % in the dose range lower than 1.5 Gy
and within 5 % for the dose of 3.3 Gy, for all the partici-
pants of this group. The results of group B were less sat-
isfactory. As a consequence of the high DL values, no
participant of group B was able to assign the dose correctly
for doses around 1 Gy, and only four participants out of
eight assigned correctly the highest dose. All participants
of group B, except for one, were able to identify correctly
the non-irradiated samples.
It should be pointed out that, in principle, the calibration
curve that was used to assess the unknown dose should have
been built only with the calibration doses higher than the
detection limit. This was the case for the calibration curves
of all participants of group A. For group B, however, four
participants calibration doses lower than 2 Gy and the other
four participants calibration doses lower than 4 Gy should
have been excluded from the linear fit. Note that, based on
preliminary findings (MULTIBIODOSE 2013), such high
Fig. 2 Measured dose per participant of group A (top) and B
(bottom)
Radiat Environ Biophys
123

DL values were completely unexpected. When it was
realized that unexpected factors had occurred which led to
high DL values in some laboratories, the design of the
intercomparison should have been modified and the exer-
cise repeated. This will certainly be an objective of future
work, but, at this stage, the authors believe that the results
obtained so far are nevertheless worth to be analyzed and
published. In fact, the results of the intercomparison, on the
one hand (group A), confirmed the hypothesis that the glass
found in touch screens is intrinsically suitable for dosi-
metric triage, with a DL lower than 1 Gy and a high
potential for interlaboratory transfer. On the other hand, the
results from group B are also interesting, because they allow
to evidence possible pitfalls of the method that could turn
out to be troublesome in a real situation.
Possible explanations for the unexpected results from
group B are given here, together with suggestions for fur-
ther investigation:
• The reason for the variability of the background line
shape and of the radiation-induced signal increase per
dose unit of glass, when coming from different smart
phones, cannot be explained by different quality and
composition of the original glass making the touch
screens. In fact, the EPR signals of the Gorilla Glass�
were studied in several glasses coming from different
smart phone models and brands in a previous study
(Trompier et al. 2012), and variations like the ones
observed in the present work were not reported.
• Inexperience of participants might be one cause of the
high variability of results, but it does not apply to all
participants of group B, because participants 2 and 5
were two of the organizers of this exercise and had the
highest experience. As shown in ‘‘Appendix 2,’’
participant 5 performed reasonably well when they
measured samples that had been stored fortuitously in
the absence of light.
• A more sound explanation could be a different sensi-
tivity of the glass to environmental parameters, which
were variable among laboratories and not always
monitored. Exposure to light and, or, temperature or a
combination of the two might have an impact on the
EPR spectrum. For instance, the worse performing
participants (5, 6, and 10) exposed their samples to
direct bright sunlight. In the present study, it was not
possible to draw any conclusion on the possible
influence of sample storing and preparation conditions
on the EPR spectrum, but these should be certainly
studied in the future;
• The effect of the intersample variability on the
calibration curve uncertainty could be partially
bypassed using several samples, coming from different
smart phones, per calibration dose. This would average
Ta
ble
2M
ean
val
ues
of
the
do
ses
mea
sure
db
yev
ery
par
tici
pan
to
fg
rou
ps
Aan
dB
±th
est
and
ard
dev
iati
on
of
the
thre
ere
pli
cate
dm
easu
rem
ents
.T
he
fig
ure
inb
rack
ets
isth
eu
nce
rtai
nty
asso
ciat
edto
the
cali
bra
tio
ncu
rve
(1si
gm
a).
All
fig
ure
sar
eex
pre
ssed
inG
y
Act
ual
dose
(Gy)
Par
tici
pan
tID
AB
411
13
12
35
67
910
0.9
0.7
±0.2
(0.2
)1.2
±0.7
(0.2
)1.0
±0.1
(0.2
)2.1
±0.2
(0.8
)2.5
±0.0
(0.7
)1.5
±0.4
(1.1
)-
0.7
±0.6
(2.8
)1.5
±0.1
(1.6
)1.7
±0.1
(0.6
)1.6
±0.2
(0.7
)3.7
±0.5
(2.0
)
1.3
1.2
±0.1
(0.2
)1.4
±0.1
(0.2
)1.6
±0.1
(0.2
)2.2
±0.2
(0.8
)2.6
±0.1
(0.7
)1.0
±0.3
(1.1
)-
0.8
±0.2
(2.8
)1.2
±0.1
(1.6
)1.1
±0.2
(0.6
)1.9
±0.2
(0.7
)4.1
±0.5
(2.0
)
3.3
3.2
±0.2
(0.2
)3.4
±0.1
(0.2
)4.3
±0.1
(0.8
)4.5
±0.0
(0.7
)3.6
±0.5
(1.1
)2.5
±0.4
(2.8
)2.9
±0.1
(1.5
)2.9
±0.1
(0.6
)4.1
±0.1
(0.7
)6.4
±0.3
(2.0
)
0.0
-0.3
±0.1
(0.2
)0.4
±0.0
(0.8
)-
0.7
±0.0
(0.7
)-
1.2
±0.6
(1.2
)-
3.2
±0.4
(2.7
)-
2.1
±0.1
(1.6
)-
0.7
±0.0
(0.7
)3.2
±0.6
(2.1
)
Radiat Environ Biophys
123

out the individual variations and would lead to a
reduction in the fit error of the calibration curves and
then of the DL.
• Finally, the EPR acquisition parameters, i.e., modula-
tion amplitude and microwave power, were not opti-
mized for every spectrometer. It is expected that
acquisition parameter optimization can impact on the
quality of EPR signal identification and then on the
spectrum deconvolution.
Nevertheless, participants of both groups A and B were
able to discriminate between irradiated and non-irradiated
samples and, for group A participants, in addition between
high and low doses.
A final outcome of this exercise was that no major
problems were identified by the participants in applying the
protocol. The possible minor trouble that required solving
was the operational systems compatibility of the dedicated
software. The absence of problems is especially meaning-
ful if one considers that the participants were not experi-
enced on the protocol and that they had received only a
relatively short training course of 2 days. The protocol can
be considered easily transferable to a potential network of
laboratories in case of a mass casualty event.
Acknowledgments This intercomparison was organized and per-
formed under the European Union’s Seventh Framework Programme
(FP7/2007-2013) under Grant Agreement No. 241536 (MULTIBIO-
DOSE) and under EURADOS and was supported by the 7th Frame-
work Programme, Grant Agreement No. 295513 (RENEB). The
authors would like to thank the members of the EURADOS Working
Group 10 on ‘‘Retrospective dosimetry’’ and the EURODOS council
and office. In particular, they wish to express their gratitude to H.
Schuhmacher and H. Harms for their continuous support in the
implementation of the project. ISS authors also wish to express their
gratitude to Ms. Maria Cristina Quattrini for her support in the
organization and management of the exercise.
Appendix 1
A data point that is graphically far from the relationship
between x and y described by the other points generally
deserves to be further investigated. In the case of the
present exercise, the 0.8-Gy calibration data point was far
from the linear pattern of the other data points for most
participants (see Fig. 1, lower panel) and required further
investigation. For this reason, although keeping in mind the
weak statistical power of the sample, specific statistic tests
were carried out to identify outliers, leverage points, and
influential points of the calibration curves (Draper and
Smith 1998; Chatterjee and Hadi 1986):
a. Outliers are data points that appear to deviate markedly
from other members of the sample in which it occurs, as
defined by Grubbs (1979). In this exercise, outliers were
identified by the Grubbs test (Grubbs 1979) and by the
deleted studentized residuals (Draper and Smith 1998).
One individual measurement (out of the three replicates
of participants 3, 6, and 9) for the dose 0.8 Gy exceeded
slightly the Grubbs test value (assumed as 2).
b. Leverage points are the points of the independent
variable (in the present analysis, the calibration dose)
having the potential to dominate a regression analysis,
but not necessarily to influence it. These were iden-
tified according to the Sokal test. The 0.8-Gy calibra-
tion dose points resulted not to cause large changes in
the linear fit parameter estimates when they were
deleted. The only dose point with a statistically high
leverage value was the 10-Gy dose point.
c. Influential points are data points that greatly affect the
parameters of the regression line and therefore deserve
further investigation. They are typically outliers
weighted for their leverage value. The influential
points of the calibration curves were identified by the
Cook distance test (Cook and Dennis 1979). This
parameter was evaluated for the calibration curve of
every participant, and it was repeated after removing
one calibration data point at a time point from all the
calibration curves. In Fig. 3 (top), the resulting
estimated slopes versus estimated intercepts obtained
Fig. 3 Top estimated slopes versus estimated Y-intercepts obtained
by removing one calibration data point at a time. Bottom Cook’s
distance test
Radiat Environ Biophys
123

by removing one calibration data point at a time is
plotted. The estimated coefficients are all bunched
together regardless of the removed data points, except
for the calibration curve of participant 5 when the
points 0.8, 4, and 10 Gy were eliminated, and for the
curves of participants 5, 6, and 10 when the 0-Gy
calibration point was eliminated. The Cook distance
(Fig. 3, bottom) indicated that only the 10-Gy point
was influential for some participant (2, 7, and 9). This
was an expected result given the fact that the 10-Gy
calibration dose is an extreme point of the calibration
curve and obviously a high leverage point. Although
this test is controversial and there are different
opinions on the threshold to be chosen for the Cook
distance, it is possible to state that no influential points
were found.
Although no outliers were identified, it is out of doubt
that a problem existed in some participants’ measurements
in the signal line shape at 0.8 Gy, which appeared different
from the signal observed by the other participants. Figure 4
shows the comparison of the spectrum for 0.8 and 10 Gy
for participants 5 and 13. Whereas the signal at 10 Gy
appeared similar in shape and intensity (although within an
expected intersample variability), the signal for the 0.8-Gy
irradiated sample was evidently different in line shape and
intensity. Excluding the 0.8-Gy calibration data point from
3425 3450 3475 3500 3525 3550 3575
-2000
0
2000
EP
R s
igna
l (A
.U.)
Magnetic field (Gauss)3450 3475 3500 3525 3550 3575 3600
-60000
-40000
-20000
0
20000
EP
R s
igna
l (A
.U.)
Magnetic field (Gauss)
3425 3450 3475 3500 3525 3550 3575
-6000
-4000
-2000
0
2000
4000
EP
R s
igna
l (A
.U.)
Magnetic field (Gauss)3450 3500 3550 3600
-60000
-40000
-20000
0
20000
40000
EP
R s
igna
l (A
.U.)
Magnetic field (Gauss)
Fig. 4 EPR spectra of the samples irradiated at 0.8 Gy (top) and 10 Gy (bottom) for participants 13 (left) and 5 (right)
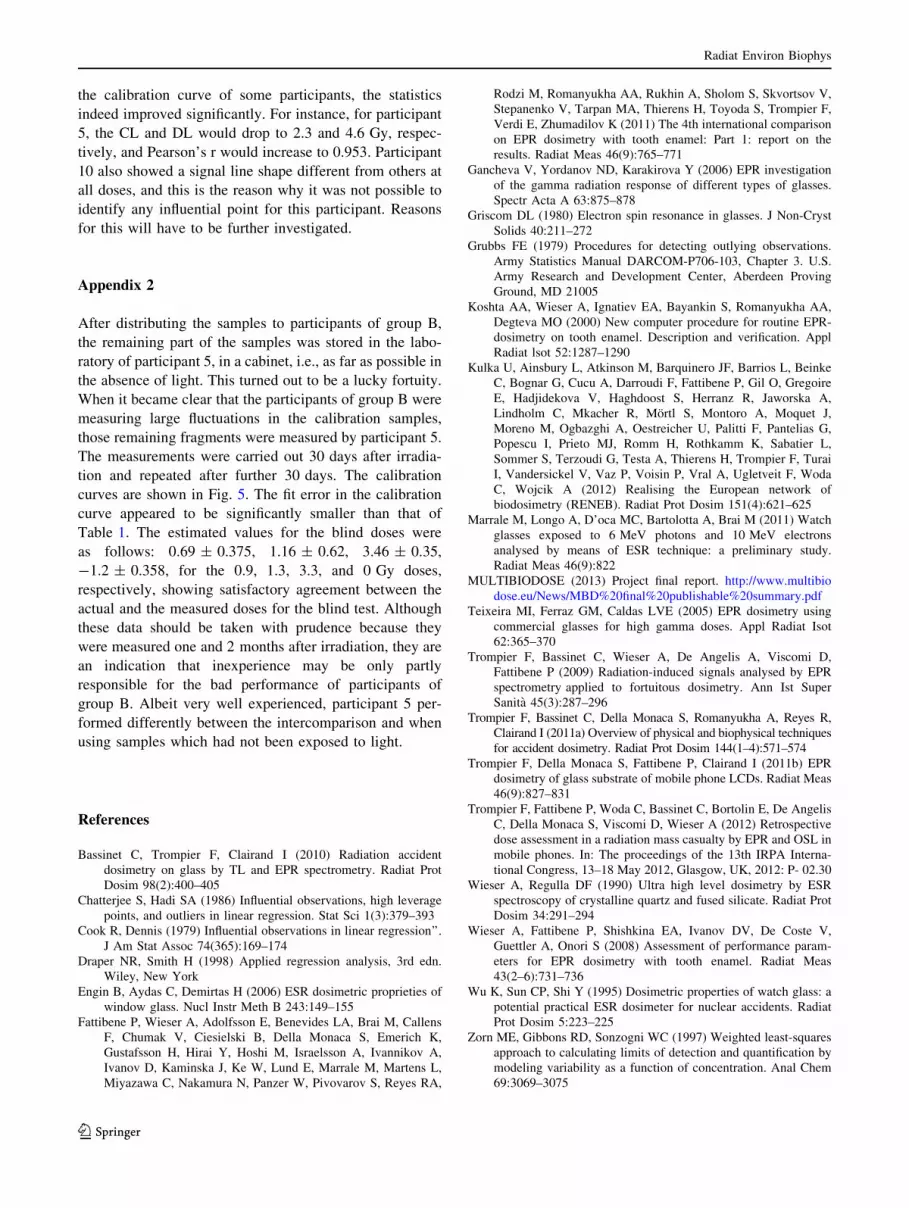
Fig. 5 Calibration curve obtained by participant 5 with samples of
glass taken from the same batch used for group B, but stored under
controlled conditions and in condition of absence of light (as far as
possible)
Radiat Environ Biophys
123
the calibration curve of some participants, the statistics
indeed improved significantly. For instance, for participant
5, the CL and DL would drop to 2.3 and 4.6 Gy, respec-
tively, and Pearson’s r would increase to 0.953. Participant
10 also showed a signal line shape different from others at
all doses, and this is the reason why it was not possible to
identify any influential point for this participant. Reasons
for this will have to be further investigated.
Appendix 2
After distributing the samples to participants of group B,
the remaining part of the samples was stored in the labo-
ratory of participant 5, in a cabinet, i.e., as far as possible in
the absence of light. This turned out to be a lucky fortuity.
When it became clear that the participants of group B were
measuring large fluctuations in the calibration samples,
those remaining fragments were measured by participant 5.
The measurements were carried out 30 days after irradia-
tion and repeated after further 30 days. The calibration
curves are shown in Fig. 5. The fit error in the calibration
curve appeared to be significantly smaller than that of
Table 1. The estimated values for the blind doses were
as follows: 0.69 ± 0.375, 1.16 ± 0.62, 3.46 ± 0.35,
-1.2 ± 0.358, for the 0.9, 1.3, 3.3, and 0 Gy doses,
respectively, showing satisfactory agreement between the
actual and the measured doses for the blind test. Although
these data should be taken with prudence because they
were measured one and 2 months after irradiation, they are
an indication that inexperience may be only partly
responsible for the bad performance of participants of
group B. Albeit very well experienced, participant 5 per-
formed differently between the intercomparison and when
using samples which had not been exposed to light.
References
Bassinet C, Trompier F, Clairand I (2010) Radiation accident
dosimetry on glass by TL and EPR spectrometry. Radiat Prot
Dosim 98(2):400–405
Chatterjee S, Hadi SA (1986) Influential observations, high leverage
points, and outliers in linear regression. Stat Sci 1(3):379–393
Cook R, Dennis (1979) Influential observations in linear regression’’.
J Am Stat Assoc 74(365):169–174
Draper NR, Smith H (1998) Applied regression analysis, 3rd edn.
Wiley, New York
Engin B, Aydas C, Demirtas H (2006) ESR dosimetric proprieties of
window glass. Nucl Instr Meth B 243:149–155
Fattibene P, Wieser A, Adolfsson E, Benevides LA, Brai M, Callens
F, Chumak V, Ciesielski B, Della Monaca S, Emerich K,
Gustafsson H, Hirai Y, Hoshi M, Israelsson A, Ivannikov A,
Ivanov D, Kaminska J, Ke W, Lund E, Marrale M, Martens L,
Miyazawa C, Nakamura N, Panzer W, Pivovarov S, Reyes RA,
Rodzi M, Romanyukha AA, Rukhin A, Sholom S, Skvortsov V,
Stepanenko V, Tarpan MA, Thierens H, Toyoda S, Trompier F,
Verdi E, Zhumadilov K (2011) The 4th international comparison
on EPR dosimetry with tooth enamel: Part 1: report on the
results. Radiat Meas 46(9):765–771
Gancheva V, Yordanov ND, Karakirova Y (2006) EPR investigation
of the gamma radiation response of different types of glasses.
Spectr Acta A 63:875–878
Griscom DL (1980) Electron spin resonance in glasses. J Non-Cryst
Solids 40:211–272
Grubbs FE (1979) Procedures for detecting outlying observations.
Army Statistics Manual DARCOM-P706-103, Chapter 3. U.S.
Army Research and Development Center, Aberdeen Proving
Ground, MD 21005
Koshta AA, Wieser A, Ignatiev EA, Bayankin S, Romanyukha AA,
Degteva MO (2000) New computer procedure for routine EPR-
dosimetry on tooth enamel. Description and verification. Appl
Radiat lsot 52:1287–1290
Kulka U, Ainsbury L, Atkinson M, Barquinero JF, Barrios L, Beinke
C, Bognar G, Cucu A, Darroudi F, Fattibene P, Gil O, Gregoire
E, Hadjidekova V, Haghdoost S, Herranz R, Jaworska A,
Lindholm C, Mkacher R, Mortl S, Montoro A, Moquet J,
Moreno M, Ogbazghi A, Oestreicher U, Palitti F, Pantelias G,
Popescu I, Prieto MJ, Romm H, Rothkamm K, Sabatier L,
Sommer S, Terzoudi G, Testa A, Thierens H, Trompier F, Turai
I, Vandersickel V, Vaz P, Voisin P, Vral A, Ugletveit F, Woda
C, Wojcik A (2012) Realising the European network of
biodosimetry (RENEB). Radiat Prot Dosim 151(4):621–625
Marrale M, Longo A, D’oca MC, Bartolotta A, Brai M (2011) Watch
glasses exposed to 6 MeV photons and 10 MeV electrons
analysed by means of ESR technique: a preliminary study.
Radiat Meas 46(9):822
MULTIBIODOSE (2013) Project final report. http://www.multibio
dose.eu/News/MBD%20final%20publishable%20summary.pdf
Teixeira MI, Ferraz GM, Caldas LVE (2005) EPR dosimetry using
commercial glasses for high gamma doses. Appl Radiat Isot
62:365–370
Trompier F, Bassinet C, Wieser A, De Angelis A, Viscomi D,
Fattibene P (2009) Radiation-induced signals analysed by EPR
spectrometry applied to fortuitous dosimetry. Ann Ist Super
Sanita 45(3):287–296
Trompier F, Bassinet C, Della Monaca S, Romanyukha A, Reyes R,
Clairand I (2011a) Overview of physical and biophysical techniques
for accident dosimetry. Radiat Prot Dosim 144(1–4):571–574
Trompier F, Della Monaca S, Fattibene P, Clairand I (2011b) EPR
dosimetry of glass substrate of mobile phone LCDs. Radiat Meas
46(9):827–831
Trompier F, Fattibene P, Woda C, Bassinet C, Bortolin E, De Angelis
C, Della Monaca S, Viscomi D, Wieser A (2012) Retrospective
dose assessment in a radiation mass casualty by EPR and OSL in
mobile phones. In: The proceedings of the 13th IRPA Interna-
tional Congress, 13–18 May 2012, Glasgow, UK, 2012: P- 02.30
Wieser A, Regulla DF (1990) Ultra high level dosimetry by ESR
spectroscopy of crystalline quartz and fused silicate. Radiat Prot
Dosim 34:291–294
Wieser A, Fattibene P, Shishkina EA, Ivanov DV, De Coste V,
Guettler A, Onori S (2008) Assessment of performance param-
eters for EPR dosimetry with tooth enamel. Radiat Meas
43(2–6):731–736
Wu K, Sun CP, Shi Y (1995) Dosimetric properties of watch glass: a
potential practical ESR dosimeter for nuclear accidents. Radiat
Prot Dosim 5:223–225
Zorn ME, Gibbons RD, Sonzogni WC (1997) Weighted least-squares
approach to calculating limits of detection and quantification by
modeling variability as a function of concentration. Anal Chem
69:3069–3075
Radiat Environ Biophys
123


