Embed Size (px)
Citation preview

EvEel (Evolutionary ecology based model for Eel): a model to explore the role of phenotypic
plasticity as an adaptive response of three temperate eels (Anguilla anguilla, A. japonica and A.
rostrata) to spatially structured environments
Authors:
Hilaire DROUINEAU ( corresponding author)
◦ affiliations: Irstea, UR EABX Ecosystèmes aquatiques et changements globaux / Pôle
Écohydraulique Onema-INP-Irstea
◦ address: 50, avenue de Verdun - 33 612 CESTAS Cedex – FRANCE
◦ tel : +33 (0)5 57 89 27 09
◦ fax: +33 (0)5 57 89 08 01
◦ mail: [email protected]
Christian RIGAUD
◦ affiliations: Irstea, UR EABX Ecosystèmes aquatiques et changements globaux / Pôle
Écohydraulique Onema-INP-Irstea
◦ mail: [email protected]
Françoise DAVERAT
◦ affiliations: Irstea, UR EABX Ecosystèmes aquatiques et changements globaux
◦ mail: [email protected]
Patrick LAMBERT
◦ affiliations: Irstea, UR EABX Ecosystèmes aquatiques et changements globaux
1
2
3
4
5
6
7
8
9
10
11
12
13
14
15
16
17
18
19
20
21

◦ mail: [email protected]
Keywords: Anguilla sp., phenotypic plasticity, adaptive response, EvEel, length-at-silvering, sex-
determination, habitat use
Abstract
Anguilla anguilla, A. japonica and A. rostrata are three largely distributed catadromous and
semelparous species characterized by a long and passive oceanic larval drift between their marine
spawning grounds and their nursery areas in continental waters. Their large and spatially
heterogeneous environments combined with population panmixia and long and passive larval drift
impair the possibility of local adaptation and favour the development of phenotypic plasticity. In
this context, we develop EvEel, a model that aims at exploring the role of phenotypic plasticity as
an adaptive response of eels. Results suggest that the spatial patterns in terms of sex-ratio, length-at-
silvering and habitat use observed at both the distribution area and the river catchment scales may
actually be the result of three adaptive mechanisms to maximize individual fitness in spatially
structured environments. We think that considering phenotypic plasticity as a paradigm is required
to develop appropriate models for this species.
22
23
24
25
26
27
28
29
30
31
32
33
34
35
36
37
38
39

Introduction
Phenotypic plasticity has been proposed as an adaptive response to environment variability for
many species (Levins 1963; Gotthard and Nylin 1995; Pigliucci 2005). It has been demonstrated
that in some cases, fitness gains arise from plastic phenotypes compared to non-plastic ones and that
consequently, phenotypic plasticity may be selected by natural selection (Schlichting 1986; Sultan
1987; Travis 1994). Moreover, Ernande and Dieckmann (2004) demonstrated that density-
dependence favours the selection of plastic phenotypes. The phenotypic plasticity issue is all the
more interesting for temperate eels (European eel Anguilla anguilla, American eel A. rostrata and
Japanese eel A. japonica) that meet all the conditions favouring the emergence of phenotypic
plasticity while impairing the possibility of local adaptation: panmictic populations with large
distribution areas and density-dependent population dynamics, concomitantly with a large
variability in life history traits, life tactics and demographic attributes.
Temperate eels are three semelparous catadromous species displaying remarkable similarities in
their life history traits (Daverat et al. 2006; Edeline 2007). All three species have a large distribution
area, from Morocco to Norway (Tesch 2003) for the European eel, from ~7°N to ~55°N for A.
rostrata (Helfman et al. 1987; Edeline 2007) and from Northern Philippines to Korea for A.
japonica. The populations are considered as panmictic since no clear genetic difference at neutral
loci was observed along the distribution area (Han et al. 2010; Als et al. 2011; Pujolar 2013). All
three species are characterised by a long and passive larval drift (larvae are called leptocephali)
between spawning grounds (Sargasso Sea for A. anguilla and A. rostrata (Schmidt 1923; McCleave
1993), and west of the Mariana Islands for A. japonica (Tsukamoto 1992)) and continental nursery.
Leptocephali metamorphose into glass eels when arriving on the continental shelf (Tesch 2003).
Then, glass-eels colonise continental waters where they become pigmented yellow eels and remain
during their growth phase that lasts several years. After a variable period generally lasting from 3 to
15 years, yellow eels metamorphose again into silver eels. They achieve their sexual maturation
40
41
42
43
44
45
46
47
48
49
50
51
52
53
54
55
56
57
58
59
60
61
62
63
64

while migrating back to spawning grounds.
As leptocephali drift passively to the continental shelf (McCleave 1993; Kettle and Haines 2006;
Bonhommeau et al. 2009), larvae are not able to select the river catchment in which they will grow.
Consequently, eels are distributed in contrasted environments (from Mauritania to Norway for
example for European eel, or from Northern South-America to Greenland for the American eel),
and more specifically with contrasting temperature which is a primary driver of physiological
processes, affecting both growth and survival (Brown et al. 2004).
Concomitantly with this environmental heterogeneity, a large phenotypic diversity is observed at the
distribution area and at the river catchment scales. For example, sex-ratio is spatially highly
heterogeneous at the distribution area and at the river catchment scale (Vladykov 1966; Helfman et
al. 1987; Oliveira et al. 2001). Vladykov (1966) and Helfman et al. (1987) mentioned a female
biased sex-ratio in the northern part of the distribution area. Krueger & Oliveria (1999) and Oliveira
et al. (2001) argued that sex-ratio variability can also vary a lot within a limited range of latitudes
under the influence of local conditions. A large data collection of existing observations carried out
by Kettle et al. (2011) for both A. rostrata and anguilla confirms this latitudinal pattern. Sex-
determination for eel is still poorly known but is controlled by environmental factors (Geffroy
2012). Environmentally controlled sex-determination is generally selected by evolution when the
environmental factor differentially affects the fitness of males and females (Mayhew 2006).
Environmental sex-determination is not rare for fishes, temperature being the main driving factor,
though the influence of density or social interactions have also been observed for some species
(Devlin and Nagahama 2002). Several factors have been proposed as driving factors for eel sex-
determination. Regarding eel density, a male biased sex-ratio is generally observed when eel density
is high (Roncarati et al. 1997; Tesch 2003; Han and Tzeng 2006). This has been observed at the
catchment scale where males are concentrated in the downstream part of the catchment (Oliveira
and Mccleave 2000; Tesch 2003), though this observation may result from a more limited
colonisation ability of males. More convincing observations come from catchments where
65
66
67
68
69
70
71
72
73
74
75
76
77
78
79
80
81
82
83
84
85
86
87
88
89
90

modifications of densities have resulted in modifications of the sex-ratio (Poole et al. 1990;
Roncarati et al. 1997; Tesch 2003), and by observations in controlled environment experiments
(Colombo and Grandi 1996; Beullens et al. 1997; Holmgren et al. 1997). Growth rate in youngest
stages is also suspected to play a role in sex-determination, however results are less obvious.
Holmgren (1996) and Holmgren and Mosegaard (1996) observed in controlled experiments that fast
growing (especially in weight) young eelspreferentially turn into males. However results were
unclear because of concomitant variation in density. More generally, Geffroy (2012) assumed that
the global quality of the environment may be the main factor affecting sex-determination.
This issue of sex-determination is of major importance because males and females are supposed to
display distinct life tactics (Helfman et al. 1987). The reproduction success of a male does not vary
with its body size, consequently males are assumed to follow a time-minimising strategy, leaving
continental waters as soon as they have enough energy to migrate to the spawning grounds
(Vollestad 1992). This assumption would explain why male silver eels display rather similar
weights and sizes (Oliveira 1999)all over the distribution area (Vollestad 1992; Oliveira 1999). Such
a size threshold may correspond to the size at which energy stores are sufficient to undergo the
transoceanic reproduction migration (Van Den Thillart et al. 2007). By contrast, fecundity and
consequently reproduction success of females is mainly influenced by body size. Consequently,
females are assumed to follow a size-maximising strategy, adapting their length-at-silvering to local
growth and mortality conditions in order to find a trade-off between survival and fecundity.
Latitudinal pattern of female silver eel length is often mentioned with larger females in the northern
part of the distribution area (slow growth but lower mortality) than in the southern part (Helfman et
al. 1987; Davey and Jellyman 2005; Jessop 2010).
In addition to sex-ratio and length-at-silvering variability, eels also display a large range of tactics in
terms of growth and habitat use, some settling in estuarine waters while others move far upstream in
river catchments (Tsukamoto et al. 1998; Daverat et al. 2006; Arai and Chino 2012). Growth rate in
salted and brackish downstream parts of catchments is significantly higher than in upper parts of the
91
92
93
94
95
96
97
98
99
100
101
102
103
104
105
106
107
108
109
110
111
112
113
114
115
116

catchments (Helfman et al. 1984; Melià et al. 2006b; Daverat et al. 2012). A lower mortality in
upper parts of river catchments is sometimes assumed to balance the associated lower growth.
Consequently, upstream habitats with more limited intraspecific competition may still be favourable
especially for females which can adapt their length-at-silvering to balance lower growth rates.
Edeline (2007), for example, assumed that catchment colonisation and tactics in habitat use by eels
correspond to a conditional evolutionary stable strategy (Gardner et al. 1987). A conditional
evolution stable strategy is a generalisation of evolutionary stable strategy in which an individual
can express different phenotypes (the tactics of the conditional strategy) depending on its
environmental, social and physiological status (cueing trait). According to Edeline (2007),
individuals with high energetic status would migrate upstream to avoid competition and then settle
(i.e. change tactics) when their energetic status becomes too low or when the benefits do not
outweigh the costs of migration. This assumption is challenged by Cairns et al. (2009) who did not
observe mortality differences large enough to balance variations in growth between different
habitats. Cairns et al. (2009) concludes that the decrease of natural mortality (competition) would
not outweigh the cost of migration and the decrease in growth rate.
As a summary, eels display a large phenotypic and tactical variability at both the distribution area
and the catchment scales including sex-determination, females length-at-silvering and use of growth
habitats within a catchment with higher density downstream. Since eels meet all conditions
favouring phenotypic plasticity, the objective of this paper is to explore if those spatial patterns may
result from adaptive responses to spatially structured environments and density-dependence, or if
they are a "passive" response to environmental variability (Van Kleunen and Fischer 2005). This
analysis is carried out using EvEel (Evolutionary ecology model for Eel): a model exploring the
role of phenotypic plasticity as an adaptive response of eels to spatially structured environments.
117
118
119
120
121
122
123
124
125
126
127
128
129
130
131
132
133
134
135
136
137
138
139

Material and methods
Model rationales and definition of the spatial patterns
The model is based on the assumption that the growth phase of eels in continental waters starts by
two successive events, sex-determination and growth habitat selection, which are two adaptive
responses to environmental variability. Consequently sex-determination and growth habitat
selection are assumed to be two "decisions that maximise expected fitness”. Assuming that
decisions are made to maximise expected fitness is the main assumption when modelling adaptive
life history decisions (Mangel and Clark 1988). For example, in the optimal foraging theory,
animals are assumed to move to maximise their food intake which is considered as a proxy of their
fitness (Mangel and Clark 1986; Giske et al. 1998; Railsback and Harvey 2013). Similarly, models
based on the life history theory posits that the schedule and duration of life traits are the results of
natural selection to optimize individual fitness (Giske et al. 1998). For example, McLaren (1963)
developed a model of spatial distribution of zooplankton based on habitat profitability, by modelling
the effect of water temperature on reproduction rate.(2013) Life-history theory models generally
focus on finding an optimal trade-off between age at maturity, fecundity and survival (McNamara
and Houston 1992; Clarke 1993; Giske et al. 1998). Alternative migratory tactics of salmonids
(anadromous, jacks and freshwater resident) may be interpreted as an adaptation to local
environment in the context of life-history theory (Dodson et al. 2013).
Assumed that males adopt a time-minimising strategy, their fitness may be approximated by the
probability to survive until length-at-silvering. On the other hand, females are assuming to adopt a
size-maximising strategy, seeking an optimal trade-off between length-at-silvering (fecundity) and
survival, consequently females fitness can be approximated by the product of expected fecundity at
the length-at-silvering multiplied by the probability to survive until this length.
Following Grimm and Railsback (2012), we applied a pattern-oriented modelling approach by
comparing model outputs to the following observed and documented spatial patterns:
140
141
142
143
144
145
146
147
148
149
150
151
152
153
154
155
156
157
158
159
160
161
162
163
164

at the distribution area scale:
1. male-biased sex ratio in the southern part of the distribution area and female-biased
sex-ratio in the northern part
2. male-biased sex-ratio in environment with high density
3. male-biased sex-ratio in fast growth environment
at the river catchment scale:
4. higher density downstream than upstream
5. higher length-at-silvering upstream than downstream
6. male-biased sex-ratio downstream and female-biased sex-ratio upstream
Distribution area scale: sex-determination and length-at-silvering as adaptive
mechanisms to a wide variety of spatially structured environmental conditions
We denote r a river catchment where glass-eels arrive. It is characterised at its mouth by:
an instantaneous natural mortality rate M(r)
a Brody growth coefficient K(r) of a Von-Bertalanffy growth curve
a mean water temperature T(r)
We assume that female fitness may be approximated by the product of the expected number of eggs
at length-at-silvering and the probability to survive until this length-at-silvering Lsf(r), i.e. the mean
expected number of eggs produced by each female. Following De Leo and Gatto (1995), we assume
that growth is well represented by a Von Bertalanffy growth model:
01ttrK
eL=rt,L
with L(t,r) the length at time t of a fish, L the asymptotic length and K(r) the Brody growth
165
166
167
168
169
170
171
172
173
174
175
176
177
178
179
180
181
182
183
184
185
186
coefficient.
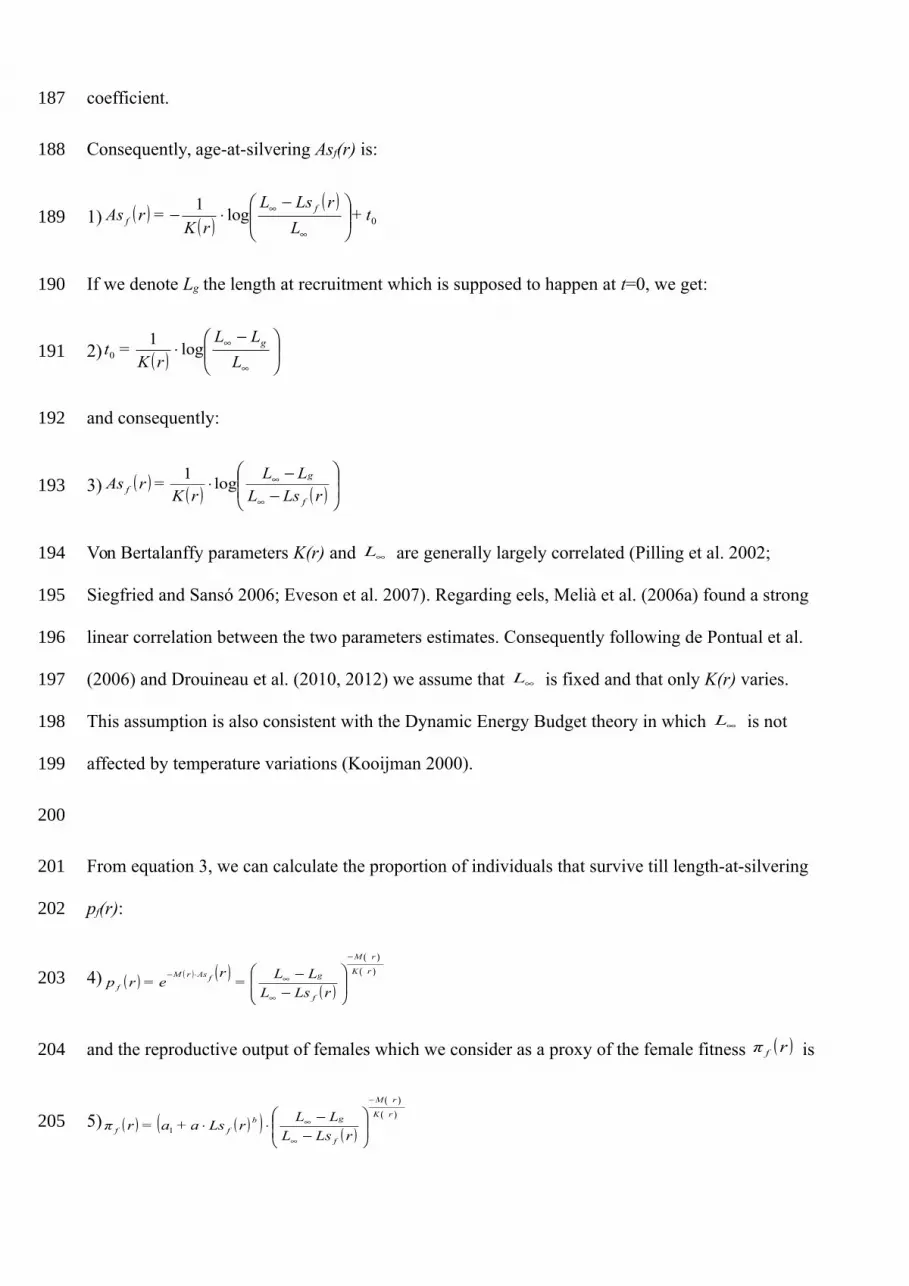
Consequently, age-at-silvering Asf(r) is:
1)
0log1
t+L
rLsL
rK=rAs f
f
If we denote Lg the length at recruitment which is supposed to happen at t=0, we get:
2)
L
LL
rK=t glog
10
and consequently:
3)
rLsL
LL
rK=rAs
f
g
f log1
Von Bertalanffy parameters K(r) and L are generally largely correlated (Pilling et al. 2002;
Siegfried and Sansó 2006; Eveson et al. 2007). Regarding eels, Melià et al. (2006a) found a strong
linear correlation between the two parameters estimates. Consequently following de Pontual et al.
(2006) and Drouineau et al. (2010, 2012) we assume that L is fixed and that only K(r) varies.
This assumption is also consistent with the Dynamic Energy Budget theory in which L is not
affected by temperature variations (Kooijman 2000).
From equation 3, we can calculate the proportion of individuals that survive till length-at-silvering
pf(r):
4)
rK
rM
f
gfAsrM
f rLsL
LL=
re=rp
and the reproductive output of females which we consider as a proxy of the female fitness rπ f is
5)
rK
rM
f
gbff rLsL
LLrLsa+a=rπ
1
187
188
189
190
191
192
193
194
195
196
197
198
199
200
201
202
203
204
205

with a1, a and b parameters from a fecundity-at-length relationship proposed by Andrello et al.
(2011), in which fecundity is assumed to be a linear function of weight, the latter scaling
allometrically to length (Melià et al. 2006a).
As previously mentioned, females length-at-silvering is assumed to be a trade-off between
fecundity and survival probability, consequently we numerically estimated rLs f as the value that
maximises rπ f in the growth and survival conditions of r. This trade-off between fecundity is
illustrated by Fig. 1.
Conversely, male reproduction success is assumed to adopt a time minimising strategy, leaving
continental waters as soon as they have reached the minimal length to undergo the reproduction
migration (Helfman et al. 1987; Vollestad 1992). Consequently, we assume that male length-at-
silvering is constant (as observed by Oliveira (1999)) and corresponds to the minimal length to
carry out the migration to the spawning grounds. Males fitness rπm may thus be approximated by
the probability to survive until length-at-silvering:
6)
rK
rM
m
g
m rLsL
LL=rπ
The ratio rπrπ mf / is then calculated for different values of K(r) and M(r) varying from 0 to 0.3
year-1. For each case, the optimal female length-at-silvering rLs f is also estimated. This produces
a diagram of ratio of fitness. A large ratio indicates a marginal fitness gain for females while a
smaller ratio indicates a marginal fitness gain for males. This also produces a diagram of females
length-at-silvering, as a function of K(r) and M(r). We do not consider any feedback in sex-
determination: the expected fitness of choosing male or female does not depend on how many other
eels choose which sex.
206
207
208
209
210
211
212
213
214
215
216
217
218
219
220
221
222
223
224
225
226
227
228

Natural mortality and growth rates of living organisms are largely influenced by temperature
because of physiological processes (Brown et al. 2004). Correlation between eel natural mortality
(Bevacqua et al. 2011b), growth (Daverat et al. 2012) and temperature has been observed.
Consequently, all combinations of values of M(r) and K(r) are not physiologically possible. Pauly
(1980) has carried out a large meta-analysis linking growth parameters to survival for numerous
marine fish species:
7) rT+rK+L=rM log0.4634log0.6543log0.2790.0066log
We use this relationship with temperatures ranging from 5°C to 25°C, and plot this relation on the
diagrams of ratio of fitness and females length-at-silvering as functions of K(r) and M(r), to detect
plausible combinations of growth and mortality rates. We also plot hypothetical points of growth
and mortality to illustrate how sex-ratio and length-at-silvering may vary between Scandinavia, Bay
of Biscay and Mediterranean area: Scandinavia is characterised by a low temperature (we chose 5°C
as an illustration) and a slow growth (see (Helfman et al. 1987; Jessop 2010) for description of
latitudinal pattern in growth). Mortality rate was then estimated using equation 7, Conversely,
Mediterranean area is characterised by a warmer temperature (we chose 25°C as an illustration) and
a faster growth.
Parameters values are presented in the control experiment scenario in table 1.
River catchment scale: habitat selection, sex-ratio and length-at-
silvering as adaptive mechanisms within a catchment
A slightly more complex version of the model is developed to be applied to a theoretical river
229
230
231
232
233
234
235
236
237
238
239
240
241
242
243
244
245
246
247
248
249
250
251
252

catchment r. In this second step, we consider that sex-determination has already occurred, and we
focus on the selection of growth habitat by Nm(r) males and Nf(r) females in the river catchment.
The river catchment is represented by n contiguous cells, the first cell representing the river mouth
while the n-th cell represents the source of the river. As previously mentioned, within river growth
rates are significantly faster downstream than upstream . To represent this gradient, we assume that
the instantaneous growth rate in cell i, K(r,i) is:
8)
Kγ,
n
inr,Kr,K+nr,K=ir,K cauchit1
9)
γ
xatan
π=γx,
221cauchit
with cauchit a mathematical function similar to the sigmoid function but that allows asymmetrical
patterns (by modifying the parameter γ - Fig. 2 illustrates the form of this relationship).
Since natural mortality is also sometimes assumed to be smaller upstream than downstream
(Moriarty 2003; Daverat and Tomás 2006), we assume that the instantaneous natural mortality in
cell i, M(r,i) is:
10)
Mγ,
n
inr,Mr,M+nr,M=ir,M cauchit1
We can notice that assuming that nr,M=r,M 1 is equivalent to assuming a constant
instantaneous natural mortality all over the river catchment.
We denote ir,M m and ir,M f the instantaneous natural mortality rates for males and females.
For simplicity, following Lockwood (1980), we assume that natural mortality increases linearly
with density (Hixon and Jones 2005)though logarithmic relationship may also been assumed (Myers
and Cadigan 1993; Fromentin et al. 2001) and provide similar results:
253
254
255
256
257
258
259
260
261
262
263
264
265
266
267
268
269
270
271
272
273
274

11) mfmm αir,N+ir,N+ir,M=ir,M
12) ffmf αir,N+ir,N+ir,M=ir,M
with ir,Nm and ir,N f the number of males and females in cell i while mα and fα are two
parameters that control the intensity of density-dependence.
In each cell i, males and females fitnesses (denoted ir,πm and ir,π f ) are calculated using
equations 5 and 6 and assuming a density-dependent natural mortality (Vollestad and Jonsson 1988;
De Leo and Gatto 1996; Lobón-Cerviá and Iglesias 2008; Bevacqua et al. 2011b) as described in
equations 11 and 12:
13)
ir,K
ir,fM
f
gbff rLsL
LLir,Lsa+a=ir,π
1
14)
ir,K
ir,mM
m
g
m LsL
LL=ir,π
ir,Ls f is estimated as the length maximising ir,π f (see Fig .1).
For each cell i, we estimate the mean length-at-silvering as:
15)
ir,πir,N+ir,Lsa+a
ir,πir,N
ir,Lsa+a
ir,πir,Lsir,N+ir,πLsir,N
=ir,L
mmbf
ff
bf
fffmmm
s
1
1
and standardised fitnesses along the riverside as:
16) jr,π
ir,π=ir,π
mmax
j
mstdm,
17) jr,π
ir,π=ir,π
fmax
j
fstdf,
275
276
277
278
279
280
281
282
283
284
285
286
287
288
289
290
291
292

We assume that the Nm males and the Nf females settle in the cell of maximum fitness. Based on this
assumption, males and females are distributed in the river catchment by applying the following
algorithm:
For k from 1 to max(Nm, Nf)
◦ if k<=Nm
▪ k-th male goes in cell i having 1=iπ stdm, (maximum fitness)
◦ if k<=Nf
▪ k-th female goes in cell i having 1=iπ stdf, (maximum fitness)
i.e. males and females are put one after the other in the cell of maximum fitness.
The procedure is repeated with four different sets of model parameters. Figure 2 summarizes the
assumed values of natural mortality and growth rates along the catchment for each set of
parameters. It mimics a catchment with a small downstream part with fast growth rate
corresponding to brackish waters. Concerning mortality rates, we assume constant rates in three sets
and a small gradient in the fourth one.
For each set, we analyse different outputs: ir,N f , ir,Nm , ir,π f , ir,πm , ir,Ls f , ir,M f
and ir,M m .
Results
Distribution area scale: sex-determination and length-at-silvering as adaptive
mechanisms to a wide variety of spatially structured environmental conditions
The ratio of fitness for various conditions of K(x) and M(x) (Fig. 3) demonstrates that high mortality
293
294
295
296
297
298
299
300
301
302
303
304
305
306
307
308
309
310
311
312
313
314

tends to favour males as compared to females fitness. If we assume that high density increases
mortality because of intra-specific competition, this may explain why males-biased sex-ratios are
observed in high density environments.
Fast growth rate seems to favour females with respect to males. This is not consistent with the
observed pattern of sex-ratio at the distribution area, with female biased sex-ratio in the northern
part (slow growth) and male biased sex-ratio in the south (fast growth). However, the physiological
relationship (Pauly 1980) between M(r) and K(r) implies that in the southern part (white circle -
Fig. 3) fast growth is generally associated with higher natural morality, and consequently males
become favoured with respect to females compared to Northern area (black circle - Fig. 3), which is
consistent with observations.
Consequently, at the distribution area, the model mimics the geographical pattern of sex-ratio and is
consistent with male-biased sex-ratios in high density environment.
Looking at length-at-silvering as a function of M(r) and K(r) (Fig. 4), we observe that the model
predicts largest females in cold conditions (black circle) than in warm conditions (white circle).
This is consistent with the observation of largest silver eels females in the northern part of the
distribution than in the southern part (Fig. 4).
As a summary, the model mimics all three spatial patterns observed at the distribution area scale
(Table 2).
River catchment scale: habitat selection, sex-ratio and length-at-silvering as
adaptive mechanisms within a catchment
Without density-dependence (set S0 – Fig. 5), all males and females concentrate downstream the
river. In this situation, dispersion in the catchment would not correspond to a conditional
evolutionary stable strategy, as suggested by Cairns et al. (2009).
315
316
317
318
319
320
321
322
323
324
325
326
327
328
329
330
331
332
333
334
335
336
337
338

If we consider that natural mortality is partly density-dependent (set S1 - Fig. 5), males and females
are distributed all along the river, with highest densities downstream the catchment. However, males
and females have exactly the same distribution while only females are observed upstream in the
field. Relative fitness and length-at-silvering is constant all along the river in this situation.
If we assume lower mortality rate upstream than downstream (set S3 - Fig. 5), results are not
changed drastically and males and females spatial distributions are still similar.
Consequently, dispersion may be a conditional evolutionary stable strategy if we assume that part of
the natural mortality is density-dependent. However, it does not explain why the spatial
distributions of males and females are different.
With set S2 (Fig. 5), we assume that males are less sensitive than females to density-dependence.
Set S2 produces results rather similar to field observations. First, males are concentrated in the
downstream part of the catchment, where growth is faster, while females are distributed more
upstream in zone with lower fish density. When looking at length-at-silvering, silver eels are
smaller downstream (where there are more males) than upstream. Moreover, natural mortality is
rather constant downstream (where males are concentrated), which may explain why Cairns et al.
(2009) do not observe high variations in natural mortality.
To conclude, density-dependence is required to mimic catchment colonisation (Table 2) and all the
patterns are mimicked if we assume that males are less sensitive than females to density-
dependence.
Discussion
The aim of this paper was to explore if few assumptions based on evolutionary concepts may
explain the spatial patterns observed in the 3 temperate eels in term of sex-ratio, length-at-silvering
and habitat distribution, both at the distribution area scale and at the river catchment scale. Six
spatial patterns were listed and the model mimics all of them at both distribution area and river
339
340
341
342
343
344
345
346
347
348
349
350
351
352
353
354
355
356
357
358
359
360
361
362
363

catchment scales (Table 2). This does not demonstrate that our assumptions are correct, however, it
suggests that sex-determination, length-at-silvering and growth habitat selection may be interpreted
as adaptive plasticity selected by evolution to respond to the highly variable and spatially structured
environmental conditions encountered by temperate eels. An extension to tropical eels would be
interesting in the future.
Interestingly, Côté et al. (2009, 2014) and Gagnaire et al. (2012) have recently explored an
alternative hypothesis. Côté et al. (2009) observed permanent growth rate differences between eels
originating from two different regions that were reared in similar conditions. Gagnaire et al. (2012)
observed genetic differences between eels originating from different sites. They assumed that
despite population panmixia, local conditions may select adaptive alleles that are then reshuffled
again during the next reproduction. The two hypotheses are not totally contradictory: the two
mechanisms, i.e. phenotypic plasticity and genetic adaptation, may complement each other as
adaptive responses. In the future, it would be interested to turn EvEel into a demo-genetic model
(Piou and Prévost 2012) or to a quantitative genetic model that incorporates phenotype plasticity
similar to the model developed by Baskett et al. (2005). In this model, each individual is
characterised by its genotype which corresponds to the genetic predisposition to mature at a given
size (that would be length-at silvering for eel). However, the phenotype is assumed to be a balance
between the genotype and a response to environment through phenotypic plasticity.
Within a river catchment, Edeline (2007) proposed that colonisation may correspond to a
conditional evolutionary stable strategy, assuming that lower growth rates upstream were
compensated by lower mortality rates. This point of view was challenged by Cairns et al. (2009)
who did not observe large variations of natural mortality rates in the field. However, our model
suggests that, despite these limited variations of natural mortality, the colonisation and the choice of
a growth habitat may still correspond to fitness maximisation strategy. If we assume that females
are more sensitive to density-dependent mortality than males, males are concentrated downstream
364
365
366
367
368
369
370
371
372
373
374
375
376
377
378
379
380
381
382
383
384
385
386
387
388
389

where Cairns et al. (2009) made their observations, a zone where the model predicts that their
natural mortality rate is rather constant (Fig. 5, scenario S2). It is well known than density-
dependence plays a major role in eel dynamics (De Leo and Gatto 1996), especially in migratory
behaviour (Geffroy and Bardonnet 2012). Our assumption of distinct density-dependent sensitivity
between males and females, i.e. females suffering a higher density-dependant natural mortality rate
than males, is plausible for two main reasons: First, Holmgren et al. (1997) observed that males in
young stages have a faster growth in weight, with higher condition indices, and so they may become
dominant with respect to females. Secondly, we may assume that males may have evolved to be
more adapted to high-density since males biased sex-ratios are observed in high density
environments. Gender difference in sensitivity to intraspecific competition has already been
observed for insects (Gibbs et al. 2004; Tsurim et al. 2013) and birds (Clobert et al. 1988). For
example, Gibbs et al. (2004) demonstrated in controlled experiments that females of a butterfly
were more adversely affected by high density than males. In the model, we assumed that density-
dependence affects natural mortality because of negative effects of intra-cohort and inter- cohort
densities on mortality have been observed in many studies (Vollestad and Jonsson 1988; De Leo
and Gatto 1996; Lobón-Cerviá and Iglesias 2008; Bevacqua et al. 2011a, 2011b).
In our model, we assume that only natural mortality was impacted by density-dependent processes
though intra-specific competition may also result in lower growth rates in reality. However, since
fitness is approximated by a function of the ratio of instantaneous natural mortality over Brody
growth coefficient in our model (see equations 5 and 6), the results would not change if modelling a
density-dependant growth rate.
EvEel is based on few evolutionary assumptions: (i) sex-determination is an adaptive response to
favour sex with highest fitness in a given environment (assumption consistent with what is observed
on many species having an environmental sex-determination (Mayhew 2006)), (ii) since females
adopt an size-maximising strategy, fitness may be approximated by the product of fecundity and
survival rate, (iii) since males adopt a time-minimising strategy, their fitness may be approximated
390
391
392
393
394
395
396
397
398
399
400
401
402
403
404
405
406
407
408
409
410
411
412
413
414
415

by their survival rate, (iv) females are more sensitive to intra-specific competition than males and
(v) colonisation and growth habitat selection in a catchment is based on the maximisation of the
fitness. Only five assumptions are enough to mimic the main spatial pattern of sex-ratios, length-at-
silvering and distribution at the distribution area scale and at the river catchment scale. However,
mimicking patterns does not validate (or invalidate) those assumptions and controlled experiments
would be required to investigate their reliability.
Sex-determination, length-at-silvering and habitat selection are not conscious choices of eels.
Optimality models assumes that decisions are made to maximize expected future fitness though
organisms do not understand the world they live in and are not able to predict the future. However,
evolution has selected animals that undertake those types of decisions in given environmental
conditions (Giske et al. 1998). Eel plasticity may be influenced by a few environmental factors so
that eels may adapt to the wide range of environmental conditions they may encounter. Among
these factors, temperature probably plays a major role by affecting growth and mortality rates. Food
availability also plays a role through natural mortality and density-dependence. More generally,
global environment quality would affect those three mechanisms, as proposed by Geffroy (2012) for
sex-determination.
Temperature is known to affect most physiological processes (Brown et al. 2004; Clarke 2006).
Pauly (1980) proposed a relation between somatic growth, natural mortality and temperature. This
relation was fitted mainly at the inter-specific level, however we considered that this relationship
was still relevant at the intra-specific level for two reasons. First in the database analysed by Pauly
(1980), many species were included more than once (Gadhus morhu was considered 8 times for
example) with growth and mortality estimates from distinct regions. This tends to demonstrate that
the relationship remains correct at the intra-level scale. Secondly, the arguments suggested by Pauly,
i.e. increased physiological mortality and increased predation, to explain a direct relationship are
still valid at the specific level. Indeed, high temperature increases all metabolic rates (Clarke and
Johnston 1999; Clarke 2003) leading to higher growth rates (Brown et al. 2004). However, resting
416
417
418
419
420
421
422
423
424
425
426
427
428
429
430
431
432
433
434
435
436
437
438
439
440
441

metabolic rates (and consequently the energy required for maintenance) (Clarke 2003) and inter-
specific interactions (competition, predation...) (Brown et al. 2004) also increase with temperature,
potentially leading to higher natural mortality rates.
Pauly's equation (1980) describes a general trend in growth and mortality with temperature which is
considered correlated to latitude in our study. However, this general trend may be altered by local
conditions. Upwellings for example may disrupt (i) the temperature/latitude gradient and (ii) the
growth rate/temperature relationship because of high productivity. Specific habitats, such as lakes,
may also disrupt the trend and may explain the phenotypic variability observed by Krueger and
Oliveira (1999) and Oliveira et al. (2001) at similar latitudes.
Provided our assumptions are valid, it is interesting to analyse the effect of various sources of
anthropogenic mortalities. Glass-eels fisheries downstream river catchments tend to decrease eel
densities which may lead to a change in sex-ratio towards females and to a decrease of the
colonisation of upstream habitats. Remaining individuals are consequently located in downstream
habitats where growth is faster mitigating the impact of the fishery. An obstacle to upstream
colonisation implies higher densities of individuals downstream. An obstacle close to the mouth
would result in a change of sex-ratio towards males (impacting undetermined young eels) or block
females which are very sensitive to density-dependence.
This first version of EvEel is simple. It does not model population dynamics and assume that fishes
are omniscient (perfect knowledge of the entire river catchment) and omnipotent (they are able to
migrate to any part of the catchment without any delay). Moreover, it assumes that sex-
determination and choice of growth habitat are two successive events that occur very early in the
growth phase in continental waters. The reality is more complex: sex-determination occurs between
20 cm and 30 cm and consequently, colonisation has already started. Moreover, it has been
demonstrated that some eels that settle upstream can then move downstream to more favourable
habitats when density decreases (Daverat et al. 2006). The model simplicity explains the rough
contrasts in the spatial distribution of individuals within a catchment and in the distribution of
442
443
444
445
446
447
448
449
450
451
452
453
454
455
456
457
458
459
460
461
462
463
464
465
466
467

length-at-silvering. It would be interesting in the future to incorporate population dynamics and to
apply the model to a real river catchment. Basin model proposed by MacCall (1990) and diffusion-
advection models (Mullen 1989; Bertignac et al. 1998) would be relevant solution to model eel
spatial distribution. Diffusion-advection model would allow to incorporate dynamics in EvEel.
These types of models are all based on theoretical ecological concepts (fitness) which are often
interesting to explore assumptions that may be validated in the future (Willis 2011). These models
would probably result in smoother transitions between males and females and in length-at-silvering
because of diffusion. It would be very interesting to compare the results of those models to the
outputs of mechanistic or statistical models that have been used to model eels spatial distribution
(Ibbotson et al. 2002; Lambert et al. 2011; Jouanin et al. 2012).
In the current version of the model, we only consider the growth phase in continental waters and we
do not consider the larval drift and the spawning migration. Depending on the river catchment,
distance to spawning grounds and consequently migration duration may vary. Larval drift being
passive, there is probably no systematic inter-individual difference in fitness. Glass-eels may recruit
with variable lengths and energetic resources at different latitudes, however our results were not
affected when varying Lg. Regarding spawning migration, Clevestam et al. (2011) suggested that
silver eels from the Baltic Sea, one of the most distant region from A. anguilla spawning grounds,
may be too small to undergo the migration. Consequently, it would be interesting to take into
account this migration in a future version of the model.
Regarding length-at-silvering, the model produces smaller silver eels downstream where males are
dominant than upstream where females are dominant. This pattern is consistent with observations.
Regarding females length-at-silvering, it is constant over the whole catchment. Possible gradient of
female length-at-silvering is sometimes suspected in the literature though evidence is small. By
taking into account population dynamics, and especially migration dynamics, in the model, fast
migrating females would benefit from upstream habitat with lower density since all females would
not be able to reach upstream habitat, resulting in females with slightly larger length-at-silvering.
468
469
470
471
472
473
474
475
476
477
478
479
480
481
482
483
484
485
486
487
488
489
490
491
492
493

To conclude, the study of phenotypic plasticity has progressed significantly over the past few
decades (Pigliucci 2005) and empirical evidences have been accumulated for many taxa (Ernande
and Dieckmann 2004). Regarding diadromous fishes, the role of phenotypic plasticity in explaining
some geographic gradients in migratory behaviour of salmonids have for example been underlined
by Dodson et al (2013). We think that temperate eels are relevant species to work on phenotypic
plasticity. Their large distribution area with spatially structured environments, panmixia and passive
larval drift limit the possibility of local adaptation and favours phenotypic plasticity as an adaptive
response. Phenotypic plasticity in terms of sexual-determination and subsequent sex-ratio (Davey
and Jellyman 2005), length-at-silvering (Vollestad 1992), growth rate (Geffroy and Bardonnet
2012), natural mortality rate and migration behaviour (Edeline 2007; Cairns et al. 2009) have
actually been documented and analysed for a long time. However, they have generally been
considered separately, or two by two, without considering the entire continental life cycle of eels.
To our knowledge, it is the first time that all those mechanisms are analysed simultaneously in a
single model that considers the implications of life history traits and tactical choices as adaptive
responses to highly variable environmental conditions. More generally, we think that evolutionary
ecology may provide valuable insights to better understand the continental phase of this species.
Phenotypic plasticity has been considered as a nuisance parameter in evolutionary study before
becoming a paradigm (Pigliucci 2005). Phenotypic variability is also considered as a nuisance
(noise) in population dynamic models for eels. We are alike convinced that phenotypic plasticity
should become a paradigm to develop appropriate models for this species.
Acknowledgements
We would like to thank Guy Verreault and Martin Castonguay for the fruitful discussions we had
about this paper. We also would like to thank to anonymous referees who helped to improve the
quality and the clarity of this manuscript.
494
495
496
497
498
499
500
501
502
503
504
505
506
507
508
509
510
511
512
513
514
515
516
517
518
References
Als, T.D., Hansen, M.M., Maes, G.E., Castonguay, M., Riemann, L., Aarestrup, K., Munk, P.,
Sparholt, H., Hanel, R., and Bernatchez, L. 2011. All roads lead to home: panmixia of
European eel in the Sargasso Sea. Mol Ecol 20: 1333–1346.
Andrello, M., Bevacqua, D., Maes, G.E., and De Leo, G.A. 2011. An integrated genetic-
demographic model to unravel the origin of genetic structure in European eel (Anguilla
anguilla L.). Evol. Appl. 4: 517–533.
Arai, T., and Chino, N. 2012. Diverse migration strategy between freshwater and seawater habitats
in the freshwater eel genus Anguilla. J. FISH Biol. 81: 442–455.
Baskett, M.L., Levin, S.A., Gaines, S.D., and Dushoff, J. 2005. Marine reserve design and the
evolution of size at maturation in harvested fish. Ecol. Appl. 15: 882–901. doi: 10.1890/04-
0723.
Bertignac, M., Lehodey, P., and Hampton, J. 1998. A spatial population dynamics simulation model
of tropical tunas using a habitat index based on environmental parameters. Fish. Oceanogr.
7: 326–334.
Beullens, K., Eding, E., Gilson, P., Ollevier, F., Komen, J., and Richter, C. 1997. Gonadal
differentiation, intersexuality and sex ratios of European eel (Anguilla anguilla L.)
maintained in captivity. Aquaculture 153: 135–150.
Bevacqua, D., Andrello, M., Melia, P., Vincenzi, S., De Leo, G.A., and Crivelli, A.J. 2011a.
Density-dependent and inter-specific interactions affecting European eel settlement in
freshwater habitats. Hydrobiologia 671: 259–265.
Bevacqua, D., Melià, P., de Leo, G.A., and Gatto, M. 2011b. Intra-specific scaling of natural
mortality in fish: The paradigmatic case of the European eel. 165: 333–339.
Bonhommeau, S., Blanke, B., Tréguier, A.-M., Grima, N., Rivot, E., Vermard, Y., Greiner, E., and
519
520
521
522
523
524
525
526
527
528
529
530
531
532
533
534
535
536
537
538
539
540
541
542
543

Le Pape, O. 2009. How fast can the European eel (Anguilla anguilla) larvae cross the
Atlantic Ocean? Fish Ocean. 18: 371–385.
Brown, J.H., Gillooly, J.F., Allen, A.P., Savage, V.M., and West, G.B. 2004. Toward a metabolic
theory of ecology. Ecology 85: 1771–1789.
Cairns, D.K., Secor, D.A., Morrison, W.E., and Hallett, J.A. 2009. Salinity-linked growth in
anguillid eels and the paradox of temperate-zone catadromy. J. Fish Biol. 74: 2094–2114.
Clarke, A. 2003. Costs and consequences of evolutionary temperature adaptation. Trends Ecol.
Evol. 18: 573–581. doi: 10.1016/j.tree.2003.08.007.
Clarke, A. 2006. Temperature and the metabolic theory of ecology. Funct. Ecol. 20: 405–412. doi:
10.1111/j.1365-2435.2006.01109.x.
Clarke, A., and Johnston, N.M. 1999. Scaling of metabolic rate with body mass and temperature in
teleost fish. J. Anim. Ecol. 68: 893–905. doi: 10.1046/j.1365-2656.1999.00337.x.
Clarke, C.W. 1993. Dynamic models of behavior: An extension of life history theory. Trends Ecol.
Evol. 8: 205–209. doi: 10.1016/0169-5347(93)90100-4.
Clevestam, P.D., Ogonowski, M., Sjoberg, N.B., and Wickstrom, H. 2011. Too short to spawn?
Implications of small body size and swimming distance on successful migration and
maturation of the European eel Anguilla anguilla. J. FISH Biol. 78: 1073–1089.
Clobert, J., Perrins, C., McCleery, R., and Gosler, A. 1988. Survival rate in the great tit Parus major
in relation to sex, age, and immigration status. J. Anim. Ecol. 57: 287–306.
Colombo, G., and Grandi, G. 1996. Histological study of the development and sex differentiation of
the gonad in the European eel. J Fish Biol 48: 493–512.
Côté, C.L., Castonguay, M., McWilliam, K.S., Gordon, C., and Bernatchez, L. 2014. In absence of
local adaptation, plasticity and spatially varying selection rule: a view from genomic
reaction norms in a panmictic species (Anguilla rostrata). BMC Genomics 15: 403. doi:
10.1186/1471-2164-15-403.
Côté, C.L., Castonguay, M., Verreault, G., and Bernatchez, L. 2009. Differential effects of origin
544
545
546
547
548
549
550
551
552
553
554
555
556
557
558
559
560
561
562
563
564
565
566
567
568
569

and salinity rearing conditions on growth of glass eels of the American eel Anguilla rostrata:
implications for stocking programmes. J. Fish Biol. 74: 1934–1948. doi: 10.1111/j.1095-
8649.2009.02291.x.
Daverat, F., Beaulaton, L., Poole, R., Lambert, P., Wickstrom, H., Andersson, J., Aprahamian, M.,
Hizem, B., Elie, P., Yalcin-Ozdilek, S., and Gumus, A. 2012. One century of eel growth:
changes and implications. Ecol. Freshw. FISH 21: 325–336.
Daverat, F., Limburg, K., Thibault, I., Shiao, J.-C., Dodson, J., Caron, F., Tzeng, W.-N., Iizuka, Y.,
and Wickström, H. 2006. Phenotypic plasticity of habitat use by three temperate eel species,
Anguilla anguilla, A. japonica and A. rostrata. Mar Ecol Prog Ser 308: 231–241.
Daverat, F., and Tomás, J. 2006. Tactics and demographic attributes in the European eel Anguilla
anguilla in the Gironde watershed, SW France. Mar Ecol Prog Ser 307: 247–257.
Davey, A., and Jellyman, D. 2005. Sex determination in freshwater eels and management options
for manipulation of sex. Rev Fish Biol Fish 15: 37–52.
Dekker, W. 1998. Long-term trends in the glasseels immigrating at Den Oever, The Netherlands.
Bull. Fr. Pêche Piscic.: 199–214. doi: 10.1051/kmae:1998045.
Dekker, W. 2000. A Procrustean assessment of the European eel stock. 57: 938–947.
Van Den Thillart, G., Palstra, A., and Van Ginneken, V. 2007. Simulated migration of European
silver eel; swim capacity and cost of transport. J. Mar. Sci. Technol. 15: 1–16.
Desaunay, Y., and Guerault, D. 1997. Seasonal and long-term changes in biometrics of eel larvae: a
possible relationship between recruitment variation and North Atlantic ecosystem
productivity. J. Fish Biol. 51: 317–339. doi: 10.1111/j.1095-8649.1997.tb06106.x.
Desaunay, Y., Lecomte-Finiger, R., and Guérault, D. 2012. Mean age and migration patterns of
Anguilla anguilla (L.) glass eels from three French estuaries (Somme, Vilaine and Adour
Rivers). Arch. Pol. Fish. 20: 185–190. [accessed 22 January 2014].
Devlin, R., and Nagahama, Y. 2002. Sex determination and sex differentiation in fish: An overview
of genetic, physiological, and environmental influences. Aquaculture 208: 191–364.
570
571
572
573
574
575
576
577
578
579
580
581
582
583
584
585
586
587
588
589
590
591
592
593
594
595

Dodson, J.J., Aubin-Horth, N., Thériault, V., and Páez, D.J. 2013. The evolutionary ecology of
alternative migratory tactics in salmonid fishes. Biol. Rev. 88: 602–625. doi:
10.1111/brv.12019.
Drouineau, H., Mahévas, S., Bertignac, M., and Duplisea, D. 2010. A length-structured and
spatialised model for the Northern stock of European hake (Merluccius merluccius). ICES J.
Mar. Sci. 67: 1697–1709.
Drouineau, H., Savard, L., Desgagnés, M., and Duplisea, D. 2012. SPAM (Sex-Structured Pandalus
Assessment Model): a stock assessment model for Pandalus stocks. Can. J. Fish. Aquat. Sci.
69: 770–783.
Edeline, E. 2007. Adaptive phenotypic plasticity of eel diadromy. Mar. Ecol.-Prog. Ser. 341: 229–
232.
Ernande, B., and Dieckmann, U. 2004. The evolution of phenotypic plasticity in spatially structured
environments: Implications of intraspecific competition, plasticity costs and environmental
characteristics. J Evol Biol 17: 613–628.
Eveson, J.P., Polacheck, T., and Laslett, G.M. 2007. Consequences of assuming an incorrect error
structure in von Bertalanffy growth models: a simulation study. Can. J. Fish. Aquat. Sci. 64:
602–617. doi: 10.1139/f07-036.
Fromentin, J.-M., Myers, R.A., Bjørnstad, O.N., Stenseth, N.C., Gjøsæter, J., and Christie, H. 2001.
Effects of density-dependent and stochastic processes on the regulation of cod populations.
Ecology 82: 567–579. doi: 10.1890/0012-9658(2001)082[0567:EODDAS]2.0.CO;2.
Gagnaire, P.-A., Normandeau, E., Côté, C., Hansen, M.M., and Bernatchez, L. 2012. The Genetic
Consequences of Spatially Varying Selection in the Panmictic American Eel (Anguilla
rostrata). Genetics 190: 725–736. doi: 10.1534/genetics.111.134825.
Gardner, R., Morris, M.R., and Nelson, C.E. 1987. Conditional evolutionarily stable strategies.
Anim. Behav. 35: 507–517. doi: 10.1016/S0003-3472(87)80275-0.
Geffroy, B. 2012. Déterminisme environnemental du sexe chez l’Anguille Européenne Anguilla
596
597
598
599
600
601
602
603
604
605
606
607
608
609
610
611
612
613
614
615
616
617
618
619
620
621
anguilla. Thèse de doctorat - spécialité physiologie et biologie des organismes-populations-
interactions, Université de Pau et des pays de l’Adour - École docorale 211 sciences exactes
et leurs applications.
Geffroy, B., and Bardonnet, A. 2012. Differential effects of behaviour, propensity to migrate and
recruitment season on glass eels and elvers’ growing performance. Ecol. Freshw. Fish 21:
469–482.
Gibbs, M., Lace, L., Jones, M., and Moore, A. 2004. Intraspecific competition in the speckled wood
butterfly Pararge aegeria: effect of rearing density and gender on larval life history. J Insect
Sci 4: 16.
Giske, J., Huse, G., and Fiksen, O. 1998. Modelling spatial dynamics of fish. Rev Fish Biol Fish 8:
57–91.
Gotthard, K., and Nylin, S. 1995. Adaptive Plasticity and Plasticity as an Adaptation: A Selective
Review of Plasticity in Animal Morphology and Life History. Oikos 74: 3–17. doi:
10.2307/3545669.
Grimm, V., and Railsback, S. 2012. Pattern-oriented modelling: A “multi-scope” for predictive
systems ecology. Philos Trans R Soc B Biol Sci 367: 298–310.
Han, Y., Hung, C., Liao, Y., and Tzeng, W. 2010. Population genetic structure of the Japanese eel
Anguilla japonica: panmixia at spatial and temporal scales. Mar. Ecol. Prog. Ser. 401: 221–
232. doi: 10.3354/meps08422.
Han, Y.-S., and Tzeng, W.-N. 2006. Use of the sex ratio as a means of resource assessment for the
Japanese eel Anguilla japonica: A case study in the Kaoping River, Taiwan. Zool. Stud. 45:
255–263.
Helfman, G., Bozeman, E., and Brothers, E. 1984. Size, age, and sex of American eels in a Georgia
river. Trans. Am. Fish. Soc. 113: 132–141.
Helfman, G., Facey, D.E., Stanton Hales Jr., L., and Bozeman Jr., E.L. 1987. Reproductive ecology
of the American eel. Am. Fish. Soc. Symp. 1: 42–56.
622
623
624
625
626
627
628
629
630
631
632
633
634
635
636
637
638
639
640
641
642
643
644
645
646
647

Hixon, M.A., and Jones, G.P. 2005. Competition, Predation, and Density-Dependent Mortality in
Demersal Marine Fishes. Ecology 86: 2847–2859. [accessed 13 June 2014].
Holmgren, K. 1996. Effect of water temperature and growth variation on the sex ratio of
experimentally reared eels. Ecol Freshw Fish 5: 203–212.
Holmgren, K., and Mosegaard, H. 1996. Implications of individual growth status on the future sex
of the European eel. J Fish Biol 49: 910–925.
Holmgren, K., Wickström, H., and Clevestam, P. 1997. Sex-related growth of European eel,
Anguilla anguilla, with focus on median silver eel age. Can J Fish Aquat. Sci 54: 2775–
2781.
Ibbotson, A., Smith, J., Scarlett, P., and Aprhamian, M. 2002. Colonisation of freshwater habitats by
the European eel Anguilla anguilla. Freshw Biol 47: 1696–1706.
Jessop, B.M. 2010. Geographic effects on American eel (Anguilla rostrata) life history
characteristics and strategies. Can. J. Fish. Aquat. Sci. 67: 326–346.
Jouanin, C., Briand, C., Beaulaton, L., and Lambert, P. 2012. Eel Density Analysis (EDA 2.x) : Un
modèle statistique pour estimer l’échappement des anguilles argentées (Anguilla anguilla)
dans un réseau hydrographique. Irstea Onema.
Kettle, A., and Haines, K. 2006. How does the European eel (Anguilla anguilla) retain its
population structure during its larval migration across the North Atlantic Ocean? Can J Fish
Aquat. Sci 63: 90–106.
Kettle, A.J., Asbjørn Vøllestad, L., and Wibig, J. 2011. Where once the eel and the elephant were
together: decline of the European eel because of changing hydrology in southwest Europe
and northwest Africa? Fish Fish. 12: 380–411.
Van Kleunen, M., and Fischer, M. 2005. Constraints on the evolution of adaptive phenotypic
plasticity in plants. New Phytol 166: 49–60.
Kooijman, S.A.L.M. 2000. Dynamic Energy and Mass Budgets in Biological Systems. Cambridge
University Press.
648
649
650
651
652
653
654
655
656
657
658
659
660
661
662
663
664
665
666
667
668
669
670
671
672
673

Krueger, W., and Oliveira, K. 1999. Evidence for environmental sex determination in the American
eel, Anguilla rostrata. Env. Biol Fishes 55: 381–389.
Lambert, P., Verreault, G., Lévesque, B., Tremblay, V., Dutil, J.D., and Dumont, P. 2011.
Détermination de l’impact des barrages sur l’accès de l’anguille d’Amérique (Anguilla
rostrata) aux habitats d’eau douce et établissement de priorités pour des gains en habitat.
Rapport technique canadien des sciences halieutiques et aquatiques 2921.
De Leo, G.A., and Gatto, M. 1995. A size and age-structured model of the European eel (Anguilla
anguilla L.). Can. J. Fish. Aquat. Sci. 52: 1351–1367.
De Leo, G., and Gatto, M. 1996. Trends in vital rates of the European eel: evidence for density
dependence? Ecol. Appl. 6: 1281–1294.
Levins, R. 1963. Theory of fitness in a heterogeneous environment. II. Developmental flexibility
and niche selection. Amercian Nat. 47: 75–90.
Lobón-Cerviá, J., and Iglesias, T. 2008. Long-term numerical changes and regulation in a river
stock of European eel Anguilla anguilla. Freshw. Biol. 53: 1832–1844. doi: 10.1111/j.1365-
2427.2008.02008.x.
Lockwood, S.J. 1980. Density-dependent mortality in 0-group plaice (Pleuronectes platessa L.)
populations. J. Cons. 39: 148–153. doi: 10.1093/icesjms/39.2.148.
MacCall, A.D. 1990. Dynamic Geography of Marine Fish Populations (Books in Recruitment
Fisheries Oceanography, Washington Sea Grant Program). University of Washington Press.
Mangel, M., and Clark, C.W. 1986. Towards a Unified Foraging Theory. Ecology 67: 1127–1138.
doi: 10.2307/1938669.
Mangel, M., and Clark, C.W. 1988. Dynamic Modeling in Behavioral Ecology. Princeton
University Press.
Mayhew, P. 2006. Discovering evolutionary ecology: bringing together ecology and evolution.
Oxford University Press.
McCleave, J. 1993. Physical and behavioural controls on the oceanic distribution and migration of
674
675
676
677
678
679
680
681
682
683
684
685
686
687
688
689
690
691
692
693
694
695
696
697
698
699

leptocephali. J Fish Biol 43: 243–273.
McLaren, I.A. 1963. Effects of Temperature on Growth of Zooplankton, and the Adaptive Value of
Vertical Migration. J. Fish. Res. Board Can. 20: 685–727. doi: 10.1139/f63-046.
McNamara, J.M., and Houston, A.I. 1992. State-dependent life-history theory and its implications
for optimal clutch size. Evol. Ecol. 6: 170–185. doi: 10.1007/BF02270710.
Melià, P., Bevacqua, D., Crivelli, A.J., De Leo, G.A., Panfili, J., and Gatto, M. 2006a. Age and
growth of Anguilla anguilla in the Camargue lagoons. J. Fish Biol. 68: 876–890. doi:
10.1111/j.0022-1112.2006.00975.x.
Melià, P., Bevacqua, D., Crivelli, A., Panfili, J., De Leo, G., and Gatto, M. 2006b. Sex
differentiation of the European eel in brackish and freshwater environments: A comparative
analysis. J Fish Biol 69: 1228–1235.
Moriarty, C. 2003. The Yellow Eel. In Eel Biology. Edited by K. Aida, K. Tsukamoto, and K.
Yamauchi. Springer Japan. pp. 89–105. Available from
http://link.springer.com/chapter/10.1007/978-4-431-65907-5_7 [accessed 21 January
2014].
Mullen, A.J. 1989. Aggregation of fish through variable diffusivity. Fish. Bull. 87: 353–362.
Myers, R.A., and Cadigan, N.G. 1993. Density-Dependent Juvenile Mortality in Marine Demersal
Fish. Can. J. Fish. Aquat. Sci. 50: 1576–1590. doi: 10.1139/f93-179.
Oliveira, K. 1999. Life history characteristics and strategies of the American eel, Anguilla rostrata.
56: 795–802.
Oliveira, K., and Mccleave, J. 2000. Variation in population and life history traits of the American
eel, Anguilla rostrata, in four rivers in Maine. Env. Biol Fishes 59: 141–151.
Oliveira, K., McCleave, J., and Wippelhauser, G. 2001. Regional variation and the effect of lake:
River area on sex distribution of American eels. J Fish Biol 58: 943–952.
Pauly, D. 1980. On the interrelationships between natural mortality, growth parameters, and mean
environmental-temperature in 175 fish stocks. J. Cons. 39: 175–192.
700
701
702
703
704
705
706
707
708
709
710
711
712
713
714
715
716
717
718
719
720
721
722
723
724
725

Pigliucci, M. 2005. Evolution of phenotypic plasticity: Where are we going now? Trends Ecol Evol
20: 481–486.
Pilling, G.M., Kirkwood, G.P., and Walker, S.G. 2002. An improved method for estimating
individual growth variability in fish, and the correlation between von Bertalanffy growth
parameters. Can. J. Fish. Aquat. Sci. 59: 424–432. doi: 10.1139/f02-022.
Piou, C., and Prévost, E. 2012. A demo-genetic individual-based model for Atlantic salmon
populations: Model structure, parameterization and sensitivity. Ecol. Model. 231: 37–52.
doi: 10.1016/j.ecolmodel.2012.01.025.
De Pontual, H., Groison, A.L., Pineiro, C., and Bertignac, M. 2006. Evidence of underestimation of
European hake growth in the Bay of Biscay, and its relationship with bias in the agreed
method of age estimation. ICES J. Mar. Sci. 63: 1674–1681.
Poole, W., Reynolds, J., and Moriarty, C. 1990. Observations on the silver eel migrations of the
Burrishoole River system, Ireland, 1959 to 1988. Int. Rev. Gesamten Hydrobiol. 75: 807–
815.
Pujolar, J.M. 2013. Conclusive evidence for panmixia in the American eel. Mol. Ecol. 22: 1761–
1762. doi: 10.1111/mec.12143.
Railsback, S.F., and Harvey, B.C. 2013. Trait-mediated trophic interactions: is foraging theory
keeping up? Trends Ecol. Evol. 28: 119–125. doi: 10.1016/j.tree.2012.08.023.
Roncarati, A., Melotti, P., Mordenti, O., and Gennari, L. 1997. Influence of stocking density of
European eel (Anguilla anguilla, L.) elvers on sex differentiation and zootechnical
performances. J Appl Ichthyol 13: 131–136.
Schlichting, C.D. 1986. The evolution of phenotypic plasticity in plants. Annu Rev Ecol Syst 17:
667–693.
Schmidt, J. 1923. Breeding places and migrations of the eel. Nature 111: 51–54.
Siegfried, K.I., and Sansó, B. 2006. Two Bayesian methods for estimating parameters of the von
Bertalanffy growth equation. Environ. Biol. Fishes 77: 301–308. doi: 10.1007/s10641-006-
726
727
728
729
730
731
732
733
734
735
736
737
738
739
740
741
742
743
744
745
746
747
748
749
750
751

9112-6.
Sultan, S.E. 1987. Evolutionary implications of phenotypic plasticity in plants. Evol. Biol. 21: 127–
178.
Tesch, F.W. 2003. The Eel. Blackwell Publishing.
Travis, J. 1994. Evaluating the adaptive role of morphological plasticity. In Ecological Morphology:
Integrative Organismal Biology. University of Chicago Press. pp. 99–122.
Tsukamoto, K. 1992. Discovery of the spawning area for Japanese eel. Nature 356: 789–791. doi:
10.1038/356789a0.
Tsukamoto, K., Nakai, I., and Tesch, W.-V. 1998. Do all freshwater eels migrate? [3]. Nature 396:
635–636.
Tsurim, I., Silberbush, A., Ovadia, O., Blaustein, L., and Margalith, Y. 2013. Inter- and Intra-
Specific Density-Dependent Effects on Life History and Development Strategies of Larval
Mosquitoes. PLoS ONE 8. Available from http://www.scopus.com/inward/record.url?eid=2-
s2.0-84874630437&partnerID=40&md5=5537d1e98088552935df51e187be8151.
Vladykov, V.D. 1966. Remarks on the American Eel (Anguilla rostrata LeSueur). Sizes of elvers
entering streams; the relative abundance of adult males and females; and present economic
importance of eels in North America. Verhandlungen Int. Ver. Für Theor. Angew. Limnol.
16: 1007–1017.
Vollestad, L.A. 1992. Geographic variation in age and length at metamorphosis of maturing
European eel - Environmental effects and phenotypic plasticity. 61: 41–48.
Vollestad, L.A., and Jonsson, B. 1988. A 13-year study of population dynamics and growth of the
European eel Anguilla anguilla in a Norwegian River: evidence for density-dependent
mortality, and development of a model for predicting yield. J. Anim. Ecol. 57: 983–997.
Willis, J. 2011. Modelling swimming aquatic animals in hydrodynamic models. Ecol Modell 222:
3869–3887.
752
753
754
755
756
757
758
759
760
761
762
763
764
765
766
767
768
769
770
771
772
773
774
775
776

Tables
Table 1. Parameters values used in the four sets
S0 : Controlexperiment
S1 : Density-dependence
S2 : Differentialdensity-dependence
S3 : Gradient onmortality
n 30
rNm 10000
10000
1a 8846 (Andrello et al. 2011)
a 1.387119 (Melià et al. 2006a; Andrello et al. 2011)
b 3.22 (Melià et al. 2006a)
L 76.2 cm (De Leo and Gatto 1995)
mLs 40.5 cm (Vollestad 1992)
gL 7.5 cm (Desaunay and Guerault 1997; Dekker 1998; Desaunay et al. 2012)
1r,K 0.23 year-1 (De Leo and Gatto 1995)
nr,K 0.115 year-1
1r,M 0.138 year-1 (Dekker 2000)
nr,M 0.138 year-1 0.103 year-1
Mγ 0.05
Kγ 0.05
mα 0 0.0001 0.00005 0.0001
fα 0 0.0001 0.0001 0.0001
777
778
779
780
781

Table 2. Consistency of the model with observed spatial patterns at the river catchment scale and at
the distribution area scale
Patterns
Distribution area scale
male-biased sex ratio in the southern part of the distribution area and female-biased sex-ratio in the northern part
yes
male-biased sex-ratio in environment with high density yes
male-biased sex-ratio in fast growth environment yes
River catchment scale S0 S1 S2 S3
higher density downstream than upstream yes yes yes yes
higher length-at-silvering upstream than downstream no no yes no
male-biased sex-ratio downstream and female-biased sex-ratio upstream no no yes no
782
783
784

Figures
Fig. 1. Illustration of the trade-off between fp (grey line) and fecundity (black solid line): fp
decreases with length-at-silvering while fecundity increases resulting in a dome-shaped mean
expected reproductive output which is considered as a proxy of the fitness fπ (dashed line). The
optimal length-at-silvering is 64.1 cm for considered conditions (M=0.138 year-1 (Dekker 2000) and
0.23 year-1 (De Leo and Gatto 1995)).
785
786

Fig. 2. Instantaneous growth rate (left panel) and instantaneous non density-dependent natural
mortality (right panel) corresponding to each set of parameters.

Fig. 3. Fitness ratio rπrπ mf / depending on instantaneous natural mortality rate M(r) and
instantaneous growth rate K(r) at the catchment mouth. Dark colours indicate fitness marginal gains
for females whereas light colours indicate fitness marginal gains for males. Lines represent the
physiologically plausible values of K(r) and M(r) combinations at different temperatures based on
Pauly (1980) (5°C longdash, 10°C solid, 15°C dashed, 20°C dotted and 25°C dotdash). Circles
indicates putative positions for eels in Scandinavia (black circle), Bay of Biscay (grey circle) and
Mediterranean lagoons (white circle)

Fig. 4. Lsf(r) maximising female fitness as a function of K(r) and M(r). Coloured lines represent the
physiologically plausible values of K(r) and M(r) combinations at different temperatures based on
Pauly (1980) (5°C longdash, 10°C solid, 15°C dashed, 20°C dotted and 25°C dotdash). Circles
indicates putative positions for eels in Scandinavia (black circle), Bay of Biscay (grey circle) and
Mediterranean lagoons (white circle).

Fig. 5. Length-at-silvering, abundance, natural morality (including density-dependence), and
relative fitness by sex for each set of parameters.