Embed Size (px)
Citation preview
Animal Biology, Vol. 57, No. 4, pp. 453-465 (2007) Koninklijke Brill NV, Leiden, 2007.Also available online - www.brill.nl/ab
Endocrine profiles during silvering of the European eel(Anguilla anguilla L.) living in saltwater
VINCENT VAN GINNEKEN 1,∗, CAROLINE DURIF 2, SYLVIE DUFOUR 3,MISKAL SBAIHI 3, RON BOOT 1, KEES NOORLANDER 1, JORGDOORNBOS 1, ALBERTINKA J. MURK 4,5, GUIDO VAN DEN THILLART 1
1 Integrative Zoology, Institute Biology Leiden (IBL), van der Klaauw Laboratorium, P.O. Box 9511,2300 RA Leiden, The Netherlands
2 Institute of Marine Research, 5392, Storebø/Centre for Ecological and Evolutionary Synthesis,University of Oslo, P.O. Box 1066, Blindern 0316 Oslo, Norway
3 Museum National Histoire Naturelle (MNHN), Paris, France4 Section Toxicology, Wageningen University, P.O. Box 8000, 6700 EA Wageningen, The Netherlands5 Wageningen IMARES, Haringkade 1, 1976 CP Ijmuiden, The Netherlands
Abstract—The transformation of yellow eel into silver eel is called ‘silvering’, and takes place priorto migration. This is the first study to provide hormonal profiles of European eel (Anguilla anguilla L.)during silvering. This transformation occurs in association with hormonal surges of testosterone (T)and estradiol (E2) but not with thyroid hormones (TH) and growth hormone (GH) which have amaximum activity in spring and a minimum activity in summer and autumn. It is therefore suggestedTHs and GH are not important for eel gonadal development in the autumn. Based on PCA analysiswith physiological, morphological and endocrinological parameters it is concluded that the transitionis gradual and that eels go through several stages.
Keywords: Anguilla anguilla L.; cortisol; estradiol; European eel; growth hormone; metamorphosis;seasonal changes; silvering; testosterone; thyroid hormone.
INTRODUCTION
The European eel (Anguilla anguilla L.) undergoes two metamorphoses during itslife cycle. The first one corresponds to the transformation from leptocephalus larvaeinto glass eel during its oceanic migration from the supposed spawning grounds inthe Sargasso Sea to the European coasts. The second metamorphosis occurs afterthe growth phase as a yellow eel, and marks the onset of puberty (silver eel). This
∗Corresponding author; e-mail: [email protected]
454 V. van Ginneken et al.
transition phase, referred to as silvering, anticipates the long-distance migrationback to oceanic waters. The drastic changes of habitat (from a freshwater or coastalhabitat to an open-sea environment) and behavior (from sedentary to migratory)necessitate the modification of many systems (see Lokman et al., 2003 for review):visual (increase in eye-surface, and shift to shorter wave-lengths characteristicof deep-sea vision, Archer et al., 1995), osmoregulatory (hypo-osmoregulatoryadaption), and metabolic (increase in muscle power output, and changes in locationof fat stores). Silver or migratory eels have stopped feeding, and a regression ofthe alimentary tract can be observed. Although true sexual maturation only occursduring the oceanic migration, the gonadotropic axis is initiated before the eel startsits first downstream movements. A slight development of gonads can be observedin female silver European eels while they are still in fresh- or coastal waters.
Unlike smoltification in salmonids, silvering of eels is largely unpredictable. Itoccurs at various ages (5-20 years) and sizes (body length: 26-101 cm) (Tesch, 2003;Dekker et al., 1998). Because of the difficulty of getting individuals while they are inthe process of metamorphosing, it is most common when studying eels, to separateindividuals into two groups, yellow (resident) and silver (presumably migrant),and to compare the physiological profiles between the two. Basic knowledge wasobtained in this way on the major differences in hormone levels between the twostages. Histology has shown that the thyroid gland of silver eels is more active thanthat of yellow eels (Callamand and Fontaine, 1942). High levels of total thyroxine(TT4) have been found in migratory eels (Marchelidon et al., 1999). The productionof thyroid hormones is also thought to be responsible for the hyperactivity of eels atthe onset of migration (Fontaine, 1975).
The most important changes however relate to the reproductive system. As in allvertebrates, the development and activity of the gonads are under the positive controlof gonadotropic hormones (GTH), which are produced by the pituitary. In responseto stimulation, gonads will produce gametes and sexual steroids, which in turn willstimulate other organs implicated in reproduction. Vitellogenin is secreted by theliver under the control of estradiol. In contrast to yellow eels, silver eels only, havecells with the necessary estradiol receptors (Burzawa-Gerard et al., 1994). Yelloweels are incapable of vitellogenesis, while silver eels also have the structures, whichwill allow endocytosis of vitellogenin. In the yellow eel, the gonadotropic functionis totally inactive, while in silver eels plasma levels of gonadotropin are low (Dufouret al., 1983a; Dufour et al., 1983b). Although main differences between the twostages have been described, little is known about the dynamics of the silveringprocess, although it has been shown that the transition is gradual and that eelsgo through several stages (Durif et al., 2005). The objective of this study was toobtain a finer seasonal description of the silvering process (start and duration) aswell as of the physiological mechanisms involved (triggers and endocrine control).Due to the difficulty to obtain early silvering eels or to predict eels that will startthe metamorphosis, a monthly sampling schedule was carried out in which thebiggest eels were collected as they were the most likely to start silvering (Durif
Endocrine profiles of the European eel 455
et al., 2005). Eels were sampled at regular intervals from April to November, andseveral endocrine and metabolic parameters were analyzed.
MATERIAL AND METHODS
Animals
Every month from April until November 2002, local fishermen caught eels by fykenets at the Grevelingen. This is the largest saltwater lake of Western Europe witha total area of 14 000 hectares. The lake is situated on the boundary between Zuid-Holland and Zeeland, The Netherlands. As they were most likely to start silvering,the largest 8 female eels were selected every month (body length 63-90 cm). The fishwere rapidly anaesthetized with benzocaine (100 ppm). Blood was collected with aheparinized syringe and stored on dry ice for further analysis. The carcasses weretaken to the laboratory to measure body length, body weight, vertical and horizontaleye diameters. Organs were collected to determine the weights of digestive tract,liver, and gonads.
Blood analysis
For hormones and vitellogenin (VTG) the plasma was divided in Eppendorftubes (50 µl, 100 µl, 1 ml, 1 ml) for measurement of respectively VTG, growthhormone (GH) testosterone (T) and 17β-estradiol (E2), and stored at −80◦Cpending analysis. VTG was measured by immunoenzymatic assay according tothe protocol of Burzawa-Gerard et al. (1991) and GH by radioimmunoassayaccording to Marchelidon et al. (1996). T and E2 measurements were performedby Radioimmunoassay. Total thyroxin (TT4), free-T4 and tri-iodothyronine (TT3)were determined with commercial Amerlite kits (Amsersham International PLC,UK) modified for fish plasma.
Histology
After fixation in Bouin’s fluid, gonads were dehydrated in a graded ethanol seriesand embedded in Historesin according to standard procedures (Romeis, 1968). Theywere sectioned at 5 µm and stained with haematoxylin and eosin. The length andwidth of thirty oocytes of one section were measured and then averaged.
Data analysis
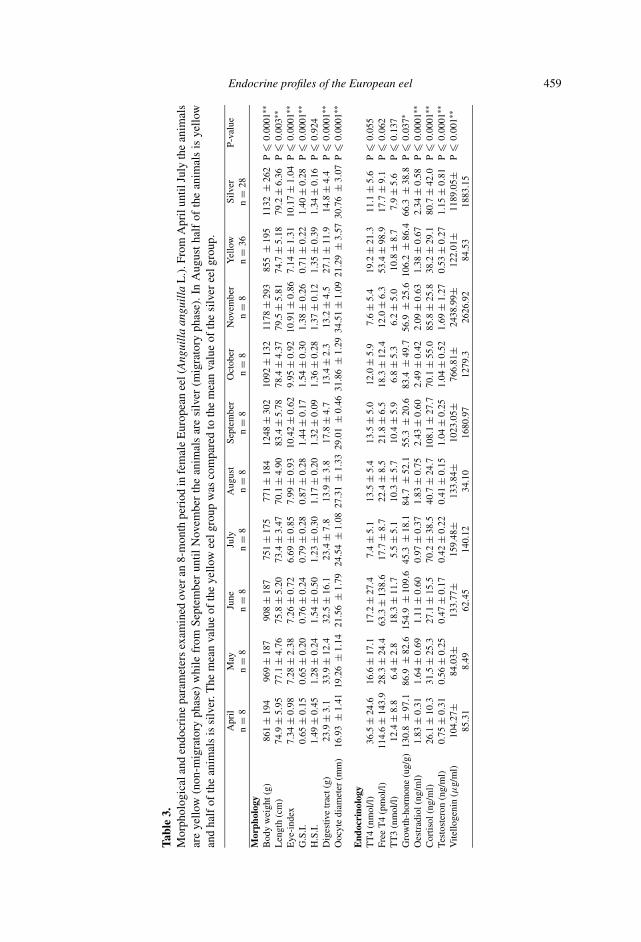
The animals caught in the period from April until July were all ‘yellow’ while theanimals in the period September until November were all ‘silver’. Classification wasperformed according to external parameters (skin color, eye size and thickness skin).Comparison between ‘yellow’ and ‘silver’ was performed on the average value us-ing a two sample T-test (table 3). Morphological and physiological descriptors were
456 V. van Ginneken et al.
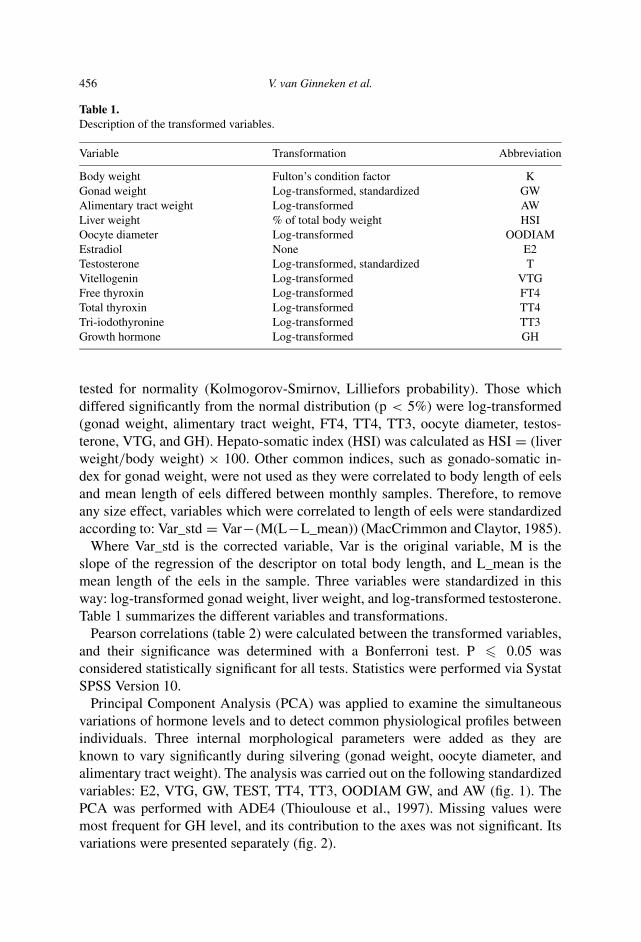
Table 1.Description of the transformed variables.
Variable Transformation Abbreviation
Body weight Fulton’s condition factor KGonad weight Log-transformed, standardized GWAlimentary tract weight Log-transformed AWLiver weight % of total body weight HSIOocyte diameter Log-transformed OODIAMEstradiol None E2Testosterone Log-transformed, standardized TVitellogenin Log-transformed VTGFree thyroxin Log-transformed FT4Total thyroxin Log-transformed TT4Tri-iodothyronine Log-transformed TT3Growth hormone Log-transformed GH
tested for normality (Kolmogorov-Smirnov, Lilliefors probability). Those whichdiffered significantly from the normal distribution (p < 5%) were log-transformed(gonad weight, alimentary tract weight, FT4, TT4, TT3, oocyte diameter, testos-terone, VTG, and GH). Hepato-somatic index (HSI) was calculated as HSI = (liverweight/body weight) × 100. Other common indices, such as gonado-somatic in-dex for gonad weight, were not used as they were correlated to body length of eelsand mean length of eels differed between monthly samples. Therefore, to removeany size effect, variables which were correlated to length of eels were standardizedaccording to: Var_std = Var−(M(L−L_mean)) (MacCrimmon and Claytor, 1985).
Where Var_std is the corrected variable, Var is the original variable, M is theslope of the regression of the descriptor on total body length, and L_mean is themean length of the eels in the sample. Three variables were standardized in thisway: log-transformed gonad weight, liver weight, and log-transformed testosterone.Table 1 summarizes the different variables and transformations.
Pearson correlations (table 2) were calculated between the transformed variables,and their significance was determined with a Bonferroni test. P � 0.05 wasconsidered statistically significant for all tests. Statistics were performed via SystatSPSS Version 10.
Principal Component Analysis (PCA) was applied to examine the simultaneousvariations of hormone levels and to detect common physiological profiles betweenindividuals. Three internal morphological parameters were added as they areknown to vary significantly during silvering (gonad weight, oocyte diameter, andalimentary tract weight). The analysis was carried out on the following standardizedvariables: E2, VTG, GW, TEST, TT4, TT3, OODIAM GW, and AW (fig. 1). ThePCA was performed with ADE4 (Thioulouse et al., 1997). Missing values weremost frequent for GH level, and its contribution to the axes was not significant. Itsvariations were presented separately (fig. 2).
Endocrine profiles of the European eel 457
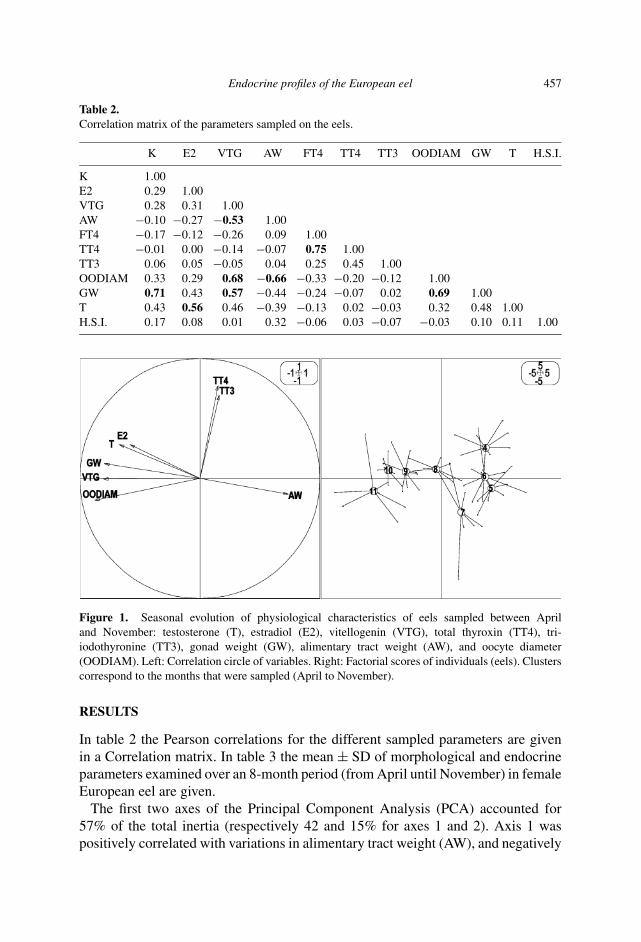
Table 2.Correlation matrix of the parameters sampled on the eels.
K E2 VTG AW FT4 TT4 TT3 OODIAM GW T H.S.I.
K 1.00E2 0.29 1.00VTG 0.28 0.31 1.00AW −0.10 −0.27 −0.53 1.00FT4 −0.17 −0.12 −0.26 0.09 1.00TT4 −0.01 0.00 −0.14 −0.07 0.75 1.00TT3 0.06 0.05 −0.05 0.04 0.25 0.45 1.00OODIAM 0.33 0.29 0.68 −0.66 −0.33 −0.20 −0.12 1.00GW 0.71 0.43 0.57 −0.44 −0.24 −0.07 0.02 0.69 1.00T 0.43 0.56 0.46 −0.39 −0.13 0.02 −0.03 0.32 0.48 1.00H.S.I. 0.17 0.08 0.01 0.32 −0.06 0.03 −0.07 −0.03 0.10 0.11 1.00
Figure 1. Seasonal evolution of physiological characteristics of eels sampled between Apriland November: testosterone (T), estradiol (E2), vitellogenin (VTG), total thyroxin (TT4), tri-iodothyronine (TT3), gonad weight (GW), alimentary tract weight (AW), and oocyte diameter(OODIAM). Left: Correlation circle of variables. Right: Factorial scores of individuals (eels). Clusterscorrespond to the months that were sampled (April to November).
RESULTS
In table 2 the Pearson correlations for the different sampled parameters are givenin a Correlation matrix. In table 3 the mean ± SD of morphological and endocrineparameters examined over an 8-month period (from April until November) in femaleEuropean eel are given.
The first two axes of the Principal Component Analysis (PCA) accounted for57% of the total inertia (respectively 42 and 15% for axes 1 and 2). Axis 1 waspositively correlated with variations in alimentary tract weight (AW), and negatively
458 V. van Ginneken et al.
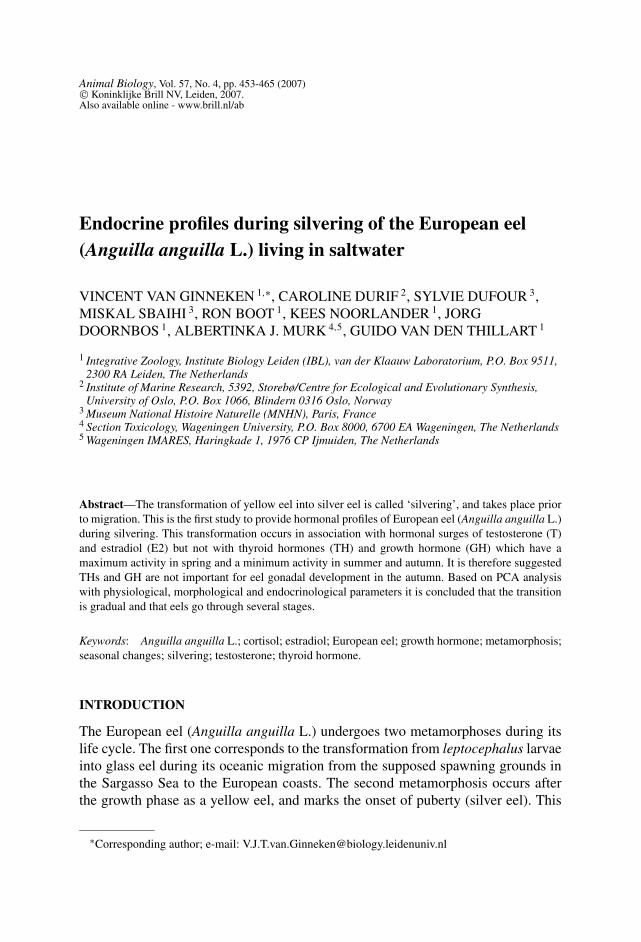
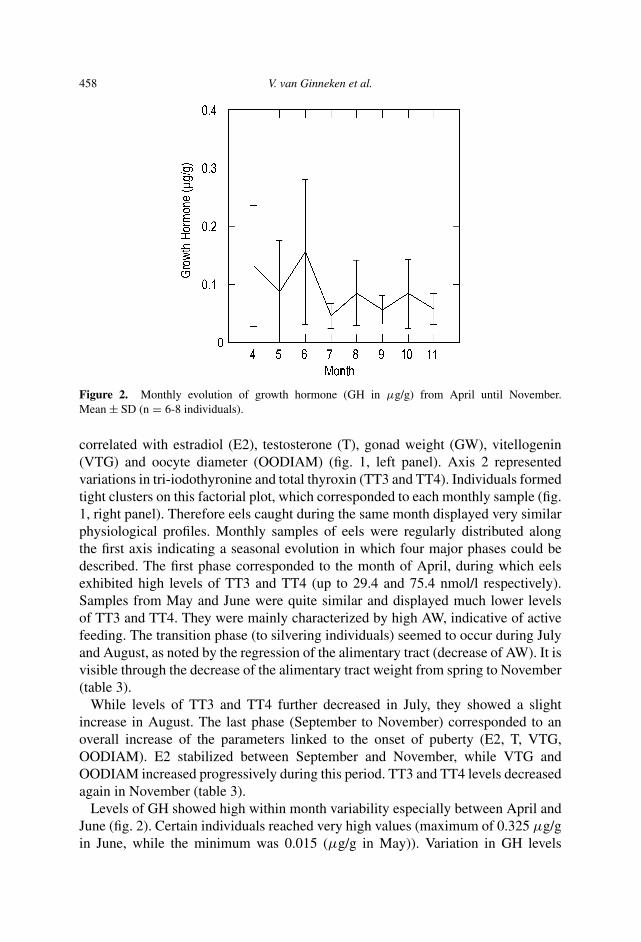
Figure 2. Monthly evolution of growth hormone (GH in µg/g) from April until November.Mean ± SD (n = 6-8 individuals).
correlated with estradiol (E2), testosterone (T), gonad weight (GW), vitellogenin(VTG) and oocyte diameter (OODIAM) (fig. 1, left panel). Axis 2 representedvariations in tri-iodothyronine and total thyroxin (TT3 and TT4). Individuals formedtight clusters on this factorial plot, which corresponded to each monthly sample (fig.1, right panel). Therefore eels caught during the same month displayed very similarphysiological profiles. Monthly samples of eels were regularly distributed alongthe first axis indicating a seasonal evolution in which four major phases could bedescribed. The first phase corresponded to the month of April, during which eelsexhibited high levels of TT3 and TT4 (up to 29.4 and 75.4 nmol/l respectively).Samples from May and June were quite similar and displayed much lower levelsof TT3 and TT4. They were mainly characterized by high AW, indicative of activefeeding. The transition phase (to silvering individuals) seemed to occur during Julyand August, as noted by the regression of the alimentary tract (decrease of AW). It isvisible through the decrease of the alimentary tract weight from spring to November(table 3).
While levels of TT3 and TT4 further decreased in July, they showed a slightincrease in August. The last phase (September to November) corresponded to anoverall increase of the parameters linked to the onset of puberty (E2, T, VTG,OODIAM). E2 stabilized between September and November, while VTG andOODIAM increased progressively during this period. TT3 and TT4 levels decreasedagain in November (table 3).
Levels of GH showed high within month variability especially between April andJune (fig. 2). Certain individuals reached very high values (maximum of 0.325 µg/gin June, while the minimum was 0.015 (µg/g in May)). Variation in GH levels
Endocrine profiles of the European eel 459
Tabl
e3.
Mor
phol
ogic
alan
den
docr
ine
para
met
ers
exam
ined
over
an8-
mon
thpe
riod
infe
mal
eE
urop
ean
eel(
Ang
uill
aan
guil
laL
.).F
rom
Apr
ilun
tilJu
lyth
ean
imal
sar
eye
llow
(non
-mig
rato
ryph
ase)
whi
lefr
omSe
ptem
ber
until
Nov
embe
rth
ean
imal
sar
esi
lver
(mig
rato
ryph
ase)
.In
Aug
ust
half
ofth
ean
imal
sis
yello
wan
dha
lfof
the
anim
als
issi
lver
.The
mea
nva
lue
ofth
eye
llow
eelg
roup
was
com
pare
dto
the
mea
nva
lue
ofth
esi
lver
eelg
roup
.
Apr
ilM
ayJu
neJu
lyA
ugus
tSe
ptem
ber
Oct
ober
Nov
embe
rY
ello
wSi
lver
P-va
lue
n=
8n
=8
n=
8n
=8
n=
8n
=8
n=
8n
=8
n=
36n
=28
Mor
phol
ogy
Bod
yw
eigh
t(g)
861
±19
496
9±
187
908
±18
775
1±
175
771
±18
412
48±
302
1092
±13
211
78±
293
855
±19
511
32±
262
P�
0.00
01∗∗
Len
gth
(cm
)74
.9±
5.95
77.1
±4.
7675
.8±
5.20
73.4
±3.
4770
.1±
4.90
83.4
±5.
7878
.4±
4.37
79.5
±5.
8174
.7±
5.18
79.2
±6.
36P
�0.
003∗
∗E
ye-i
ndex
7.34
±0.
987.
28±
2.38
7.26
±0.
726.
69±
0.85
7.99
±0.
9310
.42
±0.
629.
95±
0.92
10.9
1±
0.86
7.14
±1.
3110
.17
±1.
04P
�0.
0001
∗∗G
.S.I
.0.
65±
0.15
0.65
±0.
200.
76±
0.24
0.79
±0.
280.
87±
0.28
1.44
±0.
171.
54±
0.30
1.38
±0.
260.
71±
0.22
1.40
±0.
28P
�0.
0001
∗∗H
.S.I
.1.
49±
0.45
1.28
±0.
241.
54±
0.50
1.23
±0.
301.
17±
0.20
1.32
±0.
091.
36±
0.28
1.37
±0.
121.
35±
0.39
1.34
±0.
16P
�0.
924
Dig
estiv
etr
act(
g)23
.9±
3.1
33.9
±12
.432
.5±
16.1
23.4
±7.
813
.9±
3.8
17.8
±4.
713
.4±
2.3
13.2
±4.
527
.1±
11.9
14.8
±4.
4P
�0.
0001
∗∗O
ocyt
edi
amet
er(m
m)
16.9
3±
1.41
19.2
6±
1.14
21.5
6±
1.79
24.5
4±
1.08
27.3
1±
1.33
29.0
1±
0.46
31.8
6±
1.29
34.5
1±
1.09
21.2
9±
3.57
30.7
6±
3.07
P�
0.00
01∗∗
End
ocri
nolo
gyT
T4
(nm
ol/l)
36.5
±24
.616
.6±
17.1
17.2
±27
.47.
4±
5.1
13.5
±5.
413
.5±
5.0
12.0
±5.
97.
6±
5.4
19.2
±21
.311
.1±
5.6
P�
0.05
5Fr
eeT
4(p
mol
/l)11
4.6
±14
3.9
28.3
±24
.463
.3±
138.
617
.7±
8.7
22.4
±8.
521
.8±
6.5
18.3
±12
.412
.0±
6.3
53.4
±98
.917
.7±
9.1
P�
0.06
2T
T3
(nm
ol/l)
12.4
±8.
86.
4±
2.8
18.3
±11
.75.
5±
5.1
10.3
±5.
710
.4±
5.9
6.8
±5.
36.
2±
5.0
10.8
±8.
77.
9±
5.6
P�
0.13
7G
row
th-h
orm
one
(ug/
g)13
0.8
±97
.186
.9±
82.6
154.
9±
109.
645
.3±
18.1
84.7
±52
.155
.3±
20.6
83.4
±49
.756
.9±
25.6
106.
2±
86.4
66.3
±38
.8P
�0.
037∗
Oes
trad
iol(
ng/m
l)1.
83±
0.31
1.64
±0.
691.
11±
0.60
0.97
±0.
371.
83±
0.75
2.43
±0.
602.
49±
0.42
2.09
±0.
631.
38±
0.67
2.34
±0.
58P
�0.
0001
∗∗C
ortis
ol(n
g/m
l)26
.1±
10.3
31.5
±25
.327
.1±
15.5
70.2
±38
.540
.7±
24.7
108.
1±
27.7
70.1
±55
.085
.8±
25.8
38.2
±29
.180
.7±
42.0
P�
0.00
01∗∗
Test
oste
ron
(ng/
ml)
0.75
±0.
310.
56±
0.25
0.47
±0.
170.
42±
0.22
0.41
±0.
151.
04±
0.25
1.04
±0.
521.
69±
1.27
0.53
±0.
271.
15±
0.81
P�
0.00
01∗∗
Vite
lloge
nin
(µg/
ml)
104.
27±
84.0
3±13
3.77
±15
9.48
±13
3.84
±10
23.0
5±76
6.81
±24
38.9
9±12
2.01
±11
89.0
5±P
�0.
001∗
∗85
.31
8.49
62.4
514
0.12
34.1
016
80.9
712
79.3
2626
.92
84.5
318
83.1
5
460 V. van Ginneken et al.
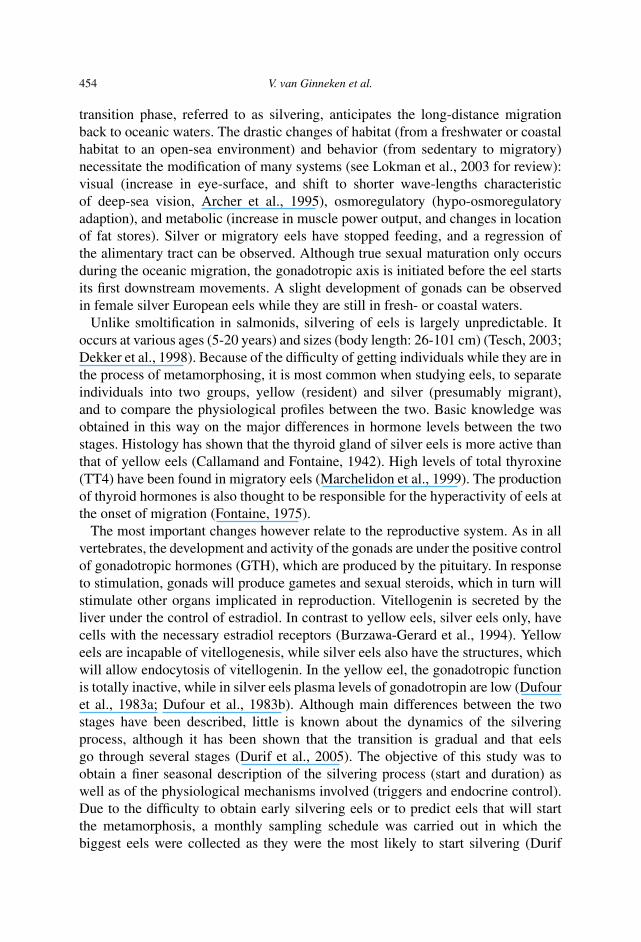
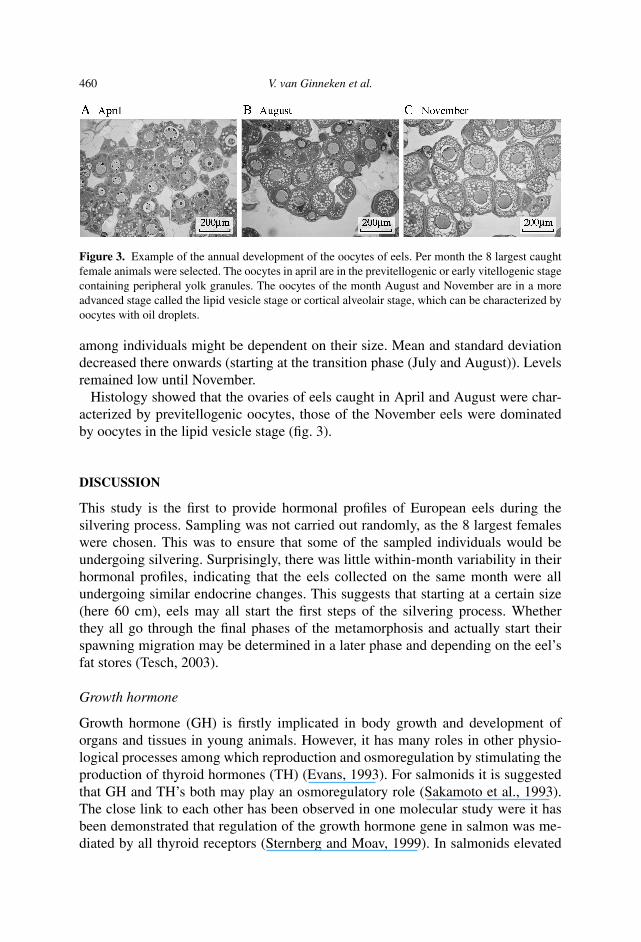
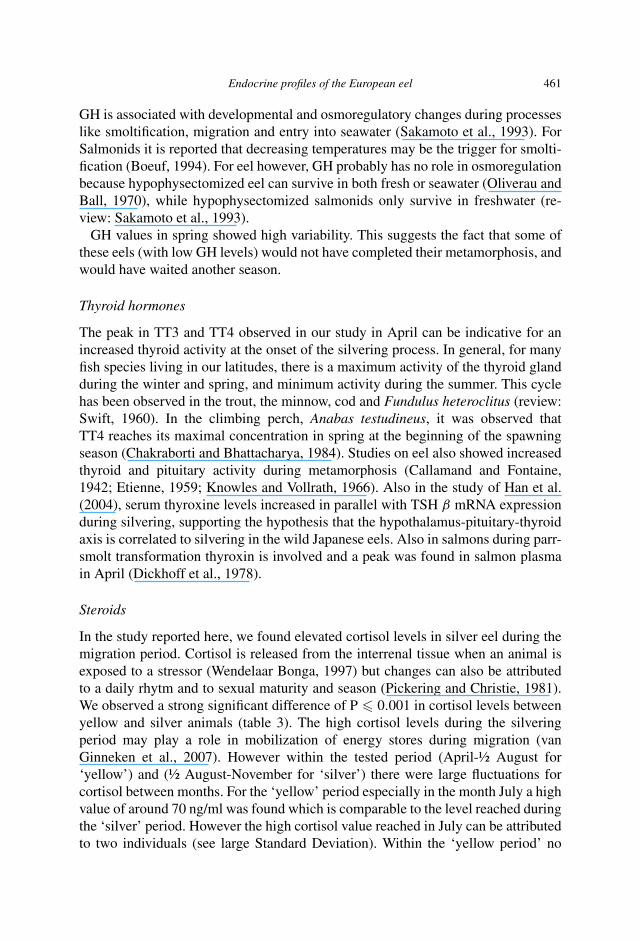
Figure 3. Example of the annual development of the oocytes of eels. Per month the 8 largest caughtfemale animals were selected. The oocytes in april are in the previtellogenic or early vitellogenic stagecontaining peripheral yolk granules. The oocytes of the month August and November are in a moreadvanced stage called the lipid vesicle stage or cortical alveolair stage, which can be characterized byoocytes with oil droplets.
among individuals might be dependent on their size. Mean and standard deviationdecreased there onwards (starting at the transition phase (July and August)). Levelsremained low until November.
Histology showed that the ovaries of eels caught in April and August were char-acterized by previtellogenic oocytes, those of the November eels were dominatedby oocytes in the lipid vesicle stage (fig. 3).
DISCUSSION
This study is the first to provide hormonal profiles of European eels during thesilvering process. Sampling was not carried out randomly, as the 8 largest femaleswere chosen. This was to ensure that some of the sampled individuals would beundergoing silvering. Surprisingly, there was little within-month variability in theirhormonal profiles, indicating that the eels collected on the same month were allundergoing similar endocrine changes. This suggests that starting at a certain size(here 60 cm), eels may all start the first steps of the silvering process. Whetherthey all go through the final phases of the metamorphosis and actually start theirspawning migration may be determined in a later phase and depending on the eel’sfat stores (Tesch, 2003).
Growth hormone
Growth hormone (GH) is firstly implicated in body growth and development oforgans and tissues in young animals. However, it has many roles in other physio-logical processes among which reproduction and osmoregulation by stimulating theproduction of thyroid hormones (TH) (Evans, 1993). For salmonids it is suggestedthat GH and TH’s both may play an osmoregulatory role (Sakamoto et al., 1993).The close link to each other has been observed in one molecular study were it hasbeen demonstrated that regulation of the growth hormone gene in salmon was me-diated by all thyroid receptors (Sternberg and Moav, 1999). In salmonids elevated
Endocrine profiles of the European eel 461
GH is associated with developmental and osmoregulatory changes during processeslike smoltification, migration and entry into seawater (Sakamoto et al., 1993). ForSalmonids it is reported that decreasing temperatures may be the trigger for smolti-fication (Boeuf, 1994). For eel however, GH probably has no role in osmoregulationbecause hypophysectomized eel can survive in both fresh or seawater (Oliverau andBall, 1970), while hypophysectomized salmonids only survive in freshwater (re-view: Sakamoto et al., 1993).
GH values in spring showed high variability. This suggests the fact that some ofthese eels (with low GH levels) would not have completed their metamorphosis, andwould have waited another season.
Thyroid hormones
The peak in TT3 and TT4 observed in our study in April can be indicative for anincreased thyroid activity at the onset of the silvering process. In general, for manyfish species living in our latitudes, there is a maximum activity of the thyroid glandduring the winter and spring, and minimum activity during the summer. This cyclehas been observed in the trout, the minnow, cod and Fundulus heteroclitus (review:Swift, 1960). In the climbing perch, Anabas testudineus, it was observed thatTT4 reaches its maximal concentration in spring at the beginning of the spawningseason (Chakraborti and Bhattacharya, 1984). Studies on eel also showed increasedthyroid and pituitary activity during metamorphosis (Callamand and Fontaine,1942; Etienne, 1959; Knowles and Vollrath, 1966). Also in the study of Han et al.(2004), serum thyroxine levels increased in parallel with TSH β mRNA expressionduring silvering, supporting the hypothesis that the hypothalamus-pituitary-thyroidaxis is correlated to silvering in the wild Japanese eels. Also in salmons during parr-smolt transformation thyroxin is involved and a peak was found in salmon plasmain April (Dickhoff et al., 1978).
Steroids
In the study reported here, we found elevated cortisol levels in silver eel during themigration period. Cortisol is released from the interrenal tissue when an animal isexposed to a stressor (Wendelaar Bonga, 1997) but changes can also be attributedto a daily rhytm and to sexual maturity and season (Pickering and Christie, 1981).We observed a strong significant difference of P � 0.001 in cortisol levels betweenyellow and silver animals (table 3). The high cortisol levels during the silveringperiod may play a role in mobilization of energy stores during migration (vanGinneken et al., 2007). However within the tested period (April-½ August for‘yellow’) and (½ August-November for ‘silver’) there were large fluctuations forcortisol between months. For the ‘yellow’ period especially in the month July a highvalue of around 70 ng/ml was found which is comparable to the level reached duringthe ‘silver’ period. However the high cortisol value reached in July can be attributedto two individuals (see large Standard Deviation). Within the ‘yellow period’ no
462 V. van Ginneken et al.
significant difference was observed between April and July (P � 0.24) but onlybetween June and July (P � 0.008). Months that are significantly different at a5% level are mainly between the ‘yellow’ and ‘silver’ period: April and September(P � 0.001), April and October (P � 0.014), April and November (P � 0.001);May and October (P � 0.028), May and November (P � 0.001). June is differentfrom September (P � 0.001), October (P � 0.005), November (P � 0.001). Augustis different from September (P � 0.002) and November (P � 0.03).
So despite the large fluctuations of plasma cortisol within months, major sig-nificant differences can be observed between the ‘yellow’ and ‘silver’ period. Sochanges in cortisol levels for eel can possibly be attributed to sexual maturity andseason in order to mobilize energy stores during migration. The high value of 70ng/ml found in July may be a release of this hormone in anticipation of the ‘silver-ing’ period.
From the well-marked seasonal pattern in female T, which lags behind but followsfemale E2, we can conclude there is a correlation between the two (R = 0.56,table 2). This supports the possibility that testosterone may act as a precursor for E2synthesis during the vitellogenic season.
The increased E2 profile in the period September-November suggests that in theperiod of gonad development the aromatizing enzymes are partially stimulated. Inseveral fish species aromatizing activity have been observed in the ovary (review:Nagahama, 1994).
For eels in general T and 11-Ketotestosterone (11-KT) may play a more prominentrole in females during silvering and/or maturation. Lokman et al. (1998) foundhigh values of 11-KT in females of Anguilla dieffenbachi, and suggested that thissteroid may play a role in preparing maturing animals for their spawning migration.Indeed, Rohr et al. (2001) demonstrated in immature short-finned eels (A. australis)implanted with a vehicle containing 11-KT, that this steroid was involved in theprocess of silvering. Observed changes were: a) a change in head shape and pectoralfin appearance, b) structural changes of the skin, and c) an increase in eye size andventricular, liver and gonad mass (Rohr et al., 2001). Also Han et al. (2003) foundthat androgen, but not estrogen, plays a major role in silvering process of the eels inboth sexes.
E2 is the ‘trigger’ for VTG synthesis (Burzawa-Gerard and Dumas-Vidal, 1991).Although we found a low correlation coefficient of (R = 0.31, table 2) betweenplasma E2 and VTG it is generally assumed that there is a causal relation betweenthose two components in the vitellogenesis which is at the basis for the growthof the gonad by incorporation of yolk proteins in the oocytes (review: Nagahama,1994). The low correlation coefficient can be explained by the substantial increasedlevels of VTG in fall, in comparison with the stabilization of plasma E2 fromSeptember to November. The progressively larger vitellogenic response can beascribed the so called ‘memory effect’, an increased sensitivity of the liver to E2 viaits receptor mechanism (sensitivity and density) and also possibly by an enhanced
Endocrine profiles of the European eel 463
post-transcriptional mechanism of hepatic vitellogenesis (Jackson and Sullivan,1995).
In conclusion, we described the hormonal profile of European eel during the‘silvering’ process, the onset of puberty and seaward migration. Especially levelstestosterone and estradiol were high in autumn during the migration season whilethyroid hormones and growth hormone were high in spring and are therefore notinvolved in the ‘silvering’ process.
ACKNOWLEDGEMENTS
We thank the fishermen Wim and Piet Bout (Brunisse, The Netherlands) for sup-plying Grevelingen eels every month. This study was supported by the NetherlandsOrganisation for Scientific Research (STW-project no. LBI66.4199) and by the Eu-ropean Commission (EELREP-Q5RS-2001-01836).
REFERENCES
Archer, S., Hope, A. & Partridge, J.C. (1995) The molecular basis for the green-bluesensitivity shiftin the rod visual pigments of the European eel. Proc. R. Soc. Lond. B, 262, 289-295.
Burzawa-Gérard E. & Dumas-Vidal, A. (1991) Effects of 17β-estradiol and carp gonadotropin onvitellogenesis in normal and hypophysectomized European silver female eel (Anguilla anguillaL.) employing a homologous radioimmunoassay for vitellogenin. Gen. Comp. Endocrinol., 84,264-276.
Burzawa-Gérard, E., Nath, P., Baloche, S. & Peyon, P. (1991) ELISA (enzyme-linked-immunosorbentassay) for vitellogenin and vitellus in the eel (Anguilla anguilla) and in the Indian major carp(Labeo rohita). In: A.P. Scott, J.P. Sumpter, D.E. Kime & M.S. Rolfe (Eds.), ReproductivePhysiology of Fish. Sheffield, Fish Symp., 1991, 319.
Burzawa-Gérard, E., Baloche, S., Leloup-Hatey, J., Le Menn, F., Messaouri, H., Nunez-Rodriguez,J., Peyon, P. & Roger, C. (1994) Ovogénèse chez l’anguille (Anguilla anguilla L.): ultrastructurede l’ovaire a différents stades de développement et implication des lipoprotéines au cours de lavitellogenèse. Bull. Fr. Pêche Piscic., 335, 213-233.
Callamand, O. & Fontaine, M. (1942) L’Activité thyrodienne de l’Anguille au cours de son develop-ment. Arch. Zool. Exp. Gen., 82, 129-135.
Chakraborti, P. & Bhattacharya, S. (1984) Plasma thyroxin levels in freshwater perch: influence ofseason, gonadotropins, and gonadal hormones. Gen. Comp. Endocrinol., 53, 179-186.
Dekker, W., Van Os, B. & van Willigen, J. (1998) Minimal and maximal size of eel. Bull. Fr. PêchePiscic., 349, 195-197.
Dickhoff, W.W., Folmar, L.C. & Gorbman, A. (1978) Changes in plasma thyroxin during smoltifica-tion of coho salmon, Oncorhynchus kisutch. Gen. Comp. Endocrinol., 36, 229-232.
Dufour, S., Delerue-Le Belle, N. & Fontaine, Y.A. (1983a) Development of a heterologous radioim-munoassay for eel (Anguilla anguilla) gonadotropin. Gen. Comp. Endocrinol., 49, 403-413.
Dufour, S., Le Belle, N.D. & Fontaine, Y.A. (1983b) Effects of steroid hormones on pituitaryimmunoreactive gonadrotropin in European freshwater eel, Anguilla anguilla L. Gen. Comp.Endocrinol., 52, 190-197.
Durif, C., Dufour, S. & Elie, P. (2005) The silvering process of Anguilla anguilla: a new classificationfrom the yellow resident to the silver migrating stage. J. Fish. Biol., 66, 1025-1043.
464 V. van Ginneken et al.
Etienne, N. (1959) Influence de la maturation sexuelle provoquée sur l’activité thyroïdienne del’Anguille européenne mâle, Anguilla anguilla L. Société de Biologie, 41-44.
Evans, D.H. (Ed.) (1993) The Physiology of Fishes. CRC Press, Boca Raton, Florida.Fontaine, M. (1975) Physiological mechanisms in the migration of marine and amphihaline fish. Ad.
Mar. Biol., 13, 241-355.van Ginneken, V., Durif, C., Balm, P., Boot, R., Verstegen, M., Antonissen, E. & van den Thillart, G.
(2007) Silvering of European eel (Anguilla anguilla L.): seasonal changes of morphological andmetabolic parameters. Anim. Biol., 57, 63-77.
Han, Y.S., Liao, I.C., Tzeng, W.N., Huang, Y.S. & Yu, J.Y.L. (2003) Serum estradiol-17β andtestosterone levels during silvering in wild Japanese eel Anguilla japonica. Comp. Biochem.Physiol. B, 136, 913-920.
Han, Y.S., Liao, I.C., Tzeng, W.N. & Ju, J.Y. (2004) Cloning of the cDNA for thyroid stimulatinghormone β subunit and changes in activity of the pituitary-thyroid axis during silvering of theJapanese eel, Anguilla japonica. J. Mol. Endocrinol., 32, 179-194.
Jackson, L.F. & Sullivan, C.V. (1995) Reproduction of White Perch: the Annual. Gametogenic Cycle.Trans. Amer. Fish. Soc., 124, 563-577.
Knowles, F. & Vollrath, L. (1966) Changes in the pituitary of the migrating European eel during itsjourney from rivers to the sea. Zeitschrift für Zellforschung, 75, 317-327.
Lokman, P.M., Vermeulen, G.J., Lambert, J.G.D. & Young, G. (1998) Gonad histology and plasmasteroid profiles in wild New Zealand freshwater eels (Anguilla dieffenbachi and A. australis) beforeand at the onset of the natural spawning migration. I. Females. Fish Phys. Biochem., 19, 325-338.
Lokman, P.M., Detlef, H.R., Davie, P.S. & Young, G. (2003) The physiology of silvering in Anguillideels: androgens and control of metamorphosis from the yellow to silver stage. In: K. Aida, K.Tsukamoto & K. Yamauchi (Eds.), Eel Biology, pp. 331-349. Springer Verlag, Tokyo.
MacCrimmon, H.R. & Claytor, R.R. (1985) Meristic and morphometric identity of Baltic stocks ofAtlantic Salmon (Salmo salar). Can. J. Zool., 63, 2032-2037.
Marchelidon, J., Schmitz, M., Houdebine, L.M., Vidal, B., Le Belle, N. & Dufour, S. (1996)Development of a radioimmunoassay for European eel growth hormone and application to thestudy of silvering and experimental fasting. Gen. Comp. Endocrinol., 102, 360-369.
Marchelidon, J., Le Belle, N., Hardy, A., Vidal, B., Sbaihi, M., Burzawa-Gérard, E., Schmitz, M. &Dufour, S. (1999) Etude des variations de paramètres anatomiques et endocriniens chez l’anguilleeuropéenne (Anguilla anguilla) femelle, sédentaire et d’avalaison: application à la caractérisationdu stade argenté. Bull. Fr. Pêche Piscic., 355, 349-368.
Nagahama, Y. (1994) Endocrine regulation of gametogenesis in fish. Int. J. Dev. Biol., 38, 217-229.Oliverau, M. & Ball, J.N. (1970) Pituitary influences on osmoregulation in teleosts. Mem. Soc.
Endocrinol., 18, 57-85.Pickering, A.D. & Christie, A.A. (1981) Changes in the concentrations of plasma cortisol and
thyroxine during sexual maturation of the hatchery-reared brown trout, Salmo trutta L. Gen. Comp.Endocrinol., 44, 487-496.
Romeis, B. (1968) Mikroskopische Technik. R. Oldenbourg Verlag, München, Wien, pp. 757.Rohr, D.H., Lokman, P.M., Davie, P.S. & Young, G. (2001) 11-Ketotestosterone induces silvering-
related changes in immature female short-finned eels, Anguilla australis. Comp. Biochem. Physiol.,A, 130, 701-714.
Sakamoto, T., McCormick, S.D. & Hirano, T. (1993) Osmoregulatory actions of growth hormone andits mode of action in salmonids. A review. Fish. Physiol. Biochem., 11, 15-164.
Sternberg, H. & Moav, B. (1999) Regulation of the growth hormone gene by fish thyroid retinoidreceptors. Fish. Physiol. Biochem., 20, 331-339.
Swift, D.R. (1960) Cyclical activity of the thyroid gland of fish in relation to environmental changes.S. Zool. Soc. London, 2, 17-27.
Tesch, F.W. (2003) The Eel. 5th edn. Blackwell Publishing, Oxford.

Endocrine profiles of the European eel 465
Thioulouse, J., Chessel, D., Dolédec, S. & Olivier, J.M. (1997) ADE-4: a multivariate analysis andgraphical display software. Statistics and Computing, 7, 75-83.
Wendelaar Bonga, S. (1997) The stress response in fish. Physiol. Rev., 77, 591-625.