Embed Size (px)
Citation preview
Combustion and Flame 146 (2006) 589–604www.elsevier.com/locate/combustflame
Examination of the oxidation behavior of biodiesel soot
Juhun Song a,1, Mahabubul Alam a,2, André L. Boehman a,∗, Unjeong Kim b
a The Energy Institute, The Pennsylvania State University, 405 Academic Activities Building, University Park, PA 16802, USAb Department of Physics, The Pennsylvania State University, 205 Osmond Building, University Park, PA 16802, USA
Received 1 March 2006; received in revised form 20 May 2006; accepted 23 June 2006
Available online 9 August 2006
Abstract
In this work, we expand upon past work relating the nanostructure and oxidative reactivity of soot. This workshows that the initial structure alone does not dictate the reactivity of diesel soot and rather the initial oxygengroups have a strong influence on the oxidation rate. A comparison of the complete oxidation behavior and burn-ing mode was made to address the mechanism by which biodiesel soot enhances oxidation. Diesel soot derivedfrom neat biodiesel (B100) is far more reactive during oxidation than soot from neat Fischer–Tropsch diesel fuel(FT100). B100 soot undergoes a unique oxidation process leading to capsule-type oxidation and eventual forma-tion of graphene ribbon structures. The results presented here demonstrate the importance of initial properties ofthe soot, which lead to differences in burning mode. Incorporation of greater surface oxygen functionality in theB100 soot provides the means for more rapid oxidation and drastic structural transformation during the oxidationprocess.© 2006 The Combustion Institute. Published by Elsevier Inc. All rights reserved.
Keywords: Diesel particulate; Oxidation; Biodiesel; Surface oxygen functionality
1. Introduction
The oxidative reactivity of diesel particulate mat-ter is an important factor affecting diesel particulatefilter (DPF) regeneration behavior, which is relatedto three key properties of diesel particulates. Sincea carbon atom at an edge site is much more reactivethan one in the basal plane of a graphene layer, a sootwith many populated edge sites has a higher reactivity
* Corresponding author. Fax: +1 814 863 8892.E-mail address: [email protected]
(A.L. Boehman).1 Current affiliation: Energy System Division, Argonne
National Laboratory.2 Current affiliation: International Truck and Engine Cor-
poration.
0010-2180/$ – see front matter © 2006 The Combustion Institute.doi:10.1016/j.combustflame.2006.06.010
[1–3]. This edge site population density can be in-creased by decreasing the graphene layer size and or-derliness within the particle and by a more amorphousarrangement within the primary particle. Surface oxy-gen groups bonded to edge sites are also importantsince they can induce structural changes during attackby air on an edge site [4,5]. Finally, volatile mattersuch as hydrocarbons that filled the micropores on thesoot or covered the outer surface of the soot is a sourceof further micropore development creating a variationin particle reactivity [6,7].
However, some investigations on structural changewithin the primary soot particles as oxidation pro-ceeds have been pursued for soot surrogates, but notspecifically for diesel soots obtained from practicaldiesel-related fuels. This structure change is closelyrelated to burning mode and can be affected by factors
Published by Elsevier Inc. All rights reserved.
590 J. Song et al. / Combustion and Flame 146 (2006) 589–604
Nomenclature
I intensity of spectrak rate constantL graphene layer lengthd diameter of primary particlex wt% burnoff
Greek letters
π graphitic peak in EELS spectra
σ another peak in EELS spectra
Subscripts
0 initial stage
d defect band in Raman spectra
g graphitic band in Raman spectra
a one direction inside a graphene layer
such as initial nanostructure, initial surface groups,or micropore development. Ishiguro and co-workersinvestigated structural changes during the oxidationprocess of diesel soot at 500 ◦C in air [8]. During theearly stage of oxidation, diesel soot develops porositydue to loss of volatile matter providing more inter-nal surface area and layers within the soot were re-arranged to form larger and turbostratic crystallitesin the direction normal to the graphene layer. Sub-sequently, this precrystallite growth can induce layerstripping from the outer surface caused by strain en-ergy between the layer planes [9]. A decrease in oxy-gen groups during oxidation was observed via in-frared (IR) absorption spectroscopy measurements. Inthis case, soot with curved and unstable crystalliteswith respect to the direction normal to the graphenelayers was likely to become more reactive, since thiscrystallite is likely to strip off from the outer sur-face. In contrast, Hurt et al. asserted the role of gas-induced internal structural changes in the gasifica-tion of carbon materials [10]. They argued againstthe “flake off” mechanism that Ishiguro explainedand instead emphasized the importance of inner struc-tural changes during the oxidation process. A diame-ter change was experimentally determined with sev-eral carbon materials including diesel soot and theyclaimed that all samples were oxidized under a burn-ing mode where the internal burning rate is 10 timesgreater than the surface burning rate.
Heckman and Harling showed the difference inoxidation rate between the carbon blacks producedfrom different synthesis conditions and the depen-dence on burning mode [11]. For example, thermalcarbon black that was oxidized at 450 ◦C in 50% O2had a strong tendency to burn from the inside out,forming “capsules.” In this case, primary aggregatesburned as units, while particle size did not changeappreciably until the capsule collapsed. They havealso reported further coalescence of particles, since“cell walls” between the two particles disappeared ata later stage. In contrast, the mode and rate of oxida-tive attack on graphitized thermal carbon black werestrikingly different. This particle was likely to burn
from the outside in, through surface burning, whichresulted in the slowest rate of oxidation. Even after64 h, oxidation had not reached an advanced stage, re-sulting in much slower burning. But a mechanism bywhich initial properties led to differences in structureduring oxidation was not fully explained. During coalgasification, variation in structure such as progressiveordering has been observed by Feng et al. [12,13],while a decrease in interlayer spacing was also ob-served during oxidation of carbon black [14,15]. Theobservation that reactivity loss takes place at either700 ◦C [16] or during the later stage of oxidation[17,18] was attributed to microstructural changes as-sociated with thermal annealing.
Motivated by interest in possible routes to enhancethe oxidation behavior of soot, some researchers haveprovided supporting evidence that either thermal con-ditions or fuel decomposition chemistry can yield avariation in soot nanostructure and functionality onthe soot surface resulting in different oxidation behav-ior. Vander Wal and Tomasek demonstrated the de-pendence of initial nanostructure on certain fuel com-pounds and proposed the underlying mechanism [19]for this effect. Su et al. reported that morphologycontrolled reactivity for diesel soot from the latestengines that meet the EURO IV particulate matter(PM) standards [20,21]. They demonstrated that theamount of defects as well as the functionality playedan important role in the onset temperature of oxida-tion. Morjan et al. reported that addition of oxygen infuel during pyrolysis could yield a greater presence ofcurved layers inside the primary particle [22]. Basedon prior work of other researchers, the authors alsodemonstrated two important observations over fourdifferent soot samples by highlighting the relation-ship between oxidation rate and initial soot properties[23–25].
We have observed that although soot obtainedfrom neat soybean-derived biodiesel fuel (B100) pos-sesses an initially ordered structure, it is 5 times morereactive than soot obtained from Fischer–Tropsch(FT) diesel fuel. While the initial structure alone doesnot dictate the reactivity of diesel soot, the degree
J. Song et al. / Combustion and Flame 146 (2006) 589–604 591
of internal structural change has a strong influenceon the oxidation rate under the surface burning dom-inance of the early stage of oxidation. The relativeamount of initial surface oxygen groups is a moreimportant factor governing the oxidation rate thanthe initial structure and pore size distribution [24,25].Most recently, Müller and co-workers provided strongsupport for the relationship between initial oxygencontent and reactivity, even though the interrelation-ship with initial structure was present in their re-sults [26].
From these observations, it is most likely that spe-cific compounds in the fuel may produce soot thatdisplays favorable oxidation behavior. Therefore, par-ticulate reactivity and its relationship to either initialproperties or as a function of burnoff should be thor-oughly examined to give feedback on control of DPFregeneration as well as guidance for modification offuel composition to enhance DPF regeneration. In thiswork, the structure and composition of diesel soot atdifferent levels of burnoff were characterized to in-vestigate differences in the thermal oxidation processand burning mode by centering on two soot sam-ples that exhibit significant differences in oxidationrate. From this observation, an oxidation progressionmodel is proposed to explain the differences in theoverall oxidation rate. The crucial mechanism (i.e.,burning mode) by which certain fuels enhance partic-ulate reactivity is identified. Finally, the importance ofsome initial properties leading to difference in burn-ing mode is emphasized.
2. Experimental
2.1. PM production and sampling
A highly instrumented 6-cylinder Cummins ISB5.9L DI turbodiesel engine, connected to a 250 HPeddy current dynamometer, was used to produce dif-ferent particulate samples at a fixed engine operatingcondition (2400 rpm and 25% of peak load). The en-gine has been instrumented with a 0.1 crank angleresolution crank shaft encoder, a cylinder pressuresensor, and a needle lift sensor. The engine and dy-namometer are operated through an automated con-trol system.
Four test fuels were considered including alterna-tive diesel fuels. The base fuel was an ultralow sulfurNo. 2 diesel (ULSD), which had 15 wt ppm sulfur,no oxygen, and 25.5 wt% aromatics. A 20% biodieselblend in ULSD fuel (B20) was produced from thebase fuel. Neat biodiesel fuel (B100) had no sulfur,no aromatics, and 10% oxygen and was composedof soybean methyl ester. Neat Fischer–Tropsch fuel(FT), derived from a gas to liquids process, was the
Table 1Key properties of test fuels
Fuelsa ULSD B20 B100 FT
Sulfur content (wt ppm) 15 13 0 0Oxygen content (wt%) 0 2 10 0Aromatics (wt%) 25.5 20 0 0Cetane number 50.5 52.5 60 85Density (g/cm3) 0.837 0.846 0.885 0.780
a ULSD, ultralow sulfur No. 2 diesel; B20, 20% biodieselblend in ULSD fuel; B100, neat biodiesel fuel; FT, neatFischer–Tropsch fuel.
least dense fuel, had a high cetane number, had nosulfur or aromatics, and had no oxygen compared toB100. Therefore, the main difference in fuel compo-sition between FT and B100 was oxygen content. Thekey properties of the test fuels can be found in Ta-ble 1. However, primary consideration in this work isrestricted to soot samples from two of the test fuels,B100 and FT soot, which exhibit a significant differ-ence in oxidation rate.
For thermogravimetric analysis (TGA), bulk par-ticulate matter samples collected on quartz filtersfrom the engine exhaust were subjected to a ther-mal treatment at 500 ◦C in argon to remove thevolatile fraction of the particulates and were oxi-dized at 500 ◦C in air. The operating conditions wereoptimized and the detailed procedures and theoreti-cal analysis to derive rate constants can be found inRef. [24]. While thermophoretic sampling was used tocapture initial samples from the raw exhaust for struc-tural analysis via transmission electron microscopy(TEM), an acoustic suspension in ethanol was usedto disperse the partially oxidized samples onto TEMgrids for structural analysis at various stages of oxida-tion. Other bulk samples were collected onto “Teflo”filters and the soot material was separated from the fil-ter substrate with dichloromethane (DCM) solvent inan ultrasonic bath. Then, these bulk samples were an-alyzed with the following characterization methods.
2.2. PM characterization
To determine particulate reactivity, which is quan-tified by the oxidation rate and temperature requiredto initiate the oxidation, two methods were employed.A mass-based oxidation rate was calculated from themass loss profile from TGA. Based on these curvesmeasured under isothermal conditions, a theoreticalanalysis was performed to extract rate constants ateach temperature [24]. Based on the time to reachthe desired burnoff extent for each sample at 500 ◦C,oxidized samples at 20, 40, and 75% burnoff wereprepared. Table 2 illustrates that the time when B100soot reached 75% burnoff was 50 min, while the timerequired to reach the same burnoff for FT soot was
592 J. Song et al. / Combustion and Flame 146 (2006) 589–604
Table 2Time durations to reach each burnoffs
Burn off (x) B100 (min) FT (min)
0 0 00.2 15 300.4 30 500.75 50 105
105 min. A surface area-based oxidation rate was alsodetermined by applying particle size analysis to theTEM images. The rate constants from these two mea-surements of the initial oxidation rate will be relatedto the initial soot properties and the changes in sootproperties during oxidation.
To relate the differences in oxidation rate withthe initial soot properties and structural changes dur-ing oxidation, various characterization techniqueswere used. The initial internal structure of the sootand change during oxidation were visualized byhigh-resolution transmission electron microscopy(HRTEM) and were supplemented by micro-Ramanspectroscopy and electron energy loss spectra (EELS).In addition, 002 diffraction contrast images weresometimes obtained to provide complementary struc-tural information. By using Fourier transform in-frared (FTIR) spectra, the differences in initial oxygengroups that are bonded to edge sites of the graphenelayers were quantified, although only for the initialsoot samples. Oxygen content in the soot sampleswas measured and quantified by EELS as a functionof burnoff. Full descriptions about each operation andits analysis can be found elsewhere [23–28].
Definitions of relative intensities from some spec-tra and the relationship between relative intensity andsoot structure were thoroughly described elsewhere[23,24]. In Raman spectra, the relative D band to Gband intensity (Id/Ig) is related to the size and (phys-ical and chemical) defects in the basal plane of indi-vidual graphene layers [29]. In electron energy lossspectra, the sharp presence of the π graphitic peakat 285 eV and the relative ratio of the π peak tothe π + σ peak at 293 eV (Iπ/Iπ+σ ) are relatedto the degree of graphitization, since the π peak ismore pronounced due to the popularity of shared π
electrons for carbons within a long-range graphitizedlayer [30]. The procedure to calculate the stackingnumber in the direction normal to the graphene layeris also found by using the measured X-ray diffrac-tion profile. From FTIR spectra, the ratio of the car-boxyl peak at 1740 cm−1 and the aromatic peak at1620 cm−1 (I1740/I1620) is used to determine therelative amount of oxygen functionality. As has beenreported in prior work [24,25], the level of other oxy-gen peaks from ethers/esters at 1450 cm−1 was ob-served to increase concurrently as the intensity of the
(a)
(b)
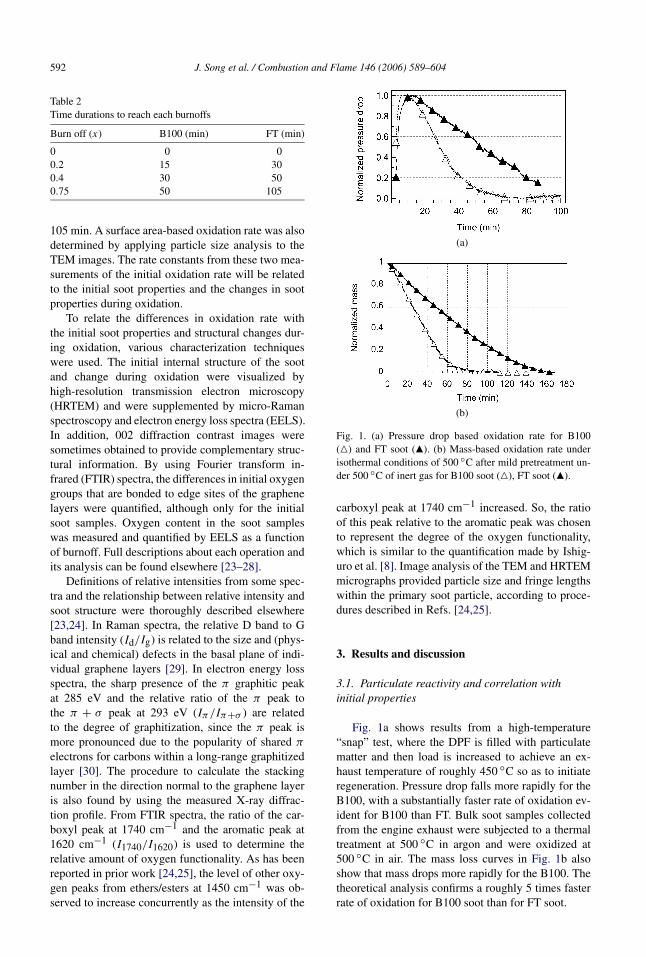
Fig. 1. (a) Pressure drop based oxidation rate for B100(P) and FT soot (Q). (b) Mass-based oxidation rate underisothermal conditions of 500 ◦C after mild pretreatment un-der 500 ◦C of inert gas for B100 soot (P), FT soot (Q).
carboxyl peak at 1740 cm−1 increased. So, the ratioof this peak relative to the aromatic peak was chosento represent the degree of the oxygen functionality,which is similar to the quantification made by Ishig-uro et al. [8]. Image analysis of the TEM and HRTEMmicrographs provided particle size and fringe lengthswithin the primary soot particle, according to proce-dures described in Refs. [24,25].
3. Results and discussion
3.1. Particulate reactivity and correlation withinitial properties
Fig. 1a shows results from a high-temperature“snap” test, where the DPF is filled with particulatematter and then load is increased to achieve an ex-haust temperature of roughly 450 ◦C so as to initiateregeneration. Pressure drop falls more rapidly for theB100, with a substantially faster rate of oxidation ev-ident for B100 than FT. Bulk soot samples collectedfrom the engine exhaust were subjected to a thermaltreatment at 500 ◦C in argon and were oxidized at500 ◦C in air. The mass loss curves in Fig. 1b alsoshow that mass drops more rapidly for the B100. Thetheoretical analysis confirms a roughly 5 times fasterrate of oxidation for B100 soot than for FT soot.
J. Song et al. / Combustion and Flame 146 (2006) 589–604 593
(a)
(b)
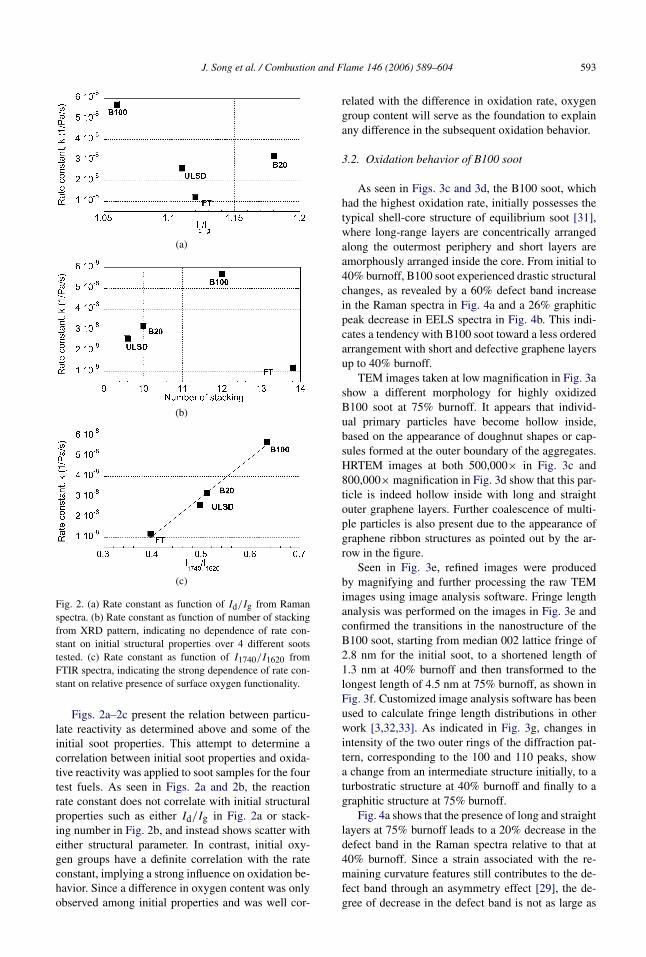
(c)
Fig. 2. (a) Rate constant as function of Id/Ig from Ramanspectra. (b) Rate constant as function of number of stackingfrom XRD pattern, indicating no dependence of rate con-stant on initial structural properties over 4 different sootstested. (c) Rate constant as function of I1740/I1620 fromFTIR spectra, indicating the strong dependence of rate con-stant on relative presence of surface oxygen functionality.
Figs. 2a–2c present the relation between particu-late reactivity as determined above and some of theinitial soot properties. This attempt to determine acorrelation between initial soot properties and oxida-tive reactivity was applied to soot samples for the fourtest fuels. As seen in Figs. 2a and 2b, the reactionrate constant does not correlate with initial structuralproperties such as either Id/Ig in Fig. 2a or stack-ing number in Fig. 2b, and instead shows scatter witheither structural parameter. In contrast, initial oxy-gen groups have a definite correlation with the rateconstant, implying a strong influence on oxidation be-havior. Since a difference in oxygen content was onlyobserved among initial properties and was well cor-
related with the difference in oxidation rate, oxygengroup content will serve as the foundation to explainany difference in the subsequent oxidation behavior.
3.2. Oxidation behavior of B100 soot
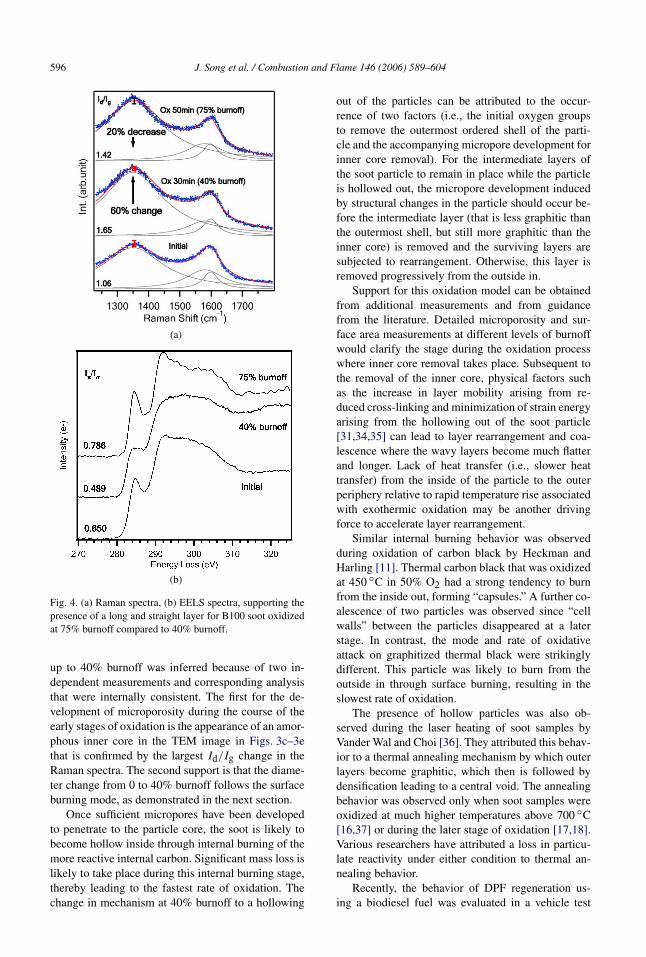
As seen in Figs. 3c and 3d, the B100 soot, whichhad the highest oxidation rate, initially possesses thetypical shell-core structure of equilibrium soot [31],where long-range layers are concentrically arrangedalong the outermost periphery and short layers areamorphously arranged inside the core. From initial to40% burnoff, B100 soot experienced drastic structuralchanges, as revealed by a 60% defect band increasein the Raman spectra in Fig. 4a and a 26% graphiticpeak decrease in EELS spectra in Fig. 4b. This indi-cates a tendency with B100 soot toward a less orderedarrangement with short and defective graphene layersup to 40% burnoff.
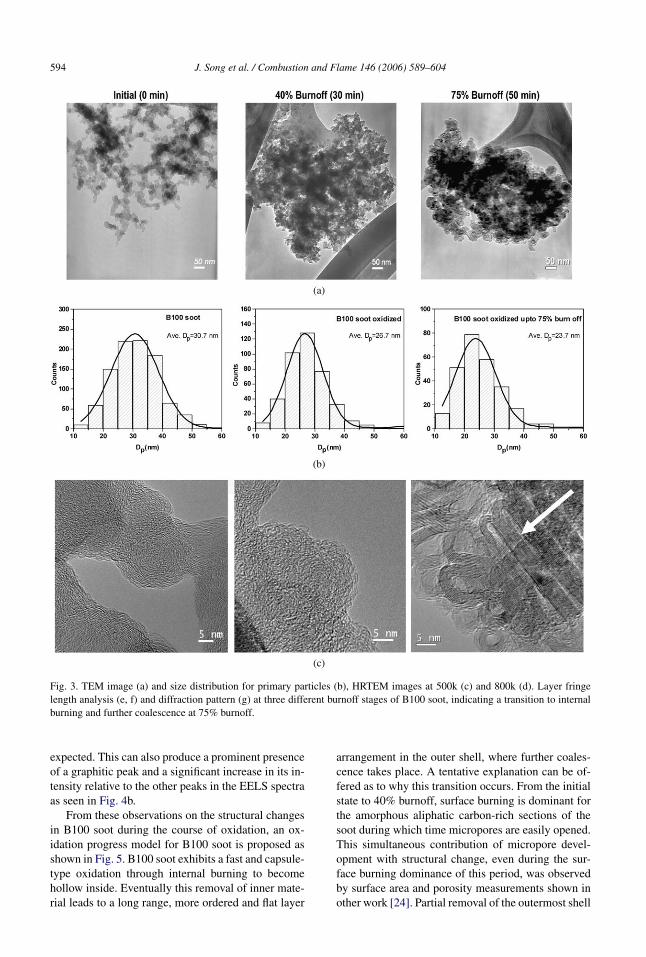
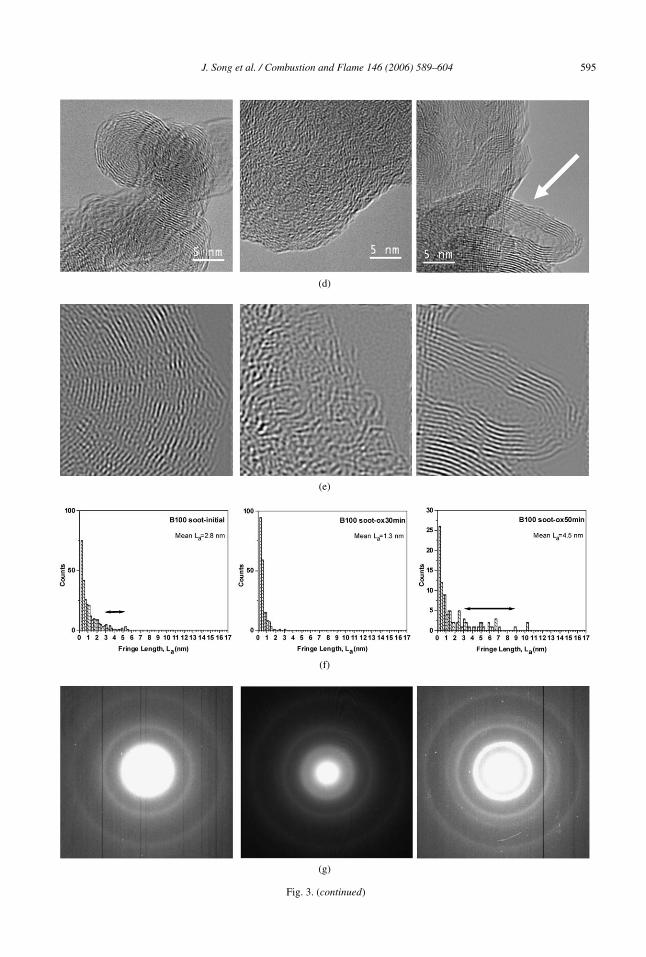
TEM images taken at low magnification in Fig. 3ashow a different morphology for highly oxidizedB100 soot at 75% burnoff. It appears that individ-ual primary particles have become hollow inside,based on the appearance of doughnut shapes or cap-sules formed at the outer boundary of the aggregates.HRTEM images at both 500,000× in Fig. 3c and800,000× magnification in Fig. 3d show that this par-ticle is indeed hollow inside with long and straightouter graphene layers. Further coalescence of multi-ple particles is also present due to the appearance ofgraphene ribbon structures as pointed out by the ar-row in the figure.
Seen in Fig. 3e, refined images were producedby magnifying and further processing the raw TEMimages using image analysis software. Fringe lengthanalysis was performed on the images in Fig. 3e andconfirmed the transitions in the nanostructure of theB100 soot, starting from median 002 lattice fringe of2.8 nm for the initial soot, to a shortened length of1.3 nm at 40% burnoff and then transformed to thelongest length of 4.5 nm at 75% burnoff, as shown inFig. 3f. Customized image analysis software has beenused to calculate fringe length distributions in otherwork [3,32,33]. As indicated in Fig. 3g, changes inintensity of the two outer rings of the diffraction pat-tern, corresponding to the 100 and 110 peaks, showa change from an intermediate structure initially, to aturbostratic structure at 40% burnoff and finally to agraphitic structure at 75% burnoff.
Fig. 4a shows that the presence of long and straightlayers at 75% burnoff leads to a 20% decrease in thedefect band in the Raman spectra relative to that at40% burnoff. Since a strain associated with the re-maining curvature features still contributes to the de-fect band through an asymmetry effect [29], the de-gree of decrease in the defect band is not as large as
594 J. Song et al. / Combustion and Flame 146 (2006) 589–604
(a)
(b)
(c)
Fig. 3. TEM image (a) and size distribution for primary particles (b), HRTEM images at 500k (c) and 800k (d). Layer fringelength analysis (e, f) and diffraction pattern (g) at three different burnoff stages of B100 soot, indicating a transition to internalburning and further coalescence at 75% burnoff.
expected. This can also produce a prominent presenceof a graphitic peak and a significant increase in its in-tensity relative to the other peaks in the EELS spectraas seen in Fig. 4b.
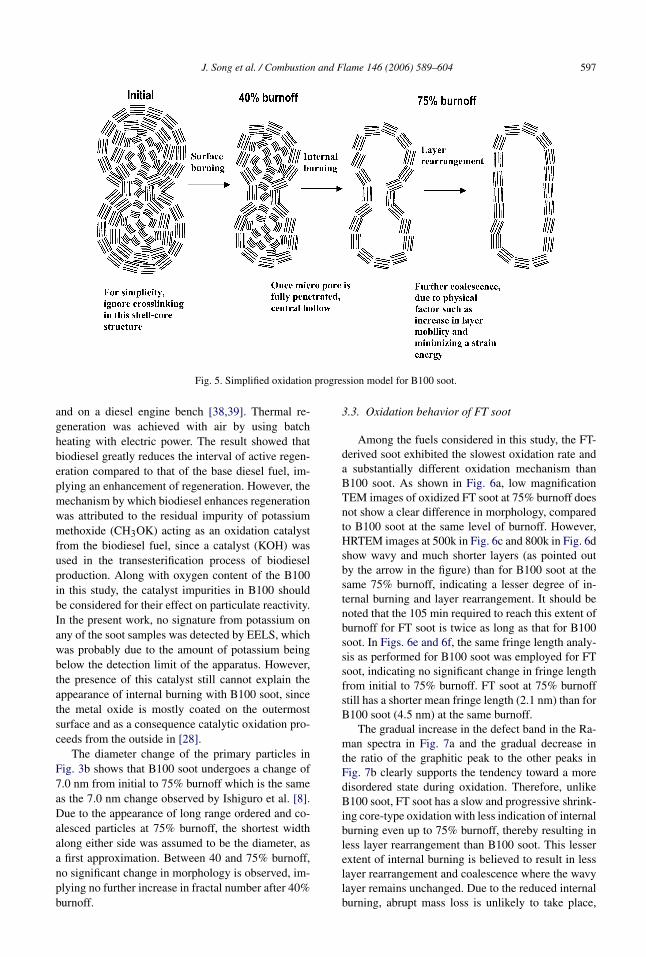
From these observations on the structural changesin B100 soot during the course of oxidation, an ox-idation progress model for B100 soot is proposed asshown in Fig. 5. B100 soot exhibits a fast and capsule-type oxidation through internal burning to becomehollow inside. Eventually this removal of inner mate-rial leads to a long range, more ordered and flat layer
arrangement in the outer shell, where further coales-cence takes place. A tentative explanation can be of-fered as to why this transition occurs. From the initialstate to 40% burnoff, surface burning is dominant forthe amorphous aliphatic carbon-rich sections of thesoot during which time micropores are easily opened.This simultaneous contribution of micropore devel-opment with structural change, even during the sur-face burning dominance of this period, was observedby surface area and porosity measurements shown inother work [24]. Partial removal of the outermost shell
J. Song et al. / Combustion and Flame 146 (2006) 589–604 595
(d)
(e)
(f)
(g)
Fig. 3. (continued)
596 J. Song et al. / Combustion and Flame 146 (2006) 589–604
(a)
(b)
Fig. 4. (a) Raman spectra, (b) EELS spectra, supporting thepresence of a long and straight layer for B100 soot oxidizedat 75% burnoff compared to 40% burnoff.
up to 40% burnoff was inferred because of two in-dependent measurements and corresponding analysisthat were internally consistent. The first for the de-velopment of microporosity during the course of theearly stages of oxidation is the appearance of an amor-phous inner core in the TEM image in Figs. 3c–3ethat is confirmed by the largest Id/Ig change in theRaman spectra. The second support is that the diame-ter change from 0 to 40% burnoff follows the surfaceburning mode, as demonstrated in the next section.
Once sufficient micropores have been developedto penetrate to the particle core, the soot is likely tobecome hollow inside through internal burning of themore reactive internal carbon. Significant mass loss islikely to take place during this internal burning stage,thereby leading to the fastest rate of oxidation. Thechange in mechanism at 40% burnoff to a hollowing
out of the particles can be attributed to the occur-rence of two factors (i.e., the initial oxygen groupsto remove the outermost ordered shell of the parti-cle and the accompanying micropore development forinner core removal). For the intermediate layers ofthe soot particle to remain in place while the particleis hollowed out, the micropore development inducedby structural changes in the particle should occur be-fore the intermediate layer (that is less graphitic thanthe outermost shell, but still more graphitic than theinner core) is removed and the surviving layers aresubjected to rearrangement. Otherwise, this layer isremoved progressively from the outside in.
Support for this oxidation model can be obtainedfrom additional measurements and from guidancefrom the literature. Detailed microporosity and sur-face area measurements at different levels of burnoffwould clarify the stage during the oxidation processwhere inner core removal takes place. Subsequent tothe removal of the inner core, physical factors suchas the increase in layer mobility arising from re-duced cross-linking and minimization of strain energyarising from the hollowing out of the soot particle[31,34,35] can lead to layer rearrangement and coa-lescence where the wavy layers become much flatterand longer. Lack of heat transfer (i.e., slower heattransfer) from the inside of the particle to the outerperiphery relative to rapid temperature rise associatedwith exothermic oxidation may be another drivingforce to accelerate layer rearrangement.
Similar internal burning behavior was observedduring oxidation of carbon black by Heckman andHarling [11]. Thermal carbon black that was oxidizedat 450 ◦C in 50% O2 had a strong tendency to burnfrom the inside out, forming “capsules.” A further co-alescence of two particles was observed since “cellwalls” between the particles disappeared at a laterstage. In contrast, the mode and rate of oxidativeattack on graphitized thermal black were strikinglydifferent. This particle was likely to burn from theoutside in through surface burning, resulting in theslowest rate of oxidation.
The presence of hollow particles was also ob-served during the laser heating of soot samples byVander Wal and Choi [36]. They attributed this behav-ior to a thermal annealing mechanism by which outerlayers become graphitic, which then is followed bydensification leading to a central void. The annealingbehavior was observed only when soot samples wereoxidized at much higher temperatures above 700 ◦C[16,37] or during the later stage of oxidation [17,18].Various researchers have attributed a loss in particu-late reactivity under either condition to thermal an-nealing behavior.
Recently, the behavior of DPF regeneration us-ing a biodiesel fuel was evaluated in a vehicle test
J. Song et al. / Combustion and Flame 146 (2006) 589–604 597
Fig. 5. Simplified oxidation progression model for B100 soot.
and on a diesel engine bench [38,39]. Thermal re-generation was achieved with air by using batchheating with electric power. The result showed thatbiodiesel greatly reduces the interval of active regen-eration compared to that of the base diesel fuel, im-plying an enhancement of regeneration. However, themechanism by which biodiesel enhances regenerationwas attributed to the residual impurity of potassiummethoxide (CH3OK) acting as an oxidation catalystfrom the biodiesel fuel, since a catalyst (KOH) wasused in the transesterification process of biodieselproduction. Along with oxygen content of the B100in this study, the catalyst impurities in B100 shouldbe considered for their effect on particulate reactivity.In the present work, no signature from potassium onany of the soot samples was detected by EELS, whichwas probably due to the amount of potassium beingbelow the detection limit of the apparatus. However,the presence of this catalyst still cannot explain theappearance of internal burning with B100 soot, sincethe metal oxide is mostly coated on the outermostsurface and as a consequence catalytic oxidation pro-ceeds from the outside in [28].
The diameter change of the primary particles inFig. 3b shows that B100 soot undergoes a change of7.0 nm from initial to 75% burnoff which is the sameas the 7.0 nm change observed by Ishiguro et al. [8].Due to the appearance of long range ordered and co-alesced particles at 75% burnoff, the shortest widthalong either side was assumed to be the diameter, asa first approximation. Between 40 and 75% burnoff,no significant change in morphology is observed, im-plying no further increase in fractal number after 40%burnoff.
3.3. Oxidation behavior of FT soot
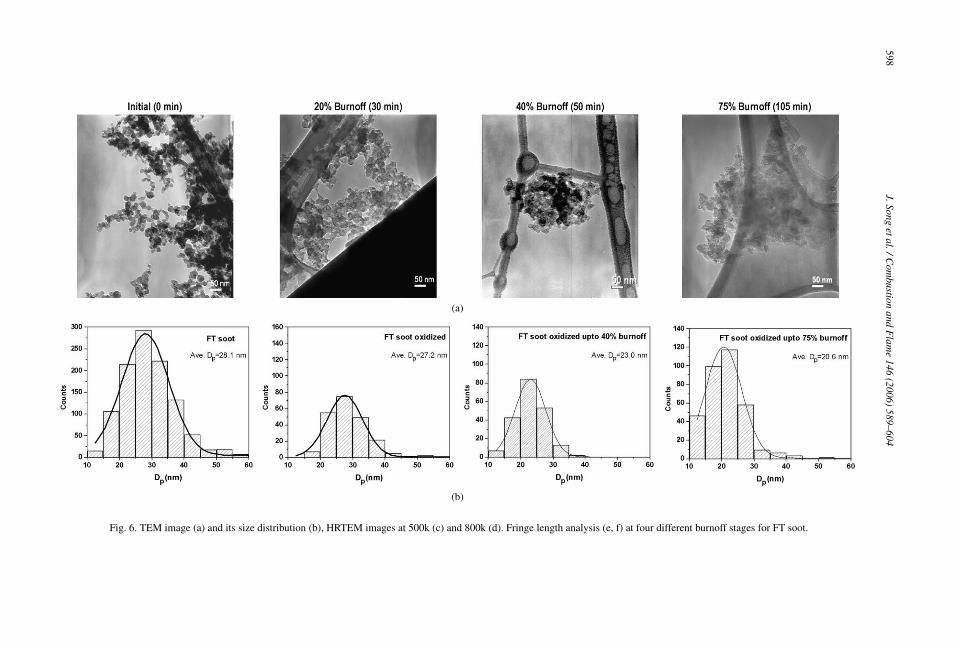
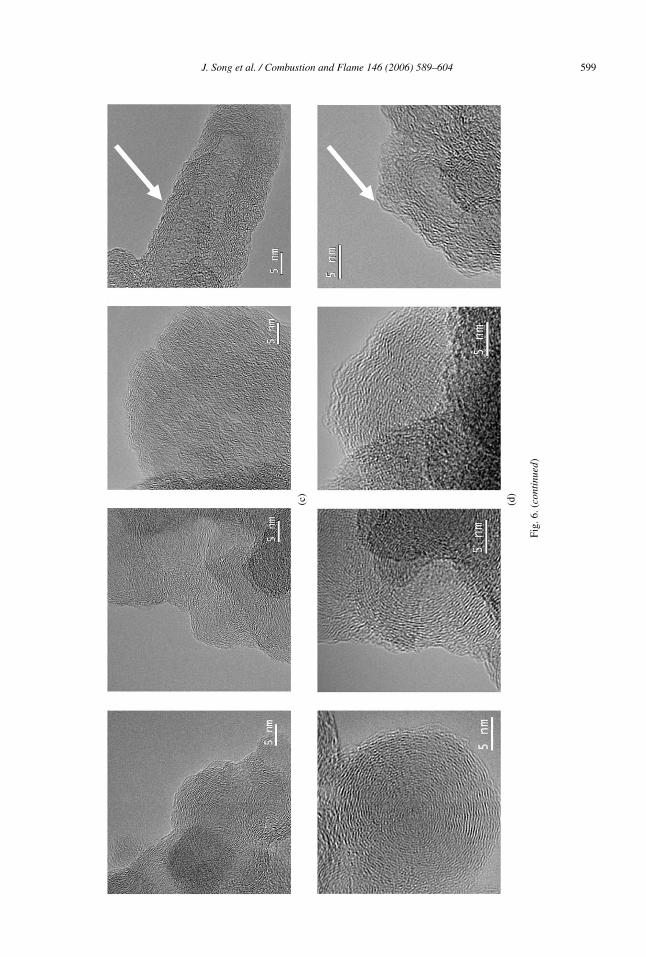
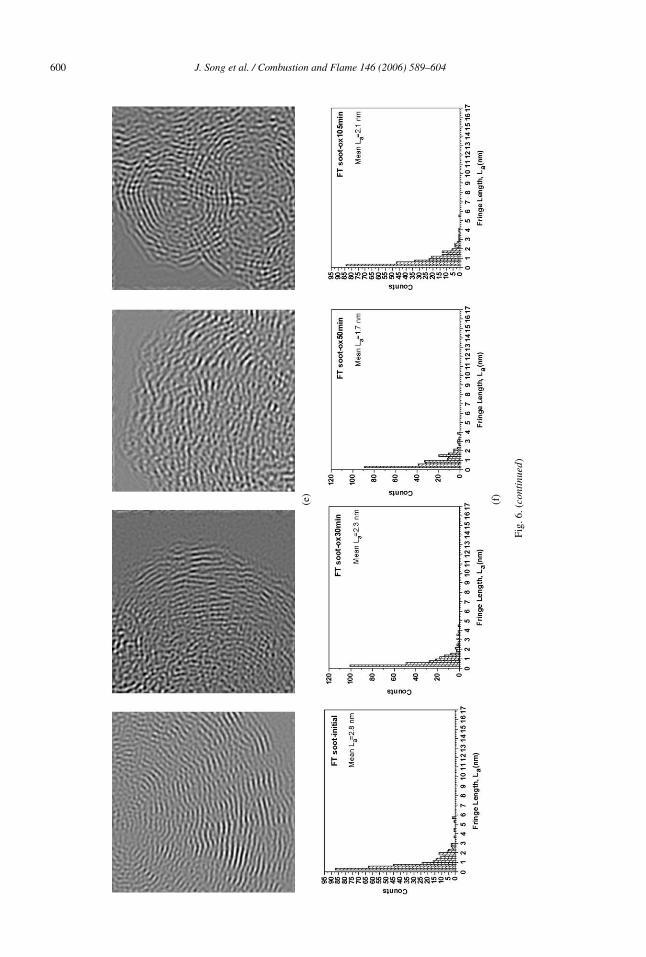
Among the fuels considered in this study, the FT-derived soot exhibited the slowest oxidation rate anda substantially different oxidation mechanism thanB100 soot. As shown in Fig. 6a, low magnificationTEM images of oxidized FT soot at 75% burnoff doesnot show a clear difference in morphology, comparedto B100 soot at the same level of burnoff. However,HRTEM images at 500k in Fig. 6c and 800k in Fig. 6dshow wavy and much shorter layers (as pointed outby the arrow in the figure) than for B100 soot at thesame 75% burnoff, indicating a lesser degree of in-ternal burning and layer rearrangement. It should benoted that the 105 min required to reach this extent ofburnoff for FT soot is twice as long as that for B100soot. In Figs. 6e and 6f, the same fringe length analy-sis as performed for B100 soot was employed for FTsoot, indicating no significant change in fringe lengthfrom initial to 75% burnoff. FT soot at 75% burnoffstill has a shorter mean fringe length (2.1 nm) than forB100 soot (4.5 nm) at the same burnoff.
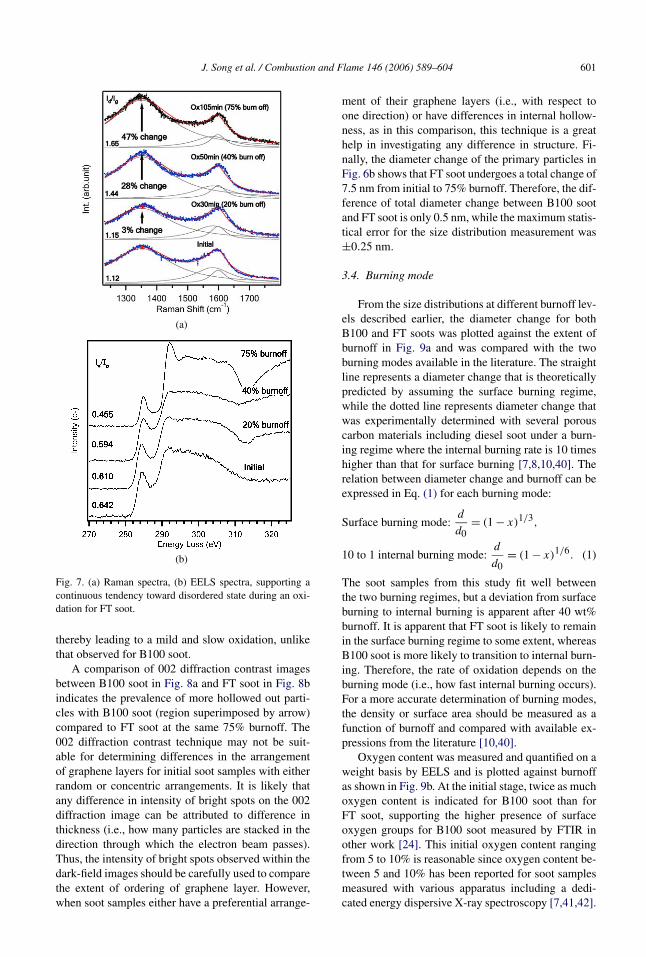
The gradual increase in the defect band in the Ra-man spectra in Fig. 7a and the gradual decrease inthe ratio of the graphitic peak to the other peaks inFig. 7b clearly supports the tendency toward a moredisordered state during oxidation. Therefore, unlikeB100 soot, FT soot has a slow and progressive shrink-ing core-type oxidation with less indication of internalburning even up to 75% burnoff, thereby resulting inless layer rearrangement than B100 soot. This lesserextent of internal burning is believed to result in lesslayer rearrangement and coalescence where the wavylayer remains unchanged. Due to the reduced internalburning, abrupt mass loss is unlikely to take place,
598J.Song
etal./Com
bustionand
Flam
e146
(2006)589–604
s (e, f) at four different burnoff stages for FT soot.
(a)
(b)
Fig. 6. TEM image (a) and its size distribution (b), HRTEM images at 500k (c) and 800k (d). Fringe length analysi
J. Song et al. / Combustion and Flame 146 (2006) 589–604 599
(c)
(d)
Fig.
6.(c
onti
nued
)
600 J. Song et al. / Combustion and Flame 146 (2006) 589–604
(e)
(f)
Fig.
6.(c
onti
nued
)
J. Song et al. / Combustion and Flame 146 (2006) 589–604 601
(a)
(b)
Fig. 7. (a) Raman spectra, (b) EELS spectra, supporting acontinuous tendency toward disordered state during an oxi-dation for FT soot.
thereby leading to a mild and slow oxidation, unlikethat observed for B100 soot.
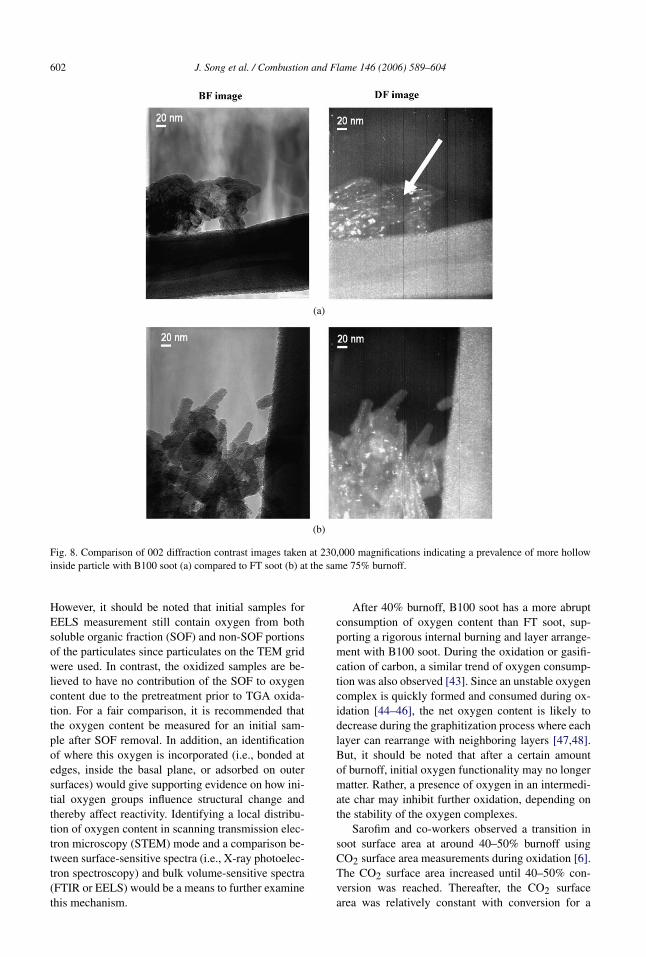
A comparison of 002 diffraction contrast imagesbetween B100 soot in Fig. 8a and FT soot in Fig. 8bindicates the prevalence of more hollowed out parti-cles with B100 soot (region superimposed by arrow)compared to FT soot at the same 75% burnoff. The002 diffraction contrast technique may not be suit-able for determining differences in the arrangementof graphene layers for initial soot samples with eitherrandom or concentric arrangements. It is likely thatany difference in intensity of bright spots on the 002diffraction image can be attributed to difference inthickness (i.e., how many particles are stacked in thedirection through which the electron beam passes).Thus, the intensity of bright spots observed within thedark-field images should be carefully used to comparethe extent of ordering of graphene layer. However,when soot samples either have a preferential arrange-
ment of their graphene layers (i.e., with respect toone direction) or have differences in internal hollow-ness, as in this comparison, this technique is a greathelp in investigating any difference in structure. Fi-nally, the diameter change of the primary particles inFig. 6b shows that FT soot undergoes a total change of7.5 nm from initial to 75% burnoff. Therefore, the dif-ference of total diameter change between B100 sootand FT soot is only 0.5 nm, while the maximum statis-tical error for the size distribution measurement was±0.25 nm.
3.4. Burning mode
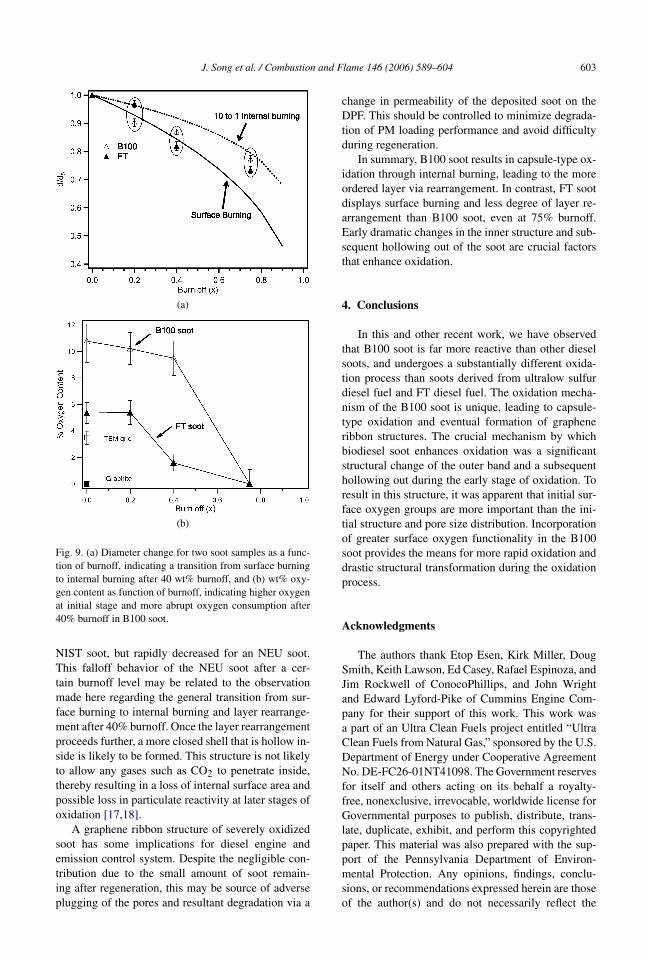
From the size distributions at different burnoff lev-els described earlier, the diameter change for bothB100 and FT soots was plotted against the extent ofburnoff in Fig. 9a and was compared with the twoburning modes available in the literature. The straightline represents a diameter change that is theoreticallypredicted by assuming the surface burning regime,while the dotted line represents diameter change thatwas experimentally determined with several porouscarbon materials including diesel soot under a burn-ing regime where the internal burning rate is 10 timeshigher than that for surface burning [7,8,10,40]. Therelation between diameter change and burnoff can beexpressed in Eq. (1) for each burning mode:
Surface burning mode:d
d0= (1 − x)1/3,
(1)10 to 1 internal burning mode:d
d0= (1 − x)1/6.
The soot samples from this study fit well betweenthe two burning regimes, but a deviation from surfaceburning to internal burning is apparent after 40 wt%burnoff. It is apparent that FT soot is likely to remainin the surface burning regime to some extent, whereasB100 soot is more likely to transition to internal burn-ing. Therefore, the rate of oxidation depends on theburning mode (i.e., how fast internal burning occurs).For a more accurate determination of burning modes,the density or surface area should be measured as afunction of burnoff and compared with available ex-pressions from the literature [10,40].
Oxygen content was measured and quantified on aweight basis by EELS and is plotted against burnoffas shown in Fig. 9b. At the initial stage, twice as muchoxygen content is indicated for B100 soot than forFT soot, supporting the higher presence of surfaceoxygen groups for B100 soot measured by FTIR inother work [24]. This initial oxygen content rangingfrom 5 to 10% is reasonable since oxygen content be-tween 5 and 10% has been reported for soot samplesmeasured with various apparatus including a dedi-cated energy dispersive X-ray spectroscopy [7,41,42].
602 J. Song et al. / Combustion and Flame 146 (2006) 589–604
(a)
(b)
Fig. 8. Comparison of 002 diffraction contrast images taken at 230,000 magnifications indicating a prevalence of more hollowinside particle with B100 soot (a) compared to FT soot (b) at the same 75% burnoff.
However, it should be noted that initial samples forEELS measurement still contain oxygen from bothsoluble organic fraction (SOF) and non-SOF portionsof the particulates since particulates on the TEM gridwere used. In contrast, the oxidized samples are be-lieved to have no contribution of the SOF to oxygencontent due to the pretreatment prior to TGA oxida-tion. For a fair comparison, it is recommended thatthe oxygen content be measured for an initial sam-ple after SOF removal. In addition, an identificationof where this oxygen is incorporated (i.e., bonded atedges, inside the basal plane, or adsorbed on outersurfaces) would give supporting evidence on how ini-tial oxygen groups influence structural change andthereby affect reactivity. Identifying a local distribu-tion of oxygen content in scanning transmission elec-tron microscopy (STEM) mode and a comparison be-tween surface-sensitive spectra (i.e., X-ray photoelec-tron spectroscopy) and bulk volume-sensitive spectra(FTIR or EELS) would be a means to further examinethis mechanism.
After 40% burnoff, B100 soot has a more abruptconsumption of oxygen content than FT soot, sup-porting a rigorous internal burning and layer arrange-ment with B100 soot. During the oxidation or gasifi-cation of carbon, a similar trend of oxygen consump-tion was also observed [43]. Since an unstable oxygencomplex is quickly formed and consumed during ox-idation [44–46], the net oxygen content is likely todecrease during the graphitization process where eachlayer can rearrange with neighboring layers [47,48].But, it should be noted that after a certain amountof burnoff, initial oxygen functionality may no longermatter. Rather, a presence of oxygen in an intermedi-ate char may inhibit further oxidation, depending onthe stability of the oxygen complexes.
Sarofim and co-workers observed a transition insoot surface area at around 40–50% burnoff usingCO2 surface area measurements during oxidation [6].The CO2 surface area increased until 40–50% con-version was reached. Thereafter, the CO2 surfacearea was relatively constant with conversion for a
J. Song et al. / Combustion and Flame 146 (2006) 589–604 603
(a)
(b)
Fig. 9. (a) Diameter change for two soot samples as a func-tion of burnoff, indicating a transition from surface burningto internal burning after 40 wt% burnoff, and (b) wt% oxy-gen content as function of burnoff, indicating higher oxygenat initial stage and more abrupt oxygen consumption after40% burnoff in B100 soot.
NIST soot, but rapidly decreased for an NEU soot.This falloff behavior of the NEU soot after a cer-tain burnoff level may be related to the observationmade here regarding the general transition from sur-face burning to internal burning and layer rearrange-ment after 40% burnoff. Once the layer rearrangementproceeds further, a more closed shell that is hollow in-side is likely to be formed. This structure is not likelyto allow any gases such as CO2 to penetrate inside,thereby resulting in a loss of internal surface area andpossible loss in particulate reactivity at later stages ofoxidation [17,18].
A graphene ribbon structure of severely oxidizedsoot has some implications for diesel engine andemission control system. Despite the negligible con-tribution due to the small amount of soot remain-ing after regeneration, this may be source of adverseplugging of the pores and resultant degradation via a
change in permeability of the deposited soot on theDPF. This should be controlled to minimize degrada-tion of PM loading performance and avoid difficultyduring regeneration.
In summary, B100 soot results in capsule-type ox-idation through internal burning, leading to the moreordered layer via rearrangement. In contrast, FT sootdisplays surface burning and less degree of layer re-arrangement than B100 soot, even at 75% burnoff.Early dramatic changes in the inner structure and sub-sequent hollowing out of the soot are crucial factorsthat enhance oxidation.
4. Conclusions
In this and other recent work, we have observedthat B100 soot is far more reactive than other dieselsoots, and undergoes a substantially different oxida-tion process than soots derived from ultralow sulfurdiesel fuel and FT diesel fuel. The oxidation mecha-nism of the B100 soot is unique, leading to capsule-type oxidation and eventual formation of grapheneribbon structures. The crucial mechanism by whichbiodiesel soot enhances oxidation was a significantstructural change of the outer band and a subsequenthollowing out during the early stage of oxidation. Toresult in this structure, it was apparent that initial sur-face oxygen groups are more important than the ini-tial structure and pore size distribution. Incorporationof greater surface oxygen functionality in the B100soot provides the means for more rapid oxidation anddrastic structural transformation during the oxidationprocess.
Acknowledgments
The authors thank Etop Esen, Kirk Miller, DougSmith, Keith Lawson, Ed Casey, Rafael Espinoza, andJim Rockwell of ConocoPhillips, and John Wrightand Edward Lyford-Pike of Cummins Engine Com-pany for their support of this work. This work wasa part of an Ultra Clean Fuels project entitled “UltraClean Fuels from Natural Gas,” sponsored by the U.S.Department of Energy under Cooperative AgreementNo. DE-FC26-01NT41098. The Government reservesfor itself and others acting on its behalf a royalty-free, nonexclusive, irrevocable, worldwide license forGovernmental purposes to publish, distribute, trans-late, duplicate, exhibit, and perform this copyrightedpaper. This material was also prepared with the sup-port of the Pennsylvania Department of Environ-mental Protection. Any opinions, findings, conclu-sions, or recommendations expressed herein are thoseof the author(s) and do not necessarily reflect the
604 J. Song et al. / Combustion and Flame 146 (2006) 589–604
views of the DEP. High resolution transmission elec-tron microscopy was performed using the facilities ofthe Materials Research Institute at The PennsylvaniaState University and the authors are grateful for ac-cess to these facilities.
References
[1] H. Marsh, Introduction to Carbon Science, Butter-worths, London, 1989, pp. 107–152.
[2] W.M. Hess, C.R. Herd, in: J.B. Donnet, R.C. Bansal,M.J. Wang (Eds.), Carbon Black Science and Technol-ogy, Dekker, New York, 1993, pp. 89–173.
[3] R.L. Vander Wal, A.J. Tomasek, Combust. Flame 134(2003) 1–9.
[4] D.M. Smith, A.R. Chughtai, Colloids Surf. A 105(1995) 47–77.
[5] H.P. Boehm, Carbon 32 (1994) 759–769.[6] A.W. Kandas, I.G. Senel, Y. Levendis, A.F. Sarofim,
Carbon 43 (2005) 241–251.[7] B.R. Stanmore, J.F. Brilhac, P. Gilot, Carbon 39 (2001)
2247–2268.[8] T. Ishiguro, N. Suzuki, Y. Fujitani, H. Morimoto, Com-
bust. Flame 85 (1991) 1–6.[9] P.L. Walker Jr., Carbon 28 (1990) 261–279.
[10] R.H. Hurt, A.F. Sarofim, J.P. Longwell, Combust.Flame 95 (1993) 430–432.
[11] F.A. Heckman, D.F. Harling, Rubber Chem. Tech-nol. 37 (1964) 1245–1254.
[12] B. Feng, S.K. Bhatia, J.C. Barry, Carbon 40 (2002)481–496.
[13] B. Feng, S.K. Bhatia, J.C. Barry, Energy Fuels 17(2003) 744–754.
[14] A.B. Palotas, L.C. Rainey, A.F. Sarofim, J.B. VanderSande, P. Ciambelli, Energy Fuels 10 (1996) 254–259.
[15] P.A. Marsh, A. Voet, T.J. Mullens, L.D. Price, RubberChem. Technol. 40 (1969) 470–481.
[16] F. Marcuccilli, P. Gilot, B. Stanmore, G. Prado, Proc.Combust. Inst. 19 (1982) 1045–1065.
[17] R.H. Hurt, K.A. Davis, Proc. Combust. Inst. 25 (1994)561–568.
[18] R.H. Hurt, J.K. Sun, M. Lunden, Combust. Flame 113(1998) 181–197.
[19] R.L. Vander Wal, A.J. Tomasek, Combust. Flame136 (1) (2004) 129–140.
[20] D.S. Su, R.E. Jentoft, J.-O. Müller, D. Rothe, E. Jacob,R. Schlögl, Catal. Today 90 (2004) 127–132.
[21] J.-O. Müller, D.S. Su, R.E. Jentoft, J. Kröhnert, F.C.Jentoft, R. Schlögl, Catal. Today 102 (2005) 259–265.
[22] I. Morjan, I. Voicu, R. Alexandrescu, I. Pasuk, I. Sandu,F. Dumitrache, I. Soare, T.C. Fleaca, M. Ploscaru, V.Ciupina, Carbon 42 (2004) 1269–1273.
[23] A.L. Boehman, J.H. Song, M. Alam, Energy Fu-els 19 (5) (2005) 1857–1864.
[24] J.H. Song, M. Alam, A.L. Boehman, Combust. Sci.Technol. (2006), in press.
[25] J.H. Song, Ph.D. thesis, Fuel Science, College of Earthand Mineral Science, Pennsylvania State University(2005).
[26] J.-O. Müller, Ph.D. thesis, College of Engineering,Berlin University (2005).
[27] J.H. Song, K. Cheenkakorn, J. Wang, J. Perez, A.L.Boehman, P.J. Young, F.J. Waller, Energy Fuels 16(2002) 294–301.
[28] J.H. Song, J. Wang, A.L. Boehman, Combust. Flame146 (1–2) (2006) 73–84.
[29] M.S. Dresselhaus, G. Dresselhaus, M.A. Pimenta, P.C.Eklund, in: J.M. Pelletier (Ed.), Analytical Appli-cations of Raman Spectroscopy, Blackwell Science,1999, Chap. 9.
[30] A. Braun, F.E. Huggins, N. Shah, Y. Chen, S. Wirick,S.B. Mun, C. Jacobsen, G.P. Huffman, Carbon 43 (1)(2005) 117–124.
[31] R.H. Hurt, G.P. Crawford, H.S. Shim, Proc. Combust.Inst. 28 (2000) 2539–2546.
[32] A.B. Palotas, L.C. Rainey, C.J. Feldermann, A.F.Sarofim, Microscopy Res. Techn. 33 (1996) 266–278.
[33] H.S. Shim, R.H. Hurt, N.Y.C. Yang, Carbon 38 (2000)29–45.
[34] M. Inagaki, Carbon 35 (5) (1997) 711–713.[35] R.H. Hurt, Y. Hu, Carbon 37 (1999) 281–292.[36] R.L. Vander Wal, M.Y. Choi, Carbon 37 (1999) 231–
239.[37] H.L. Fang, M.J. Lance, SAE (2004), No. 2004-01-
3043.[38] K. Yamane, T. Asakawa, H. Numao, M. Komori, SAE
(2004), No. 2004-01-1883.[39] K. Yamane, T. Asakawa, H. Numao, M. Komori, SAE
(2005), No. 2005-01-2198.[40] R.H. Essenhigh, Combust. Flame 99 (1994) 269–279.[41] O.B. Popovicheva, N.M. Persiantseva, B.V. Kuznetsov,
T.A. Rakhmanova, N.K. Shonija, J. Suzanne, D. Ferry,J. Phys. Chem. A 107 (2003) 10046–10054.
[42] E.G. Lindheimer, A. Lindheimer, A. Lagerge, S. Par-tyka, Colloids Surf. A 233 (2004) 79–86.
[43] M.J. Wornat, R.H. Hurt, N.Y.C. Yang, Combust.Flame 100 (1995) 131–143.
[44] N.R. Laine, F.J. Vastola, P.L. Walker Jr., in: Proceed-ings of the Fifth Conference on Carbon, 1961, pp. 211–217.
[45] R.C. Bansal, F.J. Vastola, P.L. Walker Jr., J. Colloid In-terface Sci. 32 (1970) 187–194.
[46] B.R. Puri, Chem. Phys. Carbon (2003) 191–282.[47] A. Oberlin, Chem. Phys. Carbon 22 (1989) 1–143.[48] A. Oberlin, Carbon 22 (1984) 521–541.