Embed Size (px)
Citation preview
Examples of Fatigue Crack Growth in real Structures H. A. Richard1,2, M. Fulland2, M. Sander1, G. Kullmer1 1Institute of Applied Mechanics, Universität Paderborn, Pohlweg 47-49, 33098
Paderborn, Germany, e-mail: [email protected] 2Westfälisches Umwelt Zentrum, Pohlweg 55, 33098, Paderborn, Germany ABSTRACT. In this contribution several examples for fatigue crack growth in machines and components will be shown. The reason for failures e.g. can be found in misconstructions, inappropriate fatigue strength calculations as well as material and manufacturing imperfections. Fatigue crack growth as consequence of service loads depends on many different contributing factors. The magnitude and chronological sequence of the loading as well as its type and direction and such the normal and shear stress distribution in a structure have major influence. Not only the crack velocity (crack growth rate) but also the crack configuration (crack path) can be determined by means of fracture mechanics. With the help of numerical simulations fatigue crack growth in three-dimensional structures can either be predicted or at least be explained for already existing failures. INTRODUCTION During service time machine and component failures may occur, that cause the structure’s breakdown. This generally yields enormous economical costs and sometimes in worst-case scenarios even the death of human beings. Frequently such damage events originate from misconstructions, manufacturing and material failures, inappropriate fatigue strength calculations, overloads or other problems during service time or maintenance. Beginning from already existing or newly originating flaws, often extended fatigue crack growth occurs due to service loads. Finally the functional capability of structures and components is lost with the already mentioned consequences.
In case of existing damage events, it is of major importance to fundamentally analyze them in order to obtain valuable information on structural improvements. Therefore the knowledge about the real global and local loadings, the relevant material parameters and the initiation and growth of cracks under various general loading situations is essential. By means of fracture mechanics the development of fatigue crack growth processes then can be reconstructed. So it is possible to improve the strength optimised and fracture safe design of structures and components. This goal can ideally be achieved by a composition of numerical and experimental simulations.
CRACK GROWTH IN REAL STRUCTURES In machines, constructions and vehicles occasionally small imperfections and pre-cracks will occur, that enlarge due to service loads and finally, after a more or less long period of fatigue crack growth, cause the breakdown of the structure. Examples for such damage events will be presented in the following.
a) b)
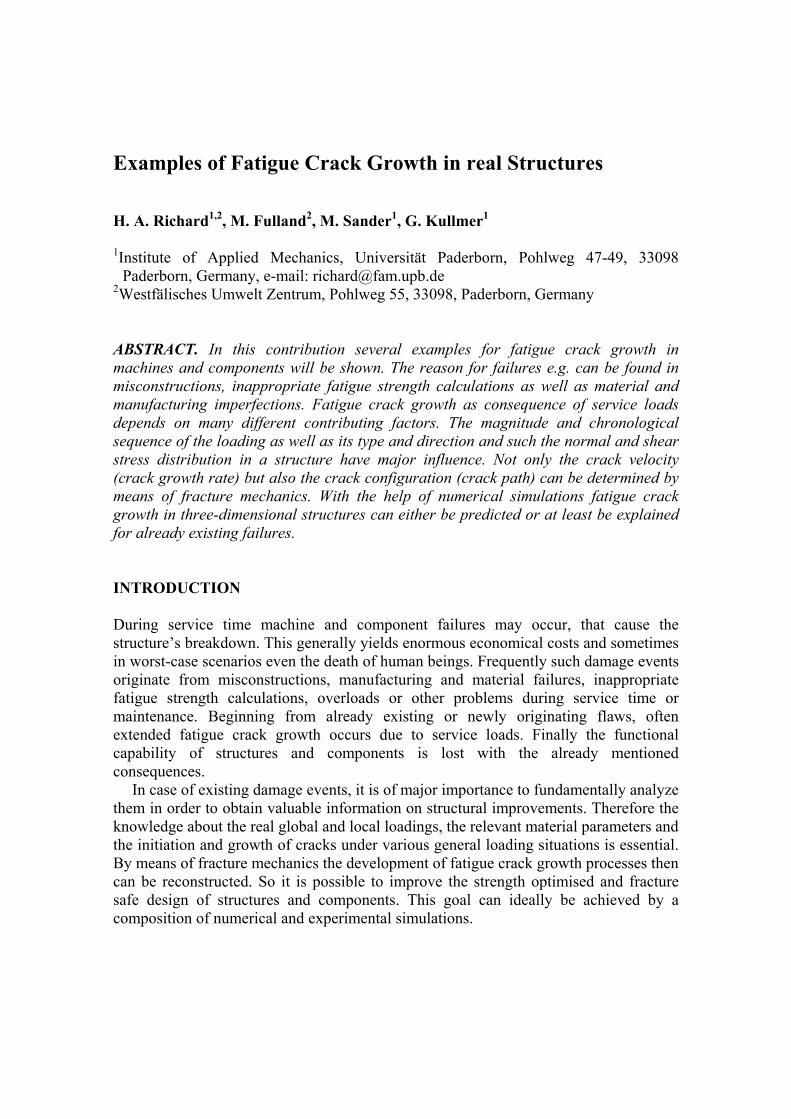
Figure 1. Fatigue crack growth in an agricultural machine a) Crack path at the back side of the structure b) Crack initiation at the end of a seam weld
The example of Figure 1 shows the fatigue crack growth in an agricultural machine.
The curved crack path (Figure 1a) indicates locally different loading situations, that result from both the external loading and the engineering design of the component. The crack starts at the end of a seam weld and then grows through the whole structure (Figure 1b).
a) b)
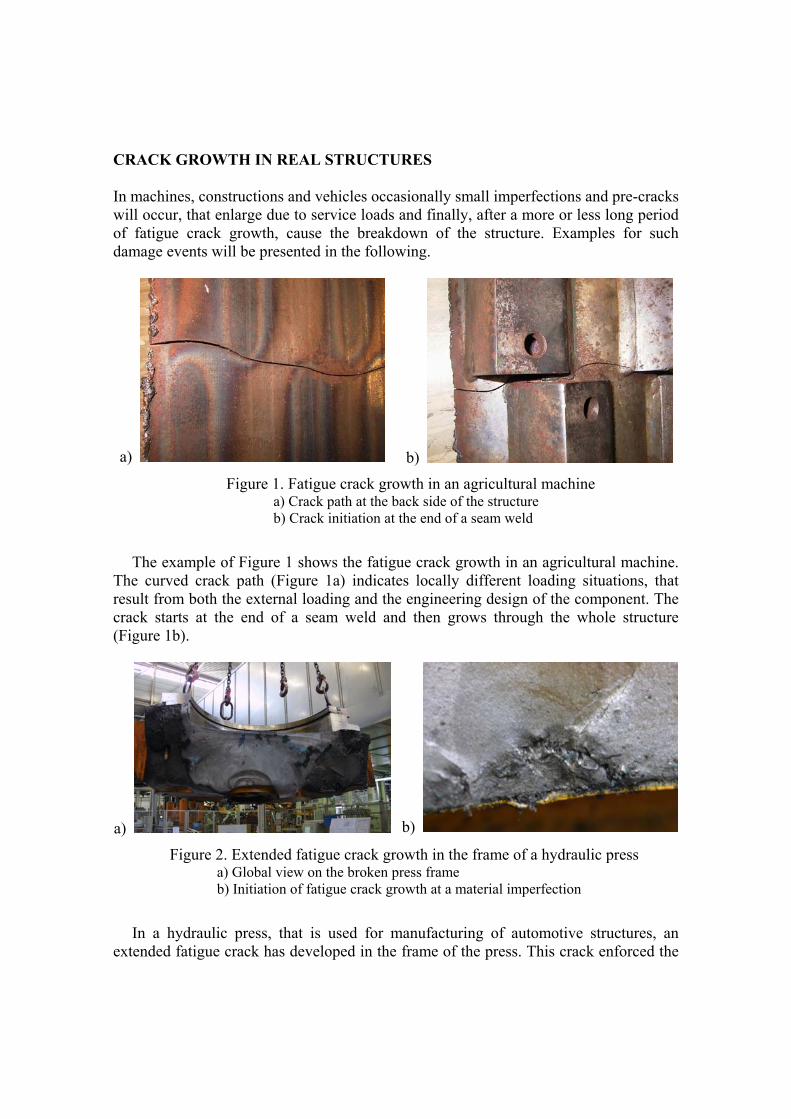
Figure 2. Extended fatigue crack growth in the frame of a hydraulic press a) Global view on the broken press frame b) Initiation of fatigue crack growth at a material imperfection
In a hydraulic press, that is used for manufacturing of automotive structures, an
extended fatigue crack has developed in the frame of the press. This crack enforced the
untimely substitution of the press frame (Figure 2a). On the fracture surface of the broken frame different phases of crack growth are observable. The crack initiated from a material imperfection, Figure 2b. Fracture mechanical investigations for this structure are given in [1].
a) b)
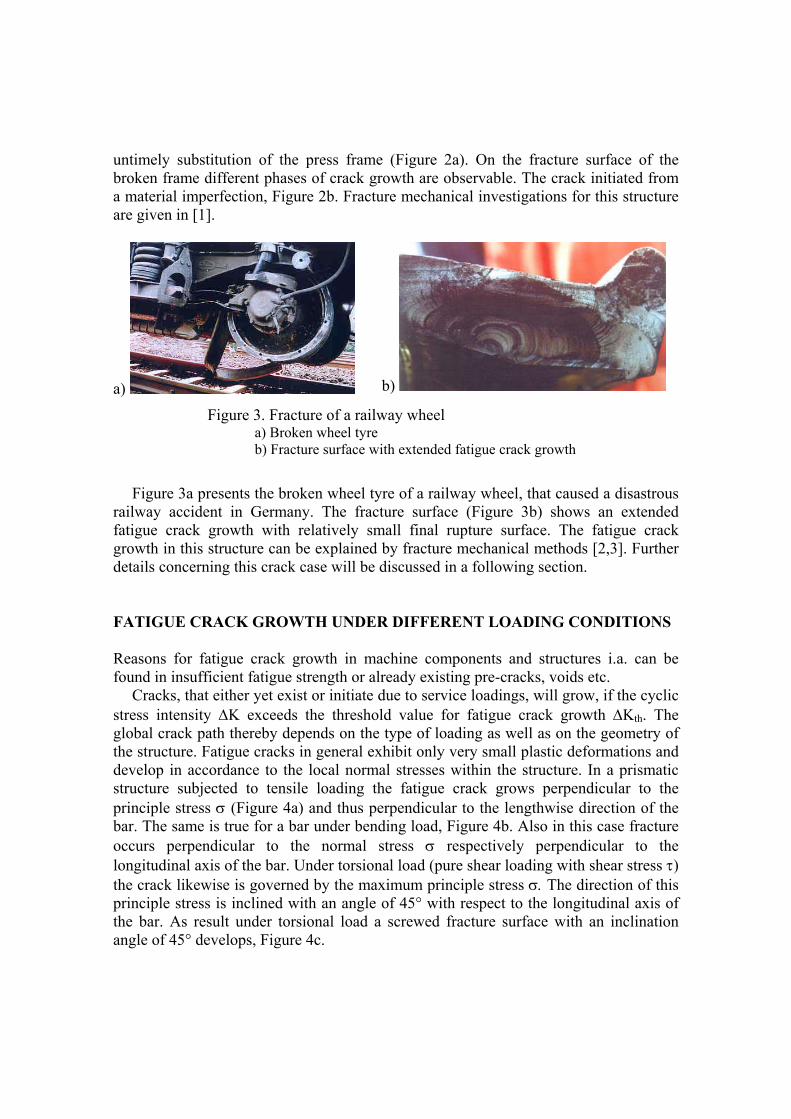
Figure 3. Fracture of a railway wheel a) Broken wheel tyre b) Fracture surface with extended fatigue crack growth
Figure 3a presents the broken wheel tyre of a railway wheel, that caused a disastrous
railway accident in Germany. The fracture surface (Figure 3b) shows an extended fatigue crack growth with relatively small final rupture surface. The fatigue crack growth in this structure can be explained by fracture mechanical methods [2,3]. Further details concerning this crack case will be discussed in a following section. FATIGUE CRACK GROWTH UNDER DIFFERENT LOADING CONDITIONS Reasons for fatigue crack growth in machine components and structures i.a. can be found in insufficient fatigue strength or already existing pre-cracks, voids etc.
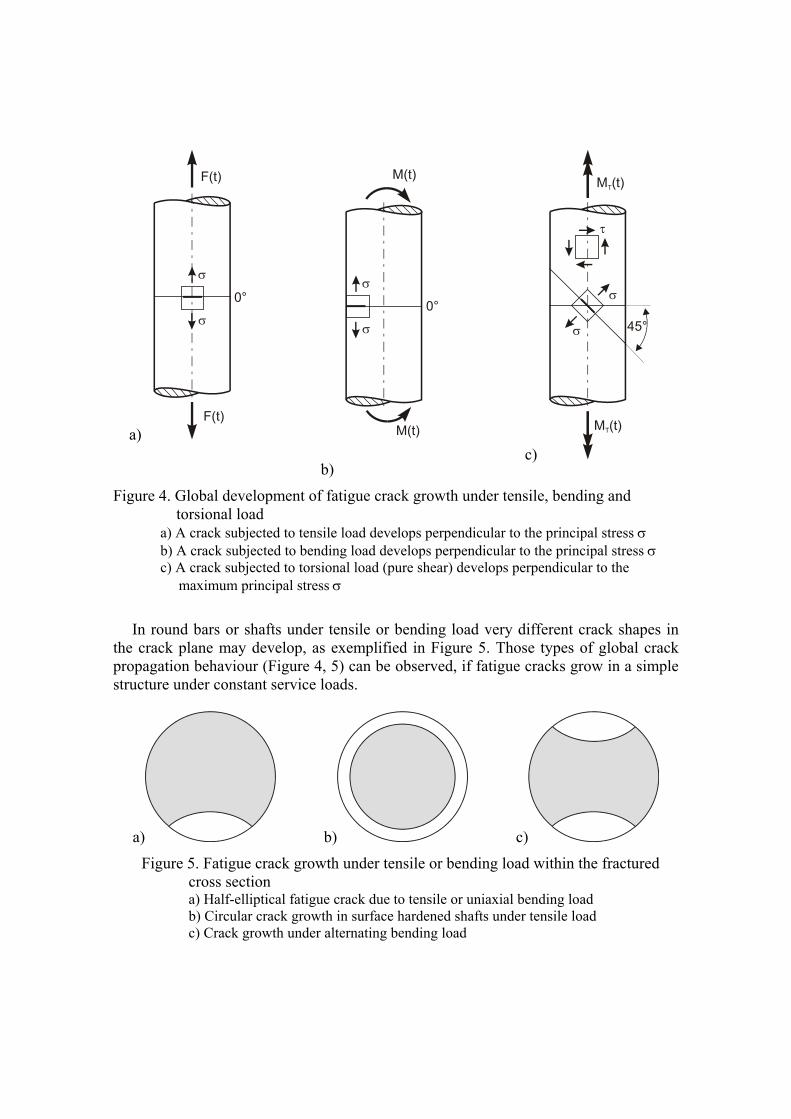
Cracks, that either yet exist or initiate due to service loadings, will grow, if the cyclic stress intensity ∆K exceeds the threshold value for fatigue crack growth ∆Kth. The global crack path thereby depends on the type of loading as well as on the geometry of the structure. Fatigue cracks in general exhibit only very small plastic deformations and develop in accordance to the local normal stresses within the structure. In a prismatic structure subjected to tensile loading the fatigue crack grows perpendicular to the principle stress σ (Figure 4a) and thus perpendicular to the lengthwise direction of the bar. The same is true for a bar under bending load, Figure 4b. Also in this case fracture occurs perpendicular to the normal stress σ respectively perpendicular to the longitudinal axis of the bar. Under torsional load (pure shear loading with shear stress τ) the crack likewise is governed by the maximum principle stress σ. The direction of this principle stress is inclined with an angle of 45° with respect to the longitudinal axis of the bar. As result under torsional load a screwed fracture surface with an inclination angle of 45° develops, Figure 4c.
a)
F(t)
F(t)
σ
σ
0°
σ
σ
M(t)
M(t)
0°
b)
c)
M (t)T
M (t)T
σ
σ
τ
45°
Figure 4. Global development of fatigue crack growth under tensile, bending and torsional load a) A crack subjected to tensile load develops perpendicular to the principal stress σ b) A crack subjected to bending load develops perpendicular to the principal stress σ c) A crack subjected to torsional load (pure shear) develops perpendicular to the maximum principal stress σ
In round bars or shafts under tensile or bending load very different crack shapes in
the crack plane may develop, as exemplified in Figure 5. Those types of global crack propagation behaviour (Figure 4, 5) can be observed, if fatigue cracks grow in a simple structure under constant service loads.
a) b) c)
Figure 5. Fatigue crack growth under tensile or bending load within the fractured cross section a) Half-elliptical fatigue crack due to tensile or uniaxial bending load b) Circular crack growth in surface hardened shafts under tensile load c) Crack growth under alternating bending load
a)
σ
σ
0°
ϕ0
existingflaw
local stress field
global stress field
b)
τ
τ
ϕ0=70,5°
existingflaw
local stress field
global stress field
45°
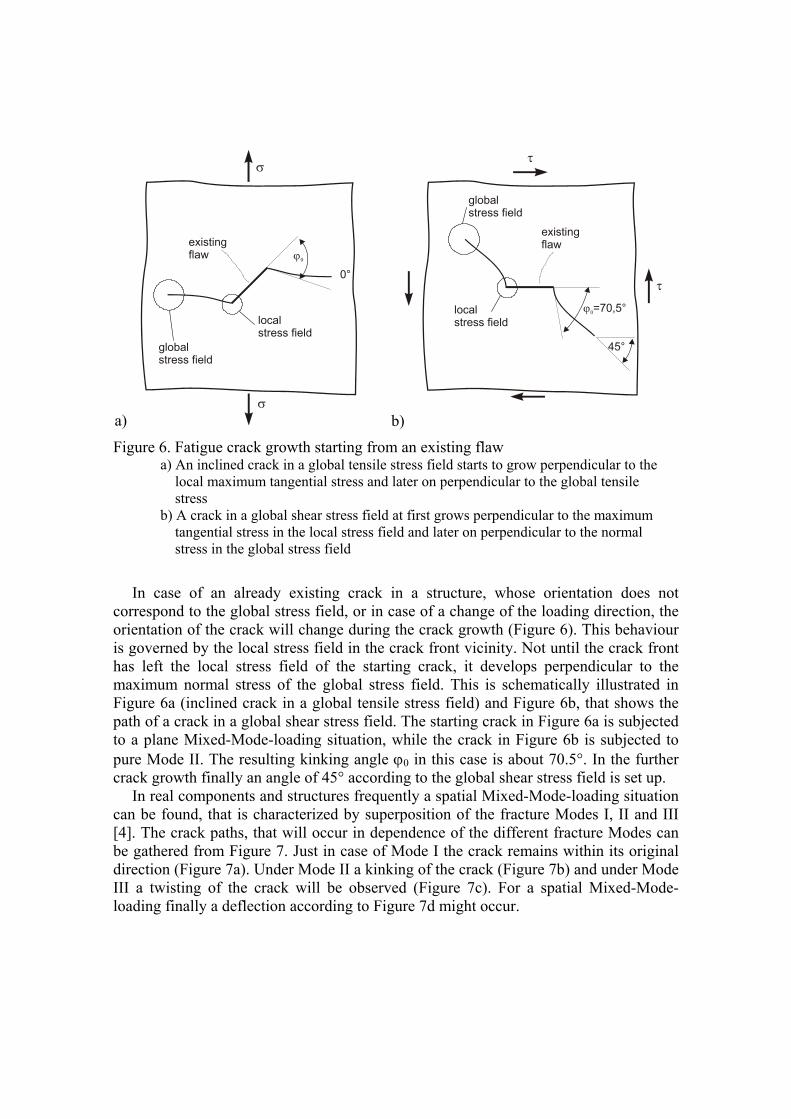
Figure 6. Fatigue crack growth starting from an existing flaw a) An inclined crack in a global tensile stress field starts to grow perpendicular to the local maximum tangential stress and later on perpendicular to the global tensile stress b) A crack in a global shear stress field at first grows perpendicular to the maximum tangential stress in the local stress field and later on perpendicular to the normal stress in the global stress field
In case of an already existing crack in a structure, whose orientation does not
correspond to the global stress field, or in case of a change of the loading direction, the orientation of the crack will change during the crack growth (Figure 6). This behaviour is governed by the local stress field in the crack front vicinity. Not until the crack front has left the local stress field of the starting crack, it develops perpendicular to the maximum normal stress of the global stress field. This is schematically illustrated in Figure 6a (inclined crack in a global tensile stress field) and Figure 6b, that shows the path of a crack in a global shear stress field. The starting crack in Figure 6a is subjected to a plane Mixed-Mode-loading situation, while the crack in Figure 6b is subjected to pure Mode II. The resulting kinking angle ϕ0 in this case is about 70.5°. In the further crack growth finally an angle of 45° according to the global shear stress field is set up.
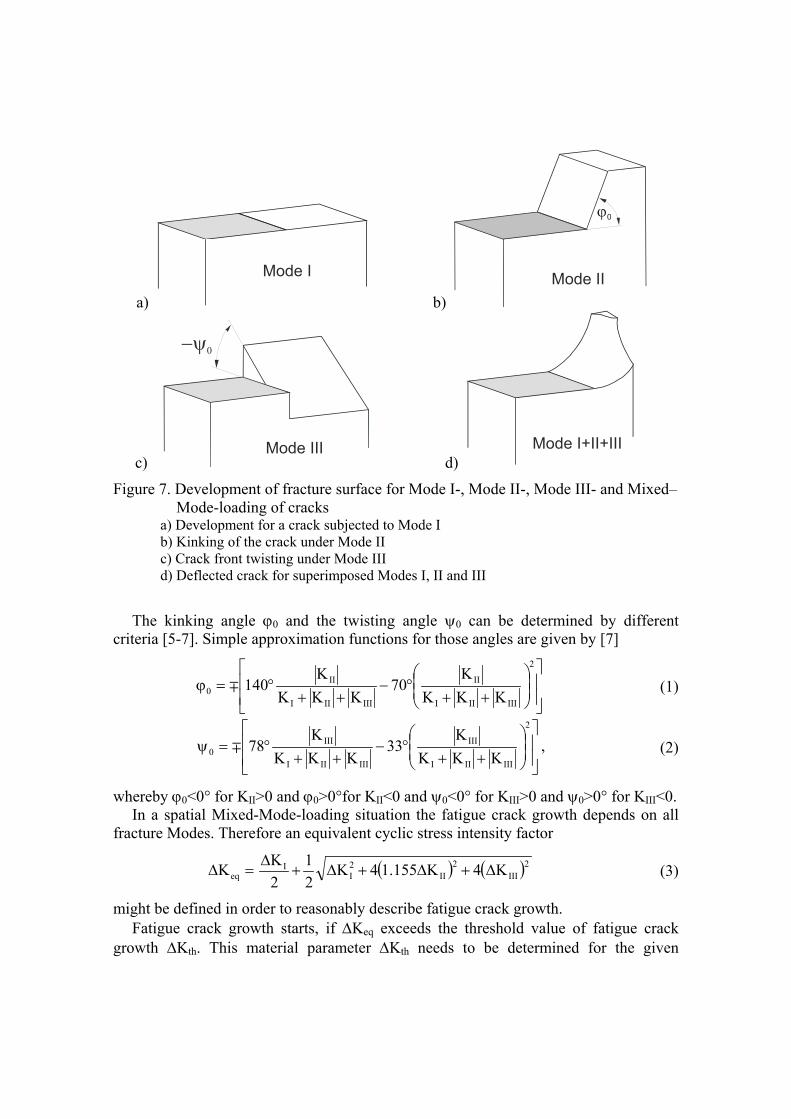
In real components and structures frequently a spatial Mixed-Mode-loading situation can be found, that is characterized by superposition of the fracture Modes I, II and III [4]. The crack paths, that will occur in dependence of the different fracture Modes can be gathered from Figure 7. Just in case of Mode I the crack remains within its original direction (Figure 7a). Under Mode II a kinking of the crack (Figure 7b) and under Mode III a twisting of the crack will be observed (Figure 7c). For a spatial Mixed-Mode-loading finally a deflection according to Figure 7d might occur.
a)
Mode I
b)
ϕ0
Mode II
c)
−ψ0
Mode III d)
Mode I+II+III
Figure 7. Development of fracture surface for Mode I-, Mode II-, Mode III- and Mixed– Mode-loading of cracks a) Development for a crack subjected to Mode I b) Kinking of the crack under Mode II c) Crack front twisting under Mode III d) Deflected crack for superimposed Modes I, II and III
The kinking angle ϕ0 and the twisting angle ψ0 can be determined by different
criteria [5-7]. Simple approximation functions for those angles are given by [7]
++°−
++°=ϕ
2
IIIIII
II
IIIIII
II0 KKK
K70
KKKK
140∓ (1)
++°−
++°=ψ
2
IIIIII
III
IIIIII
III0 KKK
K33
KKKK
78∓ , (2)
whereby ϕ0<0° for KII>0 and ϕ0>0°for KII<0 and ψ0<0° for KIII>0 and ψ0>0° for KIII<0. In a spatial Mixed-Mode-loading situation the fatigue crack growth depends on all
fracture Modes. Therefore an equivalent cyclic stress intensity factor
( ) ( )2III
2II
2I
Ieq K4K155.14K
21
2KK ∆+∆+∆+
∆=∆ (3)
might be defined in order to reasonably describe fatigue crack growth. Fatigue crack growth starts, if ∆Keq exceeds the threshold value of fatigue crack
growth ∆Kth. This material parameter ∆Kth needs to be determined for the given
material by experimental investigations [8]. The crack’s propagation rate da/dN depends on the equivalent cyclic stress intensity ∆Keq as well as on the fracture mechanical properties of the material which is under consideration. It also is determined by experiments (in general with CT-specimens). Technically the crack growth rate da/dN can be described e.g. by the modified Forman-/Mettu-equation:
q
C
max
p
eq
thn
eq
KK1
KK1
KR1f1C
dNda
−
∆∆
−
∆
−−
= . (4)
In this equation C, n, p and q are the material parameters, and f denotes the crack opening function [9,10].
If –either due to the growing crack or due to increase of the external load– the maximum equivalent stress intensity
( ) ( ) Ic2
III2
II2I
Imax,eq KK4K155.14K
21
2KK =+++= (5)
reaches the fracture toughness KIc, unstable crack growth and thus in general failure of the whole structure occurs.
In case of real service loads often so-called interaction effects have to be taken into account for fatigue crack growth purposes. Due to variable amplitude loadings acceleration as well as retardation in the crack growth might occur, see Figure 12. Despite the fact, that the influence of single loading change events like over- or block-loads meanwhile are well known [10], extensive research for arbitrary variable amplitude loadings is still necessary, especially if not only the amplitude but also the direction of the load (Mixed-Mode-loading) changes. FRACTURE MECHANICAL ASSESSMENT OF THE FATIGUE CRACK GROWTH IN A RUBBER-SPRUNG RAILWAY WHEEL In the year 1998 near Eschede the German ICE high speed train Wilhelm-Conrad Röntgen got into an accident on its way from Munich to Hamburg with catastrophic results. The broken wheel tyre of the rubber-sprung wheel finally was identified as reason for the accident.
Rubber-sprung wheels in general consist of a wheel tyre, a wheel rim and a number of rubber blocks, that are clamped in between. The highest stress in the wheel tyre can be found on its inner side. As consequence of the rotation of the wheel a cyclic loading can be observed in the wheel tyre. This loading led to an extended fatigue crack growth and in the end to the fracture of the wheel tyre (Figure 3).
The finally broken ICE-wheel in new condition had a diameter of 920mm. Due to wear and thus necessary re-profiling the diameter of the broken wheel had decreased to 862mm (the limiting size of the diameter was set to 854mm). As result of the decrease
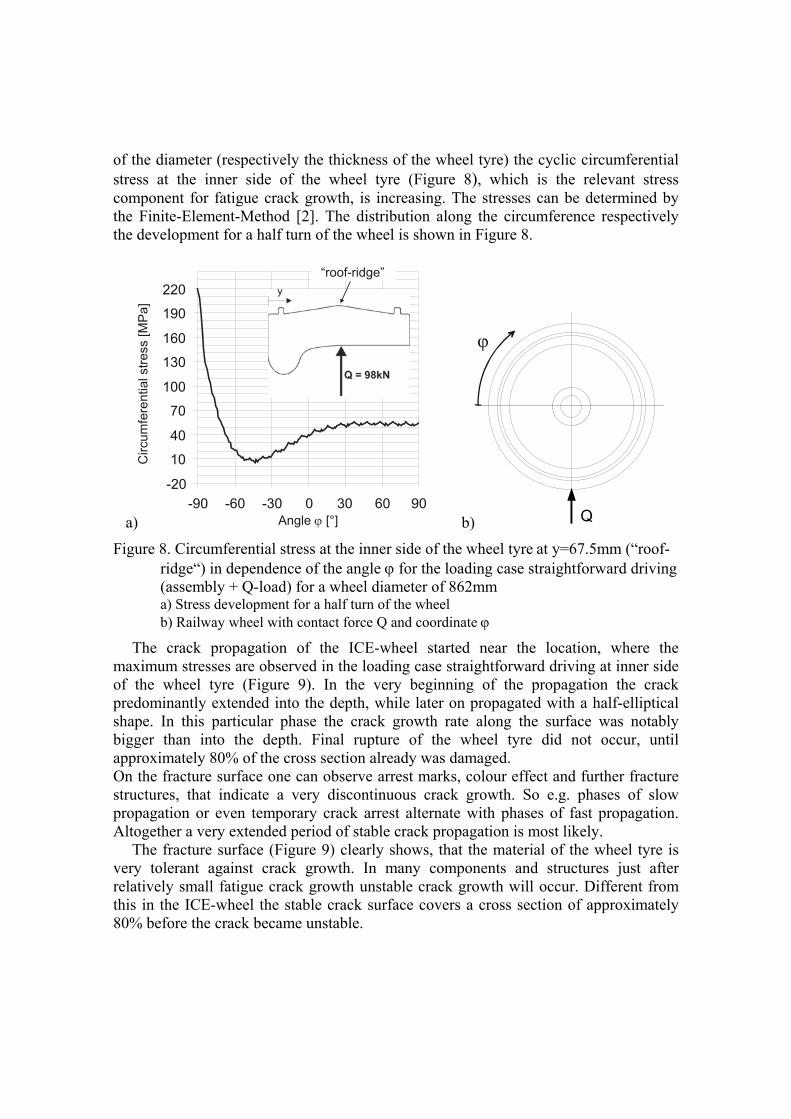
of the diameter (respectively the thickness of the wheel tyre) the cyclic circumferential stress at the inner side of the wheel tyre (Figure 8), which is the relevant stress component for fatigue crack growth, is increasing. The stresses can be determined by the Finite-Element-Method [2]. The distribution along the circumference respectively the development for a half turn of the wheel is shown in Figure 8.
a)
-20
10
40
70
100
130
160
190
220
-90 -60 -30 0 30 60 90Angle [°]ϕ
Circ
umfe
rent
ial s
tress
[MP
a]
“roof-ridge”
b) Q
ϕ
Figure 8. Circumferential stress at the inner side of the wheel tyre at y=67.5mm (“roof-ridge“) in dependence of the angle ϕ for the loading case straightforward driving (assembly + Q-load) for a wheel diameter of 862mm a) Stress development for a half turn of the wheel b) Railway wheel with contact force Q and coordinate ϕ
The crack propagation of the ICE-wheel started near the location, where the maximum stresses are observed in the loading case straightforward driving at inner side of the wheel tyre (Figure 9). In the very beginning of the propagation the crack predominantly extended into the depth, while later on propagated with a half-elliptical shape. In this particular phase the crack growth rate along the surface was notably bigger than into the depth. Final rupture of the wheel tyre did not occur, until approximately 80% of the cross section already was damaged. On the fracture surface one can observe arrest marks, colour effect and further fracture structures, that indicate a very discontinuous crack growth. So e.g. phases of slow propagation or even temporary crack arrest alternate with phases of fast propagation. Altogether a very extended period of stable crack propagation is most likely.
The fracture surface (Figure 9) clearly shows, that the material of the wheel tyre is very tolerant against crack growth. In many components and structures just after relatively small fatigue crack growth unstable crack growth will occur. Different from this in the ICE-wheel the stable crack surface covers a cross section of approximately 80% before the crack became unstable.
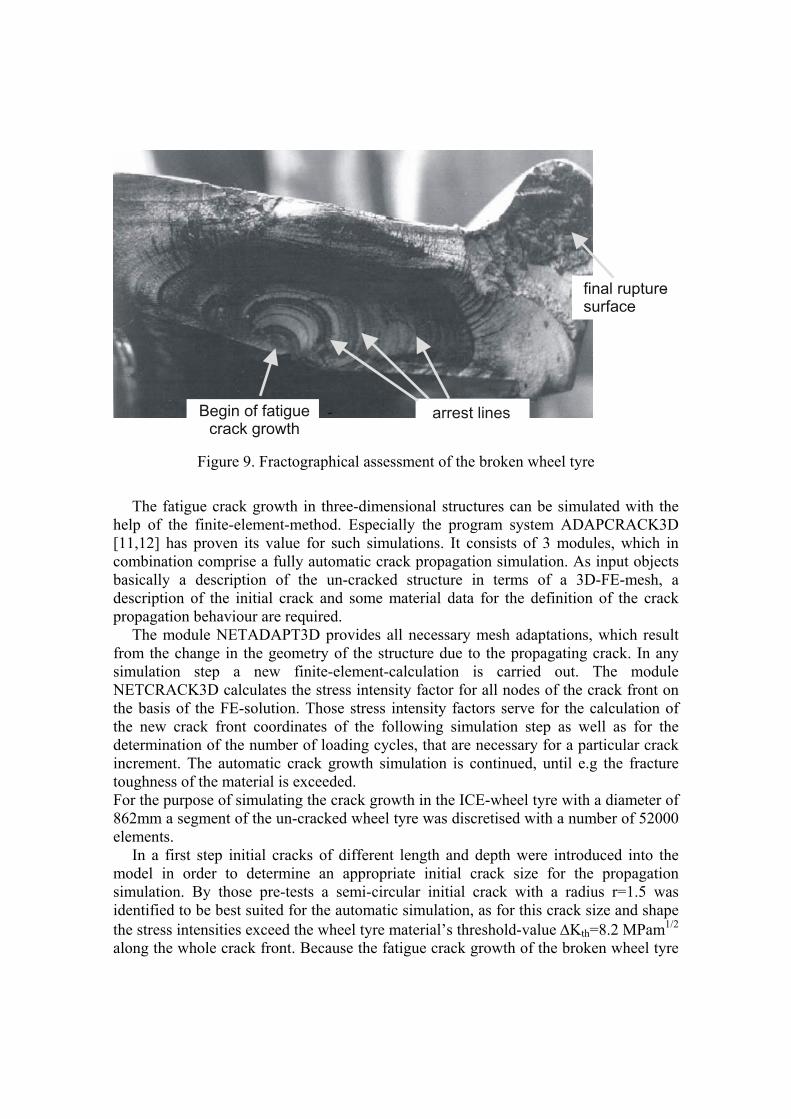
Begin of fatigue crack growth
-
final rupture surface
-
arrest lines
Figure 9. Fractographical assessment of the broken wheel tyre
The fatigue crack growth in three-dimensional structures can be simulated with the
help of the finite-element-method. Especially the program system ADAPCRACK3D [11,12] has proven its value for such simulations. It consists of 3 modules, which in combination comprise a fully automatic crack propagation simulation. As input objects basically a description of the un-cracked structure in terms of a 3D-FE-mesh, a description of the initial crack and some material data for the definition of the crack propagation behaviour are required.
The module NETADAPT3D provides all necessary mesh adaptations, which result from the change in the geometry of the structure due to the propagating crack. In any simulation step a new finite-element-calculation is carried out. The module NETCRACK3D calculates the stress intensity factor for all nodes of the crack front on the basis of the FE-solution. Those stress intensity factors serve for the calculation of the new crack front coordinates of the following simulation step as well as for the determination of the number of loading cycles, that are necessary for a particular crack increment. The automatic crack growth simulation is continued, until e.g the fracture toughness of the material is exceeded. For the purpose of simulating the crack growth in the ICE-wheel tyre with a diameter of 862mm a segment of the un-cracked wheel tyre was discretised with a number of 52000 elements.
In a first step initial cracks of different length and depth were introduced into the model in order to determine an appropriate initial crack size for the propagation simulation. By those pre-tests a semi-circular initial crack with a radius r=1.5 was identified to be best suited for the automatic simulation, as for this crack size and shape the stress intensities exceed the wheel tyre material’s threshold-value ∆Kth=8.2 MPam1/2 along the whole crack front. Because the fatigue crack growth of the broken wheel tyre
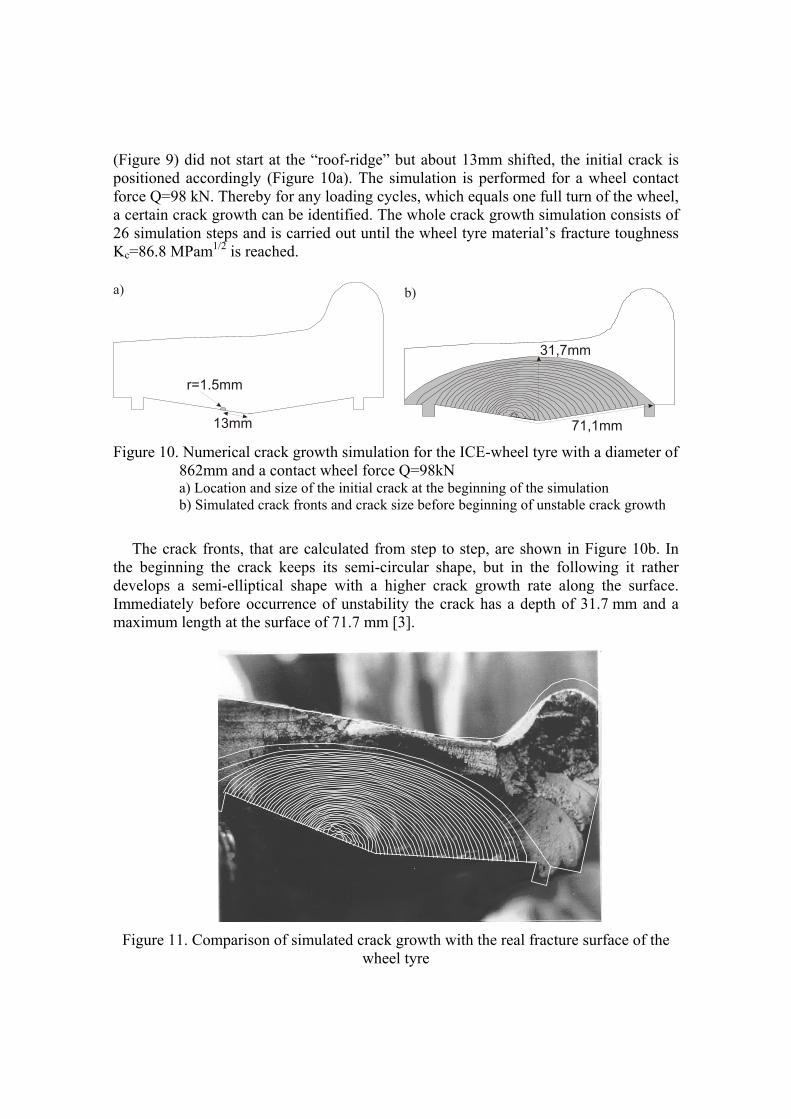
(Figure 9) did not start at the “roof-ridge” but about 13mm shifted, the initial crack is positioned accordingly (Figure 10a). The simulation is performed for a wheel contact force Q=98 kN. Thereby for any loading cycles, which equals one full turn of the wheel, a certain crack growth can be identified. The whole crack growth simulation consists of 26 simulation steps and is carried out until the wheel tyre material’s fracture toughness Kc=86.8 MPam1/2 is reached.
r=1.5mm
13mm
a)
31,7mm
71,1mm
b)
Figure 10. Numerical crack growth simulation for the ICE-wheel tyre with a diameter of 862mm and a contact wheel force Q=98kN a) Location and size of the initial crack at the beginning of the simulation b) Simulated crack fronts and crack size before beginning of unstable crack growth
The crack fronts, that are calculated from step to step, are shown in Figure 10b. In
the beginning the crack keeps its semi-circular shape, but in the following it rather develops a semi-elliptical shape with a higher crack growth rate along the surface. Immediately before occurrence of unstability the crack has a depth of 31.7 mm and a maximum length at the surface of 71.7 mm [3].
Figure 11. Comparison of simulated crack growth with the real fracture surface of the
wheel tyre
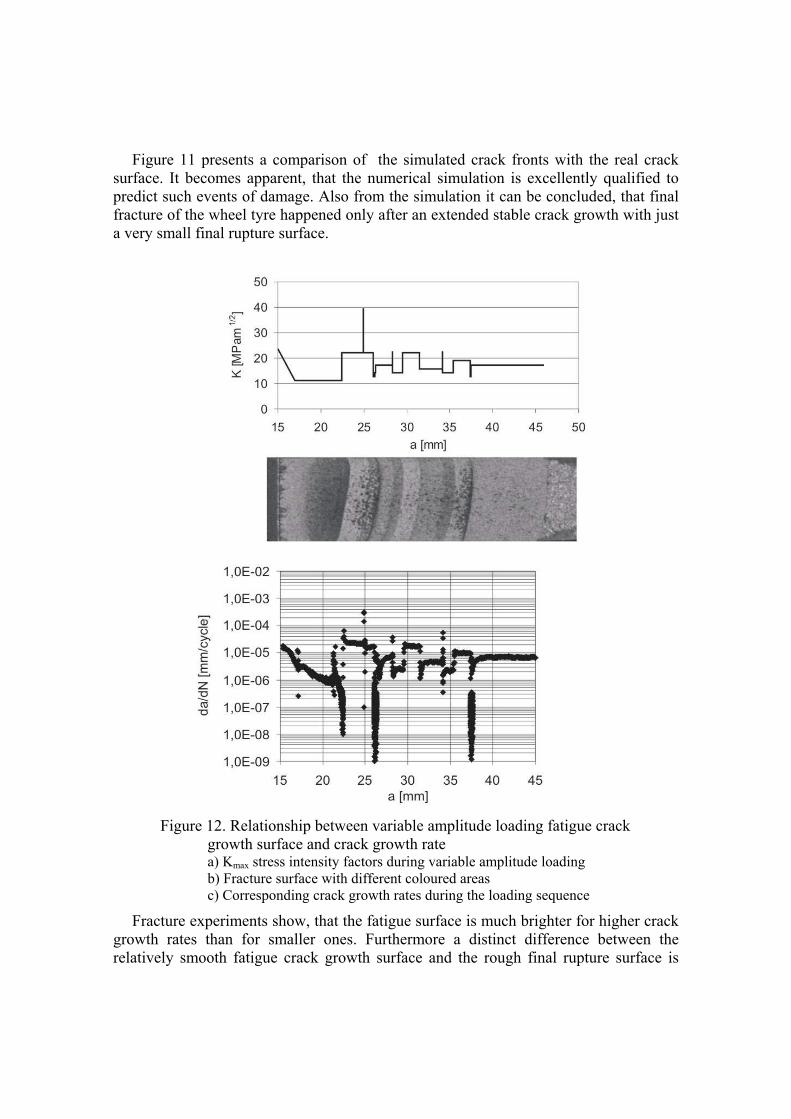
Figure 11 presents a comparison of the simulated crack fronts with the real crack surface. It becomes apparent, that the numerical simulation is excellently qualified to predict such events of damage. Also from the simulation it can be concluded, that final fracture of the wheel tyre happened only after an extended stable crack growth with just a very small final rupture surface.
Figure 12. Relationship between variable amplitude loading fatigue crack
growth surface and crack growth rate a) Kmax stress intensity factors during variable amplitude loading b) Fracture surface with different coloured areas c) Corresponding crack growth rates during the loading sequence
Fracture experiments show, that the fatigue surface is much brighter for higher crack growth rates than for smaller ones. Furthermore a distinct difference between the relatively smooth fatigue crack growth surface and the rough final rupture surface is
evident. Bright and dark colourings can also be observed under cyclic loading with variable amplitude. So e.g. changes of the load amplitude in general lead to arrest marks and brighter and darker crack surface structures, Figure 12.
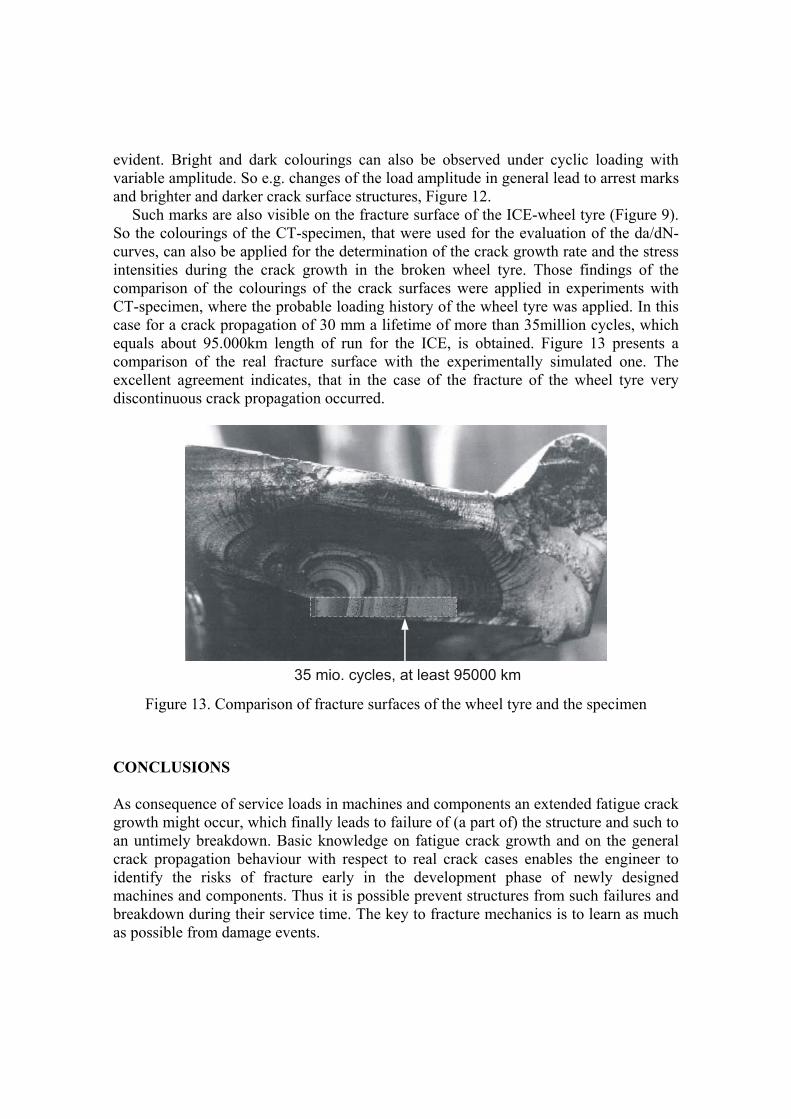
Such marks are also visible on the fracture surface of the ICE-wheel tyre (Figure 9). So the colourings of the CT-specimen, that were used for the evaluation of the da/dN-curves, can also be applied for the determination of the crack growth rate and the stress intensities during the crack growth in the broken wheel tyre. Those findings of the comparison of the colourings of the crack surfaces were applied in experiments with CT-specimen, where the probable loading history of the wheel tyre was applied. In this case for a crack propagation of 30 mm a lifetime of more than 35million cycles, which equals about 95.000km length of run for the ICE, is obtained. Figure 13 presents a comparison of the real fracture surface with the experimentally simulated one. The excellent agreement indicates, that in the case of the fracture of the wheel tyre very discontinuous crack propagation occurred.
35 mio. cycles, at least 95000 km Figure 13. Comparison of fracture surfaces of the wheel tyre and the specimen
CONCLUSIONS As consequence of service loads in machines and components an extended fatigue crack growth might occur, which finally leads to failure of (a part of) the structure and such to an untimely breakdown. Basic knowledge on fatigue crack growth and on the general crack propagation behaviour with respect to real crack cases enables the engineer to identify the risks of fracture early in the development phase of newly designed machines and components. Thus it is possible prevent structures from such failures and breakdown during their service time. The key to fracture mechanics is to learn as much as possible from damage events.
REFERENCES 1. Fulland, M., Richard, H.A., Sander, M., Kullmer, G. (2006). In: Proc. of CP2006,
Carpinteri, A., Pook, L. (Eds.), Parma. 2. Richard, H.A., Sander, M., Kullmer, G., Fulland, M. (2004). Materialprüfung 46,
441-449. 3. Richard, H.A., Fulland, M., Sander, M., Kullmer, G. (2005). Eng. Fail. Anal. 12,
986-999. 4. Richard, H.A., Fulland, M., Buchholz, F.G., Schöllmann, M. (2003). Steel research
74, 491-497. 5. Pook, L.P. (1985). Multiaxial Fatigues, pp. 249-263. In: Miller, K.J., Brown, M.W.
(Eds.), ASTM STP853, American Society for Testing and Materials, Philadelphia 6. Schöllmann, M., Richard, H.A., Kullmer, G. and Fulland, M. (2002) Int. J. Frac.
117, 129-141. 7. Richard, H.A., Fulland, M., Sander, M. (2005). FFEMS 28, 3-12. 8. Sander, M., Richard, H.A. (2004) Materialprüfung 46, 495-500. 9. Forman, R.G. and Mettu, S.R. (1992) ASTM STP 1131, 948-953. 10. Sander, M., Richard, H.A. (2006) FFEMS 29, 291-319. 11. Schöllmann, M., Fulland, M. and Richard, H.A. (2003) Eng. Frac. Mech. 70, 249-
268. 12. Fulland, M., Richard, H.A. (2005) CD-ROM Proc. of ICF11, Torino.


