Embed Size (px)
Citation preview
American Institute of Aeronautics and Astronautics
1
Experimental investigation of electrostatically charged liquid hydrocarbon sprays for power generation applications
Eric K. Anderson1a, A. Paolo Carlucci2b, Arturo de Risi3b, Dimitrios C. Kyritsis4a a University of Illinois at Urbana-Champaign, Urbana, IL, 61801
b University of Lecce, Lecce, Italy
Electrospray technology has caused a veritable revolution in the field of analytic chemistry but its potential for applications relating to power generation has not been thoroughly investigated. Liquid fuel injection is typically driven by significant pressure differences and dispersion relies almost exclusively to phenomena related to fuel inertia, even for novel ideas like high pressure gasoline direct injection (GDI). In this paper, we offer an experimental investigation of the extent to which inertial and electrostatic phenomena can be combined for liquid hydrocarbon spray injection. A GDI injector was modified so that the liquid fuel was charged and the effect of electric fields on spray steering and atomization was studied, with a particular emphasis on the determination of the relative importance of inertial and electrostatic forces for varying conditions of injector operation. Spray penetration and cone angle were measured using laser light Mie scattering and digital imaging. The acquired images scanned the transient injection, over a range of fuel pressures, with either 0 or 3 kV voltage applied to the injector tip. Results showed that the electric fields had little effect above an injection pressure of 10 bar, at cold ambient conditions. However below this level, it was possible to significantly influence spray dispersion and atomization through electrostatic effects. Also, measurements of the charge transferred to the gasoline spray are reported.
Nomenclature A = early spray penetration (“early” as defined in Section III. A.) B = late spray penetration (“late” as defined in Section III. A.) C = early spray width D = late spray width DISC = direct injection stratified charge DISI = direct injection sprak ignition GDI = gasoline direct injection IC = internal combustion w = width
I. Introduction o achieve reliable ignition in a spark ignited engine, it is desirable that fuel and air be mixed at an approximately stoichiometric proportion in the vicinity of the ignition source. It is difficult, however, to design a fuel system
that provides optimal fuel distribution under all engine operating conditions. The mass of the injected fuel, which determines engine load, and its momentum, which determines the way fuel is atomized and distributed, are inherently interwoven, making it difficult to independently control fuel distribution and engine load. By adding another means of controlling spray, such as electrostatic charge, this limitation can be lifted. Thong and Weinberg
1 Graduate Student, Dept. of Mechanical and Industrial Eng., MC-244, 1206 W. Green St., Urbana, IL 61801, AIAA member. 2 Post Doctoral Fellow, Dept. of Eng. for Innovation, Via Arnesano, 73100 Lecce-Italy 3 Associate Professor, Dept. of Eng. for Innovation, Via Arnesano, 73100 Lecce-Italy 4 Assistant Professor, Dept. of Mechanical and Industrial Eng., MC-244, 1206 W. Green St., Urbana, IL 61801, AIAA member.
T
American Institute of Aeronautics and Astronautics
2
[1] pointed out the possibility of using electrostatic effects in combustion applications. Later work by Kim and Turnbull [2] and Kelly [3] showed that electric charge can be injected in liquids of relatively low conductivity such as hydrocarbons (σ<10-6 (Ωm)-1) with the use of sharp electrodes. Hydrocarbon fuel sprays have been studied extensively by Gomez and collaborators [4,5]. They recently proposed a mesoscale burner based on kerosene electrosprays to be used in a “liquid fuel battery” [6,7]. In “electrospray combustion”, injection takes place across minute pressure differences and the electric field is employed as the sole mechanism of atomization. Although electostatics has been studied and applied to low pressure, low flow rate sprays, the combination of electrostatic phenomena with the relatively high flow rates and high injection pressures typical of engine operation has received very little research interest. This is probably because of the implicit assumption that inertial effects will dominate electrostatic ones in such a spray. Recent findings, however, indicate that this assertion may not be universally valid. Thomas et. al. [8] demonstrated computationally that electrostatic effects can alter sprays during diesel injection, and Bellan and Harstad [9] showed that electrostatically charging the diesel spray can affect the formation of soot. Hetrick and Parsons [10] discussed the possibility of “electrospray” port injection in an IC engine. Also, a recent computational study by Shrimpton [11] indicated that by appropriately tailoring an applied electric field, significant improvement of fuel dispersion is possible in a direct injection spark ignition (DISI) engine. Our objective was to experimentally determine the conditions under which electrostatic effects can influence gasoline injection, with an emphasis on fuel atomization and dispersion. To this end, we installed a gasoline injector in an optically accessible test cell and modified it so that the fuel could be electrostatically charged. Modifications to the injector tip were based on finite element modeling of the electric field within the chamber for various tip configurations. Using appropriate optical techniques we measured the effect of electrostatic charging on spray penetration and cone angle. Also, in order to estimate the magnitude of the electric charge transferred to the fuel, charge measurements were obtained using an electrometer. These preliminary results will guide subsequent Phase-Doppler size and velocity measurements in order to rationalize the results in terms of a competition of electrostatic with inertial forces.
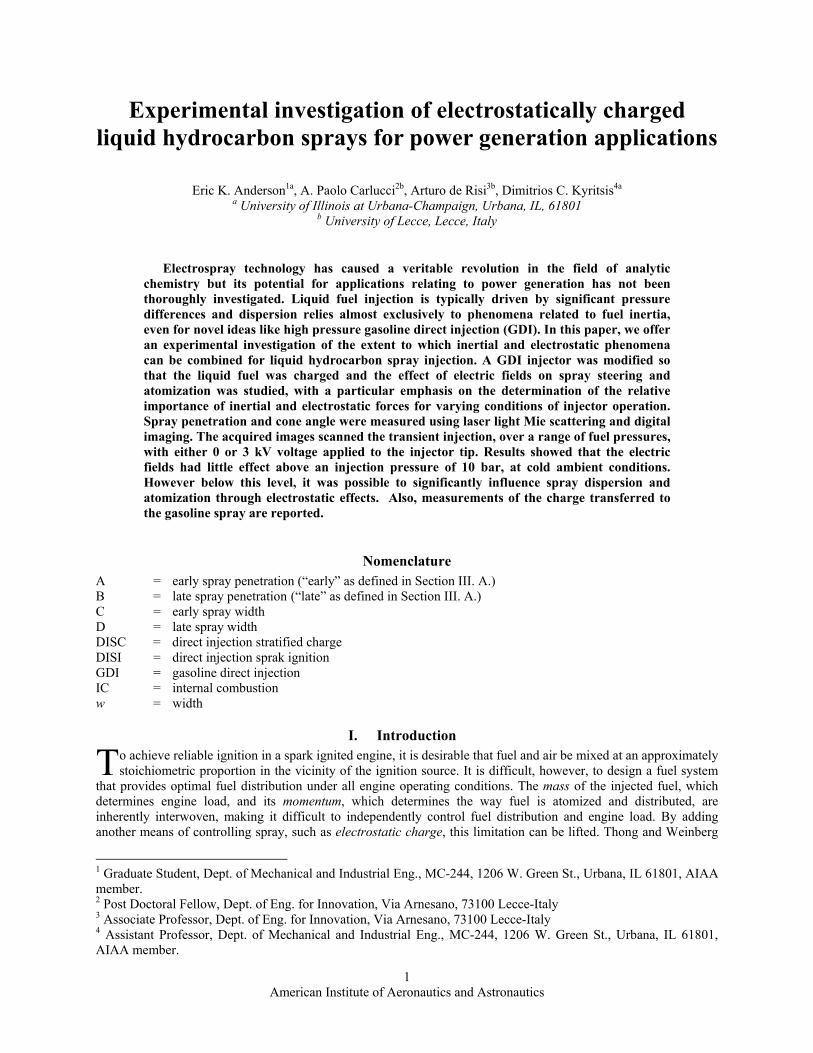
II. Experimental Apparatus and Techniques A schematic of the experimental apparatus is shown in Fig.1. A Mitsubishi MR560552 injector was installed in an optically accessible test cell, with a teflon insert at the top to electrically isolate the injector. The injector was a tangential swirl type injector with an inwardly opening pintle. The dimensions of the test chamber in which the injector was installed were 30.5 cm in height and 22 cm in diameter. Three 6.3 cm – diameter circular quartz windows were used to provide laser sheet passage and 90° imaging. 87 octane number (defined with the (R+M)/2 standard) commercially available gasoline was used as a fuel and delivered to the injector through an accumulator pressurized by nitrogen gas. Detailed physical and chemical properties of the fuel can be found at http://www.bpdirect.com/pdfs/ Amoco_Regular_Gasoline.pdf.
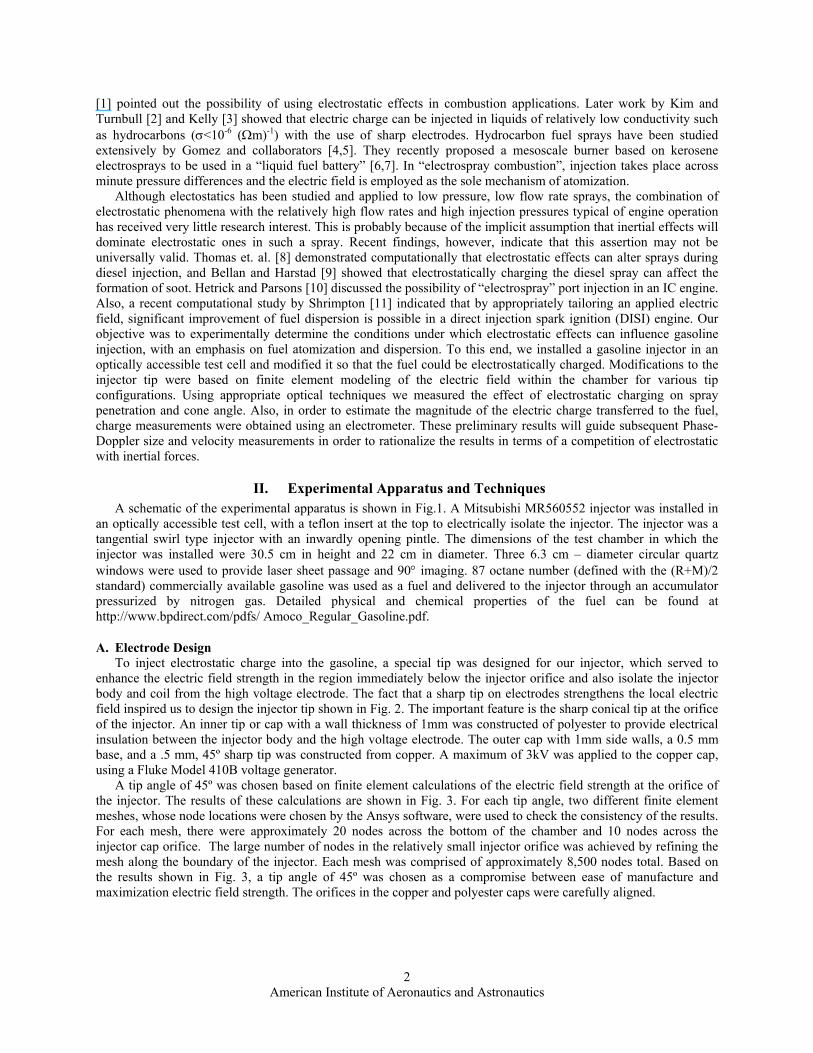
A. Electrode Design To inject electrostatic charge into the gasoline, a special tip was designed for our injector, which served to
enhance the electric field strength in the region immediately below the injector orifice and also isolate the injector body and coil from the high voltage electrode. The fact that a sharp tip on electrodes strengthens the local electric field inspired us to design the injector tip shown in Fig. 2. The important feature is the sharp conical tip at the orifice of the injector. An inner tip or cap with a wall thickness of 1mm was constructed of polyester to provide electrical insulation between the injector body and the high voltage electrode. The outer cap with 1mm side walls, a 0.5 mm base, and a .5 mm, 45º sharp tip was constructed from copper. A maximum of 3kV was applied to the copper cap, using a Fluke Model 410B voltage generator.
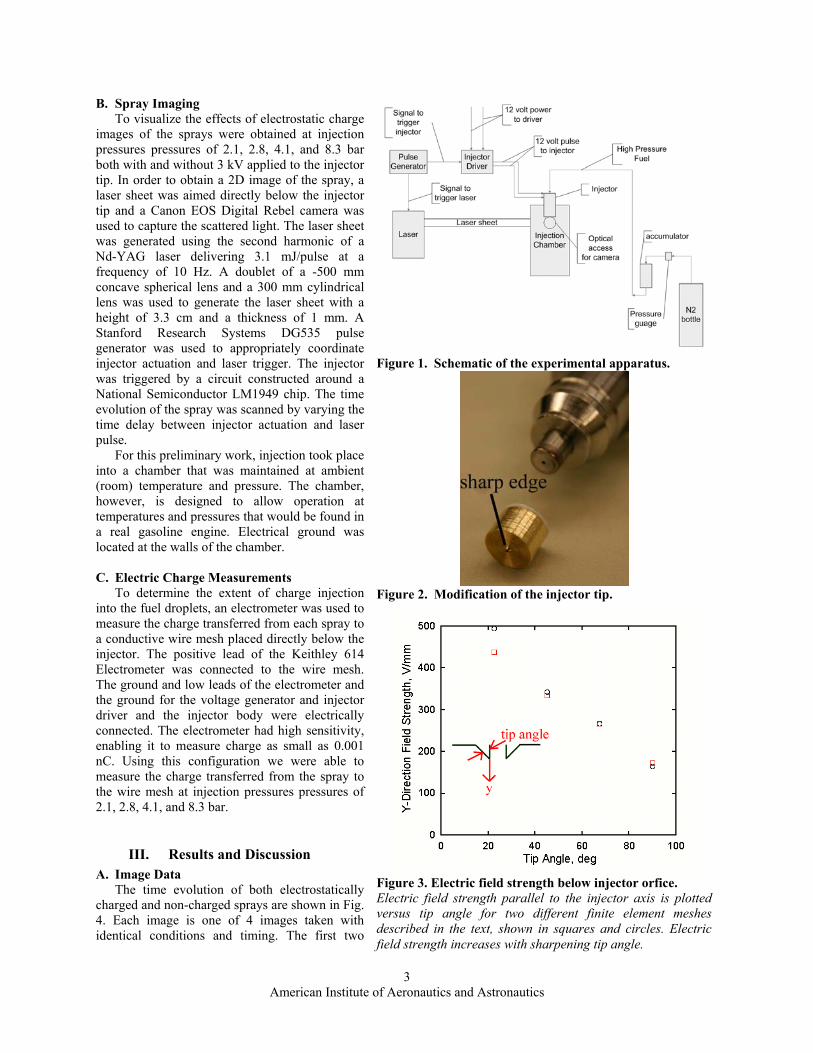
A tip angle of 45º was chosen based on finite element calculations of the electric field strength at the orifice of the injector. The results of these calculations are shown in Fig. 3. For each tip angle, two different finite element meshes, whose node locations were chosen by the Ansys software, were used to check the consistency of the results. For each mesh, there were approximately 20 nodes across the bottom of the chamber and 10 nodes across the injector cap orifice. The large number of nodes in the relatively small injector orifice was achieved by refining the mesh along the boundary of the injector. Each mesh was comprised of approximately 8,500 nodes total. Based on the results shown in Fig. 3, a tip angle of 45º was chosen as a compromise between ease of manufacture and maximization electric field strength. The orifices in the copper and polyester caps were carefully aligned.
American Institute of Aeronautics and Astronautics
3
B. Spray Imaging To visualize the effects of electrostatic charge
images of the sprays were obtained at injection pressures pressures of 2.1, 2.8, 4.1, and 8.3 bar both with and without 3 kV applied to the injector tip. In order to obtain a 2D image of the spray, a laser sheet was aimed directly below the injector tip and a Canon EOS Digital Rebel camera was used to capture the scattered light. The laser sheet was generated using the second harmonic of a Nd-YAG laser delivering 3.1 mJ/pulse at a frequency of 10 Hz. A doublet of a -500 mm concave spherical lens and a 300 mm cylindrical lens was used to generate the laser sheet with a height of 3.3 cm and a thickness of 1 mm. A Stanford Research Systems DG535 pulse generator was used to appropriately coordinate injector actuation and laser trigger. The injector was triggered by a circuit constructed around a National Semiconductor LM1949 chip. The time evolution of the spray was scanned by varying the time delay between injector actuation and laser pulse.
For this preliminary work, injection took place into a chamber that was maintained at ambient (room) temperature and pressure. The chamber, however, is designed to allow operation at temperatures and pressures that would be found in a real gasoline engine. Electrical ground was located at the walls of the chamber. C. Electric Charge Measurements To determine the extent of charge injection into the fuel droplets, an electrometer was used to measure the charge transferred from each spray to a conductive wire mesh placed directly below the injector. The positive lead of the Keithley 614 Electrometer was connected to the wire mesh. The ground and low leads of the electrometer and the ground for the voltage generator and injector driver and the injector body were electrically connected. The electrometer had high sensitivity, enabling it to measure charge as small as 0.001 nC. Using this configuration we were able to measure the charge transferred from the spray to the wire mesh at injection pressures pressures of 2.1, 2.8, 4.1, and 8.3 bar.
III. Results and Discussion A. Image Data
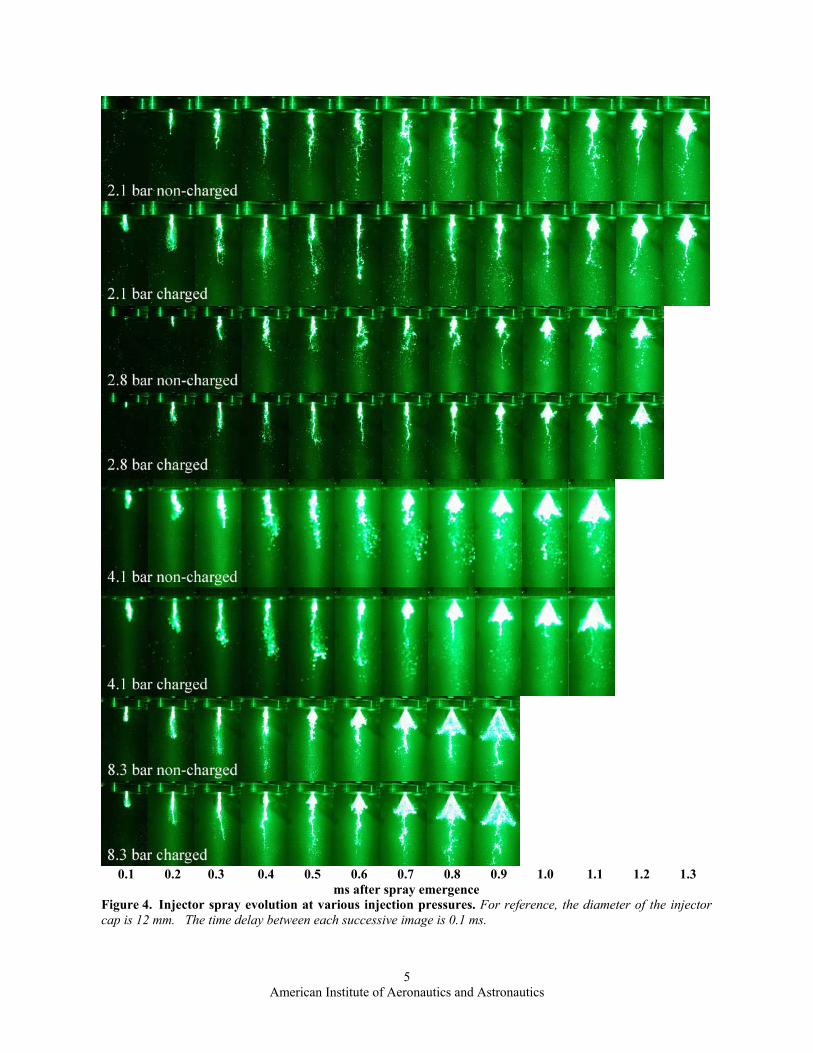
The time evolution of both electrostatically charged and non-charged sprays are shown in Fig. 4. Each image is one of 4 images taken with identical conditions and timing. The first two
Figure 1. Schematic of the experimental apparatus.
Figure 2. Modification of the injector tip.
Figure 3. Electric field strength below injector orfice. Electric field strength parallel to the injector axis is plotted versus tip angle for two different finite element meshesdescribed in the text, shown in squares and circles. Electric field strength increases with sharpening tip angle.
American Institute of Aeronautics and Astronautics
4
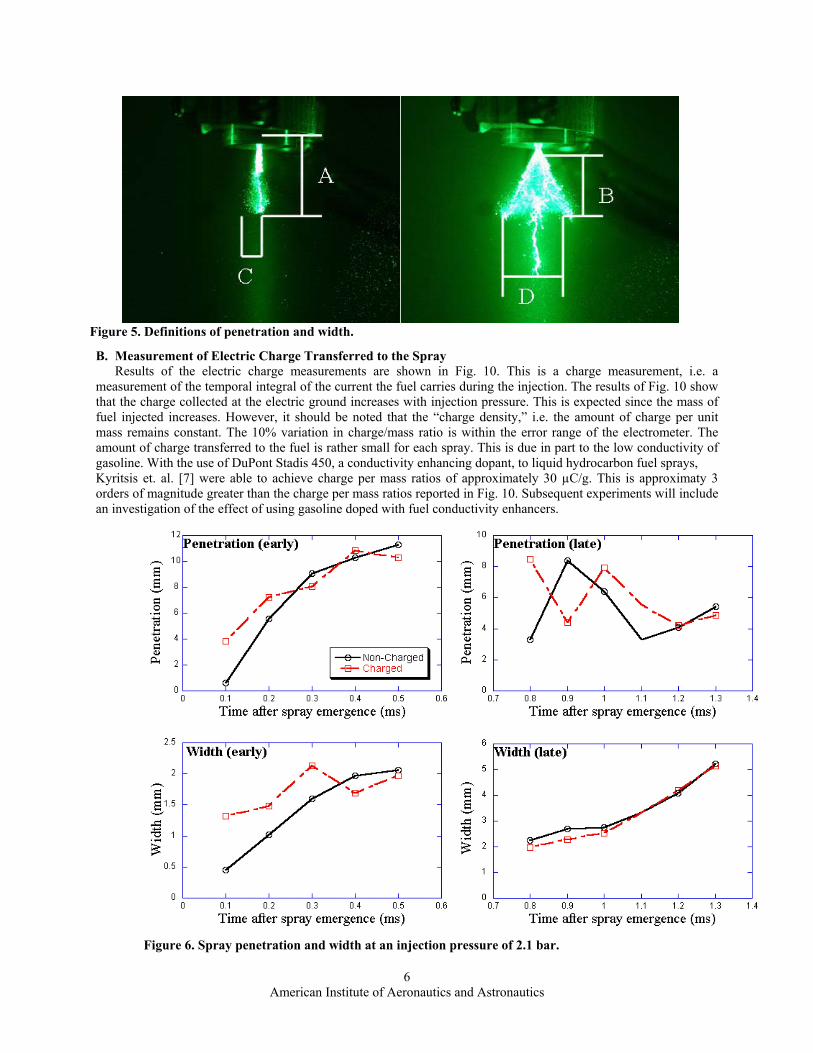
rows of images show the spray evolution at 2.1 bar injection pressure. The first row shows the non-charged spray and the second row shows the spray with 3 kV applied to the injector tip. The most significant difference between the two cases is during the first 0.3 ms of the spray evolution, when the electrostatically charged spray clearly shows greater penetration and width. During the transition to a well defined spray cone, differences are still apparent; the charged spray appears more coherent with fewer large, poorly atomized droplets. Once the cone is established, however, little difference is observed between the two sprays. The fact that atomization is facilitated early in the spray is significant because it is during the initial stages of the spray the fuel is most poorly atomized with typical fuel injectors. Similar trends are apparent at the higher pressure cases, but at 4.1 and 8.3 bar injection pressure the differences between the charged and non-charged are not very apparent. It is still apparent from the images, however, that the electrostatically charged spray has slightly greater penetration during the first 0.3 ms of the spray. It can be seen from these images that injection takes place in two clearly distinct phases. In what we define as “early” phase the spray has the appearance of an elongated stream of poorly atomized droplets, whereas in the “late” phase a spray cone develops. In practical injector operation, the early phase is undesirable and the early formation of the spray cone yields good quality of atomization. To define spray penetration, we used two different algorithms for each of these phases, since the spray topology was drastically different. The first step in both algorithms was to convert the color RGB images to grayscale. This generated images stored as arrays of integers ranging from 0 to 255 depending on the light intensity. Then the images were converted to a double array, where the intensity of each pixel was specified by a double ranging from 0 to 1. Next, all pixels brighter than a threshold intensity of .6 were reassigned an intensity of 1 and all other pixels were assigned an intensity of zero. All intensity 1 pixels not contiguous with a pixel directly below the injector tip were assigned an intensity of zero, in order to discard bright points resulting from scattering from dust particles or stray droplets away from the main spray.
After this step, the two algorithms differed. In the early phase, penetration was computed as the distance from the tip of the injector to the bright pixel furthest in the vertical direction from the injector tip, shown as “A” in Fig. 5. Width was calculated simply by taking the difference between the horizontal components of the left-most and right-most pixels, shown as “C” in Fig. 5. The algorithm used for the late phase of the injection calculated penetration as the distance between the injector tip and the vertical coordinate where the maximum width occurred, shown as “B”. A width w was calculated for each vertical coordinate in the spray image, and the actual spray width, shown as “D,” was computed as the maximum value of w along the spray. The results of these calculations are shown in Figs. 6-9. Each data point recorded in these plots is an average of calculations from 4 separate images taken at exactly the same conditions and the same time after the beginning of injection. Typical variations of penetration around the measured average are on the order of 10%. The apparently un-physical behavior of diminishing spray penetration with time for the early phase of the electrified spray, which is observed at all 4 injection pressures, deserves some discussion. Initially, both the charged and the non-charged sprays develop in their “early” phase. The electrostatically charged spray penetrates approximately 20-30% faster in the first 0.4 ms after injection, which is reasonable since the electrically charged droplets are attracted to the neutral hardware of the chamber. However, relatively early (at a time of approximately 0.4 ms) the electrified spray exhibits characteristics that make the algorithm used for penetration measurement at the early phase of injection fail. From Fig. 4, it can be seen that for the charged sprays, already at 0.4 ms, the sprays cannot be treated as a poorly atomized liquid column. The column has already broken up and the algorithm that deals with the late phase of the injection is invoked, which causes an apparent decrease in penetration. It should be stressed that this does not correspond to an actual recession of the spray but instead to the breakup of the spray into small droplets no longer contiguous with the main spray and therefore not recorded by the algorithm. The fact that application of electric fields appears to aid in fuel dispersion early in the spray is significant. Fuel injectors atomize the fuel fairly well once the injector pintle is fully open and the spray is established, but they still tend to produce large, poorly atomized droplets early in the injection. A first contribution of the use of electric fields could be improving the spray pattern during the opening of the injector pintle. Once the spray cones are established (1.0 ms and later, i.e. when both injections are in their late phase) the results indicate that the differences between the charged and non-charged sprays are less pronounced. It should be noted that this is valid for the particular chamber configuration for which the “grounded” parts of the hardware were located at distances on the order of several cm from the injector tip. The possibility of steering the electrified jet with appropriate location of the ground will be investigated in subsequent work. The images in Fig. 4 and the plots in Figs. 6, 7, 8, and 9 show that the effect of applying electric charge decreases with increasing injection pressure. As the inertial forces become larger, the electrostatic effects influence the sprays less.
American Institute of Aeronautics and Astronautics
5
0.1 0.2 0.3 0.4 0.5 0.6 0.7 0.8 0.9 1.0 1.1 1.2 1.3
ms after spray emergence Figure 4. Injector spray evolution at various injection pressures. For reference, the diameter of the injector cap is 12 mm. The time delay between each successive image is 0.1 ms.
American Institute of Aeronautics and Astronautics
6
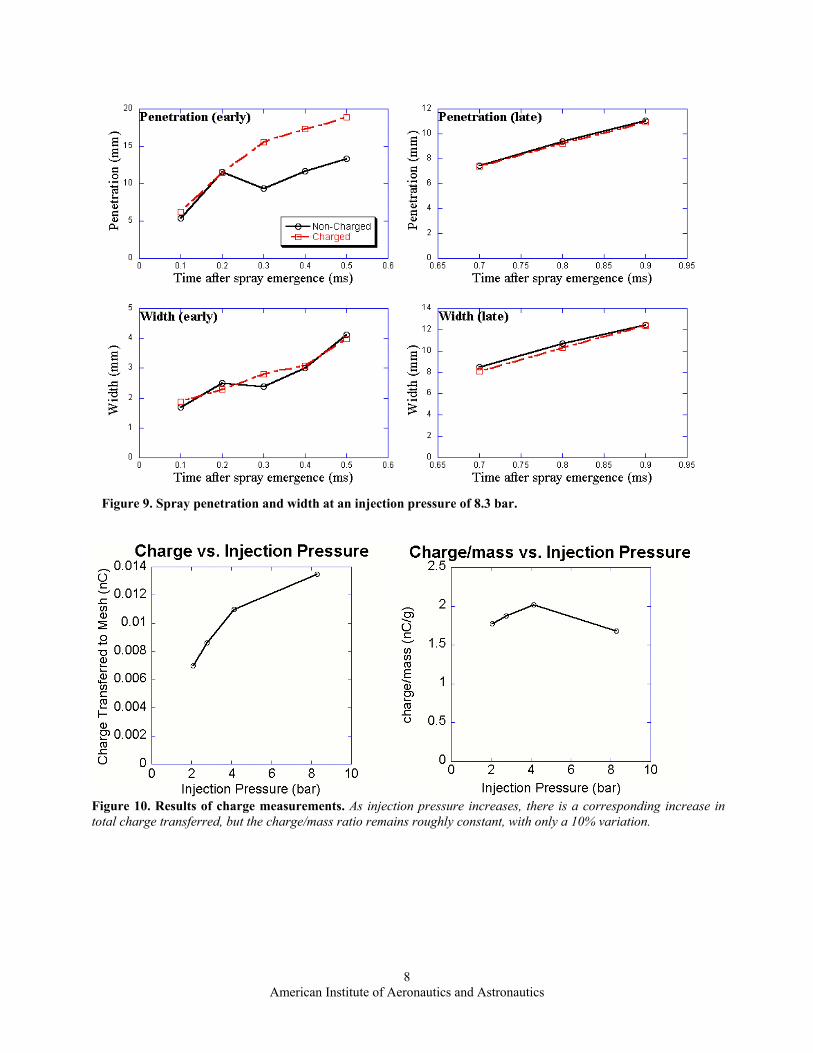
B. Measurement of Electric Charge Transferred to the Spray Results of the electric charge measurements are shown in Fig. 10. This is a charge measurement, i.e. a measurement of the temporal integral of the current the fuel carries during the injection. The results of Fig. 10 show that the charge collected at the electric ground increases with injection pressure. This is expected since the mass of fuel injected increases. However, it should be noted that the “charge density,” i.e. the amount of charge per unit mass remains constant. The 10% variation in charge/mass ratio is within the error range of the electrometer. The amount of charge transferred to the fuel is rather small for each spray. This is due in part to the low conductivity of gasoline. With the use of DuPont Stadis 450, a conductivity enhancing dopant, to liquid hydrocarbon fuel sprays, Kyritsis et. al. [7] were able to achieve charge per mass ratios of approximately 30 µC/g. This is approximaty 3 orders of magnitude greater than the charge per mass ratios reported in Fig. 10. Subsequent experiments will include an investigation of the effect of using gasoline doped with fuel conductivity enhancers.
Figure 5. Definitions of penetration and width.
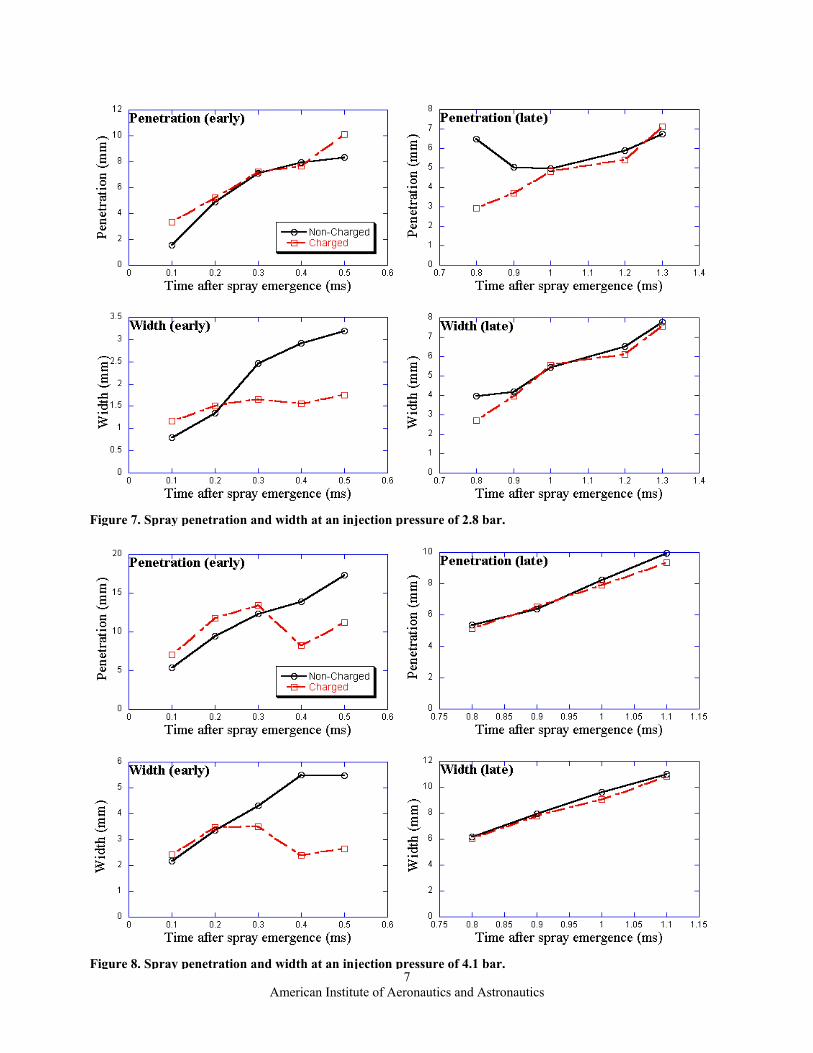
Figure 6. Spray penetration and width at an injection pressure of 2.1 bar.
American Institute of Aeronautics and Astronautics
7
Figure 8. Spray penetration and width at an injection pressure of 4.1 bar.
Figure 7. Spray penetration and width at an injection pressure of 2.8 bar.
American Institute of Aeronautics and Astronautics
8
Figure 10. Results of charge measurements. As injection pressure increases, there is a corresponding increase in total charge transferred, but the charge/mass ratio remains roughly constant, with only a 10% variation.
Figure 9. Spray penetration and width at an injection pressure of 8.3 bar.
American Institute of Aeronautics and Astronautics
9
IV. Conclusions Application of a high-voltage electrostatic field was shown to affect the early stages of gasoline injection from a commercially available GDI injector. The early phase of injection, when poorly atomized liquid emerges immediately following the opening of the injector pintle, was abbreviated and the formation of the hollow cone spray that is characteristic of proper injector operation was facilitated. In order to achieve effective charge transfer to the non-conducting fluid, it was necessary to modify the fuel injector by introducing a high-voltage application cap that featured a sharp edge and was appropriately aligned with the injector nozzle. Images of the sprays showed that the electrostatic charge had the greatest effect early in the spray, and at low injection pressures. These results have to be corroborated with Phase Doppler measurements. Currently, the charge transfer to the fuel is small (on the order of nC/g). Addition of conductivity enhancers and redesign of the charge induction apparatus will address this issue.
Acknowledgments Acknowledgement is made to the Donors of the American Chemical Society Petroleum Research Fund for support of this research (Grant # PRF 42287 – G9 – Dr. David L. Schutt, Acting Program Director).
References 1Thong, K. C., and Weinberg, F. J., “Electrical Control of the Combustion of Solid and Liquid Particulate Suspensions,”
Proceedings of the Royal Society of London, Vol. 324, 1971, pp. 201-215. 2Kim, K., and Turnbull, R. J., “Generation of Charged Drops of Insulating Liquids by Electrostatic Spraying,” Journal of
Applied Physics, Vol. 47, No. 5, May. 1976, pp. 1964-1969. 3Kelly, A. J., “The Electrostatic Atomization of Hydrocarbons,” Journal of the Institute of Energy, Vol. 57, 1984, pp. 312-
320. 4Tang, K. Q., and Gomez, A., “Monodisperse Electrosprays of Low Conductivity Liquids in the Cone-Jet Mode,” Journal of
Colloid and Interface Science, Vol. 184, No. 2, 25 Dec. 1996, pp. 500-511. 5Gomez, A., and Tang, K. Q., “Charge and Fission of Droplets in Electrostatic Sprays,” Physics of Fluids, Vol. 6, No. 1, Jan.
1994, pp. 404-414. 6Kyritsis, D. C., Guerrero-Arias, I., Roychoudhury, S., and Gomez, A. et. al., “Mesocale Power Generation by a Catalytic
Combustor Using Electrosprayed Liquid Hydrocarbons,” Proceedings of the Combustion Institute, Vol. 29, The Combustion Institute, 2002, pp. 965-972.
7Kyritsis, D. C., Roychoudhury, S., McEnally, C. S., Pfefferle, L. D., and Gomez, A. et. al., “Mesoscale Combustion: A First Step towards Liquid Fueled Batteries,” Experimental Thermal and Fluid Sciences, Vol. 28, 2004, pp. 763-770.
8Thomas, M. E., Di Salvo, R., and Makar, P., “Electrostatic Atomization Insertion into Compression Ignition Engines,” SAE Technical Paper 2002-01-3053.
9Bellan, J., and Harstad, K., “Dispersion (electrostatic/mechanical) and fuel properties effects on soot propensity in clusters of drops,” Atomization and Sprays, Vol. 8, No. 6, Nov.-Dec. 1998, pp. 601-624.
10Hetrick, R. E., and Parsons, M. H., “Electrospray for Fuel Injection,” SAE Technical Paper 972987. 11Shrimpton, J. S., “Pulsed Charged Sprays: Application to DISI Engines During Early Injection,” International Journal for
Numerical Methods in Engineering, Vol. 58, 2003, pp. 513-536.