Embed Size (px)
Citation preview

Expression Profiling and Comparative GenomicsIdentify a Conserved Regulatory Region ControllingMidline Expression in the Zebrafish EmbryoThomas Dickmeis,1,3 Charles Plessy,1 Sepand Rastegar,1 Pia Aanstad,2,4 Ralf Herwig,2
Frederic Chalmel,1 Nadine Fischer,1 and Uwe Strähle1,51Institut de Genetique et de Biologie Moleculaire et Cellulaire, CNRS/INSERM/ULP, BP 10142, F-67404 Illkirch Cedex,C.U. de Strasbourg, France; 2Max Planck Institut fur Molekulare Genetik, D-14195 Berlin (Dahlem), Germany
Differential gene transcription is a fundamental regulatory mechanism of biological systems during development,body homeostasis, and disease. Comparative genomics is believed to be a rapid means for the identification ofregulatory sequences in genomes. We tested this approach to identify regulatory sequences that control expressionin the midline of the zebrafish embryo. We first isolated a set of genes that are coexpressed in the midline of thezebrafish embryo during somitogenesis stages by gene array analysis and subsequent rescreens by in situhybridization. We subjected 45 of these genes to Compare and DotPlot analysis to detect conserved sequences innoncoding regions of orthologous loci in the zebrafish and Takifugu genomes. The regions of homology that werescored in nonconserved regions were inserted into expression vectors and tested for their regulatory activity bytransient transgenesis in the zebrafish embryo. We identified one conserved region from the connective tissue growthfactor gene (ctgf), which was able to drive expression in the midline of the embryo. This region shares sequencesimilarity with other floor plate/notochord-specific regulatory regions. Our results demonstrate that an unbiasedcomparative approach is a relevant method for the identification of tissue-specific cis-regulatory sequences in thezebrafish embryo.
[Supplemental material is available online at www.genome.org. The sequence data from this study have beensubmitted to GenBank under accession nos. AY428026–AY428035, CD777505–CD777543, and CD777544–CD778191.]
Differential gene transcription is essential for many developmen-tal processes and physiological responses. Moreover, evolution ofthe body plan is thought to have been driven to a large extent bychanges in gene expression, and differences in gene expressionare believed to determine disease risk (Davidson 2001; Ludwig2002 and references therein). A detailed knowledge of the cis-regulatory architecture of genomes is thus a central prerequisitefor a comprehensive understanding of many fundamental bio-logical processes and has also medical implications.
Despite enormous progress in our understanding of tran-scriptional regulation in vertebrates (Davidson 2001), we are notable to unequivocally predict the pattern and responsiveness ofexpression by mere sequence analysis of a gene. This is largelybecause of the structure and the scattered location of cis-regulatory regions in the huge vertebrate genomes (Davidson2001). In vertebrates, promoter regions are rarely sufficient todrive faithful gene transcription. Frequently, other regulatory re-gions contribute to the correct spatial and temporal expression ofgenes. These regions can be scattered over large distances in non-coding sequences, and they can be located upstream, down-stream, and in intronic regions (Davidson 2001). Regulatory re-gions are usually a composite of multiple transcription-factor-
binding sites. The small size and degenerate DNA sequence ofthese binding sites renders a genome-wide computational analy-sis very difficult as not only the binding sequence but also thecontext in which it is placed plays an important role. Delineationof the regulatory architecture of individual loci by reverse genet-ics and functional assays is tedious and costly. The elucidation ofthe cis-regulatory wiring of vertebrate genomes by conventionalassays will be a formidable task despite the fact that the genomesequences are available.
Comparison of genomes of related species was shown toprovide a possible shortcut in the identification of regulatoryregions as they form islands of partially conserved sequence innoncoding regions (Hardison 2000; Wasserman et al. 2000; Pen-nacchio and Rubin 2001). Within the vertebrate lineage, the te-leost genomes such as those of pufferfish (Takifugu rubripes),medaka (Oryzias latipes), and zebrafish (Danio rerio) representpromising tools to elucidate the regulatory architecture in mam-malian genomes as these genomes have significantly diverged toeliminate functionally irrelevant sequence identities (Aparicio etal. 1995; Muller et al. 2002).
Several studies reported conservation of regulatory se-quences in comparisons of mammalian and Takifugu loci (Apari-cio et al. 1995; Goode et al. 2003). Takifugu has a very small,compact genome (Aparicio and Brenner 1997). However,Takifugu cannot be maintained in a laboratory environment, pre-venting characterization of gene expression patterns and func-tional analysis of putative regulatory regions. In contrast,medaka and zebrafish allow large-scale expression profiling aswell as functional assessment of regulatory sequences by trans-genesis (Muller et al. 2002). Fast transient transgenic assays in thezebrafish allow scanning large genomic regions for regulatory
Present addresses: 3Max-Planck-Institut für Entwicklungsbiologie,Friedrich-Miescher-Laboratorium, D-72076 Tübingen, Germany;4Department of Biochemistry and Biophysics, University of Califor-nia–San Francisco, San Francisco, CA 94143-0448, USA.5Corresponding author.E-MAIL [email protected]; FAX 00 33 3 88 65 32 01.Article and publication are at http://www.genome.org/cgi/doi/10.1101/gr.1819204. Article published online before print in January 2004.
Letter
228 Genome Research 14:228–238 ©2004 by Cold Spring Harbor Laboratory Press ISSN 1088-9051/04; www.genome.orgwww.genome.org

activity very efficiently (Westerfield et al. 1992; Muller et al.1999). As in the Takifugu genome, regulatory regions appear to behighly conserved between zebrafish and mammals. For example,three of the five functionally mapped regulatory regions of thezebrafish Sonic hedgehog (shh) locus are structurally highly relatedin mouse and human shh, and four of the five regulatory regionsare conserved in zebrafish and Takifugu shh orthologs (Muller etal. 1999,2002;Goodeetal. 2003;R. Ertzer andU.Strähle,unpubl.).Also, the three functionally characterized regulatory regions ofthe neurogenin1 (ngn1) gene showed high similarity to the 5� non-coding region of the mammalian counterpart of ngn1 (Blader etal. 2003). The two enhancers residing in the noncoding se-quences between the two distalless genes dlx4 and dlx6 have also
highly related sequences in the mouse orthologs (Zerucha et al.2000). These regions of conservation are in the range of 100–400bp and have an overall sequence identity between 60% and 80%.Moreover, the orientation and relative position of these elementswith respect to one another and the coding sequence were re-tained, indicating a high selection pressure not only for the regu-latory sequences themselves but also for the position of the ele-ments within the locus. Several of these enhancers were tested bytransgenesis in zebrafish and mouse demonstrating conservedregulatory function (Muller et al. 1999, 2002; Zerucha et al.2000). Taken together, the results from the analysis of this albeitlimited number of genes indicate that the comparisons of thegenome of the zebrafish with that of other vertebrates also have
a high potential to elucidate the locationof regulatory regions.
Because the number of zebrafishgenes whose regulatory structure hasbeen analyzed in depth is rather small, itremains to be seen whether this highconservation of regulatory sequences ofteleost genomes is indeed a general phe-nomenon and can be exploited as arapid approach to elucidate the regula-tory structure of genomes. In fact, thereis evidence that regulatory sequences inzebrafish genes were not maintainedstructurally during evolution. The struc-ture of an enhancer that was mapped tothe second intron of the zebrafish net-rin1 gene and that mediates floor plateexpression in zebrafish has not beenconserved (Rastegar et al. 2002; data notshown). Similarly, a regulatory region inthe first intron of shh that drives expres-sion in the floor plate of zebrafish em-bryos is not conserved in the mamma-lian shh orthologs (Muller et al. 2002).
To assess the wider applicability ofcomparative approaches to the zebrafishgenome sequence, we carried out a sys-tematic search for homologies in non-conserved regions of the zebrafish andTakifugu loci and tested the regulatoryactivity of these regions by transienttransgenesis in the zebrafish. We chosethese two teleost genomes to carry outthe comparison as we expected a higheryield of conserved sequences within theteleost lineage. We first identified genesexpressed in the embryonic midlinecomprising the axial mesoderm, noto-chord, and prechordal plate. In additionto providing mechanical support, thesemidline structures have important regu-latory activity that controls cell differen-tiation in the adjacent neural tube, en-doderm, and somites (Pourquie et al.1993; Placzek 1995; Tanabe and Jessell1996). We characterized 152 genes thatfall into diverse functional groups, rang-ing from genes involved in signaling,transcriptional regulation, cytoarchitec-ture, and cell metabolism. Among these,we identified 85 genes that are specifi-cally expressed in the midline. In thecompared 45 genes, we found 18 con-
Figure 1 Strategy to enrich for midline genes. Transgenic embryos carrying the –2.2shh:gfpABC (left)or the –8.4ngn1:gfp transgene (right) were dissociated, and GFP-positive cells were sorted with afluorescence-activated cell sorter. cDNA was prepared from GFP-positive cells and subtracted crosswisebefore analysis of subclones and microarray hybridization. The complex probe S is enriched for midlinespecific genes, whereas the reverse subtraction (probe N) serves as a hybridization control.
Midline Expression in the Zebrafish Embryo
Genome Research 229www.genome.org

served noncoding regions. One homology from the connectivetissue growth factor (ctgf) gene drove expression in the midline ininjected zebrafish embryos. We demonstrate here that this ap-proach in the zebrafish does allow isolation of regulatory regions.Comparisons of the ctgf region with midline enhancers, whichwere identified previously, revealed several short sequencestretches, indicating shared protein-binding sites.
RESULTS
Preparation of a Complex Probe From Midline CellsTo isolate a representative set of genes expressed in the midline ofzebrafish embryos, we used a subtraction strategy that was pre-viously used to identify genes acting downstream from Nodalsignals in the gastrula (Dickmeis et al. 2001a). This approachentails several steps of enrichment and selection to minimize thescale of the final screening by in situ hybridization (Fig. 1). Weused transgenic embryos that express the green fluorescent protein(gfp) gene under control of the regulatory elements of the shhgene (Albert et al. 2003). At the 6–10-somite stage, these trans-genic embryos express the gfp reporter gene in the notochord, theprechordal plate, and in the ventral midline of the neural platecomprising the prospective floor plate and hypothalamus (Fig.
1). Several hundred shh:gfp embryos were dissociated into singlecells at the 6–10-somite stage, and GFP-positive cells were en-riched with a fluorescence-activated cell sorter (FACS). As a sec-ond further enrichment, we carried out a cDNA subtraction usingcDNA prepared from the shh:gfp cells as tester cDNA. The drivercDNA was prepared from the GFP-positive cells sorted from asecond transgenic line that expressed GFP under control of thengn1 gene (-8.4ngn1:gfp; Blader et al. 2003). GFP marks primaryneurons and is also weakly detectable in the epidermis of theseembryos at the 6–10-somite stage (Fig. 1). The forward subtrac-tion (S) of the two cDNA pools normalized the abundance oftranscripts and enriched midline-specific genes (Fig. 1). The re-verse subtraction (N) was carried out as a control.
As a first assessment of the distribution of cDNAs in the tworesulting probe pools, S and N, we performed Southern blotanalysis with a series of genes whose expression patterns areknown (Fig. 2A). The pool S that was expected to contain genesexpressed in the midline hybridized strongly to cDNAs such asone-eyed pinhead (oep), no tail (ntl), floating head (flh), collagen 2�1,and forkhead4 (fkd4) that are expressed in the midline of thezebrafish embryo (Schulte-Merker et al. 1992; Talbot et al. 1995;Yan et al. 1995; Odenthal and Nusslein-Volhard 1998; Gritsmanet al. 1999). Much weaker or no signals were detected with probes
that are derived from genes expressedpredominantly in the neuroectodermsuch as pax2a (Krauss et al. 1991), elav(Kim et al. 1996), msxB (Ekker et al.1997), deltaA (dla), and deltaD (dld)(Haddon et al. 1998). The reverse patternof hybridization signals was obtainedwhen the probe pool N was hybridized:The neuroectoderm-specific cDNAs hy-bridized strongly, whereas the midlinegenes gave rise to only weak signals (Fig.2A, bottom row, N). These results indi-cate that the subtraction resulted in theanticipated enrichment of genes. As asecond evaluation, cDNA fragmentsfrom the S pool were subcloned and 37fragments were sequenced (GenBank Ac-cession numbers CD777505–CD777543).These 37 clones corresponded to 33genes, indicating a low level of redun-dancy in the complex probe. Next, insitu hybridization was carried out toassess the tissue-specific expression ofindividual S clones. Of the clones, 40%were expressed in midline tissues in-cluding the prechordal plate-derivedhatching glands (Fig. 2B–G; data notshown). Taken together, these tests indi-cate that the subtraction successfully en-riched clones that are expressed in themidline.
Macroarray AnalysisAs a next step, the S and N probes werehybridized to a macroarray containing25,102 cDNAs from 24-h-old whole em-bryos and adult liver cDNA (MPMGp609;Clark et al. 2001). This library contains aminimally redundant clone set derivedfrom initially 75,000 clones by normal-ization with oligonucleotide fingerprint-ing (Clark et al. 1999). Hybridizationswith the two complex probes were car-
Figure 2 Assessment of S and N probes. (A) Southern blot analysis of subtracted probe pools. (S)Forward subtraction (shh:gfp vs. ngn1:gfp line); (N) reverse subtraction (ngn1:gfp vs. shh:gfp line).Blotted cDNAs are oep (one-eyed pinhead), ntl (no tail), fkd4, (forkhead 4), col2a1 (collagen type II �-1),flh (floating head), pax2b, msxb, elav, dla (�A), dld (�D). (B–G) Expression pattern of clones of the Ssubtraction. (B) Clone s1h9, zebrafish EST fc02c07.y1, shows expression in the notochord and the tailbud (arrowhead). (C) Clone s2a5, zebrafish EST fm63h08.x1, is expressed in the notochord, butexcluded from the tail bud (arrowhead). (D) Clone s2b4 is expressed in the notochord (arrowhead). (E)Clone s2c1, procollagen C-terminal enhancer protein 2, is expressed in the notochord and the edge ofthe lateral plate mesoderm (white arrowhead). (F) Clone s2c8, apolipoprotein H, shows expression inthe notochord and the adaxial edge of the somites (arrow). (G) Clone s2d6, zebrafish EST fm91b12.x1,is expressed in the notochord and both the edge of the lateral plate mesoderm (arrowhead) and theadaxial part of the somites (arrow). (B–D) Lateral view, dorsal right; (E–G) dorsal view, anterior up.
Dickmeis et al.
230 Genome Researchwww.genome.org
ried out in triplicate to membranes with two distinct arrange-ments of spotted clones. The resulting signals were averaged, andthe differential intensity of each signal was calculated. A total of662 cDNAs with a 1.8-fold or higher representation in the hy-bridizations with the S probe in comparison to the N probe werechosen for further analysis. The cDNAs were sequenced (Gen-Bank accession numbers CD777544–CD778191), and the subse-quent BLAST analysis revealed that 487 clones represented 152genes with homologs in the protein database and that 93 cloneswere without such homologs. On average, every gene was repre-sented 3.2 times in the set of 487 clones that yielded homologyscores in the databases. Large differences in abundance of clonesrepresenting the same gene existed, with cathepsin l being thebiggest cluster (55 clones) and 78 genes being represented onlyby one clone.
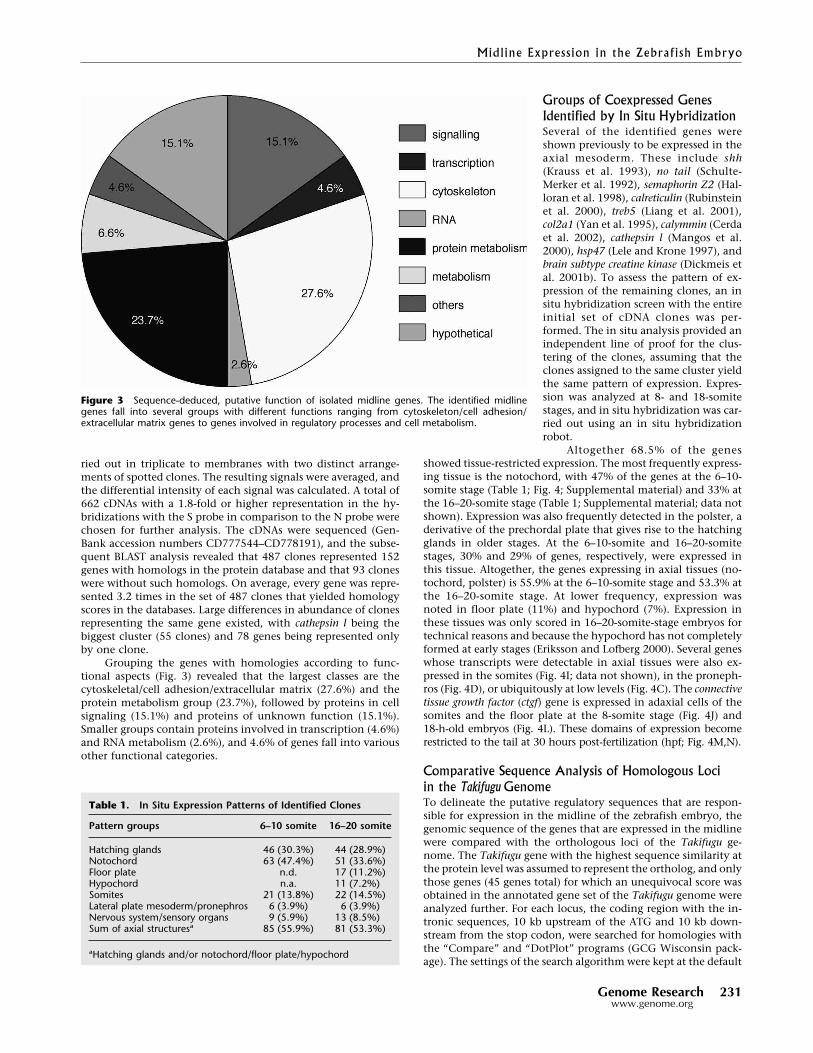
Grouping the genes with homologies according to func-tional aspects (Fig. 3) revealed that the largest classes are thecytoskeletal/cell adhesion/extracellular matrix (27.6%) and theprotein metabolism group (23.7%), followed by proteins in cellsignaling (15.1%) and proteins of unknown function (15.1%).Smaller groups contain proteins involved in transcription (4.6%)and RNA metabolism (2.6%), and 4.6% of genes fall into variousother functional categories.
Groups of Coexpressed GenesIdentified by In Situ HybridizationSeveral of the identified genes wereshown previously to be expressed in theaxial mesoderm. These include shh(Krauss et al. 1993), no tail (Schulte-Merker et al. 1992), semaphorin Z2 (Hal-loran et al. 1998), calreticulin (Rubinsteinet al. 2000), treb5 (Liang et al. 2001),col2a1 (Yan et al. 1995), calymmin (Cerdaet al. 2002), cathepsin l (Mangos et al.2000), hsp47 (Lele and Krone 1997), andbrain subtype creatine kinase (Dickmeis etal. 2001b). To assess the pattern of ex-pression of the remaining clones, an insitu hybridization screen with the entireinitial set of cDNA clones was per-formed. The in situ analysis provided anindependent line of proof for the clus-tering of the clones, assuming that theclones assigned to the same cluster yieldthe same pattern of expression. Expres-sion was analyzed at 8- and 18-somitestages, and in situ hybridization was car-ried out using an in situ hybridizationrobot.
Altogether 68.5% of the genesshowed tissue-restricted expression. The most frequently express-ing tissue is the notochord, with 47% of the genes at the 6–10-somite stage (Table 1; Fig. 4; Supplemental material) and 33% atthe 16–20-somite stage (Table 1; Supplemental material; data notshown). Expression was also frequently detected in the polster, aderivative of the prechordal plate that gives rise to the hatchingglands in older stages. At the 6–10-somite and 16–20-somitestages, 30% and 29% of genes, respectively, were expressed inthis tissue. Altogether, the genes expressing in axial tissues (no-tochord, polster) is 55.9% at the 6–10-somite stage and 53.3% atthe 16–20-somite stage. At lower frequency, expression wasnoted in floor plate (11%) and hypochord (7%). Expression inthese tissues was only scored in 16–20-somite-stage embryos fortechnical reasons and because the hypochord has not completelyformed at early stages (Eriksson and Lofberg 2000). Several geneswhose transcripts were detectable in axial tissues were also ex-pressed in the somites (Fig. 4I; data not shown), in the proneph-ros (Fig. 4D), or ubiquitously at low levels (Fig. 4C). The connectivetissue growth factor (ctgf) gene is expressed in adaxial cells of thesomites and the floor plate at the 8-somite stage (Fig. 4J) and18-h-old embryos (Fig. 4L). These domains of expression becomerestricted to the tail at 30 hours post-fertilization (hpf; Fig. 4M,N).
Comparative Sequence Analysis of Homologous Lociin the Takifugu GenomeTo delineate the putative regulatory sequences that are respon-sible for expression in the midline of the zebrafish embryo, thegenomic sequence of the genes that are expressed in the midlinewere compared with the orthologous loci of the Takifugu ge-nome. The Takifugu gene with the highest sequence similarity atthe protein level was assumed to represent the ortholog, and onlythose genes (45 genes total) for which an unequivocal score wasobtained in the annotated gene set of the Takifugu genome wereanalyzed further. For each locus, the coding region with the in-tronic sequences, 10 kb upstream of the ATG and 10 kb down-stream from the stop codon, were searched for homologies withthe “Compare” and “DotPlot” programs (GCG Wisconsin pack-age). The settings of the search algorithm were kept at the default
Table 1. In Situ Expression Patterns of Identified Clones
Pattern groups 6–10 somite 16–20 somite
Hatching glands 46 (30.3%) 44 (28.9%)Notochord 63 (47.4%) 51 (33.6%)Floor plate n.d. 17 (11.2%)Hypochord n.a. 11 (7.2%)Somites 21 (13.8%) 22 (14.5%)Lateral plate mesoderm/pronephros 6 (3.9%) 6 (3.9%)Nervous system/sensory organs 9 (5.9%) 13 (8.5%)Sum of axial structuresa 85 (55.9%) 81 (53.3%)
aHatching glands and/or notochord/floor plate/hypochord
Figure 3 Sequence-deduced, putative function of isolated midline genes. The identified midlinegenes fall into several groups with different functions ranging from cytoskeleton/cell adhesion/extracellular matrix genes to genes involved in regulatory processes and cell metabolism.
Midline Expression in the Zebrafish Embryo
Genome Research 231www.genome.org

values, which allowed scoring the regulatory sequences of thezebrafish ngn1 (Blader et al. 2003) and shh genes (Muller et al.1999, 2000; Albert et al. 2003). Among 45 pairwise comparisons,18 homologies were detected in the noncoding regions of 10genes (Fig. 5; Table 2). The size of these regions varied from ∼75to 680 bp, and the degree of similarity ranged from 63.9% to88.9% (Table 2). The positions of the regions of homology werefound upstream and downstream of the coding regions (Fig. 5).
Functional Analysis of IdentifiedHomology Regions
To test whether these regions of homol-ogy mediate gene expression in the ze-brafish embryo, we inserted PCR frag-ments spanning the regions of homol-ogy downstream from a reporter genecomprising the Herpes simplex virus thy-midine kinase TATA-box directing expres-sion of a green fluorescent reporter (gfp)gene (Rastegar et al. 2002). This expres-sion vector works well in transient ex-pression experiments and has a very lowbasal activity without inserted addi-tional regulatory sequences (Rastegar etal. 2002). We inserted conserved frag-ments also downstream from annetrin1:gfp reporter gene. The promoterof the netrin1 gene is weakly active in theneural tube of the zebrafish and wasused previously to map the regulatorysequences of the netrin1 locus (Rastegaret al. 2002).
The activity of the homology re-gions was tested by a transient expres-sion protocol (Westerfield et al. 1992;Muller et al. 1999; Rastegar et al. 2002).This protocol provides a fast means toidentify sequences with a regulatory po-tential in the midline of the zebrafishembryo, even though the reporter ex-pression in the G0 embryos is highly mo-saic. We analyzed 10 homologies down-stream from the netrin1 and/or tk pro-moters in 24-h-old embryos (Table 2).The homology region up1 from the ctgfgene drove expression of the tk:gfp re-porter in notochord and floor plate cells(18%, n = 85; Fig. 6B). It was less efficientdownstream from the netrin1 expressionsystem (data not shown). The floor plateactivity matches the expression pattern ofthe endogenous ctgf gene (Fig. 4J–N), in-dicating that this region is a bona fide cis-regulator of the endogenous ctgf gene.However, we did not detect expression ofthe endogenous ctgf gene in the noto-chord. This implies that a repressor ele-ment, which prevents expression in thenotochord, is missing in our constructs.
The up1 homology of the ctgf geneis located immediately upstream of andoverlaps with the first exon of the gene.This indicates that this region comprisesthe promoter of the gene. In agreement,a well-conserved TATA-box is located 69bp upstream of the reported 5�-end of
the mRNA (Fig. 6A). We thus inserted this region upstream of thegfp reporter gene in place of the netrin1 or tk promoters. Wedetected strong expression in the notochord (41%, n = 100) andfloor plate (31%, n = 100) of 24-h-old embryos injected with thectgf:gfp construct (Fig. 6C). These results indicate that the up1region includes the promoter of the ctgf gene. This region seemsto function, however, also as an enhancer because it can also actin a downstream position.
Figure 4 Representative RNA expression patterns of identified midline genes. (A) transducer of erbB-21 (Tob1). (B) septin6. (C) adenylate kinase 3 � like 1 (AK3). (D) CD151/tetraspanin (CD151). (E) septin7.(F) annexin II. (G) Homolog of the medaka hatching enzyme ehe 13. (H) annexin IV. (I) prolyl-4-hydroxylase. (J–N) connective tissue growth factor (ctgf). (A–G,I,J) Eight-somite-stage embryos; (H,L,N)16–18-somite-stage embryos. Orientation of embryos is anterior up, dorsal view (A–G,I,J). Scale bar: 50µm (A–G,J,L); 25 µm (H,K,M,N). (ad) Adaxial cells; (f) floor plate; (h) hatching gland; (hy) hypochord;(n) notochord; (pr) pronephros; (s) somites.
Dickmeis et al.
232 Genome Researchwww.genome.org

Figure5
Resultsfrom
DotPlotsearchesforhomologousnoncodingsequencesbycomparisonofzebrafishandTakifuguorthologs.Theconservedcodingregions(blackboxes)andthepositionof
homologousnoncodingsequenceblocks(coloredboxes)areillustrated.Thegenesareorientedwiththe5�-endtotheleft.Theregion
up1ofthectgfgenethatdrivesexpressioninthemidlinewhen
insertedinreporterconstructsishighlightedingreen.
Midline Expression in the Zebrafish Embryo
Genome Research 233www.genome.org

The other homology regions tested did not yield significantexpression in injected embryos (Table 2; data not shown). Eitherthese regions do not have transcription regulatory activity in the24-h-old embryo or they are not active in the specific context ofour reporter constructs as they are, for example, repressor ele-ments. It is also possible that they have functions other thantranscription regulation (Glazko et al. 2003; Mistry et al. 2003).
The Regulatory Region of the ctgf Gene SharesHomology With Other FloorPlate/Notochord EnhancersWe searched the ctgf up1 region for potential binding sites ofknown regulators of midline development (Rastegar et al. 2002).We found an FoxA2 (Axial, HNF3�) binding site (Transfac data-base) at position �121, which is, like the TATA-box, highly con-served between the Takifugu and zebrafish ctgf sequences.
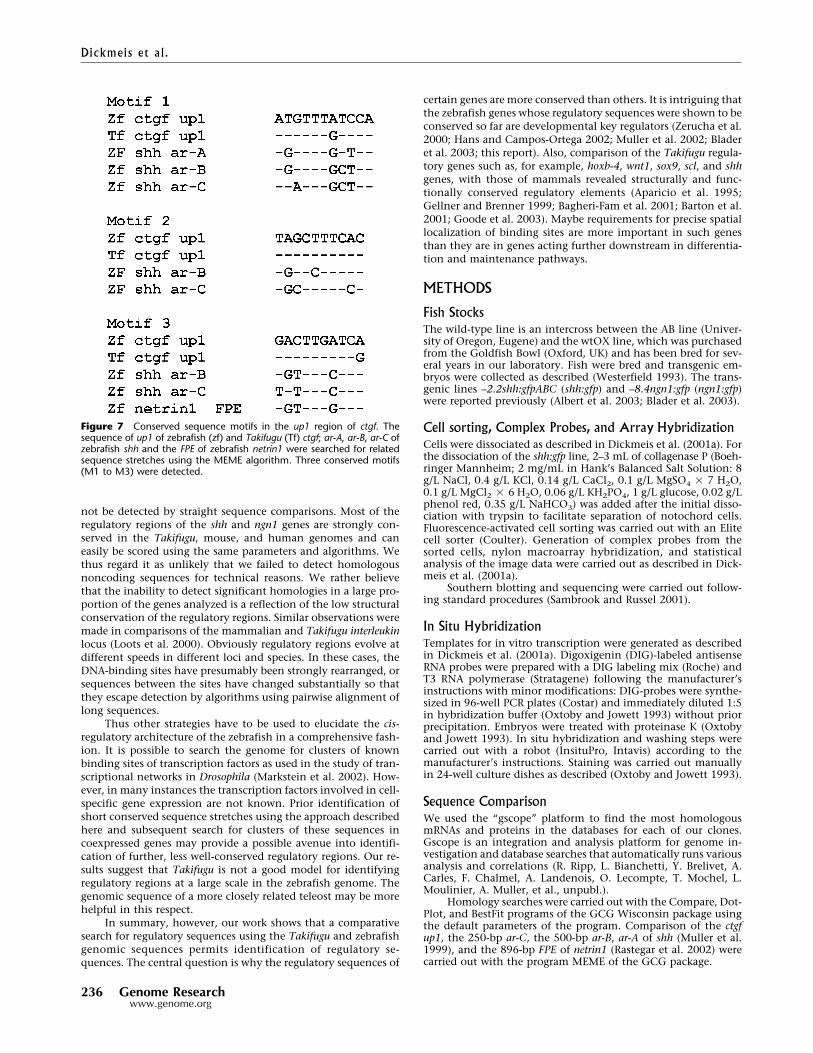
It can be assumed that genes with similar expression profilesuse similar sets of regulatory factors. Several regulatory regionswith activity in the floor plate or notochord were previouslyidentified in the zebrafish shh and netrin1 genes (Muller et al.1999; Rastegar et al. 2002; Albert et al. 2003). We compared thesequence of the ctgf up1 region with the floor plate/notochordenhancers ar-A, ar-B, and ar-C of the shh, and the FPE of thenetrin1 gene (Figs. 6A and 7). A conserved motif (M1) is located atthe position of the putative HNF3�-binding site. Related se-quences were found in all three shh enhancers (Fig. 7). In par-ticular, the homology to M1 resides in a region (subregion H1) ofar-C that is necessary for function (Muller et al. 2002; F. Müllerand U. Strähle, unpubl.). Two other sequence stretches (M2 andM3) in ctgf up1 were found in the shh and netrin enhancers. Thelatter has similarity with the M1 motif.
DISCUSSIONHere we have tested the applicability of the zebrafish genome incomparative searches for cis-regulatory elements. We identified85 genes that are expressed in midline tissues comprising noto-chord, prechordal plate, and floor plate. In a second step, we usedthe previously observed conservation of regulatory regions be-tween orthologous loci in zebrafish and Takifugu. This approachwas appealing as it has the advantage of yielding an enrichmentof regulatory sequences over predicted nonfunctional sequencesand was expected to facilitate detection of shared transcription-
factor-binding sites. In a search of 45genes expressed in the midline, wefound 10 genes with significant homolo-gies. One of these conserved regions di-rected gene expression in the midline ofthe zebrafish embryo. Our results dem-onstrate that the unbiased approach ofcomparing between orthologous loci ofthe zebrafish and Takifugu genomes canyield regulatory elements.
The Embryonic Midline ExpressesCollagens andCollagen-Processing EnzymesThe zebrafish midline depends on theactivity of Nodal signals (Feldman et al.1998). We have previously carried out ascreen for Nodal-dependent genes at theearly gastrula stage (Dickmeis et al.2001a). At this early stage, the embry-onic fate of blastomeres is induced butnot irreversibly determined as hetero-topic transplantation can reprogram cell
fate according to the new location (Ho and Kimmel 1993). Incontrast, many cells including the cells of the body axis havebecome committed to a cell fate irreversibly by the 6–10-somitestage. When one compares the distribution of the gene functionsin the two screens, several important changes can be noted thatreflect this commitment to a differentiated state. Whereas therelative number of genes involved in transcription regulationdecreased by 5.7-fold, the abundance of genes with a role in thecytoskeleton, cell adhesion, and extracellular matrix increased2.5-fold in the somitogenesis gene set. Similarly, genes involvedin protein metabolism are twice as abundant in the midline ofthe 6–10-somite stage embryos in comparison with early gastrulaembryos expressing the constitutively active form of the Nodalreceptor TARAM-A (Fig. 3; Dickmeis et al. 2001a). Genes with aputative function in cell communication were equally abundantin both screens.
When examined for specific biochemical pathways, severalcollagens (col1a1,col2a1, col5a1, col9a1, col9a2, col9a3, andcol11a1) and collagen-processing enzymes were detected in thesomitogenesis but not in the gastrula stage screen. The processinggenes include procollagen-lysine; 2-oxoglutarate 5-dioxygenase 1;prolyl-4-hydroxylase; the peptidyl-prolyl isomerase; fk506 bindingprotein; and the heat-shock proteins hsp47 and glucose regulatedprotein 78 (grp78). The abundance of these enzymes in the mid-line is likely to reflect the mechanical support function of thenotochord for the early embryo.
The Promoter Region of the ctgf Gene Controls FloorPlate and Notochord ExpressionThe ctgf gene encodes a secreted protein, which is a member ofthe CCN family (Brigstock et al. 2003). Knockout mice exhibitskeletal dysmorphisms and have reduced cell proliferation, ex-tracellular matrix remodeling, and impaired angiogenesis duringchondrogenesis (Ivkovic et al. 2003). CTGF was implicated as amodulator of TGF� signaling (Abreu et al. 2002). It inhibits theactivity of BMP signals and can enhance signalling by low levelsof TGF-�1. In this respect, expression of zebrafish ctgf in the floorplate is intriguing as the differentiation of the floor plate in ze-brafish depends on the TGF� related Nodal factor Cyclops (Re-bagliati et al. 1998; Sampath et al. 1998; Muller et al. 2000).Moreover, BMPs are known inhibitors of floor plate differentia-
Table 2. Summary of Transient Analysis of Conserved Noncoding Sequences
GeneHomologyregion
% identity(length in base pairs) Tested Vector Expression
Hsp47 Upstream 72.1% (87) + Net/TK �Trebf Upstream 69.4% (89) + Net/TK �
3�-UTR 69.3% (405) + Net/TK �47L13 Upstream 74.7% (82) + Net/TK �TOB1 Upstream 78.4% (125) + Net/TK �
Downstream 88.9% (228) � � �
CTGF Upstream 1 63.9% (680) + Net/TKNotochord/floor plate
Upstream 2 66.5% (252) + Net/TK �Downstream 76.9% (313) � � �
Septin 6 Downstream 1 71.9% (95) + Net �Downstream 2 74.0% (102) � � �Downstream 3 79.6% (102) � � �Downstream 4 82.9% (82) � � �Downstream 5 67.7% (291) + Net �
SPARC Downstream 65.1% (171) � � �Trap� Downstream 88.0% (75) + Net �Adenylate Kinase 3 Downstream 65.2% (121) � � �GRP78 Upstream 73.0% (165) � � �
Dickmeis et al.
234 Genome Researchwww.genome.org

tion (Liem et al. 1995). ctgf may thus play also a crucial role in thedifferentiation of this structure.
The conserved up1 region confers notochord and floor plateexpression to the tk:gfp reporter gene. The region overlaps withthe first exon of the ctgf gene and is thus likely to represent thepromoter of this gene. In agreement, it harbors a conservedTATA-box 69 bp upstream of the 5�-end of the isolated ctgf cDNAand is able to direct expression of gfp from ctgf:gfp constructs. Therelated region of human ctgf directs expression in tissue culturecells (Eguchi et al. 2001), providing further support for the no-tion that up1 has promoter activity. However, our results indicatethat it can also act at a distance, as it directed midline expressionof the Tk promoter when inserted downstream of the reportertranscription unit.
The endogenous ctgf gene is not expressed at detectable lev-
els in the notochord. This expression inthe notochord in the transient expres-sion assays used here appears thus to bean ectopic activity of the up1 region.This has previously been noted also forthe promoter region of the tiggywinklehedgehog (twhh) gene (Du et al. 1997).Like ctgf, twhh mRNA is present in thefloor plate of zebrafish embryos. How-ever, when the twhh promoter was in-serted upstream of a reporter gene, alsonotochord expression was observed.This indicates that repressor elementsare a common feature of floor plategenes and function to prevent noto-chord expression. These are predicted tobe absent from the up1 fragment.
Several features in the up1 fragmentare shared with previously identified no-tochord/floor plate enhancers. Motif1overlaps with an FoxA2/HNF3�/AxialDNA-binding site (Strähle et al. 1993;Chang et al. 1997). Knockdown ofFoxA2 by antisense morpholinos abol-ishes floor plate differentiation, indicat-ing a crucial role of FoxA2 in floor platedevelopment in the zebrafish (Rastegaret al. 2002). The fact that FoxA2 sites arepresent in floor plate enhancers of shh(Chang et al. 1997; Müller et al. 1999),netrin1 (Rastegar et al. 2002), and ctgf in-dicates that FoxA2 is involved in thecontrol of medial floor plate genes ingeneral. It is, however, unlikely to be suf-ficient for the control of these genes(Strähle et al. 1996). The other conservedsequence stretches may bind additionalfactors that cooperate with FoxA2.
Zebrafish/Takifugu LocusComparisons Permit Detectionof Regulatory ElementsWe reasoned that comparisons withinthe teleost lineage would be a most effi-cient way to detect conserved regulatoryelements. Zebrafish and Takifugu areseparated by only 100 million years ofindependent evolution, whereas 400–450 million years elapsed since the lastcommon ancestor of fish and mammals.
Ten genes from the tested 45 genes showed at least one homol-ogy, and one homology (of 10 tested homologies from eightgenes) was functional in our assay system. Our transient testsystem may have failed to detect regulatory activity in particularin the case of repressors or regulatory regions that function onlyin the context of other sequences in the locus of origin. Con-served regions can also represent sequences that are involved inother processes such as, for example, replication or matrix at-tachment.
The frequency with which we detected homologous se-quences is lower than expected from the previous analysis of asmall sample of zebrafish genes (Zerucha et al. 2000; Hans andCampos-Ortega 2002; Muller et al. 2002; Blader et al. 2003). Theregulatory sequences in at least 35/45 genes have evolved in theTakifugu and zebrafish genomes to such an extent that they can-
Figure 6 The up1 homology of the ctgf gene mediates midline expression in the zebrafish. (A)Comparison of the up1 homology from the Takifugu and the zebrafish ctgf gene. A putative TATA boxand the end of the zebrafish ctgf cDNA are indicated. Underlined sequences represent three regions(M1 to M3) partially conserved in the floor plate/notochord enhancers ar-A, ar-B, and ar-C of shh andthe FPE of netrin1. H indicates a putative FoxA2/Axial/HNF3� binding site. (B) Transient transgenicembryo expressing GFP under control of the up1 region from the tk:gfp cassette. (C) Transient trans-genic embryo expressing GFP from the ctgf:gfp transgene. (f) Floor plate; (n) notochord.
Midline Expression in the Zebrafish Embryo
Genome Research 235www.genome.org
not be detected by straight sequence comparisons. Most of theregulatory regions of the shh and ngn1 genes are strongly con-served in the Takifugu, mouse, and human genomes and caneasily be scored using the same parameters and algorithms. Wethus regard it as unlikely that we failed to detect homologousnoncoding sequences for technical reasons. We rather believethat the inability to detect significant homologies in a large pro-portion of the genes analyzed is a reflection of the low structuralconservation of the regulatory regions. Similar observations weremade in comparisons of the mammalian and Takifugu interleukinlocus (Loots et al. 2000). Obviously regulatory regions evolve atdifferent speeds in different loci and species. In these cases, theDNA-binding sites have presumably been strongly rearranged, orsequences between the sites have changed substantially so thatthey escape detection by algorithms using pairwise alignment oflong sequences.
Thus other strategies have to be used to elucidate the cis-regulatory architecture of the zebrafish in a comprehensive fash-ion. It is possible to search the genome for clusters of knownbinding sites of transcription factors as used in the study of tran-scriptional networks in Drosophila (Markstein et al. 2002). How-ever, in many instances the transcription factors involved in cell-specific gene expression are not known. Prior identification ofshort conserved sequence stretches using the approach describedhere and subsequent search for clusters of these sequences incoexpressed genes may provide a possible avenue into identifi-cation of further, less well-conserved regulatory regions. Our re-sults suggest that Takifugu is not a good model for identifyingregulatory regions at a large scale in the zebrafish genome. Thegenomic sequence of a more closely related teleost may be morehelpful in this respect.
In summary, however, our work shows that a comparativesearch for regulatory sequences using the Takifugu and zebrafishgenomic sequences permits identification of regulatory se-quences. The central question is why the regulatory sequences of
certain genes are more conserved than others. It is intriguing thatthe zebrafish genes whose regulatory sequences were shown to beconserved so far are developmental key regulators (Zerucha et al.2000; Hans and Campos-Ortega 2002; Muller et al. 2002; Bladeret al. 2003; this report). Also, comparison of the Takifugu regula-tory genes such as, for example, hoxb-4, wnt1, sox9, scl, and shhgenes, with those of mammals revealed structurally and func-tionally conserved regulatory elements (Aparicio et al. 1995;Gellner and Brenner 1999; Bagheri-Fam et al. 2001; Barton et al.2001; Goode et al. 2003). Maybe requirements for precise spatiallocalization of binding sites are more important in such genesthan they are in genes acting further downstream in differentia-tion and maintenance pathways.
METHODS
Fish StocksThe wild-type line is an intercross between the AB line (Univer-sity of Oregon, Eugene) and the wtOX line, which was purchasedfrom the Goldfish Bowl (Oxford, UK) and has been bred for sev-eral years in our laboratory. Fish were bred and transgenic em-bryos were collected as described (Westerfield 1993). The trans-genic lines –2.2shh:gfpABC (shh:gfp) and –8.4ngn1:gfp (ngn1:gfp)were reported previously (Albert et al. 2003; Blader et al. 2003).
Cell sorting, Complex Probes, and Array HybridizationCells were dissociated as described in Dickmeis et al. (2001a). Forthe dissociation of the shh:gfp line, 2–3 mL of collagenase P (Boeh-ringer Mannheim; 2 mg/mL in Hank’s Balanced Salt Solution: 8g/L NaCl, 0.4 g/L KCl, 0.14 g/L CaCl2, 0.1 g/L MgSO4 � 7 H2O,0.1 g/L MgCl2 � 6 H2O, 0.06 g/L KH2PO4, 1 g/L glucose, 0.02 g/Lphenol red, 0.35 g/L NaHCO3) was added after the initial disso-ciation with trypsin to facilitate separation of notochord cells.Fluorescence-activated cell sorting was carried out with an Elitecell sorter (Coulter). Generation of complex probes from thesorted cells, nylon macroarray hybridization, and statisticalanalysis of the image data were carried out as described in Dick-meis et al. (2001a).
Southern blotting and sequencing were carried out follow-ing standard procedures (Sambrook and Russel 2001).
In Situ HybridizationTemplates for in vitro transcription were generated as describedin Dickmeis et al. (2001a). Digoxigenin (DIG)-labeled antisenseRNA probes were prepared with a DIG labeling mix (Roche) andT3 RNA polymerase (Stratagene) following the manufacturer’sinstructions with minor modifications: DIG-probes were synthe-sized in 96-well PCR plates (Costar) and immediately diluted 1:5in hybridization buffer (Oxtoby and Jowett 1993) without priorprecipitation. Embryos were treated with proteinase K (Oxtobyand Jowett 1993). In situ hybridization and washing steps werecarried out with a robot (InsituPro, Intavis) according to themanufacturer’s instructions. Staining was carried out manuallyin 24-well culture dishes as described (Oxtoby and Jowett 1993).
Sequence ComparisonWe used the “gscope” platform to find the most homologousmRNAs and proteins in the databases for each of our clones.Gscope is an integration and analysis platform for genome in-vestigation and database searches that automatically runs variousanalysis and correlations (R. Ripp, L. Bianchetti, Y. Brelivet, A.Carles, F. Chalmel, A. Landenois, O. Lecompte, T. Mochel, L.Moulinier, A. Muller, et al., unpubl.).
Homology searches were carried out with the Compare, Dot-Plot, and BestFit programs of the GCG Wisconsin package usingthe default parameters of the program. Comparison of the ctgfup1, the 250-bp ar-C, the 500-bp ar-B, ar-A of shh (Muller et al.1999), and the 896-bp FPE of netrin1 (Rastegar et al. 2002) werecarried out with the program MEME of the GCG package.
Figure 7 Conserved sequence motifs in the up1 region of ctgf. Thesequence of up1 of zebrafish (zf) and Takifugu (Tf) ctgf; ar-A, ar-B, ar-C ofzebrafish shh and the FPE of zebrafish netrin1 were searched for relatedsequence stretches using the MEME algorithm. Three conserved motifs(M1 to M3) were detected.
Dickmeis et al.
236 Genome Researchwww.genome.org

Expression AnalysisRegions of homology were amplified from the zebrafish genomeby PCR and resulting fragments were either inserted downstreamof the tk:gfp or the netrin1:gfp cassettes. tk:gfp contains the TATA-box of the Herpes simplex virus thymidine kinase gene in front ofa gfp cassette, and netrin1:gfp drives gfp expression with the ze-brafish netrin1 promoter (Rastegar et al. 2002). Standard cloningtechniques were used, and details are available upon request.
ACKNOWLEDGMENTSWe thank D. Biellmann and C. Vialle for fish care and artwork.We are indebted to Nick Foulkes for a critical reading of themanuscript. We acknowledge the help of the project studentsMatthias Corrotte and Simon Jochum. This work was supportedby Boehringer Ingelheim and AFM fellowships to T.D. We arealso grateful to the Institut National de la Sante et de la Recher-che Medicale, the Centre National de la Recherche Scientifique,the Hôpital Universitaire de Strasbourg, AFM, ARC, ACI, AICR,and the Max Planck Society.
The publication costs of this article were defrayed in part bypayment of page charges. This article must therefore be herebymarked “advertisement” in accordance with 18 USC section 1734solely to indicate this fact.
REFERENCESAbreu, J.G., Ketpura, N.I., Reversade, B., and De Robertis, E.M. 2002.
Connective-tissue growth factor (CTGF) modulates cell signalling byBMP and TGF-�. Nat. Cell Biol. 4: 599–604.
Albert, S., Muller, F., Fischer, N., Biellmann, D., Neumann, C., Blader,P., and Strahle, U. 2003. Cyclops-independent floor platedifferentiation in zebrafish embryos. Dev. Dyn. 226: 59–66.
Aparicio, S. and Brenner, S. 1997. How good a model is the Fugugenome? Nature 387: 140.
Aparicio, S., Morrison, A., Gould, A., Gilthorpe, J., Chaudhuri, C., Rigby,P., Krumlauf, R., and Brenner, S. 1995. Detecting conservedregulatory elements with the model genome of the Japanese pufferfish, Fugu rubripes. Proc. Natl. Acad. Sci. 92: 1684–1688.
Bagheri-Fam, S., Ferraz, C., Demaille, J., Scherer, G., and Pfeifer, D.2001. Comparative genomics of the SOX9 region in human andFugu rubripes: Conservation of short regulatory sequence elementswithin large intergenic regions. Genomics 78: 73–82.
Barton, L.M., Gottgens, B., Gering, M., Gilbert, J.G., Grafham, D.,Rogers, J., Bentley, D., Patient, R., and Green, A.R. 2001. Regulationof the stem cell leukemia (SCL) gene: A tale of two fishes. Proc. Natl.Acad. Sci. 98: 6747–6752.
Blader, P., Plessy, C., and Strahle, U. 2003. Multiple regulatory elementswith spatially and temporally distinct activities control neurogenin1expression in primary neurons of the zebrafish embryo. Mech. Dev.120: 211–218.
Brigstock, D.R., Goldschmeding, R., Katsube, K.I., Lam, S.C., Lau, L.F.,Lyons, K., Naus, C., Perbal, B., Riser, B., Takigawa, M., et al. 2003.Proposal for a unified CCN nomenclature. Mol. Pathol. 56: 127–128.
Cerda, J., Grund, C., Franke, W.W., and Brand, M. 2002. Molecularcharacterization of Calymmin, a novel notochord sheath-associatedextracellular matrix protein in the zebrafish embryo. Dev. Dyn.224: 200–209.
Chang, B.-E., Fischer, N., Blader, P., Ingham, P., and Strähle, U. 1997.Axial (HNF3�) and retinoic acid receptors are regulators of thezebrafish sonic hedgehog promoter. EMBO J. 16: 3955–3964.
Clark, M.D., Panopoulou, G.D., Cahill, D.J., Bussow, K., and Lehrach, H.1999. Construction and analysis of arrayed cDNA libraries. MethodsEnzymol. 303: 205–233.
Clark, M.D., Hennig, S., Herwig, R., Clifton, S.W., Marra, M.A., Lehrach,H., Johnson, S.L., and the WU-GSC EST Group. 2001. Anoligonucleotide fingerprint normalized and expressed sequence tagcharacterized zebrafish cDNA library. Genome Res. 11: 1594–1602.
Davidson, E. 2001. Genomic regulatory systems: Development and evolution.Academic Press, San Diego, CA.
Dickmeis, T., Aanstad, P., Clark, M., Fischer, N., Herwig, R., Mourrain,P., Blader, P., Rosa, F., Lehrach, H., and Strahle, U. 2001a.Identification of nodal signaling targets by array analysis of inducedcomplex probes. Dev. Dyn. 222: 571–580.
Dickmeis, T., Rastegar, S., Aanstad, P., Clark, M., Fischer, N., Plessy, C.,Rosa, F., Korzh, V., and Strahle, U. 2001b. Expression of brainsubtype creatine kinase in the zebrafish embryo. Mech. Dev.109: 409–412.
Du, S.J., Devoto, S.H., Westerfield, M., and Moon, R.T. 1997. Positive
and negative regulation of muscle cell identity by members of thehedgehog and TGF-� gene families. J. Cell Biol. 139: 145–156.
Eguchi, T., Kubota, S., Kondo, S., Shimo, T., Hattori, T., Nakanishi, T.,Kuboki, T., Yatani, H., and Takigawa, M. 2001. Regulatorymechanism of human connective tissue growth factor (CTGF/Hcs24)gene expression in a human chondrocytic cell line, HCS-2/8. J.Biochem. (Tokyo) 130: 79–87.
Ekker, M., Akimenko, M.A., Allende, M.L., Smith, R., Drouin, G.,Langille, R.M., Weinberg, E.S., and Westerfield, M. 1997.Relationships among msx gene structure and function in zebrafishand other vertebrates. Mol. Biol. Evol. 14: 1008–1022.
Eriksson, J. and Lofberg, J. 2000. Development of the hypochord anddorsal aorta in the zebrafish embryo (Danio rerio). J. Morphol.244: 167–176.
Feldman, B., Gates, M.A., Egan, E.S., Dougan, S.T., Rennebeck, G.,Sirotkin, H.I., Schier, A.F., and Talbot, W.S. 1998. Zebrafish organizerdevelopment and germ-layer formation require nodal-related signals.Nature 395: 181–185.
Gellner, K. and Brenner, S. 1999. Analysis of 148 kb of genomic DNAaround the wnt1 locus of Fugu rubripes. Genome Res. 9: 251–258.
Glazko, G.V., Koonin, E.V., Rogozin, I.B., and Shabalina, S.A. 2003. Asignificant fraction of conserved noncoding DNA in human andmouse consists of predicted matrix attachment regions. Trends Genet.19: 119–124.
Goode, D.K., Snell, P.K., and Elgar, G.K. 2003. Comparative analysis ofvertebrate Shh genes identifies novel conserved non-codingsequence. Mamm. Genome 14: 192–201.
Gritsman, K., Zhang, J., Cheng, S., Heckscher, E., Talbot, W.S., andSchier, A.F. 1999. The EGF-CFC protein one-eyed pinhead isessential for nodal signaling. Cell 97: 121–132.
Haddon, C., Smithers, L., Schneider-Maunoury, S., Coche, T., Henrique,D., and Lewis, J. 1998. Multiple � genes and lateral inhibition inzebrafish primary neurogenesis. Development 125: 359–370.
Halloran, M.C., Severance, S.M., Yee, C.S., Gemza, D.L., and Kuwada,J.Y. 1998. Molecular cloning and expression of two novel zebrafishsemaphorins. Mech. Dev. 76: 165–168.
Hans, S. and Campos-Ortega, J.A. 2002. On the organisation of theregulatory region of the zebrafish �D gene. Development129: 4773–4784.
Hardison, R.C. 2000. Conserved noncoding sequences are reliable guidesto regulatory elements. Trends Genet. 16: 369–372.
Ho, R.K. and Kimmel, C.B. 1993. Commitment of cell fate in the earlyzebrafish embryo. Science 261: 109–111.
Ivkovic, S., Yoon, B.S., Popoff, S.N., Safadi, F.F., Libuda, D.E.,Stephenson, R.C., Daluiski, A., and Lyons, K.M. 2003. Connectivetissue growth factor coordinates chondrogenesis and angiogenesisduring skeletal development. Development 130: 2779–2791.
Kim, C.H., Ueshima, E., Muraoko, O., Tanaka, H., Yeo, S.-Y., Huh, T.-L.,and Miki, N. 1996. Zebrafish elav/HuC homologue as a very earlyneuronal marker. Neurosci. Lett. 216: 109–112.
Krauss, S., Johansen, T., Korzh, V., and Fjose, A. 1991. Expression of thezebrafish paired box gene pax[zf-b] during early neurogenesis.Development 113: 1193–1206.
Krauss, S., Concordet, J.-P., and Ingham, P.W. 1993. A functionallyconserved homolog of the Drosophila segment polarity gene hedgehogis expressed in tissues with polarizing activity in zebrafish embryos.Cell 75: 1431–1444.
Lele, Z. and Krone, P.H. 1997. Expression of genes encoding thecollagen-binding heat shock protein (Hsp47) and type II collagen indeveloping zebrafish embryos. Mech. Dev. 61: 89–98.
Liang, L., Li, M., Wang, Y., Zhao, C., Zhao, Z., and Meng, A. 2001. Thezygotic expression of zebrafish trebf during embryogenesis isrestricted to the embryonic shield and its derivatives. Dev. GenesEvol. 211: 445–448.
Liem, K.F., Tremml, G., Roelink, H., and Jessell, T.M. 1995. Dorsaldifferentiation of neural plate cells induced by BMP-mediated signalsfrom epidermal ectoderm. Cell 82: 969–979.
Loots, G.G., Locksley, R.M., Blankespoor, C.M., Wang, Z.E., Miller, W.,Rubin, E.M., and Frazer, K.A. 2000. Identification of a coordinateregulator of interleukins 4, 13, and 5 by cross-species sequencecomparisons. Science 288: 136–140.
Ludwig, M.Z. 2002. Functional evolution of noncoding DNA. Curr. Opin.Genet. Dev. 12: 634–639.
Mangos, S., Krawetz, R., and Kelly, G.M. 2000. The Translocon-associatedprotein � (TRAP�) in zebrafish embryogenesis. I. Enhancedexpression of transcripts in notochord and hatching glandprecursors. Mol. Cell. Biochem. 215: 93–101.
Markstein, M., Markstein, P., Markstein, V., and Levine, M.S. 2002.Genome-wide analysis of clustered Dorsal binding sites identifiesputative target genes in the Drosophila embryo. Proc. Natl. Acad. Sci.99: 763–768.
Mistry, N., Harrington, W., Lasda, E., Wagner, E.J., and Garcia-Blanco,
Midline Expression in the Zebrafish Embryo
Genome Research 237www.genome.org

M.A. 2003. Of urchins and men: Evolution of an alternative splicingunit in fibroblast growth factor receptor genes. RNA 9: 209–217.
Muller, F., Chang, B., Albert, S., Fischer, N., Tora, L., and Strahle, U.1999. Intronic enhancers control expression of zebrafish sonichedgehog in floor plate and notochord. Development126: 2103–2116.
Muller, F., Albert, S., Blader, P., Fischer, N., Hallonet, M., and Strahle, U.2000. Direct action of the nodal-related signal cyclops in inductionof Sonic hedgehog in the ventral midline of the CNS. Development127: 3889–3897.
Muller, F., Blader, P., and Strahle, U. 2002. Search for enhancers: Teleostmodels in comparative genomic and transgenic analysis of cisregulatory elements. Bioessays 24: 564–572.
Odenthal, J. and Nusslein-Volhard, C. 1998. fork head domain genes inzebrafish. Dev. Genes Evol. 208: 245–258.
Oxtoby, E. and Jowett, T. 1993. Cloning of the zebrafish krox-20 gene(krx-20) and its expression during hindbrain development. Nucl.Acids Res. 21: 1087–1095.
Pennacchio, L.A. and Rubin, E.M. 2001. Genomic strategies to identifymammalian regulatory sequences. Nat. Rev. Genet. 2: 100–109.
Placzek, M. 1995. The role of the notochord and floor plate in inductiveinteractions. Curr. Opin. Genet. Dev. 5: 499–506.
Pourquie, O., Coltey, M., Teillet, M.A., Ordahl, C., and Le Douarin, N.1993. Control of dorsoventral patterning of somitic derivatives bynotochord and floor plate. Proc. Natl. Acad. Sci. 90: 5242–5246.
Rastegar, S., Albert, S., Le Roux, I., Fischer, N., Blader, P., Muller, F., andStrahle, U. 2002. A floor plate enhancer of the zebrafish netrin1gene requires Cyclops (Nodal) signalling and the winged helixtranscription factor FoxA2. Dev. Biol. 252: 1–14.
Rebagliati, M.R., Toyama, R., Fricke, C., Haffter, P., and Dawid, I.B.1998. Zebrafish nodal related genes are implicated in axialpatterning and establishing left–right asymmetry. Dev. Biol.199: 261–272.
Rubinstein, A.L., Lee, D., Luo, R., Henion, P.D., and Halpern, M.E. 2000.Genes dependent on zebrafish cyclops function identified by AFLPdifferential gene expression screen. Genesis 26: 86–97.
Sambrook, J. and Russel, D.W. 2001. Molecular cloning: A laboratorymanual. Cold Spring Harbor Laboratory Press, Cold Spring Harbor,NY.
Sampath, K., Rubinstein, A.L., Cheng, A.M., Liang, J.O., Fekany, K.,
Solnica-Krezel, L., Korzh, V., Halpern, M.E., and Wright, C.V. 1998.Induction of the zebrafish ventral brain and floorplate requirescyclops/nodal signalling. Nature 395: 185–189.
Schulte-Merker, S., Ho, R.K., Herrmann, B.G., and Nüsslein-Volhard, C.1992. The protein product of the zebrafish homologue of the mouseT gene is expressed in nuclei of the germ ring and the notochord ofthe early embryo. Development 116: 1021–1032.
Strähle, U., Blader, P., Henrique, D., and Ingham, P. 1993. Axial, azebrafish gene expressed along the developing body axis, showsaltered expression in cyclops mutant embryos. Genes & Dev.7: 1436–1446.
Strahle, U., Blader, P., and Ingham, P.W. 1996. Expression of axial andSonic hedgehog in wildtype and midline defective zebrafishembryos. Int. J. Dev. Biol. 40: 929–940.
Talbot, W.S., Trevarrow, B., Halpern, M.E., Melby, M.E., Farr, A.E.,Postlethwait, J.H., Jowett, T., Kimmel, C.B., and Kimelman, D. 1995.Requirement for the homeobox gene floating head in zebrafishdevelopment. Nature 378: 150–157.
Tanabe, Y. and Jessell, T.M. 1996. Diversity and pattern in thedeveloping spinal cord. Science 274: 1115–1123.
Wasserman, W.W., Palumbo, M., Thompson, W., Fickett, J.W., andLawrence, C.E. 2000. Human–mouse genome comparisons to locateregulatory sites. Nat. Genet. 26: 225–228.
Westerfield, M. 1993. The zebrafish book. University of Oregon Press,Eugene.
Westerfield, M., Wegener, J., Jegalian, B.G., DeRobertis, E.M., andPüschel, A.W. 1992. Specific activation of mammalian Hoxpromoters in mosaic transgenic zebrafish. Genes & Dev. 6: 591–598.
Yan, Y.L., Hatta, K., Riggleman, B., and Postlethwait, J.H. 1995.Expression of a type II collagen gene in the zebrafish embryonicaxis. Dev. Dyn. 203: 363–376.
Zerucha, T., Stuhmer, T., Hatch, G., Park, B.K., Long, Q., Yu, G.,Gambarotta, A., Schultz, J.R., Rubenstein, J.L., and Ekker, M. 2000. Ahighly conserved enhancer in the Dlx5/Dlx6 intergenic region is thesite of cross-regulatory interactions between Dlx genes in theembryonic forebrain. J. Neurosci. 20: 709–721.
Received July 29, 2003; accepted in revised form November 4, 2003.
Dickmeis et al.
238 Genome Researchwww.genome.org
![Paternal Benzo[a]pyrene Exposure Affects Gene Expression in the Early Developing Mouse Embryo](https://img.pdfslide.net/doc/110x75/6356aee5dffe30f4b50c3f02/paternal-benzoapyrene-exposure-affects-gene-expression-in-the-early-developing.jpg)


