Embed Size (px)
Citation preview
DISCLOSURE APPENDIX AT THE BACK OF THIS REPORT CONTAINS IMPORTANT DISCLOSURES, ANALYST CERTIFICATIONS, LEGAL ENTITY DISCLOSURE AND THE STATUS OF NON-US ANALYSTS. US Disclosure: Credit Suisse does and seeks to do business with companies covered in its research reports. As a result, investors should be aware that the Firm may have a conflict of interest that could affect the objectivity of this report. Investors should consider this report as only a single factor in making their investment decision.
18 November 2016Americas/United States
Equity ResearchIT Hardware
F5 Networks (FFIV)
COMPANY UPDATE Rating NEUTRALPrice (17-Nov-16,US$) 143.91Target price (US$) 134.0052-week price range 143.91 - 86.96Market cap (US$ m) 9,399.63*Stock ratings are relative to the coverage universe in each analyst's or each team's respective sector.¹Target price is for 12 months.
Research AnalystsSami Badri
212 538 [email protected]
Kulbinder Garcha212 325 4795
Philip Wang212 538 3458
Syed Talha Saleem212 538 1428
William Chu212 538 4993
Analyst Day – Sound and Realistic■ F5's 2017 strategy – sound and realistic. Management presented a very
elaborate Security, Cloud, and overall company strategy going into 2017 with the introduction of key partnerships, new product rollouts and technological innovations associated with application connectivity for enterprises. Overall, the company views 2017 as a product revenue growth year and our estimates align with these views, modeling in growth of +6.6%/+2.8% y/y for FY17/18 and we see this as conservative in the context of the Security business optionality and newly announced Equinix partnership to drive the cloud opportunity. Despite the positive messaging at the analyst day, we still see challenges ahead associated with the product revenue mix and leave our rating and valuation unchanged as a Neutral with a $134 target price.
■ F5 and Equinix partnership a win-win. F5 and Equinix recently announced a strategic partnership where F5 benefits from the cloud service providers that are currently leasing space from Equinix and Equinix benefits from F5's enterprise customers migrating workloads to the cloud. We view this partnership as a solid opportunity for F5 given that Equinix has 23.6% share of the multi-tenant data center market, the largest vendor by far, and that F5 has been fairly sidelined in the cloud opportunity based on our views. We do not integrate the potential revenues from this partnership in our assumptions, but note this does give F5 another avenue of growth, beyond their current enterprise ADC install base.
■ New security products to address the security focused buyer. Along with the already announced single-purpose security appliances in 2016, F5 confirmed and announced that it will have three standalone security products shipping in 2017 (Herculon, DDoS Hybrid Defender, and SSL Orchestrator) that tailor to the IT security buyer. We believe this gives F5 a solid opportunity to use its best-in-class technology and we estimate that more than 41% of product sales will include security features attached to product sales in 2017, given these newly announced product launches.
■ Valuation – Target Price of $134. We value F5 on a P/E multiple of 13x FY18 EPS, in-line with networking peers with security attach businesses, and add back net cash of $1.2bn.
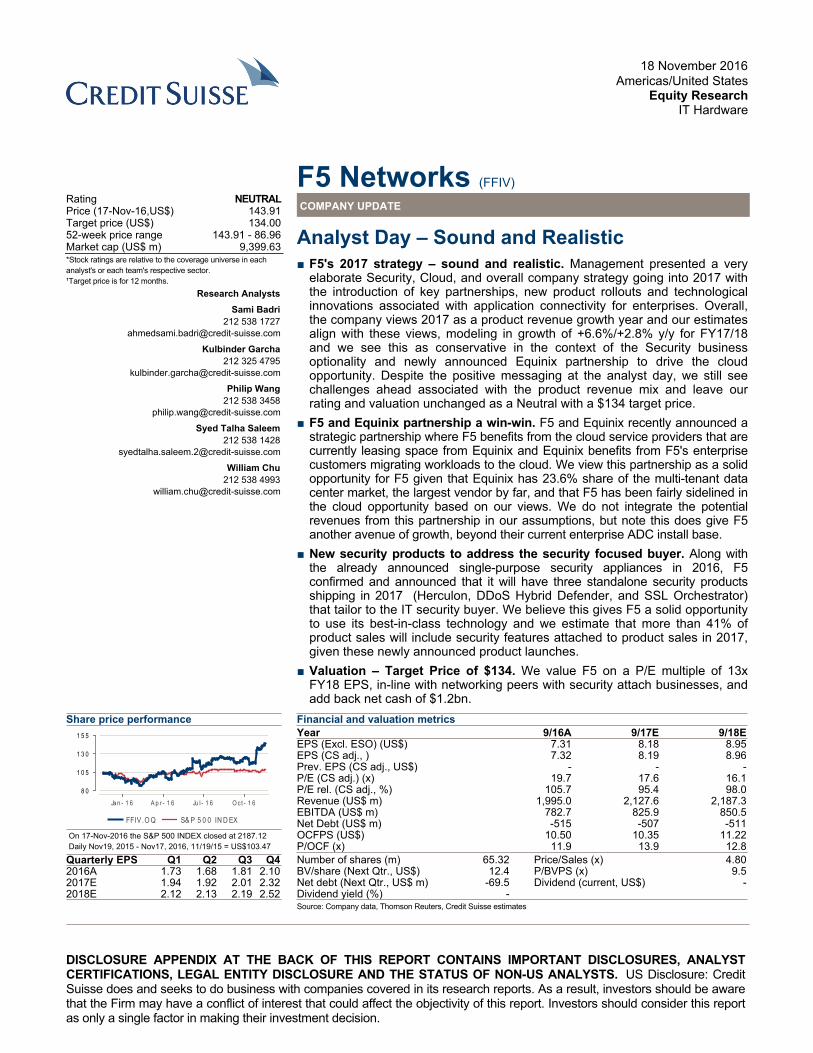
Share price performance
FFIV .O Q S& P 5 0 0 IN D EX
Jan - 1 6 A p r - 1 6 Ju l - 1 6 O ct - 1 68 0
1 0 5
1 3 0
1 5 5
On 17-Nov-2016 the S&P 500 INDEX closed at 2187.12Daily Nov19, 2015 - Nov17, 2016, 11/19/15 = US$103.47
Quarterly EPS Q1 Q2 Q3 Q42016A 1.73 1.68 1.81 2.102017E 1.94 1.92 2.01 2.322018E 2.12 2.13 2.19 2.52
Financial and valuation metricsYear 9/16A 9/17E 9/18EEPS (Excl. ESO) (US$) 7.31 8.18 8.95EPS (CS adj., ) 7.32 8.19 8.96Prev. EPS (CS adj., US$) - - -P/E (CS adj.) (x) 19.7 17.6 16.1P/E rel. (CS adj., %) 105.7 95.4 98.0Revenue (US$ m) 1,995.0 2,127.6 2,187.3EBITDA (US$ m) 782.7 825.9 850.5Net Debt (US$ m) -515 -507 -511OCFPS (US$) 10.50 10.35 11.22P/OCF (x) 11.9 13.9 12.8
Number of shares (m) 65.32 Price/Sales (x) 4.80BV/share (Next Qtr., US$) 12.4 P/BVPS (x) 9.5Net debt (Next Qtr., US$ m) -69.5 Dividend (current, US$) -Dividend yield (%) -Source: Company data, Thomson Reuters, Credit Suisse estimates
18 November 2016
F5 Networks (FFIV) 2
F5 Networks (FFIV)Price (17 Nov 2016): US$143.91; Rating: NEUTRAL; Target Price: US$134.00; Analyst: Kulbinder GarchaIncome Statement 9/16A 9/17E 9/18ERevenue (US$ m) 1,995.0 2,127.6 2,187.3EBITDA 783 826 850Depr. & amort. (57) (60) (62)EBIT (US$) 726 765 788Net interest exp 6 6 6Associates - - -Other adj. (4) (5) (5)PBT (US$) 728 766 789Income taxes (234) (244) (252)Profit after tax 495 522 538Minorities - - -Preferred dividends - - -Associates & other 1 0 0Net profit (US$) 496 522 538Other NPAT adjustments (130) (134) (140)Reported net income 366 388 398Cash Flow 9/16A 9/17E 9/18EEBIT 726 765 788Net interest 6 6 6Cash taxes paid - - -Change in working capital 1,488 1,518 1,536Other cash & non-cash items (1,509) (1,629) (1,657)Cash flow from operations 712 661 674CAPEX (63) (70) (72)Free cashflow to the firm 648 590 602Aquisitions (5) 0 0Divestments 0 0 0Other investment/(outflows) 131 0 0Cash flow from investments 63 (70) (72)Net share issue(/repurchase) (700) (600) (600)Dividends paid 0 0 0Issuance (retirement) of debt - - -Other 47 0 0Cashflow from financing activities (653) (600) (600)Effect of exchange rates 3 2 2Changes in Net Cash/Debt 124 (7) 4Net debt at start (390) (515) (507)Change in net debt (124) 7 (4)Net debt at end (515) (507) (511)Balance Sheet (US$) 9/16A 9/17E 9/18EAssetsCash & cash equivalents 515 507 511Account receivables 268 294 300Inventory 34 40 41Other current assets 472 475 476Total current assets 1,289 1,316 1,328Total fixed assets 123 133 143Intangible assets and goodwill 556 542 528Investment securities 276 276 276Other assets 62 62 62Total assets 2,306 2,330 2,337LiabilitiesAccounts payables 34 40 41Short-term debt 0 0 0Other short term liabilities 810 876 916Total current liabilities 844 916 957Long-term debt 0 0 0Other liabilities 277 295 306Total liabilities 1,121 1,211 1,263Shareholder equity 1,185 1,118 1,074Minority interests - - -Total liabilities and equity 2,306 2,330 2,337Net debt (515) (507) (511)
Per share 9/16A 9/17E 9/18ENo. of shares (wtd avg) 68 64 60CS adj. EPS 7.32 8.19 8.96Prev. EPS (US$) - - -Dividend (US$) 0.00 0.00 0.00Dividend payout ratio 0.00 0.00 0.00Free cash flow per share 9.56 9.25 10.02Earnings 9/16A 9/17E 9/18ESales growth (%) 3.9 6.6 2.8EBIT growth (%) 2.1 5.4 3.0Net profit growth (%) 3.3 5.3 3.0EPS growth (%) 10.4 11.9 9.4EBITDA margin (%) 39.2 38.8 38.9EBIT margin (%) 36.4 36.0 36.0Pretax margin (%) 36.5 36.0 36.1Net margin (%) 24.9 24.5 24.6Valuation 9/16A 9/17E 9/18EEV/Sales (x) 4.45 4.18 4.06EV/EBITDA (x) 11.9 11.3 11.0EV/EBIT (x) 12.2 11.6 11.3P/E (x) 19.7 17.6 16.1Price to book (x) 8.2Asset turnover 0.9 0.9 0.9Returns 9/16A 9/17E 9/18EROE stated-return on (%) 29.2 65.4ROIC (%) 0.7 0.9 1.0Interest burden (%) 1.00 1.00 1.00Tax rate (%) 32.1 31.9 31.9Financial leverage (%) 0.00Gearing 9/16A 9/17E 9/18ENet debt/equity (%) (43.4) (45.3) (47.6)Net Debt to EBITDA (x) Net Cash Net Cash Net CashInterest coverage ratio (X) (115.6) (121.9) (125.5)Quarterly EPS Q1 Q2 Q3 Q42016A 1.73 1.68 1.81 2.102017E 1.94 1.92 2.01 2.322018E 2.12 2.13 2.19 2.52
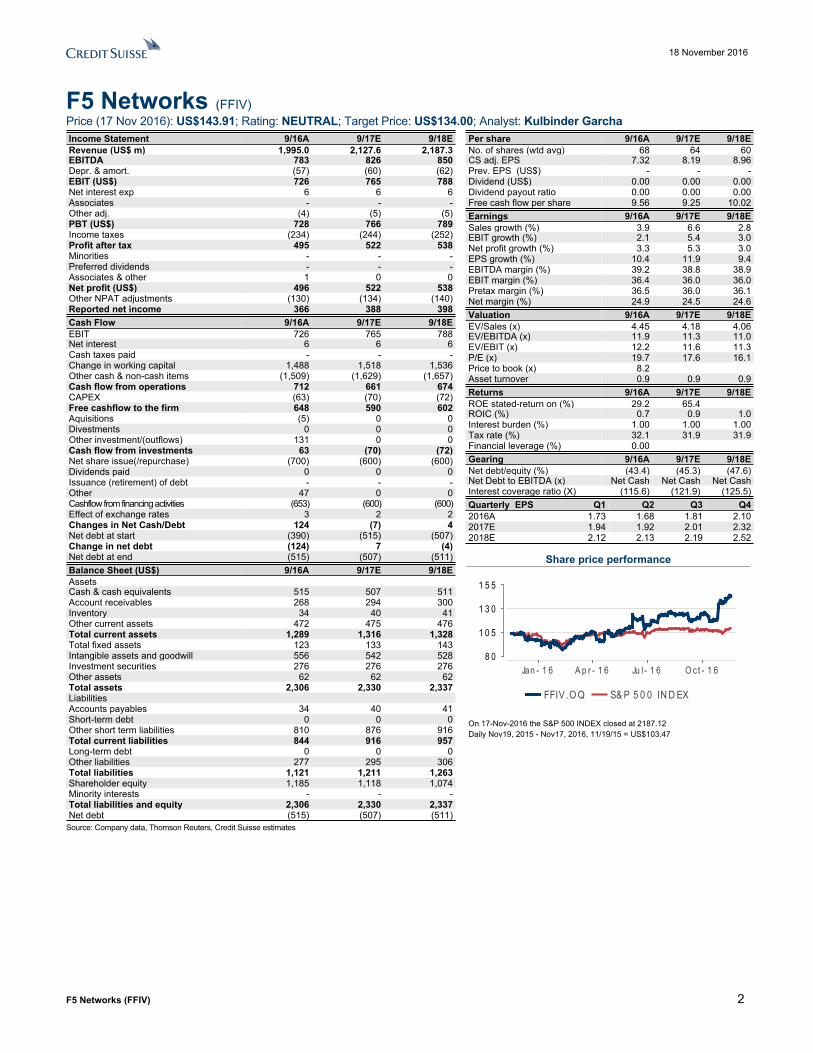
Share price performance
FFIV .O Q S& P 5 0 0 IN D EX
Jan - 1 6 A p r - 1 6 Ju l - 1 6 O ct - 1 68 0
1 0 5
1 3 0
1 5 5
On 17-Nov-2016 the S&P 500 INDEX closed at 2187.12Daily Nov19, 2015 - Nov17, 2016, 11/19/15 = US$103.47
Source: Company data, Thomson Reuters, Credit Suisse estimates
18 November 2016
F5 Networks (FFIV) 3
2017 Strategy: Sound and Realistic F5 Networks held its annual Analyst Day in Chicago, IL, this year, highlighting key milestones in 2016 and showcased their 2017 strategy, product release plans, and new technological innovations that they believe will make 2017 a pivotal year for revenue growth, fueled by product refreshes across ADCs and new security product introductions, compared to a tough 2016. F5 Management that presented included:
− John MacAdam-CEO
− Andy Reinland-CFO
− Sangeeta Anand-SVP of Product Management
− Ryan Kearny-CTO
− Calvin Rowland-SVP of Business Development
− Ben Gibson-CMO
− Julian Eames-COO
− John DiLullo-EVP of World Sales
We highlight the key parts of the Analyst Day below and go into more detail in later parts of this report to highlight what we believe is a very realistic strategy for a networking hardware vendor navigating the secular pressures in the IT Hardware & Networking industries that are impacted by the wide-spread adoption of the Public Cloud.
F5 Networks and Equinix Partnership a win-win Enterprise-Cloud Strategy. Announced on November 15, 2016, F5 Networks and Equinix announced a strategic partnership to help enterprises navigate the complexities associated with enterprise-cloud adoption through a variety of solutions using Equinix's Cloud Exchange and Silverline solutions. This partnership will help enterprises avoid cloud service provider lock-in and allow for the flexibility to use AWS, GCP, Azure, Softlayer, and others, as they see fit overtime. Equinix is the largest single vendor in the multi-tenant colocation data center market, with a 23.6% share, which is up significantly compared to FY13 when it only had 17.7% of the market. Additionally, the enterprise vertical within the multi-tenant colocation market is only ~16%, which is miniscule when compared to other customer verticals of the market. We view this partnership as a win-win for both F5 Networks and Equinix and address it in more detail in our report.
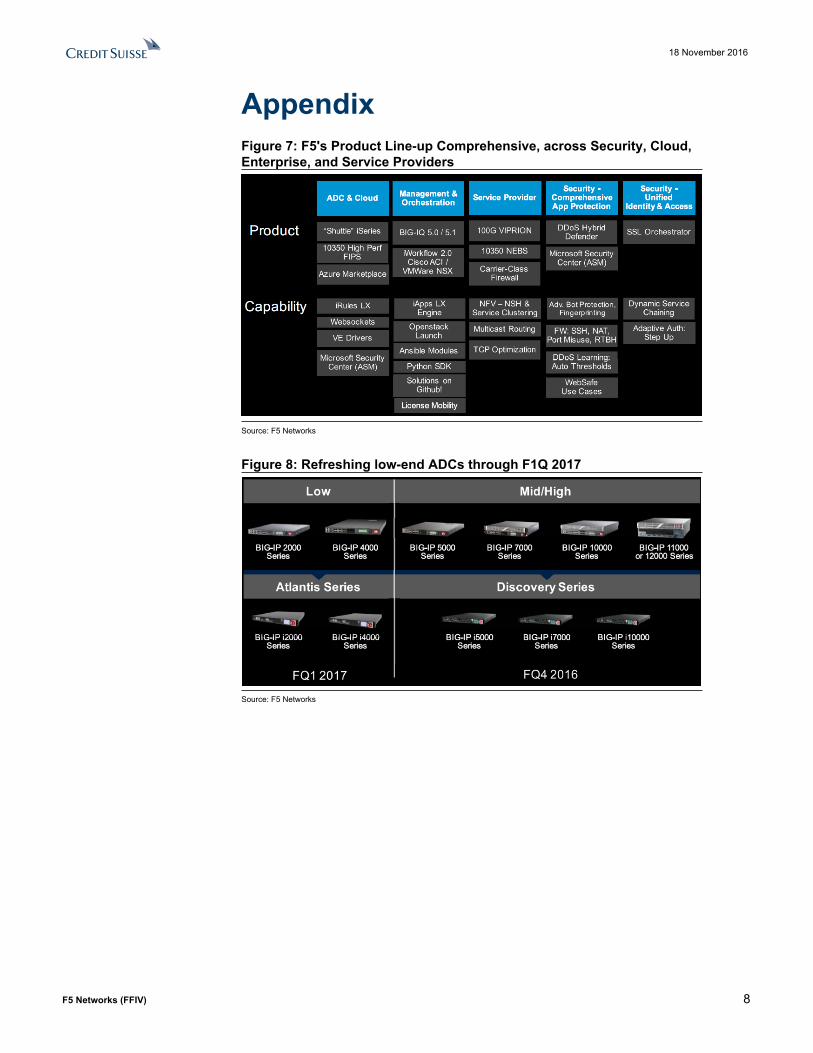
F5's Cloud Strategy is sound and realistic. F5 has made it its business to provide networking and application solutions to customers trying to solve very complex IT problems. For an enterprise to adopt or move workloads to public clouds, enterprises face significant compliance and security problems, and F5 has found its niche to address this market at the right customer costs. F5 has found that Enterprises want to move to a multi-cloud model, which we discuss further in the F5 and Equinix partnership section later in our report. F5 also highlighted their BIG-IP iSeries appliance, which they note is the most programmable Cloud-Ready ADC in the networking appliance market with DevOps-like agility, scale, security, and investment protection (highlighting that a large portion of their install base includes ADCs that are a decade old). See Figure 8 for a full line up of their BIG-IP "Shuttle" iSeries that have shipped to customers in F4Q16 and will continue shipping new low-end ADC versions in F1Q17. Overall, on F5's Cloud Strategy, we view their approach and strategy to this highly competitive market as sound and realistic given their IT competencies, customer install base, and on-going technological innovations.
18 November 2016
F5 Networks (FFIV) 4
Security: F5 pivoting into single-purpose security appliance market a positive, but not a game-changer. F5 highlighted that 70% of internet traffic will be encrypted by 2017, and since F5 views their products and technology as best-in-class performers when compared to other products in the traffic decryption market, and given the success F5 has had in SSL, WAF, and DDoS security technologies, F5 will have three separate security appliances for the IT security buyer listed in 2017; the Herculon (designed for Security Buyers and can be added on to existing ADC installs), DDoS Hybrid Defender (for Advanced Bot Protection, DDoS thresholds, and WebSafe Use Cases), and SSL Orchestrator (for Dynamic Services Chaining, and Adaptive Authorization). See Figure 7 for complete listing of products and capabilities. In FY15, F5 disclosed that 41% of all product sales included security feature add-ons (in both hardware and software), and we view this figure to continue to rise given the pushes F5 is making in the security market and the increase in DDoS cyber attacked enterprises have observed in the last year alone. Additionally, we believe that F5's pivot into the single-purpose security appliance market will help hardware product revenues, but will not serve as a major source of growth given the fragmented customer use cases in the single-purpose security appliance market.
Financial guidance unchanged. Management provided a brief summary of their previously set financial outlook, in line with our estimates. Management commented several times on how the focus of the company is on Product Revenue growth/re-acceleration and that F1Q17 would be the base quarter, followed by sequential growth to complete a back half loaded product revenue year. We forecast FY17/18 revenues of $2.13bn/$2.19bn or growth of +6.6%/+2.8% y/y and we see this as conservative in the context of the Security business optionality and newly announced Equinix partnership to drive the cloud opportunity. For margins, we see FY17/18 GMs at 84.6%/84.7%, lifted by increased software sales, and OMs of 36.0%/36.0%, respectively. Finally on earnings, we forecast FY17/18 EPS of $8.19/$8.96, growing at +11.9%/+9.4%, respectively, growing faster than revenues driven by business operating leverage opportunities and higher margin product revenue mix.
Figure 1: F5 Mini P&L – Forecasting ~12%/~10% EPS growth for FY17/18Revenue by segment FY2015 FY2016 FY2017E FY2018EProduct 992 944 952 871 Services 928 1,051 1,175 1,316 Total Revenue 1,920 1,995 2,128 2,187 yoy % 10.9% 3.9% 6.6% 2.8%Gross Profit 1,612 1,687 1,801 1,853Gross Margin (%) 84.0% 84.6% 84.6% 84.7%Operating Expense 901.37 961.17 1035.41 1064.62as % of sales 47.0% 48.2% 48.7% 48.7%Operating Profit 711.06 725.89 765.42 788.37Operating Margin (%) 37.0% 36.4% 36.0% 36.0%Net income 479.95 495.81 522.11 537.74Sharecount 72.41 67.79 63.81 60.07EPS ($) $6.63 $7.32 $8.19 $8.96yoy % 22.0% 10.4% 11.9% 9.4%Source: Company data, Credit Suisse estimates
F5 Networks and Equinix Partnership a win-win Cloud Strategy for both companiesOn November 15, 2016, F5 Networks and Equinix announced a strategic partnership to help enterprises navigate the complexities associated with enterprise-cloud adoption
18 November 2016
F5 Networks (FFIV) 5
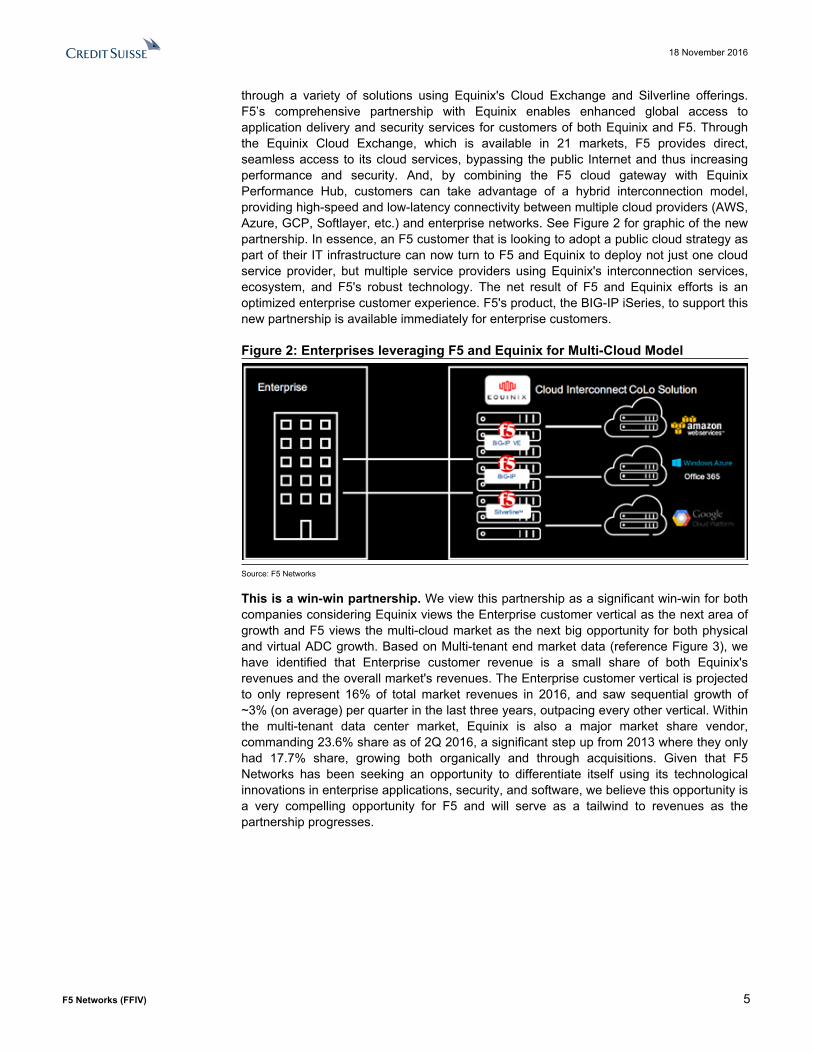
through a variety of solutions using Equinix's Cloud Exchange and Silverline offerings. F5’s comprehensive partnership with Equinix enables enhanced global access to application delivery and security services for customers of both Equinix and F5. Through the Equinix Cloud Exchange, which is available in 21 markets, F5 provides direct, seamless access to its cloud services, bypassing the public Internet and thus increasing performance and security. And, by combining the F5 cloud gateway with Equinix Performance Hub, customers can take advantage of a hybrid interconnection model, providing high-speed and low-latency connectivity between multiple cloud providers (AWS, Azure, GCP, Softlayer, etc.) and enterprise networks. See Figure 2 for graphic of the new partnership. In essence, an F5 customer that is looking to adopt a public cloud strategy as part of their IT infrastructure can now turn to F5 and Equinix to deploy not just one cloud service provider, but multiple service providers using Equinix's interconnection services, ecosystem, and F5's robust technology. The net result of F5 and Equinix efforts is an optimized enterprise customer experience. F5's product, the BIG-IP iSeries, to support this new partnership is available immediately for enterprise customers.
Figure 2: Enterprises leveraging F5 and Equinix for Multi-Cloud Model
Source: F5 Networks
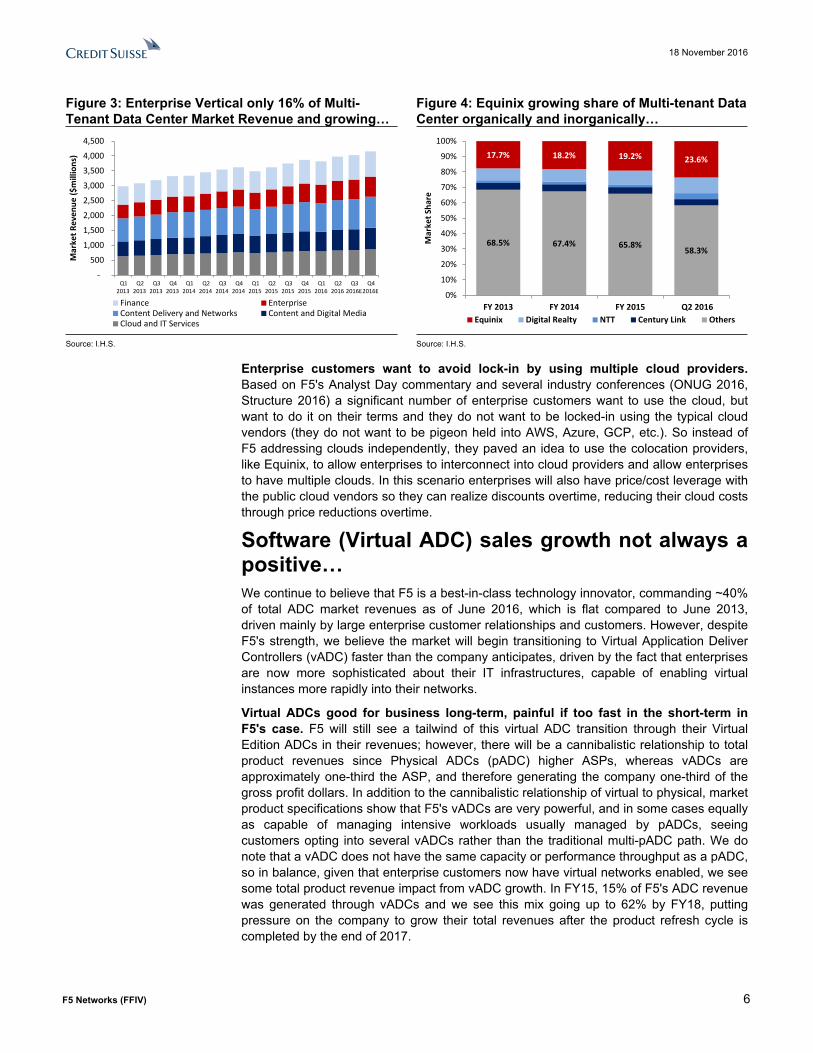
This is a win-win partnership. We view this partnership as a significant win-win for both companies considering Equinix views the Enterprise customer vertical as the next area of growth and F5 views the multi-cloud market as the next big opportunity for both physical and virtual ADC growth. Based on Multi-tenant end market data (reference Figure 3), we have identified that Enterprise customer revenue is a small share of both Equinix's revenues and the overall market's revenues. The Enterprise customer vertical is projected to only represent 16% of total market revenues in 2016, and saw sequential growth of ~3% (on average) per quarter in the last three years, outpacing every other vertical. Within the multi-tenant data center market, Equinix is also a major market share vendor, commanding 23.6% share as of 2Q 2016, a significant step up from 2013 where they only had 17.7% share, growing both organically and through acquisitions. Given that F5 Networks has been seeking an opportunity to differentiate itself using its technological innovations in enterprise applications, security, and software, we believe this opportunity is a very compelling opportunity for F5 and will serve as a tailwind to revenues as the partnership progresses.
18 November 2016
F5 Networks (FFIV) 6
Figure 3: Enterprise Vertical only 16% of Multi-Tenant Data Center Market Revenue and growing…
Figure 4: Equinix growing share of Multi-tenant Data Center organically and inorganically…
-
500
1,000
1,500
2,000
2,500
3,000
3,500
4,000
4,500
Q12013
Q22013
Q32013
Q42013
Q12014
Q22014
Q32014
Q42014
Q12015
Q22015
Q32015
Q42015
Q12016
Q22016
Q32016E
Q42016E
Mar
ket R
even
ue ($
mill
ions
)
Finance EnterpriseContent Delivery and Networks Content and Digital MediaCloud and IT Services
68.5% 67.4% 65.8% 58.3%
17.7% 18.2% 19.2% 23.6%
0%
10%
20%
30%
40%
50%
60%
70%
80%
90%
100%
FY 2013 FY 2014 FY 2015 Q2 2016
Mar
ket S
hare
Equinix Digital Realty NTT Century Link Others
Source: I.H.S. Source: I.H.S.
Enterprise customers want to avoid lock-in by using multiple cloud providers. Based on F5's Analyst Day commentary and several industry conferences (ONUG 2016, Structure 2016) a significant number of enterprise customers want to use the cloud, but want to do it on their terms and they do not want to be locked-in using the typical cloud vendors (they do not want to be pigeon held into AWS, Azure, GCP, etc.). So instead of F5 addressing clouds independently, they paved an idea to use the colocation providers, like Equinix, to allow enterprises to interconnect into cloud providers and allow enterprises to have multiple clouds. In this scenario enterprises will also have price/cost leverage with the public cloud vendors so they can realize discounts overtime, reducing their cloud costs through price reductions overtime.
Software (Virtual ADC) sales growth not always a positive…We continue to believe that F5 is a best-in-class technology innovator, commanding ~40% of total ADC market revenues as of June 2016, which is flat compared to June 2013, driven mainly by large enterprise customer relationships and customers. However, despite F5's strength, we believe the market will begin transitioning to Virtual Application Deliver Controllers (vADC) faster than the company anticipates, driven by the fact that enterprises are now more sophisticated about their IT infrastructures, capable of enabling virtual instances more rapidly into their networks.
Virtual ADCs good for business long-term, painful if too fast in the short-term in F5's case. F5 will still see a tailwind of this virtual ADC transition through their Virtual Edition ADCs in their revenues; however, there will be a cannibalistic relationship to total product revenues since Physical ADCs (pADC) higher ASPs, whereas vADCs are approximately one-third the ASP, and therefore generating the company one-third of the gross profit dollars. In addition to the cannibalistic relationship of virtual to physical, market product specifications show that F5's vADCs are very powerful, and in some cases equally as capable of managing intensive workloads usually managed by pADCs, seeing customers opting into several vADCs rather than the traditional multi-pADC path. We do note that a vADC does not have the same capacity or performance throughput as a pADC, so in balance, given that enterprise customers now have virtual networks enabled, we see some total product revenue impact from vADC growth. In FY15, 15% of F5's ADC revenue was generated through vADCs and we see this mix going up to 62% by FY18, putting pressure on the company to grow their total revenues after the product refresh cycle is completed by the end of 2017.
18 November 2016
F5 Networks (FFIV) 7
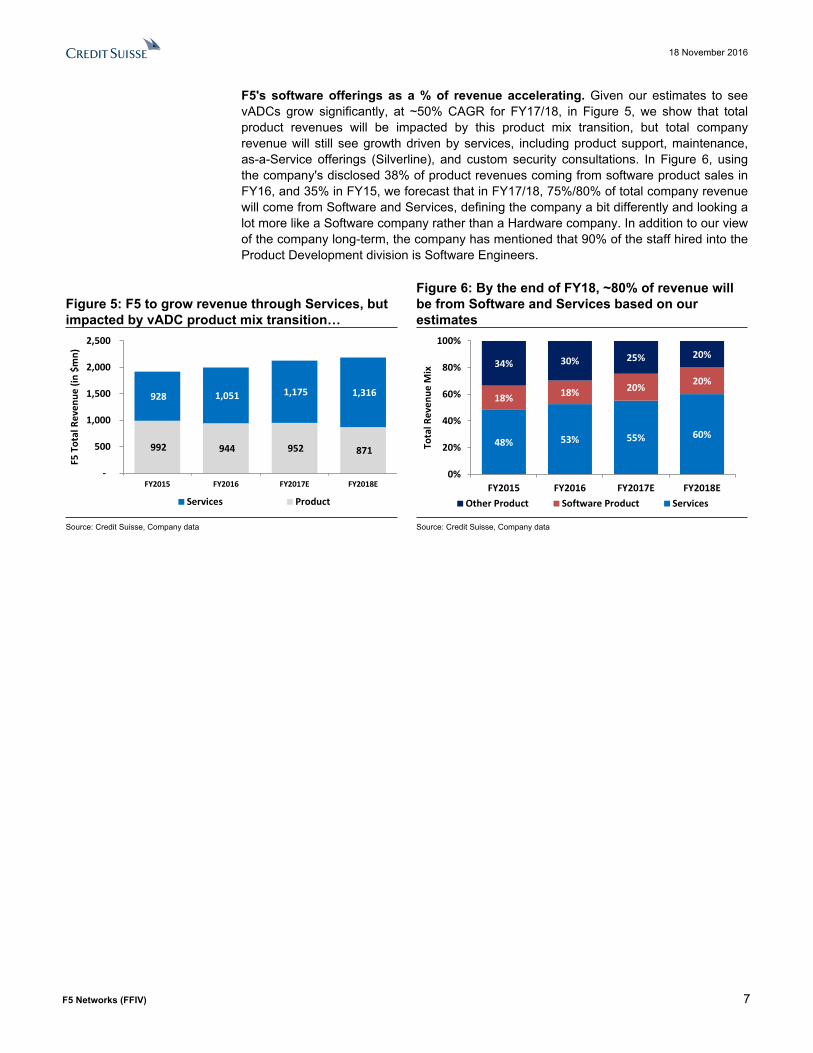
F5's software offerings as a % of revenue accelerating. Given our estimates to see vADCs grow significantly, at ~50% CAGR for FY17/18, in Figure 5, we show that total product revenues will be impacted by this product mix transition, but total company revenue will still see growth driven by services, including product support, maintenance, as-a-Service offerings (Silverline), and custom security consultations. In Figure 6, using the company's disclosed 38% of product revenues coming from software product sales in FY16, and 35% in FY15, we forecast that in FY17/18, 75%/80% of total company revenue will come from Software and Services, defining the company a bit differently and looking a lot more like a Software company rather than a Hardware company. In addition to our view of the company long-term, the company has mentioned that 90% of the staff hired into the Product Development division is Software Engineers.
Figure 5: F5 to grow revenue through Services, but impacted by vADC product mix transition…
Figure 6: By the end of FY18, ~80% of revenue will be from Software and Services based on our estimates
992 944 952 871
928 1,051 1,175 1,316
-
500
1,000
1,500
2,000
2,500
FY2015 FY2016 FY2017E FY2018E
F5 T
otal
Rev
enue
(in
$mn)
Services Product
48% 53% 55% 60%
18% 18% 20% 20%
34% 30% 25% 20%
0%
20%
40%
60%
80%
100%
FY2015 FY2016 FY2017E FY2018E
Tota
l Rev
enue
Mix
Other Product Software Product Services
Source: Credit Suisse, Company data Source: Credit Suisse, Company data
18 November 2016
F5 Networks (FFIV) 8
AppendixFigure 7: F5's Product Line-up Comprehensive, across Security, Cloud, Enterprise, and Service Providers
Source: F5 Networks
Figure 8: Refreshing low-end ADCs through F1Q 2017
Source: F5 Networks
18 November 2016
F5 Networks (FFIV) 9
Companies Mentioned (Price as of 17-Nov-2016)Alphabet (GOOGL.OQ, $786.16)Amazon com Inc. (AMZN.OQ, $756.4)Equinix (EQIX.OQ, $331.14)F5 Networks (FFIV.OQ, $143.91, NEUTRAL, TP $134.0)International Business Machines Corp. (IBM.N, $159.8)Microsoft Corporation (MSFT.OQ, $60.64)Oracle Corporation (ORCL.N, $40.25)
Disclosure AppendixAnalyst Certification I, Kulbinder Garcha, certify that (1) the views expressed in this report accurately reflect my personal views about all of the subject companies and securities and (2) no part of my compensation was, is or will be directly or indirectly related to the specific recommendations or views expressed in this report.
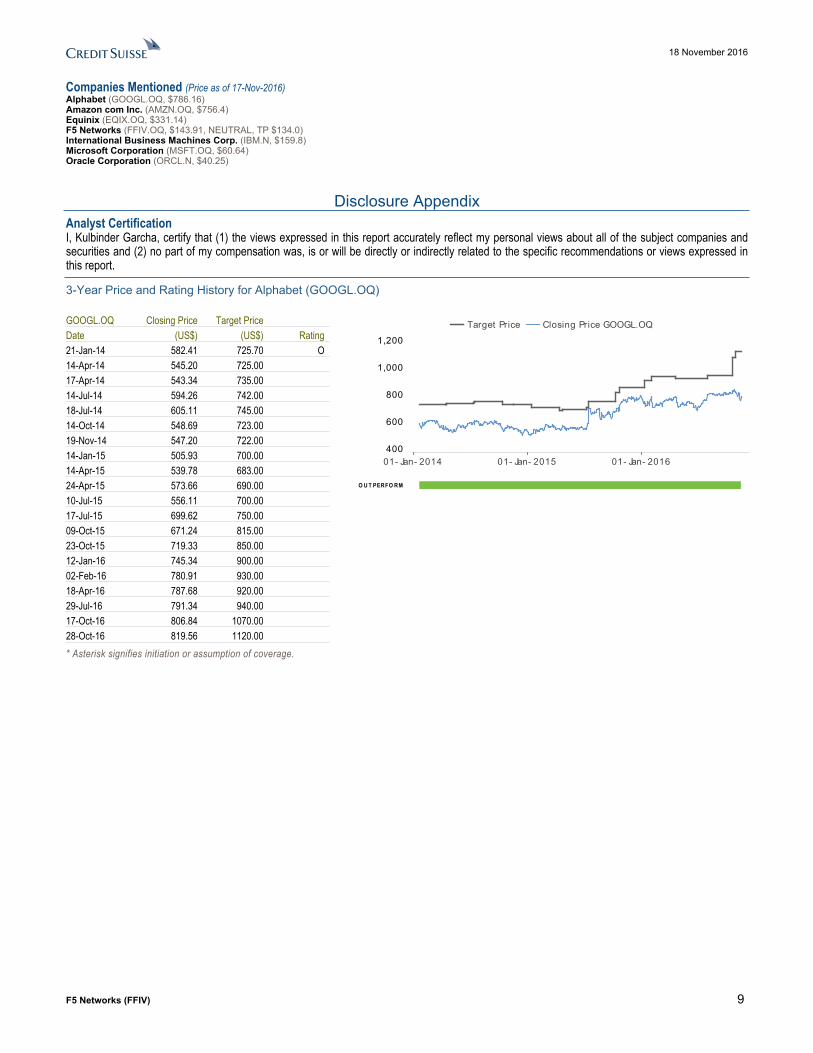
3-Year Price and Rating History for Alphabet (GOOGL.OQ)
GOOGL.OQ Closing Price Target Price Date (US$) (US$) Rating 21-Jan-14 582.41 725.70 O 14-Apr-14 545.20 725.00 17-Apr-14 543.34 735.00 14-Jul-14 594.26 742.00 18-Jul-14 605.11 745.00 14-Oct-14 548.69 723.00 19-Nov-14 547.20 722.00 14-Jan-15 505.93 700.00 14-Apr-15 539.78 683.00 24-Apr-15 573.66 690.00 10-Jul-15 556.11 700.00 17-Jul-15 699.62 750.00 09-Oct-15 671.24 815.00 23-Oct-15 719.33 850.00 12-Jan-16 745.34 900.00 02-Feb-16 780.91 930.00 18-Apr-16 787.68 920.00 29-Jul-16 791.34 940.00 17-Oct-16 806.84 1070.00 28-Oct-16 819.56 1120.00 * Asterisk signifies initiation or assumption of coverage.
Target Price Closing Price GOOGL.OQ
01- Jan- 2014 01- Jan- 2015 01- Jan- 2016400
600
800
1,000
1,200
O U T PERFO RM
18 November 2016
F5 Networks (FFIV) 10
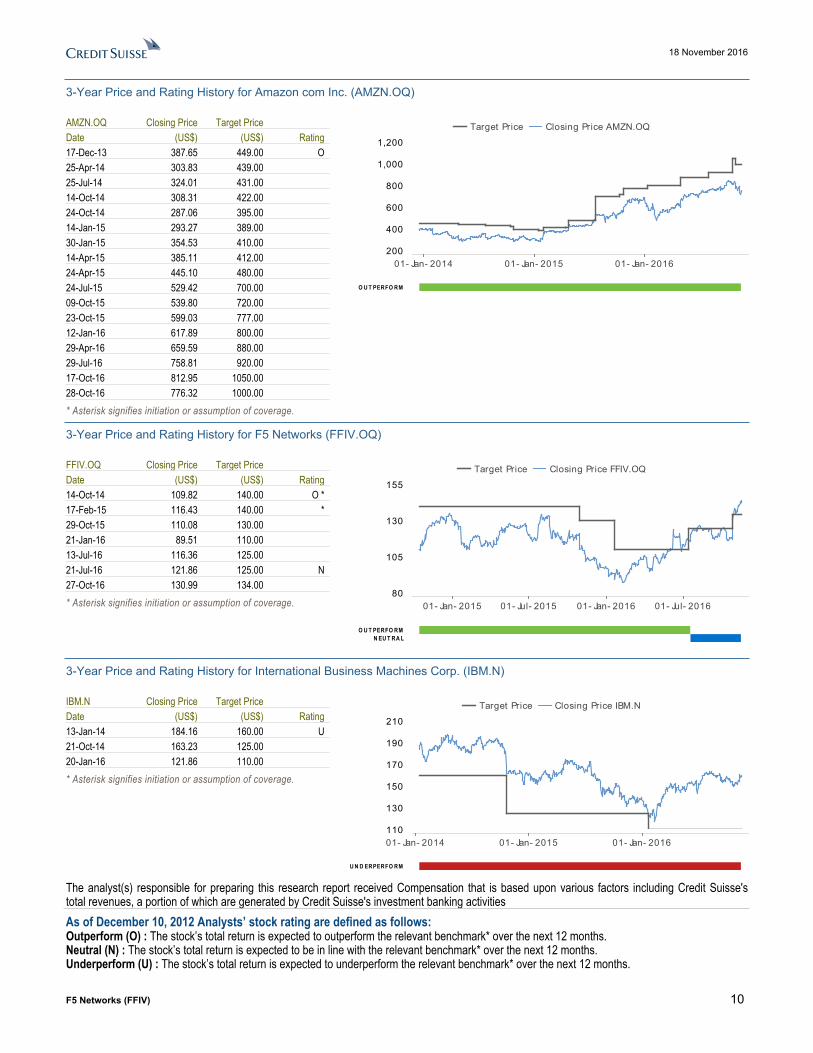
3-Year Price and Rating History for Amazon com Inc. (AMZN.OQ)
AMZN.OQ Closing Price Target Price Date (US$) (US$) Rating 17-Dec-13 387.65 449.00 O 25-Apr-14 303.83 439.00 25-Jul-14 324.01 431.00 14-Oct-14 308.31 422.00 24-Oct-14 287.06 395.00 14-Jan-15 293.27 389.00 30-Jan-15 354.53 410.00 14-Apr-15 385.11 412.00 24-Apr-15 445.10 480.00 24-Jul-15 529.42 700.00 09-Oct-15 539.80 720.00 23-Oct-15 599.03 777.00 12-Jan-16 617.89 800.00 29-Apr-16 659.59 880.00 29-Jul-16 758.81 920.00 17-Oct-16 812.95 1050.00 28-Oct-16 776.32 1000.00 * Asterisk signifies initiation or assumption of coverage.
Target Price Closing Price AMZN.OQ
01- Jan- 2014 01- Jan- 2015 01- Jan- 2016200
400
600
800
1,000
1,200
O U T PERFO RM
3-Year Price and Rating History for F5 Networks (FFIV.OQ)
FFIV.OQ Closing Price Target Price Date (US$) (US$) Rating 14-Oct-14 109.82 140.00 O * 17-Feb-15 116.43 140.00 * 29-Oct-15 110.08 130.00 21-Jan-16 89.51 110.00 13-Jul-16 116.36 125.00 21-Jul-16 121.86 125.00 N 27-Oct-16 130.99 134.00 * Asterisk signifies initiation or assumption of coverage.
Target Price Closing Price FFIV.OQ
01- Jan- 2015 01- Jul- 2015 01- Jan- 2016 01- Jul- 201680
105
130
155
O U T PERFO RMN EU T RA L
3-Year Price and Rating History for International Business Machines Corp. (IBM.N)
IBM.N Closing Price Target Price Date (US$) (US$) Rating 13-Jan-14 184.16 160.00 U 21-Oct-14 163.23 125.00 20-Jan-16 121.86 110.00 * Asterisk signifies initiation or assumption of coverage.
Target Price Closing Price IBM.N
01- Jan- 2014 01- Jan- 2015 01- Jan- 2016110
130
150
170
190
210
U N D ERPERFO RM
The analyst(s) responsible for preparing this research report received Compensation that is based upon various factors including Credit Suisse's total revenues, a portion of which are generated by Credit Suisse's investment banking activitiesAs of December 10, 2012 Analysts’ stock rating are defined as follows:Outperform (O) : The stock’s total return is expected to outperform the relevant benchmark* over the next 12 months.Neutral (N) : The stock’s total return is expected to be in line with the relevant benchmark* over the next 12 months.Underperform (U) : The stock’s total return is expected to underperform the relevant benchmark* over the next 12 months.
18 November 2016
F5 Networks (FFIV) 11
*Relevant benchmark by region: As of 10th December 2012, Japanese ratings are based on a stock’s total return relative to the analyst's coverage universe which consists of all companies covered by the analyst within the relevant sector, with Outperforms representing the most attractive, Neutrals the less attractive, and Underperforms the least attractive investment opportunities. As of 2nd October 2012, U.S. and Canadian as well as European ratings are based on a stock’s total return relative to the analyst's coverage universe which consists of all companies covered by the analyst within the relevant sector, with Outperforms representing the most attractive, Neutrals the less attractive, and Underperforms the least attractive investment opportunities. For Latin American and non-Japan Asia stocks, ratings are based on a stock’s total return relative to the average total return of the relevant country or regional benchmark; prior to 2nd October 2012 U.S. and Canadian ratings were based on (1) a stock’s absolute total return potential to its current share price and (2) the relative attractiveness of a stock’s total return potential within an analyst’s coverage universe. For Australian and New Zealand stocks, the expected total return (ETR) calculation includes 12-month rolling dividend yield. An Outperform rating is assigned where an ETR is greater than or equal to 7.5%; Underperform where an ETR less than or equal to 5%. A Neutral may be assigned where the ETR is between -5% and 15%. The overlapping rating range allows analysts to assign a rating that puts ETR in the context of associated risks. Prior to 18 May 2015, ETR ranges for Outperform and Underperform ratings did not overlap with Neutral thresholds between 15% and 7.5%, which was in operation from 7 July 2011.Restricted (R) : In certain circumstances, Credit Suisse policy and/or applicable law and regulations preclude certain types of communications, including an investment recommendation, during the course of Credit Suisse's engagement in an investment banking transaction and in certain other circumstances.Not Rated (NR) : Credit Suisse Equity Research does not have an investment rating or view on the stock or any other securities related to the company at this time.Not Covered (NC) : Credit Suisse Equity Research does not provide ongoing coverage of the company or offer an investment rating or investment view on the equity security of the company or related products.Volatility Indicator [V] : A stock is defined as volatile if the stock price has moved up or down by 20% or more in a month in at least 8 of the past 24 months or the analyst expects significant volatility going forward.Analysts’ sector weightings are distinct from analysts’ stock ratings and are based on the analyst’s expectations for the fundamentals and/or valuation of the sector* relative to the group’s historic fundamentals and/or valuation:Overweight : The analyst’s expectation for the sector’s fundamentals and/or valuation is favorable over the next 12 months.Market Weight : The analyst’s expectation for the sector’s fundamentals and/or valuation is neutral over the next 12 months.Underweight : The analyst’s expectation for the sector’s fundamentals and/or valuation is cautious over the next 12 months. *An analyst’s coverage sector consists of all companies covered by the analyst within the relevant sector. An analyst may cover multiple sectors.
Credit Suisse's distribution of stock ratings (and banking clients) is:
Global Ratings DistributionRating Versus universe (%) Of which banking clients (%)Outperform/Buy* 44% (63% banking clients)Neutral/Hold* 39% (60% banking clients)Underperform/Sell* 15% (55% banking clients)Restricted 3%*For purposes of the NYSE and NASD ratings distribution disclosure requirements, our stock ratings of Outperform, Neutral, and Underperform most closely correspond to Buy, Hold, and Sell, respectively; however, the meanings are not the same, as our stock ratings are determined on a relative basis. (Please refer to definitions above.) An investor's decision to buy or sell a security should be based on investment objectives, current holdings, and other individual factors.
Important Global Disclosures Credit Suisse’s research reports are made available to clients through our proprietary research portal on CS PLUS. Credit Suisse research products may also be made available through third-party vendors or alternate electronic means as a convenience. Certain research products are only made available through CS PLUS. The services provided by Credit Suisse’s analysts to clients may depend on a specific client’s preferences regarding the frequency and manner of receiving communications, the client’s risk profile and investment, the size and scope of the overall client relationship with the Firm, as well as legal and regulatory constraints. To access all of Credit Suisse’s research that you are entitled to receive in the most timely manner, please contact your sales representative or go to https://plus.credit-suisse.com . Credit Suisse’s policy is to update research reports as it deems appropriate, based on developments with the subject company, the sector or the market that may have a material impact on the research views or opinions stated herein.Credit Suisse's policy is only to publish investment research that is impartial, independent, clear, fair and not misleading. For more detail please refer to Credit Suisse's Policies for Managing Conflicts of Interest in connection with Investment Research: http://www.csfb.com/research-and-analytics/disclaimer/managing_conflicts_disclaimer.html . Credit Suisse's policy is only to publish investment research that is impartial, independent, clear, fair and not misleading. For more detail please refer to Credit Suisse's Policies for Managing Conflicts of Interest in connection with Investment Research:
Target Price and RatingValuation Methodology and Risks: (12 months) for F5 Networks (FFIV.OQ)
Method: We focus our valuation on a P/E multiple valuation (comparing P/E with networking hardware peers). Our approach suggests that the business’s equity value is $134 per share (based on 13x FY17 EPS) and include $1.2bn of net cash to our valuation. We see product revenues as flat and do not see further upside from the $134 price level, therefore, F5 recieves a Neutral rating.
Risk: Risks to our $134 target for F5 include: 1) the transition to virtual appliances and the resulting compression in economics; 2) SDN incorporating "good enough" F5 ADC functionality; 3) transition to DevOps and converged infrastructures, eroding traditional F5 buying centers; and 4) security initiatives failing to garner market traction. These are also risks for the Neutral rating.
18 November 2016
F5 Networks (FFIV) 12
Please refer to the firm's disclosure website at https://rave.credit-suisse.com/disclosures for the definitions of abbreviations typically used in the target price method and risk sections. See the Companies Mentioned section for full company names The subject company (FFIV.OQ, AMZN.OQ, IBM.N, GOOGL.OQ) currently is, or was during the 12-month period preceding the date of distribution of this report, a client of Credit Suisse.Credit Suisse provided investment banking services to the subject company (IBM.N, GOOGL.OQ) within the past 12 months.Credit Suisse provided non-investment banking services to the subject company (IBM.N) within the past 12 monthsCredit Suisse has managed or co-managed a public offering of securities for the subject company (GOOGL.OQ) within the past 12 months.Credit Suisse has received investment banking related compensation from the subject company (IBM.N, GOOGL.OQ) within the past 12 monthsCredit Suisse expects to receive or intends to seek investment banking related compensation from the subject company (FFIV.OQ, AMZN.OQ, IBM.N, GOOGL.OQ) within the next 3 months.Credit Suisse has received compensation for products and services other than investment banking services from the subject company (IBM.N) within the past 12 monthsAs of the date of this report, Credit Suisse makes a market in the following subject companies (FFIV.OQ, AMZN.OQ, IBM.N, GOOGL.OQ).Credit Suisse beneficially holds >0.5% long position of the total issued share capital of the subject company (GOOGL.OQ).For date and time of production, dissemination and history of recommendation for the subject company(ies) featured in this report, disseminated within the past 12 months, please refer to the link: https://rave.credit-suisse.com/disclosures/view/report?i=271500&v=6no9z4hbyd9l7k9uzwc6tkyky . Important Regional Disclosures Singapore recipients should contact Credit Suisse AG, Singapore Branch for any matters arising from this research report.The analyst(s) involved in the preparation of this report may participate in events hosted by the subject company, including site visits. Credit Suisse does not accept or permit analysts to accept payment or reimbursement for travel expenses associated with these events.Restrictions on certain Canadian securities are indicated by the following abbreviations: NVS--Non-Voting shares; RVS--Restricted Voting Shares; SVS--Subordinate Voting Shares.Individuals receiving this report from a Canadian investment dealer that is not affiliated with Credit Suisse should be advised that this report may not contain regulatory disclosures the non-affiliated Canadian investment dealer would be required to make if this were its own report.For Credit Suisse Securities (Canada), Inc.'s policies and procedures regarding the dissemination of equity research, please visit https://www.credit-suisse.com/sites/disclaimers-ib/en/canada-research-policy.html.Credit Suisse has acted as lead manager or syndicate member in a public offering of securities for the subject company (IBM.N, GOOGL.OQ) within the past 3 years.Principal is not guaranteed in the case of equities because equity prices are variable.Commission is the commission rate or the amount agreed with a customer when setting up an account or at any time after that.This research report is authored by:Credit Suisse Securities (USA) LLC ...........................................Sami Badri ; Kulbinder Garcha ; Philip Wang ; Syed Talha Saleem ; William ChuFor Credit Suisse disclosure information on other companies mentioned in this report, please visit the website at https://rave.credit-suisse.com/disclosures or call +1 (877) 291-2683.
18 November 2016
F5 Networks (FFIV) 13
This report is produced by subsidiaries and affiliates of Credit Suisse operating under its Global Markets Division. For more information on our structure, please use the following link: https://www.credit-suisse.com/who-we-are This report may contain material that is not directed to, or intended for distribution to or use by, any person or entity who is a citizen or resident of or located in any locality, state, country or other jurisdiction where such distribution, publication, availability or use would be contrary to law or regulation or which would subject Credit Suisse or its affiliates ("CS") to any registration or licensing requirement within such jurisdiction. All material presented in this report, unless specifically indicated otherwise, is under copyright to CS. None of the material, nor its content, nor any copy of it, may be altered in any way, transmitted to, copied or distributed to any other party, without the prior express written permission of CS. All trademarks, service marks and logos used in this report are trademarks or service marks or registered trademarks or service marks of CS or its affiliates.The information, tools and material presented in this report are provided to you for information purposes only and are not to be used or considered as an offer or the solicitation of an offer to sell or to buy or subscribe for securities or other financial instruments. CS may not have taken any steps to ensure that the securities referred to in this report are suitable for any particular investor. CS will not treat recipients of this report as its customers by virtue of their receiving this report. The investments and services contained or referred to in this report may not be suitable for you and it is recommended that you consult an independent investment advisor if you are in doubt about such investments or investment services. Nothing in this report constitutes investment, legal, accounting or tax advice, or a representation that any investment or strategy is suitable or appropriate to your individual circumstances, or otherwise constitutes a personal recommendation to you. CS does not advise on the tax consequences of investments and you are advised to contact an independent tax adviser. Please note in particular that the bases and levels of taxation may change. Information and opinions presented in this report have been obtained or derived from sources believed by CS to be reliable, but CS makes no representation as to their accuracy or completeness. CS accepts no liability for loss arising from the use of the material presented in this report, except that this exclusion of liability does not apply to the extent that such liability arises under specific statutes or regulations applicable to CS. This report is not to be relied upon in substitution for the exercise of independent judgment. CS may have issued, and may in the future issue, other communications that are inconsistent with, and reach different conclusions from, the information presented in this report. Those communications reflect the different assumptions, views and analytical methods of the analysts who prepared them and CS is under no obligation to ensure that such other communications are brought to the attention of any recipient of this report. Some investments referred to in this report will be offered solely by a single entity and in the case of some investments solely by CS, or an associate of CS or CS may be the only market maker in such investments. Past performance should not be taken as an indication or guarantee of future performance, and no representation or warranty, express or implied, is made regarding future performance. Information, opinions and estimates contained in this report reflect a judgment at its original date of publication by CS and are subject to change without notice. The price, value of and income from any of the securities or financial instruments mentioned in this report can fall as well as rise. The value of securities and financial instruments is subject to exchange rate fluctuation that may have a positive or adverse effect on the price or income of such securities or financial instruments. Investors in securities such as ADR's, the values of which are influenced by currency volatility, effectively assume this risk. Structured securities are complex instruments, typically involve a high degree of risk and are intended for sale only to sophisticated investors who are capable of understanding and assuming the risks involved. The market value of any structured security may be affected by changes in economic, financial and political factors (including, but not limited to, spot and forward interest and exchange rates), time to maturity, market conditions and volatility, and the credit quality of any issuer or reference issuer. Any investor interested in purchasing a structured product should conduct their own investigation and analysis of the product and consult with their own professional advisers as to the risks involved in making such a purchase. Some investments discussed in this report may have a high level of volatility. High volatility investments may experience sudden and large falls in their value causing losses when that investment is realised. Those losses may equal your original investment. Indeed, in the case of some investments the potential losses may exceed the amount of initial investment and, in such circumstances, you may be required to pay more money to support those losses. Income yields from investments may fluctuate and, in consequence, initial capital paid to make the investment may be used as part of that income yield. Some investments may not be readily realisable and it may be difficult to sell or realise those investments, similarly it may prove difficult for you to obtain reliable information about the value, or risks, to which such an investment is exposed. This report may provide the addresses of, or contain hyperlinks to, websites. Except to the extent to which the report refers to website material of CS, CS has not reviewed any such site and takes no responsibility for the content contained therein. Such address or hyperlink (including addresses or hyperlinks to CS's own website material) is provided solely for your convenience and information and the content of any such website does not in any way form part of this document. Accessing such website or following such link through this report or CS's website shall be at your own risk.
This report is issued and distributed in European Union (except Switzerland): by Credit Suisse Securities (Europe) Limited, One Cabot Square, London E14 4QJ, England, which is authorised by the Prudential Regulation Authority and regulated by the Financial Conduct Authority and the Prudential Regulation Authority. Germany: Credit Suisse Securities (Europe) Limited Niederlassung Frankfurt am Main regulated by the Bundesanstalt fuer Finanzdienstleistungsaufsicht ("BaFin"). United States and Canada: Credit Suisse Securities (USA) LLC; Switzerland: Credit Suisse AG; Brazil: Banco de Investimentos Credit Suisse (Brasil) S.A or its affiliates; Mexico: Banco Credit Suisse (México), S.A. (transactions related to the securities mentioned in this report will only be effected in compliance with applicable regulation); Japan: by Credit Suisse Securities (Japan) Limited, Financial Instruments Firm, Director-General of Kanto Local Finance Bureau ( Kinsho) No. 66, a member of Japan Securities Dealers Association, The Financial Futures Association of Japan, Japan Investment Advisers Association, Type II Financial Instruments Firms Association; Hong Kong: Credit Suisse (Hong Kong) Limited; Australia: Credit Suisse Equities (Australia) Limited; Thailand: Credit Suisse Securities (Thailand) Limited, regulated by the Office of the Securities and Exchange Commission, Thailand, having registered address at 990 Abdulrahim Place, 27th Floor, Unit 2701, Rama IV Road, Silom, Bangrak, Bangkok10500, Thailand, Tel. +66 2614 6000; Malaysia: Credit Suisse Securities (Malaysia) Sdn Bhd, Credit Suisse AG, Singapore Branch; India: Credit Suisse Securities (India) Private Limited (CIN no.U67120MH1996PTC104392) regulated by the Securities and Exchange Board of India as Research Analyst (registration no. INH 000001030) and as Stock Broker (registration no. INB230970637; INF230970637; INB010970631; INF010970631), having registered address at 9th Floor, Ceejay House, Dr.A.B. Road, Worli, Mumbai - 18, India, T- +91-22 6777 3777; South Korea: Credit Suisse Securities (Europe) Limited, Seoul Branch; Taiwan: Credit Suisse AG Taipei Securities Branch; Indonesia: PT Credit Suisse Securities Indonesia; Philippines: Credit Suisse Securities (Philippines ) Inc., and elsewhere in the world by the relevant authorised affiliate of the above. Additional Regional DisclaimersHong Kong: Credit Suisse (Hong Kong) Limited ("CSHK") is licensed and regulated by the Securities and Futures Commission of Hong Kong under the laws of Hong Kong, which differ from Australian laws. CSHKL does not hold an Australian financial services licence (AFSL) and is exempt from the requirement to hold an AFSL under the Corporations Act 2001 (the Act) under Class Order 03/1103 published by the ASIC in respect of financial services provided to Australian wholesale clients (within the meaning of section 761G of the Act). Research on Taiwanese securities produced by Credit Suisse AG, Taipei Securities Branch has been prepared by a registered Senior Business Person. Malaysia: Research provided to residents of Malaysia is authorised by the Head of Research for Credit Suisse Securities (Malaysia) Sdn Bhd, to whom they should direct any queries on +603 2723 2020. Singapore: This report has been prepared and issued for distribution in Singapore to institutional investors, accredited investors and expert investors (each as defined under the Financial Advisers Regulations) only, and is also distributed by Credit Suisse AG, Singapore branch to overseas investors (as defined under the Financial Advisers Regulations). By virtue of your status as an institutional investor, accredited investor, expert investor or overseas investor, Credit Suisse AG, Singapore branch is exempted from complying with certain compliance requirements under the Financial Advisers Act, Chapter 110 of Singapore (the "FAA"), the Financial Advisers Regulations and the relevant Notices and Guidelines issued thereunder, in respect of any financial advisory service which Credit Suisse AG, Singapore branch may provide to you. UAE: This information is being distributed by Credit Suisse AG (DIFC Branch), duly licensed and regulated by the Dubai Financial Services Authority (“DFSA”). Related financial services or products are only made available to Professional Clients or Market Counterparties, as defined by the DFSA, and are not intended for any other persons. Credit Suisse AG (DIFC Branch) is located on Level 9 East, The Gate Building, DIFC, Dubai, United Arab Emirates. EU: This report has been produced by subsidiaries and affiliates of Credit Suisse operating under its Global Markets Division This research may not conform to Canadian disclosure requirements. In jurisdictions where CS is not already registered or licensed to trade in securities, transactions will only be effected in accordance with applicable securities legislation, which will vary from jurisdiction to jurisdiction and may require that the trade be made in accordance with applicable exemptions from registration or licensing requirements. Non-US customers wishing to effect a transaction should contact a CS entity in their local jurisdiction unless governing law permits otherwise. US customers wishing to effect a transaction should do so only by contacting a representative at Credit Suisse Securities (USA) LLC in the US. Please note that this research was originally prepared and issued by CS for distribution to their market professional and institutional investor customers. Recipients who are not market professional or institutional investor customers of CS should seek the advice of their independent financial advisor prior to taking any investment decision based on this report or for any necessary explanation of its contents. This research may relate to investments or services of a person outside of the UK or to other matters which are not authorised by the Prudential Regulation Authority and regulated by the Financial Conduct Authority and the Prudential Regulation Authority or in respect of which the protections of the Prudential Regulation Authority and Financial Conduct Authority for private customers and/or the UK compensation scheme may not be available, and further details as to where this may be the case are available upon request in respect of this report. CS may provide various services to US municipal entities or obligated persons ("municipalities"), including suggesting individual transactions or trades and entering into such transactions. Any services CS provides to municipalities are not viewed as "advice" within the meaning of Section 975 of the Dodd-Frank Wall Street Reform and Consumer Protection Act. CS is providing any such services and related information solely on an arm's length basis and not as an advisor or fiduciary to the municipality. In connection with the provision of the any such services, there is no agreement, direct or indirect, between any municipality (including the officials,management, employees or agents thereof) and CS for CS to provide advice to the municipality. Municipalities should consult with their financial, accounting and legal advisors regarding any such services provided by CS. In addition, CS is not acting for direct or indirect compensation to solicit the municipality on behalf of an unaffiliated broker, dealer, municipal securities dealer, municipal advisor, or investment adviser for the purpose of obtaining or retaining an engagement by the municipality for or in connection with Municipal Financial Products, the issuance of municipal securities, or of an investment adviser to provide investment advisory services to or on behalf of the municipality. If this report is being distributed by a financial institution other than Credit Suisse AG, or its affiliates, that financial institution is solely responsible for distribution. Clients of that institution should contact that institution to effect a transaction in the securities mentioned in this report or require further information. This report does not constitute investment advice by Credit Suisse to the clients of the distributing financial institution, and neither Credit Suisse AG, its affiliates, and their respective officers, directors and employees accept any liability whatsoever for any direct or consequential loss arising from their use of this report or its content. Principal is not guaranteed. Commission is the commission rate or the amount agreed with a customer when setting up an account or at any time after that. Copyright © 2016 CREDIT SUISSE AG and/or its affiliates. All rights reserved. Investment principal on bonds can be eroded depending on sale price or market price. In addition, there are bonds on which investment principal can be eroded due to changes in redemption amounts. Care is required when investing in such instruments. When you purchase non-listed Japanese fixed income securities (Japanese government bonds, Japanese municipal bonds, Japanese government guaranteed bonds, Japanese corporate bonds) from CS as a seller, you will be requested to pay the purchase price only.


