Embed Size (px)
Citation preview
GENERAL INFORMATION 1LAND AND OTHER NATURAL RESOURCES • Land Area by City/Municipality 4 • Land Classification Statistics 6 • Geographical Zone Surfaces 6 • Mineral Resources 7 • Forest Cover 8 • Watersheds 9 • Greenhouse Gas (GHG) Emissions 10 • Coastal Resources 14 DEMOGRAPHY • Population Size by City/Municipality by Census Years 19 • Actual and Projected Population and Number of Households, 20 Growth Rate by City/Municipality • Household Population by Sex by City/Municipality 22 • Population Density 22 • Life Expectancy 23 • Projected Population by Province, MIMAROPA 23 • Urban-Rural Population 24 • Seven Tribes of Mangyan 26 • Mangyan Attire 28 • Mangyan Tribes by Municipality 29 • List of Ancestral Domain Attributes and their Status 39 ECONOMIC PROFILE • Agriculture 30 • Tourism 37 • Commerce and Industry 44 INFRASTRUCTURE AND UTILITIES • Transportation 44 • Communication 50 • Water 53 • Power 57 SOCIAL DEVELOPMENT PROFILE • Labor and Employment 60 • Poverty and Income 60 • Health 65 • Education 70 • Social Welfare Services 72 • Protective Services 74 FINANCIAL PROFILE • Income Classification of City/Municipality 76 • Annual Income and Budget per City/Municipality 76 • Income and Expenditure 77 INSTITUTIONAL PROFILE • Organizational Chart of the Provincial Government of 78 Oriental Mindoro • Provincial Government Personnel by Office 79 • Provincial Government Personnel by Status 79
TABLE OF CONTENTS
ORIENTAL MINDORO FACTS AND FIGURES 2018
PROVINCIAL PLANNING AND DEVELOPMENT OFFICERESEARCH, PROJECT DEVELOPMENT AND DATABASE MANAGEMENT DIVISION i

GENERALINFORMATION
O R I E N TA L M I N D O R O F A C T S A N D F I G U R E S 2 0 1 8
ORIENTALMINDORO
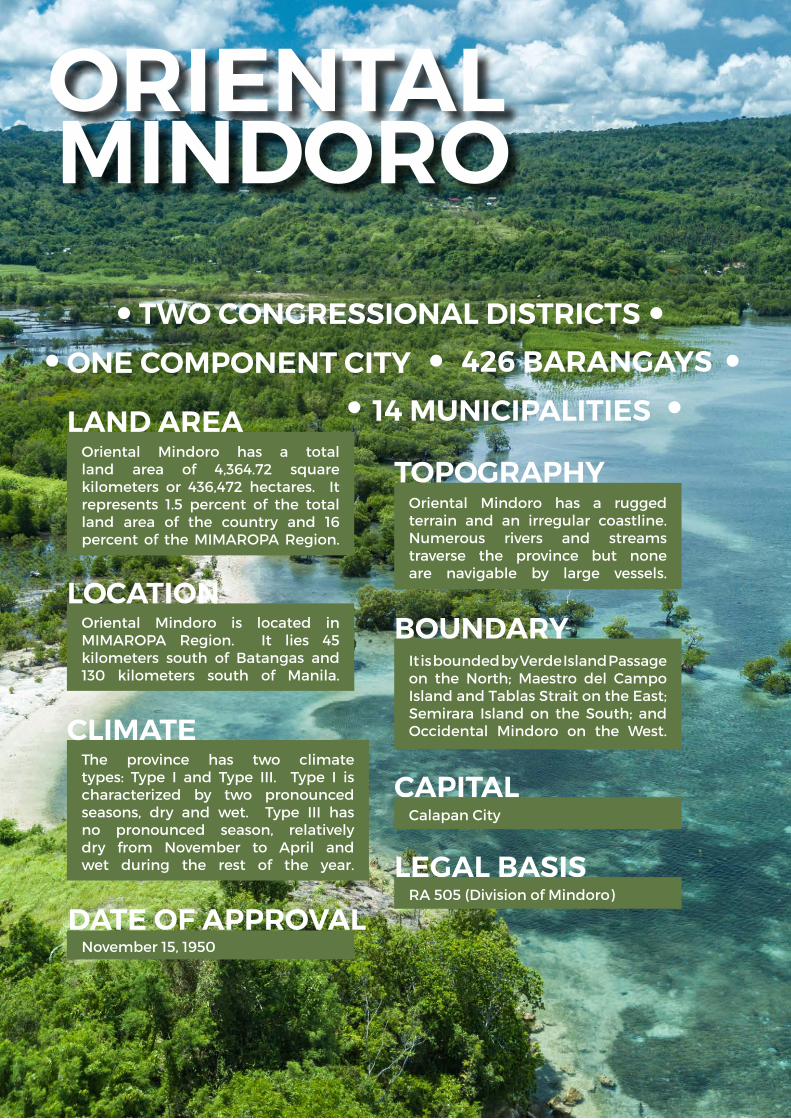
Oriental Mindoro is located in MIMAROPA Region. It lies 45 kilometers south of Batangas and 130 kilometers south of Manila.
LOCATION
Oriental Mindoro has a rugged terrain and an irregular coastline. Numerous rivers and streams traverse the province but none are navigable by large vessels.
Oriental Mindoro has a total land area of 4,364.72 square kilometers or 436,472 hectares. It represents 1.5 percent of the total land area of the country and 16 percent of the MIMAROPA Region.
TOPOGRAPHY
LAND AREA
It is bounded by Verde Island Passage on the North; Maestro del Campo Island and Tablas Strait on the East; Semirara Island on the South; and Occidental Mindoro on the West.
The province has two climate types: Type I and Type III. Type I is characterized by two pronounced seasons, dry and wet. Type III has no pronounced season, relatively dry from November to April and wet during the rest of the year.
BOUNDARY
CLIMATE
CAPITALCalapan City
November 15, 1950DATE OF APPROVAL
LEGAL BASISRA 505 (Division of Mindoro)
ONE COMPONENT CITY
14 MUNICIPALITIES
TWO CONGRESSIONAL DISTRICTS
426 BARANGAYS
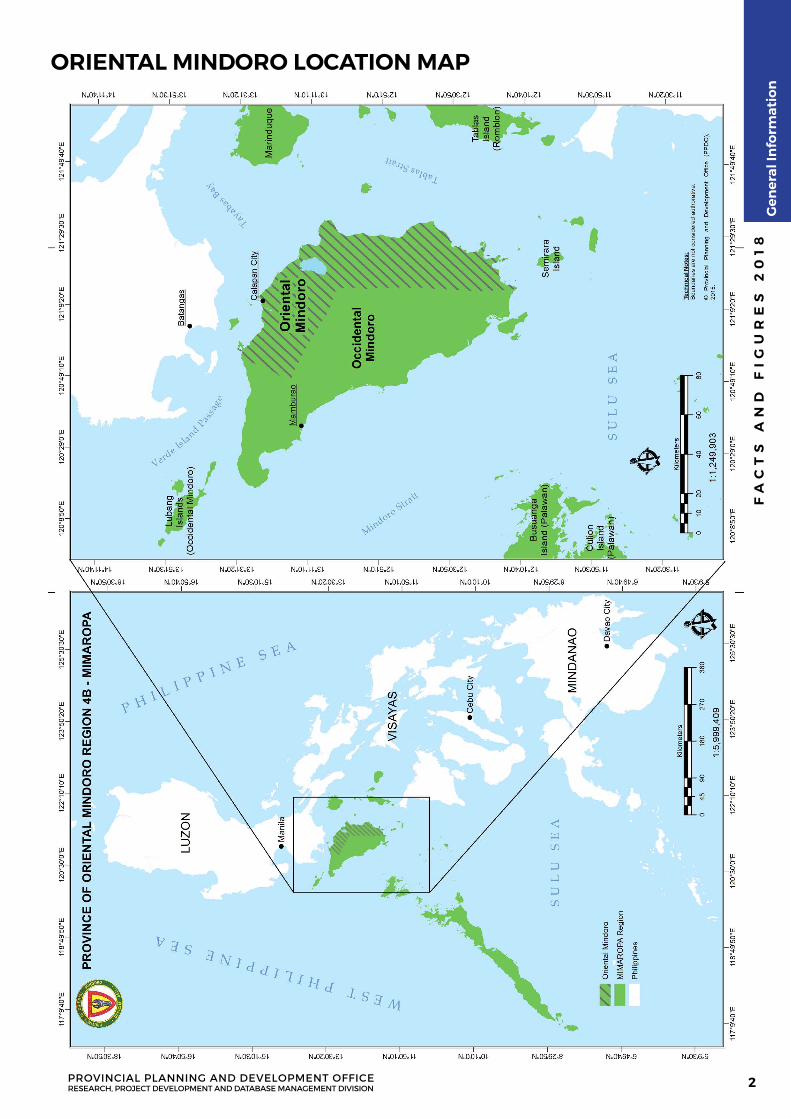
ORIENTAL MINDORO LOCATION MAP
FA
CT
S A
ND
FI
GU
RE
S 2
01
8
PROVINCIAL PLANNING AND DEVELOPMENT OFFICERESEARCH, PROJECT DEVELOPMENT AND DATABASE MANAGEMENT DIVISION
Gen
eral
Info
rmat
ion
2
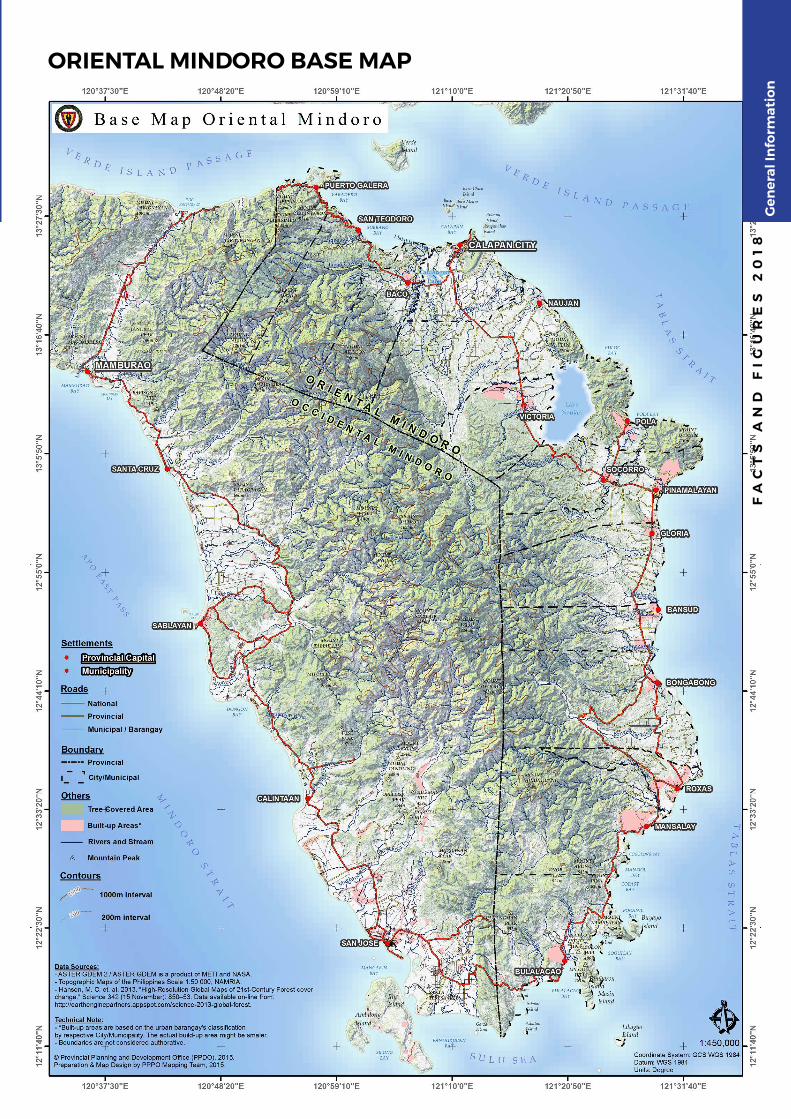
ORIENTAL MINDORO BASE MAP
FA
CT
S A
ND
FI
GU
RE
S 2
01
8G
ener
al In
form
atio
n

LAND ANDOTHER NATURAL
O R I E N TA L M I N D O R O F A C T S A N D F I G U R E S 2 0 1 8
RESOURCES
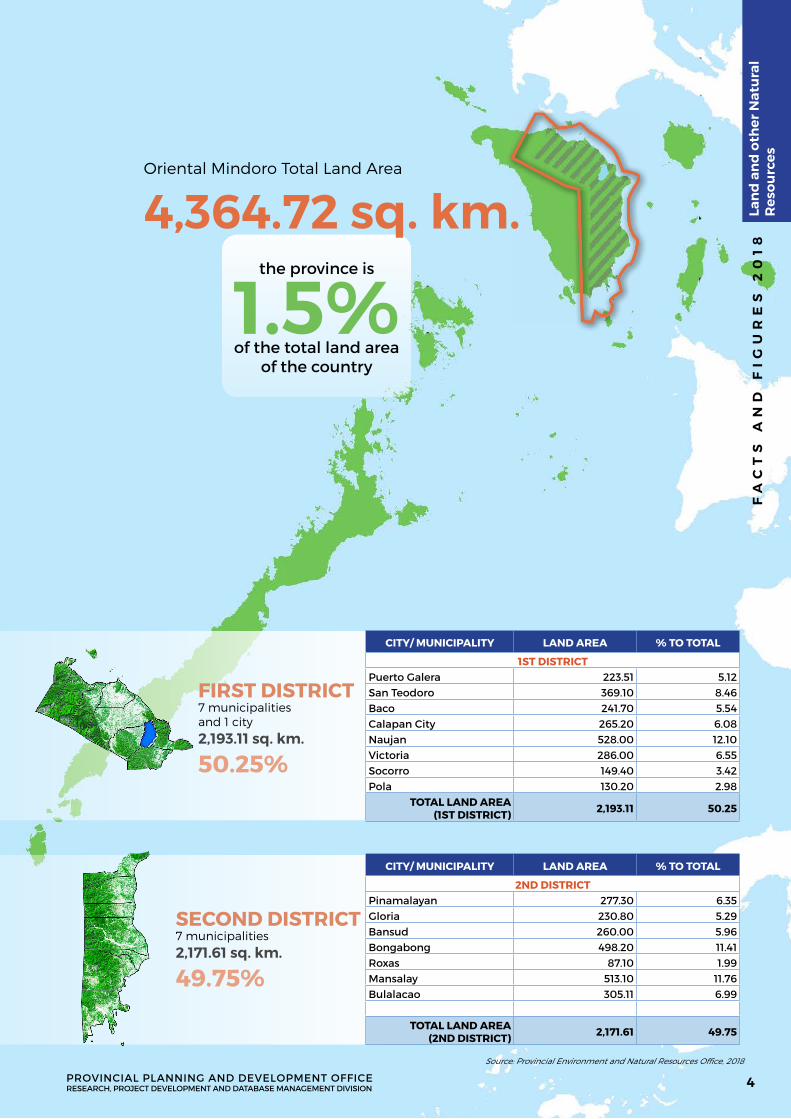
CITY/ MUNICIPALITY LAND AREA % TO TOTAL
1ST DISTRICTPuerto Galera 223.51 5.12San Teodoro 369.10 8.46Baco 241.70 5.54Calapan City 265.20 6.08Naujan 528.00 12.10Victoria 286.00 6.55Socorro 149.40 3.42Pola 130.20 2.98
TOTAL LAND AREA (1ST DISTRICT) 2,193.11 50.25
Oriental Mindoro Total Land Area
CITY/ MUNICIPALITY LAND AREA % TO TOTAL
2ND DISTRICTPinamalayan 277.30 6.35Gloria 230.80 5.29Bansud 260.00 5.96Bongabong 498.20 11.41Roxas 87.10 1.99Mansalay 513.10 11.76Bulalacao 305.11 6.99
TOTAL LAND AREA (2ND DISTRICT) 2,171.61 49.75
4,364.72 sq. km.
FIRST DISTRICT7 municipalities and 1 city2,193.11 sq. km.
50.25%
SECOND DISTRICT7 municipalities 2,171.61 sq. km.
49.75%
Source: Provincial Environment and Natural Resources Office, 2018
the province is
1.5%of the total land area
of the country
FA
CT
S A
ND
FI
GU
RE
S 2
01
8
PROVINCIAL PLANNING AND DEVELOPMENT OFFICERESEARCH, PROJECT DEVELOPMENT AND DATABASE MANAGEMENT DIVISION
Lan
d a
nd
oth
er N
atu
ral
Res
ou
rces
4
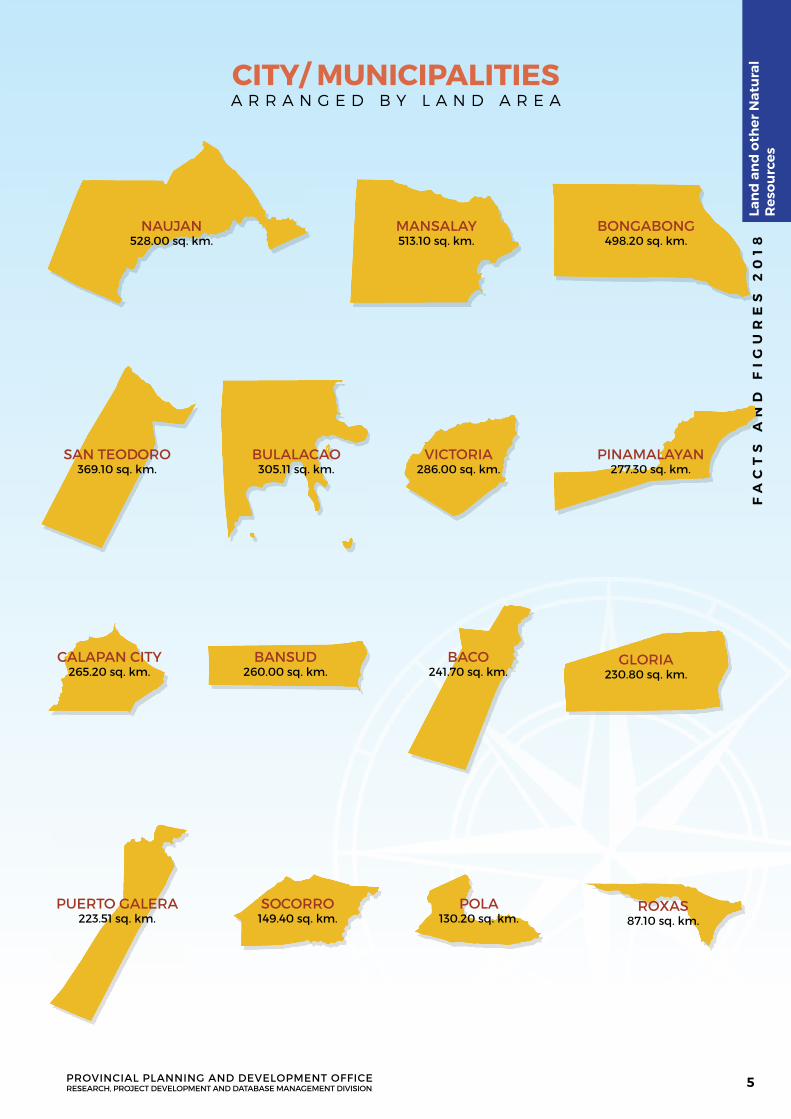
A R R A N G E D B Y L A N D A R E ACITY/ MUNICIPALITIES
FA
CT
S A
ND
FI
GU
RE
S 2
01
8
NAUJAN528.00 sq. km.
MANSALAY513.10 sq. km.
BONGABONG498.20 sq. km.
VICTORIA286.00 sq. km.
BULALACAO305.11 sq. km.
SAN TEODORO369.10 sq. km.
PINAMALAYAN277.30 sq. km.
BANSUD260.00 sq. km.
CALAPAN CITY265.20 sq. km.
BACO241.70 sq. km.
GLORIA230.80 sq. km.
POLA130.20 sq. km.
ROXAS87.10 sq. km.
SOCORRO149.40 sq. km.
PUERTO GALERA223.51 sq. km.
PROVINCIAL PLANNING AND DEVELOPMENT OFFICERESEARCH, PROJECT DEVELOPMENT AND DATABASE MANAGEMENT DIVISION
Lan
d a
nd
oth
er N
atu
ral
Res
ou
rces
5
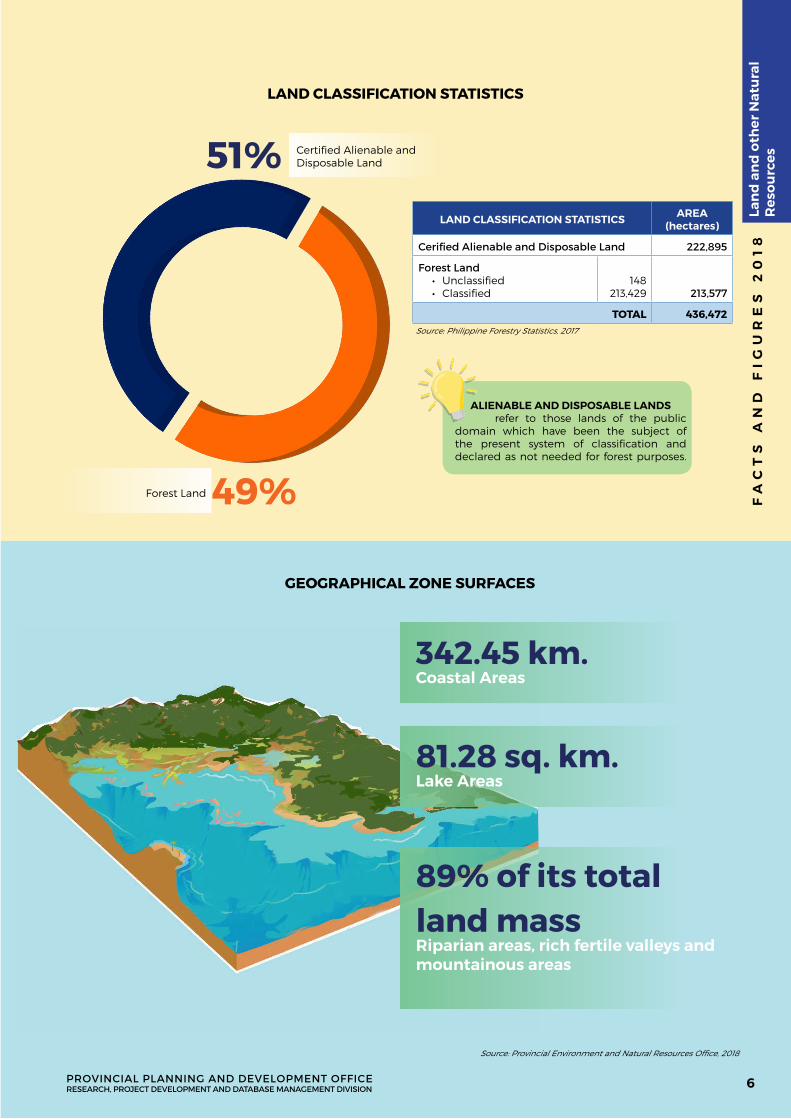
LAND CLASSIFICATION STATISTICS AREA(hectares)
Cerified Alienable and Disposable Land 222,895
Forest Land • Unclassified • Classified
148213,429 213,577
TOTAL 436,472Source: Philippine Forestry Statistics, 2017
ALIENABLE AND DISPOSABLE LANDS refer to those lands of the public domain which have been the subject of the present system of classification and declared as not needed for forest purposes.
342.45 km.Coastal Areas
LAND CLASSIFICATION STATISTICS
GEOGRAPHICAL ZONE SURFACES
51%
49%
Certified Alienable and Disposable Land
Forest Land
81.28 sq. km.Lake Areas
89% of its total land massRiparian areas, rich fertile valleys and mountainous areas
Source: Provincial Environment and Natural Resources Office, 2018
FA
CT
S A
ND
FI
GU
RE
S 2
01
8
PROVINCIAL PLANNING AND DEVELOPMENT OFFICERESEARCH, PROJECT DEVELOPMENT AND DATABASE MANAGEMENT DIVISION
Lan
d a
nd
oth
er N
atu
ral
Res
ou
rces
6
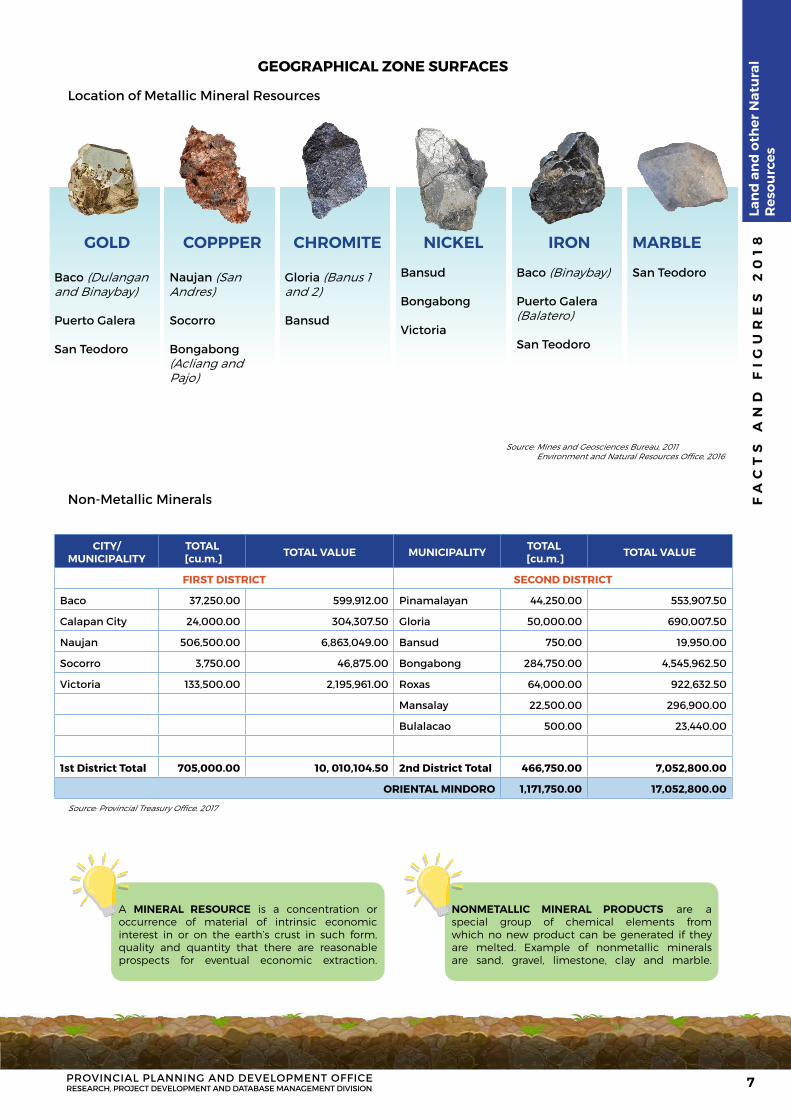
Location of Metallic Mineral Resources
CITY/ MUNICIPALITY
TOTAL [cu.m.] TOTAL VALUE MUNICIPALITY TOTAL
[cu.m.] TOTAL VALUE
FIRST DISTRICT SECOND DISTRICT
Baco 37,250.00 599,912.00 Pinamalayan 44,250.00 553,907.50
Calapan City 24,000.00 304,307.50 Gloria 50,000.00 690,007.50
Naujan 506,500.00 6,863,049.00 Bansud 750.00 19,950.00
Socorro 3,750.00 46,875.00 Bongabong 284,750.00 4,545,962.50
Victoria 133,500.00 2,195,961.00 Roxas 64,000.00 922,632.50
Mansalay 22,500.00 296,900.00
Bulalacao 500.00 23,440.00
1st District Total 705,000.00 10, 010,104.50 2nd District Total 466,750.00 7,052,800.00
ORIENTAL MINDORO 1,171,750.00 17,052,800.00
Source: Provincial Treasury Office, 2017
A MINERAL RESOURCE is a concentration or occurrence of material of intrinsic economic interest in or on the earth’s crust in such form, quality and quantity that there are reasonable prospects for eventual economic extraction.
NONMETALLIC MINERAL PRODUCTS are a special group of chemical elements from which no new product can be generated if they are melted. Example of nonmetallic minerals are sand, gravel, limestone, clay and marble.
GEOGRAPHICAL ZONE SURFACES
GOLD
Baco (Dulangan and Binaybay)
Puerto Galera
San Teodoro
COPPPER
Naujan (San Andres)
Socorro
Bongabong (Acliang and Pajo)
CHROMITE
Gloria (Banus 1 and 2)
Bansud
NICKEL
Bansud
Bongabong
Victoria
IRON
Baco (Binaybay)
Puerto Galera (Balatero)
San Teodoro
MARBLE
San Teodoro
Source: Mines and Geosciences Bureau, 2011 Environment and Natural Resources Office, 2016
Non-Metallic Minerals FA
CT
S A
ND
FI
GU
RE
S 2
01
8
PROVINCIAL PLANNING AND DEVELOPMENT OFFICERESEARCH, PROJECT DEVELOPMENT AND DATABASE MANAGEMENT DIVISION
Lan
d a
nd
oth
er N
atu
ral
Res
ou
rces
7
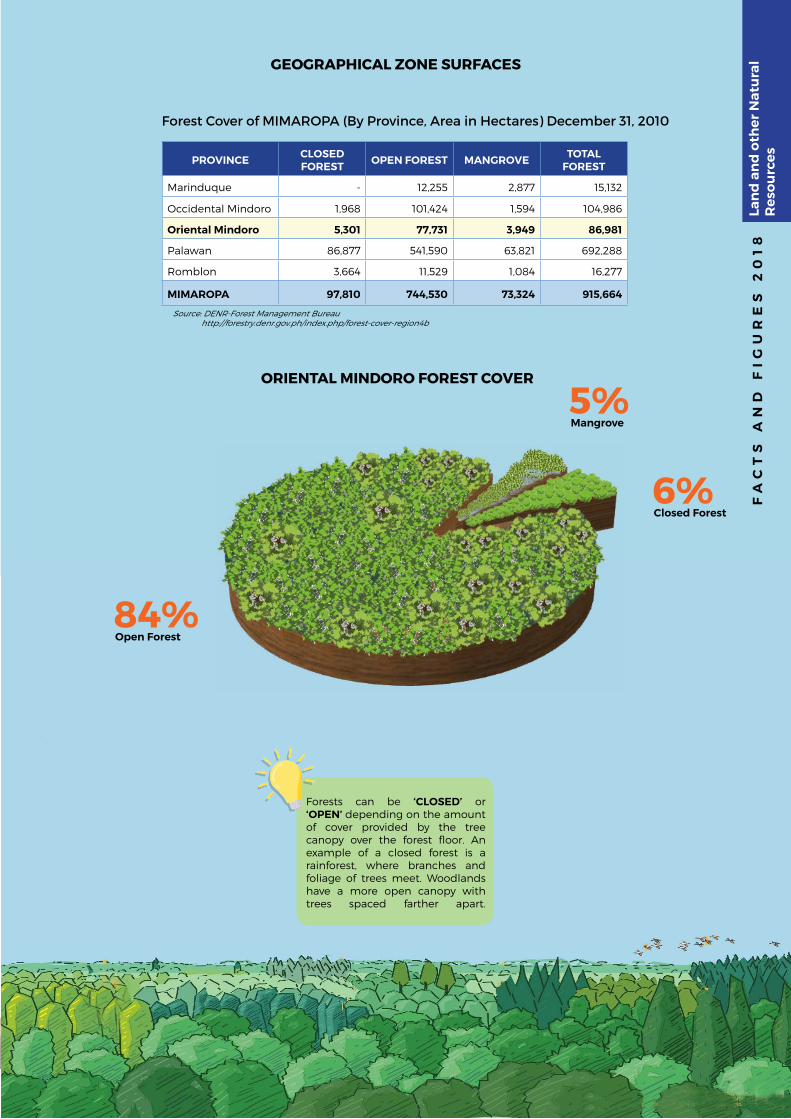
PROVINCE CLOSED FOREST OPEN FOREST MANGROVE TOTAL
FOREST
Marinduque - 12,255 2,877 15,132
Occidental Mindoro 1,968 101,424 1,594 104,986
Oriental Mindoro 5,301 77,731 3,949 86,981
Palawan 86,877 541,590 63,821 692,288
Romblon 3,664 11,529 1,084 16,277
MIMAROPA 97,810 744,530 73,324 915,664
Source: DENR-Forest Management Bureau http://forestry.denr.gov.ph/index.php/forest-cover-region4b
Forests can be ‘CLOSED’ or ‘OPEN’ depending on the amount of cover provided by the tree canopy over the forest floor. An example of a closed forest is a rainforest, where branches and foliage of trees meet. Woodlands have a more open canopy with trees spaced farther apart.
Mangrove
GEOGRAPHICAL ZONE SURFACES
Forest Cover of MIMAROPA (By Province, Area in Hectares) December 31, 2010
ORIENTAL MINDORO FOREST COVER
5%
Closed Forest6%
Open Forest84%
FA
CT
S A
ND
FI
GU
RE
S 2
01
8La
nd
an
d o
ther
Nat
ura
l R
eso
urc
es
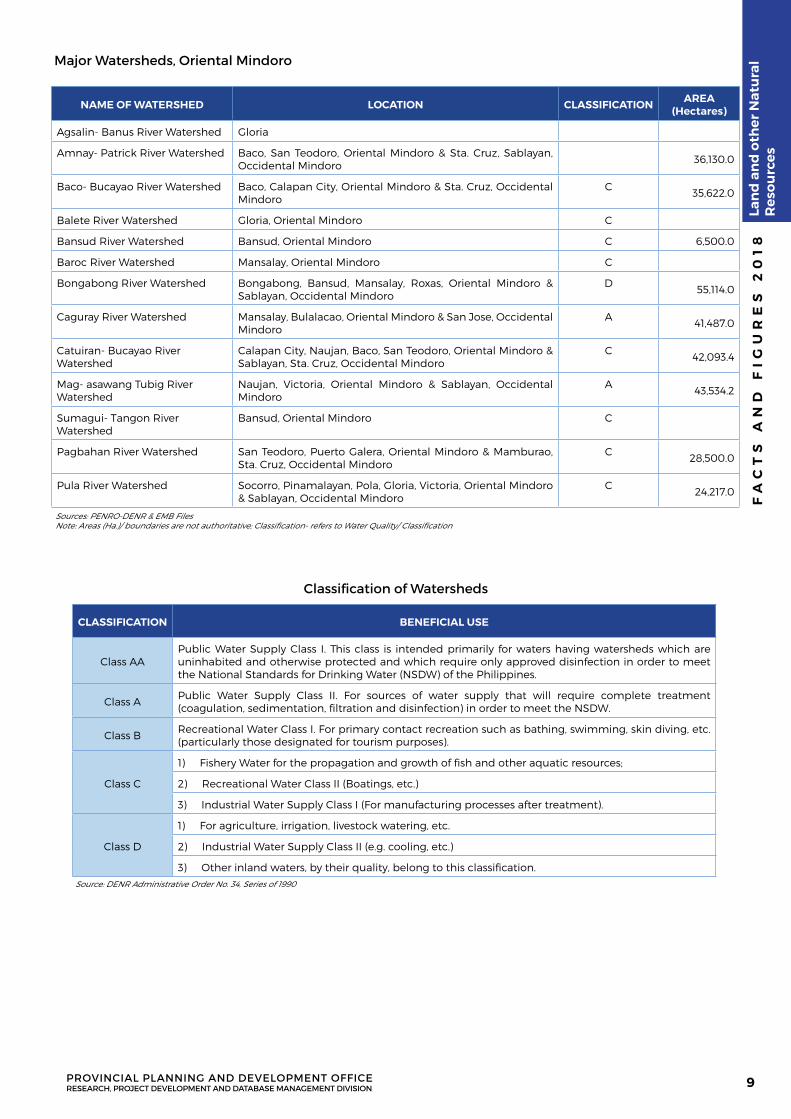
CLASSIFICATION BENEFICIAL USE
Class AAPublic Water Supply Class I. This class is intended primarily for waters having watersheds which are uninhabited and otherwise protected and which require only approved disinfection in order to meet the National Standards for Drinking Water (NSDW) of the Philippines.
Class APublic Water Supply Class II. For sources of water supply that will require complete treatment (coagulation, sedimentation, filtration and disinfection) in order to meet the NSDW.
Class BRecreational Water Class I. For primary contact recreation such as bathing, swimming, skin diving, etc. (particularly those designated for tourism purposes).
Class C
1) Fishery Water for the propagation and growth of fish and other aquatic resources;
2) Recreational Water Class II (Boatings, etc.)
3) Industrial Water Supply Class I (For manufacturing processes after treatment).
Class D
1) For agriculture, irrigation, livestock watering, etc.
2) Industrial Water Supply Class II (e.g. cooling, etc.)
3) Other inland waters, by their quality, belong to this classification.Source: DENR Administrative Order No. 34, Series of 1990
NAME OF WATERSHED LOCATION CLASSIFICATION AREA (Hectares)
Agsalin- Banus River Watershed Gloria
Amnay- Patrick River Watershed Baco, San Teodoro, Oriental Mindoro & Sta. Cruz, Sablayan, Occidental Mindoro
36,130.0
Baco- Bucayao River Watershed Baco, Calapan City, Oriental Mindoro & Sta. Cruz, Occidental Mindoro
C35,622.0
Balete River Watershed Gloria, Oriental Mindoro C
Bansud River Watershed Bansud, Oriental Mindoro C 6,500.0
Baroc River Watershed Mansalay, Oriental Mindoro C
Bongabong River Watershed Bongabong, Bansud, Mansalay, Roxas, Oriental Mindoro & Sablayan, Occidental Mindoro
D55,114.0
Caguray River Watershed Mansalay, Bulalacao, Oriental Mindoro & San Jose, Occidental Mindoro
A41,487.0
Catuiran- Bucayao River Watershed
Calapan City, Naujan, Baco, San Teodoro, Oriental Mindoro & Sablayan, Sta. Cruz, Occidental Mindoro
C42,093.4
Mag- asawang Tubig River Watershed
Naujan, Victoria, Oriental Mindoro & Sablayan, Occidental Mindoro
A43,534.2
Sumagui- Tangon River Watershed
Bansud, Oriental Mindoro C
Pagbahan River Watershed San Teodoro, Puerto Galera, Oriental Mindoro & Mamburao, Sta. Cruz, Occidental Mindoro
C 28,500.0
Pula River Watershed Socorro, Pinamalayan, Pola, Gloria, Victoria, Oriental Mindoro & Sablayan, Occidental Mindoro
C 24,217.0
Sources: PENRO-DENR & EMB FilesNote: Areas (Ha.)/ boundaries are not authoritative; Classification- refers to Water Quality/ Classification
Major Watersheds, Oriental Mindoro
Classification of Watersheds
FA
CT
S A
ND
FI
GU
RE
S 2
01
8
PROVINCIAL PLANNING AND DEVELOPMENT OFFICERESEARCH, PROJECT DEVELOPMENT AND DATABASE MANAGEMENT DIVISION
Lan
d a
nd
oth
er N
atu
ral
Res
ou
rces
9
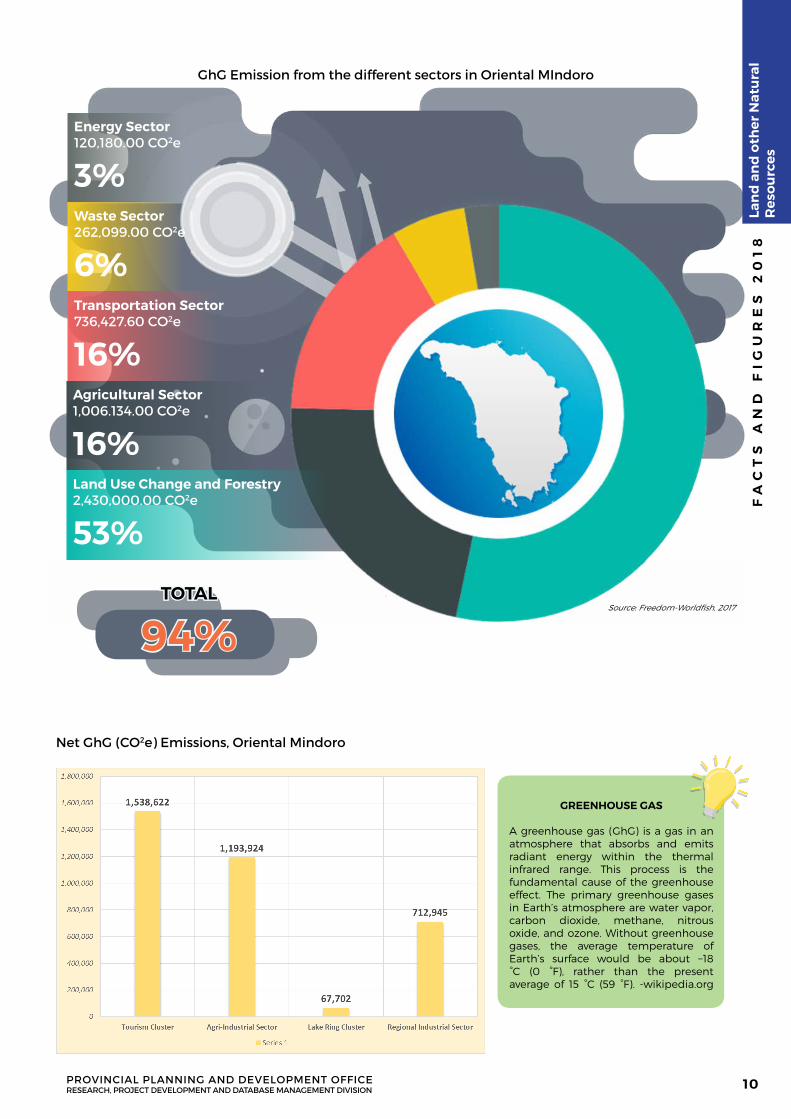
GhG Emission from the different sectors in Oriental MIndoro
Energy Sector120,180.00 CO2e
3%Waste Sector262,099.00 CO2e
6%Transportation Sector736,427.60 CO2e
16%
Land Use Change and Forestry2,430,000.00 CO2e
53%
Agricultural Sector1,006.134.00 CO2e
16%
TOTAL
94%Source: Freedom-Worldfish, 2017
GREENHOUSE GAS
A greenhouse gas (GhG) is a gas in an atmosphere that absorbs and emits radiant energy within the thermal infrared range. This process is the fundamental cause of the greenhouse effect. The primary greenhouse gases in Earth’s atmosphere are water vapor, carbon dioxide, methane, nitrous oxide, and ozone. Without greenhouse gases, the average temperature of Earth’s surface would be about −18 °C (0 °F), rather than the present average of 15 °C (59 °F). -wikipedia.org
Net GhG (CO2e) Emissions, Oriental MindoroF
AC
TS
AN
D F
IG
UR
ES
20
18
PROVINCIAL PLANNING AND DEVELOPMENT OFFICERESEARCH, PROJECT DEVELOPMENT AND DATABASE MANAGEMENT DIVISION
Lan
d a
nd
oth
er N
atu
ral
Res
ou
rces
10
FA
CT
S A
ND
FI
GU
RE
S 2
01
8
PROVINCIAL PLANNING AND DEVELOPMENT OFFICERESEARCH, PROJECT DEVELOPMENT AND DATABASE MANAGEMENT DIVISION
Lan
d a
nd
oth
er N
atu
ral
Res
ou
rces
11
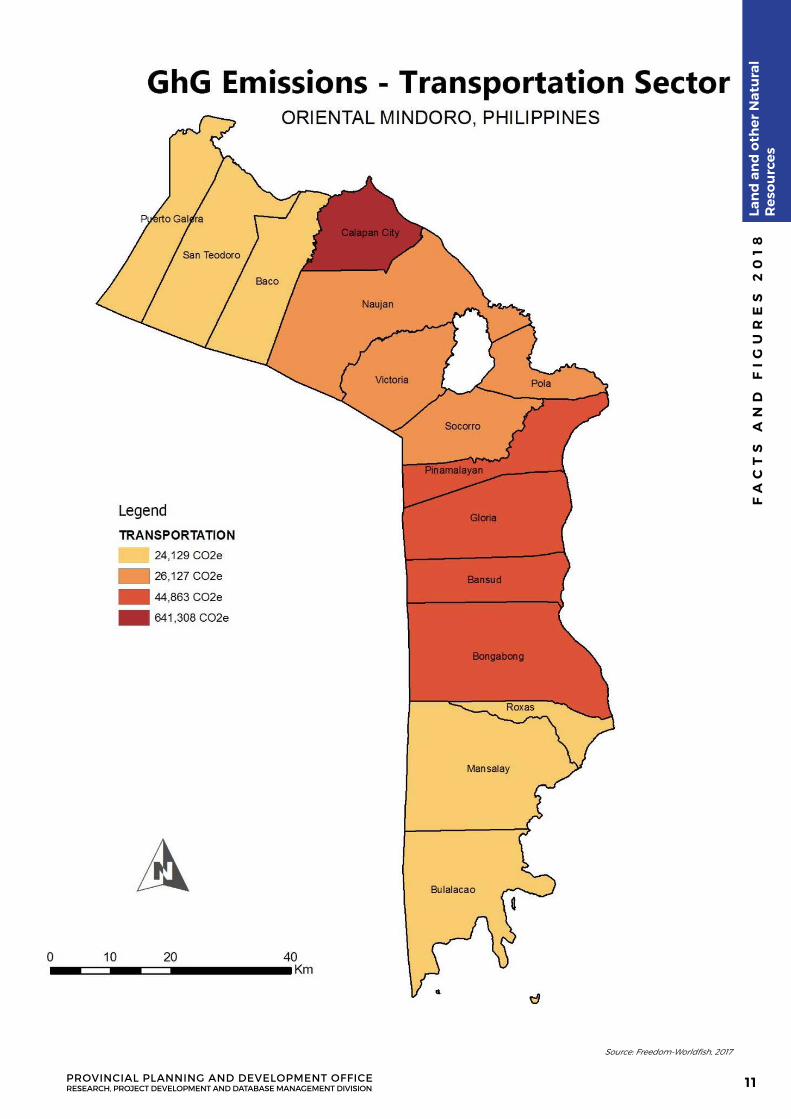
Source: Freedom-Worldfish, 2017
FA
CT
S A
ND
FI
GU
RE
S 2
01
8
PROVINCIAL PLANNING AND DEVELOPMENT OFFICERESEARCH, PROJECT DEVELOPMENT AND DATABASE MANAGEMENT DIVISION
Lan
d a
nd
oth
er N
atu
ral
Res
ou
rces
12
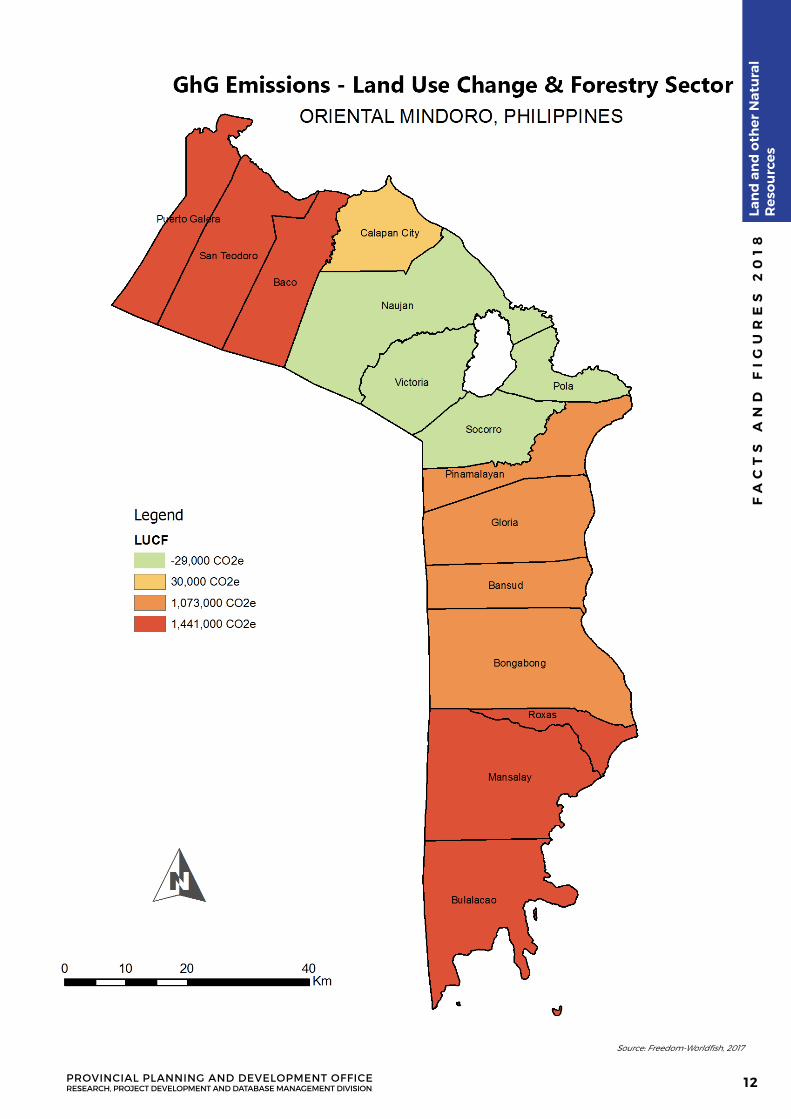
Source: Freedom-Worldfish, 2017
FA
CT
S A
ND
FI
GU
RE
S 2
01
8
PROVINCIAL PLANNING AND DEVELOPMENT OFFICERESEARCH, PROJECT DEVELOPMENT AND DATABASE MANAGEMENT DIVISION
Lan
d a
nd
oth
er N
atu
ral
Res
ou
rces
13
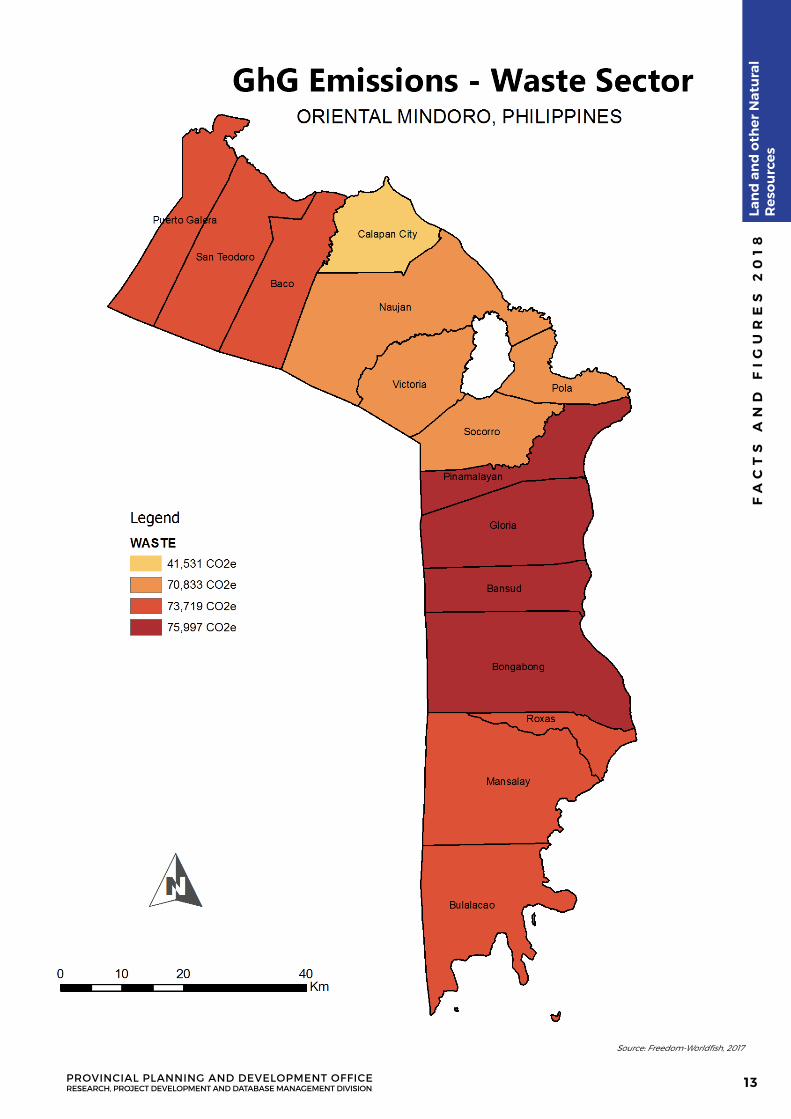
Source: Freedom-Worldfish, 2017
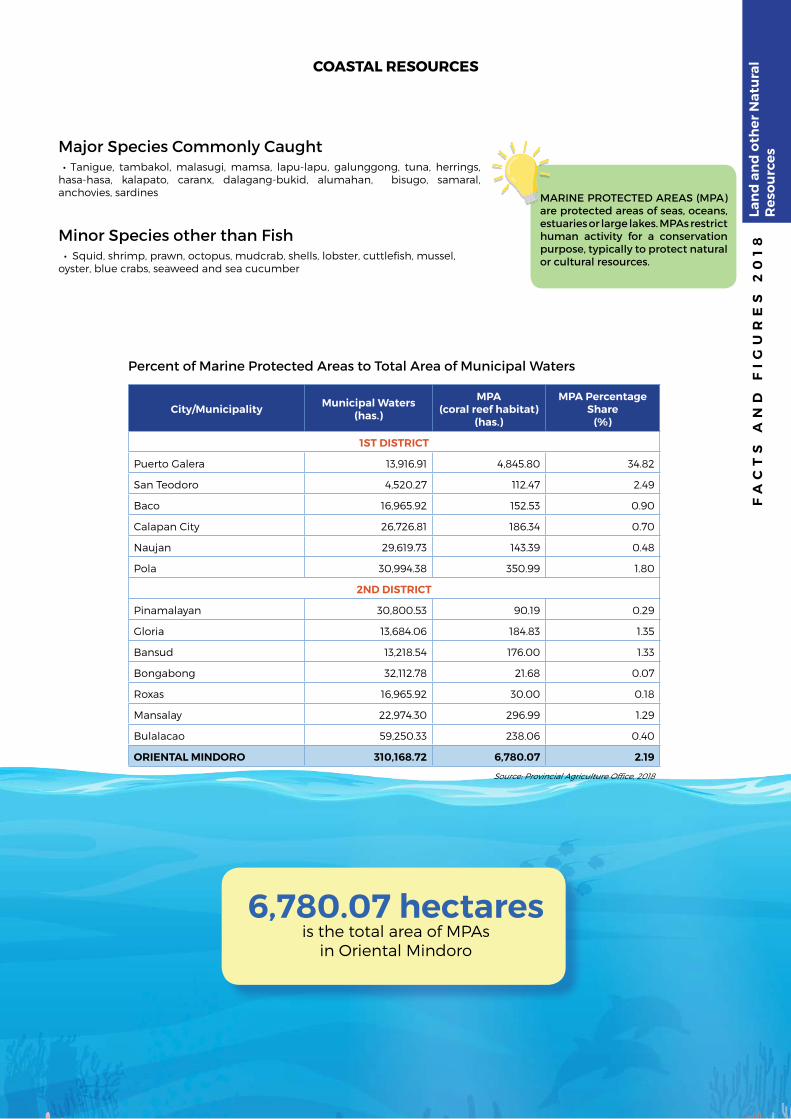
City/Municipality Municipal Waters(has.)
MPA (coral reef habitat)
(has.)
MPA Percentage Share
(%)
1ST DISTRICT
Puerto Galera 13,916.91 4,845.80 34.82
San Teodoro 4,520.27 112.47 2.49
Baco 16,965.92 152.53 0.90
Calapan City 26,726.81 186.34 0.70
Naujan 29,619.73 143.39 0.48
Pola 30,994.38 350.99 1.80
2ND DISTRICT
Pinamalayan 30,800.53 90.19 0.29
Gloria 13,684.06 184.83 1.35
Bansud 13,218.54 176.00 1.33
Bongabong 32,112.78 21.68 0.07
Roxas 16,965.92 30.00 0.18
Mansalay 22,974.30 296.99 1.29
Bulalacao 59,250.33 238.06 0.40
ORIENTAL MINDORO 310,168.72 6,780.07 2.19
Source: Provincial Agriculture Office, 2018
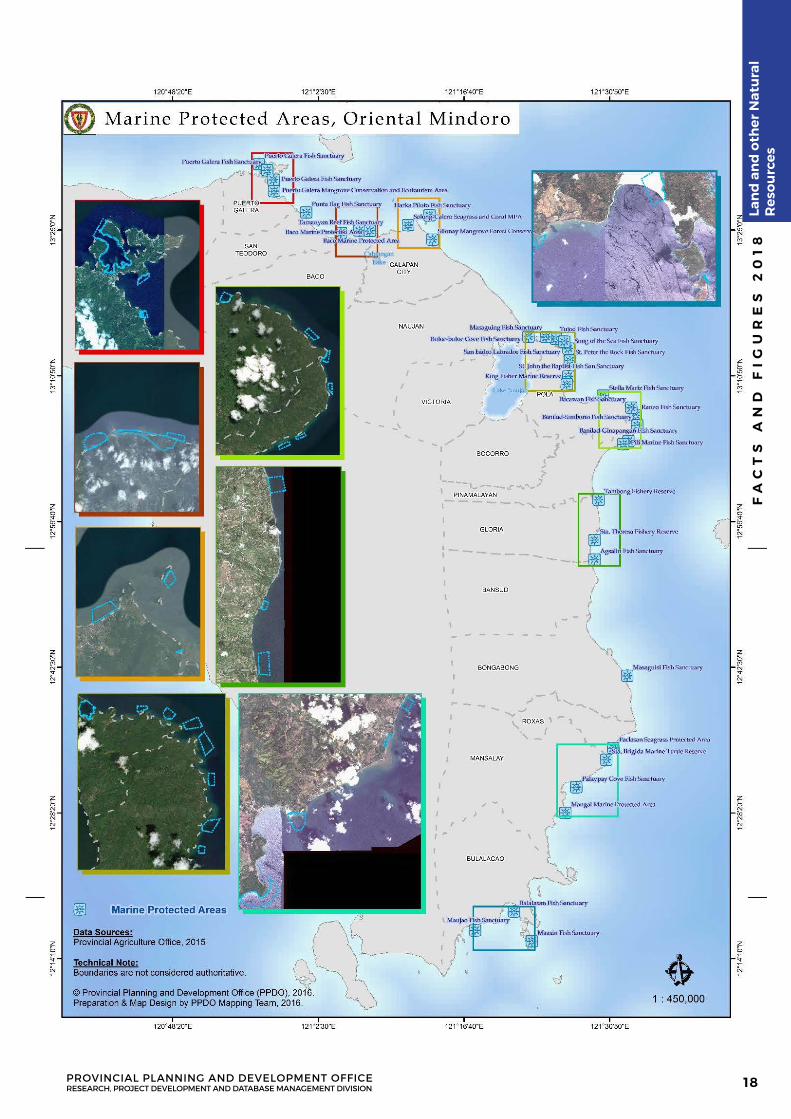
MARINE PROTECTED AREAS (MPA) are protected areas of seas, oceans, estuaries or large lakes. MPAs restrict human activity for a conservation purpose, typically to protect natural or cultural resources.
6,780.07 hectaresis the total area of MPAs
in Oriental Mindoro
Major Species Commonly Caught • Tanigue, tambakol, malasugi, mamsa, lapu-lapu, galunggong, tuna, herrings, hasa-hasa, kalapato, caranx, dalagang-bukid, alumahan, bisugo, samaral, anchovies, sardines
Minor Species other than Fish
• Squid, shrimp, prawn, octopus, mudcrab, shells, lobster, cuttlefish, mussel, oyster, blue crabs, seaweed and sea cucumber
COASTAL RESOURCES
Percent of Marine Protected Areas to Total Area of Municipal Waters
FA
CT
S A
ND
FI
GU
RE
S 2
01
8La
nd
an
d o
ther
Nat
ura
l R
eso
urc
es
FA
CT
S A
ND
FI
GU
RE
S 2
01
8
PROVINCIAL PLANNING AND DEVELOPMENT OFFICERESEARCH, PROJECT DEVELOPMENT AND DATABASE MANAGEMENT DIVISION
Lan
d a
nd
oth
er N
atu
ral
Res
ou
rces
15
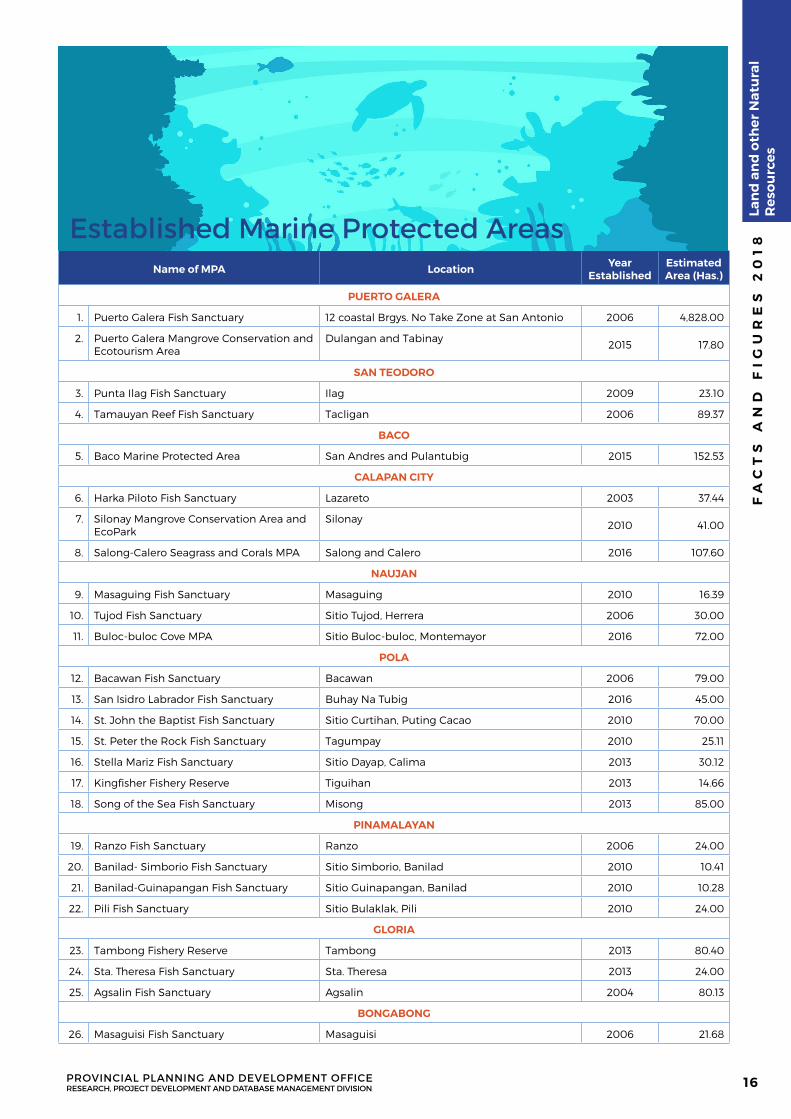
Name of MPA Location Year Established
Estimated Area (Has.)
PUERTO GALERA
1. Puerto Galera Fish Sanctuary 12 coastal Brgys. No Take Zone at San Antonio 2006 4,828.00
2. Puerto Galera Mangrove Conservation and Ecotourism Area
Dulangan and Tabinay2015 17.80
SAN TEODORO
3. Punta Ilag Fish Sanctuary Ilag 2009 23.10
4. Tamauyan Reef Fish Sanctuary Tacligan 2006 89.37
BACO
5. Baco Marine Protected Area San Andres and Pulantubig 2015 152.53
CALAPAN CITY
6. Harka Piloto Fish Sanctuary Lazareto 2003 37.44
7. Silonay Mangrove Conservation Area and EcoPark
Silonay2010 41.00
8. Salong-Calero Seagrass and Corals MPA Salong and Calero 2016 107.60
NAUJAN
9. Masaguing Fish Sanctuary Masaguing 2010 16.39
10. Tujod Fish Sanctuary Sitio Tujod, Herrera 2006 30.00
11. Buloc-buloc Cove MPA Sitio Buloc-buloc, Montemayor 2016 72.00
POLA
12. Bacawan Fish Sanctuary Bacawan 2006 79.00
13. San Isidro Labrador Fish Sanctuary Buhay Na Tubig 2016 45.00
14. St. John the Baptist Fish Sanctuary Sitio Curtihan, Puting Cacao 2010 70.00
15. St. Peter the Rock Fish Sanctuary Tagumpay 2010 25.11
16. Stella Mariz Fish Sanctuary Sitio Dayap, Calima 2013 30.12
17. Kingfisher Fishery Reserve Tiguihan 2013 14.66
18. Song of the Sea Fish Sanctuary Misong 2013 85.00
PINAMALAYAN
19. Ranzo Fish Sanctuary Ranzo 2006 24.00
20. Banilad- Simborio Fish Sanctuary Sitio Simborio, Banilad 2010 10.41
21. Banilad-Guinapangan Fish Sanctuary Sitio Guinapangan, Banilad 2010 10.28
22. Pili Fish Sanctuary Sitio Bulaklak, Pili 2010 24.00
GLORIA
23. Tambong Fishery Reserve Tambong 2013 80.40
24. Sta. Theresa Fish Sanctuary Sta. Theresa 2013 24.00
25. Agsalin Fish Sanctuary Agsalin 2004 80.13
BONGABONG
26. Masaguisi Fish Sanctuary Masaguisi 2006 21.68
Established Marine Protected Areas
FA
CT
S A
ND
FI
GU
RE
S 2
01
8
PROVINCIAL PLANNING AND DEVELOPMENT OFFICERESEARCH, PROJECT DEVELOPMENT AND DATABASE MANAGEMENT DIVISION
Lan
d a
nd
oth
er N
atu
ral
Res
ou
rces
16
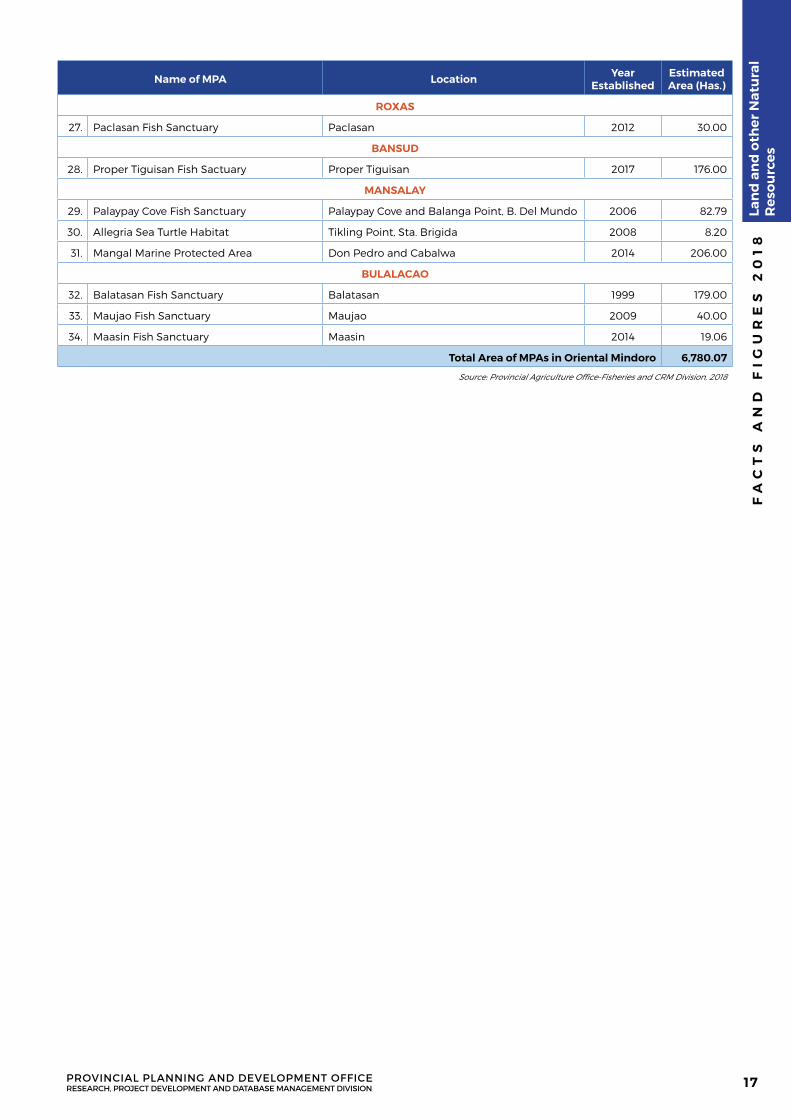
Name of MPA Location Year Established
Estimated Area (Has.)
ROXAS
27. Paclasan Fish Sanctuary Paclasan 2012 30.00
BANSUD
28. Proper Tiguisan Fish Sactuary Proper Tiguisan 2017 176.00
MANSALAY
29. Palaypay Cove Fish Sanctuary Palaypay Cove and Balanga Point, B. Del Mundo 2006 82.79
30. Allegria Sea Turtle Habitat Tikling Point, Sta. Brigida 2008 8.20
31. Mangal Marine Protected Area Don Pedro and Cabalwa 2014 206.00
BULALACAO
32. Balatasan Fish Sanctuary Balatasan 1999 179.00
33. Maujao Fish Sanctuary Maujao 2009 40.00
34. Maasin Fish Sanctuary Maasin 2014 19.06
Total Area of MPAs in Oriental Mindoro 6,780.07
Source: Provincial Agriculture Office-Fisheries and CRM Division, 2018
FA
CT
S A
ND
FI
GU
RE
S 2
01
8
PROVINCIAL PLANNING AND DEVELOPMENT OFFICERESEARCH, PROJECT DEVELOPMENT AND DATABASE MANAGEMENT DIVISION
Lan
d a
nd
oth
er N
atu
ral
Res
ou
rces
17
FA
CT
S A
ND
FI
GU
RE
S 2
01
8
PROVINCIAL PLANNING AND DEVELOPMENT OFFICERESEARCH, PROJECT DEVELOPMENT AND DATABASE MANAGEMENT DIVISION
Lan
d a
nd
oth
er N
atu
ral
Res
ou
rces
18

DEMOGRAPHYO R I E N TA L M I N D O R O F A C T S A N D F I G U R E S 2 0 1 8
CITY/ MUNICIPALITYCENSUS YEARS
1970 1975 1980 1990 1995 2000 2007 2010 2015
1ST DISTRICT
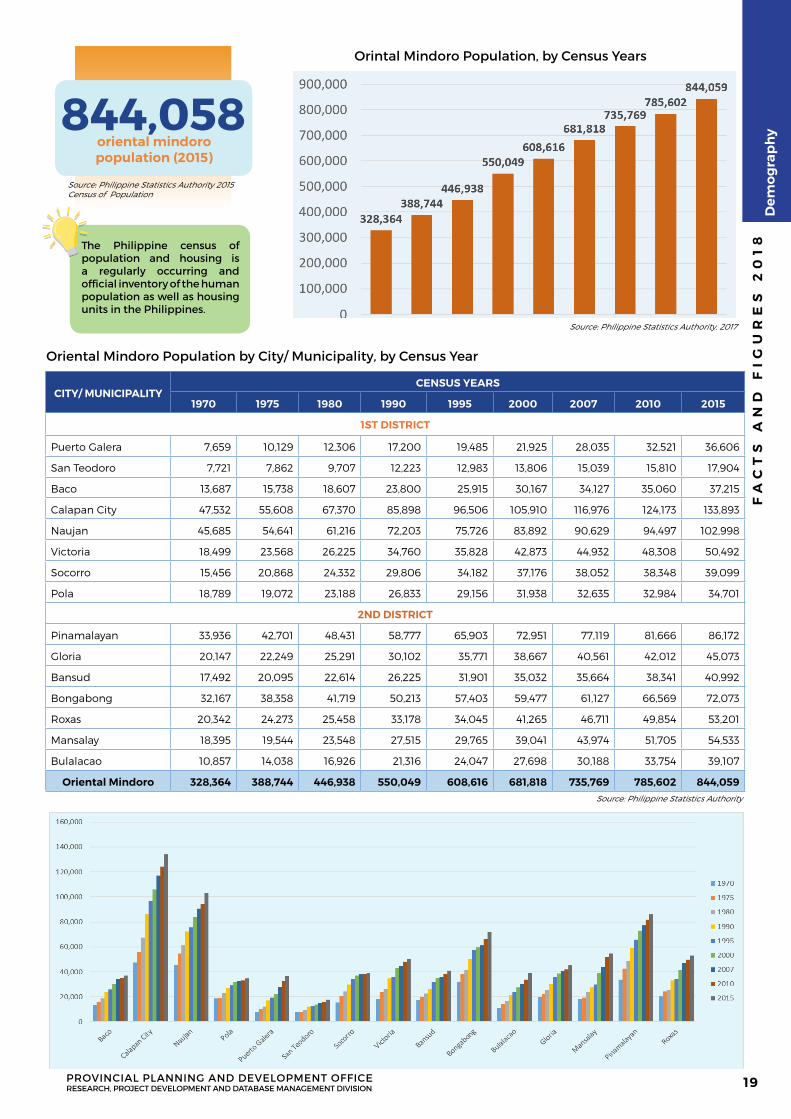
Puerto Galera 7,659 10,129 12,306 17,200 19,485 21,925 28,035 32,521 36,606
San Teodoro 7,721 7,862 9,707 12,223 12,983 13,806 15,039 15,810 17,904
Baco 13,687 15,738 18,607 23,800 25,915 30,167 34,127 35,060 37,215
Calapan City 47,532 55,608 67,370 85,898 96,506 105,910 116,976 124,173 133,893
Naujan 45,685 54,641 61,216 72,203 75,726 83,892 90,629 94,497 102,998
Victoria 18,499 23,568 26,225 34,760 35,828 42,873 44,932 48,308 50,492
Socorro 15,456 20,868 24,332 29,806 34,182 37,176 38,052 38,348 39,099
Pola 18,789 19,072 23,188 26,833 29,156 31,938 32,635 32,984 34,701
2ND DISTRICT
Pinamalayan 33,936 42,701 48,431 58,777 65,903 72,951 77,119 81,666 86,172
Gloria 20,147 22,249 25,291 30,102 35,771 38,667 40,561 42,012 45,073
Bansud 17,492 20,095 22,614 26,225 31,901 35,032 35,664 38,341 40,992
Bongabong 32,167 38,358 41,719 50,213 57,403 59,477 61,127 66,569 72,073
Roxas 20,342 24,273 25,458 33,178 34,045 41,265 46,711 49,854 53,201
Mansalay 18,395 19,544 23,548 27,515 29,765 39,041 43,974 51,705 54,533
Bulalacao 10,857 14,038 16,926 21,316 24,047 27,698 30,188 33,754 39,107
Oriental Mindoro 328,364 388,744 446,938 550,049 608,616 681,818 735,769 785,602 844,059Source: Philippine Statistics Authority
844,058oriental mindoro population (2015)
The Philippine census of population and housing is a regularly occurring and official inventory of the human population as well as housing units in the Philippines.
Orintal Mindoro Population, by Census Years
Oriental Mindoro Population by City/ Municipality, by Census Year
Source: Philippine Statistics Authority, 2017
Source: Philippine Statistics Authority 2015 Census of Population
FA
CT
S A
ND
FI
GU
RE
S 2
01
8
PROVINCIAL PLANNING AND DEVELOPMENT OFFICERESEARCH, PROJECT DEVELOPMENT AND DATABASE MANAGEMENT DIVISION
Dem
og
rap
hy
19
CITY/ MUNICIPALITY
2010 2015 (Actual) 2018 (Projected) GROWTH RATE
Total Pop’n No. of HHs Total
Pop’n No. of HHs Total Pop’n 2000-2010 2010-2015
1ST DISTRICT
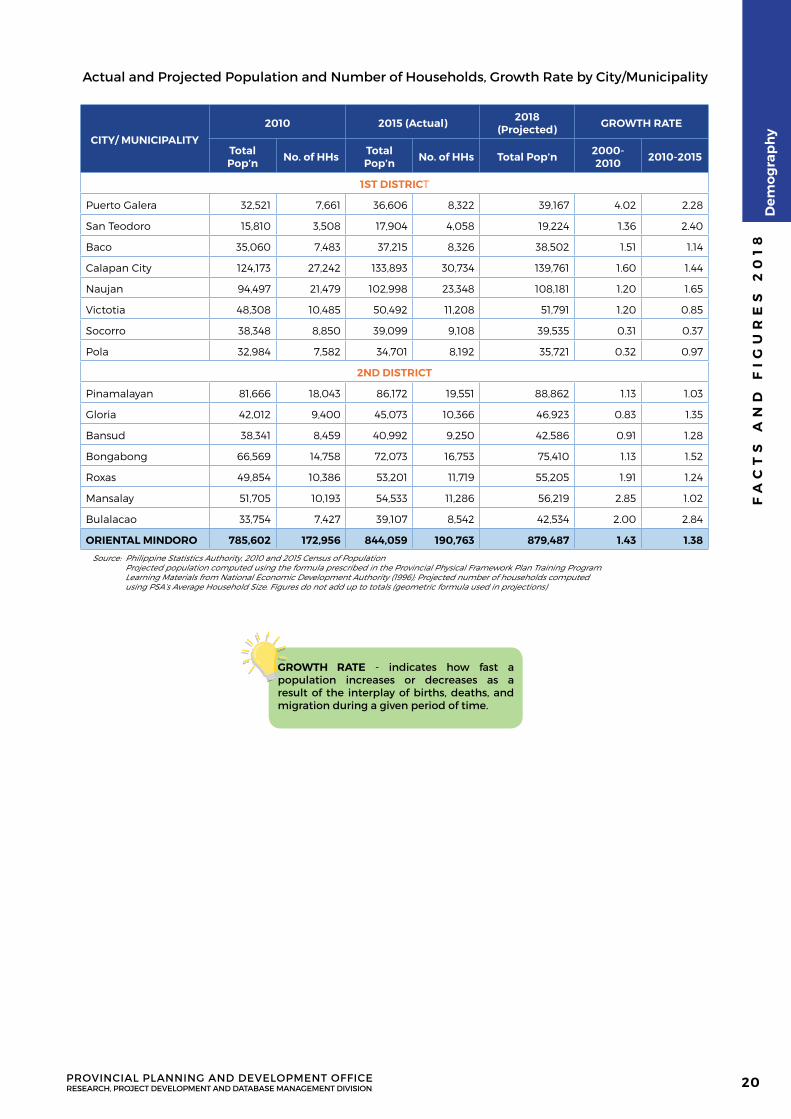
Puerto Galera 32,521 7,661 36,606 8,322 39,167 4.02 2.28
San Teodoro 15,810 3,508 17,904 4,058 19,224 1.36 2.40
Baco 35,060 7,483 37,215 8,326 38,502 1.51 1.14
Calapan City 124,173 27,242 133,893 30,734 139,761 1.60 1.44
Naujan 94,497 21,479 102,998 23,348 108,181 1.20 1.65
Victotia 48,308 10,485 50,492 11,208 51,791 1.20 0.85
Socorro 38,348 8,850 39,099 9,108 39,535 0.31 0.37
Pola 32,984 7,582 34,701 8,192 35,721 0.32 0.97
2ND DISTRICT
Pinamalayan 81,666 18,043 86,172 19,551 88,862 1.13 1.03
Gloria 42,012 9,400 45,073 10,366 46,923 0.83 1.35
Bansud 38,341 8,459 40,992 9,250 42,586 0.91 1.28
Bongabong 66,569 14,758 72,073 16,753 75,410 1.13 1.52
Roxas 49,854 10,386 53,201 11,719 55,205 1.91 1.24
Mansalay 51,705 10,193 54,533 11,286 56,219 2.85 1.02
Bulalacao 33,754 7,427 39,107 8,542 42,534 2.00 2.84
ORIENTAL MINDORO 785,602 172,956 844,059 190,763 879,487 1.43 1.38
Source: Philippine Statistics Authority, 2010 and 2015 Census of Population Projected population computed using the formula prescribed in the Provincial Physical Framework Plan Training Program Learning Materials from National Economic Development Authority (1996); Projected number of households computed using PSA’s Average Household Size. Figures do not add up to totals (geometric formula used in projections)
GROWTH RATE - indicates how fast a population increases or decreases as a result of the interplay of births, deaths, and migration during a given period of time.
Actual and Projected Population and Number of Households, Growth Rate by City/Municipality
FA
CT
S A
ND
FI
GU
RE
S 2
01
8
PROVINCIAL PLANNING AND DEVELOPMENT OFFICERESEARCH, PROJECT DEVELOPMENT AND DATABASE MANAGEMENT DIVISION
Dem
og
rap
hy
20

FA
CT
S A
ND
FI
GU
RE
S 2
01
8
PROVINCIAL PLANNING AND DEVELOPMENT OFFICERESEARCH, PROJECT DEVELOPMENT AND DATABASE MANAGEMENT DIVISION
Dem
og
rap
hy
21
City/ Municipality
2007 2010 2015
Total HH Population Male Female Total HH
Population Male Female Total HH Population Male Female
1ST DISTRICT
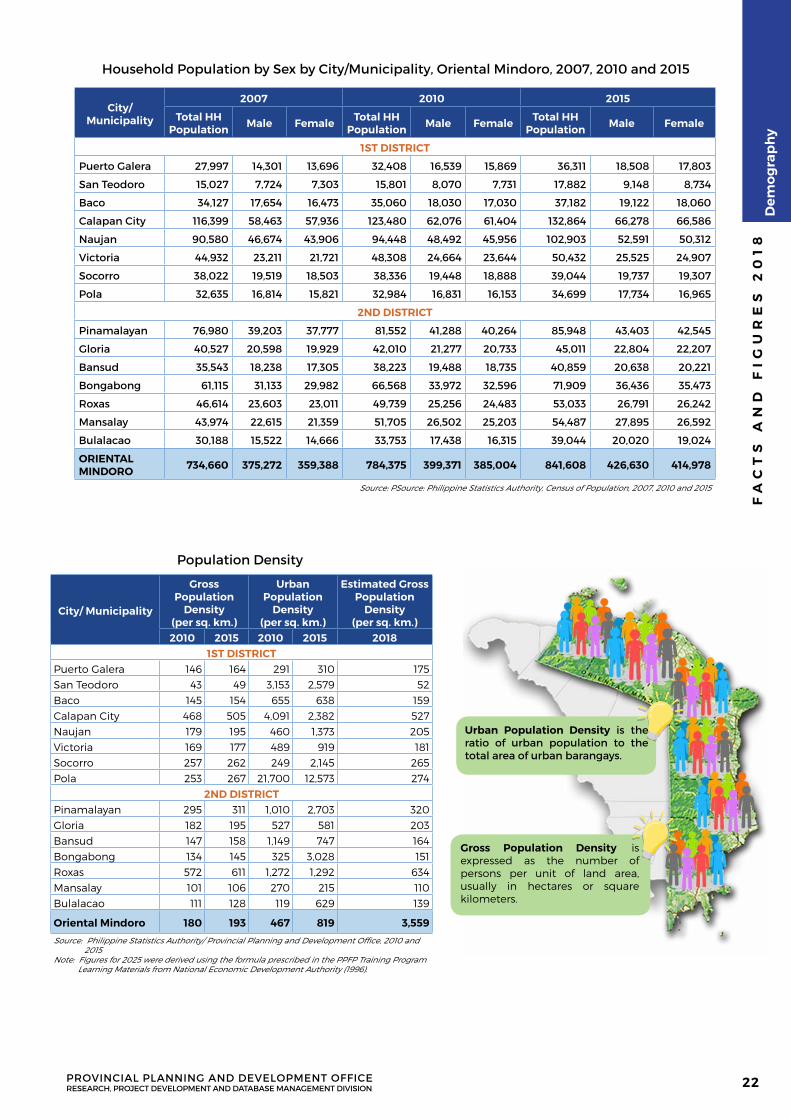
Puerto Galera 27,997 14,301 13,696 32,408 16,539 15,869 36,311 18,508 17,803
San Teodoro 15,027 7,724 7,303 15,801 8,070 7,731 17,882 9,148 8,734
Baco 34,127 17,654 16,473 35,060 18,030 17,030 37,182 19,122 18,060
Calapan City 116,399 58,463 57,936 123,480 62,076 61,404 132,864 66,278 66,586
Naujan 90,580 46,674 43,906 94,448 48,492 45,956 102,903 52,591 50,312
Victoria 44,932 23,211 21,721 48,308 24,664 23,644 50,432 25,525 24,907
Socorro 38,022 19,519 18,503 38,336 19,448 18,888 39,044 19,737 19,307
Pola 32,635 16,814 15,821 32,984 16,831 16,153 34,699 17,734 16,965
2ND DISTRICT
Pinamalayan 76,980 39,203 37,777 81,552 41,288 40,264 85,948 43,403 42,545
Gloria 40,527 20,598 19,929 42,010 21,277 20,733 45,011 22,804 22,207
Bansud 35,543 18,238 17,305 38,223 19,488 18,735 40,859 20,638 20,221
Bongabong 61,115 31,133 29,982 66,568 33,972 32,596 71,909 36,436 35,473
Roxas 46,614 23,603 23,011 49,739 25,256 24,483 53,033 26,791 26,242
Mansalay 43,974 22,615 21,359 51,705 26,502 25,203 54,487 27,895 26,592
Bulalacao 30,188 15,522 14,666 33,753 17,438 16,315 39,044 20,020 19,024
ORIENTAL MINDORO 734,660 375,272 359,388 784,375 399,371 385,004 841,608 426,630 414,978
Source: PSource: Philippine Statistics Authority, Census of Population, 2007, 2010 and 2015
City/ Municipality
Gross Population
Density(per sq. km.)
Urban Population
Density(per sq. km.)
Estimated Gross Population
Density(per sq. km.)
2010 2015 2010 2015 20181ST DISTRICT
Puerto Galera 146 164 291 310 175San Teodoro 43 49 3,153 2,579 52Baco 145 154 655 638 159Calapan City 468 505 4,091 2,382 527Naujan 179 195 460 1,373 205Victoria 169 177 489 919 181Socorro 257 262 249 2,145 265Pola 253 267 21,700 12,573 274
2ND DISTRICTPinamalayan 295 311 1,010 2,703 320Gloria 182 195 527 581 203Bansud 147 158 1,149 747 164Bongabong 134 145 325 3,028 151Roxas 572 611 1,272 1,292 634Mansalay 101 106 270 215 110Bulalacao 111 128 119 629 139
Oriental Mindoro 180 193 467 819 3,559
Source: Philippine Statistics Authority/ Provincial Planning and Development Office, 2010 and 2015Note: Figures for 2025 were derived using the formula prescribed in the PPFP Training Program Learning Materials from National Economic Development Authority (1996).
Urban Population Density is the ratio of urban population to the total area of urban barangays.
Gross Population Density is expressed as the number of persons per unit of land area, usually in hectares or square kilometers.
Household Population by Sex by City/Municipality, Oriental Mindoro, 2007, 2010 and 2015
Population Density
FA
CT
S A
ND
FI
GU
RE
S 2
01
8
PROVINCIAL PLANNING AND DEVELOPMENT OFFICERESEARCH, PROJECT DEVELOPMENT AND DATABASE MANAGEMENT DIVISION
Dem
og
rap
hy
22
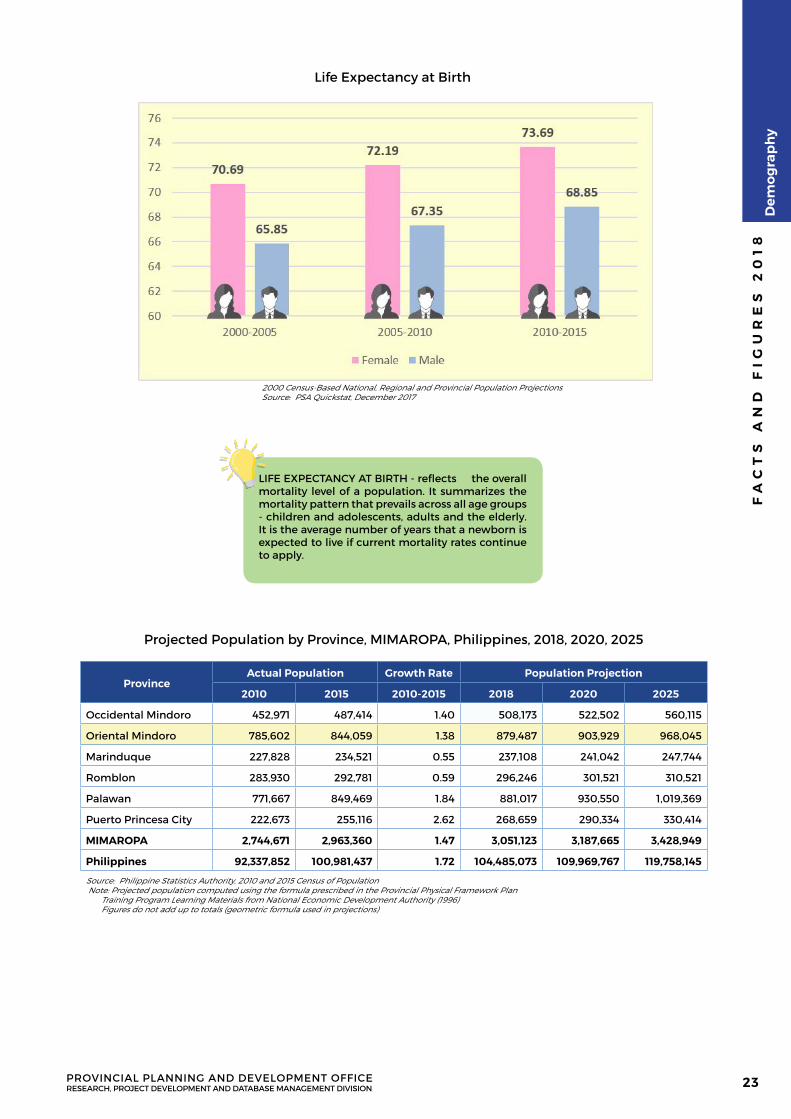
LIFE EXPECTANCY AT BIRTH - reflects the overall mortality level of a population. It summarizes the mortality pattern that prevails across all age groups - children and adolescents, adults and the elderly. It is the average number of years that a newborn is expected to live if current mortality rates continue to apply.
ProvinceActual Population Growth Rate Population Projection
2010 2015 2010-2015 2018 2020 2025
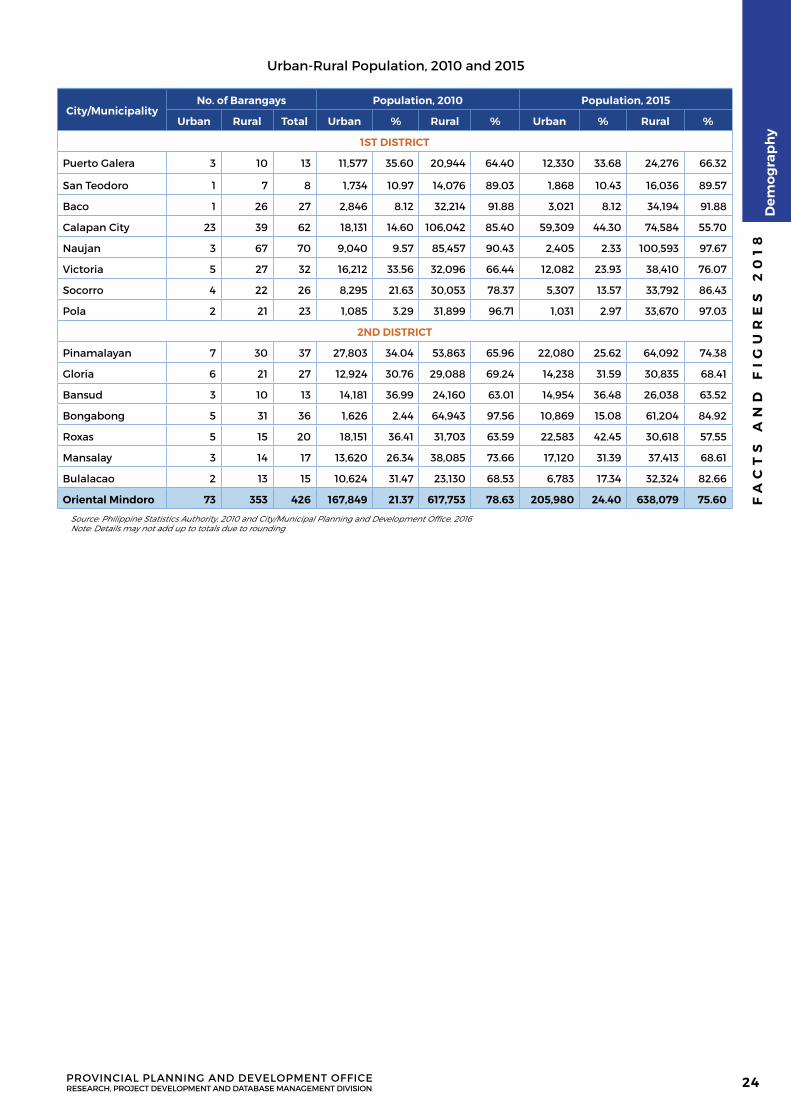
Occidental Mindoro 452,971 487,414 1.40 508,173 522,502 560,115
Oriental Mindoro 785,602 844,059 1.38 879,487 903,929 968,045
Marinduque 227,828 234,521 0.55 237,108 241,042 247,744
Romblon 283,930 292,781 0.59 296,246 301,521 310,521
Palawan 771,667 849,469 1.84 881,017 930,550 1,019,369
Puerto Princesa City 222,673 255,116 2.62 268,659 290,334 330,414
MIMAROPA 2,744,671 2,963,360 1.47 3,051,123 3,187,665 3,428,949
Philippines 92,337,852 100,981,437 1.72 104,485,073 109,969,767 119,758,145
Source: Philippine Statistics Authority, 2010 and 2015 Census of Population Note: Projected population computed using the formula prescribed in the Provincial Physical Framework Plan Training Program Learning Materials from National Economic Development Authority (1996) Figures do not add up to totals (geometric formula used in projections)
2000 Census-Based National, Regional and Provincial Population ProjectionsSource: PSA Quickstat, December 2017
Life Expectancy at Birth
Projected Population by Province, MIMAROPA, Philippines, 2018, 2020, 2025
FA
CT
S A
ND
FI
GU
RE
S 2
01
8
PROVINCIAL PLANNING AND DEVELOPMENT OFFICERESEARCH, PROJECT DEVELOPMENT AND DATABASE MANAGEMENT DIVISION
Dem
og
rap
hy
23
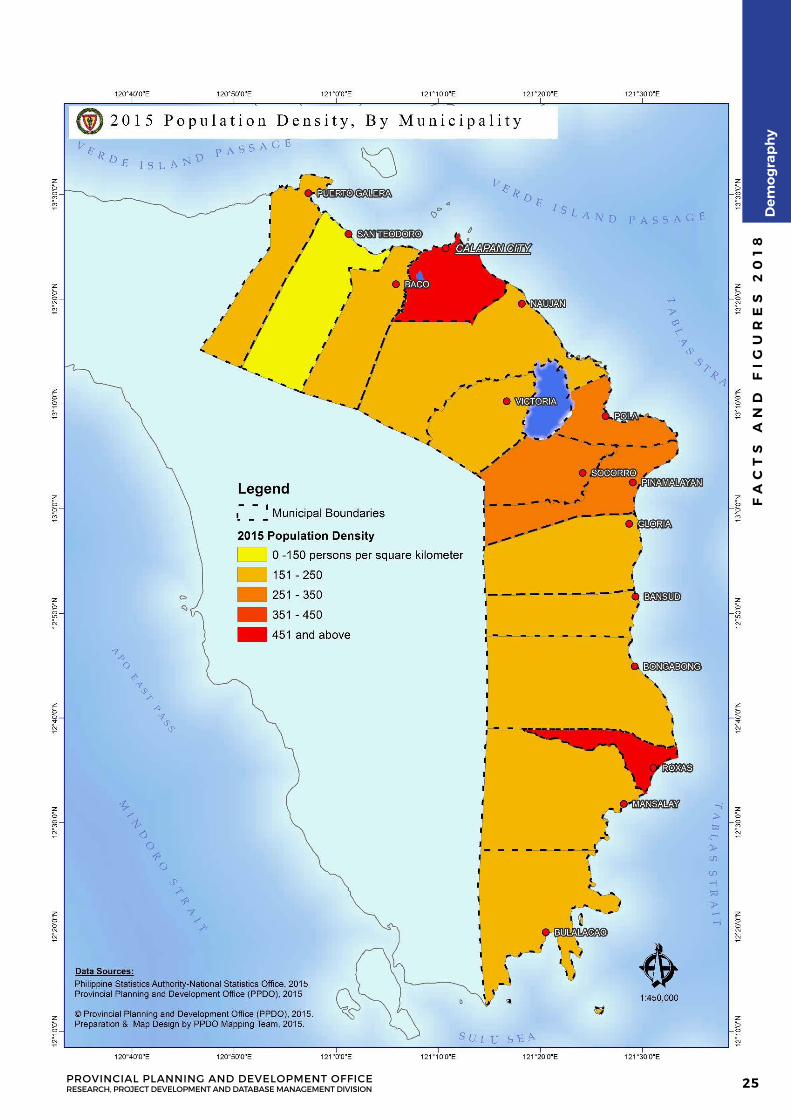
City/MunicipalityNo. of Barangays Population, 2010 Population, 2015
Urban Rural Total Urban % Rural % Urban % Rural %
1ST DISTRICT
Puerto Galera 3 10 13 11,577 35.60 20,944 64.40 12,330 33.68 24,276 66.32
San Teodoro 1 7 8 1,734 10.97 14,076 89.03 1,868 10.43 16,036 89.57
Baco 1 26 27 2,846 8.12 32,214 91.88 3,021 8.12 34,194 91.88
Calapan City 23 39 62 18,131 14.60 106,042 85.40 59,309 44.30 74,584 55.70
Naujan 3 67 70 9,040 9.57 85,457 90.43 2,405 2.33 100,593 97.67
Victoria 5 27 32 16,212 33.56 32,096 66.44 12,082 23.93 38,410 76.07
Socorro 4 22 26 8,295 21.63 30,053 78.37 5,307 13.57 33,792 86.43
Pola 2 21 23 1,085 3.29 31,899 96.71 1,031 2.97 33,670 97.03
2ND DISTRICT
Pinamalayan 7 30 37 27,803 34.04 53,863 65.96 22,080 25.62 64,092 74.38
Gloria 6 21 27 12,924 30.76 29,088 69.24 14,238 31.59 30,835 68.41
Bansud 3 10 13 14,181 36.99 24,160 63.01 14,954 36.48 26,038 63.52
Bongabong 5 31 36 1,626 2.44 64,943 97.56 10,869 15.08 61,204 84.92
Roxas 5 15 20 18,151 36.41 31,703 63.59 22,583 42.45 30,618 57.55
Mansalay 3 14 17 13,620 26.34 38,085 73.66 17,120 31.39 37,413 68.61
Bulalacao 2 13 15 10,624 31.47 23,130 68.53 6,783 17.34 32,324 82.66
Oriental Mindoro 73 353 426 167,849 21.37 617,753 78.63 205,980 24.40 638,079 75.60
Source: Philippine Statistics Authority, 2010 and City/Municipal Planning and Development Office, 2016Note: Details may not add up to totals due to rounding
Urban-Rural Population, 2010 and 2015
FA
CT
S A
ND
FI
GU
RE
S 2
01
8
PROVINCIAL PLANNING AND DEVELOPMENT OFFICERESEARCH, PROJECT DEVELOPMENT AND DATABASE MANAGEMENT DIVISION
Dem
og
rap
hy
24
FA
CT
S A
ND
FI
GU
RE
S 2
01
8
PROVINCIAL PLANNING AND DEVELOPMENT OFFICERESEARCH, PROJECT DEVELOPMENT AND DATABASE MANAGEMENT DIVISION
Dem
og
rap
hy
25
Seven Mangyan Tribes
02
03
01Alangan
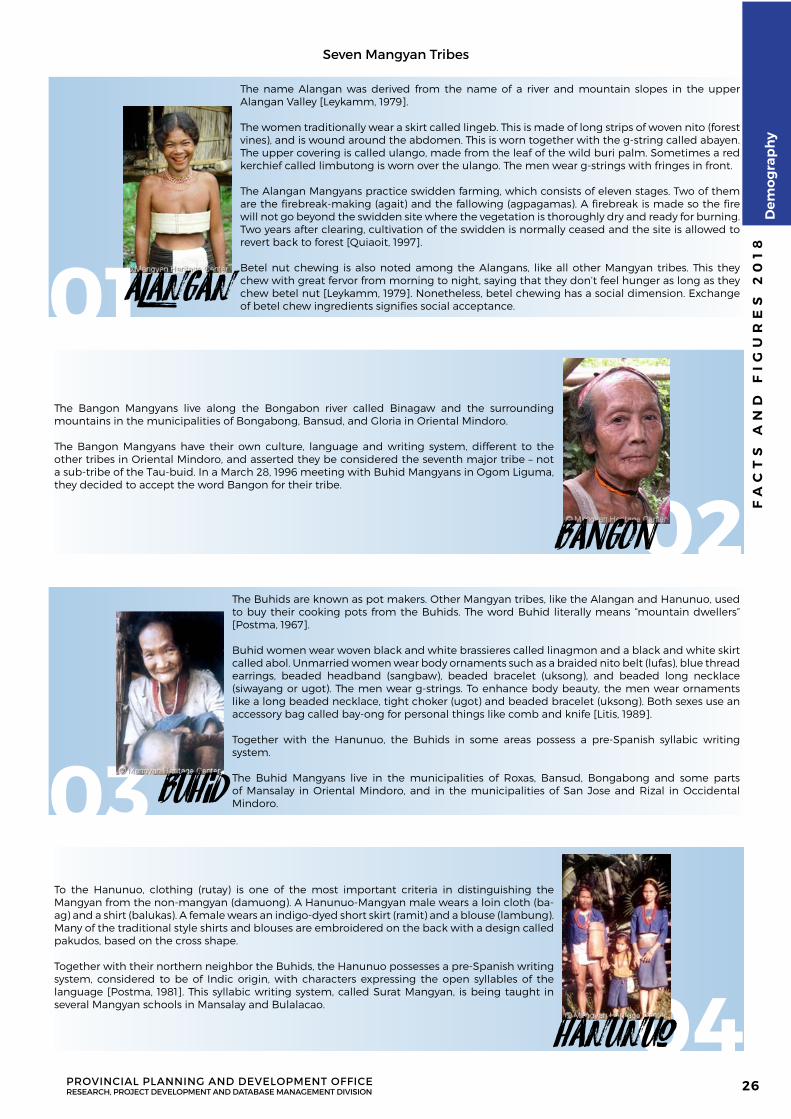
The name Alangan was derived from the name of a river and mountain slopes in the upper Alangan Valley [Leykamm, 1979].
The women traditionally wear a skirt called lingeb. This is made of long strips of woven nito (forest vines), and is wound around the abdomen. This is worn together with the g-string called abayen. The upper covering is called ulango, made from the leaf of the wild buri palm. Sometimes a red kerchief called limbutong is worn over the ulango. The men wear g-strings with fringes in front.
The Alangan Mangyans practice swidden farming, which consists of eleven stages. Two of them are the firebreak-making (agait) and the fallowing (agpagamas). A firebreak is made so the fire will not go beyond the swidden site where the vegetation is thoroughly dry and ready for burning. Two years after clearing, cultivation of the swidden is normally ceased and the site is allowed to revert back to forest [Quiaoit, 1997].
Betel nut chewing is also noted among the Alangans, like all other Mangyan tribes. This they chew with great fervor from morning to night, saying that they don’t feel hunger as long as they chew betel nut [Leykamm, 1979]. Nonetheless, betel chewing has a social dimension. Exchange of betel chew ingredients signifies social acceptance.
BANGON
The Bangon Mangyans live along the Bongabon river called Binagaw and the surrounding mountains in the municipalities of Bongabong, Bansud, and Gloria in Oriental Mindoro.
The Bangon Mangyans have their own culture, language and writing system, different to the other tribes in Oriental Mindoro, and asserted they be considered the seventh major tribe – not a sub-tribe of the Tau-buid. In a March 28, 1996 meeting with Buhid Mangyans in Ogom Liguma, they decided to accept the word Bangon for their tribe.
BUhid
The Buhids are known as pot makers. Other Mangyan tribes, like the Alangan and Hanunuo, used to buy their cooking pots from the Buhids. The word Buhid literally means “mountain dwellers” [Postma, 1967].
Buhid women wear woven black and white brassieres called linagmon and a black and white skirt called abol. Unmarried women wear body ornaments such as a braided nito belt (lufas), blue thread earrings, beaded headband (sangbaw), beaded bracelet (uksong), and beaded long necklace (siwayang or ugot). The men wear g-strings. To enhance body beauty, the men wear ornaments like a long beaded necklace, tight choker (ugot) and beaded bracelet (uksong). Both sexes use an accessory bag called bay-ong for personal things like comb and knife [Litis, 1989].
Together with the Hanunuo, the Buhids in some areas possess a pre-Spanish syllabic writing system.
The Buhid Mangyans live in the municipalities of Roxas, Bansud, Bongabong and some parts of Mansalay in Oriental Mindoro, and in the municipalities of San Jose and Rizal in Occidental Mindoro.
04Hanunuo
To the Hanunuo, clothing (rutay) is one of the most important criteria in distinguishing the Mangyan from the non-mangyan (damuong). A Hanunuo-Mangyan male wears a loin cloth (ba-ag) and a shirt (balukas). A female wears an indigo-dyed short skirt (ramit) and a blouse (lambung). Many of the traditional style shirts and blouses are embroidered on the back with a design called pakudos, based on the cross shape.
Together with their northern neighbor the Buhids, the Hanunuo possesses a pre-Spanish writing system, considered to be of Indic origin, with characters expressing the open syllables of the language [Postma, 1981]. This syllabic writing system, called Surat Mangyan, is being taught in several Mangyan schools in Mansalay and Bulalacao.
FA
CT
S A
ND
FI
GU
RE
S 2
01
8
PROVINCIAL PLANNING AND DEVELOPMENT OFFICERESEARCH, PROJECT DEVELOPMENT AND DATABASE MANAGEMENT DIVISION
Dem
og
rap
hy
26
06
07
05Tau - buhid
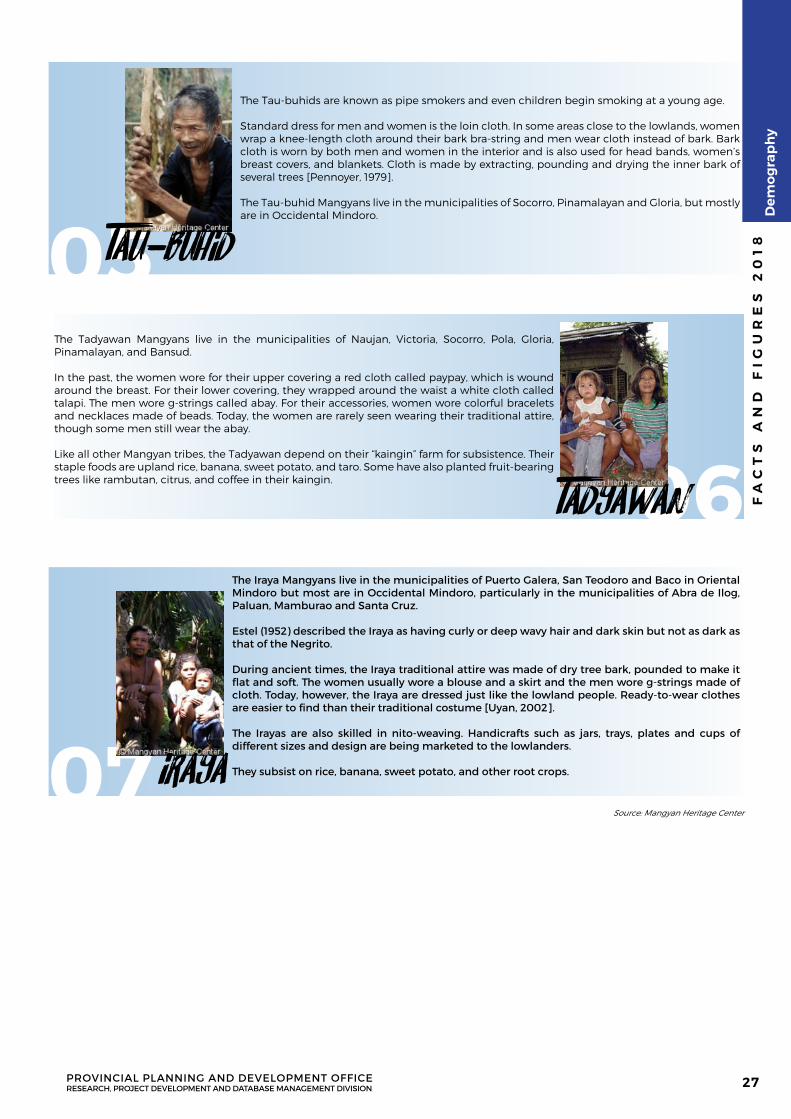
The Tau-buhids are known as pipe smokers and even children begin smoking at a young age.
Standard dress for men and women is the loin cloth. In some areas close to the lowlands, women wrap a knee-length cloth around their bark bra-string and men wear cloth instead of bark. Bark cloth is worn by both men and women in the interior and is also used for head bands, women’s breast covers, and blankets. Cloth is made by extracting, pounding and drying the inner bark of several trees [Pennoyer, 1979].
The Tau-buhid Mangyans live in the municipalities of Socorro, Pinamalayan and Gloria, but mostly are in Occidental Mindoro.
Tadyawan
The Tadyawan Mangyans live in the municipalities of Naujan, Victoria, Socorro, Pola, Gloria, Pinamalayan, and Bansud.
In the past, the women wore for their upper covering a red cloth called paypay, which is wound around the breast. For their lower covering, they wrapped around the waist a white cloth called talapi. The men wore g-strings called abay. For their accessories, women wore colorful bracelets and necklaces made of beads. Today, the women are rarely seen wearing their traditional attire, though some men still wear the abay.
Like all other Mangyan tribes, the Tadyawan depend on their “kaingin” farm for subsistence. Their staple foods are upland rice, banana, sweet potato, and taro. Some have also planted fruit-bearing trees like rambutan, citrus, and coffee in their kaingin.
Iraya
The Iraya Mangyans live in the municipalities of Puerto Galera, San Teodoro and Baco in Oriental Mindoro but most are in Occidental Mindoro, particularly in the municipalities of Abra de Ilog, Paluan, Mamburao and Santa Cruz.
Estel (1952) described the Iraya as having curly or deep wavy hair and dark skin but not as dark as that of the Negrito.
During ancient times, the Iraya traditional attire was made of dry tree bark, pounded to make it flat and soft. The women usually wore a blouse and a skirt and the men wore g-strings made of cloth. Today, however, the Iraya are dressed just like the lowland people. Ready-to-wear clothes are easier to find than their traditional costume [Uyan, 2002].
The Irayas are also skilled in nito-weaving. Handicrafts such as jars, trays, plates and cups of different sizes and design are being marketed to the lowlanders.
They subsist on rice, banana, sweet potato, and other root crops.
Source: Mangyan Heritage Center
FA
CT
S A
ND
FI
GU
RE
S 2
01
8
PROVINCIAL PLANNING AND DEVELOPMENT OFFICERESEARCH, PROJECT DEVELOPMENT AND DATABASE MANAGEMENT DIVISION
Dem
og
rap
hy
27
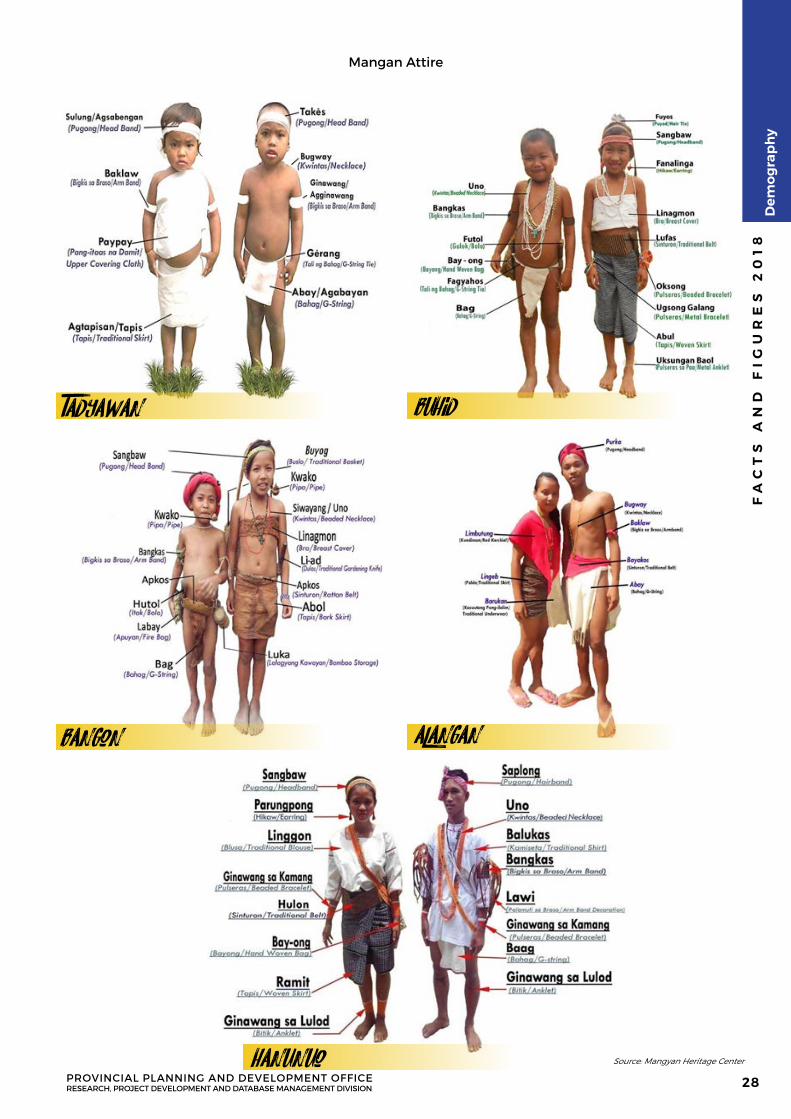
Mangan Attire
Source: Mangyan Heritage Center
Tadyawan Buhid
Bangon Alangan
Hanunuo
FA
CT
S A
ND
FI
GU
RE
S 2
01
8
PROVINCIAL PLANNING AND DEVELOPMENT OFFICERESEARCH, PROJECT DEVELOPMENT AND DATABASE MANAGEMENT DIVISION
Dem
og
rap
hy
28
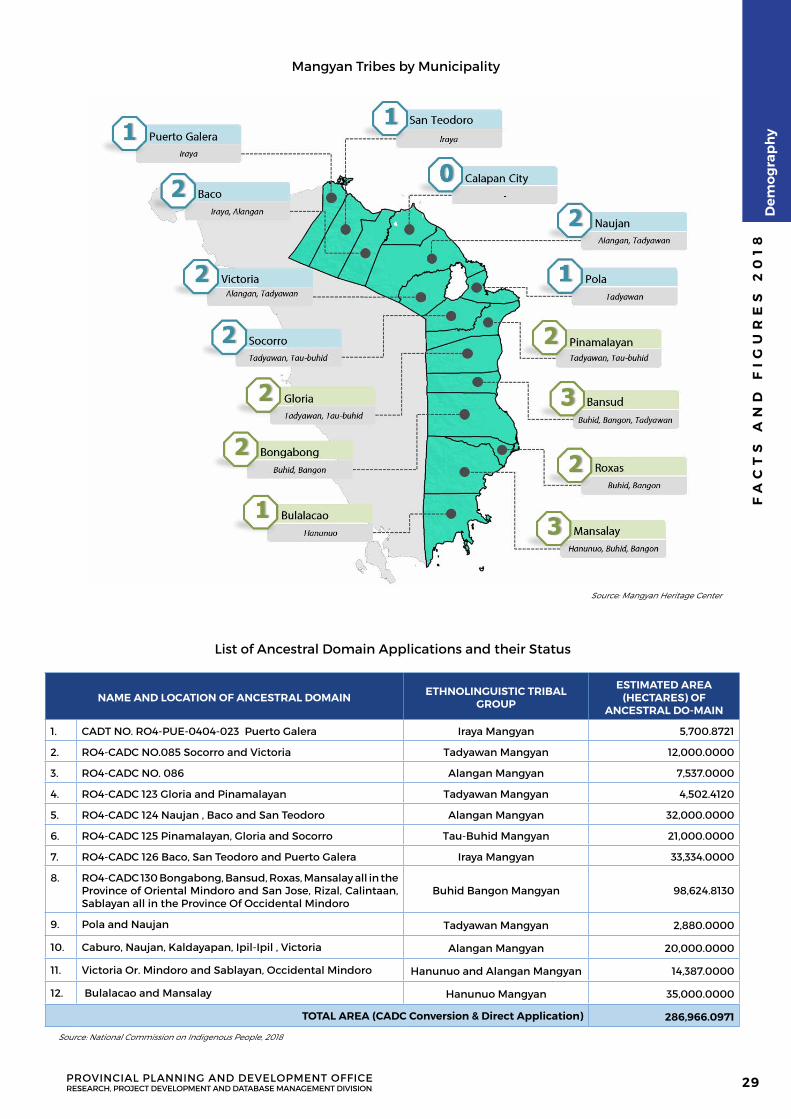
Mangyan Tribes by Municipality
Source: Mangyan Heritage Center
NAME AND LOCATION OF ANCESTRAL DOMAIN ETHNOLINGUISTIC TRIBAL GROUP
ESTIMATED AREA (HECTARES) OF
ANCESTRAL DO-MAIN
1. CADT NO. RO4-PUE-0404-023 Puerto Galera Iraya Mangyan 5,700.8721
2. RO4-CADC NO.085 Socorro and Victoria Tadyawan Mangyan 12,000.0000
3. RO4-CADC NO. 086 Alangan Mangyan 7,537.0000
4. RO4-CADC 123 Gloria and Pinamalayan Tadyawan Mangyan 4,502.4120
5. RO4-CADC 124 Naujan , Baco and San Teodoro Alangan Mangyan 32,000.0000
6. RO4-CADC 125 Pinamalayan, Gloria and Socorro Tau-Buhid Mangyan 21,000.0000
7. RO4-CADC 126 Baco, San Teodoro and Puerto Galera Iraya Mangyan 33,334.0000
8. RO4-CADC 130 Bongabong, Bansud, Roxas, Mansalay all in the Province of Oriental Mindoro and San Jose, Rizal, Calintaan, Sablayan all in the Province Of Occidental Mindoro
Buhid Bangon Mangyan 98,624.8130
9. Pola and Naujan Tadyawan Mangyan 2,880.0000
10. Caburo, Naujan, Kaldayapan, Ipil-Ipil , Victoria Alangan Mangyan 20,000.0000
11. Victoria Or. Mindoro and Sablayan, Occidental Mindoro Hanunuo and Alangan Mangyan 14,387.0000
12. Bulalacao and Mansalay Hanunuo Mangyan 35,000.0000
TOTAL AREA (CADC Conversion & Direct Application) 286,966.0971
Source: National Commission on Indigenous People, 2018
List of Ancestral Domain Applications and their Status
FA
CT
S A
ND
FI
GU
RE
S 2
01
8
PROVINCIAL PLANNING AND DEVELOPMENT OFFICERESEARCH, PROJECT DEVELOPMENT AND DATABASE MANAGEMENT DIVISION
Dem
og
rap
hy
29

ECONOMICPROFILE
O R I E N TA L M I N D O R O F A C T S A N D F I G U R E S 2 0 1 8
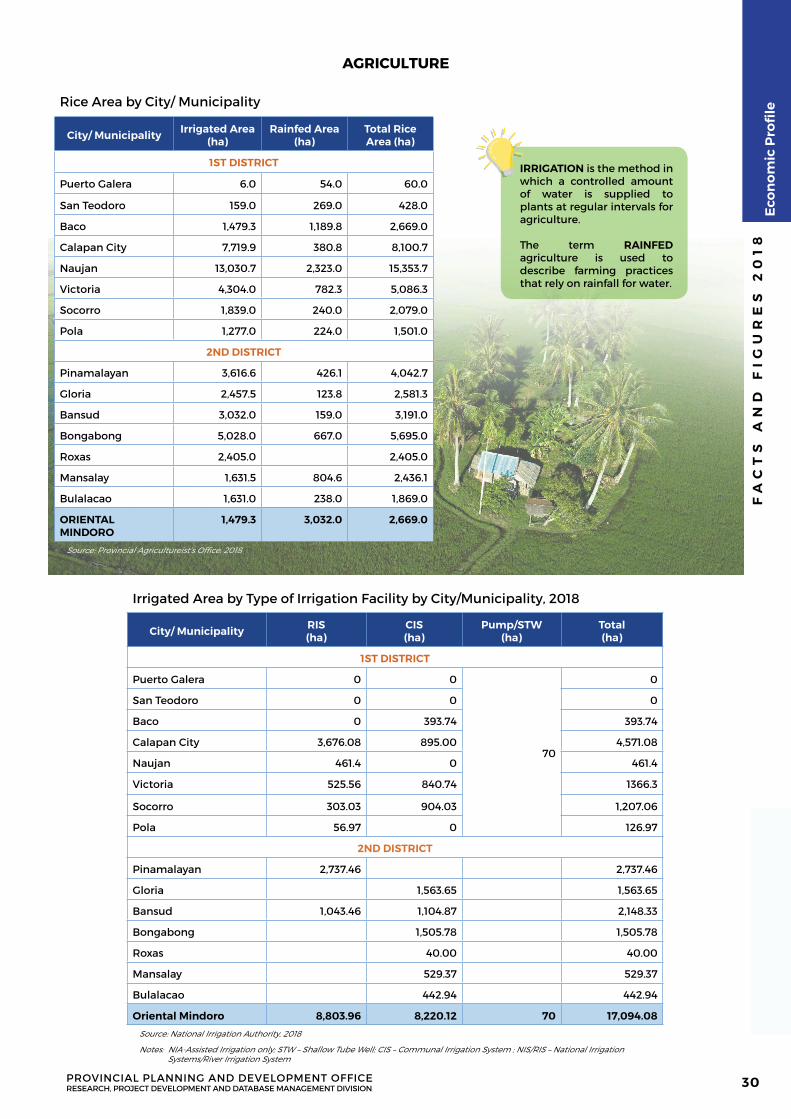
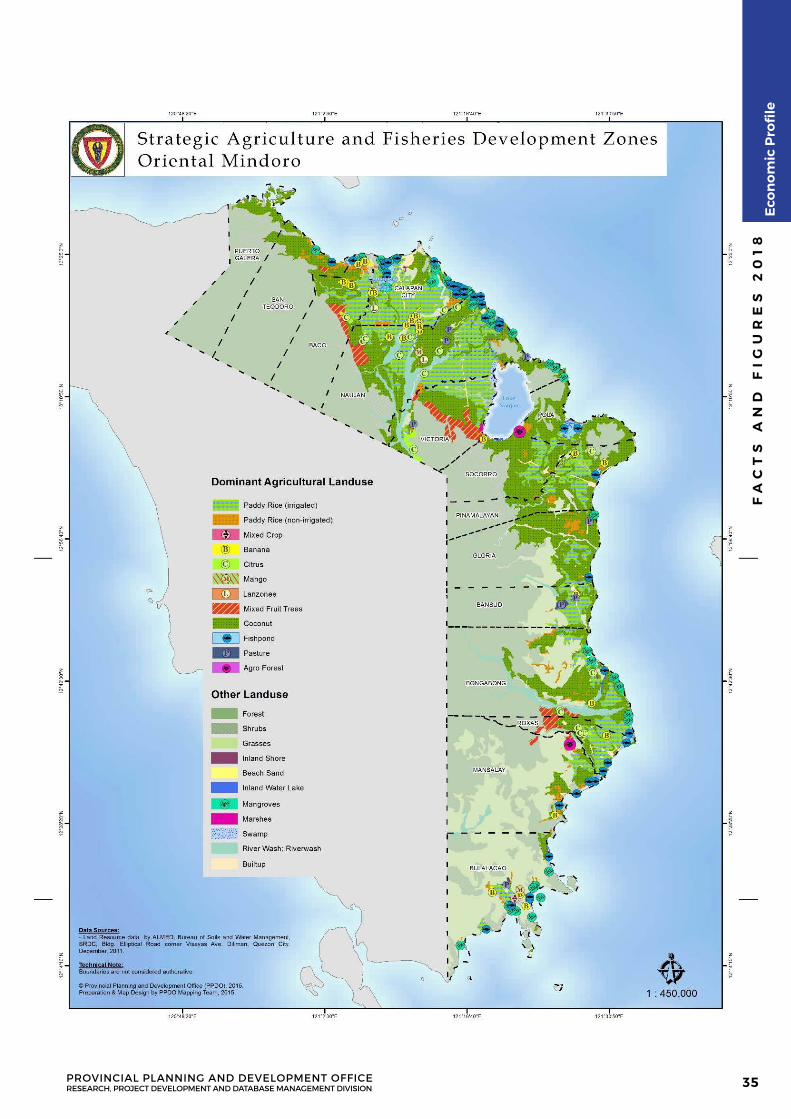
Rice Area by City/ Municipality
City/ Municipality Irrigated Area (ha)
Rainfed Area (ha)
Total Rice Area (ha)
1ST DISTRICT
Puerto Galera 6.0 54.0 60.0
San Teodoro 159.0 269.0 428.0
Baco 1,479.3 1,189.8 2,669.0
Calapan City 7,719.9 380.8 8,100.7
Naujan 13,030.7 2,323.0 15,353.7
Victoria 4,304.0 782.3 5,086.3
Socorro 1,839.0 240.0 2,079.0
Pola 1,277.0 224.0 1,501.0
2ND DISTRICT
Pinamalayan 3,616.6 426.1 4,042.7
Gloria 2,457.5 123.8 2,581.3
Bansud 3,032.0 159.0 3,191.0
Bongabong 5,028.0 667.0 5,695.0
Roxas 2,405.0 2,405.0
Mansalay 1,631.5 804.6 2,436.1
Bulalacao 1,631.0 238.0 1,869.0
ORIENTAL MINDORO
1,479.3 3,032.0 2,669.0
Source: Provincial Agricultureist’s Office, 2018
IRRIGATION is the method in which a controlled amount of water is supplied to plants at regular intervals for agriculture.
The term RAINFED agriculture is used to describe farming practices that rely on rainfall for water.
Irrigated Area by Type of Irrigation Facility by City/Municipality, 2018
City/ Municipality RIS(ha)
CIS(ha)
Pump/STW(ha)
Total(ha)
1ST DISTRICT
Puerto Galera 0 0
70
0
San Teodoro 0 0 0
Baco 0 393.74 393.74
Calapan City 3,676.08 895.00 4,571.08
Naujan 461.4 0 461.4
Victoria 525.56 840.74 1366.3
Socorro 303.03 904.03 1,207.06
Pola 56.97 0 126.97
2ND DISTRICT
Pinamalayan 2,737.46 2,737.46
Gloria 1,563.65 1,563.65
Bansud 1,043.46 1,104.87 2,148.33
Bongabong 1,505.78 1,505.78
Roxas 40.00 40.00
Mansalay 529.37 529.37
Bulalacao 442.94 442.94
Oriental Mindoro 8,803.96 8,220.12 70 17,094.08
Source: National Irrigation Authority, 2018
Notes: NIA-Assisted Irrigation only; STW – Shallow Tube Well; CIS – Communal Irrigation System ; NIS/RIS – National Irrigation Systems/River Irrigation System
AGRICULTURE
FA
CT
S A
ND
FI
GU
RE
S 2
01
8
PROVINCIAL PLANNING AND DEVELOPMENT OFFICERESEARCH, PROJECT DEVELOPMENT AND DATABASE MANAGEMENT DIVISION
Eco
no
mic
Pro
file
30
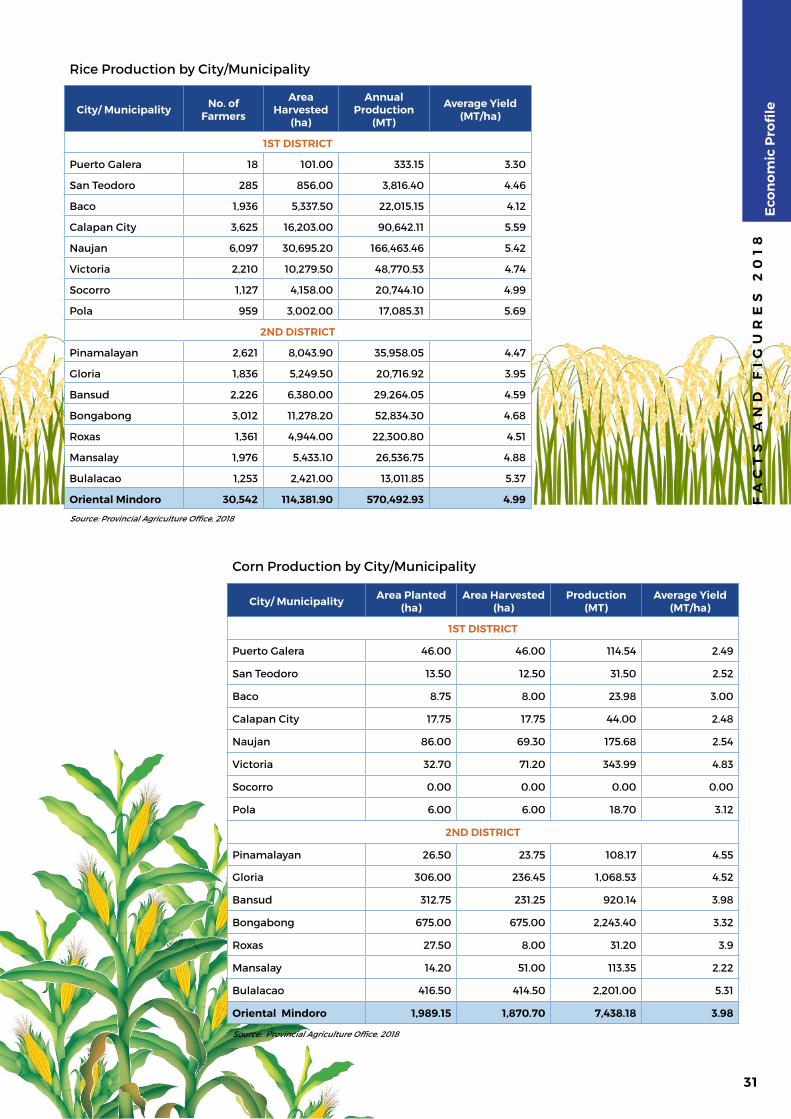
Rice Production by City/Municipality
City/ Municipality No. of Farmers
Area Harvested
(ha)
AnnualProduction
(MT)
Average Yield (MT/ha)
1ST DISTRICT
Puerto Galera 18 101.00 333.15 3.30
San Teodoro 285 856.00 3,816.40 4.46
Baco 1,936 5,337.50 22,015.15 4.12
Calapan City 3,625 16,203.00 90,642.11 5.59
Naujan 6,097 30,695.20 166,463.46 5.42
Victoria 2,210 10,279.50 48,770.53 4.74
Socorro 1,127 4,158.00 20,744.10 4.99
Pola 959 3,002.00 17,085.31 5.69
2ND DISTRICT
Pinamalayan 2,621 8,043.90 35,958.05 4.47
Gloria 1,836 5,249.50 20,716.92 3.95
Bansud 2,226 6,380.00 29,264.05 4.59
Bongabong 3,012 11,278.20 52,834.30 4.68
Roxas 1,361 4,944.00 22,300.80 4.51
Mansalay 1,976 5,433.10 26,536.75 4.88
Bulalacao 1,253 2,421.00 13,011.85 5.37
Oriental Mindoro 30,542 114,381.90 570,492.93 4.99
Source: Provincial Agriculture Office, 2018
Corn Production by City/Municipality
City/ Municipality Area Planted(ha)
Area Harvested(ha)
Production (MT)
Average Yield (MT/ha)
1ST DISTRICT
Puerto Galera 46.00 46.00 114.54 2.49
San Teodoro 13.50 12.50 31.50 2.52
Baco 8.75 8.00 23.98 3.00
Calapan City 17.75 17.75 44.00 2.48
Naujan 86.00 69.30 175.68 2.54
Victoria 32.70 71.20 343.99 4.83
Socorro 0.00 0.00 0.00 0.00
Pola 6.00 6.00 18.70 3.12
2ND DISTRICT
Pinamalayan 26.50 23.75 108.17 4.55
Gloria 306.00 236.45 1,068.53 4.52
Bansud 312.75 231.25 920.14 3.98
Bongabong 675.00 675.00 2,243.40 3.32
Roxas 27.50 8.00 31.20 3.9
Mansalay 14.20 51.00 113.35 2.22
Bulalacao 416.50 414.50 2,201.00 5.31
Oriental Mindoro 1,989.15 1,870.70 7,438.18 3.98
Source: Provincial Agriculture Office, 2018
FA
CT
S A
ND
FI
GU
RE
S 2
01
8E
con
om
ic P
rofi
le
31
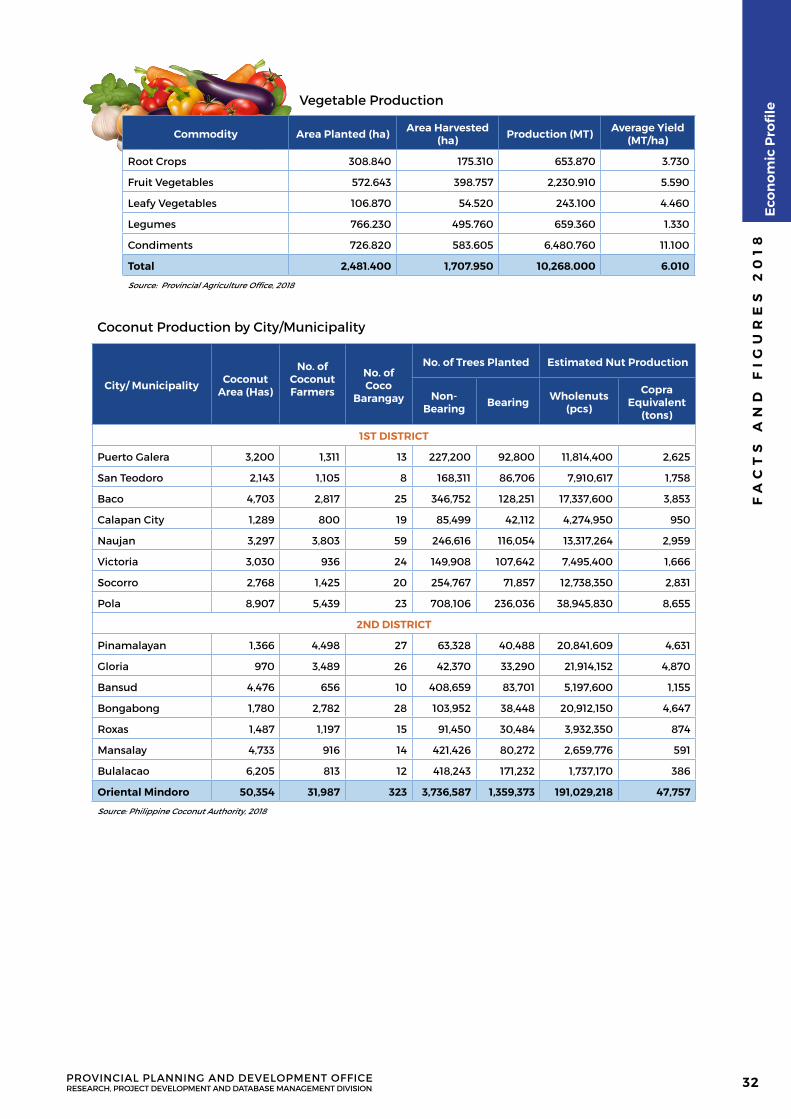
Vegetable Production
Commodity Area Planted (ha) Area Harvested (ha) Production (MT) Average Yield
(MT/ha)
Root Crops 308.840 175.310 653.870 3.730
Fruit Vegetables 572.643 398.757 2,230.910 5.590
Leafy Vegetables 106.870 54.520 243.100 4.460
Legumes 766.230 495.760 659.360 1.330
Condiments 726.820 583.605 6,480.760 11.100
Total 2,481.400 1,707.950 10,268.000 6.010
Source: Provincial Agriculture Office, 2018
Coconut Production by City/Municipality
City/ Municipality Coconut Area (Has)
No. of Coconut Farmers
No. of Coco
Barangay
No. of Trees Planted Estimated Nut Production
Non-Bearing Bearing Wholenuts
(pcs)
Copra Equivalent
(tons)
1ST DISTRICT
Puerto Galera 3,200 1,311 13 227,200 92,800 11,814,400 2,625
San Teodoro 2,143 1,105 8 168,311 86,706 7,910,617 1,758
Baco 4,703 2,817 25 346,752 128,251 17,337,600 3,853
Calapan City 1,289 800 19 85,499 42,112 4,274,950 950
Naujan 3,297 3,803 59 246,616 116,054 13,317,264 2,959
Victoria 3,030 936 24 149,908 107,642 7,495,400 1,666
Socorro 2,768 1,425 20 254,767 71,857 12,738,350 2,831
Pola 8,907 5,439 23 708,106 236,036 38,945,830 8,655
2ND DISTRICT
Pinamalayan 1,366 4,498 27 63,328 40,488 20,841,609 4,631
Gloria 970 3,489 26 42,370 33,290 21,914,152 4,870
Bansud 4,476 656 10 408,659 83,701 5,197,600 1,155
Bongabong 1,780 2,782 28 103,952 38,448 20,912,150 4,647
Roxas 1,487 1,197 15 91,450 30,484 3,932,350 874
Mansalay 4,733 916 14 421,426 80,272 2,659,776 591
Bulalacao 6,205 813 12 418,243 171,232 1,737,170 386
Oriental Mindoro 50,354 31,987 323 3,736,587 1,359,373 191,029,218 47,757
Source: Philippine Coconut Authority, 2018
FA
CT
S A
ND
FI
GU
RE
S 2
01
8
PROVINCIAL PLANNING AND DEVELOPMENT OFFICERESEARCH, PROJECT DEVELOPMENT AND DATABASE MANAGEMENT DIVISION
Eco
no
mic
Pro
file
32
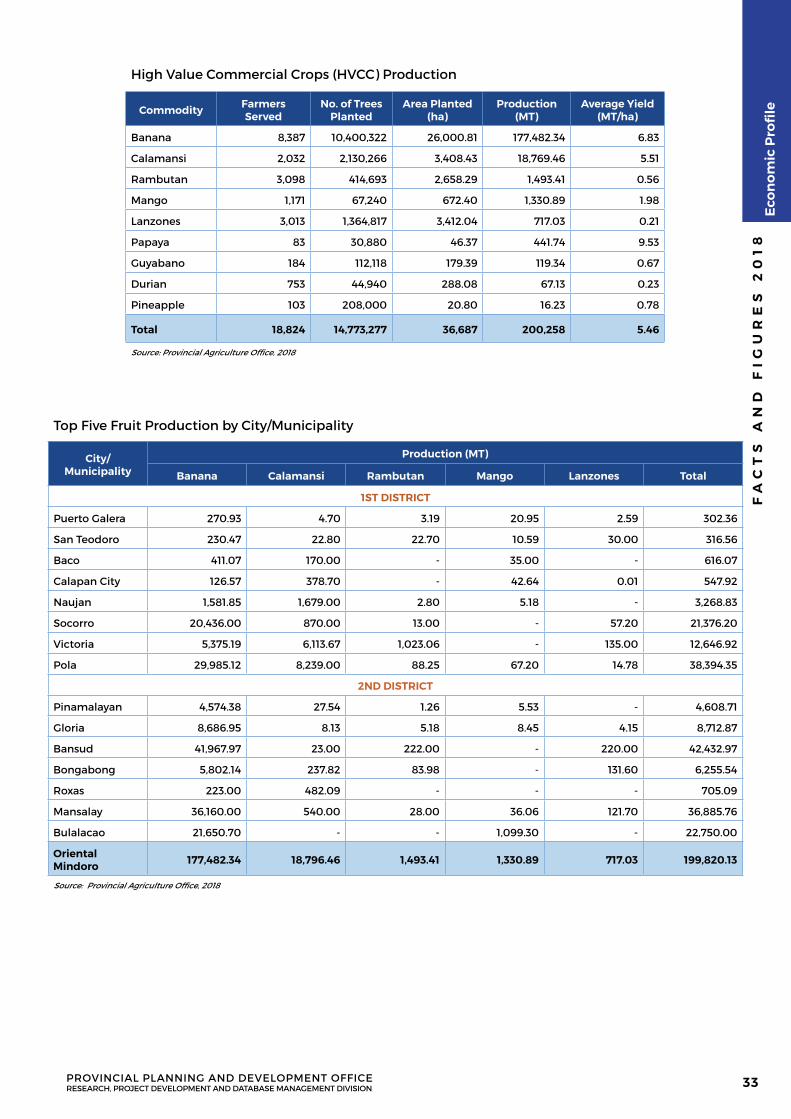
High Value Commercial Crops (HVCC) Production
Commodity Farmers Served
No. of Trees Planted
Area Planted (ha)
Production (MT)
Average Yield (MT/ha)
Banana 8,387 10,400,322 26,000.81 177,482.34 6.83
Calamansi 2,032 2,130,266 3,408.43 18,769.46 5.51
Rambutan 3,098 414,693 2,658.29 1,493.41 0.56
Mango 1,171 67,240 672.40 1,330.89 1.98
Lanzones 3,013 1,364,817 3,412.04 717.03 0.21
Papaya 83 30,880 46.37 441.74 9.53
Guyabano 184 112,118 179.39 119.34 0.67
Durian 753 44,940 288.08 67.13 0.23
Pineapple 103 208,000 20.80 16.23 0.78
Total 18,824 14,773,277 36,687 200,258 5.46
Source: Provincial Agriculture Office, 2018
Top Five Fruit Production by City/Municipality
City/ Municipality
Production (MT)
Banana Calamansi Rambutan Mango Lanzones Total
1ST DISTRICT
Puerto Galera 270.93 4.70 3.19 20.95 2.59 302.36
San Teodoro 230.47 22.80 22.70 10.59 30.00 316.56
Baco 411.07 170.00 - 35.00 - 616.07
Calapan City 126.57 378.70 - 42.64 0.01 547.92
Naujan 1,581.85 1,679.00 2.80 5.18 - 3,268.83
Socorro 20,436.00 870.00 13.00 - 57.20 21,376.20
Victoria 5,375.19 6,113.67 1,023.06 - 135.00 12,646.92
Pola 29,985.12 8,239.00 88.25 67.20 14.78 38,394.35
2ND DISTRICT
Pinamalayan 4,574.38 27.54 1.26 5.53 - 4,608.71
Gloria 8,686.95 8.13 5.18 8.45 4.15 8,712.87
Bansud 41,967.97 23.00 222.00 - 220.00 42,432.97
Bongabong 5,802.14 237.82 83.98 - 131.60 6,255.54
Roxas 223.00 482.09 - - - 705.09
Mansalay 36,160.00 540.00 28.00 36.06 121.70 36,885.76
Bulalacao 21,650.70 - - 1,099.30 - 22,750.00
Oriental Mindoro 177,482.34 18,796.46 1,493.41 1,330.89 717.03 199,820.13
Source: Provincial Agriculture Office, 2018
FA
CT
S A
ND
FI
GU
RE
S 2
01
8
PROVINCIAL PLANNING AND DEVELOPMENT OFFICERESEARCH, PROJECT DEVELOPMENT AND DATABASE MANAGEMENT DIVISION
Eco
no
mic
Pro
file
33
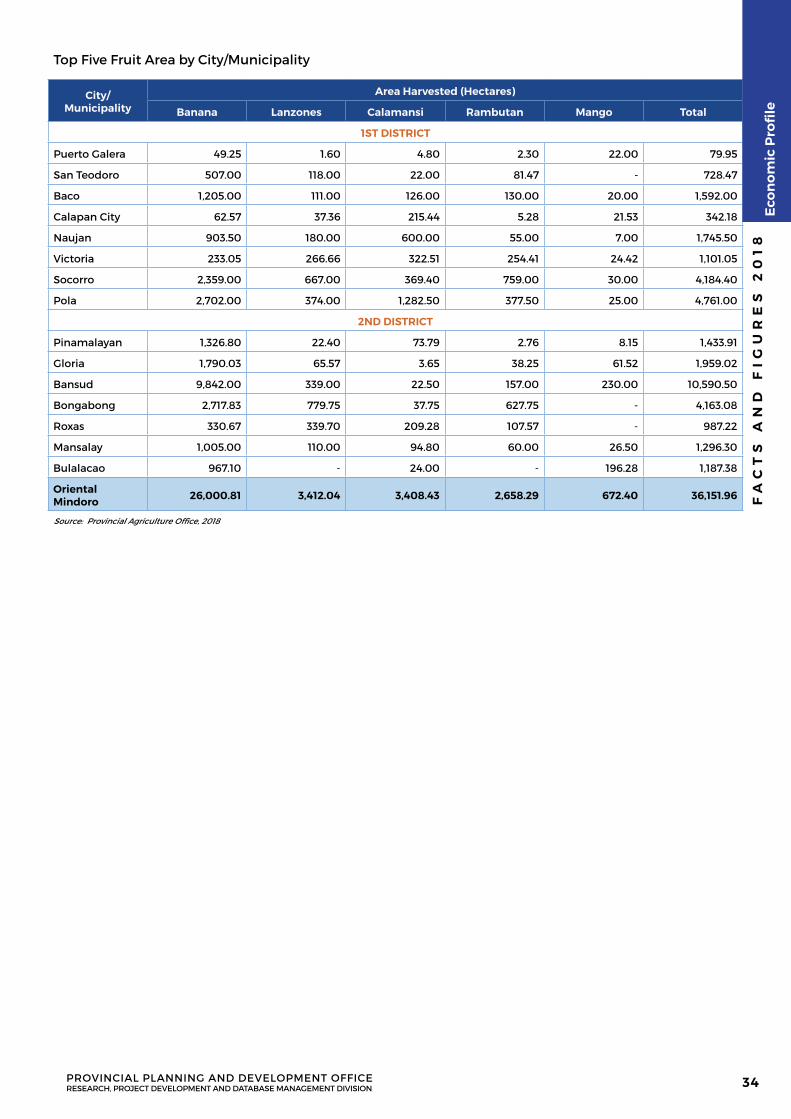
Top Five Fruit Area by City/Municipality
City/ Municipality
Area Harvested (Hectares)
Banana Lanzones Calamansi Rambutan Mango Total
1ST DISTRICT
Puerto Galera 49.25 1.60 4.80 2.30 22.00 79.95
San Teodoro 507.00 118.00 22.00 81.47 - 728.47
Baco 1,205.00 111.00 126.00 130.00 20.00 1,592.00
Calapan City 62.57 37.36 215.44 5.28 21.53 342.18
Naujan 903.50 180.00 600.00 55.00 7.00 1,745.50
Victoria 233.05 266.66 322.51 254.41 24.42 1,101.05
Socorro 2,359.00 667.00 369.40 759.00 30.00 4,184.40
Pola 2,702.00 374.00 1,282.50 377.50 25.00 4,761.00
2ND DISTRICT
Pinamalayan 1,326.80 22.40 73.79 2.76 8.15 1,433.91
Gloria 1,790.03 65.57 3.65 38.25 61.52 1,959.02
Bansud 9,842.00 339.00 22.50 157.00 230.00 10,590.50
Bongabong 2,717.83 779.75 37.75 627.75 - 4,163.08
Roxas 330.67 339.70 209.28 107.57 - 987.22
Mansalay 1,005.00 110.00 94.80 60.00 26.50 1,296.30
Bulalacao 967.10 - 24.00 - 196.28 1,187.38
Oriental Mindoro 26,000.81 3,412.04 3,408.43 2,658.29 672.40 36,151.96
Source: Provincial Agriculture Office, 2018
FA
CT
S A
ND
FI
GU
RE
S 2
01
8
PROVINCIAL PLANNING AND DEVELOPMENT OFFICERESEARCH, PROJECT DEVELOPMENT AND DATABASE MANAGEMENT DIVISION
Eco
no
mic
Pro
file
34
FA
CT
S A
ND
FI
GU
RE
S 2
01
8
PROVINCIAL PLANNING AND DEVELOPMENT OFFICERESEARCH, PROJECT DEVELOPMENT AND DATABASE MANAGEMENT DIVISION
Eco
no
mic
Pro
file
35
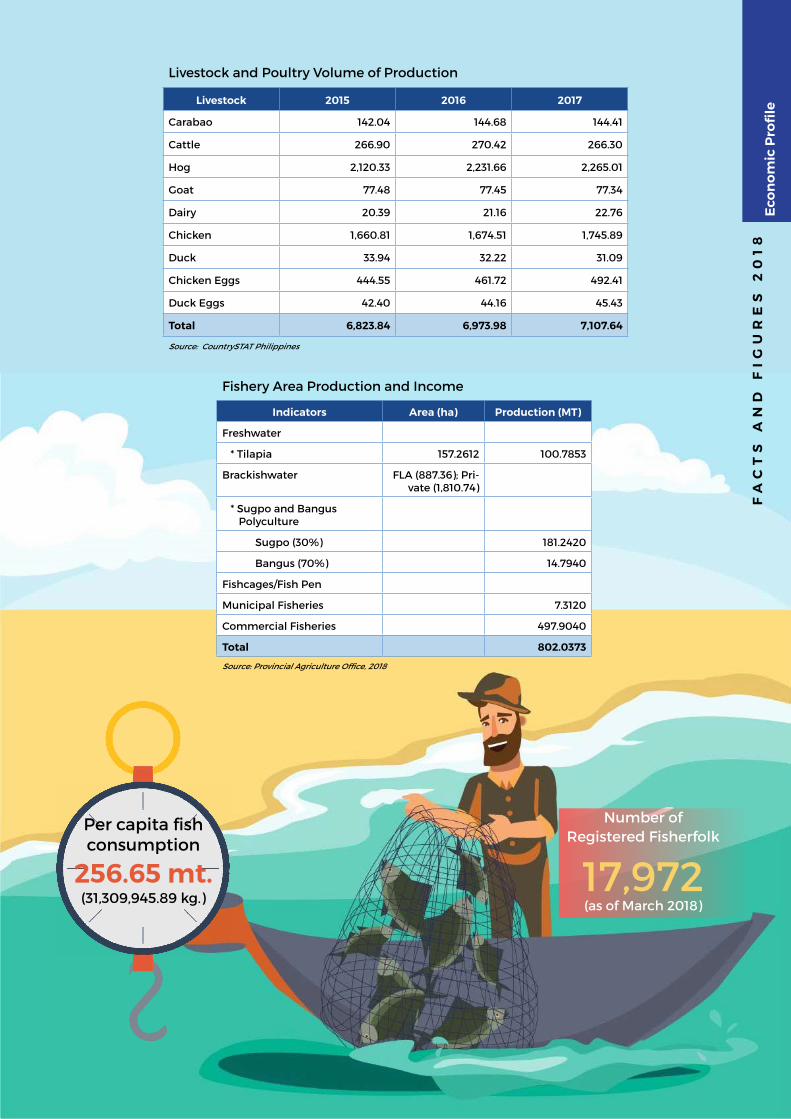
Livestock and Poultry Volume of Production
Livestock 2015 2016 2017
Carabao 142.04 144.68 144.41
Cattle 266.90 270.42 266.30
Hog 2,120.33 2,231.66 2,265.01
Goat 77.48 77.45 77.34
Dairy 20.39 21.16 22.76
Chicken 1,660.81 1,674.51 1,745.89
Duck 33.94 32.22 31.09
Chicken Eggs 444.55 461.72 492.41
Duck Eggs 42.40 44.16 45.43
Total 6,823.84 6,973.98 7,107.64
Source: CountrySTAT Philippines
Fishery Area Production and Income
Indicators Area (ha) Production (MT)
Freshwater
* Tilapia 157.2612 100.7853
Brackishwater FLA (887.36); Pri-vate (1,810.74)
* Sugpo and Bangus Polyculture
Sugpo (30%) 181.2420
Bangus (70%) 14.7940
Fishcages/Fish Pen
Municipal Fisheries 7.3120
Commercial Fisheries 497.9040
Total 802.0373
Source: Provincial Agriculture Office, 2018
Number of Registered Fisherfolk
17,972(as of March 2018)
Per capita fish consumption
256.65 mt.(31,309,945.89 kg.)
FA
CT
S A
ND
FI
GU
RE
S 2
01
8E
con
om
ic P
rofi
le
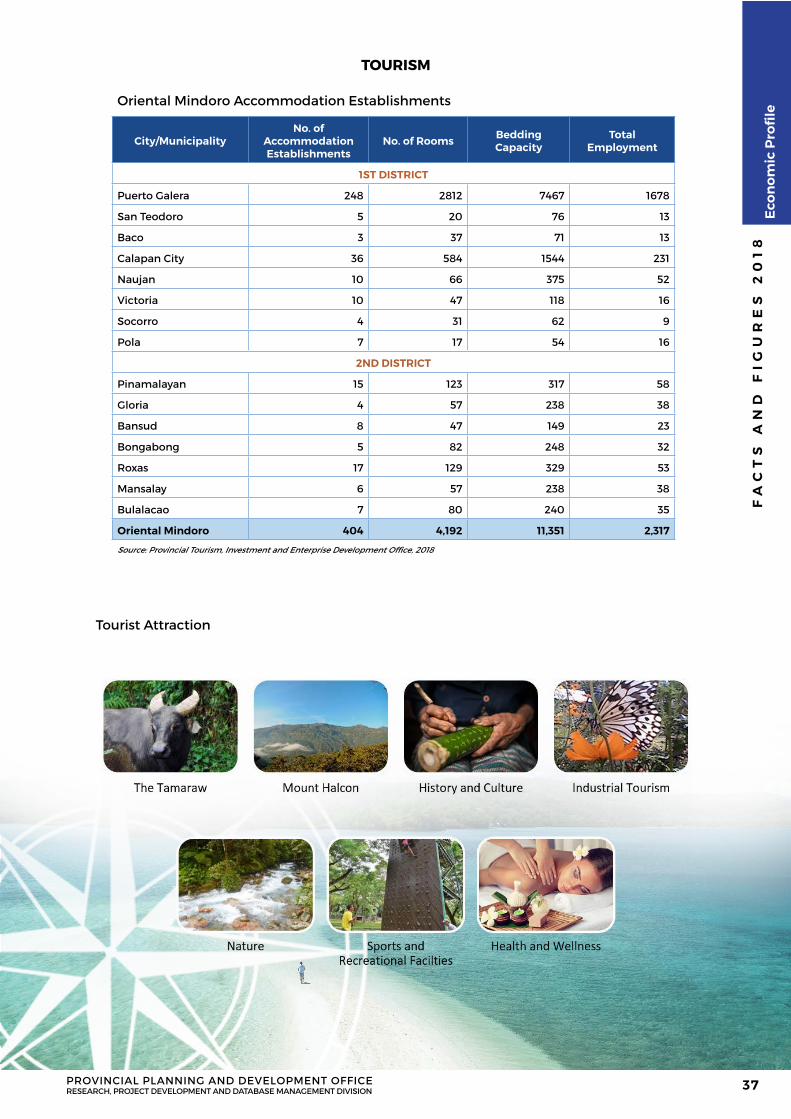
Oriental Mindoro Accommodation Establishments
City/MunicipalityNo. of
Accommodation Establishments
No. of Rooms Bedding Capacity
Total Employment
1ST DISTRICT
Puerto Galera 248 2812 7467 1678
San Teodoro 5 20 76 13
Baco 3 37 71 13
Calapan City 36 584 1544 231
Naujan 10 66 375 52
Victoria 10 47 118 16
Socorro 4 31 62 9
Pola 7 17 54 16
2ND DISTRICT
Pinamalayan 15 123 317 58
Gloria 4 57 238 38
Bansud 8 47 149 23
Bongabong 5 82 248 32
Roxas 17 129 329 53
Mansalay 6 57 238 38
Bulalacao 7 80 240 35
Oriental Mindoro 404 4,192 11,351 2,317
Source: Provincial Tourism, Investment and Enterprise Development Office, 2018
TOURISM
Tourist Attraction
FA
CT
S A
ND
FI
GU
RE
S 2
01
8
PROVINCIAL PLANNING AND DEVELOPMENT OFFICERESEARCH, PROJECT DEVELOPMENT AND DATABASE MANAGEMENT DIVISION
Eco
no
mic
Pro
file
37
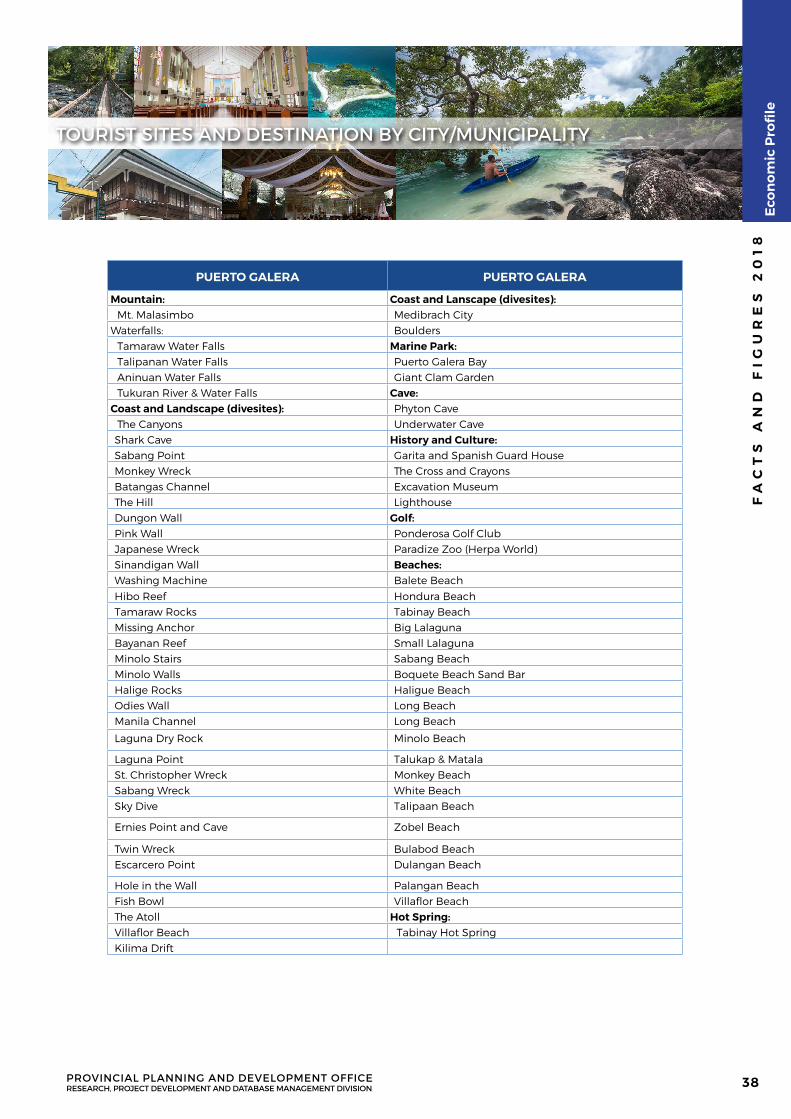
TOURIST SITES AND DESTINATION BY CITY/MUNICIPALITY
PUERTO GALERA PUERTO GALERA
Mountain: Coast and Lanscape (divesites):Mt. Malasimbo Medibrach City
Waterfalls: BouldersTamaraw Water Falls Marine Park:Talipanan Water Falls Puerto Galera BayAninuan Water Falls Giant Clam GardenTukuran River & Water Falls Cave:
Coast and Landscape (divesites): Phyton CaveThe Canyons Underwater CaveShark Cave History and Culture:Sabang Point Garita and Spanish Guard HouseMonkey Wreck The Cross and CrayonsBatangas Channel Excavation MuseumThe Hill LighthouseDungon Wall Golf:Pink Wall Ponderosa Golf ClubJapanese Wreck Paradize Zoo (Herpa World)Sinandigan Wall Beaches:Washing Machine Balete Beach
Hibo Reef Hondura BeachTamaraw Rocks Tabinay BeachMissing Anchor Big LalagunaBayanan Reef Small LalagunaMinolo Stairs Sabang BeachMinolo Walls Boquete Beach Sand BarHalige Rocks Haligue BeachOdies Wall Long BeachManila Channel Long Beach
Laguna Dry Rock Minolo Beach
Laguna Point Talukap & MatalaSt. Christopher Wreck Monkey BeachSabang Wreck White BeachSky Dive Talipaan Beach
Ernies Point and Cave Zobel Beach
Twin Wreck Bulabod BeachEscarcero Point Dulangan Beach
Hole in the Wall Palangan BeachFish Bowl Villaflor BeachThe Atoll Hot Spring:Villaflor Beach Tabinay Hot SpringKilima Drift
FA
CT
S A
ND
FI
GU
RE
S 2
01
8
PROVINCIAL PLANNING AND DEVELOPMENT OFFICERESEARCH, PROJECT DEVELOPMENT AND DATABASE MANAGEMENT DIVISION
Eco
no
mic
Pro
file
38
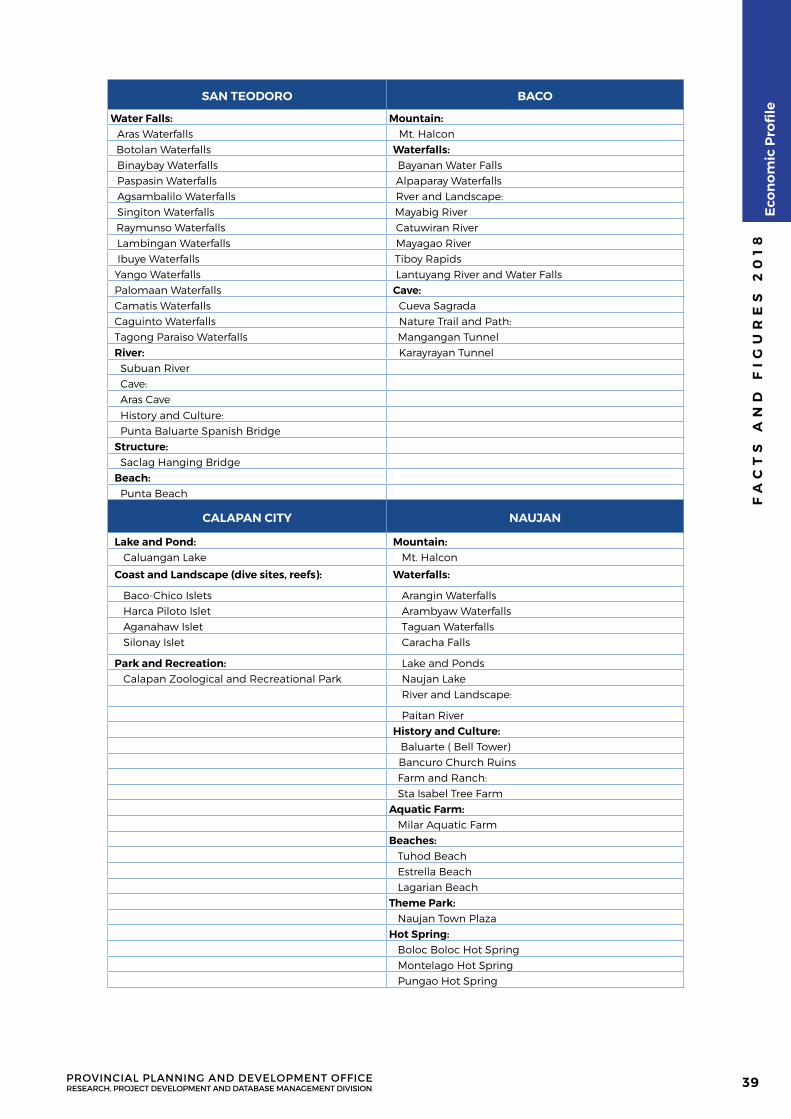
SAN TEODORO BACO
Water Falls: Mountain:Aras Waterfalls Mt. Halcon
Botolan Waterfalls Waterfalls:Binaybay Waterfalls Bayanan Water FallsPaspasin Waterfalls Alpaparay WaterfallsAgsambalilo Waterfalls Rver and Landscape:Singiton Waterfalls Mayabig River
Raymunso Waterfalls Catuwiran RiverLambingan Waterfalls Mayagao River Ibuye Waterfalls Tiboy RapidsYango Waterfalls Lantuyang River and Water FallsPalomaan Waterfalls Cave:Camatis Waterfalls Cueva SagradaCaguinto Waterfalls Nature Trail and Path:Tagong Paraiso Waterfalls Mangangan TunnelRiver: Karayrayan Tunnel Subuan River Cave: Aras Cave
History and Culture: Punta Baluarte Spanish BridgeStructure: Saclag Hanging BridgeBeach: Punta Beach
CALAPAN CITY NAUJAN
Lake and Pond: Mountain: Caluangan Lake Mt. Halcon
Coast and Landscape (dive sites, reefs): Waterfalls:
Baco-Chico Islets Arangin Waterfalls Harca Piloto Islet Arambyaw Waterfalls Aganahaw Islet Taguan Waterfalls Silonay Islet Caracha Falls
Park and Recreation: Lake and Ponds Calapan Zoological and Recreational Park Naujan Lake
River and Landscape:
Paitan RiverHistory and Culture:
Baluarte ( Bell Tower) Bancuro Church Ruins
Farm and Ranch: Sta Isabel Tree FarmAquatic Farm: Milar Aquatic FarmBeaches: Tuhod Beach Estrella Beach Lagarian BeachTheme Park: Naujan Town PlazaHot Spring: Boloc Boloc Hot Spring Montelago Hot Spring Pungao Hot Spring
FA
CT
S A
ND
FI
GU
RE
S 2
01
8
PROVINCIAL PLANNING AND DEVELOPMENT OFFICERESEARCH, PROJECT DEVELOPMENT AND DATABASE MANAGEMENT DIVISION
Eco
no
mic
Pro
file
39
FA
CT
S A
ND
FI
GU
RE
S 2
01
8
PROVINCIAL PLANNING AND DEVELOPMENT OFFICERESEARCH, PROJECT DEVELOPMENT AND DATABASE MANAGEMENT DIVISION
Eco
no
mic
Pro
file
40
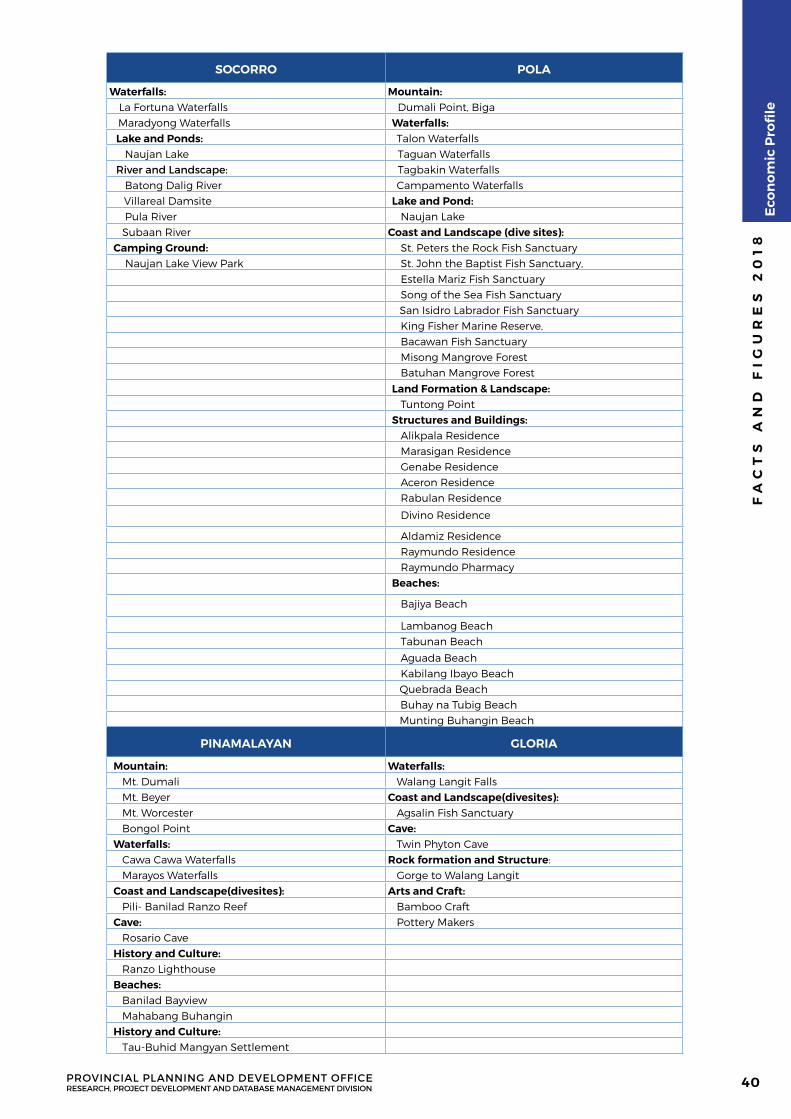
SOCORRO POLA
Waterfalls: Mountain: La Fortuna Waterfalls Dumali Point, Biga
Maradyong Waterfalls Waterfalls:Lake and Ponds: Talon Waterfalls Naujan Lake Taguan WaterfallsRiver and Landscape: Tagbakin Waterfalls Batong Dalig River Campamento Waterfalls
Villareal Damsite Lake and Pond: Pula River Naujan Lake Subaan River Coast and Landscape (dive sites):Camping Ground: St. Peters the Rock Fish Sanctuary Naujan Lake View Park St. John the Baptist Fish Sanctuary,
Estella Mariz Fish Sanctuary Song of the Sea Fish Sanctuary
San Isidro Labrador Fish Sanctuary King Fisher Marine Reserve, Bacawan Fish Sanctuary Misong Mangrove Forest Batuhan Mangrove Forest
Land Formation & Landscape: Tuntong PointStructures and Buildings: Alikpala Residence Marasigan Residence Genabe Residence Aceron Residence Rabulan Residence
Divino Residence
Aldamiz Residence Raymundo Residence Raymundo PharmacyBeaches:
Bajiya Beach
Lambanog Beach Tabunan Beach
Aguada Beach Kabilang Ibayo Beach
Quebrada Beach Buhay na Tubig Beach
Munting Buhangin Beach
PINAMALAYAN GLORIA
Mountain: Waterfalls: Mt. Dumali Walang Langit Falls Mt. Beyer Coast and Landscape(divesites): Mt. Worcester Agsalin Fish Sanctuary Bongol Point Cave:Waterfalls: Twin Phyton Cave Cawa Cawa Waterfalls Rock formation and Structure: Marayos Waterfalls Gorge to Walang LangitCoast and Landscape(divesites): Arts and Craft: Pili- Banilad Ranzo Reef Bamboo CraftCave: Pottery Makers Rosario CaveHistory and Culture: Ranzo LighthouseBeaches: Banilad Bayview Mahabang BuhanginHistory and Culture: Tau-Buhid Mangyan Settlement
FA
CT
S A
ND
FI
GU
RE
S 2
01
8
PROVINCIAL PLANNING AND DEVELOPMENT OFFICERESEARCH, PROJECT DEVELOPMENT AND DATABASE MANAGEMENT DIVISION
Eco
no
mic
Pro
file
41
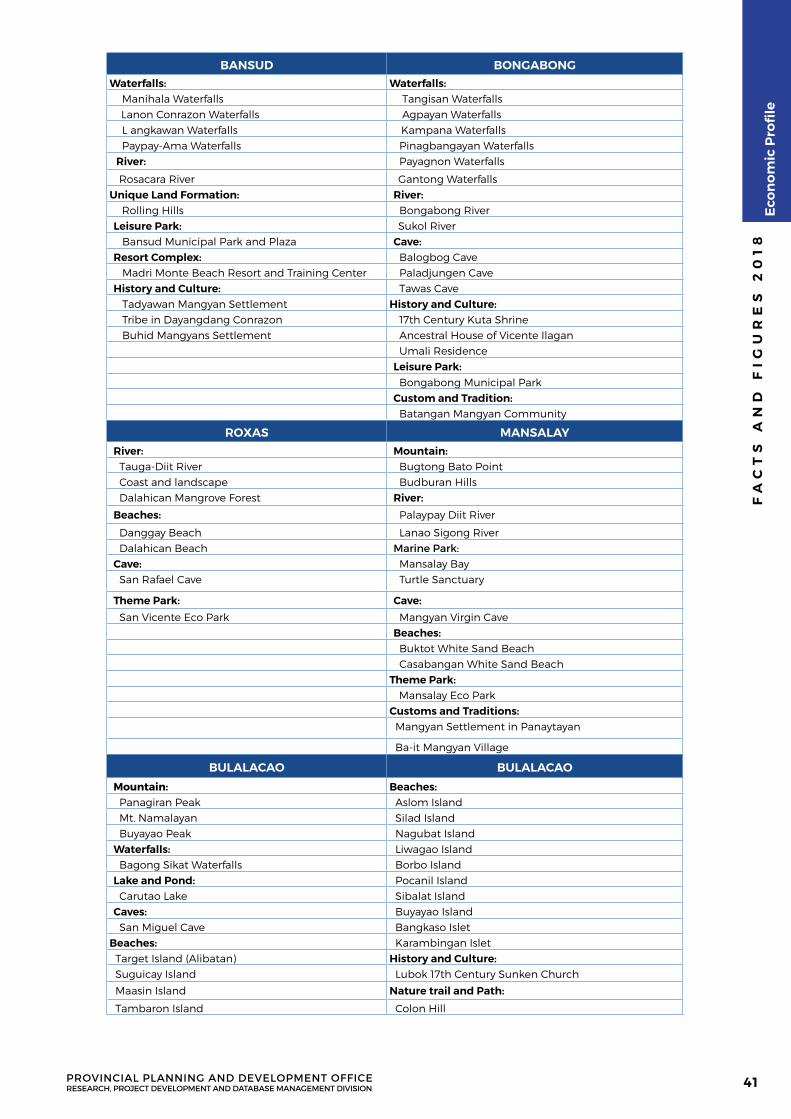
BANSUD BONGABONGWaterfalls: Waterfalls:
Manihala Waterfalls Tangisan Waterfalls Lanon Conrazon Waterfalls Agpayan Waterfalls
L angkawan Waterfalls Kampana Waterfalls Paypay-Ama Waterfalls Pinagbangayan WaterfallsRiver: Payagnon Waterfalls
Rosacara River Gantong WaterfallsUnique Land Formation: River:
Rolling Hills Bongabong RiverLeisure Park: Sukol River Bansud Municipal Park and Plaza Cave:Resort Complex: Balogbog Cave Madri Monte Beach Resort and Training Center Paladjungen CaveHistory and Culture: Tawas Cave Tadyawan Mangyan Settlement History and Culture: Tribe in Dayangdang Conrazon 17th Century Kuta Shrine Buhid Mangyans Settlement Ancestral House of Vicente Ilagan
Umali ResidenceLeisure Park: Bongabong Municipal ParkCustom and Tradition: Batangan Mangyan Community
ROXAS MANSALAYRiver: Mountain: Tauga-Diit River Bugtong Bato Point Coast and landscape Budburan Hills Dalahican Mangrove Forest River:
Beaches: Palaypay Diit River
Danggay Beach Lanao Sigong River Dalahican Beach Marine Park:Cave: Mansalay Bay San Rafael Cave Turtle Sanctuary
Theme Park: Cave:
San Vicente Eco Park Mangyan Virgin CaveBeaches: Buktot White Sand Beach Casabangan White Sand Beach
Theme Park: Mansalay Eco Park
Customs and Traditions: Mangyan Settlement in Panaytayan
Ba-it Mangyan Village
BULALACAO BULALACAO
Mountain: Beaches: Panagiran Peak Aslom Island Mt. Namalayan Silad Island Buyayao Peak Nagubat IslandWaterfalls: Liwagao Island Bagong Sikat Waterfalls Borbo IslandLake and Pond: Pocanil Island Carutao Lake Sibalat IslandCaves: Buyayao Island San Miguel Cave Bangkaso Islet
Beaches: Karambingan Islet Target Island (Alibatan) History and Culture: Suguicay Island Lubok 17th Century Sunken Church
Maasin Island Nature trail and Path:
Tambaron Island Colon Hill
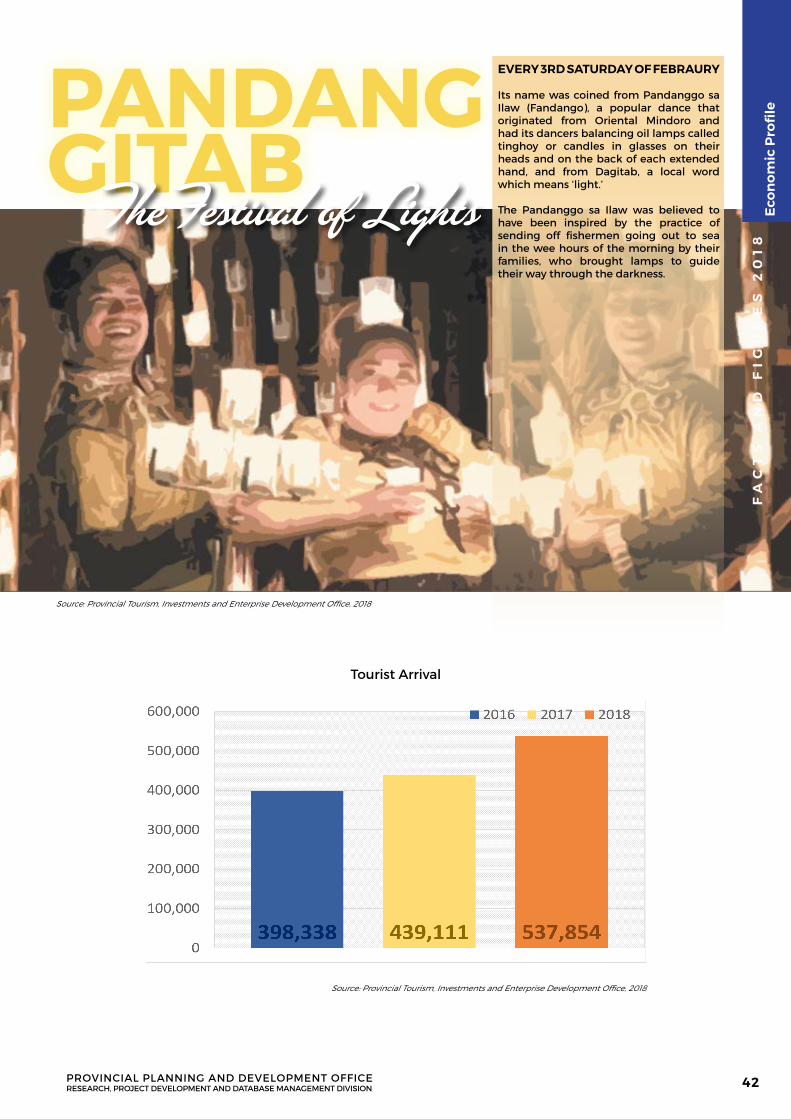
PANDANG GITABThe Festival of Lights
EVERY 3RD SATURDAY OF FEBRAURY
Its name was coined from Pandanggo sa Ilaw (Fandango), a popular dance that originated from Oriental Mindoro and had its dancers balancing oil lamps called tinghoy or candles in glasses on their heads and on the back of each extended hand, and from Dagitab, a local word which means ‘light.’
The Pandanggo sa Ilaw was believed to have been inspired by the practice of sending off fishermen going out to sea in the wee hours of the morning by their families, who brought lamps to guide their way through the darkness.
Source: Provincial Tourism, Investments and Enterprise Development Office, 2018
Source: Provincial Tourism, Investments and Enterprise Development Office, 2018
Tourist Arrival
FA
CT
S A
ND
FI
GU
RE
S 2
01
8
PROVINCIAL PLANNING AND DEVELOPMENT OFFICERESEARCH, PROJECT DEVELOPMENT AND DATABASE MANAGEMENT DIVISION
Eco
no
mic
Pro
file
42
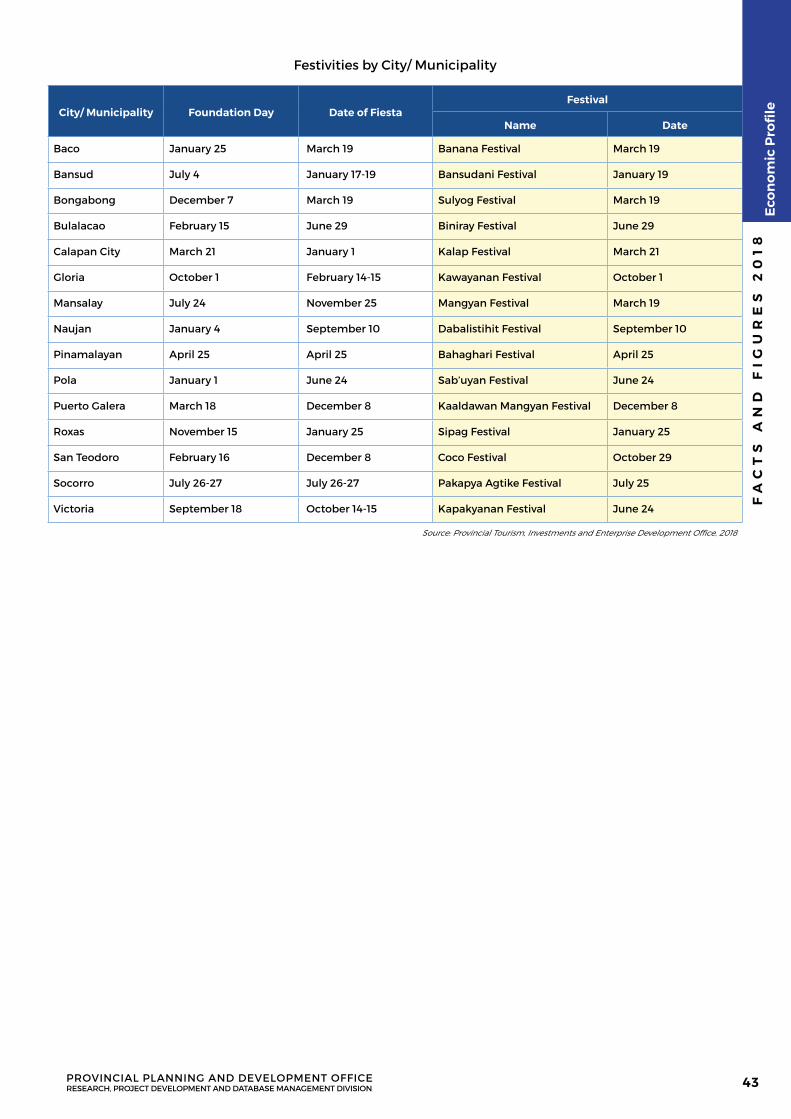
Festivities by City/ Municipality
City/ Municipality Foundation Day Date of FiestaFestival
Name Date
Baco January 25 March 19 Banana Festival March 19
Bansud July 4 January 17-19 Bansudani Festival January 19
Bongabong December 7 March 19 Sulyog Festival March 19
Bulalacao February 15 June 29 Biniray Festival June 29
Calapan City March 21 January 1 Kalap Festival March 21
Gloria October 1 February 14-15 Kawayanan Festival October 1
Mansalay July 24 November 25 Mangyan Festival March 19
Naujan January 4 September 10 Dabalistihit Festival September 10
Pinamalayan April 25 April 25 Bahaghari Festival April 25
Pola January 1 June 24 Sab’uyan Festival June 24
Puerto Galera March 18 December 8 Kaaldawan Mangyan Festival December 8
Roxas November 15 January 25 Sipag Festival January 25
San Teodoro February 16 December 8 Coco Festival October 29
Socorro July 26-27 July 26-27 Pakapya Agtike Festival July 25
Victoria September 18 October 14-15 Kapakyanan Festival June 24
Source: Provincial Tourism, Investments and Enterprise Development Office, 2018
FA
CT
S A
ND
FI
GU
RE
S 2
01
8
PROVINCIAL PLANNING AND DEVELOPMENT OFFICERESEARCH, PROJECT DEVELOPMENT AND DATABASE MANAGEMENT DIVISION
Eco
no
mic
Pro
file
43
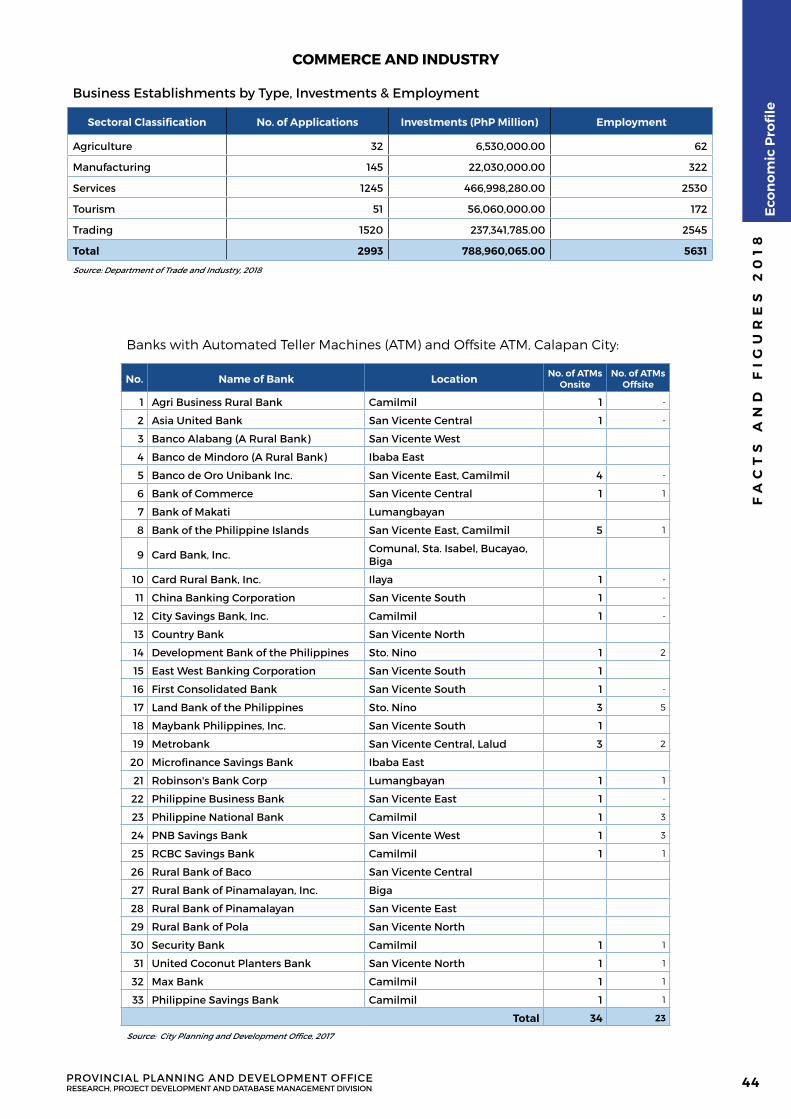
Business Establishments by Type, Investments & Employment
Sectoral Classification No. of Applications Investments (PhP Million) Employment
Agriculture 32 6,530,000.00 62
Manufacturing 145 22,030,000.00 322
Services 1245 466,998,280.00 2530
Tourism 51 56,060,000.00 172
Trading 1520 237,341,785.00 2545
Total 2993 788,960,065.00 5631
Source: Department of Trade and Industry, 2018
Banks with Automated Teller Machines (ATM) and Offsite ATM, Calapan City:
No. Name of Bank Location No. of ATMsOnsite
No. of ATMsOffsite
1 Agri Business Rural Bank Camilmil 1 -
2 Asia United Bank San Vicente Central 1 -
3 Banco Alabang (A Rural Bank) San Vicente West
4 Banco de Mindoro (A Rural Bank) Ibaba East
5 Banco de Oro Unibank Inc. San Vicente East, Camilmil 4 -
6 Bank of Commerce San Vicente Central 1 1
7 Bank of Makati Lumangbayan
8 Bank of the Philippine Islands San Vicente East, Camilmil 5 1
9 Card Bank, Inc. Comunal, Sta. Isabel, Bucayao, Biga
10 Card Rural Bank, Inc. Ilaya 1 -
11 China Banking Corporation San Vicente South 1 -
12 City Savings Bank, Inc. Camilmil 1 -
13 Country Bank San Vicente North
14 Development Bank of the Philippines Sto. Nino 1 2
15 East West Banking Corporation San Vicente South 1
16 First Consolidated Bank San Vicente South 1 -
17 Land Bank of the Philippines Sto. Nino 3 5
18 Maybank Philippines, Inc. San Vicente South 1
19 Metrobank San Vicente Central, Lalud 3 2
20 Microfinance Savings Bank Ibaba East
21 Robinson's Bank Corp Lumangbayan 1 1
22 Philippine Business Bank San Vicente East 1 -
23 Philippine National Bank Camilmil 1 3
24 PNB Savings Bank San Vicente West 1 3
25 RCBC Savings Bank Camilmil 1 1
26 Rural Bank of Baco San Vicente Central
27 Rural Bank of Pinamalayan, Inc. Biga
28 Rural Bank of Pinamalayan San Vicente East
29 Rural Bank of Pola San Vicente North
30 Security Bank Camilmil 1 1
31 United Coconut Planters Bank San Vicente North 1 1
32 Max Bank Camilmil 1 1
33 Philippine Savings Bank Camilmil 1 1
Total 34 23
Source: City Planning and Development Office, 2017
COMMERCE AND INDUSTRY
FA
CT
S A
ND
FI
GU
RE
S 2
01
8
PROVINCIAL PLANNING AND DEVELOPMENT OFFICERESEARCH, PROJECT DEVELOPMENT AND DATABASE MANAGEMENT DIVISION
Eco
no
mic
Pro
file
44
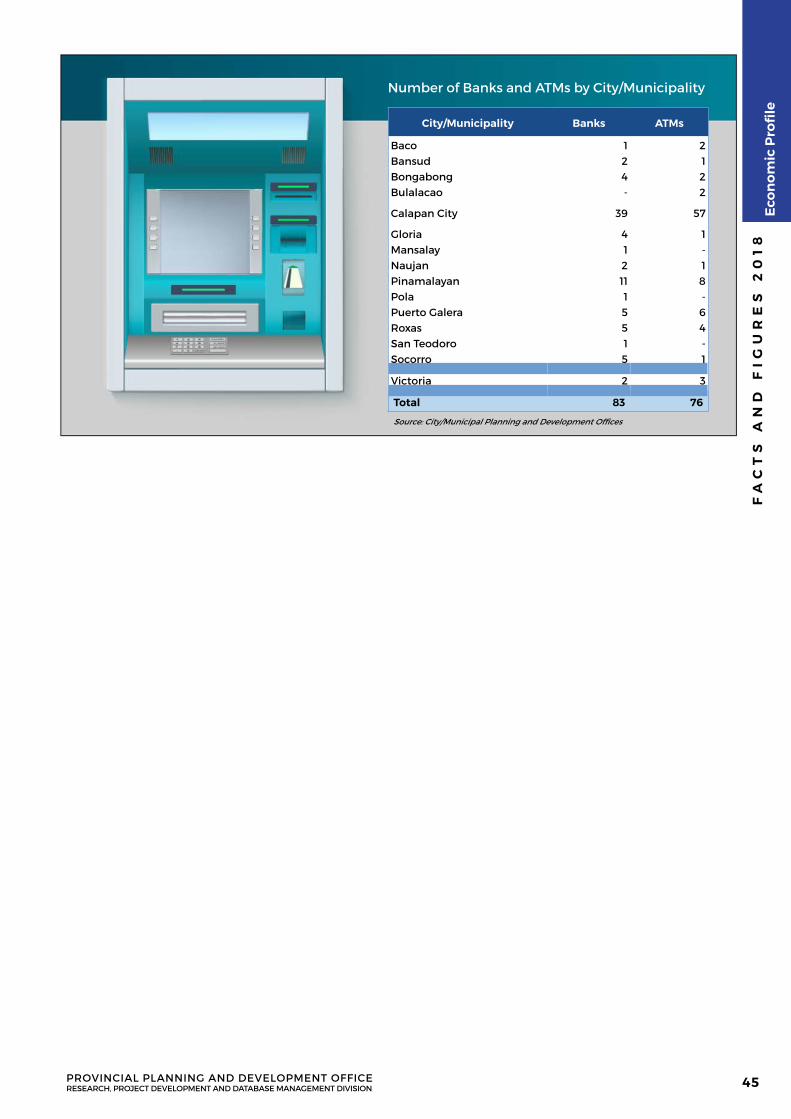
Number of Banks and ATMs by City/Municipality
City/Municipality Banks ATMs
Baco 1 2Bansud 2 1Bongabong 4 2Bulalacao - 2
Calapan City 39 57
Gloria 4 1Mansalay 1 -Naujan 2 1Pinamalayan 11 8Pola 1 - Puerto Galera 5 6Roxas 5 4San Teodoro 1 -Socorro 5 1
Victoria 2 3
Total 83 76
Source: City/Municipal Planning and Development Offices
FA
CT
S A
ND
FI
GU
RE
S 2
01
8
PROVINCIAL PLANNING AND DEVELOPMENT OFFICERESEARCH, PROJECT DEVELOPMENT AND DATABASE MANAGEMENT DIVISION
Eco
no
mic
Pro
file
45

INFRASTRUCTUREAND UTILITIES
O R I E N TA L M I N D O R O F A C T S A N D F I G U R E S 2 0 1 8
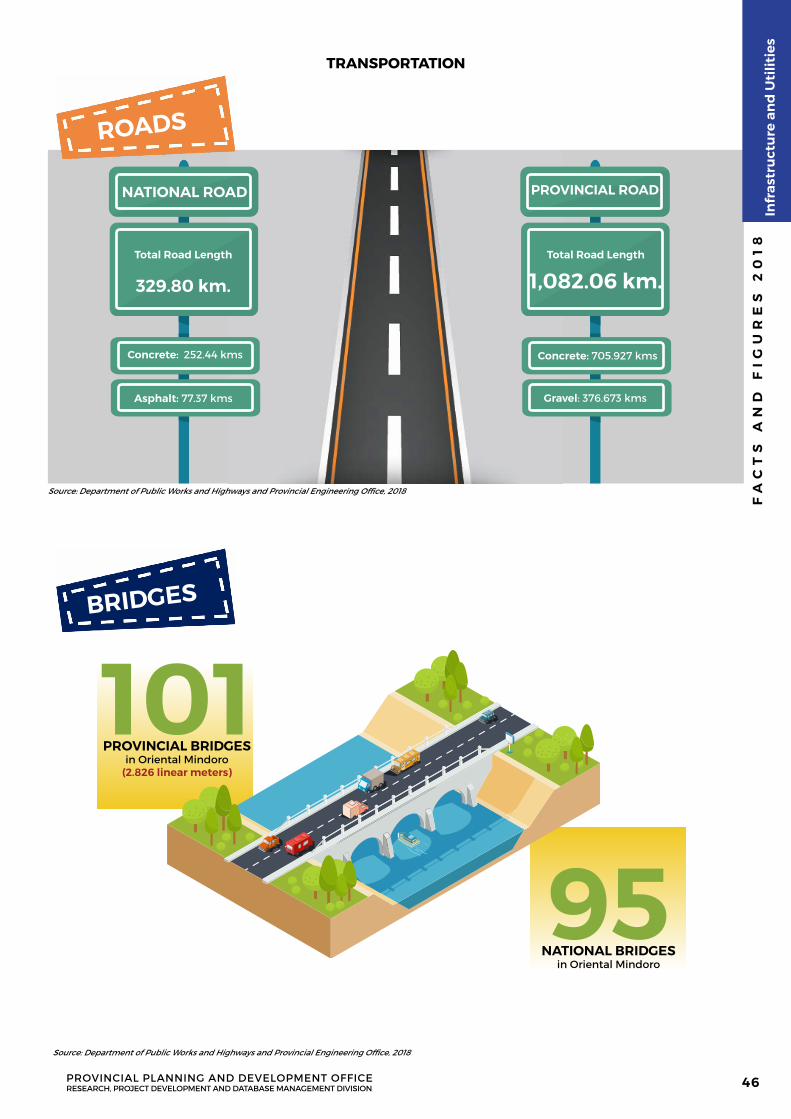
Concrete: 705.927 kms
Source: Department of Public Works and Highways and Provincial Engineering Office, 2018
ROADS
101PROVINCIAL BRIDGES
in Oriental Mindoro(2.826 linear meters)
Source: Department of Public Works and Highways and Provincial Engineering Office, 2018
TRANSPORTATION
Gravel: 376.673 kms
Concrete: 252.44 kms
Asphalt: 77.37 kms
NATIONAL ROAD PROVINCIAL ROAD
Total Road Length
329.80 km.
Total Road Length
1,082.06 km.
95NATIONAL BRIDGES
in Oriental Mindoro
BRIDGES
FA
CT
S A
ND
FI
GU
RE
S 2
01
8
PROVINCIAL PLANNING AND DEVELOPMENT OFFICERESEARCH, PROJECT DEVELOPMENT AND DATABASE MANAGEMENT DIVISION
Infr
astr
uct
ure
an
d U
tilit
ies
46
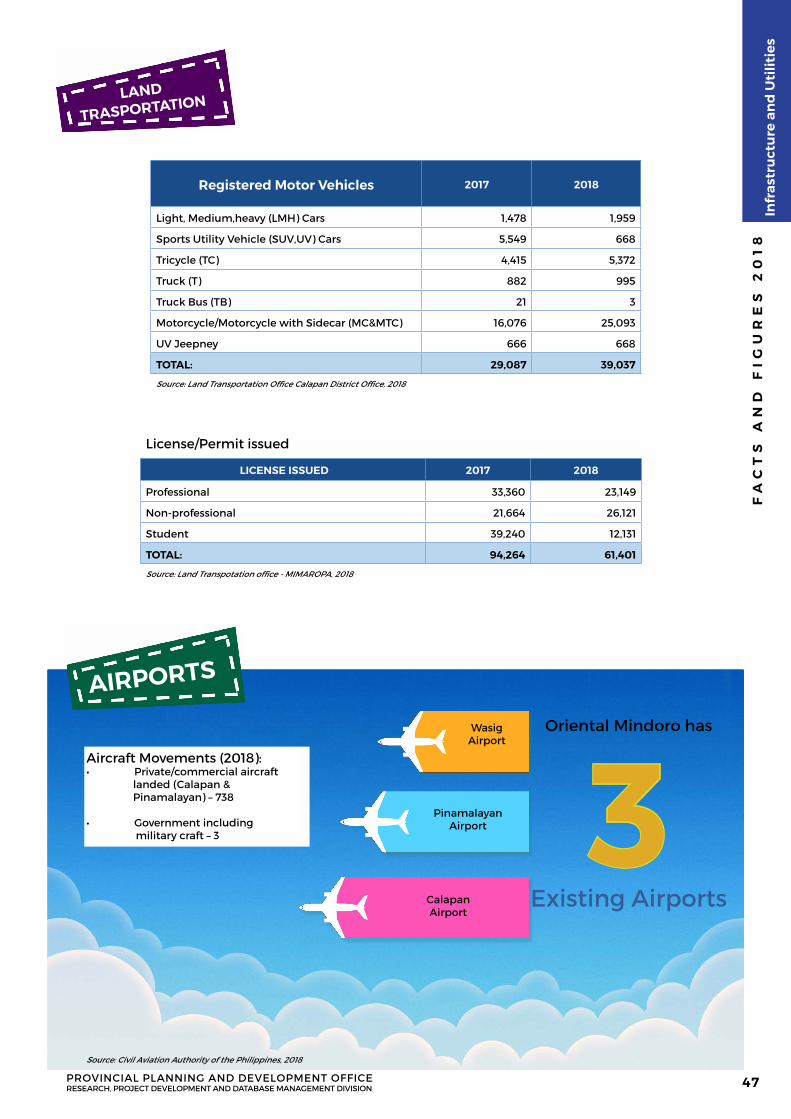
License/Permit issued
LICENSE ISSUED 2017 2018
Professional 33,360 23,149
Non-professional 21,664 26,121
Student 39,240 12,131
TOTAL: 94,264 61,401
Source: Land Transpotation office - MIMAROPA, 2018
Aircraft Movements (2018): • Private/commercial aircraft landed (Calapan & Pinamalayan) – 738
• Government including military craft – 3
Source: Civil Aviation Authority of the Philippines, 2018
3 Existing Airports
LAND
TRASPORTATION
AIRPORTS
Oriental Mindoro hasWasigAirport
PinamalayanAirport
CalapanAirport
Registered Motor Vehicles 2017 2018
Light, Medium,heavy (LMH) Cars 1,478 1,959
Sports Utility Vehicle (SUV,UV) Cars 5,549 668
Tricycle (TC) 4,415 5,372
Truck (T) 882 995
Truck Bus (TB) 21 3
Motorcycle/Motorcycle with Sidecar (MC&MTC) 16,076 25,093
UV Jeepney 666 668
TOTAL: 29,087 39,037
Source: Land Transportation Office Calapan District Office, 2018
FA
CT
S A
ND
FI
GU
RE
S 2
01
8
PROVINCIAL PLANNING AND DEVELOPMENT OFFICERESEARCH, PROJECT DEVELOPMENT AND DATABASE MANAGEMENT DIVISION
Infr
astr
uct
ure
an
d U
tilit
ies
47
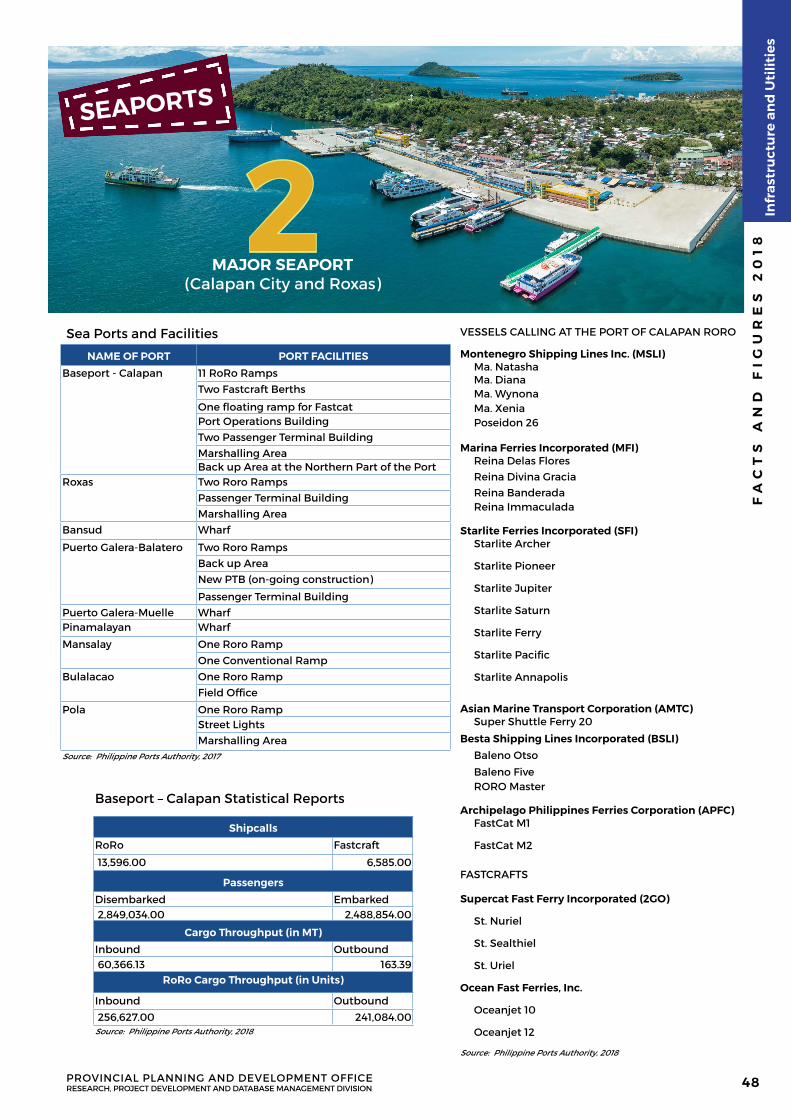
2 MAJOR SEAPORT
(Calapan City and Roxas)
Sea Ports and Facilities
NAME OF PORT PORT FACILITIES
Baseport - Calapan 11 RoRo RampsTwo Fastcraft Berths
One floating ramp for FastcatPort Operations BuildingTwo Passenger Terminal BuildingMarshalling AreaBack up Area at the Northern Part of the Port
Roxas Two Roro RampsPassenger Terminal BuildingMarshalling Area
Bansud Wharf
Puerto Galera-Balatero Two Roro RampsBack up AreaNew PTB (on-going construction)
Passenger Terminal BuildingPuerto Galera-Muelle WharfPinamalayan Wharf
Mansalay One Roro Ramp
One Conventional Ramp Bulalacao One Roro Ramp
Field Office
Pola One Roro RampStreet LightsMarshalling Area
Source: Philippine Ports Authority, 2017
Baseport – Calapan Statistical Reports
Shipcalls
RoRo Fastcraft
13,596.00 6,585.00
Passengers
Disembarked Embarked 2,849,034.00 2,488,854.00
Cargo Throughput (in MT)
Inbound Outbound 60,366.13 163.39
RoRo Cargo Throughput (in Units)
Inbound Outbound
256,627.00 241,084.00 Source: Philippine Ports Authority, 2018
VESSELS CALLING AT THE PORT OF CALAPAN RORO
Montenegro Shipping Lines Inc. (MSLI) Ma. Natasha Ma. Diana Ma. Wynona Ma. Xenia Poseidon 26
Marina Ferries Incorporated (MFI) Reina Delas Flores Reina Divina Gracia Reina Banderada Reina Immaculada
Starlite Ferries Incorporated (SFI) Starlite Archer
Starlite Pioneer
Starlite Jupiter
Starlite Saturn
Starlite Ferry
Starlite Pacific
Starlite Annapolis
Asian Marine Transport Corporation (AMTC) Super Shuttle Ferry 20
Besta Shipping Lines Incorporated (BSLI) Baleno Otso
Baleno Five RORO Master
Archipelago Philippines Ferries Corporation (APFC) FastCat M1
FastCat M2
FASTCRAFTS
Supercat Fast Ferry Incorporated (2GO)
St. Nuriel
St. Sealthiel
St. Uriel
Ocean Fast Ferries, Inc.
Oceanjet 10
Oceanjet 12
Source: Philippine Ports Authority, 2018
SEAPORTS
FA
CT
S A
ND
FI
GU
RE
S 2
01
8
PROVINCIAL PLANNING AND DEVELOPMENT OFFICERESEARCH, PROJECT DEVELOPMENT AND DATABASE MANAGEMENT DIVISION
Infr
astr
uct
ure
an
d U
tilit
ies
48
FA
CT
S A
ND
FI
GU
RE
S 2
01
8
PROVINCIAL PLANNING AND DEVELOPMENT OFFICERESEARCH, PROJECT DEVELOPMENT AND DATABASE MANAGEMENT DIVISION
Infr
astr
uct
ure
an
d U
tilit
ies
49
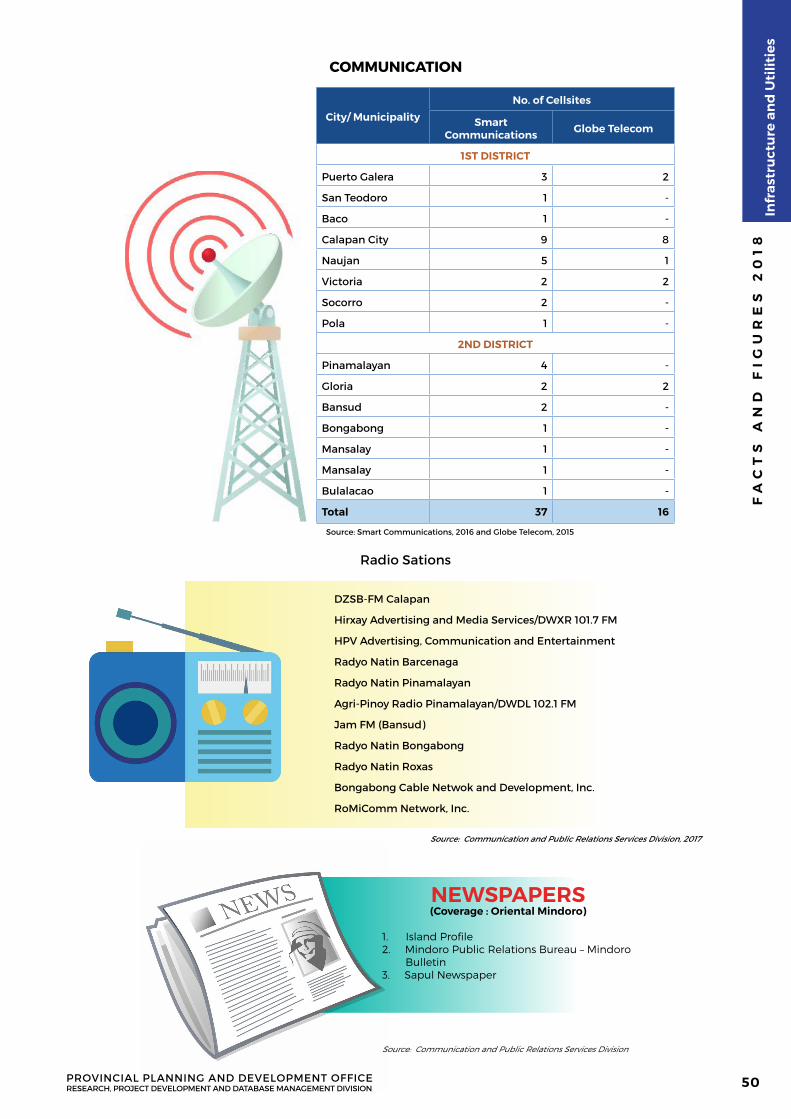
City/ Municipality
No. of Cellsites
Smart Communications Globe Telecom
1ST DISTRICT
Puerto Galera 3 2
San Teodoro 1 -
Baco 1 -
Calapan City 9 8
Naujan 5 1
Victoria 2 2
Socorro 2 -
Pola 1 -
2ND DISTRICT
Pinamalayan 4 -
Gloria 2 2
Bansud 2 -
Bongabong 1 -
Mansalay 1 -
Mansalay 1 -
Bulalacao 1 -
Total 37 16
Source: Smart Communications, 2016 and Globe Telecom, 2015
NEWSPAPERS(Coverage : Oriental Mindoro)
1. Island Profile2. Mindoro Public Relations Bureau – Mindoro Bulletin3. Sapul Newspaper
Source: Communication and Public Relations Services Division
COMMUNICATION
Source: Communication and Public Relations Services Division, 2017
DZSB-FM Calapan
Hirxay Advertising and Media Services/DWXR 101.7 FM
HPV Advertising, Communication and Entertainment
Radyo Natin Barcenaga
Radyo Natin Pinamalayan
Agri-Pinoy Radio Pinamalayan/DWDL 102.1 FM
Jam FM (Bansud)
Radyo Natin Bongabong
Radyo Natin Roxas
Bongabong Cable Netwok and Development, Inc.
RoMiComm Network, Inc.
Radio Sations
FA
CT
S A
ND
FI
GU
RE
S 2
01
8
PROVINCIAL PLANNING AND DEVELOPMENT OFFICERESEARCH, PROJECT DEVELOPMENT AND DATABASE MANAGEMENT DIVISION
Infr
astr
uct
ure
an
d U
tilit
ies
50
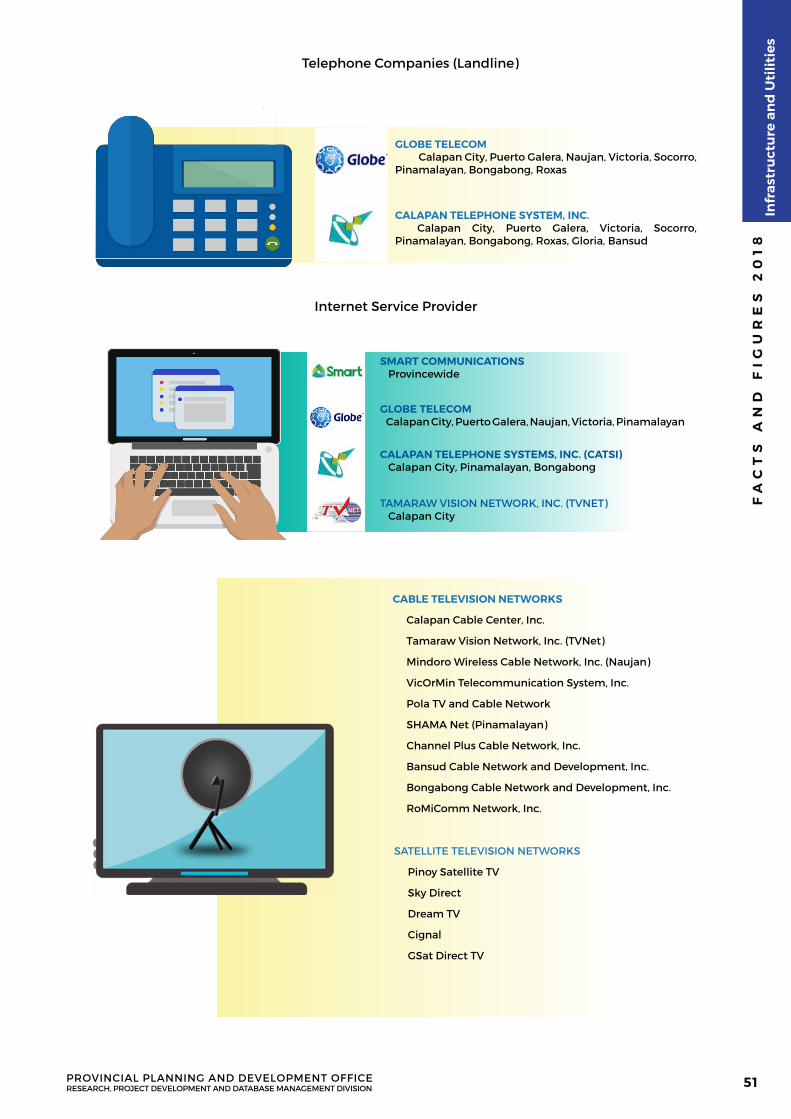
CALAPAN TELEPHONE SYSTEM, INC. Calapan City, Puerto Galera, Victoria, Socorro, Pinamalayan, Bongabong, Roxas, Gloria, Bansud
GLOBE TELECOM Calapan City, Puerto Galera, Naujan, Victoria, Socorro, Pinamalayan, Bongabong, Roxas
CALAPAN TELEPHONE SYSTEMS, INC. (CATSI) Calapan City, Pinamalayan, Bongabong
GLOBE TELECOM Calapan City, Puerto Galera, Naujan, Victoria, Pinamalayan
SMART COMMUNICATIONS Provincewide
TAMARAW VISION NETWORK, INC. (TVNET) Calapan City
CABLE TELEVISION NETWORKS
Calapan Cable Center, Inc.
Tamaraw Vision Network, Inc. (TVNet)
Mindoro Wireless Cable Network, Inc. (Naujan)
VicOrMin Telecommunication System, Inc.
Pola TV and Cable Network
SHAMA Net (Pinamalayan)
Channel Plus Cable Network, Inc.
Bansud Cable Network and Development, Inc.
Bongabong Cable Network and Development, Inc.
RoMiComm Network, Inc.
SATELLITE TELEVISION NETWORKS
Pinoy Satellite TV
Sky Direct
Dream TV
Cignal
GSat Direct TV
Telephone Companies (Landline)
Internet Service Provider
FA
CT
S A
ND
FI
GU
RE
S 2
01
8
PROVINCIAL PLANNING AND DEVELOPMENT OFFICERESEARCH, PROJECT DEVELOPMENT AND DATABASE MANAGEMENT DIVISION
Infr
astr
uct
ure
an
d U
tilit
ies
51
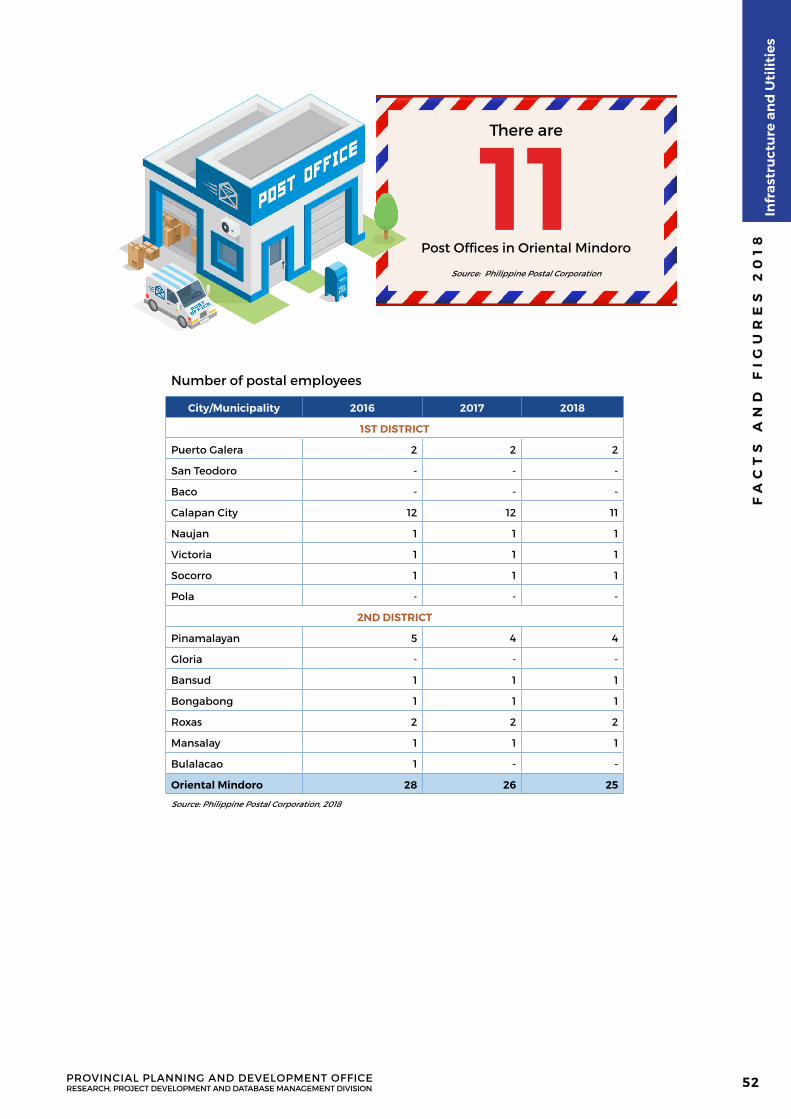
There are
11 Post Offices in Oriental Mindoro
Source: Philippine Postal Corporation
Number of postal employees
City/Municipality 2016 2017 2018
1ST DISTRICT
Puerto Galera 2 2 2
San Teodoro - - -
Baco - - -
Calapan City 12 12 11
Naujan 1 1 1
Victoria 1 1 1
Socorro 1 1 1
Pola - - -
2ND DISTRICT
Pinamalayan 5 4 4
Gloria - - -
Bansud 1 1 1
Bongabong 1 1 1
Roxas 2 2 2
Mansalay 1 1 1
Bulalacao 1 - -
Oriental Mindoro 28 26 25
Source: Philippine Postal Corporation, 2018
FA
CT
S A
ND
FI
GU
RE
S 2
01
8
PROVINCIAL PLANNING AND DEVELOPMENT OFFICERESEARCH, PROJECT DEVELOPMENT AND DATABASE MANAGEMENT DIVISION
Infr
astr
uct
ure
an
d U
tilit
ies
52
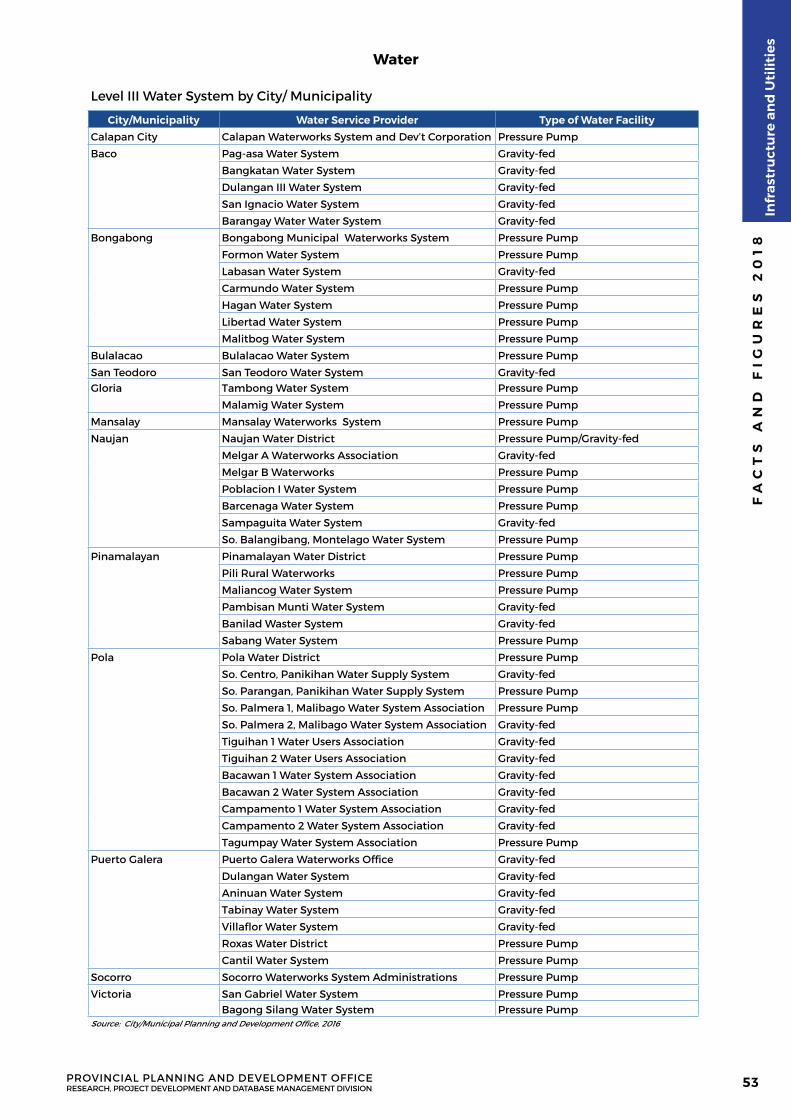
Level III Water System by City/ Municipality
City/Municipality Water Service Provider Type of Water Facility
Calapan City Calapan Waterworks System and Dev’t Corporation Pressure Pump
Baco Pag-asa Water System Gravity-fed
Bangkatan Water System Gravity-fed
Dulangan III Water System Gravity-fed
San Ignacio Water System Gravity-fed
Barangay Water Water System Gravity-fed
Bongabong Bongabong Municipal Waterworks System Pressure Pump
Formon Water System Pressure Pump
Labasan Water System Gravity-fed
Carmundo Water System Pressure Pump
Hagan Water System Pressure Pump
Libertad Water System Pressure Pump
Malitbog Water System Pressure Pump
Bulalacao Bulalacao Water System Pressure Pump
San Teodoro San Teodoro Water System Gravity-fedGloria Tambong Water System Pressure Pump
Malamig Water System Pressure Pump
Mansalay Mansalay Waterworks System Pressure Pump
Naujan Naujan Water District Pressure Pump/Gravity-fed
Melgar A Waterworks Association Gravity-fed
Melgar B Waterworks Pressure Pump
Poblacion I Water System Pressure Pump
Barcenaga Water System Pressure Pump
Sampaguita Water System Gravity-fed
So. Balangibang, Montelago Water System Pressure Pump
Pinamalayan Pinamalayan Water District Pressure Pump
Pili Rural Waterworks Pressure Pump
Maliancog Water System Pressure Pump
Pambisan Munti Water System Gravity-fed
Banilad Waster System Gravity-fed
Sabang Water System Pressure Pump
Pola Pola Water District Pressure Pump
So. Centro, Panikihan Water Supply System Gravity-fed
So. Parangan, Panikihan Water Supply System Pressure Pump
So. Palmera 1, Malibago Water System Association Pressure Pump
So. Palmera 2, Malibago Water System Association Gravity-fed
Tiguihan 1 Water Users Association Gravity-fed
Tiguihan 2 Water Users Association Gravity-fed
Bacawan 1 Water System Association Gravity-fed
Bacawan 2 Water System Association Gravity-fed
Campamento 1 Water System Association Gravity-fed
Campamento 2 Water System Association Gravity-fed
Tagumpay Water System Association Pressure Pump
Puerto Galera Puerto Galera Waterworks Office Gravity-fed
Dulangan Water System Gravity-fed
Aninuan Water System Gravity-fed
Tabinay Water System Gravity-fed
Villaflor Water System Gravity-fed
Roxas Water District Pressure Pump
Cantil Water System Pressure Pump
Socorro Socorro Waterworks System Administrations Pressure Pump
Victoria San Gabriel Water System Pressure PumpBagong Silang Water System Pressure Pump
Source: City/Municipal Planning and Development Office, 2016
Water
FA
CT
S A
ND
FI
GU
RE
S 2
01
8
PROVINCIAL PLANNING AND DEVELOPMENT OFFICERESEARCH, PROJECT DEVELOPMENT AND DATABASE MANAGEMENT DIVISION
Infr
astr
uct
ure
an
d U
tilit
ies
53
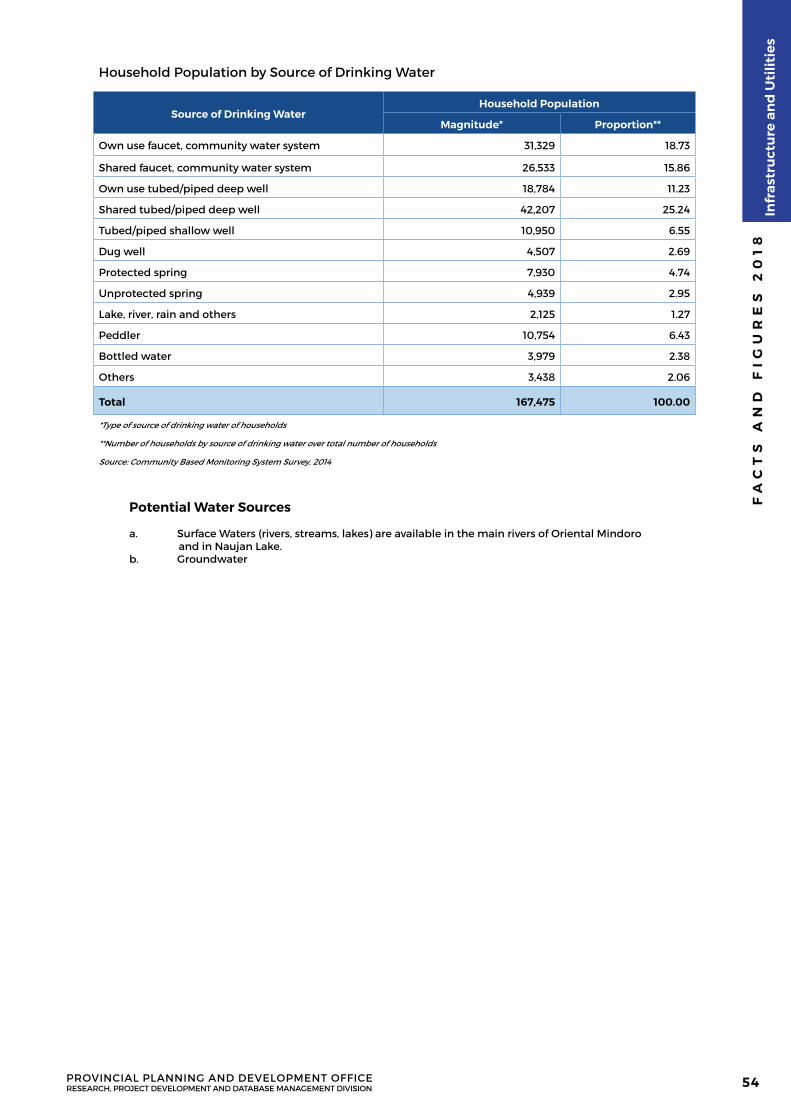
Household Population by Source of Drinking Water
Source of Drinking WaterHousehold Population
Magnitude* Proportion**
Own use faucet, community water system 31,329 18.73
Shared faucet, community water system 26,533 15.86
Own use tubed/piped deep well 18,784 11.23
Shared tubed/piped deep well 42,207 25.24
Tubed/piped shallow well 10,950 6.55
Dug well 4,507 2.69
Protected spring 7,930 4.74
Unprotected spring 4,939 2.95
Lake, river, rain and others 2,125 1.27
Peddler 10,754 6.43
Bottled water 3,979 2.38
Others 3,438 2.06
Total 167,475 100.00
*Type of source of drinking water of households
**Number of households by source of drinking water over total number of households
Source: Community Based Monitoring System Survey, 2014
Potential Water Sources
a. Surface Waters (rivers, streams, lakes) are available in the main rivers of Oriental Mindoro and in Naujan Lake.b. Groundwater
FA
CT
S A
ND
FI
GU
RE
S 2
01
8
PROVINCIAL PLANNING AND DEVELOPMENT OFFICERESEARCH, PROJECT DEVELOPMENT AND DATABASE MANAGEMENT DIVISION
Infr
astr
uct
ure
an
d U
tilit
ies
54
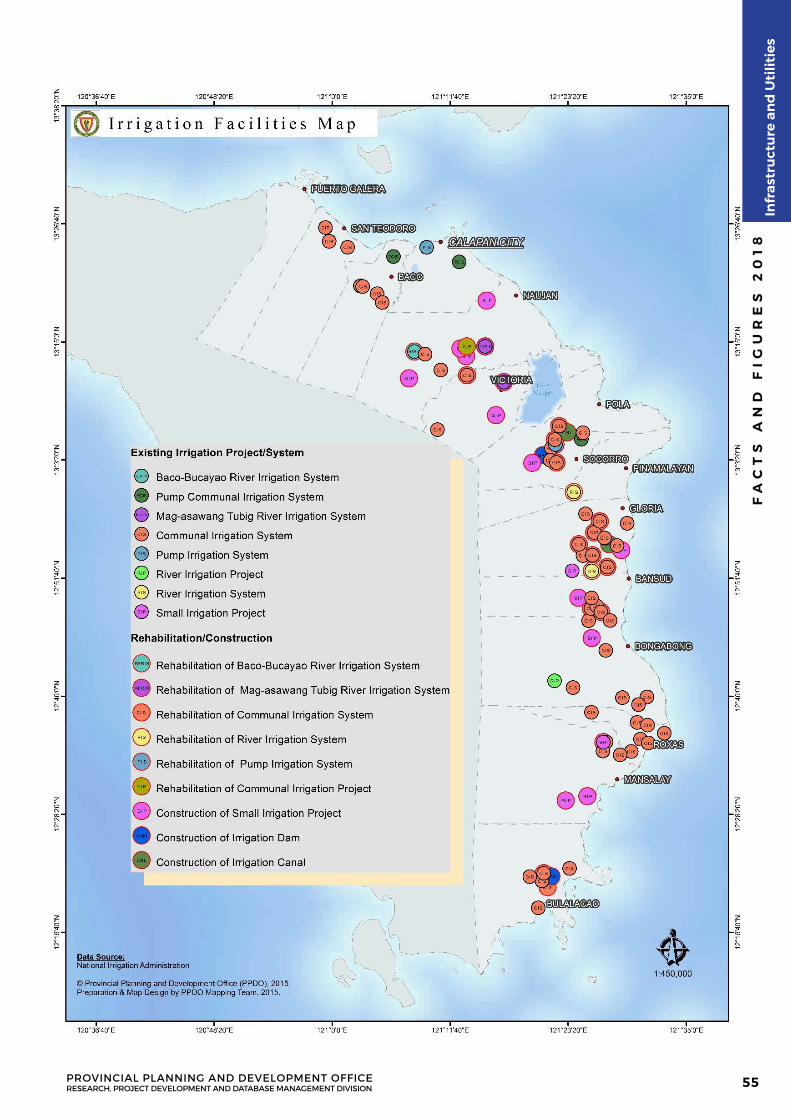
FA
CT
S A
ND
FI
GU
RE
S 2
01
8
PROVINCIAL PLANNING AND DEVELOPMENT OFFICERESEARCH, PROJECT DEVELOPMENT AND DATABASE MANAGEMENT DIVISION
Infr
astr
uct
ure
an
d U
tilit
ies
55
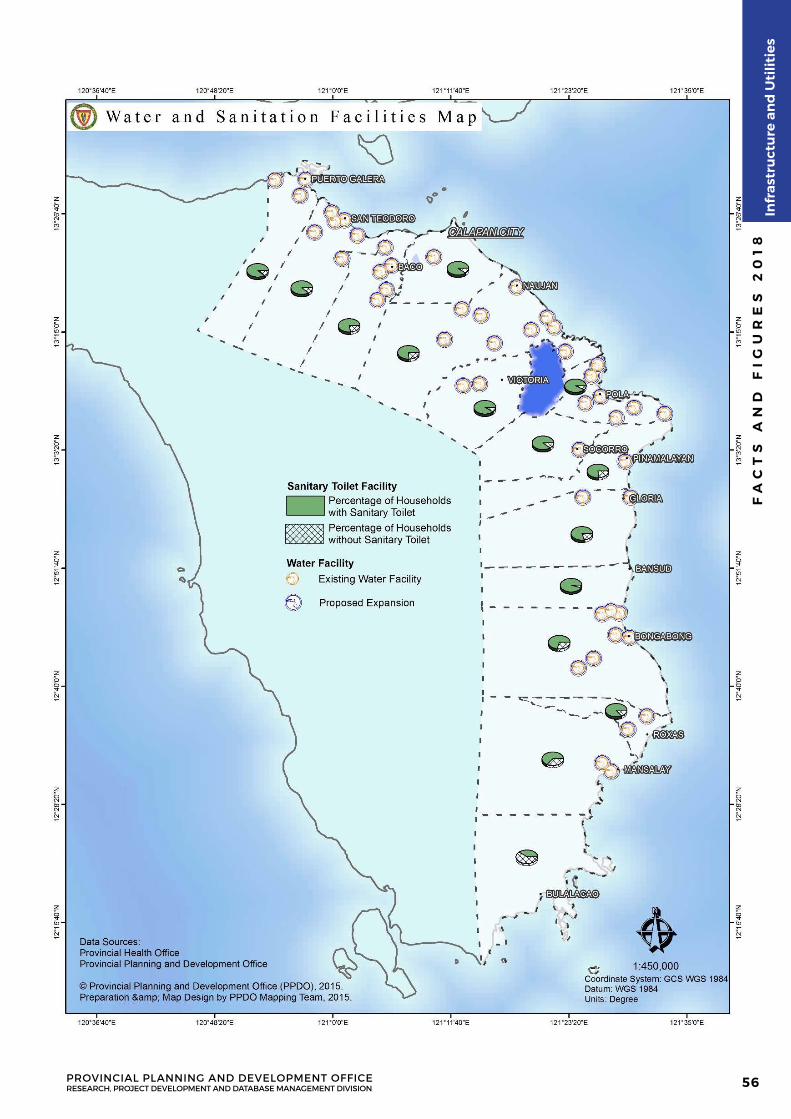
FA
CT
S A
ND
FI
GU
RE
S 2
01
8
PROVINCIAL PLANNING AND DEVELOPMENT OFFICERESEARCH, PROJECT DEVELOPMENT AND DATABASE MANAGEMENT DIVISION
Infr
astr
uct
ure
an
d U
tilit
ies
56
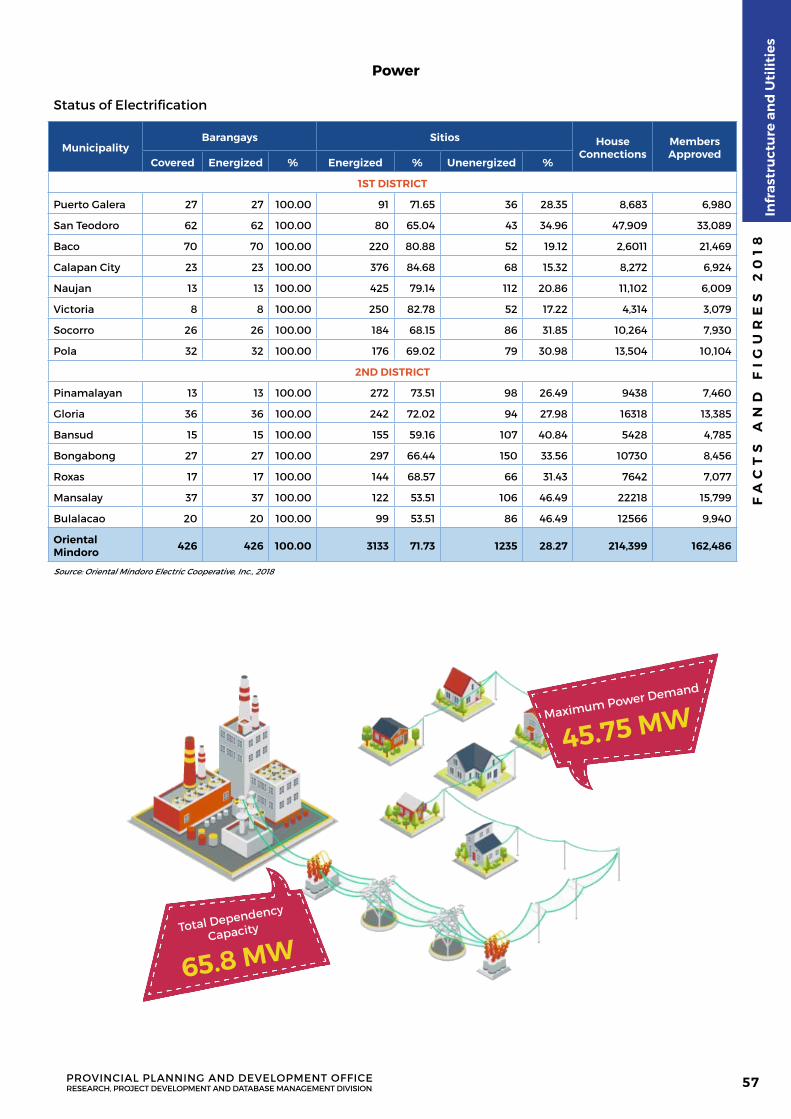
Status of Electrification
MunicipalityBarangays Sitios House
ConnectionsMembers Approved
Covered Energized % Energized % Unenergized %
1ST DISTRICT
Puerto Galera 27 27 100.00 91 71.65 36 28.35 8,683 6,980
San Teodoro 62 62 100.00 80 65.04 43 34.96 47,909 33,089
Baco 70 70 100.00 220 80.88 52 19.12 2,6011 21,469
Calapan City 23 23 100.00 376 84.68 68 15.32 8,272 6,924
Naujan 13 13 100.00 425 79.14 112 20.86 11,102 6,009
Victoria 8 8 100.00 250 82.78 52 17.22 4,314 3,079
Socorro 26 26 100.00 184 68.15 86 31.85 10,264 7,930
Pola 32 32 100.00 176 69.02 79 30.98 13,504 10,104
2ND DISTRICT
Pinamalayan 13 13 100.00 272 73.51 98 26.49 9438 7,460
Gloria 36 36 100.00 242 72.02 94 27.98 16318 13,385
Bansud 15 15 100.00 155 59.16 107 40.84 5428 4,785
Bongabong 27 27 100.00 297 66.44 150 33.56 10730 8,456
Roxas 17 17 100.00 144 68.57 66 31.43 7642 7,077
Mansalay 37 37 100.00 122 53.51 106 46.49 22218 15,799
Bulalacao 20 20 100.00 99 53.51 86 46.49 12566 9,940
Oriental Mindoro 426 426 100.00 3133 71.73 1235 28.27 214,399 162,486
Source: Oriental Mindoro Electric Cooperative, Inc., 2018
Power
Maximum Power Demand
45.75 MW
Total Dependency
Capacity
65.8 MW
FA
CT
S A
ND
FI
GU
RE
S 2
01
8
PROVINCIAL PLANNING AND DEVELOPMENT OFFICERESEARCH, PROJECT DEVELOPMENT AND DATABASE MANAGEMENT DIVISION
Infr
astr
uct
ure
an
d U
tilit
ies
57
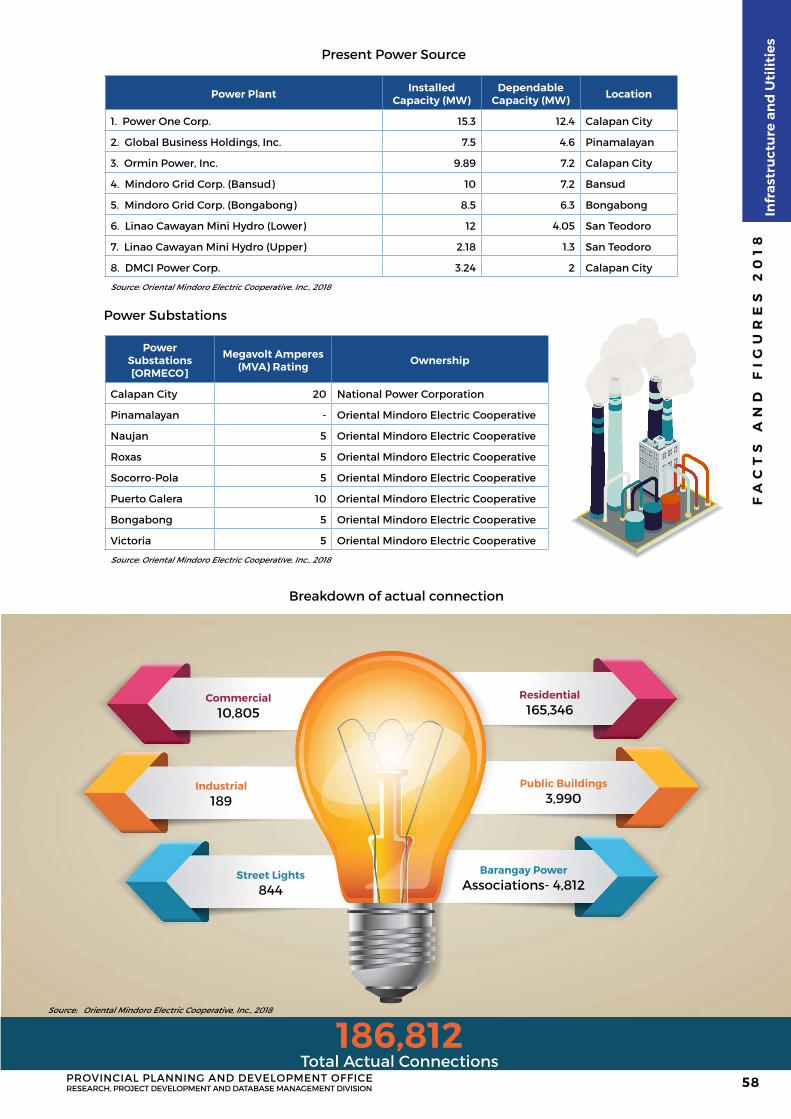
Present Power Source
Power Plant Installed Capacity (MW)
Dependable Capacity (MW) Location
1. Power One Corp. 15.3 12.4 Calapan City
2. Global Business Holdings, Inc. 7.5 4.6 Pinamalayan
3. Ormin Power, Inc. 9.89 7.2 Calapan City
4. Mindoro Grid Corp. (Bansud) 10 7.2 Bansud
5. Mindoro Grid Corp. (Bongabong) 8.5 6.3 Bongabong
6. Linao Cawayan Mini Hydro (Lower) 12 4.05 San Teodoro
7. Linao Cawayan Mini Hydro (Upper) 2.18 1.3 San Teodoro
8. DMCI Power Corp. 3.24 2 Calapan City
Source: Oriental Mindoro Electric Cooperative, Inc., 2018
Power Substations
Power Substations [ORMECO]
Megavolt Amperes (MVA) Rating Ownership
Calapan City 20 National Power Corporation
Pinamalayan - Oriental Mindoro Electric Cooperative
Naujan 5 Oriental Mindoro Electric Cooperative
Roxas 5 Oriental Mindoro Electric Cooperative
Socorro-Pola 5 Oriental Mindoro Electric Cooperative
Puerto Galera 10 Oriental Mindoro Electric Cooperative
Bongabong 5 Oriental Mindoro Electric Cooperative
Victoria 5 Oriental Mindoro Electric Cooperative
Source: Oriental Mindoro Electric Cooperative, Inc., 2018
Breakdown of actual connection
Commercial 10,805
Industrial189
Street Lights844
Residential165,346
Public Buildings3,990
Barangay PowerAssociations- 4,812
186,812Total Actual Connections
Source: Oriental Mindoro Electric Cooperative, Inc., 2018
FA
CT
S A
ND
FI
GU
RE
S 2
01
8
PROVINCIAL PLANNING AND DEVELOPMENT OFFICERESEARCH, PROJECT DEVELOPMENT AND DATABASE MANAGEMENT DIVISION
Infr
astr
uct
ure
an
d U
tilit
ies
58
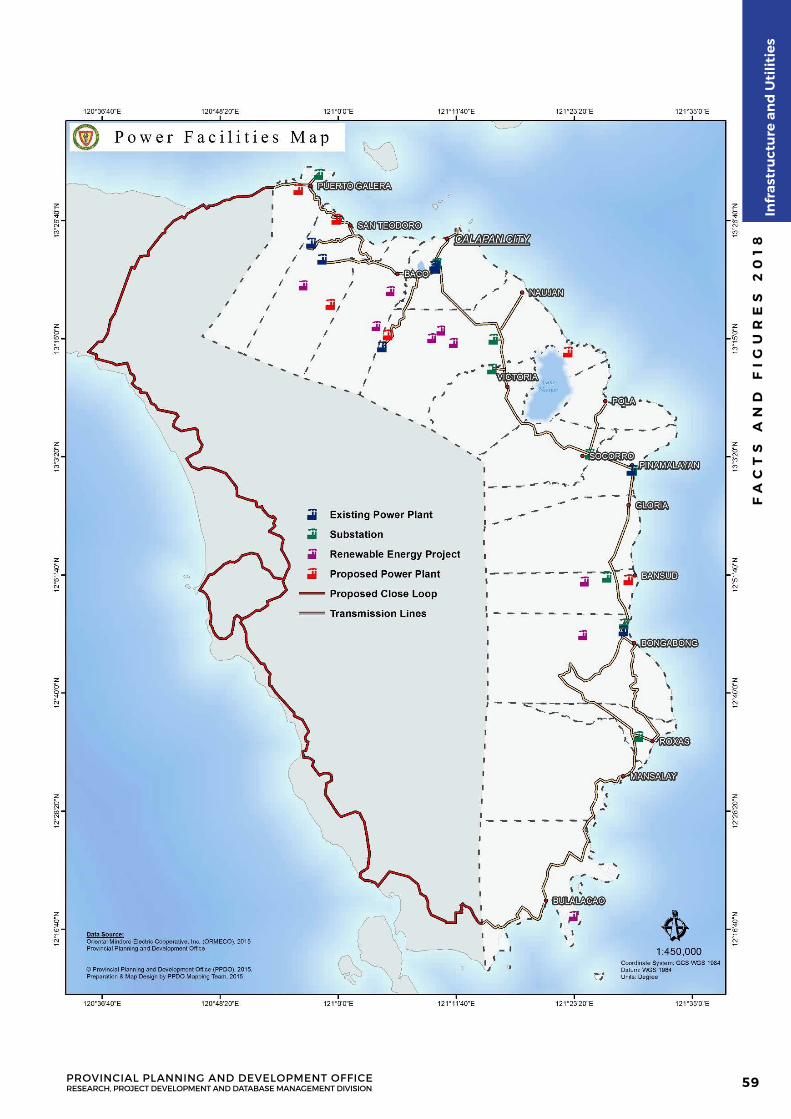
FA
CT
S A
ND
FI
GU
RE
S 2
01
8
PROVINCIAL PLANNING AND DEVELOPMENT OFFICERESEARCH, PROJECT DEVELOPMENT AND DATABASE MANAGEMENT DIVISION
Infr
astr
uct
ure
an
d U
tilit
ies
59

SOCIAL DEVELOPMENT
O R I E N TA L M I N D O R O F A C T S A N D F I G U R E S 2 0 1 8
PROFILE
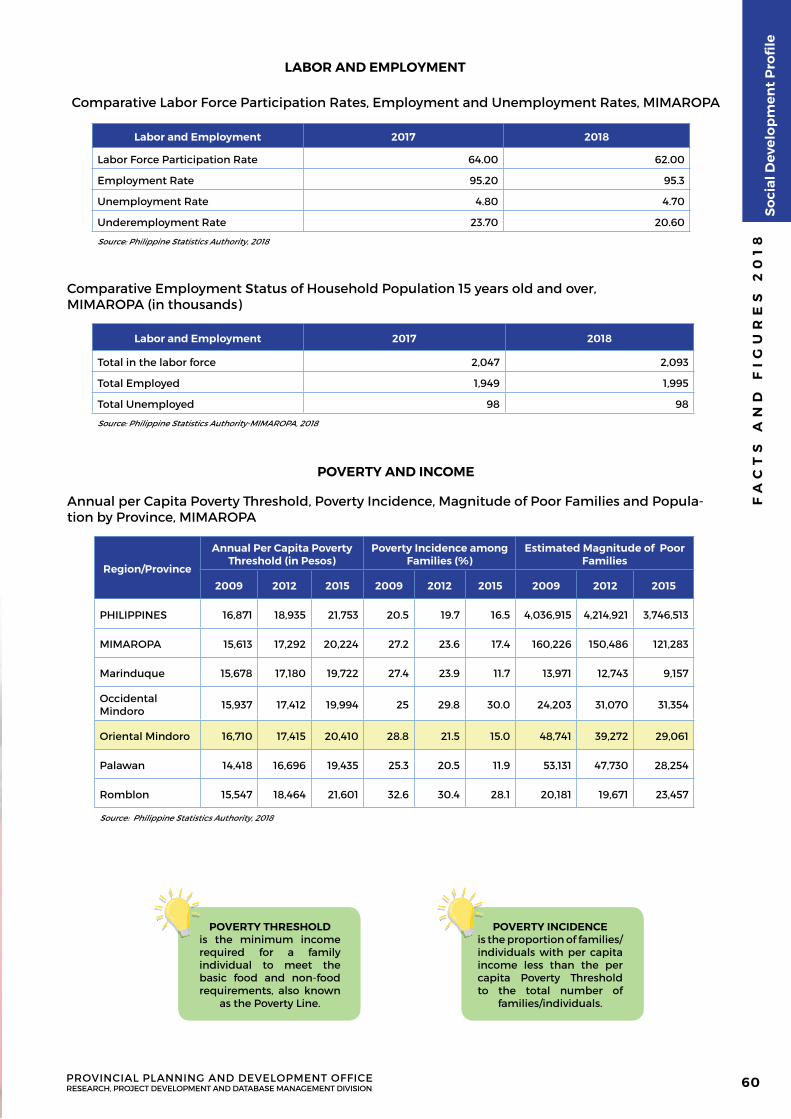
LABOR AND EMPLOYMENT
Comparative Labor Force Participation Rates, Employment and Unemployment Rates, MIMAROPA
Labor and Employment 2017 2018
Labor Force Participation Rate 64.00 62.00
Employment Rate 95.20 95.3
Unemployment Rate 4.80 4.70
Underemployment Rate 23.70 20.60
Source: Philippine Statistics Authority, 2018
Comparative Employment Status of Household Population 15 years old and over, MIMAROPA (in thousands)
Labor and Employment 2017 2018
Total in the labor force 2,047 2,093
Total Employed 1,949 1,995
Total Unemployed 98 98
Source: Philippine Statistics Authority-MIMAROPA, 2018
POVERTY AND INCOME
Annual per Capita Poverty Threshold, Poverty Incidence, Magnitude of Poor Families and Popula-tion by Province, MIMAROPA
Region/Province
Annual Per Capita Poverty Threshold (in Pesos)
Poverty Incidence among Families (%)
Estimated Magnitude of Poor Families
2009 2012 2015 2009 2012 2015 2009 2012 2015
PHILIPPINES 16,871 18,935 21,753 20.5 19.7 16.5 4,036,915 4,214,921 3,746,513
MIMAROPA 15,613 17,292 20,224 27.2 23.6 17.4 160,226 150,486 121,283
Marinduque 15,678 17,180 19,722 27.4 23.9 11.7 13,971 12,743 9,157
Occidental Mindoro 15,937 17,412 19,994 25 29.8 30.0 24,203 31,070 31,354
Oriental Mindoro 16,710 17,415 20,410 28.8 21.5 15.0 48,741 39,272 29,061
Palawan 14,418 16,696 19,435 25.3 20.5 11.9 53,131 47,730 28,254
Romblon 15,547 18,464 21,601 32.6 30.4 28.1 20,181 19,671 23,457
Source: Philippine Statistics Authority, 2018
POVERTY THRESHOLD is the minimum income required for a family individual to meet the basic food and non-food requirements, also known
as the Poverty Line.
POVERTY INCIDENCE is the proportion of families/ individuals with per capita income less than the per capita Poverty Threshold to the total number of
families/individuals.
FA
CT
S A
ND
FI
GU
RE
S 2
01
8
PROVINCIAL PLANNING AND DEVELOPMENT OFFICERESEARCH, PROJECT DEVELOPMENT AND DATABASE MANAGEMENT DIVISION
So
cial
Dev
elo
pm
ent
Pro
file
60
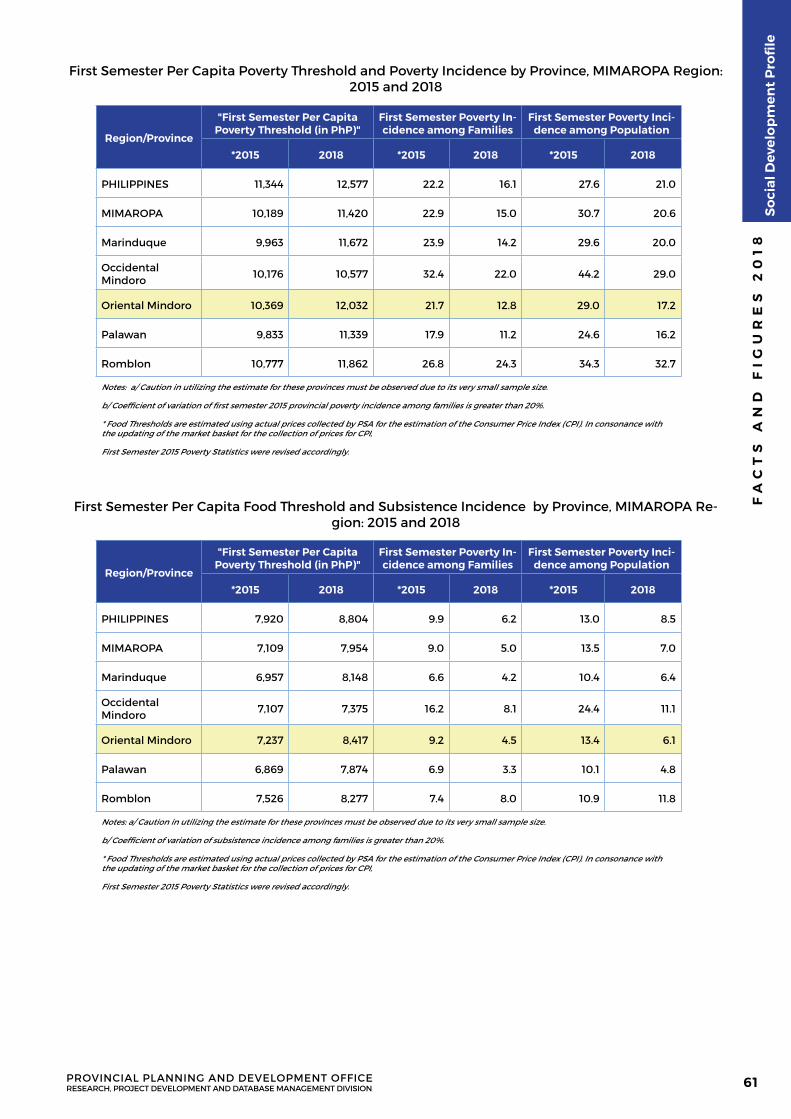
Region/Province
"First Semester Per Capita Poverty Threshold (in PhP)"
First Semester Poverty In-cidence among Families
First Semester Poverty Inci-dence among Population
*2015 2018 *2015 2018 *2015 2018
PHILIPPINES 11,344 12,577 22.2 16.1 27.6 21.0
MIMAROPA 10,189 11,420 22.9 15.0 30.7 20.6
Marinduque 9,963 11,672 23.9 14.2 29.6 20.0
Occidental Mindoro 10,176 10,577 32.4 22.0 44.2 29.0
Oriental Mindoro 10,369 12,032 21.7 12.8 29.0 17.2
Palawan 9,833 11,339 17.9 11.2 24.6 16.2
Romblon 10,777 11,862 26.8 24.3 34.3 32.7
Notes: a/ Caution in utilizing the estimate for these provinces must be observed due to its very small sample size.
b/ Coefficient of variation of first semester 2015 provincial poverty incidence among families is greater than 20%.
* Food Thresholds are estimated using actual prices collected by PSA for the estimation of the Consumer Price Index (CPI). In consonance with the updating of the market basket for the collection of prices for CPI,
First Semester 2015 Poverty Statistics were revised accordingly.
First Semester Per Capita Poverty Threshold and Poverty Incidence by Province, MIMAROPA Region: 2015 and 2018
Region/Province
"First Semester Per Capita Poverty Threshold (in PhP)"
First Semester Poverty In-cidence among Families
First Semester Poverty Inci-dence among Population
*2015 2018 *2015 2018 *2015 2018
PHILIPPINES 7,920 8,804 9.9 6.2 13.0 8.5
MIMAROPA 7,109 7,954 9.0 5.0 13.5 7.0
Marinduque 6,957 8,148 6.6 4.2 10.4 6.4
Occidental Mindoro 7,107 7,375 16.2 8.1 24.4 11.1
Oriental Mindoro 7,237 8,417 9.2 4.5 13.4 6.1
Palawan 6,869 7,874 6.9 3.3 10.1 4.8
Romblon 7,526 8,277 7.4 8.0 10.9 11.8
Notes: a/ Caution in utilizing the estimate for these provinces must be observed due to its very small sample size.
b/ Coefficient of variation of subsistence incidence among families is greater than 20%.
* Food Thresholds are estimated using actual prices collected by PSA for the estimation of the Consumer Price Index (CPI). In consonance with the updating of the market basket for the collection of prices for CPI,
First Semester 2015 Poverty Statistics were revised accordingly.
First Semester Per Capita Food Threshold and Subsistence Incidence by Province, MIMAROPA Re-gion: 2015 and 2018
FA
CT
S A
ND
FI
GU
RE
S 2
01
8
PROVINCIAL PLANNING AND DEVELOPMENT OFFICERESEARCH, PROJECT DEVELOPMENT AND DATABASE MANAGEMENT DIVISION
So
cial
Dev
elo
pm
ent
Pro
file
61
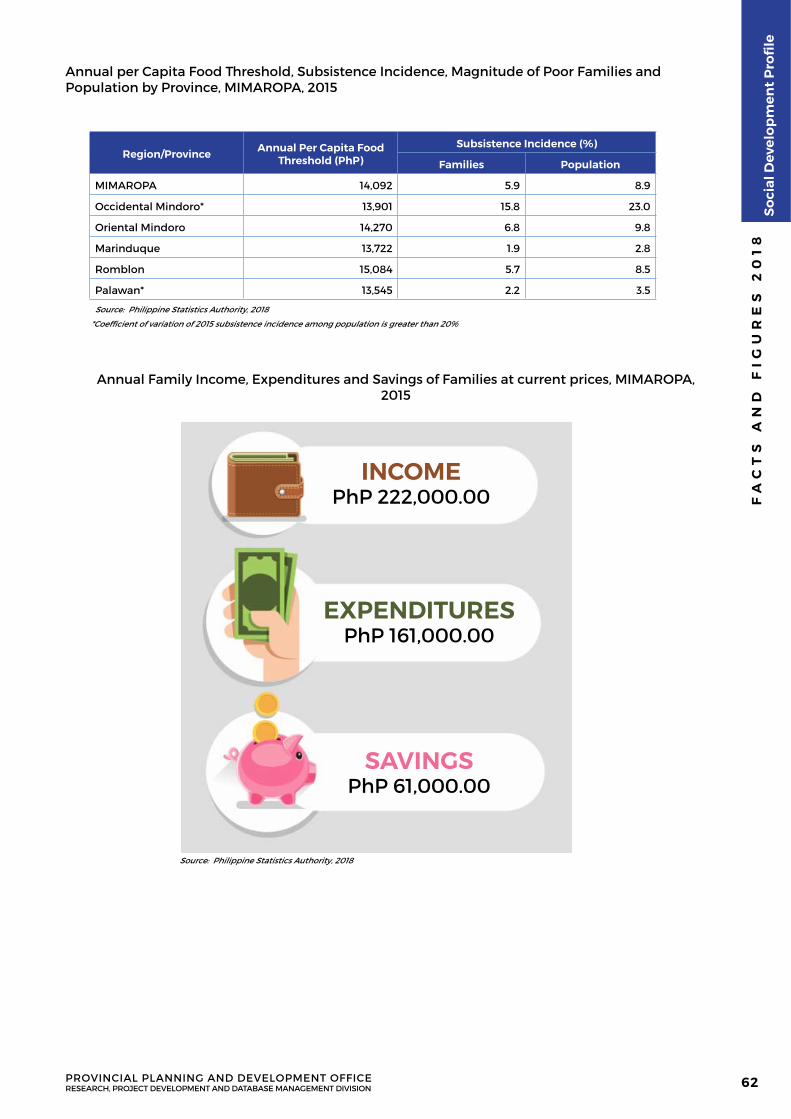
Annual per Capita Food Threshold, Subsistence Incidence, Magnitude of Poor Families and Population by Province, MIMAROPA, 2015
Region/Province Annual Per Capita Food Threshold (PhP)
Subsistence Incidence (%)
Families Population
MIMAROPA 14,092 5.9 8.9
Occidental Mindoro* 13,901 15.8 23.0
Oriental Mindoro 14,270 6.8 9.8
Marinduque 13,722 1.9 2.8
Romblon 15,084 5.7 8.5
Palawan* 13,545 2.2 3.5
Source: Philippine Statistics Authority, 2018
*Coefficient of variation of 2015 subsistence incidence among population is greater than 20%
Annual Family Income, Expenditures and Savings of Families at current prices, MIMAROPA, 2015
INCOMEPhP 222,000.00
Source: Philippine Statistics Authority, 2018
EXPENDITURESPhP 161,000.00
SAVINGSPhP 61,000.00
FA
CT
S A
ND
FI
GU
RE
S 2
01
8
PROVINCIAL PLANNING AND DEVELOPMENT OFFICERESEARCH, PROJECT DEVELOPMENT AND DATABASE MANAGEMENT DIVISION
So
cial
Dev
elo
pm
ent
Pro
file
62
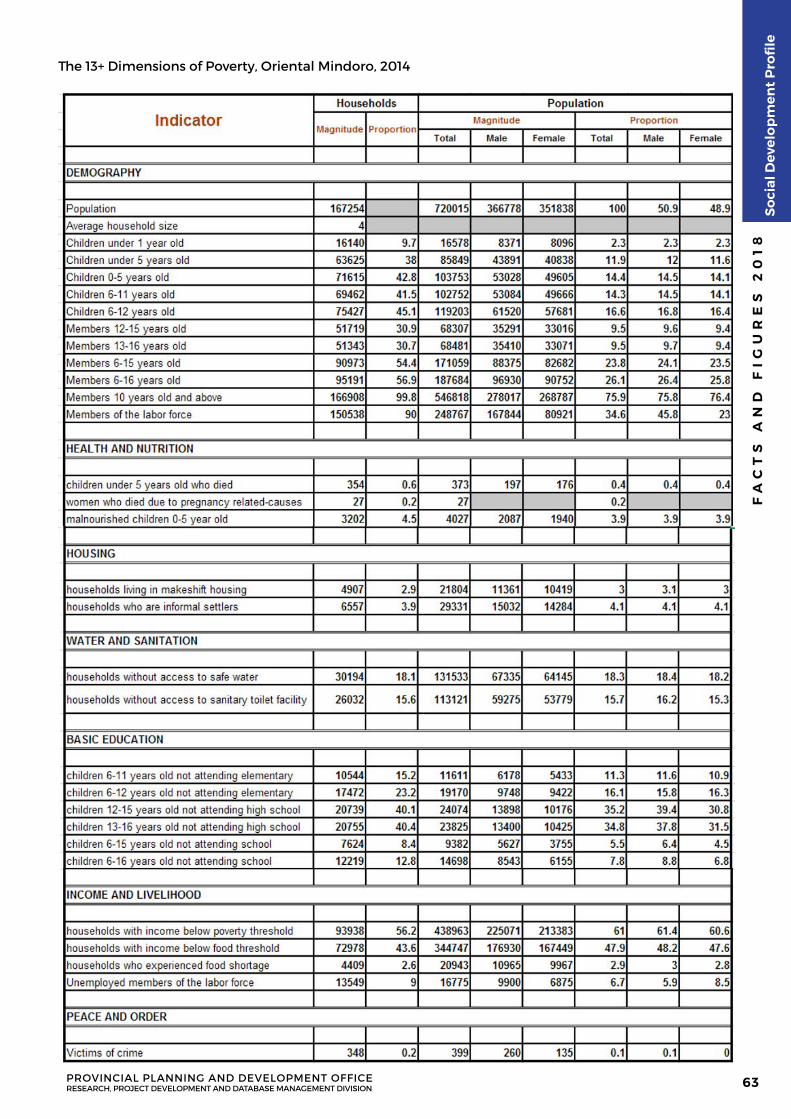
The 13+ Dimensions of Poverty, Oriental Mindoro, 2014
FA
CT
S A
ND
FI
GU
RE
S 2
01
8
PROVINCIAL PLANNING AND DEVELOPMENT OFFICERESEARCH, PROJECT DEVELOPMENT AND DATABASE MANAGEMENT DIVISION
So
cial
Dev
elo
pm
ent
Pro
file
63
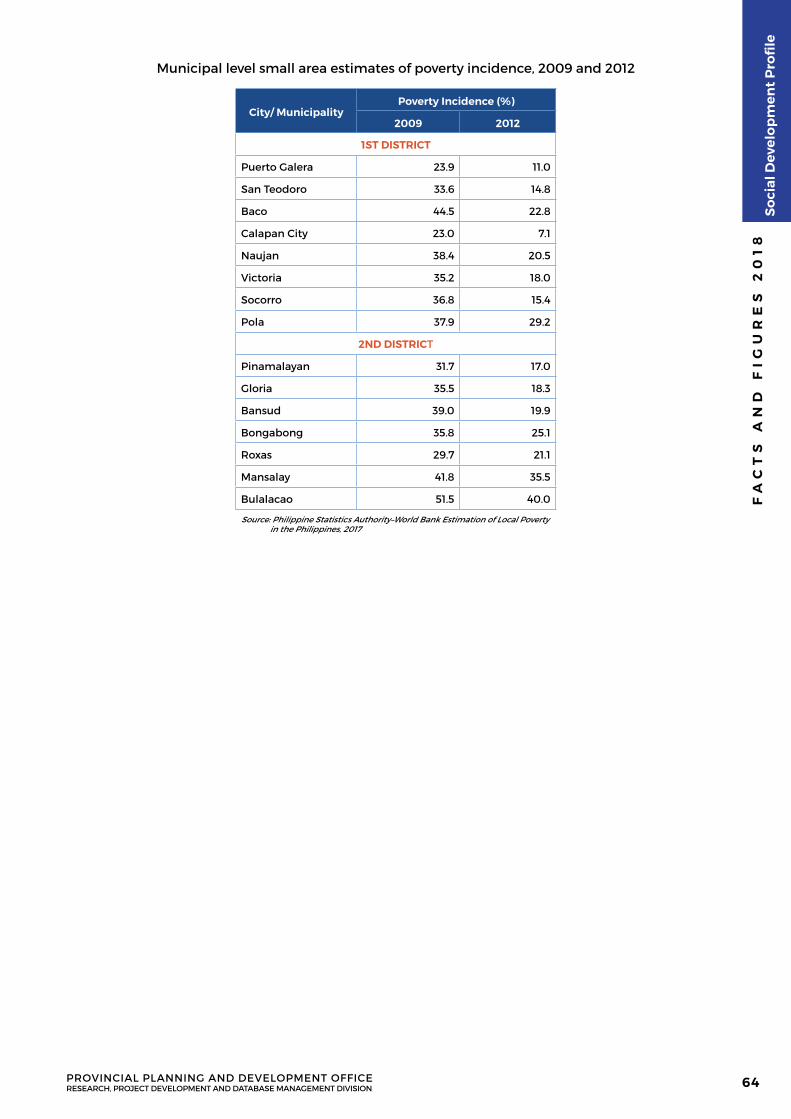
Municipal level small area estimates of poverty incidence, 2009 and 2012
City/ MunicipalityPoverty Incidence (%)
2009 2012
1ST DISTRICT
Puerto Galera 23.9 11.0
San Teodoro 33.6 14.8
Baco 44.5 22.8
Calapan City 23.0 7.1
Naujan 38.4 20.5
Victoria 35.2 18.0
Socorro 36.8 15.4
Pola 37.9 29.2
2ND DISTRICT
Pinamalayan 31.7 17.0
Gloria 35.5 18.3
Bansud 39.0 19.9
Bongabong 35.8 25.1
Roxas 29.7 21.1
Mansalay 41.8 35.5
Bulalacao 51.5 40.0
Source: Philippine Statistics Authority–World Bank Estimation of Local Poverty in the Philippines, 2017
FA
CT
S A
ND
FI
GU
RE
S 2
01
8
PROVINCIAL PLANNING AND DEVELOPMENT OFFICERESEARCH, PROJECT DEVELOPMENT AND DATABASE MANAGEMENT DIVISION
So
cial
Dev
elo
pm
ent
Pro
file
64
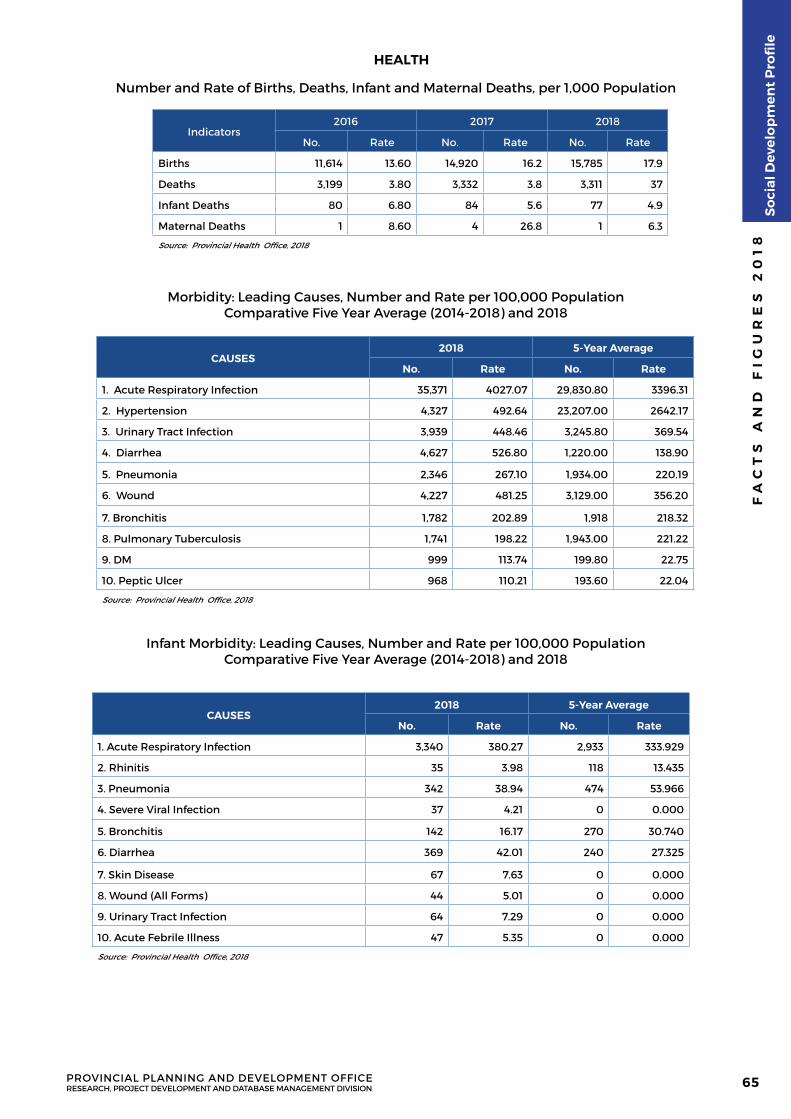
HEALTH
Number and Rate of Births, Deaths, Infant and Maternal Deaths, per 1,000 Population
Indicators2016 2017 2018
No. Rate No. Rate No. Rate
Births 11,614 13.60 14,920 16.2 15,785 17.9
Deaths 3,199 3.80 3,332 3.8 3,311 37
Infant Deaths 80 6.80 84 5.6 77 4.9
Maternal Deaths 1 8.60 4 26.8 1 6.3
Source: Provincial Health Office, 2018
Morbidity: Leading Causes, Number and Rate per 100,000 PopulationComparative Five Year Average (2014-2018) and 2018
CAUSES2018 5-Year Average
No. Rate No. Rate
1. Acute Respiratory Infection 35,371 4027.07 29,830.80 3396.31
2. Hypertension 4,327 492.64 23,207.00 2642.17
3. Urinary Tract Infection 3,939 448.46 3,245.80 369.54
4. Diarrhea 4,627 526.80 1,220.00 138.90
5. Pneumonia 2,346 267.10 1,934.00 220.19
6. Wound 4,227 481.25 3,129.00 356.20
7. Bronchitis 1,782 202.89 1,918 218.32
8. Pulmonary Tuberculosis 1,741 198.22 1,943.00 221.22
9. DM 999 113.74 199.80 22.75
10. Peptic Ulcer 968 110.21 193.60 22.04
Source: Provincial Health Office, 2018
Infant Morbidity: Leading Causes, Number and Rate per 100,000 PopulationComparative Five Year Average (2014-2018) and 2018
CAUSES2018 5-Year Average
No. Rate No. Rate
1. Acute Respiratory Infection 3,340 380.27 2,933 333.929
2. Rhinitis 35 3.98 118 13.435
3. Pneumonia 342 38.94 474 53.966
4. Severe Viral Infection 37 4.21 0 0.000
5. Bronchitis 142 16.17 270 30.740
6. Diarrhea 369 42.01 240 27.325
7. Skin Disease 67 7.63 0 0.000
8. Wound (All Forms) 44 5.01 0 0.000
9. Urinary Tract Infection 64 7.29 0 0.000
10. Acute Febrile Illness 47 5.35 0 0.000
Source: Provincial Health Office, 2018
FA
CT
S A
ND
FI
GU
RE
S 2
01
8
PROVINCIAL PLANNING AND DEVELOPMENT OFFICERESEARCH, PROJECT DEVELOPMENT AND DATABASE MANAGEMENT DIVISION
So
cial
Dev
elo
pm
ent
Pro
file
65
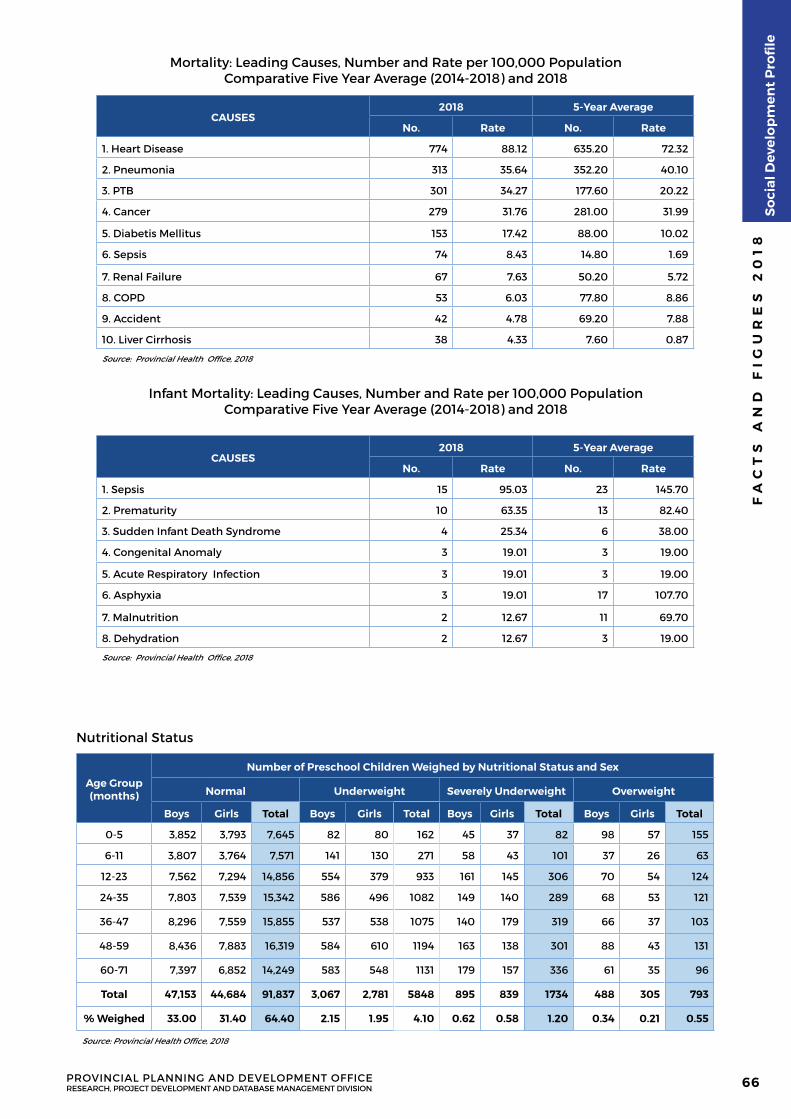
Mortality: Leading Causes, Number and Rate per 100,000 PopulationComparative Five Year Average (2014-2018) and 2018
Infant Mortality: Leading Causes, Number and Rate per 100,000 PopulationComparative Five Year Average (2014-2018) and 2018
Nutritional Status
Age Group (months)
Number of Preschool Children Weighed by Nutritional Status and Sex
Normal Underweight Severely Underweight Overweight
Boys Girls Total Boys Girls Total Boys Girls Total Boys Girls Total
0-5 3,852 3,793 7,645 82 80 162 45 37 82 98 57 155
6-11 3,807 3,764 7,571 141 130 271 58 43 101 37 26 63
12-23 7,562 7,294 14,856 554 379 933 161 145 306 70 54 124
24-35 7,803 7,539 15,342 586 496 1082 149 140 289 68 53 121
36-47 8,296 7,559 15,855 537 538 1075 140 179 319 66 37 103
48-59 8,436 7,883 16,319 584 610 1194 163 138 301 88 43 131
60-71 7,397 6,852 14,249 583 548 1131 179 157 336 61 35 96
Total 47,153 44,684 91,837 3,067 2,781 5848 895 839 1734 488 305 793
% Weighed 33.00 31.40 64.40 2.15 1.95 4.10 0.62 0.58 1.20 0.34 0.21 0.55
Source: Provincial Health Office, 2018
CAUSES2018 5-Year Average
No. Rate No. Rate
1. Sepsis 15 95.03 23 145.70
2. Prematurity 10 63.35 13 82.40
3. Sudden Infant Death Syndrome 4 25.34 6 38.00
4. Congenital Anomaly 3 19.01 3 19.00
5. Acute Respiratory Infection 3 19.01 3 19.00
6. Asphyxia 3 19.01 17 107.70
7. Malnutrition 2 12.67 11 69.70
8. Dehydration 2 12.67 3 19.00
Source: Provincial Health Office, 2018
CAUSES2018 5-Year Average
No. Rate No. Rate
1. Heart Disease 774 88.12 635.20 72.32
2. Pneumonia 313 35.64 352.20 40.10
3. PTB 301 34.27 177.60 20.22
4. Cancer 279 31.76 281.00 31.99
5. Diabetis Mellitus 153 17.42 88.00 10.02
6. Sepsis 74 8.43 14.80 1.69
7. Renal Failure 67 7.63 50.20 5.72
8. COPD 53 6.03 77.80 8.86
9. Accident 42 4.78 69.20 7.88
10. Liver Cirrhosis 38 4.33 7.60 0.87
Source: Provincial Health Office, 2018
FA
CT
S A
ND
FI
GU
RE
S 2
01
8
PROVINCIAL PLANNING AND DEVELOPMENT OFFICERESEARCH, PROJECT DEVELOPMENT AND DATABASE MANAGEMENT DIVISION
So
cial
Dev
elo
pm
ent
Pro
file
66
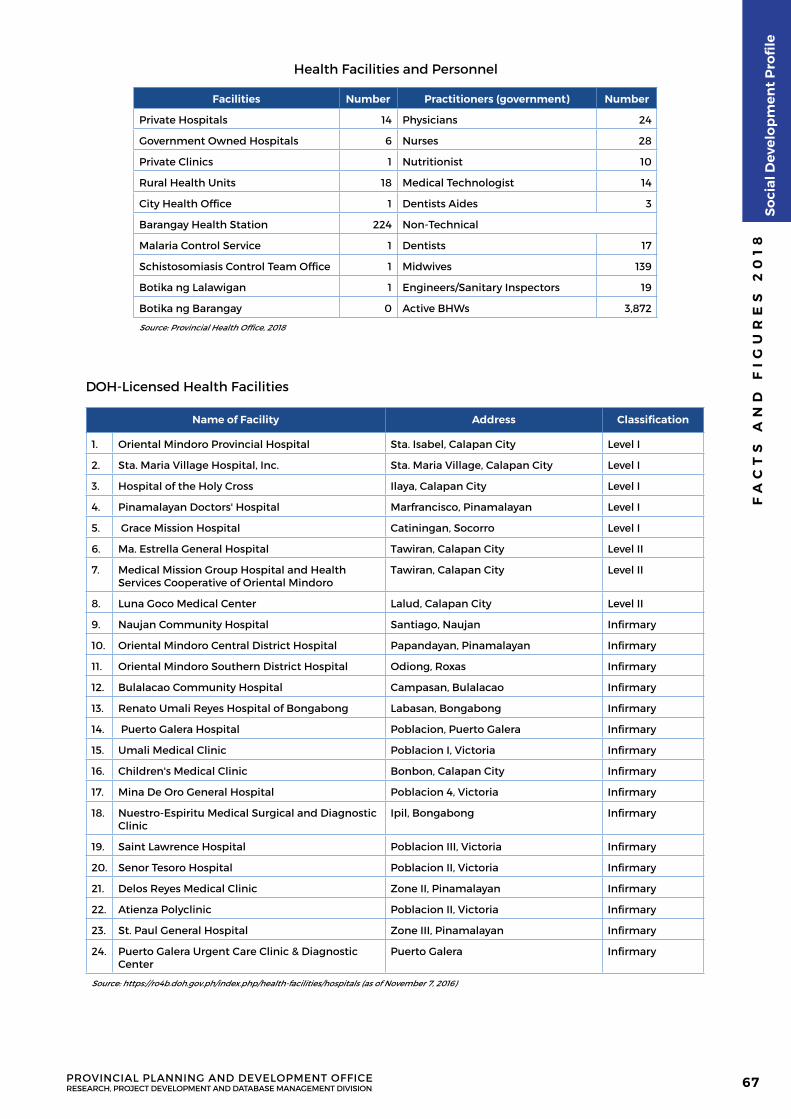
Health Facilities and Personnel
Facilities Number Practitioners (government) Number
Private Hospitals 14 Physicians 24
Government Owned Hospitals 6 Nurses 28
Private Clinics 1 Nutritionist 10
Rural Health Units 18 Medical Technologist 14
City Health Office 1 Dentists Aides 3
Barangay Health Station 224 Non-Technical
Malaria Control Service 1 Dentists 17
Schistosomiasis Control Team Office 1 Midwives 139
Botika ng Lalawigan 1 Engineers/Sanitary Inspectors 19
Botika ng Barangay 0 Active BHWs 3,872
Source: Provincial Health Office, 2018
DOH-Licensed Health Facilities
Name of Facility Address Classification
1. Oriental Mindoro Provincial Hospital Sta. Isabel, Calapan City Level I
2. Sta. Maria Village Hospital, Inc. Sta. Maria Village, Calapan City Level I
3. Hospital of the Holy Cross Ilaya, Calapan City Level I
4. Pinamalayan Doctors' Hospital Marfrancisco, Pinamalayan Level I
5. Grace Mission Hospital Catiningan, Socorro Level I
6. Ma. Estrella General Hospital Tawiran, Calapan City Level II
7. Medical Mission Group Hospital and Health Services Cooperative of Oriental Mindoro
Tawiran, Calapan City Level II
8. Luna Goco Medical Center Lalud, Calapan City Level II
9. Naujan Community Hospital Santiago, Naujan Infirmary
10. Oriental Mindoro Central District Hospital Papandayan, Pinamalayan Infirmary
11. Oriental Mindoro Southern District Hospital Odiong, Roxas Infirmary
12. Bulalacao Community Hospital Campasan, Bulalacao Infirmary
13. Renato Umali Reyes Hospital of Bongabong Labasan, Bongabong Infirmary
14. Puerto Galera Hospital Poblacion, Puerto Galera Infirmary
15. Umali Medical Clinic Poblacion I, Victoria Infirmary
16. Children's Medical Clinic Bonbon, Calapan City Infirmary
17. Mina De Oro General Hospital Poblacion 4, Victoria Infirmary
18. Nuestro-Espiritu Medical Surgical and Diagnostic Clinic
Ipil, Bongabong Infirmary
19. Saint Lawrence Hospital Poblacion III, Victoria Infirmary
20. Senor Tesoro Hospital Poblacion II, Victoria Infirmary
21. Delos Reyes Medical Clinic Zone II, Pinamalayan Infirmary
22. Atienza Polyclinic Poblacion II, Victoria Infirmary
23. St. Paul General Hospital Zone III, Pinamalayan Infirmary
24. Puerto Galera Urgent Care Clinic & Diagnostic Center
Puerto Galera Infirmary
Source: https://ro4b.doh.gov.ph/index.php/health-facilities/hospitals (as of November 7, 2016)
FA
CT
S A
ND
FI
GU
RE
S 2
01
8
PROVINCIAL PLANNING AND DEVELOPMENT OFFICERESEARCH, PROJECT DEVELOPMENT AND DATABASE MANAGEMENT DIVISION
So
cial
Dev
elo
pm
ent
Pro
file
67
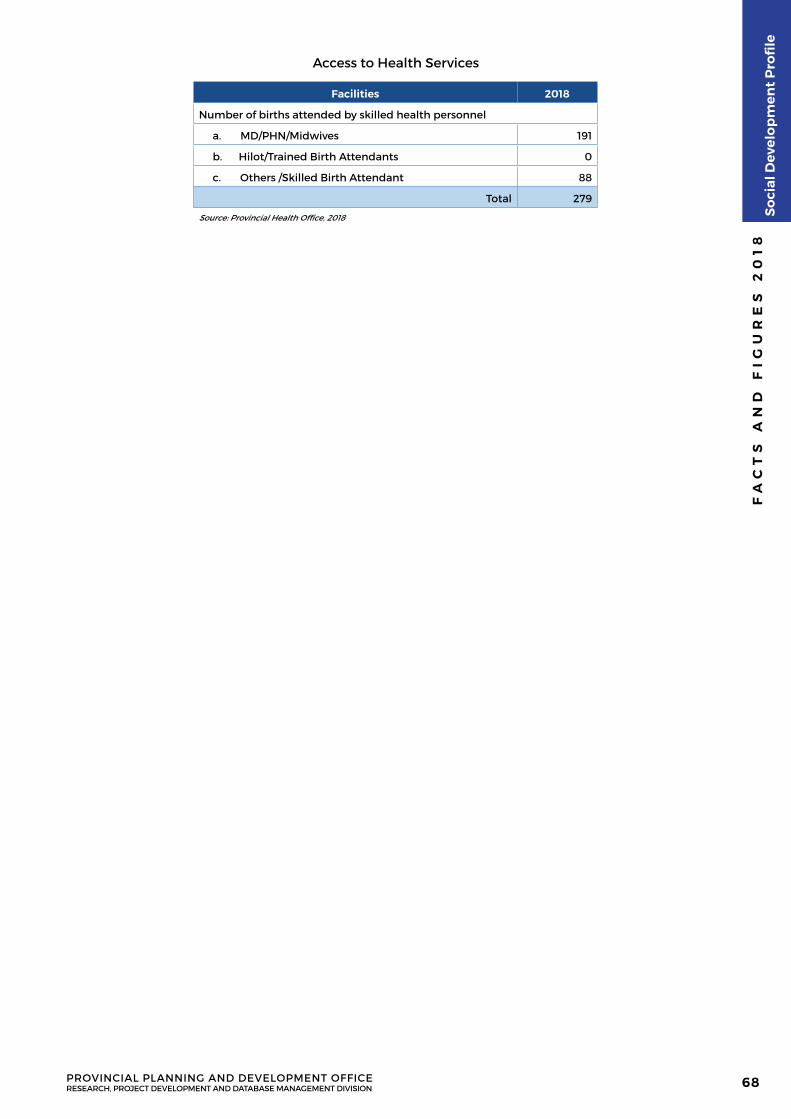
Access to Health Services
Facilities 2018
Number of births attended by skilled health personnel
a. MD/PHN/Midwives 191
b. Hilot/Trained Birth Attendants 0
c. Others /Skilled Birth Attendant 88
Total 279
Source: Provincial Health Office, 2018
FA
CT
S A
ND
FI
GU
RE
S 2
01
8
PROVINCIAL PLANNING AND DEVELOPMENT OFFICERESEARCH, PROJECT DEVELOPMENT AND DATABASE MANAGEMENT DIVISION
So
cial
Dev
elo
pm
ent
Pro
file
68
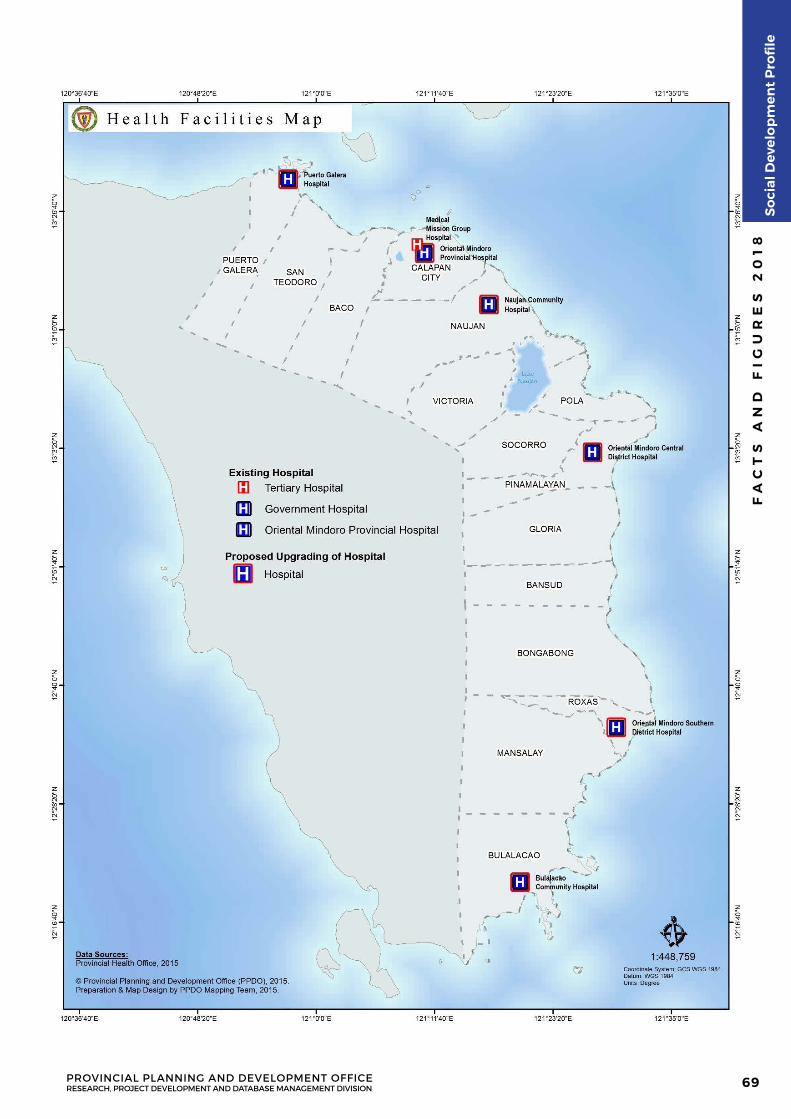
FA
CT
S A
ND
FI
GU
RE
S 2
01
8
PROVINCIAL PLANNING AND DEVELOPMENT OFFICERESEARCH, PROJECT DEVELOPMENT AND DATABASE MANAGEMENT DIVISION
So
cial
Dev
elo
pm
ent
Pro
file
69
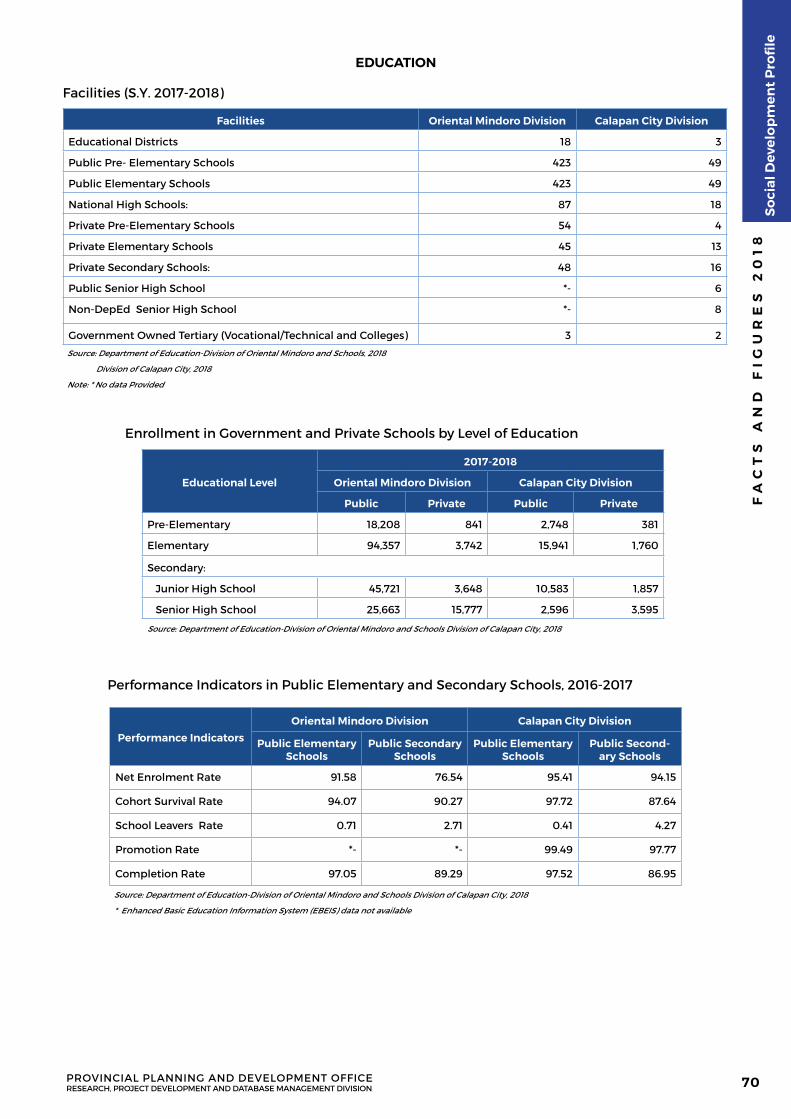
EDUCATION
Facilities (S.Y. 2017-2018)
Facilities Oriental Mindoro Division Calapan City Division
Educational Districts 18 3
Public Pre- Elementary Schools 423 49
Public Elementary Schools 423 49
National High Schools: 87 18
Private Pre-Elementary Schools 54 4
Private Elementary Schools 45 13
Private Secondary Schools: 48 16
Public Senior High School *- 6
Non-DepEd Senior High School *- 8
Government Owned Tertiary (Vocational/Technical and Colleges) 3 2
Source: Department of Education-Division of Oriental Mindoro and Schools, 2018
Division of Calapan City, 2018
Note: * No data Provided
Enrollment in Government and Private Schools by Level of Education
Educational Level
2017-2018
Oriental Mindoro Division Calapan City Division
Public Private Public Private
Pre-Elementary 18,208 841 2,748 381
Elementary 94,357 3,742 15,941 1,760
Secondary:
Junior High School 45,721 3,648 10,583 1,857
Senior High School 25,663 15,777 2,596 3,595
Source: Department of Education-Division of Oriental Mindoro and Schools Division of Calapan City, 2018
Performance Indicators in Public Elementary and Secondary Schools, 2016-2017
Performance Indicators
Oriental Mindoro Division Calapan City Division
Public Elementary Schools
Public Secondary Schools
Public Elementary Schools
Public Second-ary Schools
Net Enrolment Rate 91.58 76.54 95.41 94.15
Cohort Survival Rate 94.07 90.27 97.72 87.64
School Leavers Rate 0.71 2.71 0.41 4.27
Promotion Rate *- *- 99.49 97.77
Completion Rate 97.05 89.29 97.52 86.95
Source: Department of Education-Division of Oriental Mindoro and Schools Division of Calapan City, 2018
* Enhanced Basic Education Information System (EBEIS) data not available
FA
CT
S A
ND
FI
GU
RE
S 2
01
8
PROVINCIAL PLANNING AND DEVELOPMENT OFFICERESEARCH, PROJECT DEVELOPMENT AND DATABASE MANAGEMENT DIVISION
So
cial
Dev
elo
pm
ent
Pro
file
70
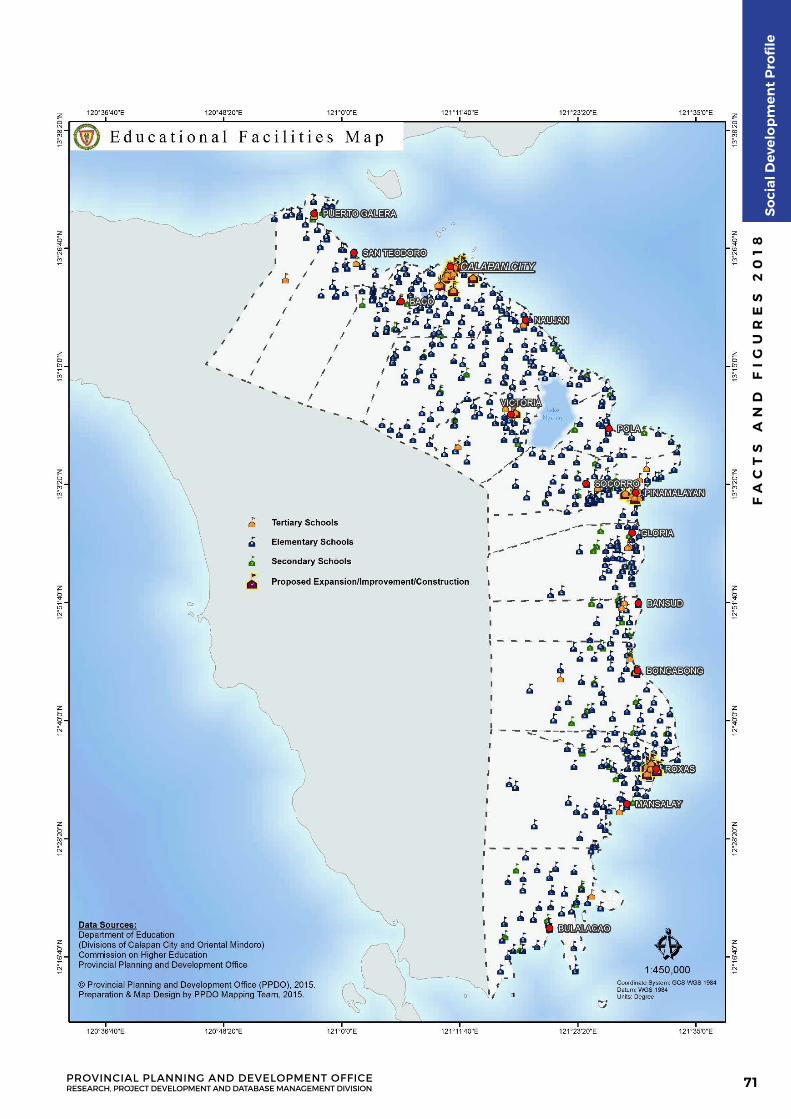
FA
CT
S A
ND
FI
GU
RE
S 2
01
8
PROVINCIAL PLANNING AND DEVELOPMENT OFFICERESEARCH, PROJECT DEVELOPMENT AND DATABASE MANAGEMENT DIVISION
So
cial
Dev
elo
pm
ent
Pro
file
71
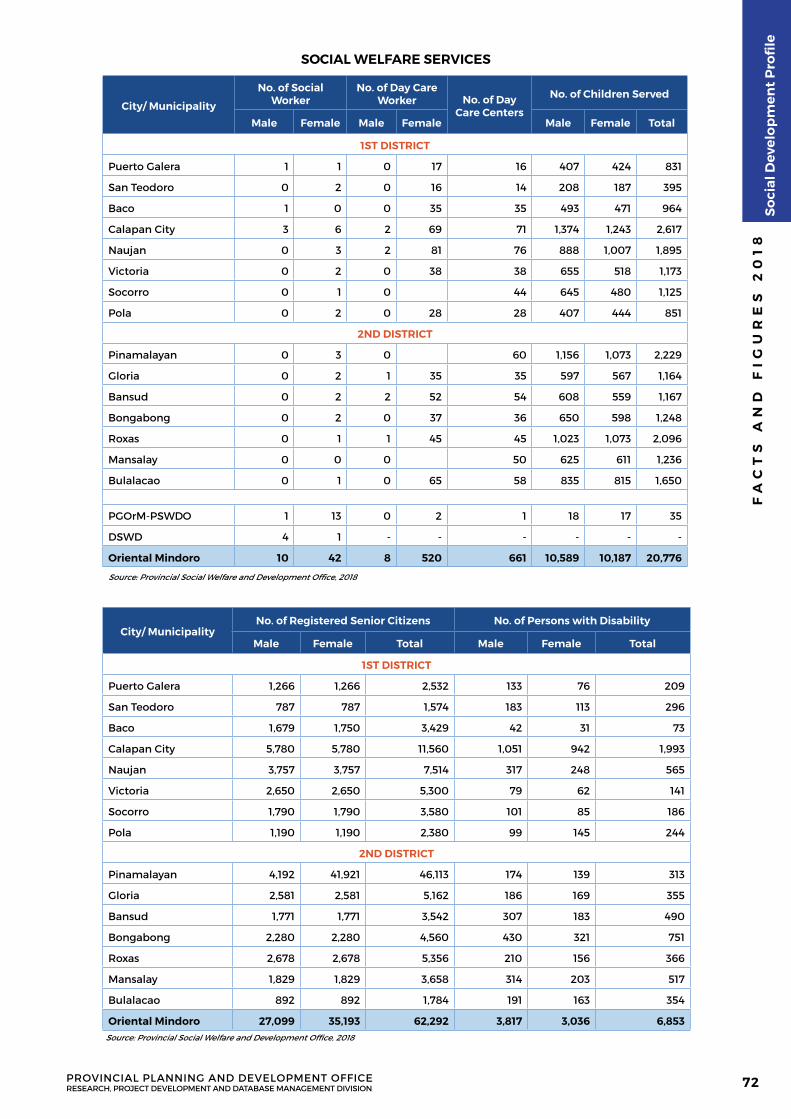
SOCIAL WELFARE SERVICES
City/ Municipality
No. of Social Worker
No. of Day Care Worker No. of Day
Care Centers
No. of Children Served
Male Female Male Female Male Female Total
1ST DISTRICT
Puerto Galera 1 1 0 17 16 407 424 831
San Teodoro 0 2 0 16 14 208 187 395
Baco 1 0 0 35 35 493 471 964
Calapan City 3 6 2 69 71 1,374 1,243 2,617
Naujan 0 3 2 81 76 888 1,007 1,895
Victoria 0 2 0 38 38 655 518 1,173
Socorro 0 1 0 44 645 480 1,125
Pola 0 2 0 28 28 407 444 851
2ND DISTRICT
Pinamalayan 0 3 0 60 1,156 1,073 2,229
Gloria 0 2 1 35 35 597 567 1,164
Bansud 0 2 2 52 54 608 559 1,167
Bongabong 0 2 0 37 36 650 598 1,248
Roxas 0 1 1 45 45 1,023 1,073 2,096
Mansalay 0 0 0 50 625 611 1,236
Bulalacao 0 1 0 65 58 835 815 1,650
PGOrM-PSWDO 1 13 0 2 1 18 17 35
DSWD 4 1 - - - - - -
Oriental Mindoro 10 42 8 520 661 10,589 10,187 20,776
Source: Provincial Social Welfare and Development Office, 2018
City/ MunicipalityNo. of Registered Senior Citizens No. of Persons with Disability
Male Female Total Male Female Total
1ST DISTRICT
Puerto Galera 1,266 1,266 2,532 133 76 209
San Teodoro 787 787 1,574 183 113 296
Baco 1,679 1,750 3,429 42 31 73
Calapan City 5,780 5,780 11,560 1,051 942 1,993
Naujan 3,757 3,757 7,514 317 248 565
Victoria 2,650 2,650 5,300 79 62 141
Socorro 1,790 1,790 3,580 101 85 186
Pola 1,190 1,190 2,380 99 145 244
2ND DISTRICT
Pinamalayan 4,192 41,921 46,113 174 139 313
Gloria 2,581 2,581 5,162 186 169 355
Bansud 1,771 1,771 3,542 307 183 490
Bongabong 2,280 2,280 4,560 430 321 751
Roxas 2,678 2,678 5,356 210 156 366
Mansalay 1,829 1,829 3,658 314 203 517
Bulalacao 892 892 1,784 191 163 354
Oriental Mindoro 27,099 35,193 62,292 3,817 3,036 6,853 Source: Provincial Social Welfare and Development Office, 2018
FA
CT
S A
ND
FI
GU
RE
S 2
01
8
PROVINCIAL PLANNING AND DEVELOPMENT OFFICERESEARCH, PROJECT DEVELOPMENT AND DATABASE MANAGEMENT DIVISION
So
cial
Dev
elo
pm
ent
Pro
file
72
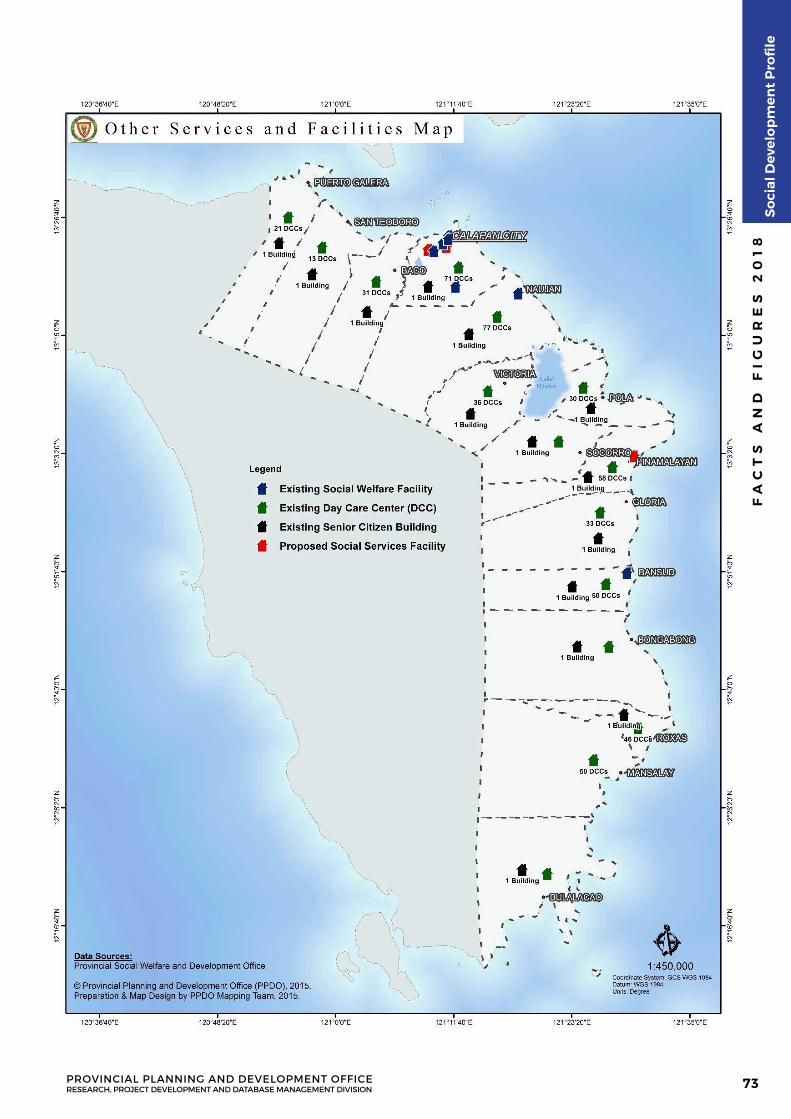
FA
CT
S A
ND
FI
GU
RE
S 2
01
8
PROVINCIAL PLANNING AND DEVELOPMENT OFFICERESEARCH, PROJECT DEVELOPMENT AND DATABASE MANAGEMENT DIVISION
So
cial
Dev
elo
pm
ent
Pro
file
73
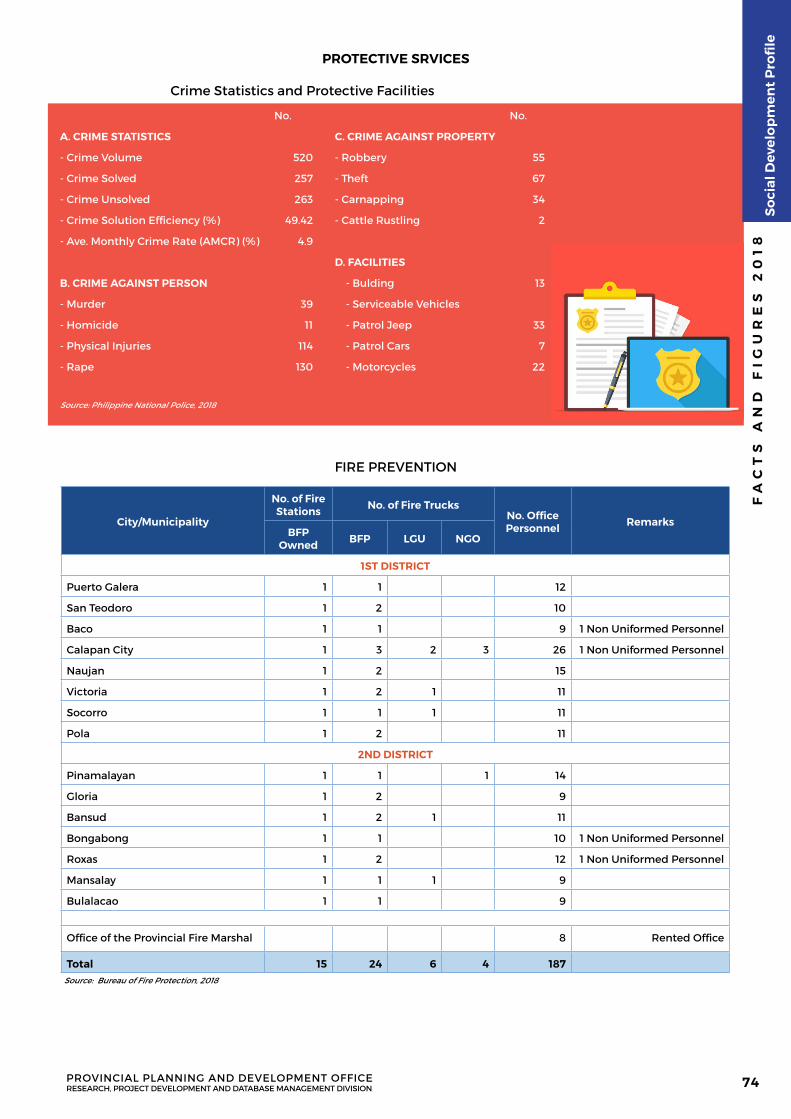
PROTECTIVE SRVICES
Crime Statistics and Protective Facilities
No. No.
A. CRIME STATISTICS C. CRIME AGAINST PROPERTY
- Crime Volume 520 - Robbery 55
- Crime Solved 257 - Theft 67
- Crime Unsolved 263 - Carnapping 34
- Crime Solution Efficiency (%) 49.42 - Cattle Rustling 2
- Ave. Monthly Crime Rate (AMCR) (%) 4.9
D. FACILITIES
B. CRIME AGAINST PERSON - Bulding 13
- Murder 39 - Serviceable Vehicles
- Homicide 11 - Patrol Jeep 33
- Physical Injuries 114 - Patrol Cars 7
- Rape 130 - Motorcycles 22
Source: Philippine National Police, 2018
FIRE PREVENTION
City/Municipality
No. of Fire Stations No. of Fire Trucks
No. Office Personnel Remarks
BFP Owned BFP LGU NGO
1ST DISTRICT
Puerto Galera 1 1 12
San Teodoro 1 2 10
Baco 1 1 9 1 Non Uniformed Personnel
Calapan City 1 3 2 3 26 1 Non Uniformed Personnel
Naujan 1 2 15
Victoria 1 2 1 11
Socorro 1 1 1 11
Pola 1 2 11
2ND DISTRICT
Pinamalayan 1 1 1 14
Gloria 1 2 9
Bansud 1 2 1 11
Bongabong 1 1 10 1 Non Uniformed Personnel
Roxas 1 2 12 1 Non Uniformed Personnel
Mansalay 1 1 1 9
Bulalacao 1 1 9
Office of the Provincial Fire Marshal 8 Rented Office
Total 15 24 6 4 187Source: Bureau of Fire Protection, 2018
FA
CT
S A
ND
FI
GU
RE
S 2
01
8
PROVINCIAL PLANNING AND DEVELOPMENT OFFICERESEARCH, PROJECT DEVELOPMENT AND DATABASE MANAGEMENT DIVISION
So
cial
Dev
elo
pm
ent
Pro
file
74
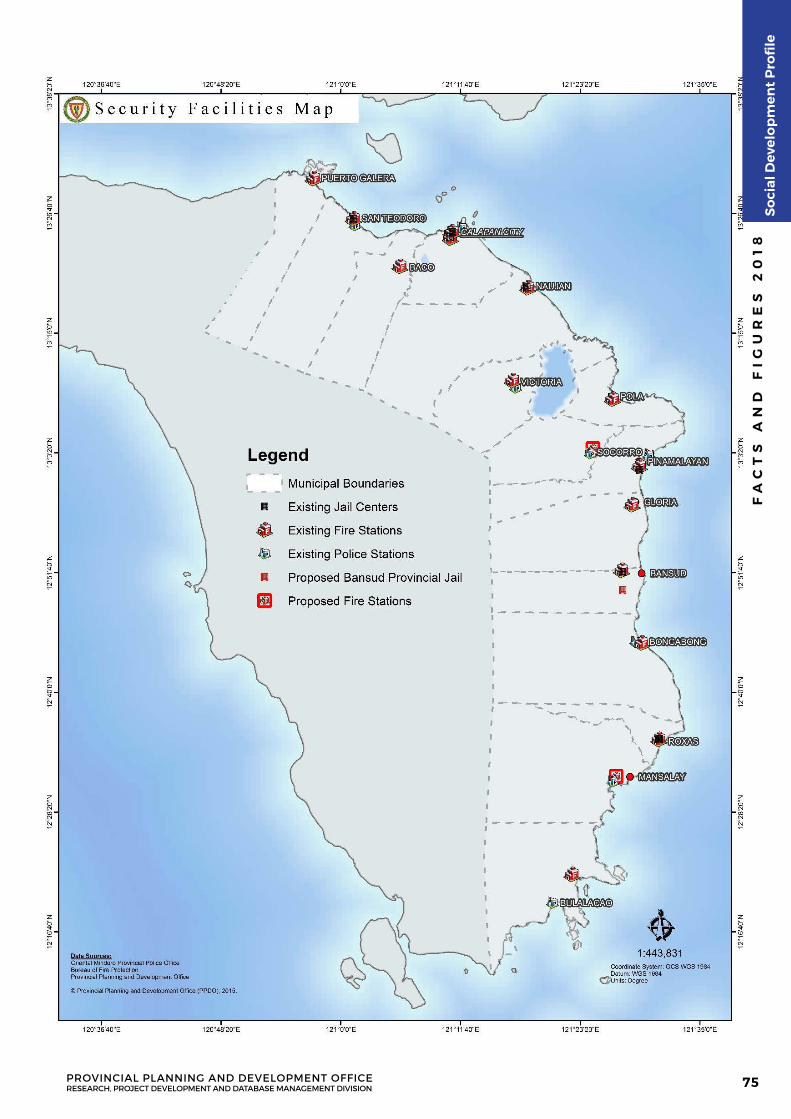
FA
CT
S A
ND
FI
GU
RE
S 2
01
8
PROVINCIAL PLANNING AND DEVELOPMENT OFFICERESEARCH, PROJECT DEVELOPMENT AND DATABASE MANAGEMENT DIVISION
So
cial
Dev
elo
pm
ent
Pro
file
75

FINANCIALO R I E N TA L M I N D O R O F A C T S A N D F I G U R E S 2 0 1 8
PROFILE
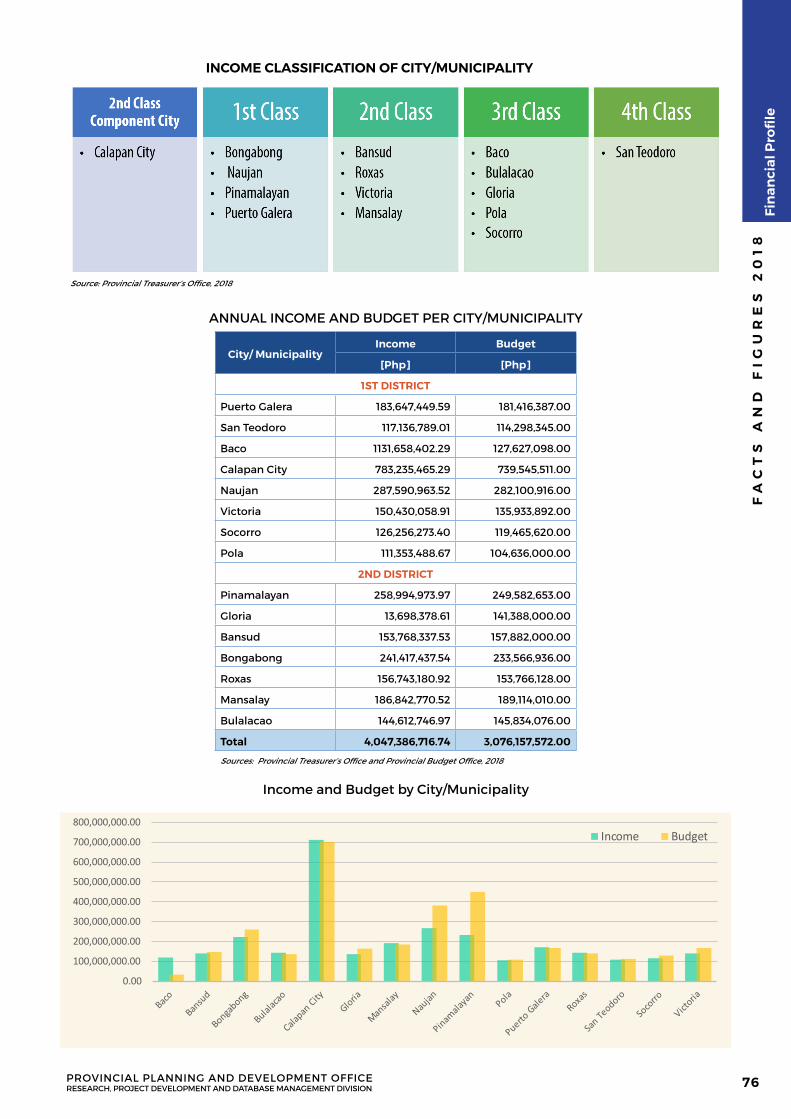
INCOME CLASSIFICATION OF CITY/MUNICIPALITY
Source: Provincial Treasurer’s Office, 2018
0.00
100,000,000.00
200,000,000.00
300,000,000.00
400,000,000.00
500,000,000.00
600,000,000.00
700,000,000.00
800,000,000.00Income Budget
ANNUAL INCOME AND BUDGET PER CITY/MUNICIPALITY
City/ MunicipalityIncome Budget
[Php] [Php]
1ST DISTRICT
Puerto Galera 183,647,449.59 181,416,387.00
San Teodoro 117,136,789.01 114,298,345.00
Baco 1131,658,402.29 127,627,098.00
Calapan City 783,235,465.29 739,545,511.00
Naujan 287,590,963.52 282,100,916.00
Victoria 150,430,058.91 135,933,892.00
Socorro 126,256,273.40 119,465,620.00
Pola 111,353,488.67 104,636,000.00
2ND DISTRICT
Pinamalayan 258,994,973.97 249,582,653.00
Gloria 13,698,378.61 141,388,000.00
Bansud 153,768,337.53 157,882,000.00
Bongabong 241,417,437.54 233,566,936.00
Roxas 156,743,180.92 153,766,128.00
Mansalay 186,842,770.52 189,114,010.00
Bulalacao 144,612,746.97 145,834,076.00
Total 4,047,386,716.74 3,076,157,572.00
Sources: Provincial Treasurer’s Office and Provincial Budget Office, 2018
Income and Budget by City/Municipality
FA
CT
S A
ND
FI
GU
RE
S 2
01
8
PROVINCIAL PLANNING AND DEVELOPMENT OFFICERESEARCH, PROJECT DEVELOPMENT AND DATABASE MANAGEMENT DIVISION
Fin
anci
al P
rofi
le
76
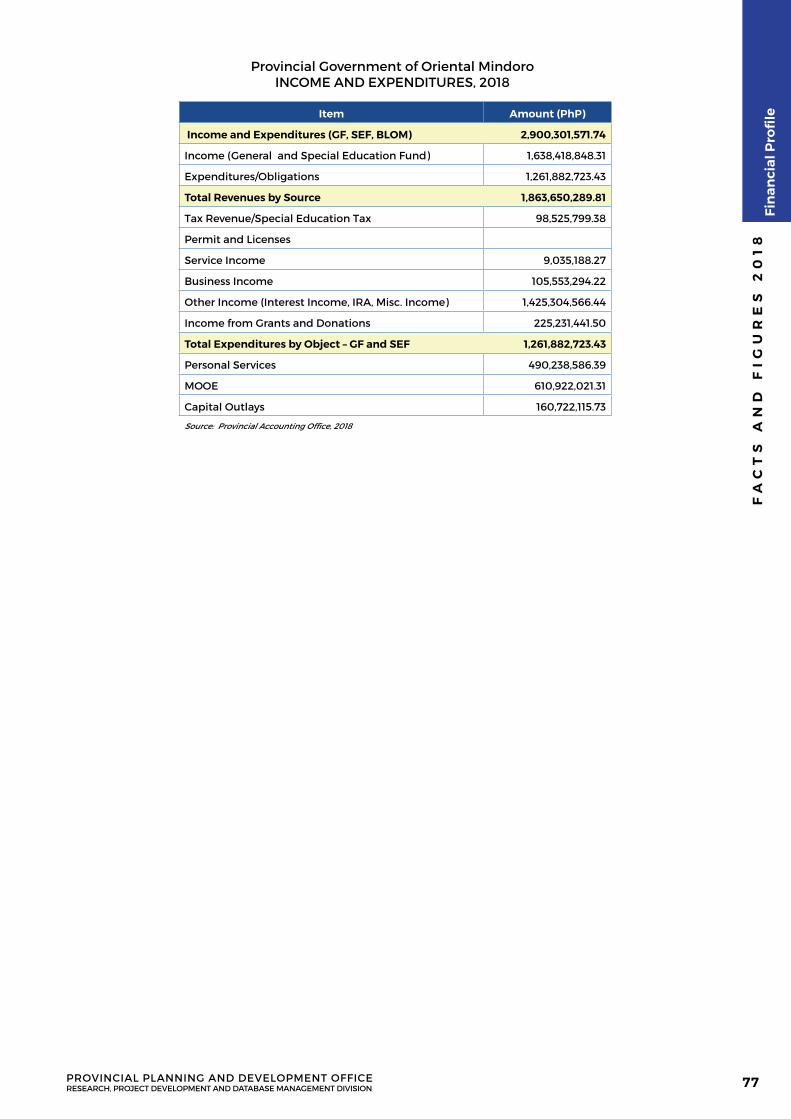
Provincial Government of Oriental MindoroINCOME AND EXPENDITURES, 2018
Item Amount (PhP)
Income and Expenditures (GF, SEF, BLOM) 2,900,301,571.74
Income (General and Special Education Fund) 1,638,418,848.31
Expenditures/Obligations 1,261,882,723.43
Total Revenues by Source 1,863,650,289.81
Tax Revenue/Special Education Tax 98,525,799.38
Permit and Licenses
Service Income 9,035,188.27
Business Income 105,553,294.22
Other Income (Interest Income, IRA, Misc. Income) 1,425,304,566.44
Income from Grants and Donations 225,231,441.50
Total Expenditures by Object – GF and SEF 1,261,882,723.43
Personal Services 490,238,586.39
MOOE 610,922,021.31
Capital Outlays 160,722,115.73
Source: Provincial Accounting Office, 2018
FA
CT
S A
ND
FI
GU
RE
S 2
01
8
PROVINCIAL PLANNING AND DEVELOPMENT OFFICERESEARCH, PROJECT DEVELOPMENT AND DATABASE MANAGEMENT DIVISION
Fin
anci
al P
rofi
le
77

INSTITUTIONALO R I E N TA L M I N D O R O F A C T S A N D F I G U R E S 2 0 1 8
PROFILE
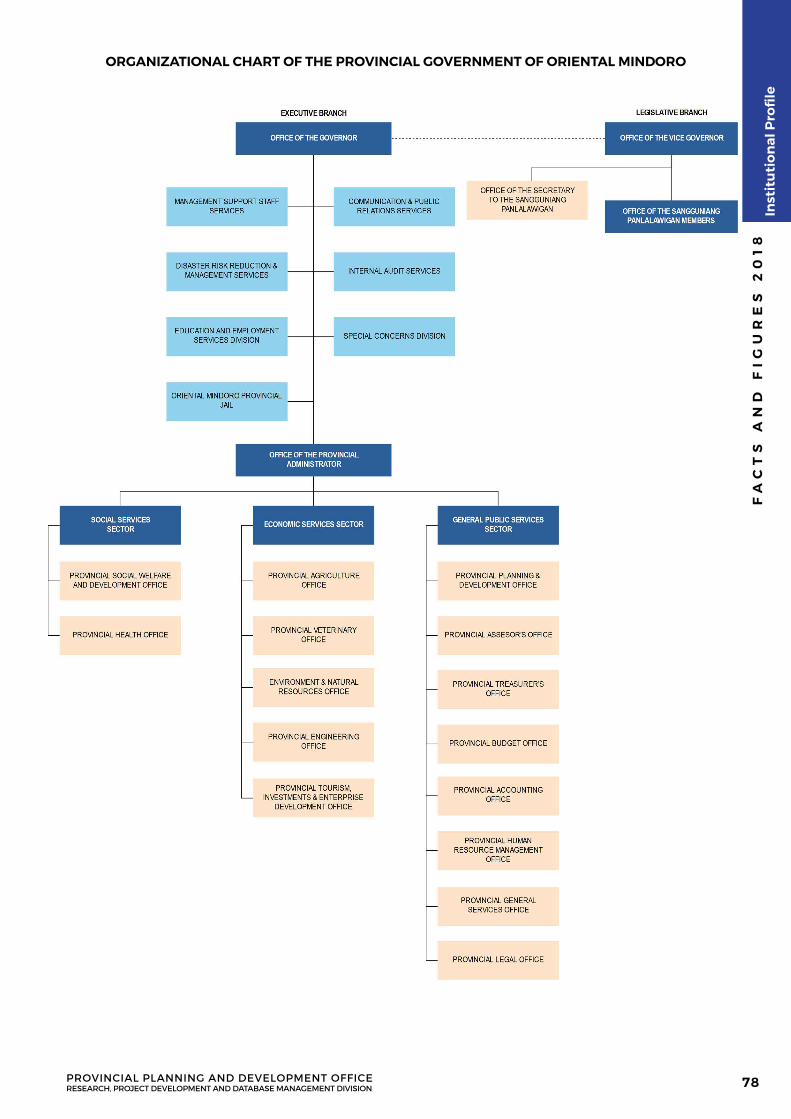
ORGANIZATIONAL CHART OF THE PROVINCIAL GOVERNMENT OF ORIENTAL MINDORO
FA
CT
S A
ND
FI
GU
RE
S 2
01
8
PROVINCIAL PLANNING AND DEVELOPMENT OFFICERESEARCH, PROJECT DEVELOPMENT AND DATABASE MANAGEMENT DIVISION
Inst
itu
tio
nal
Pro
file
78
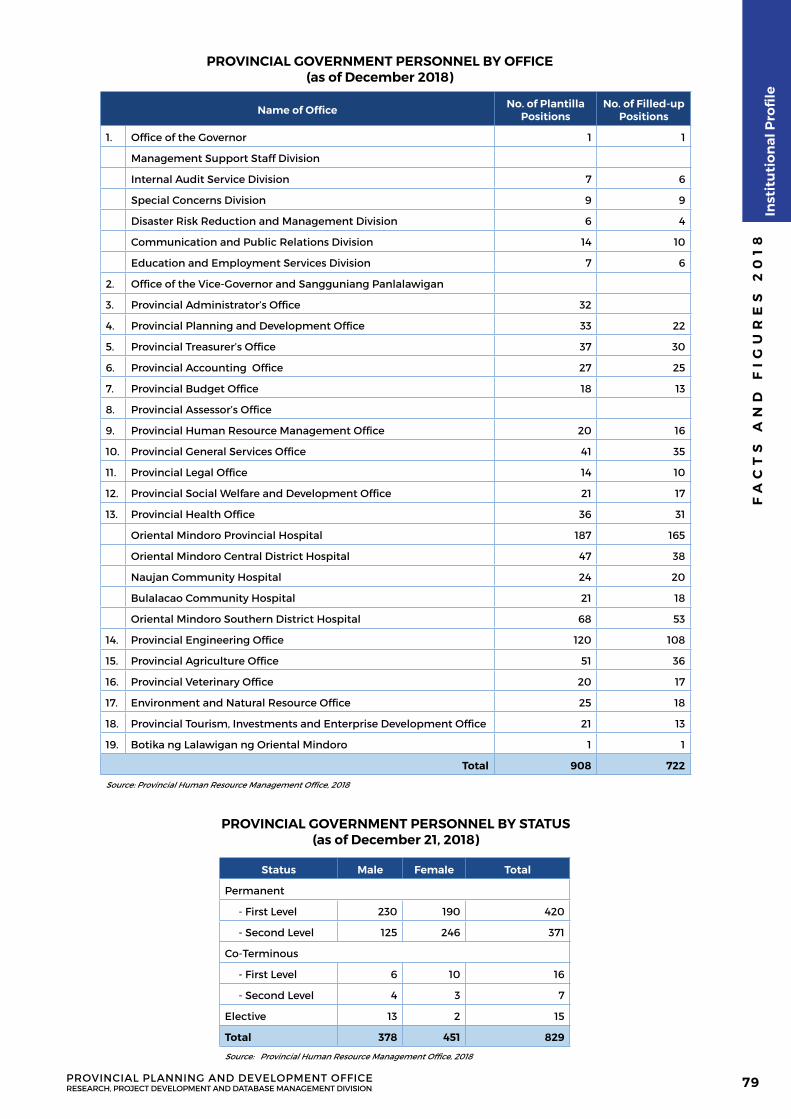
PROVINCIAL GOVERNMENT PERSONNEL BY OFFICE(as of December 2018)
Name of Office No. of Plantilla Positions
No. of Filled-up Positions
1. Office of the Governor 1 1
Management Support Staff Division
Internal Audit Service Division 7 6
Special Concerns Division 9 9
Disaster Risk Reduction and Management Division 6 4
Communication and Public Relations Division 14 10
Education and Employment Services Division 7 6
2. Office of the Vice-Governor and Sangguniang Panlalawigan
3. Provincial Administrator’s Office 32
4. Provincial Planning and Development Office 33 22
5. Provincial Treasurer’s Office 37 30
6. Provincial Accounting Office 27 25
7. Provincial Budget Office 18 13
8. Provincial Assessor’s Office
9. Provincial Human Resource Management Office 20 16
10. Provincial General Services Office 41 35
11. Provincial Legal Office 14 10
12. Provincial Social Welfare and Development Office 21 17
13. Provincial Health Office 36 31
Oriental Mindoro Provincial Hospital 187 165
Oriental Mindoro Central District Hospital 47 38
Naujan Community Hospital 24 20
Bulalacao Community Hospital 21 18
Oriental Mindoro Southern District Hospital 68 53
14. Provincial Engineering Office 120 108
15. Provincial Agriculture Office 51 36
16. Provincial Veterinary Office 20 17
17. Environment and Natural Resource Office 25 18
18. Provincial Tourism, Investments and Enterprise Development Office 21 13
19. Botika ng Lalawigan ng Oriental Mindoro 1 1
Total 908 722
Source: Provincial Human Resource Management Office, 2018
PROVINCIAL GOVERNMENT PERSONNEL BY STATUS(as of December 21, 2018)
Status Male Female Total
Permanent
- First Level 230 190 420
- Second Level 125 246 371
Co-Terminous
- First Level 6 10 16
- Second Level 4 3 7
Elective 13 2 15
Total 378 451 829
Source: Provincial Human Resource Management Office, 2018
FA
CT
S A
ND
FI
GU
RE
S 2
01
8
PROVINCIAL PLANNING AND DEVELOPMENT OFFICERESEARCH, PROJECT DEVELOPMENT AND DATABASE MANAGEMENT DIVISION
Inst
itu
tio
nal
Pro
file
79