Embed Size (px)
Citation preview

Fiscal Facts A Legislator’s Handbook of Facts, Figures, and Trends
A Publication of the Legislative Services Office

i
Introduction
Idaho Fiscal Facts is a pocket reference guide designed to provide legislators with convenient access to facts, figures, and trends in Idaho’s state budget, as well as selected information on state government programs, taxes, demographics, and state rankings.
Though not a comprehensive fiscal report, Idaho Fiscal Facts will answer many frequently asked questions in a format that is more accessible than would be found in a comprehensive fiscal publication. This booklet has been published annually since 1995. We hope the reader will find this document handy and helpful.

ii Paul Headlee, Division Manager ........................... 208-334-4746 Legislative Branch Keith Bybee, Deputy Division Manager................. 208-334-4739 Div of Financial Mgmt, Governor’s Ofc, Dept of Commerce, Dept of Labor, Dept of Rev. & Tax., Dept of Finance, Dept of Insurance Robyn Lockett, Principal Analyst............................ 208-334-4745 Public School Support/Financing, Educational Svcs for the Deaf & Blind, Supt. of Public Instruction, Div Human Res. Jared Tatro, Principal Analyst ................................ 208-334-4740 Dept of Health & Welfare, Catastrophic Health Care Program, Public Health Dist., Div of Veterans Svcs, Ofc of Drug Policy, Millennium Fund Jared Hoskins, Principal Analyst ............................ 208-334-4743 Bd of Correction, Dept of Correction, Comm Pardons & Parole, Dept of Juvenile Corrections, Judicial Branch, Attorney General, Public Defense Comm, State Appellate Public Defender, Justice Reinvestment Rob Sepich, Senior Analyst ..................................... 208-334-4742 Dept of Env Quality, Dept of Fish & Game, Dept of Lands, Endowment Fund Investment Bd, Dept of Parks & Recreation, Lava Hot Springs, Dept of Agriculture, Dept of Water Resources, Soil & Water Conservation Comm, Ofc Species Conservation, Wolf Depredation Control Bd Janet Jessup, Senior Analyst .................................. 208-334-4730 College and Universities, Agricultural Research & Extension, Health Ed. Programs, Special Programs, Community Colleges, Career-Technical Education, State Bd of Education, STEM Action Center Christine Otto, Analyst ............................................. 208-334-4732 Idaho Transportation Dept, Idaho State Police, Regulatory Boards, Div of Building Safety, Military Division Jill Randolph, Analyst .............................................. 208-334-4749 Dept of Administration, Permanent Building Fund, Capitol Comm, Historical Society, Comm for Libraries, Idaho Public Television, Comm on Hispanic Affairs, Comm for the Blind & Visually Impaired, Vocational Rehabilitation, Comm on Aging, State Ind Living Council, Arts Comm Maggie Smith, Analyst ............................................ 208-334-4741 Lt Governor, State Treasurer, Secretary of State, State Controller, State Liquor Division, Ofc Energy & Mineral Resources, PERSI, Industrial Comm, Public Utilities Comm, Medical Boards, State Lottery, Bd of Examiners J. Shane Winslow, Data Sys Coor ........................... 208-334-4738

iii
Table of Contents Idaho’s Economy .................................................................. 1-7 Revenue and Appropriations ............................................. 8-34
Budget Process .................................................................. 8-9 General Fund ................................................................. 10-15 State and Local Tax ...................................................... 16-18 Taxes and Distributions ................................................. 19-29 Reserve and Endowment Funds ................................. 30-33 Change in Employee Compensation ............................. 34
Education ............................................................................36-48 K-12 .................................................................................. 38-40 Higher Education .......................................................... 41-48
Health and Human Services ..............................................50-56 Primary Care ....................................................................... 52 Public Assistance ................................................................ 53 Mental Health Spending by DHW .................................... 54 CAT Fund ............................................................................. 55 Insurance Exchange .......................................................... 56
Law and Justice ..................................................................58-61 Imprisonments and Crime Rate ....................................... 60 IDOC Populations ............................................................... 61
Natural Resources ..............................................................62-76 Administrative Areas .......................................................... 64 Land Ownership ............................................................ 65-68 Licenses and Tags ......................................................... 69-72 Parks and Recreation ................................................... 73-74 Water Facts .................................................................... 75-76
Economic Development ....................................................77-84 ITD .................................................................................. 78-83 Lottery Revenue ................................................................ 84
General Government .........................................................86-91 Permanent Building Fund ................................................ 88 Liquor .................................................................................. 89 PERSI ................................................................................... 90 Millennium Fund ................................................................ 91
State Facts and Demographics ....................................... 92-102


Revenues & Appropriations 1
Idaho's economic output grew 4.8% from 2016 to 2017 to $71.9 billion. The US economy grew 4.1% over that same period.
Since 2011, Idaho's economy grew at an annual rate of 3.4%, which is the third fastest rate of growth for these states, behind Utah (4.2%) and Colorado (3.9%).
Idaho’s economic output represents 0.4% of the total US output and 0.5% of the total US population.
Finance, Insurance, Real Estate, Trade, and Manufacturing make up the largest private sector segments of Idaho’s economy.
$0 $100 $200 $300 $400
COAZUT
NMNVID
MTWY
2017 GDP (Current $ in Billions)

2 Revenues & Appropriations
$0 $1,000,000 $2,000,000 $3,000,000
MilkCattle/Calves
PotatoesHay, all
Wheat, allBarley
CornDry Beans
HopsTrout
Idaho's Top Commodities 2017(production values in $ thousands)
0 20,000 40,000 60,000
CAWINYIDTXPAMI
MNNMWA
2017 Milk Production - Top States(in million of pounds of milk)

Revenues & Appropriations 3
Semi -conductor & Industrial
53.2%Food and Agriculture
21.4%
Fertilizer, Pesticide, Chemicals
5.4%
Mining Products
5.0%
Transportation Equipment
4.4%
Wood, Paper, Pulp, Printing
4.0%
Other6.6%
2017 Exports by Industry
0.0% 5.0% 10.0% 15.0% 20.0% 25.0%
CanadaTaiwan
SingaporeChina
MexicoJapan
South KoreaUnited Kingdom
MalaysiaHong Kong
2017 Top 10 Trading Partners as % of Total Idaho Exports

4 Revenues & Appropriations
Idaho Jobless Rate by County
As of June 2018, the seasonally adjusted statewide jobless rate was 2.9% for Idaho while the national rate was 4.0%.
Revenues & Appropriations 5
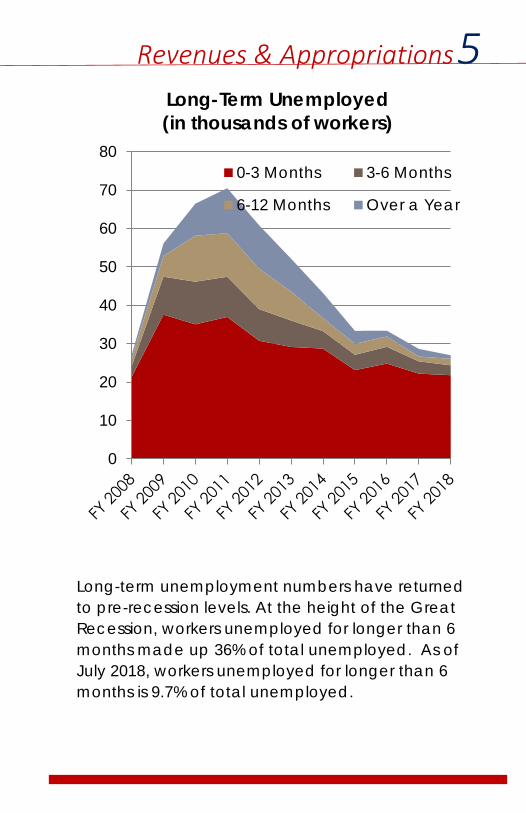
Long-term unemployment numbers have returned to pre-recession levels. At the height of the Great Recession, workers unemployed for longer than 6 months made up 36% of total unemployed. As of July 2018, workers unemployed for longer than 6 months is 9.7% of total unemployed.
0
10
20
30
40
50
60
70
80
Long-Term Unemployed(in thousands of workers)
0-3 Months 3-6 Months
6-12 Months Over a Year

6 Revenues & Appropriations
As of July 2018, the Idaho Construction sector has recovered almost three quarters of the jobs it lost during the Great Recession. Only Government, Other Services, and Educational & Health Services have grown continuously over this period.
Other Services
Professional &Business Services
Financial Activities
Information
Government
Leisure &Hospitality
Trade, Transportation,& Utilities
Educational& Health Services
Manufacturing
Semiconductor
Construction
Employment Change by Sector
Recovery Recession

Revenues & Appropriations 7
The population of Idaho is expected to grow 6.4% over the next five years to nearly 1.9 million.
The age group 25-54 is the largest population bracket with 35.6% of the population or nearly 665,300 projected in 2022, and expected growth is 2.3% during this five- year period.
The aging of the “baby boomers” and falling death rate explains the large growth for the 65-84 age group and 85+ age group.
0.0%
1.0%
2.0%
3.0%
4.0%
5.0%
6.0%
7.0%
8.0%
9.0%
0-4 5-9 10-14 15-24 25-54 55-64 65-84 85+
Population Growth from 2018-2023IHS Market Forecast projections
by age group

8 Revenues & Appropriations
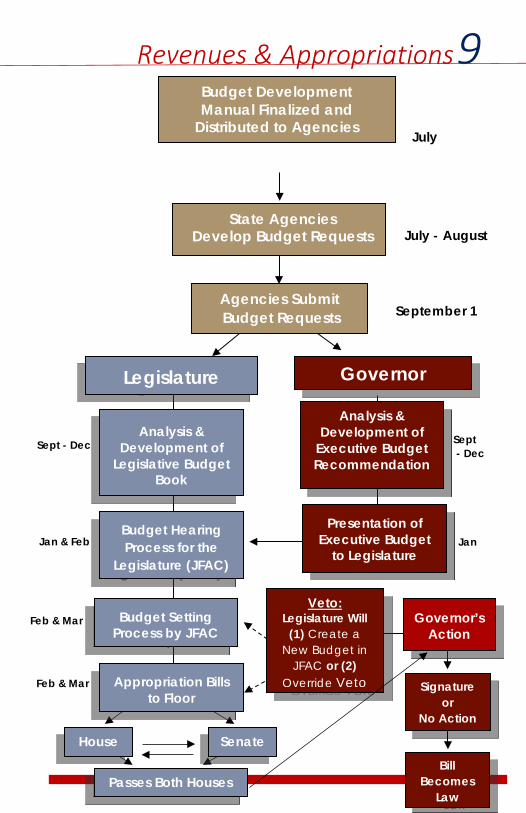
State of Idaho Budget Process The Idaho budget and appropriations process has evolved over time into one of the most streamlined and efficient state budget systems in the nation based on an approach that shares key elements of authority and responsibility between the legislative and executive branches: · The rules and guidelines used by state agencies to develop their annual budget requests are developed cooperatively by the Governor’s Division of Financial Management and the Legislature’s Budget and Policy Analysis staffs.
· Both the executive and legislative budget staffs provide input and assistance to state agencies over the summer months as they develop their new budget requests.
· Agency budget requests are statutorily required to be submitted simultaneously to the Governor’s Division of Financial Management staff and to the Legislature’s Budget and Policy Analysis staff by September 1.
· The Governor’s budget recommendation is featured prominently in the Legislative Budget Book, the primary reference document for the Joint Finance-Appropriations Committee (JFAC).
· JFAC, which is composed of ten Senate Finance Committee members and ten House Appropriations Committee members, holds budget hearings for about five weeks during the first part of the legislative session, hearing from agency directors and germane committees in its review of the agency budget requests and the Governor’s budget recommendation.
· After the budget hearing process is complete, JFAC has the responsibility to set appropriated spending levels for all state agencies and institutions. Working closely with the Legislature’s Budget and Policy Analysis staff, JFAC normally produces approximately 100 appropriation bills in a three-week time frame, providing a balanced budget for the state of Idaho each year.
· Historically, about 99% of appropriation bills passed by JFAC become law without amendment or veto.
Revenues & Appropriations 9
Budget Development Manual Finalized and
Distributed to Agencies
July
State Agencies Develop Budget Requests July - August
Agencies Submit Budget Requests September 1
Legislature Governor
Sept - Dec Analysis &
Development of Legislative Budget
Book
Analysis & Development of
Executive Budget Recommendation
Jan & Feb Budget Hearing Process for the
Legislature (JFAC)
Presentation of Executive Budget
to Legislature
Budget Setting Process by JFAC
Feb & Mar
Appropriation Bills to Floor
Veto:
Legislature Will (1) Create a
New Budget in JFAC or (2)
Override Veto
House Senate
Passes Both Houses
Signature or
No Action
Governor’s Action
Bill Becomes
Law
Feb & Mar
Sept - Dec
Jan

10 Revenues & Appropriations
Sources of Funds(millions)
TotalBy Fund Source FY 2018 FY 2019 % Chg
General Fund $3,450.6 $3,652.7 5.9% Dedicated Funds $1,729.9 $1,785.6 3.2% Federal Funds $2,726.7 $2,886.2 5.9% Total Sources $7,907.2 $8,324.5 5.3%Totals may not add due to rounding
$8,324,514,300
FY 2019 Original Appropriationsby Fund Source
General Fund
$3,652.743.9%
Dedicated Funds
$1,785.621.4%
Federal Funds
$2,886.234.7%

Revenues & Appropriations 11
FY 2019 All Funds Appropriationsby Functional Area
$8,324,514,300
All Funds Original Appropriations (millions)Total
By Functional Area FY 2018 FY 2019 % Chg
Education $2,873.5 $3,007.4 4.7% Economic Development $993.8 $1,015.2 2.1% Law & Justice $450.4 $485.6 7.8% Natural Resources $301.6 $311.7 3.4% Health & Human Serv ices $2,889.6 $3,074.1 6.4% General Government $398.3 $430.4 8.1% Total Appropriations $7,907.2 $8,324.5 5.3%Totals may not add due to rounding
Education, $3,007.4, 36%
Economic Development, $1,015.2, 12%
Law & Justice, $485.6, 6%
Natural Resources, $311.7, 4%
Health & Human Services,
$3,074.1, 37%
General Government,
$430.4, 5%

12 Revenues & Appropriations
FY 2019 General Fund Revenues$3,724,760,800
General Fund Revenues(millions)
TotalBy Revenue Source FY 2018 FY 2019 % Chg
Indiv idual Income Tax $1,828.3 $1,775.1 (2.9%)Corporate Income Tax $238.7 $207.7 (13.0%)Sales Tax $1,490.0 $1,563.8 5.0% All Other Sources $174.6 $178.2 2.0% Revenues* $3,731.6 $3,724.8 -0.2%* The FY 2019 revenue forecast was revised Aug 2018 and is $98.3M less than originally forecast .
Individual Income Tax
$1,775.147.7%
Corporate Income Tax
$207.75.6%
Sales Tax$1,563.8
42.0%
All Other Sources$178.24.8%

Revenues & Appropriations 13
FY 2019 General Fund Appropriations$3,652,724,800
General Fund Original Appropriations(millions)
TotalBy Functional Area FY 2018 FY 2019 % Chg
Education $2,171.2 $2,295.3 5.7% Natural Resources $48.3 $50.2 3.8% Law & Justice $340.7 $362.3 6.3% General Government $117.7 $120.5 2.4% Health & Human Serv ices $733.7 $784.9 7.0% Economic Development $39.0 $39.5 1.4% Appropriations $3,450.6 $3,652.7 5.9%Totals may not add due to rounding
Education62.8%
Natural Resources
1.4%
Law & Justice
9.9%
General Government
3.3% Health & Human
Serv ices21.5%
Economic Development
1.1%

14 Revenues & Appropriations
SourceFY 2010 FY 2011 FY 2012 FY 2013 FY 2014
Individual Income Tax $1,061.9 $1,152.7 $1,206.4 $1,284.4 $1,329.3
% Change (9.1%) 8.5% 4.7% 6.5% 3.5% CorporateIncome Tax $97.0 $168.9 $187.0 $198.7 $188.3
% Change (31.2%) 74.1% 10.7% 6.3% (5.2%)
Sales Tax $955.9 $972.4 $1,027.3 $1,109.8 $1,145.7 % Change (6.5%) 1.7% 5.6% 8.0% 3.2%
Cigarette Tax $16.9 $14.4 $11.6 $13.1 $3.7 Tobacco Tax $7.8 $8.5 $8.9 $10.0 $9.9 Beer Tax $2.1 $2.0 $1.9 $1.9 $1.9 Wine Tax $3.0 $3.2 $3.5 $3.9 $4.1 Liquor Profits $11.4 $14.8 $17.2 $20.9 $24.2 Product Taxes $41.2 $42.8 $43.3 $49.9 $43.8
% Change 38.5% 4.0% 1.1% 15.2% (12.2%)
Kilowatt-Hour $2.1 $2.4 $3.0 $1.9 $1.8 Mine License $1.8 $1.5 $2.0 $0.5 $5.2 Insur Premium $53.6 $54.1 $56.6 $55.6 $59.4 Unclaimed Prop $8.2 $4.5 $8.9 $7.0 $5.7 Estate Tax ($0.2) $0.5 ($0.0) $0.8 $1.2 Other $42.9 $44.6 $53.2 $41.7 $35.0 Misc. Revenue $108.5 $107.7 $123.7 $107.5 $108.3
% Change 3.6% (0.7%) 14.9% (13.1%) 0.7% TotalGeneral Fund $2,264.5 $2,444.5 $2,587.7 $2,750.3 $2,815.4
% Change (8.2%) 7.9% 5.9% 6.3% 2.4%
Sources: Legislat ive Fiscal Reports & DFM General Fund Revenue Book
ActualsGeneral Fund Revenues ($ in millions)

Revenues & Appropriations 15
Source Actuals Forecast*FY 2015 FY 2016 FY 2017 FY 2018 FY 2019
Individual Income Tax $1,470.9 $1,513.2 $1,651.2 $1,828.3 $1,775.1
% Change 10.6% 2.9% 9.1% 10.7% -2.9%CorporateIncome Tax $215.4 $186.9 $214.0 $238.7 $207.7
% Change 14.4% (13.2%) 14.5% 11.5% -13.0%
Sales Tax $1,218.8 $1,303.0 $1,382.4 $1,490.0 $1,563.8 % Change 6.4% 6.9% 6.1% 7.8% 5.0%
Cigarette Tax $3.3 $7.9 $10.0 $7.3 $10.4 Tobacco Tax $10.5 $11.6 $12.7 $13.3 $14.5 Beer Tax $1.9 $1.9 $1.9 $2.0 $2.0 Wine Tax $4.2 $4.5 $4.7 $4.8 $5.1 Liquor Profits $25.5 $25.9 $28.9 $31.0 $33.2 Product Taxes $45.5 $51.8 $58.1 $58.3 $65.2
% Change 10.6% 13.9% 12.2% 0.3% 11.8%
Kilowatt-Hour $1.9 $1.9 $2.1 $2.6 $2.2 Mine License $0.1 ($0.3) $0.1 $0.0 $0.1 Insur Premium $61.7 $72.1 $75.4 $70.5 $67.9 Unclaimed Prop $6.3 $9.9 $10.4 $8.5 $9.0 Estate Tax $0.0 $0.0 $0.0 $0.0 $0.0 Other $36.2 $45.3 $54.8 $34.7 $33.8 Misc. Revenue $106.3 $128.8 $142.7 $116.3 $113.0
% Change (1.9%) 21.2% 10.8% (18.5%) (2.9%)TotalGeneral Fund $3,056.8 $3,183.7 $3,448.4 $3,731.6 $3,724.8
% Change 8.6% 4.2% 8.3% 8.2% -0.2%
* Revenue Forecast is August Revised Forecast
General Fund Revenues ($ in millions)
16 Revenues & Appropriations
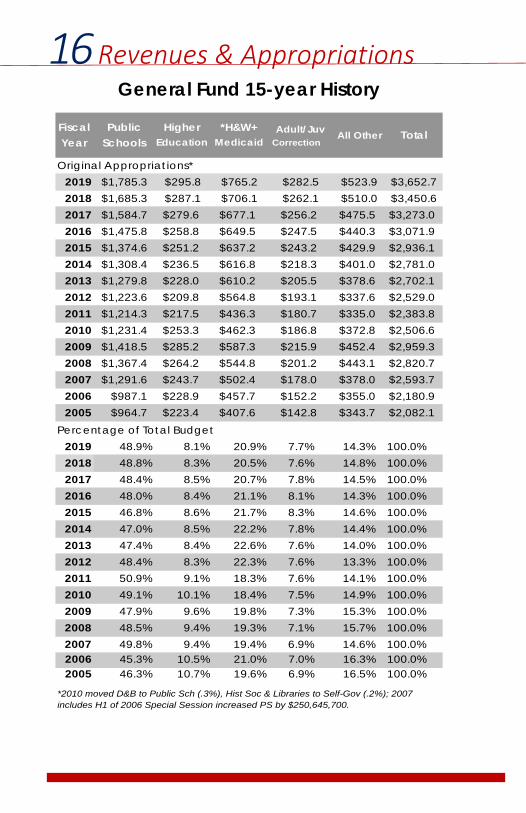
General Fund 15-year History
FiscalYear
PublicSchools
HigherEducation
*H&W+Medicaid
Adult/JuvCorrection
All Other Total
Original Appropriations*2019 $1,785.3 $295.8 $765.2 $282.5 $523.9 $3,652.72018 $1,685.3 $287.1 $706.1 $262.1 $510.0 $3,450.62017 $1,584.7 $279.6 $677.1 $256.2 $475.5 $3,273.02016 $1,475.8 $258.8 $649.5 $247.5 $440.3 $3,071.92015 $1,374.6 $251.2 $637.2 $243.2 $429.9 $2,936.12014 $1,308.4 $236.5 $616.8 $218.3 $401.0 $2,781.02013 $1,279.8 $228.0 $610.2 $205.5 $378.6 $2,702.12012 $1,223.6 $209.8 $564.8 $193.1 $337.6 $2,529.02011 $1,214.3 $217.5 $436.3 $180.7 $335.0 $2,383.82010 $1,231.4 $253.3 $462.3 $186.8 $372.8 $2,506.62009 $1,418.5 $285.2 $587.3 $215.9 $452.4 $2,959.32008 $1,367.4 $264.2 $544.8 $201.2 $443.1 $2,820.72007 $1,291.6 $243.7 $502.4 $178.0 $378.0 $2,593.72006 $987.1 $228.9 $457.7 $152.2 $355.0 $2,180.92005 $964.7 $223.4 $407.6 $142.8 $343.7 $2,082.1
Percentage of Total Budget2019 48.9% 8.1% 20.9% 7.7% 14.3% 100.0%2018 48.8% 8.3% 20.5% 7.6% 14.8% 100.0%2017 48.4% 8.5% 20.7% 7.8% 14.5% 100.0%2016 48.0% 8.4% 21.1% 8.1% 14.3% 100.0%2015 46.8% 8.6% 21.7% 8.3% 14.6% 100.0%2014 47.0% 8.5% 22.2% 7.8% 14.4% 100.0%2013 47.4% 8.4% 22.6% 7.6% 14.0% 100.0%2012 48.4% 8.3% 22.3% 7.6% 13.3% 100.0%2011 50.9% 9.1% 18.3% 7.6% 14.1% 100.0%2010 49.1% 10.1% 18.4% 7.5% 14.9% 100.0%2009 47.9% 9.6% 19.8% 7.3% 15.3% 100.0%2008 48.5% 9.4% 19.3% 7.1% 15.7% 100.0%2007 49.8% 9.4% 19.4% 6.9% 14.6% 100.0%2006 45.3% 10.5% 21.0% 7.0% 16.3% 100.0%2005 46.3% 10.7% 19.6% 6.9% 16.5% 100.0%
*2010 moved D&B to Public Sch (.3%), Hist Soc & Libraries to Self-Gov (.2%); 2007 includes H1 of 2006 Special Session increased PS by $250,645,700.

Revenues & Appropriations 17
General Fund 10 -Year Trend Comparison Original Appropriation as Cumulative Percentage
Change over FY 2009
-20%
-10%
0%
10%
20%
30%
40%
50%
60%
70%
2009
2010
2011
2012
2013
2014
2015
2016
2017
2018
2019
Public Schools Higher EducationHealth & Welfare Adult/Juv CorrectionMedicaid All Other
The largest budget increases in state government over the past 10 years have been in the areas of Adult / Juvenile Corrections and Medicaid. Corrections grew 62.6% and Medicaid grew 51.7%. The table on the facing page shows that the percent of our General Fund going to Higher Education and other agencies has decreased while Adult / Juvenile Corrections and Medicaid have grown.

18 Revenues & Appropriations
FY 2018 Major State & Local Tax Collections
FY 2018 Major State & Local Tax Distribution
($ millions)Other Taxes
$336.25.3%
Individual Income Tax
$1,837.529.0%
Corporate Income Tax
$240.83.8%
Sales Tax$1,780.228.1%Motor Fuels
Tax$344.95.4%
Property Tax$1,795.728.3%
State Dedicated
Funds 6.0% -$381.6
Local Gov 35.1% -$2,222.2
State General
Fund 58.9% -$3,731.6
Total Tax Collections $6,335.4 million
Total Tax Distribution $6,335.4 million
Revenues & Appropriations 19
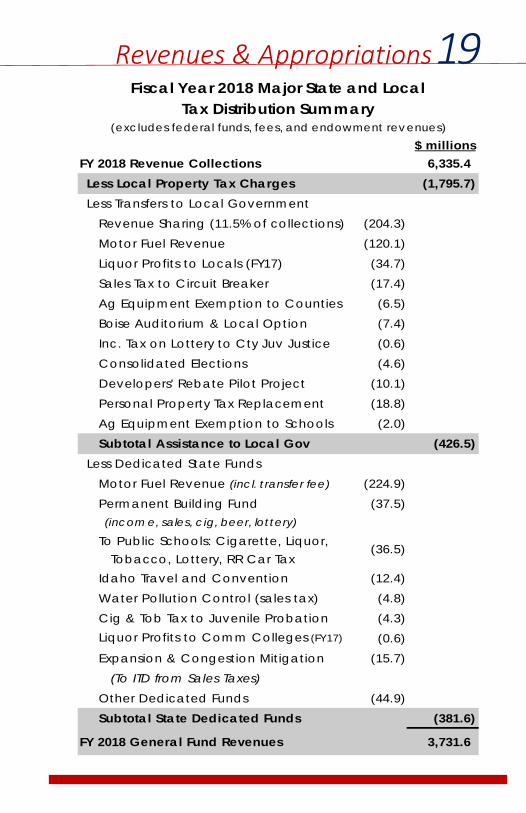
Fiscal Year 2018 Major State and LocalTax Distribution Summary
(excludes federal funds, fees, and endowment revenues)$ millions
FY 2018 Revenue Collections 6,335.4 Less Local Property Tax Charges (1,795.7) Less Transfers to Local Government
Revenue Sharing (11.5% of collections) (204.3) Motor Fuel Revenue (120.1) Liquor Profits to Locals (FY17) (34.7) Sales Tax to Circuit Breaker (17.4) Ag Equipment Exemption to Counties (6.5) Boise Auditorium & Local Option (7.4) Inc. Tax on Lottery to Cty Juv Justice (0.6) Consolidated Elections (4.6) Developers' Rebate Pilot Project (10.1) Personal Property Tax Replacement (18.8) Ag Equipment Exemption to Schools (2.0)
Subtotal Assistance to Local Gov (426.5) Less Dedicated State Funds
Motor Fuel Revenue (incl. transfer fee) (224.9) Permanent Building Fund (37.5) (incom e, sales, cig, beer, lottery)
To Public Schools: Cigarette, Liquor, Tobacco, Lottery, RR Car TaxIdaho Travel and Convention (12.4) Water Pollution Control (sales tax) (4.8) Cig & Tob Tax to Juvenile Probation (4.3) Liquor Profits to Comm Colleges (FY17) (0.6) Expansion & Congestion Mitigation (15.7)
(To ITD from Sales Taxes)Other Dedicated Funds (44.9)
Subtotal State Dedicated Funds (381.6)
FY 2018 General Fund Revenues 3,731.6
(36.5)

20 Revenues & Appropriations
($ in billions) FY 2008-2018 Major State and Local Tax Collections
$0.0
$1.0
$2.0
$3.0
$4.0
$5.0
$6.0
$7.0
Local Property Tax Motor Fuel Tax
Sales Tax Corporate Income Tax
Individual Income Tax Other Taxes
Over the ten-year period from FY 2008 to FY 2018, major state and local taxes increased 35.1%, or 7.5% annually from $4.690 billion to $6.335 billion. Over that same period, individual income tax collections grew at an annual compound rate of 2.5%, corporate income tax collections grew at an annual rate of 2.4%, sales tax collections grew at a rate of 3.0% annually, motor fuels grew at a rate of 4.1% annually, and property tax collections grew at a rate of 4.0% annually.
From FY 2017 to FY 2018, major state and local collections increased by 7.5%, individual income tax collections grew 10.7%, sales tax collections grew 8.7%, property tax collections grew 5.8%, and motor fuel collections grew 3.4%.

Revenues & Appropriations 21
Sales Tax RateJul 1965 - Feb 1983 3.0%Mar 1983 - May 1983 4.0%Jun 1983 - Jun 1984 4.5%Jul 1984 - Mar 1986 4.0%Apr 1986 - May 2003 5.0%May 2003 - June 2005 6.0%July 2005 - Oct 2006 5.0%Oct 2006 to present 6.0%
Personal (Individual) Income Tax Rate
Brackets** (indexed for inflation since 2000)
Jan 2000 through
Dec 2000
Jan 2001 through
Dec 2010
Jan 2012 through
Dec 2017
Jan 2018 through Current
1st 1,000 ($1,454) 1.9% 1.6% 1.6% 1.1%2nd 1,000 ($2,908) 3.9% 3.6% 3.6% 3.1%3rd 1,000 ($4,362) 4.4% 4.1% 4.1% 3.6%4th 1,000 ($5,816) 5.4% 5.1% 5.1% 4.6%5th 1,000 ($7,270) 6.4% 6.1% 6.1% 5.6%next 2,500 ($10,905) 7.4% 7.1% 7.1% 6.6%next 12,500 ($26,319) 7.7% 7.4%excess of 20,000 ($26,320+) 8.1% 7.8%excess of $10,00 ($10,905+) 7.4% 6.9%** Double for married individuals fi ling joint ly.
Corporate Income Tax Rate1972 through 1980 6.5%1981 through 19821983 through 1986 7.7%1987 through 2000 8.0%2001 through 2011 7.6%2012 through 2017 7.4%2018 and forward 6.9%Insurance Premium Tax RateJan 1987 - Dec 1987 3.3%Jan 1988 - Dec 1994 3.0%Jan 1995 - Dec 2004 2.75%Jan 2005 to Jan 2010 gradual decrease from 2.75% to 1.5%2010 and forward 1.5%
6.5% + 0.2% franchise tax up to $250,000
Idaho Tax Rates & History of Changes

22 Revenues & Appropriations
Sales Tax Distributions ($ in thousands)
Gross General Rev %Year (a) Collections Refunds Fund Sharing Change
FY88 311,382.5 672.5 258,762.1 42,721.6 30.7%FY89 346,682.3 882.4 288,780.3 47,522.5 11.2%FY90 383,096.0 1,664.0 319,290.7 52,410.9 10.3%FY91 404,146.4 3,403.1 335,739.5 55,064.4 5.1%FY92 435,715.5 1,799.1 364,323.0 59,634.8 8.3%FY93 481,357.9 1,163.9 402,819.5 65,992.5 10.7%FY94 541,503.6 1,739.0 452,684.8 74,142.5 12.3%FY95 575,751.5 1,767.4 481,568.8 78,890.9 6.4%FY96 602,573.0 2,114.2 462,999.7 82,577.5 4.7%FY97 624,631.8 2,109.4 476,726.1 85,588.2 3.6%FY98 655,182.6 2,023.6 496,807.8 89,725.2 4.8%FY99 704,734.8 2,784.7 588,796.7 96,217.1 7.2%FY00 750,125.9 2,741.7 627,503.0 102,607.4 6.6%FY01 778,886.9 3,464.1 647,293.8 106,024.7 3.3%FY02 791,623.6 4,103.4 657,119.2 108,500.4 2.3%FY03 839,180.9 3,119.1 700,240.7 112,947.4 4.1%FY04 1,032,987.5 4,312.6 886,079.0 117,825.4 4.3%FY05 1,125,317.0 3,478.3 950,825.2 128,485.1 9.0%FY06 1,071,204.9 7,667.2 880,772.8 143,195.3 11.4%FY07 1,272,854.7 5,029.1 1,077,455.9 154,818.1 8.1%FY08 1,339,278.0 9,606.4 1,142,468.0 152,578.2 -1.4%FY09 1,201,248.3 5,963.3 1,022,201.6 136,994.7 -10.2%FY10 1,123,885.3 3,088.4 955,908.7 128,496.0 -6.2%FY11 1,166,271.5 21,124.1 972,379.8 131,214.7 2.1%FY12 1,216,228.4 8,738.5 1,027,344.3 138,440.4 5.5%FY13 1,313,372.0 11,087.6 1,109,828.5 149,426.5 7.9%FY14 1,369,521.6 3,780.6 1,145,731.8 156,568.6 4.8%FY15 1,456,971.4 5,534.5 1,218,769.7 166,329.4 6.2%FY16 1,553,033.8 4,839.9 1,303,027.5 177,834.0 6.9%FY17 1,643,649.3 5,312.6 1,382,418.2 188,174.7 5.8%
FY18(b) 1,784,749.2 4,552.5 1,490,015.4 204,185.1 8.5%Sources: (a) DFM General Fund Revenue Book FY 2019
(b) State Tax Commission Comparat ive Report , FY 2018

Revenues & Appropriations 23
Sales Tax Distributions($ in thousands)
Perm Bldg Pollution Circuit PropertyYear(a) Fund Control Breaker Tax Relief
FY88 500.0 4,800.0 3,890.1 36.2 3
FY89 500.0 4,800.0 4,171.7 25.4 3
FY90 500.0 4,800.0 4,335.5 94.9 3
FY91 500.0 4,800.0 4,491.1 148.3 3
FY92 500.0 4,800.0 4,606.1 52.5 3
FY93 500.0 4,800.0 6,031.2 50.8 3
FY94 500.0 4,800.0 7,504.3 132.9 3
FY95 500.0 4,800.0 8,241.1 (16.6) 3
FY96 500.0 4,800.0 8,807.0 40,757.1 17.6 3
FY97 500.0 4,800.0 9,609.0 45,238.4 60.7 3
FY98 500.0 4,800.0 10,331.1 50,400.4 594.5 3
FY99 500.0 4,800.0 10,891.7 744.6 3
FY00 500.0 4,800.0 11,481.2 492.7 3
FY01 5,000.0 4,800.0 11,711.3 593.0 3
FY02 5,000.0 4,800.0 11,983.5 117.0 3
FY03 5,000.0 4,800.0 12,787.1 286.6 3
FY04 5,000.0 4,800.0 14,097.7 872.8 3
FY05 5,000.0 4,800.0 14,995.3 16,810.6 922.5 3
FY06 5,000.0 4,800.0 15,466.7 13,448.5 854.4 3
FY07 5,000.0 4,800.0 15,402.7 9,727.4 621.5 3
FY08 5,000.0 4,800.0 15,405.6 8,487.1 932.8 3,4
FY09 5,000.0 4,800.0 15,459.1 8,487.1 2,342.5 3,4
FY10 5,000.0 4,800.0 15,706.9 8,487.1 2,398.2 3,4
FY11 5,000.0 4,800.0 16,001.7 8,487.1 7,264.1 3,4,5
FY12 5,000.0 4,800.0 16,069.8 8,487.1 7,348.3 3,4,5
FY13 5,000.0 4,800.0 15,901.5 8,487.1 8,840.8 3,4,5
FY14 5,000.0 4,800.0 15,728.2 27,420.7 10,491.7 3,4,5
FY15 5,000.0 4,800.0 16,318.8 27,408.9 12,810.1 3,4,5
FY16 5,000.0 4,800.0 16,606.1 27,376.8 13,549.5 3,4,5
FY17 5,000.0 4,800.0 16,968.1 27,339.2 13,636.5 3,4,5
FY18(b) 5,000.0 4,800.0 17,426.7 27,324.5 31,445.1 3,4,5,6
Notes: 1) Social Security Trust 4) Demonst rat ion Pilot Project
2) Public School Income3) Mult i-State Tax Compact 6) Transportat ion E.C.M. Fund
MiscellaneousDistributions
5) Elect ion Consolidat ion

24 Revenues & Appropriations
Sales Tax Ag & Pers Prop Circuit Election LiquorCounty Rev Sharing1 Tax Repl1 Breaker1 Consol1 Distrib 2
Ada $55,573,567 $4,219,681 $2,954,836 $661,873 $9,936,398Adams 659,417 84,063 61,228 55,395 84,570 Bannock 10,875,224 1,135,109 876,705 167,138 1,537,388 Bear Lake 955,166 101,602 78,046 58,268 123,291 Benewah 966,263 195,107 133,976 62,642 227,788 Bingham 4,810,832 1,262,222 396,745 112,841 444,115 Blaine 4,118,678 347,524 112,812 80,227 1,029,895 Boise 654,427 106,760 91,458 59,881 137,605 Bonner 3,981,000 676,962 555,470 108,800 1,432,789 Bonneville 12,833,909 1,869,772 979,475 204,894 1,766,539 Boundary 1,120,562 204,839 213,760 66,023 229,006 Butte 406,251 202,858 38,891 53,485 50,494 Camas 240,725 57,336 13,990 51,490 23,944 Canyon 22,743,234 3,155,203 2,644,988 342,044 2,348,646 Caribou 1,204,437 268,857 81,053 59,515 96,504 Cassia 3,007,243 730,391 182,445 82,755 304,851 Clark 345,636 70,474 1,346 51,212 36,184 Clearwater 1,748,183 213,714 172,195 61,840 174,273 Custer 813,217 86,753 47,668 55,702 133,683 Elmore 2,732,435 510,955 258,471 86,157 319,165 Franklin 1,563,193 231,201 140,194 68,449 173,581 Fremont 1,546,297 286,831 148,925 67,949 217,178 Gem 1,845,067 250,028 296,990 73,713 179,875 Gooding 1,827,027 540,100 175,633 71,230 197,783 Idaho 2,207,997 247,259 251,598 72,596 235,747 Jefferson 2,213,344 525,232 240,004 88,316 185,195 Jerome 2,583,061 904,032 285,517 81,917 226,300 Kootenai 17,571,900 1,809,027 2,061,214 262,253 5,931,230 Latah 4,370,305 865,256 280,516 104,327 1,196,396 Lemhi 1,262,070 99,588 139,709 60,771 195,455 Lewis 560,838 198,710 78,011 55,324 107,567 Lincoln 768,937 197,491 37,564 57,364 83,983 Madison 3,871,456 650,777 148,652 103,870 183,827 Minidoka 2,504,307 695,493 291,683 78,620 268,569 Nez Perce 6,523,357 860,357 658,374 106,030 1,185,693 Oneida 645,829 117,507 61,258 56,009 73,515 Owyhee 1,498,351 340,786 121,444 65,816 133,283 Payette 2,381,285 447,039 368,532 81,996 449,718 Power 1,302,548 563,535 75,102 60,662 71,454 Shoshone 2,088,272 253,004 360,079 67,338 431,977 Teton 1,123,235 109,438 32,478 64,995 268,632 Twin Falls 11,046,235 1,671,780 1,021,094 165,580 1,433,484 Valley 1,535,882 141,317 76,986 64,350 552,681 Washington 1,516,043 256,860 236,512 64,043 289,749 TOTAL $204,147,240 $27,762,831 $17,483,627 $4,525,701 $34,710,000Sources: 1 Tax Commission (FY 2018), 2 Liquor Division (FY 2017)

Revenues & Appropriations 25
Highway State 2017 $ PerCounty Distrib3 Lottery 4 Total Pop 5 CapitaAda $32,659,232 $4,716,844 $110,722,431 456,849 $242.36Adams 1,312,990 25,345 2,283,008 4,147 550.52Bannock 7,640,209 884,195 23,115,968 85,269 271.09Bear Lake 1,554,228 71,510 2,942,110 6,028 488.07Benewah 1,712,900 77,346 3,376,021 9,184 367.60Bingham 5,417,951 639,409 13,084,116 45,927 284.89Blaine 2,961,636 210,700 8,861,471 22,024 402.36Boise 1,300,524 46,946 2,397,600 7,290 328.89Bonner 4,162,891 304,463 11,222,375 43,560 257.63Bonneville 9,700,594 1,457,360 28,812,543 114,595 251.43Boundary 1,602,053 85,286 3,521,529 11,922 295.38Butte 1,225,264 26,981 2,004,224 2,602 770.26Camas 1,228,383 7,883 1,623,750 1,102 1,473.46Canyon 16,356,684 2,459,526 50,050,326 216,699 230.97Caribou 2,344,073 93,744 4,148,183 7,034 589.73Cassia 4,082,554 329,670 8,719,909 23,664 368.49Clark 1,145,449 8,344 1,658,645 873 1,899.94Clearwater 1,509,122 74,891 3,954,218 8,546 462.70Custer 1,860,906 33,628 3,031,557 4,172 726.64Elmore 3,981,077 283,044 8,171,304 26,823 304.64Franklin 1,814,709 197,606 4,188,933 13,564 308.83Fremont 2,380,997 133,689 4,781,868 13,094 365.20Gem 2,022,420 156,101 4,824,194 17,379 277.59Gooding 2,265,554 199,185 5,276,512 15,124 348.88Idaho 3,908,786 108,212 7,032,195 16,369 429.60Jefferson 3,139,419 416,876 6,808,386 28,446 239.34Jerome 2,979,296 286,432 7,346,554 23,627 310.94Kootenai 13,012,870 1,338,212 41,986,706 157,637 266.35Latah 4,789,040 295,506 11,901,346 39,333 302.58Lemhi 1,651,379 59,028 3,467,999 7,875 440.38Lewis 1,609,673 45,787 2,655,910 3,887 683.28Lincoln 1,517,467 58,861 2,721,667 5,318 511.78Madison 3,597,822 422,442 8,978,846 39,141 229.40Minidoka 3,036,757 252,927 7,128,356 20,729 343.88Nez Perce 4,462,658 324,012 14,120,482 40,385 349.65Oneida 1,562,525 67,310 2,583,953 4,427 583.68Owyhee 3,027,790 142,585 5,330,055 11,628 458.38Payette 2,408,883 259,737 6,397,190 23,215 275.56Power 2,287,557 102,346 4,463,204 7,600 587.26Shoshone 1,922,569 102,463 5,225,702 12,542 416.66Teton 1,570,266 103,567 3,272,612 11,381 287.55Twin Falls 8,831,664 973,893 25,143,730 85,124 295.38Valley 2,631,552 81,315 5,084,083 10,687 475.73Washington 2,101,316 109,793 4,574,316 10,121 451.96TOTAL $182,291,689 $18,075,000 $488,996,088 1,716,943 $284.813 Transportat ion Dept (FY 2018), 4 Lottery (FY 2017), 5 U.S. Census Bureau Est .

26 Revenues & Appropriations
Specific Uses Not Taxed FY 2016 FY 2017 FY 2018Production Exemption Equip $111,144 $110,088 $117,125Production Exemption Supplies 84,136 83,337 88,663Irrigation Equipment & Supplies 4,327 4,435 4,546Pollution Control Equipment 11,523 12,133 12,752Broadcast Equipment 2,729 2,700 2,873Publishing Equipment Supplies 175 173 184Commercial Aircraft 2,054 2,154 2,154Railroad Rolling Stock & Remfg 2,550 2,550 2,550Interstate Trucks 7,740 8,058 8,351Out-of-State Contracts 4,548 4,499 4,786Trade-in Value 33,044 34,400 35,652Sales of Bus or Bus Assets 2,158 2,135 2,271SNAP/WIC 16,297 16,601 17,075Motor Vehicles used Outside ID 18,634 19,376 20,106Donation Real Prop to ID Gov't 4 4 4Incidental Sales Tangible Prop 12 12 12Lodging, Eating, Drinking Place 89 91 95School Lunches & Senior Meals 5,098 5,143 5,297Driver's Education Automobiles 39 39 38Ski Lifts & Snowgrooming Equip 600 600 600Clean Rooms 480 480 480Research & Development Equip 7,200 7,200 7,200Other 9,182 9,461 10,274Total Specific Uses Not Taxed $323,763 $325,669 $343,088
Goods Not Taxed FY 2016 FY 2017 FY 2018Motor Fuels $136,137 $138,654 $144,093Heating Materials 3,974 3,950 4,172Utility Sales 105,074 108,226 111,473Used Mobile Homes 2,760 2,760 2,760Prescrip & Durable Med Equip 61,594 65,751 68,972Funeral Caskets & Containers 1,617 1,665 1,716Nonprofit Literature 140 143 145Official Documents 70 71 72Bullion & Idaho Medallion 560 560 560New Mfd Homes & Modular Bldg 2,468 2,509 2,577Telecommunication Equipment 2,495 2,745 3,019Personnel Prop Tax on Rentals 400 400 400Remote-Access CPU Software 8,070 8,385 8,721Total Goods Not Taxed $325,359 $335,819 $348,680
Sales Tax Exceptions & Exemptions ($ in Thousands Based on 6 Cent Rate)

Revenues & Appropriations 27
Services Not Taxed FY 2016 FY 2017 FY 2018Construction $143,454 $157,728 $171,413Agricultural & Industrial Srvs 8,358 8,487 8,683Transportation Serv ices 46,603 48,702 50,306Information Serv ices 95,393 96,842 98,421Repairs 55,393 58,169 60,648Professional Serv ices 226,776 238,143 248,292Business Serv ices 135,515 142,307 148,372Personal Serv ices 11,905 12,502 13,035Health & Medical Serv ices 505,918 530,379 548,980Social Serv ices 76,045 79,722 82,517Educational Serv ices 55,658 58,447 60,938Lottery & Pari-Mutuel Betting 14,801 15,393 16,008Media Measurement Srvs 74 77 79Misc Serv ices & Range Fees 4,573 4,796 4,997Total Services Not Taxed $1,380,466 $1,451,694 $1,512,689
Entities Not Taxed FY 2016 FY 2017 FY 2018Educational Inst Purchases $8,704 $9,091 $9,554Hospital Purchases 29,302 30,718 31,796Health Entity Purchases 470 490 510Canal Company Purchases 1,056 1,073 1,088Forest Protective Assoc Purch 46 47 48Food Bank, Clothier, Indep Liv ing 343 358 374State & Local Gov Purchases 26,923 28,690 30,509INL R&D Purchases 5,619 5,692 5,978Motor Veh Purch by Relatives 2,166 2,255 2,337Sales by 4H & FFA Clubs 28 28 28Non-Retail Sales 3,861 4,032 4,197Sales by Indian Tribes on Res 5,717 5,881 6,094Sales by Outfitters & Guides 16 16 16Sales v ia Vending Machines 2,616 2,665 2,741Auto Manufacturers' Rebates 714 744 771Meals & Sales by Churches 981 1,024 1,065Volunteer Fire Depts & EMS 217 227 236Senior Citizen Centers 52 54 56Other Charitable Serv ices 32 34 36Museums 237 248 258Total Entities Not Taxed $89,100 $93,367 $97,692
Total Exceptions & Exemptions $2,118,688 $2,206,549 $2,302,149Source: DFM General Fund Revenue Book FY 2019
Sales Tax Exceptions & Exemptions (cont.) ($ in Thousands Based on 6 Cent Rate)

28 Revenues & Appropriations
Income Tax Expenditures($ in thousands)
FY 2016 FY 2017 FY 2018Investment Tax Credit $39,554 $38,165 $39,919Other States Tax Credit 82,091 84,935 88,307Elderly Dependent Credit 834 870 905Youth and Rehab Credit 9,214 9,533 9,912Schools, Libraries, Museums 8,830 9,136 9,523Grocery Credit 144,632 146,731 148,859Recycling Equipment Credit 5 15 15Tech Equipment Deduction 61 67 69Long-Term Care Insurance Ded 1,489 1,515 1,535Alt Energy Device Ded 398 435 452Insulation Deduction 1,234 1,350 1,402Workers Comp Prem Ded 400 400 400Child Care Deduction 4,308 4,373 4,402College Savings Deduction 2,085 2,280 2,370Health Insurance Deduction 20,474 22,719 23,601Elderly & Dev Disability Ded 34 37 38Adoption Expenses Deduction 33 44 44Medical Savings Deduction 1,161 1,270 1,320Right Income Adj Credit 40 40 40Broadband Investment Credit 2,123 2,049 2,143Research Activ ity Credit 7,431 7,170 7,500Promoter Event Credit 2 10 10Sml Emp Invst, Prop, & Job Cred 892 859 859Organ Donation Credit 37 34 34Reimbursement Incentive Credit 3,000 6,000 9,000Charitable Contributions Ded 25 25 25Total Specific Uses Not Taxed $330,387 $340,062 $352,684
Sources of Income Not Taxed FY 2016 FY 2017 FY 2018Capital Gains Exclusion $23,888 $26,225 $27,256Government Interest Exclusion 1,442 1,582 1,629Social Security Exclusion 79,029 86,254 89,735Retirement Benefit Exclusion 8,469 9,254 9,622Idaho Lottery Winnings Exclusion 5,159 5,248 5,432Indian Earnings on Reservation 719 744 773Certain Loss Recoveries Exclusion 250 250 250Nonresident Partnership Exclusion 440 440 440Total Goods Not Taxed $119,396 $129,997 $135,137Total Income Tax Expenditures $449,783 $470,059 $487,821

Revenues & Appropriations 29
The state Tax Commission conducts a tax burden study periodically which compares Idaho’s taxes to the national average after adjusting for differences in personal income or population among the states (State and Local Tax Burden Analysis: Fiscal Year 2015, Alan Dornfest, Oct. 2017). This information is drawn from that study.
In FY 2015, Idaho’s state and local tax burden ($9.33 per $100 of personal income) was the fifteenth lowest state burden in the country.
Idaho has the second lowest burden of the Rocky Mountain States as a percentage of personal income. Arizona was lowest among this group ($9.12 per $100 of personal income), and thirteenth lowest overall.
According to the report, Idaho’s FY 2015 tax burden from major state and local taxes relative to population ranks 29.2% below the national average and 4th lowest overall. Only South Carolina, Tennessee, and Alabama have lower per capita tax burdens. Idaho ranks second lowest in the country in taxes per person.
$8.50 $9.50 $10.50 $11.50 $12.50
WYNMNVMTUT
COIDAZ
FY 2015 State and Local Tax Burden
State and Local Taxes per $100 of Personal Income, 2015

30 Revenues & Appropriations
The Budget Stabilization Fund was created in 1984 for the purpose of meeting General Fund revenue shortfalls and to meet expenses resulting from major disasters. IC §57-814. Most of the cash balance has come from General Fund transfers; since 2000, Idaho Code requires quarterly distributions from the General Fund in the next year if the prior year’s revenue growth exceeds 4%. Over the years, money was appropriated from this fund to deal with General Fund budget shortfalls and to pay for disasters, highway projects, election consolidation, and small one time projects. In 2015, H312a removed the ceiling and provided that one-half of any General Fund surplus be deposited to the fund. The Public Education Stabilization Fund is continuously appropriated to make up shortfalls in discretionary funding for Public Schools and the state made deposits beginning in 2004. It may also be used to make up for General Fund holdbacks, for declining endowment distributions, and to meet state match for the School District Building Account. The fund reached an all-time high of $112 million in 2008, and was drawn down to $11.2 million by 2011 as the state dealt with a major recession. The Economic Recovery Reserve Fund was created in 2005 to provide savings in times of General Fund revenue shortfalls with an increase in the cigarette tax. Shortly thereafter, the cigarette taxes were redirected for Bond Levy Equalization in Public Schools and to pay for the renovation of the Capitol building. With the scheduled payoff of the capitol bond in FY 2015, H547 of 2014 redirected the cigarette tax from the fund to pay for GARVEE bonds and water projects. The Traditional Millennium Fund receives 20% of the revenue collected under the tobacco settlement agreement. Five percent of the market value is annually transferred to the Millennium Income Fund and is available to be appropriated for grants. Although the fund is not classified as a reserve fund, it is subject to appropriation and has been used by the Governor and the Legislature over several economic downturns to support shortfalls in the General Fund.

Revenues & Appropriations 31
$413.5
$79.7
$41.5
$37.8
$-
$100
$200
$300
$400
$500
$600
Traditional Millennium Fund
Emergency Funds
Higher Education Stabilization
Public Education Stabilization
Economic Recovery Reserve
Budget Stabilization

32 Revenues & Appropriations
Idaho Endowment Trusts The Admission’s Act granted Idaho about 3 million acres of federal lands for public school support (sections 16 and 36 of every township) and another 650 thousand acres for eight other endowment beneficiaries. The five-member State Board of Land Commissioners manages state lands, and is composed of the Governor, Secretary of State, Attorney General, State Controller, and Superintendent of Public Instruction.
In 1905, the Department of Lands was created to support the Land Board and take over management from the State Treasurer. The Land Board chose to deposit timber sale revenue into the permanent endowment, and to place lease revenues into the income funds for annual distribution along with the earnings from the permanent funds. In 1969, the Legislature created an Endowment Fund Investment Board (EFIB) to manage the financial assets.
Institution Idaho Land Remaining Percent Percent Grant Acres Acres 6/15 Remain of Total
Public Schools 2,982,683 2,076,829 69.5% 84.9% Agricultural College 90,000 33,526 37.3% 1.4% Charitable Institutions 150,000 77,241 51.5% 3.2% Normal School 100,000 59,639 59.6% 2.4%
Penitentiary 50,000 28,915 57.8% 1.2% School of Science 100,000 75,497 75.5% 3.1% Mental Hospital 50,000 31,376 62.8% 1.3% University of Idaho* 96,080 55,094 57.3% 2.3% Capitol Endowment 32,000 7,283 22.8% 0.3% Total 3,650,763 2,445,400 67.0% 100.0%
* Includes 46,080 acres granted Feb 18,1881 to University of Idaho
• Public school endowment lands comprise 85% of the total endowment lands.
• Sixty-seven percent of original or exchanged endowment lands remain.
Source: Idaho Department of Lands Annual Report
Revenues & Appropriations 33
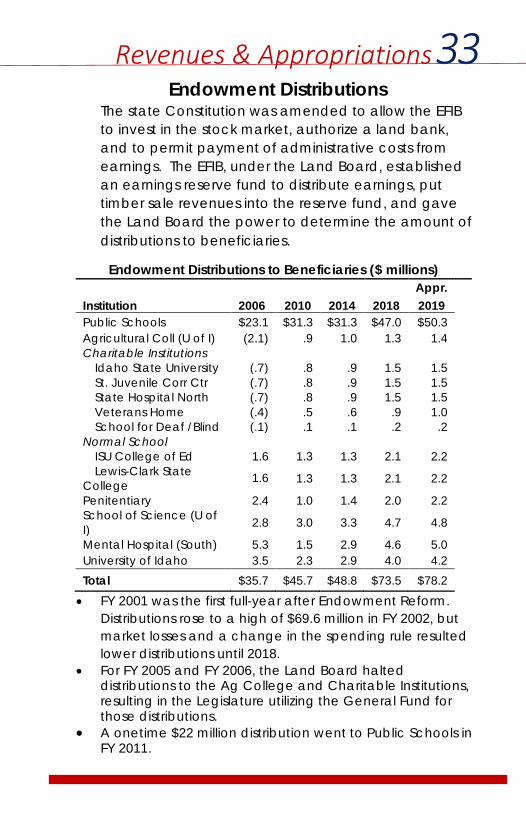
Endowment Distributions The state Constitution was amended to allow the EFIB to invest in the stock market, authorize a land bank, and to permit payment of administrative costs from earnings. The EFIB, under the Land Board, established an earnings reserve fund to distribute earnings, put timber sale revenues into the reserve fund, and gave the Land Board the power to determine the amount of distributions to beneficiaries.
Endowment Distributions to Beneficiaries ($ millions) Appr. Institution 2006 2010 2014 2018 2019 Public Schools $23.1 $31.3 $31.3 $47.0 $50.3 Agricultural Coll (U of I) (2.1) .9 1.0 1.3 1.4 Charitable Institutions Idaho State University (.7) .8 .9 1.5 1.5
St. Juvenile Corr Ctr (.7) .8 .9 1.5 1.5 State Hospital North (.7) .8 .9 1.5 1.5 Veterans Home (.4) .5 .6 .9 1.0 School for Deaf /Blind (.1) .1 .1 .2 .2
Normal School ISU College of Ed 1.6 1.3 1.3 2.1 2.2 Lewis-Clark State
College 1.6 1.3 1.3 2.1 2.2
Penitentiary 2.4 1.0 1.4 2.0 2.2 School of Science (U of I) 2.8 3.0 3.3 4.7 4.8
Mental Hospital (South) 5.3 1.5 2.9 4.6 5.0 University of Idaho 3.5 2.3 2.9 4.0 4.2 Total $35.7 $45.7 $48.8 $73.5 $78.2
• FY 2001 was the first full-year after Endowment Reform. Distributions rose to a high of $69.6 million in FY 2002, but market losses and a change in the spending rule resulted lower distributions until 2018.
• For FY 2005 and FY 2006, the Land Board halted distributions to the Ag College and Charitable Institutions, resulting in the Legislature utilizing the General Fund for those distributions.
• A onetime $22 million distribution went to Public Schools in FY 2011.

34 Revenues & Appropriations
20-Year Historical Change in Employee Compensation Comparison
For FY 2019, the Governor recommended, and the Legislature funded, a 3% salary increase for permanent state employees, to be distributed at the discretion of each agency head and institution president. The Legislature authorized and funded a 3% increase in the annual salary for appointed officials.
Fiscal Year
Gen Fund Orig Approp
Gen Fund %
Chg
Personnel Comm /
DHR CPI% FY
ChgCEC
Funded2000 $1,674.7 M 4.0% 14.0% 3.7% 3.0%2001 $1,804.0 M 7.7% 0.0% 3.2% 3.5%2002 $2,044.3 M 13.3% 0.0% 1.1% 4.5%2003 $1,967.9 M -3.7% 0.0% 2.1% 0.0%2004 $2,004.1 M 1.8% 1.0% 3.3% 0.0%2005 $2,082.1 M 3.9% 6.8% 2.5% 3.0%2006 $2,180.9 M 4.7% 6.7% 4.3% 1.0%2007 $2,593.7 M 18.9% 5.7% 2.7% 3.0%2008 $2,820.7 M 8.8% 5.8% 5.0% 5.0%2009 $2,959.3 M 4.9% 5.0% -1.4% 3.0%2010 $2,506.6 M -15.3% 5.0% 1.1% 0.0%2011 $2,383.8 M -4.9% 3.0% 3.6% 0.0%2012 $2,529.0 M 6.1% 3.0% 1.7% 0.0%2013 $2,702.1 M 6.8% 3.0% 1.8% 2.0%2014 $2,781.0 M 2.9% 0.0% 2.0% 0.0%2015 $2,936.1 M 5.6% 0.0% 0.1% 2.0%2016 $3,071.9 M 4.6% 3.0% 1.0% 3.0%2017 $3,273.0 M 6.5% 3.0% 1.6% 3.0%2018 $3,450.6 M 5.4% 3.0% 2.9% 3.0%2019 $3,652.7 M 5.9% 3.0% N/A 3.0%
Avg. Annual Change 4.40% 3.55% 2.22% 2.10%


36 Education
11-Year Appropriation Trend Selected Agencies ($ in billions)
The Public School Support budget, comprised of state and federal funds, has increased 27% from FY 2009. The FY 2019 General Fund Original Appropriation was $1.785 million, or a 5.9% increase, over FY 2018; this is an increase of just over $100 million. This appropriation provided funding for a projected 15,339 support units; provided $41.6 million to move teachers to the fourth year of the career ladder instructor compensation system; provided a $10.5 million increase for classroom technology; and increased administrators and non-certified staff base salaries by 3%.
The FY 2019 General Fund Original Appropriation for Community Colleges increased 17.3% with the creation of the College of Eastern Idaho. The Legislature also approved the creation of two new medical residency programs and increased support for existing programs, resulting in an overall 19.7% increase for health education programs. The Legislature appropriated an additional $3.5 million to expand the Opportunity Scholarship, an increase of 18.7% for Special Programs.
0.00.51.01.52.02.53.03.5
Public Schools College & Universities
All Other Education General Fund

Education 37
State Board of Education Original Appropriation
* The General Fund FY 2019 Original Appropriation for the Office of the State Board of Education increased 76.6%. This increase included a line item of $6,125,000 of dedicated funding for annual sub-lease payment from the Idaho National Laboratory (INL). Payments will be received by the Board from INL and submitted to the State Building Authority.
Original Appropriations (All Funds) FY 2018 FY 2019
Annual % Chg
($ in millions) By Department or Division Public School Support $2,041.2 $2,140.6 4.9% Agricultural Research & Extension 31.3 31.3 0.1%
College and Universities 565.0 576.8 2.1% Community Colleges 40.0 46.9 17.3% State Board of Education* 9.0 16.0 76.6%
Health Education Programs 15.9 19.0 19.7%
Career Technical Education 74.8 76.0 1.6%
Idaho Public Television 9.6 9.4 (1.9%) Special Programs 19.7 23.4 18.7% Superintend. of Public Instruction 38.8 39.7 2.2%
Vocational Rehabilitation 28.2 28.3 0.5% Total $2,873.5 $3,007.4 4.7%
By Fund Source General Fund $2,171.2 $2,295.3 5.7% Dedicated Funds $391.3 $400.6 2.4% Federal Funds $311.0 $311.5 0.2% Total $2,873.5 $3,007.4 4.7% Totals May Not Add Due to Rounding

38 Education
K – 12 Public School Metrics Five-Year History
The FY 2019 Original Appropriation added $15.9 million to maintain and increase discretionary funding from $26,748 per support unit to $27,481 per support unit, which was a 2.7% increase; provided $30.4 million for facilities maintenance; $23.2 million for the Bond Levy Equalization Program; $36.5 million for classroom technology, Wi-Fi services, and instructional management systems; $17.7 million for teacher leadership awards; $21.5 million for professional development; plus $15 million for advanced opportunities. There was $8 million provided for IT staffing, as well as increases to the Idaho Digital Learning Academy and Idaho Educational Services for the Deaf and the Blind.
Source: http://www.sde.idaho.gov/finance/index.html
School Year 2014-15 2015-16 2016-17 2017-18 2018-19
Fall Enrollment 291,022 294,471 298,787 302,332 NAAvg Daily Attendance 276,031 279,300 282,848 286,236 NAMid-Term Support Units 14,683 14,862 15,064 15,220 15,404 (est)Full-Term Support Units 14,601 14,806 15,020 15,164 15,339 (est)
General Fund $1,374.6 $1,475.8 $1,584.7 $1,685.3 $1,785.3Dedicated Funds 86.8 74.2 77.5 91.6 91.0Federal Funds 215.2 264.3 264.3 264.3 264.3Total $1,676.6 $1,814.3 $1,926.5 $2,041.2 $2,140.6
General Fund 5.1% 7.4% 7.4% 6.3% 5.9%Total Funds 4.9% 8.2% 6.2% 6.0% 4.9%
Discretionary Funds per Full-Term Support Unit
$22,401 $23,868 $25,696 $26,748 $27,481
Dollars (in millions)
Students

Education 39
FY 2019 Public Schools Funding: $2,462,615,100
Transportation $73,010,000 Classroom Tech and Wi-Fi $36,500,000
Border Contracts $1,200,000 Limited English Proficiency (LEP) $4,870,000Exceptional Contracts/Tuition Equivalents
$5,390,900 Content and Curriculum $6,350,000
Salary-based Apportionment and State-Paid Employee
$1,146,134,300Prof. Development, Gifted & Talented Teacher Training
$21,550,000
Reading Initiative $13,156,500 Remediation $5,456,300
Bond Levy Equalization $23,184,500 Assessments (Science, PSAT) $3,100,000
ID Digital Learning Academy $9,788,500 District IT Staffing $8,000,000
Safe & Drug-Free Schools $4,024,900 Math Initiative $1,817,800Additional Math and Science Requirements
$5,930,000Serv ices for the Deaf & Blind (Outreach)
$3,956,400
Advanced Opportunities $15,000,000Serv ices for the Deaf & Blind (Campus)
$7,023,000
National Board Teacher Certification
$90,000 Federal Funds for Districts $264,115,000
Facilit ies (Lottery) & Interest Earned
$18,562,500 Total Non-Statutory $362,738,500
Facilit ies State Match (GF) $3,905,000
Charter School Facilit ies $7,893,700
Leadership Awards/Premiums $17,773,600 Discretionary Funds $421,530,200Cont. Improvement Planning $652,000
Mastery-Based Education $1,400,000
Online Portal $150,000 Local Property Tax Rev (est) $322,000,000College/Career Counselors $9,000,000Innovation Schools $100,000
Total Statutory $1,356,346,400
Statutory Distributions Non-Statutory Distributions
State Sources $1.8
billion, or 76.2%
Local Levy Property Tax Est imate
$322 million, or 13.1%
Federal Funding from 40+ Programs
$264 million, or 10.7%

40 Education
Traditional and Charter School Fall Enrollment During the 2017-2018
School Year was 302,332
During the 2017-2018 school year, fall enrollment at public charter schools was 21,872 or 7.2%, of the total statewide K-12 enrollment. Enrollment at charter schools has averaged 1,150 additional students per year over the past 18 years. However, growth has slowed to an average of 626 students per year during the past four years.
H206 of 2013 required that all charter schools pay an annual authorizer fee. The purpose of the fee is to help defray the cost of providing authorizer oversight. This fee is estimated to annually generate approximately $365,000 and has allowed the Public Charter School Commission to completely shift its $325,400 budget off of the General Fund and onto dedicated funds. The bill also required that charter schools receive monies from the General Fund for facilities maintenance; for FY 2019, $7,893,700 was appropriated to charter schools for this purpose.
Traditional School Enrollment in 115
School Districts was280,460, or 92.8%
Charter School Enrollment in 52 schools was
21,872, or 7.2%

Higher Education 41
College & Universities Enrollment and Resident Tuition and Fees
Selected Measures Fall Academic Enrollment (full- and part-time students), 2017-2018
Fall 2014
Fall 2015
Fall 2016
Fall 2017
Avg. Annual Chg.
Boise State University 22,239 22,086 23,854 24,121 2.7% Idaho State University 12,248 11,915 11,831 11,560 -1.9% University of Idaho 11,534 11,372 11,780 12,072 1.5% Lewis-Clark St. College 3,178 3,216 3,481 3,313 1.4%
Total 49,199 48,589 50,946 51,066 1.2%
Fall Full-Time Equivalent (FTE) Academic Enrollment, 2017-2018
Fall 2014
Fall 2015
Fall 2016
Fall 2017
Avg. Annual Chg.
Boise State University 15,733 15,433 15,954 16,305 1.2% Idaho State University 9,416 9,220 9,049 8,766 -2.4% University of Idaho 9,610 6,384 9,422 9,433 -0.6% Lewis-Clark St. College 2,480 2,432 2,476 2,436 -0.6%
Total 37,239 33,469 36,901 36,940 -0.3%
Annual Undergraduate Resident Tuition and Fees
Fall 2015
Fall 2016
Fall 2017
Fall 2018
Avg. Annual Chg.
Boise State University 6,874 6,874 7,330 7,694 3.8% Idaho State University 6,784 6,956 7,166 7,420 3.0% University of Idaho 7,020 7,232 7,450 7,864 3.9% Lewis-Clark St. College 6,000 6,120 6,334 6,620 3.3%
Average 6,670 6,796 7,070 7,400 3.5%
For 2017-2018 average undergraduate student tuition and fees at Idaho universities (BSU, ISU, LCSC, and UI) were 77.7% ($7,245) of the Western Interstate Commission for Higher Education (WICHE) state average ($9,328). This resulted in Idaho universities being ranked 11 of 16 (1 is highest cost and 16 is lowest cost) when compared to other western states. Among WICHE state universities, Wyoming was the least expensive at 55.9% of the average, while the most expensive was Arizona at 120.3% of the average.

42 Higher Education
State Board of Education Approved Allocation of Appropriations by Institution
Appropriated Funds Only
*Total change calculations include carryover appropriations for dedicated funds.
One Year Comparative Original Approp. FY 2018 FY 2019 $ Chg %Chg by Institution BSU $194.8M $207.M $12.2M 6.3% ISU $151.7M $149.3M -$2.4M -1.6% UI $178.M $178.8M $.8M 0.5% LCSC $35.5M $35.5M $.06M 0.2% Systemwide $5.1M $6.2M $1.15M 22.7% TOTAL $565.M $576.8M $11.8M 2.1%
Ten Year Comparative All Funds
Original Approp. FY 2009 FY 2019
Avg Annl Chg
Total %Chg
TOTAL $399.M $576.8M 3.8% 44.6% Ten Year Comparative
Original Approp. FY 2009 FY 2019
Avg Annl Chg
Total %Chg*
by Fund Source General Fund $264.2M $295.7M 1.1% 11.9% Endowment Funds $5.8M $16.4M 11.0% 184.9% Student Fees/Tuition $103.6M $264.6M 9.8% 155.3% TOTAL $373.6M $576.7M 4.4% 54.3%
Higher Education 43
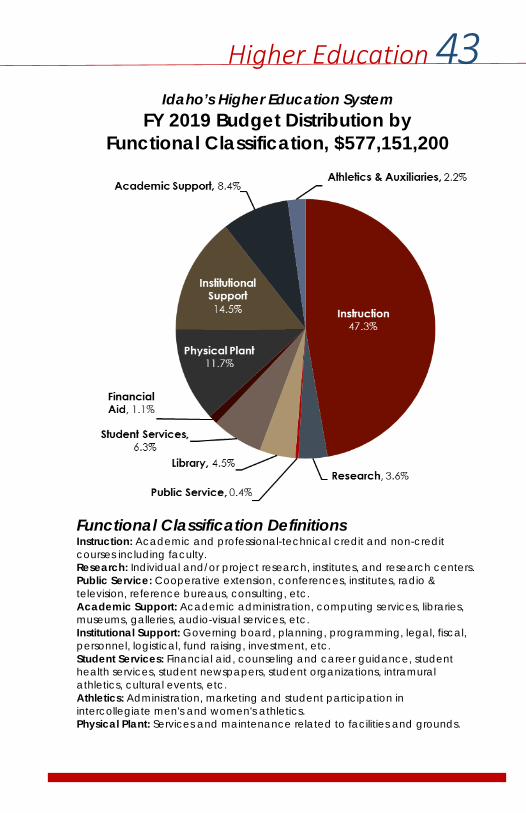
Idaho’s Higher Education System
FY 2019 Budget Distribution by Functional Classification, $577,151,200
Functional Classification Definitions Instruction: Academic and professional-technical credit and non-credit courses including faculty. Research: Individual and/or project research, institutes, and research centers. Public Service: Cooperative extension, conferences, institutes, radio & television, reference bureaus, consulting, etc. Academic Support: Academic administration, computing services, libraries, museums, galleries, audio-visual services, etc. Institutional Support: Governing board, planning, programming, legal, fiscal, personnel, logistical, fund raising, investment, etc. Student Services: Financial aid, counseling and career guidance, student health services, student newspapers, student organizations, intramural athletics, cultural events, etc. Athletics: Administration, marketing and student participation in intercollegiate men's and women's athletics. Physical Plant: Services and maintenance related to facilities and grounds.

44 Higher Education
Idaho's Higher Education System
Cost to Attend
For a traditional (single, no dependents), full-time (at least 12 credits), resident undergraduate student living independently, based on the 2017/2018 school year it cost approximately $20,603 to attend an Idaho college or university for one academic year.
Sources & Assumptions: Based on average costs provided by institutions; maximum annual limit for federal loans; academic ability for scholarships; student 10 hour work week; examples of actual family Free Application for Federal Student Aid (FAFSA) completions; U.S. Census Bureau.

Higher Education 45
Community College Fall Enrollment and Tuition & Fee Information
* Full-time enrollment is calculated at 12 credits for two semesters for all four
institutions. ** Historical student counts for Eastern Idaho Technical College (now College
of Eastern Idaho) have been included as a point of reference. However, note that student population for the College of Eastern Idaho prior to the Fall of 2017 consists of solely CTE students. Beginning in the fall of 2017, these populations include academic and CTE students.
Student Information Fall 2014
Fall 2015
Fall 2016
Fall 2017
Avg Annl Chg
Fall Enrollment Headcount (full- and part-time students), 2017-2018 North Idaho College 5,770 5,543 5,344 5,390 -2.2% College of Southern Idaho 8,357 7,570 7,021 7,063 -5.5% College of Western Idaho 10,217 8,435 9,120 10,321 0.3% College of Eastern Idaho 686 687 676 809 5.7%
Total 25,030 22,235 22,161 23,583 -2.0%
Fall Full-Time Enrollment (FTE) Academic and Career Technical, 2017-2018 North Idaho College 3,779 3,510 3,345 3,252 -4.9% College of Southern Idaho 3,917 3,702 3,518 3,409 -4.5% College of Western Idaho 5,735 4,908 4,858 5,185 -3.3% College of Eastern Idaho 436 462 470 546 7.8%
Total 13,867 12,582 12,191 12,392 -3.7%
Annual Student Tuition & Fees* 2015-6 2016-7 2017-8 2018-9 North Idaho College 3,214 3,288 3,360 3,360 1.5% College of Southern Idaho 2,880 3,120 3,120 3,360 5.3% College of Western Idaho 3,264 3,336 3,336 3,336 0.7% College of Eastern Idaho** 2,334 2,404 2,464 3,096 9.9%
Average $2,923 $3,037 $3,070 $3,288 4.3%

46 Higher Education
Community College Operating Budgets
The community college budget appropriated by the Legislature includes only the state support from the General Fund and an $800,000 statutory distribution of liquor funds, where each college receives $200,000. The Legislature does not appropriate local property tax revenues, student tuition & fees, county tuition, or other revenues.
Actual Actual Appropriated FY 2017 FY 2018 FY 2019 College of Southern Idaho State General Fund $13,465,800 $14,105,800 $14,264,000 Property Tax 6,151,900 6,300,000 6,800,000 Tuition and Fees* 10,754,300 11,800,000 11,800,000 Other** 3,624,200 3,799,700 2,551,900 Total $33,996,200 $36,005,500 $35,415,900 College of Western Idaho State General Fund $11,668,200 $12,570,000 $13,938,900 Property Tax 6,560,100 7,601,700 8,079,600 Tuition and Fees* 21,640,700 21,561,200 21,387,100 Other** 1,014,300 1,311,100 1,348,000 Total $40,883,300 $43,044,000 $44,753,600
North Idaho College State General Fund $11,785,000 $12,725,100 $12,909,900 Property Tax 14,338,600 15,019,900 15,264,800 Tuition and Fees* 13,645,100 12,522,900 12,784,600 Other** 1,743,400 1,678,500 1,395,000 Total $41,512,100 $41,946,400 $42,354,300
Eastern Idaho College State General Fund $0 $0 $5,013,800 Property Tax 0 0 860,000 Tuition and Fees* 0 0 4,152,600 Other** 0 0 773,800 Total $0 $0 $10,800,200
*Includes Career Technical student fees and summer credit classes **Other funds include State Liquor Funds ($200,000 per institution), county
tuition, and other miscellaneous revenues.
In May 2017, voters approved the creation of a taxing district to support the College of Eastern Idaho (CEI) in Idaho Falls. FY 2019 is first year that the Legislature appropriated to CEI, though property tax will be received until the summer of 2020.

Higher Education 47
Taxing Districts
Levy Rates, Property Valuations, and Taxes Charged
*Property taxes for the College of Eastern Idaho are not anticipated to be collected until July 2019.
Levy Rate / $100,000 Assessed
Value
Total Valuation Total Tax Charged
CSI 2012 $95.76 $5,365,295,851 $5,137,649 2013 $97.07 $5,508,098,852 $5,346,793 2014 $95.55 $5,763,316,656 $5,506,857 2015 $96.49 $5,958,786,059 $5,749,361 2016 $98.92 $6,102,259,644 $6,036,333 2017 $95.41 $6,619,641,360 $6,315,964
CWI 2012 $19.04 $31,243,847,551 $5,949,783 2013 $18.21 $34,311,112,262 $6,249,013 2014 $16.63 $39,451,900,388 $6,560,077 2015 $16.42 $42,282,915,154 $6,942,147 2016 $15.95 $47,177,822,649 $7,524,878 2017 $15.36 $51,085,954,861 $7,844,288
NIC
2012 $122.03 $11,200,581,030 $13,668,144 2013 $120.15 $11,472,122,065 $13,783,194 2014 $112.39 $12,359,983,215 $13,890,803 2015 $109.89 $13,087,893,022 $14,382,710 2016 $104.95 $14,026,088,304 $14,719,900 2017 $97.88 $15,340,157,680 $15,014,827

48 Higher Education
Career Technical Education FY 2019 Total Appropriation: $75,963,200
Allocation of Postsecondary Appropriation ($ in millions)
Technical Colleges FY 2018 FY 2019 College of Eastern Idaho $7.79 6.89 College of Southern Idaho $7.13 7.32 College of Western Idaho $9.14 9.25 Idaho State University $12.10 12.34 Lewis-Clark State College $4.89 4.87 North Idaho College $5.46 5.64
Total $46.51 $46.31


50 Health & Human Services
11-year Appropriation Trend (in billions)
• The Department of Health and Welfare accounts for
99.3% of all Health and Human Services appropriations.
• Within the Department, Medicaid expenditures account for 79.7% of all Health and Human Services appropriations.
• The next largest appropriation in FY 2019 was the Division of Welfare at 5.7% of all Health and Human Services appropriations.
• The Public Health Districts have the largest appropriation outside of the Department of Health and Welfare at $10.2 million or 0.3% of all Health and Human Services appropriations.
• The Catastrophic Health Care Program appropriation was reduced to $10 million for FY 2019, but is expected to be increased to about $21 million for FY 2020.
0.0
0.5
1.0
1.5
2.0
2.5
3.0
3.5
Medicaid All Other Services General Fund

Health & Human Services 51
Original Appropriations FY 2018 FY 2019 % Chg
($ in millions) By Department or Division Catastrophic Health Care $18.0 $10.0 (44.4%) Health & Welfare 2,860.8 3,053.3 6.7%
Child Welfare 69.5 76.9 10.7% Developmental Disabled 31.5 32.8 3.9% Independent Councils 9.1 9.1 0.0% Indirect Support Services 46.4 48.7 5.0% Medicaid 2,285.3 2,449.5 7.2% Mental Health Services 50.4 53.1 5.4% Psychiatric Hospitalization 38.7 38.8 0.4% Public Health Services 116.8 120.8 3.4% Service Integration 6.1 6.1 0.1% Substance Abuse 14.8 17.2 16.1% Welfare 172.3 175.0 1.6% Healthcare Policy Initiatives 12.9 17.9 38.7% Licensing and Certification 6.9 7.3 6.2%
Public Health Districts 10.1 10.2 0.8% Independent Living Council 0.7 0.7 (5.8%) Total $2,889.6 $3,074.1 6.4%
By Fund Source General Fund $733.7 $784.9 7.0% Dedicated Funds $401.6 $382.1 (4.9%) Federal Funds $1,754.3 $1,907.2 8.7% Total $2,889.6 $3,074.1 6.4%
Totals May Not Add Due to Rounding

52 Health & Human Services
Percentage of Population with Access to Primary Care
Primary Care Providers per 100,000 Population
• Idaho ranks 33rd of 50 for access to primary care with
16% of Idahoans not having access to primary care. • Idaho ranks last for the number of physicians per
100,000 people.
Source: State Rankings 2018, Morgan (CQ Press)
84.0%80.6%79.9%
88.2%92.0%
70.2%87.9%87.3%
0% 20% 40% 60% 80% 100%
IdahoMontanaNevadaOregon
UtahWashington
WyomingNational
167
733
2.450
292
884
1.558
0100200300400500600700800900
1,000
Physicians2017
RegisteredNurses 2017
CommunityHospitals 2015
Dentists 2017
Idaho
NationalRate

Health & Human Services 53
Idahoans Receiving Public Assistance In FY 2018, the Department of Health and Welfare’s Benefit Payments Program expended $89,075,000 for (1) cash payments to needy families, (2) childcare assistance payments to allow parents to work, and (3) food stamps. Medicaid trustee and benefit payments accounted for $2,255,047,700 of state expenditures in FY 2018.
Approximately 1 in 5 Idahoans (325,893) are receiving some form of public assistance.
Assistance by Program
Source: Idaho Department of Health and Welfare
Non-Public Assistance
Citizens, 81%
18.3% of Region
14.8% of Region
24.7% of Region
14.0% of Region
21.8% of Region
21.3% of Region
21.1% of Region
Idahoans Receiving Public Assistance, 19%
Region 1, Kootenai Co. Area Region 2, Nez Perce Co. AreaRegion 3, Canyon Co. Area Region 4, Ada Co. AreaRegion 5, Twin Falls Co. Area Region 6, Bannock Co. AreaRegion 7, Bonneville Co. Area
Cash Payments Received
21,6795%
Child Care Assistance
8,8612%
Food Stamps155,494
33%
Medicaid277,726
60%
Note: Individuals may have received support in more than one program.

54 Health & Human Services
Department of Health and Welfare – Mental Health Spending
Total mental health expenditures in the Department of Health and Welfare increased $55.3 million or 26% from 2013 to 2018. Expenditures in FY 2018 were $267,669,100.
Suicide Prevention and Awareness
In 2015, Idaho ranked 6th of 50 in death by suicide with 22.1 suicides per 100,000 people, whereas Wyoming ranked 1st of 50 with 28 suicides per 100,000 people and New York ranked 50th of 50 with 7.8 suicides per 100,000 people.
Source: State Rankings 2018, Morgan (CQ Press)
$0
$50,000,000
$100,000,000
$150,000,000
$200,000,000
$250,000,000
$300,000,000
FY 2013 FY 2014 FY 2015 FY 2016 FY 2017 FY 2018Medicaid Psychiatric Hospitalization Mental Health
22.1 25.3
18.4 17.8
22.4 15.4
28.0 13.3
0.0 5.0 10.0 15.0 20.0 25.0 30.0
IdahoMontanaNevadaOregon
UtahWashington
WyomingNational Avg
Death Rate by Suicide per 100,000 People, 2015

Health & Human Services 55
Catastrophic Health Care Program (CAT Fund) ($ in millions)
This program addresses the needs of the medically indigent who do not qualify for other state or federal health assistance programs, but do qualify for county assistance. Beginning July 1, 2009, the resident county is responsible for the first $11,000 in medical bills and the state is responsible for the remaining amounts.
State expenditures in this fund dropped significantly in 2013 and continued to decrease through 2017 for three primary reasons: • More Idahoans signing up for health insurance coverage • Medical reviews being done on all CAT Fund submissions • Full implementation of the dual-application for Indigence
and Medicaid.
In 2018, state expenditures increased 62% from 2017 due to less people having insurance. Starting in 2019, the federal requirement to have insurance was removed. Expenditures are expected to continue to increase for both state and county indigent programs. Current estimates are an appropriation increase of about $12 million.
Source: Idaho Association of Counties
$0$5
$10$15$20$25$30$35$40$45
2001
2002
2003
2004
2005
2006
2007
2008
2009
2010
2011
2012
2013
2014
2015
2016
2017
2018
Counties State

56 Health & Human Services
Health Insurance Exchange Information 2010: Congress passed the Patient Protection and Affordable Care Act (PPACA or ACA). 2013: Governor Otter proposed and sponsored legislation to have a state-based exchange. Legislature passed H248 creating the Your Health Idaho Exchange (YHI). Enrollment began, and more than 76,000 Idahoans enrolled in a health plan through the exchange. More than half of enrollments involved a licensed agent or broker. 2018: Individual mandate for insurance was repealed, effective in 2019.
YHI maintains operations with a 1.99% assessment fee on each premium; the federal exchange fee is 3.5% of each premium. As a result, through the end of 2017, Idahoans have saved $22 million due to the lower Idaho-based assessment fee.
Enrollment by Level Level Year 1 Year 2 Year 3 Year 4 Year 5
Bronze 11,745 16,900 21,717 22,335 35,136
Silver 54,720 61,677 65,153 62,972 41,521 Gold 7,251 5,970 7,176 3,359 8,388
Platinum 1,982 1,838 N/A N/A N/A Catastrophic 500 721 380 727 949 Dental N/A N/A N/A 4,935 6,074 Total 76,198 87,106 94,426 94,328 92,068
Insurance Carrier and Plan Information Number of
Insurance Carriers Number of Plans
Offered Change From
Prior Year
2014 7 146 N/A 2015 9 198 36% 2016 9 211 7% 2017 8 225 7% 2018 7 299 33%
Source: Your Health Idaho


58 Law & Justice
11-year Appropriation Trend (in millions)
Adult Corrections: The Department of Correction is responsible for managing felony offenders in prison and on probation and parole. In addition, the Commission of Pardons and Parole supports the department's efforts to successfully reintegrate offenders into the community. Juvenile Corrections: The Department of Juvenile Corrections operates three juvenile correctional centers and works closely with county probation departments to provide accountability, community protection, and rehabilitation to justice-involved juveniles. Idaho State Police: The Idaho State Police provides law enforcement services to Idaho, including patrol, investigations, forensics, training, and support activities. Supreme Court: Idaho has a unified court system, in which all state courts are administered and supervised by the Idaho Supreme Court. The Court establishes statewide rules and policies for its operation and that of the district courts.
0
100
200
300
400
500
600
Adult Correction Juvenile Corrections
Judicial Branch Idaho State Police
General Fund

Law & Justice 59
Original Appropriations FY
2018 FY
2019 % Chg ($ in millions) By Department or Division Correction Dept. 247.1 275.7 11.5%
Management Services 15.8 22.9 45.2% State Prisons 119.7 120.7 0.8% County & Out-of-State 11.5 24.8 116.7% Corr. Alternative Placement 9.8 10.0 1.9% Community Corrections 33.7 34.1 1.4% Education & Treatment 9.7 9.9 1.9% Medical Services 43.7 49.8 14.1% Pardons and Parole Com. 3.3 3.4 2.1%
Judicial Branch 72.4 73.7 1.9% Juvenile Corrections 52.8 52.1 (1.3%) State Police 78.1 84.1 7.7%
Brand Inspection 3.1 3.1 1.1% Police, Division of State 69.7 75.8 8.7% POST Academy 4.7 4.8 2.7% Racing Commission 0.7 0.4 (34.2%)
Total 450.4 485.6 7.8%
By Fund Source General Fund 340.7 362.3 6.3% Dedicated Funds 95.1 108.2 13.8% Federal Funds 14.6 15.0 3.1% Total 450.4 485.6 7.8% Totals May Not Add Due to Rounding

60 Law & Justice
2016 State Imprisonment & Crime Rates Comparison of Idaho's Imprisonment & Crime
Rates to Adjacent States and the Nation
*Regional Ranking is from high to low with one being the highest and seven being the lowest. Note: Imprisonment rate is the final count of prisoners under the jurisdiction of state and federal correctional authorities as of December 31, 2016 with a sentence of more than one year per 100,000 residents. Source: O'Leary Morgan, Kathleen and Morgan, Scott. State Rankings 2018: A Statistical View of America.
Idaho 435 1,963 17Regional Rank* 2 7 2Montana 364 3,036 17Regional Rank 5 5 2Nevada 460 3,249 17Regional Rank 1 2 2Oregon 367 3,217 15Regional Rank 4 3 5Utah 201 3,181 14Regional Rank 7 4 6Washington 259 3,785 14Regional Rank 6 1 6Wyoming 406 2,192 25Regional Rank 3 6 1U.S. Rate 397 2,836 22
Western States
State Imprisonment
Rate per 100,000 Pop
State Crime Rate per 100,000
Pop
Number of Peace Officers
Per 10,000 Pop

Law & Justice 61
IDOC Populations: FYs 2014-2018 Community & Incarcerated
The total offender population increased by 12.5% from 21,646 at the beginning of FY 2014 to 24,355 at the end of FY 2018. The incarcerated population increased by 5.3% from 8,213 to 8,644. The community population increased by 17.0% from 13,433 to 15,711.
Source: IDOC Evaluation and Compliance

62 Natural Resources
11-Year Appropriation Trends (in millions)
Over the eleven-year period from FY 2009 to FY 2019, the Natural Resources functional area grew by $56.2 million, or 22%. Concurrently, General Fund support decreased 10.2% from $55.9 million in FY 2009 to $50.2 million in FY 2019. The Natural Resources functional area increased by $10.1 million or 3.4% from FY 2018 to FY 2019. The entire state budget increased $417.3 million or 5.3%. For FY 2019, the Natural Resources functional area accounted for 1.4% of the General Fund appropriation and 3.7% of the $8.3 billion all funds appropriation.
0
50
100
150
200
250
300
350
Environmental Quality Fish & Game
Land Board Water Resources
Parks & Recreation General Fund

Natural Resources 63
Original Appropriations FY 2018 FY 2019 % Chg ($ in millions) By Department or Division Environmental Quality $67.9 $67 (1.3%) Fish & Game 108.1 112.7 4.3% Land Board 55.5 60.1 8.3%
Investment Board 0.8 0.7 (4.1%) Lands 54.7 59.4 8.5%
Parks & Recreation 43.5 45.5 4.6% Parks & Recreation 41.2 43.2 4.8% Lava Hot Springs 2.3 2.3 0.9%
Water Resources 26.6 26.5 (0.4%) Total $301.6 $311.7 3.3%
By Fund Source General Fund 48.3 50.2 3.9% Dedicated Funds 152.4 165.4 8.5% Federal Funds 100.8 96.2 (4.6%) Total $301.6 $311.7 3.3%
Totals May Not Add Due to Rounding
The Department of Environmental Quality budget decreased 1.3% from FY 2018 to FY 2019 largely due to the removal of federal fund appropriations in excess of federal receipts. The Endowment Fund Investment Board budget decreased 4.1% from FY 2018 to FY 2019 due in part to the removal of onetime costs to hire a new investment manager. The Department of Lands budget increased 8.5% from FY 2018 to FY 2019 due, in part, to added funding through the Good Neighbor Authority allowing the state to manage federal lands.

64 Natural Resources
Idaho Land Ownership Map
Map Source: Idaho Department of Lands Idaho’s endowment lands, in blue, comprise 2.5 million acres or about 5% of Idaho’s 53 million acres. Private lands, in white, represent about 31% of Idaho’s area.

Natural Resources 65
Idaho Land Ownership Description Acres % of Total Federal Land 33,412,277 63.1%
BLM 11,836,481 22.3% USFS 20,458,276 38.6% Other 1,117,520 2.1%
State Land 2,693,260 5.1% Endowments 2,458,405 4.6% Fish & Game 187,769 0.4% Parks & Recreation 38,407 0.1% U of I Board of Regents 8,679 0.0%
Private Land 16,271,679 30.7% Tribal Land 464,077 0.9% County Land 96,311 0.2% Municipal Land 22,972 0.0% Total 52,960,576 100.0%
Idaho is the 14th largest state by total area. Idaho ranks 11th largest for land area after excluding over 500,000 acres of lakes, reservoirs, and rivers.
Forest39%
Barren, Wetland,
Urban, Tundra
5%Rangeland
41%Agricultural
15%

66 Natural Resources
County Federal %Local Gov,
State & Tribal Private Total Custer 2,937,675 93% 56,206 158,503 3,152,384Lemhi 2,648,258 91% 39,705 233,189 2,921,152Valley 2,063,164 88% 69,733 221,151 2,354,048Butte 1,229,906 86% 15,639 183,511 1,429,056Idaho 4,523,385 83% 85,983 821,160 5,430,528Blaine 1,314,806 78% 65,429 312,501 1,692,736Owyhee 3,727,155 76% 474,728 712,293 4,914,176Lincoln 584,486 76% 22,998 164,100 771,584Shoshone 1,255,653 74% 60,041 370,066 1,685,760Boise 900,540 74% 89,738 227,322 1,217,600Elmore 1,327,041 67% 120,397 522,354 1,969,792Clark 747,690 66% 80,905 300,813 1,129,408Camas 445,876 65% 27,143 214,981 688,000Adams 565,066 65% 39,769 268,573 873,408Boundary 495,219 61% 108,775 208,038 812,032Fremont 708,023 59% 116,413 370,316 1,194,752Cassia 925,150 56% 54,066 663,408 1,642,624Clearwater 841,755 53% 244,332 489,337 1,575,424Oneida 409,305 53% 13,048 345,903 768,256Bonneville 623,145 52% 59,641 513,118 1,195,904Twin Falls 640,399 52% 33,541 558,124 1,232,064Gooding 237,503 51% 20,971 209,238 467,712Jefferson 328,226 47% 29,471 343,168 700,864Bear Lake 287,994 46% 19,187 314,515 621,696Bonner 492,593 44% 178,691 440,780 1,112,064Caribou 447,779 40% 132,004 550,521 1,130,304Gem 135,009 37% 22,230 202,825 360,064Washington 345,204 37% 75,077 511,815 932,096Minidoka 174,649 36% 11,118 300,441 486,208Power 300,239 33% 106,549 492,860 899,648Teton 95,131 33% 1,850 191,275 288,256Franklin 139,255 33% 13,299 273,366 425,920Kootenai 254,276 32% 60,624 482,028 796,928Bannock 221,402 31% 108,668 382,378 712,448Bingham 392,484 29% 280,457 667,731 1,340,672Ada 196,633 29% 55,030 423,537 675,200Payette 66,136 25% 10,804 183,860 260,800Jerome 96,510 25% 10,471 276,955 383,936Madison 63,519 21% 24,212 214,093 301,824Latah 112,791 16% 43,602 532,695 689,088Benewah 48,887 10% 70,842 376,911 496,640Nez Perce 33,771 6% 96,596 413,057 543,424Canyon 20,486 5% 3,750 353,236 377,472Lewis 8,104 3% 22,886 275,634 306,624
Total 33,412,277 63% 3,276,619 16,271,680 52,960,576
Federal Land Ownership by County (in acres)

Natural Resources 67
Federal Land Ownership by State (millions of acres)
(Excludes water area) Federal
Acreage % of
Federal Total Acres
in State % of State
Nevada 55.9 9.0% 70.3 79.6% Utah 33.3 5.4% 52.7 63.1% Idaho 32.6 5.2% 52.9 61.6% Alaska 224.1 36.1% 365.5 61.3% Oregon 32.6 5.3% 61.6 53.0% Wyoming 30.2 4.9% 62.3 48.4% California 46.0 7.4% 100.2 45.9% Arizona 28.1 4.5% 72.7 38.7% Colorado 23.8 3.8% 66.5 35.9% New Mexico 27.5 4.4% 77.8 35.4% Montana 27.0 4.4% 93.3 29.0% Washington 12.2 2.0% 42.7 28.6% Other States & D.C. 48.0 7.7% 1,152.9 4.2% Total 621.5 100.0% 2,271.3 27.4%
• The table above excludes 5-10 million acres owned by the Department of Energy, Bureau of Reclamation, Agricultural Research Service, and other federal landowners.
• The federal government owns about 28% of the land in the United States, a decrease of 3.9% since 1990.
• Of all federal land ownership nationwide, the Bureau of Land Management owns 40%, the Forest Service owns 31%, the Fish and Wildlife Service owns 14%, the National Park Service owns 13%, and the Department of Defense owns 2%.
• Federal land ownership is concentrated in the West with 36.1% of all federal lands located in Alaska, 46.4% in the 11 western states and 7.7% in the remaining 38 states and the District of Columbia. “This western concentration has contributed to a higher degree of controversy over land ownership and use in that part of the country.”
Source: Federal Land Ownership: Overview and Data, March 2017, Congressional Research Service (CRS).

68 Natural Resources
Idaho Fish and Game License and Tag Sales
Number Sold Description FY 2017 FY 2018 Change
17 to 18 %
Change Resident Combination 144,808 139,279 (5,529) -3.8% Resident Sportsman Package 21,434 21,770 336 1.6% Resident Season Fishing 132,849 146,216 13,367 10.1% Resident Short Term Fishing 6,928 8,620 1,692 24.4% Resident Hunting 60,079 57,759 (2,320) -3.9%
Total Resident Licenses 366,098 373,644 7,546 2.1% Non-resident Combination 2,258 2,445 187 8.3% Non-resident Season Fishing 23,923 25,528 1,605 6.7% Non-resident Short Term Fishing 132,916 139,431 6,515 4.9% Non-resident Hunting * 44,368 47,584 3,216 7.2%
Total Nonresident Licenses 203,465 214,988 11,523 5.7% Resident Tags 247,675 237,557 (10,118) -4.1% Resident Tags -Sportsman Pack** 121,829 124,790 2,961 2.4% Non-Resident Tags 49,360 53,413 4,053 8.2% Miscellaneous Permits 214,482 230,277 15,795 7.4% Misc. Permits in Sportsman Pack** 80,754 81,975 1,221 1.5% Misc. Permit issued at $0*** 113,435 93,608 (19,827) -17.5% Access Depredation Fee * Eff 5/1/17 136,088 415,516 279,428 205.3%
Controlled Hunt Applications 218,207 221,806 3,599 1.6% Total Tags, Permits, and Misc. 1,181,830 1,458,942 277,112 23.4%
Total Licenses, Tags, & Permits 1,751,393 2,047,574 296,181 16.9%
* Includes all hunting licenses (Big Game, Small Game, Nongame, and Shooting Preserve) ** Fees were collected in the sale of the sportsman package license sale. *** includes automatically generated purchase records where no funding goes to IDFG, such as handicapped permits
From FY 2017 to FY 2018, Fish and Game resident license sales increased by 7,546 units or 2.1%, and nonresident license sales increased by 11,523 or 5.7%.
Overall sales of licenses, tags and permits were up 296,181 units or 16.9% from FY 2017 to FY 2018, primarily due to the Access Depredation Permit, which started 5/1/17. This permit was created to provide a new funding mechanism to pay for depredation programs such as crops damage reimbursement and purchase access for sportsmen through easements on public and private land.
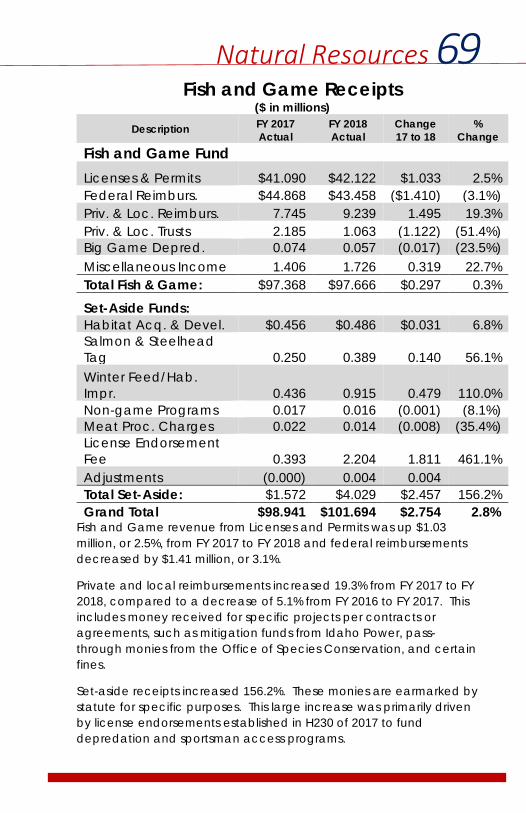
Natural Resources 69
Fish and Game Receipts ($ in millions)
Description FY 2017 Actual
FY 2018 Actual
Change 17 to 18
% Change
Fish and Game Fund Licenses & Permits $41.090 $42.122 $1.033 2.5% Federal Reimburs. $44.868 $43.458 ($1.410) (3.1%) Priv. & Loc. Reimburs. 7.745 9.239 1.495 19.3% Priv. & Loc. Trusts 2.185 1.063 (1.122) (51.4%) Big Game Depred. 0.074 0.057 (0.017) (23.5%) Miscellaneous Income 1.406 1.726 0.319 22.7% Total Fish & Game: $97.368 $97.666 $0.297 0.3%
Set-Aside Funds: Habitat Acq. & Devel. $0.456 $0.486 $0.031 6.8% Salmon & Steelhead Tag 0.250 0.389 0.140 56.1% Winter Feed/Hab. Impr. 0.436 0.915 0.479 110.0% Non-game Programs 0.017 0.016 (0.001) (8.1%) Meat Proc. Charges 0.022 0.014 (0.008) (35.4%) License Endorsement Fee 0.393 2.204 1.811 461.1% Adjustments (0.000) 0.004 0.004 Total Set-Aside: $1.572 $4.029 $2.457 156.2% Grand Total $98.941 $101.694 $2.754 2.8%
Fish and Game revenue from Licenses and Permits was up $1.03 million, or 2.5%, from FY 2017 to FY 2018 and federal reimbursements decreased by $1.41 million, or 3.1%.
Private and local reimbursements increased 19.3% from FY 2017 to FY 2018, compared to a decrease of 5.1% from FY 2016 to FY 2017. This includes money received for specific projects per contracts or agreements, such as mitigation funds from Idaho Power, pass-through monies from the Office of Species Conservation, and certain fines.
Set-aside receipts increased 156.2%. These monies are earmarked by statute for specific purposes. This large increase was primarily driven by license endorsements established in H230 of 2017 to fund depredation and sportsman access programs.

70 Natural Resources
2018 Resident Cost to Hunt (Includes licenses, tags, application and vendor fees)
Rank
Pronghorn Deer Elk Sheep Antelope
1 $34.00 MT $38.00 MT $153.00 MT $37.00 MT 2 $37.50 ID
$48.50 ID
$172.50 WY $41.00 CO
3 $41.00 CO $50.40 WA $173.00 NV $55.25 ID 4 $44.90 WA $56.00 CO $179.00 NM $57.50 WY 5 $45.50 ID $57.50 ID $179.50 OR $63.50 ID 6 $60.00 NM $77.50 WY $201.25 ID
$79.00 NM 7 $61.00 OR $81.50 OR $237.25 ID $91.50 OR 8 $62.50 WY $84.00 UT $264.00 CO $99.00 UT 9 $74.00 UT $109.00 NM $332.00 WA $113.00 NV 10 $80.23 CA $178.00 NV $350.00 AZ $140.00 AZ 11 $83.00 NV $185.00 AZ $497.37 CA $210.65 CA 12 $95.00 AZ $515.72 CA $557.00 UT NA WA
Av $59.89 $123.43 $274.66 $89.76
Highlighted costs are "Price Locked"; unhighlighted Idaho costs are 2018 prices
2018 Non-Resident Cost to Hunt
(Includes licenses, tags, application and vendor fees) Deer Elk Sheep Pronghorn
Antelope 1 $333.00 UT $458.00 UT $1,325.00 MT $230.00 MT 2 $352.00 NM $497.00 WA $1,371.50 NV $352.00 NM 3 $404.50 WY $581.50 ID $1,593.00 UT $356.50 WY 4 $406.00 CO $617.00 NM $1,644.50 OR $368.00 UT 5 $411.50 NV $671.00 CO $1,652.00 WA $406.00 CO 6 $434.30 WA $722.50 WY $1,810.08 CA $471.50 NV 7 $453.50 CA $738.00 OR $1,975.00 AZ $491.25 ID 8 $466.50 ID $825.00 AZ $2,224.00 CO $559.00 OR 9 $475.00 AZ $885.00 MT $2,308.25 ID $650.08 CA 10 $597.50 OR $1,376.50 NV $2,350.50 WY $725.00 AZ 11 $625.00 MT $1,581.73 CA $3,242.00 NM N/A WA
Av $450.80 $813.93 $1,954.17 $460.93 Source: Idaho Department of Fish and Game Survey

Natural Resources 71
2018 Resident Cost to Fish R
ank
State License 1 Day 2 Day 3 Day
1 New Mexico $29.00 $16.00 2 Washington $29.50 $11.35 $15.75 $19.05
3 Idaho $30.75 $11.50 $16.50 $21.50 4 Montana $31.00 $15.00 5 Utah $34.00 $16.00 6 Idaho $35.50 $13.50 $19.50 $25.50 7 Colorado $36.00 $9.00 $14.00 $19.00 8 Arizona $37.00 $15.00 $30.00 9 Nevada $40.00 $9.00 $12.00 $15.00
10 Oregon $41.00 $21.00 $38.00 11 Wyoming $42.50 $6.00 $12.00 $18.00 12 California $48.34 $15.69 $24.33
Average $36.22 $12.80 $19.71 $19.15
Highlighted costs are "Price Locked"; unhighlighted Idaho costs are 2018 prices
2018 Non-Resident Cost to Fish
Rank
State License 1 Day 2 Day 3 Day
1 Arizona $55.00 $20.00 $40.00 2 New Mexico $60.00 $16.00 3 Colorado $66.00 $9.00 $14.00 $19.00 4 Utah $75.00 $24.00 5 Nevada $80.00 $18.00 $25.00 $32.00 6 Washington $84.50 $20.15 $28.95 $35.55 7 Oregon $103.50 $21.00 $38.00 $54.50 8 Idaho $108.25 $12.75 $18.75 $24.75 9 Montana $111.00 $50.00
10 Wyoming $117.50 $14.00 $28.00 $42.00 11 California $130.42 $15.69 $24.33
Average $90.11 $16.29 $29.67 $33.11 Source: Idaho Department of Fish and Game Survey

72 Natural Resources
State Park Self-Support Index and Visitor Spending
State Park FY 2018
Park Operating Expend.
FY 2018 Park
Revenues
Self-Support Percent
Total Visitors CY 2017
% Change vs 2016
Total Visitor Spending CY 2016
Bear Lake $333,096 $307,298 92.3% 175,160 7.6% $3,451,000 Bruneau Dunes 375,229 355,225 94.7% 101,290 16.4% 2,382,000
City of Rocks /Castle Rocks 850,961 882,093 103.7% 511,639 18.7% 11,237,000
CdA Lake Pkwy 90,380 19,007 21.0% 455,377 87.4% 2,709,000
Dworshak 380,018 328,746 86.5% 95,702 -1.2% 2,967,000 Eagle Island 338,715 269,461 79.6% 345,917 -15.3% 5,262,000 Farragut 979,804 1,253,766 128.0% 507,362 0.2% 12,814,000 Harriman 546,555 498,331 91.2% 88,243 -25.5% 9,280,000 Hells Gate 535,971 555,205 103.6% 276,319 1.5% 6,941,000 Henrys Lake 158,910 320,659 201.8% 138,158 0.1% 4,246,000 Heyburn 695,959 1,005,474 144.5% 195,559 -8.0% 6,197,000 Lake Cascade 682,560 732,673 107.3% 662,918 63.0% 11,048,000
Lake Walcott 211,662 196,482 92.8% 71,644 -2.5% 1,029,000 Land of the Yankee Fork 313,557 38,751 12.4% 42,191 0.2% 959,000
Lucky Peak 488,655 401,521 82.2% 831,361 13.3% 12,490,000 Massacre Rocks 252,407 122,613 48.6% 38,936 1.4% 735,000
McCroskey 53,574 14,834 27.7% n/a n/a n/a Mesa Falls 38,643 40,340 104.4% 174,592 -0.5% n/a Old Mission 273,392 102,658 37.5% 86,729 -4.6% 771,000 Ponderosa 700,364 928,593 132.6% 462,752 6.5% 15,911,000 Priest Lake 656,500 863,641 131.6% 184,178 3.7% 5,302,000 Round Lake 231,681 191,832 82.8% 100,115 -3.9% 2,102,000 Thousand Springs 278,652 174,572 62.6% 185,726 19.5% 1,459,000
Three Island 393,373 440,913 112.1% 133,353 -0.6% 4,231,000 Trail of the Coeur d'Alenes
106,273 144,698 136.2% 53,619 -4.2% 566,000
Winchester 237,549 184,553 77.7% 134,356 3.3% 2,101,000
Subtotal $10,204,438
$10,373,939 101.7% 6,053,19
6 11.5% $ 126,190,000
Capital Repair/ Maintenance
2,782,194
Passport Revenue
2,276,400
Total $12,986,632
$12,650,339 97.4%
Total Visitor Spending is calculated using the “Economic Impact and Importance of State Parks in Idaho: a Park-Level Study” created by Boise State University, January 2018. This analysis did not include McCroskey or Mesa Falls Parks.

Natural Resources 73
Parks & Recreation Facts and Figures 1. State Park Revenue Details - FY18 % Chg Non-Resident Visitors - 29% 1,758,872 13%
Resident Visitors - 71% 4,294,324 8%
Dedicated Fund Revenue $ 10,373,900 3% Passport Revenue (Gross of fees & tax) $ 2,276,400 20%
Total Expenditures (includes Capital) $ 12,986,633 16%
Self-Support Percent 97.4%
General Fund Support $ 2,619,800 0%
Capital Repair and Maintenance $ 2,782,194 22%
2. Recreation Users by Registration Type - CY17 Boat Registrations 85,180 -4%
Snowmobile Registrations 39,491 -3%
Motorbikes, ATVs, UTVs Registrations 157,393 -1%
Recreational Vehicle Registrations 114,490 5%
Cross-country Ski Permits 1,916 -25%
3. Recreational Funds to Public Agencies - FY18 Recreational Vehicle Fund Grants $ 3,922,797 20% Waterway Improvement Fund Grants $ 1,207,567 6%
State and Federal Trails Programs $ 2,926,782 45%
County Boating Programs $ 2,381,812 9%
Federal Boating Safety Grants $ 630,000 10%
County Snow Grooming Programs $ 1,014,628 8%
Trout License Plate Grants* $ -
4. Park Land and Facilities - FY18 Number of State Parks/Trails 30 Number of Acres in the Park System 60,167 Number of Structures Maintained 556
*IDPR allows these funds to accumulate over a few years to increase the scope of projects rather than providing small grants every year

74 Natural Resources
Idaho households had the highest average per capita domestic water use in the nation at 184 gallons per person, per day. The 2015 statewide average was 102 gallons higher per person per day than the national average. Domestic per capita water use was at or below the national average in only five counties: Bear Lake, Bingham, Bonner, Boundary, and Gem counties.
Water Surface Area 880 square miles or 1.1% of the stateNumber of Lakes More than 2,000Largest Lake Pend Oreille - 158 square milesDeepest Lake Pend Oreille - more than 1,100 feetMiles Streams & Rivers 93,000 milesLongest River Snake River - 779 milesHighest Waterfall Big Fiddler Crk, S Fork Boise River - 600 ftAnnual Precipitation Varies from 10 to 50 inchesAnnual Inflows/Outflows About 37 million/75 million acre-feetReservoir Storage 12,384,000 acre-feet
Idaho Water Facts
Used in Idaho in 2015 Acre-Feet/Yr MG/D PercentIrrigation 17,108,010 15,273.0 86.3%Aquaculture 2,201,089 1,965.0 11.1%Public Supply 309,161 276.0 1.6%Domestic Self-Supply 78,410 70.0 0.4%Industrial and Mining 79,284 70.8 0.4%Livestock 57,128 51.0 0.3%TOTAL WATER USE 19,833,082 17,705.8 100.0%
Water WithdrawalsEstimated Use of Water in the United States in 2015
Source: USGS Idaho Water Use, 2015 http://www.usgs.gov
1 acre 43,560 square feet (208.71 ft x 208.71 ft)1 acre-foot 325,850 gallons
646,315 gallons per day or1.9835 acre-feet per day, 724 AF/year
Ex @ $.01/100 gal $32.59 per acre foot or $23,595 per cfs/yrSource: Idaho Departm ent of Water Resources
Water Conversion Factors
1 cubic ft per sec
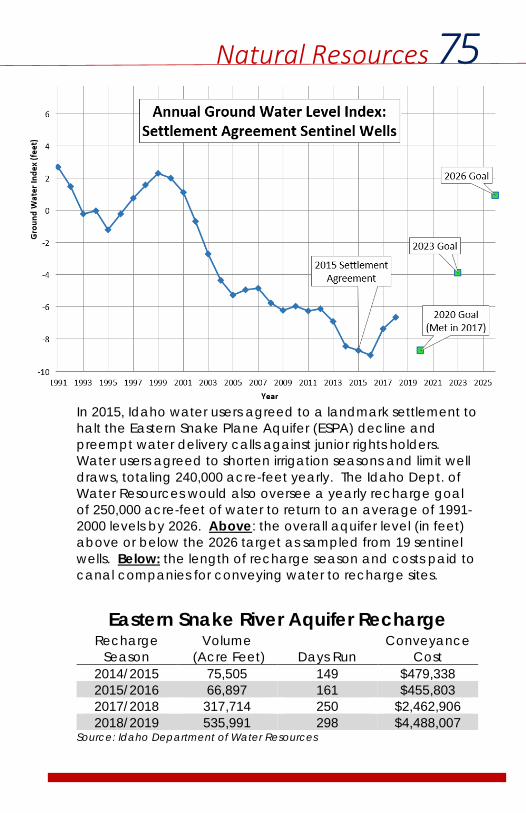
Natural Resources 75
In 2015, Idaho water users agreed to a landmark settlement to halt the Eastern Snake Plane Aquifer (ESPA) decline and preempt water delivery calls against junior rights holders. Water users agreed to shorten irrigation seasons and limit well draws, totaling 240,000 acre-feet yearly. The Idaho Dept. of Water Resources would also oversee a yearly recharge goal of 250,000 acre-feet of water to return to an average of 1991-2000 levels by 2026. Above: the overall aquifer level (in feet) above or below the 2026 target as sampled from 19 sentinel wells. Below: the length of recharge season and costs paid to canal companies for conveying water to recharge sites.
Eastern Snake River Aquifer Recharge
Recharge Season
Volume (Acre Feet) Days Run
Conveyance Cost
2014/2015 75,505 149 $479,338 2015/2016 66,897 161 $455,803 2017/2018 317,714 250 $2,462,906 2018/2019 535,991 298 $4,488,007
Source: Idaho Department of Water Resources

76 Natural Resources
Excluding Fish and Game (IDFG), natural resource agencies use the six-region system for administration. IDFG splits out Lemhi and Custer counties to form a seventh region.
Natural Resource Administrative
Regions
1. Panhandle2. Clearwater3. Southwest4. Magic Valley5. Southeast6. Upper Snake7. Salmon (IDFG)

Economic Development 77
Annual Original Appropriations FY 2018 FY 2019 % Chg
(in millions) By Department or Division Agriculture $48.1 $48.1 0.2%
Agriculture Department 44.9 44.8 (0.3%) Soil & Water Conservation Com. 3.1 3.3 6.4%
Commerce Department 38.8 42.3 9.0% Finance 8.4 8.6 3.5% Industrial Commission 16.9 17.5 3.7% Insurance, Department 9.7 10.2 5.4% Labor Department 97.8 88.3 (9.7%) Public Utilities Commission 6.6 6.7 1.7% Self-Governing Agencies 102.5 92.6 (9.6%)
Building Safety, Division of 14.0 14.3 2.2% Hispanic Commission 0.3 0.3 6.1% Historical Society 8.1 7.5 (6.5%) Libraries, Commission of 5.8 5.9 2.6% Lottery, State 6.2 6.1 (2.1%) Medical Boards 6.7 6.5 (4.1%) Public Defense Commission 5.8 5.8 (0.2%) Regulatory Boards 8.1 9.0 11.1% State Appellate Pub. Defend. 2.9 2.9 2.0% Veterans Services 44.6 34.2 (23.2%)
Transportation Department 665.2 700.8 5.4% Total $993.8 $1,015.2 2.1%
By Fund Source General Fund $39.0 $39.5 1.4% Dedicated Funds 518.8 543.2 4.7% Federal Funds 436.1 432.4 (0.8%) Total $993.8 $1,015.2 2.1%
Totals May Not Add Due to Rounding

78 Economic Development
Legislation with Fiscal Impact Idaho Transportation Department
H547, 2014: Provides $4.7 million annually from cigarette tax revenue for the purpose of paying the state match required for federal Grant Anticipation Revenue Vehicle (GARVEE) debt obligations. H312, 2015: Increased registration fees by $21 for personal vehicles and $25 for commercial vehicles. Increased the motor fuels tax from 25 cents to 32 cents per gallon. These collections are subject to a 60/40 split between ITD’s Highway Account and Local Highway jurisdictions to be used exclusively for maintenance of roads and bridges. The bill also created the Strategic Initiatives Program (SIP) and the General Fund Surplus Eliminator which provides any unrecognized General Fund monies to be split 50/50 between the Budget Stabilization Fund and the SIP. This was due to sunset May 31, 2017, but was extended two years pursuant to S1206 during the 2017 Legislative session. S1206, 2017: Approved bonding authority for the issuance of GARVEE bonds up to $300 million to finance new construction of highway transportation projects listed in Section 40-315, Idaho Code. Extended the General Fund Surplus Eliminator for two years with a sunset date of May 31, 2019. There is a still a 50/50 split between the Budget Stabilization Fund and the SIP with a 60/40 split of the SIP going to ITD and the local units of government, respectively. The Transportation Expansion and Congestion Mitigation Program Fund was created, funded by 1% of sales tax distributed annually and is an apportionment of the Cigarette Tax distribution. H599, 2018: Repealed the law that allowed courts to report unpaid citations and ITD to suspend a license for failure to appear or pay fines. This could reduce the amount of revenue ITD will receive.
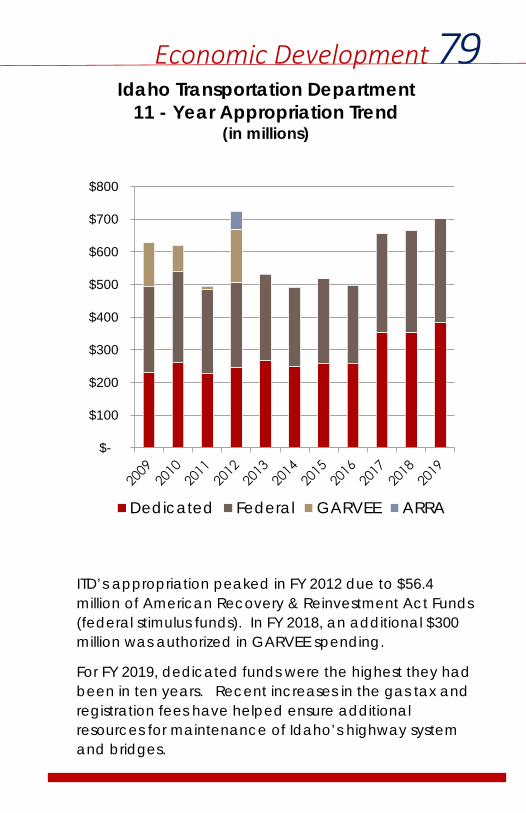
Economic Development 79
Idaho Transportation Department 11 - Year Appropriation Trend
(in millions)
ITD’s appropriation peaked in FY 2012 due to $56.4 million of American Recovery & Reinvestment Act Funds (federal stimulus funds). In FY 2018, an additional $300 million was authorized in GARVEE spending.
For FY 2019, dedicated funds were the highest they had been in ten years. Recent increases in the gas tax and registration fees have helped ensure additional resources for maintenance of Idaho’s highway system and bridges.
$-
$100
$200
$300
$400
$500
$600
$700
$800
Dedicated Federal GARVEE ARRA

80 Economic Development
Idaho Transportation Department FY 2019 Original Appropriation
$700,814,600
Totals May Not Add Due to Rounding
$28.5
$37.6
$194.2
$3.6
$431.6
$5.4
$0 $400
Administration
Motor Vehicles
Hwy Operations
Capital Facilities
Contract Construction
Aeronautics
Millions
Personnel19%
Operating15%
Capital Outlay
63%
Trustee & Benefit
3%

Economic Development 81
Idaho Transportation Trend Indicators
Trend Indicator
Actual Numbers During 2017
Percent Total 10 Year Growth
Avg Annual Growth for 2007 - 2017
Annual Vehicle Miles Traveled
17,300,703,167 9.2% 0.9%
Passenger Cars Registered
1,372,988 9.4% 0.9%
Drivers Licenses in Force
1,208,319 17.6% 1.8%
Population 1,716,943 67.7% 6.8% Gallons of Highway Fuel Consumed*
1,023,172,405 7.4% 0.7%
*Includes gasoline, diesel, and other highway fuels.
Idaho’s gas tax is 32 cents per gallon; federal fuel tax is 18.4 cents per gallon and was last increased in 1993.
There is also a 1 cent per gallon transfer fee that is used to fund the Petroleum Clean Water Trust Fund.
Not all fuel uses are taxed, including stationary engines, off-road equipment, furnaces, and commercial motor boats. Any person or business purchasing 50 gallons or more of taxable fuel for a non-taxed purpose can claim a refund from the Tax Commission.
Annual registration fees for passenger vehicles range from $45 to $69, depending on the age of the vehicle. An EMS Service fee of $1.25 is added to all registrations. Vehicles registered in Ada County require an additional fee ranging from $24 to $40. County administrative charges may also apply.
The statewide motorcycle registration fee is $19, plus an additional $8 in Ada County.

82 Economic Development
FY 2018 State & Local Transportation Revenues (in $ millions)
Description State a County
b Hwy Dist Cities Total
Federal Receipts Administered by ITD 294.7 8.8 15.3 14.6 333.4
Secure Rural Schools f 4.8 3.4 0.0 8.2
Other Federal Receipts f 1.0 1.5 5.3 7.8
Hwy Distribution Acct e 208.2 44.6 49.4 40.3 342.5
User Funds to State Hwy Account 66.6 66.6
HB 312 Revenue c, e 65.4 14.0 15.5 12.6 107.5 Other State Sources 1.5 5.9 7.5 14.9 Property Tax 21.9 82.3 23.7 127.9 Other Local Sources 43.5 6.1 55.6 105.2 Transportation Expansion and Congestion Mitigation (TECM) g
22.7 22.7
Subtotal 657.6 140.1 179.4 159.6 1,136.7 % of Subtotal 57.9% 12.3% 15.8% 14.0% 100.0%
Strategic Initiatives Program Fund d 36.2 24.1 60.3
% of SIPF fund 60.0% 40.0% 100.0% Revenues reported are for surface transportation programs, only. Does not include revenues for non-surface transportation (aeronautics, behavioral safety, transit, etc.). a Amounts to the state reflect actual FY 2017 receipts to the State Highway Fund. b Includes only counties that maintain roads and streets. c H312 (2015) raised fuel taxes and registration fees effective July 1, 2015. d Pursuant to S1206 (2017), 60% to ITD and 40% to local units of gov. Allocations among locals is undetermined as of July 30th, 2018. e Local Entities information from actual FY 2017 distribution. f Local Entities information obtained from FY16 Annual Road and Street Financial Reports. g Revenue from 1% of Sales Tax Revenue after revenue sharing with locals and Cigarette Tax distribution.

Economic Development 83
GARVEE and Transportation Comparison The Grant Anticipation Revenue Vehicle (GARVEE) Transportation Program is a debt-financing mechanism that permits states to accelerate highway construction projects by selling bonds. In Idaho’s case, the bonds are secured solely by future federal funds. However, the bonds are paid back with a combination of federal appropriations and state matching funds.
The 2017 Legislature approved an additional $300 million in bonding authority to advance infrastructure projects selected by the Idaho Transportation Board. As of July 2018, no additional bonds have been issued. Once issued, the additional bonding amount will add approximately $24 million annually to the debt service amount.
Debt service on the total amount bonded to date of $857 million is approximately $56 million per year ($52 million federal share and $4 million state matching funds). The overall weighted average cost of debt is now just under 4%. The current outstanding bonds are scheduled to be paid off in FY 2032.
Surrounding State Comparison NOTES: -Registration fees are the cost to register a 2007 Toyota Camry in the county seat of each state's most populous county. -Fuel Tax Source: American Petroleum Institute, 2018
-Some surrounding states have additional funding sources such as general funds, extraction taxes, local option taxes, gross-vehicle-
weight fees, rental car taxes, toll taxes, royalties, severance taxes, etc.

84 Economic Development
FY 2017 Distribution of Lottery Revenues
Total = $240,814,100
State lottery revenues are derived from the sale of lottery tickets and deposited into the State Lottery Fund. Funds are used to pay agency administrative costs, as well as other expenditures under continuous appropriation, including prizes, retailer commissions, advertising and promotional costs, and gaming supplier vendor fees.
Per Section 67-7434, Idaho Code, a lottery dividend must be paid annually from net income of lottery ticket sales. Net income is distributed as follows: one-fourth to the Bond Levy Equalization Fund; three-eighths to the Permanent Building Fund; and three-eighths to the School District Building Fund. In FY 2017, the total dividend was $48,500,000, which was distributed in FY 2018. The FY 2018 School District Building appropriation was set at $18,075,000, resulting in a cash balance of $112,500 carried forward into FY 2019.
Prizes$160.3M
Commissions$14.1M
Other Costs$1.8M
Vendor/Ticket Costs$9.8M
Advertising$3.4M
Salaries and
Benefits$3.M
Permanent Building
Fund$18.2M
Public Schools$16.8M
Charter Schools$1.3M
Carryover$.1M
Bond Levy Equalization
$12.1MDividend$48.5M


86 General Government
11-Year Appropriation Trends Selected Agencies (in millions)
In FY 2018, in conjunction with the purchase of the Hewlett Packard Campus, H315 authorized the Department of Administration to authorize the Division of Public Works to enter into lease with existing tenants at the HP Campus. An increase in appropriation of $5.5 million was given to the department for campus maintenance, which was to be paid through lease fees collected from tenants other than state agencies.
0
50
100
150
200
250
300
350
400
450
500
Administration Revenue & Taxation
Elected Officials All Other
General Fund

General Government 87
Original Appropriations FY
2018 FY
2019 % Chg By Department or Division ($ in millions)
Administration, Dept. $114.0 $115.7 1.5% Administration, Dept. 27.9 23.7 -15.1%
Capitol Commission 2.3 2.3 0.0% Bond Payments 12.3 11.9 -3.5% Permanent Building Fund 71.4 77.8 8.9%
Attorney General 24.7 25.3 2.4% Controller, State 16.2 18.8 16.5% Governor, Office of the 173.2 201.1 16.1% Aging, Commission on 12.6 13.6 8%
Arts, Commission on the 2.0 2.0 1.7% Blind and Visually Impaired 5.0 5.0 0.0% Drug Policy, Office of 4.9 4.8 -1.1% Energy Resource, Office of 1.3 1.3 0.6% Financial Management, Div. 1.9 2.0 1.6% Governor, Executive Office 2.3 2.4 3.4% Human Resources, Div. 2.3 2.2 -4.4% Liquor Division 20.2 21.4 6.2% Military Division 92.1 105.0 14.0% Public Empl. Retire. Sys. 7.9 8.1 2.1% Species Conservation 14.1 14.2 0.8% STEM Action Center 6.6 4.7 -29.0% Workforce Dev. Council** 8.6 N/A Info. Technology, Office of** 5.9 N/A
Legislative Branch 15.9 15.7 -1.5% Lieutenant Governor .2 .2 2.7% Revenue & Taxation, Dept. 44.0 44.4 0.8% Secretary of State 3.2 5.0 54.3% Treasurer, State 6.9 4.2 -38.5% Treasurer, State 4.2 4.2 0.8%
Idaho Millennium Fund 2.7 -100.0% Total $398.3 $430.4 8.1% By Fund Source ($ in millions)
General Fund $117.7 $120.5 2.4% Dedicated Funds 170.6 186.1 9.0% Federal Funds 109.9 123.9 12.7% Total $398.3 $430.4 8.1% *Totals May Not Sum Due to Rounding ** Agencies created in FY 2019

88 General Government
Permanent Building Fund
FY 2019 Revenue Estimates Revenues (in millions) FY 16 FY 17 FY 18 FY 19 Est Income Tax $7.8 M $7.6 M $7.9 M $8.0 M Cigarette Tax $5.0 M $5.0 M $5.0 M $5.0 M Beer Tax $1.4 M $1.4 M $1.4 M $1.4 M Sales Tax $5.0 M $5.0 M $5.0 M $5.0 M Lottery $17.0 M $18.6 M $18.2 M $20.1 M Budget Stab. Interest $.2 M $2.2 M $4.8 M $8.4 M
Other Income $.2 M $.3 M $.6 M $1.4 M General Fund Transfer N/A N/A $45.3 M $44.1 M
GRAND TOTAL $36.6 M $40.1 M $88.2 M $93.5 M
FY 2019 Original Appropriation Public Works Operating Budget $2,695,200 Bond Payments $6,874,000 New Alteration and Repair Projects $49,564,900 ADA Compliance Projects $1,300,000 Asbestos Abatement Projects $200,000 Capitol Mall Maintenance $250,000 IDOC Waste Water Lagoon Upgrade $1,220,000 CSI Canyon Building Remodel $830,000 Div. of Military's MWR Facility $250,000 New Pub. Safety Communications Site $700,000 IDOC Community Reentry Center $9,114,200 CWI Nampa Health Sciences Building $10,000,000 Nuclear Seed Potato Facility $3,000,000 IDOC Facility Expansions $1,342,900
Total $87,341,200

General Government 89
FY 2017 Distribution of Liquor Earnings
Total = $73,297,000
There is a 2% surcharge on sales in liquor stores, directed to the Drug Court, Mental Health Court, and Family Court Services Fund. This amount, including a fixed statutory distribution of $680,000 made annually to the fund, is up 5.4% from the FY 2016 distribution. Fifty-percent of annual net profits are distributed to the General Fund, less a total of $5,650,000 in statutory distributions to the Substance Abuse Treatment Fund, Community Colleges, Public Schools, Cooperative Welfare Fund, and Court Supervision Fund. The other 50% of net profits are split 40% to counties based on liquor sales, and 60% to cities based on number of liquor stores or population (for cities without liquor stores).
General Fund
$29,060,000 39.6%
Public Schools
$1,200,000 1.6%
Community Colleges$600,000
0.8%
Counties$13,884,000
18.9%
Substance Abuse Treatment$2,080,000
2.8%
Cooperative Welfare Fund
$650,000 0.9%
Cities$20,826,000
28.4%
Court Services$4,557,000
6.2%
Court Supervision Fund
$440,000 0.6%

90 General Government
PERSI As of June 30, 2017, 783 public employers in Idaho participated in PERSI, for a system-wide total of 128,210 individual members and beneficiaries. In FY 2017, the gross return on investments for the PERSI Base Plan was 12.7%. The funded ratio for FY 2017 was 89.6% and the amortization period was estimated to be 16.2 years, which is less than the 25 year maximum allowed by statute.
Actuarial analysis for the most recently closed fiscal year is presented to PERSI’s Board of Trustees annually at its October meeting. As of June 29, 2018, PERSI was valued at $17.5 billion.
Membership and Employer Types
Investment Returns and Funded Ratios
45,468
12,669
70,073
0
10,000
20,000
30,000
40,000
50,000
60,000
70,000
80,000
Active Retiree Inactive
20%
5%
21%13%
41%
City
County
School
State
Other
20.0%
-4.2%-16%
12% 20.7%1.6% 9.1%
17.2%3.0% 1.9%
12.7%
106%93%
73% 79%90%
85%
87% 94% 90%
86%
90%
-20%0%
20%40%60%80%
100%120%
Investment Returns Funded Ratio

General Government 91
Idaho Millennium Fund (in millions)
Idaho Millennium Permanent Fund Endowment Fund
Fiscal Year Receipts
Approp. and
Transfers
Ending Market Value Receipts
Approp. and
Transfers
Ending Market Value
2011 $4.9 ($8.4) $74.6 $19.6 ($2.4) $130.2
2012 $5.0 ($70.9) $14.2 $19.9 ($4.0) $147.4
2013 $5.0 ($3.7) $15.5 $19.9 ($5.5) $179.7
2014 $5.5 ($.8) $20.3 $22.0 ($6.4) $227.0
2015 $4.8 ($.6) $25.4 $19.3 ($7.9) $246.1
2016 $5.1 ($.8) $29.8 $20.2 ($9.8) $260.2
2017 $4.6 ($1.0) $33.6 $18.4 ($11.5) $301.4 2018 $4.7 ($1.3) $37.5 $18.9 ($11.8) $337.8 2019 $5.0 ($1.5) $41.4 $18.9 ($13.6) $368.3 2020* $5.0 ($1.7) $45.1 $20.0 ($15.8) $387.0 *Estimates
• The Idaho Millennium Fund consists of three funds:
(1) Permanent Endowment Fund: Receives 80% of the master settlement agreement with tobacco companies. Through specific statutory requirement, 5% of the average fair market value is distributed to the Income Fund.
(2) Millennium Fund: Receives 20% of the master settlement agreement with tobacco companies. Through specific statutory requirement, 5% of the average fair market value is distributed to the Income Fund.
(3) Millennium Income Fund: Legislature appropriates funds from this account.
• The Legislature appropriates funds to state agencies and qualified private sector organizations. Monies are typically appropriated for tobacco cessation, substance abuse prevention, and treatment efforts.
• In 2016, Idaho ranked 39 for adults who smoke at 14.5%; the national average was 17.1%.

92 State Facts & Demographics
Idaho Facts
Geography Total Area: 83,569 square miles (14th in area size) Lowest Elevation: 710 feet, Snake River at Lewiston
Highest Elevation:
12,662 feet, Mt. Borah in Custer County
Length: 164 / 479 miles at shortest / longest Width: 45 / 305 miles at narrowest / widest % of Fed. Land: 63.1% % of State Land: 5.1% State Symbols Amphibian Idaho Giant Salamander
(Dicamptodon aterrimus) Bird Mountain Bluebird (Sialia arctica) Fish Cutthroat Trout (Oncorhynchus clarkii) Flower Syringa (Philadelphus lewisii) Dance Square Dance Fossil Hagerman Horse Fruit Huckleberry Gem Idaho Star Garnet Horse Appaloosa Insect Monarch Butterfly (Danaus plexippus) Motto Esto Perpetua ("Let it be perpetual") Nickname The Gem State Raptor Peregrine Falcon (Falco peregrinus) Song "Here We Have Idaho" Tree Western White Pine (Pinus monticola) Vegetable Potato Cities and Counties Number of Cities 200 Incorporated Cities
Largest Boise, Ada County, pop. 226,570 Smallest Warm River, Fremont County, pop. 3
# of Counties 44 Largest Ada, population 456,849

State Facts & Demographics 93
County Population
2017 County Seat 2017 License Prefix
Ada 456,849 Boise 226,570 1A Adams 4,147 Council 865 2A Bannock 85,269 Pocatello 55,193 1B Bear Lake 6,028 Paris 517 2B Benewah 9,184 St. Maries 2,443 3B Bingham 45,927 Blackfoot 11,922 4B Blaine 22,024 Hailey 8,282 5B Boise 7,290 Idaho City 452 6B Bonner 43,560 Sandpoint 8,390 7B Bonneville 114,595 Idaho Falls 61,076 8B Boundary 11,922 Bonners Ferry 2,603 9B Butte 2,602 Arco 880 10B Camas 1,102 Fairfield 402 1C Canyon 216,699 Caldwell 54,660 2C Caribou 7,034 Soda Springs 3,038 3C Cassia 23,664 Burley 10,474 4C Clark 873 Dubois 602 5C Clearwater 8,546 Orofino 3,035 6C Custer 4,172 Challis 1,062 7C Elmore 26,823 Mountain Home 14,224 E Franklin 13,564 Preston 5391 1F Fremont 13,094 St. Anthony 3,549 2F Gem 17,379 Emmett 6,829 1G Gooding 15,124 Gooding 3,452 2G Idaho 16,369 Grangeville 3,166 I Jefferson 28,446 Rigby 4,062 1J Jerome 23,627 Jerome 11,636 2J Kootenai 157,637 Coeur d'Alene 50,665 K Latah 39,333 Moscow 25,146 1L Lemhi 7,875 Salmon 3,108 2L Lewis 3,887 Nezperce 476 3L Lincoln 5,318 Shoshone 1,502 4L Madison 39,141 Rexburg 28,337 1M Minidoka 20,729 Rupert 5,814 2M Nez Perce 40,385 Lewiston 32,820 N Oneida 4,427 Malad 2,104 1O Owyhee 11,628 Murphy 101 2O Payette 23,215 Payette 7,434 1P Power 7,600 American Falls 4,280 2P Shoshone 12,542 Wallace 761 S Teton 11,381 Driggs 1,805 1T Twin Falls 85,124 Twin Falls 49,202 2T Valley 10,687 Cascade 981 V Washington 10,121 Weiser 5,365 W Total 1,716,943 726,693 42%

94 State Facts & Demographics
Idaho’s 20 Largest Cities City
2010 Census
Pop Rank 2017 Pop.
Pop Rank Change % Change
Boise 205,671 1 226,570 1 20,899 10.2% Meridian 75,092 3 99,926 2 24,834 33.1% Nampa 81,557 2 93,590 3 12,033 14.8% Idaho Falls 56,813 4 61,076 4 4,263 7.5% Pocatello 54,255 5 55,193 5 938 1.7% Caldwell 46,237 6 54,660 6 8,423 18.2% Coeur d'Alene 44,137 7 50,665 7 6,528 14.8% Twin Falls 44,125 8 49,202 8 5,077 11.5% Post Falls 27,574 10 33,290 9 5,716 20.7% Lewiston 31,894 9 32,820 10 926 2.9% Rexburg 25,484 11 28,337 11 2,853 11.2% Eagle 19,908 13 26,089 12 6,181 31.0% Moscow 23,800 12 25,146 13 1,346 5.7% Kuna 15,210 14 19,200 14 3,990 26.2% Ammon 13,816 17 15,540 15 1,724 12.5% Chubbuck 13,922 16 14,869 16 947 6.8% Hayden 13,294 18 14,693 17 1,399 10.5% Mtn. Home 14,206 15 14,224 18 18 0.1% Blackfoot 11,899 19 11,922 19 23 0.2% Garden City 10,972 20 11,890 20 918 8.4% 938,902, or 55%, of Idaho's total population live in the 20 largest cities
Northwest Population Highlights Northwest States 2010 2017 Change
% Change
Washington 6,724,540 7,405,743 681,203 10.1% Oregon 3,831,074 4,142,776 311,702 8.1% Utah 2,763,885 3,101,833 337,948 12.2% Nevada 2,700,551 2,998,039 297,488 11.0% Idaho 1,567,582 1,716,943 149,361 9.5% Montana 989,415 1,050,493 61,078 6.2% Wyoming 563,626 579,315 15,689 2.8% Source: US Census Bureau

State Facts & Demographics 95
Senate 35 Members 6 Democrat (17%) 9 Female (26%) 29 Republican (83%) 26 Male (74%) President Pro Tempore: Brent Hill, R-Rexburg Average Tenure in the Senate: 4.9 terms Longest Serving Senator: Shawn Keough, R-Sandpoint, 12 terms
House of Representatives 70 Members 12 Democrat (17%) 22 Female (31%) 58 Republican (83%) 48 Male (69%) Speaker: Scott Bedke, R-Oakley Average Tenure in the House: 4.4 terms Longest Serving Representative: Maxine Bell, R-Jerome, 16 terms
Legislation 2018 5-Yr Avg Bills Drafted 799 799 Bills Introduced 561 545 Bills Passed Both Houses 355 357 Bills Enacted 353 355 Length of Session (Days) 80 81
The Legislative Council oversees the management responsibilities and permanent staff of the Legislature. The Council consists of the President Pro Tempore of the Senate, the Speaker of the House of Representatives, the majority and minority leaders of each house, and four senators and four representatives (two from each party) appointed by the parties of the Senate and House. The Legislative Council meets twice annually, once in the spring and once in the fall. Legislative Council Members for 2018:
Senate House Brent Hill Scott Bedke
Chuck Winder Mike Moyle Steve Bair Clark Kauffman
Steve Vick Jason Monks Michelle Stennett Mathew Erpelding
Cherie Buckner-Webb Phylis King Grant Burgoyne Sally Toone

96 State Facts & Demographics
Commodities Idaho Rank
% of US Production Unit
Potatoes 1 32.8 131,325,000 cwt Australian Winter Peas 1 43.2 54,000 cwt Barley 1 34.1 48,450,000 bu Peppermint Oil 2 29.1 1,680,000 lb Sugarbeets 2 18.4 6,507,000 ton Wrinkled Seed Peas 2 30.3 108,000 cwt Alfalfa Hay 2 7.7 4,240,000 ton Hops 2 13.2 13,759,200 lb Spring Wheat 4 8.5 35,260,000 bu Lentils 4 4.2 315,000 cwt Dry Edible Beans 5 8 2,873,000 cwt Dry Edible Peas 6 1.7 234,000 cwt Canola 7 1.1 34,565,000 lb Winter Wheat 7 4.2 53,600,000 bu All Hay 8 3.9 5,128,000 ton
Livestock/ Products Idaho Rank
% of US Production Unit
Foodsize Trout 1 45.7 49,968 dollars Honey 8 2.8 4,180,000 lb Total Cheese 3 7.6 958,687,000 lb Milk Production 4 6.8 14,627 million lb Milk Cows 4 6.4 600,000 head All Sheep / Lambs 7 4.4 230,000 head Wool 7 6.5 1,600,000 lb Cattle & Calves 12 2.5 2,400,000 head Source: USDA, NASS Idaho Facts and Figures 2018
https://www.nass.usda.gov/Stastistics_by_State/Idaho/index.php

State Facts & Demographics 97
RANKING IDAHO VALUE US NW* AGRICULTURE Number of Farms (2016) 24,300 34 4 Ave Acres Per Farm (2016) 486 14 5
Farm Income: Crops (2016) $2,809,522,000 21 3
Farm Income: Livestock (2016) $4,300,405,000 12 1
Farm Income: Gov't Pymts (2016) $158,281,000 25 3
Acres Planted (2017) 4,195,000 21 2 Acres Harvested (2017) 4,064,000 22 2
POPULATION ESTIMATES Population (2017) 1,716,943 39 5 Percent Change (2016 - 2017) 2.2% 1 1
Persons Per Square Mile (2017) 20.8 44 5
% White Population (2016) 93.3% 5 1
% Hispanic Pop (2016) 12.3% 16 5 2030 Pop (projected) 1,969,624 36 5 % Idaho Born living in Idaho (2016) 51.3% 41 4
Net Domestic Migration (2016 - 2017) 24,597 12 5
Population per U.S. House Seat (2018) 858,472 4 2
Population per State Legislator (2017) 16,352 39 5
*NW Rank: Idaho's rank (1=highest, 7=lowest) relative to its six contiguous neighboring states: Montana, Nevada, Oregon, Utah, Washington, and Wyoming
Source: State Rankings 2018, CQ Press (Morgan); CDC - NIH

98 State Facts & Demographics
RANKING VALUE US NW* EDUCATION Pupil-Teacher Ratio (2016) 18.7 7 5 Average Teacher Salary (2017) $47,504 42 6 Public High School Grad Rate (2016) 79.7% 40 4
% of Pop High School Grad (2016) 90.4% 19 5
College Enrollment Rate per 1,000 18-24 years old 777 7 2
Per Capita Expend. for Education (2015) $1,932 50 7
Ed. Expend. as % of All State & Local Expenditures (2015) 30.1% 45 6
Expenditures Per Pupil (2017) $6,515 50 7 Per Capita Higher Ed. Exp. (2015) $643 44 6 % of Pop. College Grads (2015) 27.6% 36 5 Pop. per Public Library (2015) 11,454 38 5
ECONOMY Gross Domestic Product (GDP) (2016) $68.4b 42 5
2012-2016 % Change in GDP 11.5% 7 3 Personal Income (2016) $66.4b 41 5 Per Capita Personal Income (2016) $39,470 45 7
Median Household Income (2016) $54,339 31 5
Avg Fed Individual Tax Refund (2016) $2,433 44 5 *NW Rank: Idaho's rank (1=highest, 7=lowest) relative to its six contiguous neighboring states: Montana, Nevada, Oregon, Utah, Washington, and Wyoming
Source: State Rankings 2018, CQ Press (Morgan); National Center for Education Statistics

State Facts & Demographics 99
RANKING VALUE US NW* GOVERNMENT FINANCE Per Capita Fed Gov't Exp (2016) $7,350 35 4 Federal Civilian Employees per 10,000 population (2016) 44 25 5
Per Capita State Property Tax Rev (2015) $967 39 6
Per Capita State Tax Rev (2015) $3,444 47 7 Per Capita State Individual Income Tax Revenue1 (2015)
$905 30 4
Per Capita State Corporate Income Tax Revenue1 (2016) $905 30 4
Per Capita State Sales Tax Revenue 2 (2016) $928 24 4
Per Capita State Fuel Tax Revenue (2016) $201 6 1
Per Capita State Gov't Exp (2014) $7,558 44 6 State Employee per 10,000 pop (2016) 489 39 3
Per Capita Local Gov't Total $5,661 42 7 Revenue (2014) Per Capita Local Gov't Exp (2015) $7,272 50 7 1 NV, WA, and WY do not have income tax 2 MT and OR do not have sales tax *NW Rank: Idaho's rank (1=highest, 7=lowest) relative to its six contiguous neighboring states: Montana, Nevada, Oregon, Utah, Washington, and Wyoming
Source: State Rankings 2018, CQ Press (Morgan); CDC - NIH

100 State Facts & Demographics
RANKING VALUE US NW* EMPLOYMENT & LABOR Average Annual Pay (2016) $39,637 49 7 Unemployment Rate1 (2017) 2.9% 7 1 Labor Force: % Women (2016) 57.2% 30 6 Job Growth (2016-2017) 2.1% 7 4 % Emp: Construction (2017) 6.1% 7 4 % Emp: Manufacturing (2017) 9.4% 21 2 % Emp: Mining/Logging (2017) 0.5% 13 4 % Emp: Ed and Health Svcs (2017) 14.8% 29 2
CRIME & LAW ENFORCEMENT Violent Crimes Per 100,000 Pop (2016) 219 46 7 Murder Rate Per 100,000 Pop (2016) 2.9 36 4 State Prisoner Incarceration Rate Per 100,000 Pop (2016) 435 16 2
Death Row Inmates (2017) 8 24 4 Law Officers per 10,000 Pop (2016) 17 38 2 Per Capita State & Local Expenditures for Police (2015) $259 36 5
Per Capita State & Local Expenditures for Corrections (2015) $206 25 6
1 Unemployment rate is ranked lowest percent to highest *NW Rank: Idaho's rank (1=highest, 7=lowest) relative to its six contiguous neighboring states: Montana, Nevada, Oregon, Utah, Washington, and Wyoming
Source: State Rankings 2018, CQ Press (Morgan); CDC - NIH

State Facts & Demographics 101
RANKING VALUE US NW* ENERGY & ENVIRONMENT Per Capita BTUs Consumed (2015) $318B 23 3 Per Capita Energy Expend. (2015) $3,626 24 3 Energy Prices - Per Million BTUs (2014) 34 Per Capita Gasoline Used (Gal.) (2015) 454 30 3 National Priority Listed Hazardous Waste Sites (2017) 9 41 5
Total Pollution Released in lbs (2016) 46.2M 20 3
HEALTH Birth Rate Per 1,000 Pop (2016) 13.4 8 2 Teen Birth Rate, % of All Births (2015) 5.6 24 4 Births to Unmarried Women, % of All Births (2016) 27.6% 48 6
Abortions Per 1,000 Live Births (2014) ~No data reported by WY 59 43 5
Deaths (2015) 13,026 40 5 Estimated Cancer Deaths (2018) 3,020 40 5 Heart Disease Deaths (2015) 2,825 40 5 AIDS Deaths (2015) 4 45 6 % of Adults Overweight or Obese (2016) 64.5% 32 1 % of Children (19-35 months) Fully Immunized (2016) 73.9% 18 2
*NW Rank: Idaho's rank (1=highest, 7=lowest) relative to its six contiguous neighboring states: Montana, Nevada, Oregon, Utah, Washington, and Wyoming
Source: State Rankings 2018, CQ Press (Morgan); CDC - NIH

102 State Facts & Demographics
RANKING VALUE US NW* SOCIAL WELFARE % of Population in Poverty (2016) 14.4% 19 1 Per Capita Soc. Sec. Payment (2015) $2,746 30 3 % of Population in Medicare (2016) 17.5% 30 3 % of Population in Medicaid (2015) 17.2% 39 4 Recipients of TANF Payments (2017) 2,738 48 6 % Change in TANF Recipients (2016-2017) -3.9% 18 4
% of SNAP Recipients (2017) 10.0% 40 5
TRANSPORTATION Per Capita Fed Highway Fund (2016) $173 12 3 % Federally Funded Road & Street Miles (2016) 22.8% 36 4
Pub. Road & Street Mileage (2016) 51,342 35 4 Highway Fatalities Per 100 Million Vehicle Miles (2015) 1.3 15 3
Alcohol Related Fatalities as a % of all Highway Fatalities (2016) 35% 17 2
Safety Belt Usage Rate (2016) 82.9% 39 5 Vehicle Registrations (2016) 1,842,245 37 5 % Fatalities Drivers Ages 15-20 (2015) 7.9% 5 2
DEFENSE Per Capita US Defense Department Expenditures (2016) $144 48 7
US Reserve Personnel (2016) 5,335 39 5 Active Duty Military Personnel (2016) 3,338 33 4 Number of Veterans in Idaho (2017) 122,067 39 5 *NW Rank: Idaho's rank (1=highest, 7=lowest) relative to its six contiguous neighboring states: Montana, Nevada, Oregon, Utah, Washington, and Wyoming
Source: State Rankings 2018, CQ Press (Morgan)