Embed Size (px)
Citation preview

PR,3-,34o7
POLICY RESEARCH WORKING PAPER 23 67
Gender, Poverty, and For women in Ghana andUganda, nonfarm activities
Nonfarm Employment piay an important role in
in Ghana and Uganda yielding the lowest -and the most rapidly
declining -- rural poverty
Constance Newman rates. In both countries rural
Sudharshan Canagara jab poverty declined fastest for
female heads of housenold
engaged in nonfarn work
(which tended to be a
secondary activity). BLut
patterns vary between the
two countries.
The World Bank
Development Research GroupRural DevelopmentandHuman Development NetworkSocial Protection TeamJune 2000
Pub
lic D
iscl
osur
e A
utho
rized
Pub
lic D
iscl
osur
e A
utho
rized
Pub
lic D
iscl
osur
e A
utho
rized
Pub
lic D
iscl
osur
e A
utho
rized

POLICY RESEARCII WORKING PAPER 2367
Summary findings
Newman and Canagarajah provide evidence that Women were more likely than men to combinewomen's nonfarm activities help reduce poverty in two agriculture and nonfarm activities. In Ghana it waseconomically and culturally different countries, Ghana nonfarm activities (for which income data are available)and Uganda. that provided the highest average incomes and the
In both countries rural poverty rates were lowest - highest shares of income.and fell most rapidly - for female heads of household Bivariate probit analysis of participation shows that inengaged in nonfarm activities. Uganda female heads of household and in Ghana women
Participation in nonfarm activities increased more in general are significantly more likely than men torapidly for women, especially married women and participate in nonfarm activities and less likely tofemale heads of household, than for men. participate in agriculture.
This paper - a joint product of Rural Development, Development Research Group, and the Social Protection Team,Human Development Network- is part of a larger effort in the Bank to discuss gender, employment, and poverty linkages.Copies of the paper are available free from the World Bank, 1818 H Street NW, Washington, DC 20433. Please contactMelvina Clarke, room G8-118, telephone 202-473-1752, fax 202-522-3252, email address [email protected] Research Working Papers are also posted on the Web at www.worldbank.org/research/workingpapers. The authorsmay be contacted at [email protected] or [email protected]. June 2000. (43 pages)
The Policy Research Working Paper Series disseminates the findings of work in progress to encourage the exchange of ideas aboutdevelopment issues. An objective of the series is to get the findings out quickly, even if the presentations are less than fully polished. Thepapers carry the names o/ the authors and should be cited accordingly. The findings, interpretations, and conclusions expressed in thispaper are entirely those of the authors. They do not necessarily represent the view of the World Bank, its Executive Directors, or thecountries they represent.
Produced by the Policy Research Dissemination Center
Gender, Poverty, and Nonfarm Employment in Ghana and Uganda
Constance Newman and Sudharshan Canagarajah*
Constance Newman is with Rural Development and Poverty and Human Resources in the DevelopmentEconomics Research Group (DECRG), World Bank, and Sudharshan Canagarajah is with the Social ProtectionTeam in the Human Development Network (HDNSP), World Bank. The funding for this research came fromthe Poverty Research Report on Gender and the Poverty Reduction and Social Development Division in theAfrica Region. We would like to express our thanks to Simon Appleton for his assistance, Patricia Zambranoand Ruchira Bhattamishra for excellent research assistance, and Andrew Mason for his valuable comments on anearlier version of the paper.


Gender, Poverty, and Nonfarm Employment in Ghana and Uganda
Constance Newman and Sudharshan Canagarajah
1 Introduction
Poverty levels in Sub-Saharan Africa are remarkably high, especially in rural areas. In
some countries, the majority of rural residents can be classified as poor. Over the last decade,
rural poverty has declined, but it is still twice the rate of urban poverty in many countries. To
address rural poverty, policy makers are increasingly looking to the growth potential of the
nonfarm sectors of the rural economy. Nonfarm sectors such as petty commerce, wage
employment, transportation, and construction, have been linked to lower poverty levels in
recent work. This paper corroborates these findings and further explores the importance of
nonfarm participation to poverty reduction differences by gender. We find that women are
increasingly active in the nonfarm economies of Ghana and Uganda and that this participation
is linked to greater reductions in poverty for women than for men. The literature to date has
not focused on gender differences, but the differences are significant and they show another
important benefit of nonfarm activity.
In this paper, we define "nonfarm" as all the activities that are associated with
wage work or self-employment in work that is not in agriculture but located in rural
areas. Subsistence agriculture is the dominant activity in SSA countries, so we analyze
all activities that are "nonfarm" as a way of examining the extent of diversification in the
economy. We focus on Ghana and Uganda, each representing not only different
economic and political experiences, but also different cultures. We compare trends in
rural poverty by gender and sector; changes in income and labor market participation by
2

sector and gender; and the determinants of sector participation using a bivariate probit
model of participation. Recent studies by Appleton (1999), Deininger and Okidi (1999),
and Abdulai and Delgado (1999) explore different aspects of these same issues for Ghana
and Uganda, but none focuses specifically on the gender, non-farm, poverty nexus.
A large body of recent research has demonstrated the importance of the non-farm
sector.' The non-farm sector provides employment, household income diversification
and security, market linkages for agriculture, and thus, the potential for reducing poverty
and inequality.2 Most authors have concluded that non-farm activities can be seen as a
route out of poverty, and that the impacts of non-farm growth on inequality depend on the
type of non-farm activity, lancl tenure patterns, and physical and human capital
requirements in question. The role of non-farm work has been examined from a number
of perspectives, but one area in the non-farm literature that has not been examined in
much detail is that of the different impacts of non-farm development by gender.
Analysis of the gendered impacts of non-farm activity has been included in general
overviews of the non-farm sector. But from the little that has been written, the policy
implications can be contradictory. Most scholars conclude that growth in non-farm
activities is beneficial to women since women are said to participate more in these
activities.3 But the opposite was described in a recent paper by Abdulai and Delgado
about non-farm participation in Northern Ghana. They write that men are more active
than women in non-farm work. Others assert that women's traditional role of processing
' See Reardon (1997) and Ranis and Stewart (1993) as examnples.2 See Lanjouw and Lanjouw (1995) :for a recent survey of the literature. Also see Lanjouw (1997), van deWalle (1993), Hazell and Haggblade (1993), Adams (1994 1999), Reardon and Taylor (1996), and Leonesand Feldman (1998).
3

agricultural output has been supplanted by more modem processing systems, thus
replacing women's work. There are many possibilities, especially since "non-farm" as a
sector can represent a wide range of activity types. Women's involvement in the different
kinds of non-farm activities is likely to be highly varied across different countries and
cultural contexts.
In this paper we find that non-farm activities are very important to women's welfare
in the two countries of Ghana and Uganda. In both countries, poverty among female
headed-households was significantly lower and fell more rapidly over time in those
households participating in non-farm activities. In order to get a better idea of the gender
dynamics, we explore the implications of these findings by looking at individual level
changes in labor market participation and at changes in income by source at the individual
level for Ghana. Individual-level income data is not available for Uganda, so we show
changes over time in household income. We conclude by discussing our estimates of the
determinants of an individual's participation in agriculture and/or non-farm activities
rounding out the story of who benefits from non-farm participation and why.
The next section of the paper provides some background on gender roles and the
division of responsibilities in the two countries. The third section provides a discussion
of the data and methods of approach. The fourth section provides a description of rural
poverty trends by gender and sector, and the fifth section describes the trends in sector
participation, income, and income shares. The sixth section presents econometric
estimates of the joint probability of participation in non-farm and agricultural activities.
The final section concludes and recommends areas for further investigation.
3Hazell and Haggblade (1993) for Latin America and a World Bank report on the non-farm sector in
4

2 Gender Roles: Division of Labor in Rural Ghana and Uganda
The division of labor by gender appears to be similar in the two countries with the
main difference being that women in Ghana have more access to the market as traders
than do women in Uganda. Otherwise, women in both countries work primarily in
agriculture with little say in production decisions.
Lloyd and Brandon (1991) review the anthropological literature on the role of
Ghanaian women in the division of labor by household. They assert that men have
authority over all resources and labor allocation, but that since both men and women have
strong ties to extended family, women are able to exercise a fair amount of autonomy
within their own economic sphere. Wives usually contribute labor to the family
enterprises-which are controlled by their husbands-and engage in their own income-
generating activities. On the farm, men are usually responsible for the more arduous jobs
such as the initial clearing of the land, while women are responsible for the cultivation
and processing of crops for home use and market sale. The introduction of cash crops has
been linked to increases in inequality between men and women, with men moving more
actively toward control of those crops and women taking more responsibility for food
crops produced for home consumption.
The roles and responsibilities of men and women are similar in Uganda according
to a summary paper by Mugyenyi (1998). Women in Uganda are predominantly occupied
in farming, and like in Ghana, they have little access to resources and capital. The men
control cash crop farming and revenues, and women provide most of the total labor to
food and cash crops. The rights of women in Uganda seem more curtailed however, an
Bangladesh (1997) as examples.
5
example being their rights to land ownership. Mugyenyi writes that only 5 percent of
land is owned by women as a result of cultural practices that restrict women's inheritance
and property ownership. Quoting from a UNICEF study on this subject, she writes:
"There are no statutes that prevent a woman from acquiring property but according to
custom, property acquired during marriage belongs to the husband. If a woman leaves
her husband, she may have to leave most of her property." (p.137). Mugyenyi describes
other women's work in Uganda as being comprised of domestic service and informal
sector trade in petty commodities, both of which she says provide very low returns. The
overall patterns of division of labor are similar to the ones found in Ghana, but possibly
more restricted for women in Uganda.
3 Data and Methodology
The analysis in this paper is based on two comprehensive sets of household level
data over periods spanning four to five years for each country. The period of analysis for
Ghana is from 1987/88 to 1991/92, and though this period does not correspond with the
major agricultural reforms, we would expect the rural economy to have benefited from
the liberalization of trade and exchange rates that occurred just prior to the period. The
period of analysis for Uganda is from 1992 to 1996, corresponding to the implementation
of agricultural as well as macroeconomic and trade reforms.
For the Ghana analysis, we use data from the Ghana Living Standards Surveys from
1987/88 and 1991/92 (GLSS 1 and GLSS3). These surveys were modeled after the Living
Standards Measurement Surveys (LSMS) designed by The World Bank for in-depth
poverty measurement. We use the poverty lines and mean per capita expenditure
6

variables developed by Coulombe and MacKay (1995) and used by other analysts of these
data. The poverty line is de-fined as 132,300 cedis which amounts to $25 per month per
person in 1992 prices. The GLSS surveys, which cover about 3000-4000 households, are
nationally representative mu,lti-purpose surveys conducted over a period of one year.4
For Uganda, we use twvo household surveys, the Integrated Household Survey from
1992 (IHS 1992) and the fourth Monitoring Survey from 1996 (MS 1996). Like the
GLSS, the IHS 1992 survey was modeled after the LSMS to measure welfare. The MS
1996, like the other annual mnonitoring surveys implemented after 1992, was designed to
collect vital welfare data such as consumption and labor data. We use the regional
poverty lines and mean per capita expenditure variables developed by Appleton (1999).
The resulting weighted average national poverty line is 16443 Ugandan shillings per adult
equivalent per month (in 1992 prices) or about $34 per person per month.
Since this paper exploires the gender dimensions of non-farm activity, we chose to
make maximum use of individual level data wherever available. We used all of the
information available for economic activity, main and secondary occupations (and tertiary
where given), since many people-especially women-participate in more than one
sector. In fact, most of the interesting information about non-farm participation comes
from the analysis of the different combinations of activities. We also use imputed
individual level incomes for Ghana that shed light on the different gender dimensions of
the labor market. We estimate individual incomes by combining existing salary data with
a proportional share of household income based on the individual's reported participation
4 GLSS 1 had a 14 day recall period while GLSS3 had a much smaller 3 day recall period. Since longerrecall periods are associated with recall error the expenditure figures had to be corrected using a correctionfactor of 2.7 for each additional day of longer recall period in order to avoid unwanted bias in the analysis.
7

and hours worked in the household activity. We conducted the same analysis for Uganda,
but the data from the MS 1996 did not permit a reliable comparison.
Income data is known to be of generally poor quality, but we use it here to
complement individual level participation data and focus on the relative income
differences by gender and sector rather than differences in magnitudes. We make the
strong assumption that incomes are distributed according to the amount of time a person
spends contributing to the household enterprise. This may not be the case, and thus we
would overestimate incomes of the relatively powerless in the household. Despite this
bias, we find that the income data tells an important part of the story. As Adams (1999)
noted in a recent paper on non-farm eamings in rural Egypt, income data collection
efforts should be strengthened if we want to better understand the determinants of growth
by sector. We would add that it is especially needed to distinguish gender differences that
are usually masked by household income and expenditure totals.
We use household headship as the main indicator of gender differences in this
paper, mostly out of necessity, but also because of its qualities as an indicator. We use
headship first because the poverty measures are derived from household level
consumption data and second because the 1996 Uganda data has minimal information at
the individual level. However, the strength of headship as a gender indicator is that it
provides the best representation of women's general economic opportunities and
circumstances at the household level. Since we have an economy that is composed of
households which interact as collective units, rather than one in which individuals interact
as purely independent agents, the differences among households as defined by the gender
of their head can reveal a lot about different economic experiences. There are, of course,
8

many problems with the use of headship that have been highlighted in the literature, so
we differentiate by individuals as well wherever data permits.
In the non-farm literature, there are several prevailing approaches to the concept
and definition of "non-farm", with no one definition being correct from our point of view.
One approach is to identify non-farm by industry, with the result that an individual's
occupational status (whether the individual is an employer, employee, or self-employed)
is irrelevant to the definition. In that case, for example, one would find all persons
employed in agriculture as either wage workers or self-employed farmers grouped
together. Further divisions of the dominant agriculture sector may also treat livestock as
separate. In this paper, we chose to focus on the occupational aspect and thus isolate the
self-employed farmers from the agricultural wage workers, for example. We include
livestock and "agricultural services" (very small percentages) with agriculture. For the
broad categories that we use in most of the paper, we divide non-farm work into wage
work (including agricultural) and all self-employment that is not self-employment in
agriculture.
4 Rural Poverty in Uganda and Ghana
4.1 Comparisons of Rural Poverty by Gender
In both Uganda and Grhana, poverty declined for female-headed households(Tables
1 and 2). However, the results from the two countries differ when the rates of change in
poverty for female-headed aLnd male-headed households in the two countries are
compared. In Ghana, the rural (and national) poverty rates for male-headed households
9

(MHHs) declined at a lower rate than for female-headed households (FHHs)5 , but in
Uganda, the reverse is true. For Ghanaian rural households, FHH poverty decreased by
38% while that for MHH fell by only 17%. In Uganda, MHH poverty fell by 20%, and
FHH poverty fell by 12%. FHH poverty in Ghana was actually lower than MHH poverty
by 1992. In Uganda, FHH poverty remained slightly higher than MMH poverty, though
not significantly. Poverty rates for FHHs and MHHs are very close in Uganda for both
years, as also shown for 1992 by Appleton (1996). The results for both countries add to
existing evidence that female headship is not in itself a robust indicator of poverty.6
4.2 Rural Poverty by Sector and Gender
Flow do rural poverty rates differ by activity? Many people were active in more
than one activity, with agriculture being the dominant one, but not always the most
important in terms of income. For both countries, almost 90% were active in agriculture
to some extent, but only 60 to 70% were in agriculture exclusively. Almost a third of the
rural population in both countries was active in both agriculture and non-farm activities,
and the percentage is even higher for household heads of which 40% were active in both
agriculture and non-farm (Tables 3 and 4).
Table 3 shows poverty statistics with three views on the agriculture/non-farm split:
first by main occupation and whether the main occupation is in agriculture or non-farm;
second, by whether the person works for any amount of time in agriculture or non-farm as
5 A recent paper by Bhushan and Chao (1997) makes the valid criticism that the poverty statistics by genderreported in the 1995 World Bank report were based on assumptions of equal household size and otherassumptions that bias poverty findings downward for female headed households. We recalculated thepoverty statistics using their criteria and find that the relative differences in poverty movement over timebetween male and female headed households are still the same as reported in the 1995 report. Our analysisis available upon request.6 Louat et al (1993), Rosenhouse (1989) among others.
10

either their main or secondary occupation; and third, by whether the person works
exclusively in agriculture, exclusively in non-farm, or in both sectors. A clear result from
all combinations, for both years, and for both countries, is that non-farn participation
corresponds to lower rates of poverty.7 The results show the benefits of diversification
since individuals in combinations of agriculture and non-farm activities have lower levels
of poverty than agriculture only. However, non-farm alone or non-farm as the main
occupation shows the lowest levels of poverty overall.
Comparing the rates of change over time between agriculture and non-farm, we find
that for both countries, poverty levels for the people in non-farm activities declined more
rapidly than for those in agriculture. In Ghana, poverty rates for people working in non-
farm declined only slightly mrore rapidly than for those working in agriculture. In
Uganda, the differences were more pronounced: for those citing agriculture as their main
occupation, poverty fell by 20%, and for those in non-farm, it fell by 31 %; for those
working exclusively in non-farm, poverty fell by the largest amount, 42%; and for those
working exclusively in agrictlture, poverty fell by only 17%.
Poverty rates fell most rapidly among female heads engaged in non-farm activities
in both countries as shown in Table 4. Strikingly in Uganda, the drop in poverty for
female heads in non-farm activities was greater than that for male heads despite the much
larger overall drop in poverty experienced by all male heads. Poverty reduction for male
heads was greater than that for female heads in agriculture as a main job (24 to 17%), any
agriculture (24 to 18%), any non-farm (31 to 20%), agriculture only (18 to 15%), and the
combination of agriculture and non-farm (31 to 23%). But poverty reduction was greater
7 As other analysts have cautioned, this result cannot tell us whether non-farmn activity leads to lower
11

for female heads than for male heads in the categories of non-farm as a main job (29 to
26%) and non-farm alone (44 to 37%). In Ghana, less surprisingly, female heads
experienced greater reductions in poverty than men in all categories and greater
reductions were found for female heads with some connection to non-farm activities. For
those female heads in agriculture only, poverty dropped by 31%, and for men it dropped
by only 18%. For female heads in non-farm only, poverty fell by 37% and for men, it fell
by 32%. In the combination of agriculture and non-farm, poverty for female heads fell by
35% also, and for males it fell by only 14%.
5 Rural Employment and Income Changes in Uganda and Ghana
To better understand the underlying changes behind poverty reduction in non-farm
activities, we examine participation and income data each in a couple of different ways.
Since the participation data shows trends at the individual level, we get the clearest
picture of what is happening by gender from participation. We first take a snapshot look
at the different types of industries comprising non-farm activities and how these differ by
gender. We then look in more detail at how participation in the broader categories of
agriculture, wage work, and self-employment differ by gender and family role. Then we
turn to the income data.
5.1 Sector Participation
Tables 6 and 7 show industry participation trends for main and secondary activities.
Agriculture is clearly the main activity for both genders in both countries, but what is
nicely depicted is how important it is to look at secondary activities. Among secondary
poverty, or whether by contrast, the poor face too many barriers to participation in non-farm activities.
12

activities, women were more likely to be active in non-farm work than were men,
especially by the second period. In 1992 Ghana, only 30% of women with a secondary
activity were in agriculture, compared to 53% of the men. In 1996 Uganda, 35% of
women and 58% of the men were in agriculture as a secondary job. However, it is also
interesting to note that the number of non-farm industries that women are found in is
more circumscribed than it is for men: in both countries, women are clustered into
wholesale/retail trade and manufacturing while men's secondary activities are distributed
across public administration, trade, several kinds of manufacturing,
construction/transport, and forestry/fishing/mining.
Tlhe differences in women's roles in the two countries are highlighted in Tables 6
and 7. As described by Mugyenyi, these data show that women in Uganda are primarily
farmers, and they are more active than men in agriculture (94 to 80%) as a main activity.
In Ghana, women have slightly lower participation in agriculture as their main activity
compared to men (80 to 84%/0), and they have slightly more opportunities than Ugandan
women in other sectors. The traditional role of women as market traders in Ghana is
clearly shown: in 1988, 9% of Ghanaian women report trade as their main industry and
34% report it as their secondary industry and by 1992, these percentages increased to 12
(main) and 41% (secondary) respectively. The secondary activity participation of
Ugandan women shows 7 to 10% in trade, but much greater concentration in
food/beverage manufacturing (18 and 19% in 1992 and 1996). The main change over
time shown in these data raises a very relevant insight to this research. Rural Ugandan
women, whose main work is farming, increased their secondary participation in another
group of manufacturing industries-textiles, leather, wood, handicrafts-from 4 to 27%.
13

This statistic alone reveals the magnitude of these labor market shifts among women and
the need to better understand their impacts.
Next we turn to an examination of how the combinations of agriculture and non-
farm activities change over time for different members of the household, with non-farm
activities split by wage and self-employment. Tables 8 and 9 show the different
combinations of agriculture and non-farm as either main or secondary occupations for
Ghana and Uganda. For Ghana, men as a whole were more likely than women to
participate exclusively in agriculture: for men the percentage went from 63% to 70%
while for women it was just over half (54 to 58%). Almost all of the rest of the women
worked in farming plus self-employment (either one as a main occupation for a total of
30% in 1987 and 27% in 1991) or in self-employment alone (9% in 1987 and 12% in
1991). The trends over time for both men and women suggest a movement toward
specialization-toward either farming, wage employment or self-employment alone.
In Ghana, the patterns for male and female household heads in Table 8 reveal
important differences from the patterns for males and females as a whole. The biggest
difference is that a much lower percentage of female household heads worked exclusively
in agriculture (from 36 to 42%) compared to that for women as a whole (from 54 to
58%). Female household heads were more active in the combination of farming and self-
employment (from 40% in 1987 down to 33% in 1991). Female heads were more
represented in self-employment as a main occupation than women as a whole, up to 18%
in 1991. The participation of male household heads was less concentrated in farming
than for males as a group and more equally distributed across the different activity
combinations.
14

The changing occupations over time of female spouses and females who are neither
household heads or spouses ('other female members") rounds out the story of women's
patterns in Ghana. Other fernale members were much more likely than women as a group
to be exclusively in farming, and their participation shows a bigger increase over time
than any of the other groups shown; participation in farming alone was 62% in 1987 and
increased to 76% in 1991. Their participation in all other activities declined over time.
Female spouses, on the other hand, had almost the same participation level in farming as
women as a whole, except that their participation did not increase as it did for every other
group. Female spouses had high and more stable participation in the combination of self-
employment and farming than did women as a whole (32%). Their participation in self-
employment alone increased from 7 to 11%. Overall the data suggest that the working
females with most responsibi.lity for family welfare (spouses and heads) were more active
in non-farm activities, especially self-employment. Younger and older female household
members increased their participation on the farm.
The story in Uganda is similar to that of Ghana in that the combination of
agriculture with self-employrnent participation increases, especially for women. Table 9
shows that Ugandan women as a whole were more likely than men to participate
exclusively in agriculture: 60% of men in 1991 fell to 54% and 85% of women which fell
to 67%. The rate for both men and women declined, but more so for women; it fell by 6
percentage points for men and 18% points for women. Those same women who left
working exclusively in agriculture plus a small percentage from wage work must have
added self-employment to their agricultural work as participation in self-employment and
agriculture increased by 21%. Men also appear to have added self-employment work to
15

agriculture, but the switch is not quite as large as for women: 13% more men combined
agriculture and self-employment in 1996.
Ugandan heads of households, both men and women, were much more likely to
diversify into other activities than were men and even women as a whole. Over time,
female heads show a large drop in farming from 73 to 54%, while male heads' farming
participation remained virtually stable at 49%. The participation of both male and female
heads in self-employment and farming increases, but it does so much more for female
heads: males and females start out at almost the same rate of participation of 16 and 14%
respectively, but females' participation increases to 38% and males' increases to 28%.
Male heads also show a switch from participation in wage work toward self-employment.
Overall the trends in female participation in Uganda closely mirror those in Ghana and
show a movement toward more non-farm work.
5.2 Income and Income Shares
In this section we investigate patterns in reported income by gender and sector (see
Tables 10-13). For both countries, there are apparent problems with the comparability of
the income figures across the two periods even after adjusting for prices. Therefore, we
report only the relative differences for male and female groupings. For Ghana, we use
individual level incomes for both periods, but for Uganda, we use household level income
data.
For both countries, our data indicate that women earned substantially less than men,
though for Ghana the gap may be closing if the relative changes over time for men and
women can be compared. For Ghanaian women, the highest average incomes came from
16

self-employment, and the most rapid rate of income growth was in self-employment, for
both mean and median incomes. For Ghanaian men, the most rapid growth was in either
wage employment or self-employment income, depending on whether one uses the mean
or median. For both Ghanaian men and women, wage income increased over time, and
farm income had the smallest growth over time. Table 10 shows that although Ghanaian
men's incomes were higher than women's in all sectors, the percentage gap is smallest for
self-employment incomes, particularly when looking at mean incomes. Comparing mean
income changes, women earned only 15% less than men in self-employment, compared to
the 33% and 26% less they earned in farming and wage employment in 1987,
respectively. By 1991, the percentage gap between men's and women's mean incomes in
self-employment had declined to 11%.
The earnings reported for female-headed households in Uganda were significantly
lower than those for male-headed households in both years, and if anything, the average
earnings grew further apart over time. The difference between average earnings from
female-headed households and those from male-headed households went from 33% to
47% in 1996. The difference between average earnings in self-employment in the two
types of households was highest in both years and grew larger over time, from 46 to 56%.
These figures cast heavy doubt on the possibilities for female-headed households in
gaining earnings equity via self-employment as the poverty analysis suggests.
Ugandan women-as measured by headship-would seem to have much lower
non-farm incomes relative to agricultural incomes compared to Ghanaian women and
even compared to Ugandan men. However, we only have earnings data at the household
level for Uganda, which is c learly problematic because it hides the earnings of females in
17

male-headed households engaged in non-farm activities. From the participation data, we
know that by 1996 there was a large increase in female participation in non-farm
activities as a secondary activity, especially among female spouses, thereby calling into
question the significance of income averages at the household level.
Looking at changes in shares of income provides another perspective. For Ghana,
in Table 1 1, self-employment accounted for a larger percentage of total incomes earned
by women (26% ) than that for men (9%) in 1987. The proportion of self-employment
income increased to 31% for women and 11% for men. Table 11 also shows how self-
employment income may affect intra-household relations. First, as noted above, women's
income share in self-employment income-a high-earning sector-increased, and it
decreased in farming, the lowest earning sector. In contrast, men' s income shares are
almost stable in all three sectors over the period. Compared to women as a whole,
married women had the same starting income share from self-employment in 1987 (25%)
but by 1991 had a higher share (34%) than for women as a whole (3 1%). Married women
also had a sharper decline in the share of income from farming. In contrast, married men
had a smaller increase in the share of self-employment, but their share of farm income
remained high and stable at 70% while their wage income share declined. Married
women appear to have gained more than married men, more than men as a group, and
slightly more than women as a group.
Examining the trends for the other household members in Ghana, men's income
share patterns differed little across the categories with the exception of the "other men"
category, men who are neither household heads nor married. Compared to men as a
group, these men have much higher and growing income shares from farming, from 86 to
18

91%, and declining shares in the higher-earning sectors. Male household heads and
married men are largely overlapping groups and as a result are similar. In contrast to
other men, they have higher income shares in the high-earning sectors, with the self-
employment income share increasing and the wage share decreasing.
"Other women" in Ghanaian families who were neither a household head or spouse
gained the least among women. Their income share from farming increased, from 75 to
82%, and decreased from 22 10 17% in self-employment. This, together with the
participation data shows that women other than the main income-eamers (presumably
older and younger women) take over the agriculture duties usually done by the female
head or spouse, the higher-earners in the family. Female household heads appear to have
gained the most among women; their participation in farming was lowest, and it declined
from 56 to 51%. Their self-ernployment income share was highest and increased from 34
to 43%. And as the only femaLles with significant participation in wage employment, their
wage income remained significant, despite a decline from 10 to 6%. On the whole,
married women and female heads appear to have gained as a result of increasing income
from self-employment. These gains also appear to have been at the expense of more
dependent women, young and old, whose income shares moved away from the high-
earning sectors.
Table 13 shows income share changes for Uganda and Ghana by household head
type, male or female. These comparisons for Ghana differ from the above in that they
include eamings from the whole household as opposed to above comparisons for
household heads only. We see that female headed households gained considerably more
in Ghana than they did in Uganda over the periods, with Ugandan female households
19

earning an increasing share from agriculture and an only slightly increasing share from
self-employment. Male-headed households in Uganda have almost the same distribution
of income sources over time, with slight percent increases from wage and self-
employment. Ghanaian households -both male and female headed-show a significant
change in income sources, while Ugandan households' share in agriculture seems to stay
fairly fixed and even grow slightly larger for female-headed households.
6 Understanding the Determinants of Sector Participation in Ghana and Uganda
In earlier sections we discussed changes in rural poverty and their linkages to
farm/non-farm and gender aspects through mostly univariate relationships. In this
section, we examine the determinants (individual and household) associated with
participation in agriculture and non-farm activities in a multivariate dimension. We use a
bivariate probit model to estimate the joint probability of participation in the two sectors.
The dependent variable of the first equation takes a value of one if the person participates
for any amount of time in agriculture, and the dependent variable for the second equation
takes a value of one if the person spends any time in non-farm activities. Since the
bivariate probit evaluates how factors influence participation in each sector at the same
time, we can see whether the directional impacts are same or opposite for the separate
sectors. If a factor is significant in one direction in one of the equations and has the
opposite directional impact in the other, our understanding of its impact is strengthened.
Alternately, if both equations have factors with the same directional significance, we can
conclude that it is an impact not special to that sector alone, but important for
participation in general. A bivariate probit models allow for the existence of possible
20

correlated disturbances, p, between two probit equations. It also allows for testing of
whether this joint estimation makes a significant difference as opposed to estimating
univariate probits for each decision.
Three variations of the base model are estimated for both Ghana and Uganda. The
coefficients of the two equations, along with the correlation of the disturbances p, are
jointly estimated using maximum likelihood estimation. (See Annex I for a description of
the bivariate model.). The slight variations in the model that are presented show some of
the independent variables as interactions with gender. Model 1 is the benchmark model
in which interaction terms are not included and where a dummy for female household
head is included. Model 2 introduces an interaction between the dependency ratio and
being female, while Model 3 substitutes the female head dummy (fhh2) for a dummy
representing members of a female-headed household (thhO).
The base model that we estimate includes the same set of independent variables
used in recent non-farm participation models (Deininger and Okidi, Lanjouw, Abdulai
and Delgado, and others). As in the other studies, and where our data permits, we include
regional dummies, age (and age squared), education, distance to markets, non-labor
income, land acreage, the ratio of dependents to working adults, and different dummies
representing gender. We use dummies for gender differences instead of estimating
separate equations by gender in order to directly compare differences by gender rather
than differences among men and women. We test for differences in the slopes of the
independent variables by gender and for those variables where we find significant
differences, we show separate variations of the model which test the separate effects
using interaction variables. The estimate of p that maximized the bivariate probit
21

likelihood function for Ghana was in the range of -0.7 to -0.8 in 1987 and -0.38 in 1992,
while in Uganda it assumed values of-2.6 to -2.7 in 1992 and -1.08 in 1996. All of
these were significant at one percent. This negative and significant p indicates that on the
whole disturbances in the farm/non-farm participation decisions are affected in opposite
directions and are not statistically independent. This clearly indicates that parameter
estimates obtained from a uimvariate probit will be inefficient and require A joint
estimation as in a bivarate probit. Similarly the likelihood ratio test for joint significance
of the independent variables is significant at one porcenFl level. The McFadden fV shows'
an indication of goodness of fit of all equations.
6.1 Ghana
The results for Ghana are presented in Table 15 for the 1987/88 survey and in Table
16 for the 1991/92 survey. The descriptive statistics for all of the varables used in the
estimation are shown in Table 14. For the most part, thb estimation results show the
factors to have fairly distinguishable effects on participation in one sector or the other.
The estimations for the two periods are mostly similar, though there are interesting
differences.
Looking at all versions of the models for both years, a clear commonality is that
women are significantly less likely than men to be in agriculture and more likely than
men to be in non-farm activities. As anticipated, female household heads behave slightly
different from women as a whole in that they participate more in agiculture (though not
significant in 1992). They also participate significantly more than others in non-farm, as
is the case for women on the whole. These effects are found in both yearm with the
22

exception of Model 2 using the 1991/92 data where the "female" dummy in the non-farm
equation is not significant (perhaps due to the inclusion of the dependency ratio for
females only, discussed below). The participation patterns of members residing in
female-headed households is not clear from Model 3; the inclusion of that dummy is
insignificant in all but agriculture participation in 1987/88 where they are found to be
significantly less likely to participate.
Higher level of education has a negative effect on participation in agriculture, and it
has the opposite effect on non-farm participation. This is true of both years, and it is a
common finding in the literature (Lanjouw, Deininger and Okidi, and others). The effect
of primary schooling is more nuanced: it has a positive but insignificant effect in the
agriculture equation in 1987-88 (except for Model 3 where the effect is significant) and a
positive and significant effect in the 1987-88 non-farm equation. But by 1992, primary
schooling has a negative and significant impact on agriculture participation, and it has a
positive, insignificant impact on non-farm participation in 1991-92. Since the excluded
dummy is those with no schooling, this suggests that in 1988, there was more of a
mixture of people with no school and primary school in agriculture, and that by 1992,
those with primary schooling had declined. These patterns indicate that over time some
of those with no education have moved toward non-farm, while as a group, those with no
schooling became the main group in agriculture.
Distance to markets is an important determinant of growth prospects of the rural
economy. Non-farm activities require a certain proximity to trading centers or small
towns, while agricultural production gets an added impetus from close proximity to
markets. As a proxy for "distance to market" we used a combination of distance traveled
23
to school by the children in the family and "distance to work" if the school distance data
was not available. The hypothesized negative impact on non-farm participation was
significant in the 1992 equation but not in the 1988 equation. Also, the distance variable
is negative and significant in the agriculture equation for 1987-88, indicating that this
variable is important for all of rural economy. These results confirm the now perceived
wisdom that price incentives alone are not adequate to revise and rejuvenate the rural
economy-markets and other infrastructure are necessary.
We expected non-labor income to be an important determinant of non-farm
participation as hypothesized by others and since small amounts of capital are probably
needed to start self-employment enterprises. Along those lines, some analysts argue that
remittances are used to help households start new, non-farm activities. In this estimation,
non-labor income is the sum of remittances, rental income, and "other" incomes listed
(measured in 100,000 cedis). The results show that non-labor income is a positive and
significant determinant of non-farm activity in both periods. The effect of non-labor
income on agriculture is positive but not significant for the first two models for the 1987
survey, while it is negative and significant for the 1992 survey. Several explanations
could be offered, one being that families with non-labor income moved out of agriculture
in the latter period. It could also, by itself, indicate that agriculture families relied less on
other sources of income than on the proceeds from agriculture. The first explanation is,
however, more in keeping with the evidence on declining agricultural incomes, and the
evidence on the growth of importance of non-labor income in non-farm participation in
1991/92.
24

As has been the case in rnany studies of female labor market participation,
particularly in developing countries (Behrman and Wolfe, 1984), the dependency ratio
was hypothesized to be an important factor in determining non-farm participation. The
dependency ratio here is the ratio of the total number of children and non-working adults
to the number of working adults in the family. This was thought to be the best relative
measure of the family responsibility of each eaming individual. The results are not
entirely clear. In 1987, the dependency ratio has a significant impact only on agriculture
in Model 1, where the effect is negative. In 1992, however, the effect on agriculture is
the opposite (significant and positive). It is also significant and positive for participation
in non-farmn activities. For 199:2, when the interaction dependency ratio "if female" is
included, the separate female effect is insignificant for agriculture but positive and
significant for non-farm. This interaction term is not significant when using the 1987
data, but at least for 1992, there is some indication that the effect of dependents was more
important for females' participation in non-farm work than for males' and that this effect
became more important over time.
The regional dummies reveal expected results. The coastal region which is closest
to trade routes and urban areas hEas the most non-farm participation and the least
agriculture. The forest region has more, but not significant, agriculture participation than
the savanna region which is the excluded dummy. The forest and savanna regions appear
to have about the same amount of non-farm activity.
In an attempt to link individual sectoral participation decisions to the differing
fortunes of sectors within agriculture, we included household crop acreage. Most
families have several crops and nIot one dominant crop, so we use acreage in each of the
25
main categories as the best proxy of the household's diversification strategy as well as the
extent of their investment in agriculture. The main crop groups are cocoa, cereals (millet,
maize, guinea corn, sorghum, and rice), fruit and vegetables (tomatoes, okra, onions,
garden eggplants, eggplants, pineapples, oranges, mangoes, etc.) oils and pulses (ground
nuts, palm oil, etc.), and starches (plantains, cocoyams, yams, and sweet potatoes). As a
caveat, the data from the two different survey periods differ substantially in magnitude,
with the data from 1992 being much smaller. Agriculture is known to have suffered a
large depression over this time, but the magnitudes of differences in the data reported
seem too large to be correct. The relative acreage totals and patterns would still reveal
information about differential sector participation.
In the estimation for 1987-88, none of the family crop acreages were more likely
than the others to lead to agricultural participation. In 1988, there were three crops that
did have a negative and significant effect on non-farm participation: fruit & vegetables,
oils & pulses, and starches. Then in 1992, all of the crops except for cocoa were positive,
significant determinants of participation in agriculture. The biggest effect was from fruit
& vegetables, followed in order by cereals and oils & pulses. The fact that these crops
were significant in 1992 and not in 1988 may be a result of the fall in cocoa production
and relative specialization in the other crops in 1992. These crops had the opposite
impact on the probability of non-farm participation (except for fruit & vegetables)
completing the symmetry. On the contrary, cocoa acreage was negatively associated with
agriculture participation and also negatively associated with non-farm participation.
Cocoa production declined rapidly over this period, so these negative impacts on
26

participation in both sectors are not surprising, given the direct and indirect linkages of
the cocoa sector to the rest of the economy.
The crop results can be explained to some extent by the relation of the crops to
markets, both export and internal. Cash crops such as cocoa, fruits & vegetable, starches,
and to a lesser extent oils & pulses had different trajectories over the period and
presurnably different linkages to the non-farm sector. The results may be interpreted to
show that the crops of cereals, oils & pulses, and starches which did not have strong
linkages to the non-farm sector grew in relative importance as determinants of agriculture
participation and as an alternative to non-farm work. Cocoa's fall had a negative effect
on both sectors, presumably because it had strong linkages to markets. Similarly, fruit
and vegetables also having lirkages to non-farm markets show positive impact on
agriculture and on non-farm though the impacts on non-farm are not significant. These
explanations are only to be considered as possible explanations for the results. Much
better data is needed to fully understand the changes in the agricultural sector and how
they have impacted labor force participation.
6.2 Uganda
As with the Ghana data, we estimated bivariate models of participation in
agriculture and non-farm employment for Uganda for 1992 and 1996 (Table 17 shows
summary statistics and the est;imation results are in Tables 18 and 19). We include the
same independent variables used in the Ghana base model with the exception of distance
to market and agricultural acreage which were not available in the Uganda data.8 It is
8 Agricultural acreage is available in the 1995 Monitoring Survey from Uganda, but we chose to use the1996 survey for the analysis since it :is most recent and has more information about labor marketparticipation.
27

interesting to note that most of the effects we observed in Ghana are also present in
Uganda. There are, however, interesting differences.
The main difference from Ghana is that women were more likely than men to be
involved in agriculture and this effect was the same for both survey years. However,
female household heads were distinguished from women as a group in that they were
found to participate significantly less in agriculture in both years. This supports our
earlier findings that female heads were moving into non-farm much more than other
female household members. For non-farm activities, women were less likely than men to
participate but again this effect is mitigated by the opposite, positive and significant effect
of being a female head of household on non-farm participation. The results from Model 3
show that like female heads, members of female headed households were significantly
less likely to participate in agriculture and significantly more likely to participate in non-
farm activities. This stronger attachment of female heads and their family members to
non-farm as opposed to agriculture is only positive to the extent that earnings are higher
in non-farm activities. It is possible that female headed households have fewer options
and are forced to enter non-farm activities that are less profitable. Since we do not have
reliable individual income and hours data for Uganda we cannot fully resolve this
question as we have been able to do for Ghana. At least, the poverty analysis suggests
that non-farm activities are helping female-headed families out of poverty marginally
more so than those in agriculture.
As for Ghana, higher education is an important determinant of participation in non-
farm activities in Uganda. In both years, individuals who pursued primary education and
higher education have a higher likelihood of participating in non-farm activities than
28

people without any education. The opposite is true for agriculture, though the negative
effect of primary education is not significant for agriculture. Having an education level
anywhere above primary school, however, makes one much less likely to participate in
agriculture. This shows that education is more rewarded in non-farm activities even in
rural areas.
Non-labor income, which is defined as it was for Ghana-the sum of income from
rent, remittances and other income-is negative and significant for both years in the
agriculture equation, but interestingly the effect is also negative for non-farm activities in
the 1992 analysis. The effect is not significant in the non-farm equation for the 1996
survey, but it is still negative. This may be interpreted as an indication that neither
farning nor non-farm households had access to sufficient "other" income to make a
difference to their job participation decision.
The dependency ratio has the expected effect in 1992 when the interaction for
gender is included (Model 2), but in 1996, it is insignificant. In 1992, the effect of the
dependency ratio when men and women are together leads to higher participation in
agriculture and lower participation in non-farm. When you include the interaction with
the female dummy, the effect for the interaction term is the opposite. The higher the
dependency ratio when the individual is a woman, the more likely she will participate in
agriculture and less likely she will participate in agriculture. It is not clear why the samne
relation would not hold by 1996.
Living in the Central region has a significant and negative effect on the probability
of participating in agriculture and a significantly positive effect on participating in non-
29

farmn activities. This is consistent with the closer proximity of the Central region to the
larger cities, Kampala and Entebbe. The Eastern region show a positive and significant
effect on participation in agriculture, while the effect changes from positive to negative
for participation in non-farn activities. Finally, the Western region had a negative impact
on both agriculture (but insignificant) and non-farm (significant) which is possibly
explained by the greater degree of proximity to conflicts in neighboring Rwanda and the
Republic of the Congo.
7 Conclusions
This analysis has shown that non-farm activities play an important role for women
in rural Ghana and Uganda in many ways, but perhaps most importantly, in yielding the
lowest as well as the most rapidly declining poverty rates. Non-farm participation led to
the largest declines in female poverty rates in both countries despite differences in the
gender divisions of labor. Poverty among Ugandan female-headed households declined,
but at a slower pace than the poverty rate for male-headed households from 1992 to 1996.
The reverse is true for Ghana. Female-headed poverty declined at a faster rate than that
for male-headed poverty from 1988 to 1992. Regardless, both countries showed greater
poverty reductions for female-headed households in non-farm work.
Poverty rates for female-headed households in non-farm activities are lower not
because they are female-headed households, but because they are in non-farm activities.
Non-farm activities were linked to lower and more rapidly falling poverty rates in both
countries for both male and female-headed households. One may conclude that non-farm
activities are therefore equally important for men and women. However, non-farm
30

activities are particularly important to women's welfare as evidenced by women's greater
and faster growing participation in non-farm activities. Women in both countries,
especially female heads of households, increased their participation in non-farm activities
over the periods examined more so than men.
The most interesting aspect of this finding is that the bulk of women's increased
participation in non-fann activities comes from female spouses and household heads who
add non-farm work as a secondary activity. This is true for both countries. Spouses and
household heads were also more likely to be involved in a combination of agriculture and
non-farm activities than men were. The other women in the households were found to
either maintain or even increase their time in agriculture, apparently taking over duties
once done by the female head or spouse. The patterns displayed by the spouses and heads
could be interpreted to mean that these women worked more than men, with the added
non-farm work being an extra burden, or it could reflect women having less rigid ties to
their main agricultural duties and more flexibility to diversify. Whichever is the case, the
data show that participation in non-farm activities is strongly linked to reduced poverty,
and that this linkage is beneficial to women.
The most striking difference between Ghana and Uganda is in the greater
participation of women in agriculture in Uganda and their correspondingly lower
participation in non-farm activities. The greater participation of Ghanaian women in non-
farrm self-employment conforms more easily to the culturally accepted role of women as
market traders. In Uganda, women's traditional role is on the farm, and that is reflected
in the participation rates found in this paper. However, Ugandan women have clearly
started to diversify into non-farm activities. The examination of secondary activities of
31

Ugandan women reveal a large increase from 1992 to 1996 in participation in non-farm
activities. Also, the much higher participation of Ugandan female heads (and members of
female-headed households) in non-farm activities is an important sign that Ugandan
women are taking on non-farm opportunities when they can.
In Ghana, the only country for which we have detailed individual level data, non-
farm income may be giving women added bargaining power in the household. Average
incomes from non-farm activities for women were higher than incomes from agriculture,
and more importantly, income shares from non-farm activities increased for Ghanaian
women, especially female heads and spouses, more so than for men. Comparable data is
not available for Uganda, but participation and poverty rate trends suggest a similar trend,
though maybe not as marked as in Ghana where women are more active in the non-farm
sector.
What leads people to choose to participate in non-farm or agriculture or both? Our
analysis of the joint determinants of participation corroborates the main findings in the
literature. Higher levels of education lead to greater participation in non-farm activities
and lower participation in agriculture. Non-labor income is an important factor
explaining non-farm participation in Ghana, but not in Uganda. There is some evidence
that a higher dependency ratio is more important as a determinant of women's
participation, and that it leads to a larger increase in participation in non-farm activities.
But there is also some evidence that a higher dependency ratio is linked to higher
participation in agriculture (for both men and women), so overall it is not a robust
determinant. We were able to show for Ghana that distance to markets is linked to
32

participation in both sectors. The inclusion of different crop acreage in the Ghana
regressions helps explain the linkages between agriculture and non-farm participation.
The econometric analysis shows that in both countries, female heads of households
are significantly more likely to work in the non-farm sector and significantly less likely to
work in agriculture. In Ghana, non-farm work is especially important for all women. In
Uganda, the strongly significant result for female heads of household suggests that
women who are on their own have made significant inroads into the non-farm sector. We
have to interpret this with some caution however, because rather than being a choice,
participation in non-farm work. may be necessary if the female household head does not
have access to land. Given the very inequitable access to land by men and women in
Uganda, this may be a real barrier. Nevertheless, the association of lower poverty rates
for those female headed households in non-farm work shows that non-farm work is
linked with higher standards of living at least at the lower income deciles. Another
important aspect of the gender differences in Uganda compared to Ghana, however, is
that Ugandan men are much more likely to participate in the non-farm sector than are
Ghanaian men. The overall impression given by the Uganda data, from all of the angles
of analysis on poverty, income, and participation, is that both men and women have
gained from non-farm work in Uganda, with men gaining more on balance.
Further research is needed to better understand the distributional implications of
non-farm work by gender. In upcoming work, we examine the role of non-farm income
in income inequality and changes over time.
33

Annex 1: The Bivariate Model
A bivariate probit model allows for the existence of possible correlateddisturbances between two probit equations. It also allows for testing of whether this jointestimation makes significant difference as opposed to estimating univariate probits foreach decision. In the bivariate probit, let the latent variable y* represent the decision of
working in agriculture and y; represent the decision of working in a non-farm activity.Therefore the general specification for a two-equation model would be
yl =PIX+£, yl =I if y; > 0, O otherwise
Y2 = 2X + 2, Y2 =1 if Y2 > 0, O othervise,E[E1 ] = E[j2] = °,
Var[E ] = Var[E2] = 1,
CoVS IIC2]= P-
and the likelihood function to maximize is
P1X, P2X2
L= f J4I2 (zi z2 ;p)dz2dzI
where 02, the bivariate normal density function, is
02 (Z. Iz 22; p)= [2ir(l - p 2 )1/2 ]- exp[-(l / 2)(I -p 2 ) 1 (z2 +z2 - 2p,Z 2)]
and
p - coefficient of correlation between the two equations.
Xi and X2 - row vectors of exogenous variables
,B, and P2 - associated parameter column vectors.
34

References
Abdulai, A. and C. L. Delgado. 1999. "Determinants of nonfarm earnings of farm-basedhusbands and wives in Northern Ghana," American Journal ofAgricultural Economics 81(1), 117-130.
Adams, Richard H., Jr. 1994. "Non-Farm Income and Inequality in Rural Pakistan: ADecomposition Analysis," Journal of Development Studies (October) 31 (1): pp. 110-133.
Adams, Richard H., Jr. 1999. '1"on-Farm Income, Inequality, and Land in Rural Egypt" PolicyResearch Working Paper, 2178. The World Bank: September.
Appleton, Simon. 1999. "Changes in poverty in Uganda, 1992-1997" (mimeo), May.
Appleton, Simon. 1996. "Women-Headed Households and Household Welfare: An EmpiricalDeconstruction for Uganda," World Development 24 (12) 1811-27.
Behrman, Jere R. and Barbara L. Wolfe. 1984. "Labor Force Participation and EarningsDeterminants for Women in the Special Conditions of Developing Countries," Journal ofDevelopment Economics (Netherlands) (May-August) 15: pp.259-288.
Bhushan, Indu and Shiyan Chao. "Measurement Issues in Gender-Based Poverty Comparisons:Lessons from Ghana" (minmeo), June 1997.
Brown, Lynn R. and Joanna KerT. 1997. The Gender Dimensions of Economic Reforms inGhana, Mali, and Zambia Trhe North-South Institute, Ottawa, Ontario.
Canagarajah, S., D. Mazumdar, and Ye Xiao. 1998. The Structure and Determinants ofInequality and Poverty Reduction in Ghana, World Bank Policy Research Working PaperSeries no. 1998, Washington DC.
Cleaver, Kevin M. and W. Graeme Donovan. 1995. "Agriculture, Poverty, and Policy Reform inSub-Saharan Africa" World Bank Technical Discussion Papers 280, Washington DC.
Coulombe, H. and A. McKay. 1995. "An Analysis of Changes in Poverty in Ghana 1987/88 -1991/92." (mimeo) Department of Economics: University of Warwick (April).
Deininger, K. and J. Okidi. 1999. "Determinants of Agricultural Productivity and Non-FarmEnterprise Startups: The Case of Uganda." (mimeo) September.
Hazell, Peter and Steven Haggblade. 1993. "Farm-Nonfarrn Growth Linkages and the Welfare ofthe Poor" in Lipton and Van der Gaag (eds) Including the Poor, Washington DC: TheWorld Bank.
Lanjouw, Peter. 1998. "Ecuador's Rural Nonfarm Sector as a Route Out of Poverty" PolicyResearch Working Paper, 1094. The World Bank: March.
Lanjouw, Jean 0. and Peter Lanjouw. 1995. "Rural Nonfarm Employment: A Survey" " PolicyResearch Working Paper, 1463. The World Bank: May.
35

Lloyd, Cynthia B. and Anastasia J. Brandon. 1991. "Women's Role in Maintaining Households:Poverty and Gender Inequality in Ghana" Population Council Research Division WorkingPaper 25, New York.
Mugyenyi, Mary R. 1998. "Towards the empowerment of women: a critique of NRM policiesand programmes" in ed. Holger Bernt Hansen and Michael Twaddle, Developing UgandaOxford: James Currey Ltd, p. 133-144.
Ranis, Gustav and Frances Stewart. 1993. "Rural Nonagricultural Activities in Development:Theory and Application" Journal of Development Economics Vol. 40: pp. 75-101.
Huppi, Monika and Martin Ravallion. 1991. "The Sectoral Structure of Poverty During anAdjustment Period: Evidence for Indonesia in the Mid-1980s" World Development, Vol. 19,No. 12, pp.1653-78.
Louat, Grosh and van der Gaag. 1993. "Welfare Implications of Female Headship in JamaicanHouseholds" Living Standards Measurement Study Working Paper No. 96. The WorldBank.
Mason, Andrew and Jacqueline Baptist. 1996. "How Important Are Labor Markets to theWelfare of Indonesia's Poor?" Policy Research Working Paper, 1665. The World Bank:October.
Reardon, Thomas. 1997. "Using Evidence of Household Income Diversification to Inform Studyof the Rural Nonfarm Labor Market in Africa" World Development Vol. 25 (5).
Reardon, Thomas and J. Edward Taylor. 1996. "Agroclimactic Shock, Income Inequality, andPoverty: Evidence from Burkina Faso," World Development Vol. 24 (5): pp. 901-914.
Rosenhouse, Sandra. 1989. "Identifying the Poor: Is "Headship" a Useful Concept?" LivingStandards Measurement Study Working Paper No. 58. The World Bank.
Quisumbing, Agnes R., Lawrence Haddad, and Christine Pefia. 1995. "Gender and Poverty: NewEvidence from Ten Developing Countries" Food Consumption and Nutrition DivisionDiscussion Paper No.9, International Food Policy Research Institute, December.
van de Walle, Dominique. 1994. "Rural Poverty in an Emerging Market Economy: IsDiversification into Nonfarm Activities in Rural Viet Nam the Solution?" Policy ResearchDepartment. The World Bank, mimeo.
World Bank. 1997. "Bangladesh: The Non-Farm Sector in a Diversifying Rural Economy"Report No. 16740-BD.
World Bank. 1994. "The Many Faces of Poverty." Status Report on Poverty in Sub-SaharanAfrica. Technical Department, Africa Region.
36
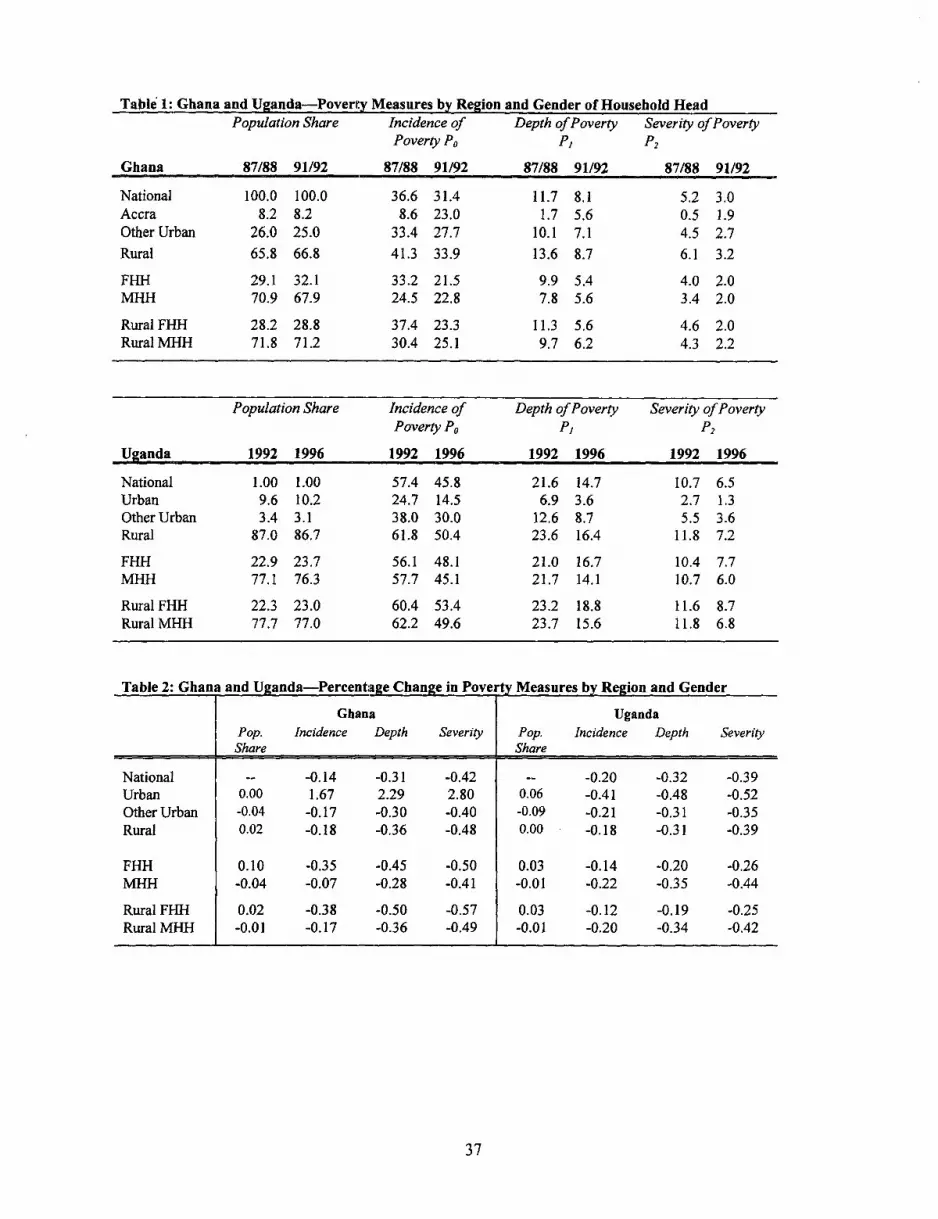
Table 1: Ghana and Uganda-Poverty Measures by Region and Gender of Household HeadPopulation Share Incidence of Depth of Poverty Severity of Poverty
Poverty Po P1 P2
Ghana 87/88 91/92 87/88 91/92 87/88 91/92 87/88 91/92
National 100.0 100.0 36.6 31.4 11.7 8.1 5.2 3.0Accra 8.2 8.2 8.6 23.0 1.7 5.6 0.5 1.9Other Urban 26.0 25.0 33.4 27.7 10.1 7.1 4.5 2.7Rural 65.8 66.8 41.3 33.9 13.6 8.7 6.1 3.2
FHH 29.1 32.1 33.2 21.5 9.9 5.4 4.0 2.0MHH 70.9 67.9 24.5 22.8 7.8 5.6 3.4 2.0
Rural FHH 28.2 28.8 37.4 23.3 11.3 5.6 4.6 2.0Rural MHH 71.8 71.2 30.4 25.1 9.7 6.2 4.3 2.2
Population Share Incidence of Depth of Poverty Severity of PovertyPoverty PO PI P2
Uganda 1992 1996 1992 1996 1992 1996 1992 1996
National 1.00 1.00 57.4 45.8 21.6 14.7 10.7 6.5Urban 9.6 10.2 24.7 14.5 6.9 3.6 2.7 1.3OtherUrban 3.4 3.1 38.0 30.0 12.6 8.7 5.5 3.6Rural 87.0 86.7 61.8 50.4 23.6 16.4 11.8 7.2
FHH 22.9 23.7 56.1 48.1 21.0 16.7 10.4 7.7MHH 77.1 76.3 57.7 45.1 21.7 14.1 10.7 6.0
Rural FHH 22.3 23.0 60.4 53.4 23.2 18.8 11.6 8.7Rural MHH 77.7 77.0 62.2 49.6 23.7 15.6 11.8 6.8
Table 2: Ghana and Uganda-Percentage Change in Pove] 1y Measures by Region and Gender
Ghana UgandaPop. Incidence Depth Severity Pop. Incidence Depth SeverityShare Share
National -- -0.14 -0.31 -0.42 -- -0.20 -0.32 -0.39Urban 0.00 1.67 2.29 2.80 0.06 -0.41 -0.48 -0.52Other Urban -0.04 -0.17 -0.30 -0.40 -0.09 -0.21 -0.31 -0.35Rural 0.02 -0.18 -0.36 -0.48 0.00 -0.18 -0.31 -0.39
FHH 0.10 -0.35 -0.45 -0.50 0.03 -0.14 -0.20 -0.26MHH -0.04 -0.07 -0.28 -0.41 -0.01 -0.22 -0.35 -0.44
Rural FHH 0.02 -0.38 -0.50 -0.57 0.03 -0.12 -0.19 -0.25Rural MHH -0.01 -0.17 -0.36 -0.49 -0.01 -0.20 -0.34 -0.42
37

Table 3: Rural Poverty Changes by Agriculture/Non-farm Rural Industry: Ghana and Uganda
Pop. Share Incidence Depth Severity
Ghana 87/88 91/92 87/88 91/92 % A 87/88 91/92 % A 87/88 91/92 % A
Agriculture-mainjob 80.4 79.2 41.2 31.9 -0.23 13.8 8.2 -0.41 6.3 3 -0.52Non-farm-main job 29.6 20.8 27.2 20.6 -0.24 7.7 4.9 -0.36 3 1.7 -0.43
Any agriculture 91.4 88.7 39.4 30.6 -0.22 12.9 7.8 -0.40 5.8 2.8 -0.52Any non-farm 37.7 35.6 31.7 24.0 -0.24 9.5 6.0 -0.37 3.9 2.2 -0.44
Agriculture only 62.0 64.4 42.7 32.7 -0.23 14.5 8.3 -0.43 6.7 3.0 -0.55Non-farm only 8.2 11.3 28.5 21.3 -0.25 9.1 5.2 -0.43 3,6 1.8 -0.50Both AG and NF 29.5 24.4 32.5 25.3 -0.22 9.6 6.4 -0.33 4.0 2.3 -0.43
Pop. Share Incidence Depth Severity
Uganda 1992 1996 1992 1996 %A 1992 1996 %A 1992 1996 %A
Agriculture-main job 85.6 84.0 64.0 50.9 -0.20 24.5 16.5 -0.33 12.3 7.3 -0.41Non-farm-mainjob 14.4 16.0 46.3 31.8 -0.31 16.3 9.1 -0.44 7.9 3.7 -0.53
Any agriculture 91.2 92.6 62.9 49.5 -0.21 24.0 16.0 -0.33 12.0 7.1 -0.41Any non-farm 27.0 39.0 54.4 39.8 -0.27 19.9 12.0 -0.40 9.7 5.1 -0.47
Agriculture only 73.0 60.8 64.0 53.0 -0.17 24.6 17.4 -0.29 12.4 7.7 -0.38Non-farm only 8.8 7.2 46.3 26.9 -0.42 16.9 6.9 -0.59 8.4 2.5 -0.70BothAGandNF 18.2 31.8 58.5 42.9 -0.27 21.4 13.2 -0.38 10.4 5.7 -0.45
Table 4: Rural Poverty by Gender and Agriculture/Nonfarm Sector*FHH MHH
Pop. Share Incidence Pop. share IncidenceGhana 87/88 91/92 87/88 91/92 % A 87/88 91/92 87/88 91/92 % A
Agriculture-mainjob 69.4 63.9 0.51 0.37 -0.27 76.1 74.9 0.41 0.37 -0.10Non-farm-main job 30.6 36.1 0.34 0.22 -0.35 23.9 25.1 0.29 0.24 -0.17
Any agriculture 86.0 78.8 37.7 25.3 -0.33 93.7 90.5 31.0 26.4 -0.15Any non-farm 55.8 56.3 32.8 20.3 -0.38 44.0 39.7 23.1 18.9 -0.18
Agriculture only 0.44 0.44 40.9 28.1 -0.31 0.56 0.60 36.1 29.5 -0.18Non-farm only 0.14 0.21 28.4 17.8 -0.37 0.06 0.09 20.8 14.2 -0.32BothAGandNF 0.42 0.35 34.4 21.8 -0.37 0.39 0.30 23.5 20.3 -0.14
FHH MHHPop. Share Incidence Pop. share Incidence
Uganda 1992 1996 1992 1996 % A 1992 1996 1992 1996 % A
Agriculture-mainjob 87.3 85.6 57.9 48.1 -0.17 74.1 73.2 61.4 46.8 -0.24Non-farm-main job 12.7 14.5 40.2 28.6 -0.29 25.9 26.8 39.8 29.3 -0.26
Any agriculture 91.1 94.2 57.0 46.8 -0.18 87.1 89.1 58.6 44.4 -0.24Any non-farm 28.0 46.0 52.4 41.9 -0.20 50.1 50.8 49.1 33.9 -0.31
Agriculture only 0.73 0.55 56.8 48.4 -0.15 0.50 0.48 62.4 50.9 -0.18Non-farm only 0.09 0.05 40.9 23.1 -0.44 0.13 0.11 37.1 23.4 -0.37BothAGandNF 0.18 0.39 57.9 44.4 -0.23 0.37 0.41 53.4 36.8 -0.31
38

Table 6: Participation trends by industry grouping: Uganda1992 1996
Industry grouping: Men Main Secondary Main Secondary
Obs % Obs % Obs % Obs %Agri/Livestock/Agri Services 4720 80.27 2301 71.37 2455 75.35 1034 57.89Fish/Forest/Mining 126 2.14 125 3.88 100 3.07 96 5.38Manuf Food/Beverages/Tobacco 65 1.11 115 3.57 51 1.57 101 5.66Manuf:Textil./Wood/Leather/Handicraft 88 1.50 118 3.66 69 2.12 136 7.61Manuf: Paper/Chem/Metal/Nonmetal 43 0.73 74 2.30 41 1.26 71 3.98Util/Cons/Trans & Comm. 154 2.62 64 1.99 112 3.44 68 3.81Wholesale/Retail Trade 227 3.86 239 7.41 185 5.68 189 10.58Restaurant/Repair/Other Services 77 1.31 88 2.73 71 2.18 54 3.02Pub. Admin/Education 303 5.15 26 0.81 138 4.24 11 0.62Prof & Financial Services 77 1.31 74 2.30 36 1.10 26 1.46Total 5880 100 3224 100 3258 100 1786 100
Industrygrouping: Women Main Secondary | Main Secondary
Obs % Obs % Obs % Obs %Agri/Livestock/Agri Services 5691 94.33 1407 71.86 3543 91.84 530 35.19Fish/Forest/Mining 17 0.28 14 0.72 31 0.80 92 6.11Manuf: Food/Beverages/Tobacco 44 0.73 344 17.57 53 1.37 283 18.79Manuf:Textil./Wood/Leather/Handicraft 44 0.73 86 4.39 35 0.91 403 26.76Manuf: Paper/Chem/Metal/Nonmetal 5 0.08 2 0.10 5 0.13 16 1.06Util/Cons/Trans& Comm. 8 0.13 2 0.10 10 0.26 11 0.73Wholesale/Retail Trade 66 1.09 60 3.06 74 1.92 110 7.30Restaurant/Repair/Other Services 46 0.76 30 1,53 58 1.50 55 3.65Pub. Admin/Education 88 1.46 4 0.20 30 0.78 1 0.07Prof & Financial Services 24 0.40 9 0.46 19 0.49 5 0.33Total 6033 100 1958 100 3858 100 1506 100
Table 7: Participation trends by industry grouping: Ghana__ _ _ _ _ _ _ __ _ _ _ _ _ _ 1987/88 1991/92
Industrygrouping: Men J Main Seconda!! a Main SecondaryObs % Obs % Obs % Obs %
Agri/Livestock/Agri Services 2144 84.14 391 52.13 2675 82.92 377 53.48Fish/Forest/Mining 80 3.14 64 8.53 89 2.76 24 3.4Manuf Food/Beverages/Tobacco 24 0.94 58 7.73 23 0.71 74 10.5Manuf:Textil./Wood/Leather/Handicraft 39 1.53 36 4.8 63 1.95 55 7.8Manuf: Paper/Chem/Metal/Nonmetal 15 0.59 34 4.53 27 0.84 30 4.26Util/Cons/Trans & Comrn. 47 1.84 28 3.73 79 2.45 29 4.11Wholesale/Retail Trade 36 1.41 72 9.6 56 1.74 71 10.07Restaurant/Repair/Other Services 39 1.53 45 6 36 1.12 21 2.98Pub. Admin/Education 89 3.49 8 1.07 123 3.81 5 0.71Prof & Financial Services 35 1.37 14 1.87 55 1.7 19 2.7Total 2548 100 750 100 3226 100 705 100
Industry grouping: Women M - lain Secondary | Main SecondaryObs % Obs % Obs % Obs %
Agri/Livestock/Agri Services 2183 80.23 300 33.67 2793 78.61 299 29.49Fish/Forest/Mining 8 0.29 52 5.84 5 0.14 0 0Manuf: Food/Beverages/Tobacco 124 4.56 146 16.39 155 4.36 199 19.63Manuf:Textil./Wood/Leather/Mandicraft 35 1.29 26 2.92 39 1.1 15 1.48Manuf: Paper/Chem/Metal/Nonmetal 20 0.74 25 2.81 18 0.51 63 6.21Util/Cons/Trans & Comm. 2 0.07 3 0.34 2 0.06 1 0.1Wholesale/Retail Trade 257 9.45 302 33.89 439 12.36 420 41.42Restaurant/Repair/Other Services 35 1.29 33 3.7 45 1.27 12 1.18Pub. Admin/Education 36 1.32 2 0.22 49 1.38 1 0.1Prof. & Financial Services 21 0.77 2 0.22 8 0.23 4 0.39Total 2721 100 891 100 3553 100 1014 100
39

Table 8: Main and Seconda Occupations-- Rural Ghana
Main Occupation 1987 1991 1987 1991
+ Secondary occupation Men Women
Obs % Obs % Obs % Obs %
Farming 1408 62.9 2208 70.1 1243 54.4 1981 57.8+Wageemployment 114 5.1 64 2.0 31 1.4 10 0.3+ Self-employment 239 10.7 266 8.4 477 20.9 661 19.3
Wage employment 72 3.2 130 4.1 26 1.1 37 1.1+ Farning 201 9.0 216 6.9 50 2.2 37 1.1
Self-employment 48 2.1 102 3.2 209 9.1 426 12.4+ Farming 89 4.0 124 3.9 212 9.3 259 7.6
Subtotal 2171 97.0 3110 98.8 2248 98.3 3411 99.5All other 66 3.0 38 1.2 38 1.7 17 0.5TOTAL 2237 100 3148 100 2286 100 3428 100
Male Household Heads Female Household HeadsObs % Obs % Obs % Obs %
Farming 640 52.2 1212 60.0 151 36.2 323 41.8+ Wage employment 63 5.1 59 2.9 5 1.2 8 1.0+ Self-employment 183 14.9 236 11.7 102 24.5 153 19.8
Wage employment 46 3.8 100 4.9 11 2.6 20 2.6+ Farming 166 13.6 203 10.0 21 5.0 16 2.1
Self-employment 22 1.8 73 3.6 46 11.0 137 17.7+ Farming 54 4.4 103 5.1 65 15.6 103 13.3
Subtotal 1174 95.8 1986 98.3 401 96.2 760 98.3All other 51 4.2 35 1.7 16 3.8 13 1.7TOTAL 1225 100 2021 100 417 100 773 100
Female Spouses Females (not HHd or spouse)Obs % Obs % Obs % Obs %
Farming 618 55.8 958 55.4 473 62.1 698 75.5+ Wage employment 11 1.0 1 0.1 15 2.0 1 0.1+ Self-employment 278 25.1 420 24.3 97 12.7 88 9.5
Wage employment 5 0.5 11 0.6 10 1.3 6 0.6+ Farmning 17 1.5 14 0.8 12 1.6 7 0.8
Self-employment 72 6.5 194 11.2 91 11.9 95 10.3+ Farming 92 8.3 129 7.5 55 7.2 27 2.9
Subtotal 1093 98.7 1727 99.9 753 98.8 922 99.8All other 14 1.3 2 0.1 9 1.2 2 0.2TOTAL 1107 100 1729 100 762 100 924 100
Source: GLSSI (1987-88) and GLSS3 (1991-92)
40

Table 9: Main and Seconda Occupations-Rural Uganda
Main Occupation 1992 1996 1992 1996
+ Secondary occupation Men Women
Obs % Obs % Obs % Obs %
Farming 4208 60.2 1752 53.8 6118 85.4 2579 66.8+ Wage employment 603 8.6 148 4.5 127 1.8 31 0.8+ Self-employment 583 8.3 538 16.5 472 6.6 924 24.0
Wage employment 620 8.9 173 5.3 145 2.0 37 1.0+ Farming 471 7.2 212 6.5 67 0.8 39 1.0
Self-employment 257 3.7 158 4.9 169 2.4 93 2.4+ Farming 201 2.9 235 7.2 55 0.8 140 3.6
Subtotal 6943 99.3 3216 98.8 7147 98.8 3843 96.4All other 44 0.7 41 1.2 15 0.2 13 0.4TOTAL 6987 100 3257 100 7162 100 3856 100
Male Household Heads Female Household HeadsObs % Obs % Obs % Obs %
Farming 2089 49.7 1183 49.1 1009 72.5 476 54.0+ Wage employment 505 12.0 120 5.0 54 3.9 9 1.0+ Self-employment 521 12.4 460 19.1 165 11.9 269 30.5
Wage employment 349 8.3 109 4.5 47 3.4 12 1.4+ Farming 385 9.2 180 7.4 23 1.7 15 1.7
Self-employment 156 23.7 116 4.8 61 4.4 32 3.6+ Farming 167 4.0 207 8.6 26 1.9 63 7.1
Subtotal 4172 99.3 2375 98.7 1385 99.7 876 99.3All other 34 0.7 34 1.3 6 0.3 6 0.7TOTAL 4206 l00 2409 100 1391 100 882 100
Female Spouses Females (not HHd or spouse)Obs %1 Obs % Obs % Obs %
Farming 3331 89.0 1547 71.8 1785 87.7 556 68.0+ Wage employment 50 1.3 15 0.7 23 1.1 7 0.9+ Self-employment 222 5.9 488 22.6 86 4.2 167 20.4
Wage employment 41 1.1 3 0.1 57 2.8 22 2.7+ Farming 24 0.7 8 0.4 14 0.7 16 1.9
Self-employment 57 1.5 38 1.8 51 2.5 23 2.8+ Farming 13 0.4 52 2.4 16 0.8 25 3.1
Subtotal 3738 99.9 2151 99.8 2032 99.8 816 99.8All other 4 0.1 5 0.2 5 0.2 2 0.2TOTAL 3742 100 2156 100 2037 100 818 1000
Source: IHS (1992-93) and NHS-4 (1996-97)
41

Table 10: Ghana Real Income (Adjusted values)*
1987 Men Women % Dif Women/Men
Obs Mean Median Obs Mean Median Mean Median
AG 1984 75,803 33,623 1907 50,818 23,042 -33.0 -31.5SE 267 199,272 70,956 729 169,917 61,495 -14.7 -13.3Wage 392 217,586 188,908 116 160,461 162,588 -26.3 -13.9Total 2237 129,143 54,971 2286 104,721 36,866 -18.9 -32.9
1991 Men Women % Diff Women/Men
Obs Mean Median Obs Mean Median Mean Median
AG 2797 76,861 42,485 2861 51,892 30,792 -32.5 -27.5SE 494 267,567 134,041 1346 238,836 95,519 -10.7 -28.7Wage 446 328,656 300,398 92 222,564 227,629 -32.3 -24.2Total 3148 156,482 67,303 3428 143,061 55,638 -8.6 -17.3
Table 11: Uganda Mean Income (Adjusted values to 1989 prices)
1992 MHHO FHHO % diff FHHO/MHHO
Obs Mean Median Obs Mean Median Mean Median
AG 3,954 125,391 87,983 1,300 93,945 61,878 -25.1 -29.7SE 1,197 117,823 51,302 370 63,875 35,517 -45.8 -30.8Wage 1,417 81,975 52,091 307 65,827 35,517 -19.7 -31.8Total 4,323 176,135 123,441 1,424 118,005 80,446 -33.0 -34.8
1996 MHHO FHHO % diff FHHO/MHHO
Obs Mean Median Obs Mean Median Mean Median
AG 2,406 185,563 126,384 902 114,556 78,238 -38.3 -38.1SE 875 192,557 78,238 295 84,623 36,110 -56.1 -53.8Wage 947 147,272 72,219 199 91,682 36,110 -37.7 -50.0Total 4,210 304,573 203,267 1,387 160,846 108,329 -47.2 -46.7
The values shown in both tables are those for which the adjusted income is different from zero. The numbers in each group addup to more than the total number of observations since many have several types of income.
42

Table 12: Mean Income Shares from Individual Incomes-Ghana
Ghana Men Women MHH FHH
Sector 1987 1991 1987 1991 1987 1991 1987 1991
Farm 0.77 0.76 0.71 0.67 0.70 0.68 0.56 0.51Self-employment 0.09 0.11 0.25 0.31 0.10 0.15 0.34 0.43Wage employment 0.14 0.13 0.04 0.02 0.20 0.17 0.10 0.06
Obs 2237 3148 2286 3428 1225 2021 417 773
Ghana Married Men Married Women Other men Other Women
Sector 1987 1991 1987 1991 1987 1991 1987 1991
Farm 0.70 0.69 0.71 0.63 0.86 0.91 0.75 0.82Self-employment 0.10 0.14 0.25 0.34 0.07 0.05 0.22 0.17Wage employment 0.20 0.17 0.04 0.02 0.07 0.03 0.03 0.01
Obs 1148 1718 1445 2095 910 1080 587 794
Table 13: Mean Income Shares from household incomes
Ghana MHHO FHHOSector 1987/88 1991/92 1987/88 1991/92
Agriculture 0.65 0.60 0.52 0.49Self-employnment 0.18 0.25 0.34 0.44Wage labour 0.17 0.15 0.13 0.07
Obs 1265 2059 432 783
Uganda MHH{0 FHHOSector 1992 1996 1992 1996
Agriculture 0.71 0.70 0.76 0.78Self-employment 0.12 0.14 0.12 0.13Wage labour 0.16 0.17 0.10 0.10
Obs 4323 2579 1424 962
43

Policy Research Working Paper Series
ContactTitle Author Date for paper
WPS2352 How Stronger Patent Protection in Carsten Fink May 2000 L. TabadaIndia Might Affect the Behavior 36896of Transnational PharmaceuticalIndustries
WPS2353 The Sao Mateus-Jabaquara Jorge Rebelo May 2000 S. Van VeldhuizenTrolleybusway Concession in Brazil Pedro Machado 38722
WPS2354 When the Bureaucrats Move out of Yi Chen May 2000 M. YafiBusiness: A Cost-Benefit Ishac Diwan 34649Assessment of Labor Retrenchmentin China
WPS2355 Greed and Grievance in Civil War Paul Collier May 2000 A. Kitson-WaltersAnke Hoeffler 33712
WPS2356 Bureaucratic Delegation and Political Philip Keefer June 2000 P. Sintim-AboagyeInstitutions: When Are Independent David Stasavage 37644Central Banks Irrelevant?
WPS2357 Evaluating Carbon Offsets from Kenneth M. Chomitz June 2000 J. AncrumForestry and Energy Projects: 33512How Do They Compare?
WPS2358 Why Infrastructure Financing Daniela Klingebiel June 2000 M. SalehiFacilities Often Fall Short of Their Jeff Ruster 37157Objectives
WPS2359 Reducing Carbon Dioxide Emissions Will Martin June 2000 L. TabadaThrough Joint Implementation of 36896Projects
WPS2360 Corruption and the Composition of Beata K. Smarzynska June 2000 H. SladovichForeign Direct Investment: Shang-Jin Wei 37698Firm-Level Evidence
WPS2361 The Welfare Effects of Private Sector George Clarke June 2000 H. SladovichParticipation in Guinea's Urban Water Claude M6nard 37698Supply Ana Maria Zuluaga
WPS2362 A Transitory Regime: Water Supply Claude Menard June 2000 H. SladovichIn Conakry, Guinea George Clarke 37698
WPS2363 Would Collective Action Clauses Barry Eichengreen June 2000 S. KpundehRaise Borrowing Costs? An Update Ashoka Mody 39591and Additional Results
WPS2364 Perverse Effects of a Ratings- Patrick Honohan June 2000 A. YaptencoRelated Capital Adequacy System 38526

Policy Research Working Paper Series
ContactTitle Author Date for paper
WPS2365 Leading Indicator Project: Lithuania Stephen S. Everhart June 2000 M. GellerRobert Duval-Hernandez 85155
WPS2366 Fiscal Constraints, Collection Costs, Keiko Kubota June 2000 L. Tabadaand Trade Policies 36896


