Embed Size (px)
Citation preview

the assessment of animal Welfareon Broiler farms
Welfare QualIty reports No. 18
edited by
Bettina B. Bock and Ingrid de Jong
Welfare Quality reports
edited by Mara Miele and Joek roex
school of City and regional planning
Cardiff university
Glamorgan Building
King edward VII avenue
Cardiff
Cf10 3Wa
Wales
uK
tel.: +44(0)2920874462; fax: +44(0)2920874845;
e-mail: [email protected]
May 2010
the present study is part of the Welfare Quality® research project which has been co-
financed by the european Commission, within the 6th framework programme, contract
No. fooD-Ct-2004-506508. the text represents the authors’ views and does not
necessarily represent a position of the Commission who will not be liable for the use
made of such information.
© Copyright is held by the editors and the individual contributors 2010.
IsBN 978-1-908442-02-4
IssN 1749-5164
CONtENtS
Preface iii
Part I Synthesis of the Farm assessments in the UK, Italy and Netherlands 1
1 Introduction to Part I 3
2 Materials and Methods 5
3 results 15
4 Discussion 25
5 Conclusions to Part I 27
Part II Farmers’ Experiences of the Farm assessment: Interviews with 29
Farmers
6 Methodology 31
7 Farmers’ Definitions of animal Welfare 35
8 Farmers’ Comments on assessment Parameters 41
9 Farmers’ Experiences of the On-farm assessment 51
10 Farmers’ reactions to the assessment results 59
11 Differences between Farmers with the Best and Worst Welfare Scores 63
12 Conclusions to Part II 67
13 recommendations: Lessons to Be Learnt for Welfare Quality 71
appendix 73
Bibliography 95

PrEFaCE
the objective of work package 463 was to test the implementation of the WQ assessment
Scheme on regular broiler farms. We assessed the perception and attitudes of farmers
towards animal welfare and on-farm assessment, the experience and evaluation of the
assessment itself and the relevance and applicability of the results. at the same time animal
scientists assessed the welfare of the animals by WQ monitoring instruments. In addition
they scored foot pad lesions at the slaughterhouse by way of video imaging. Both studies
proceeded in parallel; farmers told, hence, about their real-life experience. It is to be noted
that the WQ monitoring instruments were not at their final state, and experiences and
comments of the farmers are to be interpreted as reflection and discussion on work in
progress.
a team of sociologists carried out the study on farmers’ experiences, perception and
attitude whereas the assessment of animal welfare was done by animal scientists. the
study took place in three countries – Netherlands, Italy and the UK.
We choose to focus on broilers for two main reasons. First of all the production cycle of
broilers is relatively short and so it is possible to assess the welfare of different flocks
within a short time-span and to check more easily any improvement of animal welfare as
a result of farmers’ interventions. a second reason for focusing on broilers is that it allows
us to link this project to another project where a new way of checking for foot-pad lesions
is developed. this is, moreover, a relatively easy manner of checking animal welfare that
allows us to lower the burden of three on-farm assessments considerably.
In the following we report on the results of the welfare assessment (Part I) and the
interviews with farmers about their perception and experience of animal welfare and the
welfare assessment (Part II). In both parts we compare the results across the participating
countries (Netherlands, Italy and United Kingdom). More in detail information on the
national results of welfare assessment and interviews with farmers can be found in the
deliverables 4.31.a (farmers’ interviews) and D4.31b (assessment results). as appendixes,
we provide the technical and sociological questionnaires and the assessment reports that
were sent to the farmers in the different countries.
Bettina B. Bock
Ingrid de Jong
iii

Part I
Synthesis of the Farm Assessments in the
UK, Italy and Netherlands
by
Ingrid C. de Jong, Andrew Butterworth,
Paolo Ferrari, Elena Andreoli, Valentina Ferrante,
Gisabeth Binnendijk, Steven N. Brown, Henk Gunnink,
Susanna Lolli, Nicola Labartino, Mirco Monti,
Enrico Spagnoli and Leonie WorkelWageningen University, Netherlands
University of Bristol, United Kingdom
CRPA Research Centre on Animal Production, Italy
University of Milan, Italy

3
the objective of work package 4.6.3 of Welfare Quality® was to test the implementation
of the WQ assessment scheme on regular broiler farms. We assessed the welfare of broilers
on farm and at the slaughter plant by using the WQ monitoring instruments. at the same
time, social scientists studied the perception and attitude of farmers towards
implementation strategies by way of on-farm interviews. Both studies proceeded in
parallel. We chose to focus on broiler chickens for two reasons. First, broilers have a
relatively short production cycle and, hence, we were able to do a pre-, interim- and post-
assessment of their welfare within a relatively short timespan, and we were able to check
possible improvements after intervention. Second, in a previous Welfare Quality® project
an automated system was developed to monitor foot pad lesions in broiler chickens by
means of video imaging (Work package 2.2., task 2.2.14). this allowed us to reduce the
measurements in the interim round to only automatic monitoring of foot pad lesions at the
slaughter plant (in Italy and the netherlands, manual recording was necessary in the uK),
thus reducing the number of visits to the farms, which are time consuming for the farmer
as well as for the researchers. In this report we compare the results of the on-farm
assessment studies in the netherlands, Italy and the uK.
1
IntroductIon to Part I

5
2.1 FarMs
2.1.1 dutch FarMs
eighteen farms participated in the on-farm assessment. all farms were contracted by the
same slaughter plant, located in the south-east of the netherlands. all farms were also
located in the south of the netherlands. the reason for the focus on one slaughter plant was
that the video imaging equipment to monitor foot pad lesions (MeYn camera) was
installed there. the slaughter plant provided us with a list of contracted farms. From that
list, farms with fast growing strains were selected. We contacted these farmers by phone
and asked them if they were willing to participate in the project. Farms that participated
received a financial support of €120 for both visits. at each farm, only one (and the same)
house was visited in the pre- and post-assessment, and measurements were carried out for
these birds (if possible, if these birds could be separated from other flocks of that particular
farm) at the slaughter plant.
2.1.2 italian FarMs
eighteen farms participated in the on-farm assessment. all farms were contracted by the
same company (amadori Group) and by the same slaughter plant, which is located close
to them, in the south-east of the emilia-romagna region. the reason for the focus on one
slaughter plant was that the video imaging equipment to monitor foot pad lesions (MeYn
camera) was installed there. the farms were selected by crPa in collaboration with the
responsible person of the quality insurance of the slaughterhouse. the farmers had been
contacted by phone and asked if they were willing to participate in the project. at each
farm, only one (and the same) house was visited in the pre- and post-assessment and
measurements were done for the birds inside the house and later at the slaughter plant.
2
Materials and Methods
6 / The Assessment of Animal Welfare on Broiler Farms
2.1.3 uK FarMs
ten farms participated in the on-farm assessment. all farms were contracted by the same
slaughter plant, all of which were located in the south-west of the united Kingdom. the
reason for the focus on one slaughter plant was that the video imaging equipment to
monitor foot pad lesions (MeYn camera) was installed there. due to design of the plant,
the camera was used ‘manually’ and this required the assessor to visit the plant during the
slaughter of the birds from the sample farms. this somewhat increased the number of total
visits required. the slaughter plant provided a list of contracted farms. From the list, free-
range farms using the Freedom Food standards were selected (see appendix 1). the
farmers were contacted by phone and asked if they were willing to participate in the
project. at each farm, only one house was assessed, and the same house was monitored for
the two farm visits and all three slaughter plant visits. no financial reward was offered to
the farms, but a small ‘thank you’gift (not money) was provided to all farms at the end of
the study period.
2.2 Procedure
the complete ‘broiler welfare monitor’ consisted of a farm visit of one day (between 5 and
1 days before slaughter) as well as a visit to the slaughter plant at the day of slaughter of
the birds (see below for a description of the broiler welfare monitor). For the dutch farms,
a complete assessment was carried out for only 10 farms in the pre-assessment round. For
the remaining farms in the the pre-assessment round and all farms in the post-assessment
of the dutch study round only the farm was visited and not the slaughter plant. in addition,
for as many farms as was possible, foot pad lesions were measured using the video imaging
equipment in the pre-, interim- and post-assessment rounds. as the italian farmers
slaughter the chickens at a higher age and live weights than in the intensive dutch farms
surveyed, the research team agreed to assess the birds in the italian farms when they were
about 6 weeks old in order to achieve comparable results; therefore the intervals between
the visits in the italian farms and the slaughter days were 7 days on average, (ranging from
2 to 13). in italy, the complete assessment was carried out for 10 farms in the pre-
assessment round. For the other farms in the pre-assessment round, and all farms in the
post-assessment round, only farm visits took place. in addition, for all farms foot pad
lesions were measured using the video imaging equipment in the interim- and post-
assessment round (except for Farm 3 in the post assessment round). Moreover, for all
farms data was collected from the slaughterhouse regarding dead on arrival, rejections,
feed and water withdrawal times, transport time, waiting time in the lairage and slaughter
weights. For the 10 uK farms, the complete broiler welfare monitor including the slaughter
plant visit was carried out. in addition, foot pad lesions were measured using the video
imaging equipment in all assessment rounds and for all farms. dutch and italian farms
Materials and Methods / 7
were assigned to one of two treatment groups: farmers that only received their results and
benchmark results after pre-assessment (n=9 farms) and farmers that received their results,
benchmark results and feedback on their results by phone by one of the researchers of the
project after the pre-assessment (n=9 farms). in addition, they received the results of the
interim- and post-assessment round. the uK farms received their results after the pre-,
interim- and post-assessment as a feedback form and verbal discussion of any points of
interest to the farmer.
2.3 tiMe schedule
For the dutch farms, the pre-assessment was carried out between 2 april 2008 and 27
May 2008. the interim assessment was carried out between 11 July 2008 and 12
september 2008. the post-assessment was carried out between 1 september 2008 and 8
december 2008. due to an outbreak of Gumboro’s disease, the post-assessment for two
farms had to be postponed for one production cycle. For the italian farms, the pre-
assessment was carried out between 6 May 2008 and 25 June 2008, the interim assessment
between 26 July 2008 and 5 september 2008 and the post-assessment between 1
september 2008 and 14 november 2008. due to an emergency in Farm 3, the post-
assessed birds from Flock 3a had been slaughtered in another slaughterhouse and thus
the data could not be recorded. the team agreed to assess foot pad lesions and to collect
the data at slaughter of the birds of Flock 3B instead of those of Flock 3a because they
were reared in the same house and environment within the same production cycle and
using the same genetics and feeds; such data were not intended to be processed together
with those of the other post-assessed birds but to get useful information for further analysis.
For the uK farms, the pre-assessment was carried out between 5 november 2008 and 14
January 2009. the interim assessment was carried out between 19 January 2009 and 24
March 2009. the post-assessment was carried out between 24 March 2009 and 27 May
2009. the project was late in starting due the loss of key staff.
2.4 the Broiler WelFare Monitor
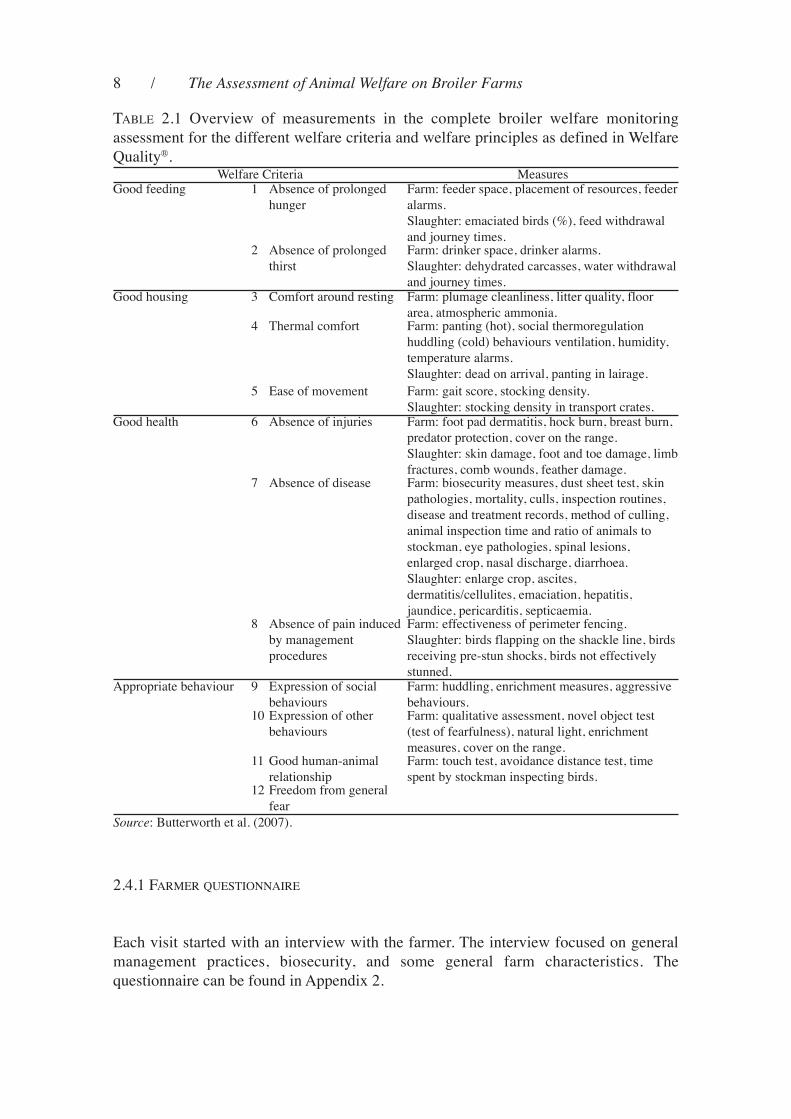
table 2.1 shows an overview of the measurements performed in the ‘broiler welfare
monitoring assessment’. how the different measures were performed is explained briefly
below. Before starting the farm visits, the researchers were trained during a two-day
session by experienced persons in how to perform the broiler monitoring assessment on
farm and at the slaughter plant.
8 / The Assessment of Animal Welfare on Broiler Farms
taBle 2.1 overview of measurements in the complete broiler welfare monitoring
assessment for the different welfare criteria and welfare principles as defined in Welfare
quality®.Welfare criteria Measures
Good feeding 1 absence of prolonged
hunger
Farm: feeder space, placement of resources, feeder
alarms.
slaughter: emaciated birds (%), feed withdrawal
and journey times.2 absence of prolonged
thirst
Farm: drinker space, drinker alarms.
slaughter: dehydrated carcasses, water withdrawal
and journey times.Good housing 3 comfort around resting Farm: plumage cleanliness, litter quality, floor
area, atmospheric ammonia.4 thermal comfort Farm: panting (hot), social thermoregulation
huddling (cold) behaviours ventilation, humidity,
temperature alarms.
slaughter: dead on arrival, panting in lairage.
5 ease of movement Farm: gait score, stocking density.
slaughter: stocking density in transport crates.Good health 6 absence of injuries Farm: foot pad dermatitis, hock burn, breast burn,
predator protection, cover on the range.
slaughter: skin damage, foot and toe damage, limb
fractures, comb wounds, feather damage.7 absence of disease Farm: biosecurity measures, dust sheet test, skin
pathologies, mortality, culls, inspection routines,
disease and treatment records, method of culling,
animal inspection time and ratio of animals to
stockman, eye pathologies, spinal lesions,
enlarged crop, nasal discharge, diarrhoea.
slaughter: enlarge crop, ascites,
dermatitis/cellulites, emaciation, hepatitis,
jaundice, pericarditis, septicaemia.8 absence of pain induced
by management
procedures
Farm: effectiveness of perimeter fencing.
slaughter: birds flapping on the shackle line, birds
receiving pre-stun shocks, birds not effectively
stunned.appropriate behaviour 9 expression of social
behaviours
Farm: huddling, enrichment measures, aggressive
behaviours.10 expression of other
behaviours
Farm: qualitative assessment, novel object test
(test of fearfulness), natural light, enrichment
measures, cover on the range.11 Good human-animal
relationship
Farm: touch test, avoidance distance test, time
spent by stockman inspecting birds.12 Freedom from general
fear
2.4.1 FarMer questionnaire
each visit started with an interview with the farmer. the interview focused on general
management practices, biosecurity, and some general farm characteristics. the
questionnaire can be found in appendix 2.
Source: Butterworth et al. (2007).
Materials and Methods / 9
2.4.2 PantinG and huddlinG
the percentage of birds showing panting or huddling behaviour was estimated at three
locations in the house (entrance, center, far end of the house) (dutch and italian farms) or
five locations in the house (uK farms). the proportion of birds showing panting or
huddling was estimated and scored into 5 classes: 0=none, 1=a few, 2= a half, 3= more than
a half, 4= all birds showing panting/huddling behaviour. the average score per flock was
calculated.
2.4.3 qualitative Behavioural assessMent (qBa)
the behaviour of the birds was carefully observed for 10 min near to the entrance of the
house and in the center of the house. thereafter the behaviour of the birds was scored
according to 23 terms expressing their body language (see appendix 3 for details).
2.4.4 Behavioural tests
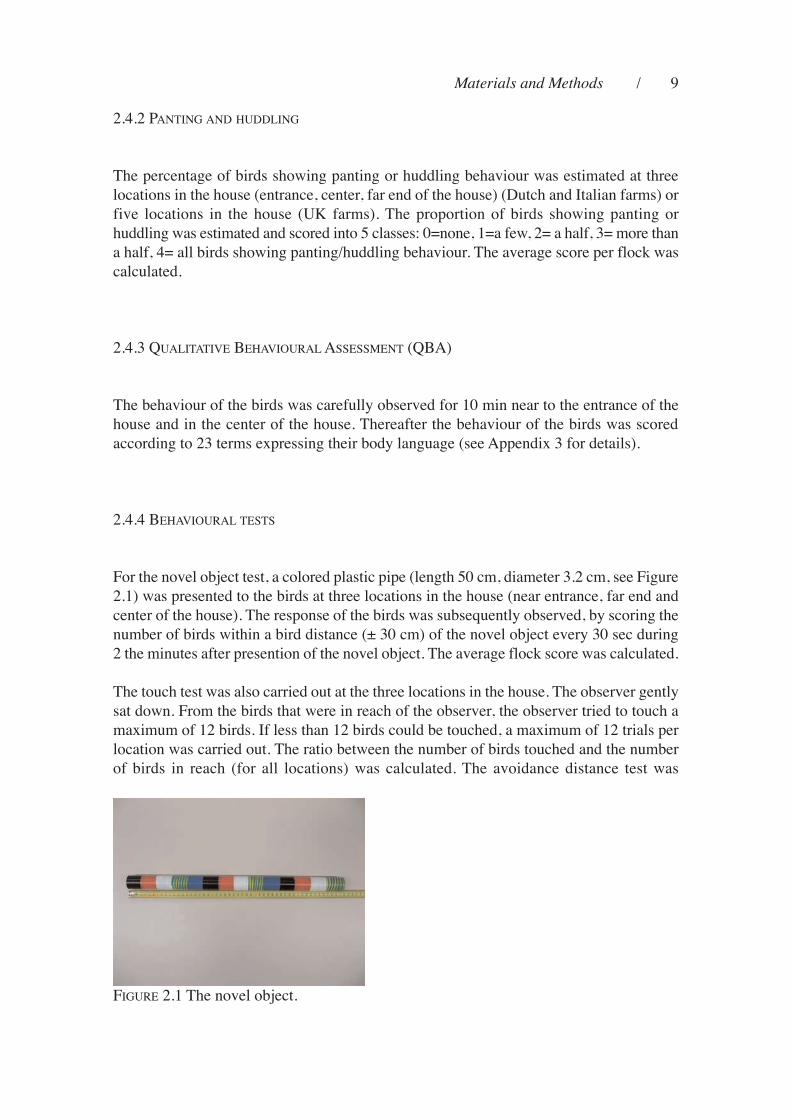
For the novel object test, a colored plastic pipe (length 50 cm, diameter 3.2 cm, see Figure
2.1) was presented to the birds at three locations in the house (near entrance, far end and
center of the house). the response of the birds was subsequently observed, by scoring the
number of birds within a bird distance (± 30 cm) of the novel object every 30 sec during
2 the minutes after presention of the novel object. the average flock score was calculated.
the touch test was also carried out at the three locations in the house. the observer gently
sat down. From the birds that were in reach of the observer, the observer tried to touch a
maximum of 12 birds. if less than 12 birds could be touched, a maximum of 12 trials per
location was carried out. the ratio between the number of birds touched and the number
of birds in reach (for all locations) was calculated. the avoidance distance test was
FiGure 2.1 the novel object.
10 / The Assessment of Animal Welfare on Broiler Farms
performed for the dutch and italian farms only. the avoidance distance test was carried
out when the observer gently walked trough the house, i.e. from the center to the far end,
from the far end to the entrance and near the entrance of the house. the observer chose a
bird at approximately 1.5 m distance that was focused in the direction of the observer.
then he walked towards the bird and measured the distance at which the bird stood up and
walked away from the observer. this was repeated seven times per location. the mean
distance per flock was calculated.
2.4.5 Gait score and litter qualitY
at 10 randomly chosen locations in the house, birds were penned using a catching pen.
twenty-five birds were subsequently stimulated to walk and their gait was scored using a
6-point scale (ranging from 0-5, where 0 means no walking deficiencies and 5 means that
a bird is unable to walk (Kestin et al. 1992)). a flock score was calculated: flock score =
((n birds score 0 * 0) + (n birds score 1 * 1) + (n birds score 2 * 2) + (n birds score 3 *
3) + (n birds score 4 * 4) + (n birds score 5 * 5)) / (total number of birds scored). at the
same locations, the litter was scored according to a 5 point scale where a score 1 means
that the litter is dry and flaky, and a score 5 means that the litter is wet and capped. For
the uK farms, due to the high activity level and the difficulty in catching birds in the free
range system a slight modification to the gait score method was employed. the house was
walked at a slow and steady pace and birds were scored for their gait using a 6-point scale
(ranging from 0-5, where 0 means no walking deficiencies and 5 means that a bird is
unable to walk (Kestin, 1992) a total of 150 birds were assessed. the litter was scored at
six representative locations throughout the house (pop holes, under drinkers, open areas)
according to the same scale as described above.
2.4.6 PatholoGies
at the same 10 locations as for the gait scoring, birds were penned using a catching pen
and 10 birds were scored for cleanliness, foot pad dermatitis, hock burn, breast burn and
pathologies. cleanliness was scored on a 4-point scale from 1 (clean) to 4 (dirty). Foot pad
dermatitis was scored on a 5 point scale from 0 (intact foot pads) to 4 (severe lesion). Both
feet were scored and the most severe score was noted. hock burns were scored on the
same scale as foot pad dermatitis. Breast burns were scored on a two point scale (0:
absence, 1: presence). in addition, for the dutch and italian farms every bird was scored
if it had one of the following pathologies: eye discharge or swollen eye, enlarged crop,
nasal discharge or respiratory noise, diarrhoea, spinal lesion. For cleanliness, hock burns
and foot pad lesions flock scores were calculated as described for the gait score in section
2.3.5.
Materials and Methods / 11
2.4.7 resource MeasureMents
in addition to the bird measurements, the following measurements were carried out with
respect to the resources/dimensions of the house: length and width of the house and
stocking density, feeder space per bird, type of feeders, evidence of spilled feed, type of
drinkers, evidence of leaks, number of drinkers per bird, light intensity at 6 randomly
chosen locations, ammonia (subjective score on a scale ranging from not detectable (score
0) to very unpleasant and difficulty in breathing (score 4)), ventilation characteristics, dust
(subjective score ranging between 0 and 4, by scoring the amount of dust on a black paper
that is laid down in the house at the start of the visit and scored at the end of the visit),
presence of enrichment, characteristics of an outdoor run (if present), evidence of feather
pecking or aggression.
2.4.8 MortalitY and culls
the total mortality since that the birds were placed was recorded and expressed as a
percentage of the birds placed. if known, the reasons for culling were scored.
2.4.9 WeiGhts
all weights as recorded by the farmer were noted.
2.4.10 Measures at the slauGhter Plant
2.4.10.1 Resource measurements/measures provided by the slaughter plant
at the slaughter plant, the following data were recorded: time of food and water
withdrawal, flock health report as provided by the slaughter plant, catching method,
percentage of dead-on-arrival (doa) as reported by the slaughter plant, stunner type,
stocking density in transport crates, slaughter age of the birds, percentage of rejections
with reason of rejection, percentage of birds with bruises, wing and limb fractures. not all
parameters could be recorded at the uK plant because the assessor had to be scoring feet
using the camera at the time that the birds were being processed (as the camera was not
fully automated in this plant) and so was unable to score some points when feet analysis
was taking place.
12 / The Assessment of Animal Welfare on Broiler Farms
2.4.10.2 Animal-based measures
after arrival, the percentage of birds showing panting or huddling behaviour in the lorry
and in the lairage was estimated and scored on a 5-point scale (0: no birds showing
panting/huddling to 4: all birds showing panting/huddling). this was not scored at the uK
plant. during the process of killing and slaughter, the number of birds flapping on the
shackle during four separate minute intervals was recorded at two locations. the
percentage of birds receiving pre-stun shocks was estimated by counting the number of
birds receiving pre-stun shocks during ten separate one-minute intervals. in addition, the
stunner effectiveness was determined by estimating the number of birds not adequately
stunned at ten separate one minute intervals at three locations: immediately after the
sticking point, during bleeding and at the entrance to the scalding tank. these parameters
were not scored at the uK plant.
the number of birds with wing damage was recorded during two separate periods of five
minutes. the number of birds with breast burn was recorded during two separate periods
of one minute. Breast burns were scored on a 3-point scale: 0= no burn, 1=mild breast
burn, 2=severe breast burn. the number of birds with foot pad lesions and hock burns
were scored during two separate five minute periods. Foot pad lesions and hock burns
were scored on a three-point scale, where 0=no foot or hock burn, 1=mild lesion, 2=severe
lesion (erosion) (for a description of these classifications, see Berg, 2004). in addition,
foot pad lesions were scored using the MeYn camera system for scoring foot pads. in the
dutch and italian slaughterhouse, the MeYn camera system was placed at the slaughter
line just after removing the feet from the carcass. each pair of feet was photographed and
scored according to the three-point scale as described above. the most severe score was
noted. due to differences in plant layout, the MeYn camera could not be mounted directly
on line for the uK plant. therefore a total of 500 feet comprising 250 left and 250 right
feet (unpaired) were collected during the processing of the flock and were assessed by
placing them manually in front of the camera. the feet were collected at various times as
the flock was being slaughtered. due to technical problems it was not possible to use the
MeYn system for all dutch and italian flocks.
2.5 statistical analYsis
not all parameters measured were statistically analysed. some parameters (slaughterhouse
measurements) were only performed in the pre-assessment , other parameters were not
selected because they were difficult to interpret or not reliable measured. For the
parameters not analysed we provide the means and standard error of the mean. the
following parameters were selected for analysis for effect of country and assessment round:
novel object test score, touch test (number of birds in reach, ratio of birds touched),
avoidance distance test, gait score (% birds with score 3 and more, and average flock
Materials and Methods / 13
score), litter quality, cleanliness (% birds with score 3 and more, and average flock score),
foot pad dermatitis and hock burn (% of birds with score 3 and more, and average flock
score), breast burn, % birds with enlarged crop, diarrhoea, respiratory disease, slaughter
weight, % doa and % rejections. as it turned out from the separate analyses of the dutch
and italian farms that there was no effect of intervention (see the country reports), and for
the uK farms the intervention took the form of an assessment report and verbal discussion
with individual farmers intervention was not taken as factor in the joint analysis of all
three countries. data were analysed using Genstat (committee Genstat, 2000). data were
analysed using an anova for unbalanced design, testing the effect of country, assessment
round and the interaction between both.

15
3.1 GeNeRal DeSCRiPTiON OF The FaRmS
3.1.1. DuTCh FaRmS
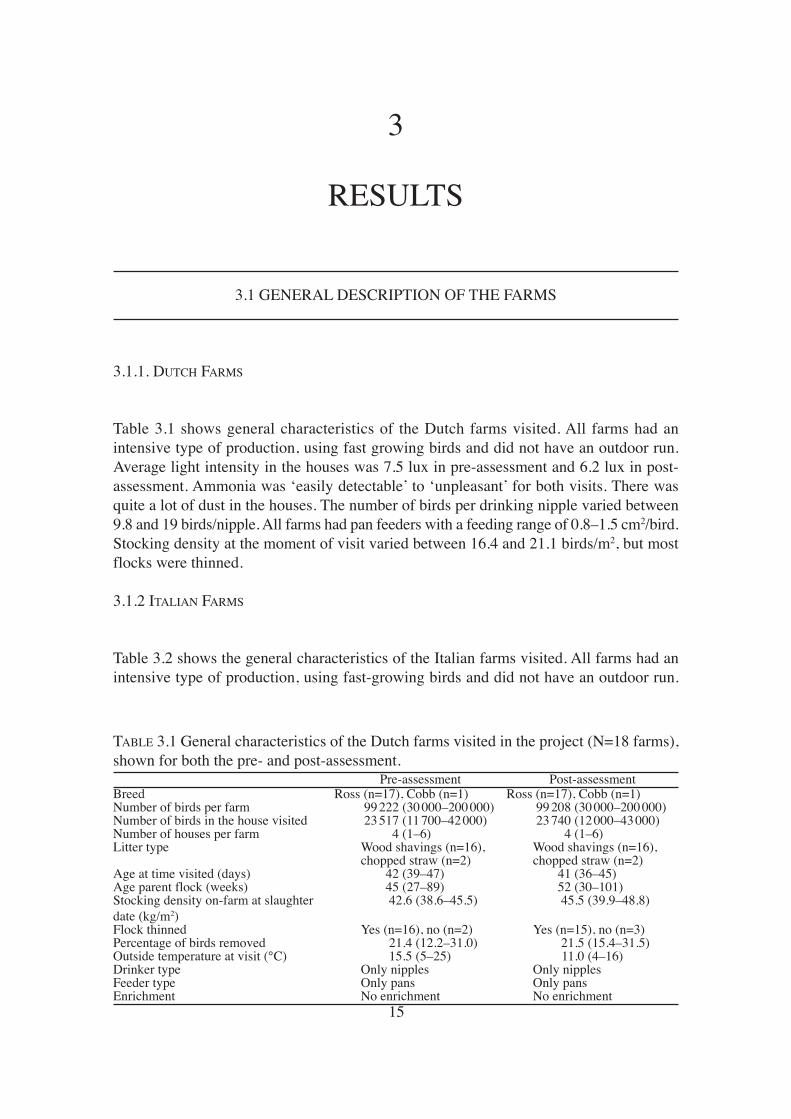
Table 3.1 shows general characteristics of the Dutch farms visited. all farms had an
intensive type of production, using fast growing birds and did not have an outdoor run.
average light intensity in the houses was 7.5 lux in pre-assessment and 6.2 lux in post-
assessment. ammonia was ‘easily detectable’ to ‘unpleasant’ for both visits. There was
quite a lot of dust in the houses. The number of birds per drinking nipple varied between
9.8 and 19 birds/nipple. all farms had pan feeders with a feeding range of 0.8–1.5 cm2/bird.
Stocking density at the moment of visit varied between 16.4 and 21.1 birds/m2, but most
flocks were thinned.
3.1.2 iTaliaN FaRmS
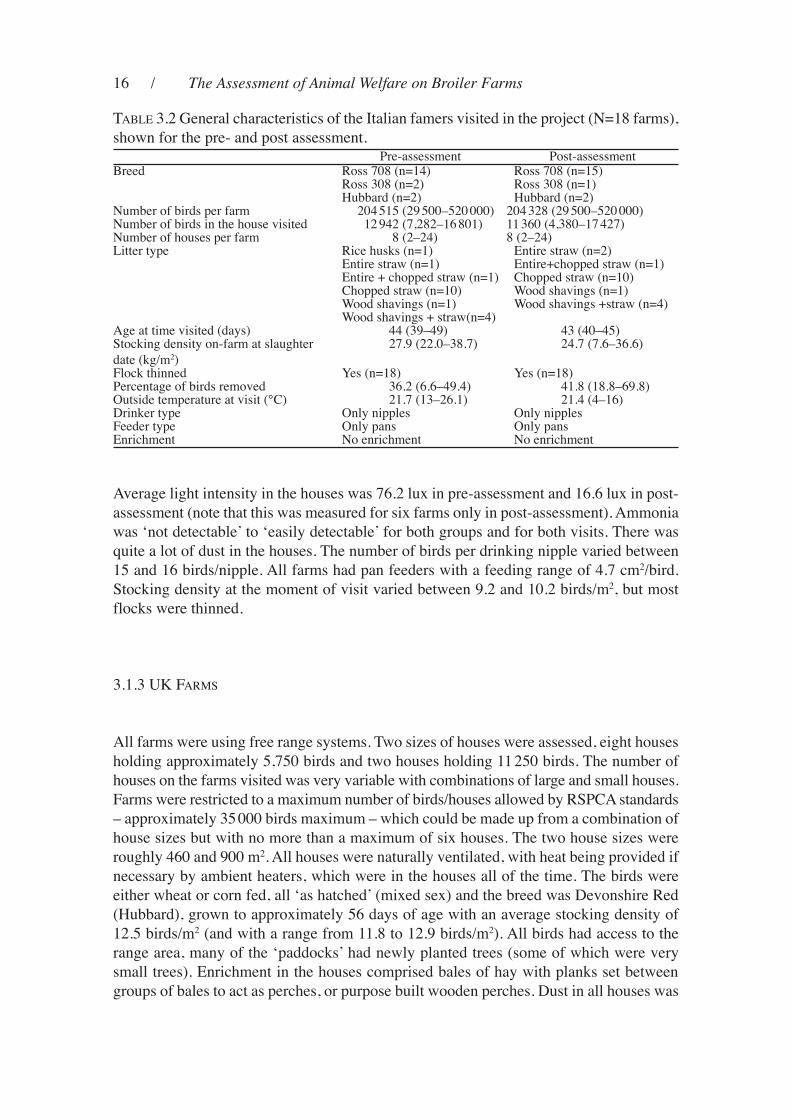
Table 3.2 shows the general characteristics of the italian farms visited. all farms had an
intensive type of production, using fast-growing birds and did not have an outdoor run.
3
ReSulTS
Pre-assessment Post-assessmentbreed Ross (n=17), Cobb (n=1) Ross (n=17), Cobb (n=1)Number of birds per farm 99 222 (30 000–200 000) 99 208 (30 000–200 000)Number of birds in the house visited 23 517 (11 700–42 000) 23 740 (12 000–43 000)Number of houses per farm 4 (1–6) 4 (1–6)litter type Wood shavings (n=16),
chopped straw (n=2)Wood shavings (n=16),chopped straw (n=2)
age at time visited (days) 42 (39–47) 41 (36–45)age parent flock (weeks) 45 (27–89) 52 (30–101)Stocking density on-farm at slaughter
date (kg/m2)
42.6 (38.6–45.5) 45.5 (39.9–48.8)
Flock thinned Yes (n=16), no (n=2) Yes (n=15), no (n=3)Percentage of birds removed 21.4 (12.2–31.0) 21.5 (15.4–31.5)Outside temperature at visit (°C) 15.5 (5–25) 11.0 (4–16)Drinker type Only nipples Only nipplesFeeder type Only pans Only pansenrichment No enrichment No enrichment
Table 3.1 General characteristics of the Dutch farms visited in the project (N=18 farms),
shown for both the pre- and post-assessment.
16 / The Assessment of Animal Welfare on Broiler Farms
average light intensity in the houses was 76.2 lux in pre-assessment and 16.6 lux in post-
assessment (note that this was measured for six farms only in post-assessment). ammonia
was ‘not detectable’ to ‘easily detectable’ for both groups and for both visits. There was
quite a lot of dust in the houses. The number of birds per drinking nipple varied between
15 and 16 birds/nipple. all farms had pan feeders with a feeding range of 4.7 cm2/bird.
Stocking density at the moment of visit varied between 9.2 and 10.2 birds/m2, but most
flocks were thinned.
3.1.3 uK FaRmS
all farms were using free range systems. Two sizes of houses were assessed, eight houses
holding approximately 5,750 birds and two houses holding 11 250 birds. The number of
houses on the farms visited was very variable with combinations of large and small houses.
Farms were restricted to a maximum number of birds/houses allowed by RSPCa standards
– approximately 35 000 birds maximum – which could be made up from a combination of
house sizes but with no more than a maximum of six houses. The two house sizes were
roughly 460 and 900 m2. all houses were naturally ventilated, with heat being provided if
necessary by ambient heaters, which were in the houses all of the time. The birds were
either wheat or corn fed, all ‘as hatched’ (mixed sex) and the breed was Devonshire Red
(hubbard), grown to approximately 56 days of age with an average stocking density of
12.5 birds/m2 (and with a range from 11.8 to 12.9 birds/m2). all birds had access to the
range area, many of the ‘paddocks’ had newly planted trees (some of which were very
small trees). enrichment in the houses comprised bales of hay with planks set between
groups of bales to act as perches, or purpose built wooden perches. Dust in all houses was
Pre-assessment Post-assessmentbreed Ross 708 (n=14)
Ross 308 (n=2)hubbard (n=2)
Ross 708 (n=15)Ross 308 (n=1)hubbard (n=2)
Number of birds per farm 204 515 (29 500–520 000) 204 328 (29 500–520 000)Number of birds in the house visited 12 942 (7,282–16 801) 11 360 (4,380–17 427)Number of houses per farm 8 (2–24) 8 (2–24)litter type Rice husks (n=1)
entire straw (n=1)entire + chopped straw (n=1)Chopped straw (n=10)Wood shavings (n=1)Wood shavings + straw(n=4)
entire straw (n=2)entire+chopped straw (n=1)Chopped straw (n=10)Wood shavings (n=1)Wood shavings +straw (n=4)
age at time visited (days) 44 (39–49) 43 (40–45)Stocking density on-farm at slaughter
date (kg/m2)
27.9 (22.0–38.7) 24.7 (7.6–36.6)
Flock thinned Yes (n=18) Yes (n=18)Percentage of birds removed 36.2 (6.6–49.4) 41.8 (18.8–69.8)Outside temperature at visit (°C) 21.7 (13–26.1) 21.4 (4–16)Drinker type Only nipples Only nipplesFeeder type Only pans Only pansenrichment No enrichment No enrichment
Table 3.2 General characteristics of the italian famers visited in the project (N=18 farms),
shown for the pre- and post assessment.
Results / 17
minimal as was the occurrence of spilled feed and water leaks. One flock did have a major
water leak at the beginning of the flock cycle that required replacement of the litter whilst
the birds were still in the house (this is not common). all houses used nipple drinkers and
pan feeders. There was a range of birds/ nipple of 6.70 to 11.59 with an average of 8.60.
The number of birds/cm of feeder had a range of 0.66 to 2.21 with an average of 1.98. all
the farms and the broiler houses were in very good condition (some nearly new) they were
well maintained and with all relevant documentation readily available (the companies had
good document systems in place as part of RSPCa Freedom Food requirements). The
birds examined in this trial were all in very good condition, and inspected regularly by the
farmer, but nearly all of the farms had some problems with litter condition during the
middle of the survey. bad weather (particularly cold and wet) resulted in litter which was
wet and capped, and this was made worse by the enforced use in some cases of chopped
straw because of the unavailability of the farmers preferred litter which was wood-
shavings.
3.2 PaNTiNG
For the Dutch farms, the average score for panting was in pre-assessment 1.41, and in
post-assessment 0.87. Thus, in pre-assessment more birds showed panting behaviour, and
thus seemed to have more difficulty in losing heat, as compared to post-assessment. On
some days during pre-assessment, the outdoor temperature was quite high (>23°C). No
huddling was observed.
For the italian farms, more birds showed panting behaviour in pre-assessment (average
score 1.24), and thus seemed to have more difficulty in losing heat, compared to post-
assessment (average score 1.18). No huddling was observed.
Neither panting nor huddling was apparent at any of the uK farms visited. The outside
temperature ranged from approximately 0°C to 20°C.
3.3 QualiTaTive behaviOuR aSSeSSmeNT
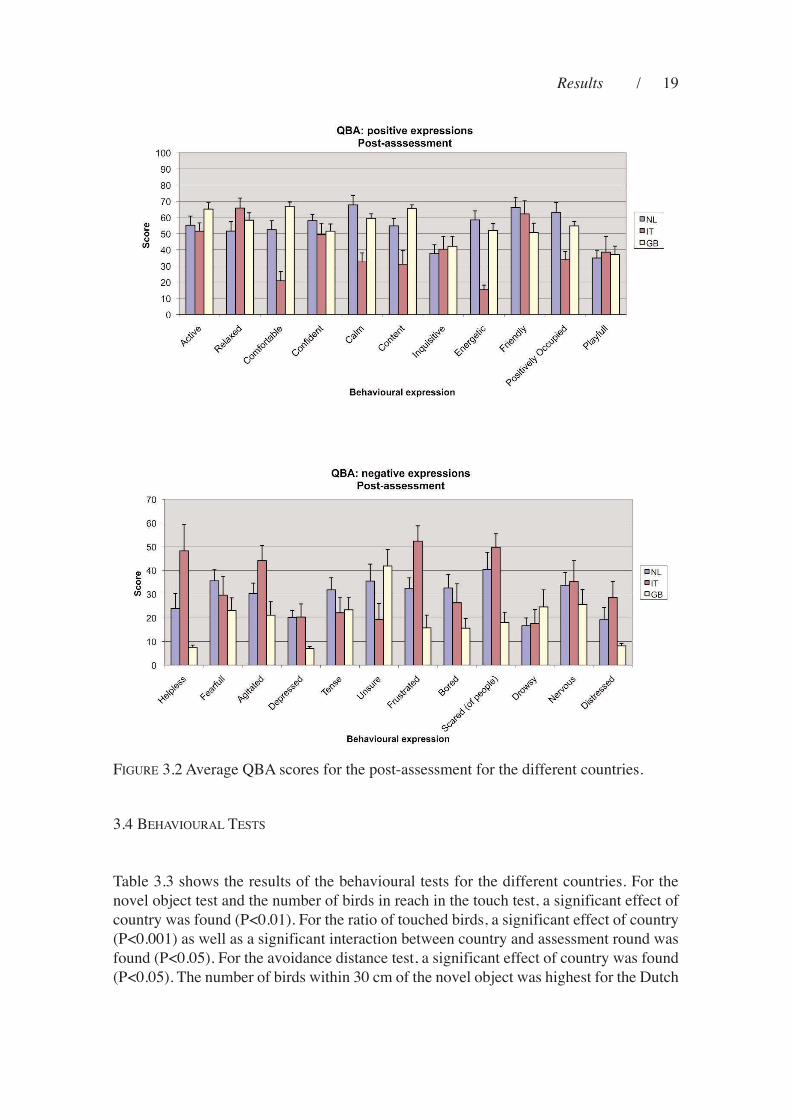
average scores for the different countries in pre- and post-assessment are shown in Figures
3.1 and 3.2. For the pre-assessment, all countries had equal scores for active, relaxed, and
comfortable. The italian farms scored lower for the other positive descriptions. also for
the post-assessment, lower scores were found for the italian farms regarding positive
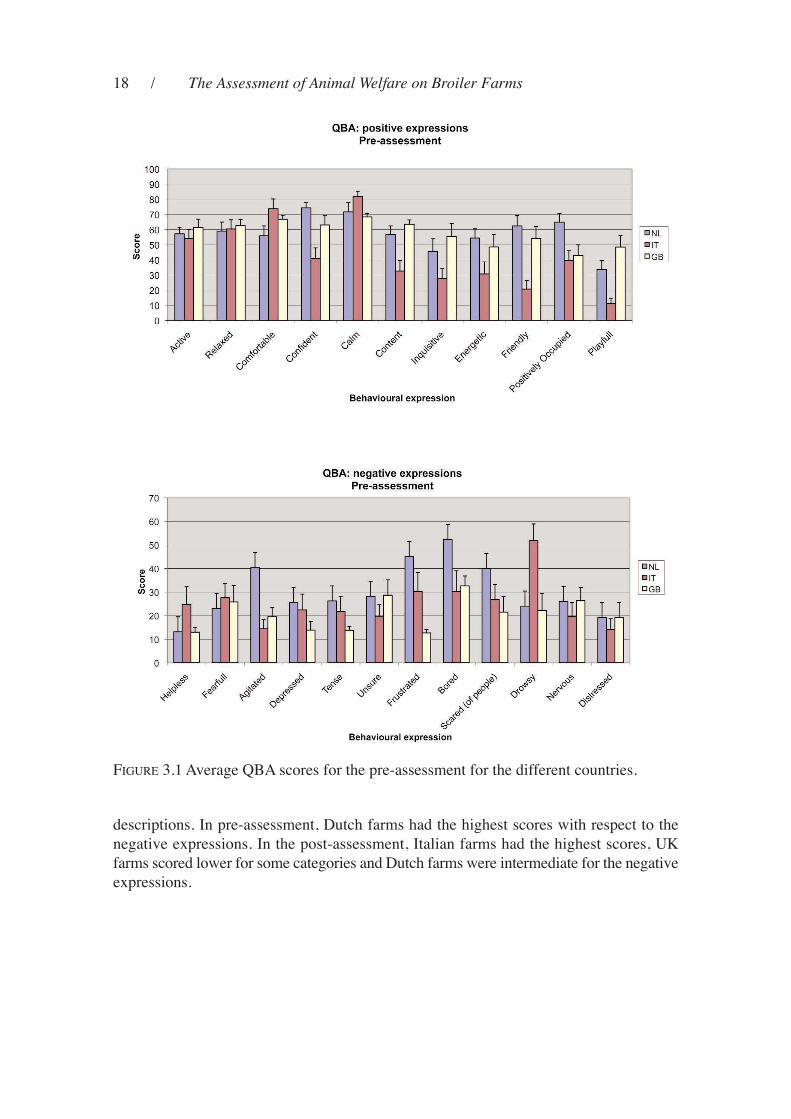
18 / The Assessment of Animal Welfare on Broiler Farms
descriptions. in pre-assessment, Dutch farms had the highest scores with respect to the
negative expressions. in the post-assessment, italian farms had the highest scores, uK
farms scored lower for some categories and Dutch farms were intermediate for the negative
expressions.
FiGuRe 3.1 average Qba scores for the pre-assessment for the different countries.
Results / 19
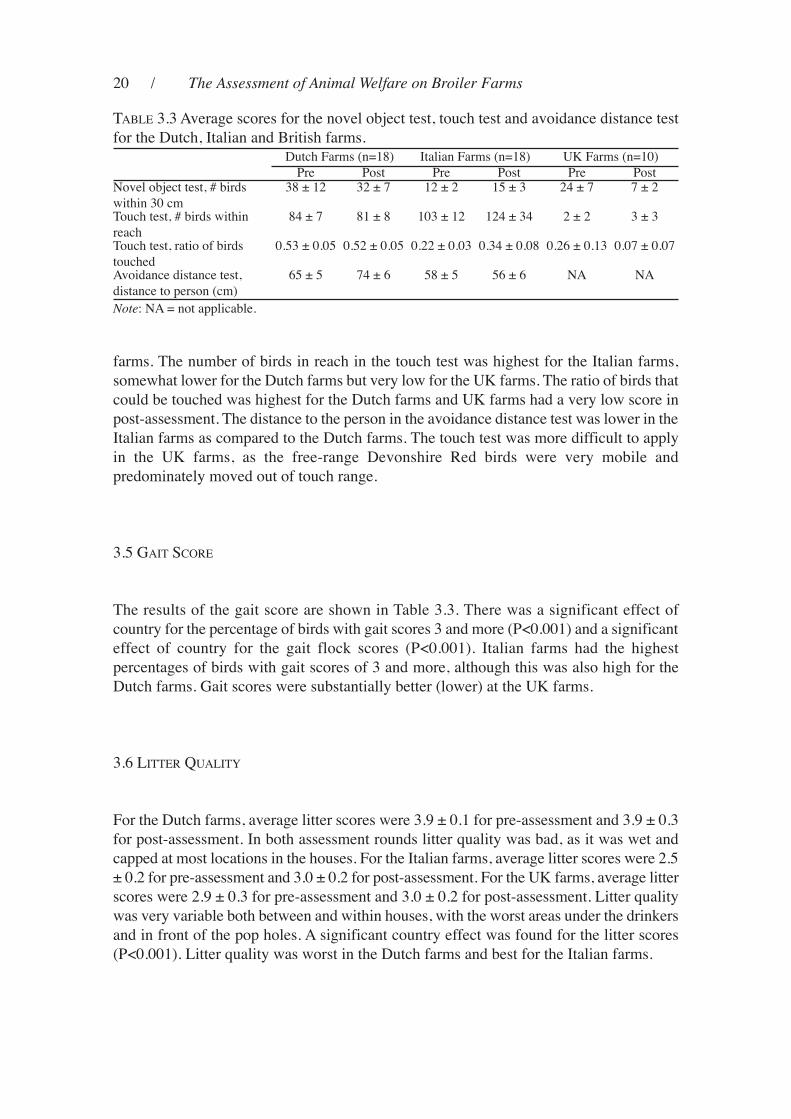
3.4 behaviOuRal TeSTS
Table 3.3 shows the results of the behavioural tests for the different countries. For the
novel object test and the number of birds in reach in the touch test, a significant effect of
country was found (P<0.01). For the ratio of touched birds, a significant effect of country
(P<0.001) as well as a significant interaction between country and assessment round was
found (P<0.05). For the avoidance distance test, a significant effect of country was found
(P<0.05). The number of birds within 30 cm of the novel object was highest for the Dutch
FiGuRe 3.2 average Qba scores for the post-assessment for the different countries.
20 / The Assessment of Animal Welfare on Broiler Farms
farms. The number of birds in reach in the touch test was highest for the italian farms,
somewhat lower for the Dutch farms but very low for the uK farms. The ratio of birds that
could be touched was highest for the Dutch farms and uK farms had a very low score in
post-assessment. The distance to the person in the avoidance distance test was lower in the
italian farms as compared to the Dutch farms. The touch test was more difficult to apply
in the uK farms, as the free-range Devonshire Red birds were very mobile and
predominately moved out of touch range.
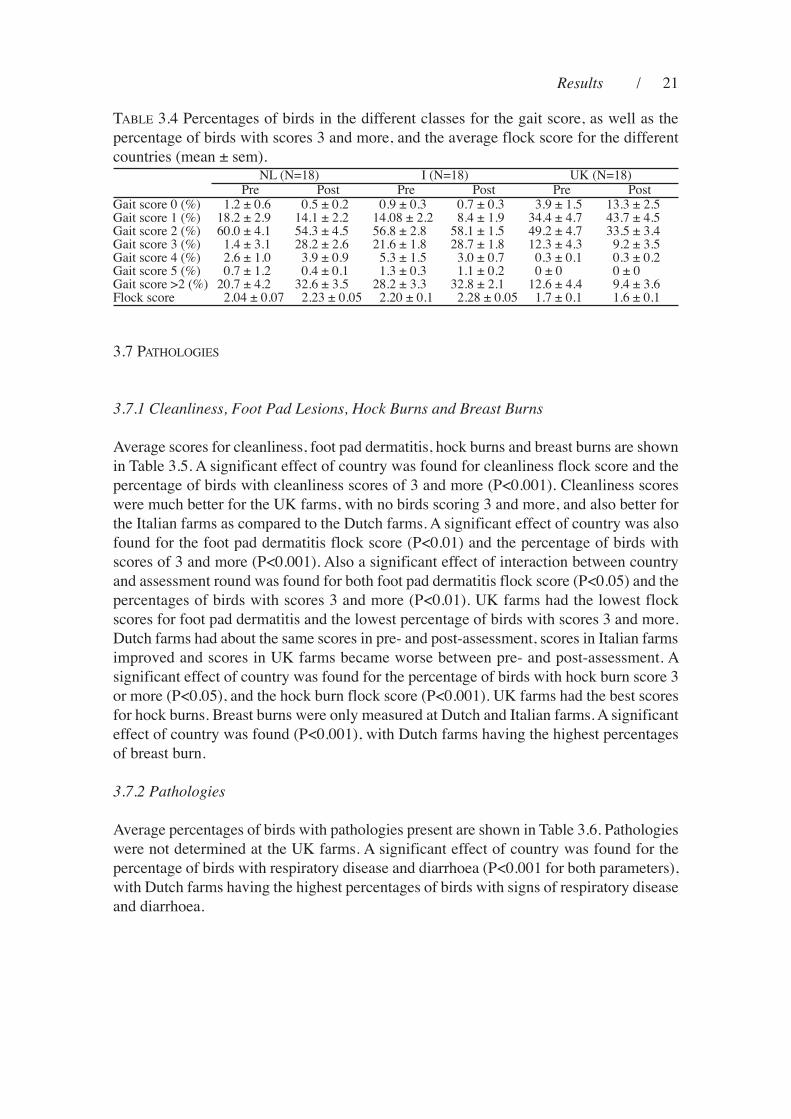
3.5 GaiT SCORe
The results of the gait score are shown in Table 3.3. There was a significant effect of
country for the percentage of birds with gait scores 3 and more (P<0.001) and a significant
effect of country for the gait flock scores (P<0.001). italian farms had the highest
percentages of birds with gait scores of 3 and more, although this was also high for the
Dutch farms. Gait scores were substantially better (lower) at the uK farms.
3.6 liTTeR QualiTY
For the Dutch farms, average litter scores were 3.9 ± 0.1 for pre-assessment and 3.9 ± 0.3
for post-assessment. in both assessment rounds litter quality was bad, as it was wet and
capped at most locations in the houses. For the italian farms, average litter scores were 2.5
± 0.2 for pre-assessment and 3.0 ± 0.2 for post-assessment. For the uK farms, average litter
scores were 2.9 ± 0.3 for pre-assessment and 3.0 ± 0.2 for post-assessment. litter quality
was very variable both between and within houses, with the worst areas under the drinkers
and in front of the pop holes. a significant country effect was found for the litter scores
(P<0.001). litter quality was worst in the Dutch farms and best for the italian farms.
Table 3.3 average scores for the novel object test, touch test and avoidance distance test
for the Dutch, italian and british farms.
Note: Na = not applicable.
Dutch Farms (n=18) italian Farms (n=18) uK Farms (n=10)
Pre Post Pre Post Pre PostNovel object test, # birds
within 30 cm
38 ± 12 32 ± 7 12 ± 2 15 ± 3 24 ± 7 7 ± 2
Touch test, # birds within
reach
84 ± 7 81 ± 8 103 ± 12 124 ± 34 2 ± 2 3 ± 3
Touch test, ratio of birds
touched
0.53 ± 0.05 0.52 ± 0.05 0.22 ± 0.03 0.34 ± 0.08 0.26 ± 0.13 0.07 ± 0.07
avoidance distance test,
distance to person (cm)
65 ± 5 74 ± 6 58 ± 5 56 ± 6 Na Na
Results / 21
3.7 PaThOlOGieS
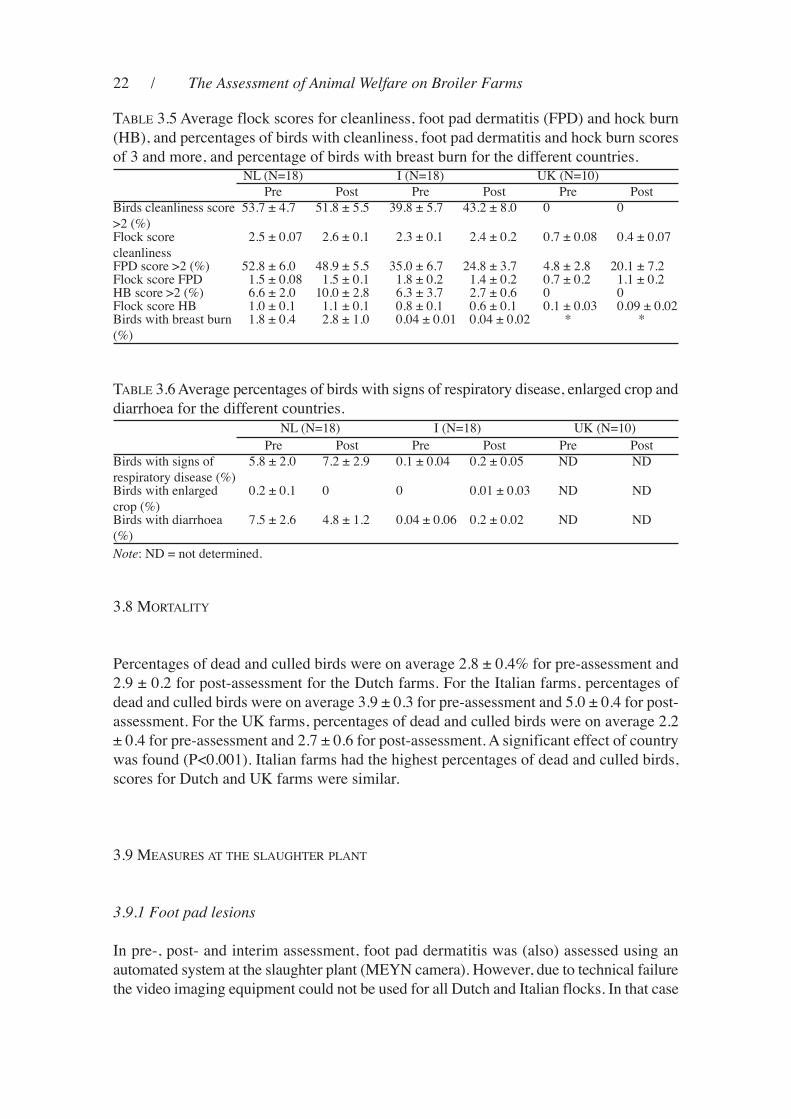
3.7.1 Cleanliness, Foot Pad Lesions, Hock Burns and Breast Burns
average scores for cleanliness, foot pad dermatitis, hock burns and breast burns are shown
in Table 3.5. a significant effect of country was found for cleanliness flock score and the
percentage of birds with cleanliness scores of 3 and more (P<0.001). Cleanliness scores
were much better for the uK farms, with no birds scoring 3 and more, and also better for
the italian farms as compared to the Dutch farms. a significant effect of country was also
found for the foot pad dermatitis flock score (P<0.01) and the percentage of birds with
scores of 3 and more (P<0.001). also a significant effect of interaction between country
and assessment round was found for both foot pad dermatitis flock score (P<0.05) and the
percentages of birds with scores 3 and more (P<0.01). uK farms had the lowest flock
scores for foot pad dermatitis and the lowest percentage of birds with scores 3 and more.
Dutch farms had about the same scores in pre- and post-assessment, scores in italian farms
improved and scores in uK farms became worse between pre- and post-assessment. a
significant effect of country was found for the percentage of birds with hock burn score 3
or more (P<0.05), and the hock burn flock score (P<0.001). uK farms had the best scores
for hock burns. breast burns were only measured at Dutch and italian farms. a significant
effect of country was found (P<0.001), with Dutch farms having the highest percentages
of breast burn.
3.7.2 Pathologies
average percentages of birds with pathologies present are shown in Table 3.6. Pathologies
were not determined at the uK farms. a significant effect of country was found for the
percentage of birds with respiratory disease and diarrhoea (P<0.001 for both parameters),
with Dutch farms having the highest percentages of birds with signs of respiratory disease
and diarrhoea.
Table 3.4 Percentages of birds in the different classes for the gait score, as well as the
percentage of birds with scores 3 and more, and the average flock score for the different
countries (mean ± sem).Nl (N=18) i (N=18) uK (N=18)
Pre Post Pre Post Pre PostGait score 0 (%) 1.2 ± 0.6 0.5 ± 0.2 0.9 ± 0.3 0.7 ± 0.3 3.9 ± 1.5 13.3 ± 2.5Gait score 1 (%) 18.2 ± 2.9 14.1 ± 2.2 14.08 ± 2.2 8.4 ± 1.9 34.4 ± 4.7 43.7 ± 4.5Gait score 2 (%) 60.0 ± 4.1 54.3 ± 4.5 56.8 ± 2.8 58.1 ± 1.5 49.2 ± 4.7 33.5 ± 3.4Gait score 3 (%) 1.4 ± 3.1 28.2 ± 2.6 21.6 ± 1.8 28.7 ± 1.8 12.3 ± 4.3 9.2 ± 3.5Gait score 4 (%) 2.6 ± 1.0 3.9 ± 0.9 5.3 ± 1.5 3.0 ± 0.7 0.3 ± 0.1 0.3 ± 0.2Gait score 5 (%) 0.7 ± 1.2 0.4 ± 0.1 1.3 ± 0.3 1.1 ± 0.2 0 ± 0 0 ± 0Gait score >2 (%) 20.7 ± 4.2 32.6 ± 3.5 28.2 ± 3.3 32.8 ± 2.1 12.6 ± 4.4 9.4 ± 3.6Flock score 2.04 ± 0.07 2.23 ± 0.05 2.20 ± 0.1 2.28 ± 0.05 1.7 ± 0.1 1.6 ± 0.1
22 / The Assessment of Animal Welfare on Broiler Farms
3.8 mORTaliTY
Percentages of dead and culled birds were on average 2.8 ± 0.4% for pre-assessment and
2.9 ± 0.2 for post-assessment for the Dutch farms. For the italian farms, percentages of
dead and culled birds were on average 3.9 ± 0.3 for pre-assessment and 5.0 ± 0.4 for post-
assessment. For the uK farms, percentages of dead and culled birds were on average 2.2
± 0.4 for pre-assessment and 2.7 ± 0.6 for post-assessment. a significant effect of country
was found (P<0.001). italian farms had the highest percentages of dead and culled birds,
scores for Dutch and uK farms were similar.
3.9 meaSuReS aT The SlauGhTeR PlaNT
3.9.1 Foot pad lesions
in pre-, post- and interim assessment, foot pad dermatitis was (also) assessed using an
automated system at the slaughter plant (meYN camera). however, due to technical failure
the video imaging equipment could not be used for all Dutch and italian flocks. in that case
Table 3.5 average flock scores for cleanliness, foot pad dermatitis (FPD) and hock burn
(hb), and percentages of birds with cleanliness, foot pad dermatitis and hock burn scores
of 3 and more, and percentage of birds with breast burn for the different countries.
Table 3.6 average percentages of birds with signs of respiratory disease, enlarged crop and
diarrhoea for the different countries.
Nl (N=18) i (N=18) uK (N=10)
Pre Post Pre Post Pre Post
birds cleanliness score
>2 (%)
53.7 ± 4.7 51.8 ± 5.5 39.8 ± 5.7 43.2 ± 8.0 0 0
Flock score
cleanliness
2.5 ± 0.07 2.6 ± 0.1 2.3 ± 0.1 2.4 ± 0.2 0.7 ± 0.08 0.4 ± 0.07
FPD score >2 (%) 52.8 ± 6.0 48.9 ± 5.5 35.0 ± 6.7 24.8 ± 3.7 4.8 ± 2.8 20.1 ± 7.2Flock score FPD 1.5 ± 0.08 1.5 ± 0.1 1.8 ± 0.2 1.4 ± 0.2 0.7 ± 0.2 1.1 ± 0.2hb score >2 (%) 6.6 ± 2.0 10.0 ± 2.8 6.3 ± 3.7 2.7 ± 0.6 0 0Flock score hb 1.0 ± 0.1 1.1 ± 0.1 0.8 ± 0.1 0.6 ± 0.1 0.1 ± 0.03 0.09 ± 0.02birds with breast burn
(%)
1.8 ± 0.4 2.8 ± 1.0 0.04 ± 0.01 0.04 ± 0.02 * *
Note: ND = not determined.
Nl (N=18) i (N=18) uK (N=10)
Pre Post Pre Post Pre Post
birds with signs of
respiratory disease (%)
5.8 ± 2.0 7.2 ± 2.9 0.1 ± 0.04 0.2 ± 0.05 ND ND
birds with enlarged
crop (%)
0.2 ± 0.1 0 0 0.01 ± 0.03 ND ND
birds with diarrhoea
(%)
7.5 ± 2.6 4.8 ± 1.2 0.04 ± 0.06 0.2 ± 0.02 ND ND
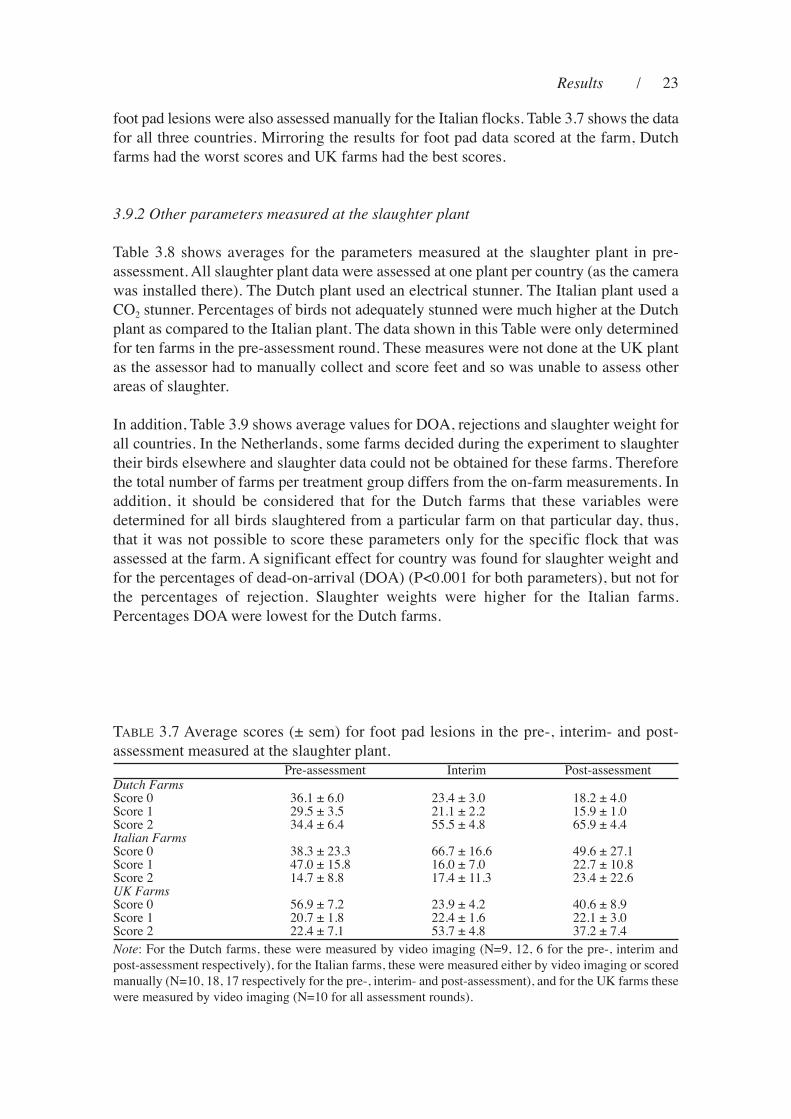
Results / 23
foot pad lesions were also assessed manually for the italian flocks. Table 3.7 shows the data
for all three countries. mirroring the results for foot pad data scored at the farm, Dutch
farms had the worst scores and uK farms had the best scores.
3.9.2 Other parameters measured at the slaughter plant
Table 3.8 shows averages for the parameters measured at the slaughter plant in pre-
assessment. all slaughter plant data were assessed at one plant per country (as the camera
was installed there). The Dutch plant used an electrical stunner. The italian plant used a
CO2 stunner. Percentages of birds not adequately stunned were much higher at the Dutch
plant as compared to the italian plant. The data shown in this Table were only determined
for ten farms in the pre-assessment round. These measures were not done at the uK plant
as the assessor had to manually collect and score feet and so was unable to assess other
areas of slaughter.
in addition, Table 3.9 shows average values for DOa, rejections and slaughter weight for
all countries. in the Netherlands, some farms decided during the experiment to slaughter
their birds elsewhere and slaughter data could not be obtained for these farms. Therefore
the total number of farms per treatment group differs from the on-farm measurements. in
addition, it should be considered that for the Dutch farms that these variables were
determined for all birds slaughtered from a particular farm on that particular day, thus,
that it was not possible to score these parameters only for the specific flock that was
assessed at the farm. a significant effect for country was found for slaughter weight and
for the percentages of dead-on-arrival (DOa) (P<0.001 for both parameters), but not for
the percentages of rejection. Slaughter weights were higher for the italian farms.
Percentages DOa were lowest for the Dutch farms.
Note: For the Dutch farms, these were measured by video imaging (N=9, 12, 6 for the pre-, interim and
post-assessment respectively), for the italian farms, these were measured either by video imaging or scored
manually (N=10, 18, 17 respectively for the pre-, interim- and post-assessment), and for the uK farms these
were measured by video imaging (N=10 for all assessment rounds).
Pre-assessment interim Post-assessmentDutch FarmsScore 0 36.1 ± 6.0 23.4 ± 3.0 18.2 ± 4.0Score 1 29.5 ± 3.5 21.1 ± 2.2 15.9 ± 1.0Score 2 34.4 ± 6.4 55.5 ± 4.8 65.9 ± 4.4Italian FarmsScore 0 38.3 ± 23.3 66.7 ± 16.6 49.6 ± 27.1Score 1 47.0 ± 15.8 16.0 ± 7.0 22.7 ± 10.8Score 2 14.7 ± 8.8 17.4 ± 11.3 23.4 ± 22.6UK FarmsScore 0 56.9 ± 7.2 23.9 ± 4.2 40.6 ± 8.9Score 1 20.7 ± 1.8 22.4 ± 1.6 22.1 ± 3.0Score 2 22.4 ± 7.1 53.7 ± 4.8 37.2 ± 7.4
Table 3.7 average scores (± sem) for foot pad lesions in the pre-, interim- and post-
assessment measured at the slaughter plant.
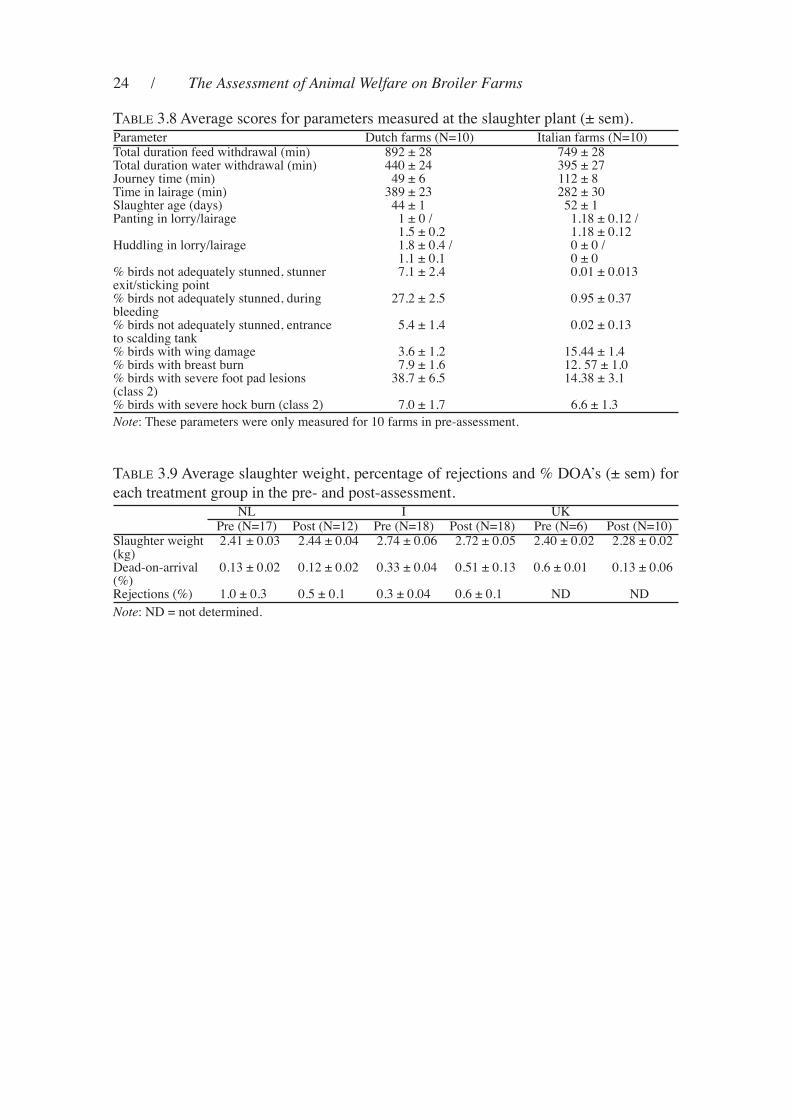
24 / The Assessment of Animal Welfare on Broiler Farms
Table 3.8 average scores for parameters measured at the slaughter plant (± sem).Parameter Dutch farms (N=10) italian farms (N=10)Total duration feed withdrawal (min) 892 ± 28 749 ± 28Total duration water withdrawal (min) 440 ± 24 395 ± 27Journey time (min) 49 ± 6 112 ± 8Time in lairage (min) 389 ± 23 282 ± 30Slaughter age (days) 44 ± 1 52 ± 1Panting in lorry/lairage 1 ± 0 /
1.5 ± 0.21.18 ± 0.12 /1.18 ± 0.12
huddling in lorry/lairage 1.8 ± 0.4 /1.1 ± 0.1
0 ± 0 /0 ± 0
% birds not adequately stunned, stunnerexit/sticking point
7.1 ± 2.4 0.01 ± 0.013
% birds not adequately stunned, duringbleeding
27.2 ± 2.5 0.95 ± 0.37
% birds not adequately stunned, entranceto scalding tank
5.4 ± 1.4 0.02 ± 0.13
% birds with wing damage 3.6 ± 1.2 15.44 ± 1.4% birds with breast burn 7.9 ± 1.6 12. 57 ± 1.0% birds with severe foot pad lesions(class 2)
38.7 ± 6.5 14.38 ± 3.1
% birds with severe hock burn (class 2) 7.0 ± 1.7 6.6 ± 1.3
Note: These parameters were only measured for 10 farms in pre-assessment.
Table 3.9 average slaughter weight, percentage of rejections and % DOa’s (± sem) for
each treatment group in the pre- and post-assessment.
Note: ND = not determined.
Nl i uKPre (N=17) Post (N=12) Pre (N=18) Post (N=18) Pre (N=6) Post (N=10)
Slaughter weight(kg)
2.41 ± 0.03 2.44 ± 0.04 2.74 ± 0.06 2.72 ± 0.05 2.40 ± 0.02 2.28 ± 0.02
Dead-on-arrival(%)
0.13 ± 0.02 0.12 ± 0.02 0.33 ± 0.04 0.51 ± 0.13 0.6 ± 0.01 0.13 ± 0.06
Rejections (%) 1.0 ± 0.3 0.5 ± 0.1 0.3 ± 0.04 0.6 ± 0.1 ND ND
25
in this report, we present data collected with the broiler welfare monitoring assessment in
three different European countries: the netherlands, italy and the united Kingdom. The
two most important aims of the study were (1) to test the broiler welfare monitoring
assessment in practice, and (2) to study the effect of intervention on the results of the
farmers. From the separate country reports of the netherlands and italy, it turned out that
intervention as applied in this project did not have any measurable positive effect on the
results of the farmers in both countries. For the uK farms, no direct physical intervention
was carried out, but it was asked if any of the farmers changed something in their
management after receiving the results of the assessment in an advisory assessment report
(none of the farmers made any physical changes). As the intervention did not result in
statistically significant alterations in the welfare measures between pre- and post-
assessment, the focus here is on the results of the different countries in relation to
differences in housing and management. Experiences with the welfare monitoring
assessment in practice are reported in the separate country reports.
As described in the methods section, there were large differences between the assessed
farms per country. uK farms were free-range farms using Freedom Food standards,
whereas Dutch and italian farms were farms with an intensive type of production. Most
important differences were the use of a slow-growing breed in the uK farms (Devonshire
Red, grown to 56 days of age) whereas Dutch and italian farms used fast growing breeds
(Ross, cobb or Hubbard, grown to approximately 42 days (netherlands) or 52 days
(italy)). in addition, uK farms had an outdoor run and enrichment in the houses whereas
Dutch and italian farms were only indoors without any enrichment. Furthermore, there
were differences in stocking density when the birds were placed. stocking density at day
0 ranged from about 22 birds/m2 (Dutch farms), to about 17 birds/m2 (italian farms) to
about 12 birds/m2 (uK farms). Dutch and italian flocks were thinned. Where the majority
of the Dutch farmers used wood shavings, italian and uK farms also used (chopped) straw
as litter. other differences that may play a role in the results, but could not be ascribed to
the farms, were climate (probably more humid in the netherlands and the uK) and season
of the assessment (winter and spring in the uK, spring, summer and autumn in the
netherlands and italy). The differences in responses to the behavioural tests between farms
in the different countries (novel object test and touch test) can probably be ascribed to
differences in mobility between the birds. The Devonshire Red birds at the uK farms were
very mobile and difficult to touch, as compared to the birds at the Dutch and italian farms.
Ability to touch the birds in a free-range system should be viewed in the light of the birds
ability to move away from the assessor and to leave the house or assessment area. in
general birds at the Dutch farms were not very mobile which may also have affected their
4
Discussion
26 / The Assessment of Animal Welfare on Broiler Farms
response to the novel object. The fact that panting was observed in the Dutch and italian
farms, but not in the uK farms, may be explained by breed differences (faster growing
birds may have higher metabolic energy turnover and experience difficulty in regulating
temperature) and higher stocking densities in the Dutch and italian farms. However, higher
outdoor temperatures when doing the assessment in Dutch and italian farms may also
explain the findings of panting in these flocks. Gait scores were much better in the uK
flocks when compared to the Dutch and italian farms. The Devonshire Red birds in the uK
farms were very mobile and had much more opportunity to move and explore (outdoor
area, enrichment, lower stocking density) as compared to the Dutch and italian birds, and
this probably had positive effects on the gait of the birds. Litter quality was in general not
very good (or even bad) in all countries. As there is a relationship between litter quality
and the frequency of foot pad lesions, hock burns, breast burns and cleanliness (e.g.
Haslam et al., 2007), this may explain the high percentages of severe foot pad lesions and
fouling of the birds in the Dutch farms. However, scores for foot pad lesions, hock burns
and cleanliness were best for the uK farms where litter quality was not very good either.
This may be explained by the different type of breed used (more mobile and having better
gait scores as compared to intensive breeds) and stimulation of mobility through the
outdoor run, enrichment and lower stocking density. italian farms were using the same
breeds as the Dutch farms but had better scores for foot pad lesions and cleanliness. The
somewhat better scores for litter quality in italian farms as compared to Dutch farms may
have caused this difference. Differences in climate may also have played a role here.
slaughter plant measures were only done for pre-assessment in italy and the netherlands
and therefore not analysed. one remarkable difference was the low percentage of birds not
adequately stunned in the italian plant (using a gas stunner) as compared to the Dutch
plant (using an electrical stunner).
27
The comparison of the results of the three countries involved in the project showed that
for almost every parameter assessed there were significant differences between the
countries, that could most probably be ascribed to differences in the types of farms
assessed: free range farms with slower growing birds in the uK, and intensive type of
production with fast growing strains in The netherlands and italy. uK free range farms had
the best scores for gaits, cleanliness, foot pad dermatitis and hock burns. Differences in
behavioural responses to the novel object and in the touch test, between countries, may be
ascribed to differences in mobility between the breeds used.
5
ConClusions

Part II
Farmers’ Experiences of the Farm
Assessment: Interviews with Farmers
by
Bettina B. Bock, Paul Swagemakers, John Lever,
Claudio Montanari and Paolo FerrariWageningen University, Netherlands
Cardiff University, United Kingdom
University of Milan, Italy
CRPA Research Centre on Animal Production, Italy

31
the participating farms in the Netherlands delivered to Flandrex, poultry processing plant
in ommel, in Italy to Amadori group, poultry processing plant in San Vittore di Cesena,
and in the UK to the hook2Sisters production company in devon, which is part of the 2
Sisters Food group. the video imaging tool was installed at the slaughterhouses. the
processing plant provided the farmers’ addresses. they were contacted by the animal
scientists who invited them to participate in the parallel studies.
In the Netherlands and Italy, regular indoor broiler production farms participated in the
study. the UK research focused on farms producing free-range chickens. this allowed us
to study the fitness of the monitoring tool for two different production types. Initially, we
also wanted to check for the impact of information provided and therefore distinguished
between three groups of producers:
1. producers who received information about the welfare assessment but without on-
farm assessment, i.e. the control group;
2. producers who received on-farm assessment plus feedback on individual and bench-
mark results;
3. producers who received on-farm assessment plus feedback on individual and bench-
mark results and received individual advice.
the dutch and Italian study kept to this plan. But due to unforeseen developments in the
UK the plan had to be slightly adapted for what regards the UK study and the comparative
analysis. the UK data-collection was delayed considerably because the slaughterhouse
with which the initial agreement was carried out had to be closed and changed ownership,
and as a result new arrangements had to be made. As time was running short, we had to
decide to cut down the sample size in the UK. to minimize the loss of data, we decided
to skip the control-group interviews and to focus on farms that participated in the
sociological interviews as well as the technical assessment. We were therefore unable to
include the comparison across control groups in this international analysis. the national
analysis of Italian and dutch data, however, reveals that there is little difference between
the control and assessed groups with regard to their attitude towards animal welfare and
the monitoring of it (see national reports).
In all three countries, the repeated assessments took much more time than foreseen. As a
result, farmers had to wait longer for their results. In the Netherlands, the sociological
interviews took place four to eight weeks after the assessment was done. In the UK, the
project team decided to cut the interviews into two parts; the major part took place shortly
6
Methodology
32 / The Assessment of Animal Welfare on Broiler Farms
after the assessment and on the farm; the part regarding the appreciation of the results took
place later and by telephone. In Italy, the sociological interviews took place three to eight
weeks after pre-assessment was completed.
6.1 FArMS
In the Netherlands, most of the broiler farms were located in the eastern part of the
province of Noord-Brabant. Farms differed in size from 30 000 up to 400 000 broilers, and
in level of specialization – from highly specialized to mixed farms. In Italy, all farms are
located in the province of Forlì-Cesena, in the eastern part of the region emilia-romagna,
northern Italy. Farm size ranged from 30 000 to 550 000 places and the production system
is traditional intensive. In the UK, the farms were located in south-west england, in the
counties of Cornwall, devon, and Somerset. the farms were free range, with flock sizes
ranging from 11 500 to 46 000 birds (see Appendix 4).
the dutch broiler producers were independent and private producers, although production
was embedded in a web of contracts with chick sellers, feeding companies and the
slaughterhouse. the Italian farmers are all highly specialized even if in some cases farmers
have a second job outside the farms. the biggest farms belong to the Amadori group, one
of the main Italian companies in the production and poultry processing sector: in these
cases interviewees were the farm keepers hired by the company. the others are agricultural
entrepreneurs whose farms are vertically integrated to the same company through a
contractual agreement. the processing company supplies feedstuffs, chickens and
technical and veterinary assistance, while farmers provide bird house, equipment and
labour force.
In the UK, production is aligned with the demands of a number of national supermarkets
and with the Freedom Food assurance scheme, which is linked to the rSPCA. the
production company provides the farmers with chicks, food, and technical support.
6.2 SeMI-StrUCtUred qUeStIoNNAIre
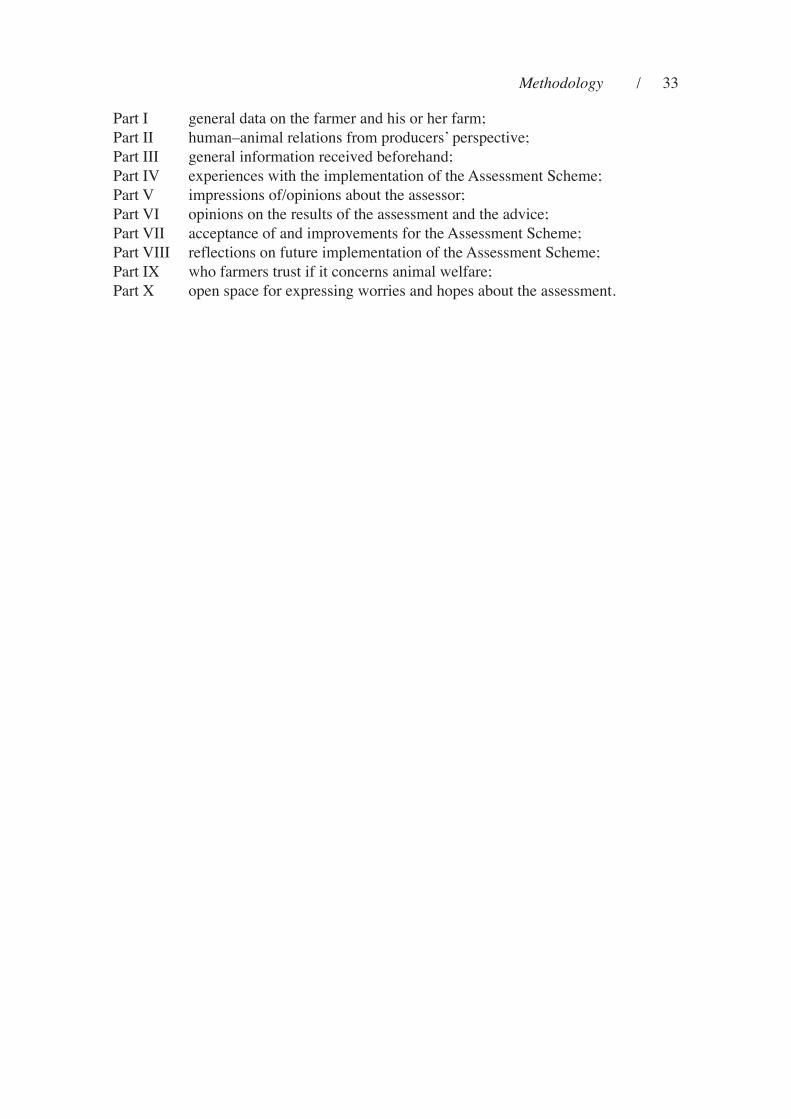
the interviews took place on the farm, and were held using a semi-structured questionnaire
(see Appendix 5). the questions in the semi-structured questionnaire were ordered
thematically:
Methodology / 33
Part I general data on the farmer and his or her farm;
Part II human–animal relations from producers’ perspective;
Part III general information received beforehand;
Part IV experiences with the implementation of the Assessment Scheme;
Part V impressions of/opinions about the assessor;
Part VI opinions on the results of the assessment and the advice;
Part VII acceptance of and improvements for the Assessment Scheme;
Part VIII reflections on future implementation of the Assessment Scheme;
Part IX who farmers trust if it concerns animal welfare;
Part X open space for expressing worries and hopes about the assessment.

35
we started the interviews by asking farmers about their definition of animal welfare.1 As
we will demonstrate in the following, most farmers considered health and productivity as
the most important aspects of welfare as it allowed them to fulfil their major ambition –
optimizing their technical results.
7.1 ProductIvIty
when defining animal welfare, most farmers referred to those conditions and practices
that in their view assured the animals’ health, wellness and growth. this was important
because the expectations towards ‘good growth’ were continuously rising. while chickens
were expected to grow 50 grams per day some year ago, a farmer today needed to realize
a growth of 60 grams per day in order to earn a living. Good growth was fast growth, and
fast growth could only be realized with good health and good welfare. And, hence, good
growth implied good welfare and good health.
‘I’ve never seen good results when chicken are kept in bad conditions’ (Italian
farmer).
‘we have a type of animal that is bred in order to grow fast. If growth is optimal, I
assume that I created good conditions’ (dutch farmer).
‘Stockmanship and husbandry are important, if they are good you won’t be far away
with your welfare; it’s the whole job; if animals are growing well, your welfare and
production will be good as well’ (uK farmer).
For many farmers animal welfare was something very similar to or at least close to health.
It meant assuring that the animals were in a good state. this entailed the following:
7
FArmerS’ deFInItIonS oF AnImAl
welFAre
1 See Questionaire Parts II and XI (Appendix 5).
36 / The Assessment of Animal Welfare on Broiler Farms
ensuring good health conditions by keeping them at the right temperature, at the right
humidity, on a dry litter, assuring access to feed and water; or, in short, making sure that
the technical aspects of broiler production are optimal. the achievement of good economic
results was the major driving force for animal welfare; assuring good welfare reduced the
occurrences of sanitary problems and mortality, and increased the growth rate. many
farmers argued that if farmers looked well after their animals, the animals would return the
favour and perform well for them economically.
‘If the chickens are healthy, they automatically have good welfare. If you talk about
healthy chickens, you speak about low mortality rates, animals standing well on
their legs, and having healthy intestines. one should get as many kilograms of meat
out of as few kilograms of feed as possible’ (dutch farmer).
7.2 conSumer demAnd
Quick growth demands a lot of the chickens. the farmers agreed that quality of life would
be better if chickens had one more week to grow and more space in the house. But as long
as consumers did not buy this better life, farmers felt neither capable nor responsible to
change the conditions of production.
‘It can all be arranged, but it is very costly. with fewer animals per square meter, all
costs per chicken increase – for electricity and gas. the finances of the farm are
calculated on the basis of 20–25 chickens per square meter. changing that never
pays back. It would not improve anything, because I would need to find the money
for paying these costs in another way’ (dutch farmer).
7.3 SuPPly oF Good mAterIAl, houSInG And mAnAGement
Farmers considered technical improvements important to make sure that animals fared
well and produced well. It was a delicate balance that required careful magament in order
to optimize both welfare and production.
‘It is about those conditions that allow chickens to live well: first of all good litter,
than the right ventilation and good quality of feed’ (Italian farmer).
Farners’ Definitions of Animal Welfare / 37
many farmers mentioned that they could not fully control the chickens’ welfare as they
depended on the material supplied and veterinary schemes associated to certain flocks.
‘It is also genetically determined. If a flock is not so good, welfare is less… Good
schemes for vaccinations help to kill viruses in time. this increases the welfare of
the flock. It will be never 100%, but mortality has to remain limited’ (dutch farmer).
when they could not control the starting conditions, they did not consider themselves fully
responsible for the welfare of their animals either. In their view the animals’ welfare was
to a large degree determined by the suppliers of material – be it the chicks themselves, the
feed or the litter. All these factors were interrelated. the quality of the feed influenced the
intestines of the chickens, which affected the manure and the quality of the litter, which
influenced the conditions in the animal house and, hence, the preconditions for welfare.
‘every round is different. It depends very much on the quality of the chickens. If the
chicks that are delivered are of bad quality, you go from one disaster to the next’
(dutch farmer).
But it was also important to have modern and efficient equipment in order to control and
optimize production conditions. the temperature, humidity and ventilation/air changes
within the house should be controlled in accordance with external climate conditions by
means of cooling/heating and ventilation system. controlling these parameters made it
possible to keep litter dry, reduce ammonia concentration and improve the quality of the
air.
7.4 BAlAncInG coStS And BeneFItS
Farmers perceived animal welfare as a function of productivity and economic performance,
applied to intensive farms.
‘chickens must find the best conditions of life within the limits of an intensive
breeding system’ (Italian farmer).
they continuously balanced maximizing production with controlling costs. to give just
one example: optimal animal welfare required a good climate. But a good climate also
cost a lot of money and the margins were small.
‘the optimization of one parameter influences the optimum of others. we are
searching for the best welfare possible. the less problems, the better it is. For us the
financial profit matters. the costs go before the benefits. Good technical results
38 / The Assessment of Animal Welfare on Broiler Farms
bring welfare for the chickens and financial advantage. therefore, management has
to be optimized’ (dutch farmer).
the farmers controlled the temperature and humidity in the house, managed and adapted
the heating/cooling and ventilation system, kept drinkers and feeders functioning properly,
controlled litter conditions, and added litter when necessary. this was what they needed
to do in their view to check for any kind of signals of disease outbreak and welfare loss.
7.5 welFAre, locAl KnowledGe And FArmInG PrActIce
Broiler producers took their management decisions on the basis of computer
measurements, but also from their own observations. they agreed that farmers could only
assess and maintain welfare by ‘walking’ through their sheds regularly and by getting to
know their flocks intimately. one needed to get close to the animals – checking the
computer was never sufficient. even in high-tech, fully automated sheds, where
ventilation, heating, humidity, light, feed and drink were all controlled (which was the
vast majority of sheds), farmers still claimed that there was no substitute for walking
through the sheds.
time and again, farmers explained to know ‘by instinct’ when things were going well –
or when something was wrong:
‘you just know, you just see them. they’ll tell you, if there’s something not right as
soon as you go in the shed… they’ll either be quiet or else be noisy, one or the other,
and you just get a feel for it’ (uK farmer).
Before entering the animal house, they controlled the ventilation but also the water and
feed intake. once in the animal house, they checked the litter quality but also observed the
behaviour of animals. the chickens should feel safe and should express natural behaviour.
‘you can see whether the animals do well; this is a matter of experience. you see
whether they are lively, energetic, and whether the plumage is nice. If you enter the
animal house and they jump everywhere, you know that they feel well. computers
cannot tell you; you have to see it with your own eyes. But you can create good
conditions. what I just mentioned [water, feed, light, and ventilation] matters, as
well as the temperature’ (dutch farmer).
Farmers also watched how the animals are spread throughout the house, whether they
grouped together, or gathered all at the sides of the animal house.
‘Internal conditions must be as comfortable for chickens as for men’ (Italian farmer).
Farners’ Definitions of Animal Welfare / 39
7.6 comPleXIty oF AnImAl welFAre
Farmers pointed out that animal welfare as such was a complex issue and a delicate balance
of many factors. Improving one aspect could easily result in the deterioration of another.
‘we can avoid foot pad dermatitis by limiting the water supply during the first week.
But then chickens feel thirsty. It improves the parameter foot pad but has a negative
effect on welfare as well. welfare is complicated’ (dutch farmer).
In addition, nature still had a large impact even if broiler production was highly industrial.
the weather, for instance, affected humidity and, hence, the quality of the litter.
7.7 concluSIonS
the vast majority of farmers considered animal welfare primarily in terms of health and
productivity. natural behaviour and well-being were important as precondition for health
and growth. Farmers took pride in achieving good technical results, which was defined in
terms of production optimization and cost reduction.
Farmers described broiler production as a complex production system in which the broiler
farm was only one location and the farmer only one actor of many. But also the production
on this one farm was complex. the equipment was often technologically advanced but
observation, expertise and experience were still considered important by farmers. As the
margins were small and the birds delicate, it was important for farmers to closely watch
the animals, their health and their well-being. If anything was wrong, they had to be able
to act in time. Farmers did not see the need for additional external control; if there were
problems that they overlooked, the slaughterhouse would tell them and they would take it
into account in the next round. In their opinion, this was sufficient for assuring animal
welfare.

41
most farmers had difficulty discussing animal welfare as such and in theory.2 It became
more interesting to the farmers themselves once we discussed the parameters that were
included in the monitoring tool. We asked the farmers which parameters they considered
relevant.
8.1 PantIng/huddlIng oF bIrdS
almost all farmers in all three countries considered panting as an important indicator, as
it revealed heat stress due to insufficient ventilation and too high temperature and humidity
inside the house or, in the worse cases, respiratory disorders. besides suffering, panting
chickens used too much water, did not eat regularly, and moistened the litter. measuring
panting and huddling informed them about the climate conditions in the animal house,
which were finally regulated by computer.
most farmers saw huddling of birds as a signal of thermal stress or sanitary problems that
could be due to low temperature inside the barn, symptoms of a disease, and/or bad
conditions of the litter. When chickens huddled, the growth of the flock decreased because
weaker chickens encountered difficulties in feeding regularly.
Some farmers underlined that it was important to check why animals huddled or panted
as it did not always indicate a real problem. huddling, for instance, was not considered as
particularly worrying if displayed by adult chickens. out of context, this parameters was
not necessarily indicating bad welfare. For instance, when external temperature and
humidity were high it was considered normal for chickens to pant. It could also be a
temporary phenomenon, limited to the hotter hours of the summer days. respiratory
disorder might also be due to a congenital problem, already present at birth. It did not
necessarily reveal bad conditions in the house.
8
FarmerS’ commentS on
aSSeSSment ParameterS
2 See Questionaire Part III.
42 / The Assessment of Animal Welfare on Broiler Farms
8.2 behavIoural characterIStIcS
many Italian and dutch farmers considered behavioural characteristics mainly as
indicators of animal health: most of the farmers paid particular attention to chickens
displaying laziness, listlessness, difficulties in moving and lack of reactions to external
stimuli.
‘the eyes must be open and watchful’ (Italian farmer).
If they flutters and challenge each other, it means that they are able to express their
normal behaviour’ (Italian farmer).
but behaviour also depended on genetics, the age of the chickens and feed intake, as well
as the management of the farmer, his/her behaviour in the shed and the light intensity in
the house.
‘Some genetic groups are more lively and reactive than others, showing completely
different behaviour’ (Italian farmer).
‘many factors influence behaviour. If it is warm, there will be less activity in the
stable. humidity influences the activity as well, but also the age of the chickens…
With 42 days they are heavy and activity is very low. If they are just one week old,
they run everywhere. If I want the chickens to be active I simply increase the
intensity of the light’ (dutch farmer).
‘I would not read too much into the welfare side of things, it could be the way
farmers walk through the shed that scares them (the same doing the test). Some do
it quickly, some slowly’ (uK farmer).
Some farmers considered only very extreme forms of behaviour as relevant indicators for
welfare, although it was difficult to define that as well. When walking through their sheds,
it could occur that something spooked one chicken for no apparent reason and set the
whole flock off running around in a frenzy. one farmer suggested that the first time you
saw this type of behaviour you might be worried, but that you just accepted it after a while.
various examples were given as to why birds reacted strangely for no apparent reason,
the primary causes being an unusual routine. Some farmers argued that high levels of
activity were actually a good sign of health in free range birds, and nothing to be concerned
about:
‘the more active they are, the healthier they are, especially on ours anyway. the
more active they are the better they’ll range, and this is what we’re after’ (uK
farmer).
Farmers’ Comments on Assessment Parameters / 43
Some farmers were concerned about measuring emotions like boredom, and also of the
way in which the emotions were measured:
‘Some of the things they were looking for sounded absolutely bizarre! how can you
tell if a chick looks bored, interested, or whatever? and then they have to give a
score for a flock as a whole, so even if there are differences in the flock… everything
ends up being a middle score’ (uK farmer).
most uK (free-range) farmers thought that it was a good thing to enhance the environment
and provide the birds with entertainment. Some considered it slightly irrelevant on free-
range systems where birds could go outside and seek their own entertainment.
8.3 dIFFerent teStS oF Fear
all farmers considered it irrelevant and some even misleading to measure chickens’
reactions to an unfamiliar person. In their view, it was normal and a sign of health if
chickens sought to escape from the presence of unknown person. only weaker and
unhealthy chickens could were easily approachable in their opinion.
‘chickens must run away when you approach them’ (Italian farmer).
In addition, it also depended on the particular of breed of chickens how they reacted to the
presence of unfamiliar persons. Some farmers pointed even at the importance of the
temperament of single animals, as it is for humans. according to some farmers it was
difficult to measure fear in an objective way. moreover, fear had little relevancy in the
context of broiler production, i.e. the (cost) efficient production of meat.
‘not really relevant, because in general they only see so many people and can get
uneasy about different things/people. It’s a closed system and they even get wary of
me if I’ve been away for a few days’ (uK farmer).
Some farmers thought that the reaction to a novel object could be a relevant sign of welfare.
In their view, chickens were curious by nature: being attracted by an unfamiliar object
meant that they were able to display a natural behaviour.
‘I observe how the animals behave. If I am repairing something, they climb on top
of my tool box and I try to touch them. I do not do this often, but if you would stand
in the animal house for 10 minutes, you would see many things’ (dutch farmer).
other farmers, however, underlined that chickens were wary and slowly in acquainting
themselves with an unknown object. curiosity also depended on age in their view.
44 / The Assessment of Animal Welfare on Broiler Farms
generally speaking, fear in chickens was not seen as a good and objective indicator for
welfare as many factors influenced the results of the tests, such as the age of the animals,
the time elapsed since the last vaccination treatment, the feeding system, the chickens’
breed but also the regular practice of individual farmers8
8.4 abIlIty to WalK
many farmers considered the ability to walk as a relevant parameter. a moving animal
was a healthy animal. It had sufficient space and as a result sufficient feed, farmers
explained. lacking ability to walk affected both animal welfare and farm productivity.
they grew more slowly and chances of breast burns were higher. Serious difficulties in
walking could indicate too high a stocking rate, sanitary problems (like arthritis,
inflammations, enteric diseases), feed quality deficiencies, bad litter conditions, and too
fast a growth of body mass compared to the bone structure.
‘It gives you all sorts of information, to be perfectly honest with you. It gives you
bone structure, muscle structure information. Feeding information, the amount of
exercise they’ve had in the past, all sorts of information’ (uK farmer).
most of the farmers argued that an animal with disability to walk would suffer even more
when gaining weight. others argued that chickens had to walk very little in order to reach
water and feed. they considered the parameter as irrelevant for animal welfare, or at least
not an appropriate parameter for intensive farming systems.
‘We are talking about animals that live indoors for no more than 50 days and that
develop in few time a great body mass. Should we expect a man of 120 kg to walk
well?’ (Italian farmer).
‘the ability to walk is not a parameter that affects the quality of their life, because
they are not born to walk for long distance and they are not stimulated to do that as
they would be in extensive farms’ (Italian farmer).
others pointed out that it also depends on the situation and the timing of the measurement
whether or not not walking is a bad sign. thus, it also depended on how and when the
ability to walk was measured. a ‘lazy’ chicken, for instance, was not necessarily a sign of
bad welfare at the end of the finishing period.
‘It relates very much to animal welfare. but as it can be influenced, for example, by
feeding, it is difficult to measure objectively: feeding continuously results in lazy
chickens whereas a feeding schedule results in chickens walking more rapidly. also
if you increase the intensity of the light the chickens will run more rapidly. If the
Farmers’ Comments on Assessment Parameters / 45
chickens have an inflammation of the joints, or bad hips, this has a negative impact
on welfare’ (dutch farmer).
Some uK farmers argued that leg problems were not really a major problem on free-range
systems and breeds:
‘It would for standard birds, but for free range it wouldn’t make no difference
because the breed of bird we’ve got, we’ve got the hubbard we do not get leg
problems. and it’s a strong bird. When we had the ross and cob before the hubbard
came in, I would say yes it would be a good thing. but for the slow-growing hubbard
bird, legs are not a problem’ (uK farmer).
again, we also see that many farmers evaluated the appropriateness of the measurement
of a certain symptom not against the significance of the symptom as such but in the light
of their ability to control the occurrence of certain symptom and, hence, their moral
responsibility. If something was out of their control and they were not to be considered
responsible for it, the symptom and its measurement was not appropriate for monitoring
animal welfare.
‘It does not necessarily reflect the real situation at the moment of the assessment. It
may be due to something happened in the past, out of the possibilities of farmers’
control or that he could not prevent’ (Italian farmer).
8.5 Foot Pad dermatItIS, hocK burn, breaSt burn and Pathology
the vast majority of farmers considered it relevant for welfare to check the presence of foot
pad dermatitis, hock burn and breast burn. For some farmers, the occurrence of such
problems was undoubtedly a good indication of welfare; others were less sure of their
exact relevance taken individually.
‘there does not seem to be any rhyme or reason to why you get high hock burns or
foot pad marks. you can have terrible litter and get good results. most people would
look at a wet litter and think ‘oh that’s [crop] going to be terrible’, but it’s not always
the case’ (uK farmer).
While farmers recognized that it was commonly accepted to attribute such problems to
poor litter, there was a feeling that these problems could just as easily be the result of the
reactions of particular breeds or of poor quality feed. as another farmer suggested:
46 / The Assessment of Animal Welfare on Broiler Farms
‘It’s an indication of something, people blame the litter but it’s often more to do
with breed and feed. If you change the feed you might change the acidity’ (uK
farmer).
‘It is certainly informative. If you are able to keep the shed dry, you won’t have this
problem so easily. they will become lame less quickly, and have less hock burns.
the foot pad is a more complicated issue. this also can originate in the first week
without you recognizing it. you would not see it happening. nevertheless, with the
information you can take action’ (dutch farmer).
‘hock burn is a clearer indicator: they reveal the actual condition of the environment
because that part of the leg is more resistant to high acidity levels of the litter’ (Italian
farmer).
also climate was stressed as an important factor and it was clear that the forces of nature
had a real impact on farming practice on a daily basis. While hot air could help to keep
litter dry in the summer, it was pointed out that cold air often kept litter damp in the winter.
as a farmer noted:
‘this is something you have to keep your eye on because the causes are not that
clear… Free-range birds run around in all types of weather, in mud or sun, some
flocks have hock burns in some conditions, some don’t, so its not clear’ (uK farmer).
Some farmers raised the question whether or not animals suffered from it, whereas others
were convinced that it caused suffering and bad welfare. Farmers also pointed at the
problem that improving this parameter would negatively affect other parameters. Some
considered this parameter as a good instrument to control animal welfare; others found its
use exaggerated. they explained that hard skin was often confused with wounds. anyhow,
the damages had a direct economic impact on farms’ revenue since they might involve
penalisations on the sale price.
8.6 lItter Score
the relevance of litter state for measuring animal welfare was recognized by all
interviewed farmers because it affected many other parameters, such as the ability to walk
and to move, the development of foot pad dermatitis, hock burn and breast burn, the
comfort of the resting area, healthiness of the environment and quality of the air in terms
of ammonia concentration and humidity, and the development of pathologies. Farmers
liked to have dry houses as it was also more comfortable for them to work in a dry house:
Farmers’ Comments on Assessment Parameters / 47
‘they can forage and behave like chickens. If the litter is sticky, they cannot do that.
the chicken will not be able to search, as it likes. all farmers like to have dry animal
houses, also because it is more comfortable to work in. If I step with my slippery
boots over a feeding pipe with a bucket of death chickens I don’t like to fall. It also
smells less’ (dutch farmer).
So litter quality was important but in the eyes of many farmers they did not need others
to tell them. moreover, measurement results always came too late to change anything for
this flock. Some farmers proposed to measure this parameter during all the breeding period
long, others thought measuring at the last day would indicate if the chickens had good
conditions or not.
many farmers pointed out that litter quality was important but a very complex issue. the
assessment was useful when assessors could also establish the cause and distinguish
between occasional/incidental factors or structural reasons.
‘litter condition may change within a few hours. you can find a very bad litter now,
but this does not mean it was bad even before’ (Italian farmer).
‘It should not be too dry, but dry enough to have no burning spots. a lot can be read
from the manure as well on how your chickens behave. If all is dry but the other day
wet, something has been wrong with the feed–water balance. to have all this
balanced is also important for the wallet’ (dutch farmer).
uK farmers pointed out that litter in free-range sheds was much more dependent on climate
than in conventional sheds, primarily because these sheds had pop holes open and air
coming through at all times of the year. For some, bad litter was thus not necessarily seen
to be ‘an indication of bad management’. the relevance of the measure was also seen to
be dependent on whether the litter was tested is for dryness, acidity or alkalinity, and on
the quality of feed and bedding materials being used. again it was not clear that the
measure was useful taken on its own and there was a feeling that it would be more useful
when used alongside other measures. as one farmer stressed:
‘all these things are linked, so litter’s going to be critical in how much foot pad
stuff, all these things, how it fits in with everything else’ (uK farmer).
8.7 aSPectS oF the houSe
Farmers said that they checked the house daily as it directly related to the optimization of
the farm production: the intensity of the light, the heating, and the provision of drinking
water. also in the uK free-range systems the underlying current was that you needed to
48 / The Assessment of Animal Welfare on Broiler Farms
have all the aspects of housing correct if your birds were going to perform effectively, and
that this was a useful measure. In case aspects of the house were changed, this affected the
behaviour and the growth of chickens.
‘you don’t want to compromise them being able to eat and drink when they want to
eat and drink, because if you compromise their eating and drinking it’s not in our
interests… because they’re not going to grow to their optimum ability’ (uK farmer).
‘I have six drinking lines per house. In order to encourage the chickens to walk, I
give only four lines, in the first period. I have to keep the chickens healthy. I also
change the ones I take up. this is part of growing chickens. I need strong legs; the
cocks can weight 3.5 kg’ (dutch farmer).
all farmers used the housing data for optimizing the production but they differed in what
they measured. not all of them checked the concentration of dust and ammonia. Some
measured co2 and the temperature of the floor. these data allowed them to check what
happened, for example, six rounds ago. most data were used to manage the actual situation
in the houses, to make sure that animals were healthy and growing while keeping a close
eye on the expenses.
discussing the aspects of the house implied also discussing the delicate balance between
costs and benefits. to control the humidity was most difficult, as humidity could only be
controlled by heating the house, which was very costly. Sometimes higher values of
ammonia, for example, needed to be accepted in case improvement cost too much.
‘you can adjust, it can be improved. during the winter you have more ammonia.
this is a result of keeping the ventilation flaps closed in order to limit the need of
heating. If we were paid better we could open them more often’ (dutch farmer).
8.8 mortalIty
Farmers tried to avoid mortality. according to some farmers, a low mortality rate indicated
good management and good health; others doubted the relevance of mortality as objective
indicator of animal welfare.
‘In the first two weeks, the mortality can be either really good or bad and there
doesn’t seem to be a lot you can do about it. after that if your mortality creeps up,
then that’s an indication and you need to do something before it gets too high’ (uK
farmer).
Farmers’ Comments on Assessment Parameters / 49
Some factors increased mortality without indicating bad welfare of lack of care. Such
factors were, among others, bad quality of the chicks and outbreak of diseases that were
not linked to housing conditions. Following the farmers, high mortality as such did not
proof lack of animal welfare, and without specifying the cause it would not provide
relevant information. In the farmers’ view, it depended on when mortality occurred (in the
first or last weeks), and whether it was incidentally or structurally high.
‘If the chicks are weak or have some problems from birth, it is impossible to avoid
high mortality’ (Italian farmer).
‘Pathologies may occur even in presence of good farmer’s management and good
general conditions of the environment where animals live’ (Italian farmer).
a high mortality rate in the first week caused by the delivery of bad material by the
breeding company forced the farmer to take the weak animals out in order to protect the
rest of the flock. this was good management but resulted in high mortality rates. at the
end of the round, animals often died from overheating, diseases or because they grew too
fast. this was a sign of bad animal welfare and unwise treatment by the farmer.
‘this is a point for discussion. It depends on the material provided. It also differs
from season to season. It is telling something though. If you have a high mortality
rate, you have very bad chickens. the health is not good. but the way in which they
die is more important than how many die. It is all about how they lay down. When
you have many animals that grew to death, and lay down backwards, you can adapt
something in your management. In that case you, the farmer, are responsible. If they
are sick there is not much you can do’ (dutch farmer).
all farmers kept mortality data in their administration and were able supply these data.
Information on mortality was considered as self-evidently relevant to dutch, Italian and
british farmers as dead animals brought no money.
8.9 concluSIonS
across countries, farmers appointed similar parameters as the most relevant parameters for
animal welfare. among them were foot pad dermatitis, hock burn, breast burn and
pathology¸ litter score, and housing. In all three countries, fearfulness was seen as the least
relevant parameter. there was more difference of opinion on the relevance and usefulness
of individual measurements.
many farmers worried about the reliability and validity of the results: the
representativeness of the sample, the subjectivity of the assessment and evaluation, the
50 / The Assessment of Animal Welfare on Broiler Farms
frequency of assessments, and the integration of factors such as climate and management
and timing of the assessment.
they also underlined time and again the interrelation between many of the parameters and
measurements. For improvement, it was necessary to take this interrelation into account.
Improvement of just one of the parameters could easily result in the deterioration of
another, and consequently harm welfare. In order to grasp the complexity of the
production, farmers thought that the different parameters should be measured at the same
time and judged in combination.
broiler farmers monitored the production process continuously, by way of direct
observation of animals and by way of various technical equipments. hence, monitoring
animal welfare was not strange to them. Farmers evaluated the monitoring tool by
assessing the practical relevance of measurements and their potential role in production
management. For them, it made sense to assess those principles and criteria that affected
production and that could be manipulated by a farmer. most of the farmers did not see the
use of measuring something that was out of their control or that had no impact on health
or growth and, hence, production.
often farmers had difficulty to recognize the usefulness of measurements done by
outsiders. outsiders were unable to see the ‘full picture’ of the farm and how welfare was
built up by many different interrelated factors. all had to be seen in the context of the
specific farm, at that specific moment, and given this specific flock. they also underlined
that the assessors’ findings did not supply new information as farmers walked daily through
the flock and therefore knew for sure if animals were able to walk or not.
51
one goal of the study was to learn from farmers how they experienced the assessment and
to check if the practical implementation of the monitoring tool on the farm could be
improved. We asked farmers how they perceived the timing of the assessment, the
behaviour of the assessor, the disturbance caused by the assessment and the usefulness of
the results. Besides, we wanted to know how they thought about the implementation of the
monitoring tool.
9.1 aSPectS, ProceSS / tIme Frame, aSSeSSor3
all farmers received information before the actual assessment. most but not all farmers had
read the information. Several farmers had taken the decision to join on the basis of the
information provided by telephone. Some commented that the information had not been
clear.
In the netherlands, the decision to join the research was not only based on the information
on Welfare Quality®. many Dutch farmers decided to join the project because they wanted
to respond to the growing social concern on animal welfare and critique towards intensive
husbandry. Besides, they worried about the objectives of the WQ assessment tool and its
potential impact on legislation. Participating in the research was a way to regain some
control. Some farmers explained that they planned their participation in a strategic way by
offering a specific bird house as sample. Some offered a particular good house in order to
get good results and contribute to a good image of the sector. others offered the worst
house to lower the results and in this way delimit expectations and future norms.
the Italian farms were selected by crPa in collaboration with the responsible of the
Quality Insurance of the Slaughterhouse. the farmers had been contacted by phone and
asked if they were willing to participate in the project. at each farm, only one (and the
9
FarmerS’ exPerIenceS oF the
on-Farm aSSeSSment
3 See Questionnaire Parts III, IV and V.
52 / The Assessment of Animal Welfare on Broiler Farms
same) house was visited in pre- and post assessment and measurements were carried out
for the birds inside the house and later at the slaughter plant.
In the UK, it was difficult to recruit farmers because the production company had changed
owners and all agreements had to be renewed. UK farmers were asked by the production
company to join. We have no information about the motivation of Italian farmers to
participate. In the Italian interviews, the experience of the assessment itself was not
discussed in detail, therefore it is mainly the Dutch and British experience on which we
report in more detail.
9.2 the aSSeSSment
9.2.1 aSSeSSment on the Farm
the on-farm assessment took place during the last week of the fattening process, in order
to minimize the effect of potential disturbance, also in agreement with farmers. In general,
the farmers spoke positively about how the assessors had carried out the work. there were
some comments on the long duration of the assessment or some minor disturbance. But
most of the farmers were satisfied.
‘the most beneficial part of the day was just talking to them about it all, what they
thought of it… their opinion… that’s useful’ (UK farmer).
‘We have the door open, researchers carry out their work. We don’t have to keep an
eye on them. We have nothing to hide… It was at the very end of the round, the day
before the chickens went to the slaughterhouse if I remember well. at that moment,
the chickens can’t get ill anymore. the risk is not very high. hygienically, it should
all be well organized. She had her own equipment, disinfected them, and again when
she left. It has been fine for me’ (Dutch farmer).
In all three countries, only few farmers joined the assessors in the house. Some of the
farmers who witnessed the assessment, complained about particular measurements. Some
Dutch farmers disliked especially the tests on fear – not because they had affected
production negatively, but because they doubted the correct and objective interpretation
of the results.
‘I did not like some of the methods – for instance, to test if a chicken is curious and
nervous and then to deduce fearfulness. Is it fear, I wonder? I did like the test on foot
pad dermatitis, yes’ (Dutch farmer).
Farmers’ Experiences of the On-farm Assessment / 53
Farmers pointed also again at the contextuality of measurements and the need to know
the practice in order to design sensible tests. In addition, the assessor needed to take the
particularities of each farm into account in order to interpret measurements correctly.
But in general, the Dutch, Italian and UK farmers were satisfied with the assessment,
including the pre-assessment information, the way the tests were carried out, and the
behaviour of the researcher. It is important, however, to take into account that the farmers
experienced the on-farm assessment as part of scientific research and, hence, something
extraordinary. It made sense and was not disturbing when looked upon as scientific
research. they never looked at it as something that could be regular practice. all farmers
considered it unrealistic to organize such assessment as part of regular broiler production
practice. they understood the need for carrying out such an in-depth research and were
happy to oblige. But they would certainly not like to be visited more frequently. they also
doubted that such tests were promising for future applications.
9.2.2 FInancIal IncentIVeS For PartIcIPatIon In aSSeSSmentS
We asked farmers if good assessment results should be financially rewarded and if this
would be an incentive to participate. Farmers had different opinions on this issue. most of
the farmers pointed out that their participation in the research had not been influenced by
the financial compensation offered. they decided on the basis of their professional interest
in animal welfare research and regulation. In addition, the on-farm assessment did not
require much of their time. In Italy, the possibility of a financial incentive for joining the
assessment was not discussed.
‘It did not cost me extra work to participate in this project. It is always nice if you
are rewarded financially. But I find it important to improve animal welfare without
financial impact. the point is that consumers won’t pay for animal welfare’ (Dutch
farmer).
‘not necessarily, if we get some useful feedback I don’t mind giving up some time’
(UK farmer).
‘It would be silly to say no, because it is taking up our time, we have to do so many
things’ (UK farmer).
When it comes to regular assessment the situation might be different. But payment seems
not to be of crucial importance. Farmers worried much more about having yet another
control and about the negative impact that scores could have on their financial results.
54 / The Assessment of Animal Welfare on Broiler Farms
9.3 aDVIce4
half of the assessed farms received not only the results of their own and other farms, but
also personal feedback on their results. For several reason, this did not work out as well
as we had intended. First of all, it took much more time than anticipated to calculate all
the results and to feed them back to the farmers. In addition, it proved to be impossible to
give real advice without having good knowledge of the particular farms. We therefore
decided to phone the farmers in order to personally discuss the findings with an animal
scientist who could give some advice on where to find more information. In the UK, the
advice was not prescriptive, and it was framed more as a way of generating advice by
comparing scores with other Freedom Food farms.
all farmers appreciated the personal attention that was given by calling them back in
person. But they did not consider it particularly useful as advice. most farmers said that
they were familiar with the conditions that would guarantee or improve animal welfare.
the suggestions of the researchers did not add anything to what they already knew. they
also pointed out that some problems occurred for reasons that they did not have under
control; again, they referred, among others, to the characteristics of the chicks and quality
of the feed, but also at financial constraints – some improvement would be to costly. Some
of the farmers said that the animal scientist just lacked the knowledge of their particular
farm in order to explain the causes of the diagnosed problems. they also disliked that they
spoke to another person than the one who had assessed the farm.
‘I would say the talk did not bring anything for me. If I had been able to discuss
with the researcher who had carried out the tests, I would have benefited more.
together we had managed perhaps to better understand the background of the
findings’ (Dutch farmer).
9.4 WIDer ImPlementatIon oF the aSSeSSment tool5
We also discussed with the farmers how they perceived the implementation of such an
animal-welfare monitoring tool more generally, and if they thought it would make sense
to inform consumers about the animal welfare by way of farm scores.
4 See Questionnaire Part VII.5 See Questionnaire Part VIII.
Farmers’ Experiences of the On-farm Assessment / 55
9.4.1 monItorIng anImal WelFare
most Dutch and Italian farmers thought that an integrated score on animal welfare
(including welfare at slaughter and during transport) would be a good idea. the Italian
farmers considered an integrated score as a good tool for assessing compliance to animal-
welfare standards for a particular flock but not a farm. others disagreed. In their view,
they were responsible for the faults of others if an integrated score would be calculated.
‘once the catchers come, that’s outside our control; we often make suggestions, but
they aren’t always taken on board’ (UK farmer).
‘Which conclusion should we draw from such a comparison: is it me not being
capable to assure animal welfare in my farm? or is the result due to other factors that
do not depend on my management?’ (Italian farmer).
many farmers liked the idea of exchanging opinions and technical information with
experts; they liked to learn more about animal-welfare management on the farm and saw
advantages of being evaluated by external and independent parties/assessors. they also
wanted to obtain confirmation that their practice was okay, and looked forward to receiving
suggestions and stimuli for improving the farm management.
many farmers were also interested to see how they score in comparison to others. they
wanted to know the scores for every parameter and criteria in order to improve their
production in terms of animal welfare but also economically.
‘I want to know how I perform in comparison to others. I try to do it better than the
others. If you want to earn money, you have to belong to the top of the producers’
(Dutch farmer).
‘Yes, because I like to consider myself a good stockman, and if I make mistakes I
want to put things right. I do my best’ (UK farmer).
But farmers also opted for some in their view important changes in the monitoring tool.
• they wanted the scores to be completed with a more detailed analysis, explaining
the causes of the results.
• they preferred a stepwise assessment – starting with some parameters and including
others only when the first were well controlled and improved.
• they considered it not right to include scores for those factors that they could not
control and that did not measure the animal friendliness of the farm. again they
referred to genetics and characteristics of the chicks.
• they wanted to be sure that the judgement would be fair and objective. therefore,
all the contextual factors that influenced the assessment and results needed to be
taken in to account: the moment when the assessment is done, feeding system,
56 / The Assessment of Animal Welfare on Broiler Farms
different characteristics of the house, previous sanitary problems that had been
already solved at the moment of the assessment.
9.4.2 laBellIng anImal WelFare
most farmers considered animal welfare as a niche market, similar to organic production.
But some farmers worried whether consumers were really interested in just animal welfare.
they thought that consumers were interested in the origin of animals and in food safety,
rather than the way animals were raised.
‘We already produce a special product, making use of as little medicine as possible.
I am of the opinion that we do already well regarding animal welfare’ (Dutch
farmer).
many farmers pointed time an again at the need for financial compensation for extra
quality in terms of animal welfare and they worried about consumers’ willingness to pay
more for animal-friendly products. the UK farmers expressed that some current assurance
schemes – Freedom Food, for example – did not really tell the public much about what they
were doing and that a scheme that did explain things more effectively would be invaluable.
as free-range producers, most farmers thought that they were producing high-end welfare-
friendly products already. as one farmer pointed out, ‘We are all bloody doing it’. another
suggested that WQ was ‘about extending this niche market further’. others argued that
such a label would be good if it explained more about the good things farmers do.
most Italian farmers considered a label attractive for consumers. It would help to create a
market segment for consumers interested in quality. they also considered certification as
an innovative marketing approach for increasing sales. and finally, promotional actions
aimed at giving consumers more information might encourage consumption and increase
trust in poultry production, which in the past had been disrupted frequently by international
food scandals and sanitary crises. a label could increase perception of intrinsic quality of
the product too.
9.4.3 eUroPean ImPlementatIon
most of the Dutch and UK farmers thought that the assessment Scheme should be
implemented europe-wide in order to allow for fair competition. many foresaw, however,
problems for equal implementation and organization – for instance, because of different
control schemes. Some also wondered if the same regulations should be applied when
production conditions differed, among others, because of climatic differences. on a global
Farmers’ Experiences of the On-farm Assessment / 57
level, the problems were even bigger. Farmers felt unfairly treated through the import of
products that were produced under lighter regulations and hence more cheaply.
‘oh god, definitely! In this country, we seem to be adhering to all these standards
when our continental brethren aren’t’ (UK farmer).
others expressed more sanguine views that ‘it would be interesting’ to see how such
schemes would work, given the many variables that would have to be considered. Italian
farmers did not provide specific data on the need or (dis)advantages of a european label.
9.5 conclUSIonS
In general the farmers spoke positively about how the assessors had carried out the work.
there were some comments on the long duration of the assessment or some minor
disturbance. But most of the farmers were satisfied.
It is important to take into account that the farmers experienced the on-farm assessment
as part of scientific research. all farmers considered it unrealistic to organize such
assessment as part of regular broiler production practice.
Payment seems not to be of crucial importance. Farmers worried much more about having
yet another control and about the negative impact that scores could have on their financial
results.
In general, farmers were interested in receiving the assessment results and wanted to know
how they compared with other farmers, although there was also widespread
disappointment that the advice was not more detailed and useful.
many farmers liked to learn more about animal-welfare management on the farm and saw
advantages of being externally evaluated and compared with others farms. But farmers
also opted for some, in their view, important changes in the monitoring tool. In short, they
wanted more information on the causes of low scores, more attention given to the
interrelations between parameters and the judgement of animal welfare within the specific
context of their farm at that particular moment in time. this should also include the
acknowledgement that they did not have full control of all factors of animal welfare.

59
many farmers received their results later than initially planned. For some of the farmers,
it was therefore difficult to remember the precise circumstances of the assessment. In the
netherlands, this was especially true for those farmers who were also called by phone in
order to discuss the results (group with advice). In these cases, the farmers often expressed
not to remember the details of the assessment (tests and assessor) nor their results. In the
uK, the individual results and advice were sent out when all the assessments had been
completed. then farmers had to be called again to discuss the results. this caused also
considerable delay.
10.1 InterPretatIon and accePtance oF the reSultS6
overall the farmers were very interested in the results and especially in how they
performed in comparison to others (the benchmarking). But many dutch and British
farmers were disappointed about their results – they had expected to do better, based on
other assessments on related issues (e.g. from the slaughterhouse). many farmers said that
the slaughterhouse had never complained about their incidence of foot pad dermatitis.
Farmers had also difficulty accepting the results because they did not know how to
interpret them, to understand the severity of problems or their causes and the ways to
prevent them. the results were not plausible to them and the results alone were providing
too little information to accept the implicit critique as relevant and significant. Farmers
personally contacted by phone in order to discuss the results were more ready to accept the
assessment results as relevant and useful in order to improve the production.
‘at first you blame yourself. Second, you realize it is not like it is written: how
should you perceive the report? how serious should you take it?… the report refers
to your daily practice, to what you do but not always consciously. You see and feel
10
FarmerS’ reactIonS to the
aSSeSSment reSultS
6 See Questionnaire Parts III, VI and IX.
60 / The Assessment of Animal Welfare on Broiler Farms
what it is about, but expressed in numbers it hurts your feelings. You don’t see your
effort back in the report… according to the report, there is not one healthy chicken
in the animal house. and that is not true. they judge whether the chickens approach
you but not the use of medicines’ (dutch farmer).
In the uK, quite a few farmers were surprised by their results, some because they had
done better than expected. Some indicated that they were sent snippets of information (on
hock marks, etc.) from the slaughterhouse, but that they did not get this level of information
from anyone else. others felt that it was good to get a second opinion and to have
confirmation of what they thought they were doing well anyway, while some claimed that
the assessment provided a good reference point. not many had considered changing their
practice as a result of their results.
most Italian farmers were not surprised by the results of the assessments. In their view, the
situation depicted in the report corresponded well to their expectations about the flock
assessed, also when the results were negative. many Italian farmers did not agree on some
parameters, especially foot pad dermatitis, mortality, cleanness of plumage, ability to walk
and ammonia concentration. they disagreed with the low measurements or the
interpretation of the results. Some farmers believed that the criteria (adopted for the
assessment) were too severe, and more detailed explanations should accompany the
judgement.
10.2 releVance oF the reSultS
Farmers explained time and again that they aimed at maximizing production volume in
order to earn their living. they found the importance attached to animal welfare and the
significance given to the assessment results exaggerated. they also pointed out that the
results of the assessment did not add information nor provided specific suggestions on
how to improve animal welfare on their farm: the assessment on the whole gave a picture
of what they already knew about the flock assessed. negative results of some parameters
were told to be dependent on occasional causes that could not be prevented, and, excluding
few cases, they were already expected. In order to be useful and relevant a lot more
information needed to be added:
• more details on the ‘history’ of the flock: weight of the birds, provenance of the
chicks, sanitary problems occurred in the past, type of the equipments, etc.;
• more information about the farm context: the timing of the assessment, genetic type
and sex of birds, the type of the ventilation system, and the type of litter.
repeatedly, farmers pointed out that others were at least partially responsible for animal
welfare. Feed was mentioned most often, followed by the ‘materials’ delivered to the farm.
Farmers’ Reactions to the Assessment Results / 61
Some of them were aware that they could make up for these drawbacks but only against
high costs, which they generally could not afford. many of the farmers also indicated that
they were unable to control the most determining factors influencing animal welfare on
their farm. they were interested in the assessment of parameters that they could influence
and use for optimizing their production system.
‘You do not control everything. Feed quality, for example, you cannot control. once
it is delivered, you have to work with it until it is finished. and if the weather is wet,
for a week, the animal houses will be wetter. You cannot dry humid air’ (dutch
farmer).
10.3 recognIzed welFare eXPertISe
most farmers had to think for quite a long time before they could indicate whose
knowledge and expertise on animal welfare they valued most. In their view, outsiders had
generally little understanding of what was going on on their farms. generally, farmers
relied on people who visited their farm on a regular basis, such as technicians of feed
suppliers and veterinarians. they understood that they had vested interests but these people
had at least a realistic idea of the farmer’s way of life. In addition, they made use of
information provided by professional magazines and by students who did their practical
periods at the farm.
Farmers generally mistrusted civil servants, political activists, and ‘society as a whole’.
although they valued their critique as keeping them ‘sharp’, they did not expect to learn
much from them. most farmers considered themselves the best experts of animal welfare
but also valued the knowledge of scientists. In their view, it would be a good idea if farmers
and scientists co-operated in the development of animal-welfare standards. animal welfare
should be driven by science and certainly not by politics.
10.4 concluSIonS
Farmers were very interested in the results but often also surprised about the results. they
had expected to do better or worse. the assessment results did not match their own
evaluation or feedback from the slaughterhouse.
62 / The Assessment of Animal Welfare on Broiler Farms
many farmers considered the results useful but wished that the assessment had looked in
more detail at the particularities of their farm and stock at that time in order to better
understand which problems were incidental or structural in nature. It was easier for them
to accept the results after personal feedback when they better understood the severity of
problems and their causes.
most farmers recognized especially the expertise of technicians of feed suppliers and
veterinarians as they visited their farm on a regular basis and had inside knowledge.
63
in Part i, we reported on the assessment results and animal welfare scores. as a follow-up
to the technical assessment, we planned to analyse the interrelation between welfare scores
and farm characteristics such as farm size and management as well as the farmer’s
definition of and attitude towards animal welfare. in practice this proved to be complicated:
the differences between farms and farmers were quite small and it was difficult to decide
which welfare scores to use for the categorization of farms. we finally decided to use
severe foot pad dermatitis, severe hock burn and gait (severe walking deficiency) as the
basis of comparison and used the average scores during pre- and post assessment for the
definition of best and worst performing farms. moreover, we decided to compare two of
the best scoring farms with two of the worst scoring farms. we did that in the netherlands
and in italy and present the results below. this analysis has, however, to be regarded as an
experiment that illustrates the possibility to better understand the background of good and
bad welfare performance. the results should be interpreted with caution and considered
as indicative findings.
11.1 netherlands
dutch farms performed on average very similar. it was therefore difficult to select farms
performing best or worst. often farms performed bad for one parameter (e.g. foot pad
dermatitis), but quite good for another one (e.g. hock burns, see farm b for example). we
selected farms based on their scores for foot pad lesions, hock burns and gaits; we argued
that farms should score best or worst for at least two of these parameters. in table 11.1,
we present farms a and b as worst scoring farms and farms c and d as best scoring
farms. there were farms having higher scores for e.g. severe foot pad lesions as compared
to farms a and b; however, these farms performed well or average for the other two
parameters included and were therefore not classified as worst performing.
11
differences between farmers
with the best and worst
welfare scores
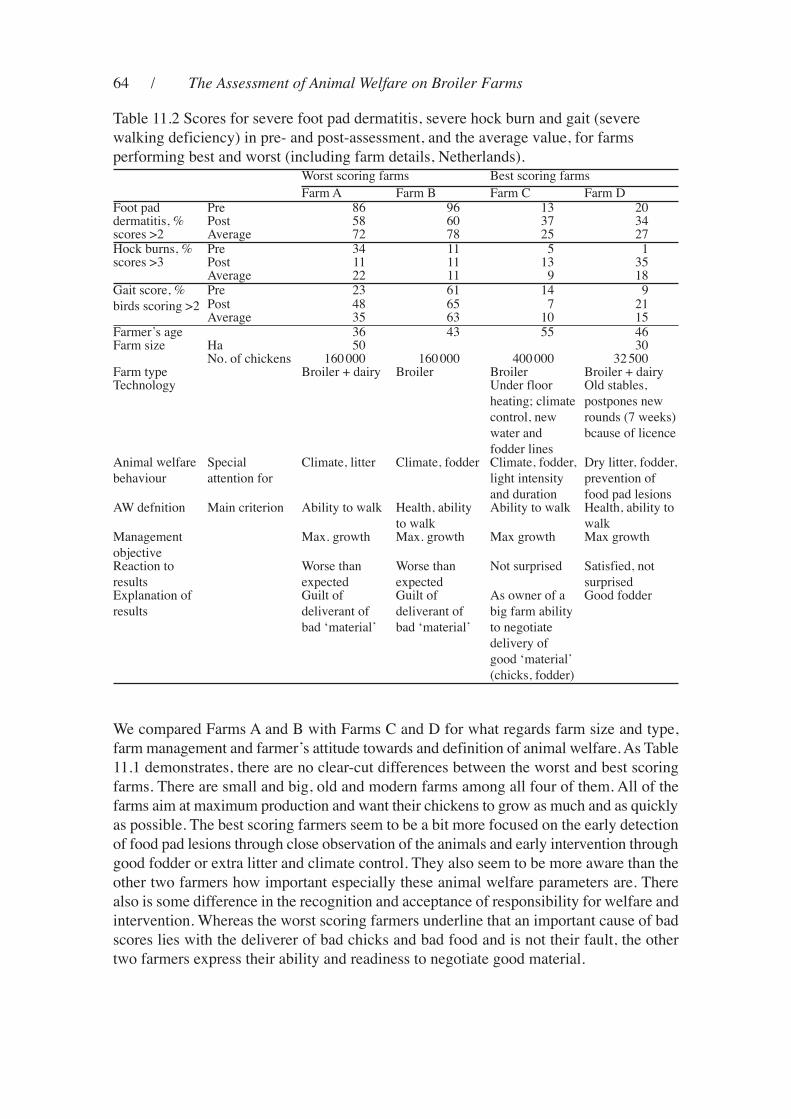
64 / The Assessment of Animal Welfare on Broiler Farms
we compared farms a and b with farms c and d for what regards farm size and type,
farm management and farmer’s attitude towards and definition of animal welfare. as table
11.1 demonstrates, there are no clear-cut differences between the worst and best scoring
farms. there are small and big, old and modern farms among all four of them. all of the
farms aim at maximum production and want their chickens to grow as much and as quickly
as possible. the best scoring farmers seem to be a bit more focused on the early detection
of food pad lesions through close observation of the animals and early intervention through
good fodder or extra litter and climate control. they also seem to be more aware than the
other two farmers how important especially these animal welfare parameters are. there
also is some difference in the recognition and acceptance of responsibility for welfare and
intervention. whereas the worst scoring farmers underline that an important cause of bad
scores lies with the deliverer of bad chicks and bad food and is not their fault, the other
two farmers express their ability and readiness to negotiate good material.
table 11.2 scores for severe foot pad dermatitis, severe hock burn and gait (severe
walking deficiency) in pre- and post-assessment, and the average value, for farms
performing best and worst (including farm details, netherlands).worst scoring farms best scoring farms
farm a farm b farm c farm dfoot paddermatitis, %scores >2
Pre 86 96 13 20Post 58 60 37 34average 72 78 25 27
hock burns, %scores >3
Pre 34 11 5 1Post 11 11 13 35average 22 11 9 18
Gait score, %
birds scoring >2
Pre 23 61 14 9Post 48 65 7 21average 35 63 10 15
farmer’s age 36 43 55 46farm size ha 50 30
no. of chickens 160 000 160 000 400 000 32 500farm type broiler + dairy broiler broiler broiler + dairytechnology Under floor
heating; climate
control, new
water and
fodder lines
old stables,
postpones new
rounds (7 weeks)
bcause of licence
animal welfare
behaviour
special
attention for
climate, litter climate, fodder climate, fodder,
light intensity
and duration
dry litter, fodder,
prevention of
food pad lesionsaw defnition main criterion ability to walk health, ability
to walk
ability to walk health, ability to
walkmanagement
objective
max. growth max. growth max growth max growth
reaction to
results
worse than
expected
worse than
expected
not surprised satisfied, not
surprisedexplanation of
results
Guilt of
deliverant of
bad ‘material’
Guilt of
deliverant of
bad ‘material’
as owner of a
big farm ability
to negotiate
delivery of
good ‘material’
(chicks, fodder)
Good fodder
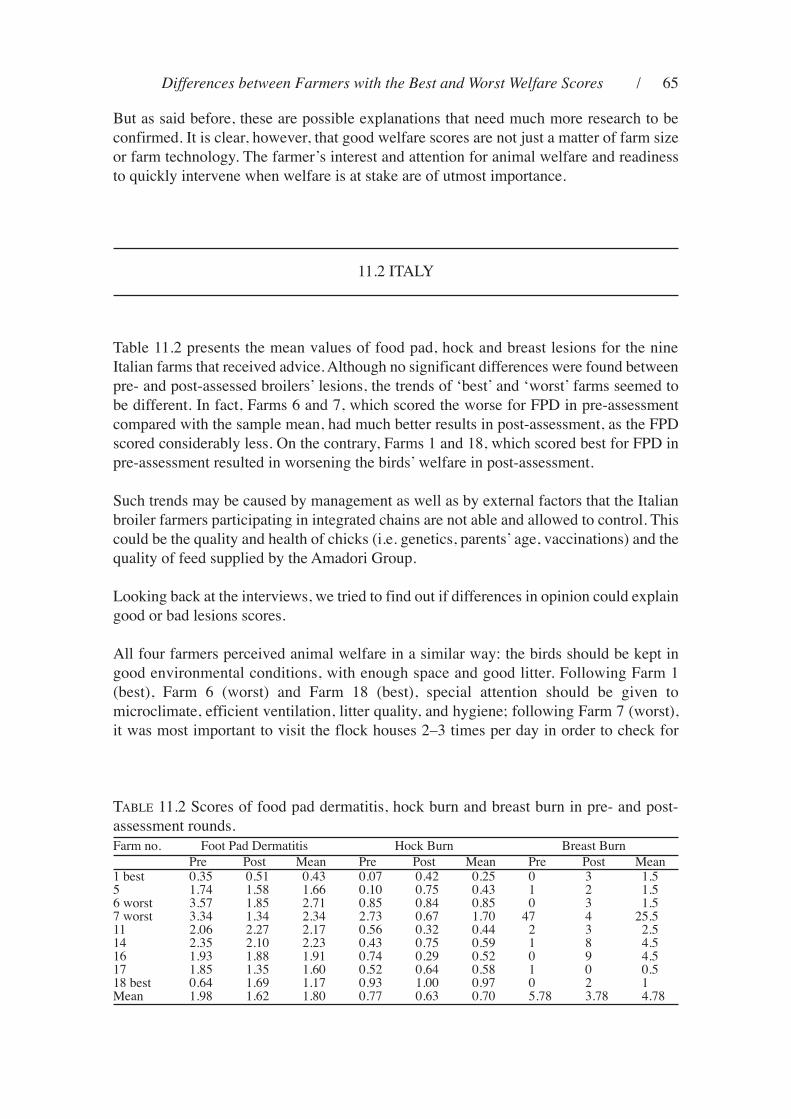
Differences between Farmers with the Best and Worst Welfare Scores / 65
but as said before, these are possible explanations that need much more research to be
confirmed. it is clear, however, that good welfare scores are not just a matter of farm size
or farm technology. the farmer’s interest and attention for animal welfare and readiness
to quickly intervene when welfare is at stake are of utmost importance.
11.2 italy
table 11.2 presents the mean values of food pad, hock and breast lesions for the nine
italian farms that received advice. although no significant differences were found between
pre- and post-assessed broilers’ lesions, the trends of ‘best’ and ‘worst’ farms seemed to
be different. in fact, farms 6 and 7, which scored the worse for fPd in pre-assessment
compared with the sample mean, had much better results in post-assessment, as the fPd
scored considerably less. on the contrary, farms 1 and 18, which scored best for fPd in
pre-assessment resulted in worsening the birds’ welfare in post-assessment.
such trends may be caused by management as well as by external factors that the italian
broiler farmers participating in integrated chains are not able and allowed to control. this
could be the quality and health of chicks (i.e. genetics, parents’ age, vaccinations) and the
quality of feed supplied by the amadori Group.
looking back at the interviews, we tried to find out if differences in opinion could explain
good or bad lesions scores.
all four farmers perceived animal welfare in a similar way: the birds should be kept in
good environmental conditions, with enough space and good litter. following farm 1
(best), farm 6 (worst) and farm 18 (best), special attention should be given to
microclimate, efficient ventilation, litter quality, and hygiene; following farm 7 (worst),
it was most important to visit the flock houses 2–3 times per day in order to check for
table 11.2 scores of food pad dermatitis, hock burn and breast burn in pre- and post-
assessment rounds.
farm no. foot Pad dermatitis hock burn breast burn
Pre Post mean Pre Post mean Pre Post mean1 best 0.35 0.51 0.43 0.07 0.42 0.25 0 3 1.55 1.74 1.58 1.66 0.10 0.75 0.43 1 2 1.56 worst 3.57 1.85 2.71 0.85 0.84 0.85 0 3 1.57 worst 3.34 1.34 2.34 2.73 0.67 1.70 47 4 25.511 2.06 2.27 2.17 0.56 0.32 0.44 2 3 2.514 2.35 2.10 2.23 0.43 0.75 0.59 1 8 4.516 1.93 1.88 1.91 0.74 0.29 0.52 0 9 4.517 1.85 1.35 1.60 0.52 0.64 0.58 1 0 0.518 best 0.64 1.69 1.17 0.93 1.00 0.97 0 2 1mean 1.98 1.62 1.80 0.77 0.63 0.70 5.78 3.78 4.78
66 / The Assessment of Animal Welfare on Broiler Farms
optimal conditions. animal welfare could be improved, following farm 7 (worst), by
installing a more efficient ventilation system.
in the farmers’ view, the most relevant measurements were litter quality (farms 6, 7 and
18) and microclimate (farm 1); as least relevant measurements farm 18 mentioned
mortality, because the health of chickens could not be checked or chosen by the farmer.
farms 1, 6, and 7 appointed the birds’ reactivity to human approach as the least relevant
welfare indicator.
all four farmers considered the birds’ lesions as relevant for animal welfare even though
farm 7 (worst) underlined the importance of causes, such as enteric diseases and seasonal
variations of the climate, which cannot be controlled.
in many occasions, the farmers reasserted that, as they are involved in an integrated food
chain, they had to accept the chicks and the feed the contracted company provided them
with no possibility of control. in their view, the health of chicks and the quality of feed
were crucial factors for animal welfare. as they could not control them, they felt unable
to improve the broilers’ welfare without the help and the collaboration of the contracted
company.
67
12.1 Definition of animal welfare anD the aCCePtanCe of the
welfare Parameters anD Criteria
• most farmers thought that animal welfare was about providing animals with the
things they needed for a good life.
• farmers recognized the need to carry out scientific assessments, but they also
stressed the merits and importance of local knowledge and practice.
• most farmers considered health as the most important aspect of welfare. for them,
welfare was important as long as it influenced growth and productivity. welfare
aspects that had little influence on growth were generally considered as irrelevant.
• on average, farmers agreed with all the parameters and criteria included in the
assessment and monitoring tool. the parameters related to health and/or growth
mattered clearly more to them than others. the ability to walk, which the farmers
related to behaviour, was generally considered of less relevance, and others such as
behaviour, human-animal relation and fearfulness were not relevant to them at all.
• the different tests of fear were the least relevant measure for all farmers, primarily
because it was difficult to pinpoint why birds reacted as they did, and also because
it was seen to be good for active, free-range birds to be a little fearful of humans.
• farmers recognized the value of most of the measures in the assessment in some
way, but questioned how useful most of them were taken individually, preferring to
view them as a holistic system that mirrored farming practice.
• in their view, many parameters were difficult to understand for outsiders. inside
knowledge of the context and the interrelation of many factors were important to
judge animal welfare and to imagine possible and necessary improvements.
• when receiving the results, the farmers had often difficulty to understand the
significance of parameters. a personal discussion with the scientists supported
farmers’ understanding and acceptance of the results. the explanation of the practical
relevance of the findings played an important role in this.
12
ConClusions to Part ii
68 / The Assessment of Animal Welfare on Broiler Farms
12.2 the exPerienCe of the on-farm assessment
• in general, farmers were satisfied with the way the assessment took place their farms.
• the assessment had no untoward effects on the birds or on production.
• as only few farmers observed the full assessment, it did not cause any significant
disturbance or loss of time. still some farmers raised questions about the long
duration of the assessment.
• some farmers raised the possibility of personality clashes and subjective
interpretations of measures as possible causes of problems during the assessment.
• Questions were raised about the time in the cycle the assessment took place.
• most farmers perceived the assessment as a scientific experiment, which they were
happy to support. they considered it unrealistic to implement such an assessment as
a regular on farm check on animal welfare.
• they were also of the opinion that certain measurements, such as foot pad lesions,
could better be done at the slaughterhouse.
12.3 ValiDity of the results
• many farmers worried about the quality of the assessment and the reliability and
validity of the results. they then referred to the representativeness of the sample, the
subjectivity of the assessment and evaluation, the frequency of assessments and
integration of factors such as climate and management and timing of the assessment.
• in their view, something sensible about animal welfare could only be said when the
parameters were looked upon in their interrelation (not separately). time and again
they also underlined that improving one parameter would easily result in the
deterioration of another. the assessment had to consider the measures holistically.
• in addition, they pointed out that animal welfare had to be understood within the
context of this particular farm at this particular moment in time. they had difficulty
to understand how these interrelations were taken into account in the way the scores
at different levels were calculated.
• it was also important for them to point out that they did not have full control of
animal welfare as they were part of a network of production and depended on the
delivery of good material by others. assessing animal welfare on their farm
implicated in their view that they were also blamed for the faults of others and had
finally to pay the price for it.
• in the uK, farmers mentioned the influence of the weather on free-range systems and
the difficulties of getting reliable results on different farms under different climatic
conditions.
Conclusions to Part II / 69
12.4 releVanCe of the results
• the farmers were interested in the results and their relative performance compared
to others, because they wanted to do well. they evaluated the relevance of the
results, however, mostly on the basis of their practical applicability and the
information they offered for solving problems and improving production.
• they indicated that they did not get such detailed feedback from anyone else.
• most farmers were disappointed that the results provided little explanation on the
causality of low scores and their prevention in the future. the telephone
conversations with animal scientists gave some more insight, but they still missed
the practical advice.
• farmers would have liked their feedback sooner. they were used to getting regular
and continuous feedback by their own equipment as well as the slaughterhouse. now
the results came often four weeks after the assessment and, hence, towards the end
of the following round and new flock.
• overall, the farmers concluded that the wQ assessment tool was fine as a scientific
tool but not very useful on a real farm. most important for this evaluation was first
of all the separation of singular measurements, which in the farmers’ view resulted
in overlooking the interrelation of all these factors. a second worry concerns the
standardization of the instruments, which in their view denied the particularity of
each farm and the importance of a time and place specific context of production;
the latter included factors such as weather and feed quality, but also the management
style of a specific farmer.

71
the welfare quality assessment tool aims at assessing animal welfare across farms, species,
sectors and countries. in order to do so, it has to use a standardized approach. for farmers,
this is difficult to accept as they perceive their farm as special and different to any other
farm. they want to be understood within the context of their farm. they also want to be
able to use the results within their farm. many were not convinced that the assessment
measures were valuable if used individually and out of context; to be more acceptable the
results need to have more relevance to farmers’ everyday practice.
for the acceptance among farmers it is therefore important:
1. to elucidate the practical applicability of the results and how farmers could use the
results in order to improve animal welfare as well as production;
2. to explain how the tool incorporates the interrelation of different parameters and
criteria when calculating scores;
3. to explain how the contextuality of animal welfare is taken into account during the
measurements – this includes the possibility of a reassessment in case of exceptional
conditions, such as bad weather;
4. to explain that assessing animal welfare at the farm does not implicate that only
farmers are considered responsible and is not meant to blame farmers.
in the uK, farmers mentioned that climatic factors needed to be taken into account on
free-range systems, as measurements taken during or in the aftermath of extreme weather
conditions often influenced scores in ways that farmers have little control over.
Remarkably, conventional farmers in the netherlands and italy argued similarly.
in addition, it is important, especially among farmers working in an agro-industrial sector
such as broiler production, to provide more information about the importance and added
value of animal welfare. farmers saw the importance of health and many of them were
aware of the importance of natural behaviour, but some other aspects were new and strange
to them. farmers underlined several times that they were ambitious to further develop
their professional skills, organizing specific study groups on the linkages between animal
welfare and production seems a promising way to support the acceptance and prepare the
implementation of the WQ assessment scheme.
13
Recommendations: lessons to
be leaRned foR WelfaRe
Quality

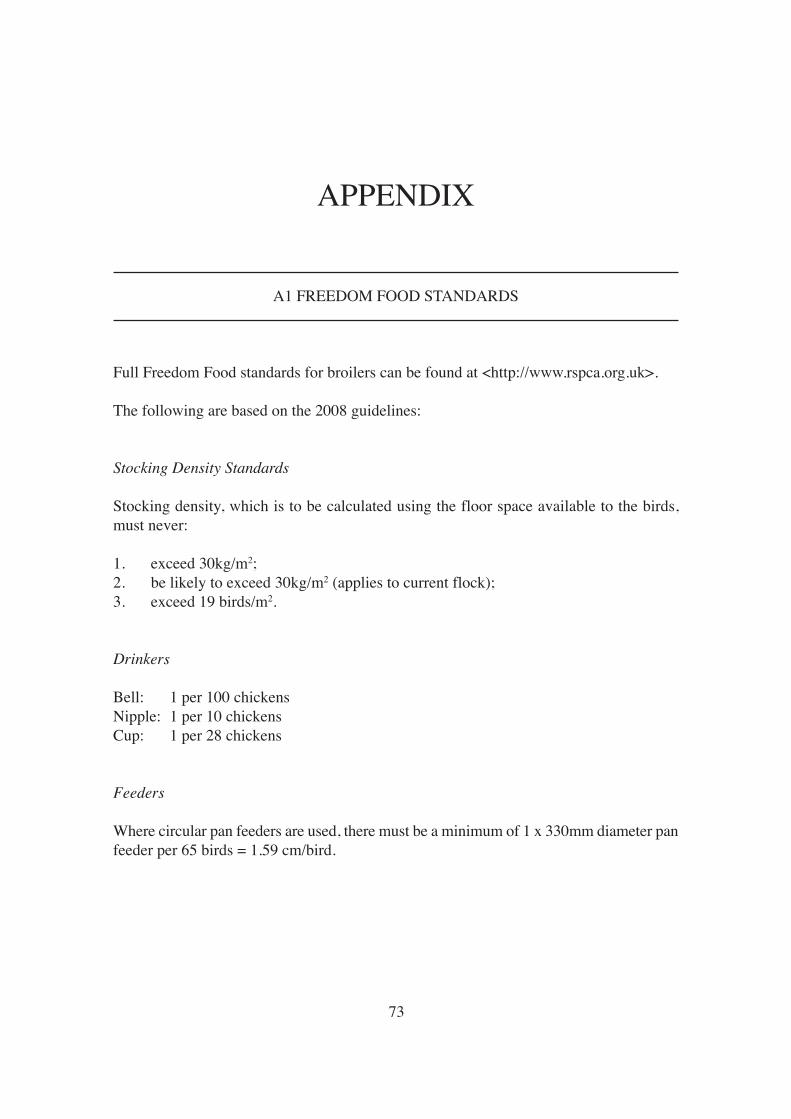
73
A1 Freedom Food stAndArds
Full Freedom Food standards for broilers can be found at <http://www.rspca.org.uk>.
the following are based on the 2008 guidelines:
Stocking Density Standards
stocking density, which is to be calculated using the floor space available to the birds,
must never:
1. exceed 30kg/m2;
2. be likely to exceed 30kg/m2 (applies to current flock);
3. exceed 19 birds/m2.
Drinkers
Bell: 1 per 100 chickens
nipple: 1 per 10 chickens
Cup: 1 per 28 chickens
Feeders
Where circular pan feeders are used, there must be a minimum of 1 x 330mm diameter pan
feeder per 65 birds = 1.59 cm/bird.
Appendix
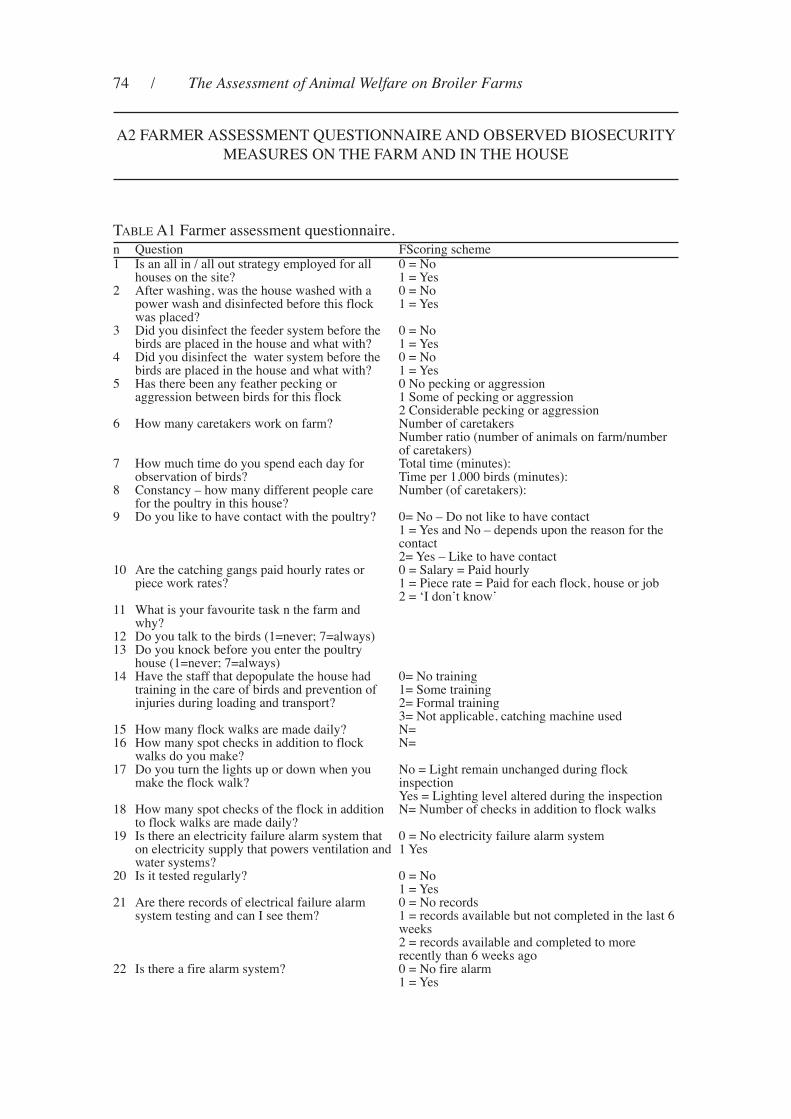
74 / The Assessment of Animal Welfare on Broiler Farms
A2 FArmer Assessment QuestionnAire And oBserved BioseCuritY
meAsures on tHe FArm And in tHe House
tABLe A1 Farmer assessment questionnaire.n Question Fscoring scheme1 is an all in / all out strategy employed for all
houses on the site?0 = no1 = Yes
2 After washing, was the house washed with apower wash and disinfected before this flockwas placed?
0 = no1 = Yes
3 did you disinfect the feeder system before thebirds are placed in the house and what with?
0 = no1 = Yes
4 did you disinfect the water system before thebirds are placed in the house and what with?
0 = no1 = Yes
5 Has there been any feather pecking oraggression between birds for this flock
0 no pecking or aggression1 some of pecking or aggression2 Considerable pecking or aggression
6 How many caretakers work on farm? number of caretakersnumber ratio (number of animals on farm/numberof caretakers)
7 How much time do you spend each day forobservation of birds?
total time (minutes):time per 1,000 birds (minutes):
8 Constancy – how many different people carefor the poultry in this house?
number (of caretakers):
9 do you like to have contact with the poultry? 0= no – do not like to have contact1 = Yes and no – depends upon the reason for thecontact2= Yes – Like to have contact
10 Are the catching gangs paid hourly rates orpiece work rates?
0 = salary = paid hourly1 = piece rate = paid for each flock, house or job2 = ‘i don’t know’
11 What is your favourite task n the farm andwhy?
12 do you talk to the birds (1=never; 7=always)13 do you knock before you enter the poultry
house (1=never; 7=always)14 Have the staff that depopulate the house had
training in the care of birds and prevention ofinjuries during loading and transport?
0= no training1= some training2= Formal training3= not applicable, catching machine used
15 How many flock walks are made daily? n=16 How many spot checks in addition to flock
walks do you make?n=
17 do you turn the lights up or down when youmake the flock walk?
no = Light remain unchanged during flockinspectionYes = Lighting level altered during the inspection
18 How many spot checks of the flock in additionto flock walks are made daily?
n= number of checks in addition to flock walks
19 is there an electricity failure alarm system thaton electricity supply that powers ventilation andwater systems?
0 = no electricity failure alarm system1 Yes
20 is it tested regularly? 0 = no1 = Yes
21 Are there records of electrical failure alarmsystem testing and can i see them?
0 = no records1 = records available but not completed in the last 6weeks2 = records available and completed to morerecently than 6 weeks ago
22 is there a fire alarm system? 0 = no fire alarm1 = Yes
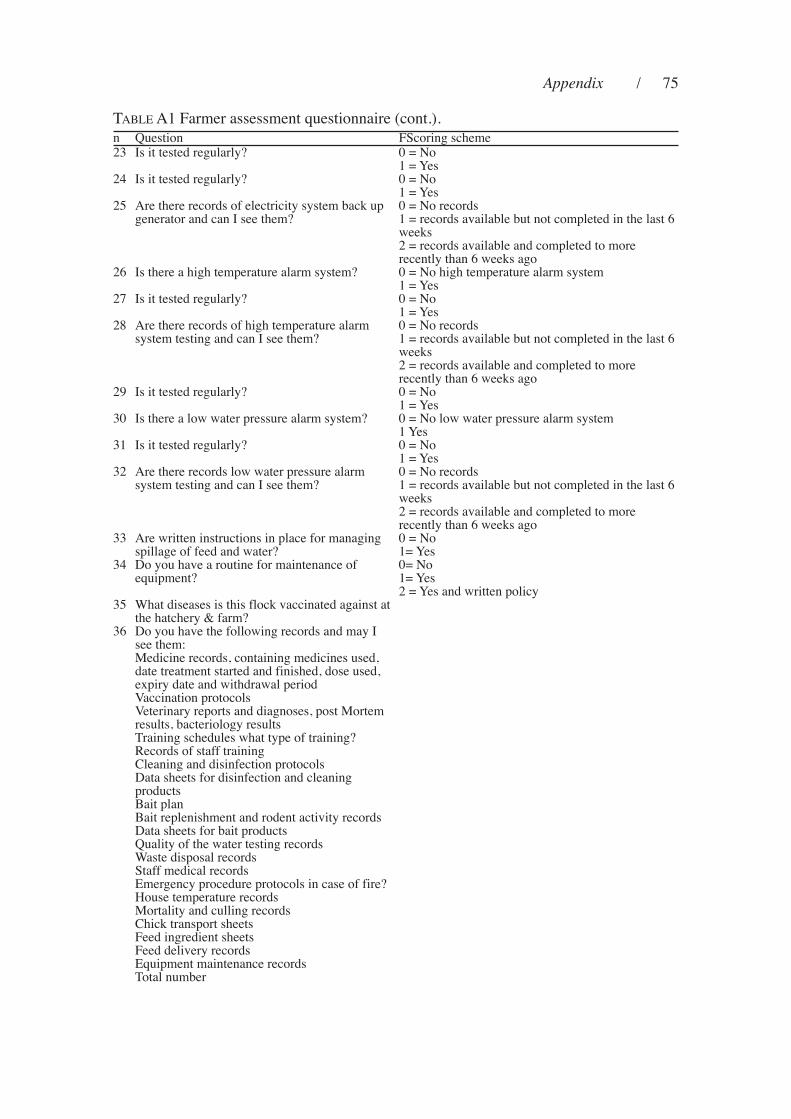
Appendix / 75
tABLe A1 Farmer assessment questionnaire (cont.).
n Question Fscoring scheme23 is it tested regularly? 0 = no
1 = Yes24 is it tested regularly? 0 = no
1 = Yes25 Are there records of electricity system back up
generator and can i see them?0 = no records1 = records available but not completed in the last 6weeks2 = records available and completed to morerecently than 6 weeks ago
26 is there a high temperature alarm system? 0 = no high temperature alarm system1 = Yes
27 is it tested regularly? 0 = no1 = Yes
28 Are there records of high temperature alarmsystem testing and can i see them?
0 = no records1 = records available but not completed in the last 6weeks2 = records available and completed to morerecently than 6 weeks ago
29 is it tested regularly? 0 = no1 = Yes
30 is there a low water pressure alarm system? 0 = no low water pressure alarm system1 Yes
31 is it tested regularly? 0 = no1 = Yes
32 Are there records low water pressure alarmsystem testing and can i see them?
0 = no records1 = records available but not completed in the last 6weeks2 = records available and completed to morerecently than 6 weeks ago
33 Are written instructions in place for managingspillage of feed and water?
0 = no1= Yes
34 do you have a routine for maintenance ofequipment?
0= no1= Yes2 = Yes and written policy
35 What diseases is this flock vaccinated against atthe hatchery & farm?
36 do you have the following records and may isee them:medicine records, containing medicines used,date treatment started and finished, dose used,expiry date and withdrawal periodvaccination protocolsveterinary reports and diagnoses, post mortemresults, bacteriology results training schedules what type of training?records of staff trainingCleaning and disinfection protocolsdata sheets for disinfection and cleaningproductsBait planBait replenishment and rodent activity recordsdata sheets for bait productsQuality of the water testing recordsWaste disposal recordsstaff medical recordsemergency procedure protocols in case of fire?House temperature recordsmortality and culling recordsChick transport sheetsFeed ingredient sheetsFeed delivery recordsequipment maintenance recordstotal number
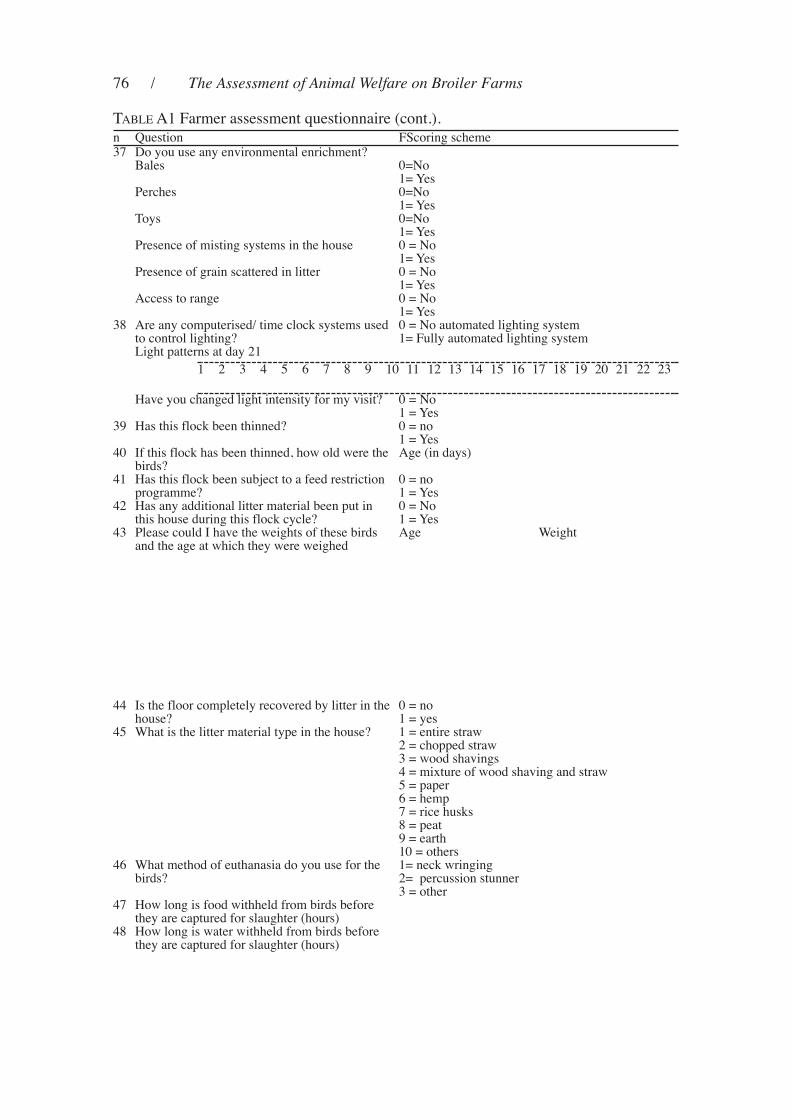
76 / The Assessment of Animal Welfare on Broiler Farms
tABLe A1 Farmer assessment questionnaire (cont.).n Question Fscoring scheme37 do you use any environmental enrichment?
Bales 0=no1= Yes
perches 0=no1= Yes
toys 0=no1= Yes
presence of misting systems in the house 0 = no1= Yes
presence of grain scattered in litter 0 = no1= Yes
Access to range 0 = no1= Yes
38 Are any computerised/ time clock systems usedto control lighting?
0 = no automated lighting system1= Fully automated lighting system
Light patterns at day 21
Have you changed light intensity for my visit? 0 = no1 = Yes
39 Has this flock been thinned? 0 = no1 = Yes
40 if this flock has been thinned, how old were thebirds?
Age (in days)
41 Has this flock been subject to a feed restrictionprogramme?
0 = no1 = Yes
42 Has any additional litter material been put inthis house during this flock cycle?
0 = no1 = Yes
43 please could i have the weights of these birdsand the age at which they were weighed
Age Weight
44 is the floor completely recovered by litter in thehouse?
0 = no1 = yes
45 What is the litter material type in the house? 1 = entire straw2 = chopped straw3 = wood shavings4 = mixture of wood shaving and straw5 = paper6 = hemp7 = rice husks8 = peat9 = earth10 = others
46 What method of euthanasia do you use for thebirds?
1= neck wringing2= percussion stunner3 = other
47 How long is food withheld from birds beforethey are captured for slaughter (hours)
48 How long is water withheld from birds beforethey are captured for slaughter (hours)
1 2 3 4 5 6 7 8 9 10 11 12 13 14 15 16 17 18 19 20 21 22 23
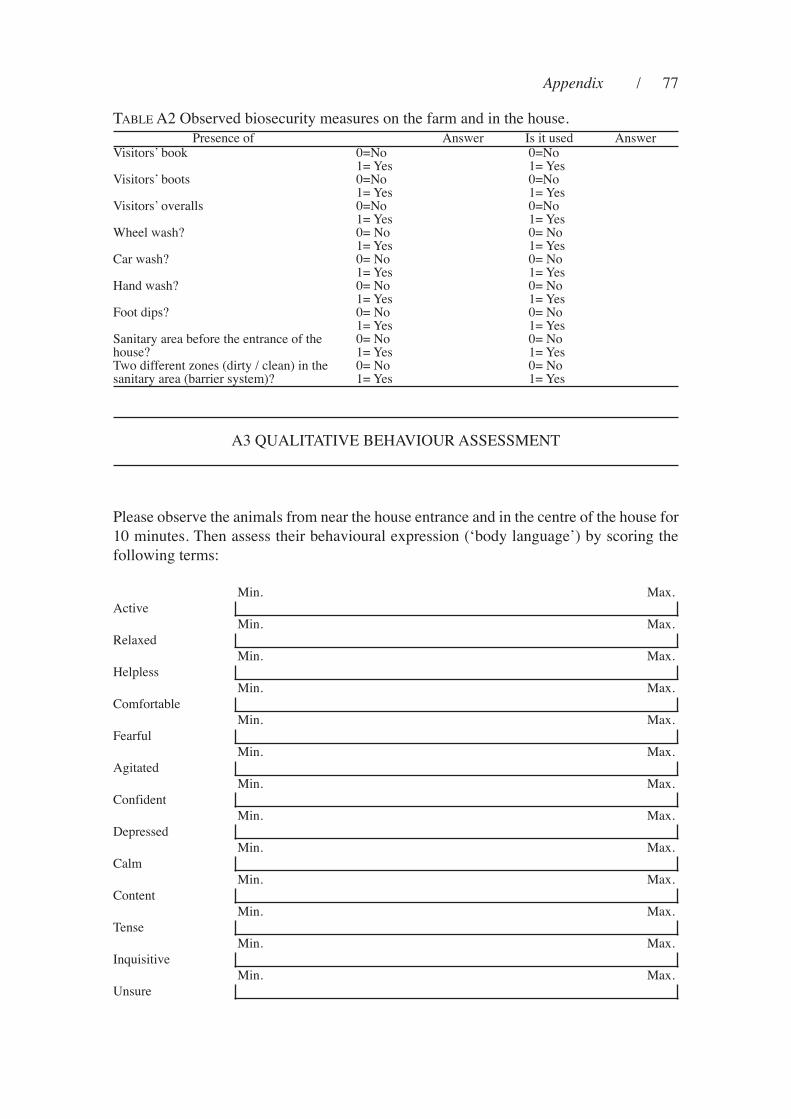
Appendix / 77
tABLe A2 observed biosecurity measures on the farm and in the house.
presence of Answer is it used Answervisitors’ book 0=no
1= Yes0=no1= Yes
visitors’ boots 0=no1= Yes
0=no1= Yes
visitors’ overalls 0=no1= Yes
0=no1= Yes
Wheel wash? 0= no1= Yes
0= no1= Yes
Car wash? 0= no1= Yes
0= no1= Yes
Hand wash? 0= no1= Yes
0= no1= Yes
Foot dips? 0= no1= Yes
0= no1= Yes
sanitary area before the entrance of thehouse?
0= no1= Yes
0= no1= Yes
two different zones (dirty / clean) in thesanitary area (barrier system)?
0= no1= Yes
0= no1= Yes
A3 QuALitAtive BeHAviour Assessment
please observe the animals from near the house entrance and in the centre of the house for
10 minutes. then assess their behavioural expression (‘body language’) by scoring the
following terms:
min. max.
Active
min. max.
relaxed
min. max.
Helpless
min. max.
Comfortable
min. max.
Fearful
min. max.
Agitated
min. max.
Confident
min. max.
depressed
min. max.
Calm
min. max.
Content
min. max.
tense
min. max.
inquisitive
min. max.
unsure
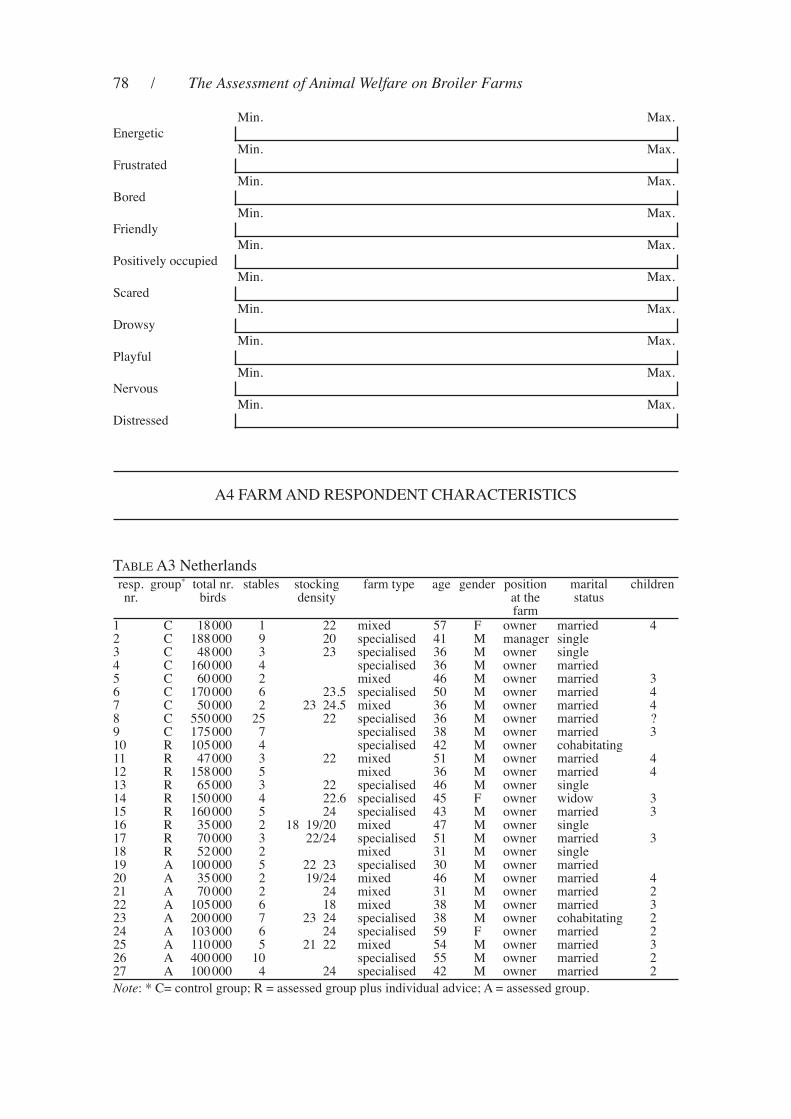
78 / The Assessment of Animal Welfare on Broiler Farms
min. max.
energetic
min. max.
Frustrated
min. max.
Bored
min. max.
Friendly
min. max.
positively occupied
min. max.
scared
min. max.
drowsy
min. max.
playful
min. max.
nervous
min. max.
distressed
A4 FArm And respondent CHArACteristiCs
resp.nr.
group* total nr.birds
stables stockingdensity
farm type age gender positionat thefarm
maritalstatus
children
1 C 18 000 1 22 mixed 57 F owner married 42 C 188 000 9 20 specialised 41 m manager single3 C 48 000 3 23 specialised 36 m owner single4 C 160 000 4 specialised 36 m owner married5 C 60 000 2 mixed 46 m owner married 36 C 170 000 6 23.5 specialised 50 m owner married 47 C 50 000 2 23 24.5 mixed 36 m owner married 48 C 550 000 25 22 specialised 36 m owner married ?9 C 175 000 7 specialised 38 m owner married 310 r 105 000 4 specialised 42 m owner cohabitating11 r 47 000 3 22 mixed 51 m owner married 412 r 158 000 5 mixed 36 m owner married 413 r 65 000 3 22 specialised 46 m owner single14 r 150 000 4 22.6 specialised 45 F owner widow 315 r 160 000 5 24 specialised 43 m owner married 316 r 35 000 2 18 19/20 mixed 47 m owner single17 r 70 000 3 22/24 specialised 51 m owner married 318 r 52 000 2 mixed 31 m owner single19 A 100 000 5 22 23 specialised 30 m owner married20 A 35 000 2 19/24 mixed 46 m owner married 421 A 70 000 2 24 mixed 31 m owner married 222 A 105 000 6 18 mixed 38 m owner married 323 A 200 000 7 23 24 specialised 38 m owner cohabitating 224 A 103 000 6 24 specialised 59 F owner married 225 A 110 000 5 21 22 mixed 54 m owner married 326 A 400 000 10 specialised 55 m owner married 227 A 100 000 4 24 specialised 42 m owner married 2
tABLe A3 netherlands
Note: * C= control group; r = assessed group plus individual advice; A = assessed group.
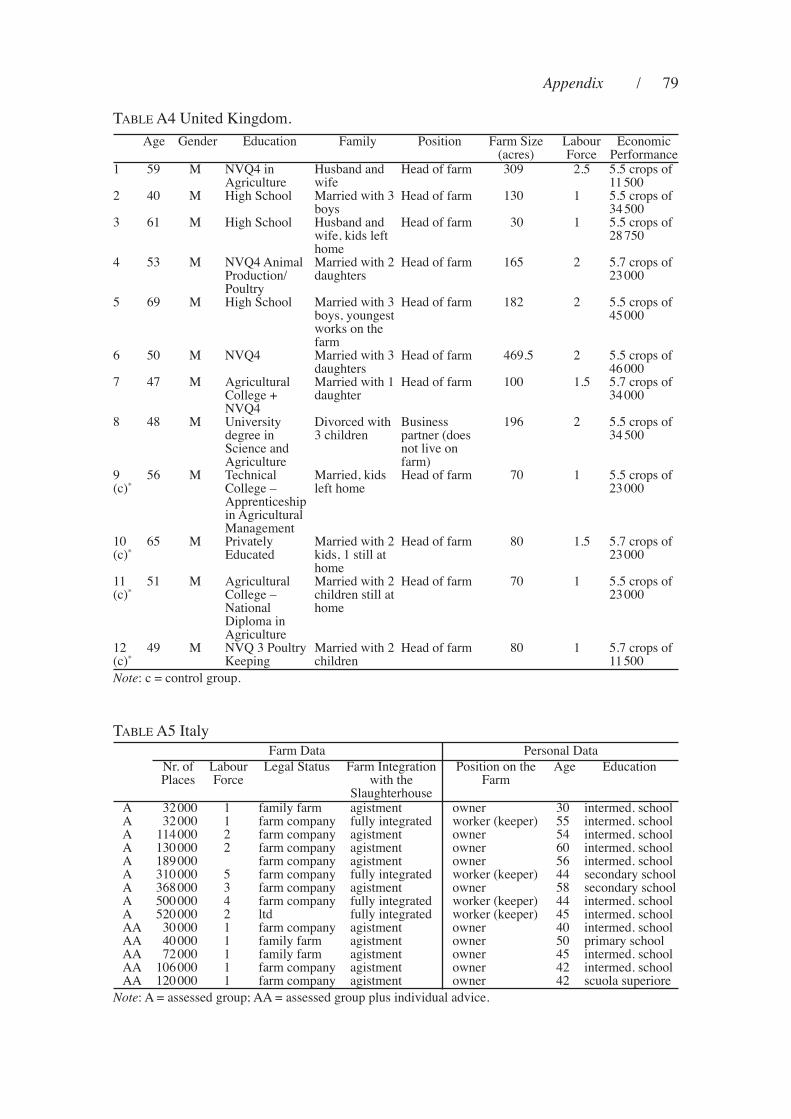
Appendix / 79
tABLe A4 united Kingdom.
Age Gender education Family position Farm size(acres)
LabourForce
economicperformance
1 59 m nvQ4 inAgriculture
Husband andwife
Head of farm 309 2.5 5.5 crops of11 500
2 40 m High school married with 3boys
Head of farm 130 1 5.5 crops of34 500
3 61 m High school Husband andwife, kids lefthome
Head of farm 30 1 5.5 crops of28 750
4 53 m nvQ4 Animalproduction/poultry
married with 2daughters
Head of farm 165 2 5.7 crops of23 000
5 69 m High school married with 3boys, youngestworks on thefarm
Head of farm 182 2 5.5 crops of45 000
6 50 m nvQ4 married with 3daughters
Head of farm 469.5 2 5.5 crops of46 000
7 47 m AgriculturalCollege +nvQ4
married with 1daughter
Head of farm 100 1.5 5.7 crops of34 000
8 48 m universitydegree inscience andAgriculture
divorced with3 children
Businesspartner (doesnot live onfarm)
196 2 5.5 crops of34 500
9(c)*
56 m technicalCollege –Apprenticeshipin Agriculturalmanagement
married, kidsleft home
Head of farm 70 1 5.5 crops of23 000
10(c)*
65 m privatelyeducated
married with 2kids, 1 still athome
Head of farm 80 1.5 5.7 crops of23 000
11(c)*
51 m AgriculturalCollege –nationaldiploma inAgriculture
married with 2children still athome
Head of farm 70 1 5.5 crops of23 000
12(c)*
49 m nvQ 3 poultryKeeping
married with 2children
Head of farm 80 1 5.7 crops of11 500
Group* Farm data personal data
nr. ofplaces
LabourForce
Legal status Farm integrationwith the
slaughterhouse
position on theFarm
Age education
A 32 000 1 family farm agistment owner 30 intermed. schoolA 32 000 1 farm company fully integrated worker (keeper) 55 intermed. schoolA 114 000 2 farm company agistment owner 54 intermed. schoolA 130 000 2 farm company agistment owner 60 intermed. schoolA 189 000 farm company agistment owner 56 intermed. schoolA 310 000 5 farm company fully integrated worker (keeper) 44 secondary schoolA 368 000 3 farm company agistment owner 58 secondary schoolA 500 000 4 farm company fully integrated worker (keeper) 44 intermed. schoolA 520 000 2 ltd fully integrated worker (keeper) 45 intermed. schoolAA 30 000 1 farm company agistment owner 40 intermed. schoolAA 40 000 1 family farm agistment owner 50 primary schoolAA 72 000 1 family farm agistment owner 45 intermed. schoolAA 106 000 1 farm company agistment owner 42 intermed. schoolAA 120 000 1 farm company agistment owner 42 scuola superiore
tABLe A5 italy
Note: c = control group.
Note: A = assessed group; AA = assessed group plus individual advice.
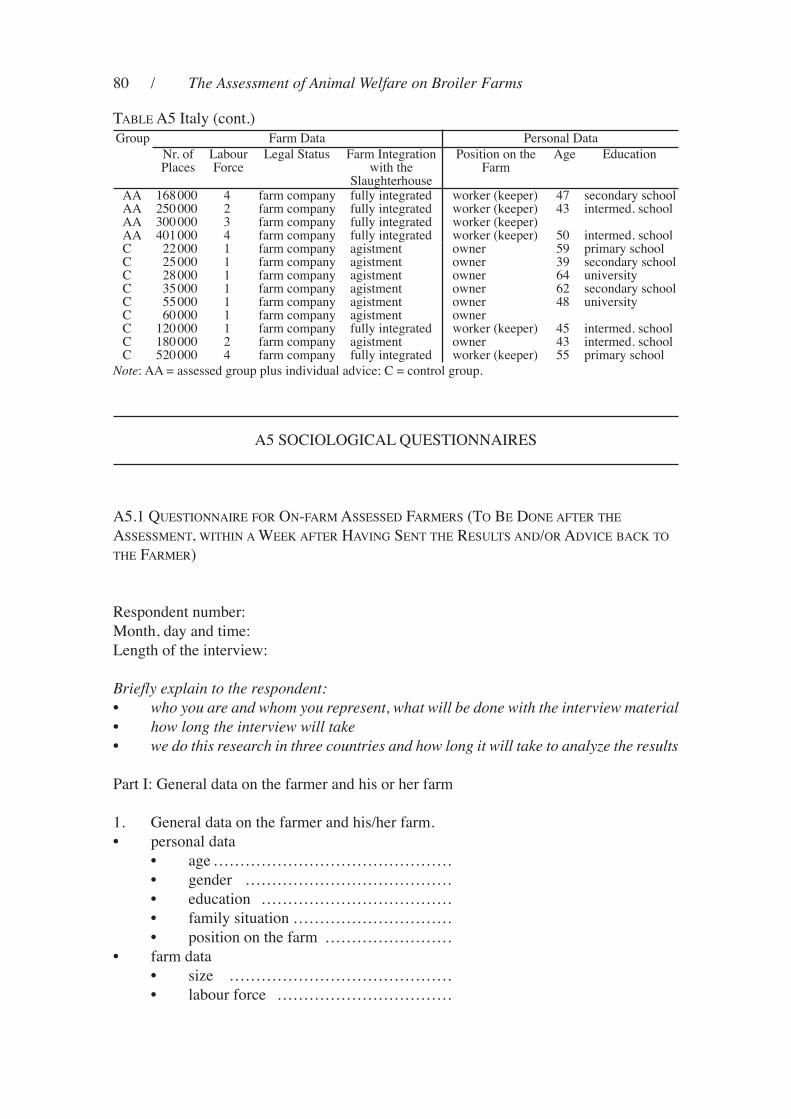
80 / The Assessment of Animal Welfare on Broiler Farms
Group Farm data personal data
nr. ofplaces
LabourForce
Legal status Farm integrationwith the
slaughterhouse
position on theFarm
Age education
AA 168 000 4 farm company fully integrated worker (keeper) 47 secondary schoolAA 250 000 2 farm company fully integrated worker (keeper) 43 intermed. schoolAA 300 000 3 farm company fully integrated worker (keeper)AA 401 000 4 farm company fully integrated worker (keeper) 50 intermed. schoolC 22 000 1 farm company agistment owner 59 primary schoolC 25 000 1 farm company agistment owner 39 secondary schoolC 28 000 1 farm company agistment owner 64 universityC 35 000 1 farm company agistment owner 62 secondary schoolC 55 000 1 farm company agistment owner 48 universityC 60 000 1 farm company agistment ownerC 120 000 1 farm company fully integrated worker (keeper) 45 intermed. schoolC 180 000 2 farm company agistment owner 43 intermed. schoolC 520 000 4 farm company fully integrated worker (keeper) 55 primary school
tABLe A5 italy (cont.)
A5 soCioLoGiCAL QuestionnAires
A5.1 QuestionnAire For on-FArm Assessed FArmers (to Be done AFter tHe
Assessment, WitHin A WeeK AFter HAvinG sent tHe resuLts And/or AdviCe BACK to
tHe FArmer)
respondent number:
month, day and time:
Length of the interview:
Briefly explain to the respondent:
• who you are and whom you represent, what will be done with the interview material
• how long the interview will take
• we do this research in three countries and how long it will take to analyze the results
part i: General data on the farmer and his or her farm
1. General data on the farmer and his/her farm.
• personal data
• age ………………………………………
• gender …………………………………
• education ………………………………
• family situation …………………………
• position on the farm ……………………
• farm data
• size ……………………………………
• labour force ……………………………
Note: AA = assessed group plus individual advice; C = control group.
Appendix / 81
• juridical form……………………………
• contracting / integrator …………………
• economic performance …………………
2. Can you briefly describe your barns to me? How many? What size? What systems?
3. regarding changes in the production system:
• i changed things. if so, what? Why?
• i plan to change things. if so, what? Why?
part ii: human-animal relations: definition, measurement and care for animal welfare from
producers’ perspective
4. What is animal welfare in your view?
5. What is important in your view for taking ‘good’ care of the animals?
• Answer on the open question: ………………………………………………………
• How do you check the welfare of the animals? How do you see if the animals are
doing well?
• How do you see that they are not doing well?
6. What can farmers do in order to assure the welfare of the animals?
7. How could you improve animal welfare on your farm?
• Answer on the open question: ………………………………………………………
• if mentioned something: are you going to do this?
• Yes, surely.
• no, i won’t.
• no idea yet.
• if no / no idea yet, why not?
8. When it comes to animal welfare, whose knowledge and opinion you value most?
part iii: General information that was received on fore-hand
9. did you read the information that we send you before-hand?
• yes
• no, because …………………………………. (⇒ continue with question 11)
10. Was the information clear and understandable?
• yes
• no, not really because ………………………………………………………………
now we would like to discuss some of the characteristics of the Welfare quality assessment
tool with you. First of all the way animal welfare is assessed in this project.
82 / The Assessment of Animal Welfare on Broiler Farms
As interviewer you present the following information:
• in the information sent to you we explain that WQ assesses the welfare of animals
by doing measurements in the barn and at the living animal.
• Besides it gathers information about the transport and looks at the dead animals at
the slaughterhouse.
• in order to do the measurements at the living animals, the assessors enter the bird
house.
• in total the assessment in the barn takes about 5 hours.
And list that assessment in the barn consists of the following on farm-measurements:
A. the researchers measure the panting/huddling of birds
B. behavioural characteristics of the flock like activity, fear etc
C. different tests of fear
d. ability to walk
e. foot pad dermatitis, hock burn, breast burn and pathology
F. litter score
G. aspects of the house
H. mortality
For each of these on-farm measurements we would like to know if:
a) you think that the measurement tells something about the welfare of the birds; and
b) it is delivering relevant information to you as farmer.
A. the researchers measure the panting/huddling of birds: by estimating the number of
birds performing this behaviour at different locations in the bird house
11. do you think this is relevant for measuring the birds’ welfare?
• Yes. if yes, why?
• no. if no, why not?
12. is the measurement giving relevant information to you as farmer and caretaker of the
animal?
• Yes. if yes, why?
• no. if no, why not?
B. Behavioural characteristics of the flock like activity, fear etc.: by carefully observing
the behaviour of the birds in the flock and giving the flock scores for each
behavioural category on a continuous scale
13. do you think this is relevant for measuring the birds’ welfare?
• Yes. if yes, why?
• no. if no, why not?
14. is the measurement giving relevant information to you as farmer and caretaker of the
animal?
• Yes. if yes, why?
Appendix / 83
• no. if no, why not?
C. different tests of fear (response to novel object and an unfamiliar person): by
measuring the response of the birds to the researcher (the ‘touch test’) and the
response of the birds to a novel object at different locations in the barn
15. do you think this is relevant for measuring the birds’ welfare?
• Yes. if yes, why?
• no. if no, why not?
16. is the measurement giving relevant information to you as farmer and caretaker of the
animal?
• Yes. if yes, why?
• no. if no, why not?
d. Ability to walk: 25 birds are randomly selected at 10 locations in the house. Birds
are stimulated to walk and the researcher scores if they have a normal or abnormal
walking pattern
17. do you think this is relevant for measuring the birds’ welfare?
• Yes. if yes, why?
• no. if no, why not?
18. is the measurement giving relevant information to you as farmer and caretaker of the
animal?
• Yes. if yes, why?
• no. if no, why not?
e. Foot pad dermatitis, hock burn, breast burn and pathology: the researcher randomly
selects 10 birds at 10 locations in the house and inspects the birds
19. do you think this is relevant for measuring the birds’ welfare?
• Yes. if yes, why?
• no. if no, why not?
20. is the measurement giving relevant information to you as farmer and caretaker of the
animal?
• Yes. if yes, why?
• no. if no, why not?
F. Litter score
21. do you think this is relevant for measuring the birds’ welfare?
• Yes. if yes, why?
• no. if no, why not?
84 / The Assessment of Animal Welfare on Broiler Farms
22. is the measurement giving relevant information to you as farmer and caretaker of the
animal?
• Yes. if yes, why?
• no. if no, why not?
G. Aspects of the house: like number of feeders, drinkers, light, ammonia, humidity,
dust
23. do you think this is relevant for measuring the birds’ welfare?
• Yes. if yes, why?
• no. if no, why not?
24. is the measurement giving relevant information to you as farmer and caretaker of the
animal?
• Yes. if yes, why?
• no. if no, why not?
H. mortality: the number of birds culled (including those that were ‘selected’)
25. do you think this is relevant for measuring the birds’ welfare?
• Yes. if yes, why?
• no. if no, why not?
26. is the measurement giving relevant information to you as farmer and caretaker of the
animal?
• Yes. if yes, why?
• no. if no, why not?
summarizing:
27. Which of the discussed measurements is most relevant in your view? mention one!
Why this one?
28. Which of the discussed measurements is the least relevant in your view? mention
one! Why this one?
part iv: experiences with the on-farm implementation of the Assessment scheme
now we would like to know how you experienced the assessment on your farm.
29. did the visit of the assessor disturb your daily work? if yes, in which sense?
30. Which part of the assessment did you witness? did you accompany the assessor into
the barn? For how long?
31. if you have accompanied the assessor,
• How did you feel about the assessment in the barn?
Appendix / 85
• do you think the visit to the barn has affected the birds?
• do you think it finally had a negative effect on the production?
• What should or could be done differently in order to minimize the disturbance or
negative effects? (⇒ continue with part v question 33)
32. if you have not accompanied the assessor,
• do you think/expect the visit to the barn has affected the birds?
• do you think it finally had a negative effect on the production?
• What should or could be done differently in order to minimize the disturbance or
negative effects?
part v: impressions of / opinions about the assessor and the assessment
33. What impression do you have of the assessor?
• did you like the way the assessor behaved towards you?
• during the first contact/at the telephone and during the visit?
34. did they explain well to you what participation in this project would entail?
35. did you like how the assessor did the measurement in the barn and on the animals?
How he/she treated the birds?
36. is there anything you would like to see different in the behaviour of the assessors?
37. is there anything that you disliked about the way the assessment took place at your
farm?
• Answer to the open question: ………………………………………………………
• What about the length of the assessment?
• What about the assessor’s presence in the barn and contact with the animals?
38. should farmers be financially rewarded for involvement in the Assessment scheme?
• Yes. if yes, why?
• no. if no, why not?
part vi: opinions on the results of the assessment
By now you should have received an assessment report with your results. the comparison
with other farms will come later.
39. What do you think about the report? is it clear and understandable?
• Yes. if yes, why?
• no. if no, why not?
40. What do you think about the results of the assessment on your farm?
• do these results surprise you?
• is the welfare of your animals better or worse than you expected?

86 / The Assessment of Animal Welfare on Broiler Farms
• What surprises you / what does not surprise you regarding your own farm and why?
41. Are the results providing interesting and relevant information for you? do they tell
you how to improve the welfare of your animals?
• Yes. if yes, why?
• no. if no, why not?
42. Are you going to use the information?
• Yes. if yes, why?
• no. if no, why not?
For tHose FArmers WHo reCeived personAL AdviCe
part vii: relevance of the advice (if no advice, continue with part viii/question 45)
43. What do you think about the individual advice that was provided to you? is the
advice useful?
• Yes. if yes, why?
• no. if no, why not?
44. do you consider to implement certain measures on your farm, based on the advice
that was provided?
• Yes. if yes, why?
• no. if no, why not?
part viii: reflections on the implementation of the Assessment scheme
Here we discuss with you about the way the WQ assessment tool is supposed to work
more in general.
the WQ assessment scheme differs from other control and inspection scheme:
1. it focuses on animal welfare
2. it measures the welfare of living animals, the production system and processes at the
farm, the transport as well as the condition of the animals at the slaughterhouse. this
combined results in an average animal welfare score per flock
3. the system allows to distinguish between more or less animal friendly producers
4. the system allows to certificate products in the shop as more or less animal friendly
products (e.g. with stars)
5. the system is meant for all producers in europe to allow for comparison across
europe.
Questions:
45. the Assessment scheme measures animal welfare at the farm, during transport as
well as at the slaughterhouse, and calculates one integrated welfare score for a certain
flock.
Appendix / 87
• do you agree that the scores are combined in 1 overall welfare score?
• Why? Why not?
46. is it interesting for you as a farmer to know the welfare score of your farm?
• Yes. if yes, why?
• no. if no, why not?
47. What do you think about the idea to compare animal welfare among farmers and to
distinguish whether they are more or less animal friendly producers?
• Answer on the open question: ………………………………………………………
48. is it interesting for you to know how you do in comparison with other farmers
working in the same sector?
• Yes. if yes, why?
• no. if no, why not?
49. do you think that a label that distinguishes between more or less animal friendly
produced products encourages consumers to buy more animal-friendly products?
• Yes. if yes, why?
• no. if no, why not?
50. Would you be interested to produce such especially animal friendly products?
• Yes. if yes, why?
• no. if no, why not?
51. do you think it is important to have the same animal welfare assessment tool across
europe?
• Yes. if yes, why?
• no. if no, why not?
part ix: open space for expressing worries and hopes about the assessment
52. About the Assessment scheme:
• is there anything else you would like to say about the Assessment scheme or its
implementation on your farm?
• do you see any pitfalls that have not been discussed yet?
• do you have any other comment about the relevance of the Assessment scheme?
• do you want to comment anything on the information that has been provided?
53. do you want to say anything else about animal welfare in general?
88 / The Assessment of Animal Welfare on Broiler Farms
A5.2 QuestionnAire For tHe FArmers tHAt BeLonG to tHe ControL Group (tHose
WHo did not HAve An on-FArm Assessment)
respondent number:
month, day and time:
Length of the interview:
Briefly explain to the respondent:
• who you are and whom you represent, what will be done with the interview material
• how long the interview will take
• we do this research in three countries and how long it will take to analyze the results
part i: General data on the farmer and his or her farm
54. General data on the farmer and his/her farm.
• personal data
• age ………………………………………
• gender …………………………………
• education ………………………………
• family situation …………………………
• position on the farm ……………………
• farm data
• size ……………………………………
• labour force ……………………………
• juridical form……………………………
• contracting / integrator …………………
• economic performance …………………
55. Can you briefly describe your barns to me? How many? What size? What systems?
56. regarding changes in the production system:
• i changed things. if so, what? Why?
• i plan to change things. if so, what? Why?
part ii: Human–animal relations: definition, measurement and care for animal welfare
from producers’ perspective
57. What is animal welfare in your view?
58. What is important in your view for taking ‘good’ care of the animals?
• Answer on the open question: ………………………………………………………
• How do you check the welfare of the animals? How do you see if the animals are
doing well?
• How do you see that they are not doing well?
Appendix / 89
59. What can farmers do in order to assure the welfare of the animals?
60. How could you improve animal welfare on your farm?
• Answer on the open question: ………………………………………………………
• if mentioned something: are you going to do this?
• Yes, surely.
• no, i won’t.
• no idea yet.
• if no / no idea yet, why not?
61. When it comes to animal welfare, whose knowledge and opinion you value most?
part iii: General information that was received on fore-hand
62. did you read the information that we send you before-hand?
• Yes
• no, because …………………………………… (⇒ continue with question 11)
63. Was the information clear and understandable?
• Yes
• no, not really because ………………………………………………………………
now we would like to discuss some of the characteristics of the Welfare quality assessment
tool with you. First of all the way animal welfare is assessed in this project.
As interviewer you present the following information:
• in the information sent to you we explain that WQ assesses the welfare of animals
by doing measurements in the barn and at the living animal.
• Besides it gathers information about the transport and looks at the dead animals at
the slaughterhouse.
• in order to do the measurements at the living animals, the assessors enter the bird
house.
• in total the assessment in the barn takes about 5 hours.
And list that assessment in the barn consists of the following on farm-measurements:
i. the researchers measure the panting/huddling of birds
J. behavioural characteristics of the flock like activity, fear etc
K. different tests of fear
L. ability to walk
m. foot pad dermatitis, hock burn, breast burn and pathology
n. litter score
o. aspects of the house
p. mortality
For each of these on-farm measurements we would like to know if:
c) you think that the measurement tells something about the welfare of the birds, and
90 / The Assessment of Animal Welfare on Broiler Farms
d) it is delivering relevant information to you as farmer.
i. the researchers measure the panting/huddling of birds: by estimating the number of
birds performing this behaviour at different locations in the bird house
64. do you think this is relevant for measuring the birds’ welfare?
• Yes. if yes, why?
• no. if no, why not?
65. is the measurement giving relevant information to you as farmer and caretaker of the
animal?
• Yes. if yes, why?
• no. if no, why not?
J. Behavioural characteristics of the flock like activity, fear etc.: by carefully observing
the behaviour of the birds in the flock and giving the flock scores for each
behavioural category on a continuous scale
66. do you think this is relevant for measuring the birds’ welfare?
• Yes. if yes, why?
• no. if no, why not?
67. is the measurement giving relevant information to you as farmer and caretaker of the
animal?
• Yes. if yes, why?
• no. if no, why not?
K. different tests of fear (response to novel object and an unfamiliar person): by
measuring the response of the birds to the researcher (the ‘touch test’) and the
response of the birds to a novel object at different locations in the barn
68. do you think this is relevant for measuring the birds’ welfare?
• Yes. if yes, why?
• no. if no, why not?
69. is the measurement giving relevant information to you as farmer and caretaker of the
animal?
• Yes. if yes, why?
• no. if no, why not?
L. Ability to walk: 25 birds are randomly selected at 10 locations in the house. Birds
are stimulated to walk and the researcher scores if they have a normal or abnormal
walking pattern
70. do you think this is relevant for measuring the birds’ welfare?
• Yes. if yes, why?
Appendix / 91
• no. if no, why not?
71. is the measurement giving relevant information to you as farmer and caretaker of the
animal?
• Yes. if yes, why?
• no. if no, why not?
m. Foot pad dermatitis, hock burn, breast burn and pathology: the researcher randomly
selects 10 birds at 10 locations in the house and inspects the birds
72. do you think this is relevant for measuring the birds’ welfare?
• Yes. if yes, why?
• no. if no, why not?
73. is the measurement giving relevant information to you as farmer and caretaker of the
animal?
• Yes. if yes, why?
• no. if no, why not?
n. Litter score
74. do you think this is relevant for measuring the birds’ welfare?
• Yes. if yes, why?
• no. if no, why not?
75. is the measurement giving relevant information to you as farmer and caretaker of the
animal?
• Yes. if yes, why?
• no. if no, why not?
o. Aspects of the house: like number of feeders, drinkers, light, ammonia, humidity,
dust
76. do you think this is relevant for measuring the birds’ welfare?
• Yes. if yes, why?
• no. if no, why not?
77. is the measurement giving relevant information to you as farmer and caretaker of the
animal?
• Yes. if yes, why?
• no. if no, why not?
p. mortality: the number of birds culled (including those that were ‘selected’)
78. do you think this is relevant for measuring the birds’ welfare?
• Yes. if yes, why?
92 / The Assessment of Animal Welfare on Broiler Farms
• no. if no, why not?
79. is the measurement giving relevant information to you as farmer and caretaker of the
animal?
• Yes. if yes, why?
• no. if no, why not?
summarizing:
80. Which of the discussed measurements is most relevant in your view? mention one!
Why this one?
81. Which of the discussed measurements is the least relevant in your view? mention
one! Why this one?
part iv: reflections on the implementation of the Assessment scheme
Here we discuss with you about the way the WQ assessment tool is supposed to work
more in general.
the WQ assessment scheme differs from other control and inspection scheme:
6. it focuses on animal welfare
7. it measures the welfare of living animals, the production system and processes at the
farm, the transport as well as the condition of the animals at the slaughterhouse. this
combined results in an average animal welfare score per flock
8. the system allows to distinguish between more or less animal friendly producers
9. the system allows to certificate products in the shop as more or less animal friendly
products (e.g. with stars)
10. the system is meant for all producers in europe to allow for comparison across
europe.
Questions:
82. the Assessment scheme measures animal welfare at the farm, during transport as
well as at the slaughterhouse, and calculates one integrated welfare score for a certain
flock.
• do you agree that the scores are combined in 1 overall welfare score?
• Why? Why not?
83. is it interesting for you as a farmer to know the welfare score of your farm?
• Yes. if yes, why?
• no. if no, why not?
84. What do you think about the idea to compare animal welfare among farmers and to
distinguish whether they are more or less animal friendly producers?
• Answer on the open question: ………………………………………………………
Appendix / 93
85. is it interesting for you to know how you do in comparison with other farmers
working in the same sector?
• Yes. if yes, why?
• no. if no, why not?
86. do you think that a label that distinguishes between more or less animal friendly
produced products encourages consumers to buy more animal-friendly products?
• Yes. if yes, why?
• no. if no, why not?
87. Would you be interested to produce such especially animal friendly products?
• Yes. if yes, why?
• no. if no, why not?
88. do you think it is important to have the same animal welfare assessment tool across
europe?
• Yes. if yes, why?
• no. if no, why not?
part ix: open space for expressing worries and hopes about the assessment
89. About the Assessment scheme:
• is there anything else you would like to say about the Assessment scheme or its
implementation on your farm?
• do you see any pitfalls that have not been discussed yet?
• do you have any other comment about the relevance of the Assessment scheme?
• do you want to comment anything on the information that has been provided?
90. do you want to say anything else about animal welfare in general?

95
Berg, C. (2004) ‘pododermatitis and hock burn in broiler chickens’, in: C.a. Weeks and
a. Butterworth (eds) Measuring and Auditing Broiler Welfare, CaBi, oxford, pp.
37–49.
Butterworth, a., algers, B., arnould, C., Forkman, B., Froehlich, E., graml, C., heiskanen,
T., Keeling, l., Kniebuhr, K., Knierim, U., lentfer, T., Sandilands, V., Staack, M.,
Waiblingar, S., Wemelsfelder, F., haslam, S.M., Westerath, h.S. and Zimmerman,
p. (2007) ‘Tables of measures developed in the Welfare Quality project to monitor
animal welfare in broiler chicken’, in: i. Veissier, B. Forman and B. Jones (eds)
Assuring Animal Welfare: From Societal Concerns to Implementation, proceedings
of the 2nd Welfare Quality Stakeholder Conference, Berlin, 3–4 May, pp 80 –81.
Committee genstat (2000) The Guide to GenStat, edited by r.W. payne. VSN
international, oxford.
haslam, S.M., Knowles, T.g., Brown, S.N., Wilkins, l.J., Kestin, S.C., Warriss, p.D. and
Nicol, C.J. (2007) ‘Factors affecting the prevalence of foot pad dermatitis, hock burn
and breast burn in broiler chicken’, British Poultry Science, 48(3), pp. 264–275.
Kestin, S.C., Knowles, T.g., Tinch, a.E. and gregory, N.g. (1992) ‘prevalence of leg
weakness in broiler chickens and its relationship with genotype’, Veterinary Record,
131, pp. 190–194.
BiBliography