Embed Size (px)
Citation preview

CLINICAL RESEARCH www.jasn.org
Ferric Citrate Reduces Intravenous Iron andErythropoiesis-Stimulating Agent Use in ESRD
Kausik Umanath,* Diana I. Jalal,† Barbara A. Greco,‡ Ebele M. Umeukeje,§ Efrain Reisin,|
John Manley,¶ Steven Zeig,** Dana G. Negoi,†† Anand N. Hiremath,‡‡
Samuel S. Blumenthal,§§ Mohammed Sika,§ Robert Niecestro,|| Mark J. Koury,¶¶
Khe-Ni Ma,*** Tom Greene,*** Julia B. Lewis,§ and Jamie P. Dwyer§
for the Collaborative Study Group
*Division of Nephrology and Hypertension, Henry Ford Hospital, Detroit, Michigan; †Renal Diseases and Hypertension,University of Colorado, Denver, Colorado; ‡Western New England Renal and Transplant Associates, Baystate MedicalCenter, Springfield, Massachusetts; Divisions of §Nephrology and Hypertension and ¶¶Hematology and Oncology,Vanderbilt University Medical Center, Nashville, Tennessee; |Section of Nephrology and Hypertension, Louisiana StateUniversity Health Science Center, New Orleans, Louisiana; ¶Mountain Kidney and Hypertension Associates, Asheville, NorthCarolina; **Pines Clinical Research, Pembroke Pines, Florida; ††Division of Nephrology, University of Vermont, Burlington,Vermont; ‡‡Nephrology and Hypertension Clinic, Southgate, Michigan; §§Division of Nephrology, Medical College ofWisconsin, Milwaukee, Wisconsin; ||Independent Consultant, Pocono Pines, Pennsylvania; and ***Department of PopulationHealth Sciences, University of Utah, Salt Lake City, Utah
ABSTRACTFerric citrate (FC) is a phosphate binder with shown efficacy and additional effects on iron stores and use ofintravenous (iv) iron and erythropoiesis-stimulating agents (ESAs). We provide detailed analyses of changes iniron/hematologic parameters and iv iron/ESA use at timepoints throughout the active control period of a phase3 international randomized clinical trial. In all, 441 subjects were randomized (292 to FC and 149 to sevelamercarbonate and/or calciumacetate [active control (AC)]) and followed for 52weeks. Subjects on FChad increasedferritin and transferrin saturation (TSAT) levels compared with subjects on AC by week 12 (change in ferritin,114.1629.35 ng/ml; P,0.001; change in TSAT, 8.62%61.57%; P,0.001). Change in TSAT plateaued at thispoint, whereas change in ferritin increased through week 24, remaining relatively stable thereafter. Subjects onFC needed less iv iron compared with subjects on AC over 52 weeks (median [interquartile range] dose=12.9[1.0–28.9] versus 26.8 [13.4–47.6] mg/wk; P,0.001), and the percentage of subjects not requiring iv iron washigher with FC (P,0.001). Cumulative ESA over 52 weeks was lower with FC than AC (median [interquartilerange] dose=5303 [2023–9695] versus 6954 [2664–12,375] units/wk; P=0.04). Overall, 90.3% of subjects on FCand 89.3% of subjects on AC experienced adverse events. In conclusion, treatment with FC as a phosphatebinder results in increased iron parameters apparent after 12 weeks and reduces iv iron and ESA use whilemaintaining hemoglobin over 52 weeks, with a safety profile similar to that of available binders.
J Am Soc Nephrol 26: ccc–ccc, 2015. doi: 10.1681/ASN.2014080842
CKD–associated mineral and bone disorders(CKD-MBDs) and anemia complicate the manage-ment of almost all patients with ESRD.1 Complexmechanisms initiated by reduction in kidney func-tion regulate the pathogenesis of these disorders.Phosphate-binding agents provide the mainstay oftherapy for CKD-MBD.2,3 The treatment of anemiain ESRD is centered on the use of erythropoiesis-stimulating agents (ESAs) and the maintenance ofadequate iron stores, typically requiring intravenous
(iv) iron administration.4,5 There are several currentlyavailable oral phosphate-binding medications, but
Received August 29, 2014. Accepted December 9, 2014.
Published online ahead of print. Publication date available atwww.jasn.org.
Correspondence: Dr. Kausik Umanath, Division of Nephrologyand Hypertension, Clara Ford Pavilion 5, Henry Ford Hospital,Detroit, MI 48202. Email: [email protected]
Copyright © 2015 by the American Society of Nephrology
J Am Soc Nephrol 26: ccc–ccc, 2015 ISSN : 1046-6673/2610-ccc 1
none have been shown to provide benefits across the domains ofboth CKD-MBD and anemia.
Ferric compounds were noted to cause hypophosphatemiawhen used to treat anemia in the 1940s. Later, these compoundswere used in small studies to treat the hyperphosphatemia ofCKD.6–8 Ferric citrate (FC)was developed as a phosphate binder,and its clinical development is discussed in detail elsewhere.8–10
We recently reported a phase 3 sequential randomized clinicaltrial consisting of two randomized periods (a 52-week activecontrol (AC) period followed by a 4-week placebo control pe-riod) to evaluate the safety and efficacy of FC as a phosphatebinder.11 FC showed efficacy and safety as a phosphate binder.FC also increased iron stores and reduced iv iron and ESA usewhile maintaining hemoglobin levels compared with AC.11
Here, we provide detailed analyses of the course of changes inserum iron parameters and hemoglobin at additional timepoints, describe and analyze monthly changes in iv iron andESA usage, and present detailed safety data of multiple organsystems over the 52-week AC period of the trial of FC as a phos-phate binder.
RESULTS
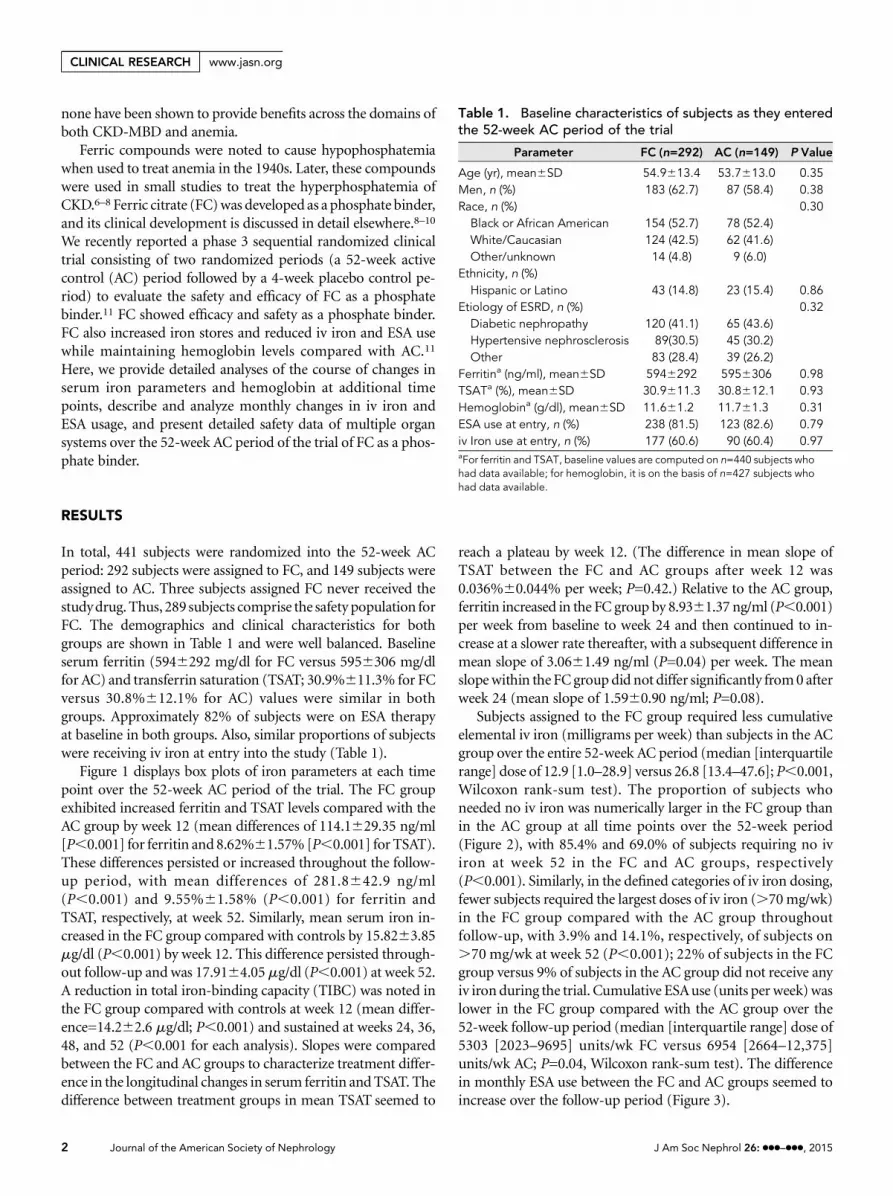
In total, 441 subjects were randomized into the 52-week ACperiod: 292 subjects were assigned to FC, and 149 subjects wereassigned to AC. Three subjects assigned FC never received thestudydrug.Thus, 289 subjects comprise the safety population forFC. The demographics and clinical characteristics for bothgroups are shown in Table 1 and were well balanced. Baselineserum ferritin (5946292 mg/dl for FC versus 5956306 mg/dlfor AC) and transferrin saturation (TSAT; 30.9%611.3% for FCversus 30.8%612.1% for AC) values were similar in bothgroups. Approximately 82% of subjects were on ESA therapyat baseline in both groups. Also, similar proportions of subjectswere receiving iv iron at entry into the study (Table 1).
Figure 1 displays box plots of iron parameters at each timepoint over the 52-week AC period of the trial. The FC groupexhibited increased ferritin and TSAT levels compared with theAC group by week 12 (mean differences of 114.1629.35 ng/ml[P,0.001] for ferritin and 8.62%61.57% [P,0.001] for TSAT).These differences persisted or increased throughout the follow-up period, with mean differences of 281.8642.9 ng/ml(P,0.001) and 9.55%61.58% (P,0.001) for ferritin andTSAT, respectively, at week 52. Similarly, mean serum iron in-creased in the FC group compared with controls by 15.8263.85mg/dl (P,0.001) by week 12. This difference persisted through-out follow-up and was 17.9164.05mg/dl (P,0.001) at week 52.A reduction in total iron-binding capacity (TIBC) was noted inthe FC group compared with controls at week 12 (mean differ-ence=14.262.6 mg/dl; P,0.001) and sustained at weeks 24, 36,48, and 52 (P,0.001 for each analysis). Slopes were comparedbetween the FC and AC groups to characterize treatment differ-ence in the longitudinal changes in serum ferritin andTSAT. Thedifference between treatment groups in mean TSAT seemed to
reach a plateau by week 12. (The difference in mean slope ofTSAT between the FC and AC groups after week 12 was0.036%60.044% per week; P=0.42.) Relative to the AC group,ferritin increased in the FC group by 8.9361.37 ng/ml (P,0.001)per week from baseline to week 24 and then continued to in-crease at a slower rate thereafter, with a subsequent difference inmean slope of 3.0661.49 ng/ml (P=0.04) per week. The meanslopewithin the FCgroup did not differ significantly from0 afterweek 24 (mean slope of 1.5960.90 ng/ml; P=0.08).
Subjects assigned to the FC group required less cumulativeelemental iv iron (milligrams per week) than subjects in the ACgroup over the entire 52-week AC period (median [interquartilerange] dose of 12.9 [1.0–28.9] versus 26.8 [13.4–47.6]; P,0.001,Wilcoxon rank-sum test). The proportion of subjects whoneeded no iv iron was numerically larger in the FC group thanin the AC group at all time points over the 52-week period(Figure 2), with 85.4% and 69.0% of subjects requiring no iviron at week 52 in the FC and AC groups, respectively(P,0.001). Similarly, in the defined categories of iv iron dosing,fewer subjects required the largest doses of iv iron (.70mg/wk)in the FC group compared with the AC group throughoutfollow-up, with 3.9% and 14.1%, respectively, of subjects on.70 mg/wk at week 52 (P,0.001); 22% of subjects in the FCgroup versus 9% of subjects in the AC group did not receive anyiv iron during the trial. Cumulative ESAuse (units per week) waslower in the FC group compared with the AC group over the52-week follow-up period (median [interquartile range] dose of5303 [2023–9695] units/wk FC versus 6954 [2664–12,375]units/wk AC; P=0.04, Wilcoxon rank-sum test). The differencein monthly ESA use between the FC and AC groups seemed toincrease over the follow-up period (Figure 3).
Table 1. Baseline characteristics of subjects as they enteredthe 52-week AC period of the trial
Parameter FC (n=292) AC (n=149) P Value
Age (yr), mean6SD 54.9613.4 53.7613.0 0.35Men, n (%) 183 (62.7) 87 (58.4) 0.38Race, n (%) 0.30Black or African American 154 (52.7) 78 (52.4)White/Caucasian 124 (42.5) 62 (41.6)Other/unknown 14 (4.8) 9 (6.0)
Ethnicity, n (%)Hispanic or Latino 43 (14.8) 23 (15.4) 0.86
Etiology of ESRD, n (%) 0.32Diabetic nephropathy 120 (41.1) 65 (43.6)Hypertensive nephrosclerosis 89(30.5) 45 (30.2)Other 83 (28.4) 39 (26.2)
Ferritina (ng/ml), mean6SD 5946292 5956306 0.98TSATa (%), mean6SD 30.9611.3 30.8612.1 0.93Hemoglobina (g/dl), mean6SD 11.661.2 11.761.3 0.31ESA use at entry, n (%) 238 (81.5) 123 (82.6) 0.79iv Iron use at entry, n (%) 177 (60.6) 90 (60.4) 0.97aFor ferritin and TSAT, baseline values are computed on n=440 subjects whohad data available; for hemoglobin, it is on the basis of n=427 subjects whohad data available.
2 Journal of the American Society of Nephrology J Am Soc Nephrol 26: ccc–ccc, 2015
CLINICAL RESEARCH www.jasn.org

Table 2 characterizes the changes in hematologic parametersover 52 weeks. Red blood cell (RBC) mean corpuscular volume(MCV) increased in the FC group throughout the 52 weekscompared with in the AC group (FC, 98.1867.27 fl versus AC,96.0766.55 fl; P,0.001). Likewise, mean cell hemoglobin(MCH) increased in the FC group compared to the AC group.There was no significant change in other red cell indices orplatelet counts. Hemoglobin levels were similar at baseline forboth groups and remained relatively stable throughout the52-week AC period in both groups, but they were significantlyand numerically slightly higher in the FC group at week 52(11.4260.10 g/dl in FC versus 11.1460.12 g/dl in AC; P=0.02)(Figure 4). As previously reported, aluminum levels were notdifferent between the two groups.
FC was noted to have a similar safety profile to AC, becausethe proportions of subjects experiencing any adverse event (sumof serious adverse events [SAEs] and non-SAEs) were similarbetween the two groups (FC, 90.3%; AC, 89.3%). Subjectsexperiencing infection-related SAEs were fewer in the FC group(FC, 12.5%;AC,18.1%). Similarly, therewere fewer subjectswho
experienced cardiovascular SAEs in the FC group (7.3%) versusthe AC group (12.1%). Likewise, fewer subjects on FC experi-enced gastrointestinal (GI) system and hepatobiliary SAEscompared with subjects on AC (GI: FC, 6.9% versus AC,12.8%; hepatobiliary: FC, 0.7% versus AC, 1.3%). At least oneserum ferritin measurement of.1500 ng/ml occurred in 57 of288 (19.8%) subjects on FC and 14 of 148 (9.5%) subjects onAC. In total, 39 of 57 patients in the FC group with elevatedserum ferritin during follow-up had resolution of the elevationat 52 weeks, and 10 of 14 patients in the AC group with elevatedserum ferritin during follow-up had resolution of the elevationat 52 weeks. As shown in Table 3, the majority of the patientswith ferritin.1500 ng/ml was adjudicated to be a result of iv ironadministration, an SAE, or both. A total of three subjects had FCdiscontinued because of elevated serum ferritin. Of seven sub-jects listed in Table 3 adjudicated to have an unknown cause of atleast a single value of ferritin.1500 ng/ml, all but one subjecthad resolution while remaining on FC. The remaining subjectwas not reviewed for a ferritin.1500 ng/ml, but because thesubject underwent a liver biopsy for evaluation of abnormal
0 12 24 36 48 52
Week
0
1000
2000
3000
Seru
m F
errit
in (n
g/m
L)
Active ControlFerric CitrateTreatment
0 12 24 36 48 52
Week
0
100
200
300
400
Seru
m Ir
on (m
cg/d
L)
Active ControlFerric CitrateTreatment
0 12 24 36 48 52
Week
20
40
60
80
TSAT
(%)
Active ControlFerric CitrateTreatment
0 12 24 36 48 52
Week
100
200
300
400
TIBC
(g/
dL)
Active ControlFerric CitrateTreatment
A B
C D
Figure 1. Ferric Citrate Increases Total Body Iron Stores Compared to Active Control. Summary box plots for (A) ferritin, (B) TSAT, (C)serum iron, and (D) TIBC.
J Am Soc Nephrol 26: ccc–ccc, 2015 Ferric Citrate Reduces IV Iron/ESA 3
www.jasn.org CLINICAL RESEARCH

hepatic imaging in the presence normal liver function tests afteran episode of hematemesis caused by reflux esophagitis and wasnoted to have increased iron staining in the liver. The serumferritin was 799 ng/ml at the time of the liver biopsy. The siteelected not to perform genetic testing for hereditary hemochro-matosis, but FC was discontinued because of the liver biopsyfindings, and the use of iv iron was left at the discretion of thetreating physicians. The increased iron staining was felt to beunrelated to solely FC according to the site investigator, datasafety monitoring board, and study chair.
DISCUSSION
FC has been shown to be an efficacious phosphate binder thatincreases iron stores and reduces iv iron and ESA use whilesustaining hemoglobin levels.11 Iron supplementation and ESAuse have been mainstays in treating the anemia that develops inpatients on dialysis. Patients on dialysis require sufficient ironstores to appropriately respond to ESA therapy.12–15 Historically,oral iron supplementation given in the fasting state to treat
functional and absolute iron deficiency in patients with ESRDwasunable tomaintain adequate iron stores.12,16,17Multiple stud-ies using different oral iron formulations (ferrous sulfate andferrous fumarate) in doses of up to 200 mg/d of elemental ironwere unable to show achievement or maintenance of adequateiron stores in patients with ESRD.12,16–19 Similarly, a recentlyapproved iron–based phosphate binder, sucroferric oxyhydrox-ide, has not been shown to increase iron stores, presumably be-cause its chemical composition does not release ferric iron forabsorption.20 Currently, there is widespread use of iv iron inpatients with ESRD. TheDialysis Outcomes and Practice PatternsStudy Practice Monitor reported that .70% of patients on di-alysis received iv iron at some time in 2011, the time duringwhichthe trial was conducted.21 There has been increasing concern overthe use of iv iron, because it bypasses many of the physiologiccontrols in place to regulate iron absorption and total iron storesand may associate with infection risks.22–25
FC was used as a phosphate binder in this randomized trialover 52weeks comparedwith anACconsistingof calciumacetateand/or sevelamer carbonate. Over the 52-week AC period,sustained and statistically significant increases were seen in the
Categories of IV Iron (mg/week) 0 >0-35 >35-70 >70
Perc
ent
0
10
20
30
40
50
60
70
80
90
100
Month
TreatmentFerric Citrate Active Control
0 1 2 3 4 5 6 7 8 9 10 11 12 0 1 2 3 4 5 6 7 8 9 10 11 12
Figure 2. Ferric citrate reduces IV iron use. Relative proportions of iv iron use during each month of the trial for specific dose categoriesof iv iron; iv iron use is expressed as milligrams per week.
4 Journal of the American Society of Nephrology J Am Soc Nephrol 26: ccc–ccc, 2015
CLINICAL RESEARCH www.jasn.org

commonlymeasured indicators of total body iron stores, namelyserum iron, TSAT, and serum ferritin, with corresponding andexpected reductions in TIBC, consistent with improved ironstores insubjects treatedwithFC.As illustrated inFigures2and3,there was a sustained and consistent reduction in the use of iviron and ESA therapy with maintenance of stable hemoglobinlevels (Figure 4). Significantly more elemental iron through theiv route was administered over the course of the trial to subjectson AC. These data strongly suggest that the use of FC as a phos-phate binder is associated with some GI absorption of iron. TheTSATplateau and the decrease in the rate of rise of serum ferritinlevels further suggest that the absorption of iron is regulated andsaturable. The increase in MCV and MCH in the FC groupcompared with the AC group also suggests iron uptake intothe RBCs. Stable hemoglobin levels, despite reductions in theuse of iv iron and ESA, suggest that hematopoiesis remained wellsupported during treatment with FC. These data suggest that thecontinued use of FC would provide a source of maintenanceiron, reducing or eliminating the need for iv iron.
The absorption of soluble inorganic iron is tightly regulatedin the intestine. Ferric (Fe3+) iron must first be reduced to the
ferrous form (Fe2+) by ferric reductase (duodenal cytochromeb)before being absorbed, because only ferrous iron can be absorbedby the enterocyte. Additionally, there are both intracellularand extracellular regulation provided by iron regulatory proteinsand hepcidin.23,26 This tight duodenal-based regulation protectsthe body against iron overload in the absence of hemochroma-tosis. Our data support the concept that the rise in iron storesassociated with FC treatment occurred through intact regula-tory pathways for GI iron absorption. The plateau of TSAT at12 weeks and the reduced rate of rise of ferritin at 24 weeks pro-vides additional evidence to suggest that the body absorbed ironin a physiologic manner, allowing for any excess to be eliminated inthe stool in the usual manner. In contrast, iv iron administrationbypasses the body’s physiologic control mechanisms. Studies,such as dialysis patients response to IV ironwith elevated ferritin(DRIVE),27,28 have shown that iv iron use improves hemoglobinlevels and ESA dose-response over short time periods, but long-term safety data are lacking for this approach to iron supple-mentation. In fact, a recent retrospective study suggested that amaintenance iv iron dosing approach may result in fewer in-fectious complications relative to a bolus iv iron dosing regimen.
Categories of ESA (unit/week) 0 >0-5000 >5000-10000 >10000
Perc
ent
0
10
20
30
40
50
60
70
80
90
100
Month
TreatmentFerric Citrate Active Control
0 1 2 3 4 5 6 7 8 9 10 11 12 0 1 2 3 4 5 6 7 8 9 10 11 12
Figure 3. Ferric citrate reduces ESA use. Relative proportions of ESA use during each month of the trial for specific dose categories ofESA; ESA use is expressed in units per week.
J Am Soc Nephrol 26: ccc–ccc, 2015 Ferric Citrate Reduces IV Iron/ESA 5
www.jasn.org CLINICAL RESEARCH

Our trial extends the length of follow-up from 12 weeks inDRIVE and DRIVE-II using iv iron to 52 weeks using oraliron. There is potential inherent benefit to stabilizing totalbody iron stores by using a more physiologic approach toiron delivery. Lastly, from a payer and health economics per-spective, reductions in iv iron and ESA use have the potentialto provide a significant cost savings.29
A hypothetical potential harm of long-term oral FC ad-ministration is increased iron accumulation.However, becausethe duodenal iron absorption from FC is limited by thephysiologic feedback response to increased iron mediated byhepcidin and iron regulatory proteins, one could hypothesizethat oral FC is safer than iv iron, which is not subject to thisfeedback regulation and used extensively in patients onhemodialysis currently; iv iron is also more likely than oralFC to increase the plasmanontransferrin-bound iron, which ismore readily accumulated in the liver, heart, and endocrineorgans. The exception to the hepcidin feedback control of ironabsorption is the#1% of patients who may have mutant hu-man hemochromatosis protein (HFE). HFE is part of thebone-morphogenetic protein receptor complex that regulateshepcidin transcription and in turn, the absorption of oral ironby the duodenum. In our study, we had two patients in the FCgroup who had progressive increases in serum ferritin thatwere not explained by concomitant iv iron administration orchronic inflammation, another cause of increased serum fer-ritin. We stopped the FC in these two patients and suggestedthat they be tested for HFE mutations.
The safety of oral FC has been shown over 52 weeks,11 andthis report details the safety of organ systems (cardiovascular,GI/hepatobiliary, or infection) that are traditionally consid-ered vulnerable to iron overload.22,23 Organ biopsies werenot done in this study to assess the deposition of iron. How-ever, iron deposition in an organ can reflect iron stores but notnecessarily be associated with organ dysfunction caused byiron accumulation. No safety concerns were identified in theseareas. Of note, across all of these organ systems, fewer subjectson FC versus AC experienced SAEs, suggesting no organ dys-function related to the accumulation or deposition of iron.Wehypothesize that the reductions in SAEsmay reflect a benefit ofsupplying iron orally. Subjects on FC received their iron pre-dominantly through the oral versus iv route, whereas subjectson AC received iron solely through the iv route. We hypoth-esize that it may be that fewer iv infusions accrue less infectionrisk, or itmay be that there is an inherent inflammatory risk ofiron delivered through the iv versus oral route. In this 52-weektrial, we found no evidence of iron overload as a result of FCadministration. However, as with all iron therapies, physiciansmust regularly monitor for laboratory or clinical evidence ofiron overload when prescribing FC.
In our study, we restricted the administration of iv iron instudysubjects if their central laboratorymonthly serumferritinwas.1000 ng/dl or their TSATwas.50%.We chose a serumferritin$1500 mg/dl as an arbitrary cutoff to adjudicate sub-jects for the etiology of the value and follow the subjects untilTa
ble
2.Cha
nges
inhe
matolog
icparam
eters,
includ
ingRBC
indices,ov
erthe52
-wee
kperiod
TimePoint
MCV
MCH
MCH
Conc
entration
PlateletCount
FCMea
n(SD)
ACMea
n(SD)
PValue
FCMea
n(SD)
ACMea
n(SD)
PValue
FCMea
n(SD)
ACMea
n(SD)
PValue
FCMea
n(SD)
ACMea
n(SD)
PValue
Baseline
95.70(7.11)
95.79(6.67)
30.60(2.45)
30.59(2.45)
32.00(1.41)
31.96(1.44)
219.4(69.84
)20
3.6(67.57
)Wee
k12
96.37(6.96)
95.58(6.39)
0.05
30.86(2.43)
30.61(2.40)
0.07
32.04(1.31)
32.05(1.52)
0.72
212.3(73.42
)20
4.9(63.94
)0.35
Wee
k24
97.36(6.68)
96.32(6.69)
0.02
30.90(2.41)
30.47(2.44)
,0.01
31.77(1.36)
31.65(1.36)
0.51
215.2(71.54
)20
5.9(63.13
)0.70
Wee
k36
97.34(6.95)
95.90(6.37)
,0.00
130
.73(2.45)
30.29(2.38)
,0.01
31.59(1.28)
31.61(1.31)
0.70
214.9(71.77
)20
4.3(64.64
)0.87
Wee
k48
98.18(7.15)
96.51(6.49)
,0.00
130
.88(2.48)
30.21(2.31)
,0.00
131
.48(1.35)
31.31(1.25)
0.23
209.0(70.47
)20
3.5(65.81
)0.26
Wee
k52
98.18(7.27)
96.07(6.55)
,0.00
130
.82(2.43)
30.22(2.30)
,0.00
131
.44(1.35)
31.47(1.43)
0.66
212.0(74.59
)20
2.4(72.68
)0.74
Pvalues
areforco
mparisonof
FCwith
ACat
each
timepoint.
6 Journal of the American Society of Nephrology J Am Soc Nephrol 26: ccc–ccc, 2015
CLINICAL RESEARCH www.jasn.org

resolution or the end of the study. Our adjudications were for thepurpose of assuring safety. This allowed us to monitor subjectsfor a level of ferritin that was sufficiently high to be sensitive as amarker for iron stores but extremely nonspecific.Using a cutoff ofan achieved ferritin.1500 ng/ml, we observed that there weremore subjects on FC whose serum ferritin crossed this arbitrarycutoff as expected, because subjects on FC had increased ironstores compared with subjects on AC. Our data suggest physio-logic regulation of iron absorption with FC and use of these in-creased iron stores, which is evident by the achieved hematologicparameters on FC, despite decreased ESAusage. The overwhelm-ing majority of patients in both the FC and AC groups was adju-dicated to be caused by iv iron administration and/or the
occurrence of an inflammation-associatedSAE (Table 3) and resolved. Ferritin is knowntobe an acute-phase reactant, thus increasing,often significantly, in the presence of severeintercurrent illness and as we saw in our re-sults, returning to lower levels when the in-tercurrent illness is resolved. The choice ofachieved ferritin.1500 ng/ml was actuallyquite conservative, because the majority ofUnited States dialysis units and the majorityof dialysis units in our study administered iviron up to a ferritin of 1200 ng/ml in non-study patients (unpublished data, Collabora-tive Study Group). For example, if a patientwith a serum ferritin of 1199 ng/ml continuesto receive iv iron until the next monthlyor quarterly serum ferritin is drawn, the1500-ng/ml threshold could easily be exceeded.Our data support the finding in the DRIVEstudies that achieving higher levels of ironstores in patients with ESRD results in re-duced ESA requirement for themaintenanceof hemoglobin. This is particularly impor-tant, because ESA usage is both costly andassociatedwith increased adverse events.30,31
There are several limitations to our study.First, entry into the trial was limited by the inclusion/exclusioncriteria, thuspotentially limiting the generalizabilityof the resultsto those patients who meet these criteria. Second, we did notperform radionuclide-tagged balance studies, and as such,improvements in iron stores, reductions in iv iron and ESAuse, increased MCVandMCH, and stabilization of hemoglobinlevels, while highly suggestive of ferric iron absorption andincorporation into the RBCs, cannot prove it conclusively.Hepcidin levelswerenotmeasuredduring thecourseof the study,although theprecise interpretationof these levels is controversial.Third, safety analyses are limited to the 52-week length of thistrial, andtherefore,ourconclusionsare limitedtothis timeframe.However, a long-term open-label extension study(NCT01554982) has recently concluded and will provide addi-tional data, with results expected in early 2015.32 Fourth, we didnot routinely perform organ biopsies to examine them for ironaccumulation nor did the developers of the iv iron preparationscurrently in use. Nonetheless, from a practical standpoint, thesubjects in this trial were similar to United States patients ondialysis, and these changes in measured parameters have thepotential to benefit them for the reasons outlined above. Al-though the analyses presented here are secondary outcomes,they were prespecified on the basis of prospective, randomizedcomparisons, with study-wise error rates limited by the sequen-tial gatekeeping strategy in the study design.
This report shows that the use of FC as a phosphate binderresults in improved iron parameters reflective of total body ironstores, and this change is apparent after only 12 weeks of use. FCreduces iv iron andESAusewhilemaintaining hemoglobin levels
0 12 24 36 48 52
Week
7.5
10.0
12.5
15.0
17.5
Seru
m H
emog
lobi
n (g
/dL)
Active ControlFerric CitrateTreatment
Figure 4. Treatment with FC maintains hemoglobin throughout the 52-week ACperiod. Week 52 median hemoglobin was 11.2 g/dl in subjects treated with FC versus11.0 g/dl in subjects treated with AC (P=0.02).
Table 3. Results of the committee’s adjudications forsubjects with ferritin.1500 ng/ml as well as one subject whounderwent a liver biopsy
FC (n=288),n (%)
AC (n=148),n (%)
Subjects 57 (19.8) 14 (9.5)Resolved 39a (68.4) 10 (71.4)AdjudicationCaused by iv iron administration 23 (40.4) 7 (50.0)Caused by SAE 12 (21.1) 0 (0)Caused by iv iron+SAE 15 (26.3) 7 (50.0)Unknown 7a (12.3) 0 (0)
Therewas a difference in the proportionof subjects treatedwith FC (19.8%)whoachieved an elevated ferritin compared with subjects treated with AC (9.5%).aOne subject had a liver biopsy for abnormal liver imaging but did not haveferritin.1500 ng/ml.
J Am Soc Nephrol 26: ccc–ccc, 2015 Ferric Citrate Reduces IV Iron/ESA 7
www.jasn.org CLINICAL RESEARCH

over 52 weeks of use, with a significant portion of subjectsrequiring no iv iron. The use of FC is associated with fewer SAEsin those organ systems typically considered vulnerable to ironoverload, thus suggesting that there was no clinical evidence ofclinically significant ironoverloadassociatedwith theuseofFCinthis study. The use of FC was well tolerated, and its favorableeffects on systemic ironparameters and the reduceduse of iv ironand ESA warrant its consideration as a phosphate binder inclinical practice.
CONCISE METHODS
This was a phase 3, randomized, open-label trial conducted at 60 sites
across the United States and Israel. The rationale, study design, and
principal results of this trial have been published previously.11,33 This
manuscript focuses on change in ferritin and TSAT from baseline to
week 52 and the cumulative use of iv iron and ESA over 52 weeks. All of
these end points were among five key prespecified outcomes that were
designated in a five-step gatekeeping strategy to protect the study-wise
a-level.
ParticipantsEligible subjectswereadultpatientswithESRDmaintainedoneither three
times per week hemodialysis or peritoneal dialysis for at least 3 months
before enrollment. They were required to have a screening ferritin,1000
ng/ml and TSAT,50%. Key exclusion criteria for the trial relevant to
these analyses included actively symptomatic GI tract bleeding, inflam-
matory bowel disease, or an absolute requirement for oral iron therapy,
vitamin C, or calcium-, magnesium-, or aluminum-containing drugs
with meals.
DesignAfter a washout period, subjects were randomized 2:1 to FC or AC
consisting of study-supplied calcium acetate and/or sevelamer carbon-
ate. FC was dosed based on a study-supplied titration schedule and
provided as 1-g tablets containing 210mg ferric iron. Investigators were
instructed to prescribe AC guided by their package inserts.33–35 Both FC
and AC were titrated on the basis of centrally measured serum phos-
phorus levels to achieve prespecified target levels. FC and AC were
administered for 52 weeks during the 52-week AC period. ESA dosing
was at the discretion of the local investigator; iv iron use was at the
discretion of the site as long as the serum ferritin was #1000 ng/ml
and the TSATwas#30%. All oral iron and vitaminC supplements were
prohibited.
Outcome MeasurementsChanges over 52 weeks in ferritin and TSATwere used to characterize
the effect of FC on iron stores. Cumulative doses of iv iron and ESA
were used to determine the effect of FC on iv iron and ESA usage.
Hemoglobin levels were collected every 12 weeks, and serum iron
level, serumferritin,andTIBCwerecollectedevery4weeks. SerumTSAT
was calculated as serum iron/TIBC3100; iv iron and ESA usage were
recorded monthly. Adverse events were collected at every study visit.
SAEs were reviewed by the Collaborative Study Group (CSG) Medical
Monitoring Committee (M.J.K. and J.P.D.) within 24 hours of receipt at
the Clinical Coordinating Center. Additionally, all subjects with a
ferritin$1500 ng/ml at any time point were reviewed by threemembers
of the CSG (M.J.K., J.B.L., and J.P.D.) for adjudication as to the apparent
cause of elevated serum ferritin, and recommendations on continued
use of the study drugweremade. Subjects were followed to resolution or
the end of the study.
All subjects gave written informed consent before any investigational
procedures, and the trial was conducted in accordance with the
Declaration of Helsinki and Good Clinical Practice.
This trial is registered with ClinicalTrials.gov (NCT01191255). All
laboratory measurements reported here were performed at the central
laboratory.All authors contributed to thefinalmanuscript.This trialwas
conducted under a Special Protocol Assessment agreement with the US
Food and Drug Administration. The study was sponsored by Keryx
Biopharmaceuticals, Inc.
Statistical AnalysesThe study’s analysis plan used a sequential gatekeeping strategy36 with
two-sided a=0.05 at each step to protect the study-wise a-level for the
treatment comparisons of the primary and four prespecified main sec-
ondary outcomes in the following sequence: (1) change in serum phos-
phorus during the final 4-week placebo-control period, changes in (2)
ferritin and (3) TSAT from baseline to week 52 in the 52-week period,
and finally, cumulative use of (4) iv iron and (5) ESA over the 52-week
period. Because each of these five comparisons attained the designated
a-level of 0.05, we report comparisons of ferritin, TSAT, iv iron, and
ESA between the treatment groups using a two-sided a=0.05 in accor-
dancewith the prespecified gatekeeping rule. Additional hypothesis tests
were performed at the two-sided a=0.05 level without formal adjust-
ment for multiple comparisons.
Continuous data were summarized using descriptive statistics
(number of observations [n], mean, SD, median, minimum, and
maximum). Frequencies and percentages were used to summarize
categorical (discrete) data. Separate analysis of covariance (ANCOVA)
models were used to analyze the mean change in each laboratory pa-
rameter, including iron panel values, from baseline to each follow-up
assessment after controlling for the baseline value. After first defining
outcome measurements after study drug discontinuation as missing,
all missing values were imputed using a last follow-up value carried
forward algorithm. The analyses of laboratory parameters using last
follow-up value carried forward were confirmed using corresponding
ANCOVAs on the basis of longitudinal mixed effect models with un-
structured covariancematrices to account for repeatedmeasurements.
Mixed effect analyses using two-slope linear splines with post hoc
selection of knot pointswere used to compare the relative rates of increase
in TSATand ferritin during the early and later portions of follow-up,with
separate mean slopes estimated for TSAT before and after 12 weeks and
separate mean slopes estimated for ferritin before and after 24 weeks.
ESAdosewas converted to epoetin alfa equivalent units, and the dose
perweekwas computed.Wilcoxonrank-sum testswereused to compare
thecumulative iv ironuseandESAdose throughout the follow-upperiod
between the treatment groups. The cumulative levels were computed
without imputation ofmissing values, because almost all missing values
were determined to be caused by no drug administered rather than
8 Journal of the American Society of Nephrology J Am Soc Nephrol 26: ccc–ccc, 2015
CLINICAL RESEARCH www.jasn.org

missingness of data.Wilcoxon rank-sum tests were also used to confirm
the ANCOVA results for serum ferritin and TSAT, because these
outcomes exhibited moderate departures from normality.
Statistical analyses were performed using SAS, versions 9.3 and
9.4 (SAS Institute Inc., Cary, NC). The independent CSG statisti-
cian (T.G.) had full access to the locked clinical trial database to prepare
this manuscript.
ACKNOWLEDGMENTS
The trial was funded by Keryx Biopharmaceuticals, Inc. Additionally,
this study was supported, in part, by a grant from The Patient Pro-
tection andAffordable CareAct of 2010. The Internal Revenue Service
issued the funding under the Qualifying Therapeutic Discovery
Project administeredunder section48Dof the InternalRevenueCode.
Aportionoftheseresultswaspresented inposter formatat theAnnual
Meeting of the American Society of Nephrology November 7–10, 2013
(Atlanta, GA) by the authors of this manuscript.
DISCLOSURESK.U., D.I.J., B.A.G., E.R., J.M., S.Z., D.G.N., A.N.H., S.S.B., M.S., M.J.K.,
T.G., J.B.L., and J.P.D. have received research and travel support from Keryx
Biopharmaceuticals, Inc. R.N. is a consultant for Keryx Biopharmaceuticals,
Inc.
REFERENCES
1. US Renal Data System: USRDS 2013 Annual Data Report: Atlas of End-Stage Renal Disease in the United States, Bethesda, MD, National In-stitutes of Health, National Institute of Diabetes and Digestive andKidney Diseases, 2013
2. National Kidney Foundation: K/DOQI clinical practice guidelines forbone metabolism and disease in chronic kidney disease. Am J KidneyDis 42[4 Suppl 3]: S1–S201, 2003
3. KidneyDisease: ImprovingGlobalOutcomes (KDIGO)CKD-MBDWorkGroup: KDIGO clinical practice guideline for the diagnosis, evaluation,prevention, and treatment of Chronic Kidney Disease-Mineral andBone Disorder (CKD-MBD). Kidney Int Suppl 113: S1–S130, 2009
4. KDOQINational Kidney Foundation: II. Clinical practice guidelines andclinical practice recommendations for anemia in chronic kidney diseasein adults. Am J Kidney Dis 47[5 Suppl 3]: S16–S85, 2006
5. KDOQI: KDOQI Clinical Practice Guideline and Clinical Practice Rec-ommendations for anemia in chronic kidney disease: 2007 update ofhemoglobin target. Am J Kidney Dis 50: 471–530, 2007
6. Liu SH, Chu HI: Studies of calcium and phosphorus metabolism withspecial reference to pathogenesis and effects of dihydrotachysterol(A.T. 10) and iron. Medicine (Baltimore) 22: 103–161, 1943
7. Liu SH, Chu HI, Hsu HC, Chao HC, Cheu SH: Calcium and phosphorusmetabolism in osteomalacia. XI. The pathogenetic role of pregnancyand relative importance of calcium and vitamin D supply. J Clin Invest20: 255–271, 1941
8. Umanath K, Niecestro R, Lewis J, Dwyer JP: Ferric citrate: A novelphosphate-binding agent. Expert Rev Endocrinol Metab 8: 13–19,2013
9. Sika M, Sinsakul MV, Niecestro RM, Chiang S: Prolonged use of ferriccitrate (FC) as a phosphate binder reduces IV iron use in pts with ESRD.
Presented at the American Society of Nephrology Renal Week, Denver,CO, November 16–21, 2010
10. Sinsakul M, Sika M, Koury M, Shapiro W, Greene T, Dwyer J, Smith M,Korbet S, Lewis J; Collaborative Study Group: The safety and tolera-bility of ferric citrate as a phosphate binder in dialysis patients.NephronClin Pract 121: c25–c29, 2012
11. Lewis JB, SikaM, KouryMJ, Chuang P, Schulman G, SmithMT,WhittierFC, Linfert DR, Galphin CM, Athreya BP, Nossuli AK, Chang IJ,Blumenthal SS, Manley J, Zeig S, Kant KS, Olivero JJ, Greene T, DwyerJP; forthe Collaborative Study Group: Ferric citrate controls phospho-rus and delivers iron in patients on dialysis [published online ahead ofprint July 24, 2014]. J Am Soc Nephrol doi:ASN.2014020212
12. BesarabA,CoyneDW: Iron supplementation to treat anemia in patientswith chronic kidney disease. Nat Rev Nephrol 6: 699–710, 2010
13. Kalantar-Zadeh K, Streja E, Miller JE, Nissenson AR: Intravenous ironversus erythropoiesis-stimulating agents: Friends or foes in treatingchronic kidney disease anemia? Adv Chronic Kidney Dis 16: 143–151,2009
14. Sargent JA, Acchiardo SR: Iron requirements in hemodialysis. BloodPurif 22: 112–123, 2004
15. Skikne BS, Ahluwalia N, Fergusson B, Chonko A, Cook JD: Effects oferythropoietin therapy on iron absorption in chronic renal failure. J LabClin Med 135: 452–458, 2000
16. Fudin R, Jaichenko J, Shostak A, Bennett M, Gotloib L: Correction ofuremic iron deficiency anemia in hemodialyzed patients: A prospectivestudy. Nephron 79: 299–305, 1998
17. Macdougall IC, Tucker B, Thompson J, TomsonCR, Baker LR, Raine AE:A randomized controlled study of iron supplementation in patientstreated with erythropoietin. Kidney Int 50: 1694–1699, 1996
18. Markowitz GS, Kahn GA, Feingold RE, Coco M, Lynn RI: An evaluationof the effectiveness of oral iron therapy in hemodialysis patients re-ceiving recombinant human erythropoietin. Clin Nephrol 48: 34–40,1997
19. Wingard RL, Parker RA, Ismail N, Hakim RM: Efficacy of oral iron therapyin patients receiving recombinant human erythropoietin. Am J KidneyDis 25: 433–439, 1995
20. Floege J, Covic AC, Ketteler M, Rastogi A, Chong EM, Gaillard S, LiskLJ, Sprague SM; PA21 StudyGroup: Aphase III study of the efficacy andsafety of a novel iron-based phosphate binder in dialysis patients.Kidney Int 86: 638–647, 2014
21. Fuller DS, Pisoni RL, Bieber BA, Gillespie BW, Robinson BM: TheDOPPS practice monitor for US dialysis care: Trends through Decem-ber 2011. Am J Kidney Dis 61: 342–346, 2013
22. Fishbane S, Mathew A, Vaziri ND: Iron toxicity: Relevance for dialysispatients. Am J Kidney Dis 29: 255–259, 2014
23. Fleming RE, Ponka P: Iron overload in human disease. N Engl J Med366: 348–359, 2012
24. Ishida JH, Johansen KL: Iron and infection in hemodialysis patients.Semin Dial 27: 26–36, 2014
25. Brookhart MA, Freburger JK, Ellis AR, Wang L, Winkelmayer WC,Kshirsagar AV: Infection risk with bolus versus maintenance iron sup-plementation in hemodialysis patients. J Am Soc Nephrol 24: 1151–1158, 2013
26. Nairz M, Theurl I, Ludwiczek S, Theurl M, Mair SM, Fritsche G, Weiss G:The co-ordinated regulation of iron homeostasis in murine macro-phages limits the availability of iron for intracellular Salmonella typhi-murium. Cell Microbiol 9: 2126–2140, 2007
27. Coyne DW, Kapoian T, Suki W, Singh AK, Moran JE, Dahl NV, RizkalaAR; DRIVE StudyGroup: Ferric gluconate is highly efficacious in anemichemodialysis patients with high serum ferritin and low transferrin sat-uration: Results of the Dialysis Patients’ Response to IV Iron with Ele-vated Ferritin (DRIVE) Study. J Am Soc Nephrol 18: 975–984, 2007
28. Kapoian T, O’Mara NB, Singh AK, Moran J, Rizkala AR, Geronemus R,Kopelman RC, Dahl NV, Coyne DW: Ferric gluconate reduces epoetinrequirements in hemodialysis patients with elevated ferritin. J Am SocNephrol 19: 372–379, 2008
J Am Soc Nephrol 26: ccc–ccc, 2015 Ferric Citrate Reduces IV Iron/ESA 9
www.jasn.org CLINICAL RESEARCH

29. Rodby R, Umanath K, Hsieh A, Niecestro R, Lewis J, Dwyer J, GroupCS:Phosphorus binding with ferric citrate reduces erythropoiesis-stimulatingagent usage and cost in patients with ESRD. Presented at the NationalKidney Foundation Spring Clinical Meetings, Las Vegas, NV, April 22–26, 2014
30. Besarab A, Bolton WK, Browne JK, Egrie JC, Nissenson AR, OkamotoDM, Schwab SJ, Goodkin DA: The effects of normal as compared withlow hematocrit values in patients with cardiac diseasewho are receivinghemodialysis and epoetin. N Engl J Med 339: 584–590, 1998
31. Coyne DW: The health-related quality of life was not improved bytargeting higher hemoglobin in theNormal Hematocrit Trial.Kidney Int82: 235–241, 2012
32. A long-term safety extension trial of ferric citrate in patients with end-stage renal disease (ESRD) on dialysis. Available at: https://clinicaltrials.
gov/ct2/show/NCT01554982?term=NCT01554982&rank=1. AccessedAugust 29, 2014
33. Umanath K, Sika M, Niecestro R, Connelly C, Schulman G, Koury MJ,Lewis JB, Dwyer JP; Collaborative Study Group: Rationale and studydesign of a three-period, 58-week trial of ferric citrate as a phosphatebinder in patients with ESRD on dialysis. Hemodial Int 17: 67–74,2013
34. Fresenius Medical Care North America: PhosLo Package Insert,Waltham, MA, Fresenius Medical Care North America, 2007
35. Genzyme Corp.: Renvela Package Insert, Cambridge, MA, GenzymeCorp., 2010
36. Dmitrienko A, Offen WW, Westfall PH: Gatekeeping strategies forclinical trials that do not require all primary effects to be significant. StatMed 22: 2387–2400, 2003
10 Journal of the American Society of Nephrology J Am Soc Nephrol 26: ccc–ccc, 2015
CLINICAL RESEARCH www.jasn.org


