Embed Size (px)
Citation preview
This article appeared in a journal published by Elsevier. The attachedcopy is furnished to the author for internal non-commercial researchand education use, including for instruction at the authors institution
and sharing with colleagues.
Other uses, including reproduction and distribution, or selling orlicensing copies, or posting to personal, institutional or third party
websites are prohibited.
In most cases authors are permitted to post their version of thearticle (e.g. in Word or Tex form) to their personal website orinstitutional repository. Authors requiring further information
regarding Elsevier’s archiving and manuscript policies areencouraged to visit:
http://www.elsevier.com/copyright
Author's personal copy
Computational Biology and Chemistry 33 (2009) 312–324
Contents lists available at ScienceDirect
Computational Biology and Chemistry
journa l homepage: www.e lsev ier .com/ locate /compbio lchem
A multi-level model accounting for the effects of JAK2-STAT5 signal modulationin erythropoiesis
Xin Laia, Svetoslav Nikolovb, Olaf Wolkenhauera, Julio Veraa,∗
a Systems Biology and Bioinformatics Group, Department of Computer Science, University of Rostock, 18051 Rostock, Germanyb Institute of Mechanics and Biomechanics-BAS, Acad. G. Bonchev Str., Bl.4, 1113 Sofia, Bulgaria
a r t i c l e i n f o
Article history:Accepted 1 July 2009
Keywords:Systems biologySignalling pathwaysCell population dynamicsEpoAnaemiaLeukaemiaHypoxiaErythropoiesis
a b s t r a c t
We develop a multi-level model, using ordinary differential equations, based on quantitative experimentaldata, accounting for murine erythropoiesis. At the sub-cellular level, the model includes a description ofthe regulation of red blood cell differentiation through Epo-stimulated JAK2-STAT5 signalling activation,while at the cell population level the model describes the dynamics of (STAT5-mediated) red blood celldifferentiation from their progenitors. Furthermore, the model includes equations depicting the hypoxia-mediated regulation of hormone erythropoietin blood levels. Take all together, the model constitutes amulti-level, feedback loop-regulated biological system, involving processes in different organs and atdifferent organisational levels.
We use our model to investigate the effect of deregulation in the proteins involved in the JAK2-STAT5signalling pathway in red blood cells. Our analysis results suggest that down-regulation in any of the threesignalling system components affects the hematocrit level in an individual considerably. In addition, ouranalysis predicts that exogenous Epo injection (an already existing treatment for several blood diseases)may compensate the effects of single down-regulation of Epo hormone level, STAT5 or EpoR/JAK2 expres-sion level, and that it may be insufficient to counterpart a combined down-regulation of all the elementsin the JAK2-STAT5 signalling cascade.
© 2009 Elsevier Ltd. All rights reserved.
1. Background
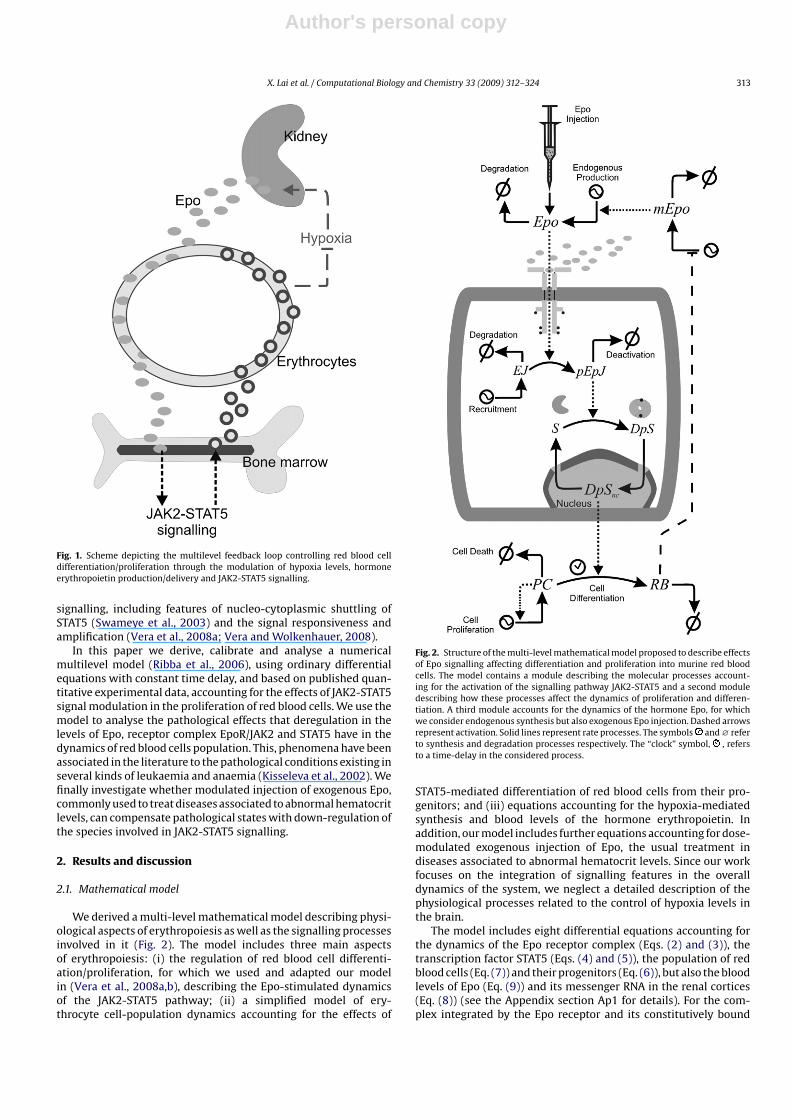
During erythropoiesis, hematopoietic stem cells (HSCs) differ-entiate into colony forming units (CFUs), the progenitors of maturered blood cells (erythrocytes) (Fisher, 2003). The overall processof differentiation and further proliferation is controlled througha multilevel feedback loop involving the oxygen levels in theorganism and modulated through the generation of hormone ery-thropoietin (Epo, synthesized mainly in the peritubular capillaryendothelial cells in the kidney) and subsequent transport and deliv-ery of Epo in the bone marrow, where HSC resides (Fig. 1). Thisfeedback loop ensures an adequate balance between productionof new red blood cells in the bone marrow, destruction of old-damaged ones in the spleen and the current necessity of oxygenin the body, in the mean while it can also balance homeostasis inthe levels of red blood cells against perturbations in the oxygensupply and injuries with loss of blood. Initiation of the JAK2-STAT5signalling pathway through the plasmatic membrane Epo receptor(EpoR) plays a major role in the control of erythropoiesis. When
∗ Corresponding author. Tel.: +49 381 498 76 81; fax: +49 381 498 75 72.E-mail address: [email protected] (J. Vera).URL: http://www.sbi.uni-rostock.de/calsys (J. Vera).
the hormone erythropoietin binds EpoR in non-differentiated cellsof the bone marrow, the protein JAK2 (constitutively associatedto the receptor) is activated and promotes the activation of EpoRthrough the phosphorylation of several tyrosine residues in thereceptor (Klingmüller, 1997). In subsequent steps, the transcriptionfactor STAT5 is recruited to the activated EpoR, is phosphory-lated, dimerises and gets activated. Once activated, dimerised STAT5translocates into the nucleus and promotes the transcription of sev-eral essential genes involved in the modulation of erythropoiesis(Jelkmann, 2004). The adequate function of the JAK2-STAT5 sig-nalling during erythropoiesis is crucial to ensure the success in thedifferentiation and maturation of red blood cells and recent resultssuggest that the pathway appears deregulated in certain kinds ofleukaemia (Kisseleva et al., 2002). From a physiological perspective,some experimental works suggest that deregulation in this systemmay induce long period oscillations in the circulating reticulocytecounts and erythropoietin levels (Chikkappa et al., 1976; Dale andHammond, 1988; Orr et al., 1968).
The mathematical modelling of relevant aspects of erythro-poiesis has been quite popular in the last decades, especially froma physiological perspective (Adimy and Crauste, 2004; Adimy etal., 2006; Bernard et al., 2003; Colijn and Mackey, 2005a, 2005b;Mackey, 1978; Mahaffy et al., 1998; Pujo-Menjouet and Mackey,2004). Others have investigated dynamical aspects of JAK2-STAT5
1476-9271/$ – see front matter © 2009 Elsevier Ltd. All rights reserved.doi:10.1016/j.compbiolchem.2009.07.003
Author's personal copy
X. Lai et al. / Computational Biology and Chemistry 33 (2009) 312–324 313
Fig. 1. Scheme depicting the multilevel feedback loop controlling red blood celldifferentiation/proliferation through the modulation of hypoxia levels, hormoneerythropoietin production/delivery and JAK2-STAT5 signalling.
signalling, including features of nucleo-cytoplasmic shuttling ofSTAT5 (Swameye et al., 2003) and the signal responsiveness andamplification (Vera et al., 2008a; Vera and Wolkenhauer, 2008).
In this paper we derive, calibrate and analyse a numericalmultilevel model (Ribba et al., 2006), using ordinary differentialequations with constant time delay, and based on published quan-titative experimental data, accounting for the effects of JAK2-STAT5signal modulation in the proliferation of red blood cells. We use themodel to analyse the pathological effects that deregulation in thelevels of Epo, receptor complex EpoR/JAK2 and STAT5 have in thedynamics of red blood cells population. This, phenomena have beenassociated in the literature to the pathological conditions existing inseveral kinds of leukaemia and anaemia (Kisseleva et al., 2002). Wefinally investigate whether modulated injection of exogenous Epo,commonly used to treat diseases associated to abnormal hematocritlevels, can compensate pathological states with down-regulation ofthe species involved in JAK2-STAT5 signalling.
2. Results and discussion
2.1. Mathematical model
We derived a multi-level mathematical model describing physi-ological aspects of erythropoiesis as well as the signalling processesinvolved in it (Fig. 2). The model includes three main aspectsof erythropoiesis: (i) the regulation of red blood cell differenti-ation/proliferation, for which we used and adapted our modelin (Vera et al., 2008a,b), describing the Epo-stimulated dynamicsof the JAK2-STAT5 pathway; (ii) a simplified model of ery-throcyte cell-population dynamics accounting for the effects of
Fig. 2. Structure of the multi-level mathematical model proposed to describe effectsof Epo signalling affecting differentiation and proliferation into murine red bloodcells. The model contains a module describing the molecular processes account-ing for the activation of the signalling pathway JAK2-STAT5 and a second moduledescribing how these processes affect the dynamics of proliferation and differen-tiation. A third module accounts for the dynamics of the hormone Epo, for whichwe consider endogenous synthesis but also exogenous Epo injection. Dashed arrowsrepresent activation. Solid lines represent rate processes. The symbols and∅ referto synthesis and degradation processes respectively. The “clock” symbol, , refersto a time-delay in the considered process.
STAT5-mediated differentiation of red blood cells from their pro-genitors; and (iii) equations accounting for the hypoxia-mediatedsynthesis and blood levels of the hormone erythropoietin. Inaddition, our model includes further equations accounting for dose-modulated exogenous injection of Epo, the usual treatment indiseases associated to abnormal hematocrit levels. Since our workfocuses on the integration of signalling features in the overalldynamics of the system, we neglect a detailed description of thephysiological processes related to the control of hypoxia levels inthe brain.
The model includes eight differential equations accounting forthe dynamics of the Epo receptor complex (Eqs. (2) and (3)), thetranscription factor STAT5 (Eqs. (4) and (5)), the population of redblood cells (Eq. (7)) and their progenitors (Eq. (6)), but also the bloodlevels of Epo (Eq. (9)) and its messenger RNA in the renal cortices(Eq. (8)) (see the Appendix section Ap1 for details). For the com-plex integrated by the Epo receptor and its constitutively bound
Author's personal copy
314 X. Lai et al. / Computational Biology and Chemistry 33 (2009) 312–324
protein JAK2, the model includes two state variables accounting fornon-activated receptor complex (EJ, Eq. (2)) without bounding ofEpo and Epo-bound activated EpoR/JAK2 complex (pEpJ, Eq. (3)). InVera et al. (2008a) we discussed the rational and consequences forthis simplification in the model. The signalling processes consid-ered in the model for the EpoR/JAK2 complex are: (i) Epo mediatedreceptor complex activation; (ii) EpoR/JAK2 complex deactivation;(iii) recruitment of new receptor complex to the plasma membrane;and (iv) degradation of non-activated EpoR/JAK2.
In case of the transcription factor STAT5, the two states consid-ered in the model account for the fraction of activated cytosolicSTAT5 (DpS, Eq. (4)) and activated nuclear STAT5 (DpSn, Eq. (5)).Furthermore, our model implicitly includes mass conservation inthe total amount of STAT5 accounting for the balance between tran-scription factor synthesis and degradation (Vera et al., 2008a). Thus,the fraction of non-activated cytosolic STAT5, S, is described by thealgebraic equation S = STOT − 2DpS − 2DpSnc with STOT referring tothe total amount of STAT5. The model includes the following STAT5signalling processes: (i) dimerisation and activation of STAT5 medi-ated by the activated EpoR/JAK2 complex; (ii) nuclear translocationof cytosolic dimeric activated STAT5; and (iii) deactivation, break ofthe dimeric configuration and subsequent cytosolic translocationof nuclear STAT5.
For the cell population dynamics level, the model includes astate for the population of red blood cells (RB) and another fortheir non-fully differentiated progenitors (PC). RB dynamics (Eq.(7)) involve terms for STAT5-mediated differentiation and depletionof aged erythrocytes. For cell progenitors dynamics (PC) we haveconsidered equations accounting for self-proliferation of progenitorcells, STAT5-mediated differentiation and self-regulated depletionof progenitors. We notice that the terms that we propose for PCproliferation and depletion are a special case of the logistic equa-tion (Gershenfeld, 1999) where the positive linear term accounts forthe proliferation of progenitor cells and the negative quadratic termrefers to the self-regulation of the PC population expansion due tothe limitations in space and resources happening in the niche forPC differentiation in the bone marrow.
To describe the dynamics of Epo, we have included state vari-ables accounting for blood levels of Epo (Epo) and for Epo messengerRNA levels in the renal cortices (mEpo). For mEpo dynamics (Eq. (8))we considered equations accounting for the RB-inhibited synthesisof messenger RNA and degradation of mEpo, while in case of Epo(Eq. (9)) we included terms accounting for mEpo-mediated synthe-sis of Epo and degradation of Epo. The term describing RB-inhibitedsynthesis of messenger RNA in Eq. (8) is a simplified representation
of the physiological feedback loop accounting for regulation of Eposynthesis by hypoxia levels on the assumption that changes in thelevels of RB has immediate effects on hypoxia levels, which in turnsmodulate the synthesis of mEpo (RB → Hypoxia → mEpo). We noticethat the model considers also a potential exogenous injection ofEpo (Epoinj) in a way that the total Epo level available for recep-tor complex activation includes the endogenous and exogenouscontributions (EpoTOT = Epo + Epoinj, Eqs. (2) and (3)).
The simplistic description of some processes suggests the inclu-sion of time-delays in the model equations (Elsgolz and Norkin,1974; Nikolov et al., 2008). Our previous results with a simplifiedqualitative version of this model in human (Nikolov et al., submittedfor publication) suggested that a time-delay accounting for thedelayed differentiation of the red blood cells from progenitors mayhave relevant dynamical consequences and therefore we includedit in our model (�, Eq. (7)). In the following, we assume a value of� = 48 h in accordance with Wu et al. (1995).
Finally, in our model we applied the strategy to derived simpli-fied power-law models (Voit, 2000) that we previously discussedin Vera et al. (2007a) and tested in Nikolov et al. (2009), Vera et al.(2008a,b). Thus, we used power-law terms with non-integer kineticorders only for the highly non-linear aggregated terms, in our casethe RB-inhibited synthesis of messenger RNA (Eq. (8)). Model vari-ables are in arbitrary units excepting Epo (mU/ml) and RB (given innormalised hematocrit, fraction of blood volume occupied by redblood cells).
2.2. Model calibration
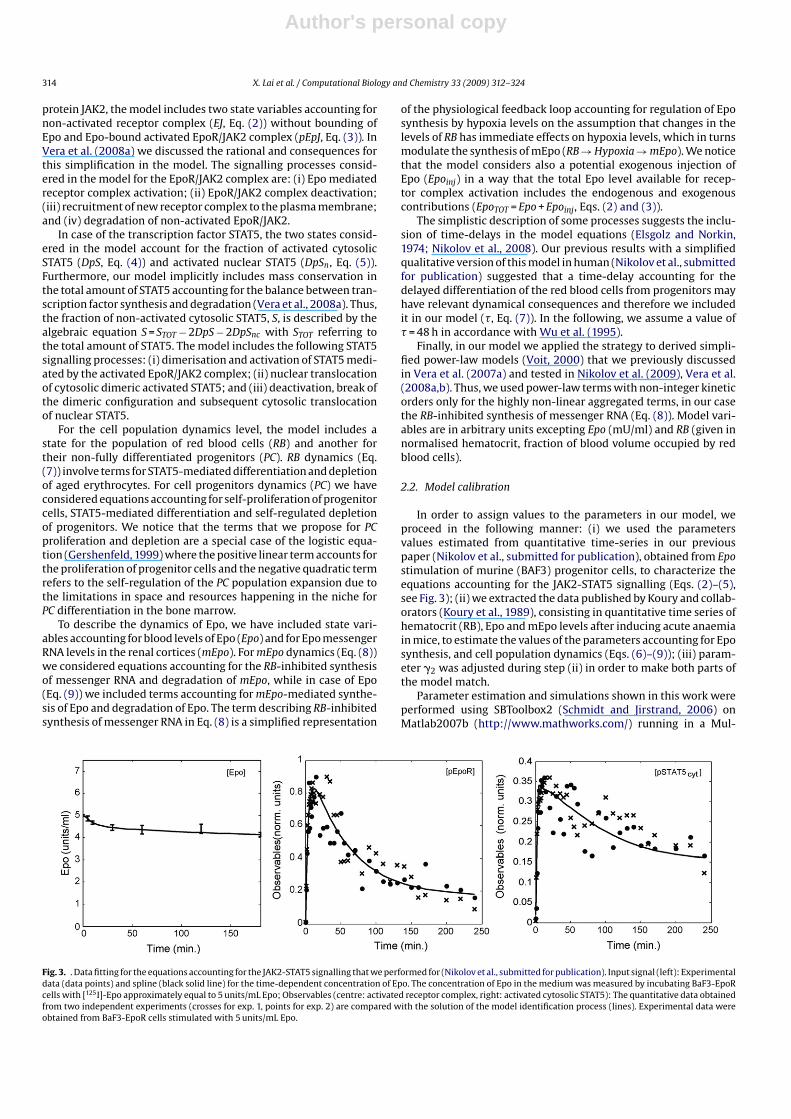
In order to assign values to the parameters in our model, weproceed in the following manner: (i) we used the parametersvalues estimated from quantitative time-series in our previouspaper (Nikolov et al., submitted for publication), obtained from Epostimulation of murine (BAF3) progenitor cells, to characterize theequations accounting for the JAK2-STAT5 signalling (Eqs. (2)–(5),see Fig. 3); (ii) we extracted the data published by Koury and collab-orators (Koury et al., 1989), consisting in quantitative time series ofhematocrit (RB), Epo and mEpo levels after inducing acute anaemiain mice, to estimate the values of the parameters accounting for Eposynthesis, and cell population dynamics (Eqs. (6)–(9)); (iii) param-eter �2 was adjusted during step (ii) in order to make both parts ofthe model match.
Parameter estimation and simulations shown in this work wereperformed using SBToolbox2 (Schmidt and Jirstrand, 2006) onMatlab2007b (http://www.mathworks.com/) running in a Mul-
Fig. 3. . Data fitting for the equations accounting for the JAK2-STAT5 signalling that we performed for (Nikolov et al., submitted for publication). Input signal (left): Experimentaldata (data points) and spline (black solid line) for the time-dependent concentration of Epo. The concentration of Epo in the medium was measured by incubating BaF3-EpoRcells with [125I]-Epo approximately equal to 5 units/mL Epo; Observables (centre: activated receptor complex, right: activated cytosolic STAT5): The quantitative data obtainedfrom two independent experiments (crosses for exp. 1, points for exp. 2) are compared with the solution of the model identification process (lines). Experimental data wereobtained from BaF3-EpoR cells stimulated with 5 units/mL Epo.
Author's personal copy
X. Lai et al. / Computational Biology and Chemistry 33 (2009) 312–324 315
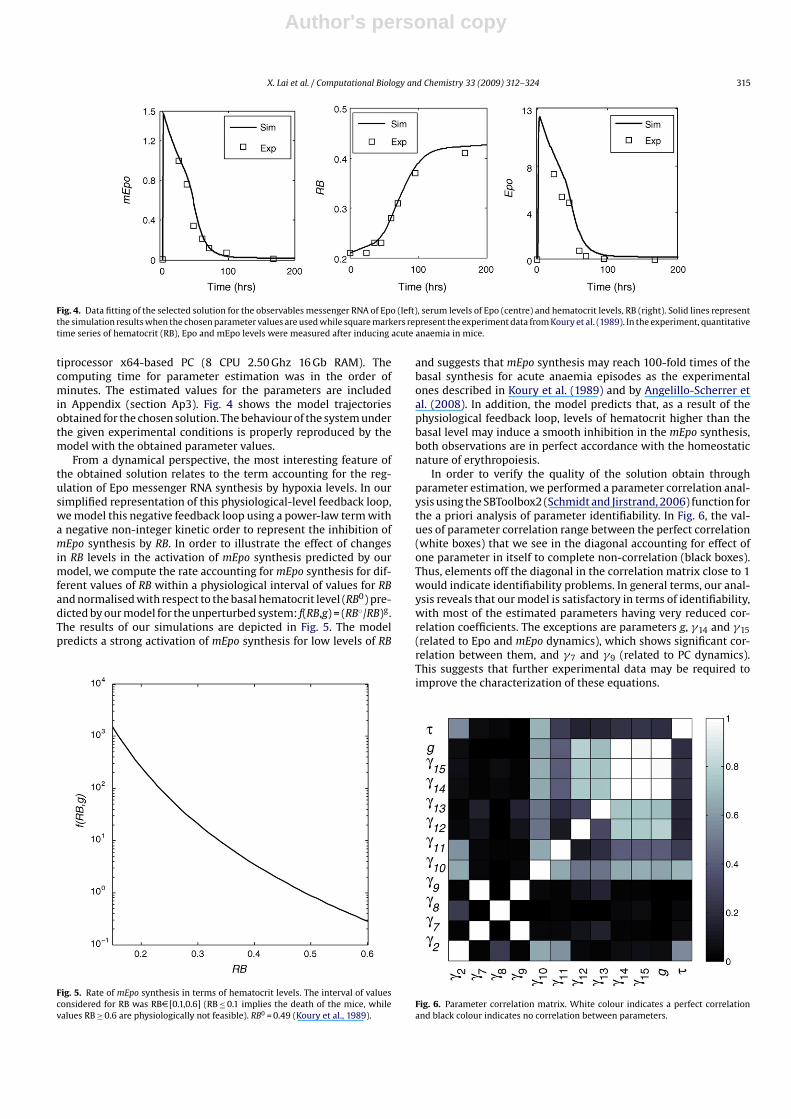
Fig. 4. Data fitting of the selected solution for the observables messenger RNA of Epo (left), serum levels of Epo (centre) and hematocrit levels, RB (right). Solid lines representthe simulation results when the chosen parameter values are used while square markers represent the experiment data from Koury et al. (1989). In the experiment, quantitativetime series of hematocrit (RB), Epo and mEpo levels were measured after inducing acute anaemia in mice.
tiprocessor x64-based PC (8 CPU 2.50 Ghz 16 Gb RAM). Thecomputing time for parameter estimation was in the order ofminutes. The estimated values for the parameters are includedin Appendix (section Ap3). Fig. 4 shows the model trajectoriesobtained for the chosen solution. The behaviour of the system underthe given experimental conditions is properly reproduced by themodel with the obtained parameter values.
From a dynamical perspective, the most interesting feature ofthe obtained solution relates to the term accounting for the reg-ulation of Epo messenger RNA synthesis by hypoxia levels. In oursimplified representation of this physiological-level feedback loop,we model this negative feedback loop using a power-law term witha negative non-integer kinetic order to represent the inhibition ofmEpo synthesis by RB. In order to illustrate the effect of changesin RB levels in the activation of mEpo synthesis predicted by ourmodel, we compute the rate accounting for mEpo synthesis for dif-ferent values of RB within a physiological interval of values for RBand normalised with respect to the basal hematocrit level (RB0) pre-dicted by our model for the unperturbed system: f(RB,g) = (RB◦/RB)g.The results of our simulations are depicted in Fig. 5. The modelpredicts a strong activation of mEpo synthesis for low levels of RB
Fig. 5. Rate of mEpo synthesis in terms of hematocrit levels. The interval of valuesconsidered for RB was RBD [0.1,0.6] (RB ≤ 0.1 implies the death of the mice, whilevalues RB ≥ 0.6 are physiologically not feasible). RB0 = 0.49 (Koury et al., 1989).
and suggests that mEpo synthesis may reach 100-fold times of thebasal synthesis for acute anaemia episodes as the experimentalones described in Koury et al. (1989) and by Angelillo-Scherrer etal. (2008). In addition, the model predicts that, as a result of thephysiological feedback loop, levels of hematocrit higher than thebasal level may induce a smooth inhibition in the mEpo synthesis,both observations are in perfect accordance with the homeostaticnature of erythropoiesis.
In order to verify the quality of the solution obtain throughparameter estimation, we performed a parameter correlation anal-ysis using the SBToolbox2 (Schmidt and Jirstrand, 2006) function forthe a priori analysis of parameter identifiability. In Fig. 6, the val-ues of parameter correlation range between the perfect correlation(white boxes) that we see in the diagonal accounting for effect ofone parameter in itself to complete non-correlation (black boxes).Thus, elements off the diagonal in the correlation matrix close to 1would indicate identifiability problems. In general terms, our anal-ysis reveals that our model is satisfactory in terms of identifiability,with most of the estimated parameters having very reduced cor-relation coefficients. The exceptions are parameters g, �14 and �15(related to Epo and mEpo dynamics), which shows significant cor-relation between them, and �7 and �9 (related to PC dynamics).This suggests that further experimental data may be required toimprove the characterization of these equations.
Fig. 6. Parameter correlation matrix. White colour indicates a perfect correlationand black colour indicates no correlation between parameters.
Author's personal copy
316 X. Lai et al. / Computational Biology and Chemistry 33 (2009) 312–324
2.3. Predictive simulations
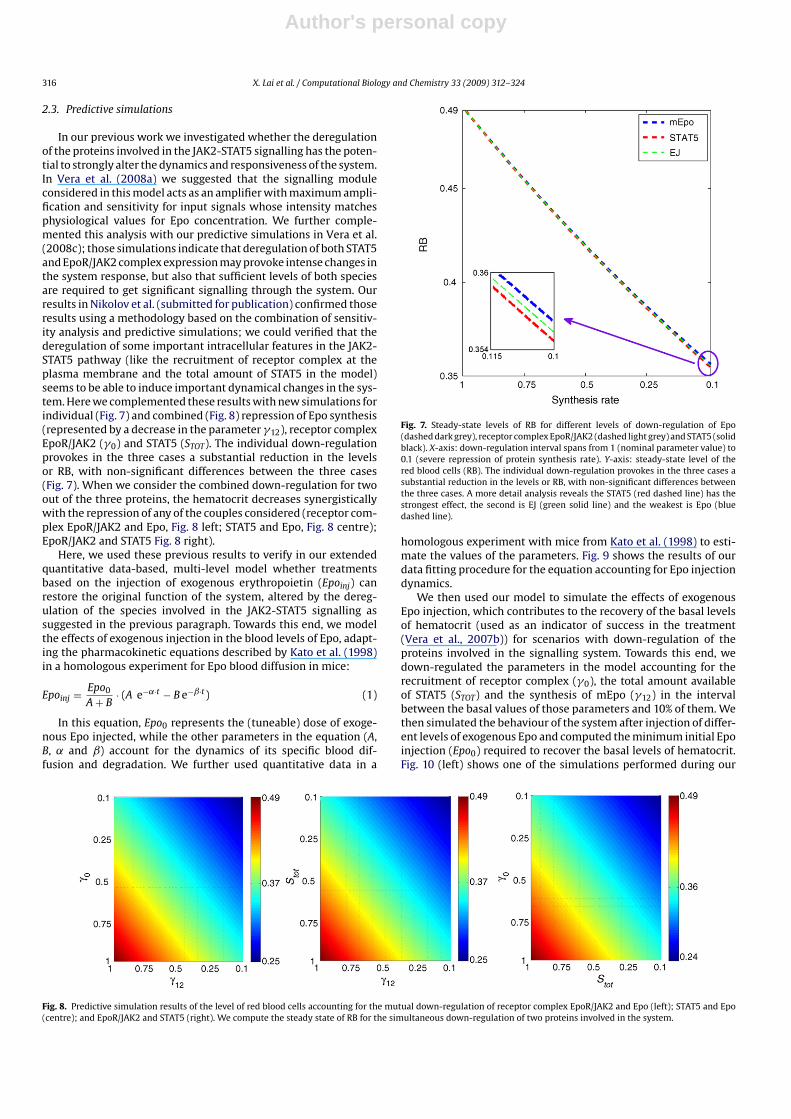
In our previous work we investigated whether the deregulationof the proteins involved in the JAK2-STAT5 signalling has the poten-tial to strongly alter the dynamics and responsiveness of the system.In Vera et al. (2008a) we suggested that the signalling moduleconsidered in this model acts as an amplifier with maximum ampli-fication and sensitivity for input signals whose intensity matchesphysiological values for Epo concentration. We further comple-mented this analysis with our predictive simulations in Vera et al.(2008c); those simulations indicate that deregulation of both STAT5and EpoR/JAK2 complex expression may provoke intense changes inthe system response, but also that sufficient levels of both speciesare required to get significant signalling through the system. Ourresults in Nikolov et al. (submitted for publication) confirmed thoseresults using a methodology based on the combination of sensitiv-ity analysis and predictive simulations; we could verified that thederegulation of some important intracellular features in the JAK2-STAT5 pathway (like the recruitment of receptor complex at theplasma membrane and the total amount of STAT5 in the model)seems to be able to induce important dynamical changes in the sys-tem. Here we complemented these results with new simulations forindividual (Fig. 7) and combined (Fig. 8) repression of Epo synthesis(represented by a decrease in the parameter �12), receptor complexEpoR/JAK2 (�0) and STAT5 (STOT). The individual down-regulationprovokes in the three cases a substantial reduction in the levelsor RB, with non-significant differences between the three cases(Fig. 7). When we consider the combined down-regulation for twoout of the three proteins, the hematocrit decreases synergisticallywith the repression of any of the couples considered (receptor com-plex EpoR/JAK2 and Epo, Fig. 8 left; STAT5 and Epo, Fig. 8 centre);EpoR/JAK2 and STAT5 Fig. 8 right).
Here, we used these previous results to verify in our extendedquantitative data-based, multi-level model whether treatmentsbased on the injection of exogenous erythropoietin (Epoinj) canrestore the original function of the system, altered by the dereg-ulation of the species involved in the JAK2-STAT5 signalling assuggested in the previous paragraph. Towards this end, we modelthe effects of exogenous injection in the blood levels of Epo, adapt-ing the pharmacokinetic equations described by Kato et al. (1998)in a homologous experiment for Epo blood diffusion in mice:
Epoinj = Epo0
A + B· (A e−˛·t − B e−ˇ·t) (1)
In this equation, Epo0 represents the (tuneable) dose of exoge-nous Epo injected, while the other parameters in the equation (A,B, ˛ and ˇ) account for the dynamics of its specific blood dif-fusion and degradation. We further used quantitative data in a
Fig. 7. Steady-state levels of RB for different levels of down-regulation of Epo(dashed dark grey), receptor complex EpoR/JAK2 (dashed light grey) and STAT5 (solidblack). X-axis: down-regulation interval spans from 1 (nominal parameter value) to0.1 (severe repression of protein synthesis rate). Y-axis: steady-state level of thered blood cells (RB). The individual down-regulation provokes in the three cases asubstantial reduction in the levels or RB, with non-significant differences betweenthe three cases. A more detail analysis reveals the STAT5 (red dashed line) has thestrongest effect, the second is EJ (green solid line) and the weakest is Epo (bluedashed line).
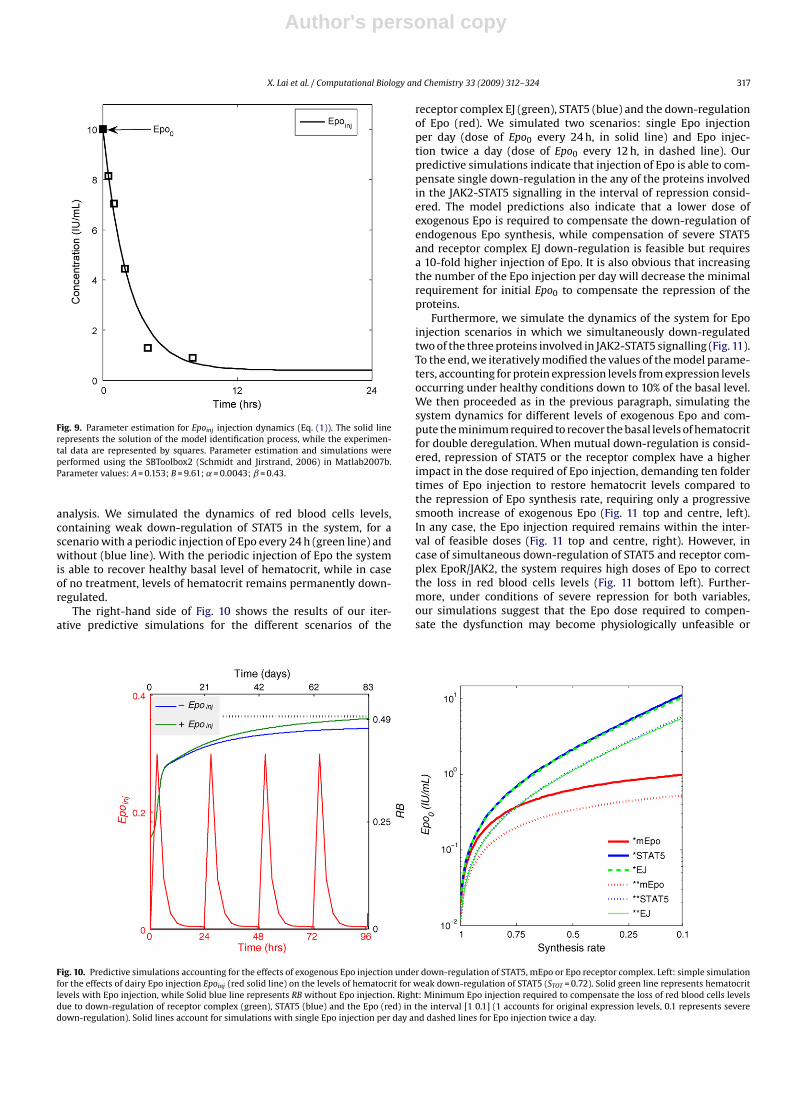
homologous experiment with mice from Kato et al. (1998) to esti-mate the values of the parameters. Fig. 9 shows the results of ourdata fitting procedure for the equation accounting for Epo injectiondynamics.
We then used our model to simulate the effects of exogenousEpo injection, which contributes to the recovery of the basal levelsof hematocrit (used as an indicator of success in the treatment(Vera et al., 2007b)) for scenarios with down-regulation of theproteins involved in the signalling system. Towards this end, wedown-regulated the parameters in the model accounting for therecruitment of receptor complex (�0), the total amount availableof STAT5 (STOT) and the synthesis of mEpo (�12) in the intervalbetween the basal values of those parameters and 10% of them. Wethen simulated the behaviour of the system after injection of differ-ent levels of exogenous Epo and computed the minimum initial Epoinjection (Epo0) required to recover the basal levels of hematocrit.Fig. 10 (left) shows one of the simulations performed during our
Fig. 8. Predictive simulation results of the level of red blood cells accounting for the mutual down-regulation of receptor complex EpoR/JAK2 and Epo (left); STAT5 and Epo(centre); and EpoR/JAK2 and STAT5 (right). We compute the steady state of RB for the simultaneous down-regulation of two proteins involved in the system.
Author's personal copy
X. Lai et al. / Computational Biology and Chemistry 33 (2009) 312–324 317
Fig. 9. Parameter estimation for Epoinj injection dynamics (Eq. (1)). The solid linerepresents the solution of the model identification process, while the experimen-tal data are represented by squares. Parameter estimation and simulations wereperformed using the SBToolbox2 (Schmidt and Jirstrand, 2006) in Matlab2007b.Parameter values: A = 0.153; B = 9.61; ˛ = 0.0043; ˇ = 0.43.
analysis. We simulated the dynamics of red blood cells levels,containing weak down-regulation of STAT5 in the system, for ascenario with a periodic injection of Epo every 24 h (green line) andwithout (blue line). With the periodic injection of Epo the systemis able to recover healthy basal level of hematocrit, while in caseof no treatment, levels of hematocrit remains permanently down-regulated.
The right-hand side of Fig. 10 shows the results of our iter-ative predictive simulations for the different scenarios of the
receptor complex EJ (green), STAT5 (blue) and the down-regulationof Epo (red). We simulated two scenarios: single Epo injectionper day (dose of Epo0 every 24 h, in solid line) and Epo injec-tion twice a day (dose of Epo0 every 12 h, in dashed line). Ourpredictive simulations indicate that injection of Epo is able to com-pensate single down-regulation in the any of the proteins involvedin the JAK2-STAT5 signalling in the interval of repression consid-ered. The model predictions also indicate that a lower dose ofexogenous Epo is required to compensate the down-regulation ofendogenous Epo synthesis, while compensation of severe STAT5and receptor complex EJ down-regulation is feasible but requiresa 10-fold higher injection of Epo. It is also obvious that increasingthe number of the Epo injection per day will decrease the minimalrequirement for initial Epo0 to compensate the repression of theproteins.
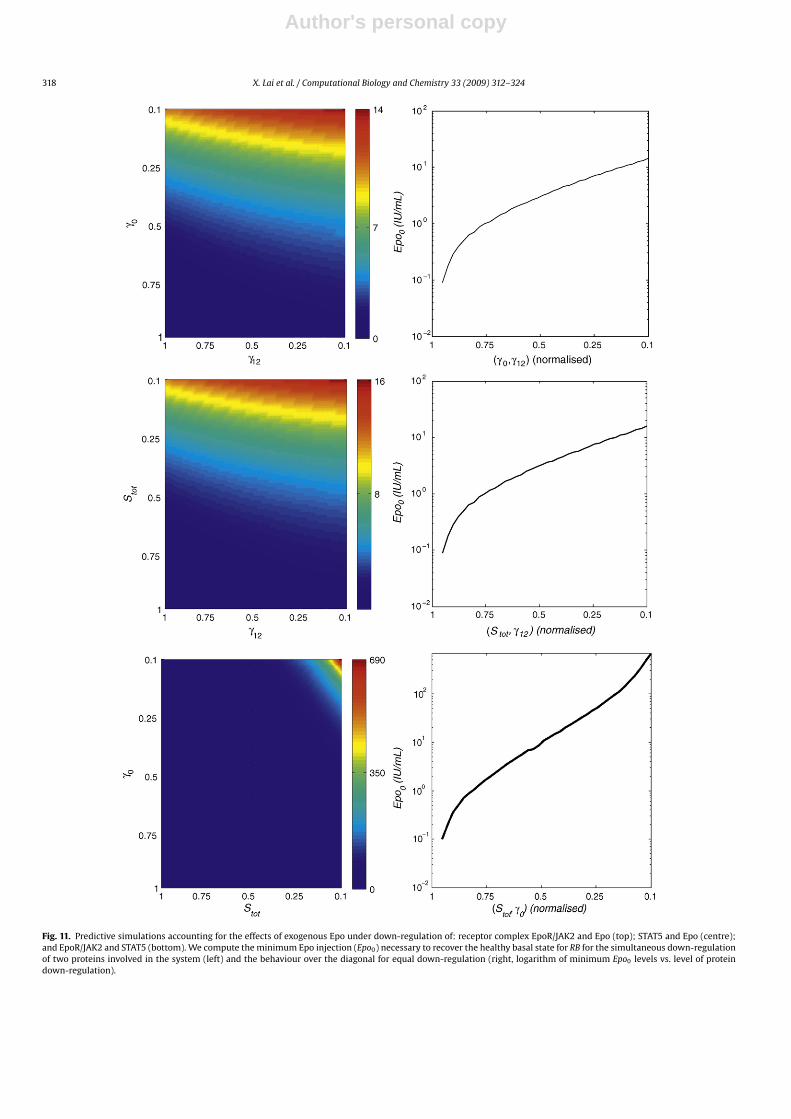
Furthermore, we simulate the dynamics of the system for Epoinjection scenarios in which we simultaneously down-regulatedtwo of the three proteins involved in JAK2-STAT5 signalling (Fig. 11).To the end, we iteratively modified the values of the model parame-ters, accounting for protein expression levels from expression levelsoccurring under healthy conditions down to 10% of the basal level.We then proceeded as in the previous paragraph, simulating thesystem dynamics for different levels of exogenous Epo and com-pute the minimum required to recover the basal levels of hematocritfor double deregulation. When mutual down-regulation is consid-ered, repression of STAT5 or the receptor complex have a higherimpact in the dose required of Epo injection, demanding ten foldertimes of Epo injection to restore hematocrit levels compared tothe repression of Epo synthesis rate, requiring only a progressivesmooth increase of exogenous Epo (Fig. 11 top and centre, left).In any case, the Epo injection required remains within the inter-val of feasible doses (Fig. 11 top and centre, right). However, incase of simultaneous down-regulation of STAT5 and receptor com-plex EpoR/JAK2, the system requires high doses of Epo to correctthe loss in red blood cells levels (Fig. 11 bottom left). Further-more, under conditions of severe repression for both variables,our simulations suggest that the Epo dose required to compen-sate the dysfunction may become physiologically unfeasible or
Fig. 10. Predictive simulations accounting for the effects of exogenous Epo injection under down-regulation of STAT5, mEpo or Epo receptor complex. Left: simple simulationfor the effects of dairy Epo injection Epoinj (red solid line) on the levels of hematocrit for weak down-regulation of STAT5 (STOT = 0.72). Solid green line represents hematocritlevels with Epo injection, while Solid blue line represents RB without Epo injection. Right: Minimum Epo injection required to compensate the loss of red blood cells levelsdue to down-regulation of receptor complex (green), STAT5 (blue) and the Epo (red) in the interval [1 0.1] (1 accounts for original expression levels, 0.1 represents severedown-regulation). Solid lines account for simulations with single Epo injection per day and dashed lines for Epo injection twice a day.
Author's personal copy
318 X. Lai et al. / Computational Biology and Chemistry 33 (2009) 312–324
Fig. 11. Predictive simulations accounting for the effects of exogenous Epo under down-regulation of: receptor complex EpoR/JAK2 and Epo (top); STAT5 and Epo (centre);and EpoR/JAK2 and STAT5 (bottom). We compute the minimum Epo injection (Epo0) necessary to recover the healthy basal state for RB for the simultaneous down-regulationof two proteins involved in the system (left) and the behaviour over the diagonal for equal down-regulation (right, logarithm of minimum Epo0 levels vs. level of proteindown-regulation).
Author's personal copy
X. Lai et al. / Computational Biology and Chemistry 33 (2009) 312–324 319
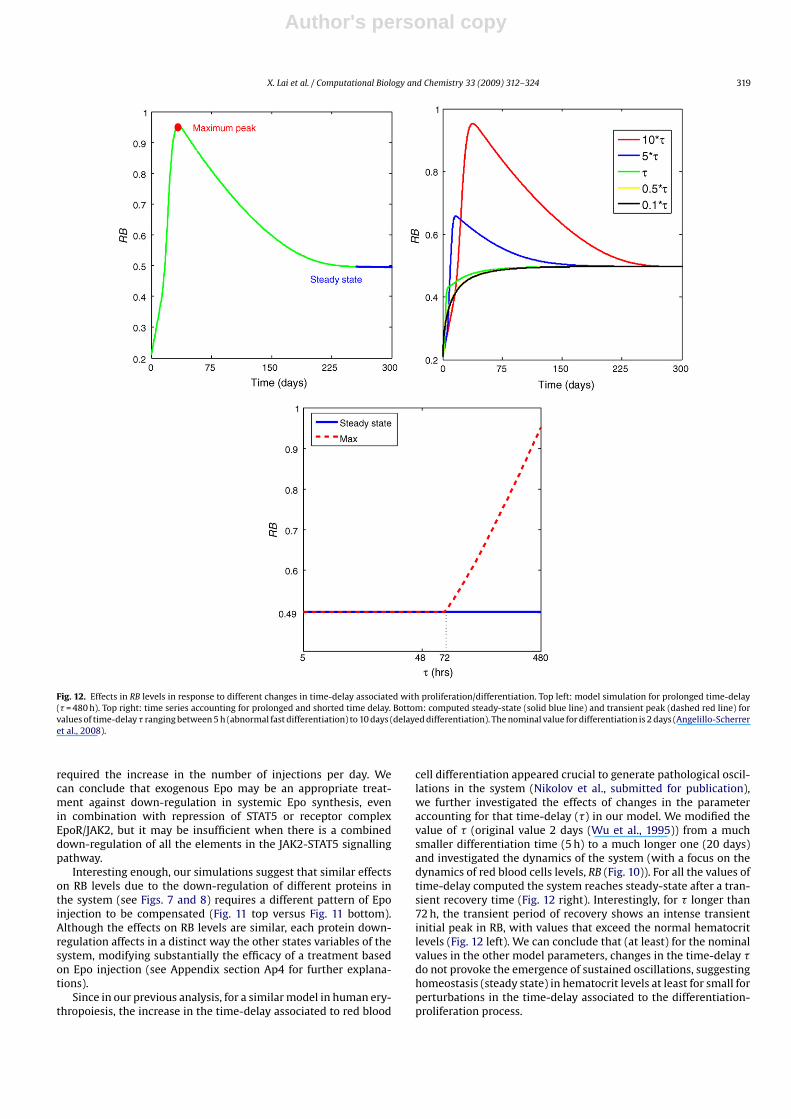
Fig. 12. Effects in RB levels in response to different changes in time-delay associated with proliferation/differentiation. Top left: model simulation for prolonged time-delay(� = 480 h). Top right: time series accounting for prolonged and shorted time delay. Bottom: computed steady-state (solid blue line) and transient peak (dashed red line) forvalues of time-delay � ranging between 5 h (abnormal fast differentiation) to 10 days (delayed differentiation). The nominal value for differentiation is 2 days (Angelillo-Scherreret al., 2008).
required the increase in the number of injections per day. Wecan conclude that exogenous Epo may be an appropriate treat-ment against down-regulation in systemic Epo synthesis, evenin combination with repression of STAT5 or receptor complexEpoR/JAK2, but it may be insufficient when there is a combineddown-regulation of all the elements in the JAK2-STAT5 signallingpathway.
Interesting enough, our simulations suggest that similar effectson RB levels due to the down-regulation of different proteins inthe system (see Figs. 7 and 8) requires a different pattern of Epoinjection to be compensated (Fig. 11 top versus Fig. 11 bottom).Although the effects on RB levels are similar, each protein down-regulation affects in a distinct way the other states variables of thesystem, modifying substantially the efficacy of a treatment basedon Epo injection (see Appendix section Ap4 for further explana-tions).
Since in our previous analysis, for a similar model in human ery-thropoiesis, the increase in the time-delay associated to red blood
cell differentiation appeared crucial to generate pathological oscil-lations in the system (Nikolov et al., submitted for publication),we further investigated the effects of changes in the parameteraccounting for that time-delay (�) in our model. We modified thevalue of � (original value 2 days (Wu et al., 1995)) from a muchsmaller differentiation time (5 h) to a much longer one (20 days)and investigated the dynamics of the system (with a focus on thedynamics of red blood cells levels, RB (Fig. 10)). For all the values oftime-delay computed the system reaches steady-state after a tran-sient recovery time (Fig. 12 right). Interestingly, for � longer than72 h, the transient period of recovery shows an intense transientinitial peak in RB, with values that exceed the normal hematocritlevels (Fig. 12 left). We can conclude that (at least) for the nominalvalues in the other model parameters, changes in the time-delay �do not provoke the emergence of sustained oscillations, suggestinghomeostasis (steady state) in hematocrit levels at least for small forperturbations in the time-delay associated to the differentiation-proliferation process.
Author's personal copy
320 X. Lai et al. / Computational Biology and Chemistry 33 (2009) 312–324
3. Conclusions
The aim of this work was to derive, calibrate and analysea multi-level model, using ordinary differential equations withdistributed time delay, and based on quantitative experimen-tal data, the model integrates the mathematical description ofintra-cellular signalling processes with cell population dynamicsof murine red blood cells proliferation (erythropoiesis). Towardsthis end, we derived equations accounting for (a) the Epo-stimulated activation of the JAK2-STAT5 signalling pathway inthe red blood cell progenitors of the bone marrow; (b) STAT5-mediated differentiation of progenitors into red blood cells; and (c)hypoxia-mediated regulation of the hormone erythropoietin bloodlevels. The integration of these three modules constitutes a multi-level, autonomous and feedback loop-regulated biological system,involving processes in different body organs and different organi-sational levels.
With the multi-level predictive abilities of the proposed math-ematical model, we analysed the effects in the hematocrit levels ofthe deregulation in any of the proteins involved in the JAK2-STAT5signalling pathway (either the renal synthesis Epo hormone or thesub-cellular level receptor complex EpoR/JAK2 and the transcrip-tion factor STAT5), a phenomena associated with the pathologicalconditions existing in several kinds of leukaemia and anaemia(Kisseleva et al., 2002). Our analysis suggests that down-regulationof any of the three system components may affect considerably thehematocrit levels of an individual.
In order to compensate the discussed hematocrit reduction, wehave simulated the effect of a modulated injection of exogenous Epoand analysed whether those externally controlled Epo injections,commonly used to treat diseases associated to abnormal hematocritlevels, can compensate pathological states with down-regulationof the species involved in JAK2-STAT5 signalling pathway. Towardsthis end, we expanded our model including additional equationsaccounting for dose-modulated exogenous injection of Epo. Frommathematical point of view, this is an example of external pertur-bation. As a result of our simulations and analysis we can concludethat Epo injection may compensate the severe reduction of Epo hor-mone levels, or the individual repression of intra-cellular STAT5 orreceptor complex EpoR/JAK2 levels (up to 10% of the nominal val-ues for the rate constants, in case of Epo and EpoR/JAK2, or totalamount, case of STAT5). Moreover, the model predicts that dailyinjections of Epo may be a feasible strategy to compensate theeffects of combined down-regulation of Epo and STAT5 (or of Epoand EpoR/JAK2 levels), but it may be insufficient when there is acombined down-regulation of all the elements in the JAK2-STAT5signalling cascade, which would require physiologically unfeasibledoses of Epo injection.
In our future work we want to expand the model to con-sider in greater detail processes involved at the physiologicallevel, but also the effect of concurrent signalling pathway mediat-ing erythropoiesis. A detailed description of the intracellular andphysiological processes related to the control of hypoxia levelsin the brain may improve the predictive abilities of our model.In addition, a better characterisation of the model to account forother (parallel or cross-talked) signalling pathways involved in theproliferation–differentiation process will help us get more insightsinto the critical cellular processes controlling erythropoiesis and/orprovoking the abnormal conditions associated to several bloodpathologies.
Based on our experiences in this work, our opinion is that thiskind of multi-level models, integrating intracellular biochemicalnetworks (cell signalling, metabolism and/or gene transcription),together with their effects in cell population dynamics andtissue organisation, will be a very useful method in the com-ing phases of the development of Systems Biology, in which
increasing amounts of complex multi-level data will require inte-gration. The main outcome of that multi-level data integrationstrategy through mathematical modelling will be the improvementin the design of experiments and the reduction of the experimen-tal effort necessary to obtain a complete characterisation (fromthe molecular level to the tissue organisation) of biological pro-cesses. But these models will be especially useful for the detection ofemergent multi-level phenomena, crucial from a biomedical pointof view, which cannot be detected using a single-level perspec-tive.
Acknowledgements
Fig. 3 and its figure caption were taken and modify from ourprevious work (Vera et al., 2008a) under the terms of Open AccessLicense. J.V., X.L and S.N. designed the study and set up the math-ematical model. X.L. performed the calculations concerning thepredictive simulations. The biological interpretation of the resultswas conducted by J.V. Finally, all the authors including O.W. draftedthe manuscript. This work was supported by the German Fed-eral Ministry of Education and Research (BMBF) as part of theproject CALSYS-FORSYS under contract 0315264 (www.sbi.uni-rostock.de/calsys). S.N. is supported by DAAD-Bulgarian NationalScience Fund project DO02-23/05.3.2009.
Appendix A.
A.1. Model equations
d
dtEJ = �0 − �2 · EJ · (Epo + Epoinj) − �1 · EJ (2)
d
dtpEpJ = �2 · EJ · (Epo + Epoinj) − �3 · pEpJ (3)
d
dtDpS = �5 · (STOT − 2 · DpS − 2 · DpSnc) · pEpJ − �6 · DpS (4)
d
dtDpSnc = �6 · DpS − �4 · DpSnc (5)
d
dtPC = �7 · PC − �8 · PC · DpSnc − �9 · PC2 (6)
d
dtRB = �10 · PC(t − �) · DpSnc(t − �) − �11 · RB (7)
d
dtmEpo = �12
RBg− �13 · mEpo (8)
d
dtEpo = �14 · mEpo − �15 · Epo (9)
A.2. Model variables
EJ Non-activated receptor complex EpoR/JAK2pEpJ Epo-bound activated EpoR/JAK2 complexDpS Activated cytosolic STAT5DpSn Activated nuclear STAT5STOT Total amount of STAT5PC Red blood progenitor cell levelsRB Cells levels (hematocrit)mEpo Levels of Epo messenger RNA in the renal corticesEpo Blood levels of erythropoietin, Epo
Author's personal copy
X. Lai et al. / Computational Biology and Chemistry 33 (2009) 312–324 321
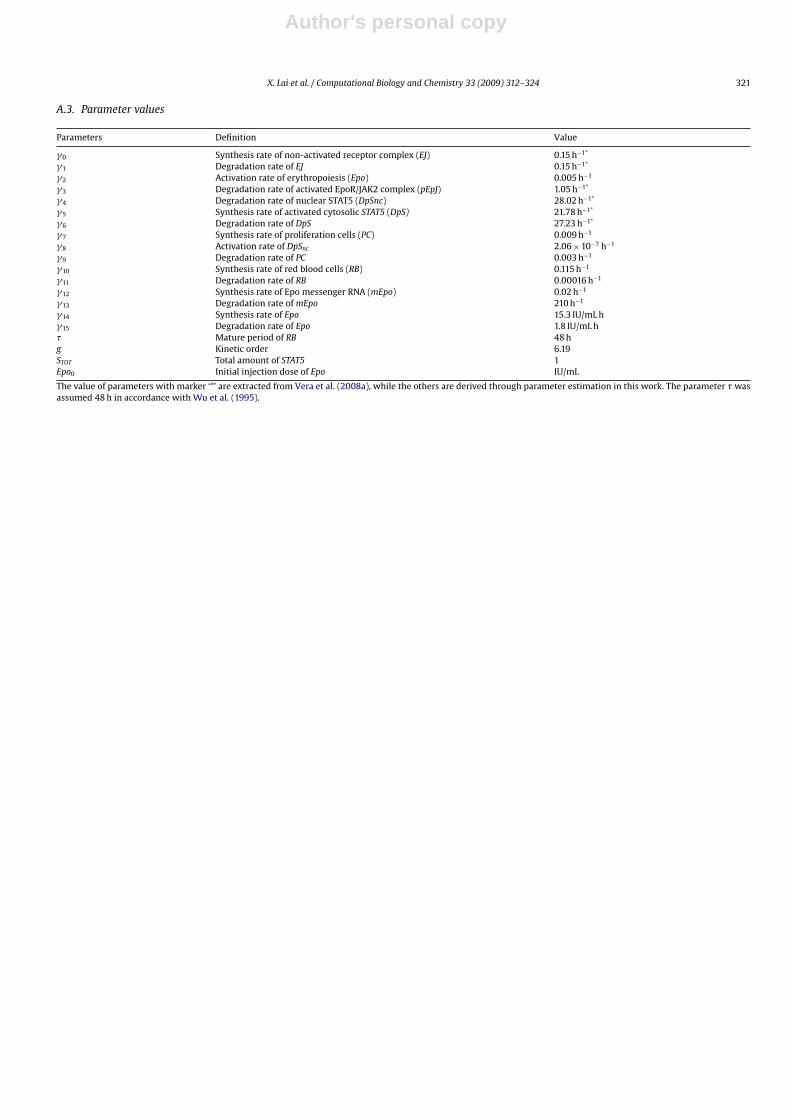
A.3. Parameter values
Parameters Definition Value
�0 Synthesis rate of non-activated receptor complex (EJ) 0.15 h−1*
�1 Degradation rate of EJ 0.15 h−1*
�2 Activation rate of erythropoiesis (Epo) 0.005 h−1
�3 Degradation rate of activated EpoR/JAK2 complex (pEpJ) 1.05 h−1*
�4 Degradation rate of nuclear STAT5 (DpSnc) 28.02 h−1*
�5 Synthesis rate of activated cytosolic STAT5 (DpS) 21.78 h−1*
�6 Degradation rate of DpS 27.23 h−1*
�7 Synthesis rate of proliferation cells (PC) 0.009 h−1
�8 Activation rate of DpSnc 2.06 × 10⁻⁷ h−1
�9 Degradation rate of PC 0.003 h−1
�10 Synthesis rate of red blood cells (RB) 0.115 h−1
�11 Degradation rate of RB 0.00016 h−1
�12 Synthesis rate of Epo messenger RNA (mEpo) 0.02 h−1
�13 Degradation rate of mEpo 210 h−1
�14 Synthesis rate of Epo 15.3 IU/mL h�15 Degradation rate of Epo 1.8 IU/mL h� Mature period of RB 48 hg Kinetic order 6.19STOT Total amount of STAT5 1Epo0 Initial injection dose of Epo IU/mL
The value of parameters with marker ‘*’ are extracted from Vera et al. (2008a), while the others are derived through parameter estimation in this work. The parameter � wasassumed 48 h in accordance with Wu et al. (1995).
Author's personal copy
322 X. Lai et al. / Computational Biology and Chemistry 33 (2009) 312–324
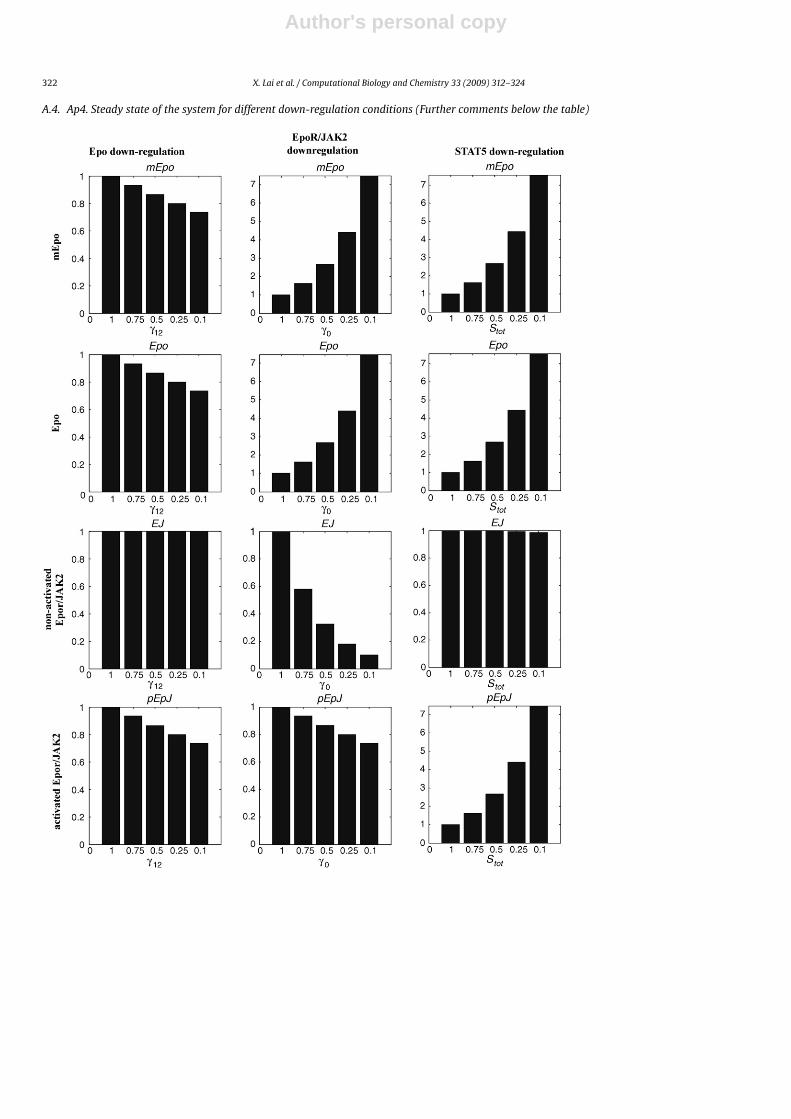
A.4. Ap4. Steady state of the system for different down-regulation conditions (Further comments below the table)
Author's personal copy
X. Lai et al. / Computational Biology and Chemistry 33 (2009) 312–324 323
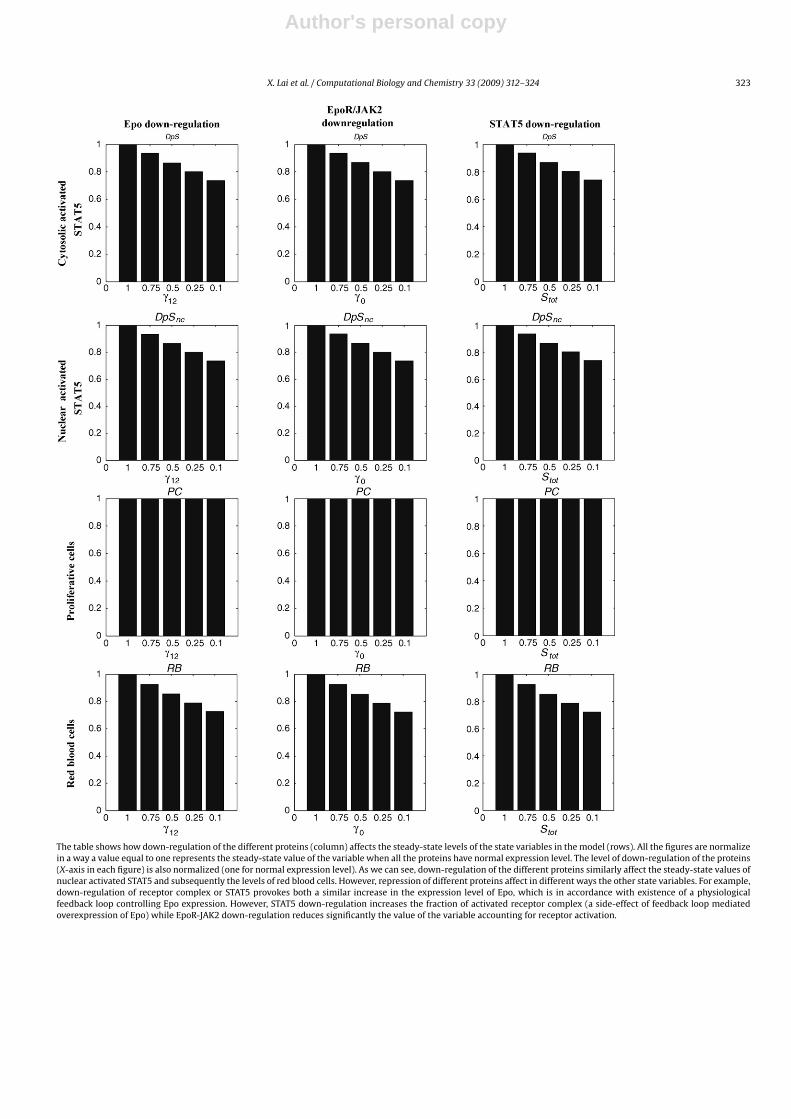
The table shows how down-regulation of the different proteins (column) affects the steady-state levels of the state variables in the model (rows). All the figures are normalizein a way a value equal to one represents the steady-state value of the variable when all the proteins have normal expression level. The level of down-regulation of the proteins(X-axis in each figure) is also normalized (one for normal expression level). As we can see, down-regulation of the different proteins similarly affect the steady-state values ofnuclear activated STAT5 and subsequently the levels of red blood cells. However, repression of different proteins affect in different ways the other state variables. For example,down-regulation of receptor complex or STAT5 provokes both a similar increase in the expression level of Epo, which is in accordance with existence of a physiologicalfeedback loop controlling Epo expression. However, STAT5 down-regulation increases the fraction of activated receptor complex (a side-effect of feedback loop mediatedoverexpression of Epo) while EpoR-JAK2 down-regulation reduces significantly the value of the variable accounting for receptor activation.
Author's personal copy
324 X. Lai et al. / Computational Biology and Chemistry 33 (2009) 312–324
References
Adimy, M., Crauste, F., 2004. Stability and instability induced by time delay in an ery-thropoiesis model. Monografias del Seminario Matematico Garcia de Galdeano31, 3–12.
Adimy, M., Crauste, F., Ruan, Sh., 2006. Modelling hematopoiesis mediated by growthfactors with applications to periodic hematological diseases. Bull. Math. Biol. 68(8), 2321–2351.
Angelillo-Scherrer, A., Burnier, L., Lambrechts, D., Fish, R.J., Tjwa, M., Plaisance, S.,Sugamele, R., DeMol, M., Martinez-Soria, E., Maxwell, P.H., Lemke, G., Goff, S.P.,Matsushima, G.K., Earp, H.S., Chanson, M., Collen, D., Izui, S., Schapira, M., Con-way, E.M., Carmeliet, P., 2008. Role of Gas6 in erythropoiesis and anemia in mice.J. Clin. Invest. 118 (2), 583–596.
Bernard, S., Pujo-Menjouet, L., Mackey, M.C., 2003. Analysis of cell kinetics using acell division marker: mathematical modeling of experimental data. Biophys. J.84 (5), 3414–3424.
Chikkappa, G., Borner, G., Burlington, H., Chanana, A.D., Cronkite, E.P., et al., 1976.Periodic oscillation of blood leukocytes, platelets and reticulocytes in a patientwith chronic myelocytic leukemia. Blood 47, 1023–1030.
Colijn, C., Mackey, M.C., 2005a. A Mathematical model of hematopoiesis. I. Periodicchronic myelogenous leukemia. J. Theor. Biol. 237 (2), 117–132.
Colijn, C., Mackey, M.C., 2005b. A mathematical model of hematopoiesis. II. Cyclicalneutropenia. J. Theor. Biol. 237 (2), 133–146.
Dale, D.C., Hammond, W.P., 1988. Cyclic neutropenia: a clinical review. Blood Rev. 2,178–185.
Elsgolz, L., Norkin, S., 1974. Introduction to Time Delay Equations. Nauka, Moscow.Fisher, J.W., 2003. Erythropoietin: physiology and pharmacology update. Exp. Biol.
Med. (Maywood) 228 (1), 1–14.Gershenfeld, N., 1999. The Nature of Mathematical Modeling. Cambridge University
Press, Cambridge, UK, ISBN 978-0521-570954.Jelkmann, L., 2004. Molecular biology of erythropoietin. Intern. Med. 43 (8),
649–659.Kato, M., Miura, K., Kamiyama, H., Okazaki, A., Kumaki, K., Kato, Y., Sugiyama, Y., 1998.
Pharmacokinetics of erythropoietin in genetically anemic mice. Drug Metab.Dispos. 26 (2), 126–131.
Kisseleva, T., Bhattacharya, S., Braunstein, J., Schindler, C.W., 2002. Signaling throughthe JAK/STAT pathway, recent advances and future challenges. Gene 285, 1–24.
Klingmüller, U., 1997. The role of tyrosine phosphorylation in proliferation and mat-uration of erythroid progenitor cells-signals emanating from the erythropoietinreceptor. Eur. J. Biochem. 249 (3), 637–647.
Mackey, M.C., 1978. Unified hypothesis for the origin of aplastic anemia and periodichematopoiesis. Blood 51 (5), 941–956.
Mahaffy, J.M., Belair, J., Mackey, M.C., 1998. Hematopoietic model with movingboundary condition and state dependent delay: applications in erythropoiesis.J. Theor. Biol. 190, 135–146.
Nikolov, S., Vera, J., Kotev, V., Wolkenhauer, O., Petrov, V., 2008. Dynamic propertiesof a delayed protein cross talk model. Biosystems 91, 51–68.
Nikolov, S., Vera, J., Rath, O., Kolch, W., Wolkenhauer, O., 2009. The role of inhibitoryproteins as modulators of oscillations in NFkB signalling. IET Syst. Biol. 3 (2),59–76.
Nikolov, S., Lai, X., Liebal, U.W., Wolkenhauer, O., Vera, J., submitted for publication.Integration of sensitivity and bifurcation analysis to detect critical processes ina model combining signalling and cell population dynamics, Int. J. Syst. Sci.
Orr, J.S., Kirk, J., Gray, K.G., Anderson, J.R., 1968. A study of the interdepen-dence of red cell and bone marrow stem cell populations. Br. J. Haemat. 15,23–34.
Pujo-Menjouet, L., Mackey, M.C., 2004. Contribution to the study of periodic chronicmyelogenous leukemia. C R Biol. 327 (3), 235–244.
Ribba, B., Colin, T., Schnell, S., 2006. A multiscale mathematical model of can-cer, and its use in analyzing irradiation therapies. Theor. Biol. Med. Model3, 7.
Schmidt, H., Jirstrand, M., 2006. Systems biology toolbox for MATLAB: a com-putational platform for research in systems biology. Bioinformatics 22 (4),514–515.
Koury, S.T., Koury, M.J., Bondurant, M.C., Caro, J., Graber, S.E., 1989. Quantitation oferythropoietin-producing cells in kidneys of mice by in situ hybridization: cor-relation with hematocrit, renal erythropoietin mRNA, and serum erythropoietinconcentration. Blood 74 (2), 645–651.
Swameye, I., Muller, T.G., Timmer, J., Sandra, O., Klingmuller, U., 2003. Identification ofnucleocytoplasmic cycling as a remote sensor in cellular signaling by databasedmodeling. Proc. Natl. Acad. Sci. U.S.A. 100 (3), 1028–1033.
Vera, J., Balsa-Canto, E., Wellstead, P., Banga, J.R., Wolkenhauer, O., 2007a. Power-Lawmodels of signal transduction pathways. Cell. Signal. 19, 1531–1541.
Vera, J., Curto, R., Cascante, M., Torres, N.V., 2007b. Detection of potential enzymetargets by metabolic modelling and optimization. Application to a simple enzy-mopathy. Bioinformatics 23 (17), 2281–2289.
Vera, J., Bachmann, J., Pfeifer, A.C., Becker, V., Hormiga, J., Torres-Darias, N.V., Tim-mer, J., Klingmuller, U., Wolkenhauer, O., 2008a. A systems biology approach toanalyse amplification in the JAK2-STAT5 signalling pathway. BMC Syst. Biol. 2,38.
Vera, J., Millat, T., Kolch, W., Wolkenhauer, O., 2008b. Dynamics of receptor andprotein transducer homodimerisation. BMC Syst. Biol. 2, 92.
Vera, J., Wolkenhauer, O., 2008. A system biology approach to understand functionalactivity of cell communication systems. Methods Cell Biol. 90, 399–415.
Voit, E.O., 2000. Computational Analysis of Biochemical Systems: A Practical Guidefor Biochemists and Molecular Biologist. Cambridge University Press, Cambridge,UK.
Wu, H., Liu, X., Jaenisch, R., Lodish, H.F., 1995. Generation of committed erythroidBFU-E and CFU-E progenitors does not require erythropoietin or the erythropoi-etin receptor. Cell 83 (1), 59–67.


