Embed Size (px)
Citation preview

Financial Review
Financial Performance
Looking at the DOWA Group’s businesses in fiscal 2020, the fiscal year ended March 31, 2021, sales of automo-bile-related products and services, which were affected by the spread of COVID-19, continued to follow a basic trend of recovery from the second quarter. In informa-tion and communication-related products, sales of products for 5G applications recorded higher sales, while sales of products related to new forms of energy remained firm. In environmental- and recycling-related services, orders for waste treatment were firm. Looking at the exchange rate and metals prices, in comparison with the previous fiscal year, the average exchange rate appreciation of the yen against the dollar, and the aver-age prices of precious metals and base metals, such as zinc and copper, increased. Amid these circumstances, the Group made steady progress with measures to raise corporate value under the basic policies put forth under its Midterm Plan 2020, which are “expand businesses in growth markets” and “increase competitiveness of existing businesses.”
As a result, consolidated net sales increased 21.2%, to ¥588,003 million; consolidated operating income was up 44.3%, to ¥37,454 million; and consolidated ordinary income increased 28.3%, to ¥37,200 million. Total income taxes increased 35.3%, to ¥13,636 million, and net income attributable to owners of parent increased 25.5%, to ¥21,824 million. The principal effects of COVID-19 on the Group’s busi-ness performance in the consolidated fiscal year under review were as follows. Automobile-related products and services account for high percentages of sales in the Heat Treatment Business and the Metal Processing Business. Sales in these businesses declined significantly in the first quarter due to a worldwide decline in auto-mobile production, but turned to recovery from the second quarter. In addition, looking at equity-method affiliates, business was affected by the temporary sus-pension of operations from mid-April to the end of May 2020 at the Los Gatos Mine of MINERAPLATAREAL, in Mexico. Also, Fujita Kanko Inc., which is not included in principal segments, was affected by a decline in guests at the lodges and hotels it operates.
Results by Segment(Billions of yen)
FY2019 Results FY2020 Results YoY Changes
Net Sales Operating Income
Ordinary Income Net Sales Operating
IncomeOrdinary Income Net Sales Operating
IncomeOrdinary Income
Environmental Management & Recycling 112.1 7.2 6.9 117.6 8.4 8.6 5.4 1.2 1.7
Nonferrous Metals 227.2 10.0 12.2 282.0 20.3 25.9 54.7 10.3 13.7
Electronic Materials 98.2 1.0 2.4 151.2 2.4 3.6 53.0 1.4 1.2
Metal Processing 82.3 5.1 5.1 77.8 4.3 4.6 (4.5) (0.7) (0.5)
Heat Treatment 27.9 1.2 1.2 23.1 0.7 0.8 (4.8) (0.4) (0.4)
Others / Elimination (62.8) 1.3 1.0 (63.9) 1.0 (6.5) (1.0) (0.3) (7.5)
Total 485.1 25.9 28.9 588.0 37.4 37.2 102.8 11.4 8.2
Foreign-Exchange Rate and Metal PricesFY2019 Results* FY2020 Results*
Exchange rate: (¥/$) 108.7 106.1
Copper: ($/t) 5,860 6,879
Zinc: ($/t) 2,405 2,419
Indium: ($/kg) 156 166
* Figures are the average for the full year.
FY2019 Equitymethodincomeor loss
Year-endrevaluation
Foreigncurrency
exchange rate
Others Metalprices
Salesincrement
Purchaseconditions ofraw material
Electricityrates
Difference in foreigncurrency
exchange rate
FY2020
28.9 (5.4)
(2.0)
(0.8)(0.9)
8.7
3.1
2.31.3
2.0 37.2
Factor Analysis of Ordinary Income(Billions of yen)
2016 2017 2018 2019 2020 (FY)
17.3
21.8
14.9
24.626.1
Net Income Attributable to Owners of Parent(Billions of yen)
2016 2017 2018 2019 2020 (FY)
28.9
37.2
24.3
36.336.5
Ordinary Income (Billions of yen)
2016 2017 2018 2019 2020 (FY)
25.9
37.4
18.6
30.933.9
Operating Income(Billions of yen)
Net Sales / Operating Income to Net Sales(Billions of yen / %)
2016 2017 2018 2019 2020 (FY)
485.1
588.0
452.9454.7
5.3 6.34.16.88.2
410.5
Net sales Operating income to net sales
DOWA HOLDINGS CO., LTD.1 2FINANCIAL SECTION 2021

Analysis of Financial Position
AssetsTotal assets at the end of the fiscal year under review stood at ¥598,471 million, up ¥85,975 million compared with the end of the previous fiscal year. Total current assets were up ¥84,856 million, while total non-current assets increased ¥1,119 million. The increase in current assets was due to such factors as a rise of ¥89,924 million in inventories, an expansion of ¥9,002 million in notes and accounts receivable – trade, and a decrease of ¥13,452 million in cash and deposits. The increase in non-current assets is attributable to such factors as an increase of ¥7,231 million in property, plant and equipment; an increase of ¥937 million in other assets listed under intangible assets; a contraction of ¥5,825 million in long-term loans receivable; and a decrease of ¥1,214 million in other assets listed under investments and other assets.
LiabilitiesTotal liabilities grew ¥67,501 million compared with the previous fiscal year-end. This was due to such factors as an increase of ¥24,809 million in borrowing precious metals, an increase of ¥20,857 million in notes and accounts payable–trade, an increase of ¥13,008 million in short-term borrowings, and an increase of ¥11,000 million in commercial paper.
EquityLooking at total equity, net income attributable to owners of parent amounted to ¥21,824 million, but pay-ment of cash dividends, etc., resulted in an increase in shareholders’ equity of ¥17,554 million. In addition, total accumulated other comprehensive income increased ¥102 million due to such factors as an expansion in valu-ation difference on available-for-sale securities, and total equity was ¥18,473 million higher than the balance as of the end of the previous fiscal year. As a result, the equity to asset ratio was 44.4%.
Analysis of Cash FlowsConsolidated cash and cash equivalents (hereinafter, “net cash”) at the end of the consolidated fiscal year under review were down by ¥12,911 million compared with the previous fiscal year-end, to ¥17,320 million. Net cash used in operating activities came to ¥3,088 million, compared with net cash provided by operating activities of ¥55,113 million in the previous fiscal year. This was due to such factors as income before income taxes of ¥38,860 million, a decrease in cash of ¥89,511 million due to an increase in inventories, an increase in cash of ¥24,809 million due to an increase in borrowing precious metals, and an increase in cash of ¥20,690 mil-lion due to an increase in trade payables. Net cash used in investing activities was ¥22,943 mil-lion, down ¥14,869 million compared with the previous fiscal year. This was due to such factors as capital expenditures of ¥35,022 million, primarily in the Environmental Management & Recycling Business, and proceeds from sale of shares of subsidiaries and associates of ¥7,754 million. Net cash provided by financing activities was ¥11,585 million, compared with net cash used in financing activi-ties of ¥6,569 million in the previous fiscal year. This was due to such factors as an increase in interest-bearing debt of ¥19,824 million and cash dividends paid of ¥7,962 million.
2016 2017 2018 2019 2020 (FY)
55.1
(3.0)
37.5
11.1
29.3
2016 2017 2018 2019 2020
258.2276.7
246.1247.7227.8
(YE)
Total Equity(Billions of yen)
2016 2017 2018 2019 2020 (FY)
(37.8)
(22.9)
(51.0)
(34.0)
(25.9)
Cash Flows from Investing Activities(Billions of yen)
Cash Flows from Operating Activities(Billions of yen)
Financial Review
2016 2017 2018 2019 2020
134.0153.9
135.2
109.8
79.8
(YE)
Interest-Bearing Debt(Billions of yen)
2016 2017 2018 2019 2020 (YE)
512.4
598.4
494.6456.5
404.6
Total Assets(Billions of yen)
Basic Dividend Policy and Dividends Paid for the Fiscal Year under Review
DOWA views the payment of dividends to shareholders as one of its most important management issues. The Company’s fundamental policy is to maintain the stable payment of dividends and, in that light, it pays a divi-dend commensurate with performance, having appro-priated a sufficient amount of retained earnings to bolster the Group’s business position and support future business development. In addition, as part of Midterm Plan 2020, we aim to increase dividends according to profit levels, maintaining a stable dividend of at least ¥90 per share. Based on the above, with consideration for results, future demand for funds, etc., the annual dividend paid for the fiscal year under review was ¥95 per share, an increase of ¥5 per share from the previous fiscal year.
2016 2017 2018 2019 2020 (FY)
90.095.0
90.090.0
18.0
Cash Dividends(Yen)
Note: On October 1, 2017, the Company conducted a 5-for-1 reverse stock split.
DOWA HOLDINGS CO., LTD.3 4FINANCIAL SECTION 2021

(Millions of yen)
For the years ended March 31 2010 2011 2012 2013 2014 2015 2016 2017 2018 2019 2020*1
Financial Performance
Net Sales ¥379,816 ¥392,468 ¥419,390 ¥443,985 ¥464,219 ¥406,598 ¥410,503 ¥ 454,754 ¥ 452,928 ¥ 485,130 ¥ 588,003Cost of Sales 330,380 343,015 365,963 382,079 391,509 337,314 341,177 387,831 396,495 421,630 512,155Selling, General and Administrative Expenses 26,511 27,443 28,863 30,111 33,616 34,216 35,335 35,975 37,761 37,544 38,393Operating Income 22,924 22,009 24,564 31,794 39,094 35,067 33,990 30,948 18,671 25,955 37,454Operating Income by Segment
Environmental Management & Recycling (%) 12.22 20.34 26.37 29.86 18.80 18.01 19.50 16.06 30.46 27.76 22.58Nonferrous Metals (%) 22.56 19.25 19.09 22.20 34.69 38.00 29.58 29.74 3.17 38.54 54.31Electronic Materials (%) 31.16 24.95 23.58 21.12 22.55 22.89 19.36 18.17 11.66 4.09 6.60Metal Processing (%) 23.66 20.59 19.89 16.96 14.85 14.01 20.49 23.54 33.74 19.71 11.72Heat Treatment (%) 6.18 8.95 6.33 7.12 6.02 3.86 7.00 8.47 13.05 4.63 1.97Others and Elimination (%) 4.21 5.92 4.74 2.74 3.09 3.24 4.06 4.01 7.92 5.27 2.82Ordinary Income (Loss) ¥ 23,371 ¥ 20,918 ¥ 27,277 ¥ 35,055 ¥ 42,037 ¥ 35,056 ¥ 36,504 ¥ 36,355 ¥ 24,309 ¥ 28,996 ¥ 37,200EBITDA*2 41,410 40,354 41,551 48,000 54,667 50,212 49,786 48,160 37,300 45,244 57,505Net Income (Loss) Attributable to Owners of Parent 8,521 10,610 15,213 23,310 26,543 21,826 26,169 24,693 14,986 17,395 21,824Capital Expenditures 17,820 15,910 18,422 16,549 17,247 22,936 26,526 24,608 24,087 37,723 37,338Depreciation 18,486 18,344 16,987 16,205 15,572 15,145 15,796 17,212 18,628 19,288 20,050R&D Expenses 4,266 4,623 4,604 4,651 5,320 5,594 5,670 5,380 5,888 6,076 6,177
Exchange Rate and Metal Prices
Copper (Price Quoted, Average) ¥738,200 ¥717,817 ¥696,375 ¥757,633 ¥765,775 ¥675,483 ¥603,917 ¥ 756,683 ¥ 746,608 ¥ 681,592 ¥ 769,500Zinc (Price Quoted, Average) 231,858 211,683 208,675 240,325 285,983 269,383 305,633 386,733 353,725 313,308 309,400U.S. Dollar (Average) 85.72 79.08 83.10 100.24 109.93 120.14 108.38 110.85 110.91 108.74 106.06
Financial Position
Equity ¥113,785 ¥121,807 ¥142,400 ¥166,987 ¥195,649 ¥203,370 ¥227,821 ¥ 247,762 ¥ 246,158 ¥ 258,241 ¥ 276,715Non-Controlling Interests 6,942 7,999 8,807 8,733 8,528 8,449 8,518 8,946 8,944 10,194 11,010Total Assets*3 340,161 319,665 349,787 358,717 379,193 364,420 404,604 456,530 494,683 512,495 598,471Interest-Bearing Debt 138,119 117,670 107,138 99,663 86,668 81,135 79,883 109,827 135,241 134,086 153,951
Per Share*4 (Yen)
Basic Net Income (Loss) ¥ 28.80 ¥ 35.86 ¥ 51.41 ¥ 78.77 ¥ 89.69 ¥ 73.75 ¥ 88.43 ¥ 417.21 ¥ 253.22 ¥ 293.92 ¥ 368.45Fully Diluted Equity 361.18 384.55 451.41 534.75 632.30 658.66 741.06 4,035.06 4,008.03 4,191.09 4,465.44Cash Dividends 10.00 10.00 12.00 15.00 18.00 18.00 18.00 90.00 90.00 90.00 95.00
Cash Flows
Cash Flows from Operating Activities ¥ 23,955 ¥ 31,499 ¥ 34,970 ¥ 30,189 ¥ 38,345 ¥ 45,751 ¥ 29,389 ¥ 11,125 ¥ 37,555 ¥ 55,113 ¥ (3,088)Cash Flows from Investing Activities (19,257) (19,491) (19,354) (18,689) (20,321) (23,486) (25,954) (34,010) (51,025) (37,812) (22,943)Cash Flows from Financing Activities (15,070) (24,134) (14,982) (12,341) (16,905) (11,159) (7,155) 24,087 15,944 (6,569) 11,585 Free Cash Flow 4,698 12,007 15,615 11,499 18,024 22,265 3,434 (22,884) (13,470) 17,301 (26,032)Cash and Cash Equivalents at End of Year 16,741 4,788 6,129 5,823 8,044 18,902 15,126 16,472 19,002 30,232 17,320
Ratios
Return on Assets*5 (%) 6.97 6.34 8.15 9.90 11.39 9.43 9.49 8.44 5.11 5.76 6.70Return on Equity*6 (%) 8.01 9.62 12.30 15.97 15.37 11.43 12.64 10.78 6.30 7.17 8.50Operating Income (Loss) to Net Sales (%) 6.04 5.61 5.86 7.16 8.42 8.62 8.28 6.81 4.12 5.35 6.37Equity Ratio*7 (%) 31.41 35.60 38.19 44.12 49.35 53.49 54.20 52.31 47.95 48.40 44.40Operating Income Growth (%) 67.31 (3.99) 11.60 29.43 22.96 (10.30) (3.07) (8.95) (39.67) 39.01 44.31Interest Coverage (Times) 10.55 11.52 14.82 21.41 34.23 39.04 43.12 55.47 20.71 21.69 43.03Debt / Equity Ratio*7 (Times) 1.29 1.03 0.80 0.63 0.46 0.42 0.36 0.46 0.57 0.54 0.58Debt / Capacity Ratio (Times) 1.90 1.83 1.37 1.28 1.06 1.00 0.83 1.05 1.29 1.26 1.50Return on Invested Capital*7 (%) 3.48 4.58 6.32 9.04 9.70 7.91 8.75 7.08 4.02 4.55 5.20
*1 The years stated in the table above are ended March 31. Thus, “2020” refers to the fiscal year that ran from April 1, 2020 through March 31, 2021.*2 EBITDA is calculated by adding operating income and depreciation.*3 Changes put forth in the Partial Amendments to Accounting Standard for Tax Effect Accounting (ASBJ Statement No. 28, issued February 16, 2018)
have been applied to the consolidated financial results for the fiscal year under review. These amendments have been retroactively applied to the consolidated financial results for fiscal 2017, and the amount of total assets has been adjusted accordingly.
*4 On October 1, 2017, the Company conducted a 5-for-1 reverse stock split.
*5 Ordinary income (loss) divided by the average of total assets at the start and end of the year.*6 Net income (loss) attributable to owners of parent divided by the average of shareholders’ equity (the amounts after deducting non-controlling interest
amounts from equity amounts) at the start and end of the year.*7 The ratios have been calculated using shareholders’ equity (the amounts after deducting non-controlling interest amounts from equity amounts).
Consolidated Performance Trends
Midterm Plan 2020
DOWA HOLDINGS CO., LTD.5 6FINANCIAL SECTION 2021

Millions of yen
Thousands of U.S. dollars
(Note 1)Assets 2021 2020 2021
Current Assets:Cash and time deposits (Notes 4, 7, and 15) ......................................... ¥ 18,277 ¥ 31,730 $ 165,097
Notes and accounts receivable: (Note 15)
Trade ................................................................................................. 83,015 73,544 749,850
Nonconsolidated subsidiaries and associates ................................... 1,398 2,247 12,632Others ............................................................................................... 5,483 6,255 49,531
Subtotal ............................................................................................ 89,898 82,047 812,014Inventories: (Note 14)
Merchandise and finished products ................................................. 44,908 29,416 405,643
Work in process ............................................................................... 6,925 5,679 62,552Raw materials and supplies ............................................................. 153,394 80,207 1,385,548
Subtotal ............................................................................................ 205,228 115,303 1,853,744Other current assets ............................................................................. 13,822 13,413 124,856Allowance for doubtful accounts ........................................................ (227) (352) (2,056)
Total current assets ......................................................................... 326,999 242,143 2,953,656
Property, Plant, and Equipment (Notes 6 and 7):
Land ..................................................................................................... 27,776 27,883 250,894
Buildings and structures ...................................................................... 142,800 132,996 1,289,859
Machinery and equipment ................................................................... 271,782 261,306 2,454,908
Construction in progress ..................................................................... 21,147 21,688 191,020Others .................................................................................................. 19,197 18,829 173,400
Subtotal ............................................................................................. 482,704 462,704 4,360,083Accumulated depreciation .................................................................... (322,136) (309,368) (2,909,736)
Net property, plant, and equipment .................................................. 160,567 153,336 1,450,347
Investments and Other Assets:
Investments in securities (Notes 5, 7, and 15) ..................................... 26,865 19,667 242,667Investments in and advances to nonconsolidated subsidiaries and
associates (Notes 5, 7, 15 and 19) .................................................... 65,820 78,992 594,527Deferred tax assets (Note 10) ............................................................... 7,461 6,883 67,396
Goodwill ............................................................................................... 3,591 4,037 32,442
Other assets .......................................................................................... 7,258 7,534 65,560Allowance for doubtful accounts ......................................................... (93) (100) (845)
Total investments and other assets ................................................... 110,903 117,016 1,001,750
Total assets ...................................................................................... ¥ 598,471 ¥ 512,495 $ 5,405,753*1. The accompanying notes are an integral part of these consolidated financial statements.
2. ¥110.71 = U.S. $1, the rate of exchange on March 31, 2021.
Consolidated Balance SheetDOWA HOLDINGS CO., LTD. and Its Consolidated SubsidiariesFor the years ended March 31, 2021 and 2020
Page 1 of 400527503262609_013.htm
2021/09/14https://edit.xsmart.jp/mdn_manager/Common/ASHX/AsyncHTMLOutput.ashx
Millions of yen
Thousands of U.S. dollars
(Note 1)Liabilities and Equity 2021 2020 2021
Current Liabilities:Short-term borrowings (Notes 7 and 15).............................................. ¥ 38,449 ¥ 33,454 $ 347,300
Commercial paper (Notes 7 and 15) .................................................... 35,000 24,000 316,141
Current maturities of long-term debt (Notes 7 and 15) ....................... 14,962 6,838 135,150
Notes and accounts payable: (Note 15)
Trade ................................................................................................ 53,867 33,697 486,562
Nonconsolidated subsidiaries and associates ................................... 1,470 783 13,283Others ............................................................................................... 9,299 5,481 83,998
Subtotal ............................................................................................ 64,637 39,962 583,844Accrued expenses ................................................................................. 7,484 7,519 67,608
Accrued income taxes .......................................................................... 6,179 6,224 55,820
Accrued bonuses .................................................................................. 4,244 3,945 38,340
Accrued directors’ bonuses .................................................................. 212 191 1,923
Borrowing precious metals ................................................................... 38,180 13,371 344,873Other current liabilities ......................................................................... 17,541 21,279 158,447
Total current liabilities ..................................................................... 226,894 156,786 2,049,449
Long-term Liabilities:
Long-term debt (Notes 7 and 15) ......................................................... 67,257 71,299 607,509
Liability for employees’ retirement benefits (Note 13) ....................... 19,546 18,548 176,558Retirement allowance for directors and Audit & Supervisory
Board members ................................................................................. 739 730 6,680Deferred tax liabilities (Note 10) ......................................................... 2,334 2,158 21,086Other long-term liabilities .................................................................... 4,982 4,731 45,009
Total long-term liabilities ................................................................ 94,861 97,467 856,844
Total liabilities ................................................................................. 321,755 254,254 2,906,293
Contingent Liabilities (Note 8)
Equity: (Note 9)
Common stock:
Authorized: 200,000 thousand shares in 2021 and 2020
Issued: 61,989 thousand shares in 2021 and 2020 36,437 36,437 329,124Capital surplus ...................................................................................... 26,473 25,928 239,120
Retained earnings ................................................................................. 201,290 184,927 1,818,179Treasury stock, at cost (2,486 thousand shares in 2021 and 2,804 thousand shares in 2020) .. (5,064) (5,711) (45,743)
Accumulated Other Comprehensive Income:Unrealized gain (loss) on available-for-sale securities (Note 5) ........................................................................................ 10,569 5,226 95,468Deferred gain (loss) on derivatives under hedge accounting
(Note 16) ...................................................................................... (2,196) 2,285 (19,843)Foreign currency translation adjustments ........................................ (1,643) (875) (14,843)Defined retirement benefit plans (Note 13) ..................................... (161) (172) (1,460)
Total ................................................................................................. 265,704 248,047 2,400,003Noncontrolling interests ........................................................................ 11,010 10,194 99,457
Total equity ...................................................................................... 276,715 258,241 2,499,460
Total liabilities and equity ............................................................ ¥ 598,471 ¥ 512,495 $ 5,405,753
Page 2 of 400527503262609_013.htm
2021/09/14https://edit.xsmart.jp/mdn_manager/Common/ASHX/AsyncHTMLOutput.ashx
Consolidated Balance SheetDOWA HOLDINGS CO., LTD. and Its Consolidated SubsidiariesFor the years ended March 31, 2021 and 2020
DOWA HOLDINGS CO., LTD.7 8FINANCIAL SECTION 2021

Millions of yen
Thousands of U.S. dollars
(Note 1)2021 2020 2021
Net Sales ................................................................................................. ¥ 588,003 ¥ 485,130 $ 5,311,207Cost of Sales (Notes 12 and 14) ............................................................. 512,155 421,630 4,626,100
Gross profit (loss) ........................................................................... 75,848 63,499 685,107Selling, General, and Administrative Expenses (Notes 11 and 13) ... 38,393 37,544 346,791
Operating income (loss) .................................................................. 37,454 25,955 338,316Other Income (Expenses):
Interest and dividend income .............................................................. 1,733 2,752 15,661
Interest expense .................................................................................. (910) (1,323) (8,226)Gain (loss) on sales and disposals of property, plant and equipment,
net ................................................................................................... (1,008) (676) (9,110)Foreign exchange gain (loss) .............................................................. 1,133 (986) 10,240Share of profit (loss) of entities accounted for using
equity method ............................................................................... (4,815) 605 (43,499)Commission income ............................................................................ 998 838 9,019Royalty income ................................................................................... 1,036 790 9,363Gain (loss) on sales of investments in securities, net
(Note 5) ......................................................................................... 5,026 1,555 45,399Loss on devaluation of investments in securities................................ (198) - (1,794)Environmental expenses ..................................................................... (760) (535) (6,869)
Loss on impairments (Note 6) ............................................................ (2,252) (1,181) (20,341)
Loss from natural disaster .................................................................. -- (107) --
Other, net ............................................................................................ 1,423 1,075 12,857
Subtotal ........................................................................................... 1,405 2,806 12,699
Income (loss) before income taxes ................................................. 38,860 28,762 351,015Income Taxes: (Note 10)
Current ................................................................................................ 14,525 9,857 131,205Deferred .............................................................................................. (889) 223 (8,030)
Total income taxes .......................................................................... 13,636 10,081 123,175
Net Income (loss) ............................................................................ 25,224 18,680 227,840Net Income (Loss) Attributable to Noncontrolling Interests ............ 3,399 1,284 30,708
Net income (loss) attributable to owners of the parent ................. ¥ 21,824 ¥ 17,395 $ 197,132
Per Share: (Note 18) YenU.S. dollars
(Note 1)Basic net income ................................................................................. ¥ 368.45 ¥ 293.92 $ 3.32Cash dividends .................................................................................... 95.00 90.00 0.85
*1. The accompanying notes are an integral part of these consolidated financial statements.2. ¥110.71= U.S. $1, the rate of exchange on March 31, 2021.
Consolidated Statement of IncomeDOWA HOLDINGS CO., LTD. and Its Consolidated SubsidiariesFor the years ended March 31, 2021 and 2020
Page 3 of 400527503262609_013.htm
2021/09/14https://edit.xsmart.jp/mdn_manager/Common/ASHX/AsyncHTMLOutput.ashx
Millions of yen
Thousands of U.S. dollars
(Note 1)2021 2020 2021
Net Income (loss)............................................................................... ¥ 25,224 ¥ 18,680 $ 227,840Other comprehensive income: (Note 17)
Unrealized gain (loss) on available-for-sale securities ................. 5,807 (5,127) 52,455
Deferred gain (loss) on derivatives under hedge accounting ....... (4,179) 5,069 (37,756)
Foreign currency translation adjustments ..................................... (102) (880) (923)
Defined retirement benefit plans .................................................. (89) 169 (808)Share of other comprehensive income in affiliates ...................... (1,366) 396 (12,344)
Total other comprehensive income .............................................. 68 (372) 621
Comprehensive income .................................................................... ¥ 25,293 ¥ 18,307 $ 228,462
Total comprehensive income attributable to:Owners of the parent .................................................................... ¥ 21,927 ¥ 17,042 $ 198,058Noncontrolling interests ............................................................... 3,366 1,265 30,403
*1. The accompanying notes are an integral part of these consolidated financial statements.2. ¥110.71= U.S. $1, the rate of exchange on March 31, 2021.
Consolidated Statement of Comprehensive IncomeDOWA HOLDINGS CO., LTD. and Its Consolidated SubsidiariesFor the years ended March 31, 2021 and 2020
Page 4 of 400527503262609_013.htm
2021/09/14https://edit.xsmart.jp/mdn_manager/Common/ASHX/AsyncHTMLOutput.ashx
Consolidated Statement of Income Consolidated Statement of Comprehensive IncomeDOWA HOLDINGS CO., LTD. and Its Consolidated SubsidiariesFor the years ended March 31, 2021 and 2020
DOWA HOLDINGS CO., LTD. and Its Consolidated SubsidiariesFor the years ended March 31, 2021 and 2020
DOWA HOLDINGS CO., LTD.9 10FINANCIAL SECTION 2021

Millions of yen
Accumulated Other Comprehensive Income
Total
Non-controlling
Interests Total Equity
Unrealized Gain (Loss)
onAvailable-for-Sale
Securities
Deferred Gain (Loss)
onDerivatives
under Hedge
Accounting
Foreign Currency
TranslationAdjustments
Defined Retirement
Benefit Plans Balance, April 1, 2019......................................... ¥ 9,992 ¥ (2,787) ¥ (27) ¥ (360) ¥ 237,214 ¥ 8,944 ¥ 246,158
Cash dividends paid .......................................... - - - - (5,409) - (5,409)Net Income (loss) attributable to owners of
the parent ....................................................... - - - - 17,395 - 17,395
Purchases of treasury stock ................................ - - - - (1) - (1)Change of scope of consolidation ....................... - - - - (683) - (683)Change in the parent’s ownership interest due
to transactions with noncontrolling interests .. - - - - (115) - (115)
Net changes of items other than shareholders’ equity .......................................
(4,766) 5,072 (848) 187 (353) 1,249 896
Balance, March 31, 2020......................................... ¥ 5,226 ¥ 2,285 ¥ (875) ¥ (172) ¥ 248,047 ¥10,194 ¥ 258,241Cash dividends paid ........................................... -- -- -- -- (5,409) -- (5,409)Net Income (loss) attributable to owners of
the parent ....................................................... -- -- -- -- 21,824 -- 21,824
Purchases of treasury stock ................................. -- -- -- -- (1) -- (1)Disposal of treasury stock ...................................... -- -- -- -- 1,192 -- 1,192Change of scope of consolidation ....................... -- -- -- -- (51) -- (51)Net changes of items other than
shareholders’ equity ........................................5,342 (4,482) (767) 10 102 816 919
Balance, March 31, 2021....................................... ¥ 10,569 ¥ (2,196) ¥ (1,643) ¥ (161) ¥ 265,704 ¥11,010 ¥ 276,715
Thousands of U.S. dollars (Note 1)
Accumulated Other Comprehensive Income
Total
Non-controlling
Interests Total Equity
Unrealized Gain (Loss)
onAvailable-for-Sale
Securities
Deferred Gain (Loss)
onDerivatives
under Hedge
Accounting
Foreign Currency
TranslationAdjustments
Defined Retirement
Benefit Plans Balance, April 1, 2020......................................... $ 47,211 $ 20,646 $ (7,907) $ (1,555) $ 2,240,512 $ 92,079 $ 2,332,592
Cash dividends paid ........................................... -- -- -- -- (48,858) -- (48,858)Net Income (loss) attributable to owners of
the parent ....................................................... -- -- -- -- 197,132 -- 197,132
Purchases of treasury stock ................................. -- -- -- -- (13) -- (13)Disposal of treasury stock ...................................... -- -- -- -- 10,771 -- 10,771Change of scope of consolidation ....................... -- -- -- -- (469) -- (469)Net changes of items other than
shareholders’ equity ........................................48,257 (40,489) (6,936) 95 926 7,377 8,304
Balance, March 31, 2021....................................... $ 95,468 $ (19,843) $(14,843) $ (1,460) $ 2,400,003 $ 99,457 $ 2,499,460
Page 6 of 400527503262609_013.htm
2021/09/14https://edit.xsmart.jp/mdn_manager/Common/ASHX/AsyncHTMLOutput.ashx
Thousands Millions of yen
Shareholders’ EquityNumber of Shares of
Common StockOutstanding Common Stock Capital Surplus Retained Earnings
Treasury Stock,at Cost
Balance, April 1, 2019........................................... 59,184 ¥ 36,437 ¥ 26,044 ¥ 173,624 ¥ (5,710)Cash dividends paid .............................................. - - - (5,409) -
Net Income (loss) attributable to owners of the parent .......................................................... - - - 17,395 -
Purchases of treasury stock ................................... (0) - - - (1)Change of scope of consolidation ......................... - - - (683) --
Change in the parent’s ownership interest due to transactions with noncontrolling interests.... - - (115) - -
Net changes of items other than shareholders’ equity .......................................... - - - - -
Balance, March 31, 2020............................................ 59,184 ¥ 36,437 ¥ 25,928 ¥ 184,927 ¥ (5,711)Cash dividends paid .............................................. -- -- -- (5,409) --
Net Income (loss) attributable to owners of the parent .......................................................... -- -- - 21,824 -
Purchases of treasury stock ................................... (0) -- -- -- (1)Disposal of treasury stock ...................................... 318 -- 544 -- 648Change of scope of consolidation ......................... -- -- -- (51) --
Net changes of items other than shareholders’ equity .......................................... - -- -- -- --
Balance, March 31, 2021......................................... 59,502 ¥ 36,437 ¥ 26,473 ¥ 201,290 ¥ (5,064)
Thousands Thousands of U.S. dollars (Note 1)
Shareholders’ EquityNumber of Shares of
Common StockOutstanding Common Stock Capital Surplus Retained Earnings
Treasury Stock,at Cost
Balance, April 1, 2020............................................ 59,184 $ 329,124 $ 234,205 $ 1,670,375 $ (51,587)Cash dividends paid .............................................. -- -- -- (48,858) --
Net Income (loss) attributable to owners of the parent .......................................................... -- -- -- 197,132 --
Purchases of treasury stock ................................... (0) -- -- -- (13)
Disposal of treasury stock ...................................... 318 -- 4,915 -- 5,856Change of scope of consolidation ......................... -- -- -- (469) --
Net changes of items other than shareholders’ equity .......................................... - -- -- -- --
Balance, March 31, 2021..................................... 59,502 $ 329,124 $ 239,120 $ 1,818,179 $ (45,743)
*1. The accompanying notes are an integral part of these consolidated financial statements. 2. ¥110.71= U.S. $1, the rate of exchange on March 31, 2021.
Consolidated Statement of Changes in EquityDOWA HOLDINGS CO., LTD. and Its Consolidated SubsidiariesFor the years ended March 31, 2021 and 2020
Page 5 of 400527503262609_013.htm
2021/09/14https://edit.xsmart.jp/mdn_manager/Common/ASHX/AsyncHTMLOutput.ashx
Consolidated Statement of Changes in EquityDOWA HOLDINGS CO., LTD. and Its Consolidated SubsidiariesFor the years ended March 31, 2021 and 2020
DOWA HOLDINGS CO., LTD.11 12FINANCIAL SECTION 2021

Millions of yen
Thousands of U.S.
dollars (Note 1) 2021 2020 2021
Cash Flows from Operating ActivitiesIncome (loss) before income taxes................................................ ¥ 38,860 ¥ 28,762 $ 351,015
Adjustments for:
Income taxes (paid) refund ..................................................... (14,496) (5,443) (130,938)
Depreciation and amortization ................................................ 20,526 19,774 185,403Loss (gain) on sales and disposals of property, plant, and
equipment, net...................................................................... 1,008 676 9,110
Share of (profit) loss of entities accounted for using the equity method ................................................................. 4,815 (605) 43,499
Loss (gain) on sales of investment securities, net (Note 5) ...... (5,026) (1,555) (45,399)
Loss on impairments (Note 6) ................................................. 2,252 1,181 20,341
Changes in assets and liabilities
Decrease (increase) in notes and accounts receivable .............. (9,152) 8,553 (82,674)
Decrease (increase) in inventories ........................................... (89,511) 4,361 (808,519)
Increase (decrease) in notes and accounts payable .................. 20,690 (8,383) 186,885
Increase (decrease) in allowance for doubtful accounts .......... (120) 207 (1,086)
Increase (decrease) in net defined benefit liability .................. 879 624 7,948
Decrease (increase) in interest and dividend receivables ...... 1,236 3,362 11,169
Increase (decrease) in interest payable .................................... (97) (24) (884)
Increase (decrease) in borrowing precious metals .................. 24,809 649 224,097Other, net ..................................................................................... 235 2,973 2,131
Net cash provided by (used in) operating activities ................. (3,088) 55,113 (27,899)
Cash Flows from Investing Activities:Acquisition of property, plant, and equipment ............................ (33,487) (35,241) (302,476)
Proceeds from sales of property, plant, and equipment ............. 565 605 5,107
Acquisition of intangible fixed assets........................................... (1,535) (885) (13,867)
Acquisition of investments in securities ...................................... (6) (8) (54)
Proceeds from sales of investments in securities (Note 5)............ 966 2,557 8,726
Acquisition of investments in subsidiaries and associates ........... (700) (4,705) (6,323)Proceeds from sales of shares of subsidiaries and associates (Note 5)......................................................................................... 7,754 - 70,040
Payments for loans ....................................................................... (4,086) (8,120) (36,911)
Proceeds from collection of loans ................................................ 7,334 2,134 66,245
Proceeds from subsidies ............................................................... 687 6,484 6,210Other, net ..................................................................................... (435) (633) (3,936)
Net cash provided by (used in) investing activities .................. (22,943) (37,812) (207,238)
Consolidated Statement of Cash FlowsDOWA HOLDINGS CO., LTD. and Its Consolidated SubsidiariesFor the years ended March 31, 2021 and 2020
Page 7 of 400527503262609_013.htm
2021/09/14https://edit.xsmart.jp/mdn_manager/Common/ASHX/AsyncHTMLOutput.ashx
Millions of yen
Thousands of U.S.
dollars (Note 1) 2021 2020 2021
Cash Flows from Financing Activities:Net increase (decrease) in short-term loans payable ................... 5,440 4,661 49,142
Net increase (decrease) in commercial papers ............................. 11,000 (5,000) 99,358
Proceeds from long-term debt ...................................................... 10,180 9,840 91,960
Repayment of long-term debt ...................................................... (6,797) (10,262) (61,398)
Proceeds from issuance of bonds.................................................. -- 9,953 --
Redemption of bonds.................................................................... -- (10,000) --
Cash dividends paid ..................................................................... (5,407) (5,408) (48,845)
Dividends paid to non-controlling interests ................................. (2,554) (168) (23,073)
Repayment of lease obligations ................................................... (275) (183) (2,484)
Purchases of treasury stock .......................................................... (1) (1) (13)Other, net ..................................................................................... -- 0 --
Net cash provided by (used in) financing activities .................. 11,585 (6,569) 104,647Foreign Currency Translation Adjustment on Cash and
Cash Equivalents ........................................................................ 55 114 505Net Increase (Decrease) in Cash and Cash Equivalents ............. (14,390) 10,846 (129,984)
Cash and Cash Equivalents of Newly Consolidated Subsidiaries .. 1,479 383 13,359Cash and Cash Equivalents at Beginning of Year ..................... 30,232 19,002 273,074
Cash and Cash Equivalents at End of Year (Note 4) .................. ¥ 17,320 ¥ 30,232 $ 156,450*1. The accompanying notes are an integral part of these consolidated financial statements.2. ¥ 110.71 = U.S. $1, the rate of exchange on March 31, 2021.
Page 8 of 400527503262609_013.htm
2021/09/14https://edit.xsmart.jp/mdn_manager/Common/ASHX/AsyncHTMLOutput.ashx
Consolidated Statement of Cash FlowsDOWA HOLDINGS CO., LTD. and Its Consolidated SubsidiariesFor the years ended March 31, 2021 and 2020
DOWA HOLDINGS CO., LTD.13 14FINANCIAL SECTION 2021

HOLDINGS PTE. LTD., which remains as a consolidated subsidiary.
(b) Accounting Period of Foreign SubsidiariesIn preparing the consolidated financial statements for the year ended March 31, 2021, the Company used financial statements with an account closing date of December 31, 2020, for 22 foreign subsidiaries, including PT. Prasadha Pamunah Limbah Industri.; Dowa Environmental Management Co., Ltd.; Dowa Advanced Materials (Shanghai) Co., Ltd.; and other companies and used financial statements with an account closing date of February 28, 2021, for DOWAINTERNATIONAL CORPORATION. Material transactions that occurred between January 1, 2021, and March 31, 2021, were adjusted in the consolidated financial statements, as necessary.
The fiscal year-end for GOLDEN DOWA ECO-SYSTEM MYANMAR CO., LTD. is September 30. Therefore, provisional financial statements closing procedures were conducted on March 31, 2021.
(c) Unification of Accounting Policies Applied to Foreign Subsidiaries for the Consolidated Financial StatementsUnder Accounting Standards Board of Japan (“ASBJ”) Practical Issues Task Force (“PITF”) No. 18, “Practical Solution on Unification of Accounting Policies Applied to Foreign Subsidiaries for the Consolidated Financial Statements,” the accounting policies and procedures applied to a parent company and its subsidiaries for similar transactions and events under similar circumstances should in principle be unified for the preparation of the consolidated financial statements. However, financial statements prepared by foreign subsidiaries in accordance with either International Financial Reporting Standards (“IFRS”) or generally accepted accounting principles in the United States of America (Financial Accounting Standards Board Accounting Standards Codification—“FASB ASC”) tentatively may be used for the consolidation process, except for the following items that should be adjusted in the consolidation process so that net income is accounted for in accordance with Japanese GAAP, unless they are not material: (a) amortization of goodwill; (b) scheduled amortization of actuarial gain or loss of pensions that has been recorded in equity through other comprehensive income; (c) expensing capitalized development costs of R&D; and (d) cancellation of the fair value model of accounting for property, plant and equipment and investment properties and incorporation of the cost model of accounting.
(2) Cash EquivalentsCash equivalents are short-term investments that are readily convertible into cash and that are exposed to insignificant risk of changes in value.
Cash equivalents include time deposits, certificates of deposit, commercial paper and bond funds, all of which mature or become due within three months of the date of acquisition.
(3) Investment SecuritiesInvestment securities held by the Group are classified into two categories.
Available-for-sale securities with market quotations are stated at fair value. Unrealized gains and losses on these securities are stated, net of applicable taxes, as “unrealized gain (loss) on available-for-sale securities” on the consolidated balance sheet. The fair value is determined based on the average market price during the month before the balance sheet date.
Available-for-sale securities without market quotations are stated at cost by using the moving-average method.In cases where the fair value of equity securities issued by nonconsolidated subsidiaries and associates, or available-
for-sale securities, has declined significantly and such impairment is deemed other than temporary, those securities are written down to the fair value and the resulting losses are included in net profit or loss for the period.
(4) InventoriesInventories are stated at the lower of cost or market value. The costs of the primary finished products such as gold, silver, copper, zinc, lead, platinum, palladium, rhodium, cadmium, and other metals, and imported raw materials are determined by the first-in, first-out method. The costs of other finished products and other raw materials are determined by the moving-average method or the specific identification method, etc.
Notes to Consolidated Financial Statements
Page 10 of 400527503262609_013.htm
2021/09/14https://edit.xsmart.jp/mdn_manager/Common/ASHX/AsyncHTMLOutput.ashx
Notes to Consolidated Financial StatementsDOWA HOLDINGS CO., LTD. and Its Consolidated SubsidiariesFor the years ended March 31, 2021 and 2020
1. Basis of Presentation of the Consolidated Financial StatementsThe accompanying consolidated financial statements have been prepared in accordance with the provisions set forth in the Japanese Financial Instruments and Exchange Act and its related accounting regulations and in accordance with accounting principles generally accepted in Japan (“Japanese GAAP”), which are different in certain respects as to the application and disclosure requirements of International Financial Reporting Standards.
Japanese yen figures less than a million yen are rounded down to the nearest million yen, except for per share data.In preparing these consolidated financial statements, certain reclassifications and rearrangements have been made to
the consolidated financial statements issued domestically in order to present them in a form which is more familiar to readers outside Japan. In addition, certain reclassifications have been made in the 2020 consolidated financial statements to conform to the classifications used in 2021.
The consolidated financial statements are stated in Japanese yen, the currency of the country in which DOWA HOLDINGS CO., LTD. (the “Company”) is incorporated and operates. The translations of Japanese yen amounts into U.S. dollar amounts are included solely for the convenience of readers outside Japan and have been made at the rate of ¥110.71 to U.S. $1, the approximate rate of exchange at March 31, 2021. Such translations should not be construed as representations that the Japanese yen amounts could be converted into U.S. dollars at that or any other rate.
2. Summary of Significant Accounting Policies(1) Consolidation
The consolidated financial statements as of March 31, 2021, include the accounts of the Company and its 87 (82 in 2020) significant subsidiaries (together, the “Group”).
Under the control and influence concepts, those significant companies in which the Company, directly or indirectly, is able to exercise control over operations are fully consolidated, and those companies over which the Group has the ability to exercise significant influence are accounted for by the equity method.
Investments in 18 (18 in 2020) associated companies are accounted for by the equity method.Investments in the remaining nonconsolidated subsidiaries and associated companies are stated at cost. If the equity
method of accounting had been applied to the investments in these companies, the effect on the accompanying consolidated financial statements would not be material.
The excess of the cost of acquisition over the fair value of the net assets of an acquired subsidiary at the date of acquisition is amortized on a straight-line basis within 20 years.
All significant intercompany balances and transactions have been eliminated in consolidation. All material unrealized profit included in assets resulting from transactions within the Group is also eliminated.
(a) Changes in Consolidated Subsidiaries and Associates(2021)The consolidated financial statements for the year ended March 31, 2021 (fiscal 2021), now include DOWA METALTECH MEXICO, S.A.de C.V. , DOWA HD Europe GmbH, and 3 other companies which were nonconsolidated subsidiaries in the consolidated financial statements for the year ended March 31, 2020, because they were not material subsidiaries.
(2020)The consolidated financial statements for the year ended March 31, 2020 (fiscal 2020), now include Dowali Precision Co., Ltd. and DOWA THERMOTECH MEXICO, S.A. DE C.V. which were nonconsolidated subsidiaries in the consolidated financial statements for the year ended March 31, 2019, because they were not material subsidiaries. Furthermore, DOWA ECO-SYSTEM SINGAPORE PTE. LTD. and TECHNOCHEM ENVIRONMENTAL COMPLEX PTE. LTD., which were previously classified as consolidated subsidiaries, have been extinguished and removed as consolidated subsidiaries as a result of an absorption-type merger with MODERN ASIA ENVIRONMENTAL
Page 9 of 400527503262609_013.htm
2021/09/14https://edit.xsmart.jp/mdn_manager/Common/ASHX/AsyncHTMLOutput.ashx
Notes to Consolidated Financial StatementsDOWA HOLDINGS CO., LTD. and Its Consolidated SubsidiariesFor the years ended March 31, 2021 and 2020
DOWA HOLDINGS CO., LTD.15 16FINANCIAL SECTION 2021

(13) Retirement Allowances for Directors and Audit & Supervisory Board MembersRetirement allowance for directors and Audit & Supervisory Board members of some of the Company’s subsidiaries are recorded as a liability at the amount that would be required if all directors and Audit & Supervisory Board members retired at each balance sheet date.
(14) Allowance for Environmental MeasuresThe Group adopted the Act Concerning Special Measures against PCB Waste (Act No. 65 of June 22, 2001) and recorded the estimated cost for the disposal of polychlorinated biphenyl waste. Those amounts are included in other long-term liabilities in the consolidated balance sheet.
(15) Construction ContractsIn December 2007, the ASBJ issued ASBJ Statement No. 15, “Accounting Standard for Construction Contracts,” and ASBJ Guidance No. 18, “Guidance on Accounting Standard for Construction Contracts.” Under this accounting standard, construction revenue and construction costs should be recognized by the percentage-of-completion method if the outcome of a construction contract can be estimated reliably. When total construction revenue, total construction costs, and the stage of completion of the contract at the balance sheet date can be reliably measured, the outcome of a construction contract is deemed to be estimated reliably. If the outcome of a construction contract cannot be reliably estimated, the completed-contract method should be applied. When it is probable that the total construction costs will exceed total construction revenue, an estimated loss on the contract should be immediately recognized by providing for a loss on construction contracts.
(16) Accounting Treatment for Consumption TaxAll transactions are recorded net of consumption tax.
(17) Income TaxesThe provision for income taxes is computed based on the pretax income included in the consolidated statement of income. The asset and liability approach is used to recognize deferred tax assets and liabilities for the expected future tax consequences of temporary differences between the carrying amounts and the tax bases of assets and liabilities. Deferred taxes are measured by applying currently enacted income tax rates to the temporary differences.
(18) Consolidated Tax ReturnThe Group files a tax return under the consolidated taxation system, which allows companies to base tax payments on the combined profits or losses of the Parent company and its wholly owned domestic subsidiaries.
(19) Adoption of tax effect accounting for the transition from the consolidated taxation system to the group tax sharing system
The Company adopted the group tax sharing system established under the “Act on Partial Revision of the Income Tax Act, etc.” (Act No. 8 of 2020), as well as the revision of the non-consolidated taxation system. However, domestic consolidated companies have not yet adopted the provisions of Paragraph 44 of the “Implementation Guidance on Tax Effect Accounting” (ASBJ Guidance No. 28, issued on February 16, 2018), in accordance with the treatment under Paragraph 3 of the “Practical Solution on the Treatment of Tax Effect Accounting for the Transition from the Consolidated Taxation System to the Group Tax Sharing System” (PITF No. 39, issued on March 31, 2020). Therefore, the amounts of deferred tax assets and deferred tax liabilities are calculated based on the provisions of the Income Tax Act prior to the revision.
Page 12 of 400527503262609_013.htm
2021/09/14https://edit.xsmart.jp/mdn_manager/Common/ASHX/AsyncHTMLOutput.ashx
(5) Property, Plant and EquipmentProperty, plant and equipment, including significant renewals and additions, are stated at cost. Repairs and maintenance expenses are charged to current income. Depreciation is mainly computed by the declining-balance method based on the estimated useful lives of the respective assets.
The Company and domestic consolidated subsidiaries have computed the depreciation for buildings (excluding leasehold improvements and building improvements) acquired on or after April 1, 1998, as well as for building improvements and structures acquired on or after April 1, 2016, by the straight-line method.
Depreciation of the landfill is computed using the production method, while the straight-line method is applied to all property, plant and equipment of consolidated foreign subsidiaries.
Property and equipment are carried at cost, less gains deferred on government subsidies of certain assets.
(6) Long-lived AssetsThe Group reviews its long-lived assets for impairment whenever events or changes in circumstances indicate the carrying amount of an asset or asset group may not be recoverable.
An impairment loss would be recognized if the carrying amount of an asset or asset group exceeds the sum of the undiscounted future cash flows expected to result from the continued use and eventual disposition of the asset or asset group.
The impairment loss would be measured as the amount by which the carrying amount of the asset exceeds its recoverable amount, which is the higher of the discounted cash flows from the continued use and eventual disposition of the asset or the net selling price at disposition.
(7) LeasesFinance lease transactions are capitalized to recognize lease assets and lease obligations in the consolidated balance sheet.
(8) Research and DevelopmentResearch and development costs are charged to income as incurred.
(9) Allowance for Doubtful AccountsThe allowance for doubtful accounts is stated in amounts considered to be appropriate based on the Group’s past credit loss experience and an evaluation of potential losses in the receivables outstanding.
(10) Accrued BonusesAccrued bonuses to employees are provided for at the estimated amounts, which the Group is obliged to pay to employees after the year-end.
(11) Accrued Directors’ BonusesAccrued bonuses to directors, including bonuses for the portion corresponding to the corporate performance-based remuneration system, are provided for at the estimated amounts, which the Group is obliged to pay to directors after the year-end.
(12) Retirement and Pension PlansThe Company and consolidated subsidiaries have unfunded retirement benefit plans for employees.
The Company accounts for the liability for retirement benefits based on the projected benefit obligations at the balance sheet date. The projected benefit obligations are attributed to periods on a benefit formula basis. Actuarial gains and losses are amortized on a straight-line basis over five years within the average remaining service period. Past service costs are amortized on a straight-line basis over five years within the average remaining service period.
Page 11 of 400527503262609_013.htm
2021/09/14https://edit.xsmart.jp/mdn_manager/Common/ASHX/AsyncHTMLOutput.ashx
DOWA HOLDINGS CO., LTD.17 18FINANCIAL SECTION 2021

The accounting standard and guidance are effective for annual periods beginning on or after April 1, 2021.
The Company expects to apply the accounting standard and guidance for annual periods beginning on or after April 1, 2021. The total amount affected by applying the accounting standard and guidance will be reflected in net assets at the beginning of the next consolidated fiscal year, and the balance of retained earnings at that time is expected to decrease by ¥233 million (U.S. $2,109 thousand).
(b) Fair Value MeasurementOn July 4, 2019, the ASBJ issued ASBJ Statement No. 30, "Accounting Standard for Fair Value Measurement", ASBJ Guidance No. 31, "Implementation Guidance on Accounting Standard for Fair Value Measurement", ASBJ Statement No. 9, "Accounting Standard for Measurement of Inventories”, and ASBJ Statement No. 10, “Accounting Standard for Financial Instruments”. Also, on March 31, 2020, the ASBJ issued ASBJ Guidance No. 19, “Implementation Guidance on Disclosures about Fair Value of Financial Instruments”.
“Accounting Standard for Fair Value Measurement” and “Implementation Guidance on Accounting Standard for Fair Value Measurement” (hereinafter, collectively referred to as "Accounting Standard and Guidance for Fair Value Measurement") were developed to increase comparability with international accounting standards and had been established to provide guidance for matters related to fair value measurement methods. "Accounting Standard and Guidance for Fair Value Measurement" is applied to the fair value of the items below.ⅰ) Financial instruments highlighted under “Accounting Standard for Financial Instruments”ⅱ) Inventory assets held for trading purposes highlighted under “Accounting Standard for Measurement of Inventories”
In addition, “Implementation Guidance on Disclosures about Fair Value of Financial Instruments” has been revised, and discloser items, including the fair value of financial instruments by level, have been established.
These accounting standards are effective for annual periods beginning on or after April 1, 2021.
The Company anticipates to apply these accounting standards for annual periods beginning on or after April 1, 2021. The effects on the consolidated financial statements will be minor.
3. Significant Accounting Estimate Investments and loans receivable in Los Gatos Mine in Mexico
DOWA Metals & Mining Co., Ltd., an operating company in the Group's Nonferrous Metals Business, owns 30% of shares issued by the operating companies who operate the Los Gatos Mine in Mexico. As of the end of the consolidated fiscal year, the book value of the investments to these operating companies were ¥5,687 million (U.S. $51,370 thousands) recorded in the account of “Investments in and advances to nonconsolidated subsidiaries and associates”, and the book value of the loans receivable to these operating companies were ¥24,664 million (U.S. $222,783 thousands) recorded in the same accounts. The Group assesses the amount of these investments and loans receivable by comparing the amount of enterprise value, based on the total amount of future cash flows expected to be earned by the Los Gatos mine with the book value. The total amount of future cash flows is calculated using a complex calculation model, taking into account of elements such as the metal concentrate grade, the forecast of the market prices of the metals, the foreign exchange rates, the operational costs, and the discount rate. The metal concentrate grade is estimated based on the results of feasibility studies and the results of the actual mining and exploration activities. The forecast of the market prices of the metals and foreign exchange rates are calculated based on forecasts estimated by several external specialists. Operational costs are estimated based on the actual operational costs taking into account of the effects as a result of the feasible improvement measures and the changes in the external environments. The discount rate is determined based on the nature of the business.If there are certain changes in the elements for the Group's estimation and the total amount of future cash flows falls below the book value, it could result in the Group's consideration that it could not be recoverable and as such it will impact the consolidated financial statements.
Page 14 of 400527503262609_013.htm
2021/09/14https://edit.xsmart.jp/mdn_manager/Common/ASHX/AsyncHTMLOutput.ashx
Notes to Consolidated Financial Statements
(20) Foreign Currency Translations and Consolidated Foreign Currency Financial StatementsAll monetary receivables and payables denominated in foreign currencies are translated into Japanese yen at the spot exchange rates as of the balance sheet date and foreign exchange gains and losses from translation are recognized in the consolidated statement of income. Assets and liabilities of foreign subsidiaries are converted into Japanese yen at the spot exchange rates prevailing on the balance sheet date of the foreign subsidiaries. Revenues and expenses of foreign subsidiaries are converted into Japanese yen at the average exchange rate for the accounting period of foreign subsidiaries. Translation differences are included as non-controlling interests and foreign currency translation adjustments in equity.
(21) Derivatives and Hedging ActivitiesThe Group uses derivative financial instruments to manage its exposures to fluctuations in nonferrous metal, foreign exchange, and interest rates.
Nonferrous metal forward contracts, foreign exchange forward contracts, and interest rate swaps are utilized by the Group to reduce risks of fluctuation in nonferrous metal rates, foreign currency exchange, and interest rates. The Group does not enter into derivatives for trading or speculative purposes.
Derivative financial instruments and foreign currency transactions are classified and accounted for as follows:a) All derivatives are recognized as either assets or liabilities and measured at fair value, and gains or losses on derivative transactions are recognized in the consolidated statement of income.b) For derivatives used for hedging purposes, if derivatives qualify for hedge accounting because of high correlation and effectiveness between the hedging instruments and the hedged items, gains or losses on derivatives are deferred until maturity of the hedged transactions.
Foreign exchange forward contracts employed to hedge foreign exchange exposures for export sales and import purchases are measured at fair value and the unrealized gains or losses are mainly recognized in income. Forward contracts applied for forecasted (or committed) transactions are also measured at fair value, but the unrealized gains or losses are deferred until the underlying transactions are completed.
Interest rate swaps which qualify for hedge accounting and meet specific matching criteria are not remeasured at market value but the differential paid or received under the swap agreements is recognized and included in interest expense.
(22) Per Share InformationBasic net income per share is based on the weighted-average number of shares of common stock of the Company issued and outstanding during the respective year.
(23) New Accounting Pronouncements(a) Revenue RecognitionOn March 31, 2020, the ASBJ issued ASBJ Statement No. 29, "Accounting Standard for Revenue Recognition," and on March 26, 2021 ASBJ Guidance No. 30, "Implementation Guidance on Accounting Standard for Revenue Recognition." The core principle of the standard and guidance is that an entity should recognize revenue to depict the transfer of promised goods or services to customers in an amount that reflects the consideration to which the entity expects to be entitled in exchange for those goods or services. An entity should recognize revenue in accordance with that core principle by applying the following steps:Step 1: Identify the contract(s) with a customerStep 2: Identify the performance obligations in the contractStep 3: Determine the transaction priceStep 4: Allocate the transaction price to the performance obligations in the contract Step 5: Recognize revenue when (or as) the entity satisfies a performance obligation
Page 13 of 400527503262609_013.htm
2021/09/14https://edit.xsmart.jp/mdn_manager/Common/ASHX/AsyncHTMLOutput.ashxDOWA HOLDINGS CO., LTD.19 20FINANCIAL SECTION 2021

6. Long-lived Assets(2021)The Group reviewed its long-lived assets for impairment as of March 31, 2021. As a result, the Group recognized an impairment loss of ¥2,252 million (U.S. $20,341 thousand) included in other expenses related to the building and machinery asset group for the heat treatment processing business in Mexico, the electroplating business in Mexico, the smelting business in Kosaka Town, the waste treatment business in Thailand, and the idle asset group due to significant decreases in fair value. The carrying amount of the relevant assets were written down to the recoverable amount for the year ended March 31, 2021.
(2020)The Group reviewed its long-lived assets for impairment as of March 31, 2020. As a result, the Group recognized an impairment loss of ¥1,181 million included in other expenses related to the building and machinery asset group for the heat treatment processing business in Mexico, the waste treatment business in Singapore, the chemical production facilities in Honjo City, the waste treatment business in Thailand, the brass alloy rods production facilities in Asahi City, the platinum group metals smelting business in the United States, the soil remediation business in Chiyoda Ward (due to significant decreases of business profitability), and the idle asset group due to significant decreases in fair value. The carrying amount of the relevant assets were written down to the recoverable amount for the year ended March 31, 2020.
Page 16 of 400527503262609_013.htm
2021/09/14https://edit.xsmart.jp/mdn_manager/Common/ASHX/AsyncHTMLOutput.ashx
Millions of yen
Thousands ofU.S. dollars
(Note 1)2021 2020 2021
Cash and time deposits ¥ 18,277 ¥ 31,730 $ 165,097
Time deposits with deposit terms of over three months (957) (1,498) (8,647)
Cash and cash equivalents ¥ 17,320 ¥ 30,232 $ 156,450
Millions of yen
Thousands ofU.S. dollars
(Note 1)2021 2020 2021
Increase in investment in securities ¥ 3,436 ¥ 5,496 $ 31,040
Decrease in long-term loans receivable 3,433 5,498 31,017
Millions of yen
Thousands ofU.S. dollars
(Note 1)2021 2020 2021
Investments in securities
Available-for-sale securities with market quotations ¥ 24,192 ¥ 16,969 $ 218,520
Unlisted securities 2,673 2,698 24,147
Subtotal 26,865 19,667 242,667Investments in and advances to nonconsolidated subsidiaries and associates
Investments in securities 38,017 45,364 343,399
Long-term loans receivable 27,802 33,628 251,128
Subtotal 65,820 78,992 594,527
Total ¥ 92,685 ¥ 98,660 $ 837,195
Millions of yen
Thousands ofU.S. dollars
(Note 1)2021 2020 2021
Proceeds from sales ¥8,720 ¥2,557 $ 78,767
Gain on sales 5,029 1,556 45,432
Loss on sales 3 0 33
4. Consolidated Statement of Cash Flows(1) Cash and cash equivalentsCash and cash equivalents at March 31, 2021 and 2020, consisted of the following:
(2) Non-cash investing and financing activityThe increase (decrease) in assets related to investment at March 31, 2021 and 2020, consisted of the following:
5. InvestmentInvestment securities as of March 31, 2021 and 2020, consisted of the following:
(Note) Certain reclassifications have been made in the 2020 to conform to the classifications used in 2021.
The net unrealized gains on the available-for-sale securities with market quotations as of March 31, 2021 and 2020, were ¥14,590 million (U.S. $131,791 thousand) and ¥6,616 million, respectively.
The information for available-for-sale securities which were sold during the years ended March 31, 2021 and 2020, is as follows:
Page 15 of 400527503262609_013.htm
2021/09/14https://edit.xsmart.jp/mdn_manager/Common/ASHX/AsyncHTMLOutput.ashx
DOWA HOLDINGS CO., LTD.21 22FINANCIAL SECTION 2021
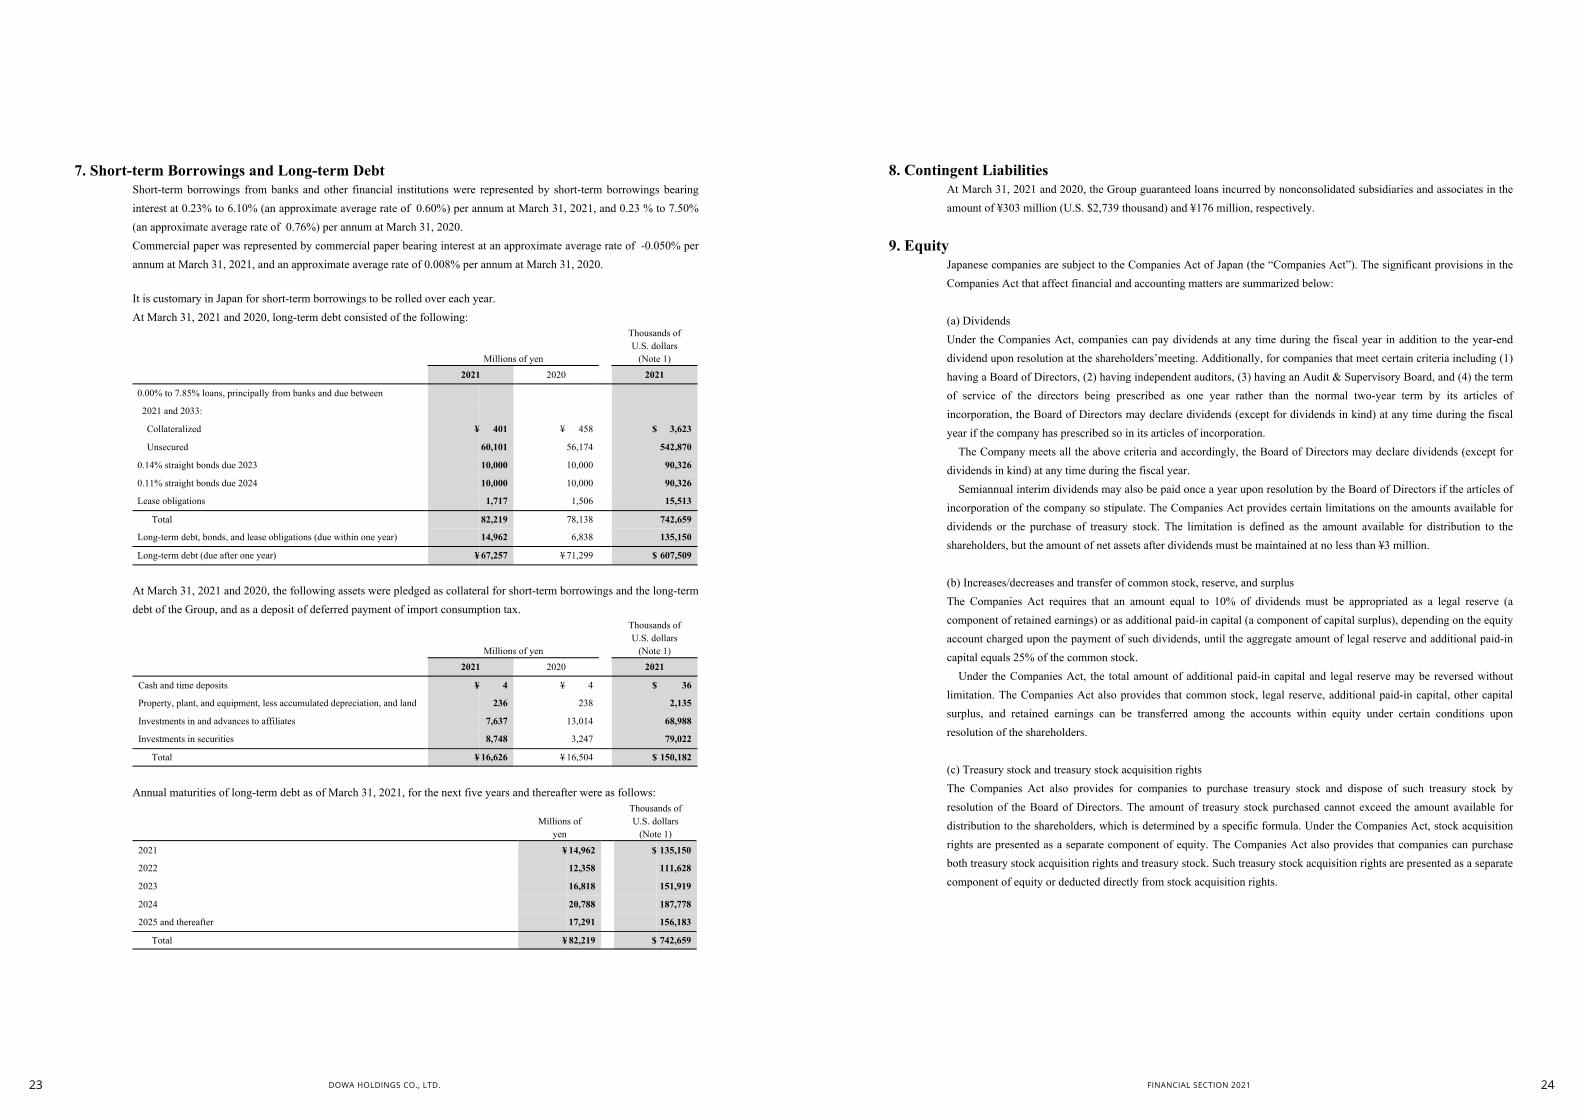
8. Contingent LiabilitiesAt March 31, 2021 and 2020, the Group guaranteed loans incurred by nonconsolidated subsidiaries and associates in the amount of ¥303 million (U.S. $2,739 thousand) and ¥176 million, respectively.
9. EquityJapanese companies are subject to the Companies Act of Japan (the “Companies Act”). The significant provisions in the Companies Act that affect financial and accounting matters are summarized below:
(a) DividendsUnder the Companies Act, companies can pay dividends at any time during the fiscal year in addition to the year-end dividend upon resolution at the shareholders’meeting. Additionally, for companies that meet certain criteria including (1) having a Board of Directors, (2) having independent auditors, (3) having an Audit & Supervisory Board, and (4) the term of service of the directors being prescribed as one year rather than the normal two-year term by its articles of incorporation, the Board of Directors may declare dividends (except for dividends in kind) at any time during the fiscal year if the company has prescribed so in its articles of incorporation.
The Company meets all the above criteria and accordingly, the Board of Directors may declare dividends (except for dividends in kind) at any time during the fiscal year.
Semiannual interim dividends may also be paid once a year upon resolution by the Board of Directors if the articles of incorporation of the company so stipulate. The Companies Act provides certain limitations on the amounts available for dividends or the purchase of treasury stock. The limitation is defined as the amount available for distribution to the shareholders, but the amount of net assets after dividends must be maintained at no less than ¥3 million.
(b) Increases/decreases and transfer of common stock, reserve, and surplusThe Companies Act requires that an amount equal to 10% of dividends must be appropriated as a legal reserve (a component of retained earnings) or as additional paid-in capital (a component of capital surplus), depending on the equity account charged upon the payment of such dividends, until the aggregate amount of legal reserve and additional paid-in capital equals 25% of the common stock.
Under the Companies Act, the total amount of additional paid-in capital and legal reserve may be reversed without limitation. The Companies Act also provides that common stock, legal reserve, additional paid-in capital, other capital surplus, and retained earnings can be transferred among the accounts within equity under certain conditions upon resolution of the shareholders.
(c) Treasury stock and treasury stock acquisition rightsThe Companies Act also provides for companies to purchase treasury stock and dispose of such treasury stock by resolution of the Board of Directors. The amount of treasury stock purchased cannot exceed the amount available for distribution to the shareholders, which is determined by a specific formula. Under the Companies Act, stock acquisition rights are presented as a separate component of equity. The Companies Act also provides that companies can purchase both treasury stock acquisition rights and treasury stock. Such treasury stock acquisition rights are presented as a separate component of equity or deducted directly from stock acquisition rights.
Page 18 of 400527503262609_013.htm
2021/09/14https://edit.xsmart.jp/mdn_manager/Common/ASHX/AsyncHTMLOutput.ashx
Millions of yen
Thousands of U.S. dollars
(Note 1)2021 2020 2021
0.00% to 7.85% loans, principally from banks and due between
2021 and 2033:
Collateralized ¥ 401 ¥ 458 $ 3,623
Unsecured 60,101 56,174 542,870
0.14% straight bonds due 2023 10,000 10,000 90,326
0.11% straight bonds due 2024 10,000 10,000 90,326
Lease obligations 1,717 1,506 15,513
Total 82,219 78,138 742,659
Long-term debt, bonds, and lease obligations (due within one year) 14,962 6,838 135,150
Long-term debt (due after one year) ¥ 67,257 ¥ 71,299 $ 607,509
Millions of yen
Thousands ofU.S. dollars
(Note 1)2021 2020 2021
Cash and time deposits ¥ 4 ¥ 4 $ 36
Property, plant, and equipment, less accumulated depreciation, and land 236 238 2,135
Investments in and advances to affiliates 7,637 13,014 68,988
Investments in securities 8,748 3,247 79,022
Total ¥ 16,626 ¥ 16,504 $ 150,182
Millions ofyen
Thousands ofU.S. dollars
(Note 1)
2021 ¥ 14,962 $ 135,150
2022 12,358 111,628
2023 16,818 151,919
2024 20,788 187,778
2025 and thereafter 17,291 156,183
Total ¥ 82,219 $ 742,659
Notes to Consolidated Financial Statements
7. Short-term Borrowings and Long-term DebtShort-term borrowings from banks and other financial institutions were represented by short-term borrowings bearing interest at 0.23% to 6.10% (an approximate average rate of 0.60%) per annum at March 31, 2021, and 0.23 % to 7.50% (an approximate average rate of 0.76%) per annum at March 31, 2020.Commercial paper was represented by commercial paper bearing interest at an approximate average rate of -0.050% per annum at March 31, 2021, and an approximate average rate of 0.008% per annum at March 31, 2020.
It is customary in Japan for short-term borrowings to be rolled over each year.At March 31, 2021 and 2020, long-term debt consisted of the following:
At March 31, 2021 and 2020, the following assets were pledged as collateral for short-term borrowings and the long-term debt of the Group, and as a deposit of deferred payment of import consumption tax.
Annual maturities of long-term debt as of March 31, 2021, for the next five years and thereafter were as follows:
Page 17 of 400527503262609_013.htm
2021/09/14https://edit.xsmart.jp/mdn_manager/Common/ASHX/AsyncHTMLOutput.ashxDOWA HOLDINGS CO., LTD.23 24FINANCIAL SECTION 2021

March 31, 2021 1 year or less
After 1 year
through 2 years
After 2 years
through 3 years
After 3 years
through 4 years
After 4 years
through 5 years
After 5 years Total
Deferred tax assets relating to tax loss carryforwards (a) 106 61 7 15 19 373 583
Less valuation allowances for tax loss carryforwards (42) (60) (7) (15) (19) (329) (475)
Net deferred tax assets relating to tax loss carryforwards 63 0 0 0 0 43 (b)108
March 31, 2021 1 year or less
After 1 year
through 2 years
After 2 years
through 3 years
After 3 years
through 4 years
After 4 years
through 5 years
After 5 years Total
Deferred tax assets relating to tax loss carryforwards (a) 958 551 63 142 179 3,376 5,273
Less valuation allowances for tax loss carryforwards (383) (550) (63) (140) (179) (2,979) (4,296)
Net deferred tax assets relating to tax loss carryforwards 575 1 0 2 0 397 (b)976
March 31, 2020 1 year or less
After 1 year
through 2 years
After 2 years
through 3 years
After 3 years
through 4 years
After 4 years
through 5 years
After 5 years Total
Deferred tax assets relating to tax loss carryforwards (a) 213 117 60 7 33 343 777
Less valuation allowances for tax loss carryforwards (161) (110) (60) (7) (27) (317) (685)
Net deferred tax assets relating to tax loss carryforwards 52 7 - - 6 26 (b)92
million (U.S. $6,291 thousand) for bad debt loss.
(*2) Certain reclassifications have been made in the 2020 to conform to the classifications used in 2021.
(*3) The expiration of tax loss carryforwards, the related valuation allowances and the resulting net deferred tax assets as
of March 31, 2021 and 2020, were as follows:
Millions of yen
Thousands of U.S. Dollars
Millions of yen
(a) Tax loss carryforwards were calculated using the statutory tax rate.
(b) Out of tax loss carryforward as of March 31, 2021 and 2020 of ¥583 million (U.S. $5,273 thousand) and ¥777 million
were calculated using the statutory tax rate. Deferred tax assets of ¥108 million (U.S. $976 thousand) and ¥92 million
were recognized, because utilization of such assets are supported by probable future taxable net income.
Page 20 of 400527503262609_013.htm
2021/09/14https://edit.xsmart.jp/mdn_manager/Common/ASHX/AsyncHTMLOutput.ashx
Millions of yen
Thousands ofU.S. dollars
(Note 1)2021 2020 2021
Deferred tax assets
Reserve for employees’retirement benefits ¥ 5,908 ¥ 5,711 $ 53,365
Unrealized earnings 2,832 2,672 25,581
Loss on impairments of property, plant and equipment 2,274 1,826 20,543
Loss on devaluation of investment securities 1,387 2,017 12,530
Accrued bonus 1,306 1,216 11,798
Loss on devaluation of inventories 1,120 1,288 10,125
Deferred losses on derivatives under hedge accounting 835 19 7,549
Foreign tax credit(*2) 805 7 7,279
Bad debt loss 696 696 6,291
Accrued enterprise tax 593 470 5,358
Consolidated subsidiaries’deficit 583 777 5,273Reserve for directors’and Audit & Supervisory Board members’ retirement benefits
231 228 2,091
Loss on disposal of property, plant and equipment 204 220 1,845
Excess depreciation 156 136 1,415
Allowance for doubtful accounts 23 78 212
Unrealized loss on available-for-sale securities 0 10 0
Others(*2) 3,374 3,446 30,484
Total 22,335 20,824 201,747
Less valuation allowance for tax loss carryforwards(*3) (475) (685) (4,296)
Less valuation allowance for temporary differences (7,098) (7,287) (64,115)
Total valuation allowance(*1) (7,573) (7,972) (68,411)
Total deferred tax assets 14,761 12,852 133,335
Deferred tax liabilities
Unrealized gain on available-for-sale securities (4,367) (2,219) (39,450)
Unrealized gain on land (732) (732) (6,612)
Reserve for overseas investment loss (52) (52) (476)
Enterprise tax receivable (11) (6) (104)
Deferred gain on derivatives under hedge accounting -- (1,014) --
Others (4,470) (4,101) (40,380)
Total deferred tax liabilities (9,634) (8,126) (87,025)
Net deferred tax assets ¥ 5,126 ¥ 4,725 $ 46,310
Notes to Consolidated Financial Statements
10. Income TaxesThe Company and its domestic subsidiaries are subject to Japanese national and local income taxes which, in the aggregate, resulted in normal effective statutory tax rates of approximately 31.3% for each of the years ended March 31, 2021 and 2020.
The tax effects of significant temporary differences and tax loss carryforwards which resulted in deferred tax assets and liabilities at March 31, 2021 and 2020, are as follows:
(*1) The amount of valuation allowance has decreased by ¥398 million (U.S. $3,599 thousand). The main reason for this
decrease is the recognition of a valuation allowance of ¥673 million (U.S. $6,079 thousand) for foreign tax credit and a
valuation allowance of ¥426 million (U.S. $3,855 thousand) for loss on impairment of property, plant and equipment, in
addition to the fact that consolidated subsidiaries no longer recognize the valuation allowance of ¥649 million (U.S.
$5,866 thousand) for valuation loss on devaluation of investment securities or the valuation allowance of ¥696
Page 19 of 400527503262609_013.htm
2021/09/14https://edit.xsmart.jp/mdn_manager/Common/ASHX/AsyncHTMLOutput.ashxDOWA HOLDINGS CO., LTD.25 26FINANCIAL SECTION 2021

Millions of yen
Thousands of U.S. dollars
(Note 1)2021 2020 2021
Balance at beginning of year ¥ 11,952 ¥ 11,483 $ 107,965
Service cost 1,004 923 9,069
Interest expense 45 38 408
Actuarial (gains) losses 232 (41) 2,098
Benefits paid (416) (459) (3,760)
Past service cost (32) - (294)
Other (74) 8 (669)
Balance at end of year ¥ 12,711 ¥ 11,952 $ 114,818
Millions of yen
Thousands of U.S. dollars
(Note 1)2021 2020 2021
Funded defined benefit obligation ¥ - ¥ - $ --
Plan assets - - --
- - --
Unfunded defined benefit obligation 12,711 11,952 114,818
Net liability arising from defined benefit obligation ¥ 12,711 ¥ 11,952 $ 114,818
Millions of yen
Thousands of U.S. dollars
(Note 1)2021 2020 2021
Service cost ¥ 1,004 ¥ 923 $ 9,069
Interest expense 45 38 408
Recognized actuarial (gains) losses 158 179 1,427
Net periodic benefit costs ¥ 1,207 ¥ 1,141 $ 10,906
Notes to Consolidated Financial Statements
13. Retirement and Pension PlansThe Company and its consolidated subsidiaries have adopted lump-sum benefit plans as their defined benefit pension plans and the Company and certain consolidated subsidiaries have adopted contributory defined benefit pension plans. In addition, certain consolidated subsidiaries have adopted the Smaller Enterprise Retirement Allowance Mutual Aid (SERAMA) Scheme. Moreover, the payment of a premium severance amount that falls outside the scope of retirement benefit obligations based on computations that comply with accounting standards for retirement benefits may arise at the time of an employee’s retirement.
Further, the lump-sum benefit plans adopted by certain consolidated subsidiaries calculate the liabilities for employees’ retirement benefits and retirement benefit expenses using the simplified method.
Defined benefit plans excluding plans applying the simplified method(1) The changes in defined benefit obligations relating to defined benefit plans in the consolidated fiscal years ended March 31, 2021 and 2020, were as follows:
(2) Reconciliation between the liability recorded in the consolidated balance sheet and the balances of defined benefit obligation and plan assets was as follows:
(3) The components of net periodic benefit costs for the years ended March 31, 2021 and 2020, were as follows:
Page 22 of 400527503262609_013.htm
2021/09/14https://edit.xsmart.jp/mdn_manager/Common/ASHX/AsyncHTMLOutput.ashx
2021 2020Normal effective statutory tax rate 31.3 % 31.3 %
Tax credits (1.8) (1.6)
Nontaxable items, including dividend income (0.1) (0.2)
Equity in earnings of affiliates 3.7 (0.9)
Retained earnings of affiliated companies 0.4 1.0
Nondeductible items, including entertainment expenses 0.4 0.5
Valuation allowance 0.3 3.0
Inhabitants’tax 0.3 0.4
Foreign source taxes 0.2 0.7
Others 0.3 0.9
Actual effective tax rate 35.1 % 35.1 %
Millions of yen
Thousands ofU.S. dollars
(Note 1)2021 2020 2021
Operating leases (lessee)
Within one year ¥ 193 ¥ 268 $ 1,746
Over one year 314 515 2,838
Total ¥ 507 ¥ 784 $ 4,585
A reconciliation between the normal effective statutory tax rates and the actual effective tax rates reflected in the accompanying consolidated statement of income for the year ended March 31, 2021 with the corresponding figures for 2020, is as follows:
11. Research and Development CostsResearch and development costs charged to income were ¥5,781 million (U.S. $52,225 thousand) and ¥5,554 million for the years ended March 31, 2021 and 2020, respectively.
12. LeasesThe minimum rental commitments under noncancelable operating leases due at March 31, 2021 and 2020, were as follows:
Page 21 of 400527503262609_013.htm
2021/09/14https://edit.xsmart.jp/mdn_manager/Common/ASHX/AsyncHTMLOutput.ashx
DOWA HOLDINGS CO., LTD.27 28FINANCIAL SECTION 2021
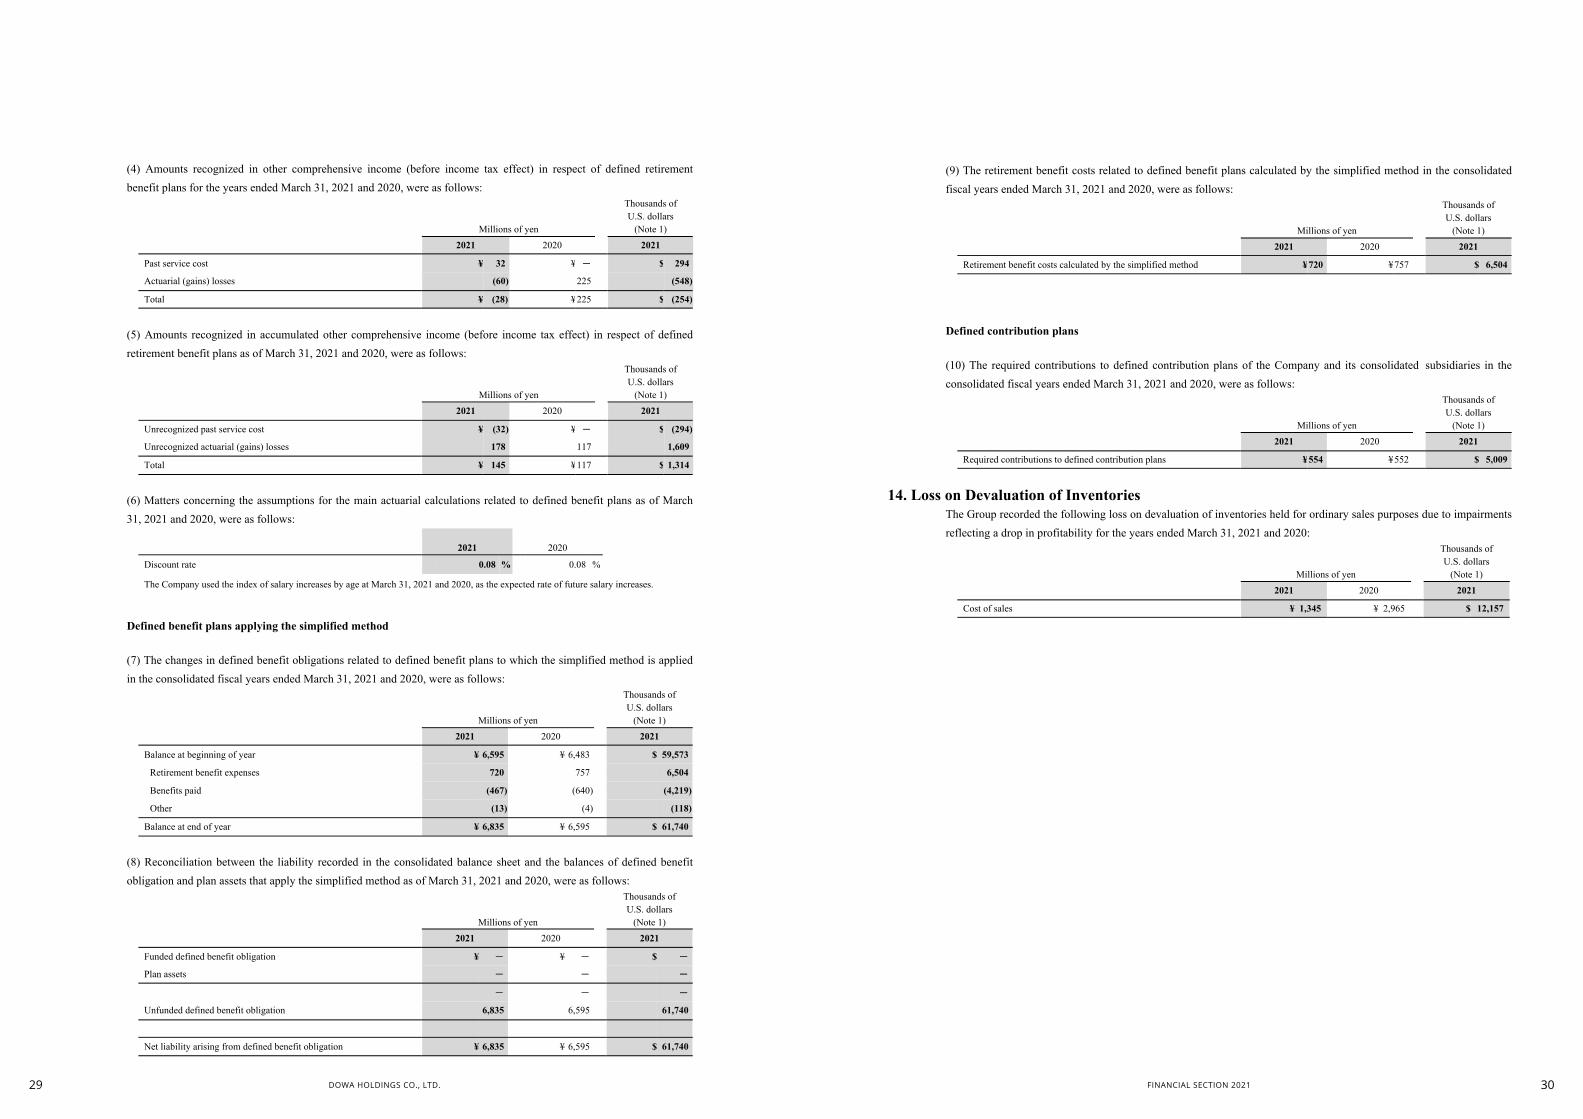
Millions of yen
Thousands of U.S. dollars
(Note 1)2021 2020 2021
Retirement benefit costs calculated by the simplified method ¥720 ¥757 $ 6,504
Millions of yen
Thousands of U.S. dollars
(Note 1)2021 2020 2021
Required contributions to defined contribution plans ¥554 ¥552 $ 5,009
Millions of yen
Thousands of U.S. dollars
(Note 1)2021 2020 2021
Cost of sales ¥ 1,345 ¥ 2,965 $ 12,157
Notes to Consolidated Financial Statements
(9) The retirement benefit costs related to defined benefit plans calculated by the simplified method in the consolidated fiscal years ended March 31, 2021 and 2020, were as follows:
Defined contribution plans
(10) The required contributions to defined contribution plans of the Company and its consolidated subsidiaries in the consolidated fiscal years ended March 31, 2021 and 2020, were as follows:
14. Loss on Devaluation of InventoriesThe Group recorded the following loss on devaluation of inventories held for ordinary sales purposes due to impairments reflecting a drop in profitability for the years ended March 31, 2021 and 2020:
Page 24 of 400527503262609_013.htm
2021/09/14https://edit.xsmart.jp/mdn_manager/Common/ASHX/AsyncHTMLOutput.ashx
Millions of yen
Thousands of U.S. dollars
(Note 1)2021 2020 2021
Past service cost ¥ 32 ¥ - $ 294
Actuarial (gains) losses (60) 225 (548)
Total ¥ (28) ¥225 $ (254)
Millions of yen
Thousands of U.S. dollars
(Note 1)2021 2020 2021
Unrecognized past service cost ¥ (32) ¥ - $ (294)
Unrecognized actuarial (gains) losses 178 117 1,609
Total ¥ 145 ¥117 $ 1,314
2021 2020
Discount rate 0.08 % 0.08 %
Millions of yen
Thousands of U.S. dollars
(Note 1)2021 2020 2021
Balance at beginning of year ¥ 6,595 ¥ 6,483 $ 59,573
Retirement benefit expenses 720 757 6,504
Benefits paid (467) (640) (4,219)
Other (13) (4) (118)
Balance at end of year ¥ 6,835 ¥ 6,595 $ 61,740
Millions of yen
Thousands of U.S. dollars
(Note 1)2021 2020 2021
Funded defined benefit obligation ¥ - ¥ - $ --
Plan assets - - --
- - --
Unfunded defined benefit obligation 6,835 6,595 61,740
Net liability arising from defined benefit obligation ¥ 6,835 ¥ 6,595 $ 61,740
(4) Amounts recognized in other comprehensive income (before income tax effect) in respect of defined retirement benefit plans for the years ended March 31, 2021 and 2020, were as follows:
(5) Amounts recognized in accumulated other comprehensive income (before income tax effect) in respect of defined retirement benefit plans as of March 31, 2021 and 2020, were as follows:
(6) Matters concerning the assumptions for the main actuarial calculations related to defined benefit plans as of March 31, 2021 and 2020, were as follows:
The Company used the index of salary increases by age at March 31, 2021 and 2020, as the expected rate of future salary increases.
Defined benefit plans applying the simplified method
(7) The changes in defined benefit obligations related to defined benefit plans to which the simplified method is applied in the consolidated fiscal years ended March 31, 2021 and 2020, were as follows:
(8) Reconciliation between the liability recorded in the consolidated balance sheet and the balances of defined benefit obligation and plan assets that apply the simplified method as of March 31, 2021 and 2020, were as follows:
Page 23 of 400527503262609_013.htm
2021/09/14https://edit.xsmart.jp/mdn_manager/Common/ASHX/AsyncHTMLOutput.ashx
DOWA HOLDINGS CO., LTD.29 30FINANCIAL SECTION 2021

Millions of yen
Thousands ofU.S. dollars
(Note 1)
As of March 31, 2021Carryingamount Fair value Difference
Carryingamount Fair value Difference
(1) Cash and time deposits ¥ 18,277 ¥ 18,277 ¥ -- $ 165,097 $ 165,097 $ --
(2) Notes and accounts receivable (*1) 84,132 84,132 -- 759,939 759,939 --
(3) Investments in securities (*2) 33,249 31,484 (1,764) 300,332 284,390 (15,942)
(4) Long-term loans receivable(*2) 27,802 30,537 2,734 251,128 275,829 24,700
Total ¥ 163,463 ¥ 164,432 ¥ 969 $ 1,476,498 $ 1,485,257 $ 8,758
(1) Notes and accounts payable (*3) 55,337 55,337 -- 499,845 499,845 --
(2) Short-term borrowings 38,449 38,449 -- 347,300 347,300 --
(3) Commercial paper 35,000 35,000 -- 316,141 316,141 --
(4) Long-term debt (including repayments due within one year) (*4)
80,502 80,635 132 727,146 728,347 1,201
Total ¥ 209,289 ¥ 209,422 ¥ 132 $ 1,890,433 $ 1,891,634 $ 1,201
Derivatives (*5) ¥ (4,822) ¥ (4,822) ¥ -- $ (43,556) $ (43,556) $ --
Millions of yen
As of March 31, 2020Carryingamount Fair value Difference
(1) Cash and time deposits ¥ 31,730 ¥ 31,730 ¥ -
(2) Notes and accounts receivable (*1) 75,130 75,130 -
(3) Investments in securities (*2) 32,402 23,282 (9,120)
(4) Long-term loans receivable(*2) 33,628 32,670 (958)
Total ¥ 172,892 ¥ 162,813 ¥(10,078)
(1) Notes and accounts payable (*3) 34,480 34,480 -
(2) Short-term borrowings 33,454 33,454 -
(3) Commercial paper 24,000 24,000 -
(4) Long-term debt (including repayments due within one year) (*4)
76,632 77,225 592
Total ¥ 168,567 ¥ 169,159 ¥ 592
Derivatives (*5) ¥ 4,231 ¥ 4,231 ¥ -
Notes to Consolidated Financial Statements
(2) Fair Value of Financial InstrumentsThe table below shows the amounts of financial instruments recorded in the consolidated balance sheet and their fair values. Financial instruments whose fair values are not readily determinable are not included (refer to (b) below).
(*1) Assets (2): Notes and accounts receivable as of March 31, 2021 and 2020, stated above, are obtained by subtracting advances paid of
¥403 million (U.S. $3,645 thousand) and ¥1,068 million, respectively, accounts receivable other of ¥5,136 million (U.S. $46,395 thousand)
and ¥5,656 million, respectively, and loans of ¥239 million (U.S. $2,159 thousand) and ¥212 million, respectively, from the amount of notes
and accounts receivable of ¥89,898 million (U.S. $812,014 thousand) and ¥82,047 million, respectively, presented in the consolidated
balance sheet.
(*2) Assets (3)(4): At March 31, 2021 and 2020, the difference between the sum of (3) investments in securities ¥33,249 million (U.S.
$300,332 thousand) and ¥32,402 million, respectively, and (4) long-term loans receivable of ¥27,802 million (U.S. $251,128 thousand) and
¥33,628 million, respectively, and the sum of investments in securities of ¥26,865 million (U.S. $242,667 thousand) and ¥19,667 million,
respectively, and investments in and advances to nonconsolidated subsidiaries and associates of ¥65,820 million (U.S. $594,527 thousand)
and ¥78,992 million, respectively, presented in the consolidated balance sheet is financial instruments whose fair values are not readily
determinable of ¥31,633million (U.S. $285,734 thousand) and ¥32,628million, respectively.
Page 26 of 400527503262609_013.htm
2021/09/14https://edit.xsmart.jp/mdn_manager/Common/ASHX/AsyncHTMLOutput.ashx
15. Financial Instruments(1) Status of Financial Instruments
(a) Policy for financial instrumentsThe Group manages its funds using short-term deposits and bond repurchase agreements.
Financial instruments used for financing are mainly bank loans and other instruments, including corporate bonds and electronic commercial paper, based on the Group’s policy of diversifying financing methods, sources, and maturities, etc.
Derivatives are used to avoid the market fluctuation risks of interest on borrowings and the sale and purchase prices of inventories, etc., only within the range of the hedged items, and the Group’s policy is to not use derivatives for speculative purposes.
(b) Nature, extent of risks, and risk management for financial instrumentsNotes and accounts receivable, which are operating receivables, are exposed to customer credit risk. The Group manages the credit risk of receivables by monitoring the payment terms and balances for each customer.
Listed securities, which are among the equity instruments in investments in securities, are exposed to the risk of market price fluctuations. The Group has a system to periodically monitor and assess the fair values of listed securities, although the securities are held neither for pure investment purposes nor short-term trading purposes.
Payment terms of notes and accounts payable, which are operating debt, are mostly less than one year.Borrowings are exposed to liquidity risk and interest rate fluctuation risk. In order to mitigate these risks, the Group
uses multiple financial institutions and staggers the redemption dates of loans. With regard to a portion of long-term debt, the Group uses interest rate swaps as hedging instruments to avoid fluctuation risks of interest rates. The Group periodically compiles cash flow plans and performance and the status of financing is reported at the management meeting monthly.
In addition to interest rate swaps, the Group enters into derivative financial instruments, namely foreign exchange forward contracts and nonferrous metal forward contracts. The former are used to avoid risks of foreign exchange fluctuations associated with the sale of finished products and purchases of inventories (mainly imported raw materials), which are denominated in foreign currencies. The latter are used to avoid fluctuation risks in market prices for raw materials and finished goods that are influenced by nonferrous metal market prices.
Monthly meetings are held regarding derivative transactions, with the attendance of directors who are in charge of hedge transactions and the head of each business division. At the meetings, the implementation policies for hedge transactions are determined, the execution of derivative transactions is managed and reported, and hedge effectiveness is evaluated. In accordance with the policies, each derivative transaction is executed based on internal guidelines, which regulate the credit limit amount and procedures of transactions and reporting. Evaluation of hedge effectiveness is omitted for interest rate swaps as the swaps qualify for hedge accounting and meet specific matching criteria for interest rate swaps. The Group has a policy to diversify transactions through multiple counterparties with high credit standings in order to mitigate credit risk.
(c) Supplementary explanation to fair values of financial instrumentsFair values of financial instruments are based on quoted prices in active markets. If a quoted price is not available, other rational valuation techniques are used instead. Such techniques include variable factors, and the results of valuation may differ depending on prerequisites. The contract or notional amounts of derivatives which are shown in Note 16. Derivatives do not represent the amounts exchanged by the parties and do not measure the Group's exposure to credit or market risk.
Page 25 of 400527503262609_013.htm
2021/09/14https://edit.xsmart.jp/mdn_manager/Common/ASHX/AsyncHTMLOutput.ashx
DOWA HOLDINGS CO., LTD.31 32FINANCIAL SECTION 2021

Millions of yen
As of March 31, 2021Due in 1
year or less
Due after 1 year through
5 years
Due after 5 years through
10 yearsDue after 10 years
Cash and time deposits ¥ 2,041 ¥ -- ¥ -- ¥--
Notes and accounts receivable 84,132 -- -- --
Long-term loans receivable -- 17,617 10,185 --
Total ¥ 86,174 ¥ 17,617 ¥ 10,185 ¥--
Thousands of U.S. dollars (Note 1)
As of March 31, 2021Due in 1
year or less
Due after 1 year through
5 years
Due after 5 years through
10 yearsDue after 10 years
Cash and time deposits $ 18,443 $ -- $ -- $--
Notes and accounts receivable 759,939 - -- --
Long-term loans receivable -- 159,132 91,997 --
Total $ 778,383 $ 159,132 $ 91,997 $--
Millions of yen
As of March 31, 2020Due in 1
year or less
Due after 1 year through
5 years
Due after 5 years through
10 yearsDue after 10 years
Cash and time deposits ¥ 2,898 ¥ - ¥ - ¥-
Notes and accounts receivable 75,130 - - -
Long-term loans receivable - 20,384 13,244 -
Total ¥ 78,029 ¥ 20,384 ¥ 13,244 ¥-
Notes to Consolidated Financial Statements
(c) Maturity analysis for financial assets with contractual maturities
(d) Maturity analysis for long-term debtSee Note 7. Short-term Borrowings and Long-term Debt
Page 28 of 400527503262609_013.htm
2021/09/14https://edit.xsmart.jp/mdn_manager/Common/ASHX/AsyncHTMLOutput.ashx
Millions of yen
Thousands of U.S. dollars
(Note 1)Classification 2021 2020 2021
Unlisted securities and others (carrying amount) ¥ 31,633 ¥ 32,628 $ 285,734
(*3) Liabilities (1): Notes and accounts payable as of March 31, 2021 and 2020, stated above are obtained by subtracting accounts payable other
of ¥8,730 million (U.S. $78,861 thousand) and ¥4,998 million, respectively, and deposits received of ¥570 million (U.S. $5,153 thousand)
and ¥485 million, respectively, from notes and accounts payable of ¥64,637 million (U.S. $583,844 thousand) and ¥39,962 million,
respectively, presented in the consolidated balance sheet.
(*4) Liabilities (4): Long-term debt as of March 31, 2021 and 2020, stated above, is obtained by subtracting lease obligations of ¥1,717 million
(U.S. $15,513 thousand) and ¥1,506 million, respectively, from the sum of current maturities of long-term debt of ¥14,962 million (U.S.
$135,150 thousand) and ¥6,838 million, respectively, and long-term debt of ¥67,257 million (U.S. $607,509 thousand) and ¥71,299 million,
respectively, presented in the consolidated balance sheet.
(*5) Derivative transactions stated above are stated net of assets and liabilities.
(a) Fair value measurement of financial instruments and matters regarding securities and derivativesAssets(1) Cash and time deposits and (2) Notes and accounts receivableThe fair value of these accounts approximates their book value because of their short maturities.(3) Investments in securitiesThe fair value of equity instruments is measured using market prices from stock exchanges.(4) Long-term loans receivableThe fair value of long-term loans receivable is determined by discounting the amount of the total principal and interest at the interest rate assumed when similar new loans are made.
Liabilities(1) Notes and accounts payable, (2) Short-term borrowings, and (3) Commercial paperThe fair value of these accounts approximates their book value because of their short maturities.(4) Long-term debt (including repayment due within one year)The fair value of long-term debt is determined by discounting the future cash flows related to the debt at the Group’s assumed corporate borrowing rate for loans from banks and the market price for bonds. Long-term debt with variable interest rates qualifies for special treatment under hedge accounting (refer to Note 16. Derivatives). The fair value of these accounts is calculated by discounting the total of interest and principal, including the relevant interest rate swap, by an interest rate reasonably estimated assuming similar borrowings are taken out.
DerivativesRefer to Note 16. Derivatives.
(b) Financial instruments whose fair values are not readily determinable
These financial instruments are not included in Assets (3) Investments in securities, as they have no quoted market prices and their fair values are not readily determinable.
Page 27 of 400527503262609_013.htm
2021/09/14https://edit.xsmart.jp/mdn_manager/Common/ASHX/AsyncHTMLOutput.ashx
DOWA HOLDINGS CO., LTD.33 34FINANCIAL SECTION 2021

Millions of yen
TypeContract amount
Over 1 year
Fair value
Unrealized gains/losses
Forward Exchange Contract Transactions
Selling
U. S. dollars ¥ 17,112 ¥- ¥ (146) ¥ (146)
Thai baht 1,080 - 58 58
Total ¥ - ¥- ¥ - ¥ (88)
Millions of yen
TypeContractamount
Over 1 year
Fair value
Unrealized gains/losses
Nonferrous Metal Forward Contracts
Selling
Gold ¥ 1,708 ¥- ¥ (27) ¥ (27)
Silver 2,487 - 449 449
Zinc 755 - 104 104
Copper 3,462 - 448 448
Lead 4 - 0 0
Nickel 164 - 17 17
Palladium 1,384 - (91) (91)
Total ¥ - ¥- ¥ - ¥ 901
Currency-related transactions (2020)
Commodity-related transactions (2020)
(Note) Fair value was calculated using quotations obtained from the commodity futures market and the exchange futures market as of March 31, 2021 and 2020.
Page 30 of 400527503262609_013.htm
2021/09/14https://edit.xsmart.jp/mdn_manager/Common/ASHX/AsyncHTMLOutput.ashx
Millions of yen Thousands of U.S. dollars (Note 1)
TypeContract amount
Over 1 year
Fair value
Unrealized gains/losses
Contract amount
Over 1 year
Fair value
Unrealized gains/losses
Forward Exchange Contract Transactions
Selling
U. S. dollars ¥ 31,650 ¥-- ¥ (1,543) ¥ (1,543) $ 285,884 $-- $ (13,944) $ (13,944)
Thai baht 1,379 -- (42) (42) 12,456 -- (385) (385)
Total ¥ -- ¥-- ¥ -- ¥ (1,586) $ -- $-- $ -- $ (14,329)
Millions of yen Thousands of U.S. dollars (Note 1)
TypeContractamount
Over 1 year
Fair value
Unrealized gains/losses
Contract amount
Over 1 year
Fair value
Unrealized gains/losses
Nonferrous Metal Forward Contracts
Selling
Gold ¥ 1,364 ¥-- ¥ 12 ¥ 12 $ 12,320 $-- $ 109 $ 109
Silver 4,571 -- 124 124 41,291 -- 1,121 1,121
Zinc 348 -- (9) (9) 3,147 -- (89) (89)
Copper 4,169 -- (469) (469) 37,661 -- (4,243) (4,243)
Lead 0 -- (0) (0) 4 - (0) (0)
Nickel 212 -- 9 9 1,922 -- 85 85
Palladium 1,790 -- (338) (338) 16,171 -- (3,059) (3,059)
Total ¥ -- ¥- ¥ - ¥ (672) $ - $- $ - $ (6,076)
16. Derivatives(1) Derivative Transactions to which Hedge Accounting is Not Applied Currency-related transactions (2021)
Commodity-related transactions (2021)
Page 29 of 400527503262609_013.htm
2021/09/14https://edit.xsmart.jp/mdn_manager/Common/ASHX/AsyncHTMLOutput.ashx
DOWA HOLDINGS CO., LTD.35 36FINANCIAL SECTION 2021

Millions of yen
Treatment Type Hedged itemContract amount
Over1 year Fair value
Standard treatment
Forward exchange contract transactions
Accounts receivable
Selling
U. S. dollars ¥ 12,573 ¥- ¥ (162)
Thai baht 348 - 5
Currency swaps under designated hedge accounting
Forward exchange contract transactions
Accounts receivable
Selling
U. S. dollars ¥ 1,854 ¥- (*1)
Thai baht 519 - (*1)
Total ¥ - ¥- ¥ -
Millions of yen
Treatment Type Hedged itemContract amount
Over1 year Fair value
Interest rate swaps under special accounting treatment
Interest rate swaps
Long-term debt
Fixed rate payment,Floating rate receipt ¥ 964 ¥ 464 (*2)
Total ¥ - ¥ - ¥ -
Millions of yen
Treatment Type Hedged itemContract amount
Over1 year Fair value
Standard treatment
Nonferrous Metal Forward Contracts
Inventory
Selling
Gold ¥ 4,981 ¥- ¥ (143)
Silver 3,129 - 516
Zinc 13,566 - 1,757
Copper 9,968 - 1,578
Lead 157 - 7
Buying
Silver ¥ 567 ¥- ¥ (72)
Zinc 820 6 (63)
Copper 55 - (3)
Total ¥ - ¥- ¥ -
Currency-related transactions (2020)
Interest-related transactions (2020)
Commodity-related transactions (2020)
(Note) Fair value was calculated using quotations obtained from the commodity futures market and the exchange futures market as of March 31, 2021 and 2020.
(*1) The fair values of currency swaps under designated hedge accounting are included in the fair values of accounts receivable because they are accounted for as an integral part of accounts receivable, which are hedged items.
(*2) The fair values of interest rate swaps under special accounting treatment are included in the fair values of long-term debt because they are accounted for as an integral part of long-term debt, which are hedged items.
Page 32 of 400527503262609_013.htm
2021/09/14https://edit.xsmart.jp/mdn_manager/Common/ASHX/AsyncHTMLOutput.ashx
Millions of yen
Treatment Type Hedged itemContract amount
Over1 year Fair value
Standard treatment
Forward exchange contract transactions
Accounts receivable
Selling
U. S. dollars ¥ 12,573 ¥- ¥ (162)
Thai baht 348 - 5
Currency swaps under designated hedge accounting
Forward exchange contract transactions
Accounts receivable
Selling
U. S. dollars ¥ 1,854 ¥- (*1)
Thai baht 519 - (*1)
Total ¥ - ¥- ¥ -
Millions of yen
Treatment Type Hedged itemContract amount
Over1 year Fair value
Interest rate swaps under special accounting treatment
Interest rate swaps
Long-term debt
Fixed rate payment,Floating rate receipt ¥ 964 ¥ 464 (*2)
Total ¥ - ¥ - ¥ -
Millions of yen
Treatment Type Hedged itemContract amount
Over1 year Fair value
Standard treatment
Nonferrous Metal Forward Contracts
Inventory
Selling
Gold ¥ 4,981 ¥- ¥ (143)
Silver 3,129 - 516
Zinc 13,566 - 1,757
Copper 9,968 - 1,578
Lead 157 - 7
Buying
Silver ¥ 567 ¥- ¥ (72)
Zinc 820 6 (63)
Copper 55 - (3)
Total ¥ - ¥- ¥ -
Currency-related transactions (2020)
Interest-related transactions (2020)
Commodity-related transactions (2020)
(Note) Fair value was calculated using quotations obtained from the commodity futures market and the exchange futures market as of March 31, 2021 and 2020.
(*1) The fair values of currency swaps under designated hedge accounting are included in the fair values of accounts receivable because they are accounted for as an integral part of accounts receivable, which are hedged items.
(*2) The fair values of interest rate swaps under special accounting treatment are included in the fair values of long-term debt because they are accounted for as an integral part of long-term debt, which are hedged items.
Page 32 of 400527503262609_013.htm
2021/09/14https://edit.xsmart.jp/mdn_manager/Common/ASHX/AsyncHTMLOutput.ashx
Millions of yen Thousands of U.S. dollars (Note 1)
Treatment Type Hedged itemContract amount
Over1 year Fair value
Contract amount
Over1 year Fair value
Standard treatment
Forward exchange contract transactions
Accounts receivable
Selling
U. S. dollars ¥ 18,837 ¥-- ¥ (831) $ 170,152 $-- $ (7,512)
Thai baht 1,009 -- (8) 9,117 -- (80)
Currency swaps under designated hedge accounting
Forward exchange contract transactions
Accounts receivable
Selling
U. S. dollars ¥ 2,140 ¥-- (*1) $ 19,335 $-- (*1)
Thai baht 948 -- (*1) 8,570 -- (*1)
Total ¥ -- ¥-- ¥ -- $ -- $-- $ --
Millions of yen Thousands of U.S. dollars (Note 1)
Treatment Type Hedged itemContract amount
Over1 year Fair value
Contract amount
Over1 year Fair value
Interest rate swaps under special accounting treatment
Interest rate swaps
Long-term debt
Fixed rate payment,Floating rate receipt ¥ -- ¥ -- - $ -- $ -- -
Total ¥ -- ¥ -- ¥ -- $ -- $ -- $ --
Millions of yen Thousands of U.S. dollars (Note 1)
Treatment Type Hedged itemContract amount
Over1 year Fair value
Contract amount
Over1 year Fair value
Standard treatment
Nonferrous Metal Forward Contracts
Inventory
Selling
Gold ¥ 9,049 ¥-- ¥ 170 $ 81,743 $ -- $ 1,539
Silver 5,087 -- 140 45,952 -- 1,264
Zinc 9,066 -- (390) 81,893 -- (3,523)
Copper 10,612 -- (1,672) 95,854 -- (15,109)
Lead 85 -- (1) 767 -- (10)
Buying
Silver ¥ 18 ¥-- ¥ (0) $ 168 $ -- $ (8)
Zinc 1,772 11 32 16,007 107 290
Total ¥ -- ¥-- ¥ -- $ -- $ -- $ --
Notes to Consolidated Financial Statements
(2) Derivative Transactions to which Hedge Accounting is Applied Currency-related transactions (2021)
Interest-related transactions (2021)
Commodity-related transactions (2021)
Page 31 of 400527503262609_013.htm
2021/09/14https://edit.xsmart.jp/mdn_manager/Common/ASHX/AsyncHTMLOutput.ashxDOWA HOLDINGS CO., LTD.37 38FINANCIAL SECTION 2021

Millions of yen
Thousands ofU.S. dollars
(Note 1)Year-end cash dividends, ¥95 (U.S. $0.85) per share ¥ 5,709 $ 51,572
18. Subsequent EventThe following appropriation of retained earnings at March 31, 2021, was approved at the Board of Directors’meeting held on May 18, 2021:
19. Segment Information(1) Outline of reportable segments
The Company’s reportable segments are the components of the Group about which separate financial information is available. These segments are subject to periodic examinations to enable the Company’s Board of Directors to decide how to allocate resources and assess performance.The Company’s operations are classified into five product and service segments based on its operating companies.Each segment’s businesses are as follows:In the Environmental Management & Recycling segment, the Group conducts waste treatment, soil remediation, resource recycling, logistics, and other operations.In the Nonferrous Metals segment, the Group produces and sells copper, zinc, lead, gold, silver, zinc alloys, platinum, palladium, rhodium, indium, sulfuric acid, tin, antimony, and other materials.In the Electronic Materials segment, the Group produces and sells high-purity metal materials, compound semiconductor wafers, LEDs, conductive materials, battery materials, magnetic materials, reduced iron powder, and other materials. In the Metal Processing segment, the Group produces and sells copper, brass and copper alloy strips, electroplated products, brass rods, metal-ceramic substrates, and other materials.In the Heat Treatment segment, the Group provides heat and surface treatment of metallic materials, such as automobile components, and manufactures, sells, and provides maintenance of industrial furnaces and ancillary equipment.
(2) Method for calculating sales, income (loss), assets, liabilities, and other items by reportable segmentThe accounting treatment and methods for the reportable segments are largely consistent with Note 1. Basis of Presentation of the Consolidated Financial Statements, and Note 2. Summary of Significant Accounting Policies.Segment income is reconciled to ordinary income. Ordinary income is calculated by adding share of profit (loss) of entities accounted for using equity method, interest and dividend income, royalty income, etc. and deducting interest expense, environmental expenses, etc. from operating profit (loss).
Page 34 of 400527503262609_013.htm
2021/09/14https://edit.xsmart.jp/mdn_manager/Common/ASHX/AsyncHTMLOutput.ashx
Millions of yen
Thousands of U.S. dollars
(Note 1)
2021 2020 2021
Unrealized gain (loss) on available-for-sale securities:
Gain (loss) arising during the year ¥ 8,133 ¥ (4,974) $ 73,467
Reclassification adjustments to profit or loss (167) (1,507) (1,516)
Amount before income tax effect 7,965 (6,481) 71,951
Income tax effect (2,158) 1,354 (19,495)
Total ¥ 5,807 ¥ (5,127) $ 52,455
Deferred gain (loss) on derivatives under hedge accounting:
Gain (loss) arising during the year ¥ (13,921) ¥ 7,961 $ (125,746)
Reclassification adjustments to profit or loss 7,907 (794) 71,426
Adjustment for cost of asset acquisition -- 48 --
Amount before income tax effect (6,013) 7,215 (54,319)
Income tax effect 1,833 (2,145) 16,563
Total ¥ (4,179) ¥ 5,069 $ (37,756)
Foreign currency translation adjustments:
Adjustments arising during the year ¥ (153) ¥ (880) $ (1,384)
Reclassification adjustments to profit or loss 50 - 460
Amount before income tax effect (102) (880) (923)
Income tax effect -- - --
Total ¥ (102) ¥ (880) $ (923)
Defined retirement benefit plan:
Adjustments arising during the year ¥ (199) ¥ 41 $ (1,797)
Reclassification adjustments to profit or loss 170 184 1,543
Amount before income tax effect (28) 225 (254)
Income tax effect (61) (56) (554)
Total ¥ (89) ¥ 169 $ (808)
Share of other comprehensive income in associates:
Gain (loss) arising during the year ¥ (1,353) ¥ 522 $ (12,224)
Reclassification adjustments to profit or loss (13) (126) (120)
Total ¥ (1,366) ¥ 396 $ (12,344)
Total other comprehensive income ¥ 68 ¥ (372) $ 621
Notes to Consolidated Financial Statements
17. Comprehensive IncomeThe components of other comprehensive income for the years ended March 31, 2021 and 2020, were as follows:
Page 33 of 400527503262609_013.htm
2021/09/14https://edit.xsmart.jp/mdn_manager/Common/ASHX/AsyncHTMLOutput.ashxDOWA HOLDINGS CO., LTD.39 40FINANCIAL SECTION 2021
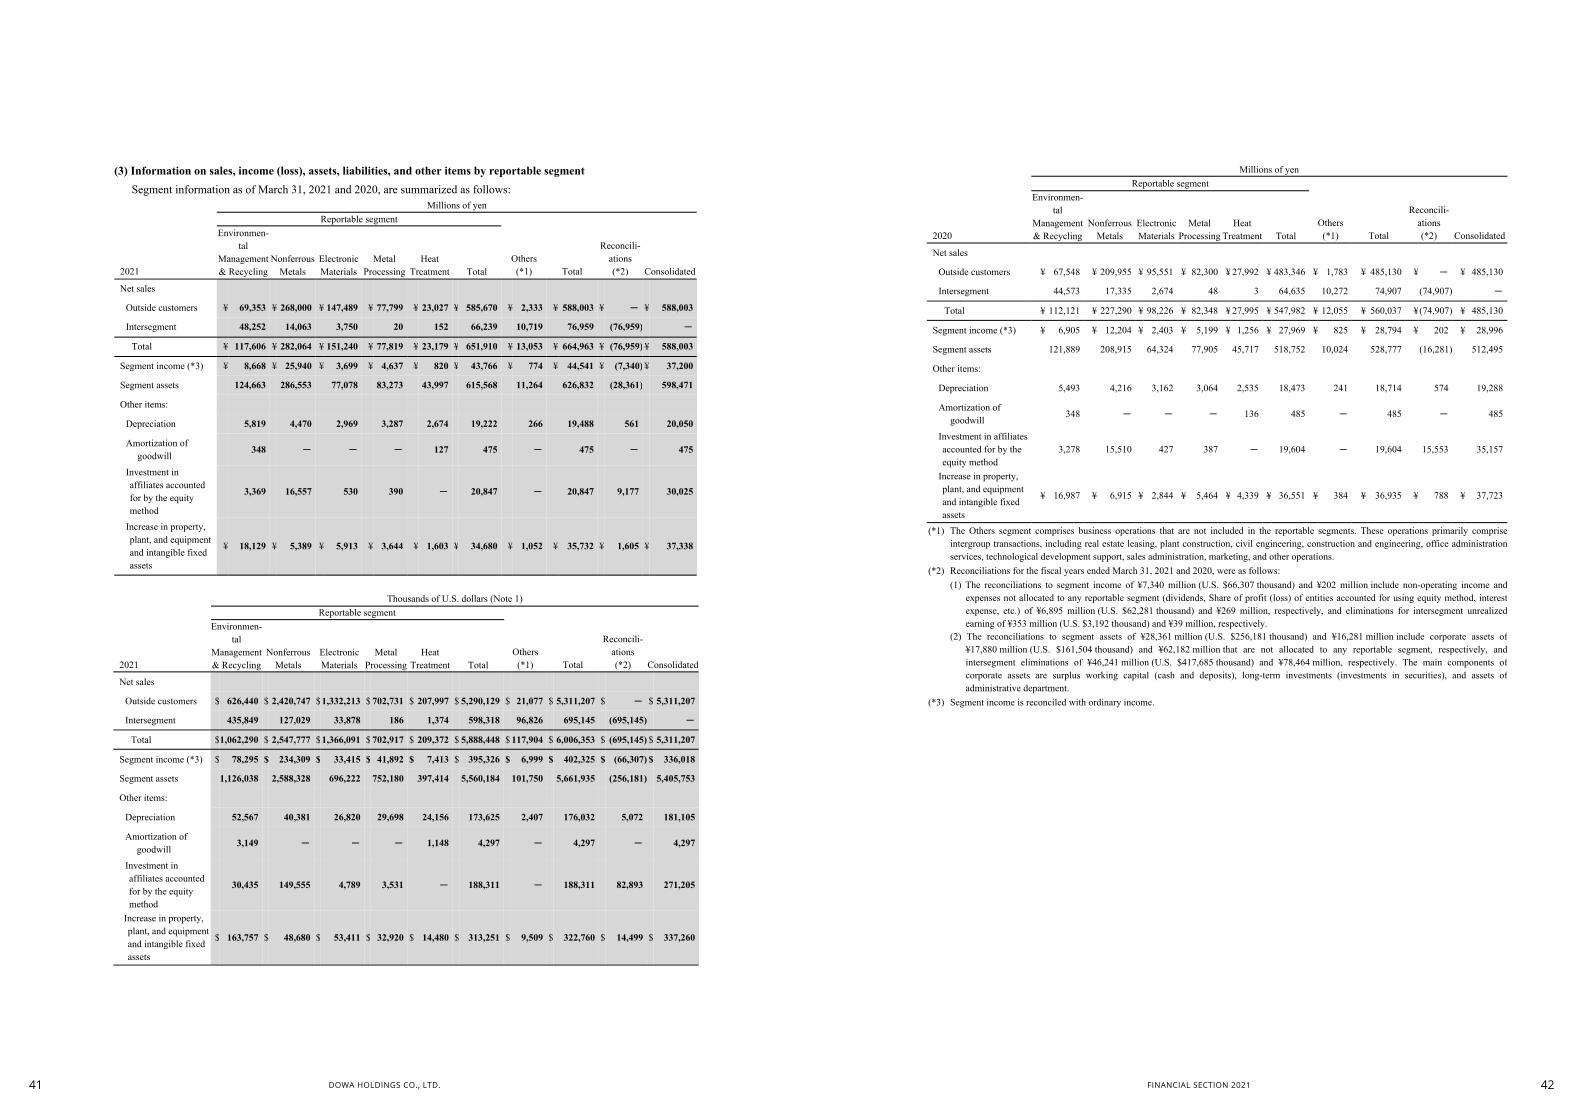
Millions of yenReportable segment
2020
Environmen-tal
Management& Recycling
NonferrousMetals
ElectronicMaterials
Metal Processing
HeatTreatment Total
Others(*1) Total
Reconcili-ations(*2) Consolidated
Net sales
Outside customers ¥ 67,548 ¥ 209,955 ¥ 95,551 ¥ 82,300 ¥ 27,992 ¥ 483,346 ¥ 1,783 ¥ 485,130 ¥ - ¥ 485,130
Intersegment 44,573 17,335 2,674 48 3 64,635 10,272 74,907 (74,907) -
Total ¥ 112,121 ¥ 227,290 ¥ 98,226 ¥ 82,348 ¥ 27,995 ¥ 547,982 ¥ 12,055 ¥ 560,037 ¥(74,907) ¥ 485,130
Segment income (*3) ¥ 6,905 ¥ 12,204 ¥ 2,403 ¥ 5,199 ¥ 1,256 ¥ 27,969 ¥ 825 ¥ 28,794 ¥ 202 ¥ 28,996
Segment assets 121,889 208,915 64,324 77,905 45,717 518,752 10,024 528,777 (16,281) 512,495
Other items:
Depreciation 5,493 4,216 3,162 3,064 2,535 18,473 241 18,714 574 19,288
Amortization of goodwill
348 - - - 136 485 - 485 - 485
Investment in affiliates accounted for by the equity method
3,278 15,510 427 387 - 19,604 - 19,604 15,553 35,157
Increase in property, plant, and equipment and intangible fixed assets
¥ 16,987 ¥ 6,915 ¥ 2,844 ¥ 5,464 ¥ 4,339 ¥ 36,551 ¥ 384 ¥ 36,935 ¥ 788 ¥ 37,723
(*1) The Others segment comprises business operations that are not included in the reportable segments. These operations primarily comprise intergroup transactions, including real estate leasing, plant construction, civil engineering, construction and engineering, office administration services, technological development support, sales administration, marketing, and other operations.
(*2) Reconciliations for the fiscal years ended March 31, 2021 and 2020, were as follows:(1) The reconciliations to segment income of ¥7,340 million (U.S. $66,307 thousand) and ¥202 million include non-operating income and
expenses not allocated to any reportable segment (dividends, Share of profit (loss) of entities accounted for using equity method, interest expense, etc.) of ¥6,895 million (U.S. $62,281 thousand) and ¥269 million, respectively, and eliminations for intersegment unrealized earning of ¥353 million (U.S. $3,192 thousand) and ¥39 million, respectively.
(2) The reconciliations to segment assets of ¥28,361 million (U.S. $256,181 thousand) and ¥16,281 million include corporate assets of ¥17,880 million (U.S. $161,504 thousand) and ¥62,182 million that are not allocated to any reportable segment, respectively, and intersegment eliminations of ¥46,241 million (U.S. $417,685 thousand) and ¥78,464 million, respectively. The main components of corporate assets are surplus working capital (cash and deposits), long-term investments (investments in securities), and assets of administrative department.
(*3) Segment income is reconciled with ordinary income.
Page 36 of 400527503262609_013.htm
2021/09/14https://edit.xsmart.jp/mdn_manager/Common/ASHX/AsyncHTMLOutput.ashx
Millions of yenReportable segment
2021
Environmen-tal
Management& Recycling
NonferrousMetals
Electronic Materials
Metal Processing
HeatTreatment Total
Others(*1) Total
Reconcili-ations(*2) Consolidated
Net sales
Outside customers ¥ 69,353 ¥ 268,000 ¥ 147,489 ¥ 77,799 ¥ 23,027 ¥ 585,670 ¥ 2,333 ¥ 588,003 ¥ -- ¥ 588,003
Intersegment 48,252 14,063 3,750 20 152 66,239 10,719 76,959 (76,959) --
Total ¥ 117,606 ¥ 282,064 ¥ 151,240 ¥ 77,819 ¥ 23,179 ¥ 651,910 ¥ 13,053 ¥ 664,963 ¥ (76,959) ¥ 588,003
Segment income (*3) ¥ 8,668 ¥ 25,940 ¥ 3,699 ¥ 4,637 ¥ 820 ¥ 43,766 ¥ 774 ¥ 44,541 ¥ (7,340) ¥ 37,200
Segment assets 124,663 286,553 77,078 83,273 43,997 615,568 11,264 626,832 (28,361) 598,471
Other items:
Depreciation 5,819 4,470 2,969 3,287 2,674 19,222 266 19,488 561 20,050
Amortization of goodwill
348 -- -- -- 127 475 -- 475 -- 475
Investment in affiliates accounted for by the equity method
3,369 16,557 530 390 -- 20,847 -- 20,847 9,177 30,025
Increase in property, plant, and equipment and intangible fixed assets
¥ 18,129 ¥ 5,389 ¥ 5,913 ¥ 3,644 ¥ 1,603 ¥ 34,680 ¥ 1,052 ¥ 35,732 ¥ 1,605 ¥ 37,338
Thousands of U.S. dollars (Note 1)Reportable segment
2021
Environmen-tal
Management& Recycling
NonferrousMetals
ElectronicMaterials
Metal Processing
HeatTreatment Total
Others(*1) Total
Reconcili-ations(*2) Consolidated
Net sales
Outside customers $ 626,440 $ 2,420,747 $1,332,213 $ 702,731 $ 207,997 $ 5,290,129 $ 21,077 $ 5,311,207 $ -- $ 5,311,207
Intersegment 435,849 127,029 33,878 186 1,374 598,318 96,826 695,145 (695,145) --
Total $1,062,290 $ 2,547,777 $1,366,091 $ 702,917 $ 209,372 $ 5,888,448 $ 117,904 $ 6,006,353 $ (695,145) $ 5,311,207
Segment income (*3) $ 78,295 $ 234,309 $ 33,415 $ 41,892 $ 7,413 $ 395,326 $ 6,999 $ 402,325 $ (66,307) $ 336,018
Segment assets 1,126,038 2,588,328 696,222 752,180 397,414 5,560,184 101,750 5,661,935 (256,181) 5,405,753
Other items:
Depreciation 52,567 40,381 26,820 29,698 24,156 173,625 2,407 176,032 5,072 181,105
Amortization of goodwill
3,149 -- -- -- 1,148 4,297 -- 4,297 -- 4,297
Investment in affiliates accounted for by the equity method
30,435 149,555 4,789 3,531 -- 188,311 -- 188,311 82,893 271,205
Increase in property, plant, and equipment and intangible fixed assets
$ 163,757 $ 48,680 $ 53,411 $ 32,920 $ 14,480 $ 313,251 $ 9,509 $ 322,760 $ 14,499 $ 337,260
Notes to Consolidated Financial Statements
(3) Information on sales, income (loss), assets, liabilities, and other items by reportable segmentSegment information as of March 31, 2021 and 2020, are summarized as follows:
Page 35 of 400527503262609_013.htm
2021/09/14https://edit.xsmart.jp/mdn_manager/Common/ASHX/AsyncHTMLOutput.ashxDOWA HOLDINGS CO., LTD.41 42FINANCIAL SECTION 2021

Millions of yenReportable segment
2021
Environmen-tal
Management& Recycling
NonferrousMetals
Electronic Materials
Metal Processing
HeatTreatment Total Others Total Eliminations Consolidated
Unamortized balance at fiscal year end
¥ 2,789 ¥ -- ¥-- ¥-- ¥ 801 ¥ 3,591 ¥-- ¥ 3,591 ¥-- ¥ 3,591
Thousands of U.S. dollars (Note 1)Reportable segment
2021
Environmen-tal
Management& Recycling
NonferrousMetals
Electronic Materials
Metal Processing
HeatTreatment Total Others Total Eliminations Consolidated
Unamortized balance at fiscal year end
$ 25,199 $ -- $-- $-- $ 7,243 $ 32,442 $-- $32,442 $-- $ 32,442
Millions of yen
JapanNorth and Central
America Europe ChinaAsia (excluding
Japan and China) Other Total
¥ 342,346 ¥ 4,955 ¥ 25,831 ¥ 69,547 ¥ 41,745 ¥ 703 ¥ 485,130
Millions of yen
JapanNorth and Central
America Europe ChinaAsia (excluding
Japan and China) Other Total
¥ 126,505 ¥ 3,055 ¥ 89 ¥ 2,234 ¥ 21,451 ¥- ¥ 153,336
Name of corporate customer Net sales Name of involved segment
TANAKA KIKINZOKU KOGYO K.K. ¥65,403 million Mainly the Nonferrous Metals segment
Millions of yenReportable segment
2020
Environmen-tal
Management& Recycling
NonferrousMetals
Electronic Materials
Metal Processing
HeatTreatment Total Others Total Eliminations Consolidated
Impairment losses on fixed assets
¥ 457 ¥60 ¥187 ¥ 111 ¥ 362 ¥ 1,179 ¥- ¥ 1,179 ¥ 2 ¥1,181
Millions of yenReportable segment
2020
Environmen-tal
Management& Recycling
NonferrousMetals
Electronic Materials
Metal Processing
HeatTreatment Total Others Total Eliminations Consolidated
Unamortized balance at fiscal year end
¥ 3,138 ¥ - ¥- ¥- ¥ 899 ¥ 4,037 ¥- ¥ 4,037 ¥- ¥ 4,037
5. Amortization of goodwill and unamortized balance of goodwill by reportable segment (2021)
(Note) The Company has omitted disclosure of amortization of goodwill because equivalent information appears in the segment information
1. Information by product and service (2020)The Company has omitted such disclosure herein because equivalent information appears in the segment information.
2. Information by geographic region (2020)(1) Net sales
(2) Net property, plant, and equipment
3. Information by major customer (2020)
4. Information on impairment losses on fixed assets by reportable segment (2020)
5. Amortization of goodwill and unamortized balance of goodwill by reportable segment (2020)
(Note) The Company has omitted disclosure of amortization of goodwill because equivalent information appears in the segment information.
Page 38 of 400527503262609_013.htm
2021/09/14https://edit.xsmart.jp/mdn_manager/Common/ASHX/AsyncHTMLOutput.ashx
Millions of yen
JapanNorth and Central
America Europe ChinaAsia (excluding
Japan and China) Other Total
¥ 379,395 ¥ 4,833 ¥ 31,080 ¥ 127,722 ¥ 44,440 ¥ 531 ¥ 588,003
Thousands of U.S. dollars (Note 1)
JapanNorth and Central
America Europe ChinaAsia (excluding
Japan and China) Other Total
$3,426,930 $ 43,663 $ 280,736 $ 1,153,664 $ 401,412 $ 4,800 $5,311,207
Millions of yen
JapanNorth and Central
America Europe ChinaAsia (excluding
Japan and China) Other Total
¥ 131,567 ¥ 2,818 ¥ 51 ¥ 2,075 ¥ 24,054 ¥ -- ¥ 160,567
Thousands of U.S. dollars (Note 1)
JapanNorth and Central
America Europe ChinaAsia (excluding
Japan and China) Other Total
$1,188,399 $ 25,460 $ 461 $ 18,748 $ 217,276 $ -- $1,450,347
Name of corporate customer Net sales (Note 1) Name of involved segment
TANAKA KIKINZOKU KOGYO K.K. ¥80,708 million (U.S. $729,007 thousand) Mainly the Nonferrous Metals segment
SUMISHO MATERIALS CORPORATION ¥61,103 million (U.S. $551,923 thousand) Mainly the Nonferrous Metals segment
Millions of yenReportable segment
2021
Environmen-tal
Management& Recycling
NonferrousMetals
Electronic Materials
Metal Processing
HeatTreatment Total Others Total Eliminations Consolidated
Impairment losses on fixed assets
¥ 339 ¥ 464 ¥ -- ¥ 665 ¥ 756 ¥ 2,226 ¥-- ¥ 2,226 ¥ 25 ¥ 2,252
Thousands of U.S. dollars (Note 1)Reportable segment
2021
Environmen-tal
Management& Recycling
NonferrousMetals
Electronic Materials
Metal Processing
HeatTreatment Total Others Total Eliminations Consolidated
Impairment losses on fixed assets
$3,063 $4,198 $ -- $6,013 $6,833 $20,108 $-- $20,108 $ 233 $20,341
Notes to Consolidated Financial Statements
Related Information1. Information by product and service (2021)
The Company has omitted such disclosure herein because equivalent information appears in the segment information.
2. Information by geographic region (2021)(1) Net sales
(2) Net property, plant, and equipment
3. Information by major customer (2021)
4. Information on impairment losses on fixed assets by reportable segment (2021)
Page 37 of 400527503262609_013.htm
2021/09/14https://edit.xsmart.jp/mdn_manager/Common/ASHX/AsyncHTMLOutput.ashxDOWA HOLDINGS CO., LTD.43 44FINANCIAL SECTION 2021

Type Company Address
Capital or contribution
to capitalContents of
business
Ratio of voting rights ownership
Relationship with related
parties ContentTransaction
amountAccount
items
Balance at the end of the
period
Affiliate
MINERA PLATA REAL, S. DE R.L. DE C.V.
LOMAS DE CHAPULTEPEC 11000, MEXICO, D.F.
$174,102 thousand Smelting 48.5%
indirectly Fund loan
Long-term fund loan
¥1,418 million
Long-term loan
¥3,972 million
Long-term fund collection
¥534million - -
Underwriting of capital increase
¥541million - -
Interest on loans
¥178million - -
Affiliate
OPERACIONES SAN JOSÉ DE PLATA, S. DE R.L. DE C.V.
LOMAS DE CHAPULTEPEC 11000, MEXICO, D.F.
$63,802 thousand Smelting 48.5%
indirectly Fund loan
Long-term fund loan
¥7,048million
Long-term loan
¥26,802million
Long-term fund collection
¥6,582million - -
Underwriting of capital increase
¥4,955million - -
Interest on loans
¥1,241 million - -
2020
(Note) The interest rate of the loan is determined taking market interest rate into account.
Page 40 of 400527503262609_013.htm
2021/09/14https://edit.xsmart.jp/mdn_manager/Common/ASHX/AsyncHTMLOutput.ashx
Type Company Address
Capital or contribution
to capitalContents of
business
Ratio of voting rights ownership
Relationship with related
parties ContentTransaction
amountAccount
items
Balance at the end of the
period
Affiliate
MINERA PLATA REAL, S. DE R.L. DE C.V.
LOMAS DE CHAPULTEPEC 11000, MEXICO, D.F.
$174,102 thousand Smelting 30.0%
indirectly Fund loan
Fund loan
¥260million($2,354 thousand)
Long-term loan
¥3,155 million($28,502 thousand)
Fund collection
¥1,123million($10,146 thousand)
- -
Underwriting of capital increase
¥260million($2,354 thousand)
- -
Interest on loans
¥632million($5,714 thousand)
- -
Affiliate
OPERACIONES SAN JOSÉ DE PLATA, S. DE R.L. DE C.V.
LOMAS DE CHAPULTEPEC 11000, MEXICO, D.F.
$97,265 thousand Smelting 30.0%
indirectly Fund loan
Fund loan
¥3,173million($28,662 thousand)
Long-term loan
¥21,508million($194,280 thousand)
Fund collection
¥8,795million($79,442 thousand)
- -
Underwriting of capital increase
¥3,427million($30,958 thousand)
- -
Interest on loans
¥355 million($3,207 thousand)
- -
Notes to Consolidated Financial Statements
20. Related Party DisclosuresTransactions with related parties
2021
(Note) The interest rate of the loan is determined taking market interest rate into account.(Note) ¥110.71= U.S. $1, the rate of exchange on March 31, 2021.
Page 39 of 400527503262609_013.htm
2021/09/14https://edit.xsmart.jp/mdn_manager/Common/ASHX/AsyncHTMLOutput.ashxDOWA HOLDINGS CO., LTD.45 46FINANCIAL SECTION 2021

Report of Independent Auditors
DOWA HOLDINGS CO., LTD.47 48FINANCIAL SECTION 2021

DOWA HOLDINGS CO., LTD.49 50FINANCIAL SECTION 2021
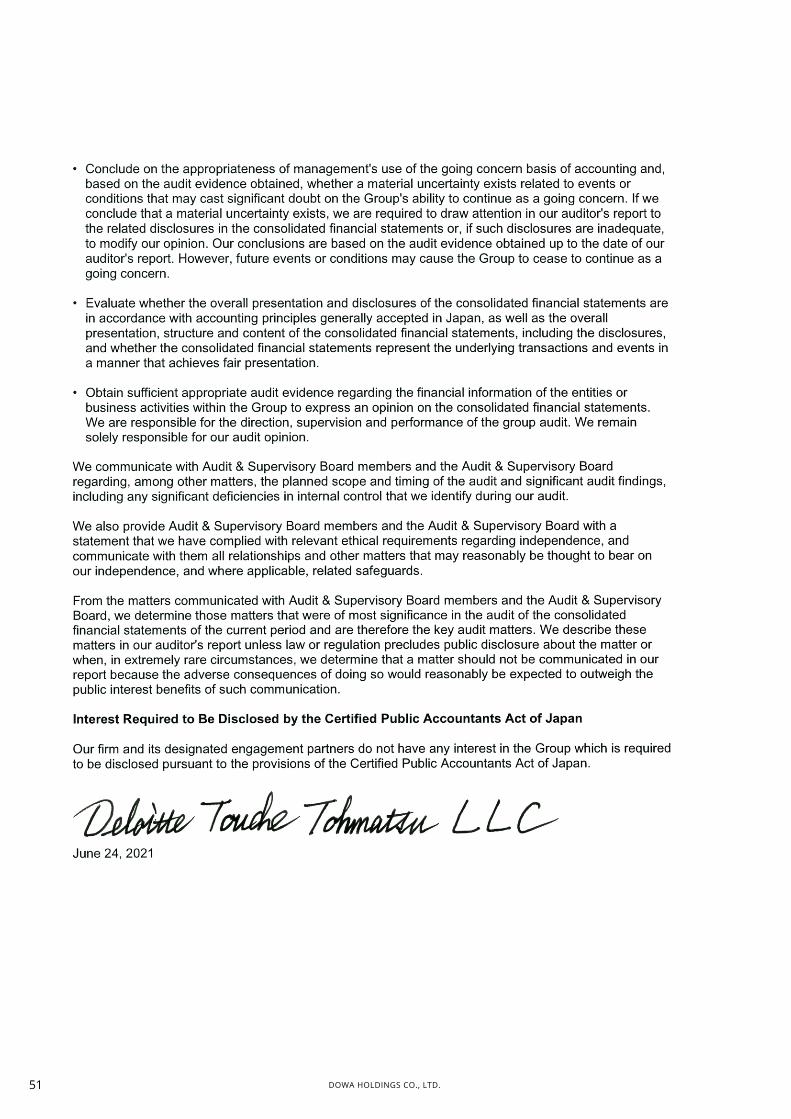
DOWA HOLDINGS CO., LTD.51


