Embed Size (px)
Citation preview
COMPANY NUMBER 11540126
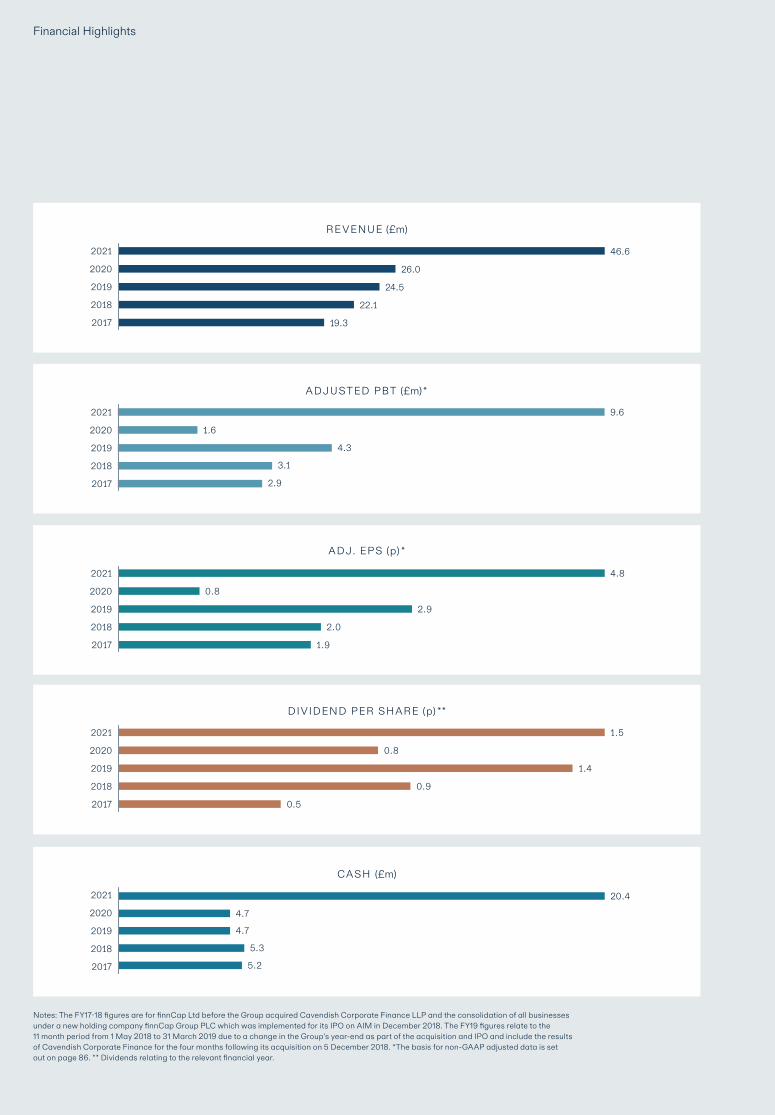
Notes: The FY17-18 figures are for finnCap Ltd before the Group acquired Cavendish Corporate Finance LLP and the consolidation of all businesses under a new holding company finnCap Group PLC which was implemented for its IPO on AIM in December 2018. The FY19 figures relate to the 11 month period from 1 May 2018 to 31 March 2019 due to a change in the Group’s year-end as part of the acquisition and IPO and include the results of Cavendish Corporate Finance for the four months following its acquisition on 5 December 2018. *The basis for non-GAAP adjusted data is set out on page 86. ** Dividends relating to the relevant financial year.
Financial Highlights
DIVIDEND PER SHARE (p) **
1.5
0.8
1.4
0.9
0.5
RE VENUE (£m)
46.6
26.0
24.5
22.1
19.3
ADJUSTED PBT (£m) *
9.6
1.6
4.3
3.1
2.9
ADJ. EPS (p) *
4.8
0.8
2.9
2.0
1.9
CASH (£m)
20.4
4.7
4.7
5.3
5.2
2021
2020
2019
2018
2017
2021
2020
2019
2018
2017
2021
2020
2019
2018
2017
2021
2020
2019
2018
2017
2021
2020
2019
2018
2017
Other Information
REGISTERED OFFICE FOR ALL ENTITIES1 Bartholomew CloseLondonEC1A 7BL
WEBSITESwww.finncap.comwww.cavendish.com
REGISTRATION NUMBERSfinnCap Group plc – 11540126finnCap Ltd – 06198898Cavendish Corporate Finance LLP – OC333044Cavendish Corporate Finance (UK) Ltd – 02234889All companies are incorporated in England
DIRECTORSROBERT LISTER, Non-Executive ChairmanSAMANTHA SMITH, Chief Executive OfficerRICHARD SNOW, Chief Financial OfficerTOM HAYWARD, Chief Operating OfficerSTUART ANDREWS, Managing Director, finnCapANDY HOGARTH, Senior Independent Non-Executive DirectorBARBARA FIRTH, Independent Non-Executive Director
COMPANY SECRETARYAMY RUPRAI
NOMINATED ADVISER Grant Thornton UK LLP 30 Finsbury Square London EC2A 1AG
BROKERfinnCap Ltd1 Bartholomew CloseLondonEC1A 7BL
AUDITORSBDO LLP55 Baker StreetLondon W1U 7EU
SOLICITORSTravers Smith LLP 10 Snow Hill London EC1A 2AL
REGISTRARShare Registrars Limited17 West StreetFarnham GU9 7DR
3 STRATEGIC REPORT 4 Letter from the Chairman6 Chief Executive Officer’s Report10 Business Model12 Our Strategy14 Key Performance Indicators16 Chief Financial Officer’s Report19 S.172 statement20 Engaging with our Stakeholders22 Operating Responsibly25 Managing Risks
28 GOVERNANCE31 Board of Directors33 Corporate Governance Report36 Nominations Committee37 Audit Committee Report38 Risk Committee Report39 Remuneration Committee Report
44 FINANCIAL STATEMENTS47 Statement of Directors’ Responsibilities 48 Directors’ Report50 Auditors’ Report55 Consolidated Statement of Comprehensive Income56 Consolidated Statement of Financial Position57 Company Statement of Financial Position58 Consolidated Statement of Cashflows59 Company Statement of Cashflows60 Consolidated Statement of Changes in Equity61 Company Statement of Changes in Equity62 Notes to Financial Statements
84 OTHER INFORMATION86 Alternative Performance Measures87 Other Information
finnCap Group PLC is a certified Carbon Neutral organisation
Contents 1

Strategic Report
FY 21 Report and Accounts
FY 21 Report and Accounts4
Letter from the Chairman “In an extra ordinary year with significant highs and
lows, our team adapted to change rapidly and united
to deliver outstanding results for our clients.”
The last financial year saw one of the most challenging operating environ-ments that our industry, staff and many of our clients have ever faced with a combination of extreme uncertainty, remote working and, as it transpired, extraordinary demand for our broad range of services.
DELIVERING RECORD RESULTS
In the face of this, I am delighted to say that our team delivered seamlessly and produced the best results finnCap has recorded since its inception in 2007 with revenue up over 80%, adjusted profit before tax up by six times and a four-fold increase in our cash resources.
finnCap Capital Markets had a record year for both corporate advisory fees and sales and trading income, as we helped a diverse range of clients - whether they needed protection against the adverse effects of the COVID-19 pandemic, to raise capital to accelerate growth or to float a new company on AIM. In aggregate the Capital Markets team raised c.£720m through placings and IPOs and advised on £235m of public markets M&A. Our enlarged debt team, arranged new credit facilities of over £120m across 9 completed transactions.
finnCap Cavendish, our private M&A advisory team, which we acquired in 2018, had its second-best year in terms of deal revenues which were up 66% on last year.
INVESTING IN OUR PEOPLE
In March 2020, we moved to remote working and remained so for almost the entire financial year. Through outstand-ing teamwork and innovation we rapidly overcame the challenges of remote working and returned to focusing on delivering for our clients and winning new business.
Whilst we contained costs carefully in H1, it became clear during Q2 that activity would continue to be strong. We therefore took the decision to invest further in people and made senior hires in UK M&A Advisory, Consumer Goods,
Investment Banking and Research, and Family Office coverage, and to establish finnCap Analytics, an expansion of our sales and trading business.
Although I joined finnCap mid lock-down, I have enjoyed meeting many of our people via Zoom and Teams to hear their perspectives on the business and our opportunities for growth.
The people I met all demonstrated our core values – Smart Thinking, Col-legiate and Dynamic – which underpin our belief in doing things the right way. It was also good to be part of a busi-ness that had already established good ESG practices at its heart.
GROWING SHAREHOLDER RETURNS WITH BALANCE SHEET STRENGTH
Like our peers, we initially assumed that the impact of COVID-19 would be strongly negative. We therefore put in place a firm-wide salary reduction for the first quarter, cancelled the final employee bonus for FY20, and also the final dividend for shareholders. These highly supportive actions from our colleagues, directors and shareholders - together with a strong financial per-formance - generated strong operating cashflow. Cash at year end stood at over £20m, up from £5m in March 2020.
Taking into account our performance and the strong start to the current finan-cial year, we announced the intention to pay a second interim dividend of 1.0p bringing the total for the year to 1.5p ahead of our dividend policy at IPO, and we expect to pay at least 1.6p per share in the current financial year.
BOARD CHANGES
In the past 18 months we have seen significant changes to our Board. In May 2020, Vin Murria stepped down from the Board to focus on her wider business opportunities. Vin provided the Board with her sharp entrepreneurial insight and energy and we wish her well.
After overseeing the successful integration of Cavendish into the Group, Lord Leigh of Hurley moved back to his
key relationship role as Cavendish’s Senior Partner in November 2020.
Jon Moulton retired as our much- valued Chairman in December 2020 after supporting and guiding the finnCap executive team for over eleven years of growth.
On behalf of us all at finnCap, I would like to thank each of them for their significant contributions to the Board, our strategy and the continuing devel-opment of finnCap as a successful and growing financial services company.
At an operational level, Richard Snow joined the Board in May 2020 as our Chief Financial Officer and Tom Hayward moved to the role of Chief Operating Officer.
OUTLOOK
Our performance in FY21 demonstrates that finnCap and its people have the ability to deliver certainty to clients in increasingly larger and more complex mandates. We also believe the mean-ingful revenue generation from our ex-panded product offering, together with our strategic investments in people, will help drive our growth to new levels.
Importantly, we finished the year with a very much stronger balance sheet allowing us to withstand better the inevitable volatility of our sector, take advantage of opportunities for growth and sustain shareholder returns.
Our 2022 financial year has started well and our strategy means finnCap is well positioned to drive profitable reve-nue growth over the medium-term.
FY21 has been an immensely chal-lenging but ultimately successful year for finnCap’s people. I would like to thank them for their exceptional client service and for supporting each other during a most extraordinary time.
ROBERT LISTER Non-Executive Chairman2 July 2021
5Strategic Report
Chief Executive Officer’s Report “Our FY21 results are a
testament to thegreat team we have built over many
years, and our dynamic, collegiate and smart- thinking culture del ivering our clients’ ambitions.”
FY 21 Report and Accounts6
RECORD RESULTS
In the year ended 31 March 2021, we delivered our best-ever financial results whilst operating in the most complex operating environment since we founded finnCap.
In contrast with FY20 which was impacted by Brexit uncertainty and the UK General Election, strong equity market conditions and the impact of COVID-19 on clients – both positive and negative - created extraordinary demand for our services and pressure for our team to deliver.
Added to this was the huge practical and personal complexity caused by COVID-19, lock-downs and remote working.
I am delighted to say that the team met and overcame these challenges brilliantly, and the Group delivered ex - ceptional results in FY21 for both its clients and its shareholders and, as a result of significant and focused investment in the business, is also in a strategically stronger position.
In FY21 total income was £47.6m, up 84% on FY20 (£25.9m). Adjusted PBT at £9.6m was 6 times higher than in FY20 (£1.6m). Cash was c.£20.4m, over four times higher than at the end of the last financial year.
COVID-19 - MAKING REMOTE WORKING WORK
The COVID-19 pandemic required a rapid response from our team who redeployed the business to their homes and implemented our disaster recovery plans flawlessly.
In line with the wider market, we planned for a severe economic impact and took significant measures to preserve and improve cashflow. Our actions included cancelling FY20 bonus payments, pausing dividends, company-wide staff salary reductions in Q1 and making limited use of the UK government’s furlough and tax deferral schemes.
Against initial sector expectations, activity in the capital markets was ex-traordinarily good with wide institutional
support for fundraisings and IPOs by companies with strong investment cases whether impacted by COVID-19 or not. We have particularly benefitted from years of strategic investment in research and investment banking capability in the life sciences and technology sectors.
By October 2020, the business had reached a point where it no longer need-ed to access UK government support schemes and we repaid all outstanding amounts due to the UK Government and returned all furlough support payments.
MARKET DYNAMICS
Overall equity issuance on the AIM market was high with c.£5.3bn raised in the year. Our market share was c.13% (fundraisings greater than £5m) reflecting our particular strength and historic investment in the technology, life sciences and consumer sectors.
The corporate placings market was busy and fund managers were highly receptive to:– investment in COVID-19 related therapies– providing support for companies with strong investment cases impacted by COVID-19 UK lock-downs; and– providing funds to support strong growth-led investment cases
Retail investors also returned to the equity markets, providing increased liquidity and a further source of capital. The increased liquidity and restored valuations also spurred on the IPO market adding new companies and life to AIM.
The M&A market was altogether more volatile with the COVID-19 uncertainty significantly impacting buyer confidence at the start of the year. However, stronger equity markets and the impact of owners’ concerns about potentially adverse changes to capital gains tax created much increased activity towards year end.
STRONG DIVISIONAL PERFORMANCE
finnCap Capital Markets generated £34.5m of revenue up 84% on last year (£18.7m). Deal fees exceeding £20m
for the first time and there was a strong contribution from sales and trading.
RETAINERS - Total fees from retainers in the period were stable at £6.4m (FY 20: £6.5m) and client numbers declined slightly to 119. In an environment where winning new clients has been challenging - due to the move to working from home and continuing client loss through delisting and takeover - we consider a stable client count to be a good outcome.
TRANSACTIONS - Total fees received from transactions in the period were £21.3m (FY20: £8.6m).
In the year, finnCap Capital Markets executed 64 transactions, including raising over £720m across 33 equity fundraisings for listed clients and four IPOs. NOTABLE DEALS INCLUDED: Life Sciences: Synairgen (£94m - 2 deals); Avacta (£53m - 2 deals); Evgen Pharma (£11m) Destiny Pharma (£9.5m); and Open Orphan (£12m)Tech: Argo BlockChain (£26.8m); Ideagen (£48.7m); RedCentric (£38.5m); Sopheon (£10m); Quartix (£28.9m); and Xeros Technology (£14m - 2 deals)Other key deals: K3 Capital (£30.5m); Revolution Bars (£15m); and Surface Transforms (£19.7m)
It was pleasing to bring four great companies to market in the year:IPOs: Dye and Durham (deal size £100m); Elixirr International (£25m); fonix Mobile (£45m) and Parsley Box (£17m).
We also advised on a total of 5 plc M&A deals with an aggregate deal value of £235m.
PLC M&A transactions included: £83m acquisition of Castleton Tech-nology PLC by MRI Software LLC; £79m acquisition of HWSI Realisation Fund Limited by Cubbitt Trade Holdings Lim-ited; £19m acquisition of HML Holdings PLC by Harwood Capital LLP; the £23m mandatory offer by Waterford Finance & Investment Limited for
7Strategic Report
Gulfsands Petroleum PLC; and the £30m acquisition of IndigoVision Group plc by Motorola Solutions, Inc.
The debt advisory team, which works across both finnCap and Cavendish, completed 9 mandates raising £124m and billed over £1m for the first time.
TRADING - Trading revenues were £6.8m (FY 20: £3.6m). The team provided critical liquidity to our corpo-rate and institutional clients during a volatile trading period and benefitted from increased corporate activity across the equity capital markets and the return of substantial retail demand to the AIM market.
In Q122 finnCap Capital Markets has continued to be highly active with equity placings in particular the £60m secondary placing of 25% of Best of the Best plc in April. The pipeline looks good with a number of IPOs expected in Q2 and in the coming months.
finnCap Cavendish experienced an M&A market that was impacted significantly by COVID-19 - which initially reducing buyer and seller confidence and the availability of M&A financing. As capital markets recovered and funding and confidence concerns eased, we saw a significant increase in activity with a rush to complete multiple deals in March 2021 due to perceived uncertainty around the impact of the UK budget.
finnCap Cavendish generated revenues of £12.1m, up 66% on FY20 (£7.3m). In total, it closed 11 private M&A transactions with an aggregate value of over £340m and with a much stronger performance in H2.
Key deals included: the sale of Caselines to Thomson Reuters, the sale of Systal to Inflexion and the sale of a stake in Margaret Dabbs to an Asian Trade investor.
Activity levels remained good in Cavendish. In Q1 22 we completed three deals in the human capital technology sector where a new sector head was hired in mid FY21, and we strengthened our Consumer team by hiring a new sec-tor head and an M&A focused director.
The deal pipeline is stronger than at this time last year with three deals currently awaiting regulatory approval prior to completion.
STRATEGIC DEVELOPMENT
We continued to invest in our strategy, particularly in the second half, when it became clear that business activity and financial performance would continue to be strong.
We have made selective sector/product hires across: – Investment Banking: Human Capital Technology, Consumer M&A, UK Technology and UK M&A; – Consumer Equity Research;– Family Offices and private growth capital fund-raising; and– an origination/lead generation function to primarily support our M&A efforts
We also strengthened our equity sales, corporate broking and ECM teams to ensure we have the capacity to service the needs of our client base both now and as we grow.
In Sales and Trading, we established a new team to expand this business into service a new class of institutional investors. This team, finnCap Analytics, offers analysis of market trends and events and execution services pre-dominantly around large cap equities. Activity began in April 2021 and will, over time, grow our secondary commis-sion business and establish relationships with the larger institutions and hedge funds that will be increasingly important to our growing corporate clients.
Our debt advisory business broke the £1m revenue threshold for the first time and its pipeline of business, now sourced from a wide range of situations across PE, M&A team and our ECM clients, is good.
Finally, in September 2020, the Group occupied its new offices at One Bartholomew Close having completed a COVID-19 compliant fit out, success-fully co-locating all parts of the Group. Alongside this co-location, in order to further align our team, substantially all Cavendish partners moved across to join the Group’s discretionary
bonus plan - giving up the deal specific bonus arrangements historically used in Cavendish with an accompanying normalisation of salaries. This is an important change encouraging team behaviour and the best client service.
Whilst we have endured another UK lockdown since our move, during the period that we could work together we have seen clear signs of the synergies obtainable from all parts of our business being in the same environment. The move has allowed staff to co-operate and find the best solutions for clients – a key factor that underpinned our decision to find new offices that would enable us both to co-locate and also provide space for future headcount growth.
In late 2020 we began to review potential M&A opportunities including business services sectors and specific companies that might form part of a third leg of the finnCap group, so ex-panding our business potentially beyond its core financial services offering.
OPERATING RESPONSIBLY
finnCap has always focused on operat-ing responsibly and engaging actively with its key stakeholders and the wider community, in particular around youth entrepreneurship.
Environmental, social and govern-ance (ESG) issues are finally becoming mainstream and of clear relevance to providers of capital, customers and colleagues alike.
We were pleased to support World-WideGeneration (“WWG”), a leading ESG Governance software provider, through a £150k investment as part of a larger fundraising. We also entered into a commercial partnership with WWG to assist in growing its client base by offering its service to our clients on a one-year free trial basis. We use this product ourselves and its benchmark scores for finnCap are set out in the section of this report called Operating responsibly – our approach to ESG.
Together with our partnership with WWG we continued to show leadership in the governance and measurement around ESG with the creation of our
FY 21 Report and Accounts8
own finnCap ESG Scorecard to give small cap clients the ability to take their first formal steps around ESG reporting.
We have also hosted client education events around ESG, targeting NEDs and executives and investors focused on ESG reporting.
During FY21 we introduced an Employee Volunteer programme which allows employees to donate two days of their time each year to a chosen charity or good cause.
After the year end, in May we entered into a partnership with YourGamePlan to create free online training focused on entrepreneurship and a UK wide initiative to discover some of the UK’s brightest young entrepreneurial talent. The first initiative, Your Side Hustle is open to 14-18 year olds who already have a side hustle (part time job) or an amazing business idea with a £10,000 prize fund for the winners to help grow their business.
REWARDING SHAREHOLDERS
The Board recognises the importance of income to its shareholders and appreciated the support it received from shareholders for its cancellation of the final dividend for FY20.
This, in conjunction with the compa-rable contribution made by employees from the cancellation of the FY20 dis cretionary bonus plan, and the benefit of the staff-wide salary cuts in Q1, substantially improved our financial position as we entered the pandemic.
Given the strong financial performan-ce in FY21 and the improved balance sheet position of the Group, the Directors intend to confirm a second interim div-idend of 1.0p per share bringing a total dividend for FY21 to 1.5p ahead of our commitment at the time of our IPO.
Paying the dividend as an interim dividend allows the Board to make a payment ahead of the AGM in Septem-ber and to spread dividends more equally across the financial year. There will, accordingly, be no further dividend paid in respect of FY21.
Q1 TRADING AND OUTLOOK
The financial year has started well with revenue ahead of last year. Our ECM division has continued to raise equity and execute block trades for clients , alongside this, we have exchanged on several private M&A transactions and another large equity fund raising which remain subject to regulatory approval and are expected to close in H1. Sales and trading activity has been good and was supported by the first contributions from the finnCap Analytics team which commenced activity in April.
Cash at 29 June was £17.2m (unaudited) reflecting the payment of staff discretionary bonuses post year end offset by the continued strong trading performance and receipt of funds from the sale of 70% of our stake in Primary Bid Limited.
Although it is still early in the year, our pipeline of business for the rest of the year is good, including several IPOs and M&A deals for Q2. Our results will be influenced by the market’s continuing receptiveness to new equity issuance and IPOs, however, we currently look set to have another strong performance in FY22 and expect revenue for FY22 to be in the £40-£50m range.
In recognition of the significant progress the group has made to drive growth from its strategy, and our strong capital and cash position, in the absence of unforeseen circumstances, the Board has committed to declare aggregate dividends of at least 1.6p per share for FY22 given the significantly strengthened balance sheet and in line with our intention to hold minimum cash reserves (post liabilities) of at least £10m.
A BIG THANK YOU TO THE TEAM
Our FY21 results and stronger balance sheet are a testament to the great team that we have built over many years and the expertise and sector knowledge they use to serve clients well in extraordinary as well as ordinary times.
SAM SMITHChief Executive Officer2 July 2021
9Strategic Report
BUSINESS MODEL – IN THE BUSINESS OF TOMORROW
finnCap Group provides strategic ad-vice, capital raising and related services to corporate and institutional clients, to high net worth investors including private equity and family offices.
Established in 2007 we have built a strong track record in equity advice and fund-raisings, public and private M&A, debt arrangement and advice and act as NOMAD for 119 clients listed on AIM with a particular focus on the technology, life sciences, consumer and business services sectors.
We understand that every business success does not just benefit its share-holders, but also delivers innovation, employment, economic prosperity and benefits society and the world at large.
Our ambition is to partner with inno-vative, entrepreneurial and determined businesses to take them through each stage of their development. Together we unlock potential and deliver transforma-tional business growth. Our corporate clients usually have values of between £20m and £500m and a need to raise capital to take advantage of or adapt to strategic change or to gain liquidity for their investments. Our sales and trading
teams service institutional clients which focus on investment across a wide range of assets under management, strategy and geographic and sector focus.
We operate in a highly competitive market but, beyond our ability to deliver for clients, we believe that we offer three key differentiators. Our people – who are highly capable and united by our unique, collaborative culture; the partnership approach we take with our clients; and our ability to advise and deliver across a wider and more comprehensive range of services than our peers.
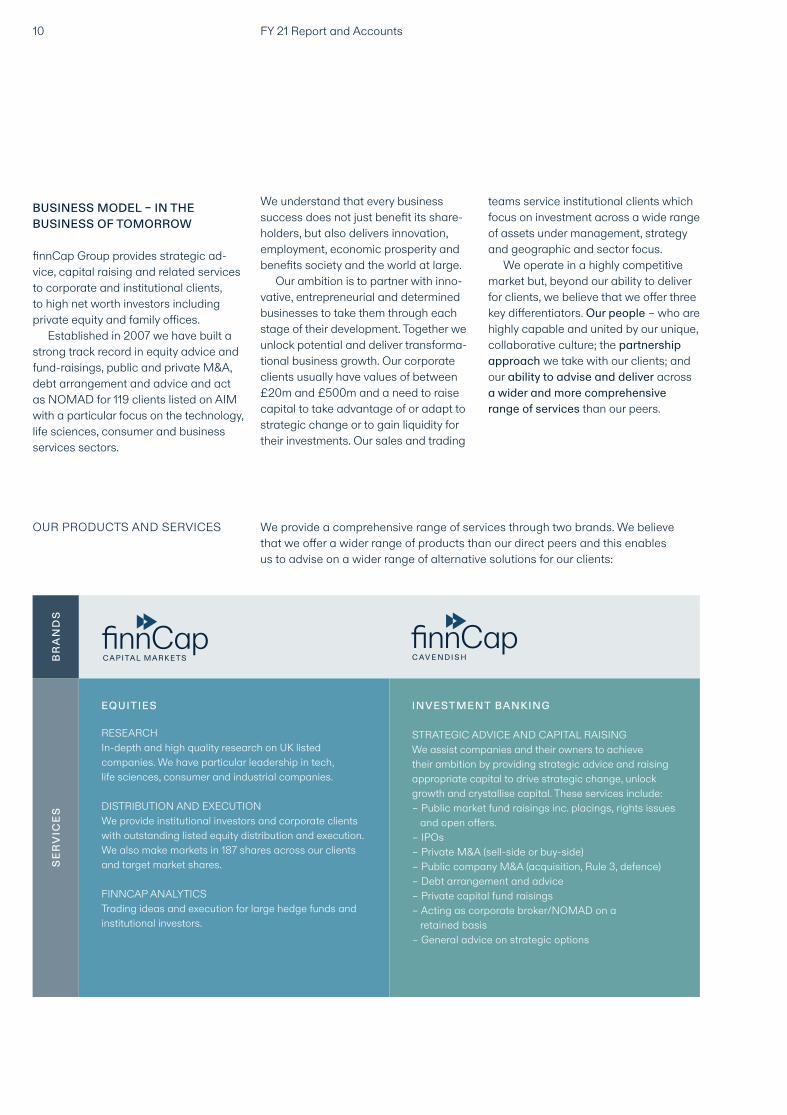
OUR PRODUCTS AND SERVICES We provide a comprehensive range of services through two brands. We believe that we offer a wider range of products than our direct peers and this enables us to advise on a wider range of alternative solutions for our clients:
FY 21 Report and Accounts10
SE
RV
ICE
S
EQUITIES
RESEARCH In-depth and high quality research on UK listed companies. We have particular leadership in tech, life sciences, consumer and industrial companies.
DISTRIBUTION AND EXECUTION We provide institutional investors and corporate clients with outstanding listed equity distribution and execution. We also make markets in 187 shares across our clients and target market shares.
FINNCAP ANALYTICS Trading ideas and execution for large hedge funds and institutional investors.
INVESTMENT BANKING
STRATEGIC ADVICE AND CAPITAL RAISING We assist companies and their owners to achieve their ambition by providing strategic advice and raising appropriate capital to drive strategic change, unlock growth and crystallise capital. These services include:– Public market fund raisings inc. placings, rights issues and open offers. – IPOs – Private M&A (sell-side or buy-side) – Public company M&A (acquisition, Rule 3, defence) – Debt arrangement and advice – Private capital fund raisings – Acting as corporate broker/NOMAD on a retained basis – General advice on strategic options
BR
AN
DS
OUR PEOPLE AND VALUES
Since our MBO in 2007, finnCap has always believed in doing business ‘The Right Way’. It was the core reason for our creation of a unique financial services firm focused on creating value through strong partnerships between our people and our clients and a focus, also, on our contribution to the wider community.
We first wrote down our values in 2013 and they reflect our culture, our way of doing business and have remained, essentially, unchanged since we founded finnCap.
COLLEGIATE – We work as a team to ensure that our clients get the best pos-sible advice based on a very wide set of options. We are inclusive and make use of everyone’s skills.
SMART THINKING – To compete in our markets requires us to be innovative and proactive in dev eloping ideas and relevant solutions for our clients.
DYNAMIC – We deliver our client’s ambitions with energy, focused solely on their objectives.
THE RIGHT WAY: The people in finnCap combine this set of values with established best practice within our markets and our wider engagement with stakeholders to do business in the right way.
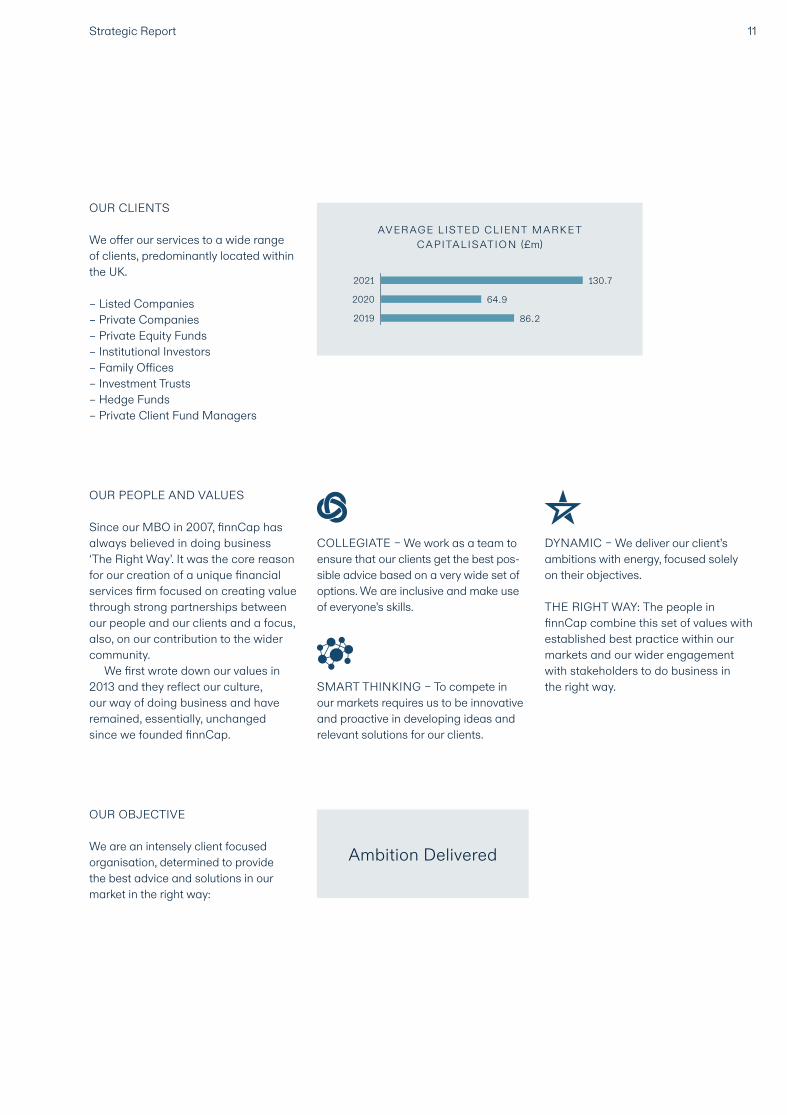
OUR CLIENTS
We offer our services to a wide range of clients, predominantly located within the UK.
– Listed Companies – Private Companies – Private Equity Funds – Institutional Investors – Family Offices – Investment Trusts – Hedge Funds – Private Client Fund Managers
11Strategic Report
OUR OBJECTIVE
We are an intensely client focused organisation, determined to provide the best advice and solutions in our market in the right way:
Ambition Delivered
AVER AGE L ISTED CLIENT MARK E T CAPITALISATION (£m)
2021
2020
2019
130.7
64.9
86.2
FY 21 Report and Accounts12
OUR STRATEGY TO CREATE VALUE FOR SHAREHOLDERS
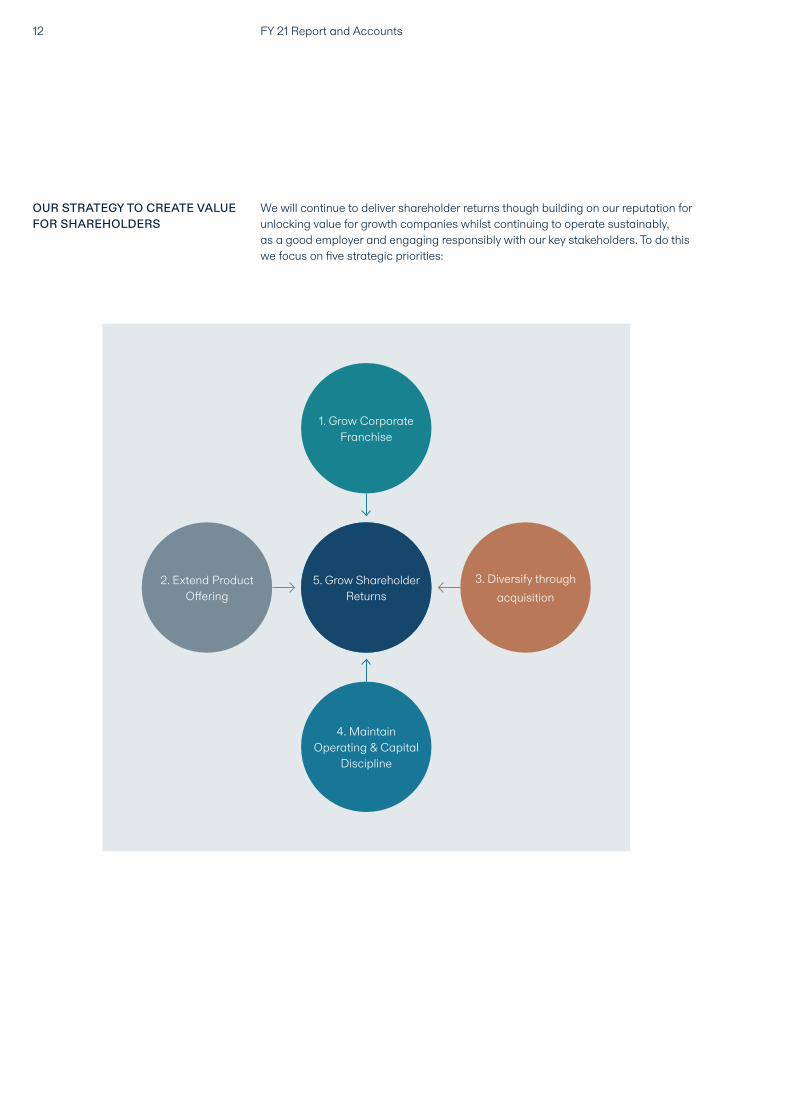
We will continue to deliver shareholder returns though building on our reputation for unlocking value for growth companies whilst continuing to operate sustainably, as a good employer and engaging responsibly with our key stakeholders. To do this we focus on five strategic priorities:
1. Grow Corporate Franchise
5. Grow Shareholder Returns
2. Extend ProductOffering
3. Diversify through acquisition
4. Maintain Operating & Capital
Discipline
13Strategic Report
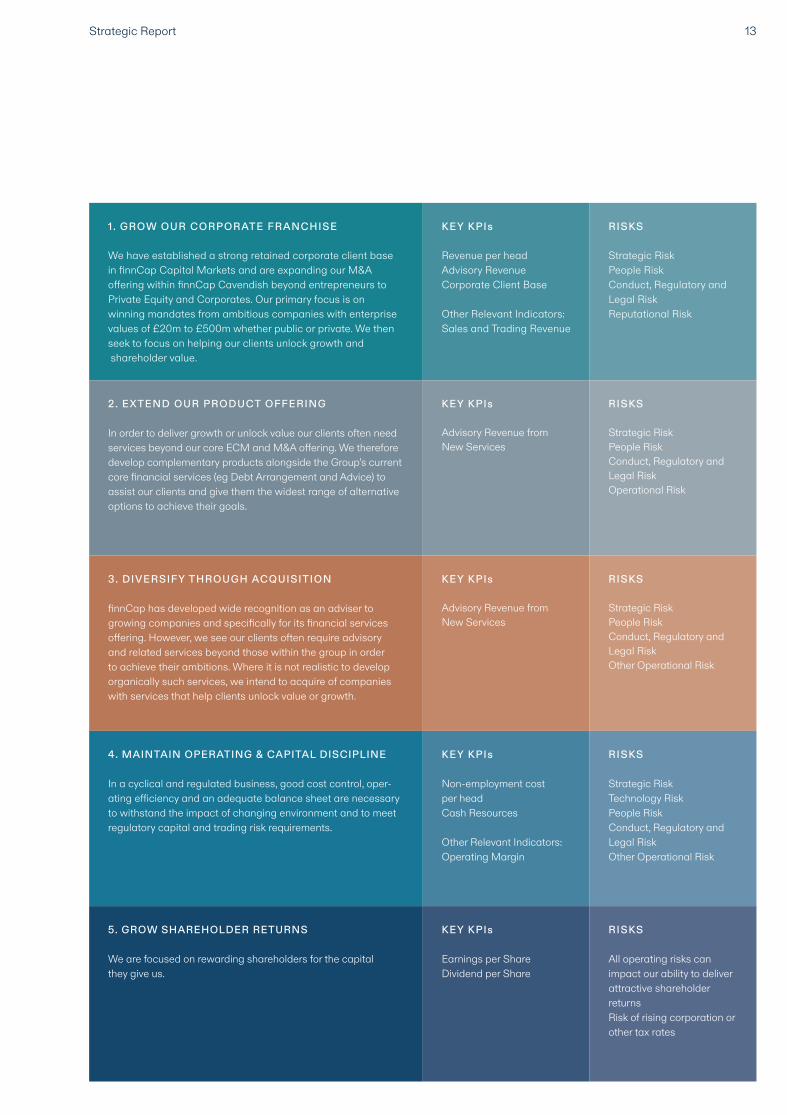
1 . GROW OUR CORPORATE FRANCHISE
We have established a strong retained corporate client base in finnCap Capital Markets and are expanding our M&A offering within finnCap Cavendish beyond entrepreneurs to Private Equity and Corporates. Our primary focus is on winning mandates from ambitious companies with enterprise values of £20m to £500m whether public or private. We then seek to focus on helping our clients unlock growth and shareholder value.
KEY KPIs
Revenue per headAdvisory RevenueCorporate Client Base
Other Relevant Indicators:Sales and Trading Revenue
RISKS
Strategic RiskPeople RiskConduct, Regulatory and Legal RiskReputational Risk
2. EXTEND OUR PRODUCT OFFERING
In order to deliver growth or unlock value our clients often need services beyond our core ECM and M&A offering. We therefore develop complementary products alongside the Group’s current core financial services (eg Debt Arrangement and Advice) to assist our clients and give them the widest range of alternative options to achieve their goals.
KEY KPIs
Advisory Revenue from New Services
RISKS
Strategic RiskPeople RiskConduct, Regulatory and Legal RiskOperational Risk
3. DIVERSIFY THROUGH ACQUISITION
finnCap has developed wide recognition as an adviser to growing companies and specifically for its financial services offering. However, we see our clients often require advisory and related services beyond those within the group in order to achieve their ambitions. Where it is not realistic to develop organically such services, we intend to acquire of companies with services that help clients unlock value or growth.
KEY KPIs
Advisory Revenue from New Services
RISKS
Strategic RiskPeople RiskConduct, Regulatory and Legal RiskOther Operational Risk
4. MAINTAIN OPERATING & CAPITAL DISCIPLINE
In a cyclical and regulated business, good cost control, oper-ating efficiency and an adequate balance sheet are necessary to withstand the impact of changing environment and to meet regulatory capital and trading risk requirements.
KEY KPIs
Non-employment cost per headCash Resources Other Relevant Indicators: Operating Margin
RISKS
Strategic RiskTechnology RiskPeople RiskConduct, Regulatory and Legal RiskOther Operational Risk
5. GROW SHAREHOLDER RETURNS
We are focused on rewarding shareholders for the capital they give us.
KEY KPIs
Earnings per ShareDividend per Share
RISKS
All operating risks can impact our ability to deliver attractive shareholder returnsRisk of rising corporation or other tax rates
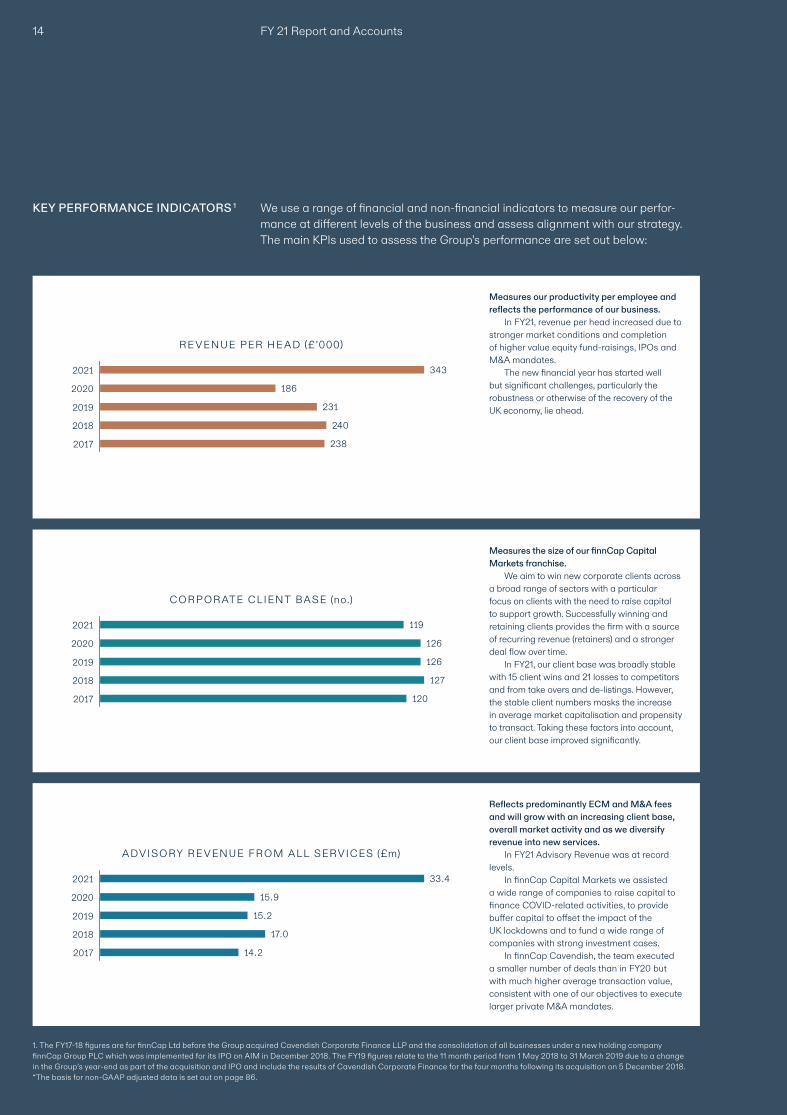
Measures the size of our finnCap Capital Markets franchise.
We aim to win new corporate clients across a broad range of sectors with a particular focus on clients with the need to raise capital to support growth. Successfully winning and retaining clients provides the firm with a source of recurring revenue (retainers) and a stronger deal flow over time.
In FY21, our client base was broadly stable with 15 client wins and 21 losses to competitors and from take overs and de-listings. However, the stable client numbers masks the increase in average market capitalisation and propensity to transact. Taking these factors into account, our client base improved significantly.
Measures our productivity per employee and reflects the performance of our business.
In FY21, revenue per head increased due to stronger market conditions and completion of higher value equity fund-raisings, IPOs and M&A mandates.
The new financial year has started well but significant challenges, particularly the robustness or otherwise of the recovery of the UK economy, lie ahead.
Reflects predominantly ECM and M&A fees and will grow with an increasing client base, overall market activity and as we diversify revenue into new services.
In FY21 Advisory Revenue was at record levels.
In finnCap Capital Markets we assisted a wide range of companies to raise capital to finance COVID-related activities, to provide buffer capital to offset the impact of the UK lockdowns and to fund a wide range of companies with strong investment cases.
In finnCap Cavendish, the team executed a smaller number of deals than in FY20 but with much higher average transaction value, consistent with one of our objectives to execute larger private M&A mandates.
FY 21 Report and Accounts14
1. The FY17-18 figures are for finnCap Ltd before the Group acquired Cavendish Corporate Finance LLP and the consolidation of all businesses under a new holding company finnCap Group PLC which was implemented for its IPO on AIM in December 2018. The FY19 figures relate to the 11 month period from 1 May 2018 to 31 March 2019 due to a change in the Group’s year-end as part of the acquisition and IPO and include the results of Cavendish Corporate Finance for the four months following its acquisition on 5 December 2018. *The basis for non-GAAP adjusted data is set out on page 86.
KEY PERFORMANCE INDICATORS 1 We use a range of financial and non-financial indicators to measure our perfor-mance at different levels of the business and assess alignment with our strategy. The main KPIs used to assess the Group’s performance are set out below:
343
186
231
240
238
2021
2020
2019
2018
2017
RE VENUE PER HE AD (£’000)
119
126
126
127
120
2021
2020
2019
2018
2017
CORPOR ATE CLIENT BASE (no.)
33.4
15.9
15.2
17.0
14.2
2021
2020
2019
2018
2017
ADVISORY RE VENUE FROM ALL SERVICES (£m)
15Strategic Report
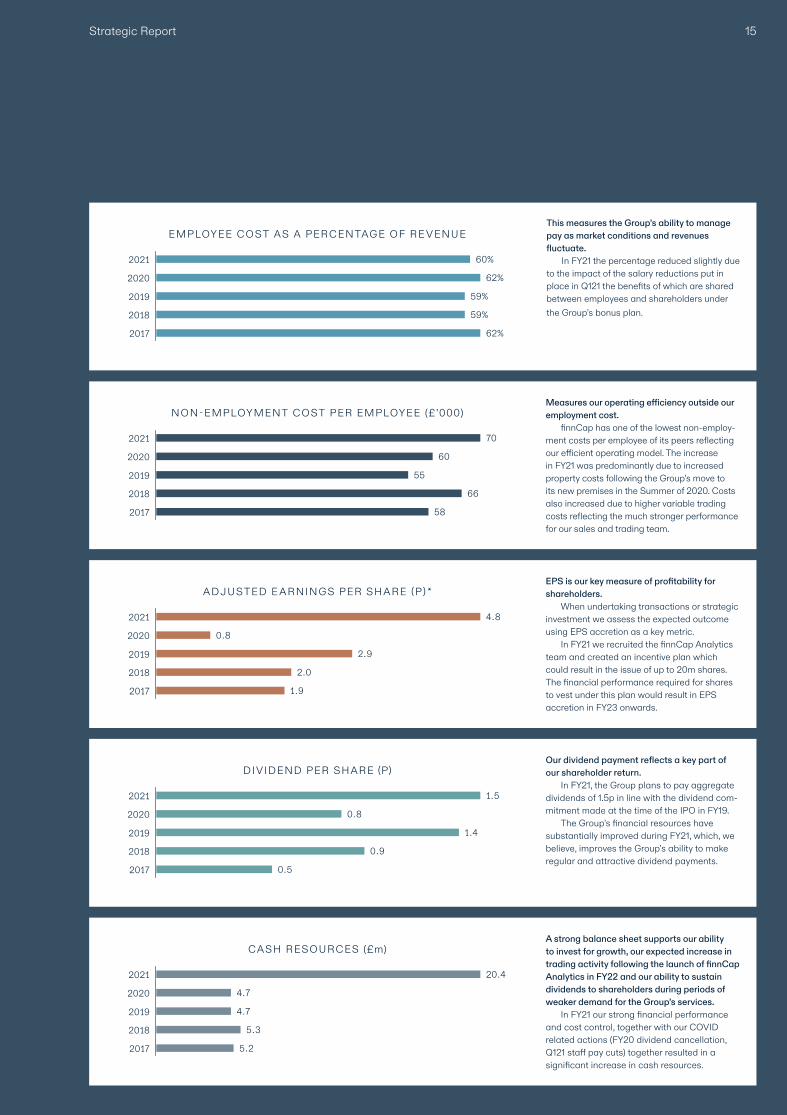
This measures the Group’s ability to manage pay as market conditions and revenues fluctuate.
In FY21 the percentage reduced slightly due to the impact of the salary reductions put in place in Q121 the benefits of which are shared between employees and shareholders under the Group’s bonus plan.
Measures our operating efficiency outside our employment cost.
finnCap has one of the lowest non-employ-ment costs per employee of its peers reflecting our efficient operating model. The increase in FY21 was predominantly due to increased property costs following the Group’s move to its new premises in the Summer of 2020. Costs also increased due to higher variable trading costs reflecting the much stronger performance for our sales and trading team.
EPS is our key measure of profitability for shareholders.
When undertaking transactions or strategic investment we assess the expected outcome using EPS accretion as a key metric.
In FY21 we recruited the finnCap Analytics team and created an incentive plan which could result in the issue of up to 20m shares. The financial performance required for shares to vest under this plan would result in EPS accretion in FY23 onwards.
Our dividend payment reflects a key part of our shareholder return.
In FY21, the Group plans to pay aggregate dividends of 1.5p in line with the dividend com-mitment made at the time of the IPO in FY19.
The Group’s financial resources have substantially improved during FY21, which, we believe, improves the Group’s ability to make regular and attractive dividend payments.
A strong balance sheet supports our ability to invest for growth, our expected increase in trading activity following the launch of finnCap Analytics in FY22 and our ability to sustain dividends to shareholders during periods of weaker demand for the Group’s services.
In FY21 our strong financial performance and cost control, together with our COVID related actions (FY20 dividend cancellation, Q121 staff pay cuts) together resulted in a significant increase in cash resources.
60%
62%
59%
59%
62%
EMPLOYEE COST AS A PERCENTAGE OF RE VENUE
70
60
55
66
58
NON-EMPLOYMENT COST PER EMPLOYEE (£’000)
4.8
0.8
2.9
2.0
1.9
ADJUSTED E ARNINGS PER SHARE (P) *
1.5
0.8
1.4
0.9
0.5
DIVIDEND PER SHARE (P)
20.4
4.7
4.7
5.3
5.2
2021
2020
2019
2018
2017
2021
2020
2019
2018
2017
2021
2020
2019
2018
2017
2021
2020
2019
2018
2017
2021
2020
2019
2018
2017
CASH RESOURCES (£m)
FY 21 Report and Accounts16
Chief Financial Officer’s Report “Through a period of
exceptional financial performance finnCap’s liquidity
and financial position has materially improved creating options for growth and protecting dividends.”
17Strategic Report
Through careful cost control and liquidity management, the Group has converted a period of exceptional revenue per-formance into strong profit and cashflow. This has enabled us to drive our strategy for growth through diversification, to invest in our new office and allows us to return to making dividend payments to our shareholders.
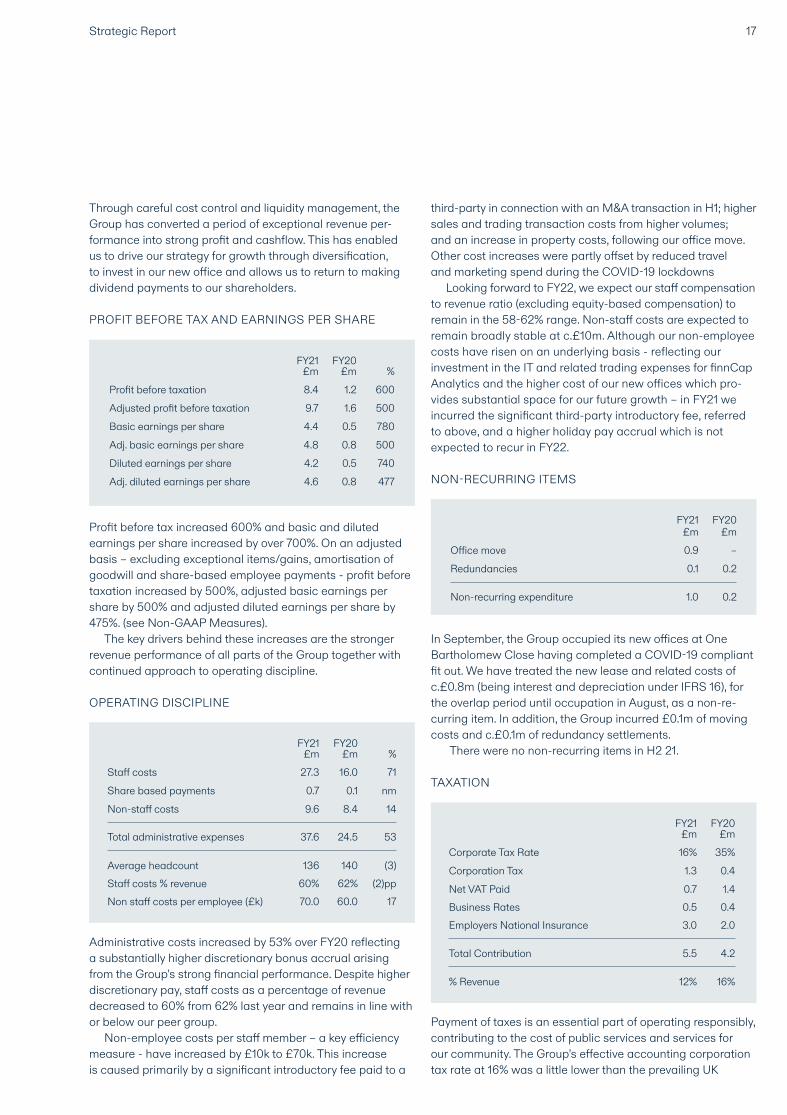
PROFIT BEFORE TAX AND EARNINGS PER SHARE
Profit before tax increased 600% and basic and diluted earnings per share increased by over 700%. On an adjusted basis – excluding exceptional items/gains, amortisation of goodwill and share-based employee payments - profit before taxation increased by 500%, adjusted basic earnings per share by 500% and adjusted diluted earnings per share by 475%. (see Non-GAAP Measures).
The key drivers behind these increases are the stronger revenue performance of all parts of the Group together with continued approach to operating discipline.
OPERATING DISCIPLINE
Administrative costs increased by 53% over FY20 reflecting a substantially higher discretionary bonus accrual arising from the Group’s strong financial performance. Despite higher discretionary pay, staff costs as a percentage of revenue decreased to 60% from 62% last year and remains in line with or below our peer group.
Non-employee costs per staff member – a key efficiency measure - have increased by £10k to £70k. This increase is caused primarily by a significant introductory fee paid to a
third-party in connection with an M&A transaction in H1; higher sales and trading transaction costs from higher volumes; and an increase in property costs, following our office move. Other cost increases were partly offset by reduced travel and marketing spend during the COVID-19 lockdowns
Looking forward to FY22, we expect our staff compensation to revenue ratio (excluding equity-based compensation) to remain in the 58-62% range. Non-staff costs are expected to remain broadly stable at c.£10m. Although our non-employee costs have risen on an underlying basis - reflecting our investment in the IT and related trading expenses for finnCap Analytics and the higher cost of our new offices which pro-vides substantial space for our future growth – in FY21 we incurred the significant third-party introductory fee, referred to above, and a higher holiday pay accrual which is not expected to recur in FY22.
NON-RECURRING ITEMS
In September, the Group occupied its new offices at One Bartholomew Close having completed a COVID-19 compliant fit out. We have treated the new lease and related costs of c.£0.8m (being interest and depreciation under IFRS 16), for the overlap period until occupation in August, as a non-re-curring item. In addition, the Group incurred £0.1m of moving costs and c.£0.1m of redundancy settlements.
There were no non-recurring items in H2 21.
TAXATION
Payment of taxes is an essential part of operating responsibly, contributing to the cost of public services and services for our community. The Group’s effective accounting corporation tax rate at 16% was a little lower than the prevailing UK
FY21£m
FY20£m %
Profit before taxation 8.4 1.2 600
Adjusted profit before taxation 9.7 1.6 500
Basic earnings per share 4.4 0.5 780
Adj. basic earnings per share 4.8 0.8 500
Diluted earnings per share 4.2 0.5 740
Adj. diluted earnings per share 4.6 0.8 477
FY21£m
FY20£m %
Staff costs 27.3 16.0 71
Share based payments 0.7 0.1 nm
Non-staff costs 9.6 8.4 14
Total administrative expenses 37.6 24.5 53
Average headcount 136 140 (3)
Non staff costs per employee (£k) 70.0 60.0 17Staff costs % revenue 60% 62% (2)pp
FY21£m
FY20£m
Office move 0.9 –
Redundancies 0.1 0.2
Non-recurring expenditure 1.0 0.2
Corporate Tax Rate
Corporation Tax
Net VAT PaidBusiness RatesEmployers National Insurance
% Revenue
Total Contribution
FY21£m
FY20£m
16% 35%
1.3 0.4
0.7 1.40.5 0.43.0 2.0
12% 16%
5.5 4.2
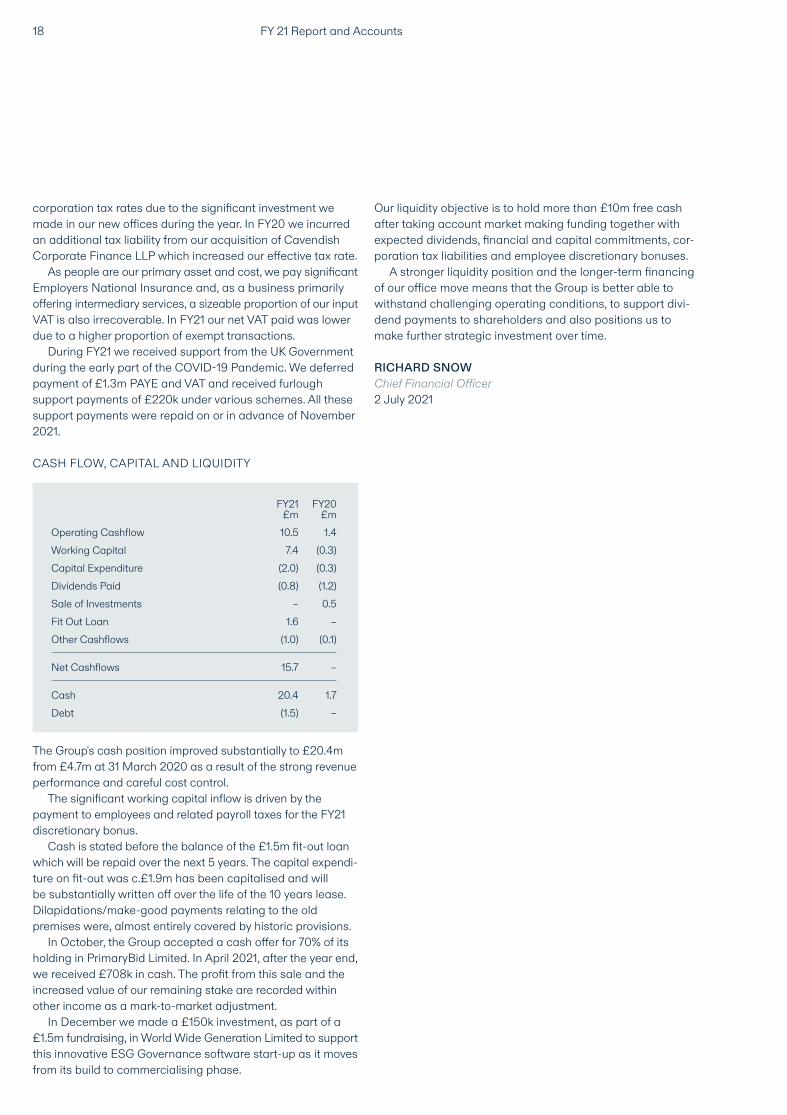
corporation tax rates due to the significant investment we made in our new offices during the year. In FY20 we incurred an additional tax liability from our acquisition of Cavendish Corporate Finance LLP which increased our effective tax rate.
As people are our primary asset and cost, we pay significant Employers National Insurance and, as a business primarily offering intermediary services, a sizeable proportion of our input VAT is also irrecoverable. In FY21 our net VAT paid was lower due to a higher proportion of exempt transactions.
During FY21 we received support from the UK Government during the early part of the COVID-19 Pandemic. We deferred payment of £1.3m PAYE and VAT and received furlough support payments of £220k under various schemes. All these support payments were repaid on or in advance of November 2021.
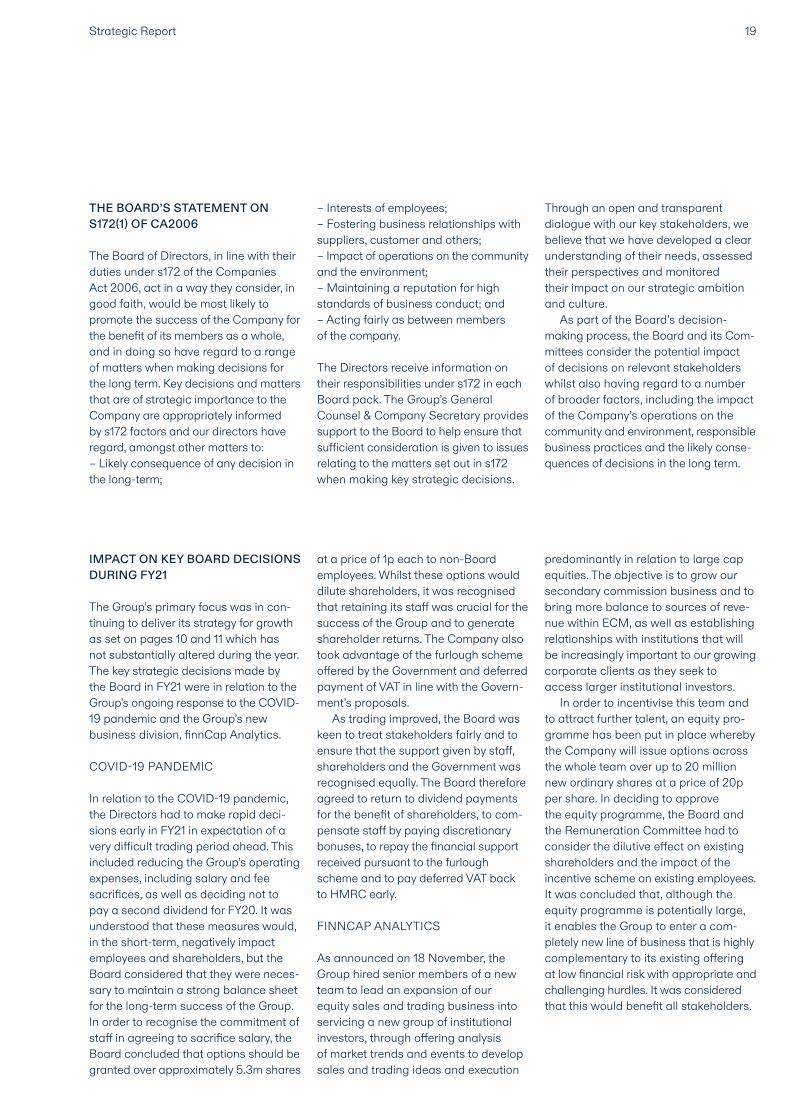
CASH FLOW, CAPITAL AND LIQUIDITY
The Group's cash position improved substantially to £20.4m from £4.7m at 31 March 2020 as a result of the strong revenue performance and careful cost control.
The significant working capital inflow is driven by the payment to employees and related payroll taxes for the FY21 discretionary bonus.
Cash is stated before the balance of the £1.5m fit-out loan which will be repaid over the next 5 years. The capital expendi-ture on fit-out was c.£1.9m has been capitalised and will be substantially written off over the life of the 10 years lease. Dilapidations/make-good payments relating to the old premises were, almost entirely covered by historic provisions.
In October, the Group accepted a cash offer for 70% of its holding in PrimaryBid Limited. In April 2021, after the year end, we received £708k in cash. The profit from this sale and the increased value of our remaining stake are recorded within other income as a mark-to-market adjustment.
In December we made a £150k investment, as part of a £1.5m fundraising, in World Wide Generation Limited to support this innovative ESG Governance software start-up as it moves from its build to commercialising phase.
Our liquidity objective is to hold more than £10m free cash after taking account market making funding together with expected dividends, financial and capital commitments, cor-poration tax liabilities and employee discretionary bonuses.
A stronger liquidity position and the longer-term financing of our office move means that the Group is better able to withstand challenging operating conditions, to support divi-dend payments to shareholders and also positions us to make further strategic investment over time.
RICHARD SNOWChief Financial Officer2 July 2021
FY21£m
FY20£m
Operating Cashflow 10.5 1.4Working Capital 7.4 (0.3)Capital Expenditure (2.0) (0.3)Dividends Paid (0.8) (1.2)Sale of Investments – 0.5
Net Cashflows 15.7 –
Other Cashflows (1.0) (0.1)
Debt (1.5) –
Fit Out Loan 1.6 –
Cash 20.4 1.7
FY 21 Report and Accounts18
19Strategic Report
THE BOARD’S STATEMENT ON S172(1) OF CA2006
The Board of Directors, in line with their duties under s172 of the Companies Act 2006, act in a way they consider, in good faith, would be most likely to promote the success of the Company for the benefit of its members as a whole, and in doing so have regard to a range of matters when making decisions for the long term. Key decisions and matters that are of strategic importance to the Company are appropriately informed by s172 factors and our directors have regard, amongst other matters to:– Likely consequence of any decision in the long-term;
– Interests of employees;– Fostering business relationships with suppliers, customer and others;– Impact of operations on the community and the environment;– Maintaining a reputation for high standards of business conduct; and– Acting fairly as between members of the company.
The Directors receive information on their responsibilities under s172 in each Board pack. The Group’s General Counsel & Company Secretary provides support to the Board to help ensure that sufficient consideration is given to issues relating to the matters set out in s172 when making key strategic decisions.
Through an open and transparent dia logue with our key stakeholders, we believe that we have developed a clear understanding of their needs, assessed their perspectives and monitored their impact on our strategic ambition and culture.
As part of the Board’s decision- making process, the Board and its Com-mittees consider the potential impact of decisions on relevant stakeholders whilst also having regard to a number of broader factors, including the impact of the Company’s operations on the community and environment, responsible business practices and the likely conse-quences of decisions in the long term.
IMPACT ON KEY BOARD DECISIONS DURING FY21
The Group’s primary focus was in con-tinuing to deliver its strategy for growth as set on pages 10 and 11 which has not substantially altered during the year. The key strategic decisions made by the Board in FY21 were in relation to the Group’s ongoing response to the COVID- 19 pandemic and the Group’s new business division, finnCap Analytics.
COVID-19 PANDEMIC
In relation to the COVID-19 pandemic, the Directors had to make rapid deci-sions early in FY21 in expectation of a very difficult trading period ahead. This included reducing the Group’s operating expenses, including salary and fee sacrifices, as well as deciding not to pay a second dividend for FY20. It was understood that these measures would, in the short-term, negatively impact employees and shareholders, but the Board considered that they were neces-sary to maintain a strong balance sheet for the long-term success of the Group. In order to recognise the commitment of staff in agreeing to sacrifice salary, the Board concluded that options should be granted over approximately 5.3m shares
at a price of 1p each to non-Board employees. Whilst these options would dilute shareholders, it was recognised that retaining its staff was crucial for the success of the Group and to generate shareholder returns. The Company also took advantage of the furlough scheme offered by the Government and deferred payment of VAT in line with the Govern-ment’s proposals.
As trading improved, the Board was keen to treat stakeholders fairly and to ensure that the support given by staff, shareholders and the Government was recognised equally. The Board therefore agreed to return to dividend payments for the benefit of shareholders, to com-pensate staff by paying discretionary bonuses, to repay the financial support received pursuant to the furlough scheme and to pay deferred VAT back to HMRC early.
FINNCAP ANALYTICS
As announced on 18 November, the Group hired senior members of a new team to lead an expansion of our equity sales and trading business into servicing a new group of institutional investors, through offering analysis of market trends and events to develop sales and trading ideas and execution
predominantly in relation to large cap equities. The objective is to grow our secondary commission business and to bring more balance to sources of reve-nue within ECM, as well as establishing relationships with institutions that will be increasingly important to our growing corporate clients as they seek to access larger institutional investors.
In order to incentivise this team and to attract further talent, an equity pro-gramme has been put in place whereby the Company will issue options across the whole team over up to 20 million new ordinary shares at a price of 20p per share. In deciding to approve the equity programme, the Board and the Remuneration Committee had to consider the dilutive effect on existing shareholders and the impact of the incentive scheme on existing employees. It was concluded that, although the equity programme is potentially large, it enables the Group to enter a com-pletely new line of business that is highly complementary to its existing offering at low financial risk with appropriate and challenging hurdles. It was considered that this would benefit all stakeholders.
FY 21 Report and Accounts20
ENGAGEMENT WITH OUR KEY STAKEHOLDERS
We set out below those whom we view to be our key stakeholders, how we engage with them and our assessment of how effective this engagement has been. As is normal for most listed or larger companies, the Board delegates authority for the day-to-day manage-ment of the Company to its executive Directors and management team, providing oversight by monitoring their progress against the Group’s KPIs and strategy as indicated in this Report.
Communication is key to building trust with our stakeholder groups and the COVID-19 pandemic has required a heightened awareness of the need to do so across new ways using often unfamiliar technology.
The Board has identified its key stakeholder groups as being its clients, employees, shareholders, regulators, and the wider community and environment. We discuss further our engagement with each stakeholder group and discuss our approach and standards we set for operating responsibly.
CLIENTS
Our clients are central to the success of our business. Our aim is to provide them with a team of experts who deliver exemplary service to achieve their business ambition.
At 31 March 2021 we were engaged by a total of 119 clients on a retainer basis and a further 41 clients on a diverse range of mandates including M&A and debt advisory.
Our strategy requires us to provide and maintain a high-quality service for our clients at all times. We recognise that the success of our clients is critical to our own success and that this applies equally to our advisory clients, quoted clients and institutional clients.
We have dedicated teams across sectors and advisory lines offering bespoke advice to our quoted, advisory and institutional clients based on a proper understanding of that client’s needs and often founded on a
relationship built over a number of years. We regularly select and undertake
independent, internal peer reviews of transactions to ensure that we maintain our internal standards and to identify where we can improve service. We also hold weekly client service meetings to identify client issues and resolution, a key aspect for retaining our listed client base.
We believe that the effect of these processes is reflected in the number of listed clients who have remained with us for more than 5 years.
In the unusual event we fail to meet our clients’ high standards, our com-plaints procedure escalates matters immediately to the Head of Compliance. Information about complaints is circu-lated to the Board’s Risk & Compliance Committee for appropriate oversight and to enable non-executive Directors to monitor the Group’s client relationships.
During the COVID-19 pandemic a limited number of our clients faced financial challenges. We have assisted some of these clients through fee and or retainer deferral and, in some cases, taking our fees in shares. Supporting clients in bad times as well as good is a key-way to demonstrate our commit-ment to their success to deepen our relationship with them.
PEOPLE
Our employees are central to our suc-cess in delivering high quality service and advice to our clients.
Engagement with our employees requires a high degree of informal day-to-day contact; regular functional team meetings; an annual strategy update and bi-annual results briefings.
In a complex operating environment due to COVID-19 home working and an entire office move and integration, our employees have worked exceptionally hard to support the business and to sustain our culture which is central to our employee engagement.
The Group’s cultural values – Smart Thinking, Collegiate, Dynamic - were established and defined by our employ-ees and outline both how we succeed
and behave and form a central part of each employee’s half yearly assessment and in creating a culture of teamwork and partnership in the Group more gen-erally. Employees, regardless of whether they are shareholders or not, are also given an opportunity to provide input on the Group’s business and strategy at the strategy sessions led by the Group’s management team.
Andy Hogarth, Senior Independent Non-Executive Director, is available to employees to discuss concerns in relation to the Group’s business or operations, and his contact details have been circulated to all employees.
During FY21 the Group has increased the less formal engagements we have with employees and focused on mental health/well-being issues.
We have set up drop in lunch zoom calls to encourage employee social contact, managers have been encour-aged check in with employees who live alone and may struggle with isolation during periods of intense work and run office based and online Yoga classes. We have also arranged and sponsored team events such as online cocktail making classes and Deliveroo team dinners to celebrate success.
We are also beginning to examine the models we adopt for working practices post COVID-19 given how successfully our people adapted to home working. This is most likely to involve flexibility around the number of days employees are required to attend the office. We are also considering alternative models for holiday benefits.
SHAREHOLDERS
Alongside the provision of capital, our shareholders play an essential role by monitoring our financial performance, progress on our key KPIs, strategy development and our approach to gov-ernance and Board leadership.
We actively engage with our institu-tional investors through regular results based or event driven investor meetings and also benefit from regular ad hoc feedback through our institutional equity sales team. Throughout the year we
21Strategic Report
conduct regular institutional investor meetings.
We also engage with our large base of employee shareholders through reg-ular briefing on results and our strategy across the Group.
All shareholders are invited to attend the Annual General Meeting (AGM) and all Board Directors attend, giving individual shareholders the opportunity to engage directly with the Board and senior management. The Chairman welcomes questions from shareholders, who have an opportunity to raise issues before or at the AGM. All Non-Executive Directors are available to meet share-holders, if requested, and the Board is regularly updated on shareholder feedback.
The Chairman is also available to meet major shareholders without the Executive Directors being present to permit direct feedback in an open and transparent forum. All our resolutions were supported by shareholders at the 2020 AGM and proxies received averaged over 99% in favour.
In FY21 we appointed a new corpo-rate broker, Oberon, to work alongside our in-house broking team. This provides institutional shareholders with increased support for corporate actions, a channel to provide ad hoc feedback outside our formal roadshow process and also allows the Board to benefit from an independent third party’s views of our investment case, communication and engagement with our investors.
We recognise that delivering on shareholder expectations is fundamental to ensuring that our business continues to be successful in the long term.
REGULATORS AND INDUSTRY BODIES
We work in a highly regulated industry where it is vital to stay on top of the key regulatory requirements which are subject to rapid change and have also been impacted by the UK’s departure from the European Union.
Our two operating companies are regulated by, inter alia, the Financial Conduct Authority and, in finnCap Ltd’s
case, the London Stock Exchange, the UK Listing Authority and AIM Team.
We have an open and transparent dialogue with the regulatory and industry bodies that we work with and we employ leading compliance professionals to monitor and police our adherence with best practice.
During FY21 we held one formal review meeting with the FCA. We were subject to no censures or disciplinary action in the period. We also require our employees to undertake specific training on regulation and best practice as required by their roles.
We are also a member of the Quoted Companies Alliance and have contrib-uted to significant issues statements and guidance including the recently published “The QCA Guide to Practical ESG”.
COMMUNITY AND ENVIRONMENT
We believe that companies require a broader ‘consent to exist’ from the community in which we operate and should have clear goals and objectives - beyond just shareholder returns - in order to demonstrate and measure a wider contribution to the communities in which we operate.
We have set out the ways that finnCap approaches ESG matters, contributes to its community and seeks to minimise its environmental impact in a separate section - Operating Responsibly – Our ESG Report.
FY 21 Report and Accounts22
OPERATING RESPONSIBLY – OUR ESG REPORT
In the past 24 months, ESG, in its broadest sense, has moved from the domain of the mega cap global entity and government to being one with true relevance for all executive and non- executive directors across small and mid-cap companies. Companies now recognise that environmental, social and governance (ESG) concerns are no longer simply a way to signal a company’s caring credentials – they are a fundamental part of sustainable business success. As we look to re-cover from the pandemic and restore economic growth, ESG should be a hallmark of our approach – ensuring that the growth that is delivered is more responsible, sustainable and for the benefit of all.
finnCap has developed specific lead-ership in its sector in ESG governance and reporting through the development and publication of the finnCap ESG scorecard and the ability to provide strategic advice to clients on ESG mat-ters in relation to the capital markets.
This report summarises our key corporate activities in FY21 and our plans for the future. By assessing our ESG ac-tivities using metrics like our proprietary finnCap ESG scorecard and the WWG
platform, we can assess our ability to reduce our adverse impact on our stake-holders and the environment and improve our sustainability as an organisation.
ESG COMMITTEE - GOVERNANCE
Our ESG Committee is responsible for coordinating and leading the groups’ internal and external ESG activities, reporting and governance. It comprises a wide range of people drawn from across the group both client facing and support and is currently chaired by the Group CFO. The committee meets every two months with a defined agenda and work-plan and provides regular updates to the Board. The committee is not responsible for leading or developing our ESG advisory services for clients which is led by the Head of Research in finnCap Capital Markets.
During the past 12 months the com-mittee has reviewed and approved the Group’s new policies on Sustainability; Diversity and Inclusion; the finnCap Index and WWG submissions; a new volunteering policy; our involvement in key charity/social initiatives; our energy usage report and our decision to offset CO2 production through tree planting in the UK. It has also enjoyed a shared purpose to make finnCap an even better participant in the world.
PARTNERSHIP WITH WWG – BENCHMARKING ESG REPORTING
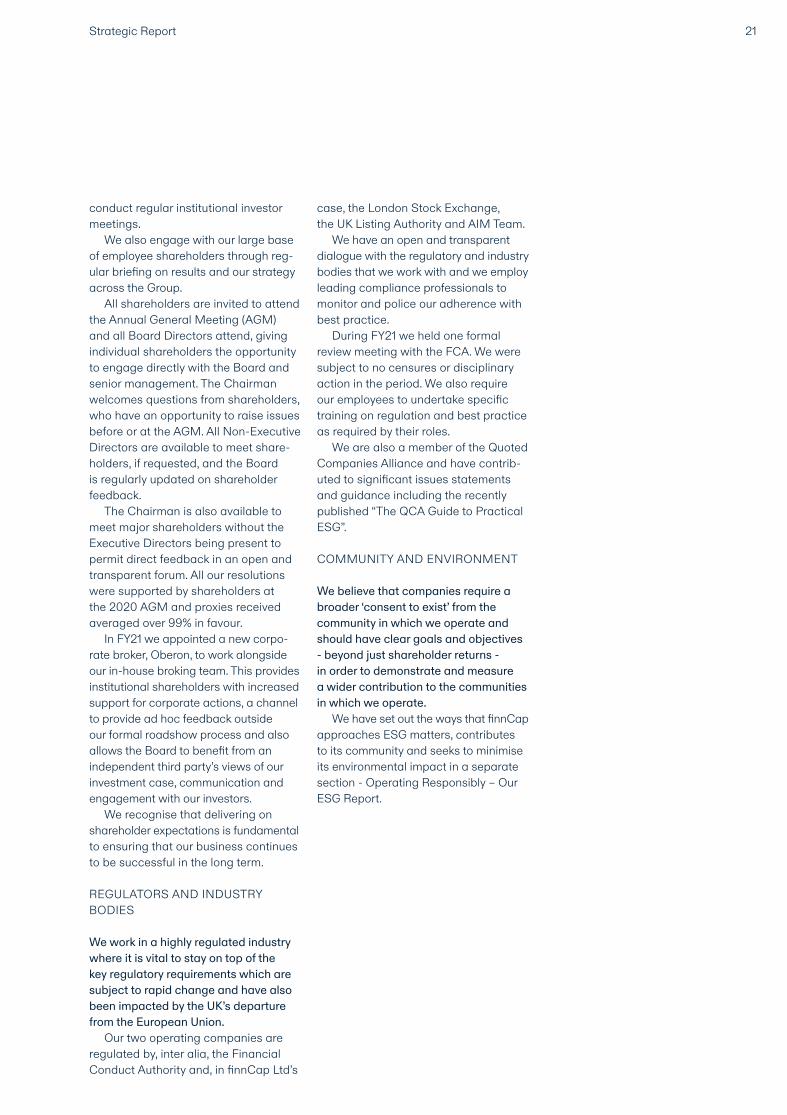
In mid-2020, finnCap alongside the development of the finnCap ESG scorecard, signed up as a customer of WorldWide Generation Limited (“WWG”) to explore using its G17Eco company tracker software platform to measure our progress against defined ESG metrics. The G17Eco platform allows companies, governments, cities and NGOs to report against their chosen UN Social Development Goals using the defined reporting standards and goals of the Global Reporting Initiative.
finnCap’s ESG committee has chosen UN SDG 4 – quality education, SDG 5- gender equality, SDG 8 -decent work and economic growth and SDG 7 – reduced inequalities as the UN SDGs where finnCap can most contribute. The G17Eco report scores each entity’s contribution on a scale of 0-100% and provides a benchmark for Boards, em-ployees and investors to assess quickly whether an entity is improving its contri-bution or, by comparing organisations, their relative performance. Comparative sector scores are key as many of the SDG related questions or benchmarks are not necessarily relevant to all companies. Our latest G17Eco report is shown above.
100%80%60%40%20%0%
No Poverty
Zero Hunger
Good Health & Wellbeing
Quality Education
Gender Equality
Clean Water & Sanitation
Affordable & Clean Energy
Decent Work & Economic Growth
Industry, Innovation & Infrastructure
Reduced Inequality
Sustainable Cities & Communities
Responsible Consumption & Production
Climate Action
Life Below Water
Life on Land
Peace Justice & Strong Institutions
Partnerships for the Goals
High –
SDG CONTRIBUTIONS
23Strategic Report
ENVIRONMENTAL – KEEPING FINNCAP SUSTAINABLE
finnCap recognises that is essential that all businesses must seek to reduce their environmental impacts where possible.
Our main environmental impact lies with the direct and indirect carbon energy emissions from employee travel and the energy usage in our office and during homeworking by our employees’ homes.
We commission Carbon Footprint Limited to undertake an independent audit of our emissions and provide a tonnes of CO2 equivalent measure.
Carbon Footprint has also assisted us in selecting an offset method (UK tree planting) to ensure that we are a certified Carbon Neutral Organisation.
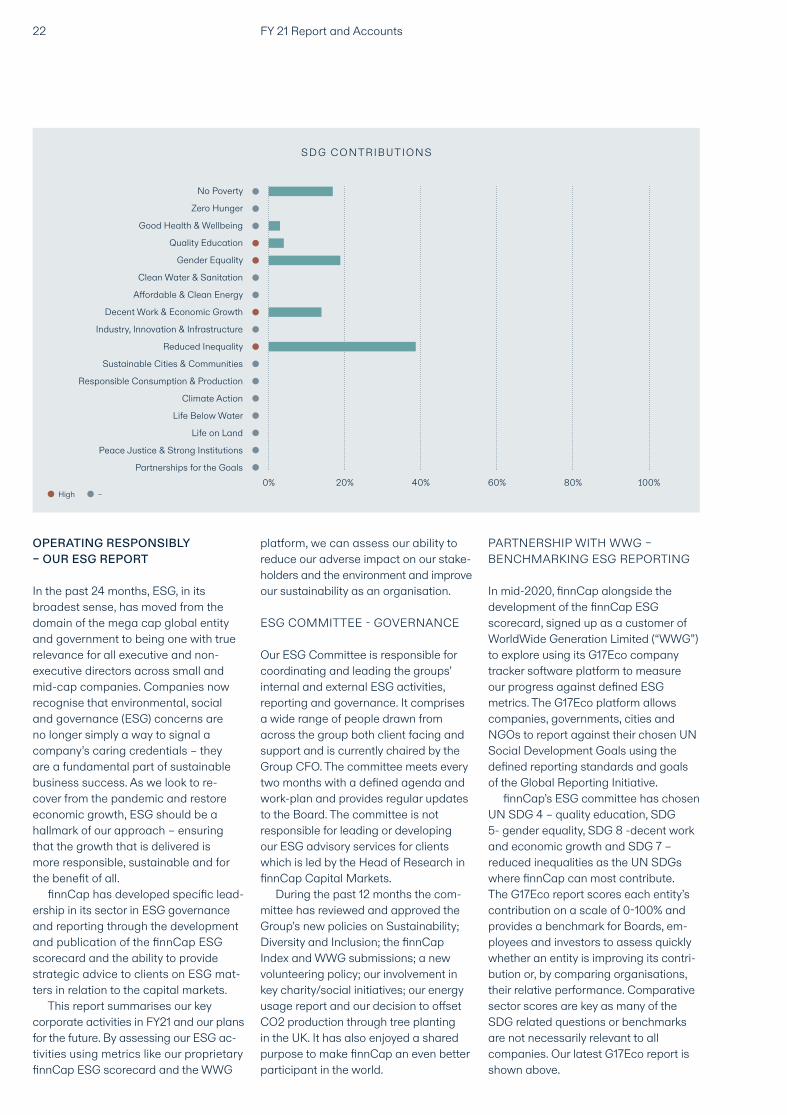
The result of our FY20 review and the key sources of our carbon footprint is shown below.
In FY20 the firm produced 287 tonnes of CO2 equivalent We are currently undertaking our review of our FY21 car-bon footprint and will report our results on the Group’s web-site in due course.
In August 2020, the Group relocated to new, more sustainable premises which have high energy operating efficiency and deploys a zero to landfill waste policy.
Our new offices also operates a large bike parking area which, with our bike to
work scheme encourages employees to use alternative forms of transport for their commute. Although we continue to grow, our new premises are highly efficient and is expected to reduce our environmental on a per capita basis further.
In January 2021, the Board adopted a new Sustainability policy to more completely encapsulate the actions we are taking around sustainability. This can be found on our web-site.
SOCIAL MATTERS – PROTECTING OUR PEOPLE, ENGAGING WITH OUR COMMUNITY
Our key activities around broader social issues focus on the wellness of our peo-ple, who are our main asset and on our broader contribution to society and on our role in encouraging better working practices and on diversity and inclusion.
COVID-19 PANDEMIC, PROTECTING OUR PEOPLE
The COVID-19 pandemic has required our employees to transition from an office based working environment to an almost entirely home based. The transition to a home-based environment was achieved rapidly and without impacting our client relationships but did have some important consequences that have required consideration. It was essential that we considered and mon-itored the well-being and mental health of our colleagues.
The executive team and managers have been in contact regularly with our colleagues both informally and through regular team meetings, town halls and results and strategy briefings. We also held a number of virtual social events and set up more informal drop-in group calls at lunch time. Our IT team has been particularly effective in sorting connectivity issues, enhancing people’s home working environment and there-fore reducing the stress caused from IT failures.
Following the first lock-down, our staff were permitted to return to work and our new office has been fitted out as a COVID-19 compliant environment,
under the guidance of an external Health and Safety advisory firm. Our team has, to their credit, demonstrated great resilience over the past 15 months and have shown that a more flexible approach to working can work well.
We are refining our approach to return to work now that the UK Government has given clearance for us to do so. This is likely to involve staff having the option to work from home for up to 2 days per week, with full team days in the office in order to ensure that we continue to benefit from the innovation, relationships and our ability to train new talent that the office environment provides.
DIVERSITY AND INCLUSION
We continue to focus on diversity and inclusion and the Board is due to con-sider an updated policy later in 2021.
In comparison with many financial services firms, we believe that finnCap is already diverse, having successfully recruited employees from across a wide range of available talent.
At 31 March 2021 35% (FY20: 39%) of our employees were women, 28% of our Board were women and c.7% of our employees were from an identifiable ethnic minority group.
We believe that we have already seen the value that comes through a diverse workforce and will continue to support difference – as a highly agile, creative and collegiate firm.
We believe that our differentiated culture has been a key driver in our abili-ty to attract the best and most capable people into finnCap through a transpar-ent and fair recruiting processes, as we have done historically.
We are also committed to the diver-sity of our Board and senior hires. More details can be found in the Nominations Committee Report. Our Diversity and Inclusion Policy can be seen on our web-site.
VOLUNTEERING POLICY
Many of our colleagues participate in regular voluntary work and raise money for charity. In 2020, we launched a
BRE AK DOWN OF CARBON FOOTPRINT
Commmuting 23.7%Site Gas 8.8%Other* 5.7%
Flights 32.8%Site Electricity 29%
*Rail travel, paper consumption, taxi travel, grey fleet and water consumption.
FY 21 Report and Accounts24
formal volunteering policy that ensures that the firm supports these activities by allowing all employees to book 2 days paid leave per year to use to sup-port their charitable/voluntary activities.Our team has undertaken several activities under this policy including a Lands End to John O’Groats charity fund raise ride and regular school support tutoring.
WORKING WITH CHARITY/SOCIAL ENTERPRISE AROUND EDUCATION
finnCap is an entrepreneurial business and we recognise how important it is to develop, mentor and champion business and social skills in future generations.
We have worked across several charities and social enterprises to encourage entrepreneurship skills and understanding of business for young people through several charitable and social enterprise initiatives including Stepping into Business (Primary School); Modern Muse (Senior Scholl focused on young women entrepre-neurs); Founders for Schools; and, most recently, in the Summer of 2021 we are partnering with YourGamePlan to introduce an entrepreneurship programme into secondary schools. This will be completed in mid 2021 and will be available – free to students – in over 700 schools. We are also running a school aged entrepreneurs competition Your Side Hustle with our partners YourGamePlan and ACCA, a free to end point supplier of online student training.
We also donate our surplus/age expired computers and tablets, where suitable, to local schools which then allocate to pupils according to need.
GOVERNANCE – MONITORING, MEASURING AND IMPROVING OUR PERFORMANCE
The Board recognises the importance of high standards of corporate governance and has implemented a strong govern-ance framework across the business to ensure that we comply with current standards and the SMCR Regime of the FCA. As an AIM company, finnCap
has adopted the QCA Code of Corporate Governance for Smaller Companies.
More details of our corporate gov-ernance framework and performance are set out in the reports from each formal committee – Governance, Remuneration, Nomination and Risk and Compliance and are set out in this report.
We continuously strive to improve our standards and, FY22 we will:– undertake a formal Gender Pay Gap study and consider its implications – implement the requirements of the Modern Slavery Act 2015; and– refresh our internal GDPR training and supplier review.
25Strategic Report
MANAGING RISKS
finnCap Group plc actively manages risk by regularly reviewing the business and by actively promoting a culture of compliance throughout the Group.
The Company has a Risk and Com-pliance Committee, which includes its Chairman and an Independent Non- Executive Director and is attended by the CFO, COO, Head and Deputy Head of Compliance and General Counsel. Risks are reviewed by both our operat-ing units and senior management team.
The Company has taken out insur-ance against those risks that the Directors consider to be appropriate. The Company's main risks are set out below, separated into operational, regulatory and financial risks. RESPONDING TO COVID-19
finnCap responded rapidly to the COVID-19 pandemic both operationally and financially.
In line with our existing disaster recovery plan, our whole operation moved to remote working, including eq-uity sales and trading, and settlement which was supported by our existing disaster recovery plans. Our IT team de-ployed new remote security and access software and increased the capacity of our networks to accommodate remote working. We ran a system of regular calls to identify and resolve issues at SMCR and operating group level. As a result, we seamlessly delivered for our clients, devising new ways to market equity transactions remotely whilst protecting our team and complying with our regulatory obligations. During the summer of 2020 we undertook our office move, implementing a new “COVID safe” fit out and engaging an external Health and Safety consultancy to assist with the planning and to advise us on Health and Safety measures going forward.
We considered our position if the Financial markets should respond adversely to the pandemic and govern-ment support was not forthcoming, concluding we would most likely need additional capital to continue to operate
our business. We therefore cancelled the final dividend to shareholders together with the discretionary bonus, and staff and directors took a significant pay cut for Q1 of FY21. In addition, we used the Government tax deferral and furlough schemes to provide additional liquidity. In November 2020, we repaid all amounts outstanding under these schemes in-cluding the furlough benefits received.
At the time of writing the UK has managed to vaccinate a substantial portion of its population and infection rates remain reasonably low, although new variants are a concern. We remain aware of the risk of new, vaccine resistant strains of COVID-19 to our population and that we may again be required to work remotely.
Although the Group’s client base is predominantly UK based, the pandemic continues to impact other countries in which our clients operate and demand for our services may be adversely im-pacted if conditions again worsen.
RISK ASSESSMENT STRATEGIC RISK RISK RATING VS FY20: UNCHANGED
The risk that we fail to deliver our strategy for growth and diversification would impact our financial results and returns for shareholders.
The Group manages this risk primarily through the Board’s oversight and annual review of strategy, adherence to the QCA’s corporate governance code, risk analysis and the provision of timely management information in order to en-able decisions to be made appropriately. The Group’s strategy is reviewed and tested both at Board level and Manage-ment committee level annually and progress and objectives are presented half yearly to all staff.
During FY21 we delivered on our key strategic objectives. We have mitigated the risk of ‘misalignment’ from remote working during COVID-19 through regular communication with staff includ-ing a half year update to staff on strate-gy in November 2020 and a full strategy presentation in January 2021.
As a result of our robust financial per-formance, we have a stronger balance sheet which will enable us to invest further when appropriate to drive our strategy for growth without increasing financial risk from doing so.
PEOPLE RISK RISK RATING VS FY20: INCREASED
The Group’s services and strong client relationships are delivered and main-tained by a specialised and highly skilled team. Failure to attract, motivate and retain team members is therefore a potential risk to our revenue by im-pacting our ability to execute business or our strategy.
The Group seeks to mitigate these risks by maintaining appropriate remu-neration and employment policies to retain and improve the quality of its team.
During FY21 we have particularly focused on the physical and mental well-being of our people, seeking to iden-tify colleagues struggling from working alone in particular. We have endeavoured to maintain motivation and our collegiate culture through frequent communication, team events and chat rooms.
We also simplified our staff grading system, aligning Cavendish and finnCap with external competitors and properly to recognise colleagues’ seniority and capability against our peers.
We have successfully made a number of key strategic hires and our staff turnover rate was broadly stable at 14% (FY 20: 12%). However, our competitors are also performing strongly and we perceive the risk of loss of key staff is higher than 12 months ago. REPUTATIONAL RISK RISK RATING VS FY20: UNCHANGED
Reputational risk potentially accom-panies all transactions we advise on, our retained client relationships and associa tions, and from our personal behaviour both within and outside the Group. Failure to maintain a good reputation would adversely affect the Group’s financial performance and its ability to grow.
FY 21 Report and Accounts26
The Group has robust policies on behav-iour and conduct in place Which require that high standards are maintained. We operate a rigorous internal approval process – primarily led by Deal Approval and Client Approval Committees - that seeks to identify and mitigate risk during client and transaction intake and at vari-ous stages of execution of mandates. In addition, the NOMAD system requires us to undertake detailed due diligence before representing companies admit-ted to trading on AIM - the majority of our clients.
We actively engage with stakehold-ers, other professional bodies and our peers as well as monitoring media and internet coverage to understand how our reputation is perceived. In the event of risk crystallisation, management would seek to address rapidly market concerns with the support of the Board and its communications advisers, in order to maintain confidence in the Group's offering and services.
We believe that our multi-year track record of growing our client base and transactions and our ability to attract highly respected individuals to join the Group demonstrate that our reputation is good and continues to improve. During FY21 no events occurred that had a material adverse impact on the Group’s reputation. TECHNOLOGY RISK RISK RATING VS FY20: SMALL INCREASE
Technology risks arises from the failure or breach of core IT systems, software or processes within the Group or at one of our third-party providers.
The level of risk arising from an IT failure is dependent largely on the extent and nature of the failure. It is particularly important with respect to our sales and trading operations that require an integrated IT system to trade and comply with regulations. In addition, our corporate finance and NOMAD operations require us to re-ceive and hold confidential/ potentially market sensitive information on behalf of clients.
The Group seeks to mitigate these risks through a continual process of review, improvement and investment in our core systems. Where we rely on ex-ternal parties or services including for software we seek providers who have suitable disaster recovery procedures in place. The IT upgrade plan, risks and issues are reviewed by the Risk and Compliance Committee and the Man-agement Committee.
In addition, the Group has invested in networks that are robust and uses software that is an externally tested combination of in-house and packaged products. The Group also uses a third- party data centre for off-site back up and DRP.During FY21 we continued to invest in cyber security systems in particular, given the higher risks of home working on data breach. We used our office move to invest in better hardware, UPS back up and networks to improve the performance of our IT systems. We continued to monitor for and install third party updates to our software systems for security and performance. We also invested in our network capa-bility and security to support remote working which is likely to become a normal part of our working practice. Notwithstanding our continual invest-ment and upgrading, the external cyber environment remains challenging and therefore we consider that this risk has increased moderately. FINANCIAL RISK RISK RATING VS FY20: UNCHANGED
We have identified three specific financial risks for the Group: Financial Markets risk; Liquidity Risk; and Credit Risk and Capital and Liquidity Risk.
FINANCIAL MARKETS RISK
The equity market's appetite for invest-ment and the confidence of M&A buyers directly impacts the Group’s activity and revenue and material adverse move-ments in financial markets can impact the value of the Group’s investments and market making positions.
The Board recognises that markets in which the Group operates are cyclical and has developed a business model that is robust in these circumstances.
Successful delivery of the Group’s strategy which targets product diver-sification whilst requiring an efficient operating model is designed both to increase the revenue and profits of the Groups as well as reduce the impact of significant equity markets movements.
The Group is exposed to movements in the value of its holdings in quoted and unquoted securities. This risk is mitigated through frequent review of its holdings for appropriateness, risk and liquidity. The Group rarely holds signifi-cant positions outside trading.
CAPITAL AND LIQUIDITY RISK
The risk that we have insufficient cash or capital to meet our contractual, contingent or regulatory obligations.
The Group’s objective in managing capital and liquidity is to ensure that it has sufficient permanent base cash funds to be able to operate and absorb any reasonable losses arising from an extreme event.
The Group’s two operating companies are also subject to the capital require-ments of the FCA Handbook which sets capital requirements based on the risks (including credit risk and market risk) assumed by each company. The operat-ing companies manage their capital risk by performing a daily computation of the capital requirements and then ensuring that their capital is sufficient.
CREDIT RISK
The risk of loss from the failure of clients or counterparties to settle or fully honour their financial obligations to us.
The Group employs policies to establish credit limits for clients. It does not make material loans or investments into clients. Our primary credit risk lies, therefore, with our agency trading business and our extension of credit on normal terms to corporate clients. At the start of the pandemic we reset and reappraised credit limits and updated
27Strategic Report
them to reflect AUM and other meas-ures. We also increased our focus on collecting aged debtors.
In FY21 we established finnCap Analytics which will focus on generating commission from larger hedge funds and institutions from predominantly event driven ideas. This will involve larger trades with larger liquid institutions. We have also seen the size of our exist-ing sales and trading business increase and, although we do not take large proprietary positions, the overall credit and capital and liquidity risk in the busi-ness has risen. Offsetting this, we have a substantially strengthened balance sheet with c.£21m at the year end and are thus better able to withstand an ad-verse financial event. Overall, financial risk has remained stable.
OTHER OPERATIONAL RISK RISK RATING VS FY20: UNCHANGED
The risk of loss resulting from inade-quate or failed internal processes. This increased following the implementation of working from home. We have sepa-rately analysed other operational risks including Technology and Liquidity else-where in this section.
The Group has implemented a controls environment at both financial and operational level and oversight functions at Board level and below, including the SMCR committee and the Group’s Management Committee. It has also demonstrated significant opera-tional resilience by Working from Home for almost 12 months.
The Group relies on third party ser-vice providers for certain aspects of its businesses (for example, on Pershing for settlement of its trades). There is a risk that these service providers are unable to meet their contractual obligations to the Group. The Group manages this risk through the identification of key pro-viders, monitoring of their performance, investigation of issues as and when they arise and through dialogue around providers’ business continuity plans.
Although our operating controls have stood the test of COVID-19 we continue to revise and improve our controls
environment. Although we expect that the majority of our team will return to work on part time basis, we see the risks returning to normal levels for FY22. CONDUCT, REGULATORY AND LITIGATION RISK RISK RATING VS FY20: UNCHANGED
The Group is highly reliant on its staff to deliver our services to clients and support the operation of our businesses which are heavily regulated.
It is therefore exposed to the impact of inappropriate conduct, behaviour or practices which may result in damage to our clients’ interests, our colleagues and/or our external reputation.
There is the potential for employees to exceed the boundaries of their roles or transactional limits, either intention-ally or through error so creating the risk of financial reputational loss and/ or fines, censure or other sanctions by our regulators.
The Group operates in a heavily regulated industry and we are exposed to the risk that regulations (or the inter-pretation of them) change materially and may adversely affect the operation of the Group’s business. Clarity around operations by UK financial services entities that may involve an EU counter-party remain unclear following Brexit.
Legal proceedings may arise from time to time in the course of the Group’s businesses in the event that we fail to comply with regulations or industry best practice.
The group has a defined Conduct Policy which sets out the standards of behaviour expected from all staff.
This is supported by a system of management supervision, segregation of duties, the operation of an independent Compliance function and the use of technology (where appropriate) to restrict the potential for breach of law, regulation or policy and monitoring to highlight breaches. We have also established a system of monitoring and oversight as part of our SMCR framework.
The Group has carries out focused regulatory, legal and conduct training for staff.
The Group has an independent compliance department that reports to the main Board through the Risk & Compliance Committee. The Directors monitor changes and developments in the regulatory environment and ensure that sufficient resources are made available to implement any required changes. However, there is the potential that future changes to the regulatory, legislative or tax environment may have further impacts on the profitability of the Group.
The Group also seeks to mitigate litigation risk through the use of en-gagement letters that clearly define services to be provided and which limit the Group’s liability appropriately.
The Group holds professional indem-nity and general insurance to provide some protection against litigation risks.
The Group has in place well- established policies on whistleblowing and financial crime. Employees may report in confidence, and anonymously if preferred, any concerns they may have about suspected impropriety or wrongdoing in any matters affecting the business. No matters were reported in the year.
In FY21 in addition to our continued risk analysis, we have examined the impact of the substantially higher involve-ment of retail investors in the primary equity markets during the COVID-19 pandemic and adjusted our policies and approach. We have identified the low level of business conducted with EU counterparties and classified the impact of the lack of a financial services deal with the EU as to be immaterial to our operations. We have also placed emphasis on the impact of staff working from home given the increase in elec-tronic communication and the remote operation of sales and trading.
Refresher training on GDPR, MAR and AML has been provided across the Group where relevant.
In FY21, no material litigation has been initiated against the Group.

Governance
FY 21 Report and Accounts

FY 21 Report and Accounts30
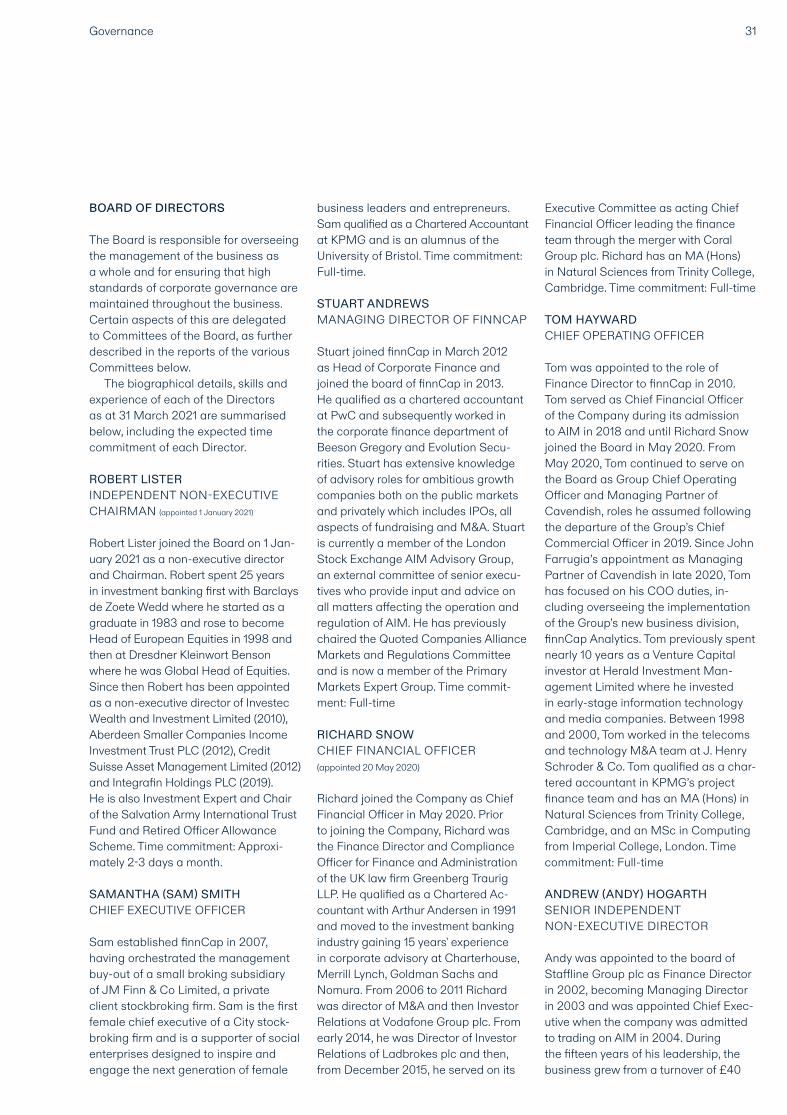
31Governance
BOARD OF DIRECTORS
The Board is responsible for overseeing the management of the business as a whole and for ensuring that high standards of corporate governance are maintained throughout the business. Certain aspects of this are delegated to Committees of the Board, as further described in the reports of the various Committees below.
The biographical details, skills and experience of each of the Directors as at 31 March 2021 are summarised below, including the expected time commitment of each Director.
ROBERT LISTER INDEPENDENT NON-EXECUTIVE CHAIRMAN (appointed 1 January 2021)
Robert Lister joined the Board on 1 Jan-uary 2021 as a non-executive director and Chairman. Robert spent 25 years in investment banking first with Barclays de Zoete Wedd where he started as a graduate in 1983 and rose to become Head of European Equities in 1998 and then at Dresdner Kleinwort Benson where he was Global Head of Equities. Since then Robert has been appointed as a non-executive director of Investec Wealth and Investment Limited (2010), Aberdeen Smaller Companies Income Investment Trust PLC (2012), Credit Suisse Asset Management Limited (2012) and Integrafin Holdings PLC (2019). He is also Investment Expert and Chair of the Salvation Army International Trust Fund and Retired Officer Allowance Scheme. Time commitment: Approxi-mately 2-3 days a month.
SAMANTHA (SAM) SMITH CHIEF EXECUTIVE OFFICER
Sam established finnCap in 2007, having orchestrated the management buy-out of a small broking subsidiary of JM Finn & Co Limited, a private client stockbroking firm. Sam is the first female chief executive of a City stock-broking firm and is a supporter of social enterprises designed to inspire and engage the next generation of female
business leaders and entrepreneurs. Sam qualified as a Chartered Accountant at KPMG and is an alumnus of the University of Bristol. Time commitment: Full-time.
STUART ANDREWS MANAGING DIRECTOR OF FINNCAP Stuart joined finnCap in March 2012 as Head of Corporate Finance and joined the board of finnCap in 2013. He qualified as a chartered accountant at PwC and subsequently worked in the corporate finance department of Beeson Gregory and Evolution Secu-rities. Stuart has extensive knowledge of advisory roles for ambitious growth companies both on the public markets and privately which includes IPOs, all aspects of fundraising and M&A. Stuart is currently a member of the London Stock Exchange AIM Advisory Group, an external committee of senior execu-tives who provide input and advice on all matters affecting the operation and regulation of AIM. He has previously chaired the Quoted Companies Alliance Markets and Regulations Committee and is now a member of the Primary Markets Expert Group. Time commit-ment: Full-time
RICHARD SNOW CHIEF FINANCIAL OFFICER (appointed 20 May 2020)
Richard joined the Company as Chief Financial Officer in May 2020. Prior to joining the Company, Richard was the Finance Director and Compliance Officer for Finance and Administration of the UK law firm Greenberg Traurig LLP. He qualified as a Chartered Ac-countant with Arthur Andersen in 1991 and moved to the investment banking industry gaining 15 years' experience in corporate advisory at Charterhouse, Merrill Lynch, Goldman Sachs and Nomura. From 2006 to 2011 Richard was director of M&A and then Investor Relations at Vodafone Group plc. From early 2014, he was Director of Investor Relations of Ladbrokes plc and then, from December 2015, he served on its
Executive Committee as acting Chief Financial Officer leading the finance team through the merger with Coral Group plc. Richard has an MA (Hons) in Natural Sciences from Trinity College, Cambridge. Time commitment: Full-time
TOM HAYWARD CHIEF OPERATING OFFICER Tom was appointed to the role of Finance Director to finnCap in 2010. Tom served as Chief Financial Officer of the Company during its admission to AIM in 2018 and until Richard Snow joined the Board in May 2020. From May 2020, Tom continued to serve on the Board as Group Chief Operating Officer and Managing Partner of Cavendish, roles he assumed following the departure of the Group’s Chief Commercial Officer in 2019. Since John Farrugia’s appointment as Managing Partner of Cavendish in late 2020, Tom has focused on his COO duties, in-cluding overseeing the implementation of the Group’s new business division, finnCap Analytics. Tom previously spent nearly 10 years as a Venture Capital investor at Herald Investment Man-agement Limited where he invested in early-stage information technology and media companies. Between 1998 and 2000, Tom worked in the telecoms and technology M&A team at J. Henry Schroder & Co. Tom qualified as a char-tered accountant in KPMG’s project finance team and has an MA (Hons) in Natural Sciences from Trinity College, Cambridge, and an MSc in Computing from Imperial College, London. Time commitment: Full-time
ANDREW (ANDY) HOGARTHSENIOR INDEPENDENT NON-EXECUTIVE DIRECTOR Andy was appointed to the board of Staffline Group plc as Finance Director in 2002, becoming Managing Director in 2003 and was appointed Chief Exec-utive when the company was admitted to trading on AIM in 2004. During the fifteen years of his leadership, the business grew from a turnover of £40
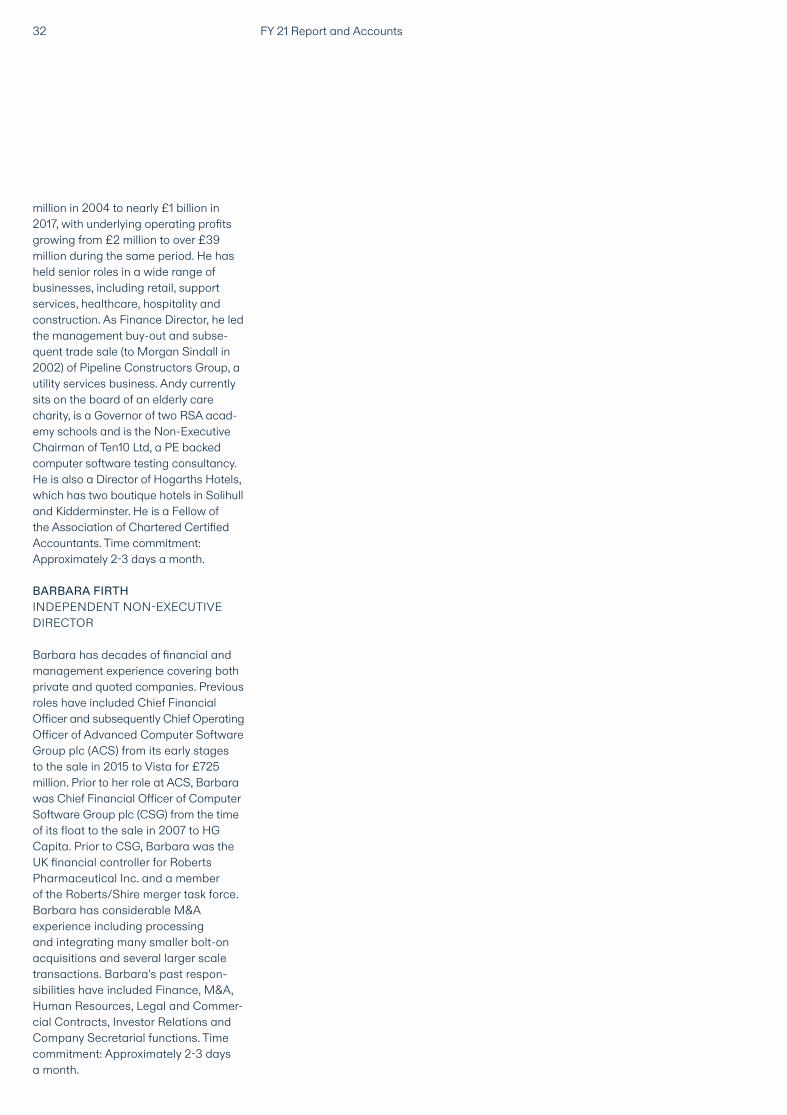
FY 21 Report and Accounts32
million in 2004 to nearly £1 billion in 2017, with underlying operating profits growing from £2 million to over £39 million during the same period. He has held senior roles in a wide range of businesses, including retail, support services, healthcare, hospitality and construction. As Finance Director, he led the management buy-out and subse-quent trade sale (to Morgan Sindall in 2002) of Pipeline Constructors Group, a utility services business. Andy currently sits on the board of an elderly care charity, is a Governor of two RSA acad-emy schools and is the Non-Executive Chairman of Ten10 Ltd, a PE backed computer software testing consultancy. He is also a Director of Hogarths Hotels, which has two boutique hotels in Solihull and Kidderminster. He is a Fellow of the Association of Chartered Certified Accountants. Time commitment: Approximately 2-3 days a month.
BARBARA FIRTH INDEPENDENT NON-EXECUTIVE DIRECTOR Barbara has decades of financial and management experience covering both private and quoted companies. Previous roles have included Chief Financial Officer and subsequently Chief Operating Officer of Advanced Computer Software Group plc (ACS) from its early stages to the sale in 2015 to Vista for £725 million. Prior to her role at ACS, Barbara was Chief Financial Officer of Computer Software Group plc (CSG) from the time of its float to the sale in 2007 to HG Capita. Prior to CSG, Barbara was the UK financial controller for Roberts Pharmaceutical Inc. and a member of the Roberts/Shire merger task force. Barbara has considerable M&A experience including processing and integrating many smaller bolt-on acquisitions and several larger scale transactions. Barbara’s past respon-sibilities have included Finance, M&A, Human Resources, Legal and Commer-cial Contracts, Investor Relations and Company Secretarial functions. Time commitment: Approximately 2-3 days a month.
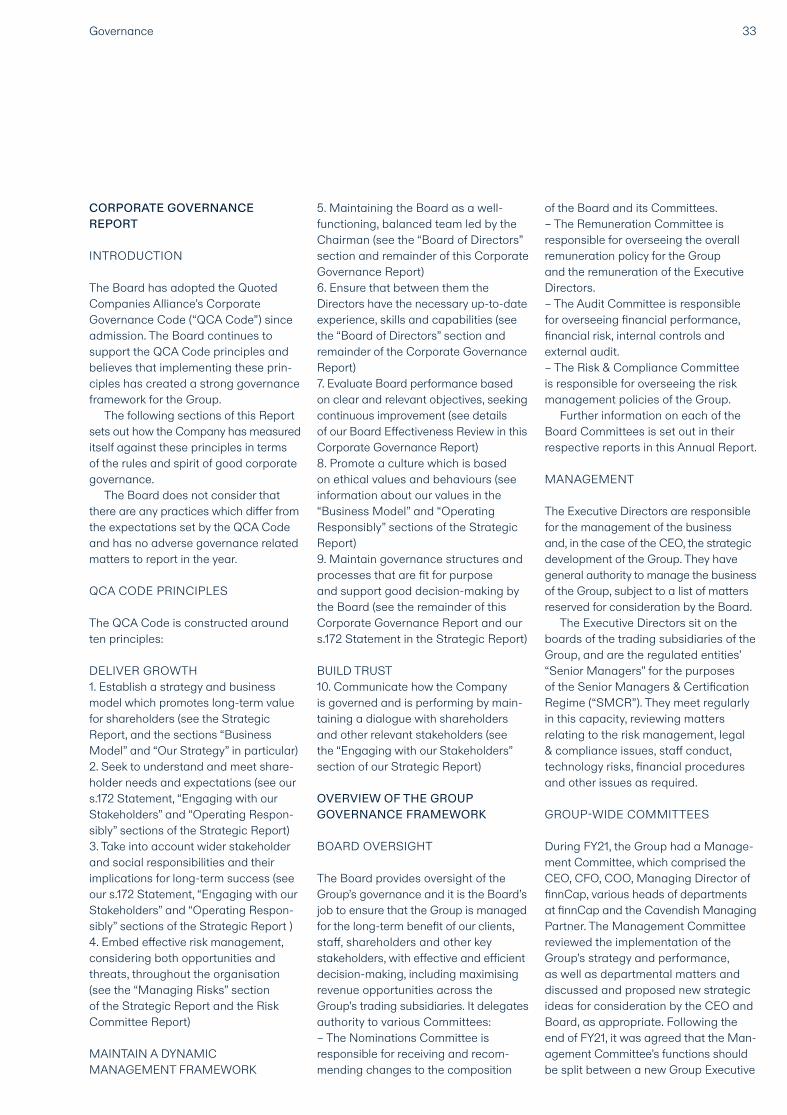
33
CORPORATE GOVERNANCE REPORT INTRODUCTION
The Board has adopted the Quoted Companies Alliance’s Corporate Governance Code (“QCA Code”) since admission. The Board continues to support the QCA Code principles and believes that implementing these prin-ciples has created a strong governance framework for the Group.
The following sections of this Report sets out how the Company has measured itself against these principles in terms of the rules and spirit of good corporate governance.
The Board does not consider that there are any practices which differ from the expectations set by the QCA Code and has no adverse governance related matters to report in the year.
QCA CODE PRINCIPLES The QCA Code is constructed around ten principles: DELIVER GROWTH 1. Establish a strategy and business model which promotes long-term value for shareholders (see the Strategic Report, and the sections “Business Model” and “Our Strategy” in particular)2. Seek to understand and meet share-holder needs and expectations (see our s.172 Statement, “Engaging with our Stakeholders” and “Operating Respon-sibly” sections of the Strategic Report)3. Take into account wider stakeholder and social responsibilities and their implications for long-term success (see our s.172 Statement, “Engaging with our Stakeholders” and “Operating Respon-sibly” sections of the Strategic Report )4. Embed effective risk management, considering both opportunities and threats, throughout the organisation (see the “Managing Risks” section of the Strategic Report and the Risk Committee Report)
MAINTAIN A DYNAMIC MANAGEMENT FRAMEWORK
5. Maintaining the Board as a well- func tioning, balanced team led by the Chairman (see the “Board of Directors” section and remainder of this Corporate Governance Report)6. Ensure that between them the Directors have the necessary up-to-date experience, skills and capabilities (see the “Board of Directors” section and remainder of the Corporate Governance Report)7. Evaluate Board performance based on clear and relevant objectives, seeking continuous improvement (see details of our Board Effectiveness Review in this Corporate Governance Report)8. Promote a culture which is based on ethical values and behaviours (see information about our values in the “Business Model” and “Operating Responsibly” sections of the Strategic Report)9. Maintain governance structures and processes that are fit for purpose and support good decision-making by the Board (see the remainder of this Corporate Governance Report and our s.172 Statement in the Strategic Report)
BUILD TRUST10. Communicate how the Company is governed and is performing by main-taining a dialogue with shareholders and other relevant stakeholders (see the “Engaging with our Stakeholders” section of our Strategic Report)
OVERVIEW OF THE GROUP GOVERNANCE FRAMEWORK
BOARD OVERSIGHT
The Board provides oversight of the Group’s governance and it is the Board’s job to ensure that the Group is managed for the long-term benefit of our clients, staff, shareholders and other key stakeholders, with effective and efficient decision-making, including maximising revenue opportunities across the Group’s trading subsidiaries. It delegates authority to various Committees:– The Nominations Committee is responsible for receiving and recom-mending changes to the composition
of the Board and its Committees.– The Remuneration Committee is responsible for overseeing the overall remuneration policy for the Group and the remuneration of the Executive Directors.– The Audit Committee is responsible for overseeing financial performance, financial risk, internal controls and external audit.– The Risk & Compliance Committee is responsible for overseeing the risk management policies of the Group.
Further information on each of the Board Committees is set out in their respective reports in this Annual Report.
MANAGEMENT
The Executive Directors are responsible for the management of the business and, in the case of the CEO, the strategic development of the Group. They have general authority to manage the business of the Group, subject to a list of matters reserved for consideration by the Board.
The Executive Directors sit on the boards of the trading subsidiaries of the Group, and are the regulated entities’ “Senior Managers” for the purposes of the Senior Managers & Certification Regime (“SMCR”). They meet regularly in this capacity, reviewing matters relating to the risk management, legal & compliance issues, staff conduct, technology risks, financial procedures and other issues as required.
GROUP-WIDE COMMITTEES
During FY21, the Group had a Manage-ment Committee, which comprised the CEO, CFO, COO, Managing Director of finnCap, various heads of departments at finnCap and the Cavendish Managing Partner. The Management Committee reviewed the implementation of the Group’s strategy and performance, as well as departmental matters and discussed and proposed new strategic ideas for consideration by the CEO and Board, as appropriate. Following the end of FY21, it was agreed that the Man-agement Committee’s functions should be split between a new Group Executive
Governance
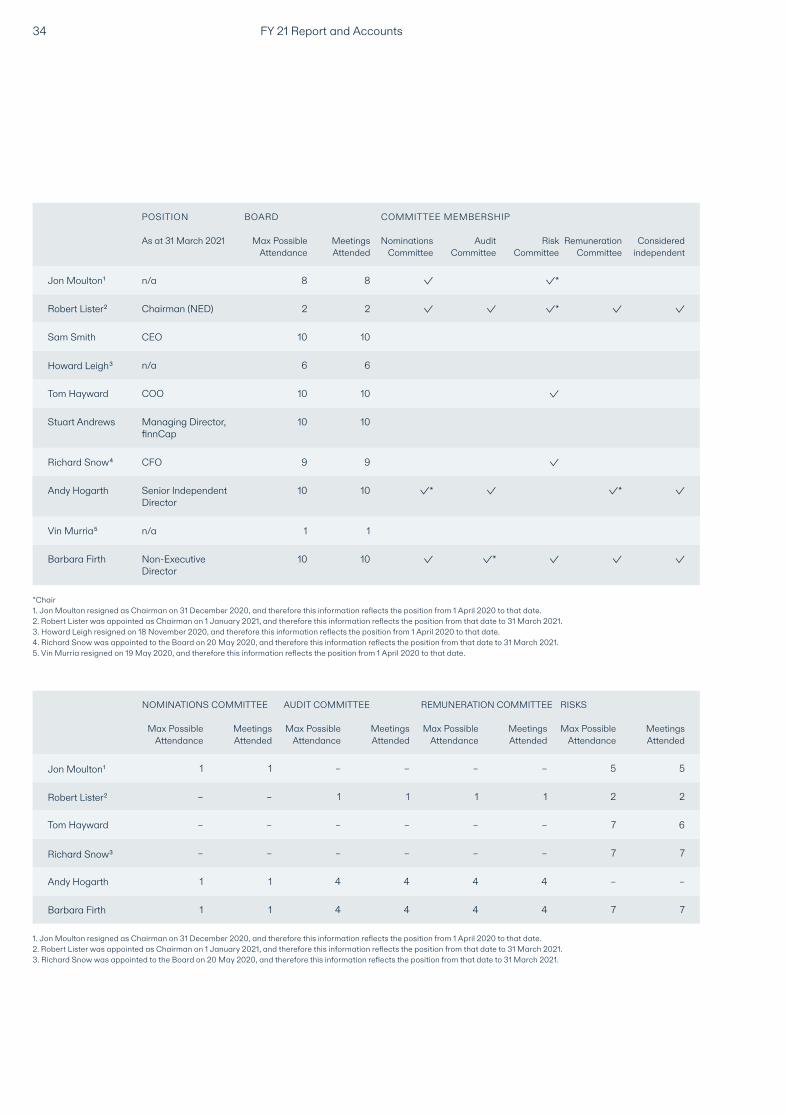
FY 21 Report and Accounts34
Jon Moulton1 n/a
Howard Leigh3 n/a
Richard Snow4 CFO
Robert Lister2 Chairman (NED)
Tom Hayward COO
Andy Hogarth Senior Independent Director
Sam Smith CEO
Stuart Andrews Managing Director, finnCap
Vin Murria5 n/a
Barbara Firth Non-Executive Director
As at 31 March 2021
POSITION
8 8 *
6 6
9 9
2 2 *
10 10
10 10 * *
10 10
10 10
1 1
10 10 *
Max Possible Attendance
Meetings Attended
Nominations Committee
Audit Committee
Risk Committee
Remuneration Committee
Considered independent
BOARD COMMITTEE MEMBERSHIP
*Chair 1. Jon Moulton resigned as Chairman on 31 December 2020, and therefore this information reflects the position from 1 April 2020 to that date. 2. Robert Lister was appointed as Chairman on 1 January 2021, and therefore this information reflects the position from that date to 31 March 2021. 3. Howard Leigh resigned on 18 November 2020, and therefore this information reflects the position from 1 April 2020 to that date. 4. Richard Snow was appointed to the Board on 20 May 2020, and therefore this information reflects the position from that date to 31 March 2021. 5. Vin Murria resigned on 19 May 2020, and therefore this information reflects the position from 1 April 2020 to that date.
Jon Moulton1
Richard Snow3
Robert Lister2
Andy Hogarth
Barbara Firth
1 1 – – – – 5 5
– – 1 1 1 1 2 2
Tom Hayward – – – – – – 7 6
– – – – – – 7 7
1 1 4 4 4 4 – –
1 1 4 4 4 4 7 7
Max Possible Attendance
Meetings Attended
Max Possible Attendance
Meetings Attended
Max Possible Attendance
Meetings Attended
Max Possible Attendance
Meetings Attended
NOMINATIONS COMMITTEE AUDIT COMMITTEE REMUNERATION COMMITTEE RISKS
1. Jon Moulton resigned as Chairman on 31 December 2020, and therefore this information reflects the position from 1 April 2020 to that date. 2. Robert Lister was appointed as Chairman on 1 January 2021, and therefore this information reflects the position from that date to 31 March 2021. 3. Richard Snow was appointed to the Board on 20 May 2020, and therefore this information reflects the position from that date to 31 March 2021.
35Governance
Committee (consisting of the executive directors, the Managing Partner of Cavendish, the Heads of HR and Mar-keting and the Group’s General Counsel) and a Business Leaders Group (con-sisting of the functional Heads of client facing parts of the Group). The Group Executive Committee meets weekly to monitor implementation of the Group’s strategy. The Business Leaders Group meets quarterly to discuss revenue- generating activities and opportunities.
The Group also has an Operations Committee, which is chaired by the CFO and operates on a Group-wide basis. It consists of members of the Trade Support, Compliance, Finance, Legal, IT, HR and wider operations team and considers inter-departmental projects and other operational issues.
SUBSIDIARY COMMITTEES
finnCap Ltd and Cavendish Corporate Finance LLP, being the Group’s operating subsidiaries, each have an Executive Committee (“ExCom”) comprised of key revenue generators and department heads. The Cavendish ExCom is chaired by its Managing Partner and discusses and decides on matters specific to Cavendish’s business, performance and staff. The finnCap ExCom is chaired by its Managing Director and discusses and decides on matters specific to finn-Cap’s business, performance and staff.finnCap and Cavendish each have new business committees which consider the take-on of new clients or transactions. finnCap also has certain other commit-tees, including a Nomad Committee, Sponsor Committee and Opinions Com-mittee, which assist in meeting finnCap’s regulatory obligations in providing services to its clients.
BOARD AND COMMITTEE MEETINGS
The Board has regular scheduled meetings at least six times per year and meets at other times as necessary. At its scheduled meetings, the Board reviews financial performance, strategy and key risks, and monitors key
performance indicators. Board packs are circulated several days in advance of formal scheduled meetings and all Directors receive appropriate information on a timely basis to enable them to discharge their duties accordingly.
Attendance at Board and Committee meetings by members of the Board, and Committee membership, during the year ended 31 March 2021 shown left.
DEVELOPMENT AND SUPPORT
All Directors receive regular updates on legal, regulatory and governance issues, as appropriate. The Board and its various Committees have access to independent advice at the Company’s expense, as well as access to the Com-pany’s Nomad and Company Secretary.
Two new Directors joined the Company in the financial year. As set out in last year’s annual report, Richard Snow joined as CFO in May 2020. A personalised induction programme was run for Richard including meetings with members of the Board, one-to-one meetings with senior managers, access to Board and Committee papers and minutes and meetings with external ad-visers, including the Company’s Nomad.
Robert Lister joined as Chairman in January 2021. A similar induction programme was run for Robert, including meetings with other Board members and members of the senior management team via video conference. Robert plans to hold informal lunches with a wide range of staff in 2021 following the easing of COVID-19 restrictions. Robert also received a briefing from the Com pany Secretary on governance procedures.
It is intended that similarly personal-ised induction programmes will be run for any future directors.
BOARD EFFECTIVENESS REVIEW
In December 2020, the Board conducted its second formal annual evaluation of its effectiveness, including its Committees, which was facilitated by the Company Secretary. Questionnaires covering topics such as composition, meeting
effectiveness and balance of skills & knowledge were circulated, and the results compiled by the Company Sec-retary for consideration by the Board. The findings of the evaluation confirmed that the Board and its Committees were operating effectively, and no changes were required at that time.
The Board will consider whether it is appropriate to conduct an evaluation facilitated by an independent third party in December 2021.
WHISTLEBLOWING
The Group has in place well-established policies on whistleblowing and financial crime. Employees may report in con-fidence, and anonymously if preferred, any concerns they may have about suspected impropriety or wrongdoing in any matters affecting the business. No matters were reported in the year.
This report was approved by the Board on 1 July 2021 and signed on its behalf by:
ROBERT LISTER Non-Executive Chairman
NOMINATIONS COMMITTEE REPORT ROLE OF THE NOMINATION COMMITTEE
The Board has delegated authority to the Nomination Committee for ensuring that the Board has the right balance of skills and experience, including suc-cession planning for directors and other senior executives and filling vacancies in the Board as they arise.
The Committee’s terms of reference are available on the finnCap Group website and set out in further detail the objectives and responsibilities of the Committee.
MEMBERS AND MEETINGS
The Nominations Committee comprises Andy Hogarth, Barbara Firth and, from his appointment on 1 January 2021, Robert Lister. Until his resignation on 31 December 2020, Jon Moulton was also a member of the Committee. The Committee is chaired by Andy Hogarth. The experience and expertise of the Committee members is set out in the biographies in the section entitled “Board of Directors” of this Annual Report.
The Committee meets as appropriate, and at least once a year. In the last financial year, the Committee met once, with further discussions on the change of Chairman at full Board meetings. Information about meetings and attendance is set out in the Corporate Governance Report.
The Chief Executive Officer and/or Chief Financial Officer are invited to attend these meetings as appropriate. The Company Secretary acts as the secretary of the Committee.
ACTIVITY DURING THE YEAR
The chief business of the Nominations Committee during the financial year was to consider succession planning for Jon Moulton as Chairman and the recom-mendation of Robert Lister’s appointment.
Robert’s appointment followed an extended and robust recruitment
process coordinated by an executive search firm, Odgers Berndtson. The Nominations Committee reviewed CVs of potential candidates proposed by the executive search firm based on pre- determined selection criteria. Theses election criteria included independence and having experience running a fin-ancial or other professional services firm, as well as expertise and insight in the sectors in which the Group operates.
Robert’s appointment was announced on 18 November 2020 and he took his position as Chairman of the Company from 1 January 2021.
DIVERSITY
The Nominations Committee recognises the importance of diversity, in its broadest sense, having regard to gender, ethnicity, background, skillset and breadth of ex-perience, at Board level and throughout the Group. The Committee is currently satisfied with the diversity of the Board, and is particularly proud that the Group has always had a female CEO, Sam being the first female CEO of a City stock-broking firm. The Committee will keep the diversity of the Board under review and will give it careful considera-tion on any changes in the composition of the Board in the future.
The Nominations Committee and the wider Board have also considered the Group’s approach to diversity and inclusion across the firm. Further infor-mation on our approach is set out in the “Operating Responsibly” section of our Strategic Report.
ANDY HOGARTHChairman – Nominations Committee
FY 21 Report and Accounts36
37Governance
AUDIT COMMITTEE REPORT
ROLE OF THE AUDIT COMMITTEE The Board has delegated authority to the Audit Committee to provide oversight and governance to the Group’s financial reports, its internal controls and its processes, its financial risk management systems and the appointment of and relationship with the external auditor.
The Committee’s terms of reference are available on the finnCap Group website and set out in further detail the objectives and responsibilities of the Committee.
MEMBERS AND MEETINGS
The Audit Committee comprises Barbara Firth, Andy Hogarth and, with effect from his appointment as a director on 1 January 2021, Robert Lister, each of whom are independent non-executive directors. Prior to Jon Moulton’s resignation as Chairman on 31 December 2020, he was invited to attend (as Chairman of the Board). The Committee is chaired by Barbara Firth. The experience and expertise of the Committee members is set out in the biographies in the section entitled “Board of Directors” of this Annual Report.
The Committee meet as appropriate, and at least three times a year. In the last financial year, the Committee met four times. Information about meetings and attendance is set out in the Corporate Governance Report.
ACTIVITY DURING THE YEAR The main items of business considered by the Audit Committee during the year included:– Reviewing and monitoring the integrity of the Group’s interim financial state-ments published in November 2020;– Considering the Group’s accounting and tax treatment of certain options, including those to be granted to the finnCap Analytics team;– Reviewing the FY21 audit plan and audit engagement letter;– Reviewing the suitability of the Group’s
external auditors for FY21;– Considering the key audit matters and how they were addressed in the financial statements for FY20;– Reviewing the financial statements and Annual Report for FY20; – Considering the external audit report and management representation letter for FY20; – Considering the operational impact of COVID-19 and also ensuring that the financial systems and controls and audit process continued to be robust during an extended period of working from home; and– Considering the Group’s need for an internal audit function.
ROLE OF THE EXTERNAL AUDITOR
The Audit Committee monitors the relationship with the Group’s external auditor BDO LLP, to ensure that its independence and objectivity is main-tained. Noting the tenure of BDO LLP, the Committee will keep under review the need for an external tender.As part of its review, the Committee monitors the review of non-audit fees and this is set out in Note 6. The Audit Committee also assesses the auditor’s performance. The Committee has confirmed it is satisfied with the performance of BDO LLP and has recommended to the Board that the auditors be reappointed, and there will be a resolution to that effect at the forthcoming AGM.
THE AUDIT PROCESS
The Group’s auditors prepare an audit plan for the review of the full period financial statements. The audit plan sets out the scope of the audit, areas to be targeted and the audit timetable. This plan is reviewed and agreed in advance by the Audit Committee. Following the audit, the auditor presents its findings to the Audit Committee for discussion.
INTERNAL AUDIT
Currently the Group does not have an internal audit function and the Audit Committee believes that management is able to derive assurance as to the adequacy and effectiveness of the internal controls from its risk manage-ment procedures. This position was last reviewed in July 2020 and will continue to be reviewed annually.
BARBARA FIRTHChair – Audit Committee
RISK COMMITTEE REPORT ROLE OF THE RISK & COMPLIANCE COMMITTEE
The Board has delegated authority to the Risk & Compliance Committee to assess the quality, integrity, implement-ation and reliability of the Company’s risk management processes. The Committee’s full terms of reference are available on the finnCap Group website.
MEMBERS AND MEETINGS
The Risk & Compliance Committee comprises Robert Lister (with effect from his appointment on 1 January 2021) and Barbara Firth as non-executive directors, and the COO, CFO, the Head & Deputy Head of Compliance and the General Counsel attend meetings of the Committee. The Committee is chaired by Robert Lister. Jon Moulton was the Chair and a member of the Committee until his resignation on 31 December 2020. The experience and expertise of the Committee members is set out in the biographies in the section entitled “Board of Directors” of this Annual Report.
The Committee meets as appropriate, and, for previous financial years, at least six times a year. In the last financial year, the Committee met seven times. Information about meetings and attendance is set out in the Corporate Governance Report. Following the end of the financial year, it was agreed that the Committee should meet quarterly in future, with further meetings and updates to be given as issues arose. More information on the reasons for this decision are set out below.
ACTIVITY DURING THE YEAR
During this year, the Risk & Compliance Committee has primarily focused on assessing, and overseeing the manage-ment of, risks associated with:– the Group’s ongoing response to the COVID-19 pandemic, including the regulatory and operational risks arising from working from home;– the Group’s new business division,
finnCap Analytics, and the necessary systems, procedures and controls to be put in place; and– Brexit and the Group’s reaction to a “no deal” Brexit, particularly in relation to its trading activities.
The Committee received regular updates from the Compliance team on incidents & breaches, market abuse monitoring, financial crime training and procedures, gifts & hospitality, conflicts checking and other matters. The Com-mittee also received regular updates on the Group’s technology and IT related risk management and procedures, and up-dates from the Group’s General Counsel.
Following the implementation of the Senior Managers & Certification Re-gime (“SMCR”) for the Group’s trading subsidiaries, the Group put in place the necessary procedures and steps to comply with this regime and to ensure staff were certified as appropriate. The Group completed its first certification process during FY21.
Following discussion at the Board, the Committee re-considered the frequency of its meetings in the light of the application of SMCR and emphasis on the Senior Managers to monitor com-pliance matters. The Senior Managers were meeting regularly to consider risk, compliance, legal, technology and con-duct related matters which had reduced the need for the Committee to provide such regular oversight.
It was also noted that over two years had elapsed since Admission and the Committee were satisfied that systems and procedures put in place at that time and subsequently were operating well. During the two year integration of Cavendish, Compliance and other risk-related procedures had been conformed across the Group and were functioning well. It was therefore agreed that it was appropriate for the Committee to amend its terms of reference to reflect that the Committee would meet quarterly going forward, with further meetings arranged and updates provid-ed to the Committee as required.
ROBERT LISTERChair – Risk Committee
FY 21 Report and Accounts38
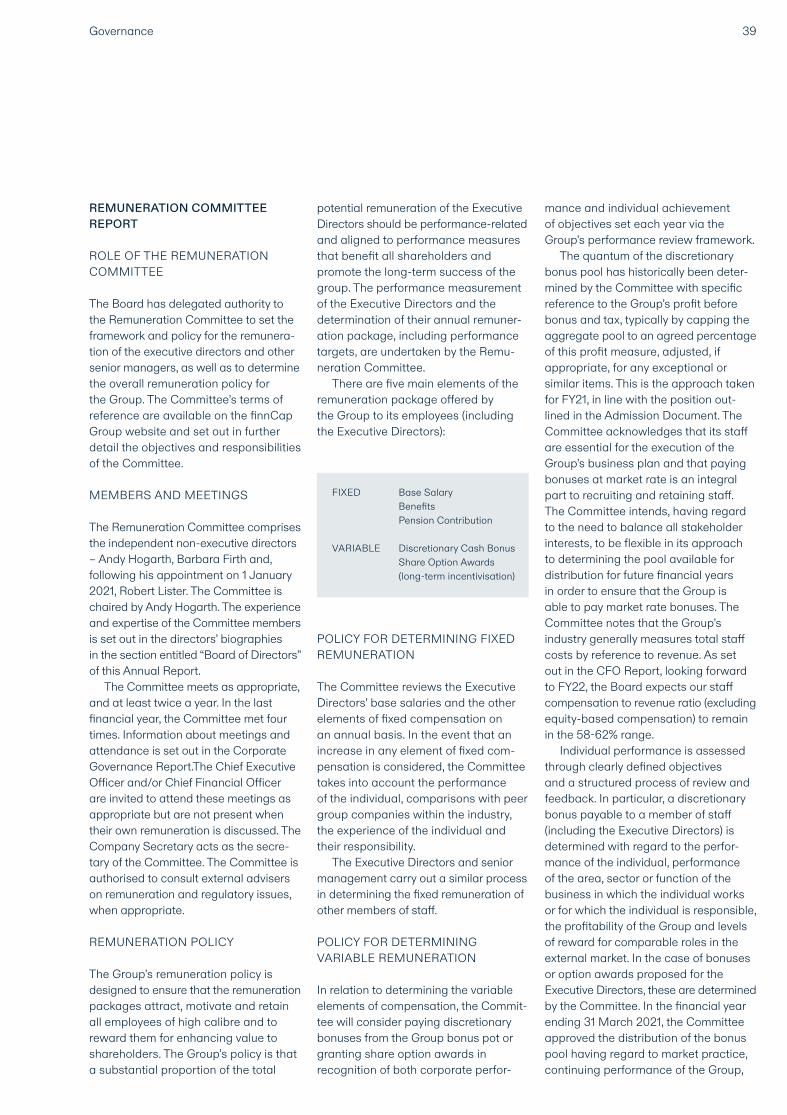
REMUNERATION COMMITTEE REPORT
ROLE OF THE REMUNERATION COMMITTEE
The Board has delegated authority to the Remuneration Committee to set the framework and policy for the remunera-tion of the executive directors and other senior managers, as well as to determine the overall remuneration policy for the Group. The Committee’s terms of reference are available on the finnCap Group website and set out in further detail the objectives and responsibilities of the Committee.
MEMBERS AND MEETINGS
The Remuneration Committee comprises the independent non-executive directors – Andy Hogarth, Barbara Firth and, following his appointment on 1 January 2021, Robert Lister. The Committee is chaired by Andy Hogarth. The experience and expertise of the Committee members is set out in the directors’ biographies in the section entitled “Board of Directors” of this Annual Report.
The Committee meets as appropriate, and at least twice a year. In the last financial year, the Committee met four times. Information about meetings and attendance is set out in the Corporate Governance Report.The Chief Executive Officer and/or Chief Financial Officer are invited to attend these meetings as appropriate but are not present when their own remuneration is discussed. The Company Secretary acts as the secre-tary of the Committee. The Committee is authorised to consult external advisers on remuneration and regulatory issues, when appropriate.
REMUNERATION POLICY
The Group’s remuneration policy is designed to ensure that the remuneration packages attract, motivate and retain all employees of high calibre and to reward them for enhancing value to shareholders. The Group’s policy is that a substantial proportion of the total
potential remuneration of the Executive Directors should be performance-related and aligned to performance measures that benefit all shareholders and promote the long-term success of the group. The performance measurement of the Executive Directors and the determination of their annual remuner-ation package, including performance targets, are undertaken by the Remu-neration Committee.
There are five main elements of the remuneration package offered by the Group to its employees (including the Executive Directors):
POLICY FOR DETERMINING FIXED REMUNERATION
The Committee reviews the Executive Directors’ base salaries and the other elements of fixed compensation on an annual basis. In the event that an increase in any element of fixed com-pensation is considered, the Committee takes into account the performance of the individual, comparisons with peer group companies within the industry, the experience of the individual and their responsibility.
The Executive Directors and senior management carry out a similar process in determining the fixed remuneration of other members of staff.
POLICY FOR DETERMINING VARIABLE REMUNERATION
In relation to determining the variable elements of compensation, the Commit-tee will consider paying discretionary bonuses from the Group bonus pot or granting share option awards in recognition of both corporate perfor-
mance and individual achievement of objectives set each year via the Group’s performance review framework.
The quantum of the discretionary bonus pool has historically been deter-mined by the Committee with specific reference to the Group’s profit before bonus and tax, typically by capping the aggregate pool to an agreed percentage of this profit measure, adjusted, if appropriate, for any exceptional or similar items. This is the approach taken for FY21, in line with the position out-lined in the Admission Document. The Committee acknowledges that its staff are essential for the execution of the Group’s business plan and that paying bonuses at market rate is an integral part to recruiting and retaining staff. The Committee intends, having regard to the need to balance all stakeholder interests, to be flexible in its approach to determining the pool available for distribution for future financial years in order to ensure that the Group is able to pay market rate bonuses. The Committee notes that the Group’s industry generally measures total staff costs by reference to revenue. As set out in the CFO Report, looking forward to FY22, the Board expects our staff compensation to revenue ratio (excluding equity-based compensation) to remain in the 58-62% range.
Individual performance is assessed through clearly defined objectives and a structured process of review and feedback. In particular, a discretionary bonus payable to a member of staff (including the Executive Directors) is determined with regard to the perfor-mance of the individual, performance of the area, sector or function of the business in which the individual works or for which the individual is responsible, the profitability of the Group and levels of reward for comparable roles in the external market. In the case of bonuses or option awards proposed for the Executive Directors, these are determined by the Committee. In the financial year ending 31 March 2021, the Committee approved the distribution of the bonus pool having regard to market practice, continuing performance of the Group,
39Governance
FIXED
VARIABLE
Base SalaryBenefitsPension Contribution
Discretionary Cash BonusShare Option Awards (long-term incentivisation)
FY 21 Report and Accounts40
and the extended period of hard work during the pandemic. The Committee also agreed to introduce a clawback of bonuses going forward, whereby the Group has, in certain circumstances, the option to seek repayment of a per-centage of bonuses.
Before its acquisition by finnCap, Cavendish’s partners received a reve-nue share from mandates introduced and/or executed, rather than participat-ing in a bonus scheme. In accordance with the Group’s values, the Board has sought to move away from this model since IPO and to remunerate all staff on the same basis. Accordingly, partners recruited since IPO do not receive a revenue share but participate in the Group bonus pot alongside other staff. The Committee is pleased that historic Cavendish partners have also chosen to be remunerated on this basis going forward.
DIRECTORS’ REMUNERATION FOR THE YEAR (AUDITED)
The single total remuneration of each of the Directors who held office during the year ended 31 March 2021 was as follows. As announced on 2 April 2020, Stuart Andrews surrendered options over 300,000 shares and was granted options over the same numbers on equivalent terms. As announced on 13 August 2020, Richard Snow was grant-ed options over 250,000 shares during the period.
SALARIES AND PENSION
For the first three months of FY21, the Executive Directors agreed to waive a significant proportion of their salaries as part of Group-wide salary sacrifices designed to reduce operating expens-es in preparation for a difficult trading period ahead.
The Committee considered the basic salary paid to Executive Directors by reference to the levels of remuneration for other key senior executive positions in the Group as well as comparative information from peer group companies in the industry. The Committee conclud-
ed that there should be no change for the financial year ending 31 March 2022 in respect of any Executive Director other than Stuart Andrews.
Stuart assumed the role of Managing Director of finnCap in January 2020 (previously Head of Corporate). Given market conditions at that time and throughout FY20, Stuart did not receive any increase in remuneration upon assuming the role and did not receive a bonus for FY20. Since that date, Stuart’s role has continued to expand to include further responsibility for, and management of, the Group’s capital markets business, including oversight of new business lines such as finnCap Analytics. The Committee recognises the contribution Stuart has made and continues to make to the performance and growth of the Group and has in-creased his basic salary by £50,000 ac-cordingly. One Director received pension contributions of £11,767 during the year.
DISCRETIONARY BONUSES
Details of discretionary bonuses paid to the Executive Directors are set out in the table shown right, which were determined in accordance with the policy for determining variable remuneration.
SHARE OPTIONS
The Remuneration Committee granted 250,000 options to Richard Snow pursuant to the finnCap Company Share Option Plan. The earliest vesting date for the options is 20 May 2025 and the exercise price is 15.5p, being the market price of finnCap ordinary shares at the date Richard joined finnCap. The options are subject to performance conditions calculated by reference to the Group's profit before tax over the next five years.
The Remuneration Committee also approved the surrender of 300,000 options by Stuart Andrews and the grant of options over the same number on equivalent terms, as announced on 2 April 2020, as part of the surrender of unapproved options and grant of EMI options to staff.
NON-EXECUTIVE DIRECTORS’ REMUNERATION
Remuneration of Non-Executive Directors is set by the Board on the recommendation of the CEO (in consul-tation with the Chairman, in relation to the Non-Executive Directors other than the Chairman, and the Remuneration Committee in relation to the Chairman), after considering comparisons with peer group companies, experience and responsibility of the individual and the level of work carried out during the year. Remuneration comprises an annual fee only with reimbursement of all reasonable expenses. Non-Executive Directors do not participate in any form of variable compensation, be that discretionary cash bonuses or awards under the Group’s share schemes and are not eligible for pension benefits.
No changes have been proposed to the fees of the Non-Executive Directors for the current financial year, although it is noted that all Non-Executive Direc-tors waived their fees for the period from 1 April 2020 to 30 June 2020 and were therefore paid a lower overall amount than in the previous financial year.
OTHER MATTERS CONSIDERED DURING THE FINANCIAL YEAR
As announced on 18 November, the Group hired senior members of a new team to lead an expansion of our equity sales and trading business into servicing a new group of institutional investors – finnCap Analytics.
In order to incentivise this team and to attract further talent, the Committee agreed that an equity programme be put in place whereby the Company will issue options across the whole team of up to 20 million new ordinary shares at a price of 20p per share. In deciding to approve the equity programme, the Board and the Remuneration Commit-tee considered the dilutive effect on existing shareholders and the impact of the incentive scheme on existing employees. It was concluded that, although the equity programme was potentially large, it enabled the Group
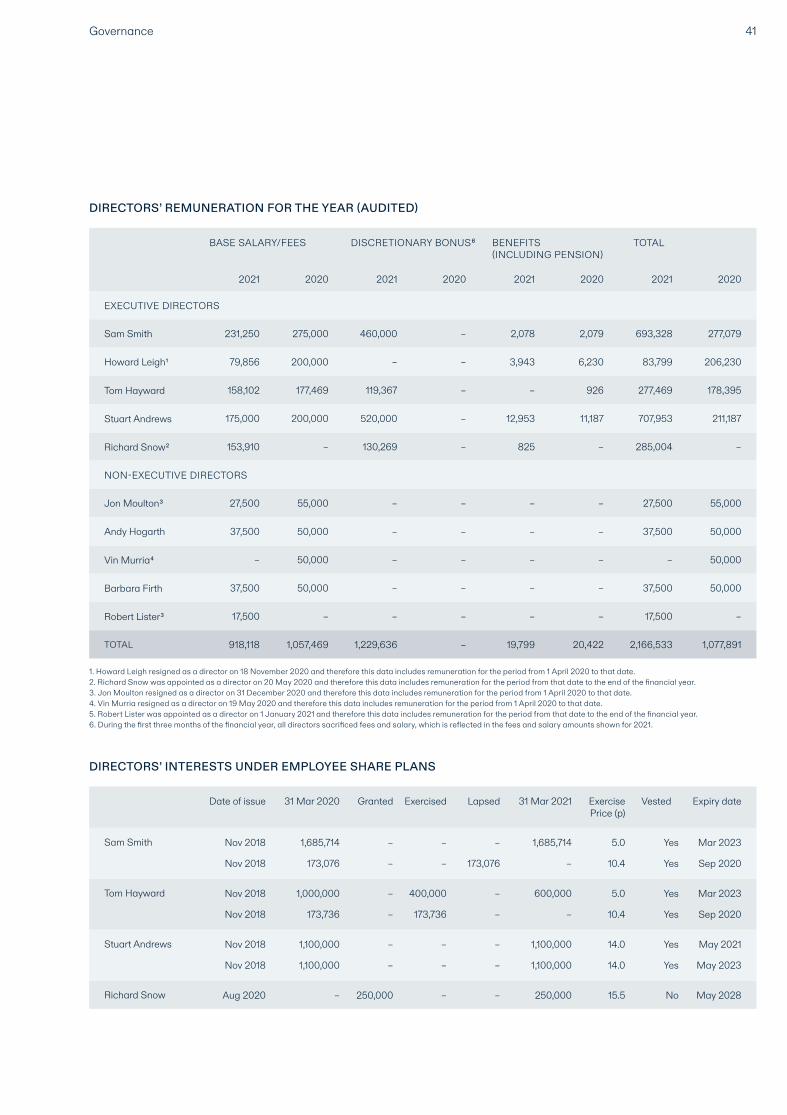
41Governance
EXECUTIVE DIRECTORS
NON-EXECUTIVE DIRECTORS
Tom Hayward
Sam Smith
Stuart Andrews
Richard Snow2
231,250 275,000 460,000 – 2,078 2,079 693,328 277,079
Howard Leigh1 79,856 200,000 – – 3,943 6,230 83,799 206,230
158,102 177,469 119,367 – – 926 277,469 178,395
175,000 200,000 520,000 – 12,953 11,187 707,953 211,187
153,910 – 130,269 – 825 – 285,004 –
Vin Murria4
Jon Moulton3
Robert Lister3
27,500 55,000 – – – – 27,500 55,000
Andy Hogarth 37,500 50,000 – – – – 37,500 50,000
– 50,000 – – – – – 50,000
Barbara Firth 37,500 50,000 – – – – 37,500 50,000
TOTAL 918,118 1,057,469 1,229,636 – 19,799 20,422 2,166,533 1,077,891
17,500 – – – – – 17,500 –
2021 2020 2021 2020 2021 2020 2021 2020
BASE SALARY/FEES DISCRETIONARY BONUS6 BENEFITS (INCLUDING PENSION)
TOTAL
1. Howard Leigh resigned as a director on 18 November 2020 and therefore this data includes remuneration for the period from 1 April 2020 to that date. 2. Richard Snow was appointed as a director on 20 May 2020 and therefore this data includes remuneration for the period from that date to the end of the financial year. 3. Jon Moulton resigned as a director on 31 December 2020 and therefore this data includes remuneration for the period from 1 April 2020 to that date. 4. Vin Murria resigned as a director on 19 May 2020 and therefore this data includes remuneration for the period from 1 April 2020 to that date. 5. Robert Lister was appointed as a director on 1 January 2021 and therefore this data includes remuneration for the period from that date to the end of the financial year. 6. During the first three months of the financial year, all directors sacrificed fees and salary, which is reflected in the fees and salary amounts shown for 2021.
Sam Smith
Tom Hayward
Stuart Andrews
Richard Snow
Date of issue 31 Mar 2020 31 Mar 2021 Expiry dateGranted Exercised ExercisePrice (p)
Lapsed Vested
Nov 2018 1,685,714 1,685,714 Mar 2023– – – Yes5.0
Nov 2018 173,076 – Sep 2020– – 173,076 Yes10.4
Nov 2018 1,000,000 600,000 Mar 2023– 400,000 – Yes5.0
Nov 2018 173,736 – Sep 2020– 173,736 – Yes10.4
Nov 2018 1,100,000 1,100,000 May 2021– – – Yes14.0
Nov 2018 1,100,000 1,100,000 May 2023– – – Yes14.0
Aug 2020 – 250,000 May 2028250,000 – – No15.5
DIRECTORS’ REMUNERATION FOR THE YEAR (AUDITED)
DIRECTORS’ INTERESTS UNDER EMPLOYEE SHARE PLANS
FY 21 Report and Accounts42
to enter a completely new line of busi-ness that is highly complementary to its existing offering, at low financial risk and with appropriate and challenging hurdles. It was believed that this would benefit all stakeholders.
On 2 April 2020, the Group became ineligible to grant EMI options because of the commencement of the lease of its new offices at 1 Bartholomew Close. Therefore, on 1 April 2020, holders of options pursuant to the finnCap Unap-proved Plan surrendered options over 3,150,000 shares and were granted options over an equivalent number of shares pursuant to the finnCap EMI Plan. Stuart Andrews, an executive director of the Company, surrendered unapproved options over 300,000 shares and was granted EMI options over the same number on equivalent terms.
Finally, Richard Snow joined the Company on 20 May 2020 as its Chief Financial Officer. The Remuneration Committee carefully considered the remuneration package to be offered to him, taking into account its Remunera-tion Policy above. Richard’s base salary is £190,000 per annum and he is eligible for a discretionary bonus on the same basis as the above. On joining the Group, it was agreed that he would be granted unapproved options over 250,000 shares pursuant to the Group’s established share option scheme, which are subject to performance conditions related to Group performance and will vest over a period of five years. His benefits and pension entitlement are in line with those offered to other Group employees.
OPTION POSITION
At IPO, the Company had options out-standing over 27.7m new shares pursu-ant to existing finnCap option schemes and grants made in connection with Admission. These shares represented 15.4% of the Group’s share capital at the time of the IPO. To date, approxim-ately 30% of these options have lapsed, due to staff leaving or performance conditions failing to be met.
Since IPO, options have been granted over 9.8m shares which could be satis-
fied by the issue of new shares or using EBT holdings. The EBT currently holds 13.3m shares.
Following announcement of the Group’s annual results, the Board intends to make grants over 5.5m shares (none of which are being made to directors or PDMRs), which may be satisfied by new shares or shares in the EBT (to be determined at the time of exercise).
Options over approximately 3.3m of these shares will be granted pursuant to a new option programme (the “New Programme”). The New Programme has been designed to ensure that staff are motivated and incentivised to work with the Group to deliver its five year plan and to retain and recruit key staff. It will consist of three tranches of option grants pursuant to the Group’s existing unapproved share option scheme, made at the ends of FY21, FY22 and FY23, and vesting in 2024, 2025 and 2026 respectively. Awards will be grant-ed over a total of 11m shares pursuant to the New Programme. No directors or PDMRs will receive awards under the New Programme.
As stated in the Admission Docu-ment, the Board resolved that options granted over new shares following the IPO will not exceed 10 per cent. of the Company’s issued share capital from time-to-time in any rolling ten year period (excluding options in existence at the time of the IPO or to be granted in connection with Admission). To date, including the grants of options over 5.5m shares referred to above, the Company has not exceeded this limit. In the event that all awards made in FY22 and FY23 pursuant to the New Programme referred to above are granted over new shares, and none of the current or proposed options lapse, the shares to be issued pursuant to the Company’s option schemes since IPO would constitute 13.2% of the Company’s issued share capital as at 30 June 2021, or 10.7% of the Company’s fully diluted share capital (excluding Analytics). The Board intend to continue to seek to minimise shareholder dilution as far as possible and will consider appropriate action to do so, including using the
EBT’s existing 13.3m shareholding or purchasing shares into treasury or the EBT, before making any further awards under the New Programme in FY22 and FY23 or otherwise.
ANDY HOGARTHChairman – Remuneration Committee
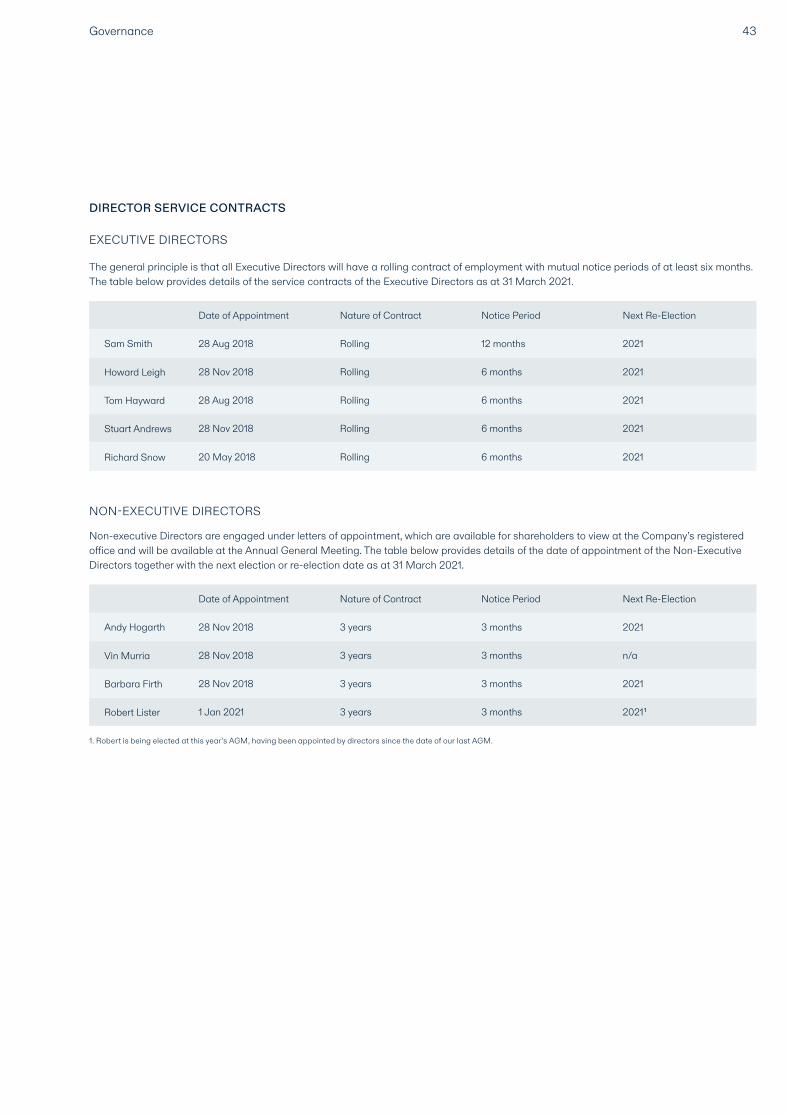
43Governance
Date of Appointment Nature of Contract Notice Period Next Re-Election
Howard Leigh
Tom Hayward
Richard Snow
Stuart Andrews
28 Aug 2018 Rolling 12 months 2021
28 Nov 2018 Rolling 6 months 2021
28 Aug 2018 Rolling 6 months 2021
20 May 2018 Rolling 6 months 2021
28 Nov 2018 Rolling 6 months 2021
Sam Smith
DIRECTOR SERVICE CONTRACTS
EXECUTIVE DIRECTORS
NON-EXECUTIVE DIRECTORS
The general principle is that all Executive Directors will have a rolling contract of employment with mutual notice periods of at least six months. The table below provides details of the service contracts of the Executive Directors as at 31 March 2021.
Date of Appointment Nature of Contract Notice Period Next Re-Election
Vin Murria
Barbara Firth
Robert Lister
28 Nov 2018 3 years 3 months 2021
28 Nov 2018 3 years 3 months n/a
28 Nov 2018 3 years 3 months 2021
1 Jan 2021 3 years 3 months 20211
Andy Hogarth
Non-executive Directors are engaged under letters of appointment, which are available for shareholders to view at the Company’s registered office and will be available at the Annual General Meeting. The table below provides details of the date of appointment of the Non-Executive Directors together with the next election or re-election date as at 31 March 2021.
1. Robert is being elected at this year’s AGM, having been appointed by directors since the date of our last AGM.

FY 21 Report and Accounts
Financial Statements

FY 21 Report and Accounts46
STATEMENT OF DIRECTORS’ RESPONSIBILITIES
The directors are responsible for preparing the annual report and the financial statements in accordance with international accounting standards in conformity with the requirements of the Companies Act 2006 and applicable law and regulations.
Company law requires the directors to prepare financial statements for each financial year. Under that law the directors are required to prepare the group financial statements and have elected to prepare the company finan-cial statements in accordance with international accounting standards in conformity with the requirements of the Companies Act 2006. Under company law the directors must not approve the financial statements unless they are satisfied that they give a true and fair view of the state of affairs of the group and company and of the profit or loss for the group and company for that period. The directors are also required to prepare financial statements in accordance with rules of the London Stock Exchange for companies trading securities on AIM.
In preparing these financial statements, the directors are required to:– select suitable accounting policies and then apply them consistently;– make judgements and accounting estimates that are reasonable and prudent;– state whether they have been pre-pared in accordance with international accounting standards in conformity with the requirements of the Companies Act 2006, subject to any material departures disclosed and explained in the financial statements– prepare the financial statements on the going concern basis unless it is inappropriate to presume that the company will continue in business;
The directors are responsible for keeping adequate accounting records that are sufficient to show and explain the company’s transactions and disclose with reasonable accuracy at
any time the financial position of the company and enable them to ensure that the financial statements comply with the Companies Act 2006. They are also responsible for safeguarding the assets of the company and hence for taking reasonable steps for the prevention and detection of fraud and other irregularities.
WEBSITE PUBLICATION
The directors are responsible for ensuring the annual report and the financial statements are made available on a website. Financial statements are published on the company’s website in accordance with legislation in the Unit-ed Kingdom governing the preparation and dissemination of financial state-ments, which may vary from legislation in other jurisdictions. The maintenance and integrity of the company's website is the responsibility of the directors. The directors' responsibility also extends to the ongoing integrity of the financial statements contained therein.
47Financial Statements
DIRECTORS’ REPORT
The Directors serving during the financial year ended 31 March 2021 and up to the date of the signing of the Financial State-ments present their report on the affairs of the Company (finnCap Group plc) and its subsidiaries (collectively the Group), together with the Company Financial Statements and the audited Financial Statements of the Group and the asso-ciated Independent Auditors’ Report, for the year ended 31 March 2021.
PARENT COMPANY
The Company acts as the holding company for the Group and details of its subsidiary undertakings can be found in Note 15.
DIVIDEND
Interim dividends of £804,000, 0.50p per share, were paid during the year (2020 - £1,218,000, 0.78p per share). No final dividend is proposed. GOING CONCERN
The Group's business activities, together with the factors likely to affect its future development, performance and position are set out in the Strategic Report. The Strategic Report and Directors’ Report describe the financial position of the Group; the Group’s objectives, policies and processes for managing its capital; its financial risk management objec-tives; and its exposure to credit risk and liquidity risk.
As normal, the Company has assessed the appropriateness of account ing on a going concern basis. This process involved the review of a forecast for the coming 18 months. This forecast showed that the Group has the required resources to operate within its resources during the period.
The Directors believe that the Com-pany has adequate resources to contin-ue trading for the foreseeable future. Accordingly, they continue to adopt the going concern basis in preparing the Annual Report and Accounts.
RISKS ARISING FROM FINANCIAL INSTRUMENTS
Risks arising from financial instruments include, but are not limited to, credit risk, liquidity risk and market risk. Details of these risks and how they are managed can be found in Note 4.
POST BALANCE SHEET EVENTS
Details of post-balance sheet events are set out in Note 28.
RELATIONS WITH SHAREHOLDERS
The Chief Executive Officer and Chief Financial Officer communicate the Group’s strategy and results to shareholders and analysts principally through meetings held following the announcement of the Group’s full annual and interim results.
Shareholders may also attend the Annual General Meeting at which members of the Board are available to answer questions.
INDEPENDENT AUDITORS
BDO LLP have expressed their willing-ness to continue in office as auditor and a resolution to reappoint BDO LLP as auditor of the Group will be proposed at the forthcoming Annual General Meeting.
EMPLOYMENT POLICY
The Group’s employment policies are based on a commitment to equal opportunities for all from the selection and recruitment processes, through to training, development, appraisal and promotion. The Group recognises that its people are pivotal to its success and encourages the involvement of employees by its performance-driven employee share plans.
CHANGE OF CONTROL
Directors’ and employees’ employment contracts do not provide for compensa-tion for loss of office or employment due
to a change of control. The provisions of the Company’s share plans may, however, cause options and awards granted to employees under such plans to vest on a change of control.
POLITICAL DONATIONS
The Group did not make any political donations or incur any political expend-iture during the year.
DIRECTORS’ INDEMNITIES
Directors and Officers’ Liability Insur-ance is maintained by the Group for all Directors and Officers of the Company and the Group as permitted by the Companies Act 2006. To the extent permitted by law and in accordance with its Articles of Association, the Company indemnifies its Directors in respect of any loss, liability or expense they incur in relation to the Company or any associated company of the Company. Indemnity provisions were in force during the year and these remain in force at the date of this report.
SHARE CAPITAL AND SHARE PREMIUM
As at 31 March 2021, the issued share capital of the Company was £1,736,994. This comprised of 173,669,389 ordinary 1p shares, which are admitted to trading on AIM. All shares have equal voting rights and no person has any special rights over the Company’s share capital.
Details of shares issued during the year are shown in Note 22.
RICHARD SNOWChief Financial Officer
FY 21 Report and Accounts48
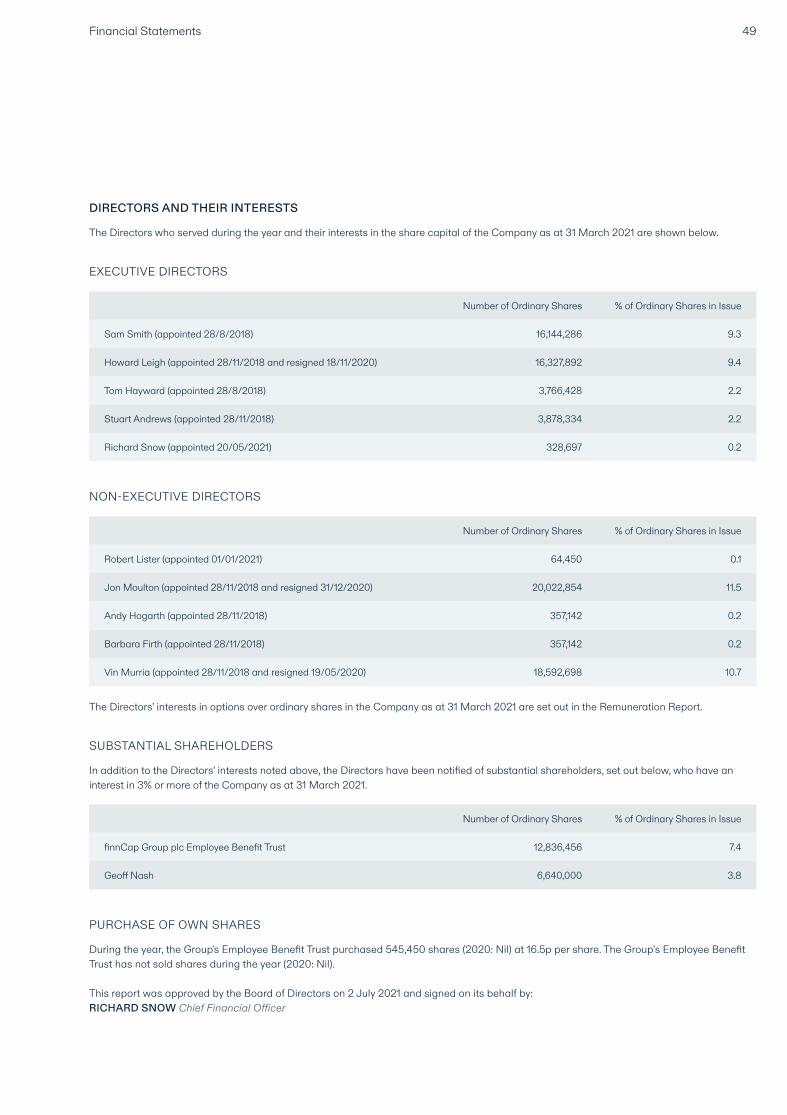
DIRECTORS AND THEIR INTERESTS
The Directors who served during the year and their interests in the share capital of the Company as at 31 March 2021 are shown below.
EXECUTIVE DIRECTORS
Number of Ordinary Shares % of Ordinary Shares in Issue
Sam Smith (appointed 28/8/2018)
Howard Leigh (appointed 28/11/2018 and resigned 18/11/2020)
16,144,286 9.3
16,327,892 9.4
Tom Hayward (appointed 28/8/2018)
Stuart Andrews (appointed 28/11/2018)
3,766,428 2.2
3,878,334 2.2
Richard Snow (appointed 20/05/2021) 328,697 0.2
NON-EXECUTIVE DIRECTORS
The Directors’ interests in options over ordinary shares in the Company as at 31 March 2021 are set out in the Remuneration Report.
Number of Ordinary Shares % of Ordinary Shares in Issue
Robert Lister (appointed 01/01/2021)
Jon Moulton (appointed 28/11/2018 and resigned 31/12/2020)
64,450 0.1
20,022,854 11.5
Andy Hogarth (appointed 28/11/2018)
Barbara Firth (appointed 28/11/2018)
357,142 0.2
357,142 0.2
Vin Murria (appointed 28/11/2018 and resigned 19/05/2020) 18,592,698 10.7
SUBSTANTIAL SHAREHOLDERS
In addition to the Directors’ interests noted above, the Directors have been notified of substantial shareholders, set out below, who have an interest in 3% or more of the Company as at 31 March 2021.
Number of Ordinary Shares % of Ordinary Shares in Issue
finnCap Group plc Employee Benefit Trust
Geoff Nash
12,836,456 7.4
6,640,000 3.8
PURCHASE OF OWN SHARES
During the year, the Group's Employee Benefit Trust purchased 545,450 shares (2020: Nil) at 16.5p per share. The Group’s Employee Benefit Trust has not sold shares during the year (2020: Nil).
This report was approved by the Board of Directors on 2 July 2021 and signed on its behalf by: RICHARD SNOW Chief Financial Officer
49Financial Statements
INDEPENDENT AUDITOR’S REPORT TO THE MEMBERS OF FINNCAP GROUP PLC OPINION ON THE FINANCIAL STATEMENTS In our opinion:– the financial statements give a true and fair view of the state of the Group’s and of the Parent Company’s affairs as at 31 March 2021 and of the Group’s profit for the year then ended;– the Group financial statements have been properly prepared in accordance with international accounting standards in conformity with the requirements of the Companies Act 2006; – the Parent Company financial state-ments have been properly prepared in accordance with international account ing standards in conformity with the requirements of the Companies Act 2006 and as applied in accordance with the provisions of the Companies Act 2006; – the financial statements have been prepared in accordance with the requirements of the Companies Act 2006.
We have audited the financial state-ments of finnCap Group plc (the ‘Parent Company’) and its subsidiaries (the ‘Group’) for the year ended 31 March 2021 which comprise the Consolidated Statement of Comprehensive Income, the Consolidated Statement of Financial Position, the Company Statement of Financial Position, the Consolidated Statement of Cash Flows, the Company Statement of Cash Flows, the Consoli-dated Statement of Changes in Equity, the Company Statement of Changes in Equity and the notes to the financial statements, including a summary of significant accounting policies.
The financial reporting framework that has been applied in their prepara-tion is applicable law and international accounting standards in conformity with the requirements of the Companies Act 2006 and, as regards the Parent Company financial statements, as applied in accordance with the provi-sions of the Companies Act 2006.
BASIS FOR OPINION
We conducted our audit in accordance with International Standards on Auditing (UK) (ISAs).
(UK)) and applicable law. Our responsibilities under those standards are further described in the Auditor’s responsibilities for the audit of the finan-cial statements section of our report. We believe that the audit evidence we have obtained is sufficient and appro-priate to provide a basis for our opinion.
INDEPENDENCE
We remain independent of the Group and the Parent Company in accordance with the ethical requirements that are relevant to our audit of the financial statements in the UK, including the FRC’s Ethical Standard as applied to listed entities, and we have fulfilled our other ethical responsibilities in accordance with these requirements.
CONCLUSIONS RELATING TO GOING CONCERN
In auditing the financial statements, we have concluded that the Directors’ use of the going concern basis of accounting in the preparation of the financial statements is appropriate. Our evaluation of the Directors’ assess-ment of the Group and the Parent Company’s ability to continue to adopt the going concern basis of accounting included:– Evaluating the appropriateness of the Directors’ method of assessing the going concern in light of market volatility and the present uncertainties in eco-nomic recovery created by the ongoing COVID-19 pandemic by reviewing the information used by the Directors in completing the assessment;– Reviewing the loan agreements to identify the covenants and assess the likelihood of them being breached based on the Directors’ forecasts and sensitivity analysis; – Challenging the Director’ assumptions and judgements made in their base case and stress-testing tested forecasts
including agreeing the revenue pipeline to underlying support where applicable and expenditure to historical expenditure. – Performing our own sensitivity analysis of the forecasts which included consideration of the covenant headroom and available liquidity;– Calculating financial ratios to consider the financial health of the Group.
Based on the work we have performed, we have not identified any material uncertainties relating to events or conditions that, individually or collectively, may cast significant doubt on the Group’s and the Parent Company’s ability to continue as a going concern for a period of at least twelve months from when the financial statements are authorised for issue.
Our responsibilities and the respon-sibilities of the Directors with respect to going concern are described in the relevant sections of this report. OVERVIEW
AN OVERVIEW OF THE SCOPE OF OUR AUDIT
Our Group audit was scoped by obtain-ing an understanding of the Group and its environment, including the Group’s system of internal control, and assessing
COVERAGE
100% (2020: 100%) of Group profit before tax100% (2020: 100%) of Group revenue
MATERIALITY
Group financial statements as a whole
£486,000 (2020: £177,000) based on 1.5% (2020: 8.1%) of Group’s average Revenue (2020: Group’s average profit before tax).
KEY AUDIT MATTERS
2021
2020
Revenue Recognition of Corporate Finance Fees and Commissions
FY 21 Report and Accounts50
the risks of material misstatement in the financial statements. We also addressed the risk of management override of internal controls, including assessing whether there was evidence of bias by the Directors that may have represented a risk of material misstatement.
We tailored our audit to ensure we have performed sufficient work to be able to give an opinion on the Group financial statements as a whole taking into account the structure of the Group and its accounting processes and controls. The Group is based in the United Kingdom and operates through subsidiaries of the Parent Company. The main trading entities are finnCap Ltd which engages in corporate finance and brokerage services and Cavendish Corporate Finance LLP which offers specialist independent advice and support on the sale and purchases of businesses.
The Group audit engagement team carried out full scope audits for the Parent Company, finnCap Ltd and Cavendish Corporate Finance LLP which were considered to be sig nificant components of the Group, as well was Cavendish Corporate Finance (UK) Limited which was not considered to be significant.
KEY AUDIT MATTERS
Key audit matters are those matters that, in our professional judgement, were of most significance in our audit of the financial statements of the current period and include the most significant assessed risks of material misstate-ment (whether or not due to fraud) that we identified, including those which had the greatest effect on: the overall audit strategy, the allocation of resources in the audit, and directing the efforts of the engagement team. This matter was addressed in the context of our audit of the financial statements as a whole, and in forming our opinion thereon, and we do not provide a separate opinion on this matter.
Our procedures performed included:
For a sample of corporate finance fees recognised during the year, we:–reviewed the terms of the engagement letter in order to assess the performance obligations and determined whether these had been met through inspection of applicable supporting documentation.–agreed the fee recognised to the fee per the engagement letter. –agreed the income recognised by the Group to the sales invoice and to bank statements. For a sample of commissions recognised during the year, we:–recalculated the commission that should be recognised by obtaining a placing agreement for each engagement and reviewing the engagement letter to confirm the percentage commission due to the Group and the supporting statements or contracts confirming the amount of debt or equity finance raised. –compared our calculation above to the revenue recognised by the Group; –agreed the timing of revenue recognition to regulator announcements or similar evidence in order to confirm the timing and occurrence of the underlying deal. –agreed the income recognised by the Group to the sales invoice and to bank statements. Performed cut off testing by selecting a sample of recorded commission and corporate finance fee income recorded for a defined period before and after year end and agreed the performance obli-gations back to contract and regulatory announcements or similar evidence to check that the income was recognised in the correct accounting period.
KEY OBSERVATIONS
Based on procedures performed we did not find any matters indicating that the recognition of corporate finance fees and commission revenue was inappropriate.
HOW THE SCOPE OF OUR AUDIT ADDRESSED THE KEY AUDIT MATTER
Revenue Recognition of Corporate Finance Fees and Commissions (Note 2 and Note 5)
As described in note 2 to the financial statements, the Group generates revenue from several different distinct revenue streams including, income from trading activities, corporate finance fee and retainer income and trading profits from short-term investments.
Revenue from corporate finance fees and commission are generated upon suc-cessfully raising debt or equity finance on behalf of clients and therefore only earned when the deal is concluded.
There is a risk in the recognition of corporate finance fees and commission that revenue is not recognised in ac-cordance with contractual entitlement or satisfaction of performance obligations. Furthermore, if there are any deals which are significantly progressed around the year-end judgement is required in deter-mining whether performance obligations have been satisfied and whether revenue may be recognised.
KEY AUDIT MATTER
51Financial Statements
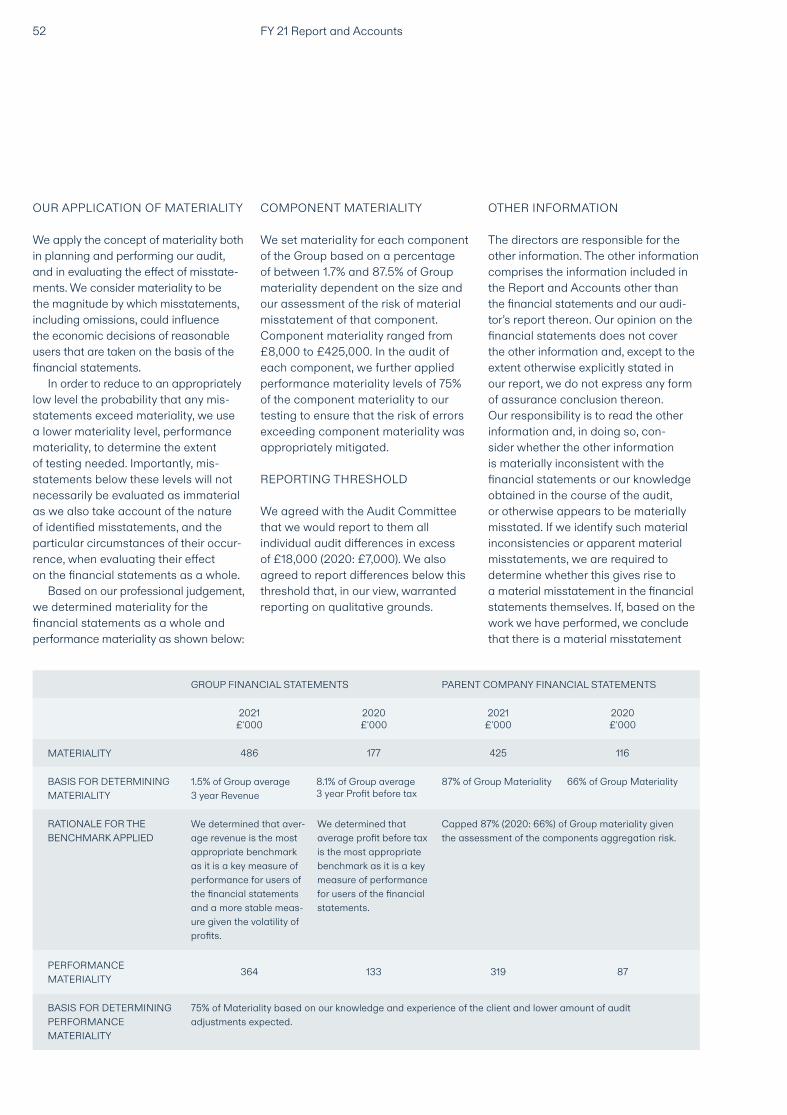
OUR APPLICATION OF MATERIALITY
We apply the concept of materiality both in planning and performing our audit, and in evaluating the effect of misstate-ments. We consider materiality to be the magnitude by which misstatements, including omissions, could influence the economic decisions of reasonable users that are taken on the basis of the financial statements.
In order to reduce to an appropriately low level the probability that any mis-statements exceed materiality, we use a lower materiality level, performance materiality, to determine the extent of testing needed. Importantly, mis-statements below these levels will not necessarily be evaluated as immaterial as we also take account of the nature of identified misstatements, and the particular circumstances of their occur-rence, when evaluating their effect on the financial statements as a whole.
Based on our professional judgement, we determined materiality for the financial statements as a whole and performance materiality as shown below:
COMPONENT MATERIALITY
We set materiality for each component of the Group based on a percentage of between 1.7% and 87.5% of Group materiality dependent on the size and our assessment of the risk of material misstatement of that component. Component materiality ranged from £8,000 to £425,000. In the audit of each component, we further applied performance materiality levels of 75% of the component materiality to our testing to ensure that the risk of errors exceeding component materiality was appropriately mitigated.
REPORTING THRESHOLD
We agreed with the Audit Committee that we would report to them all individual audit differences in excess of £18,000 (2020: £7,000). We also agreed to report differences below this threshold that, in our view, warranted reporting on qualitative grounds.
OTHER INFORMATION
The directors are responsible for the other information. The other information comprises the information included in the Report and Accounts other than the financial statements and our audi-tor’s report thereon. Our opinion on the financial statements does not cover the other information and, except to the extent otherwise explicitly stated in our report, we do not express any form of assurance conclusion thereon. Our responsibility is to read the other information and, in doing so, con - sider whether the other information is materially inconsistent with the financial statements or our knowledge obtained in the course of the audit, or otherwise appears to be materially misstated. If we identify such material inconsistencies or apparent material misstatements, we are required to determine whether this gives rise to a material misstatement in the financial statements themselves. If, based on the work we have performed, we conclude that there is a material misstatement
GROUP FINANCIAL STATEMENTS PARENT COMPANY FINANCIAL STATEMENTS
BASIS FOR DETERMINING PERFORMANCE MATERIALITY
75% of Materiality based on our knowledge and experience of the client and lower amount of audit adjustments expected.
2021 £'000
2020 £'000
2021£'000
2020 £'000
PERFORMANCE MATERIALITY
364 133 319 87
486 177 425 116MATERIALITY
1.5% of Group average 3 year Revenue
8.1% of Group average 3 year Profit before tax
87% of Group Materiality 66% of Group MaterialityBASIS FOR DETERMINING MATERIALITY
We determined that aver-age revenue is the most appropriate benchmark as it is a key measure of performance for users of the financial statements and a more stable meas-ure given the volatility of profits.
We determined that average profit before tax is the most appropriate benchmark as it is a key measure of performance for users of the financial statements.
RATIONALE FOR THE BENCHMARK APPLIED
FY 21 Report and Accounts52
Capped 87% (2020: 66%) of Group materiality given the assessment of the components aggregation risk.
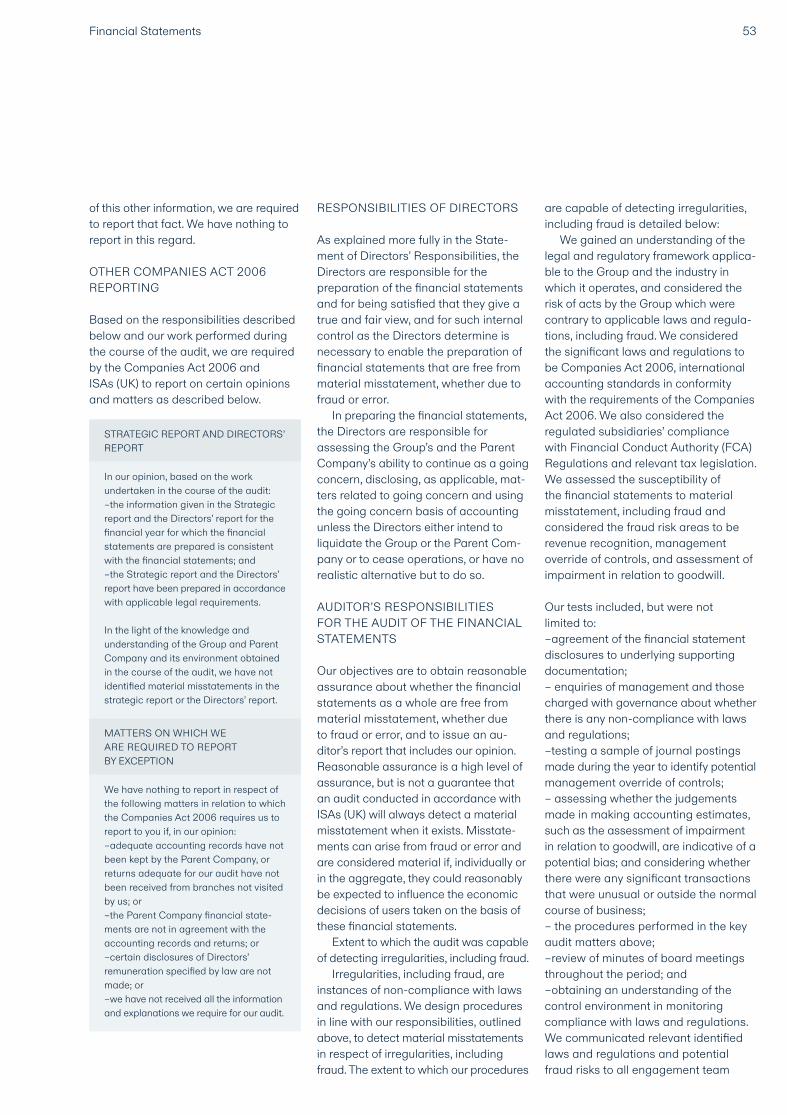
of this other information, we are required to report that fact. We have nothing to report in this regard.
OTHER COMPANIES ACT 2006 REPORTING
Based on the responsibilities described below and our work performed during the course of the audit, we are required by the Companies Act 2006 and ISAs (UK) to report on certain opinions and matters as described below.
RESPONSIBILITIES OF DIRECTORS
As explained more fully in the State-ment of Directors’ Responsibilities, the Directors are responsible for the preparation of the financial statements and for being satisfied that they give a true and fair view, and for such internal control as the Directors determine is necessary to enable the preparation of financial statements that are free from material misstatement, whether due to fraud or error.
In preparing the financial statements, the Directors are responsible for assessing the Group’s and the Parent Company’s ability to continue as a going concern, disclosing, as applicable, mat-ters related to going concern and using the going concern basis of accounting unless the Directors either intend to liquidate the Group or the Parent Com-pany or to cease operations, or have no realistic alternative but to do so.
AUDITOR’S RESPONSIBILITIES FOR THE AUDIT OF THE FINANCIAL STATEMENTS
Our objectives are to obtain reasonable assurance about whether the financial statements as a whole are free from material misstatement, whether due to fraud or error, and to issue an au-ditor’s report that includes our opinion. Reasonable assurance is a high level of assurance, but is not a guarantee that an audit conducted in accordance with ISAs (UK) will always detect a material misstatement when it exists. Misstate-ments can arise from fraud or error and are considered material if, individually or in the aggregate, they could reasonably be expected to influence the economic decisions of users taken on the basis of these financial statements.
Extent to which the audit was capable of detecting irregularities, including fraud.
Irregularities, including fraud, are instances of non-compliance with laws and regulations. We design procedures in line with our responsibilities, outlined above, to detect material misstatements in respect of irregularities, including fraud. The extent to which our procedures
are capable of detecting irregularities, including fraud is detailed below:
We gained an understanding of the legal and regulatory framework applica-ble to the Group and the industry in which it operates, and considered the risk of acts by the Group which were contrary to applicable laws and regula-tions, including fraud. We considered the significant laws and regulations to be Companies Act 2006, international accounting standards in conformity with the requirements of the Companies Act 2006. We also considered the regulated subsidiaries’ compliance with Financial Conduct Authority (FCA) Regulations and relevant tax legislation. We assess ed the susceptibility of the financial statements to material misstatement, including fraud and considered the fraud risk areas to be revenue recognition, management override of controls, and assessment of impairment in relation to goodwill.
Our tests included, but were not limited to:–agreement of the financial statement disclosures to underlying supporting documentation;– enquiries of management and those charged with governance about whether there is any non-compliance with laws and regulations;–testing a sample of journal postings made during the year to identify potential management override of controls;– assessing whether the judgements made in making accounting estimates, such as the assessment of impairment in relation to goodwill, are indicative of a potential bias; and considering whether there were any significant transactions that were unusual or outside the normal course of business;– the procedures performed in the key audit matters above;–review of minutes of board meetings throughout the period; and–obtaining an understanding of the control environment in monitoring compliance with laws and regulations.We communicated relevant identified laws and regulations and potential fraud risks to all engagement team
53Financial Statements
We have nothing to report in respect of the following matters in relation to which the Companies Act 2006 requires us to report to you if, in our opinion:–adequate accounting records have not been kept by the Parent Company, or returns adequate for our audit have not been received from branches not visited by us; or–the Parent Company financial state-ments are not in agreement with the accounting records and returns; or–certain disclosures of Directors’ remuneration specified by law are not made; or–we have not received all the information and explanations we require for our audit.
In our opinion, based on the work undertaken in the course of the audit:–the information given in the Strategic report and the Directors’ report for the financial year for which the financial statements are prepared is consistent with the financial statements; and–the Strategic report and the Directors’ report have been prepared in accordance with applicable legal requirements.
In the light of the knowledge and understanding of the Group and Parent Company and its environment obtained in the course of the audit, we have not identified material misstatements in the strategic report or the Directors’ report.
STRATEGIC REPORT AND DIRECTORS’ REPORT
MATTERS ON WHICH WE ARE REQUIRED TO REPORT BY EXCEPTION

members and discussed how and where these might occur and remained alert to any indications of fraud or non- compliance with laws and regulations throughout the audit.
Our audit procedures were designed to respond to risks of material mis-statement in the financial statements, recognising that the risk of not detecting a material misstatement due to fraud is higher than the risk of not detecting one resulting from error, as fraud may involve deliberate concealment by, for example, forgery, misrepresentations or through collusion. There are inherent limitations in the audit procedures performed and the further removed non-compliance with laws and regulations is from the events and transactions reflected in the financial statements, the less likely we are to become aware of it.
A further description of our respon-sibilities is available on the Financial Reporting Council’s website at: https://www.frc.org.uk/auditorsresponsibilities. This description forms part of our auditor’s report.
USE OF OUR REPORT
This report is made solely to the Parent Company’s members, as a body, in accordance with Chapter 3 of Part 16 of the Companies Act 2006. Our audit work has been undertaken so that we might state to the Parent Company’s members those matters we are required to state to them in an auditor’s report and for no other purpose. To the fullest extent permitted by law, we do not ac-cept or assume responsibility to anyone other than the Parent Company and the Parent Company’s members as a body, for our audit work, for this report, or for the opinions we have formed.
TIMOTHY WEST Senior Statutory AuditorFor and on behalf of BDO LLP, Statutory Auditor, London, UK2 July 2021
BDO LLP is a limited liability partnership registered in England and Wales (with registered number OC305127).
FY 21 Report and Accounts54
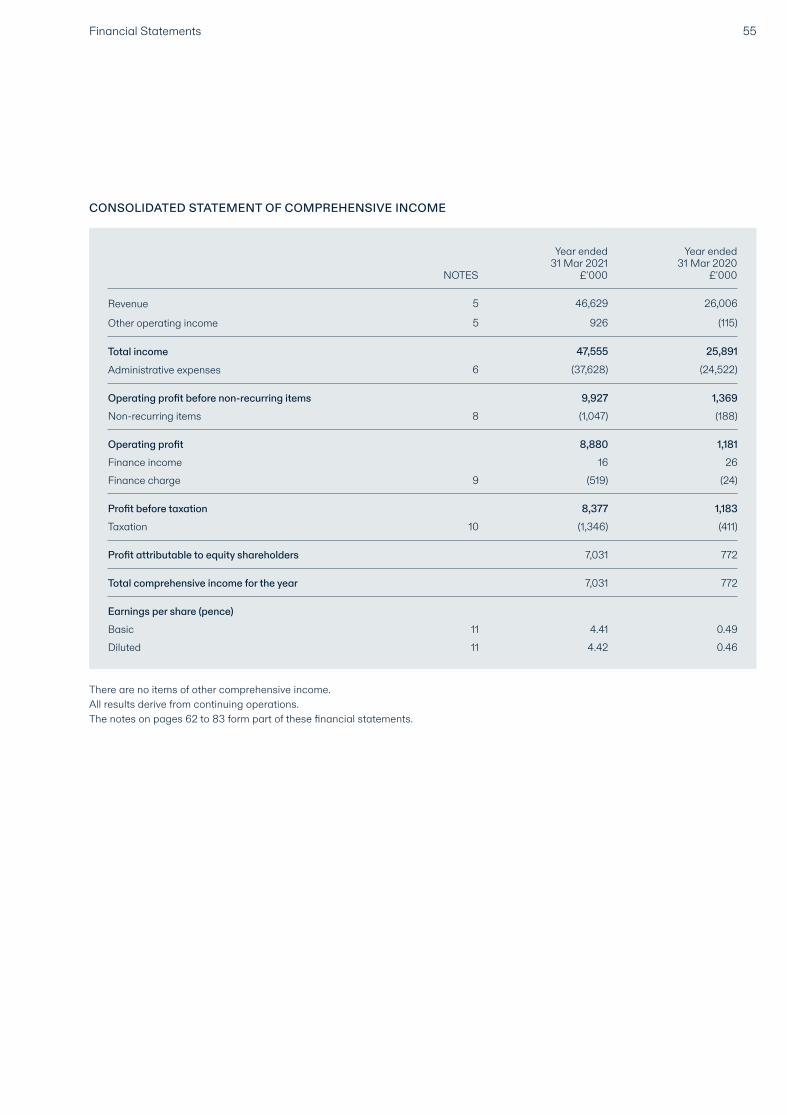
CONSOLIDATED STATEMENT OF COMPREHENSIVE INCOME
There are no items of other comprehensive income.All results derive from continuing operations.The notes on pages 62 to 83 form part of these financial statements.
NOTES
Year ended31 Mar 2021
£'000
Year ended31 Mar 2020
£'000
Total income
Other operating income
Administrative expenses
Operating profit before non-recurring itemsNon-recurring items
Operating profitFinance income
Taxation
Profit attributable to equity shareholders
Finance charge
Profit before taxation
Revenue
Total comprehensive income for the year
47,555 25,891
5 926 (115)
6 (37,628) (24,522)
9,927 1,3698 (1,047) (188)
8,880 1,18116 26
10 (1,346) (411)
7,031 772
9 (519) (24)
8,377 1,183
5 46,629 26,006
7,031 772
Earnings per share (pence)BasicDiluted
11 4.41 0.4911 4.42 0.46
55Financial Statements
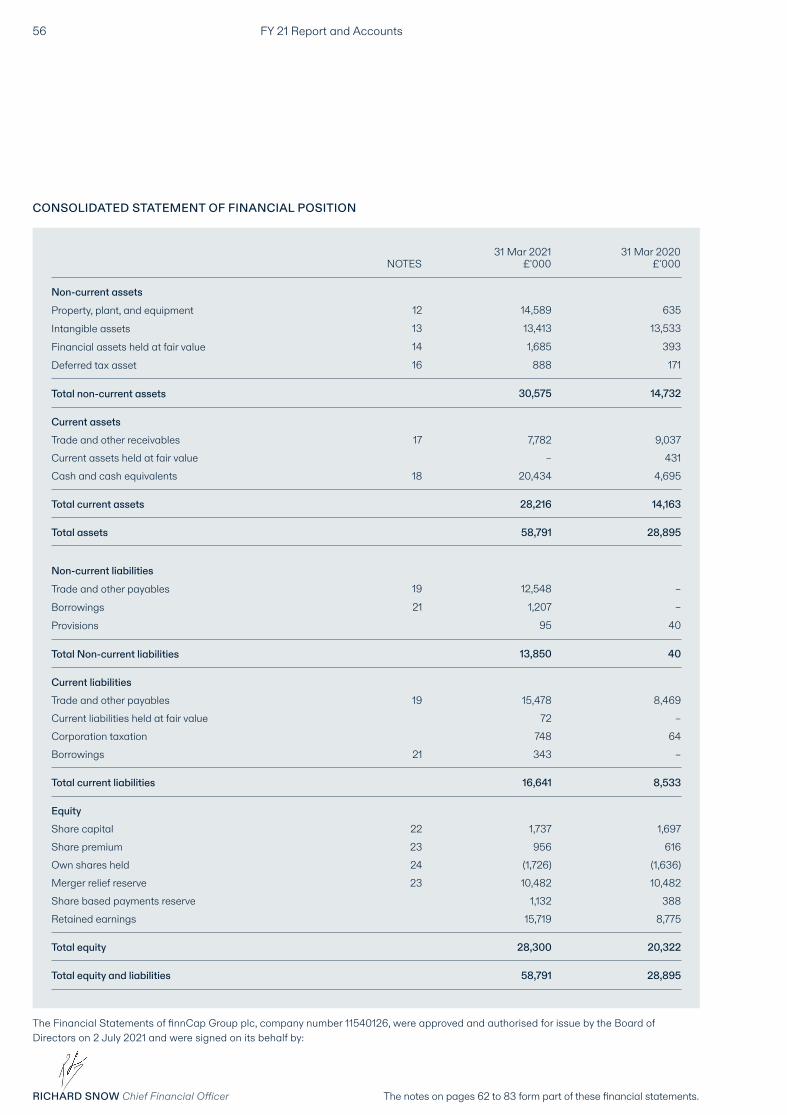
CONSOLIDATED STATEMENT OF FINANCIAL POSITION
NOTES31 Mar 2021
£'00031 Mar 2020
£'000
Total non-current assets 30,575 14,732
Current assetsTrade and other receivables 17 7,782 9,037Current assets held at fair value – 431Cash and cash equivalents 18 20,434 4,695
Total current assets 28,216 14,163
Total assets 58,791 28,895
Non-current assetsProperty, plant, and equipment 12 14,589 635
Financial assets held at fair value 14 1,685 393
Deferred tax asset 16 888 171
Intangible assets 13 13,413 13,533
Total Non-current liabilities 13,850 40
Current liabilities
Equity
Trade and other payables 19 15,478 8,469
Share capital 22 1,737 1,697
Current liabilities held at fair value 72 –
Share premium 23 956 616
Corporation taxation 748 64
Own shares held 24 (1,726) (1,636)
Share based payments reserve 1,132 388
Total equity 28,300 20,322
Borrowings 21 343 –
Merger relief reserve 23 10,482 10,482
Retained earnings 15,719 8,775
Total equity and liabilities 58,791 28,895
Total current liabilities 16,641 8,533
Non-current liabilitiesTrade and other payables 19 12,548 –
Provisions 95 40Borrowings 21 1,207 –
The Financial Statements of finnCap Group plc, company number 11540126, were approved and authorised for issue by the Board of Directors on 2 July 2021 and were signed on its behalf by:
RICHARD SNOW Chief Financial Officer The notes on pages 62 to 83 form part of these financial statements.
FY 21 Report and Accounts56
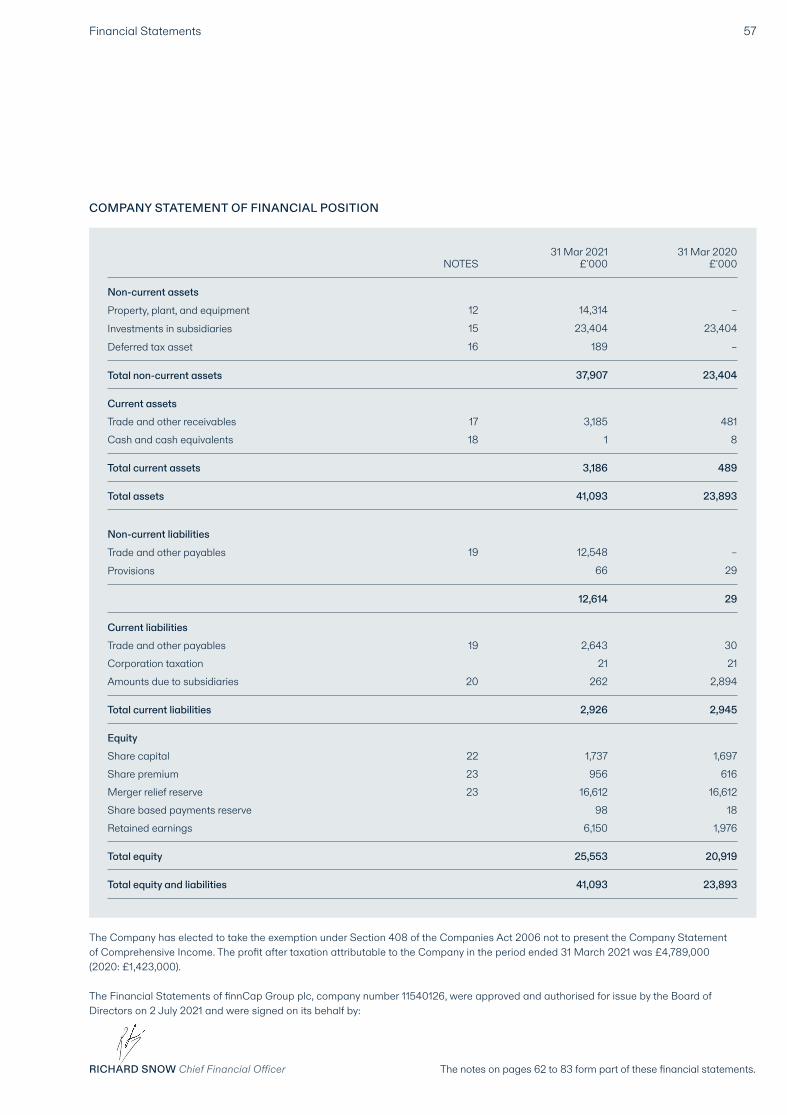
COMPANY STATEMENT OF FINANCIAL POSITION
NOTES31 Mar 2021
£'00031 Mar 2020
£'000
Total non-current assets 37,907 23,404
Current assetsTrade and other receivables 17 3,185 481Cash and cash equivalents 18 1 8
Total current assets 3,186 489
Total assets 41,093 23,893
Property, plant, and equipment 12 14,314 –
Deferred tax asset 16 189 –Investments in subsidiaries 15 23,404 23,404
Non-current assets
12,614 29
Current liabilities
Equity
Trade and other payables 19 2,643 30
Share capital 22 1,737 1,697
Corporation taxation 21 21
Share premium 23 956 616
Amounts due to subsidiaries 20 262 2,894
Merger relief reserve 23 16,612 16,612
Retained earnings 6,150 1,976
Total equity 25,553 20,919
Share based payments reserve 98 18
Total equity and liabilities 41,093 23,893
Total current liabilities 2,926 2,945
Non-current liabilitiesTrade and other payables 19 12,548 –
Provisions 66 29
The Company has elected to take the exemption under Section 408 of the Companies Act 2006 not to present the Company Statement of Comprehensive Income. The profit after taxation attributable to the Company in the period ended 31 March 2021 was £4,789,000 (2020: £1,423,000).
The Financial Statements of finnCap Group plc, company number 11540126, were approved and authorised for issue by the Board of Directors on 2 July 2021 and were signed on its behalf by:
RICHARD SNOW Chief Financial Officer The notes on pages 62 to 83 form part of these financial statements.
57Financial Statements
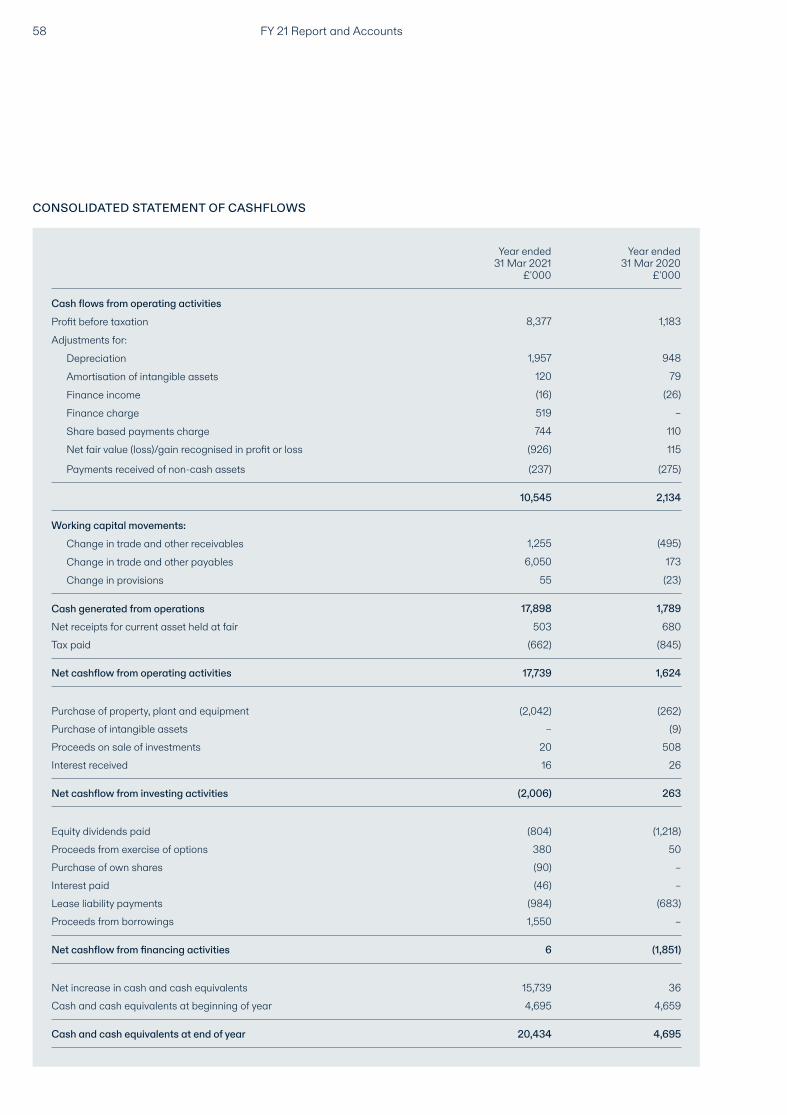
CONSOLIDATED STATEMENT OF CASHFLOWS
Year ended31 Mar 2021
£'000
Year ended31 Mar 2020
£'000
Net fair value (loss)/gain recognised in profit or loss (926) 115
Payments received of non-cash assets (237) (275)
10,545 2,134
Cash flows from operating activitiesProfit before taxation 8,377 1,183
Depreciation 1,957 948
Amortisation of intangible assets 120 79
Finance income (16) (26)
Finance charge 519 –
Share based payments charge 744 110
Adjustments for:
Net increase in cash and cash equivalents 15,739 36
Cash and cash equivalents at end of year 20,434 4,695
Cash and cash equivalents at beginning of year 4,695 4,659
Working capital movements:
Cash generated from operations 17,898 1,789Net receipts for current asset held at fair 503 680Tax paid (662) (845)
Net cashflow from operating activities 17,739 1,624
Change in trade and other receivables 1,255 (495)
Change in provisions 55 (23)Change in trade and other payables 6,050 173
Purchase of own shares (90) –
Equity dividends paid (804) (1,218)
Interest paid (46) –
Proceeds from exercise of options 380 50
Lease liability payments (984) (683)Proceeds from borrowings 1,550 –
Net cashflow from financing activities 6 (1,851)
Purchase of property, plant and equipment (2,042) (262)Purchase of intangible assets – (9)Proceeds on sale of investments 20 508Interest received 16 26
Net cashflow from investing activities (2,006) 263
FY 21 Report and Accounts58
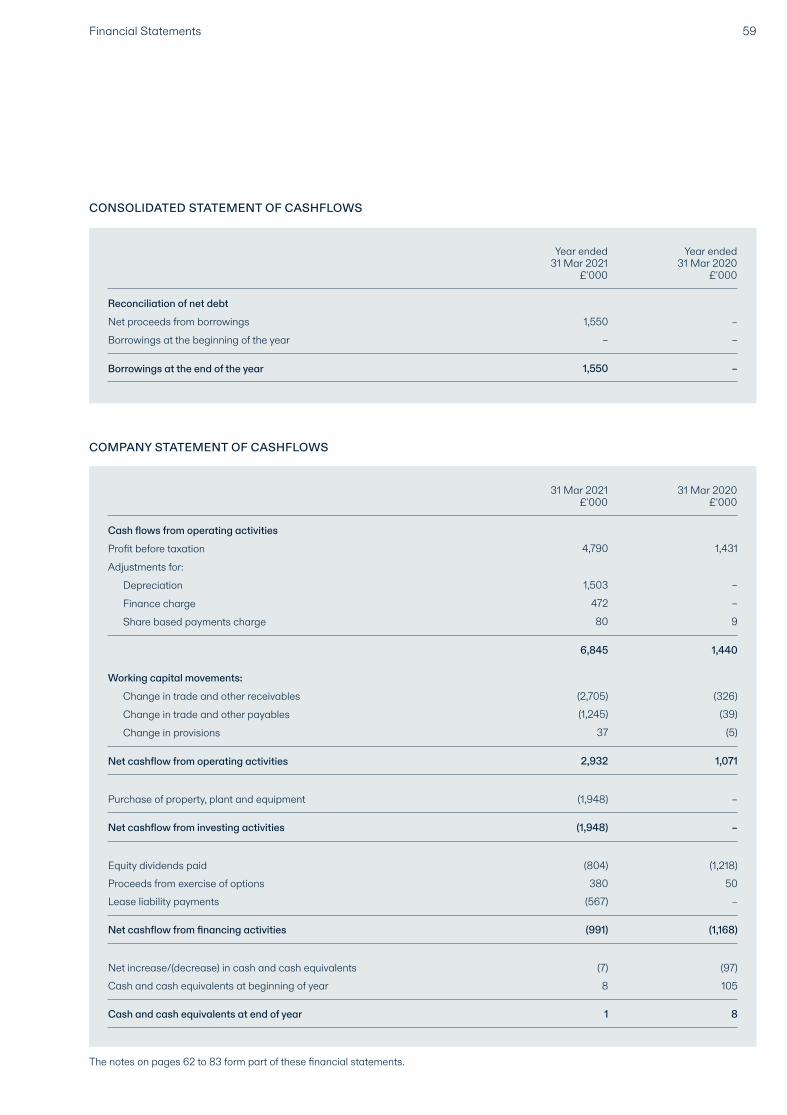
CONSOLIDATED STATEMENT OF CASHFLOWS
Year ended31 Mar 2021
£'000
Year ended31 Mar 2020
£'000
Reconciliation of net debtNet proceeds from borrowings 1,550 –
– –Borrowings at the beginning of the year
The notes on pages 62 to 83 form part of these financial statements.
COMPANY STATEMENT OF CASHFLOWS
31 Mar 2021£'000
31 Mar 2020£'000
6,845 1,440
Cash flows from operating activitiesProfit before taxation 4,790 1,431
Depreciation 1,503 –
Finance charge 472 –
Share based payments charge 80 9
Adjustments for:
Net cashflow from investing activities (1,948) –
Purchase of property, plant and equipment (1,948) –
Working capital movements:
Net cashflow from operating activities 2,932 1,071
Change in trade and other receivables
Change in provisionsChange in trade and other payables
(2,705) (326)(1,245) (39)
37 (5)
Net increase/(decrease) in cash and cash equivalents (7) (97)Cash and cash equivalents at beginning of year 8 105
Cash and cash equivalents at end of year 1 8
Equity dividends paid (804) (1,218)Proceeds from exercise of options 380 50Lease liability payments (567) –
Net cashflow from financing activities (991) (1,168)
59Financial Statements
Borrowings at the end of the year 1,550 –
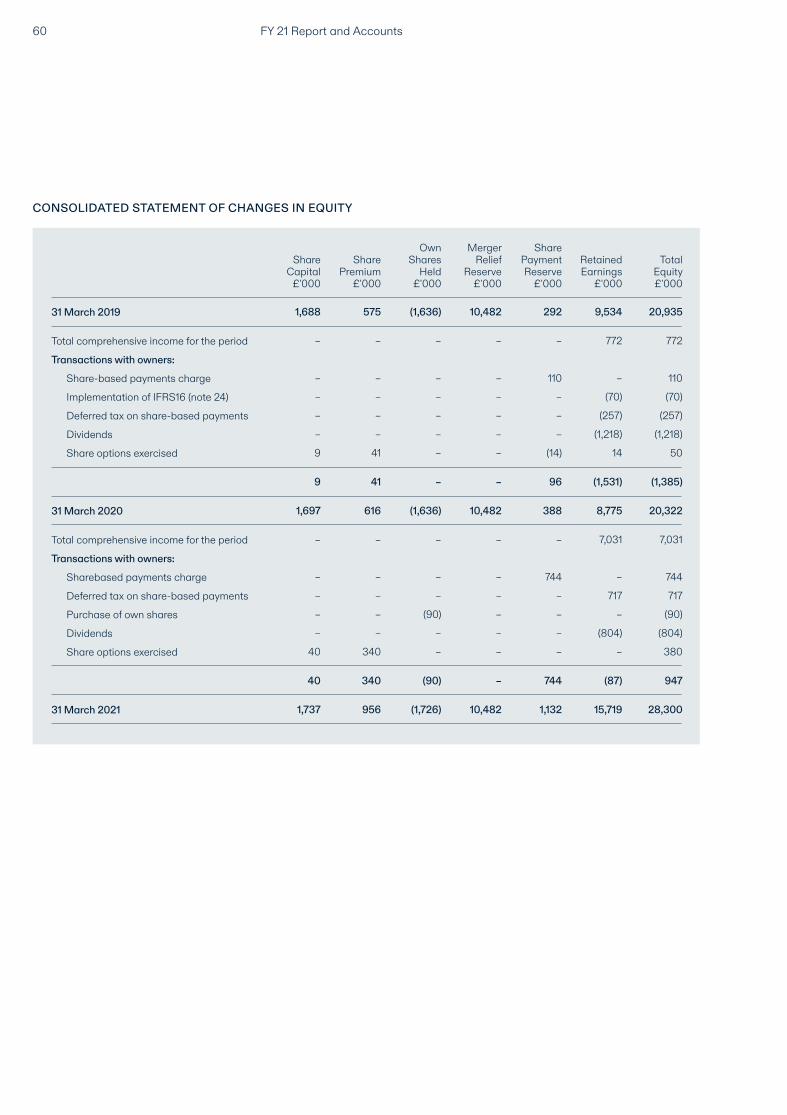
CONSOLIDATED STATEMENT OF CHANGES IN EQUITY
31 March 2019 1,688 575 (1,636) 10,482 292 9,534 20,935
Total comprehensive income for the period – – – – – 772 772
Transactions with owners:
Share-based payments charge – – – – 110 – 110
Implementation of IFRS16 (note 24) – – – – – (70) (70)
Deferred tax on share-based payments – – – – – (257) (257)
Dividends – – – – – (1,218) (1,218)
Share options exercised 9 41 – – (14) 14 50
ShareCapital
£'000
Share Premium
£'000
Own Shares
Held£'000
Merger Relief
Reserve£'000
Share PaymentReserve
£'000
RetainedEarnings
£'000
TotalEquity£'000
9 41 – – 96 (1,531) (1,385)
40 340 (90) – 744 (87) 947
31 March 2020 1,697 616 (1,636) 10,482 388 8,775 20,322
31 March 2021 1,737 956 (1,726) 10,482 1,132 15,719 28,300
Total comprehensive income for the period – – – – – 7,031 7,031
Transactions with owners:
Sharebased payments charge – – – – 744 – 744
Deferred tax on share-based payments – – – – – 717 717
Purchase of own shares – – (90) – – – (90)
Dividends – – – – – (804) (804)
Share options exercised 40 340 – – – – 380
FY 21 Report and Accounts60
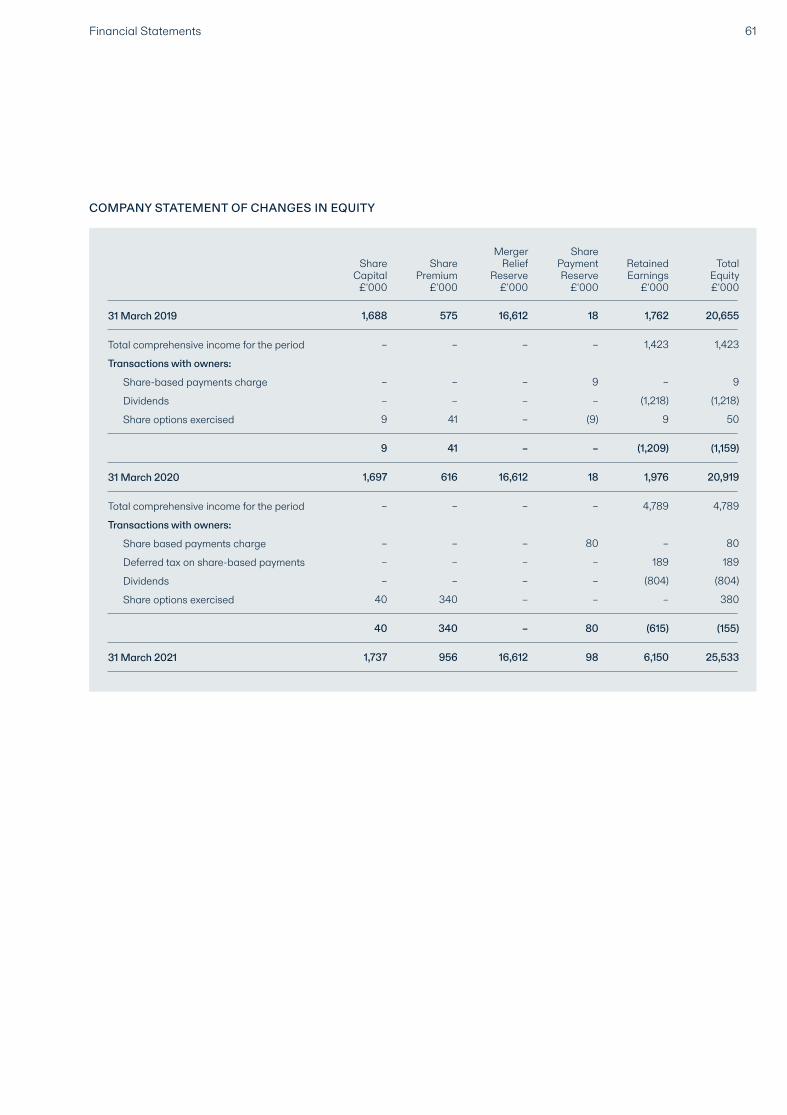
COMPANY STATEMENT OF CHANGES IN EQUITY
31 March 2019 1,688 575 16,612 18 1,762 20,655
9 41 – – (1,209) (1,159)
40 340 – 80 (615) (155)
31 March 2020 1,697 616 16,612 18 1,976 20,919
31 March 2021 1,737 956 16,612 98 6,150 25,533
Total comprehensive income for the period – – – – 1,423 1,423
Total comprehensive income for the period – – – – 4,789 4,789
Transactions with owners:
Transactions with owners:
Share-based payments charge – – – 9 – 9
Share based payments charge – – – 80 – 80
Dividends – – – – (1,218) (1,218)
Deferred tax on share-based payments – – – – 189 189
Share options exercised 9 41 – (9) 9 50
Dividends – – – – (804) (804)
Share options exercised 40 340 – – – 380
ShareCapital
£'000
Share Premium
£'000
Merger Relief
Reserve£'000
Share PaymentReserve
£'000
RetainedEarnings
£'000
TotalEquity £'000
61Financial Statements
NOTES TO THE FINANCIAL STATEMENTS
1. GENERAL INFORMATION
finnCap Group plc (the “Company”) is a public limited company, limited by shares, incorporated and domiciled in England and Wales. The Company was incorporated on 28 August 2018. The registered office of the Company is at 1 Bartholomew Close, London, EC1A 7BL, United Kingdom. The registered company number is 11540126. The Company is listed on the AIM market of the London Stock Exchange.
2. ACCOUNTING POLICIES
A. BASIS OF PREPARATIONThese consolidated Financial State-ments contain information about the Group and have been prepared on a historical cost basis except for certain Financial Instruments which are carried at fair value. Amounts are rounded to the nearest thousand, unless otherwise stated and are presented in pounds sterling, which is the currency of the primary economic environment in which the Group operates.
These consolidated Financial Statements have been prepared in accordance with International Account-ing Standards, in conformity with the requirements of the Companies Act 2006 and those parts of the Companies Act 2006 applicable to companies reporting under International Financial Reporting Standards.
The preparation of Financial State-ments in compliance with adopted IFRS requires the use of certain critical ac-counting estimates. It also requires Group management to exercise judgement in applying the Group's accounting policies. The areas where significant judgements and estimates have been made in pre-paring the financial statements and their effect are disclosed in note 3.
B. BASIS OF CONSOLIDATIONThe Group’s consolidated Financial Statements include the Financial Statements of the Company and all its
subsidiaries. Subsidiaries are entities over which the Group has control if all three of the following elements are pres-ent: power over the investee, exposure to variable returns from the investee and the ability of the investor to use its power to affect those variable returns. Subsidiaries are fully consolidated from the date on which control is established and de-con-solidated on the date that control ceases.
The acquisition method of accounting is used for the acquisition of subsidiaries. Transactions and balances between members of the Group are eliminated on consolidation and consistent accounting policies are used throughout the Group for the purposes of consolidation.
C. GOING CONCERNThe Group's business activities, together with the factors likely to affect its future development, performance and position are set out in the Letter from the Chairman. The Strategic Report and Directors’ Report describe the financial position of the Group; the Group’s objectives, policies and processes for managing its capital; its financial risk management objectives; and its exposure to credit risk and liquidity risk.
As normal, the Company has assessed the appropriateness of accounting on a going concern basis. This has become more relevant given the current economic environment caused by COVID-19. This process involved the review of a forecast for the coming 15 months, along with stress testing a second downside scenario. Both cases showed that the Group has the required resources to operate within its resources during the period.
The Directors believe that the Company has adequate resources to continue trading for the foreseeable future. Accordingly, they continue to adopt the going concern basis in pre-paring the Annual Report and Accounts.
D. NEW STANDARDS, AMENDMENTS AND INTERPRETATIONSThe Company has not adopted any new standards in this financial year. There are other standards in issue, effective in future periods, which are not expected
to have an impact on the Group and therefore have not been included in the list above.
E. PRINCIPAL ACCOUNTING POLICIES
REVENUERevenue is measured at the fair value of the consideration received or receivable and represents amounts receivable for services provided in the normal course of business, net of trade discounts, VAT and other sales related taxes. Where consideration includes financial instruments or other non-cash items, revenue is measured at fair value using an appropriate valuation method. Revenue comprises:i) Income from trading activities;ii) Corporate finance fees and retainers; andiii) Other income, including trading prof-its from short term investments taken as consideration for core services
To determine whether to recognise revenue, the Group follows a 5-step process as follows:i) Identifying the contract with the customer;ii) Identifying the performance obligations;iii) Determining the transaction price;iv) Allocating the transaction price to the performance obligations; andv) Recognising revenue when/as perfor-mance obligation(s) are satisfied
The Group also considers whether it is acting as a principal or an agent for each type of revenue. Revenue is recognised either at a point in time, or over time as the Group satisfies per-formance obligations by transferring the promised services to its customers as described below.
(A) INCOME FROM TRADING ACTIVITIESIncome from trading activities includes commissions from agency dealing which are recognised on trade date. Trading activities also include gains and losses on market making, with trades recognised on trade date, with corresponding financial assets and financial liabilities until trade settlement.
FY 21 Report and Accounts62
Market making positions are revalued to the closing market bid price (long positions) and offer price (short posi-tions) on the London Stock Exchange as appropriate at the period end. Market making revenues consist of the realised and unrealised profits and losses on financial assets and financial liabilities, arrived at after taking into account attributable dividends. Dividend income from investments is recognised when the shareholders’ right to receive pay-ment has been established.
(B) CORPORATE FINANCE FEES AND RETAINERSCorporate finance transaction fees and commission are recognised at a point in time when, under the terms of the con-tract, the conditions have been uncon-ditionally met such that the Company is entitled to the fees specified. Corporate finance retainer fees, including nominat-ed adviser retainer fees, are recognised over time as the services are delivered. (C) OTHER INCOMERevenue also includes the fair value of options and warrants over securities received as consideration for corporate finance services rendered.
Contract costs including commissions and referral fees paid to introducers of business are shown in administrative expenses.
FOREIGN CURRENCYTransactions in foreign currencies are translated into the functional currency at the foreign exchange rate ruling at the date of the transaction. Monetary assets and liabilities denominated in foreign currencies at the balance sheet date are translated at the foreign ex-change rate ruling at that date. Foreign exchange differences arising on trans-lation are recognised in profit or loss.
CLASSIFICATION OF INSTRUMENTS ISSUED BY THE COMPANYInstruments issued by the Company are treated as equity (i.e. forming part of shareholders’ funds) only to the extent that they meet the following two conditions:
i) they include no contractual obligations upon the Company to deliver cash or other financial assets or to exchange financial assets or financial liabilities with another party under conditions that are potentially unfavourable to the Company; andii) where the instrument will or may be settled in the Company’s own equity instruments, it is either a non-derivative that includes no obligation to deliver a variable number of the Company’s own equity instruments or is a derivative that will be settled by the Company exchanging a fixed amount of cash or other financial assets for a fixed number of its own equity instruments.
Financial payments associated with financial instruments that are classified in equity are dividends and are recorded directly in equity.
PROPERTY, PLANT AND EQUIPMENTProperty, plant and equipment are stated at cost less accumulated depreciation. Cost includes the original purchase price of the asset and the costs attributable to bringing the asset to its working con-dition for its intended use.
Where parts of an item of property, plant and equipment have different useful lives, they are accounted for as separate items of property, plant and equipment.
DEPRECIATIONDepreciation is charged to profit or loss on a straight-line basis over the estimated useful lives of each part of an item of property, plant and equipment. Depreciation is provided on the following basis:– Fixtures, fittings and equipment, 3-4 years straight line– Leasehold improvements, Over period of lease
It is assumed that all assets will be used until the end of their economic life.
INVESTMENTSFixed asset investments are investments in subsidiaries and are stated at cost less any accumulated impairment losses. Cost is measure of the fair value of consideration paid for the investment.
INTANGIBLE ASSETSTrademarks, trade names and computer software and are stated at cost net of accumulated amortisation and provision for any impairment in value. Amortisation is provided on the following basis: – Computer software, 2-4 years straight line– Trade names, 10 years straight line– Trademarks, held at cost less any provisions for impairment
Goodwill is recognised on consolidation as the difference between the fair value of identifiable assets and liabilities acquired and the purchase considera-tion. Goodwill has an indefinite life and is assessed for impairment at each reporting date.
IMPAIRMENT OF NON-FINANCIAL ASSETSAt each reporting date, the Group reviews the carrying amounts of its tan-gible and intangible assets to determine whether there is any indication that those assets have suffered an impair-ment loss. If any such indication exists, the recoverable amount, being the higher of value in use and fair value less costs to sell, of the asset is estimated in order to determine the extent of the impairment loss (if any).
Where it is not possible to estimate the recoverable amount of an individual asset, the impairment test is carried out on the smallest group of assets to which it belongs for which there are separately identifiable cash flows; its cash generating units ('CGUs'). Goodwill is allocated on initial recognition to each of the Group's CGUs that are expected to benefit from a business combination that gives rise to the goodwill.
If the recoverable amount of an asset is estimated to be less than the carrying amount, the carrying amount of the asset is reduced to its recoverable amount. Impairment loss is recognised as an expense immediately. Where an impairment loss subsequently reverses, the carrying amount of the asset is increased to the revised estimate of its recoverable amount. The reversal of the impairment loss does not increase
63Financial Statements
the carrying amount of the asset above the carrying amount that would have been determined (net of amortisation or depreciation) had no impairment loss been recognised for the asset in prior years. An impairment loss recognised for goodwill is not reversed.
RETIREMENT BENEFITSThe Company operates a defined contri-bution scheme for UK-based employees. The amount charged to the profit and loss account in respect of pension costs and other post-retirement benefits is the contributions payable in respect of service in the year. Differences between contributions payable during the year and contributions actually paid are shown as either accruals or prepayments in the balance sheet. PROVISIONSA provision is recognised in the balance sheet when the Group has a present legal or constructive obligation as a result of a past event, and it is probable that an outflow of economic benefits will be required to settle the obligation. If the effect is material, provisions are determined by discounting the expected future cash flows at a pre-tax rate that reflects current market assessments of the time value of money and, where ap-propriate, the risks specific to the liability. TAXATIONTax on the profit or loss for the year comprises current and deferred tax. Tax is recognised in profit or loss except to the extent that it relates to items rec-ognised in other comprehensive income or directly in equity, in which case it is recognised in other comprehensive income or in equity, respectively.
Current tax is the expected tax pay-able on the taxable income for the year, using tax rates enacted or substantively enacted at the balance sheet date, and any adjustment to tax payable in respect of previous years.
Deferred tax is provided on tempo-rary differences between the carrying amounts of assets and liabilities for financial reporting purposes and the amounts used for taxation purposes,
except to the extent that it arises on:i) the initial recognition of goodwill;ii) the initial recognition of assets or liabilities that affect neither accounting nor taxable profit other than in a business combination; andiii) differences relating to investments in subsidiaries to the extent that they will probably not reverse in the foresee-able future.
The amount of deferred tax provided is based on the expected manner of realisation or settlement of the carrying amount of assets and liabilities, using tax rates enacted or substantively enacted at the balance sheet date.
A deferred tax asset is recognised only to the extent that it is probable that future taxable profits will be available against which the asset can be utilised.
CASH AND CASH EQUIVALENTSCash and cash equivalents comprise cash balances and call deposits.
FINANCIAL INSTRUMENTS
FINANCIAL ASSETSThe Company’s financial assets com-prise trading investments, derivative financial instruments, trade and other receivables, and cash and cash equi-valents. The classification of financial assets at initial recognition depends upon the purpose for which they are acquired and their characteristics. Financial assets are measured initially at their fair value.
Financial assets held at fair value through profit or loss are held for trading and are acquired principally for selling or repurchasing. These include market making positions valued at the closing market bid price (long positions) or offer price (short positions) at the balance sheet date and presented within current asset investments. The change in the value of investments held for trading is recognised in the profit and loss account. Purchases and sales of invest-ments are recognised on trade date with the associated financial assets and liabilities presented as market making counterparty debtors and creditors up to settlement date.
Non-current financial assets held at fair value through profit or loss are deriv-ative assets comprising equity shares, options and warrants that are initially accounted for and measured at fair value on the date the Group becomes a party to the contractual provisions of the derivative contract and subse-quently measured at fair value. The gain or loss on re-measurement is taken to the income statement within revenue, as part of net trading gains or losses. Fair values are obtained from quoted prices prevailing in active markets, including recent market transactions and valuation techniques including discounted cash flow models and option pricing models as appropriate. The fair values of the warrants are determined using the Black Scholes model. These valuation techniques maximise the use of observable market data, such as the quoted share price. The variables used in the valuation include exercise price, expected life, share price at the date of grant, price volatility, dividend yield and risk-free interest rate. Derivatives are included in assets when their fair value is positive and liabilities when their fair value is negative.
Gains and losses from the financial assets held at fair value through profit and loss are presented within revenue as income from trading activities, or other operating income for trading profit on short-term investments.
Financial assets also include trade and other receivables and cash and cash equivalents. Trade and other receivables are amounts due from customers for services performed in the ordinary course of business. If collection is expected in one year or less (or in the normal operating cycle of the business if longer), they are classified as current assets. If not, they are presented as non-current assets.
Trade and other receivables are initially recorded at fair value and thereafter are measured at amortised cost using the effective interest rate.Impairment provisions for trade receivables are recognised based on the simplified approach within IFRS 9
FY 21 Report and Accounts64
using the lifetime expected credit losses. During this process the probability of the non-payment of trade receivables is assessed. This probability is then multiplied by the amount of the expected loss arising from default to determine the lifetime expected credit loss for the trade receivables. For trade receivables, which are reported net, such provisions are recorded in a separate provision account with the loss being recognised within administrative expenses in the consolidated statement of comprehen-sive income. On confirmation that the trade receivable will not be collectable, the gross carrying value of the asset is written off against the associated provision.
FINANCIAL LIABILITIESThe Group’s financial liabilities comprise trade and other payables including market making counterparty creditors and provisions. The classification of financial liabilities at initial recognition depends upon the purpose for which they are acquired and their characteristics.
Non-derivative financial liabilities are initially recognised at fair value less any directly attributable transaction costs. After initial recognition, these liabilities are measured at amortised cost using the effective interest method. The entities’ borrowings, trade and most other payables fall into this cat-egory of financial instruments. The Group derecog nises a financial liability when its contractual obligations are discharged, cancelled, or expire.
Interest-bearing borrowings are recognised initially at fair value less at-tributable transaction costs. After initial recognition, interest-bearing borrowings are stated at amortised cost with any difference between cost and redemption value being recognised in profit or loss over the period of the borrowings on an effective interest basis.
Trade payables are obligations to pay for goods or services that have been acquired in the ordinary course of business from suppliers and are initially recorded at fair value and thereafter at amortised cost using the effective interest rate method.
SEGMENTAL REPORTINGThe Group is managed as an integrated corporate advisory, M&A advisory and stockbroking business and although there are different revenue streams, the Group’s activities are considered to be subject to similar economic char-acteristics. Consequently, the Group is managed as one business unit which is reported in a manner consistent with the internal reporting to the Board of Directors, which has been identified as the chief operating decision maker. SHARE CAPITALShare capital represents the nominal value of shares that have been issued. SHARE PREMIUMShare premium includes any premiums received on issue of share capital. Any transaction costs associated with the issuing of shares are deducted from share premium. OWN SHARES HELD BY THE FINNCAP LIMITED EMPLOYEE BENEFIT TRUSTTransactions of the Group-sponsored Employee Benefit Trust are treated as being those of the Group and are therefore reflected in these consolidated financial statements. In particular, the Trust’s purchases and sales of shares in the Company are debited and credited to equity.
SHARE-BASED PAYMENTSThe Group operates equity-settled share-based remuneration plans for its employees. None of the Group’s plans are cash-settled. All goods and services received in exchange for the grant of any share-based payment are meas-ured at their fair values using the Black Scholes model.
Where employees are rewarded using share-based payments, the fair value of employees’ services is deter-mined indirectly by reference to the fair value of the equity instruments granted. This fair value is appraised at the grant date and excludes the impact of non-market vesting conditions (for example profitability and sales growth targets and performance conditions).
All share-based remuneration is ulti-mately recognised as an expense in profit or loss with a corresponding credit to equity. Where vesting periods or other vesting conditions apply, the expense is allocated over the vesting period, based on the best available estimate of the number of share options expected to vest.
Non-market vesting conditions are included in assumptions about the number of options that are expected to become exercisable. Estimates are subsequently revised if there is any indication that the number of share options expected to vest differs from previous estimates. Any adjustment to cumulative share-based compensation resulting from a revision is recognised in the current year. The number of vested options ultimately exercised by holders does not impact the expense recorded in any year.
Upon exercise of share options, the proceeds received, net of any directly attributable transaction costs, are allo-cated to share capital up to the nominal (or par) value of the shares issued with any excess being recorded as share premium.
RETAINED EARNINGSRetained earnings includes all current and prior year retained profits and losses.
DIVIDENDSDividends are recognised when they become legally payable. In the case of interim dividends to equity shareholders, this is when declared by the Directors. In the case of final dividends, this is when approved by the shareholders at the AGM.
LEASESAll leases are accounted for by recog-nising a right of use asset and a lease liability except for:– Leases of low value assets; and– Leases with a duration of 12 months or less. Lease liabilities are measured at the present value of the contractual payments due to the lessor over the lease term, with the discount rate
65Financial Statements
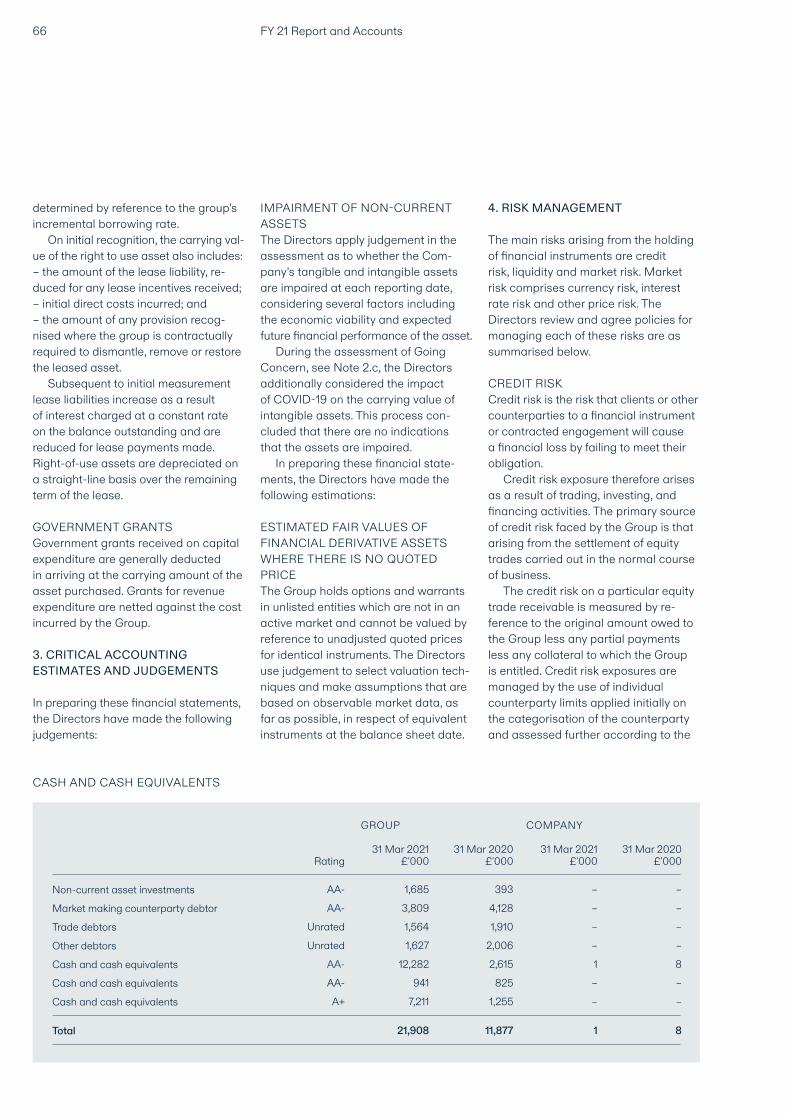
determined by reference to the group’s incremental borrowing rate.
On initial recognition, the carrying val-ue of the right to use asset also includes:– the amount of the lease liability, re-duced for any lease incentives received;– initial direct costs incurred; and– the amount of any provision recog-nised where the group is contractually required to dismantle, remove or restore the leased asset.
Subsequent to initial measurement lease liabilities increase as a result of interest charged at a constant rate on the balance outstanding and are reduced for lease payments made. Right-of-use assets are depreciated on a straight-line basis over the remaining term of the lease.
GOVERNMENT GRANTSGovernment grants received on capital expenditure are generally deducted in arriving at the carrying amount of the asset purchased. Grants for revenue expenditure are netted against the cost incurred by the Group.
3. CRITICAL ACCOUNTING ESTIMATES AND JUDGEMENTS
In preparing these financial statements, the Directors have made the following judgements:
IMPAIRMENT OF NON-CURRENT ASSETSThe Directors apply judgement in the assessment as to whether the Com-pany’s tangible and intangible assets are impaired at each reporting date, considering several factors including the economic viability and expected future financial performance of the asset.
During the assessment of Going Concern, see Note 2.c, the Directors additionally considered the impact of COVID-19 on the carrying value of intangible assets. This process con-cluded that there are no indications that the assets are impaired.
In preparing these financial state-ments, the Directors have made the following estimations:
ESTIMATED FAIR VALUES OF FIN ANCIAL DERIVATIVE ASSETS WHERE THERE IS NO QUOTED PRICEThe Group holds options and warrants in unlisted entities which are not in an active market and cannot be valued by reference to unadjusted quoted prices for identical instruments. The Directors use judgement to select valuation tech-niques and make assumptions that are based on observable market data, as far as possible, in respect of equivalent instruments at the balance sheet date.
4. RISK MANAGEMENT
The main risks arising from the holding of financial instruments are credit risk, liquidity and market risk. Market risk comprises currency risk, interest rate risk and other price risk. The Directors review and agree policies for managing each of these risks are as summarised below.
CREDIT RISKCredit risk is the risk that clients or other counterparties to a financial instrument or contracted engagement will cause a financial loss by failing to meet their obligation.
Credit risk exposure therefore arises as a result of trading, investing, and financing activities. The primary source of credit risk faced by the Group is that arising from the settlement of equity trades carried out in the normal course of business.
The credit risk on a particular equity trade receivable is measured by re-ference to the original amount owed to the Group less any partial payments less any collateral to which the Group is entitled. Credit risk exposures are managed by the use of individual counterparty limits applied initially on the categor isa tion of the counterparty and assessed further according to the
FY 21 Report and Accounts66
Non-current asset investments AA- 1,685 393 – –
Trade debtors Unrated 1,564 1,910 – –
Cash and cash equivalents AA- 12,282 2,615 1 8
Market making counterparty debtor AA- 3,809 4,128 – –
Other debtors Unrated 1,627 2,006 – –
Cash and cash equivalents AA- 941 825 – –
Cash and cash equivalents A+ 7,211 1,255 – –
Rating
GROUP
31 Mar 2021£'000
31 Mar 2020
£'000
COMPANY
31 Mar 2021£'000
31 Mar 2020
£'000
Total 21,908 11,877 1 8
CASH AND CASH EQUIVALENTS
67Financial Statements
results of relevant financial indicators and/or news flow.
Trade receivables relating to fees due on the Group’s corporate finance and advisory activities are monitored on a weekly basis. Formal credit procedures include checking client creditworthiness before starting to trade, approval of material trades and chasing of overdue accounts.
Other debtors consist of deposits held at our agency settlement agent (Persh-ing, a wholly owned subsidiary of Bank of New York Mellon Corporation), employee loans secured by finnCap Group plc shares and s455 tax. These balances are considered low risk and are reviewed on a monthly basis. The Group’s cash and cash equivalents are held with HSBC Bank plc, National Westminster Bank plc and Pershing.
The maximum exposure to credit risk on trade debtors at the end of the reporting period is equal to the balance sheet figure. In addition, the Group has credit risk exposure to the gross value of unsettled trades (on a delivery versus payment basis) at its agency settlement agent, which were £7.3 million (2020: £5.0m) at the balance sheet date. The vast majority are settled within two days.
LIQUIDITY RISKLiquidity risk is the risk that obligations associated with financial liabilities will not be met. The Company monitors its risk to a shortage of funds by consid-ering the maturity of both its financial assets and projected cash flows from operations. The Company’s objective is to maintain adequate cash resources with a material contingency to meet its obligations as they fall due.
The table below analyses the entities’ non-derivative and derivative financial liabilities into relevant maturity groupings based on the remaining period at the balance sheet date to the contractual maturity date. Derivative financial liabil-ities are included in the analysis if their contractual maturities are essential for an understanding of the timing of cash flows. The amounts disclosed in the table are the contractual undiscounted cash flows.
CONTRACTUAL UNDISCOUNTED CASH FLOWS
CURRENCY RISKCurrency risk is the risk that the fair value or future cash flows of a financial instrument will fluctuate because of changes in foreign exchange rates. There are no significant currency risks at the balance sheet date.
INTEREST RATE RISKInterest rate risk is the risk that the fair value or future cash flows of a financial instrument will fluctuate because of changes in market interest rates. There are no significant interest rate risks at the balance sheet date.
OTHER PRICE RISKOther price risk is the risk that the fair value of future cash flows of a financial instrument will fluctuate because of changes in the market prices (other than those arising from interest rate risk or currency risk) whether those changes are caused by factors specific to the in-dividual financial instrument or its issuer or factors affecting all similar financial instruments traded in the market. The Group manages market price risk by monitoring the value of its financial in-struments daily. The risk of future losses is limited to the fair value of investments as at the balance sheet date.
If equity prices had been 10% higher/lower, net profit for the period ended 31 March 2021 would have been £161k higher/lower (2020: £83k higher/lower) due to the change in value of invest-ments held at fair value through the profit and loss. The Group’s exposure to equity price risk is closely monitored by senior management on a daily basis.
As at 31 March 2021Trade and other payables
As at 31 March 2020Trade and other payables
Less than three months£'000
3,718
6,464
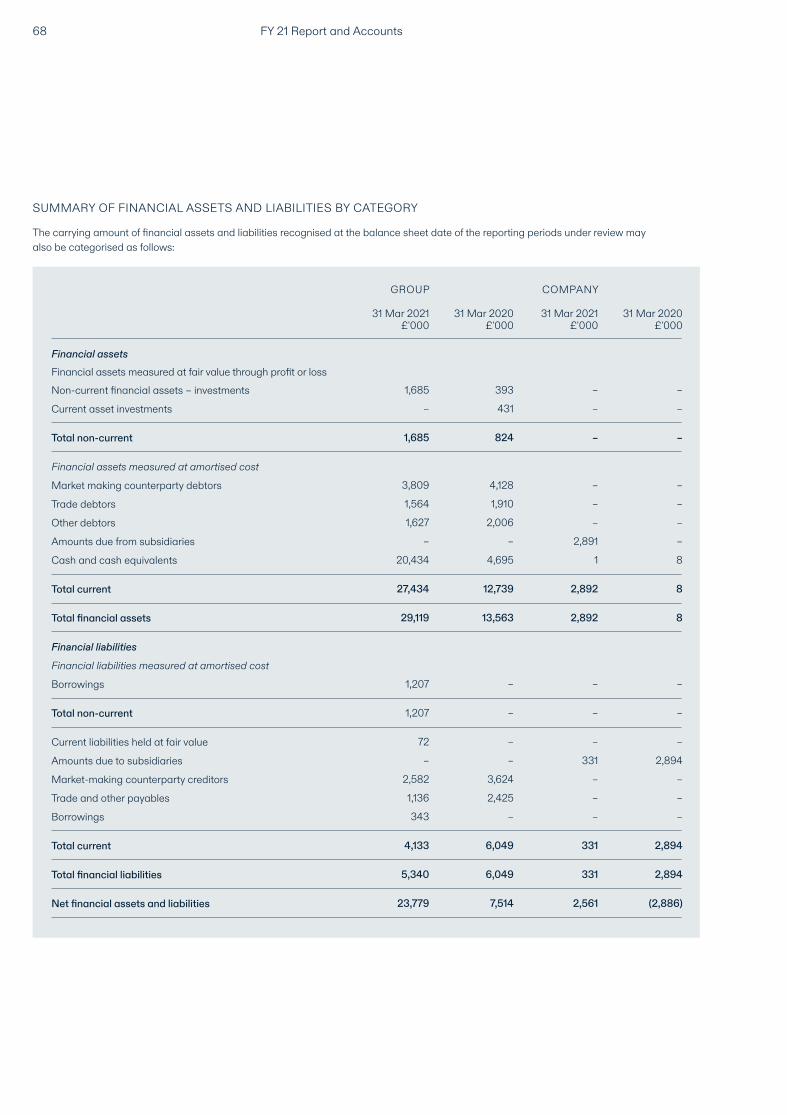
Financial assets
Financial assets measured at amortised cost
Other debtors 1,627 2,006 – –
Market-making counterparty creditors 2,582 3,624 – –
Financial liabilities
Financial assets measured at fair value through profit or loss
Market making counterparty debtors 3,809 4,128 – –
Current liabilities held at fair value 72 – – –
Amounts due from subsidiaries – – 2,891 –
Trade and other payables 1,136 2,425 – –
Financial liabilities measured at amortised cost
Non-current financial assets – investments 1,685 393 – –
Current asset investments – 431 – –
Trade debtors 1,564 1,910 – –
Amounts due to subsidiaries – – 331 2,894
Cash and cash equivalents 20,434 4,695 1 8
Borrowings 343 – – –
Borrowings 1,207 – – –
Total non-current 1,685 824 – –
Total current 27,434 12,739 2,892 8
Total financial assets 29,119 13,563 2,892 8
Total non-current 1,207 – – –
Total current 4,133 6,049 331 2,894
Total financial liabilities 5,340 6,049 331 2,894
Net financial assets and liabilities 23,779 7,514 2,561 (2,886)
GROUP
31 Mar 2021£'000
31 Mar 2020
£'000
COMPANY
31 Mar 2021£'000
31 Mar 2020
£'000
SUMMARY OF FINANCIAL ASSETS AND LIABILITIES BY CATEGORY
The carrying amount of financial assets and liabilities recognised at the balance sheet date of the reporting periods under review may also be categorised as follows:
FY 21 Report and Accounts68
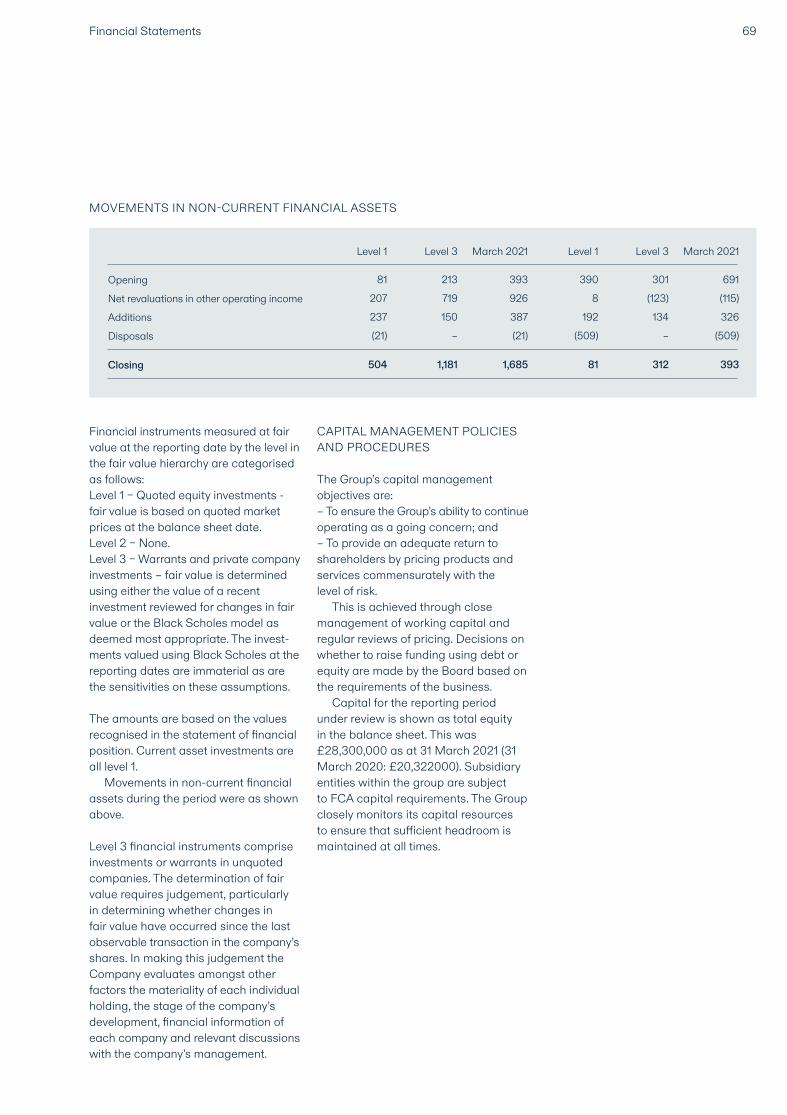
Financial instruments measured at fair value at the reporting date by the level in the fair value hierarchy are categorised as follows:Level 1 – Quoted equity investments - fair value is based on quoted market prices at the balance sheet date.Level 2 – None.Level 3 – Warrants and private company investments – fair value is determined using either the value of a recent in vestment reviewed for changes in fair value or the Black Scholes model as deemed most appropriate. The invest-ments valued using Black Scholes at the reporting dates are immaterial as are the sensitivities on these assumptions.
The amounts are based on the values recognised in the statement of financial position. Current asset investments are all level 1.
Movements in non-current financial assets during the period were as shown above.
Level 3 financial instruments comprise investments or warrants in unquoted companies. The determination of fair value requires judgement, particularly in determining whether changes in fair value have occurred since the last observable transaction in the company’s shares. In making this judgement the Company evaluates amongst other factors the materiality of each individual holding, the stage of the company’s development, financial information of each company and relevant discussions with the company’s management.
CAPITAL MANAGEMENT POLICIES AND PROCEDURES
The Group’s capital management objectives are:– To ensure the Group’s ability to continue operating as a going concern; and– To provide an adequate return to shareholders by pricing products and services commensurately with the level of risk.
This is achieved through close management of working capital and regular reviews of pricing. Decisions on whether to raise funding using debt or equity are made by the Board based on the requirements of the business.
Capital for the reporting period under review is shown as total equity in the balance sheet. This was £28,300,000 as at 31 March 2021 (31 March 2020: £20,322000). Subsidiary entities within the group are subject to FCA capital requirements. The Group closely monitors its capital resources to ensure that sufficient headroom is maintained at all times.
Opening 81 213 393 390 301 691
237 150 387 192 134 326Additions
207 719 926 8 (123) (115)Net revaluations in other operating income
(21) – (21) (509) – (509)Disposals
Level 1 Level 3 March 2021 Level 1 Level 3 March 2021
504 1,181 1,685 81 312 393Closing
69Financial Statements
MOVEMENTS IN NON-CURRENT FINANCIAL ASSETS
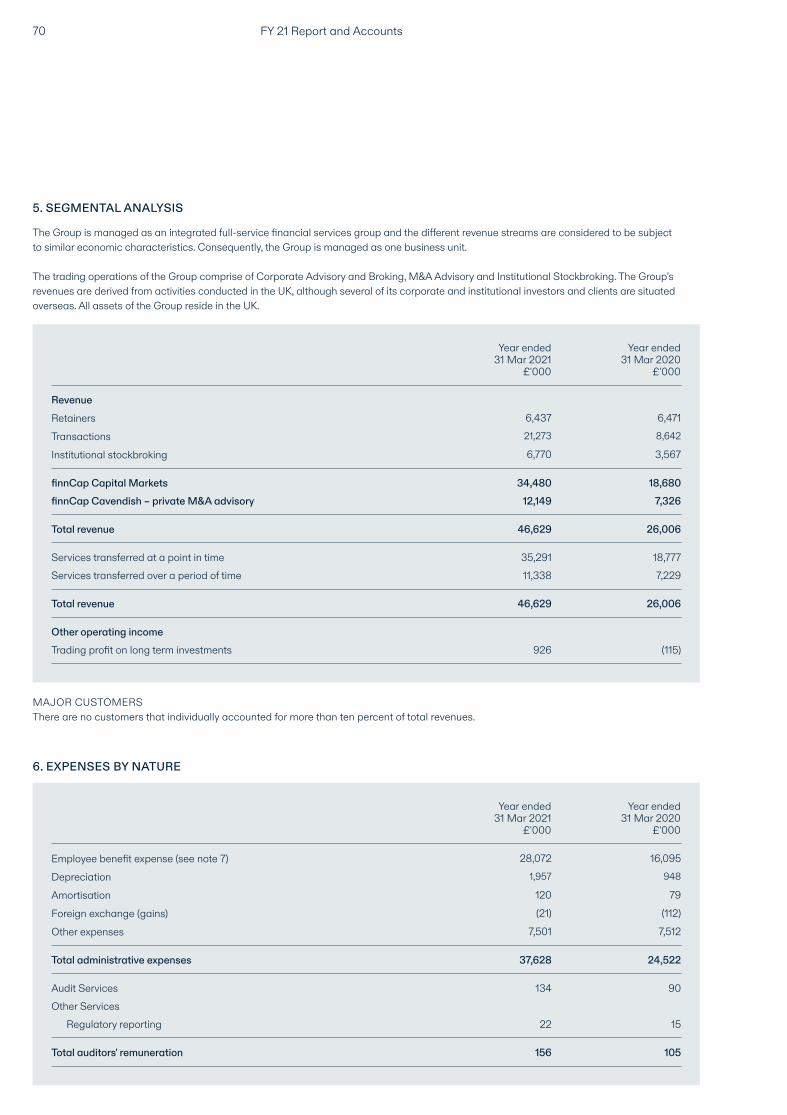
FY 21 Report and Accounts70
MAJOR CUSTOMERS There are no customers that individually accounted for more than ten percent of total revenues.
6. EXPENSES BY NATURE
Depreciation 1,957 948
Employee benefit expense (see note 7) 28,072 16,095
Amortisation 120 79
Foreign exchange (gains) (21) (112)
Other expenses 7,501 7,512
Total administrative expenses 37,628 24,522
Audit Services 134 90Other Services
Total auditors' remuneration 156 105
Year ended31 Mar 2021
£'000
Year ended31 Mar 2020
£'000
Regulatory reporting 22 15
Revenue
Transactions 21,273 8,642
Retainers 6,437 6,471
Institutional stockbroking 6,770 3,567
finnCap Capital Markets 34,480 18,680finnCap Cavendish – private M&A advisory 12,149 7,326
Total revenue 46,629 26,006
Services transferred at a point in time 35,291 18,777
Other operating income
Services transferred over a period of time 11,338 7,229
Total revenue 46,629 26,006
Year ended31 Mar 2021
£'000
Year ended31 Mar 2020
£'000
Trading profit on long term investments 926 (115)
5. SEGMENTAL ANALYSIS
The Group is managed as an integrated full-service financial services group and the different revenue streams are considered to be subject to similar economic characteristics. Consequently, the Group is managed as one business unit.
The trading operations of the Group comprise of Corporate Advisory and Broking, M&A Advisory and Institutional Stockbroking. The Group’s revenues are derived from activities conducted in the UK, although several of its corporate and institutional investors and clients are situated overseas. All assets of the Group reside in the UK.
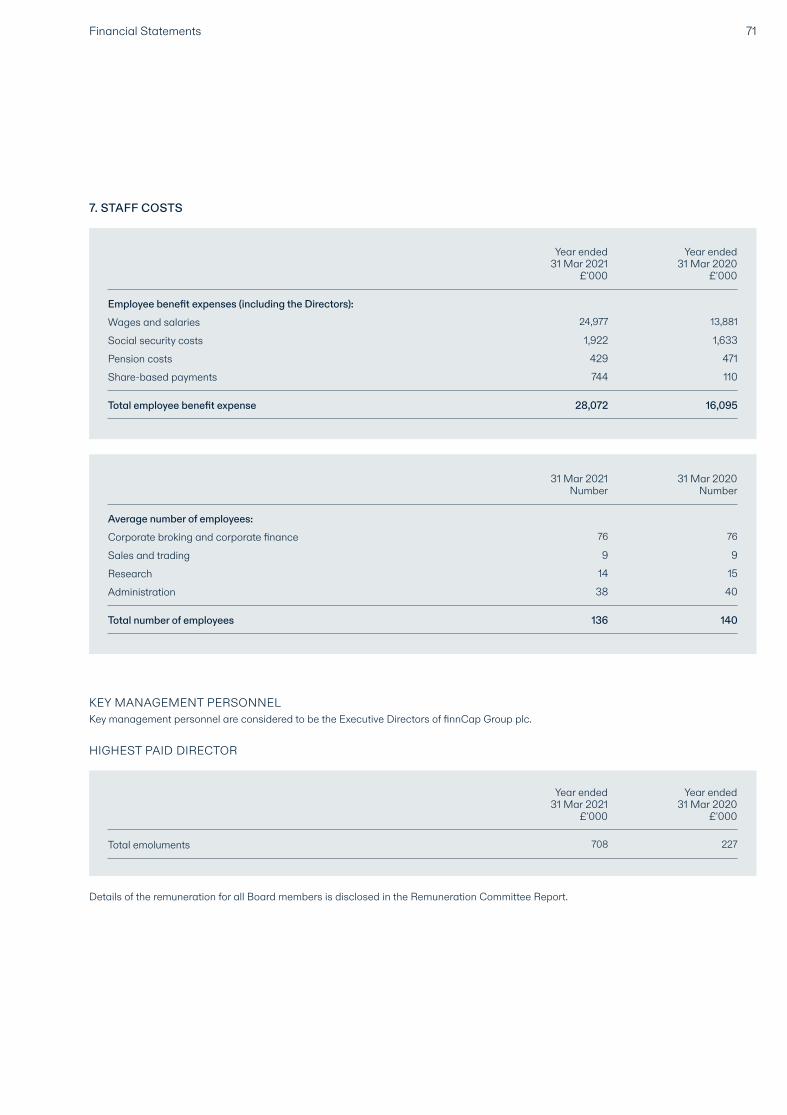
71Financial Statements
KEY MANAGEMENT PERSONNELKey management personnel are considered to be the Executive Directors of finnCap Group plc.
HIGHEST PAID DIRECTOR
Details of the remuneration for all Board members is disclosed in the Remuneration Committee Report.
7. STAFF COSTS
Employee benefit expenses (including the Directors):
Year ended31 Mar 2021
£'000
Year ended31 Mar 2020
£'000
Wages and salaries 24,977 13,881
Social security costs 1,922 1,633
Pension costs 429 471
Share-based payments 744 110
Total employee benefit expense 28,072 16,095
Corporate broking and corporate finance 76 76
Average number of employees:
Sales and trading 9 9
Research 14 15
Administration 38 40
Total number of employees 136 140
31 Mar 2021Number
31 Mar 2020Number
Total emoluments 708 227
Year ended31 Mar 2021
£'000
Year ended31 Mar 2020
£'000
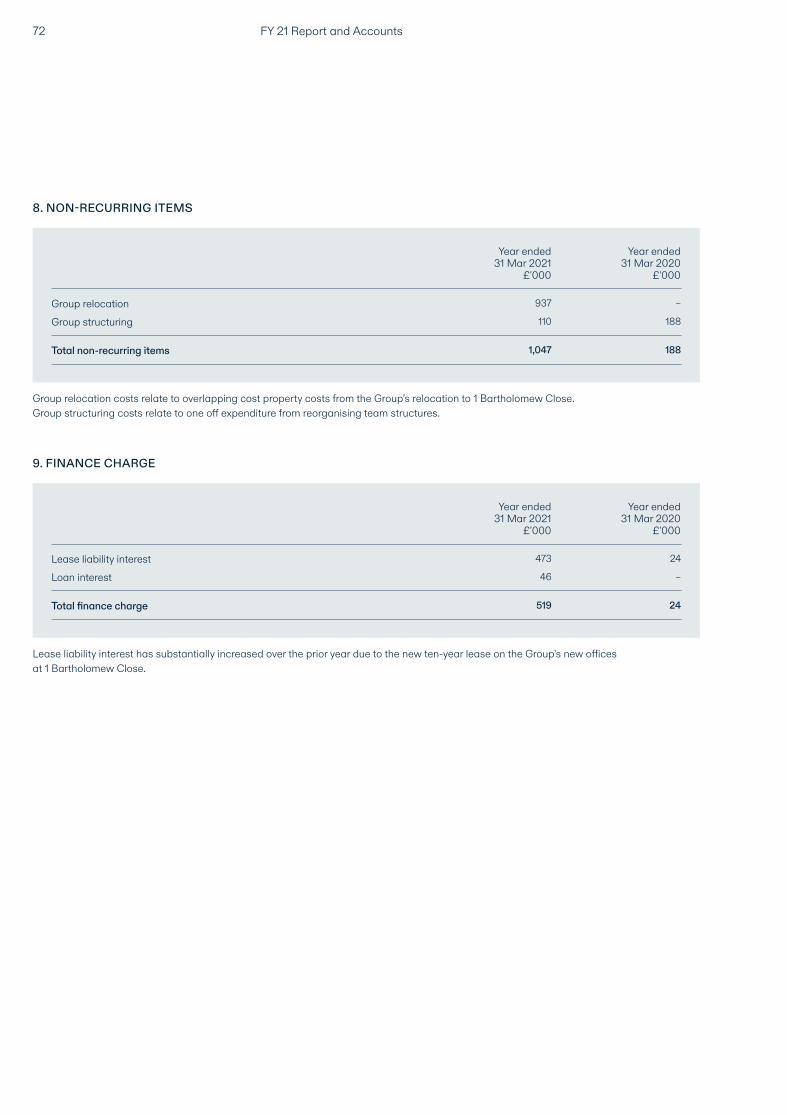
FY 21 Report and Accounts72
8. NON-RECURRING ITEMS
9. FINANCE CHARGE
Group relocation 937 –
Group structuring 110 188
Total non-recurring items 1,047 188
Year ended31 Mar 2021
£'000
Year ended31 Mar 2020
£'000
Lease liability interest 473 24
Loan interest 46 –
Total finance charge 519 24
Year ended31 Mar 2021
£'000
Year ended31 Mar 2020
£'000
Group relocation costs relate to overlapping cost property costs from the Group’s relocation to 1 Bartholomew Close.Group structuring costs relate to one off expenditure from reorganising team structures.
Lease liability interest has substantially increased over the prior year due to the new ten-year lease on the Group’s new offices at 1 Bartholomew Close.
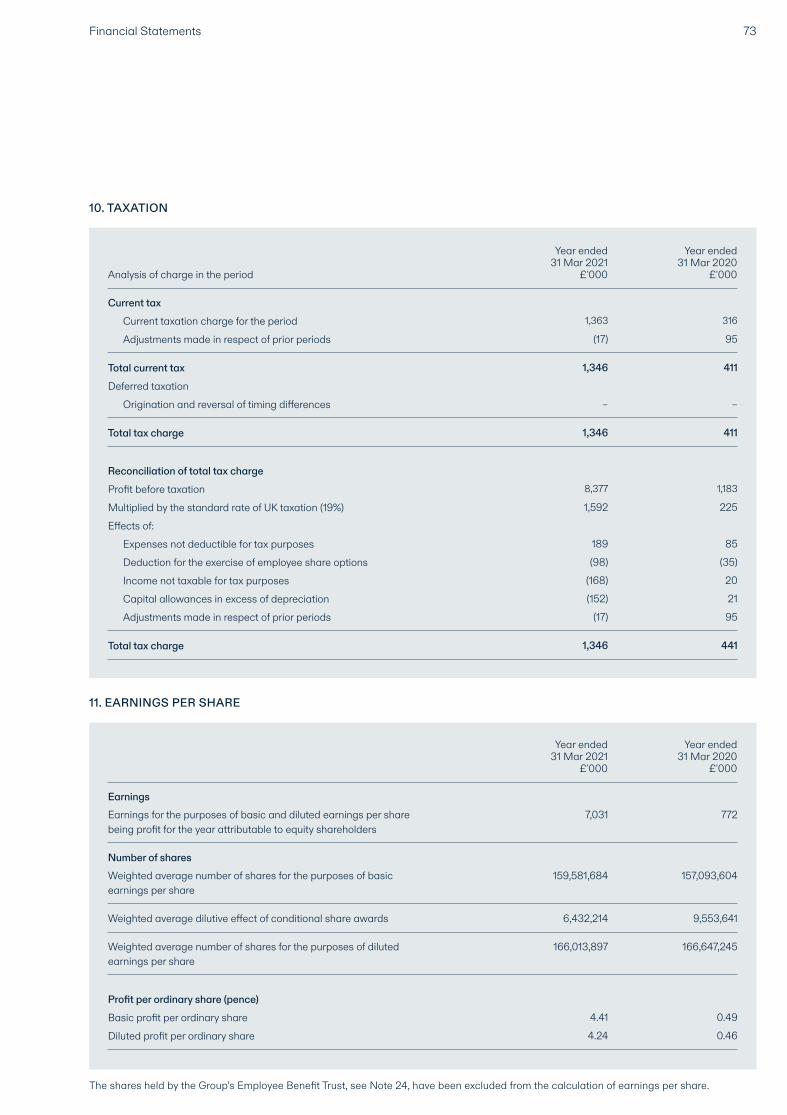
73Financial Statements
10. TAXATION
11. EARNINGS PER SHARE
Current taxation charge for the period 1,363 316
Current tax
Adjustments made in respect of prior periods (17) 95
Total current tax 1,346 411Deferred taxation
Origination and reversal of timing differences – –
Total tax charge 1,346 411
Year ended31 Mar 2021
£'000
Year ended31 Mar 2020
£'000Analysis of charge in the period
Total tax charge 1,346 441
Effects of:Expenses not deductible for tax purposes 189 85
Income not taxable for tax purposes (168) 20
Adjustments made in respect of prior periods (17) 95
Deduction for the exercise of employee share options (98) (35)
Capital allowances in excess of depreciation (152) 21
Profit before taxation 8,377 1,183
Multiplied by the standard rate of UK taxation (19%) 1,592 225
Reconciliation of total tax charge
Earnings for the purposes of basic and diluted earnings per share being profit for the year attributable to equity shareholders
Weighted average number of shares for the purposes of basic earnings per share
Weighted average dilutive effect of conditional share awards
Weighted average number of shares for the purposes of diluted earnings per share
7,031 772Earnings
Number of shares159,581,684 157,093,604
6,432,214 9,553,641
166,013,897 166,647,245
Year ended31 Mar 2021
£'000
Year ended31 Mar 2020
£'000
Basic profit per ordinary share 4.41 0.49
Diluted profit per ordinary share 4.24 0.46
Profit per ordinary share (pence)
The shares held by the Group’s Employee Benefit Trust, see Note 24, have been excluded from the calculation of earnings per share.
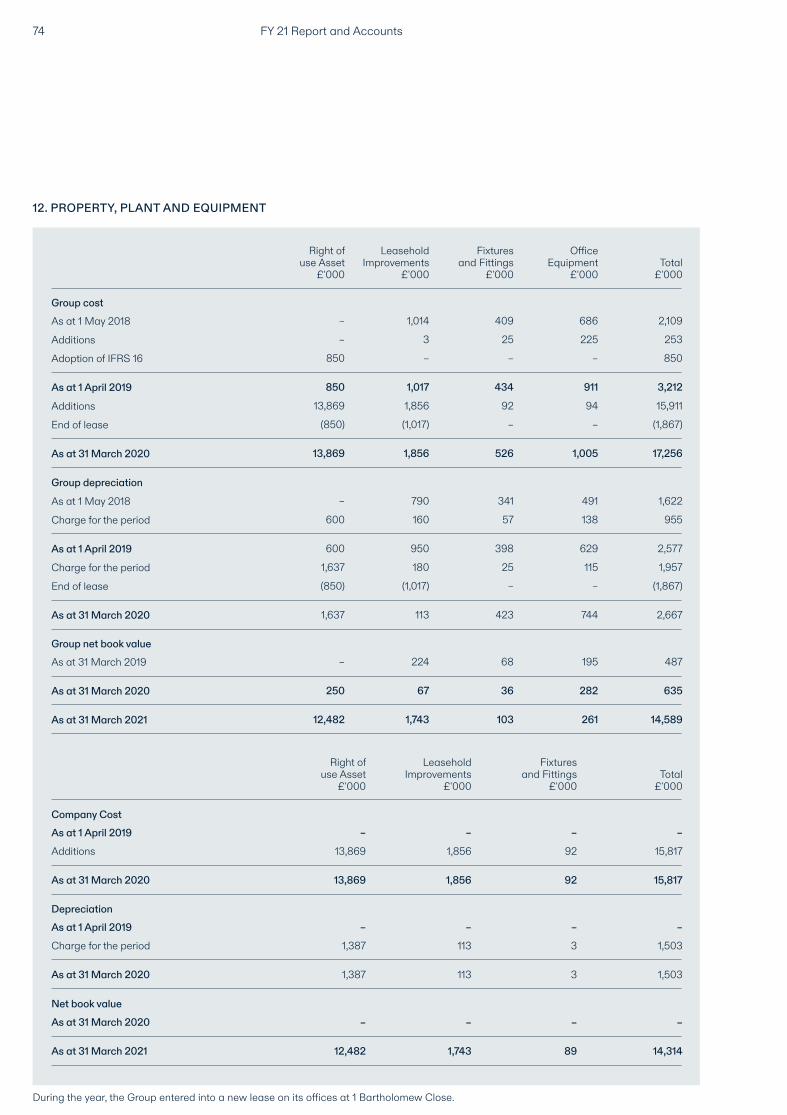
Group cost
Additions – 3 25 225 253
Adoption of IFRS 16 850 – – – 850
As at 1 May 2018 – 1,014 409 686 2,109
As at 1 April 2019 850 1,017 434 911 3,212
Additions 13,869 1,856 92 94 15,911
As at 31 March 2020 13,869 1,856 526 1,005 17,256
As at 1 May 2018 – 790 341 491 1,622
As at 1 April 2019 600 950 398 629 2,577
End of lease (850) (1,017) – – (1,867)
End of lease (850) (1,017) – – (1,867)
As at 31 March 2020 1,637 113 423 744 2,667
Group net book valueAs at 31 March 2019 – 224 68 195 487
As at 31 March 2020 250 67 36 282 635
As at 31 March 2021 12,482 1,743 103 261 14,589
Group depreciation
Charge for the period 600 160 57 138 955
Charge for the period 1,637 180 25 115 1,957
Right ofuse Asset
£'000
LeaseholdImprovements
£'000
Fixturesand Fittings
£'000
OfficeEquipment
£'000Total
£'000
Company Cost
Depreciation
As at 1 April 2019 – – – –
As at 1 April 2019 – – – –
Additions 13,869 1,856 92 15,817
Charge for the period 1,387 113 3 1,503
As at 31 March 2020 13,869 1,856 92 15,817
As at 31 March 2020 1,387 113 3 1,503
Right ofuse Asset
£'000
LeaseholdImprovements
£'000
Fixturesand Fittings
£'000Total
£'000
Net book valueAs at 31 March 2020 – – – –
As at 31 March 2021 12,482 1,743 89 14,314
12. PROPERTY, PLANT AND EQUIPMENT
FY 21 Report and Accounts74
During the year, the Group entered into a new lease on its offices at 1 Bartholomew Close.
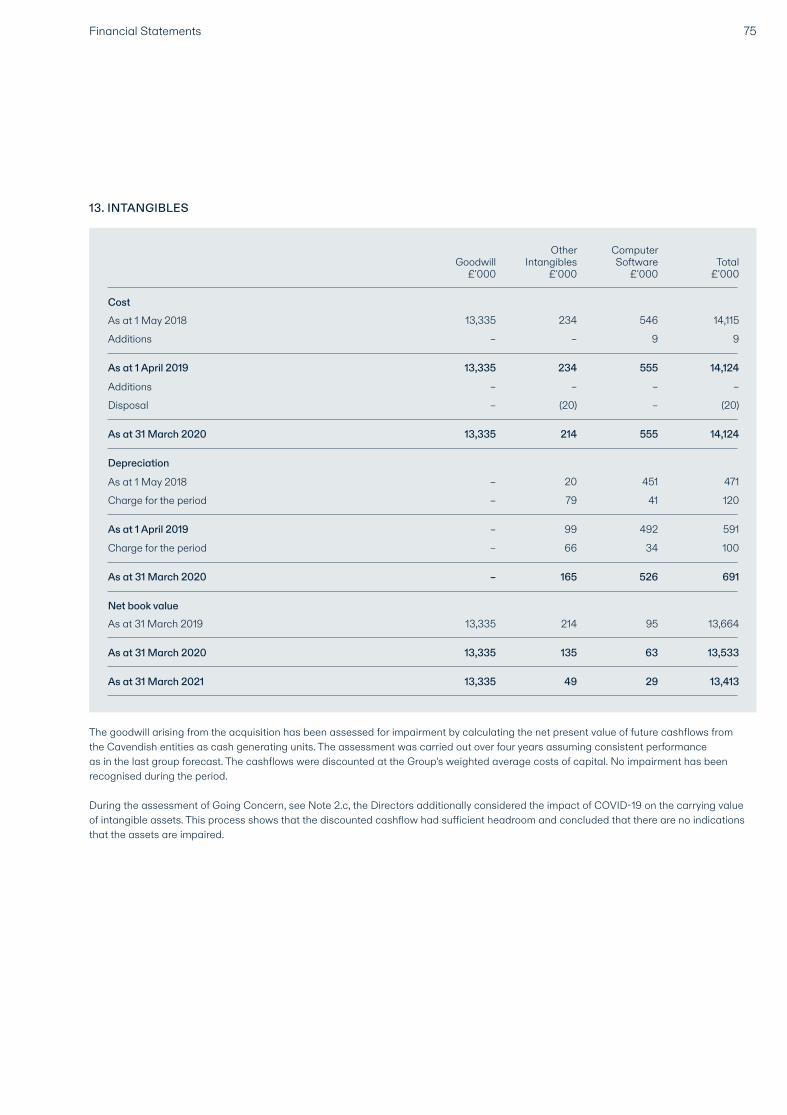
13. INTANGIBLES
CostAs at 1 May 2018 13,335 234 546 14,115
Additions – – – –
As at 1 May 2018 – 20 451 471
Additions – – 9 9
Disposal – (20) – (20)
Charge for the period – 79 41 120
Charge for the period – 66 34 100
As at 1 April 2019 13,335 234 555 14,124
Depreciation
As at 31 March 2020 13,335 214 555 14,124
As at 31 March 2020 – 165 526 691
As at 1 April 2019 – 99 492 591
Goodwill£'000
OtherIntangibles
£'000
ComputerSoftware
£'000Total
£'000
As at 31 March 2019 13,335 214 95 13,664Net book value
As at 31 March 2020 13,335 135 63 13,533
As at 31 March 2021 13,335 49 29 13,413
The goodwill arising from the acquisition has been assessed for impairment by calculating the net present value of future cashflows from the Cavendish entities as cash generating units. The assessment was carried out over four years assuming consistent performance as in the last group forecast. The cashflows were discounted at the Group’s weighted average costs of capital. No impairment has been recognised during the period.
During the assessment of Going Concern, see Note 2.c, the Directors additionally considered the impact of COVID-19 on the carrying value of intangible assets. This process shows that the discounted cashflow had sufficient headroom and concluded that there are no indications that the assets are impaired.
75Financial Statements
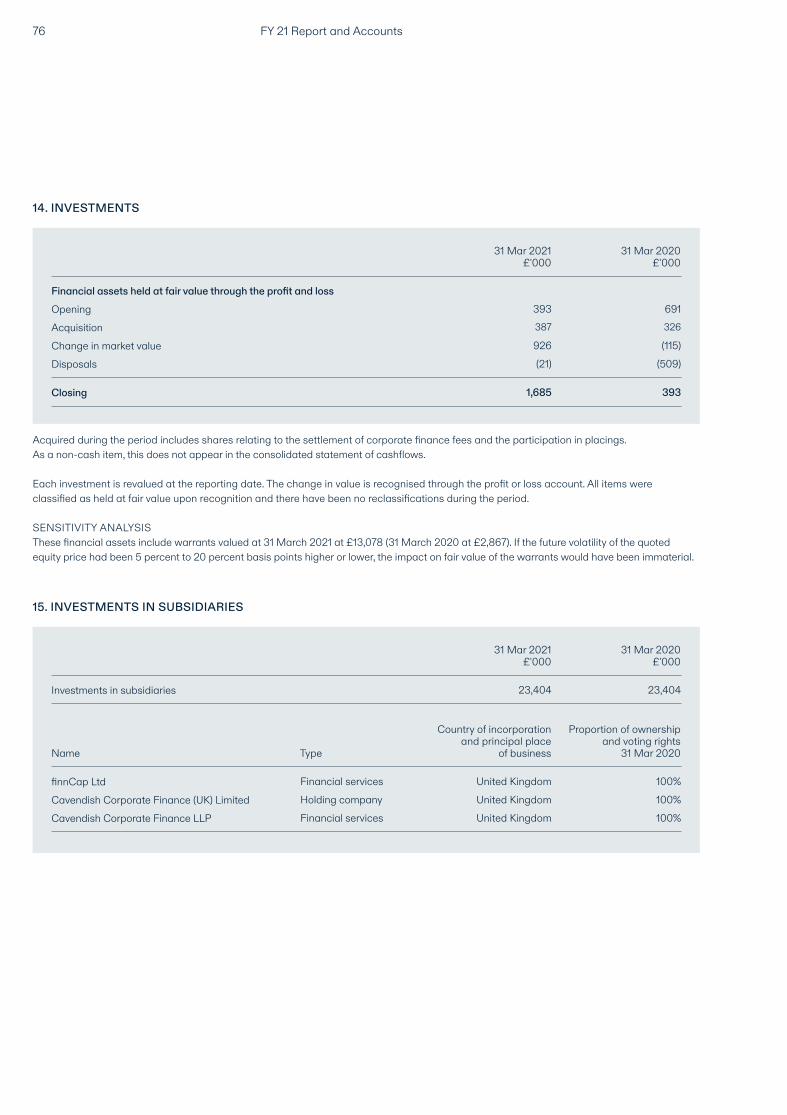
14. INVESTMENTS
15. INVESTMENTS IN SUBSIDIARIES
FY 21 Report and Accounts76
Financial assets held at fair value through the profit and loss
Acquisition 387 326
Opening 393 691
Change in market value 926 (115)
Disposals (21) (509)
Closing 1,685 393
31 Mar 2021£'000
31 Mar 2020£'000
Investments in subsidiaries 23,404 23,404
31 Mar 2021£'000
31 Mar 2020£'000
Acquired during the period includes shares relating to the settlement of corporate finance fees and the participation in placings. As a non-cash item, this does not appear in the consolidated statement of cashflows.
Each investment is revalued at the reporting date. The change in value is recognised through the profit or loss account. All items were classified as held at fair value upon recognition and there have been no reclassifications during the period.
SENSITIVITY ANALYSISThese financial assets include warrants valued at 31 March 2021 at £13,078 (31 March 2020 at £2,867). If the future volatility of the quoted equity price had been 5 percent to 20 percent basis points higher or lower, the impact on fair value of the warrants would have been immaterial.
finnCap Ltd Financial services United Kingdom 100%
Cavendish Corporate Finance (UK) Limited Holding company United Kingdom 100%
Cavendish Corporate Finance LLP Financial services United Kingdom 100%
Type
Country of incorporationand principal place
of business
Proportion of ownership and voting rights
31 Mar 2020Name
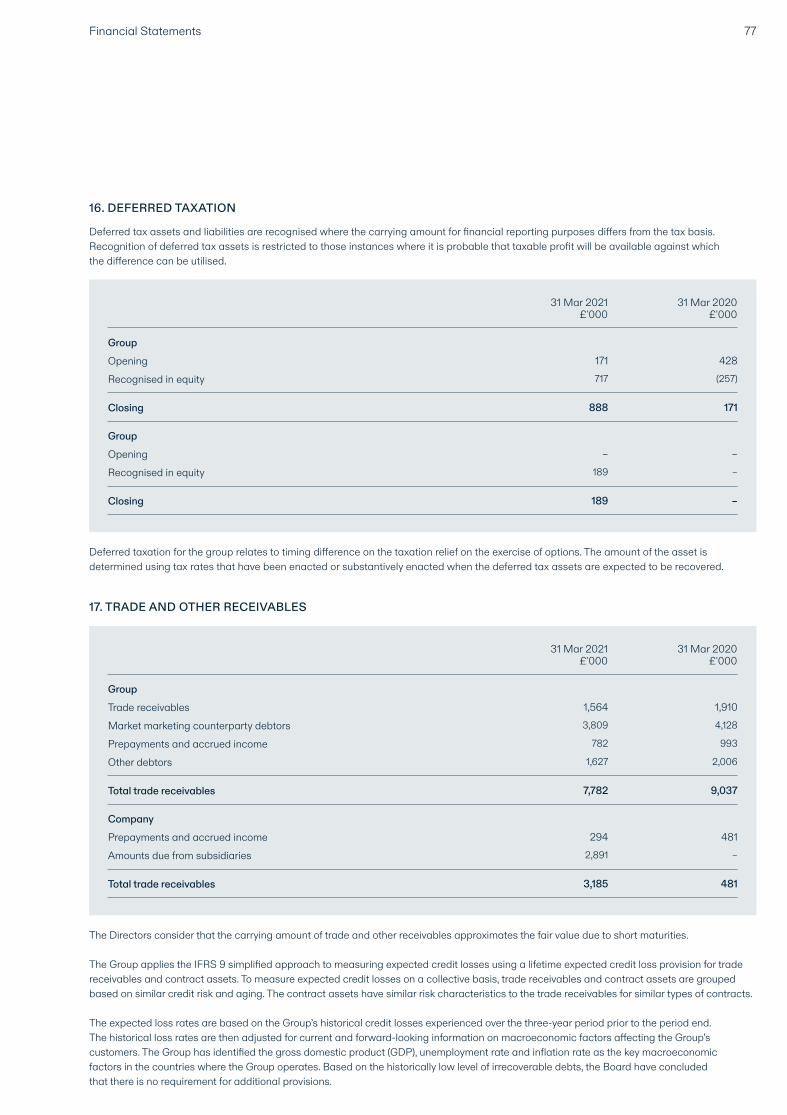
16. DEFERRED TAXATION
17. TRADE AND OTHER RECEIVABLES
77Financial Statements
Group
Group
Recognised in equity 717 (257)
Recognised in equity 189 –
Opening 171 428
Opening – –
Closing 888 171
Closing 189 –
31 Mar 2021£'000
31 Mar 2020£'000
Group
Company
Market marketing counterparty debtors 3,809 4,128
Amounts due from subsidiaries 2,891 –
Other debtors 1,627 2,006
Prepayments and accrued income 782 993
Trade receivables 1,564 1,910
Prepayments and accrued income 294 481
Total trade receivables 7,782 9,037
Total trade receivables 3,185 481
31 Mar 2021£'000
31 Mar 2020£'000
Deferred tax assets and liabilities are recognised where the carrying amount for financial reporting purposes differs from the tax basis. Recognition of deferred tax assets is restricted to those instances where it is probable that taxable profit will be available against which the difference can be utilised.
Deferred taxation for the group relates to timing difference on the taxation relief on the exercise of options. The amount of the asset is determined using tax rates that have been enacted or substantively enacted when the deferred tax assets are expected to be recovered.
The Directors consider that the carrying amount of trade and other receivables approximates the fair value due to short maturities.
The Group applies the IFRS 9 simplified approach to measuring expected credit losses using a lifetime expected credit loss provision for trade receivables and contract assets. To measure expected credit losses on a collective basis, trade receivables and contract assets are grouped based on similar credit risk and aging. The contract assets have similar risk characteristics to the trade receivables for similar types of contracts.
The expected loss rates are based on the Group’s historical credit losses experienced over the three-year period prior to the period end. The historical loss rates are then adjusted for current and forward-looking information on macroeconomic factors affecting the Group’s customers. The Group has identified the gross domestic product (GDP), unemployment rate and inflation rate as the key macroeconomic factors in the countries where the Group operates. Based on the historically low level of irrecoverable debts, the Board have concluded that there is no requirement for additional provisions.
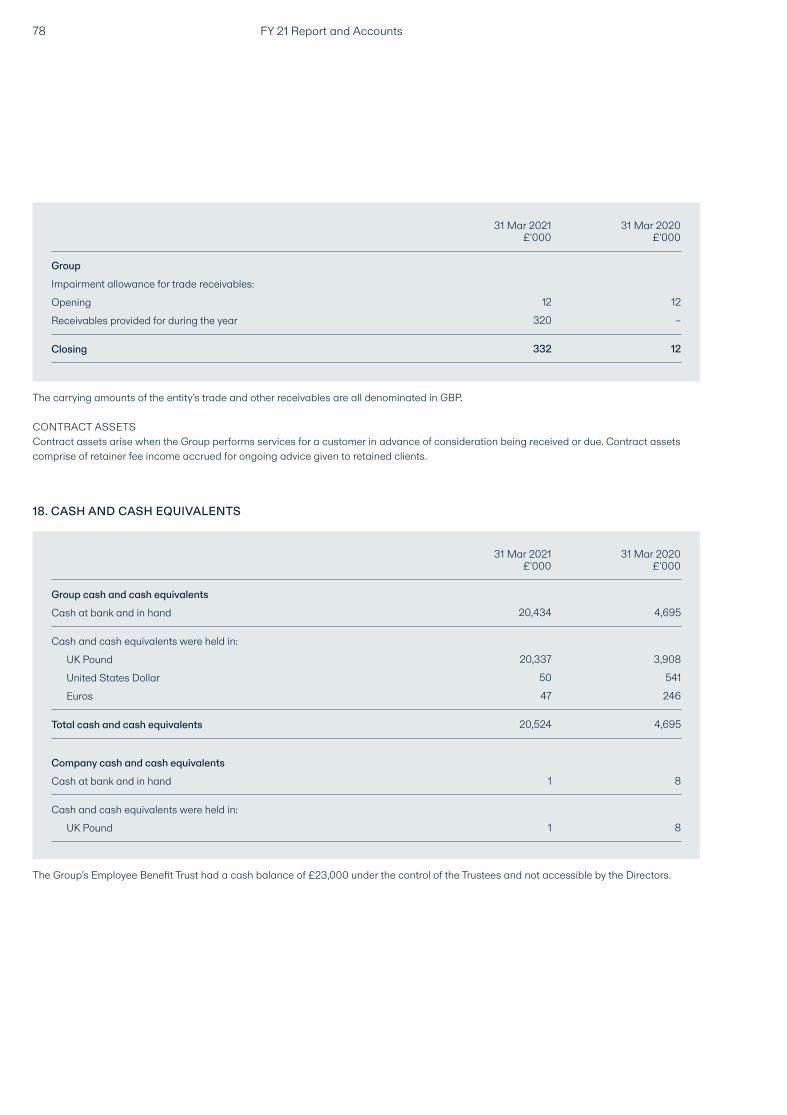
FY 21 Report and Accounts78
Group
Opening 12 12Impairment allowance for trade receivables:
Receivables provided for during the year 320 –
Closing 332 12
31 Mar 2021£'000
31 Mar 2020£'000
The carrying amounts of the entity’s trade and other receivables are all denominated in GBP.
CONTRACT ASSETSContract assets arise when the Group performs services for a customer in advance of consideration being received or due. Contract assets comprise of retainer fee income accrued for ongoing advice given to retained clients.
The Group’s Employee Benefit Trust had a cash balance of £23,000 under the control of the Trustees and not accessible by the Directors.
18. CASH AND CASH EQUIVALENTS
Group cash and cash equivalents
Total cash and cash equivalents 20,524 4,695
UK Pound 20,337 3,908
Cash at bank and in hand 20,434 4,695
United States Dollar 50 541
Euros 47 246
Cash and cash equivalents were held in:
31 Mar 2021£'000
31 Mar 2020£'000
Company cash and cash equivalents
UK Pound 1 8
Cash at bank and in hand 1 8
Cash and cash equivalents were held in:
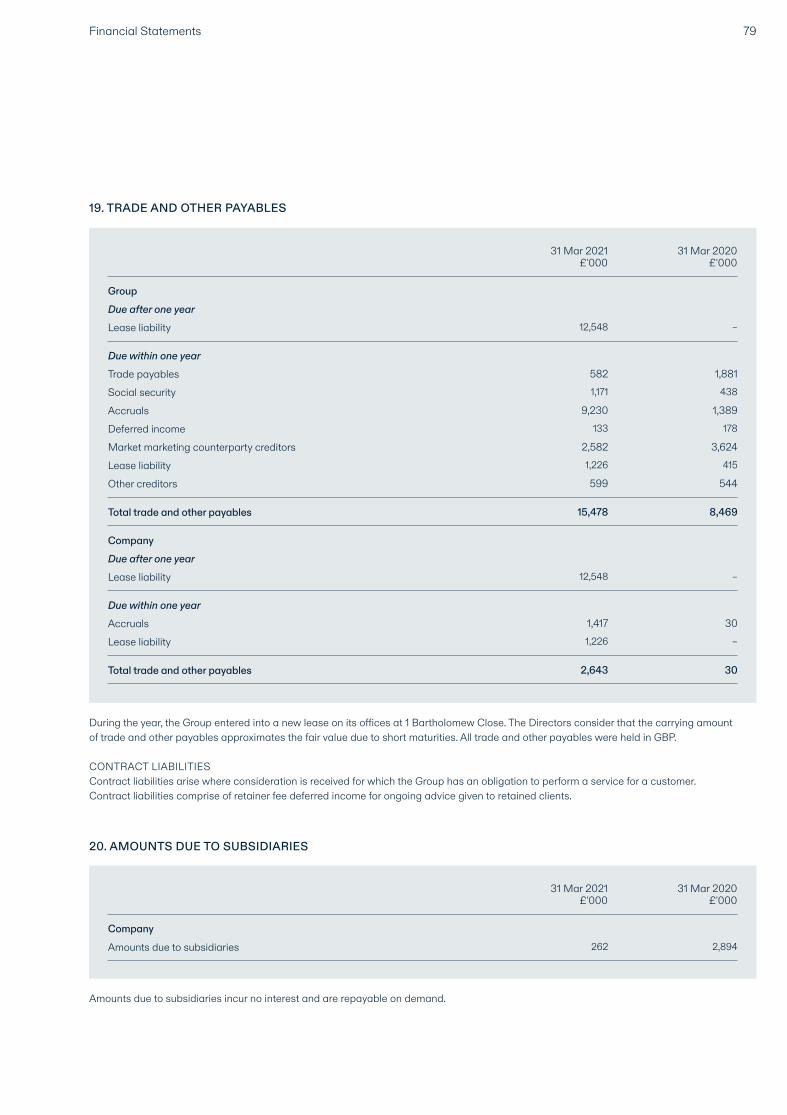
79Financial Statements
19. TRADE AND OTHER PAYABLES
20. AMOUNTS DUE TO SUBSIDIARIES
Group
Lease liability 12,548 –
Due after one year
31 Mar 2021£'000
31 Mar 2020£'000
Company
Due within one year
Due within one year
Lease liability 12,548 –
Lease liability 1,226 –
Social security 1,171 438
Lease liability 1,226 415
Deferred income 133 178
Due after one year
Accruals 1,417 30
Trade payables 582 1,881
Market marketing counterparty creditors 2,582 3,624
Accruals 9,230 1,389
Other creditors 599 544
Total trade and other payables 15,478 8,469
Total trade and other payables 2,643 30
During the year, the Group entered into a new lease on its offices at 1 Bartholomew Close. The Directors consider that the carrying amount of trade and other payables approximates the fair value due to short maturities. All trade and other payables were held in GBP. CONTRACT LIABILITIESContract liabilities arise where consideration is received for which the Group has an obligation to perform a service for a customer. Contract liabilities comprise of retainer fee deferred income for ongoing advice given to retained clients.
Amounts due to subsidiaries incur no interest and are repayable on demand.
Company
31 Mar 2021£'000
31 Mar 2020£'000
Amounts due to subsidiaries 262 2,894
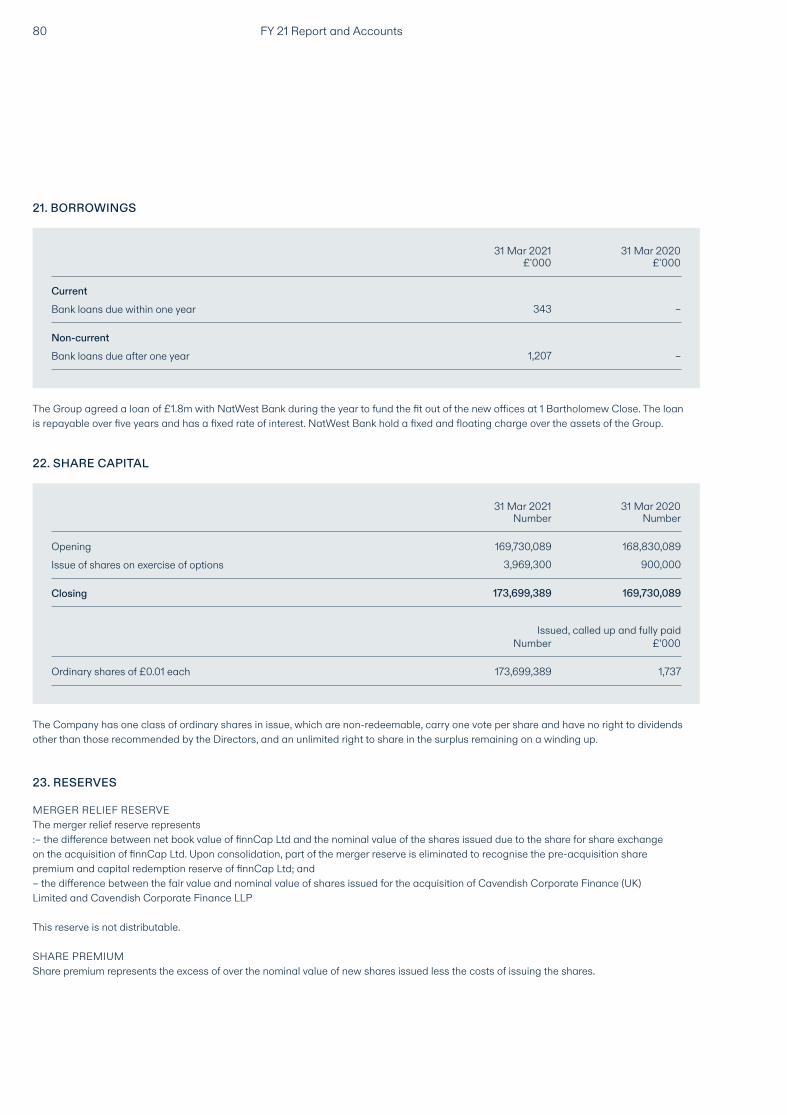
21. BORROWINGS
22. SHARE CAPITAL
CurrentBank loans due within one year 343 –
Bank loans due after one year 1,207 –Non-current
31 Mar 2021£'000
31 Mar 2020£'000
Issue of shares on exercise of options 3,969,300 900,000
173,699,389 169,730,089Closing
31 Mar 2021Number
31 Mar 2020Number
The Group agreed a loan of £1.8m with NatWest Bank during the year to fund the fit out of the new offices at 1 Bartholomew Close. The loan is repayable over five years and has a fixed rate of interest. NatWest Bank hold a fixed and floating charge over the assets of the Group.
The Company has one class of ordinary shares in issue, which are non-redeemable, carry one vote per share and have no right to dividends other than those recommended by the Directors, and an unlimited right to share in the surplus remaining on a winding up.
MERGER RELIEF RESERVEThe merger relief reserve represents:– the difference between net book value of finnCap Ltd and the nominal value of the shares issued due to the share for share exchange on the acquisition of finnCap Ltd. Upon consolidation, part of the merger reserve is eliminated to recognise the pre-acquisition share premium and capital redemption reserve of finnCap Ltd; and– the difference between the fair value and nominal value of shares issued for the acquisition of Cavendish Corporate Finance (UK) Limited and Cavendish Corporate Finance LLP
This reserve is not distributable.
SHARE PREMIUMShare premium represents the excess of over the nominal value of new shares issued less the costs of issuing the shares.
Opening 169,730,089 168,830,089
23. RESERVES
Number £’000
Ordinary shares of £0.01 each 173,699,389 1,737
Issued, called up and fully paid
FY 21 Report and Accounts80
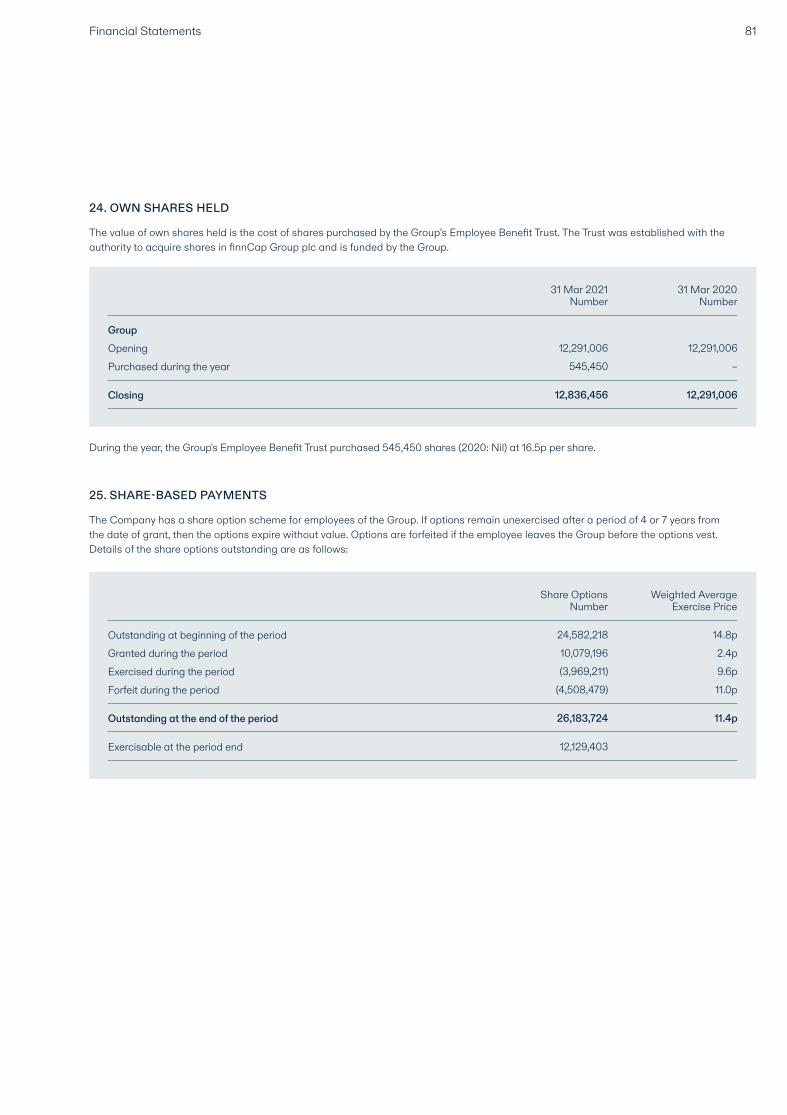
24. OWN SHARES HELD
25. SHARE-BASED PAYMENTS
Purchased during the year 545,450 –
Closing 12,836,456 12,291,006
Opening 12,291,006 12,291,006Group
31 Mar 2021Number
31 Mar 2020Number
Granted during the period 10,079,196 2.4p
Forfeit during the period (4,508,479) 11.0p
Outstanding at the end of the period 26,183,724 11.4p
Outstanding at beginning of the period 24,582,218 14.8p
Exercised during the period (3,969,211) 9.6p
Exercisable at the period end 12,129,403
Share OptionsNumber
Weighted AverageExercise Price
During the year, the Group's Employee Benefit Trust purchased 545,450 shares (2020: Nil) at 16.5p per share.
The value of own shares held is the cost of shares purchased by the Group’s Employee Benefit Trust. The Trust was established with the authority to acquire shares in finnCap Group plc and is funded by the Group.
The Company has a share option scheme for employees of the Group. If options remain unexercised after a period of 4 or 7 years from the date of grant, then the options expire without value. Options are forfeited if the employee leaves the Group before the options vest. Details of the share options outstanding are as follows:
81Financial Statements
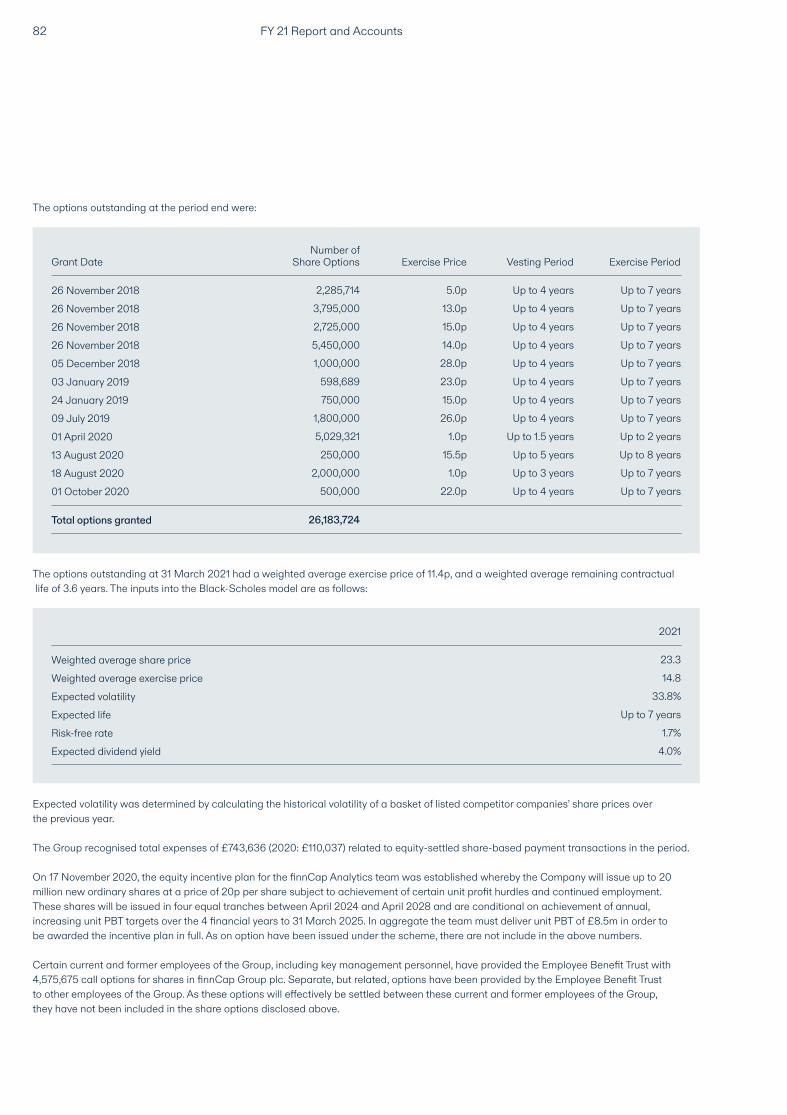
26 November 2018 3,795,000 13.0p Up to 4 years Up to 7 years
26 November 2018 5,450,000 14.0p Up to 4 years Up to 7 years
26 November 2018 2,285,714 5.0p Up to 4 years Up to 7 years
26 November 2018 2,725,000 15.0p Up to 4 years Up to 7 years
03 January 2019 598,689 23.0p Up to 4 years Up to 7 years
09 July 2019 1,800,000 26.0p Up to 4 years Up to 7 years
05 December 2018 1,000,000 28.0p Up to 4 years Up to 7 years
24 January 2019 750,000 15.0p Up to 4 years Up to 7 years
13 August 2020 250,000 15.5p Up to 5 years Up to 8 years
01 October 2020 500,000 22.0p Up to 4 years Up to 7 years
01 April 2020 5,029,321 1.0p Up to 1.5 years Up to 2 years
18 August 2020 2,000,000 1.0p Up to 3 years Up to 7 years
Number ofShare Options Exercise Price Vesting Period Exercise Period
Total options granted 26,183,724
Weighted average share priceWeighted average exercise priceExpected volatilityExpected lifeRisk-free rateExpected dividend yield
23.314.8
33.8%Up to 7 years
1.7%4.0%
2021
The options outstanding at the period end were:
The options outstanding at 31 March 2021 had a weighted average exercise price of 11.4p, and a weighted average remaining contractual life of 3.6 years. The inputs into the Black-Scholes model are as follows:
Expected volatility was determined by calculating the historical volatility of a basket of listed competitor companies’ share prices over the previous year.
The Group recognised total expenses of £743,636 (2020: £110,037) related to equity-settled share-based payment transactions in the period.
On 17 November 2020, the equity incentive plan for the finnCap Analytics team was established whereby the Company will issue up to 20 million new ordinary shares at a price of 20p per share subject to achievement of certain unit profit hurdles and continued employment. These shares will be issued in four equal tranches between April 2024 and April 2028 and are conditional on achievement of annual, increasing unit PBT targets over the 4 financial years to 31 March 2025. In aggregate the team must deliver unit PBT of £8.5m in order to be awarded the incentive plan in full. As on option have been issued under the scheme, there are not include in the above numbers.
Certain current and former employees of the Group, including key management personnel, have provided the Employee Benefit Trust with 4,575,675 call options for shares in finnCap Group plc. Separate, but related, options have been provided by the Employee Benefit Trust to other employees of the Group. As these options will effectively be settled between these current and former employees of the Group, they have not been included in the share options disclosed above.
Grant Date
FY 21 Report and Accounts82
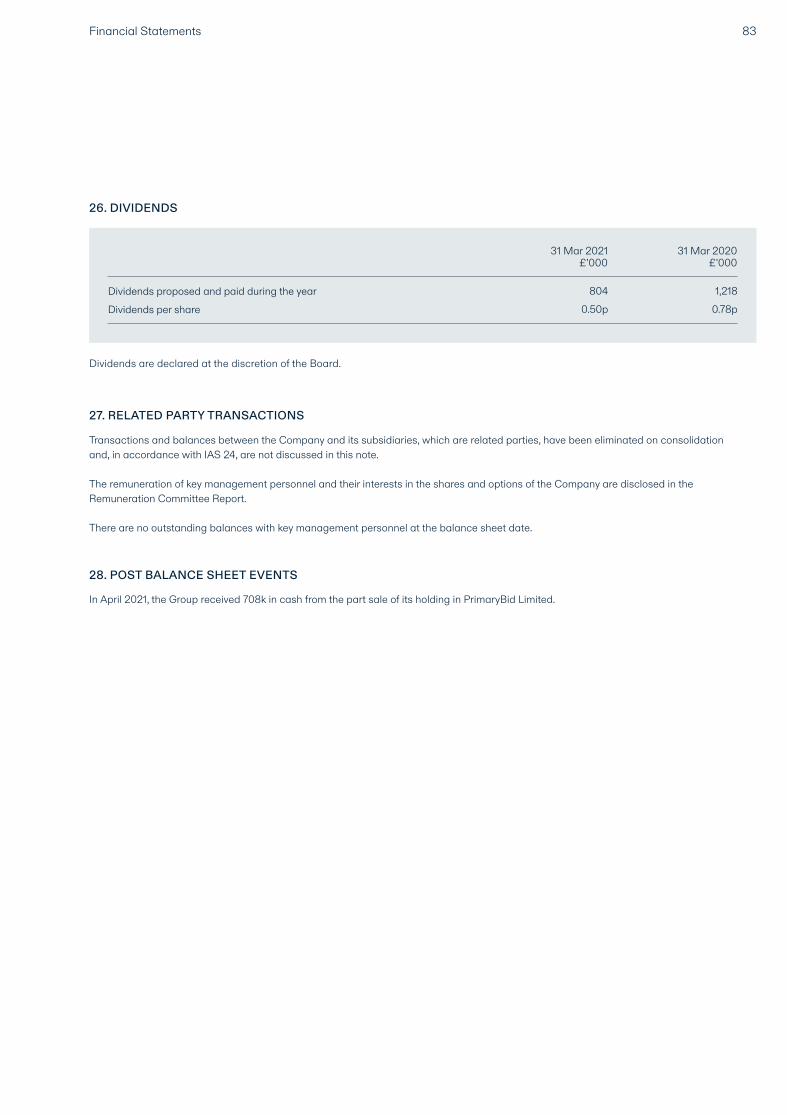
26. DIVIDENDS
27. RELATED PARTY TRANSACTIONS
28. POST BALANCE SHEET EVENTS
Dividends per share 0.50p 0.78pDividends proposed and paid during the year 804 1,218
31 Mar 2021£’000
31 Mar 2020£’000
Dividends are declared at the discretion of the Board.
Transactions and balances between the Company and its subsidiaries, which are related parties, have been eliminated on consolidation and, in accordance with IAS 24, are not discussed in this note.
The remuneration of key management personnel and their interests in the shares and options of the Company are disclosed in the Remuneration Committee Report.
There are no outstanding balances with key management personnel at the balance sheet date.
In April 2021, the Group received 708k in cash from the part sale of its holding in PrimaryBid Limited.
83Financial Statements


FY 21 Report and Accounts
Other Information
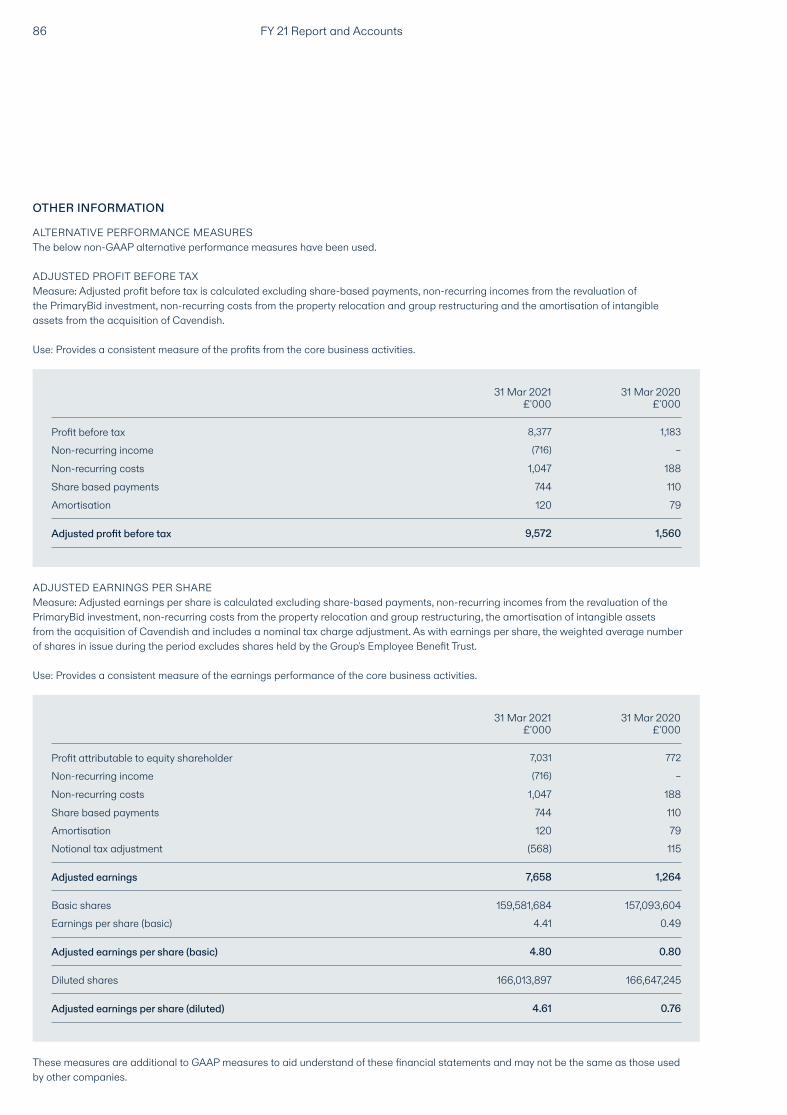
FY 21 Report and Accounts86
OTHER INFORMATION
ALTERNATIVE PERFORMANCE MEASURESThe below non-GAAP alternative performance measures have been used.
ADJUSTED PROFIT BEFORE TAXMeasure: Adjusted profit before tax is calculated excluding share-based payments, non-recurring incomes from the revaluation of the PrimaryBid investment, non-recurring costs from the property relocation and group restructuring and the amortisation of intangible assets from the acquisition of Cavendish.
Use: Provides a consistent measure of the profits from the core business activities.
ADJUSTED EARNINGS PER SHAREMeasure: Adjusted earnings per share is calculated excluding share-based payments, non-recurring incomes from the revaluation of the PrimaryBid investment, non-recurring costs from the property relocation and group restructuring, the amortisation of intangible assets from the acquisition of Cavendish and includes a nominal tax charge adjustment. As with earnings per share, the weighted average number of shares in issue during the period excludes shares held by the Group's Employee Benefit Trust.
Use: Provides a consistent measure of the earnings performance of the core business activities.
These measures are additional to GAAP measures to aid understand of these financial statements and may not be the same as those used by other companies.
Profit before tax
Non-recurring costsNon-recurring income
Share based paymentsAmortisation
(716) –
8,377 1,183
1,047 188744 110
Adjusted profit before tax 9,572 1,560
31 Mar 2021£'000
31 Mar 2020£'000
120 79
Profit attributable to equity shareholder
Non-recurring costsNon-recurring income
Share based payments
(716) –
7,031 772
1,047 188744 110
Adjusted earnings 7,658 1,264
Adjusted earnings per share (basic) 4.80 0.80
Adjusted earnings per share (diluted) 4.61 0.76
31 Mar 2021£'000
31 Mar 2020£'000
Amortisation 120 79
Basic shares 159,581,684 157,093,604
Notional tax adjustment (568) 115
Earnings per share (basic) 4.41 0.49
Diluted shares 166,013,897 166,647,245
Notes: The FY17-18 figures are for finnCap Ltd before the Group acquired Cavendish Corporate Finance LLP and the consolidation of all businesses under a new holding company finnCap Group PLC which was implemented for its IPO on AIM in December 2018. The FY19 figures relate to the 11 month period from 1 May 2018 to 31 March 2019 due to a change in the Group’s year-end as part of the acquisition and IPO and include the results of Cavendish Corporate Finance for the four months following its acquisition on 5 December 2018. *The basis for non-GAAP adjusted data is set out on page 86. ** Dividends relating to the relevant financial year.
Financial Highlights
DIVIDEND PER SHARE (p) **
1.5
0.8
1.4
0.9
0.5
RE VENUE (£m)
46.6
26.0
24.5
22.1
19.3
ADJUSTED PBT (£m) *
9.6
1.6
4.3
3.1
2.9
ADJ. EPS (p) *
4.8
0.8
2.9
2.0
1.9
CASH (£m)
20.4
4.7
4.7
5.3
5.2
2021
2020
2019
2018
2017
2021
2020
2019
2018
2017
2021
2020
2019
2018
2017
2021
2020
2019
2018
2017
2021
2020
2019
2018
2017
Other Information
REGISTERED OFFICE FOR ALL ENTITIES1 Bartholomew CloseLondonEC1A 7BL
WEBSITESwww.finncap.comwww.cavendish.com
REGISTRATION NUMBERSfinnCap Group plc – 11540126finnCap Ltd – 06198898Cavendish Corporate Finance LLP – OC333044Cavendish Corporate Finance (UK) Ltd – 02234889All companies are incorporated in England
DIRECTORSROBERT LISTER, Non-Executive ChairmanSAMANTHA SMITH, Chief Executive OfficerRICHARD SNOW, Chief Financial OfficerTOM HAYWARD, Chief Operating OfficerSTUART ANDREWS, Managing Director, finnCapANDY HOGARTH, Senior Independent Non-Executive DirectorBARBARA FIRTH, Independent Non-Executive Director
COMPANY SECRETARYAMY RUPRAI
NOMINATED ADVISER Grant Thornton UK LLP 30 Finsbury Square London EC2A 1AG
BROKERfinnCap Ltd1 Bartholomew CloseLondonEC1A 7BL
AUDITORSBDO LLP55 Baker StreetLondon W1U 7EU
SOLICITORSTravers Smith LLP 10 Snow Hill London EC1A 2AL
REGISTRARShare Registrars Limited17 West StreetFarnham GU9 7DR

COMPANY NUMBER 11540126