Embed Size (px)
Citation preview

This content has been downloaded from IOPscience. Please scroll down to see the full text.
Download details:
IP Address: 128.239.99.140
This content was downloaded on 20/10/2014 at 03:21
Please note that terms and conditions apply.
Fractal characteristics of electrical discharges: experiments and simulation
View the table of contents for this issue, or go to the journal homepage for more
1993 J. Phys. D: Appl. Phys. 26 619
(http://iopscience.iop.org/0022-3727/26/4/014)
Home Search Collections Journals About Contact us My IOPscience

J. Phys. D. Appl. Phys. 26 (1993) 619-627. Printed in the UK
Fractal characteristics of electrical discharges: experiments and simulation
I I
N Femiat, L Niemeyee and V Tuccis t Institute of Electronic Engineering, University of Salerno, Fisciano (SA), Italy * &ea Brown Boveri Research Center, Baden-Dattwill, Switzerland 5 DepaRment d Nuclear Engineering, Polytechnic of Milano. Italy
Received 19 May 1992, in final form 14 December 1992
Abstract It has been demonstrated that the general topological characteristics d branched electrical discharges can be efficiently described by the concept of fractal geometry. However, researches canled Out on thii subject hitherto have been restricted to mmputer simulation d discharge patterns without reference to experimental data and physical discharge mechanisms.
In this work, therefore, a specific discharge type is studied, namely a Uchtenberg figure in SFe. for which experimental resuits are presented together with a discussion d the underlying physical processes and numerical simulations. Good agreement is found between experiment and simulation and R is shown that the approximate fractal scaling of the discharge figure is a consequence d: specific underlying physical mechanisms.
1. Introduction
It has been hypothesized that the topological charac teristics of branched electrical discharges patterns may be efficiently described by the concept of fractal geom- etry [l]. It has been verified that equipotential patterns controlled by the field-related growth law exhibit fractal properties [2]. The mathematical conditions for fractal scaling of these structures and the relations between the parameters describing them have been identified [3].
On the basis of this concept, several papers have been published in which specific configurations are stud- ied. They include two- and three-dimensional discharge patterns in gaseous and solid dielectrics as well as sur- face discharges at the interface between gaseous and solid dielectrics [4-6]. These publications deal with computer simulations, the results of which are found to be qualitatively more or less similar to experimen- tally observed patterns. They do not provide quanti- tative comparison between experiment and simulation and they do not discuss the physical basis of the random growth law used in the simulation.
In this pper , therefore, a specific gas discharge type, namely a Lichtenberg figure in SFs, is analysed in terms of these aspects. Quantitative experimental data are presented and it is shown that their approxi- mate fractal scaling is a consequence of the underlying physical discharge propagation mechanism.
This specific example was chosen for two reasons. Firstly, Lichtenberg figures are two-dimensional s t r w tures (although controlled by a three-dimensional elec- trical field), the scaling properties of which can be
~2%3727/93/040619t09507.50 0 1993 IOP Publishing Ud
conveniently evaluated. Secondly, the basic physical mechanisms governing the propagation of this type of discharge are rather well understood (see for example
A numerical model has been developed which pre- cisely takes into account the details of the experimental arrangement and the characteristics of the discharge, namely
(1) the three-dimensionality of the electric field as- sociated with the two-dimensional discharge pattern;
(2) a threshold field below which the discharge is no longer able to propagate;
(3) a finite voltage drop along the discharge chan- nels.
We begin in section 2 with a brief a m u n t of the general characteristics of fractal scaling of discharge patterns and in section 3 we describe the specific ar- rangement considered for both experiment and numer- ical simulation. In section 4 we discus the physical mechanisms governing the specific type of discharge, whereas in section 5 the numerical simulation model is presented. In section 6 the experimental and simulation results are compared.
~71).
2. General remarks on fractal scallng of discharge patterns
It has been shown [&3] that a random pattern, the growth of which is driven by its electrical field E, ex- hibits fractal scaling if two mathematical conditions are
619
N Femia et d
dielectric (glass, ~ = 7 )
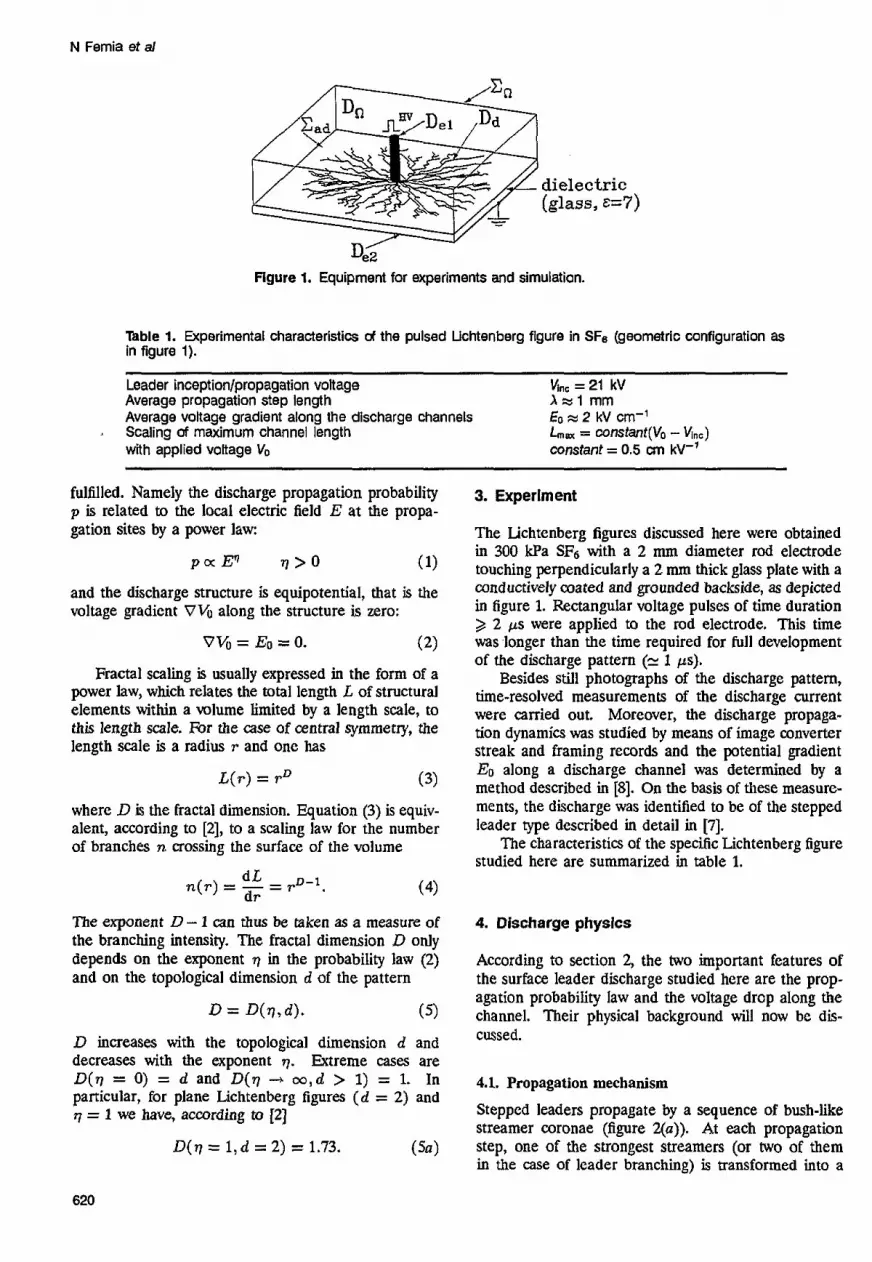
Figure 1. Equipment for experiments and simulation.
Table 1. Experimental characteristics d the pulsed Uchtenberg flgure in SFB (geometric configuration as in figure 1).
Average propagation step length Average voltage gradient along the discharge channels Scaling of maximum channel length with applied voltage Vo
Leader inceptionlpropagation voitage vi., = 21 kV A e l mm Eo = 2 kv cm-' La = constant(Vo - k) constant = 0.5 an kV-'
.
fulfilled. Namely the discharge propagation probability p is related to the local electric field E at the propa- gation sites by a power law:
P a : E n q > o ( 1)
and the discharge structure is equipotential, that is the voltage gradient VVU along the structure is zero:
VVO = EO = 0. Fractal scaling is usually expressed in the form of a
power law, which relates the total length L of structural elements within a volume limited by a length scale, to this length scale. For the case of central symmetry, the length scale is a radius r and one has
( 2 )
(3) D L ( r ) = r
where D is the fractal dimension. Equation (3) is equiv- alent, according to [2], to a scaling law for the number of branches n crossing the surface of the volume
The exponent D - 1 can thus be taken as a measure of the branching intensity. The fractal dimension D only depends on the exponent q in the probability law (2) and on the topological dimension d of the pattern
D = D(q,d) . ( 5 )
D increases with the topological dimension d and decreases with the exponent q. Extreme cases are D ( q = 0) = d and D(q --* m , d > 1) = 1. In particular, for plane Lichtenberg figures ( d = 2) and r l = 1 we have, according to [2]
D(q = 1,d = 2) = 1.73. (Sa)
3. Experiment
The Lichtenberg figures discussed here were obtained in 300 kPa SF, with a 2 mm diameter rod electrode touching perpendicularly a 2 mm thick glass plate with a conductively coated and grounded backside, as depicted in figure 1. Rectangular voltage pulses of time duration 2 2 ps were applied to the rod electrode. This time was longer than the time required for full development of the discharge pattern (E 1 ps).
Besides still photographs of the discharge pattem, time-resolved measurements of the discharge current were carried out. Moreover, the discharge propaga- tion dynamics was studied by means of image converter streak and framing records and the potential gradient EO along a discharge channel was determined by a method described in [SI. On the basis of these measure- ments, the discharge was identified to be of the stepped leader type described in detail in [7].
The characteristics of the specific Lichtenberg figure studied here are summarized in table 1.
4. Discharge physics
According to section 2, the two important features of the surface leader discharge studied here are the prop- agation probability law and the voltage drop along the channel. Their physical background will now be dis- cussed.
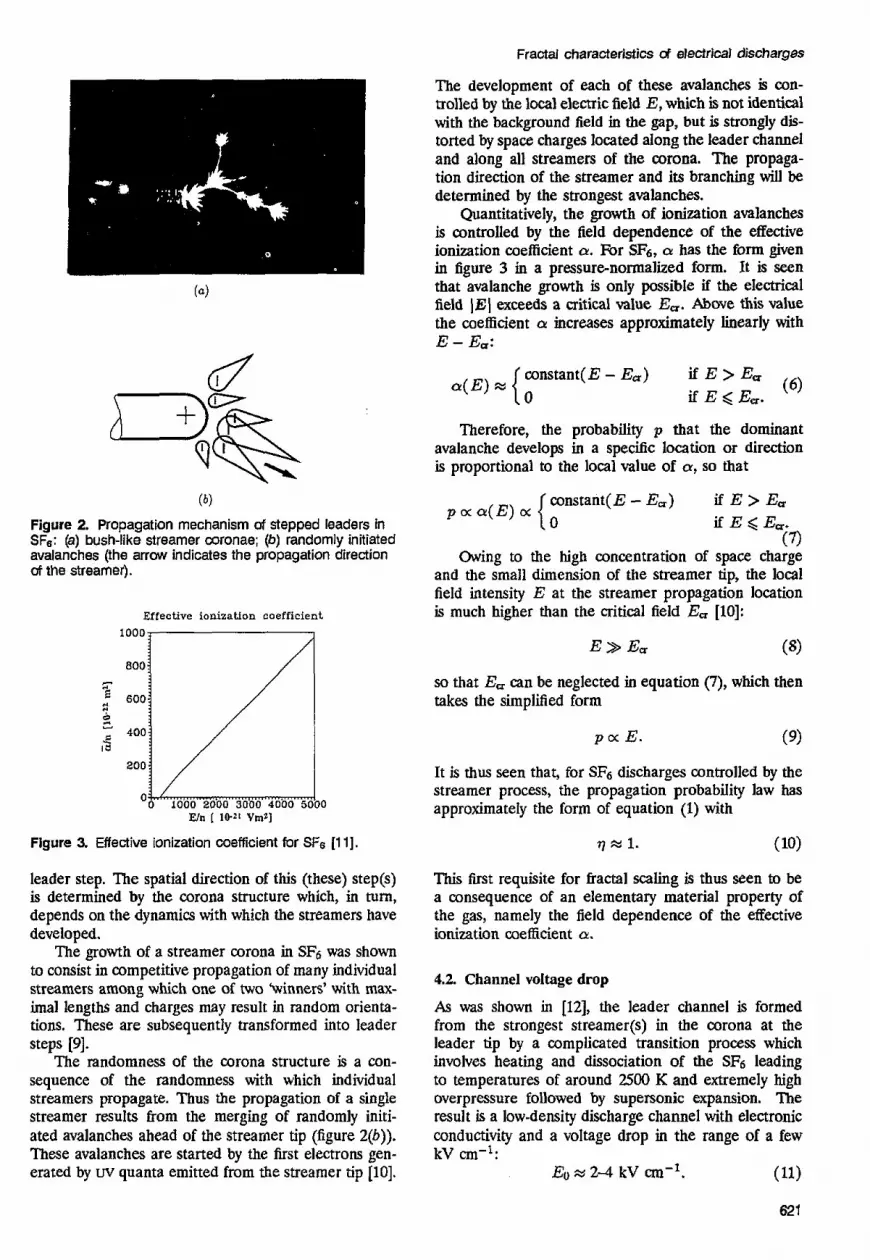
4.1. Propagation mechanism Stepped leaders propagate by a sequence of bush-like streamer coronae (figure xu)). At each propagation step, one of the strongest streamers (or two of them in the case of leader branching) is transformed into a
620
Fractal characteristics a' electrical discharges
The development of each of these avalanches is con- trolled by the local electric field E, which is not identical with the background field in the gap, but is strongly dis- torted by space charges located along the leader channel and along all streamers of the corona. The propaga- tion direction of the streamer and its branching will be determined by the strongest avalanches.
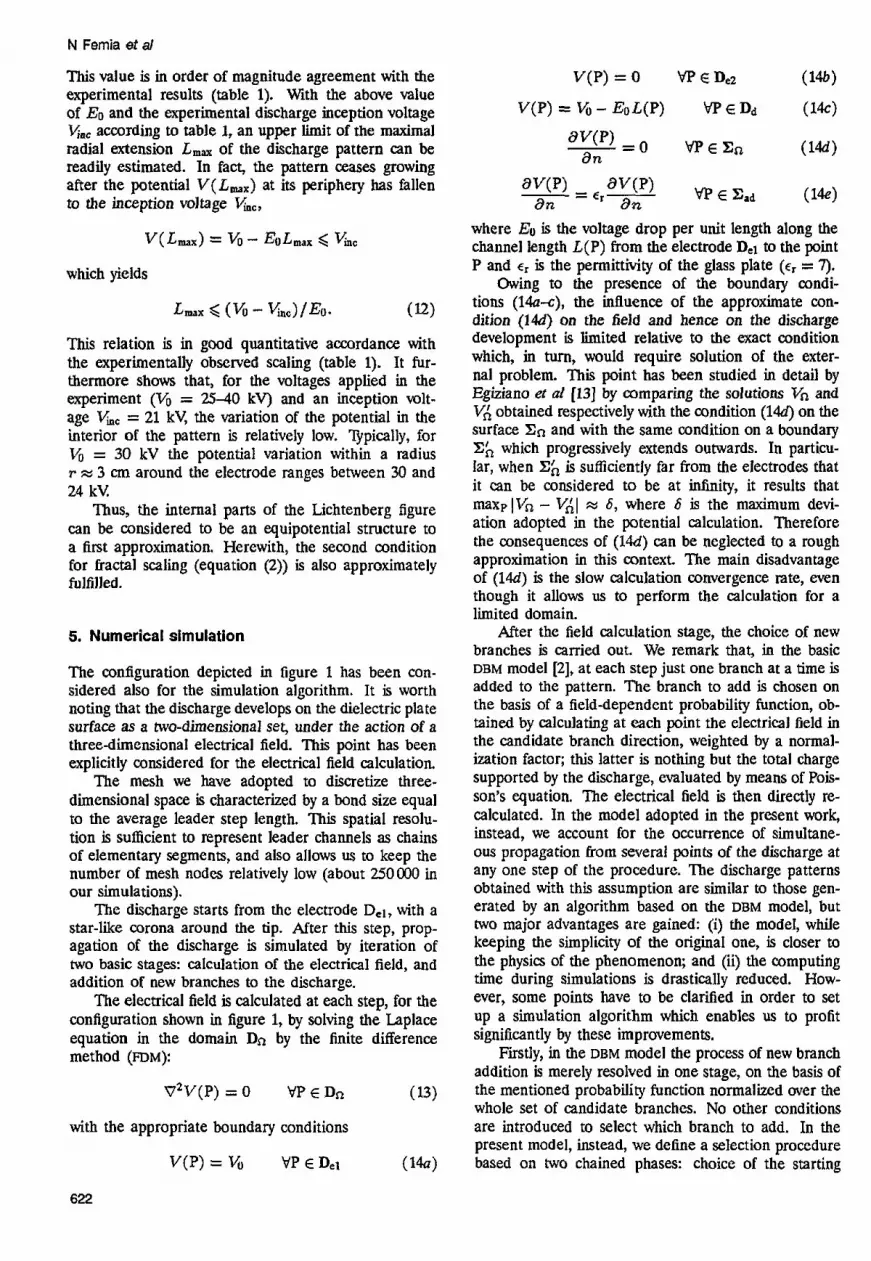
Quantitatively, the growth of ionization avalanches is controlled by the field dependence of the effective ionization coefficient a. k r sF6, a has the form given in figure 3 in a pressurenormalized form. It is seen that avalanche growth is only possible if the electrical field JEJ exceeds a critical value E-. Abwe this value the coefficient a increases approximately linearly with E - E,:
( b )
Figure 2. Propagation mechanism of stepped leaders in SFs: (a) bush-like streamer coronae; (b) randomly initiated avalanches (the arrow indicates the propagation direction of the streamer).
Effective ionization coefficient
% 600 s b E fa
400 -'~~~n 200 '0 1000 2000 3000 4000 5000
El" [ lD2l vmz1
Figure 3. Effective ionization coefficient for SFe 11 11,
leader step. The spatial direction of this (these) step@) is determined by the corona structure which, in tum, depends on the dynamics with which the streamers have developed.
The growth of a streamer corona in SF6 was shown to consist in competitive propagation of many individual streamers among which one of two %inners' with max- imal lengths and charges may result in random orienta- tions. These are subsequently transformed into leader steps [9].
The randomness of the corona structure is a con- sequence of the randomness with which individual streamers propagate. Thus the propagation of a single streamer results from the merging of randomly initi- ated avalanches ahead of the streamer tip (figure 2(b)). These avalanches are started by the first electrons gen- erated by uv quanta emitted from the streamer tip [lo].
(6) constant(E - E,) if E > E,
if E < E,. a ( E ) cx
Therefore, the probability p that the dominant avalanche develops in a specific location or direction is proportional to the local value of a, so that
constant(E - E,) if E > E, ifE<E,. (n
Owing to the high concentration of space charge and the small dimension of the streamer tip, the local field intensity E at the streamer propagation location is much higher than the critical field E, [IO]:
E > E m (8)
so that E, can be neglected in equation (7), which then takes the simplified form
p l x E . ( 9)
It is thus seen that, for SF6 discharges controlled by the streamer process, the propagation probability law has approximately the form of equation (1) with
Qcx1. ( 10)
This first requisite for fractal scaling is thus seen to be a consequence of an elementary material property of the gas, namely the field dependence of the effective ionization coefficient a.
4.2. Channel voltage drop
As was shown in 1121, the leader Channel is formed from the strongest streamer@) in the corona at the leader tip by a complicated transition process which involves heating and dissociation of the SF6 leading to temperatures of around 2500 K and extremely high overpressure followed by supersonic expansion. The result is a low-density discharge channel with electronic conductivity and a voltage drop in the range of a few kV cm-l:
Eo .W 2 4 kV CIU-'. ( 11)
621
N Femia et al
This value is in order of magnitude agreement with the experimental results (table 1). With the above value of EO and the experimental discharge inception voltage
according to table 1, an upper limit of the maximal radial extension LmU of the discharge pattern can be readily estimated. In fact, the pattern ceases growing after the potential V( LmX) at its periphery has fallen to the inception voltage V,,,
V(LmaX) = Vu- ~OL, b Vhc
which yields
This relation is in good quantitative accordance with the experimentally observed scaling (table 1). It fur- thermore shows that, for the voltages applied in the experiment (VO = 2540 kv) and an inception wlt- age Vi, = 21 kV, the variation of the potential in the interior of the pattern is relatively low. vpically, for Vu = 30 kV the potential variation within a radius T ES 3 em around the electrode ranges between 30 and 24 kV
Thus, the internal parts of the Lichtenberg figure can be considered to be an equipotential structure to a first approximation. Herewith, the second condition for fractal scaling (equation (2)) is also approximately fulfilled.
5. Numerical simulation
The configuration depicted in figure 1 has been con- sidered also for the simulation algorithm. It is worth noting that the discharge develops on the dielectric plate surface as a two-dimensional set, under the action of a three-dimensional electrical field. This point has been explicitly considered for the electrical field calculation
The mesh we have adopted to discretize three- dimensional space is characterized by a bond size equal to the average leader step length. This spatial resolu- tion is sufficient to represent leader channels as chains of elementary segments, and also allows us to keep the number of mesh nodes relatively low (about 250000 in our simulations).
The discharge starts from the electrode De,, with a star-like corona around the tip. After this step, prop- agation of the discharge is simulated by iteration of two basic stages: calculation of the electrical field, and addition of new branches to the discharge.
The electrical field is calculated at each step, for the configuration shown in figure 1, by solving the Laplace equation in the domain Dn by the mite difference method (FDM):
VzV(P) = 0 VP E Dn ( 13)
with the appropriate boundary conditions
V(P) = V, VP E Dei (14a)
622
W(P) BV(P) 'dp E Ea6 -- - e,-
a n an where E" is the voltage drop per unit length along the channel length L(P) from the electrode D.1 to the point P and is the permittivity of the glass plate (E, = 7).
Owing to the presence of the boundary condi- tions (lk-c), the influence of the approximate con- dition (14d) on the field and hence on the discharge development is limited relative to the exact condition which, m turn, would require solution of the exter- nal problem. This point has been studied in detail by Egiziano er ul [I31 by comparing the solutions Vn and VA obtained respectively with the condition (14d) on the surface E,-, and with the same condition on a boundary Xh which progressively extends outwards. In particu- lar, when Xh is sufficiently far from the electrodes that it can be considered to be at infinity, it results that maxpIVn - VAl M 6, where 6 is the maximum devi- ation adopted in the potential calculation. Therefore the consequences of (14d) can be neglected to a rough approximation in this context The main disadvantage of (14d) is the slow calculation convergence rate, even though it allows us to perform the calculation for a limited domain.
After the field calculation stage, the choice of new branches is carried out. We remark that, in the basic DBM model [2], at each step just one branch at a time is added to the pattern. The branch to add is chosen on the basis of a field-dependent probability function, ob- tained by calculating at each point the electrical field in the candidate branch direction, weighted by a normal- ization factor; this latter is nothing but the total charge supported by the dixharge, evaluated by means of Pois- son's equation. The electrical field is then directly re- calculated. In the model adopted in the present work, instead, we account for the Occurrence of simultane- ous propagation from several points of the discharge at any one step of the procedure. The discharge patterns obtained with this assumption are similar to those gen- erated by an algorithm based on the DBM model, but two major advantages are gained: (i) the model, while keeping the simplicity of the original one, is closer to the physics of the phenomenon; and (ii) the computing time during simulations is drastically reduced. How- ever, some points have to be clarified in order to set up a simulation algorithm which enables us to profit significantly by these improvements.
Firstly, in the DBM model the process of new branch addition is merely resolved in one stage, on the basis of the mentioned probability function normalized over the whole set of candidate branches. No other conditions are introduced to select which branch to add. In the present model, instead, we define a selection procedure based on two chained phases: choice of the starting

points set Dst; and choice of the propagation direction for new branches starting from each point P E Dst.
In 1141, in order to determine the starting points, a potential threshold criterion (PE) was adopted, based on the assumption that the discharge can only propagate from points P E Dd where the potential fulfills the condition
with V,, being the inception voltage previously intro- duced.
The results obtained with simulations based on (1%) are in good agreement with experiment. However, as we have seen in section 4, propagation of the discharge depends on avalanches, which in NIII take place if the electrical field exceeds the ionization critical value E,. This seems to indicate that, in the physical mechanism, the selection of growing branches depends on the elec- trical field.
Therefore, in the present work, a field threshold criterion (m) has been adopted in order to select the starting points of new branches; it is based on the electrical field and allows the propagation for those
V(P) > Vic (154
points P E Dd where
IEP, v ) l> E& ( 156)
at least along one direction v, E h beiig a suitable threshold field related to the critical field Em for avalanche inception.
In the authors’ opinion, further study is required in order to answer several open questions regarding the two threshold criteria, such as which of PTC and FE is more realistic? Under which conditions do they lead to the Same results? Is the FTC able to reproduce discharge patterns exhibiting fractal characteristics as PTC does? Specific research aimed at clarifying such aspects has been undertaken, whose results will be presented in a separate communication. In this paper, only the FTC will be considered.
Once the starting points have been determined, the propagation direction of each new branch is chosen on the basis of a probability function, depending on the threshold field E& for FTC:
where P E Dd, P’ Dd and the distance from P to P‘ is not greater than one mesh bond. IE(P,P‘)I is the electrical field strength in the direction from P to P’, evaluated as
where U is the mesh bond length and y(P,P’) is a factor equal to 1 or f i depending on the position of P‘ with respect to P. We expressly remark that the probability function (16) is locally defined and normal- ized; that is, we will have a probability distribution like
Fractal characteristics d electrical discharges
bond (1“)
Figure 4. kmpstiiion for propagation between ‘fast‘ (OA) and ‘slow’ (0’6) candidate leader branches.
(16) in the surroundings of each point P E Dd allowed to be the origin of a new branch, and this distribu- tion is normalized through the sum of the field over all the permitted directions starting from P. Therefore each candidate branch has only to ‘compete statistically’ with its ‘brother branches’, having the Same origin P, whereas in the DBM model competition is extended U)
all candidate branches of the discharge. Before one branch (P,P‘) could be definitively
added to the discharge, another confict situation has to be accounted for, involving (P, P‘) and the candidate branches starting from the points P” E Dd closest to P. In fact, we have to account for the shielding effect of ‘fast’ leader channels on the ’slow’ ones. Let us con- sider, for example, the situation of figure 4, and assume that the elechical field is greater at point A than at point B:
IE(O,A)I > IE(C‘‘,B)I. ( 18) The avalanche propagation time will be shorter
along the direction OA and it probably results that branch (0,A) becomes a new leader channel step before (O’,B). In this case the electrical field is strongly mod- Sed around point o‘, and propagation of the branch (O‘,B) can be definitively stopped, due to the shielding effect of the branch (0,A). This predominance mecha- nism can also be adopted for many other conflict situ- ations which occur during propagation. With the DBM model, because of the addition of one branch at a time, immediately followed by the electrical field calculation, this shielding mechanism is automatically reproduced. In the present model an additional criterion of selection has to be adopted in order to identify the ’winner’ among the branches in competition. Since the local electrical field is responsible for propagation, the branch charac- terized by maximum field is added to the pattern.
The iteration of the two stages goes on until no point fulfills the threshold condition (156).
A critical point in the described model is the de- termination of the value to assign to &, as it heavily influences the shape of simulated discharge patterns. We cannot assign to Etb the experimental value of the critical field E,, but have to choose a more suitable
623

N Femia et a/
6. Results and dlscusdon
Figure 5 shows an experimental Lichtenberg figure and figure qu) a simulated discharge obtained by the m model under the same conditions as the experiment. In the experimental discharge patterns (for example figure 5) the luminosity of the Channels is Seen to de- crease from the centre to the periphery. The reason for this is branching due to which more charge flows through the inner sections than through the outer ones. As the number of emitted photons is approximately proportional to the charge Row, the blackening of the photographic emulsion (and also the visual reaction of the eye) is approximately proportional to the logarithm of the impinging number of photons.
In order to represent this visual impression in the simulated discharge patterns approximately, the width of the branches in the simulation was chosen as a mea- sure of the intensity and assigned proportional to the logarithm of the charge flow. This conveys a more realistic aspect to the simulations.
Both the experimental and the simulated pattern ex- hibit radial symmetry on average. The initial anisotropy of the first propagation steps in the vicinity of the start- ing electrode is rapidly smoothed out with increasing number of propagation steps. This is due to the de- creasing relative fluctuation of the local electrical field at the propagating sites.
It is evident from figure 6(a) that the simulated dis- charge is characterized by a rather high surface filling corresponding to a fractal dimension D of a little less than ‘2, whereas the value of D for the experimental dis- charge of figure 5 is about 1.70, similar to the value also found for other simulations based on the DLA model [15]. Closer inspection shows, however, that a substan- tial fraction of the branches are sideways ramifications from a main channel and do not propagate further than one step. This is essentially a consequence of the sim- plification underlying the simulation: the stepped prop- agation has been assumed to be controlled by a single threshold field E,,, related to the streamer formation. However, in reality, the visible pattern is composed of leader steps. n e s e latter are only formed from a streamer after a further propagation step has fed them with a current pulse. Hence, the ‘last end’ steps in the simulation should be considered as (invisible) streamers only and consequently eliminated. A simple way to do this is the filtering procedure which has been discussed in detail in [4]. It is found to transform figure 6(u) into figure 6(b) essentially by suppressing the ‘dead’ streamer branches.
Comparison behveen figures 5 and 6(b) shows that the filtered simulation produces patterns of structure very similar to the experimental ones. This similarity is more than qualitative. This is demonstrated by the log-log data plot according to equation (4) shown in fig- ure 7. Both experimental points and simulated results (broken curves) closely follow a power law with an ex- ponent of about 0.7 in the interior of the pattern. This corresponds to the expected fractal dimension D 1.7.
Figure 5 Experimental Lichtenberg figure in SF8 at 300 kPa
( b )
Flgure 6. (a) Simulated discharge pattern obtained for Vo = 30 kV, Esh = 2 kV an-’, Em = 130 kV cm-’; (b) the same discharge as in (a) after graphic post-processing.
one. In fact, the electrical field that we calculate, after we have solved problems (13) and (14), is evaluated in the proximity of the discharge tips by means of (17) and is an average value over a mesh bond length. This value is strongly conditioned by the limited spatial resolution of the mesh and turns out to be significantly lower than the actual electrical field around the leader tips, so that the relation E > E, is no longer fulfilled. A simple approximation for E,,, can be found by evaluating the average field at the electrode tip under the inception voltage of 21 kV For the adopted configuration of fig- ure 1, with a mesh bond 1 mm in length, it has been calculated that E* = 130 kV cm-l.
624

Fractal characteristics d electrical discharges
L - - t
1 0.5 10
+ r /mm L m u
Figure 7. Number d discharge branches n(r) aossing a circle of radius r around the electrode tip: circles and triangles are experimental data; (----) expected fractal scaling according to equation (5a); and (-) numerical simulation for Vo = 30 k\l, ECh = 2 kV cm-', E. = 130 kV cm-'.
A" 2
e , 4 a) 0=1.75 (weak filter)
b) D=1.62 (hard filter) L&
"
e
Figure 8. Influence of filtering on fractal dimension calculation for the discharge of figure 6.
In figure 8 the scaling characteristics of a simulated dis- charge are analysed for two different filtering levels and the fractal dimension is calculated. The weak depen- dence of D on the dltering level and small difference between the values obtained and the ideal value 1.73 show that fractal scaling is an intrinsic property of the discharges, that is controlled by the specific propagation mechanism.
It just remains to understand the cause for the high number of one-step streamer side branches. This point is clarified by figure 9 which shows the equipotential lines of the electrical field in the vicinity of a propagat- ing discharge tip perpendicular to the plane of discharge propagation. It is recognized that the electrical field at
HV fb)
Figure 9. Electrical field lines during discharge propagation for two different dielectric plate thicknesses: (a) 2 mm: (6) 5 mm.
the discharge tip is strongly enhanced due to the prox- imity of the ground electrode. Wis means that the streamer propagation condition will be fulfilled every- where in the Vicinity of the channel, so that the latter will be filled with one-step streamer branches. In fact, by increasing the thickness of the dielectric plate, as in figure 9(b), the peripheral electrical field decreases and the discharge shows a much smaller quantity of onestep branches.
The observed values of the fractal dimension D are very close to 1.73, that is to the value expected according to equation (5u), for equipotential discharge patterns that are topologically two-dimensional (d = 2) and the probability scaling exponent of which is 1. In particular, both experimental and numerical values fall in the range 1.70 0.02. It is only towards the periphery of the pattern that fractality is lost because the equipotentiality condition of the discharge channels is increasingly violated due to the voltage drop E" along the channel. Obviously, in this context the value of Ea (or Ea) plays a fundamental part. In fact, if E B Eth we have a high branching probability and then a fractal- like shape, whereas when E approaches E&, as happens at the periphery of the discharge, we have no fractal growth. For increasing values of Eh the size and fractal dimension of the discharge decrease and the transition towards non-fractal scaling occur at lower radii. The value of Eh evaluated as indicated in section 5 leads to the best similarity between experiments and simulations; for higher values the simulated discharges reduce to radially directed straight branches, whereas for lower values the patterns completely fill the surface.
A systematic study of the fractality loss at the margin of the pattern can be carried out by means of the D-CY spectrum concept [17J The way described in [IS] seem
625

N Femia et fd
30 4b do 1.40 ~ari” radial size (mm)
Figure 10. Fractal dimension values versus radial extension of the discharge during propagation.
to be appropriate for our case; it consists in the calcula- tion of the qth-order bactal dimension by means of the qth-order Renyi information which, in tum, is obtained through a box covering-based set of occupation prob- ability functions. This study requires statistically more abundant experimental data, that are not available at present An improved experimental device is under development which should allow the treatment of this topic in future. Here we just remark that, even if the D-a! spectrum allows complete knowledge of the dis- charges’ local fractal properties, calculation of the frac- tal dimension D as previously performed is sufficient for most technical problems, where a single parameter linking the branching properties of the discharges to the applied stress is often sufficient.
It is interesting to analyse the behaviour of the frac- tal dimension of the pattern during the propagation; this has been obtained by freezing the simulation at in- termediate steps and calculating the fractal dimension. In figure 10 a plot of D versus the radial extension of the discharge is reported. An asymptotical tendency towards the value 1.73 is recognized, which seems to be rather systematic for the studied discharges.
We finally remark that, since the choice of the mesh bond size is forced by the intrinsic stepwise nature and characteristic step length of the leader propagation mechanism, no appreciable variations of the fractal di- mension need be expected on varying the mesh size. In fact, by neglecting the use of larger sizes due to their excessive coarseness, if a smaller size is adopted, the identification of the propagation points P’ and direc- tions (P,P’) should be more complicated as, for each new starting point P, the detection of the points P‘ fulfilling equation (1%) should be carried out within an ‘active’ region (streamer) of depth 2 or even more bonds ahead of P. Nevertheless, this should not lead to more branched and/or filled patterns as only one or two paths from P to the periphety of the ‘active’ region would be included in the leader pattern.
The maximal radial extension given by the simula- tion is also close to the obsewed one and both obey
626
the inequality equation (9) as can be recognized from the theoretical value L,,, (according to equation (12)) indicated in the figure.
By the computer simulation, it has been possible to evaluate the different influences of the physical pa- rameters introduced into the model. For example, the influence of the applied voltage V and the internal voltage gradient EO on the pattern extension has been investigated. It has been observed that EO has a greater influence on the values of L,, and D than does V, because it limits not only the radial extension of the dis- charge but also its region of fractality; this is confirmed from the data reported in [14] and from figure ll(u), where we see the strong modifications occurring in the outer region of the pattern as EO increases. In fig- ure ll(b) the filtered version of the Same discharge, looking very similar to the experiments, is reported.
With a few trivial modifications, the numerical model we have discussed has already been adopted for the simulation of seeing phenomena in solid dielectrics, with equally good results [SI.
We conclude this topic by stressing two pints re- lated to the fractal characterization. Firstly, it has been shown that the patterns obtained with m simulations exhibit realistic fractal scaling even if (8) is not ful- filled and the adopted probability function (16) is con- sequently different from (9). This seems to indicate that the numerical model is quite robust, being able to recover the relevant characteristics of the discharges. Secondly, while for deterministic fractals the fractal di- mension D can be analytically calculated once the grow- ing rule is defined, for stochastic ones, like discharge patterns, the calculation of D can only be carried out on the completely developed structure by several methods [16]. This means that we have to simulate the discharge each time D has to be determined. The reason for this limit has to be inquired into in terms of the way all the simulation algorithms devised up until now (DLA, DBM and the present one) reproduce the branching (respon- sible for fractal scaling) of the discharges. Fbr all of them, in fact, branching results from successive ‘attach-

Figure 11. Results of the simulation for Vo = 30 kv Ech = 4 kV cm-’. Ew = 130 kV an-’: (a) unfikered and (b) filtered pattern.
ments’ of new branches to the growing pattern, without considering this process as events occurring in m a t cases at a well-defined point in time, or rather in a very short time interval relative to the duration of the whole discharge propagation. In the step leader mechanism, for example, the discharge branching occurs when, in the surroundings of a leader tip, there are two winners among the streamer channels in the streamer-to-leader transition stage. Such a mechanism can be correctly reproduced by a model based on a bifurcation-limited propagation Criterion, which can be profitably adopted to simulate discharge phenomena and to find the under- lying links among embedding geometrical and electrical configuration, probabilistic propagation functions and fractal dimension. ’RI explore the potentialities of such a model, the Laplacian fractals theory due to Pietronero et af [3] seems the correct framework to work in. A description of this new model and results concerning the discharge pattem which can be obtained will be presented in a future paper.
7. Conclusions
In this paper a specific discharge type, namely a Licht- enberg figure in SFa, is studied experimentally and sim- ulated numerically based on an analysis of the phys- ical mechanisms that control the discharge propaga- tion. The mathematical conditions for fractal scaling are shown to be approximately fulfilled by physical rea- soning appropriate for a discharge. The experimental discharge exhibits the expected fractal scaling with the predicted value of the fractal dimension in the interior of the pattern. Deviations from fractal scaling at the
Fractal characteristics d electrical discharges
periphery of the pattern are due to the fact that the frao tality conditions are no longer fulfilled there and can be quantitatively explained by the numerical model. A threshold condition for propagation based on the eleo trial field has been adopted and its influence on the growth and fractal characteristics of the discharges has been investigated, providing evidence for the robustness of the model.
All the relevant experimental parameters such as in- ception voltage, avalanche critical field, voltage gradient along the discharge channels, insulator plate thickness and permittivity are accounted for and the numerical model also calculates the true three-dimensional electri- cal field around the two-dimensional discharge pattem.
The simulations reproduce accurately all the topo- logical and quantitative characteristics of the experi- ments and also explain the structure at the periphery of the discharge patterns.
Acknowledgments
The partial support of MURST ‘40 and 60%’ funds is acknowledged.
References
[l] Mandelbrot B 1982 The FMCtd Geometv of Nature
[Z] Niemeyer L, Pietronero L and Weismann H J 1984
131 Pietronero Erzan A and Evertsz C 1988 Hys. R ~ K
[4] Egiziano L, Femia N, Lupb G and lbcci V 1990 BOC
(New l b r k W H Freeman)
Phys. Rev. k t t . SL 10334
Left. 61 861
6fh Int. Symp. on Gaseous JXlechics, Knoxvile (New York Plenum)
Fractal description of the tree growth in solids Roc 7th Int. Svmo. on Hieh Voitaee Enheerine. Drerdn
[SI Egiziano L, Femia N, Lupb G and T k c i V 1991
(Dresden: 6niversig of Tecinolo2j) paprzZO5 [6] Fujimori S 1985 Japan. J. Appl. Phys. 24 1198 [7] Niemeyer L, Ullrich L and Wiegart N 1989 IEEE
Pans. Elect% Insulat. 24 309 [SI Niemeyer L and Pinnekamp F 1982 3 d Inr. Symp. M
Gaseous Dielectrics KMwviue (New York Plenum) p 379
[9] Niemeyer L and Wiesmann H J 1988 Roc Bh Int. ConJ on Gas Dkchqes (Padova: Benetton) p 223
[lo] Gallimberti I 19725. Appl Phys. 5 2179-89 [ll] Morrow R 1986 A survey of electron and ion transport
properties of SF6 IEEE Trans. Power Syst. 14 234-9 [I21 Niemeyer L 1985 Roc 8th Int. Conj on Gar
Lkhatges, &ford (Leeds: Leeds Universily Press)
[ 131 Egiziano L, Femia N, Lupb G and mcci V 1990 L’EneW’a Elemica 3 121-9 (in Italian)
[ 141 Femia N, Lupd G and lbcci V 1991 Roc X X Int Conj on Phenomena in Ionized Gases, Pira MI 4 (Pi= Jstituto di Fisica Atomica e Molecolare) pp 921-2
[IS] Pietronero Land ’batti E 1986 FmctaLr in Physics (Amsterdam: Elsevier)
[16] Barday A L, Sweeney P J, Dissado L A and Stevens G C 1990 I. Phys D Appl Phys. 23 153H5
[17] Haisey T C, Jensen M y Ladanhoff L P, Procaccia I and Shraiman B 1986 Php. R ~ K A 33 1141
[IS] lhkayasu H 1990 Fractals in the Physical Sciences (Manchester: Manchester Universily Pres)
P Z
627


