Embed Size (px)
Citation preview

This article appeared in a journal published by Elsevier. The attachedcopy is furnished to the author for internal non-commercial researchand education use, including for instruction at the authors institution
and sharing with colleagues.
Other uses, including reproduction and distribution, or selling orlicensing copies, or posting to personal, institutional or third party
websites are prohibited.
In most cases authors are permitted to post their version of thearticle (e.g. in Word or Tex form) to their personal website orinstitutional repository. Authors requiring further information
regarding Elsevier’s archiving and manuscript policies areencouraged to visit:
http://www.elsevier.com/copyright

Author's personal copy
Fracture morphology and deformation characteristics of repeatedly impactedthermoplastic matrix composites
Onur Çoban a,*, Mustafa Özgür Bora a, Tamer Sinmazçelik a,b, _Ismail Cürgül a, Volkan Günay b
a Kocaeli University, Mechanical Engineering Department, Veziroglu Campus, 41040 Izmit, Turkeyb Tubitak-Mam, Materials Institute, P.O. Box 21, 41470 Gebze, Turkey
a r t i c l e i n f o
Article history:Received 28 September 2007Accepted 16 May 2008Available online 7 July 2008
Keywords:E. Impact and ballisticA. Composite: polymer matrixG. Scanning electron microscopy
a b s t r a c t
Deformations of thermoplastic matrix composites during impact fatigue loading were investigated byinstrumented impacts tester and scanning electron and optic microscopy (SEM). Curves of damage evo-lution against the number of repeated impacts to fracture the composites revealed three distinct zones:fibre micro buckling and shear fracture of fibres (1st region), initiation and propagation of delaminationsand matrix deformations (2nd region), propagation of delaminations and fibre cracking and pull out espe-cially in tensile area (3rd region). Intensive deformations observed primarily in compression region dur-ing impact-fatigue loading can be explained by lower compressive strength of composites compared totheir tensile strength.
� 2008 Elsevier Ltd. All rights reserved.
1. Introduction
Polymer composites offer numerous potential advantages espe-cially in the aerospace, automotive and other applications, such ashigh strength to weight ratio, life-cycle cost reduction, high impactand fatigue performance of the materials [1,2]. Thermoplastic ma-trix composites have many potential advantages compared to ther-mosetting matrix composites due to the improved environmentalresistance, increased interlaminar toughness and enhanced dam-age tolerance [3]. However, many damages may occur during theirmanufacture, assembly and maintenance or service life, caused bydifferent repeated impacts with low energy values [4–6]. These im-pacts may not be big enough to cause a catastrophic failure, butthey may cause initial deformations. It is possible that, these dam-ages may grow and cause catastrophic failure (fracture) of thesample.
There are many studies that have been performed in order toinvestigate the impact properties of the polymer composites[7–12]. Also the fatigue deformations, crack initiation and propaga-tion mechanisms and fractography of the composites subjected torepeated impact loadings are reported. The damage classificationssummarized into three categories matrix cracks, delamination andfibre breakage. The delamination patterns are reported in differentsize, shape, and orientation at different laminate interfaces. Matrixtransverse cracks and fibre fractures were also observed in a differ-ent manner in each layer. The fibre/matrix interface properties,laminate configuration and impactor (striker) shape also found to
play an important role in determining the shape and extent ofdamage, which, in turn, is related to the damage resistance of thecomposite [13,14]. On the other hand, there are limited studiesinvestigated the deformations and fracture morphology of thecomposite materials subjected to repeated impact loading. Shyrand Pan [15] examined impact behavior and damage characteris-tics in various reinforced fabric structures with different numberof layers. They concluded that layer number was one of the impor-tant parameters for the energy-absorbing mechanism in compositelaminates.
In this study, fracture morphology and deformations during therepeated low-energy impact loadings of continuous carbon fibrereinforced thermoplastic Polyetherimide (PEI) matrix compositesare presented. The composite material was subjected to repeateddifferent low-energy impact loadings. The specimen was insertedinto sample holder of instrumented izod impact tester, and sub-jected to impact loads repeatedly up to fractured. Fractographicinvestigations were carried out to analyse the crack growth andthe failure mechanism in cross section during the repeated impactloading. In order to investigate the deformations, scanning electronmicroscopy (SEM) and optic microscopy were used during the re-peated low energy impact loadings.
2. Experimental procedures
Unidirectional carbon fibre reinforced Polyetherimide (PEI)composites were kindly supplied by TenCate Advanced Composites(Nijverdal/Netherlands) in the form of hot pressed plaques. Fibrevolume content was 60%. Plaques manufactured from 14 plies with
0261-3069/$ - see front matter � 2008 Elsevier Ltd. All rights reserved.doi:10.1016/j.matdes.2008.05.042
* Corresponding author. Tel.: +90 262 3351148x1140; fax: + 90 262 3352812.E-mail address: [email protected] (O. Çoban).
Materials and Design 30 (2009) 628–634
Contents lists available at ScienceDirect
Materials and Design
journal homepage: www.elsevier .com/locate /matdes

Author's personal copy
an individual ply thickness of 0.14 mm and the areal weight of aply was 222 g/m2. The commercial code of the laminate wasCD5150. Impact tests were performed by pendulum type instru-mented impact tester (CEAST-Resil 25). The test samples were pre-pared according to ISO 180 standards. Un-notched samples wereused with the dimensions of 10 � 2 � 65 mm. Fig. 1 illustratesthe sample geometry, insertion and testing procedure.
Preliminary experiments were performed in order to find theoptimum drop angle. This angle was found as 70� which has min-imum inertial oscillations in the contact load between striker(hammer) and sample during the impact. The sample was frac-tured with single impact at 70�. The maximum available impactenergy of the striker was 2.65 J for 70�. Hammer length and masswere 0.327 m and 1.254 kg, respectively. Sampling time was cho-
sen as 8 ls. At angle of 70� (2.65 J) the hammer hit the sample withthe velocity of 2.05 m/s.
It is important to understand the approach used in the analysisof force–time curves, which are critical in determining the impactcharacteristics of materials (Fig. 2). During the impact the contactforce between the hammer and sample increase sharply up to amaximum value and then gradually decrease. Reaching the contactforce down to zero means that catastrophic failure (fracture) is oc-curred. This point labeled as X.e.v. in Fig. 2. The total area under theforce–time curve gives the impact energy of the system (Emax).These curves can be divided into two regions. The first region isthe crack initiation and the second is the crack propagation re-gions. The areas under each region give the energy for these pro-cesses, which are defined as energy for crack initiation (Ei) and
Fig. 1. The illustration of sample geometry, insertion and testing procedure.
0
20
40
60
80
100
120
140
0 2 4 6 8 10 12
Emax.= Ei+Ep= The total energy that was absorbed
Deformation (mm.)
For
ce (
N)
E =Crack initiation energy
Fmax.
Ep=Crack propagation energy
X.e.v. =The amount of deformation
E.Fmax.= Ei= The maximum elastic energy that was absorbed
Fig. 2. Instrumented impact test parameters.
O. Çoban et al. / Materials and Design 30 (2009) 628–634 629
Author's personal copy
energy for crack propagation (Ep). The spikes in the first region aredue to inertial oscillations of the sample. The X.e.v values representthe amount of the deformation at each impact. Results of lowvelocity repeated impact study were reported in terms of peakload, absorbed energy and number of impacts and deformationrates. Fractured surfaces of the impact test samples were examinedby means of scanning electron microscopy (SEM) (JOEL JSM-6335Ffield emission scanning microscopy) and stereo microscopy, (Leica-Stereo 80� microscopy). The fractured composite samples weregold sputtered as a standard procedure before the fractographicinvestigations.
3. Results and discussions
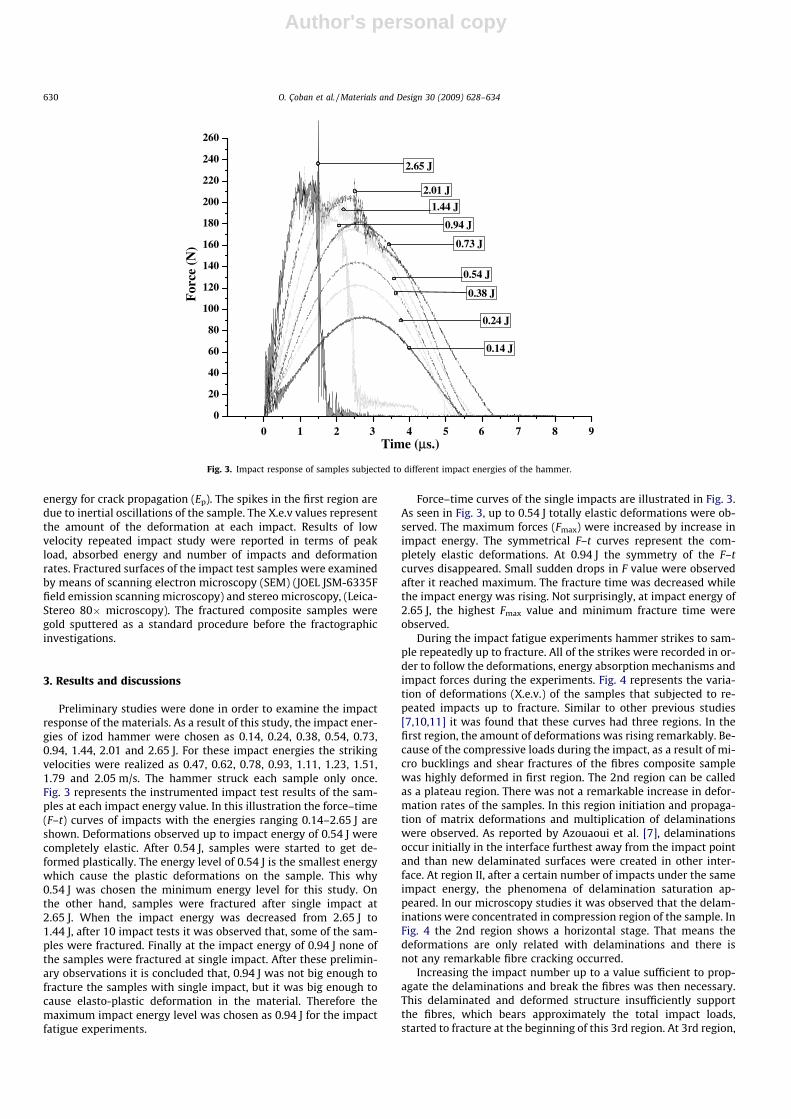
Preliminary studies were done in order to examine the impactresponse of the materials. As a result of this study, the impact ener-gies of izod hammer were chosen as 0.14, 0.24, 0.38, 0.54, 0.73,0.94, 1.44, 2.01 and 2.65 J. For these impact energies the strikingvelocities were realized as 0.47, 0.62, 0.78, 0.93, 1.11, 1.23, 1.51,1.79 and 2.05 m/s. The hammer struck each sample only once.Fig. 3 represents the instrumented impact test results of the sam-ples at each impact energy value. In this illustration the force–time(F–t) curves of impacts with the energies ranging 0.14–2.65 J areshown. Deformations observed up to impact energy of 0.54 J werecompletely elastic. After 0.54 J, samples were started to get de-formed plastically. The energy level of 0.54 J is the smallest energywhich cause the plastic deformations on the sample. This why0.54 J was chosen the minimum energy level for this study. Onthe other hand, samples were fractured after single impact at2.65 J. When the impact energy was decreased from 2.65 J to1.44 J, after 10 impact tests it was observed that, some of the sam-ples were fractured. Finally at the impact energy of 0.94 J none ofthe samples were fractured at single impact. After these prelimin-ary observations it is concluded that, 0.94 J was not big enough tofracture the samples with single impact, but it was big enough tocause elasto-plastic deformation in the material. Therefore themaximum impact energy level was chosen as 0.94 J for the impactfatigue experiments.
Force–time curves of the single impacts are illustrated in Fig. 3.As seen in Fig. 3, up to 0.54 J totally elastic deformations were ob-served. The maximum forces (Fmax) were increased by increase inimpact energy. The symmetrical F–t curves represent the com-pletely elastic deformations. At 0.94 J the symmetry of the F–tcurves disappeared. Small sudden drops in F value were observedafter it reached maximum. The fracture time was decreased whilethe impact energy was rising. Not surprisingly, at impact energy of2.65 J, the highest Fmax value and minimum fracture time wereobserved.
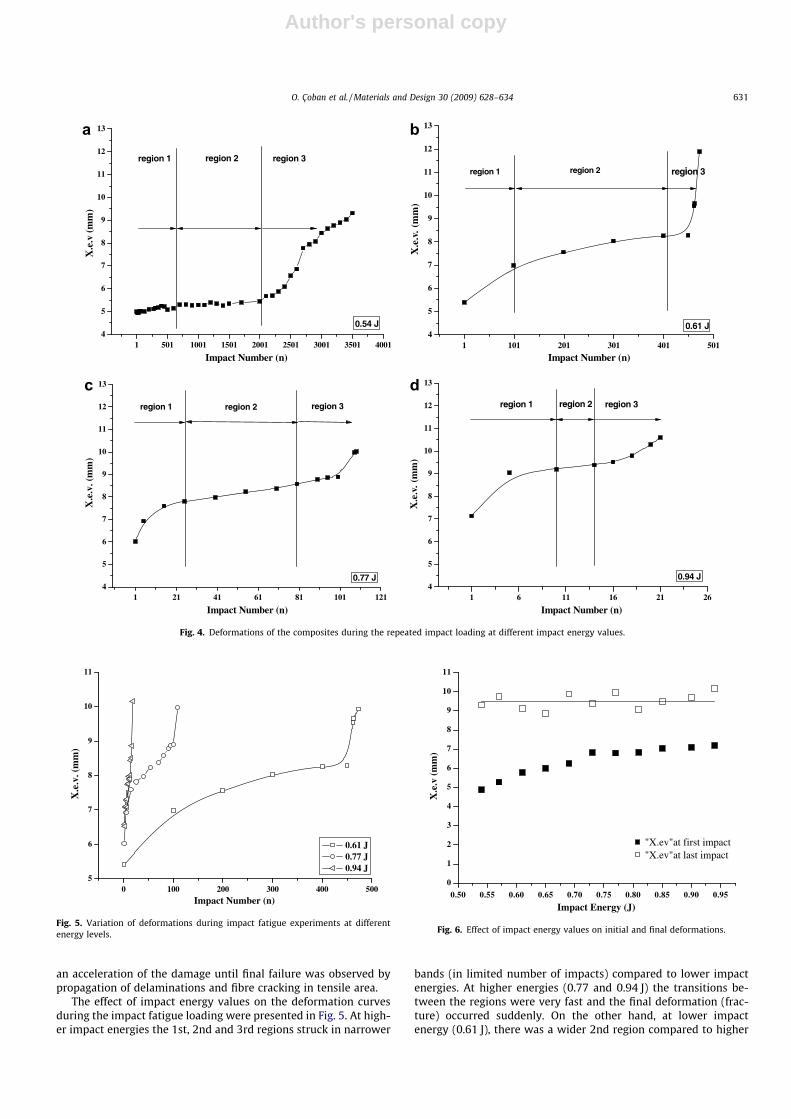
During the impact fatigue experiments hammer strikes to sam-ple repeatedly up to fracture. All of the strikes were recorded in or-der to follow the deformations, energy absorption mechanisms andimpact forces during the experiments. Fig. 4 represents the varia-tion of deformations (X.e.v.) of the samples that subjected to re-peated impacts up to fracture. Similar to other previous studies[7,10,11] it was found that these curves had three regions. In thefirst region, the amount of deformations was rising remarkably. Be-cause of the compressive loads during the impact, as a result of mi-cro bucklings and shear fractures of the fibres composite samplewas highly deformed in first region. The 2nd region can be calledas a plateau region. There was not a remarkable increase in defor-mation rates of the samples. In this region initiation and propaga-tion of matrix deformations and multiplication of delaminationswere observed. As reported by Azouaoui et al. [7], delaminationsoccur initially in the interface furthest away from the impact pointand than new delaminated surfaces were created in other inter-face. At region II, after a certain number of impacts under the sameimpact energy, the phenomena of delamination saturation ap-peared. In our microscopy studies it was observed that the delam-inations were concentrated in compression region of the sample. InFig. 4 the 2nd region shows a horizontal stage. That means thedeformations are only related with delaminations and there isnot any remarkable fibre cracking occurred.
Increasing the impact number up to a value sufficient to prop-agate the delaminations and break the fibres was then necessary.This delaminated and deformed structure insufficiently supportthe fibres, which bears approximately the total impact loads,started to fracture at the beginning of this 3rd region. At 3rd region,
0
20
40
60
80
100
120
140
160
180
200
220
240
260
0 1 2 3 4 5 6 7 8 9
For
ce (
N)
2.65 J
2.01 J
1.44 J
0.94 J
0.73 J
0.54 J
0.38 J
0.24 J
Time (μs.)
0.14 J
Fig. 3. Impact response of samples subjected to different impact energies of the hammer.
630 O. Çoban et al. / Materials and Design 30 (2009) 628–634
Author's personal copy
an acceleration of the damage until final failure was observed bypropagation of delaminations and fibre cracking in tensile area.
The effect of impact energy values on the deformation curvesduring the impact fatigue loading were presented in Fig. 5. At high-er impact energies the 1st, 2nd and 3rd regions struck in narrower
bands (in limited number of impacts) compared to lower impactenergies. At higher energies (0.77 and 0.94 J) the transitions be-tween the regions were very fast and the final deformation (frac-ture) occurred suddenly. On the other hand, at lower impactenergy (0.61 J), there was a wider 2nd region compared to higher
1 501 1001 1501 2001 2501 3001 3501 40014
5
6
7
8
9
10
11
12
13
region 3region 2
X.e
.v(m
m)
Impact Number (n) Impact Number (n)
region 1
0.54 J
1 101 201 301 401 5014
5
6
7
8
9
10
11
12
13
X.e
.v.(
mm
)
region 1 region 2 region 3
0.61 J
1 21 41 61 81 101 1214
5
6
7
8
9
10
11
12
13
Impact Number (n) Impact Number (n)
X.e
.v. (
mm
)
region 1 region 2 region 3
0.77 J
1 6 11 16 21 264
5
6
7
8
9
10
11
12
13
X.e
.v.(
mm
)region 3region 2region 1
0.94 J
Fig. 4. Deformations of the composites during the repeated impact loading at different impact energy values.
0 100 200 300 400 5005
6
7
8
9
10
11
0.61 J0.77 J0.94 J
Impact Number (n)
X.e
.v. (
mm
)
Fig. 5. Variation of deformations during impact fatigue experiments at differentenergy levels.
0.50 0.55 0.60 0.65 0.70 0.75 0.80 0.85 0.90 0.95
0
1
2
3
4
5
6
7
8
9
10
11
"X.ev"at first impact"X.ev"at last impact
X.e
.v (
mm
)
Impact Energy (J)
Fig. 6. Effect of impact energy values on initial and final deformations.
O. Çoban et al. / Materials and Design 30 (2009) 628–634 631

Author's personal copy
impact energies. During the 3rd region, the progressive fibre break-ings took place and samples were fractured within a short time atall energy levels.
It is possible to bring additional explanations for the differencein the width of the regions in deformations during the impact fati-gue experiments in Fig. 6. As seen in Fig. 6, not surprisingly, thedeformations at first impacts during the impact fatigue tests wereremarkably lower at lower impact energy. The deformations at fi-nal impacts (before the fracture) were approximately the same(approximately around 9–10 mm). The differences between theinitial and final deformations were remarkably greater at lowerimpact energies, which was responsible for wider 1st and 2ndregions.
The fractured surfaces of the single and repeatedly impactedsamples were examined by scanning electron microscopy and re-illustrated in Fig. 7. It is easy to follow the neutral axis even bynaked eye. Two different fracture morphology patterns meet nearthe neutral axis. The neutral axis behaves like a smooth boundary,or transition area between the tensile and compression areas [16].After examining the first cross section of surface that was fracturedafter a single impact (Fig. 7a), it should be noted that the compres-sion and the tensile areas were not equal. The ratio of tensile/com-pression area of fractured surface was measured as 1.4. When theimpact energy was decreased to 0.94 J, sample was fractured after
21 repeated impacts. At the cross section of the sample which wasfractured after 21 impacts at 0.94 J, the neutral axis shifted fromcompression area to tensile area due to impact fatigue loading.The ratio of tensile/compression area was measured approximately1 at 0.94 J. When the impact energy was decreased to 0.54 J, the re-peated impact number necessary to fracture the sample was in-creased to 3580. As it was described before; for the sample thatwas fractured after 3580 impacts at 0.54 J, the neutral axis shiftedfar from compression area to tensile area because of the increase inrepeated impact number. The ratio of tensile/compression areawas measured as 0.6.
The possible reason for enlargement in compression area can beexplain by lower compressive strength of composites compared toits tensile strength. During the repeated impacts, both tensile andcompression regions loaded with approximately equal stresses.The fibres in tensile region can withstand these stresses withoutdamaged up to a certain deformation. On the other hand, the fibresin compression region are deformed due to their lower compres-sion strength. During the repeated impacts, because of the defor-mation tendency of the fibres in compression type loading, widercompression regions are achieved in cross section of fracturedsample.
Compression areas of fractured surfaces were illustrated in Fig.8. In the first image (Fig. 8a), a flat fractured surface was observed.
a b c
Fractured after 1 impact at
2.65J
Fractured after 21 impact at
0.94J
Fractured after 3580 impact at
0.54J
Neutral Axis
Tensilearea
Compression area
Neutral Axis
Tensilearea
Compression area
NeutralAxis
Compression area
Tensilearea
Fig. 7. Fracture morphologies of the samples.
a b c
Fractured after 1 impact at
2.65J
Fractured after 21 impact at
0.94J
Fractured after 3580 impact at
0.54J
Fig. 8. SEM images of compression area of fractured cross section.
632 O. Çoban et al. / Materials and Design 30 (2009) 628–634

Author's personal copy
After a single impact with the impact energy of 2.65 J, all compo-nents of the sample fractured suddenly in brittle manner, so a flatsurface was occurred. In the second and third images; a roughersurfaces of samples; which were fractured after repeated impacts,were observed. As a result of repeated impacts, the delaminationtraces caused by relative movements of layers induced by hammerimpacts could be seen clearly in Fig. 8b and c.
SEM images of tensile area images of fractured samples areillustrated in Fig. 9. As seen in first photograph, the fractured fibreswere dispersed orderly. Fibres were fractured suddenly about thesame lengths. As explained in Ref. [17] shard of matrix can be seenthroughout the sample and substantial quantities of matrix wereattached to the fibres. Short pull-out lengths of the fibres are theevidence of strength fibre/matrix interfacial bond. Decrease in im-pact energy resulted in increase in repeated impact number, there-
Fractured after 1 impact at
2.65J
Fractured after 21 impact at
0.94J
Fractured after 3580 impact at
0.54J
Fig. 9. SEM images of tensile area of fractured cross section.
a b
Fractured after 1 impact at 2.65J Fractured after 3580 impact at 0.54J
Compression area
Tensile area
NeutralAxis
Compressionarea
Tensile area
NeutralAxis
Fracturedfibres
Matrixcovering
Fig. 10. SEM images of neutral axis.
Fractured after 109 impact at 0.77 J Fractured after 1 impact at 2.05 J
Fig. 11. Side view of izod sample photographs.
O. Çoban et al. / Materials and Design 30 (2009) 628–634 633
Author's personal copy
fore, relative movement between laminates the fibre/matrix inter-face strength was reduced remarkably. It was observed that, the fi-bre pull-out lengths in second and third photographs were longerthan the first image (Fig. 9a). Also, as a result of repeated impacts,relative shear loadings between the fibre surface and matrixcaused hollow holes around the fibres. These holes may widen asa result of the repeated impacts. As a result of impact fatigue load-ing, the pull-out and fractured fibres were not dispersed in orderlymanner. Darker areas on the image are evidence of topographicallow points. These are the areas where the carbon fibre bundleshave been pulled-out from the matrix [17].
As seen in Fig. 10, the neutral axis divided the tensile and com-pression areas. In first photograph, the fractured surfaces of the fi-bres are perpendicular to the fibre axis and chevron markings wereobserved on fibre surfaces as reported also in literature [16]. Afterthe examination of the surface of sample that was fractured aftersingle impact (2.65 J); surface of fractured fibres in compressionarea could be seen in detail in Fig. 10a. However, during the im-pact-fatigue loading at 0.54 J as a result of crack propagating, slip-pages occurred between the surfaces of the cracks at each impact.As a result of this slippage, thin layer of PEI resin (including smallmatrix and fibre fragments) covers the whole compression region.The deformation morphologies of the single and repeatedly im-pacted samples were also examined by means of optical micro-scope. As indicated with arrows in Fig. 11, the main horizontaldelamination was occurred at all energy values as similar to liter-ature [18]. That means delamination was followed the neutral axiswhich represents the border of tensile-compression regions of thecross section. The delaminations and deformations were concen-trated in the compression zones of the samples. In these photo-graphs transverse cracks were observed parallel to the neutralaxis [19].
4. Conclusion
In this study, fracture morphology and deformation characteris-tics of repeatedly impacted thermoplastic matrix composites wereinvestigated. Curves of damage evaluation against the number ofrepeated impact number to fracture the sample reveal three dis-tinct zones: fibre micro buckling and shear fracture of fibres espe-cially in compression area (1st region), initiation and propagationof matrix deformations and multiplication of delaminations (2ndregion), propagation of delaminations and fibre cracking and pullout especially in tensile area (3rd region). At higher impact ener-gies the 1st, 2nd, 3rd regions struck in narrower bands (in limitednumber of impacts) compared to the lower impact energies.
The deformation morphology of the single and repeatedly im-pacted samples was examined by means of scanning electronand optic microscopy. Main horizontal delamination occurred at
the side view of the samples at all energy values. Along the micro-scope investigations, delaminations and deformations were con-centrated in the compression zones of the samples. This maycause small shifting of neutral axis of the materials from compres-sion area to tensile area. As a result of this shift in of neutral axis, itshould be noted that, the compression strength of polymer com-posite materials was lower than their tensile strength under lowvelocity impact-fatigue loading.
References
[1] Ray BC. Effects of crosshead velocity and sub-zero temperature on mechanicalbehaviour of hygrothermally conditioned glass fibre reinforced epoxycomposites. Mater Sci Eng A – Struct 2004;379:39–44.
[2] Sohn MS, Hu XZ, Kim JK, Walker L. Impact damage characterization of carbonfibre/epoxy composites with multi-layer reinforcement. Compos Part B – Eng2000;31:681–91.
[3] Oya N, Hamada H. Mechanical properties and failure mechanisms of carbonfibre reinforced thermoplastic laminates. Compos Part A – Appl Sci Manuf1997;28A:823–32.
[4] Sanchez-Saez S, Barbero E, Zaera R, Navarro C. Compression after impact ofthin composite laminates. Compos Sci Technol 2005;65:1911–9.
[5] Gomez-del Rio T, Zaera R, Barbero E, Navarro C. Damage in CFRPs due to lowvelocity impact at low temperature. Compos Part B – Eng 2005;36:41–50.
[6] Sjögren A, Krasnikovs A, Varna J. Experimental determination of elasticproperties of impact damage in carbon fibre/epoxy laminates. Compos Part A– Appl Sci Manuf 2001;32:1237–42.
[7] Azouaoui K, Rechak S, Azari Z, Benmedakhene S, Laksimi A, Pluvinage G.Modelling of damage and failure of glass/epoxy composite plates subject toimpact fatigue. Int J Fatigue 2001;23:877–85.
[8] Zhao GP, Cho CD. Damage initiation and propagation in composite shellssubjected to impact. Compos Struct 2007;78:91–100.
[9] Breen C, Guild F, Pavier M. Impact of thick CFRP laminates: the effect of impactvelocity. Compos Part A – Appl Sci Manuf 2005;36:205–11.
[10] Hosur MV, Karim MR, Jeelani S. Experimental investigations on the response ofstitched/unstitched woven S2-glass/SC15 epoxy composites under single andrepeated low velocity impact loading. Compos Struct 2003;61:89–102.
[11] Sınmazçelik T, Arıcı AA, Günay V. Impact-fatigue behaviour of unidirectionalcarbon fibre reinforced polyetheremide (PEI) composites. J Mater Sci2006;41:6237–44.
[12] de Morais WA, Monterio SN, d’Almeida JRM. Evaluation of repeated low energyimpact damage in carbon-epoxy composite materials. Compos Struct2005;67:307–15.
[13] Gao SL, Kim JK. Scanning acoustic microscopy as a tool for quantitativecharacterisation of damage in CFRPs. Compos Sci Technol 2000;59:345–54.
[14] Jones FR. Handbook of polymer-fibre composites. Polymer science andtechnology series. New York: 1994.
[15] Shyr TW, Pan YH. Impact resistance and damage characteristics of compositelaminates. Compos Struct 2003;62:193–203.
[16] Sınmazçelik T, Arıcı AA. Determination of chemical corrosion effects by usinginstrumented impact testing on polyphenylenesulphide (PPS) composites. JMater Sci Lett 2002;21:1809–11.
[17] Walker L, Hu XZ. Mode I delamination behaviour of short fibre reinforcedcarbon fibre/epoxy composites following environmental conditioning. ComposSci Technol 2003;63:531–7.
[18] Tai NH, Yip MC, Lin JL. Effects of low-energy impact on the fatigue behavior ofcarbon/epoxy composites. Compos Sci Technol 1998;58:1–8.
[19] Saito H, Kimpara I. Evaluation of impact damage mechanism of multi-axialstitched CFRP laminate. Compos Part A – Appl Sci Manuf 2006;37:2226–35.
634 O. Çoban et al. / Materials and Design 30 (2009) 628–634