Embed Size (px)
Citation preview

1
This is a pre-review, pre-copyedit author version, not for redistribution of the article Carballo-Penela, A., Mateo-Mantecón, I., Doménech, J. L., & Coto-Millán, P. (2012). From the motorways of the sea to the green corridors' carbon footprint: the case of a port in Spain. Journal of Environmental Planning and Management, 55(6), 765-782. Doi 10.1080/09640568.2011.627422 Published by Taylor & Francis. From the motorways of the sea to the green corridors’ carbon footprint: the case of a port in Spain Adolfo Carballo-Penelaa1 , Ingrid Mateo-Mantecónb, Juan Luis Doménech Quesadac, Pablo Coto-Millánb aDepartment of Business Organization, University of Santiago de Compostela, Santiago de Compostela Spain.
Facultade de CC Económicas e Empresariais, Avd. Burgo das Nacións s/n. CP.15782. Tel: +34981563100 ext.11649 Fax : +34981 54 70 36. E-mail : [email protected] bDepartment of Economics, University of Cantabria, Santander, Spain.
Avd/ de los Castros s/n. CP. 39005. Santander Tel: +34942201567. Fax: +34942201603. Tel: + 34942201653. Fax: +34942201603. cDepartment of Environment. Port of Gijón, Gijón, Spain.
C/Claudio Alvargonzález 32, CP. 33201 Gijón. Tel: +34985 179600. Fax: +34 985 179696.
Abstract
Green Corridors are a European concept denoting long-distance freight transport corridors where advanced technology and co-modality are used to achieve energy efficiency and reduce environmental impact. Green corridors consider all kind of agents acting in the door-to-door co-modality chains, including ports. Carbon footprints (CF) provide companies, customers and other agents with information related to greenhouse gas (GHG) emissions from the supply chain of products, identifying key points, potential risks and opportunities of improvement. Its application in both the logistic networks and all modes of transport would allow for the creation of green corridors and sustainable motorways of the sea. This paper describes the method composed of financial accounts (MC3) used to estimate the CF of a port. The paper shows the effects of the method on the Port of Gijón (PAG), which steers the existing Gijón/Nantes/Saint-Nazaire motorway of the sea. The extension of the system to all nodes of the shipping line and other transport modes will lead in the long run to a carbon-neutral green corridor. Our findings show the importance of looking at indirect emissions in order to become a carbon neutral port.
Keywords: motorways of the sea; carbon footprint.
1 Corresponding author. Email: [email protected]

2
1. Introduction
Nowadays, the control of greenhouse emissions is a key tool in order to measure the
environmental impact of organizations and freight. The application of this measure at all
points and for every logistic agent involved in a green supply chain (Yenning and Sheu
2009; Zhu et al. 2008) would make possible to plan the reduction of emissions in the
chain, aiming to minimize emissions in the whole network. Thus, the main objective of
the so-called green corridors, reducing the emissions of freight passing through the net,
would be achieved. Such corridors are being promoted by the Directorate- General
Energy and Transport of the European Commission.
More concisely, since the publication of the White Book on Transport in 2001,
and its intermediate revision in 2006, the role of co-modality to achieve transport
sustainability in the EU has been strongly stressed (McEldowney et al., 2005). One of
the measures adopted was the European Motorways of the Sea, because they may
constitute key shipping routes between Member States, with regular services of high
quality, which combined with other transport modes can offer a more sustainable
alternative to the pure road transport.
With a ten year perspective, looking at the European Commission forecasts
about the success of the motorways of the sea, the objectives settled have not achieved,
because there are only a few motorways of the sea on use (the Gijón-Nantes is one of
them).
However, despite this modest development further to the measures designed to
achieve this aim, the European Commission adopted in October 2007 the so-called
“Freight transport Logistics Action Plan” to improve both efficiency and sustainability

3
of Freight Transport. One of the Plan’s proposals was the promotion of Green
Corridors, defined as an integrated transport concept where Short Sea Shipping, rail,
inland waterways and road, complement each other to enable the choice of an
environmentally friendly transport (European Commission Studies 2009).
Green supply corridors can be achieved through the appliance of strategies of
continuous emission reduction in a) ports b) vessels of the shipping line c) logistic
agents d) the other modes of transport up to the client. This allows establishing
connections with the industry which are aimed to extend the chain up to the extraction,
production and processing centres. The establishment of networks and alliances based
on sustainability seems to be an appropriate strategy to accomplish the objectives of the
Product Integrated Policy, which is one of the pillars of the Sustainable Development
Strategy of the European Union1.
The ecological and environmental added value of green corridors is derived
from its ability to provide an optimal framework for all kind of agents acting in the
door-to-door co-modality chains to achieve common arrangements and objectives (Van
Agtamaal and Swahn 2009).
As this is a newly established tool, the following information provides a short
summary of some specified milestones related to Green Corridors (Mulder 2009).
2006: Green Corridors idea developed in action group ENT7 from ERANET
Transport project.
2007, 3rd July: Green Corridors idea presented to Ben van Houtte/ DG Tren at
Dutch Transport Ministry.
2007, October: EU Action plan for Green Freight Corridors.
2007, November: Several Green Corridor DG Tren calls in FP7.
2008, December: Green Corridors in ENT+ proposal, cancelled 2009.

4
2009, October: Swedish Green Corridor Programme/ Initiative.
2009, 9th December: Green Corridor Conference, preparing for 2010 FP7 calls.
Events such as Green Port Logistics 2010, or Stockholm 2010, deal exclusively with
carbon management, as there is a growing demand by all sectors of the logistics supply
chain to reduce carbon emissions and implement a carbon neutral strategy. The success
of this initiative is not only determined by the level of investment but also by the
agents’ compromise and effort as well as by their ability to work together (European
Commission 2009).
One of the measures taken were the motorways of the sea. One way to promote the
motorways of the sea and to the stakeholders involved, is becoming more competitive
and contributing to their development, through the use of sustainability measures and
“carbon zero” strategies. These measures shall be implemented in ports, terminals,
shipping lines and other logistics agents. It is also one of the necessary steps for the
logical development of the motorways of the sea to the green corridors.
Therefore, it is not surprising that some of the most relevant ports have already
adopted this strategy. For example, the Port of New York has determined carbon direct
emissions derived from their activities and operations and found out they amount to
298,000 CO2 Tons2.
The Port of Oslo also determined its emissions on the basis of the ISO 14064-1
standard, by including direct emissions (456 t), indirect energetic emissions (49 t) and
other indirect emissions related to subcontracts, business and trips from home to work
(199 t). The total amounts to a 704 t CO2/year. Through the same method, the Port of
Rotterdam showed direct emissions of 8,960 t CO2/year, indirect energetic emissions of
7,230 tCO2 and other indirect emissions of 20,100 t (total: 36,290 CO2/year) (WPCC
2008).

5
These ports have already addressed strategic plans to reduce emissions. As an
example of this, both the port and the city of Rotterdam have carried out an ambitious
plan to diminish CO2 emissions –The Rotterdam Climate Initiative- the first phase of
which will end in 2025.
The European Sea Ports Organization (ESPO) has included these
recommendations in its latest statements, for instance, in the Policy statement on
reduction of Green House Gas emissions in port, of 15 May 2009, by means of which,
under the umbrella of the International Association of Ports and Harbours (IAPH), it
coordinates the regional implementation of the World Ports Climate Declaration
(WPCD) and endorses the technical developments of the projects of the Worlds Ports
Climate Initiative (WPCI), which is the follow-up initiative of WPCD. The
recommendations made by the ESPO on this issue are the following: 1) calculation of a
port’s CO2 footprint; 2) reduction of CO2 emissions from port operations and
development; 3) reduction of CO2 emissions by promoting usage renewable energy; 4)
reduction of CO2 emissions of hinterland transport; 5) reduction of CO2 emissions of
ocean going shipping (ESPO 2009).
The Climeport Project and other recent initiatives have joined together several
important Mediterranean ports such as Valencia (Spain), Algeciras (Spain), Marseille
(France), El Pireo (Greece), Koper (Slovenia) and Livorno (Italy), in order to determine
their Carbon Footprint and establish measures to reduce the impacts of climate change
(Climeport 2009).
The success of these initiatives depends on the existence of robust tools for
assessing greenhouse gas emissions from green corridors. This paper proposes the
application of Carbon Footprint to ports, vessels, maritime lines, agents and others
modes of transport that configure green corridors and motorways of the sea with the aim

6
to continuously reduce greenhouse gas (GHG) emissions until they become carbon
neutral3.
We describe one of the available methodological approaches for assessing
Carbon Footprints of organizations, goods, and services, the method composed of
financial accounts (MC3). The main goal of this study is to clarify how to apply this
method to estimate the carbon footprint of a part of a green corridor showing what kind
of results are available with this methodological approach. The paper includes a case
study, assessing the carbon footprint of the Port of Gijón (PAG), which steers the
existing Gijón/Nantes/Saint Nazaire motorway of the sea. This case study permits
checking the utility of the obtained information at this level, being a first step in order to
apply this method to a whole green corridor.
2. The Carbon Footprint: Material and Methods
2.1 From ecological footprint to corporate carbon footprint
The ecological footprint (EF) is a well-known index designed at the beginning of the
90’s by Mathis Wackernagel and William Rees to determine biological resources use
and waste generation in terms of the appropriate ecosystem surface, comparing them
with the biosphere’s capacity in a certain year (Wackernagel and Rees 1996).
Present definitions remark that the ecological footprint can be applied not only
to individuals and populations, but also to different types of activities such as goods and
organizations (Global Footprint Network 2007). A large number of works (e. g.
Wackernagel and Rees, 1996, Ewing et al. 2010) lay out in detail index’s concept,
theoretical basis of the calculation method, objectives, use and evolution over time. In
addition, there is a considerable debate, with regards to both the potential of the index
and the interpretation of the corresponding results (e.g., Van der Bergh and Verbruggen
1999, Rees 2006, Fiala 2008 or Kitzes et al. 2008, Ewing et al. 2010).

7
The carbon footprint (CF)concept is far more recent and much less defined than
the EF’s. The carbon footprint is orphan, which allows the existence of different
interpretations of the index. Some of the main differences are related to: i) gases which
emissions are present in the index; ii) the relationship with analysis of the ecological
footprint.
In the first case, some studies consider that the CF should include several
greenhouse gases, so it should be expressed in CO2equivalent tones (Doménech 2004,
Carbon Trust 2007, BSI 2008),while others (Global Footprint Network 2007,
Wiedmann and Minx 2008) prefer to stick to only one gas, CO2.
On the other hand, applying the index to certain realities, such as organizations
and their products, brings up new issues that should be taken into account. Several
studies recommend limiting the footprint of goods and services to the direct emissions
of the company which generates them. In other cases, indirect emissions are also
considered, by including the emissions of the company’s chain of suppliers (Wiedmann
and Minx 2008).
All these matters cause important differences in the proposed definitions. For
example, Global Footprint Network, reference body for ecological footprint analysis,
provides the following definition of CF: "The demand on biocapacity required to
sequester (through photosynthesis) the carbon dioxide emissions from fossil fuel
combustion" (Global Footprint Network 2007, p. 1). The definition by Carbon Trust is
much wider as it includes: “the total emission of greenhouse gases in carbon equivalents
from a product across its life cycle from the production of raw material used in its
manufacture, to disposal of the finished product (excluding in-use emissions)” (Carbon
Trust 2007, p.4).

8
For this study, it has been considered that the determination of the ecological
footprint, specially the carbon footprint of organizations, companies and their related
goods and services, presents special features which have to be examined (Carballo-
Penela and Domenech 2010). The expressions corporate ecological footprint (CEF) and
corporate carbon footprint (CCF) have been chosen as these clearly show that the
footprint estimated refers to the enterprises field. The Kyoto Protocol establishes goals
for emission reduction for six gases: CO2, N2O, CH4, HFC, PFC and SF6. The inclusion
of emissions of these gases in the CCF analysis increases their utility for those
companies that have goals of emissions linked to this and post-Kyoto Protocol
international agreements.
Finally, CEF and CCF should not be limited to direct or on-site effects, as it is
useful to take into account the emissions along the whole chain of suppliers of the goods
and services produced. This assumption i) prevent the index from excluding relevant
impacts ii) promote joint decision making processes of companies which belong to the
same chain of suppliers and which aim to reduce product footprint and search for new
business opportunities iii) make possible for the indicator to be used in order to create
an ecolabel. This ecolabel informs the final consumer about the surface/emissions which
have been used up to the time of purchase iv) the approach applied is in line with the
integrated product policy, one of the main bases of the European Sustainable
Development Strategy (EC, 2006).
2.2 Calculation methods for the estimation of the CCF
During the last decade, several methodologies aimed to calculate the carbon footprint
have been developed. Unlike simple methods, they do not only estimate the emissions
produced by certain activities but in most cases they are intended to estimate all or most
company emissions on the basis of a single calculation method.
9
The achievement of a standard method, applicable to different types of activities
and different types of companies (size, activity, etc), is a key issue due to the
requirements of both the Kyoto Protocol and the post-Kyoto period, for which there is
still no consensus. The existing standards for information concerning generated
emissions (WRI/WBCSD 2004, AENOR 2006 etc) do not solve the lack of
standardization, as they do not set specific guidelines for the calculation. The ecological
footprint standards drawn up by Global Footprint Network do not solve the problem
either, as they allow the use of different methodologies (Global footprint Network
2009).
The use of input-output techniques to determine the CCF (Wiedmann and
Lenzen 2009, Wiedmann et al. 2009), the Publicly Available Specification (PAS) 2050
(BSI 2009, Carbon Trust 2008a) or the the method composed of financial accounts
(MC3) (Doménech, 2004, Carballo-Penela and Doménech 2010) are some of the most
relevant methodological approaches. Next, the method applied in this paper, the MC3 is
briefly described.
2.3 The method composed of financial accounts (MC3)
The MC3 was developed between 2000 and 2002 by biologist J. L. Doménech. The
original method, including guidelines for assessing the CEF-CCF of organizations
(Carballo Penela and Doménech, 2010), was published by the Spanish Association for
Standardisation and Certification (AENOR) (Doménech 2007). This method has been
improved through the cooperation with five Spanish universities, and the results of this
work have been published in several papers (e.g., Marañon et al. 2008, Carballo-Penela
and Doménech, 2010, Coto et al. 2010).

10
Carballo-Penela (2009, 2010) has recently developed a method to estimate the
CEF-CCF of goods and services along the suppliers’ chain, from the raw materials to
the final consumer. In this paper it is described how the MC3 can be used to determine
the organizations’ footprint, the one used for the members of a green corridor, focusing
on the Gijón Port Authority.
The information to determine the CCF through the MC3 is mainly obtained from
accounting documents such as the balance sheet and the profit and loss account, so all
activities linked to each organization are perfectly defined. The MC3 calculates the
footprint of all goods and services included in the accounts, waste derived from the
acquisition of such goods and services and space occupied by the company, premises
which are included in the accounts4.
The CCF is estimated on the basis of the calculation sheet, which works as a
consumption land use matrix (CLUM) which applies the consumption of goods and
services needed by companies (Carballo-Penela et al., 2011).
The rows of the CLUM matrix show the footprints for each category of
good/service consumed. Columns include, amongst several other elements, relevant
categories of productive space, according to the ecological footprint analysis (see Table
1).
Columns are divided in 6 groups. The first group (column 1) stands for the
different types of consumables. They are classified in 8 main categories, energy
consumption, divided in two subcategories (electricity and fuels), materials, subdivided
in 3 subgroups (depreciable material, non-depreciable materials and construction
materials), services, residues and waste, land use, agricultural and fishing resources,
forest resources and water. Each category can include as many products as desired.

11
The second group, columns 2-6, shows the consumption of each product, in
specific units. The first column relates to product characteristics. The second column
shows consumption values in monetary units, while the third one gives consumption in
tons. The fifth column shows the amount of energy per consumption unit, in gigajoules
(Gj), by means of multiplying the tons of each product (third column) by the amount of
energy/ton used to produce it (Gj/t) (forth column).
The energy intensity factors show the amount of energy used to produce all the
products included in the CLUM matrix, considering a standard life cycle. At present,
the main sources used are Wackernagel et al. (2000), Simmons et al. (2006) and
European Commission (2007).
The third group of columns (columns 7 and 8) shows good productivity. Column
7 deals with natural productivity, which is used to calculate the CEF, in tons per
hectare. Column 8 shows energy productivity, in Gj per hectare. Energy productivity
shows how many tons of each fuel were needed to generate the CO2volume which can
be absorbed per hectare on an annual basis, applying an absorption rate per hectare/year
of 5.21 t CO2/ha/year (IPCC 1997)5.
The fourth group includes six columns (9-14), which give a breakdown of the
footprint by productive spaces. Those are the ones used to calculate the population
ecological footprint (CO2 absorption land, Cropland, Pastures, Forest, Built-up land and
Fisheries ground).
12
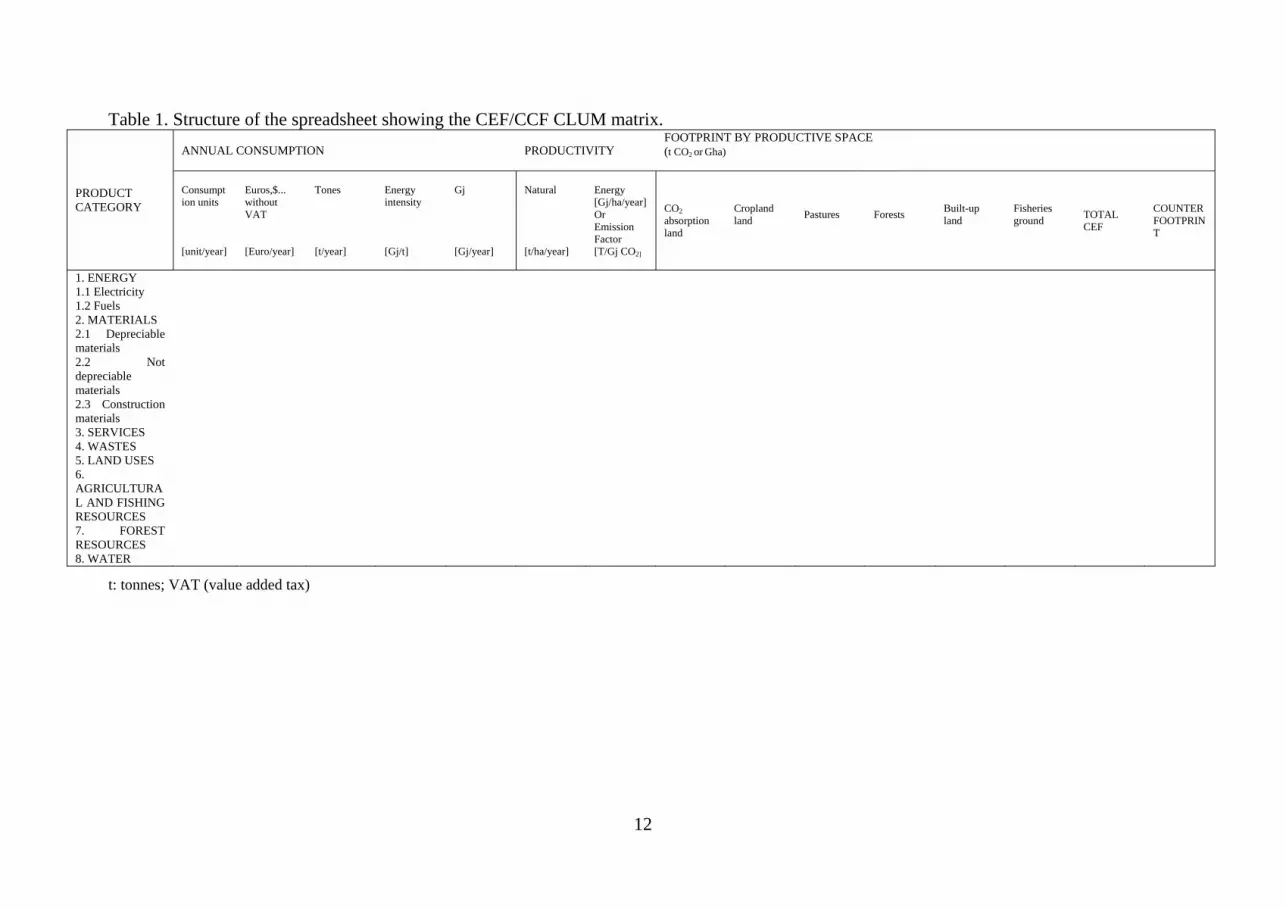
Table 1. Structure of the spreadsheet showing the CEF/CCF CLUM matrix.
PRODUCT CATEGORY
ANNUAL CONSUMPTION PRODUCTIVITY FOOTPRINT BY PRODUCTIVE SPACE (t CO2 or Gha)
Consumption units [unit/year]
Euros,$... without VAT [Euro/year]
Tones [t/year]
Energy intensity [Gj/t]
Gj [Gj/year]
Natural [t/ha/year]
Energy [Gj/ha/year] Or Emission Factor [T/Gj CO2]
CO2 absorption land
Cropland land
Pastures
Forests
Built-up land
Fisheries ground
TOTAL CEF
COUNTER FOOTPRINT
1. ENERGY 1.1 Electricity 1.2 Fuels 2. MATERIALS 2.1 Depreciable materials
2.2 Not depreciable materials
2.3 Construction materials
3. SERVICES 4. WASTES 5. LAND USES 6. AGRICULTURAL AND FISHING RESOURCES
7. FOREST RESOURCES
8. WATER
t: tonnes; VAT (value added tax)

13
Finally, the last column shows the counter footprint. The concept of counter
footprint is based on the fact that even though it is desirable for companies and
organizations to reduce their footprint by becoming more efficient and reducing their
consumption, it is also positive for companies to invest in natural capital. Thus, natural
capital investments reduce their footprint. In such a way, the index encourages the
private sector to preserve natural areas, which is positive in terms of sustainability. By
deducting the counter footprint from the CCF the net CCF is obtained (Carballo-Penela
et al., 2011).
The consumption of both goods and services and energy and natural productivity
allows calculating the CEF-CCF for acquired goods, as shown in figures 1 and 2.
Figure 1. Energy Footprint.
Figure 2. Natural Footprint.
The footprint of non biotic goods is due to the energy used in their production.
As regards the consumption of natural and biotic resources, which can be transformed
into surface dividing tons consumed by natural productivity, it does also include the
energy used in order to produce them, which is determined by applying an energy
intensity factor to the consumption of agricultural, fisheries and forestry resources.
The focus will be now placed on the CCF calculation. The latter includes not
only the CO2 emissions generated by the company premises or by its means of
productions (for example those derived from solid-fuel consumption) but also emissions
generated by the energy used in the production of goods and services acquired by the

14
company, independently of whether or not they are used in the production process. In
the latter case the Gj used in the production of a certain good (Figure 1) is transformed
into CO2 emissions by applying emission factors (t CO2/Gj) from The
Intergovernmental Panel on Climate Change6 (IPCC 1997).
The CCF includes emissions from wood and derived products, which are linked
to the “Forests” as area, as the emissions which are not absorbed by the forest area
needed to produce the wood included in the demanded products are also considered. In
the next future it will include all the greenhouse gas emissions subject to the Kyoto
Protocol able to be transformed into CO2 equivalent tons by applying the Global
Warming Potential7 (GWP) with a 100 year horizon (IPCC 2007).
2.3.1 Differences between the CCF calculation methods.
Despite sharing the same objective, the existing CCF calculation methods use different
means to reach it.
Table 2. The MC3 and other methodological approaches
Table 2. The MC3 and other methodological approaches
Concept Input-Output Techniques
PAS 2050
CBA MC3
Calculation method Input-output analysis/
Process LCA
Component-based approach/LCA
MC3 is based on Compound-Method
Activities included in CCF All the activities by an organization
All the production activities
Relevant activities
All the activities by an organization
Organization source of information
Basically, finacial accounts
Maps of processes/ LCA inventories
Basically, finacial accounts
Basically, financial accounts
Transformation of financial information into mass unit data
No needed. The method uses monetary input-output coefficients
No needed Needed. No explicit method
Needed. Explicit method
Equivalence and yield factors Yes No No Yes Is the required software accessible?
No No No Yes
Source: Carballo-Penela et al., (2011).

15
These methods differ on issues such as the activities that must be included in the
CCF, the use of equivalence and performance factors, energy intensity and related
conversion factors applied, or how to convert consumption expressed in monetary units
into physical units (Table 2). In any case, even if consensus was achieved on these
issues, the different nature of the calculation methods would lead to different results.
All these methods show strengths and weaknesses, but it has been not
considered expedient to carry out a detailed analysis in this paper. For the aim of this
work, it is more useful to stress the reasons which favor the use of MC3 at an
organization level (Carballo-Penela et al., 2009; Carballo-Penela and Doménech, 2010;
Carballo-Penela et al., 2011).
The MC3 is a comprehensive method, which includes the footprint of goods and
services consumed by organizations, independently of whether or not they are
linked to the production process. The CCF related to waste is also included by
taking into account the emissions generated by its treatment and removal
processes.
It is based on the composed method developed by Wackernagel and Rees, a
solid technique well known by ecological footprint researchers.
It is a technically viable method, as it is not necessary to possess a specific
knowledge. Any person able to use a calculation sheet can determine CCF.
The MC3 is a transparent method. Both the calculation sheet and the information
necessary to calculate the CCF, including energy intensities and emission
factors, are available at: http://www.huellaecologica.com, which includes all
sources of information.

16
It is a flexible method. The calculation sheet allows for the possibility of adding
or modifying the factors used, by adapting to the characteristics of different type
of companies.
It is a complete method, which collects the footprint from the consumption of all
goods and services and wastes generated by a company, including direct and
indirect emissions.
The method is constantly being updated and improved by a working group
formed by members of 5 Spanish universities which is in charge of problem-
solving. The MC3 approach has been recognized by the Spanish Observatory for
Sustainability as a valid methodology for assessing and reducing GHG
emissions arising from companies under the frame of the Spanish GHG
Voluntary Reduction Agreement.
At present, the method can be applied to both organizations and their products,
having a great potential on products and services ecolabelling issues.
There are also some remarkable advantages for supply chain analysis:
The footprint of every member of a supply chain, e.g. a green corridor, is assigned to the
produced goods by that organization. The fact that each company covers a complete
phase of the chain 1) implies lower economic and time costs; 2) clearly delimits the
activities under analysis, favouring the collection of information obtained from each
company; 3) avoids dealing cut-off criteria.
The theoretical presentation of the method requires determining the participants in the
supply chain. In practice, every company obtains the environmental information of the
purchased goods/services from their suppliers. This fact makes possible the integration
of the environmental information in the market in a practical way, thus avoiding high
communication costs (Carballo Penela et al., 2011).

17
3. Results
The MC3 is applied to the Port Authority of Gijón from 2004 to 2008. Located on the North coast of Spain, the Port of Gijón (PAG) is part of the state-owned
Spanish ports and harbours system is managed by 28 Port Authorities. The Port of Gijón
is the Spanish leader in moving bulk solids, mainly linked to coal, iron and cement, with
the movement of goods, around 20 million tons. Figure 3 shows the evolution of the
main traffics between 2004 and 2008.
Figure 3. Evolution of PAG’s traffics. Period 2004 to 2008.
The Port of Gijon is a part of the Gijon-Nantes motorway of the sea, being the only
European port present in the SuperGreen project (see endnote 1). The resulting footprint
is derived from both solid-fuel consumption carried out by the organization and
emissions generated by the electricity consumed in its premises as well from those
derived from both the acquisition of goods and services and waste generated by the Port
Authority.
Table 3. Evolution of PAG’s nets CCF and CEF. Period 2004 to 2008. Indicador 2004 2005 2006 2007 2008 Income(€) * 35,948,895 40,970,804 38,752,272 39,914,840 39,201,740 Goods moved (T) 20,060,466 21,790,871 20,488,293 20,782,000 19,331,000 Net CCF (tCO2/year) 30,426 32,097 30,194 29,485 32,408 Net CEF (Gha/year) 5,298 6,693 6,182 6,167 6,148
* Net turnover

18
Table 3 show that the net CCF in 2004 is 30,426 tCO2, and it follows the following
pattern: it shows a 5.5% decrease from 2004 to 2005, it decreases by 5.9% in 2006 and
by 1.2% in 2007, to subsequently increase by 8.6% in 2008. Table 3 also shows the
evolution of the net CEF, which increases considerably from year 2004 to 2005
(26.3%), decreases by 7.6% in 2006, 0.24% in 2007 and 0.3% in 2008.
Table 4 shows the breakdown of the PAG’s net CCF by consumption categories.
The greatest port impact, which took place in 2008, with an 81.8% increase in the gross
CCF, stands for materials’ footprint (70.2% of them being building materials and 11.6%
the rest of the materials). Electricity footprint follows (11.7%), then services and service
contracts, fuel (1.7%), forest resources and water (1.6%), agricultural resources (0.5%)
and waste (0.08%).
Table 4. Evolution of PAG’s CCF broken down by categories (t CO2/year)
Category 2004
2005
2006
2007
2008
Electricity 5,040 (16.5%)
3,909 (12.2%)
3,893 (12.9%)
3,815 (12.8%)
3,801 (11.7%)
Fuels 676 (2.2%)
705 (2.2%)
839 (2.8%)
578 (1.9%)
550 (1.7%)
Materials 4,036 (13.2%)
3,916 (12.2%)
3,795 (12.5%)
3,728 (12.5%)
3,756 (11.6%)
Building materials 16,281 (53.4%)
19,000 (59.1%)
19,113 (63.2%)
19,411 (64.9%)
22,772 (70.2%)
Services and contract services 786 (2.6%)
1,447 (4.5%)
1,197 (4.0%)
1,247 (4.2%)
863 (2.7%)
Waste 1.143 (3.7%)
1.250 (3.9%)
10 (0.0%)
59 (0.2%)
27 (0.1%)
Agricultural resources 410 (1.3%)
521 (1.6%)
449 (1.5%)
490 (1.6%)
159 (0.5%)
Forest resources and water 2,113 (6.9%)
1,401 (4.4%)
950 (3.1%)
569 (1.9%)
532 (1.6%)
Gross Footprint 30,485 32,148 30,245 29,896 32,460 Counter Footprint 59 51 51 51 52 Net Footprint 30,426 32,097 30,194 29,845 32,408
The net CCF increased in year 2005, due to a considerable rise in the port
activity and to the corresponding rise in the movement of goods, for which it is
necessary to use more electricity, fuels, materials and services, etc. A record 21.8

19
million tons of goods moved was reached during 2005, and the extension of port
facilities (up to date, the largest investment in a public work carried out in Asturias)
began.
Nevertheless, during year 2006 the Port Authority reached again around 20
million tons of goods, similarly to previous years, which has the effect of reducing
slightly the footprints in terms of ecoefficiency (figures 4 and 5). Due to this fact,
during 2006 a reduction of the net CCF in several consumption types (electricity,
materials, services, agricultural resources, forest resources and water) was registered, in
addition to the considerable cut in solid-fuel production, consequence of the separation
of vessels and other users of the port, which were once included. During 2007 good
consumption restraint remained and so did the footprint which even decreased slightly.
During year 2008 the restraint on consumption remained for almost every
category and it even decreased for some of them, such as agricultural resources.
Nevertheless, there is an increase in building materials, due to the execution of several
works, which increases the footprint compared to the previous year.
As it has already been pointed out, this absolute values are linked to port activity
so comparison between ports must be carried out in relative terms, that is, in terms of
ecoefficiency. The latter is determined by dividing business activity (in terms of
business or amount of goods) by the environmental impact (net CCF). Figures 4 and 5
show the results of these ecoefficiency indexes.
Even though ecoefficiency has improved in the period 2004-2007 (better
incomes and more goods moved per carbon footprint unit), it worsens in 2008 in terms
of freight. The reasons behind this fact are to be found in an increase of emissions in
absolute terms due to building works, which is not corresponded by an increase in
income or goods moved, which in fact, decreased. During year 2008, there is a decrease

20
of 100 tons of goods moved per ton of CO2 and of 127 Euros less than in 2007 (Figures
4 and 5).
Figure 4. Ecoefficiency in terms of annual income per ton emitted CO2 (€/tCO2)
Figure 5. Ecoefficiency in terms of goods moved annually per ton emitted CO2 (t/tCO2)
4. Discussion
The analysis of the CCF in the aforementioned port shows some interesting results:
From 2004 to 2006 PAG emissions increase/decrease as the traffic of goods of
Port Authorities increases/decreases (Table 3). This does not mean that traffic
has to be reduced in order to reduce the CCF. It actually means that issues such
as promoting transport efficiency, clean technologies, etc, would lead to reduce
21
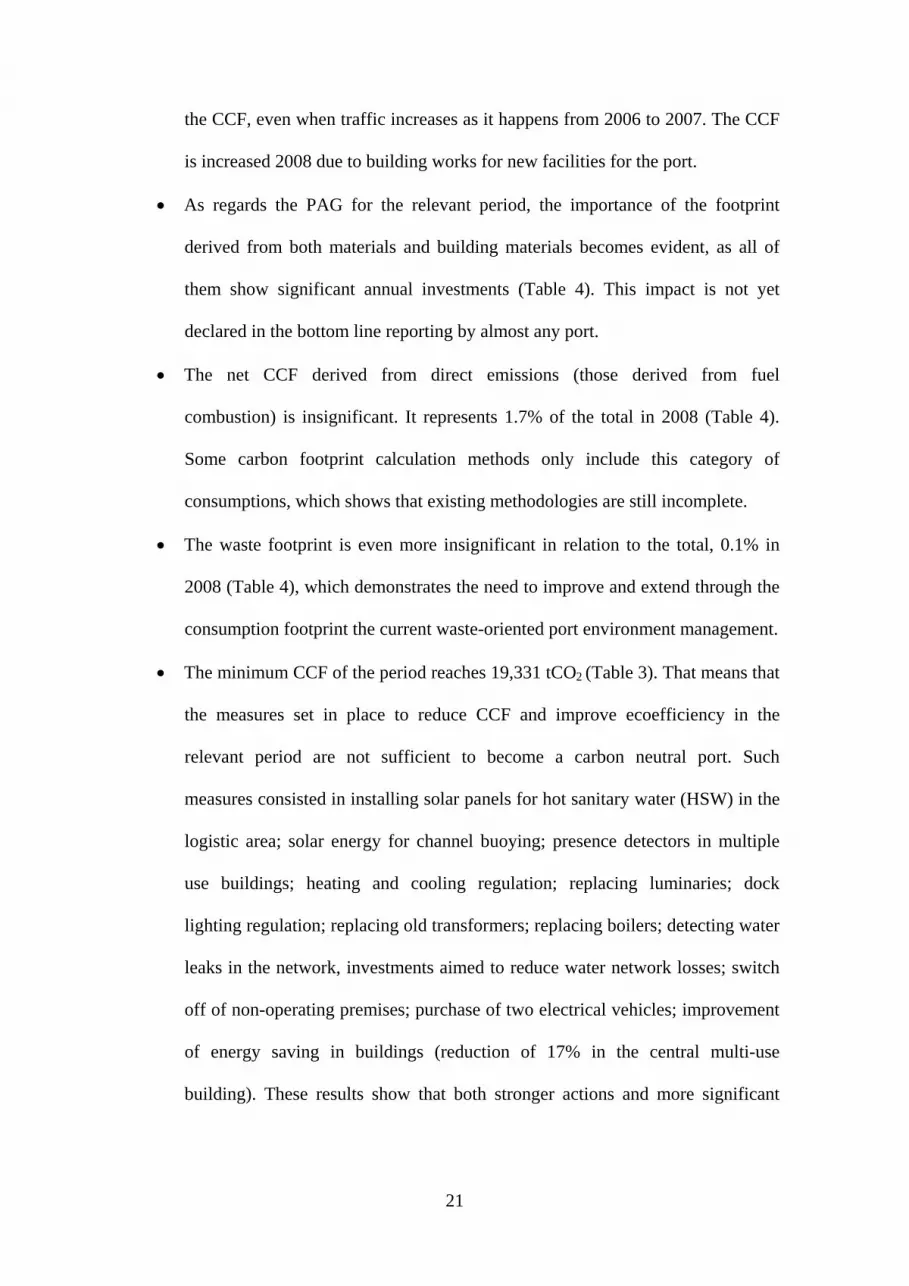
the CCF, even when traffic increases as it happens from 2006 to 2007. The CCF
is increased 2008 due to building works for new facilities for the port.
As regards the PAG for the relevant period, the importance of the footprint
derived from both materials and building materials becomes evident, as all of
them show significant annual investments (Table 4). This impact is not yet
declared in the bottom line reporting by almost any port.
The net CCF derived from direct emissions (those derived from fuel
combustion) is insignificant. It represents 1.7% of the total in 2008 (Table 4).
Some carbon footprint calculation methods only include this category of
consumptions, which shows that existing methodologies are still incomplete.
The waste footprint is even more insignificant in relation to the total, 0.1% in
2008 (Table 4), which demonstrates the need to improve and extend through the
consumption footprint the current waste-oriented port environment management.
The minimum CCF of the period reaches 19,331 tCO2 (Table 3). That means that
the measures set in place to reduce CCF and improve ecoefficiency in the
relevant period are not sufficient to become a carbon neutral port. Such
measures consisted in installing solar panels for hot sanitary water (HSW) in the
logistic area; solar energy for channel buoying; presence detectors in multiple
use buildings; heating and cooling regulation; replacing luminaries; dock
lighting regulation; replacing old transformers; replacing boilers; detecting water
leaks in the network, investments aimed to reduce water network losses; switch
off of non-operating premises; purchase of two electrical vehicles; improvement
of energy saving in buildings (reduction of 17% in the central multi-use
building). These results show that both stronger actions and more significant

22
investment should be carried out to achieve a lower footprint and higher
ecoefficiency.
5. Conclusions
Carbon neutral strategies will be key to the success and differentiation of green
corridors. ESPO joins the international demand for carbon emission reduction and
promotes measures aimed to achieve a 20% carbon footprint reduction by year 2020.
Port Authorities, local and regional governments, logistic agents and port stakeholders
should also contribute to it.
Nowadays, different standards like ISO 14040, ISO 14044 or Global Footprint
Network Standards, contain guidelines for the assessment of the CCF of products and
organizations. These standards provide sufficient flexibility to allow different
approaches to suit the specified requirements they contain, existing relevant differences
in terms of the calculation method and some assumptions involved in the estimation of
the indicator.
This paper describes one of the existing approaches the method composed of
financial accounts (MC3). MC3 offers useful information for sustainable development,
carbon management of organizations and sustainable consumption, being a flexible,
transparent, and easy-to-apply method. MC3 can be applied to motorways of the sea and
also to green corridors, fitting the needs of carbon footprint calculation of ports, means
of transport and other agents of the logistic network. We have chosen a port, the Port
Authority of Gijon, included in the Gijón/Nantes/Saint-Nazaire motorway of the sea and
the green corridors SuperGreen project has been chosen, as an example of how carbon
footprint can be calculated for all the stakeholders involved in it.
Our findings show the importance of looking at indirect emissions in order to
become a carbon neutral port. Emissions from electricity, materials, building materials,

23
services and contract services, wastes, agricultural resources and forest resources and
water reaches an average of 30,324 tCO2 in the studied period (97.84% of the CCF).
Several researchers also remark the importance of indirect CCF (Carballo Penela, 2010;
Wiedmann et al., 2009).
Measures to reduce both fuels and electricity emissions, commonly considered
by other CCF methodological approaches, are needed but only affect to 15.38 % of the
CCF in the studied period. In other words, carbon neutrality requires measures beyond
reducing electricity and fuel emissions. In this context, completeness of methods for
carbon footprinting is a key factor in order to implement carbon Neutral strategies.
Regarding PAG results, this port has reduced emissions from 2004 to 2007 in both
absolute and relative terms. Building works for new port facilities have increased the
CCF in 2008. However, building materials footprint should be lessen when new
facilities are finished. A bigger port will probably move more goods, being positive in
terms of ecoefficiency.
PAG should pay attention to absolute emissions, since is quite far from being a carbon
neutral port. Efficiency in the use of materials and replacing the electricity supplier by
one producing renewable energy would contribute to the reduction of the CCF of the
port. The footprint of materials and building materials used buy PAG would also be
decreased if the ecolabelling systems supply information on the CCF of each material.
In this case, this port could choose those with a lower footprint.

24
Appendix: Acronyms and Abbreviations
CF: Carbon footprintCCF: Corporate carbon footprint
CEF: Corporate ecological footprint
CLUM: Consumption land use matrix
EF: Ecological footprint
ESPO: European sea ports organization
Gha: Global hectare
GHG: Greenhouse gas
GWP: Global warming potential
HSW: Hot sanitarywater
IAPH: Association of ports and harbours
IPCC: Intergovernmental Panel on Climate Change
MC3: Method composed of financial accounts (from Spanish “Método compuesto de
las cuentas constables”)
PAG: Port of Gijón (from Spanish “Autoridd Portuaria de Gijón”)
UNEP: United Nations environment programme
WMO: World meteorological organization
WPCD: World ports climate declaration
WPCI: World ports climate initiative
WRI: World resources institute
WBCSD: World business council for sustainable development

25
Notes section
1 Initiatives as SuperGreen Green corridors Project promote the Green Corridors concept in Europe in order to improve energy efficiency and to reduce the environmental footprint of the transport sector. Launched at the beginning of 2010, the project SuperGreen is a key tool to assist the European Commission with developing the Green Corridor idea.
2 The Port of New York was one of the first ones to set the objective “carbon neutral” for 2010, and reduce its environmental footprint through both an ambitious strategic plan and an aggressive plan of investments which amounts to several million dollars in the next few years (Port Authority of New York and New Jersey 2008).
3 That is having a zero carbon footprint by balancing a measured amount of carbon released with an equivalent amount sequestered or offset.
4 That is the origin of the name “method composed of financial accounts”. Provision of information on certain topics (waste generation, land use, etc) linked to other company departments can be necessary in cases when such information does not appear in the accounts.
5 Starting from 2010, a 3.67 tCO2 /ha/year rate will be applied (IPCC 2007). 6 The Intergovernmental Panel on Climate Change (IPCC) is the leading international body for
the assessment of climate change. It was established by the United Nations Environment Programme (UNEP) and the World Meteorological Organization (WMO) to provide the world with a clear scientific view on the current state of knowledge in climate change and its potential environmental and socio-economic impacts.
7 Global-warming potential (GWP) is a relative measure of how much heat a greenhouse gas traps in the atmosphere. It compares the amount of heat trapped by a certain mass of the gas in question to the amount of heat trapped by a similar mass of carbon dioxide.
References
AENOR, 2006 UNE-EN ISO 14044: 2006. Gestión ambiental. Análisis de ciclo de
vida. Requisitos y directrices. Madrid: AENOR Ediciones.
British Standards Institute (BSI), 2008. PAS 2050: 2008. Specification for the
assessment of the life cycle greenhouse emissions of goods and services. London:
British Standards Institute.
Carballo-Penela, A., 2009. A pegada ecolóxica de bens e servizos: desenvolvemento dun
método de cálculo e aplicación ao ciclo de vida do mexillón en conserva en Galicia.
Thesis (Ph.D).University of Santiago de Compostela.

26
Carballo Penela, A., Doménech, J.L., 2010. Managing the carbon footprint of products:
the contribution of the method composed of financial statements (MC3). International
Journal of life Cycle Assessment, 15, 962-969.
Carballo Penela, A., Doménech, J.L., García-Negro, M.C., 2011. Environmental supply
chain management with MC3: the case of canned mussels in Galicia (Spain). Journal of
Cleaner Production (in revision)
Carballo-Penela, A., M.C. García-Negro, Doménech, J.L., 2009. A methodological
proposal for the corporate carbon footprint: an application to a wine producer company
in Galicia (Spain). Sustainability, 1, 302-318.Carbon Trust, 2006. Carbon footprints in
the supply chain: the next step for business. London: The Carbon Trust.
Carbon Trust, 2007. Carbon footprint measuring methodology 1.3. London: The Carbon
Trust.
Climeport, 2009. Second Technical meeting of Climeport. Available from:
http://www.climeport.com/en/documentation/doc_details/11-second-technical-meeting-
of-the-climeport-project-in-pireo-greece.html. [Accessed 6 Dec 2010]
Coto-Millán, P., Mateo-Mantecón I., Doménech J.L, Carballo-Penela A., Pesquera
M.A., 2010. Evaluation of Port Externalities: The Ecological Footprint of Port
Authorities. In: P. Coto-Millán, M.A. Pesquera, J. Castanedo, eds. Essays on Port
Economics. Berlin: Springer Physica-Verlag 323-340.
Doménech JL 2004. Huella ecológica portuaria y desarrollo sostenible. Puertos, 114,
26-31.
Doménech, J.L., 2007. Huella ecológica y desarrollo sostenible. 2nd ed. Madrid:
AENOR Ediciones.

27
European Commission, 2006. Making product information work for the environment.
Final Report of the Integrated Product Policy Working Group on Product Information.
Brussels: European Commission.
European Commission, 2007. Whel-to-wheels Analysis of Future Automotive Fuels and
Powertrains in the European Context. Brussels: European Commission.
European Commission, 2009. Evaluation of the Common Transport Policy (CTP) of the
EU from 2000 to 2008 and analysis of the evolution and structure of the European
transport sector in the context of the long-term development of the CTPReview of the
Common Transport Policy. Appendix A. Task 1 reports (on specific policy areas). Task
1.3. Logistics, inter- and co-modality. Brussels: European Commission.
European Commission Studies, 2009. Evaluation of the Common Transport Policy
(CTP) of the EU from 2000 to 2008 and analysis of the evolution and structure of the
European transport sector in the context of the long-term development of the CTP.
Brussels: European Commission.
European Sea Ports Organization (ESPO), 2009. Policy statement on reduction of Green
House Gas emissions in ports [online]. Available from:
http://www.espo.be/downloads/archive/ba3fecf0-7a1a-4c8f-9bbf-06805ea34022.pdf
[Accessed 20 Feb 2010]
Ewing, B., Reed, A., Galli, A., Kitzes, J., Wackernagel, M., (2010) Calculation
Methodology for the National Footprint Accounts, 2010 Edition. Oakland: Global
Footprint Network.
Fiala, N. 2008. Measuring sustainability: why the ecological footprint is bad economics
and bad environmental science. Ecological Economics, 67, 519–525.

28
Global Footprint Network, 2007. Footprint term glosary. Oakland: Global Footprint
Network.
Global Footprint Network, 2009. Ecological Footprint Standards 2009. Oakland:
Global Footprint Network.
IPCC, 1997. Revised 1996 IPCC Guidelines for National Greenhouse Gas Inventories
reporting Instructions, 1997 [online]. Available from: http://www.ipcc-
nggip.iges.or.jp/public/gl/invs1.htm. [Accessed 23 March 2009].
IPCC, 2007. IPCC Fourth Assessment Report (AR4) Changes in Atmospheric
Constituents and in Radiative Forcing [online]. Available from: http://ipcc-
wg1.ucar.edu/wg1/Report/AR4WG1_Print_Ch02.pdf. [Accessed 26 Jan 2009]
Kitzes, J., Galli, A., Riz, S.M., Reed, A., Wackernagel, M., 2008. Guidebook to the
National Footprint Accounts: 2008 Edition. Oakland: Global Footprint Network.
Marañón, E., Iregui, G., Doménech, J.L., Fernández-Nava, I., González-Arenales, M.,
2008. Propuesta de índices de conversión para la obtención de la huella de los residuos
y los vertidos. OIDLES, 1, 56-72.
McEldowney, M., Ryley, T., Scott, M., Smyth, A., 2005. Integrating Land-use Planning
and Transportation in Belfast: A New Policy Agenda for Sustainable Development?.
Journal of Environmental Planning and Management, 48, 507-526.
Mulder, F., 2009. Advanced technologies in green transport corridors. The Green
corridors conference towards climate neutral freight transport, 9 December 2009
Brussels.
Port Authority of New York and New Jersey, 2008. Port Authority of New York and
New Jersey Aims to be Carbon Neutral by 2010 [online]. Available from:

29
http://www.panynj.gov/press-room/press-item.cfm?headLine_id=971. [Accessed 12 Jan
2010].
Rees, W.E., 2006. Ecological footprints and bio-capacity: essential elements in
sustainability assessment. In: J. Dewulf, H.V. Langenhove, eds. Renewables-Based
Technology:Sustainability Assessment. New Jersey: John Wiley and Sons, 143-156.
Rotterdam Climate Initiative, 2007. The World Capital of CO2-free energy. Project
Group Rotterdam Climate Initiative [online]. Available from: http://
www.rotterdamclimateinitiative.nl. [Accessed 15 Feb 2010].
Simmons, C., González, I., Lewis, K., 2006. Methodology for determining global
sectoral material consumption, carbon dioxide emissions and Ecological Footprints
[online]. WWF, One Planet Business; Review Version 12. Available from:
http://www.bestfootforward.com/OPB/Methodology%20Report%20-
%20Review%20v12.PDF. [Accessed 7 Dec 2010].
Van Agtmaal, E., Swahn, M., 2009. How to assess eco-efficiency of green corridors.
The Green corridors conference towards climate neutral freight transport, 9 December
2009 Brussels.
Van Den Bergh, J.C.J.M., Verbruggen, H., 1999. Spatial sustainability, trade and
indicators: an evaluation of the ecological footprint. Ecological Economics, 29, 61-72.
Wackernagel, M., Dholakia, R., Deumling, D., Richardson, D., 2000. Redefining
Progress, Assess your Household's Ecological Footprint V 2.0 [online]. Available from:
http://greatchange.org/ng-footprint-ef_household_evaluation.xls. [Accessed 12 Feb
2006].

30
Wackernagel, M., Rees, W., 1996. Our ecological footprint. Reducing human impact on
Earth. Gabriola Island: New Society Publishers.
World Resources Institute (WRI)/World Business Council for Sustainable Development
(WBCSD), (ed) 2004. The greenhouse gas protocol: a corporate accounting and
reporting standard, revised edition. WRI/WBCSD, Washington DC
Wiedmann, T., Lenzen, M., 2009. Unravelling the impacts of supply chains. A new
Triple-Bottom-Line Accounting Approach. In: S. Schaltegger, M. Bennett, R. Burrit, C.
Jasch, eds. Environmental Management Accounting for Cleaner Production.
Amsterdam: Springer Netherlands, 65-90.
Wiedmann, T., Minx, J.C., 2008. A Definition of 'Carbon Footprint'. In: C.C. Petsovam,
ed. Ecological Economic Research Trends. New York: Nova Science Publishers, 55-65.
Wiedmann, T., Lenzen, M., Barret, J., 2009. Companies on the Scale: Comparing and
Benchmarking the Footprints of Businesses. Journal of Industrial Ecology, 13, 361-383.
WPCC, 2008. Developing a carbon footprint. Port of Oslo & Port of Rotterdam. The
C40 World Ports Climate Conference. 9-11 July 2008 Rotterdam.
Yenming, J.C., Sheu, J.B., 2009. Environmental-regulation pricing strategies for green
supply chain management. Transportation Research Part E, 45, 667-677.
Zhu, Q., Sarkis, J., Lai, K-H., 2008. Green supply chain management implications for
“closing the loop” Transportation Research Part E, 1-18

31


![[Document subtitle] [DATE] - Environmental Footprint Institute](https://img.pdfslide.net/doc/110x75/631ca10e7051d371800f901d/document-subtitle-date-environmental-footprint-institute.jpg)


