Embed Size (px)
Citation preview

A
diac
ndre
ct©
K
1
iaabd
aHT
0d
Neuropsychologia 45 (2007) 2922–2930
Functional compensation or pathology in cortico-subcorticalinteractions in preclinical Huntington’s disease?
Christian Beste a,b,∗,1, Carsten Saft a,1, Juliana Yordanova c, Jurgen Andrich a,Ralf Gold a, Michael Falkenstein b, Vasil Kolev c
a Department of Neurology, Huntington Centre NRW, St. Josef Hospital, Ruhr-University Bochum, Germanyb Leibniz Research Centre for Working Environment and Human Factors, WHO Collaborating Centre for Occupational
Health and Human Factors, Dortmund, Germanyc Institute of Physiology, Bulgarian Academy of Science, Sofia, Bulgaria
Received 5 February 2007; received in revised form 18 May 2007; accepted 12 June 2007Available online 24 June 2007
bstract
Huntington’s disease (HD) is an autosomal dominant neurological disorder, with degeneration amongst others affecting the basal gangliaopaminergic system. Recent findings suggest compensatory as well as pathogenetic mechanisms mediated via the adenosine receptor systemn the presymptomatic stage (pHD) of HD. The adenosine receptor system is functionally related to the dopaminergic system. In this study, wessessed error processing, a dopamine-dependent cognitive function, using an event-related potential the error negativity (Ne/ERN) in pHD andontrols. This was done by means of a flanker task. The Ne consists of a cognitive and a motor component, expressed via different frequency bands.
Time–frequency decomposition of the Ne into delta and theta sub-components was applied to assess if degeneration or compensation predomi-antly involve cognitive or motor processes. No parameter of the behavioral data (reaction times, error frequency, corrections, post-error slowing)iffered between the groups. A selective increase in the power of the cognitive delta-Ne component was found in pHD relative to controls inverselyelated to the estimated age of onset (eAO). Thus, the increase in the power of the cognitive delta-Ne component was stronger in pHD with an
arlier eAO. An earlier eAO implies stronger pathogenetic mechanisms.Due to the behavioral data our results speak for a solely cognitive compensating-mechanism controlling performance monitoring in pHD. Inontrast, correlations with eAO suggest that the increase in delta-Ne activity is also related to pathogenesis. It is proposed that compensation is aransient effect of the whole pathogenetic dynamics of HD, with these two processes not foreclosing each other.
2007 Elsevier Ltd. All rights reserved.
quenc
Ha(Tm
eywords: Event-related potential (ERP); Error negativity (Ne/ERN); Time–fre
. Introduction
Huntington’s disease (HD) is an autosomal, dominant inher-ted neuropsychiatric disorder typically characterized by choreand complex involuntary movements. Cognitive deterioration
nd neuropsychiatric symptoms including depression, suicidalehavior, mania, psychotic symptoms and apathy are also evi-ent (see for review, Craufurd & Snowden, 2002). Genetically,∗ Corresponding author at: Leibniz Research Centre for Working Environmentnd Human Factors, WHO Collaborating Centre for Occupational Health anduman Factors, Ardeystr. 67, D-44139 Dortmund, Germany.el.: +49 231 1084 212; fax: +49 231 1084 401.
E-mail address: [email protected] (C. Beste).1 These authors equally to contributed this work.
coNctWidHL
028-3932/$ – see front matter © 2007 Elsevier Ltd. All rights reserved.oi:10.1016/j.neuropsychologia.2007.06.004
y decomposition; Performance monitoring; Huntington’s disease; Flanker task
D is accompanied by an extension of the CAG-repeat lengtht the 4th chromosome encoding a large protein, huntingtinHuntington’s Disease Collaborative Research Group, 1993).his protein accumulates and causes apoptotic neuronal deathainly in the striatum (Paulsen et al., 2001). Neuroanatomi-
al pathology is not limited to the striatum but is also seen inther cortico-subcortical brain regions (for review: Gutekunst,orflus, & Hersch, 2002). Among several neurotransmitter
hanges (Yohrling & Cha, 2002), a hallmark of HD is a reduc-ion in D1 and D2 receptor density up to 60% (Turjanski,
eeks, Dolan, Harding, & Brooks, 1995), which is detected
n both symptomatic and presymptomatic HD suggesting thategenerative processes already take place at early stages ofD (Augood, Faull, & Emson, 1997; Backman, Robins-Wahlin,undin, Ginovart, & Farde, 1997; Van Oostrom et al., 2005).
holog
sgsdhAsSbpatrDF
acrerfefAm(smftri
scK2efwFrDdtItplgbIggt
d&2
awRt(peppDcd2tBatl
qtms(gta2Awa(DoatdorFapiale
2
C. Beste et al. / Neuropsyc
In progressive movement disorders such as HD and Parkin-on’s disease (PD), but also in neurodegenerative diseases ineneral, neurodegeneration can be counteracted by compen-atory mechanisms (rev. Bezard, Gross, & Brotchie, 2003)elaying the clinical onset of (motor) symptoms. In HD, theyave been recently suggested to take place at the adenosine2A-receptor level (Tarditi et al., 2006), which is supported by
everal lines of research (e.g., Blum, Hourez, Galas, Popoli, &chiffmann, 2003a; Blum et al., 2003b; Maglione et al., 2005),ut A2A-receptors also have been proposed to play a role in HDathogenesis (Jarabek, Yasuda, & Wolfe, 2004; see also Tarditi etl., 2006). From a pathophysiological perspective, it is importanto mention that adenosine A2A-receptors and dopamine D2-eceptors are functionally related (e.g., Short, Ledent, Borrelli,rago, & Lawrence, 2006; Svenningsson, Le Moine, Fisone, &redholm, 1999).
Processes attributable to compensation are not only foundt a neurobiological level, but also at a neurophysiologi-al/neurocognitive one in association with the amount andegional distribution of functional activation. Using PET, Feigint al. (2006) pointed out that additional brain areas areecruited in pHD to compensate for deficits and maintain per-ormance in a motor sequence learning task. Also, Voermanst al. (2004), using functional MRI (fMRI), have accountedor a similar mechanism compensating for caudate atrophy.s patients enter the symptomatic stage, these compensatoryechanisms may ultimately fail and performance declines
Rosas, Feigin, & Hersch, 2004). Recently, another fMRI-tudy has indicated that in a time-discrimination task, theedial prefrontal cortex of pHD was hyperactivated in pHD
ar from estimated age of onset (eAO), while it was hypoac-ivated in patients close to eAO (Paulsen et al., 2004). Theseesults suggest for cortico-subcortical compensatory processesn HD.
Another major function most likely relying on cortico-ubcortical interactions and especially on the medial prefrontalortex is action monitoring and processing of errors (Gehring &night, 2000; Ridderinkhof, Ullsperger, Crone, & Nieuwenhuis,004). Error processing can be examined by means ofvent-related (response-related) potentials (ERPs, RRPs). Dif-erent types of errors generate a phasic negative componentith fronto-central scalp maximum, the error negativity (Ne:alkenstein, Hohnsbein, Hoormann, & Blanke, 1991) or error-elated negativity (ERN: Gehring, Goss, Coles, Meyer, &onchin, 1993). The Ne has classically been interpreted as theetection of a mismatch or conflict between response represen-ations (Falkenstein, Hoormann, Christ, & Hohnsbein, 2000).n this respect, the Ne reflects an automatic mismatch betweenhe neural representations of the actual error response and thelanned correct response. Another theory, the reinforcementearning hypothesis (Holroyd & Coles, 2002) assumes a moreeneral functional significance of the Ne and states that the mid-rain DA-system evaluates evolving events including responses.
f an event is worse than expected (i.e. an error), the basalanglia detect this event and send a signal to the anterior cin-ulate cortex (ACC) via the DA-system, which in turn elicitshe Ne. Multiple research lines confirm the importance of the2
b
ia 45 (2007) 2922–2930 2923
opaminergic system in the generation of the Ne (HolroydColes, 2002; Holroyd & Yeung, 2003; Ridderinkhof et al.,
002).Given these associations of Ne with midbrain DA-system
nd medial frontal functions, the objective of the present studyas to evaluate error processing in pHD as reflected by Ne.egarding the processes (degeneration and/or compensation)
hat possibly occur in pHD, two hypothesis can be formulated:i) The dopamine striatal system (D2-system) is dysfunctional inHD (Augood et al., 1997; Backman et al., 1997; Van Oostromt al., 2005) and/or the adenosine A2A-receptors express theirathogenic effects. Accordingly, the Ne should be reduced inHD compared to healthy controls, since a suppression of theA system and cortico-subcortical interaction by pathologi-al or pharmacological factors has been consistently shown toecrease the Ne (de Bruijn, Sabbe, Hulstjin, Ruigt, & Verkes,006; Zirnheld et al., 2004) as has recently been shown in symp-omatic HD (Beste, Saft, Andrich, Gold, & Falkenstein, 2006;este et al., in press). (ii) On the contrary, compensatory mech-nisms mediated via the A2A-receptors in pHD may enhancehe DA-mediated activation, which could be accompanied by aarger Ne in pHD.
In relation to these major hypotheses, the following specificuestions were addressed: (1) Does compensation or degenera-ion in pHD occur primarily at the level of cognitive control,
otor response control, or both? This is of special interest,ince it has been suggested by Smith, Brandt, and Shadmehr2000) that deficits in error-feedback processing may be the ori-in of motor dysfunction in HD. To approach this question aime–frequency decomposition (TF) of Ne was applied because
recent study (Yordanova, Falkenstein, Hohnsbein, & Kolev,004a) has indicated that the Ne consists of two subcomponents.
sub-component from the delta frequency band (1.5–3.5 Hz)as related to error-specific monitoring at the cognitive level,
nd a second sub-component from the theta frequency band4–8 Hz) was associated with motor response monitoring. (2)o putative compensatory mechanisms involve the recruitmentf additional brain areas (Feigin et al., 2006; Voermans etl., 2004), which may produce specific scalp-topography pat-erns of the Ne in pHD? In addition to analysis of Ne scalpistribution, regional compensation was assessed at the levelf movement activation processes by analyzing the lateralisedeadiness potentials (LRPs) (Yordanova, Kolev, Hohnsbein, &alkenstein, 2004b). (3) Is there a relationship between the Nend parameters of neurodegeneration? In the presymptomatichase, the point in time when the disease becomes manifests of clinical relevance (Aylward et al., 2004). This “estimatedge of onset (eAO)” is calculated with respect to the CAG-repeatength and the parents’ age of onset (Aylward et al., 2004; Ranent al., 1995).
. Materials and methods
.1. Participants
A group of 11 right-handed presymptomatic gene mutation carriers definedy a positive gene test and absence of clinical symptoms (pHD, N = 11) from 22

2924 C. Beste et al. / Neuropsychologia 45 (2007) 2922–2930
Table 1Descriptive analysis of CAG-repeat number, estimated age of onset (eAO), duration until eAO, TFC-, IS- and motor score (MS), ages, sex as well as a synopsis ofperformance to the control group in different neuropsychological tests
Test pHD Controls Significance
Mean (S.D.) Range Mean (S.D.) Range
Age 33.70 (9.69) 22–50 34.00 (9.89) 23–49 nsSex 6 males/5 males 5 males/4 malesCAG 42.81 (1.77) 39–46 NA NAEstimated age of onset (eAO) 45.54 (4.87) 37.5–53.28 NA NADuration until estimated age of onset 10.81 (7.96) 1.28–23.28 NA NAMotor score (UHDRS) (MS) 0.55 (0.52) 0–1 NA NAIQ (MWT-B) 110 (12.12) 95–130 114 (10.11) 98–130 ns
Stroop test (UHDRS)Color naming 79.70 (4.54) 72–86 80.11 (3.01) 75–85 nsColor reading 96.60 (6.78) 80–100 94.66 (5.70) 85–100 nsInterference 50.00 (5.05) 42–59 53.33 (3.33) 48–59 ns
Symbol-digit test (WAIS) 54.50 (5.94) 45–65 55.11 (4.04) 50–61 nsWord fluency (Benton) 44.40 (15.51) 30–85 48.55 (10.12) 31–61 ns
Digit span (WMS-R)Forward 9.11 (2.02) 5–12 9.33 (1.11) 8–11 nsBackward 8.22 (2.04) 6–11 8.33 (0.86) 7–10 ns
Block span (WMS-R)Forward 8.00 (1.87) 5–11 8.88 (0.92) 7–10 nsBackward 8.00 (1.80) 6–12 8.22 (0.66) 7–9 ns
Benton test (visual memory) 14.00 (0.70) 13–15 13.77 (0.83) 13–15 ns
American verbal learning test (AVLT) [German equivalent was used; VLMT]Immediate word span 7.33 (1.32) 6–10 7.66 (1.73) 5–10 nsFinal acquisition level 13.77 (1.56) 10–15 13.88 (0.92) 12–15 nsInterference list 7.88 (1.26) 6–10 8.22 (0.97) 7–10 nsPostintergference recall I 12.33 (2.06) 8–15 12.22 (1.56) 9–14 nsPostintergference recall II 12.77 (1.98) 8–15 11.77 (1.30) 9–13 ns
Mini mental status examination (MMSE) 29.18 (0.87) 27–30 29.66 (0.50) 29–30 nsBeck depression inventory 4.45 (4.03) 0–14 3.44 (3.74) 0–12 nsTFC 13 NA NAI
N
ttratnc
riTgo
2
1a(wbo
twdabtfeedback stimulus (1000 Hz, 60 dB SPL) was given 1200 ms after the response;this stimulus had to be avoided by the subjects. Four blocks of 105 stimuli eachwere presented in this task. Compatible (60%) and incompatible stimuli (20%)and Nogo-stimuli (circle) (20%) were presented randomly. The subjects had to
Table 2Numerical values pf the Ne delta- and theta-frequencies as well as r-LRP peakamplitude
Test pHD Controls Significance
Ne (peak amplitude)(�V/m2)
136.22 (82.91) 95.08 (50.14) ns
S 100
A, not applicable.
o 50 years of age (M = 33.70; S.D. = 9.69) were recruited. All patients agreedo be videotaped in order to document their neurological status. Values of CAG-epeat length, the estimated age of onset (eAO) (Aylward et al., 2004; Ranen etl., 1995), duration until eAO, scores of neurological and psychiatric investiga-ion (UHDRS motor score, TFC, IS, BDI, MMSE) as well as performance ineuropsychological investigation is given in Table 1 in comparison to healthyontrols.
Furthermore nine healthy controls (N = 9) from 23 to 49 years of age wereecruited (mean = 34.35; S.D. = 5.19) and underwent the same neuropsycholog-cal and psychiatric assessment. For description and comparison of results seeable 1. Both groups had a comparable educational background. All participantsave written informed consent. The study was approved by the Ethics Committeef the Ruhr-University Bochum, Germany.
Table 2.
.2. Stimuli and procedure
To measure error-processing we used a Flanker Task (Kopp, Rist, & Mattler,996) which reliably yields a high percentage of errors. In here vertically
rranged visual stimuli were presented on a PC monitor. The target-stimuluswhite arrowhead or circle) was presented in the center of a black backgroundith the arrowhead pointing to the right or left. These target-stimuli were flankedy two vertically adjacent arrowheads which pointed in the same (compatible) orpposite (incompatible) direction of the target stimulus. The flankers precededNA NA
he target by 100 ms to maximize premature responding to the flankers, whichould result in errors in the incompatible and Nogo condition. The target wasisplayed for 300 ms. The response-stimulus interval was 1600 ms. Flankersnd target were switched off simultaneously. Time pressure was administeredy asking the subjects to respond within 550 ms, which additionally enhanceshe likelihood of errors. In trials with reaction times exceeding this deadline a
r-LRP (peak amplitude)(�V/m2)
23.35 (0.43) 20.17 (0.47) ns
Theta-Ne (power) 4.86 (0.18) 4.40 (0.19) nsDelta-Ne (power) 5.14 (0.14) 4.60 (0.16) <.05

holog
rr
2
FCamtb5p±HcCifet
2
bw(prpilm
2
tirals
1wd2sdoswposivm
2
ud
wBl2p
w
wa
fTctactσ
2fnNcws
3
3
oesa(sts2aiawasbnpo3Gand 341.37 ± 12.74 ms for controls. The behavioral relevance oferrors can also be measured by the number of error corrections.
C. Beste et al. / Neuropsyc
eact depending on the direction of the central arrowhead and to refrain fromesponding to circles.
.3. Data processing
During the task the EEG was recorded from 28 Ag-AgCl electrodes (Fpz,p1, Fp2, Fz, F3, F4, F7, F8, FCz, FC3, FC4, FC5, FC6, Cz, C3, C4, C7,8, Pz, P3, P4, P7, P8, Oz, O1, O2, left mastoid—M1, right mastoid—M2)gainst a reference electrode located on Cz. Additionally, eye movements wereonitored and recorded by means of two lateral and four vertical EOG elec-
rodes. The sampling rate of all recordings was 500 samples/s, applying a filterandwidth of 0.05–80 Hz to the EEG. Electrode impedances were kept belowk�. EEG was re-referenced off-line to linked mastoids. Artifact rejectionrocedures were applied twice: automatically, with an amplitude threshold of80 �V, and visually by rejecting all trials contaminated by technical artifacts.orizontal and vertical eye movements preserved in the accepted trials were
orrected by means of a linear regression method for EOG correction (Gratton,oles, & Donchin, 1983). Ne was clearly visible after response-related averaging
ndicating the presence of phase-locked components in single sweeps. There-ore, analyses were performed for the averaged response-triggered potentials toxtract the time–frequency components that were most stable and time-lockedo the response.
.4. Response-related potentials
Response-related averaging was triggered at the time point when a responseutton was pressed. To achieve a reference-free evaluation, all data analysesere performed after calculation of current source density (CSD) of the signals
Perrin, Pernier, Bertrand, & Echallier, 1989). The CSD transform replaces theotential at each electrode with the current source density, thus eliminating theeference potential. The algorithm applies the spherical Laplace operator to theotential distribution on the surface of the head. Since the potential distributions only known for the electrodes used, the procedure of spherical spline interpo-ation is employed to calculate the continuous potential distribution. The exact
athematical procedure is explained in detail in Perrin et al. (1989).
.5. Time-domain analysis
Epochs for time-domain analysis of the Ne had a length of 2048 ms, withhe moment of response production located in the centre of the epoch. Ne wasdentified as the most negative peak of RRPs at FCz within 100 ms after erroresponses. Ne peak amplitude and latency were measured in the averaged RRPsgainst a baseline of 800–600 ms before the button was pressed. This base-ine was chosen to avoid the cancellation of response-related activity occurringhortly after stimulus delivery.
Epochs for the response-locked lateralized readiness potential had a length of700 ms (from 800 ms pre-response to 900 ms post-response). R-LRP amplitudeas measured against a baseline 800–600 ms pre-response. The r-LRP onset wasefined as that point in time when the deviation from baseline reached a value of0% of total peak to baseline amplitude (20% criterion). Since LRPs have a lowignal-to-noise ratio (Ulrich & Miller, 2001) we used a jackknifing-procedure,escribed by Miller, Patterson, and Ulrich (1998) to reduce noise before LRPnset or peak detection is made. To obtain the jackknifed mean LRPs onsetcore or amplitude ji for each participant i (i = 1. . .n), first, n grand-averageaveforms are calculated across participants by successively omitting everyarticipant once. Then, for each of the n grand-average waveforms, the LRP onsetr amplitude is measured. This results in n jackknifed LRP onset or amplitudecores (j, . . ., jn), with each ji being based on the data from all participants but(see: Stahl & Gibbons, 2004). As jackknifing leads to a massive reduction ofariance in the electrophysiological data, these F-values were adjusted using theethod described by Ulrich and Miller (2001).
.6. Time–frequency decomposition
To achieve a correct evaluation of low frequency components, the epochssed for time–frequency analysis had a length of 4096 ms (response in the mid-le of the epoch). To represent RRPs in the time–frequency domain, RRPs
I(cd
ia 45 (2007) 2922–2930 2925
ere analyzed by means of a continuous wavelet transform (CWT; Samar,opardikar, Rao, & Swartz, 1999). Time–frequency representations were calcu-
ated by Morlet’s wavelets as described previously (e.g., Jensen, Hari, & Kaila,002; Tallon-Baudry, Bertrand, Delpuech, & Permier, 1997). The analyticalresentation of Morlet’s wavelet w(t, f ) is:
(t, f ) = A exp
(−t2
2σ2t
)exp(2iπft),
here t is the time, f is the frequency, A = (σt
√π)−1/2, σt the wavelet duration,
nd i = √−1.For time–frequency plots, a ratio of f0/σf = 4 was used, where f0 is the central
requency and σf is the width of the Gaussian shape in the frequency domain.he choice of the ratio f0/σf was oriented to the expected slower phase-lockedomponents present in the response-related potentials, which had an effect onhe shape of the Morlet’s wavelet and decreased its decay (see e.g., Yordanova etl., 2004a). The analysis was performed in the frequency range 0.1–16 Hz with aentral frequency at 0.1 Hz intervals. For different f0, time and frequency resolu-ions can be calculated as 2σt and 2σf, respectively (Tallon-Baudry et al., 1997).
t and σf are related by the equation σt = 1/(2�σf). For example, for f0 = 1 Hz,σt = 1280 ms and 2σf = 0.5 Hz; for f0 = 3 Hz, 2σt = 420 ms and 2σf = 1.5 Hz; for
0 = 5 Hz, 2σt = 255 ms and 2σf = 2.5 Hz. Relevant time–frequency (TF) compo-ents were extracted in the time domain and analyzed. To focus specifically one, amplitudes and latencies of the negative phases of frequency-specific TF
omponents were measured within 150 ms before and after the response onsetith the same base-line (800–600 ms before the response), and subjected to
tatistical evaluation.
. Results
.1. Behavioral data
For the reaction times (RTs) the mean and standard errorf the mean (S.E.M.) are given. To assess group differ-nces in performance RTs of correct and error trials wereubjected to separate univariate ANOVAs. RTs of correct tri-ls did not differ (F(1,18) = 1.26, p > .2) between the pHD340.9 ± 8.45 ms) and the control group (329.2 ± 5.17 ms). Theame was found for error trials (pHD: 284.9 ± 13.93 ms; con-rols: 260.6 ± 13.79 ms; F(1,18) = 1.50, p > .2). Both groupshowed comparable error rates (pHD: 25.72 ± 2.04; controls:9.11 ± 2.89; F(1,18) = 0.95; p > .3). RTs of correct responsesfter an error (post-RT) can be used to assess the behav-oral consequences of an error. Post-error slowing is seen asn indicator for behavioral adaptation after errors. Thereforee subjected the mean RT of all correct responses (c-RT)
nd those after an error (post-RT) as two levels of a within-ubjects factor to a repeated measures ANOVA with group as aetween-subjects factor. Post-RTs (344.51 ± 8.59 ms) were sig-ificantly longer than c-RTs (331.25 ± 6.68 ms; F(1,18) = 6.54;= .02). No significant interaction with the factor group wasbtained (F(1,18) = 1.61; p > .2). Group means of c-RTs were40.97 ± 8.97 ms for pHD and 321.54 ± 9.91 ms for controls.roup means of post-RTs were 347.65 ± 11.53 ms for pHD
n the present study, the frequency of corrections did not differF(1,18) = 0.01; p > .9) between groups (pHD: 5.81 ± 2.23 ms;ontrols: 5.44 ± 2.46 ms). In sum, behavioral indices did notiffer across the groups.
2926 C. Beste et al. / Neuropsychologia 45 (2007) 2922–2930
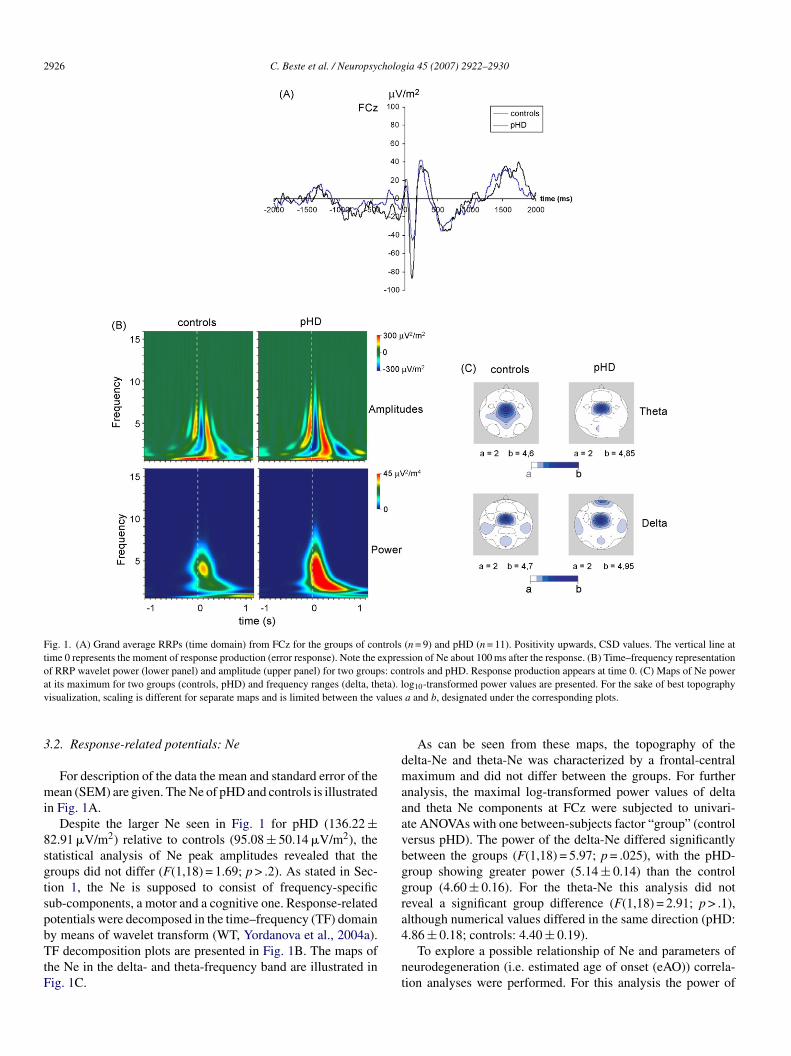
Fig. 1. (A) Grand average RRPs (time domain) from FCz for the groups of controls (n = 9) and pHD (n = 11). Positivity upwards, CSD values. The vertical line attime 0 represents the moment of response production (error response). Note the expression of Ne about 100 ms after the response. (B) Time–frequency representationof RRP wavelet power (lower panel) and amplitude (upper panel) for two groups: controls and pHD. Response production appears at time 0. (C) Maps of Ne powera eta). lv alues
3
mi
8sgtspbTtF
dmaaavbggra
t its maximum for two groups (controls, pHD) and frequency ranges (delta, thisualization, scaling is different for separate maps and is limited between the v
.2. Response-related potentials: Ne
For description of the data the mean and standard error of theean (SEM) are given. The Ne of pHD and controls is illustrated
n Fig. 1A.Despite the larger Ne seen in Fig. 1 for pHD (136.22 ±
2.91 �V/m2) relative to controls (95.08 ± 50.14 �V/m2), thetatistical analysis of Ne peak amplitudes revealed that theroups did not differ (F(1,18) = 1.69; p > .2). As stated in Sec-ion 1, the Ne is supposed to consist of frequency-specificub-components, a motor and a cognitive one. Response-relatedotentials were decomposed in the time–frequency (TF) domain
y means of wavelet transform (WT, Yordanova et al., 2004a).F decomposition plots are presented in Fig. 1B. The maps ofhe Ne in the delta- and theta-frequency band are illustrated inig. 1C.
4
nt
og10-transformed power values are presented. For the sake of best topographya and b, designated under the corresponding plots.
As can be seen from these maps, the topography of theelta-Ne and theta-Ne was characterized by a frontal-centralaximum and did not differ between the groups. For further
nalysis, the maximal log-transformed power values of deltand theta Ne components at FCz were subjected to univari-te ANOVAs with one between-subjects factor “group” (controlersus pHD). The power of the delta-Ne differed significantlyetween the groups (F(1,18) = 5.97; p = .025), with the pHD-roup showing greater power (5.14 ± 0.14) than the controlroup (4.60 ± 0.16). For the theta-Ne this analysis did noteveal a significant group difference (F(1,18) = 2.91; p > .1),lthough numerical values differed in the same direction (pHD:
.86 ± 0.18; controls: 4.40 ± 0.19).To explore a possible relationship of Ne and parameters ofeurodegeneration (i.e. estimated age of onset (eAO)) correla-ion analyses were performed. For this analysis the power of

C. Beste et al. / Neuropsychologia 45 (2007) 2922–2930 2927
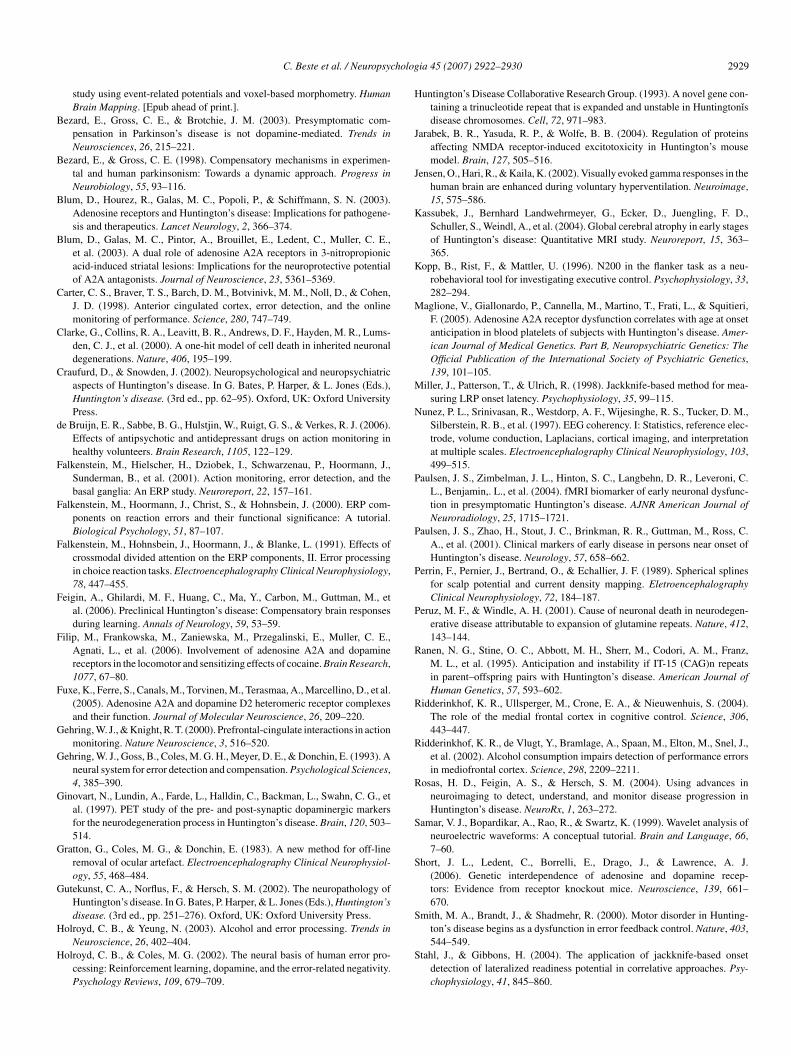
Fig. 2. Response-related lateralized readiness potentials (LRPs) of the two groups (controls, pHD) for correct (left panel) and error (right panel) responses. Time 0r
toddatW(
3
ac
af0ol(aado3pN
4
codseig
itmc(Fp
lcoccMTp1c2tgbYfpsbAi
uHepo
epresents the moment of response production.
he extracted delta-component of the Ne was used. The powerf the theta-component was ommitted, because of the lack ofifference from the control group. The power of the isolatedelta-frequency-spectra was inversely related to the estimatedge of onset (eAO) (delta-Ne: r = −.787; p = .002), indicatinghat Ne was more prominent in patients showing an early eAO.
hen using the duration until the eAO no relation was founddelta-Ne: r = −.156; p > .3).
.3. Response-related potentials: LRP
Response-locked LRPs (r-LRPs) for correct and error tri-ls were analyzed using the same ANOVA design. R-LRPs inorrect and error trials are presented in Fig. 2.
The analysis revealed that for the correct trials, the peakmplitude reflecting the strength of activation did not dif-er between the groups (F(1,18) = 0.001; p > .9; pHD: 22.35 ±.48 �V; control: 22.70 ± 0.53 �V). The same statisticalutcome (F(1,18) = 0.001; p > .9) was obtained for the onset-atency, giving the point in time when the movement is initiatedpHD: −143.81 ± 1.12 ms; control: −142.8 ± 1.24 ms). Thenalysis of the error trials revealed the same result. The peakmplitudes (pHD: 23.35 ± 0.43 �V; control: 20.17 ± 0.47 �V)id not differ between the groups (F(1,18) = 0.068; p > .7). Thenset-latencies (pHD: −155.45 ± 3.19 ms; control: −164.44 ±.52 ms) did not differ between the groups (F(1,18) = 0.010;> .9). The following table summarizes numerical values fore, delta and theta frequencies, R-LRP.
. Discussion
In the current study, we assessed error-processing in pre-linical HD and controls by analyzing the Ne, which dependsn cortico-subcortical interactions. In the time domain, the Neid not differ between the groups. Time–frequency decompo-
ition of the Ne by means of wavelet transform (Yordanovat al., 2004a) revealed that the groups differed significantlyn the power of the delta-band, with the pHD-group showingreater power than the control group. No difference was foundmdas
n the theta-band, although a trend was seen. These results implyhat the groups differed with respect to behavioral/cognitive
onitoring, but not in motor response monitoring. This disso-iation is additionally underlined by the fact that the r-LRPsreflecting motor generation) did not differentiate the groups.urther, the groups did not differ with respect to any behavioralarameters.
Such a dissociation between an increased electrophysio-ogical activity reflecting enhanced cognitive monitoring andomparable behavioral performance may be interpreted in termsf compensation occurring in functional cortico-subcorticalircuits. Such a compensatory mechanism may counteract pre-linical neuronal dysfunction or even neuron loss detectable byRI in pHD (e.g., Aylward et al., 2004; Kassubek et al., 2004;
hieben et al., 2002). Residual neurons may perform functionsreviously carried out by the entire population (Bezard & Gross,998) so that performance (behavior) is maintained at a levelomparable to that of healthy controls (see also Feigin et al.,006; Paulsen et al., 2004). The maps (Fig. 1C) denote thathe regional distribution of activation did not differ between theroups, suggesting that a compensation is not further modulatedy a reorganization of the interplay between different brain areas.et, the groups included in this study are not extended. There-
ore, the generalizability should be treated cautious, due to aossible weakness in statistical power. Even though compen-ation in motor function cannot be fully excluded, it may note as advanced and functionally relevant as the cognitive one.dditionally, the behavioral data was very stable, justifying the
nterpretation put forward here.Our finding of an error-related compensatory mechanism
nderlines the assumed importance of this cognitive process inD (Smith et al., 2000). Yet, in contrast to our results, Smith
t al. (2000) reported a dysfunction of error-processing in theirHD-group. This interpretation was based on the observationf performance differences in late stages of a complex reaching
ovement. At the early stages of movements there were no groupifferences. In our study we concentrated on simple reactionsnd not on complex movements and also on early processingtages. This might be a reason for the observed difference.

2 holog
4
itldtctohaaatiif
“rstew
cep2ataerBeido
thai(apsN&2ciac
4
te&acbtFfac&pnrame
ctNpwa
A
2RSpHfnm
R
A
A
B
B
928 C. Beste et al. / Neuropsyc
.1. Possible mechanisms
According to the major results, the Ne delta-component wasncreased in pHD patients. The correlational analysis revealedhat this increase was more expressed in patients with an ear-ier estimated age of HD onset. Due to comparable behavioralata of the groups, the enhancement of Ne delta power can bereated as a compensating mechanism occurring in functionalortico-subcortical circuits. In this perspective, the compensa-ion is more intense in subjects with an earlier expected onsetf the disease. However, Paulsen et al. (2004) argued that ayperactivation may reflect early abnormal cell processes thatre direct negative effects of the genetic alteration (Paulsen etl., 2004). Hyperactivation may therefore also be regarded asn expression of pathogenesis. Paulsen et al. (2004) state thathis interpretation is supported by electrophysiological findingsn the R6/2 transgenetic mice model of HD accounting for anncreased electrophysiological activity coupled to pathogenicactors.
In contrast to eAO, no relation was found between theduration until eAO” and Ne. One reason may be that in neu-odegenerative diseases (like HD), progression may not be ateady, continuous linear process, which is supported by the facthat neurodegeneration may follow exponential rather than lin-ar decline as revealed in animal models (Clarke et al., 2000) asell as in man (Peruz & Windle, 2001).Since the increase in Ne-power may be attributed to both
ompensation and pathogenesis, a paradoxon appears. Tarditit al. (2006) theorized about a similar paradoxon regarding theossible compensatory (Blum et al., 2003a,b; Maglione et al.,005) but also pathogenic role (Blum et al., 2003b; Jarabek etl., 2004) of the adenosine system. Convergent findings suggesthat compensatory mechanisms in pHD may be mediated via thedenosine A2A- or A1-receptors (Blum et al., 2003b; Maglionet al., 2005; Tarditi et al., 2006). However, adenosine A2A-eceptors are also supposed to exhibit pathogenic effects (e.g.,lum et al., 2003b; Jarabek et al., 2004). Accordingly, Tarditit al. (2006) suggest that an upregulation of A2A-receptors mayn time result in an increased vulnerability of striatal neurons toegeneration. Thus, the upregulation mechanism may cause itswn decline.
Carried over to the current results it may be hypothesizedhat an increase in neuronal activity as reflected by Ne mayave transiently “compensating effects” for the neurodegener-tive processes, but over time, this compensation may inducets own decline causing the beginning of the symptomatic stagesee, relation to the eAO). As such, the increase in neuronalctivity may be considered as both a compensatory and aathogenic mechanism. Compensatory effects may be a tran-ient phenomenon of the whole pathogenic process. Since thee most likely relies on the dopaminergic system (e.g., HolroydColes, 2002; Holroyd & Yeung, 2003; Ridderinkhof et al.,
002), we further suggest that the increase of the Ne delta-
omponent might be mediated via the adenosine–dopaminenteractions. Yet, these considerations about the possible mech-nisms and relationships must remain theoretical, since theyannot be directly resolved by the methods of the study.B
B
ia 45 (2007) 2922–2930
.2. Perspectives and conclusion
Based upon the current observations, several lines of fur-her research can be outlined. Like Paulsen et al. (2004), wevaluated a function of the medial prefrontal cortex (Gehring
Knight, 2000; Ridderinkhof et al., 2004) and accounted forregionally localized increased neuronal activity likely asso-
iated with compensation. Other studies, assessing differentrain functions, point to compensation via recruitment of addi-ional brain areas (Feigin et al., 2006; Voermans et al., 2004).uture research should address the basic principles of these dif-erences in compensation. As the increase in neuronal activitylso implies a relation with pathogenesis (relation to the eAO)urrent research on the pathogenesis of HD (for review, Beal
Ferrante, 2004) should be intensified with special focus onossible presymptomatic “compensation” mechanisms and cog-ition. These different lines of interdisciplinary research mayeasonably be conducted in a longitudinal manner in humansnd animals to gain more insight into the time course of suchechanisms in disease development thereby combining differ-
nt assessment techniques.In summary, we accounted for an increase in power of the
ognitive component of the Ne. With regard to the possible con-ribution of both compensation and pathogenic degeneration toe increase, it is suggested that compensatory mechanisms inHD may be a temporary phenomenon/effect as a part of thehole pathogenic process and that compensation and pathology
re not processes that exclude each other.
cknowledgements
This work was supported by a grant from FoRUMAZ-F479005, Ruhr University Bochum and a grant from the Nationalesearch Council by the Ministry of Education and Science,ofia, Bulgaria (Project L-1501/2005 to JY). The previous sup-ort of Prof. Przuntek and his great enthusiasm in founding theD unit are gratefully acknowledged. We thank all participants
or their participation. We thank L. Blanke for committed tech-ical assistance and V. Boyd for linguistic improvements to theanuscript.
eferences
ugood, S. J., Faull, R. L., & Emson, P. C. (1997). Dopamine D1 and D2receptor gene expression in the striatum in Huntington’s disease. Annals ofNeurology, 42, 215–221.
ylward, E. H., Sparks, B. F., Field, K. M., Yallapragada, V., Shpritz, B. D.,Shpritz, B. D., et al. (2004). Onset and rate of striatal atrophy in preclinicalHuntington disease. Neurology, 63, 66–72.
ackman, L., Robins-Wahlin, T. B., Lundin, A., Ginovart, N., & Farde, L. (1997).Cognitive deficits in Huntington’s disease are predicted by dopaminergicPET markers and brain volumes. Brain, 120, 2207–2217.
eal, M. F., & Ferrante, R. J. (2004). Experimental therapeutics in transgenicmouse models of Huntington’s disease. Nature Reviews Neuroscience, 5,
373–384.este, C., Saft, C., Andrich, J., Gold, R., & Falkenstein, M. (2006). Errorprocessing in Huntington’s disease. PloS One, e86.
este, C., Saft, C., Konrad, C., Andrich, J., Habbel, A., Schepers, I., et al.(2007). Levels of error processing in Huntington’s disease: A combined
holog
B
B
B
B
C
C
C
d
F
F
F
F
F
F
G
G
G
G
G
H
H
H
J
J
K
K
M
M
N
P
P
P
P
R
R
R
R
S
S
S
C. Beste et al. / Neuropsyc
study using event-related potentials and voxel-based morphometry. HumanBrain Mapping. [Epub ahead of print.].
ezard, E., Gross, C. E., & Brotchie, J. M. (2003). Presymptomatic com-pensation in Parkinson’s disease is not dopamine-mediated. Trends inNeurosciences, 26, 215–221.
ezard, E., & Gross, C. E. (1998). Compensatory mechanisms in experimen-tal and human parkinsonism: Towards a dynamic approach. Progress inNeurobiology, 55, 93–116.
lum, D., Hourez, R., Galas, M. C., Popoli, P., & Schiffmann, S. N. (2003).Adenosine receptors and Huntington’s disease: Implications for pathogene-sis and therapeutics. Lancet Neurology, 2, 366–374.
lum, D., Galas, M. C., Pintor, A., Brouillet, E., Ledent, C., Muller, C. E.,et al. (2003). A dual role of adenosine A2A receptors in 3-nitropropionicacid-induced striatal lesions: Implications for the neuroprotective potentialof A2A antagonists. Journal of Neuroscience, 23, 5361–5369.
arter, C. S., Braver, T. S., Barch, D. M., Botvinivk, M. M., Noll, D., & Cohen,J. D. (1998). Anterior cingulated cortex, error detection, and the onlinemonitoring of performance. Science, 280, 747–749.
larke, G., Collins, R. A., Leavitt, B. R., Andrews, D. F., Hayden, M. R., Lums-den, C. J., et al. (2000). A one-hit model of cell death in inherited neuronaldegenerations. Nature, 406, 195–199.
raufurd, D., & Snowden, J. (2002). Neuropsychological and neuropsychiatricaspects of Huntington’s disease. In G. Bates, P. Harper, & L. Jones (Eds.),Huntington’s disease. (3rd ed., pp. 62–95). Oxford, UK: Oxford UniversityPress.
e Bruijn, E. R., Sabbe, B. G., Hulstjin, W., Ruigt, G. S., & Verkes, R. J. (2006).Effects of antipsychotic and antidepressant drugs on action monitoring inhealthy volunteers. Brain Research, 1105, 122–129.
alkenstein, M., Hielscher, H., Dziobek, I., Schwarzenau, P., Hoormann, J.,Sunderman, B., et al. (2001). Action monitoring, error detection, and thebasal ganglia: An ERP study. Neuroreport, 22, 157–161.
alkenstein, M., Hoormann, J., Christ, S., & Hohnsbein, J. (2000). ERP com-ponents on reaction errors and their functional significance: A tutorial.Biological Psychology, 51, 87–107.
alkenstein, M., Hohnsbein, J., Hoormann, J., & Blanke, L. (1991). Effects ofcrossmodal divided attention on the ERP components, II. Error processingin choice reaction tasks. Electroencephalography Clinical Neurophysiology,78, 447–455.
eigin, A., Ghilardi, M. F., Huang, C., Ma, Y., Carbon, M., Guttman, M., etal. (2006). Preclinical Huntington’s disease: Compensatory brain responsesduring learning. Annals of Neurology, 59, 53–59.
ilip, M., Frankowska, M., Zaniewska, M., Przegalinski, E., Muller, C. E.,Agnati, L., et al. (2006). Involvement of adenosine A2A and dopaminereceptors in the locomotor and sensitizing effects of cocaine. Brain Research,1077, 67–80.
uxe, K., Ferre, S., Canals, M., Torvinen, M., Terasmaa, A., Marcellino, D., et al.(2005). Adenosine A2A and dopamine D2 heteromeric receptor complexesand their function. Journal of Molecular Neuroscience, 26, 209–220.
ehring, W. J., & Knight, R. T. (2000). Prefrontal-cingulate interactions in actionmonitoring. Nature Neuroscience, 3, 516–520.
ehring, W. J., Goss, B., Coles, M. G. H., Meyer, D. E., & Donchin, E. (1993). Aneural system for error detection and compensation. Psychological Sciences,4, 385–390.
inovart, N., Lundin, A., Farde, L., Halldin, C., Backman, L., Swahn, C. G., etal. (1997). PET study of the pre- and post-synaptic dopaminergic markersfor the neurodegeneration process in Huntington’s disease. Brain, 120, 503–514.
ratton, G., Coles, M. G., & Donchin, E. (1983). A new method for off-lineremoval of ocular artefact. Electroencephalography Clinical Neurophysiol-ogy, 55, 468–484.
utekunst, C. A., Norflus, F., & Hersch, S. M. (2002). The neuropathology ofHuntington’s disease. In G. Bates, P. Harper, & L. Jones (Eds.), Huntington’sdisease. (3rd ed., pp. 251–276). Oxford, UK: Oxford University Press.
olroyd, C. B., & Yeung, N. (2003). Alcohol and error processing. Trends inNeuroscience, 26, 402–404.
olroyd, C. B., & Coles, M. G. (2002). The neural basis of human error pro-cessing: Reinforcement learning, dopamine, and the error-related negativity.Psychology Reviews, 109, 679–709.
S
ia 45 (2007) 2922–2930 2929
untington’s Disease Collaborative Research Group. (1993). A novel gene con-taining a trinucleotide repeat that is expanded and unstable in Huntingtonısdisease chromosomes. Cell, 72, 971–983.
arabek, B. R., Yasuda, R. P., & Wolfe, B. B. (2004). Regulation of proteinsaffecting NMDA receptor-induced excitotoxicity in Huntington’s mousemodel. Brain, 127, 505–516.
ensen, O., Hari, R., & Kaila, K. (2002). Visually evoked gamma responses in thehuman brain are enhanced during voluntary hyperventilation. Neuroimage,15, 575–586.
assubek, J., Bernhard Landwehrmeyer, G., Ecker, D., Juengling, F. D.,Schuller, S., Weindl, A., et al. (2004). Global cerebral atrophy in early stagesof Huntington’s disease: Quantitative MRI study. Neuroreport, 15, 363–365.
opp, B., Rist, F., & Mattler, U. (1996). N200 in the flanker task as a neu-robehavioral tool for investigating executive control. Psychophysiology, 33,282–294.
aglione, V., Giallonardo, P., Cannella, M., Martino, T., Frati, L., & Squitieri,F. (2005). Adenosine A2A receptor dysfunction correlates with age at onsetanticipation in blood platelets of subjects with Huntington’s disease. Amer-ican Journal of Medical Genetics. Part B, Neuropsychiatric Genetics: TheOfficial Publication of the International Society of Psychiatric Genetics,139, 101–105.
iller, J., Patterson, T., & Ulrich, R. (1998). Jackknife-based method for mea-suring LRP onset latency. Psychophysiology, 35, 99–115.
unez, P. L., Srinivasan, R., Westdorp, A. F., Wijesinghe, R. S., Tucker, D. M.,Silberstein, R. B., et al. (1997). EEG coherency. I: Statistics, reference elec-trode, volume conduction, Laplacians, cortical imaging, and interpretationat multiple scales. Electroencephalography Clinical Neurophysiology, 103,499–515.
aulsen, J. S., Zimbelman, J. L., Hinton, S. C., Langbehn, D. R., Leveroni, C.L., Benjamin,. L., et al. (2004). fMRI biomarker of early neuronal dysfunc-tion in presymptomatic Huntington’s disease. AJNR American Journal ofNeuroradiology, 25, 1715–1721.
aulsen, J. S., Zhao, H., Stout, J. C., Brinkman, R. R., Guttman, M., Ross, C.A., et al. (2001). Clinical markers of early disease in persons near onset ofHuntington’s disease. Neurology, 57, 658–662.
errin, F., Pernier, J., Bertrand, O., & Echallier, J. F. (1989). Spherical splinesfor scalp potential and current density mapping. EletroencephalographyClinical Neurophysiology, 72, 184–187.
eruz, M. F., & Windle, A. H. (2001). Cause of neuronal death in neurodegen-erative disease attributable to expansion of glutamine repeats. Nature, 412,143–144.
anen, N. G., Stine, O. C., Abbott, M. H., Sherr, M., Codori, A. M., Franz,M. L., et al. (1995). Anticipation and instability if IT-15 (CAG)n repeatsin parent–offspring pairs with Huntington’s disease. American Journal ofHuman Genetics, 57, 593–602.
idderinkhof, K. R., Ullsperger, M., Crone, E. A., & Nieuwenhuis, S. (2004).The role of the medial frontal cortex in cognitive control. Science, 306,443–447.
idderinkhof, K. R., de Vlugt, Y., Bramlage, A., Spaan, M., Elton, M., Snel, J.,et al. (2002). Alcohol consumption impairs detection of performance errorsin mediofrontal cortex. Science, 298, 2209–2211.
osas, H. D., Feigin, A. S., & Hersch, S. M. (2004). Using advances inneuroimaging to detect, understand, and monitor disease progression inHuntington’s disease. NeuroRx, 1, 263–272.
amar, V. J., Bopardikar, A., Rao, R., & Swartz, K. (1999). Wavelet analysis ofneuroelectric waveforms: A conceptual tutorial. Brain and Language, 66,7–60.
hort, J. L., Ledent, C., Borrelli, E., Drago, J., & Lawrence, A. J.(2006). Genetic interdependence of adenosine and dopamine recep-tors: Evidence from receptor knockout mice. Neuroscience, 139, 661–670.
mith, M. A., Brandt, J., & Shadmehr, R. (2000). Motor disorder in Hunting-
ton’s disease begins as a dysfunction in error feedback control. Nature, 403,544–549.tahl, J., & Gibbons, H. (2004). The application of jackknife-based onsetdetection of lateralized readiness potential in correlative approaches. Psy-chophysiology, 41, 845–860.

2 holog
S
T
T
T
T
U
V
V
Y
Y
Y
930 C. Beste et al. / Neuropsyc
venningsson, P., Le Moine, C., Fisone, G., & Fredholm, B. B. (1999). Dis-tribution, biochemistry and function of striatal adenosine A2A receptors.Progress in Neurobiology, 59, 355–396.
allon-Baudry, C., Bertrand, O., Delpuech, C., & Permier, J. (1997). Oscillatorygamma-band (30–70 Hz) activity induced by a visual search task in humans.Journal of Neuroscience, 17, 722–734.
arditi, A., Cimurri, A., Varani, K., Borea, P. A., Woodman, B., Bates, G., et al.(2006). Early and transient alteration of adenosine A2A receptor signallingin a mouse model of Huntington’s disease. Neurobiology of Disease, 23,44–53.
hieben, M. J., Duggins, A. J., Good, C. D., Gomes, L., Mahant, N., Richards,F., et al. (2002). The distribution of structural neuropathology in pre-clinicalHuntington’s disease. Brain, 125, 1815–1828.
urjanski, N., Weeks, R., Dolan, R., Harding, A. E., & Brooks, D. J. (1995).
Striatal D1 and D2 receptor binding in patients with Huntington’s diseaseand other choreas. A PET study. Brain, 118, 689–696.lrich, R., & Miller, J. (2001). Using the jackknife-based scoring method formeasuring LRP onset effects in factorial designs. Psychophysiology, 38,816–827.
Z
ia 45 (2007) 2922–2930
an Oostrom, J. C., Maquire, R. P., Verschuuren-Bememans, C. C., Veenma-van der Duin, L., Pruim, J., Roos, R. A., et al. (2005). Striatal dopamineD2 receptors, metabolism, and volume in preclinical Huntington disease.Neurology, 6, 941–943.
oermans, N. C., Petersson, K. M., Daudey, L., Weber, B., Van Spaendonck, K.P., Kremer, H. P., et al. (2004). Interaction between the human hippocampusand the caudate nucleus during route recognition. Neuron, 43, 427–435.
ohrling, G. J., IV, & Cha, J. H. J. (2002). Neurochemistry of Huntington ’sdisease. In G. Bates, P. Harper, & L. Jones (Eds.), Huntington’s disease.(3rd ed., pp. 276–309). Oxford, UK: Oxford University Press.
ordanova, J., Falkenstein, M., Hohnsbein, J., & Kolev, V. (2004). Parallelsystems of error processing in the brain. Neuroimage, 22, 590–602.
ordanova, J., Kolev, V., Hohnsbein, J., & Falkenstein, M. (2004). Sensori-motor slowing with ageing is mediated by a functional dysregulation of
motor-generation processes: Evidence from high-resolution event-relatedpotentials. Brain, 127, 351–362.irnheld, P. J., Carroll, C. A., Kieffaber, P. D., OıDonnell, B. F., Shekar, A.,& Hetrick, W. P. (2004). Haloperidol impairs learning and error-relatednegativity in humans. Journal of Cognitive Neuroscience, 16, 1098–1112.


