Embed Size (px)
Citation preview

Schizophrenia Research xxx (2010) xxx–xxx
SCHRES-04140; No of Pages 8
Contents lists available at ScienceDirect
Schizophrenia Research
j ourna l homepage: www.e lsev ie r.com/ locate /schres
ARTICLE IN PRESS
Subcortical alignment precision in patients with schizophrenia
Alan Anticevic a,⁎, Grega Repovs b, Jared X. Van Snellenberg c,John G. Csernansky d, Deanna M. Barch a
a Department of Psychology, Washington University in St. Louis, United Statesb Department of Psychology, University of Ljubljana, Sloveniac Department of Psychology, Columbia University, United Statesd Department of Psychiatry, Northwestern University, United States
a r t i c l e i n f o
⁎ Corresponding author. Department of PsychologWashington University, Saint Louis, MO 63130, Unite935 8459; fax: +1 314 935 8790.
E-mail address: [email protected] (A. Anti
0920-9964/$ – see front matter © 2010 Elsevier B.V.doi:10.1016/j.schres.2009.12.040
Please cite this article as: Anticevic, A., etResearch (2010), doi:10.1016/j.schres.200
a b s t r a c t
Article history:Received 25 July 2009Received in revised form 21 December 2009Accepted 29 December 2009Available online xxxx
Previous work has demonstrated less accurate alignment of cortical structures for patients withschizophrenia than for matched control subjects when using affine registration techniques.Such amismatch presents a potential confound for functional neuroimaging studies conductingbetween-group comparisons. Critically, the same issues may be present for subcorticalstructures. However, to date no study has explicitly investigated alignment precision for majorsubcortical structures in patients with schizophrenia. Thus, to address this question we usedmethods previously validated for assessment of cortical alignment precision to examinealignment precision of subcortical structures. In contrasts to our results with cortex, we foundthat major subcortical structures (i.e. amygdala, caudate, hippocampus, pallidum, putamen andthalamus) showed similar alignment precision for schizophrenia (N=48) and control subjects(N=45) regardless of the template used (other individuals with schizophrenia or healthycontrols). Taken together, the present results show that, unlike cortex, alignment for six majorsubcortical structures is not compromised in patients with schizophrenia and as such isunlikely to confound between-group functional neuroimaging investigations.
© 2010 Elsevier B.V. All rights reserved.
Keywords:SchizophreniaSubcortexRegistrationAnatomical alignment
1. Introduction
A major challenge for most fMRI studies investigatingfunctional differences between clinical and healthy popula-tions is optimal alignment of anatomical and functional dataacross individuals, especially if there are reasons to believethat within-group alignment may be compromised in theclinical sample. Currently, most fMRI studies in schizophreniause volumetric representations for data analysis (Acton andFriston, 1998; Friston et al., 1995; Worsley and Friston, 1995)and apply volume-based registration (VBR) to compensatefor inter-individual variability in brain anatomy (Woods et al.,1998a,b). Previously, we demonstrated that affine VBR may
y, Campus Box 1125,d States. Tel.: +1 314
cevic).
All rights reserved.
al., Subcortical alignme9.12.040
not be the optimal strategy for cortical alignment, possiblydue to a mismatch between volume representations andcortical geometry, which is essentially a 2D folded sheet oftissue (Anticevic et al., 2008). Importantly, we also showedless accurate cortical alignment in patients with schizophre-nia vs. healthy controls when using affine VBR (Anticevicet al., 2008), possibly owing to subtle abnormalities in corticalmorphology in this illness, which may give rise to greateranatomical variability across schizophrenia subjects (Cser-nansky et al., 2008; Shenton et al., 2001).
The same problems may exist in patients with schizophre-niawhen considering subcortical alignment. Todate, numerousstudies have demonstrated subcortical size and shape abnor-malities in this patient population for structures such as thehippocampal complex, amygdala and thalamus (Csernanskyet al., 1998, 2004, 2008; Harms et al., 2007; Konick andFriedman, 2001; Lawrie et al., 2003;Mamahet al., 2007;Namikiet al., 2007; Shenton et al., 2001, 2002; Velakoulis et al., 1999,
nt precision in patients with schizophrenia, Schizophrenia

2 A. Anticevic et al. / Schizophrenia Research xxx (2010) xxx–xxx
ARTICLE IN PRESS
2006; Wang et al., 2008; Wood et al., 2001). While thesedifferences in brain morphology may be a consequence of thedisease process and clinically significant in their own right, theyfurther complicate functional investigations of these sameregions. In principle, more spatial heterogeneity and smalleraverage size of subcortical structures could reduce alignmentprecision in the same way as demonstrated for corticalstructures (Anticevic et al., 2008; Van Essen, 2005). In turn, asshown for cortical activations, lack of precise anatomicalalignment may result in loss of statistical power whenconducing fMRI analyses (Anticevic et al., 2008; Argall et al.,2006; Desai et al., 2005; Fischl et al., 1999a,b). Moreover, anexaggerated reduction in alignment precision in individualswith schizophrenia could further reduce power to detectsignificant task-related activation when compared to controls,which introduces a confound in the comparison of patients tohealthy controls. Thus, some apparent differences in functionalactivation could arise from power discrepancies resulting fromanatomical mismatches, and not true functional abnormalities(Anticevic et al., 2008). This presents a serious concern for fMRIstudies conducting between-group comparisons and conse-quently may impact the interpretation of fMRI results withclinical populations. However, at present it remains unclearwhether subcortical alignment precision is compromised inpatients with schizophrenia.
To illustrate the point above, consider studies examiningamygdala activation in patients with schizophrenia. To date,there is evidence suggesting that patients with schizophreniaunder-recruit the amygdala in response to affective material(Aleman and Kahn, 2005; Li et al., 2009). As noted, some ofthese findings could — in theory — reflect reduced amygdalaalignment fidelity for patients with schizophrenia whencompared to healthy controls. As shown for cortical activa-tions, reductions in amygdala alignment in patients couldlead to reduced estimates of amygdala activation. Therefore,reduced alignment could, in principle, produce a positivefinding of amygdala under-recruitment in patients whencompared to controls, which would actually arise from anartifact of reduced alignment fidelity in the clinical sample.The same concerns are not limited to the amygdala, andlogically extend to other subcortical structures. However, toour knowledge, no study to date has explicitly investigatedsubcortical alignment profiles in patients with schizophreniaand verified whether this confound can be ruled out whenexamining activation differences in major subcortical areas.
Table 1Demographics and clinical data.
Characteristic Controls
M S.D.
Age (in years) 23.81 9.62Gender (% male) 0.58Parent's education (in years) 13.94 2.50Participant's education (in years) 13.45 2.29Handedness (% right) 88.37Mean SAPS global item score 0.03 0.08Mean SANS global item score 0.27 0.31Disorganization 0.88 1.21Poverty 0.53 0.81Reality distortion 0.02 0.16
Please cite this article as: Anticevic, A., et al., Subcortical alignmeResearch (2010), doi:10.1016/j.schres.2009.12.040
To address these questions, we examined subcortical align-ment precision in six major subcortical structures for a largesample of individuals with schizophrenia and matchedhealthy controls.
2. Materials and methods
2.1. Subjects
Subjects were recruited through the clinical core of theConte Center for Neuroscience of Mental Disorders (CCNMD)at Washington University in St. Louis. Clinical assessmentswere conducted by a research associate trained to administerthe SCID-IV, who also regularly participated in the diagnosticrating sessions (First et al., 2002). An additional assessmentsession was conducted by an expert clinician using a semi-structured interview for DSM-IV as well as all availablepatient records. A consensus on each diagnosis was reachedbetween the interviewer and the expert clinician. Thecomplete sample included 48 subjects meeting DSM-IVdiagnostic criteria for schizophrenia and 45 demographicallymatched healthy control subjects (Table 1). Control subjectswere recruited using local advertisements in the samecommunity from which schizophrenia subjects wererecruited. Control subjects were not included if they hadany lifetime history of Axis I psychiatric disorder or a first-degree relative with a psychotic disorder. Both control andschizophrenia subjects were also excluded if they: 1) metcriteria for DSM-IV substance abuse or dependence withinthe past 6 months; 2) they had any severe medical complica-tions that would compromise psychiatric assessment anddiagnosis or render the subject unstable or at risk toparticipate; 3) they suffered head injury (past or present)with manifestation of neurological symptoms or loss ofconsciousness; or 4) met DSM-IV diagnostic criteria of mentalretardation. All schizophrenia subjects were taking antipsy-chotic medication at the time of the scan and had to be stablefor a period of at least 2 weeks. All subjects completed andsigned an informed consent approved by the WashingtonUniversity IRB and were assessed for handedness using theEdinburgh Handedness Inventory (Oldfield, 1971). Measure-ments of IQ (Wechsler, 1997), medication dose (converted tochlorpromazine equivalents) and symptom severity using theSchedules for the Assessment of Positive and NegativeSymptoms (Andreasen, 1983a,b) were also obtained for
Schizophrenia Significance
M S.D. t value/Chi-square p value
25.67 8.10 1.02 0.310.77 3.75 0.053
13.51 3.79 0.73 0.4611.76 2.36 1.94 0.0691.67 0.28 0.601.36 0.841.96 0.803.90 2.507.77 3.343.56 2.72
nt precision in patients with schizophrenia, Schizophrenia

3A. Anticevic et al. / Schizophrenia Research xxx (2010) xxx–xxx
ARTICLE IN PRESS
each subject and their possible relationship with alignmentquality was explored.
2.2. Scanning
All subjects were scanned at the Washington UniversityMedical School. The structural images from the participantswere obtained from either a 1.5 T Siemens VISION system (29patients and 27 controls) or a 3 T Tim TRIO system (19 patientsand 18 controls). Although there could be concerns aboutcombining data from different scanner platforms, the numberof subjects in schizophrenia vs. control group scanned at either1.5 T and 3 T data were similar (meaning that group was notconfounded with scanner platform) and there was no interac-tion between the group factor and scanner platform (seeResults). The structural images acquired on both scanners useda coronal MP-RAGE 3D T1-weighted sequence (for the 1.5 T,TR=9.7 ms, TE=4 ms, flip=10°; voxel size=1×1×1.2 mm;for 3 T, TR=2400 ms, TE=3.16 ms, flip=14.5°; voxelsize=1×1×1 mm).
2.3. Volume based registration (VBR)
The entire 3D structural volume (T1) was registered to astereotaxic atlas space (Talairach and Tournoux, 1988) using12-parameter affine transform and resampled to 1 mm cubicrepresentation (Buckner et al., 2004; Ojemann et al., 1997). TheVBR method was identical to the approach taken whenexamining cortical alignment and corresponds to widely usedmethods in the schizophrenia literature (Anticevic et al., 2008).
2.4. Subcortical structure isolation
As noted, we sought to compare alignment precision in sixdifferent bilateral subcortical structures including the amyg-dala, caudate, hippocampus, pallidum, putamen, and thala-mus. To this end, we isolated each subject's bilateral structureusing an automated subcortical segmentation algorithmimplemented in the FreeSurfer software package (http://surfer.nmr.mgh.harvard.edu/), which was shown to havehigh reliability when compared to manual subcorticalidentification (Fischl et al., 2002, 2004). Also, other authorshave found comparable results between FreeSurfer andmanual anatomical ratings in a clinical population (Taeet al., 2008). Subcortical binary masks for each structurewere isolated using in-house algorithms and used forsubsequent analyses. Results were visualized using the AFNIsoftware package (Cox, 1996). Of note, no between-groupvolume differences across structures were found (all psN0.3).In addition, the two groups were compared in terms ofequality of variances for each structure and each hemisphere.The only significant difference that emerged was in the leftthalamus, which however did not show alignment differencesbetween the groups (see Results).
2.5. Volume alignment precision
To quantitatively evaluate subcortical alignment a rigor-ously validated metric for volume alignment precision (VAP)(Anticevic et al., 2008) was used. The VAP metric is similar tothe volume alignment consistency (VAC) and surface align-
Please cite this article as: Anticevic, A., et al., Subcortical alignmeResearch (2010), doi:10.1016/j.schres.2009.12.040
ment consistency (SAC) measures introduced by Van Essen(2005), but has the advantage of allowing parametricstatistical comparisons, as it computes a quantitative measureof overlap for each subject. Briefly, to obtain the VAP index,identified subcortical structures for each subject weresummed to generate probabilistic maps that reflected, foreach voxel, the number of subjects for whom that voxel wasin the subcortical structure of interest (i.e. an overlaphistogram). We then selected those voxels for a givenstructure that were labeled as belonging to that subcorticalregion for at least 50% of subjects. Next, the intersectionbetween each individual subject's mask for that structure andthe group 50% overlap region for a particular structure wasexpressed as a fraction of the individual subject's totalstructure volume and then averaged across all subjects,yielding the VAP for that structure:
VAP =1n∑n
i=1
xiðsÞxiðtotalÞ
� �ð1Þ
where x(s) is the number of voxels in a given structure (s) forsubject i that intersect the 50% overlap region; x(total) is thetotal number of voxels that belong to structure s for subject i;and n is the total number of subjects contributing to the VAPcalculation. As shown previously, the 50% overlap criterionwas fairly stringent and was likely to detect true between-group alignment differences (Anticevic et al., 2008).
3. Results
First, in order to qualitatively visualize the results ofwithin-group alignment we generated the probabilisticoverlap maps shown in Fig. 1. The red voxels mark locationsof high overlap in a given structure, whereas the blue voxelsmark areas of low overlap. Upon visual inspection, there areno discernible alignment precision differences betweenschizophrenia (left panel) and control subjects (right panel)for any of the examined structures (Fig. 1A–L). Next, weverified these results quantitatively using the VAP index.
Fig. 2 shows the average VAP indices for both hemispheresseparately as well as bilaterally for all examined structures(Fig. 2A–F). In line with the probabilistic maps shown in Fig. 1,the VAP measures showed numerically small differencesbetween schizophrenia and control subjects. To confirm thisstatistically, we computed a 3-way ANOVA with one between-group factor (Group, 2 levels — schizophrenia and controlsubjects) and 2 within-group factors (Hemisphere, 2 levels —
left and right; Region, 6 levels). The ANOVA results indicated nomain effect of Group [F(1,91)=0.37, p=0.541]. Additionally,the interactions of Group×Region [F(5,455)=1.35, p=0.24]and Group×Hemisphere×Region [F(5,455)=1.01, p=0.40]failed to reach significance. The only interaction including theGroup term that reached significance was the Group×Hemi-sphere interaction [F(1,91)=5.49,pb0.025], indicating that theVAP differed between schizophrenia and control subjectsacross the two hemispheres. The main source of the Group×Hemisphere interaction was somewhat lower VAP for theright relative to the left hemisphere in patients (schizophreniaright hemisphere VAP=0.741; schizophrenia left hemisphereVAP=0.754), which was especially prominent in the pallidum
nt precision in patients with schizophrenia, Schizophrenia

Fig. 1. Probabilistic alignment maps for patients with schizophrenia and healthy controls. An overlap histogram is shown for the amygdala, caudate, hippocampuspallidum, putamen and thalamus for patients with schizophrenia on the left (A–F) and control participants on the right (G–L). Regions showing a high degree oacross-subject overlap are shown in red, whereas regions showingminimal overlap across subjects are shown in blue. (For interpretation of the references to colorin this figure legend, the reader is referred to the web version of this article.)
4 A. Anticevic et al. / Schizophrenia Research xxx (2010) xxx–xxx
ARTICLE IN PRESS
and putamen. In contrast, control subjects showed better VAPfor the right compared to left hemisphere (control righthemisphere VAP=0.760; schizophrenia left hemisphereVAP=0.753). Although the numerical VAP differences acrosshemispheres were very small in both groups, post-hoccontrasts revealed that the hemispheric alignment differencewas significant in the schizophrenia [t(47)=2.7, pb0.001], butnot the control group [t(44)=0.90, p=0.37]. Of note, whenincluding the scanner platform as a factor in the ANOVA (3 T vs1.5 T) therewas no significant interaction between the scannerplatform and group [F(1,89)=0.08, p=0.77], indicatingcomparable group alignment differences irrespective ofscanner.
In addition to the statistical comparisons, we quantifiedthe degree of between-group differences observed for eachstructure using effect size calculations (i.e. Cohen's d) (Cohen,1992). Table 2 shows effect sizes for differences betweenschizophrenia and control VAP indices for each structure andhemisphere. The average effect size across both hemispheresand all structures was 0.14, which by standard conventionwould be considered a negligible effect (Cohen, 1992).Furthermore, 10/18 individual comparisons had negligibleeffect sizes (i.e. Cohen's d less than 0.15) and no effect sizeexceeded the value of 0.4, thus falling below the lower cutofffor what would conventionally be considered a medium
Please cite this article as: Anticevic, A., et al., Subcortical alignment precision in patients with schizophrenia, SchizophreniaResearch (2010), doi:10.1016/j.schres.2009.12.040
,f
effect. Taken together, these results suggest minimal VAPdifferences between schizophrenia and control subjects whenusing affine registration techniques.
Although the above analysis demonstrates equivalentwithin-group alignment, it does not verify whether theacross-group alignment is adequate. In other words, it iscritical to show that schizophrenia subjects align at leastapproximately as well to the control subjects as they do tothemselves. We examined this question by using the 50%overlap region from the control sample as the intersectionvolumewhen computing the VAP for the schizophrenia group(see Materials and methods section). Fig. 2 (light gray bars)indicate that the results remain largely unchanged whenusing schizophrenia subjects' anatomies and the control 50%overlap template. To verify this statistically, we computed a3-way ANOVA identical to that used for thewithin-group VAPscores. The ANOVA results indicated no main effect of Group[F(1,94)=0.55, p=0.46]. Additionally, the interactions ofGroup×Region [F(5,470)=0.483, p=0.78], Group×Hemi-sphere [F(1,94)=0.15, p=0.69] and Group×Hemisphere×Region [ F(5,470)= 0.31, p=0.90] failed to reachsignificance. As before, effect size calculations indicatednegligible differences between original VAP values forschizophrenia group and VAP values when using the control50% overlap region (Table 2). The average effect size was 0.12,
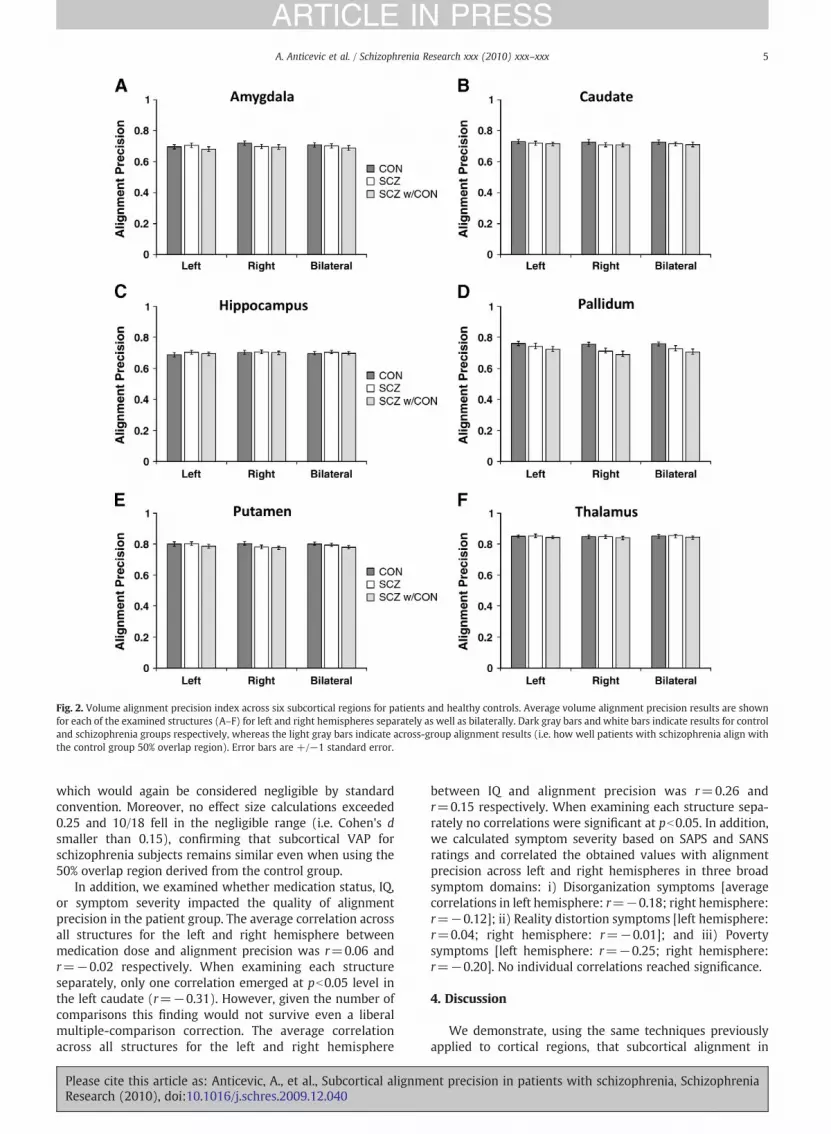
Fig. 2. Volume alignment precision index across six subcortical regions for patients and healthy controls. Average volume alignment precision results are shownfor each of the examined structures (A–F) for left and right hemispheres separately as well as bilaterally. Dark gray bars and white bars indicate results for controland schizophrenia groups respectively, whereas the light gray bars indicate across-group alignment results (i.e. how well patients with schizophrenia align withthe control group 50% overlap region). Error bars are +/−1 standard error.
5A. Anticevic et al. / Schizophrenia Research xxx (2010) xxx–xxx
ARTICLE IN PRESS
which would again be considered negligible by standardconvention. Moreover, no effect size calculations exceeded0.25 and 10/18 fell in the negligible range (i.e. Cohen's dsmaller than 0.15), confirming that subcortical VAP forschizophrenia subjects remains similar even when using the50% overlap region derived from the control group.
In addition, we examined whether medication status, IQ,or symptom severity impacted the quality of alignmentprecision in the patient group. The average correlation acrossall structures for the left and right hemisphere betweenmedication dose and alignment precision was r=0.06 andr=−0.02 respectively. When examining each structureseparately, only one correlation emerged at pb0.05 level inthe left caudate (r=−0.31). However, given the number ofcomparisons this finding would not survive even a liberalmultiple-comparison correction. The average correlationacross all structures for the left and right hemisphere
Please cite this article as: Anticevic, A., et al., Subcortical alignmeResearch (2010), doi:10.1016/j.schres.2009.12.040
between IQ and alignment precision was r=0.26 andr=0.15 respectively. When examining each structure sepa-rately no correlations were significant at pb0.05. In addition,we calculated symptom severity based on SAPS and SANSratings and correlated the obtained values with alignmentprecision across left and right hemispheres in three broadsymptom domains: i) Disorganization symptoms [averagecorrelations in left hemisphere: r=−0.18; right hemisphere:r=−0.12]; ii) Reality distortion symptoms [left hemisphere:r=0.04; right hemisphere: r=−0.01]; and iii) Povertysymptoms [left hemisphere: r=−0.25; right hemisphere:r=−0.20]. No individual correlations reached significance.
4. Discussion
We demonstrate, using the same techniques previouslyapplied to cortical regions, that subcortical alignment in
nt precision in patients with schizophrenia, Schizophrenia

Table 2Statistical comparisons. The t value, p value and an effect size measure (Cohen's d) are shown for each examined comparison for both hemispheres as well asbilaterally. Results are shown comparing schizophrenia group alignment results with that of controls. Also, results are shown comparing original schizophreniagroup alignment results to those obtained when using the control group 50% overlap region.
Structure Hemisphere Schizophrenia vs. control group VAP Schizophrenia VAP vs. results using control group50% overlap template
t value alpha Effect size (Cohen's d) t value alpha Effect size (Cohen's d)
Amygdala L 0.45 0.65 0.09 1.18 0.24 0.25R 1.05 0.30 0.22 0.18 0.86 0.04Bilateral 0.32 0.75 0.07 0.70 0.49 0.15
Caudate L 0.42 0.67 0.09 0.37 0.71 0.08R 0.94 0.35 0.20 0.07 0.94 0.01Bilateral 0.74 0.46 0.16 0.23 0.82 0.05
Hippocampus L 0.94 0.35 0.20 0.62 0.54 0.13R 0.08 0.93 0.02 0.32 0.75 0.07Bilateral 0.55 0.58 0.12 0.51 0.61 0.11
Pallidum L 0.79 0.43 0.17 0.70 0.49 0.15R 1.88 0.06 0.39 0.69 0.49 0.14Bilateral 1.37 0.17 0.29 0.70 0.48 0.15
Putamen L 0.15 0.88 0.03 0.89 0.37 0.19R 1.26 0.21 0.26 0.50 0.62 0.10Bilateral 0.59 0.56 0.12 0.72 0.47 0.15
Thalamus L 0.32 0.75 0.07 0.88 0.38 0.18R 0.04 0.97 0.01 0.53 0.60 0.11Bilateral 0.11 0.91 0.02 0.72 0.47 0.15
6 A. Anticevic et al. / Schizophrenia Research xxx (2010) xxx–xxx
ARTICLE IN PRESS
patients with schizophrenia is comparable to that of controlsubjects when using 12-parameter affine VBR. Furthermore,we cross-validate these results across groups, demonstratingthat, when using the control subjects' derived overlap region,results change minimally as compared to schizophreniawithin-group alignment.
4.1. Subcortical versus cortical alignment
The main finding in the current study is relatively similaralignment of subcortical structures in schizophrenia andcontrol subjects, supported by negligible effect sizes whencomparing group differences in alignment (Cohen, 1992).Moreover, the largest observed VAP differences (rightpalladium and right putamen) did not reach what, bystandard convention, would be considered even a mediumeffect size. Admittedly, this pattern of results was surprisinggiven our previous findings for cortical landmarks (Anticevicet al., 2008). We would have expected reduced VAP for atleast some subcortical structures in schizophrenia subjectsgiven numerous reports of anatomical and morphologicalabnormalities in some of the investigated regions (Cser-nansky et al., 1998, 2004, 2008; Harms et al., 2007; Konickand Friedman, 2001; Lawrie et al., 2003; Mamah et al., 2007;Namiki et al., 2007; Shenton et al., 2001, 2002; Velakouliset al., 1999, 2006; Wang et al., 2008; Wood et al., 2001). Onepossible explanation for our findings may be the inherentgeometry of subcortical relative to cortical anatomy. In otherwords, given that cortex is a 2D folded sheet of tissue, mostcortical landmarks take the geometric representations of‘ribbons’ or folded ‘sheets’ in 3D space with high surface-to-volume ratio. In turn, any type of movement (i.e. translationor rotation) or distortion (i.e. subtle anatomical shapeabnormalities) will have a large impact on alignment ofsuch a brain region relative to the group average. In contrast,most subcortical structures have a much smaller surface-to-
Please cite this article as: Anticevic, A., et al., Subcortical alignmeResearch (2010), doi:10.1016/j.schres.2009.12.040
volume ratio and more closely approximate spherical config-urations (with the possible exception of the hippocampus). Inturn, closer approximation of spherical shape may renderacross-subject subcortical alignment more robust to subtleshape abnormalities and/or shifts in space.
4.2. Implications for fMRI studies and statistical power
It is important to note that our findings do not imply thatsubtle shape deformations in subcortex are not clinicallyimportant. However, our findings do suggest that alignmentof subcortical structures is unlikely to confound subcorticalfMRI investigations in patients with schizophrenia. There aretwo main pieces of supporting evidence for this assertion.First, the overall magnitude of effect size differences wasnegligible when directly comparing schizophrenia vs. controlgroup alignment profiles for each structure. Second, we foundthat when testing across-group alignment (e.g., alignment ofschizophrenia to control subjects) the results remain largelyunchanged, suggesting that schizophrenia subjects' subcorti-cal structures align relatively well with respect to controlgroup templates. If schizophrenia subjects' anatomies wereshifted or much more variable relative to the control groupthen the across-group alignment would have been poorer,but we failed to observe such an effect.
It should be noted that we found a Group×Hemisphereinteraction with respect to alignment precision in the within-group alignment analyses, which indicated that schizophreniasubjects showed relatively worse alignment in the right whencompared to left hemisphere structures, whereas no suchfinding was observed for controls. While a statistically reliablefinding, themagnitude of the hemispheric alignment differencein the schizophrenia groupwas very small for almost all regions,and schizophrenia and control groups did not differ for eithertheright or the left hemisphere.Given that theonlyhemisphericdifference approaching the medium effect size was in the right
nt precision in patients with schizophrenia, Schizophrenia

7A. Anticevic et al. / Schizophrenia Research xxx (2010) xxx–xxx
ARTICLE IN PRESS
pallidum, functional neuroimaging studies examining thisregion may want to verify that alignment in their sample isnot compromised or alternatively use a ROI-based analyticstrategy that would eliminate the problem of an alignmentmismatch. Of note, one possibility is that our findings reflectexaggerated hemispheric asymmetries previously reported inschizophrenia (Crow, 1999; Crow et al., 1989a,b; Pearlson andMarsh, 1999; Qiu et al., 2009; Shenton et al., 2001), which maylead to greater alignmentmismatches in certain left hemispheresubcortical structures. Finally, the present findings also suggestthat subcortical alignment differences may have a negligibleimpact on other methods relying on similar registrationtechniques for aligning subcortical structures (e.g. voxel-basedmorphometry studies) (Modinos et al., 2009).
4.3. Possibility for further improvements
While we demonstrated that alignment precision showsnegligible discrepancies between schizophrenia and controlsubjects following 12-parameter affine registration, therewere still differences in specific structures that approachedmedium effect sizes. Such differences may be completelyeliminated with current state-of-the-art subcortical segmen-tation techniques using structure-specific alignment. Forinstance, one approach — large deformation diffeomorphicmetric mapping (LDDMM) of subcortical structures intro-duced by Khan and colleagues (Khan et al., 2008) — which isintegrated with the FreeSurfer software package employssample-specific template-based registration while producinga ‘smoother’ segmentation of subcortical structures. In turn,superior segmentation should further minimize across-subject variability for a given structure. In addition toimproved segmentation, LDDMM affords non-linear struc-ture-specific registration, which further minimizes alignmentdiscrepancies and should, in principle, yield an even betterpower profile for functional neuroimaging investigations.Additionally, state-of-the-art whole-brain non-linear defor-mation algorithms evaluated by Klein et al. (2009) mayfurther reduce alignment discrepancies observed in thecurrent study.
4.4. Limitations
We demonstrated that VAP for major subcortical struc-tures is largely equivalent in schizophrenia and controlsubjects. However, we did not explicitly examine therelationship between VAP and power profiles for fMRI signalwithin subcortical structures. The implication of the currentfindings is that the observed negligible effect sizes forbetween-group differences in subcortical alignment do notpresent a plausible confound for fMRI comparisons. However,it will be important for future work to explicitly test thishypothesis. Given that we focused on six major subcorticalstructures, it would be quite challenging to design a singleexperiment that reliably engages all of the examinedstructures in one study in the same participants. However,for future validations it would be feasible to investigate one ora few regions in focused studies (e.g. the amygdala inresponse to facial affect) to explicitly validate that evenminimal subcortical alignment mismatches do not confoundfMRI activation profiles. In addition, while we did not find
Please cite this article as: Anticevic, A., et al., Subcortical alignmeResearch (2010), doi:10.1016/j.schres.2009.12.040
alignment differences in the present study, we still cannotrule out the possibility that if we were to examine a morechronic and severe sample some differences may be moreapparent.
4.5. Conclusions
In summary, we demonstrated that, in contrast to cortex,alignment of subcortical structures is largely similar whencomparing patients with schizophrenia and healthy controls.This has important implications for studies examiningfunctional differences in subcortical structures, particularlythose using whole-brain approaches, as it suggests that groupdifferences in alignment may not present a major confoundfor interpreting group differences in functional activation.
Role of funding sourceThis research was supported by NIH grants P50 MH071616 and R01
MH56584. NIH had no further role in the current study with regard to datacollection, data analysis and interpretation of findings or in manuscriptpreparation and the submission decision.
ContributorsAlan Anticevic conducted data analyses and wrote the first draft of the
manuscript. Dr. Grega Repovs and Jared Van Snellenberg assisted with dataanalyses and writing. Dr. Deanna Barch and John Csernansky supervised thestudy. All authors contributed to and have approved the final manuscript.
Conflict of interestDr. Csernansky has received research grants from the NIMH and NIA, and
royalties from Medtronic for a patent held jointly with WashingtonUniversity School of Medicine, has been a paid consultant for Eli Lilly andSanofi-Aventis, and has received speakers' honoraria from Janssen Pharma-ceutica, Eli Lilly and Bristol-Myers Squibb. Dr. Deanna Barch has receivedgrants from the NIMH, NIA, NARSAD and the McDonnel Center for SystemsNeuroscience. None reported for the other authors.
AcknowledgementsWe thank the staff of the Administration/Assessment and Biostatistical
Cores of the CCNMD at Washington University School of Medicine forcollection of the clinical and imaging data and data management. Dr. Li-Shiun Chen had full access to all of the data in the study and takesresponsibility for the integrity of the data and the accuracy of the dataanalysis. We thank Erin Dawd for help and suggestions with additionalanalyses.
References
Acton, P.D., Friston, K.J., 1998. Statistical parametric mapping in functionalneuroimaging: beyond PET and fMRI activation studies. EuropeanJournal of Nuclear Medicine 25, 663–667.
Aleman, A., Kahn, R.S., 2005. Strange feelings: do amygdala abnormalitiesdysregulate the emotional brain in schizophrenia? Progress in Neuro-biology 77, 283–298.
Andreasen, N.C., 1983a. The Scale for the Assessment of Negative Symptoms(SANS). University of Iowa, Iowa City.
Andreasen, N.C., 1983b. The Scale for the Assessment of Positive Symptoms(SAPS). University of Iowa, Iowa City.
Anticevic, A., Dierker, D.L., Gillespie, S.K., Repovs, G., Csernansky, J.G., Van Essen,D.C., Barch, D.M., 2008. Comparing surface-based and volume-basedanalyses of functional neuroimaging data in patients with schizophrenia.NeuroImage 41, 835–848.
Argall, B.D., Saad, Z.S., Beauchamp,M.S., 2006. Simplified intersubject averagingon the cortical surface using SUMA. Human Brain Mapping 27, 14–27.
Buckner, R.L., Head, D., Parker, J., Fotenos, A.F., Marcus, D., Morris, J.C., Snyder,A.Z., 2004. A unified approach for morphometric and functional dataanalysis in young, old, and demented adults using automated atlas-basedhead size normalization: reliability and validation against manualmeasurement of total intracranial volume. NeuroImage 23, 724–738.
Cohen, J., 1992. A power primer. Psychological Bulletin 112, 155–159.
nt precision in patients with schizophrenia, Schizophrenia

8 A. Anticevic et al. / Schizophrenia Research xxx (2010) xxx–xxx
ARTICLE IN PRESS
Cox, R.W., 1996. AFNI: software for analysis and visualization of functionalmagnetic resonance neuroimages. Computers and Biomedical Research29, 162–173.
Crow, T.J., 1999. Twin studies of psychosis and the genetics of cerebralasymmetry. The British Journal of Psychiatry: The Journal of MentalScience 175, 399–401.
Crow, T.J., Ball, J., Bloom, S.R., Brown, R., Bruton, C.J., Colter, N., Frith, C.D.,Johnstone, E.C., Owens, D.G., Roberts, G.W., 1989a. Schizophrenia as ananomaly of development of cerebral asymmetry. A postmortem studyand a proposal concerning the genetic basis of the disease. Archives ofGeneral Psychiatry 46, 1145–1150.
Crow, T.J., Colter, N., Frith, C.D., Johnstone, E.C., Owens, D.G., 1989b.Developmental arrest of cerebral asymmetries inearly onset schizophrenia.Psychiatry Research 29, 247–253.
Csernansky, J.G., Joshi, S., Wang, L., Haller, J.W., Gado, M., Miller, J.P.,Grenander, U., Miller, M.I., 1998. Hippocampal morphometry inschizophrenia by high dimensional brain mapping. Proceedings of theNational Academy of Sciences 95, 11406–11411.
Csernansky, J.G., Schindler, M.K., Splinter, N.R., Wang, L., Gado, M., Selemon,L.D., Rastogi-Cruz, D., Posener, J.A., Thompson, P.A., Miller, M.I., 2004.Abnormalities of thalamic volume and shape in schizophrenia. TheAmerican Journal of Psychiatry 161, 896–902.
Csernansky, J.G., Gillespie, S.K., Dierker, D.L., Anticevic, A., Wang, L., Barch, D.M.,Van Essen, D.C., 2008. Symmetric abnormalities in sulcal patterning inschizophrenia. NeuroImage 43, 440–446.
Desai, R., Liebenthal, E., Possing, E.T., Waldron, E., Binder, J.R., 2005.Volumetric vs. surface-based alignment for localization of auditorycortex activation. NeuroImage 26, 1019–1029.
First, M.B., Spitzer, R.L., Miriam, G., Williams, J.B.W., 2002. Structured ClinicalInterview for DSM-IV-TR Axis I Disorders, Research Version, Non-patientEdition (SCID-I/NP). Biometrics Research, New York State PsychiatricInstitute, New York.
Fischl, B., Sereno, M.I., Dale, A.M., 1999a. Cortical surface-based analysis. II:inflation, flattening, and a surface-based coordinate system. NeuroImage9, 195–207.
Fischl, B., Sereno, M.I., Tootell, R.B., Dale, A.M., 1999b. High-resolutionintersubject averaging and a coordinate system for the cortical surface.Human Brain Mapping 8, 272–284.
Fischl, B., Salat, D.H., Busa, E., Albert, M., Dieterich, M., 2002. Whole brainsegmentation automated labeling of neuroanatomical structures in thehuman brain. Neuron 33, 341–355.
Fischl, B., Salat, D.H., van der Kouwe, A.J., Makris, N., Ségonne, F., Quinn, B.T.,Dale, A.M., 2004. Sequence-independent segmentation of magneticresonance images. NeuroImage 23 (Suppl 1), S69–S84.
Friston, K.J., Holmes, A.P., Poline, J.B., Grasby, P.J.,Williams, S.C., Frackowiak, R.S.,Turner, R., 1995. Analysis of fMRI time-series revisited. NeuroImage 2,45–53.
Harms,M.P.,Wang, L., Mamah, D., Barch, D.M., Thompson, P.A., Csernansky, J.G.,2007. Thalamic shape abnormalities in individuals with schizophrenia andtheir nonpsychotic siblings. The Journal of Neuroscience 27, 13835–13842.
Khan, A.R., Wang, L., Beg, M.F., 2008. FreeSurfer-initiated fully-automatedsubcortical brain segmentation in MRI using Large DeformationDiffeomorphic Metric Mapping. NeuroImage 41, 735–746.
Klein, A., Andersson, J., Ardekani, B.A., Ashburner, J., Avants, B., Chiang, M.C.,Christensen, G.E., Collins, D.L., Gee, J., Hellier, P., Song, J.H., Jenkinson, M.,Lepage,C., Rueckert, D., Thompson,P., Vercauteren,T.,Woods, R.P.,Mann, J.J.,Parsey, R.V., 2009. Evaluation of 14 nonlinear deformation algorithmsapplied to human brain MRI registration. NeuroImage 46, 786–802.
Konick, L.C., Friedman, L., 2001.Meta-analysis of thalamic size in schizophrenia.Biological Psychiatry 49, 28–38.
Lawrie, S.M., Whalley, H.C., Job, D.E., Johnstone, E.C., 2003. Structural andfunctional abnormalities of the amygdala in schizophrenia. Annals of theNew York Academy of Sciences 985, 445–460.
Li, H., Chan, R.C., McAlonan, G.M., Gong, Q.Y., 2009. Facial emotion processingin schizophrenia: a meta-analysis of functional neuroimaging data.Schizophrenia Bulletin (Electronic publication ahead of print).
Please cite this article as: Anticevic, A., et al., Subcortical alignmeResearch (2010), doi:10.1016/j.schres.2009.12.040
Mamah, D., Wang, L., Barch, D., de Erausquin, G.A., Gado, M., Csernansky, J.G.,2007. Structural analysis of the basal ganglia in schizophrenia.Schizophrenia Research 89, 59–71.
Modinos, G., Vercammen,A.,Mechelli, A., Knegtering,H.,McGuire, P.K., Aleman,A., 2009. Structural covariance in the hallucinating brain: a voxel-basedmorphometry study. Journal of Psychiatry and Neuroscience 34, 465–469.
Namiki, C., Hirao, K., Yamada, M., Hanakawa, T., Fukuyama, H., Hayashi, T.,Murai, T., 2007. Impaired facial emotion recognition and reducedamygdalar volume in schizophrenia. Psychiatry Research 156, 23–32.
Ojemann, J., Akbudak, E., Snyder, A., McKinstry, R., Raichle,M., Conturo, T., 1997.Anatomic localization and quantitative analysis of gradient refocused echo-planar fMRI susceptibility artifacts. NeuroImage 6, 156–167.
Oldfield, R.C., 1971. The assessment and analysis of handedness: TheEdinburgh inventory. Neuropsychologia 9, 97–113.
Pearlson, G.D., Marsh, L., 1999. Structural brain imaging in schizophrenia: aselective review. Biological Psychiatry 46, 627–649.
Qiu, A., Wang, L., Younes, L., Harms, M.P., Ratnanather, J.T., Miller, M.I.,Csernansky, J.G., 2009. Neuroanatomical asymmetrypatterns in individualswith schizophrenia and their non-psychotic siblings. Neuroimage 47 (4),1221–1229.
Shenton, M.E., Dickey, C.C., Frumin, M., McCarley, R.W., 2001. A review of MRIfindings in schizophrenia. Schizophrenia Research 49, 1–52.
Shenton,M.E., Gerig,G.,McCarley, R.W., Székely, G., Kikinis, R., 2002. Amygdala-hippocampal shape differences in schizophrenia: the application of 3Dshape models to volumetric MR data. Psychiatry Research 115, 15–35.
Tae, W.S., Kim, S.S., Lee, K.U., Nam, E.-C., Kim, K.W., 2008. Validation ofhippocampal volumes measured using a manual method and twoautomated methods (FreeSurfer and IBASPM) in chronic major depressivedisorder. Neuroradiology 50, 569–581.
Talairach, J., Tournoux, P., 1988. Co-planar stereotaxic atlas of the humanbrain. Thieme, New York.
Van Essen, D.C., 2005. A population-average, landmark- and surface-based(PALS) atlas of human cerebral cortex. NeuroImage 28, 635–662.
Velakoulis, D., Pantelis, C., McGorry, P.D., Dudgeon, P., Brewer, W., Cook, M.,Desmond, P., Bridle, N., Tierney, P., Murrie, V., Singh, B., Copolov, D., 1999.Hippocampal volume infirst-episode psychoses and chronic schizophrenia:a high-resolution magnetic resonance imaging study. Archives of GeneralPsychiatry 56, 133–141.
Velakoulis, D.,Wood, S.J., Wong, M.T., McGorry, P.D., Yung, A., Phillips, L., Smith,D., Brewer,W., Proffitt, T., Desmond, P., Pantelis, C., 2006. Hippocampal andamygdala volumes according to psychosis stage and diagnosis: a magneticresonance imaging study of chronic schizophrenia, first-episode psychosis,and ultra-high-risk individuals. Archives of General Psychiatry 63,139–149.
Wang, L., Mamah, D., Harms, M.P., Karnik, M., Price, J.L., Gado, M.H., Thompson,P.A., Barch, D.M., Miller, M.I., Csernansky, J.G., 2008. Progressive deforma-tion of deep brain nuclei and hippocampal–amygdala formation inschizophrenia. Biological Psychiatry 64, 1060–1068.
Wechsler, D., 1997. Wechsler Adult Intelligence Scale, Third Edition. ThePsychological Corporation, San Antonio.
Wood, S.J., Velakoulis, D., Smith, D.J., Bond, D., Stuart, G.W., McGorry, P.D.,Brewer, W.J., Bridle, N., Eritaia, J., Desmond, P., Singh, B., Copolov, D.,Pantelis, C., 2001. A longitudinal study of hippocampal volume in firstepisode psychosis and chronic schizophrenia. Schizophrenia Research 52,37–46.
Woods, R.P., Grafton, S.T., Holmes, C.J., Cherry, S.R., Mazziotta, J.C., 1998a.Automated image registration: I. General methods and intrasubject,intramodality validation. Journal of Computer Assisted Tomography 22,139–152.
Woods, R.P., Grafton, S.T., Watson, J.D.G., Sicotte, N.L., Mazziotta, J.C., 1998b.Automated image registration: II. Intersubject validation of linear andnonlinear models. Journal of Computer Assisted Tomography 22, 153–165.
Worsley, K.J., Friston, K.J., 1995. Analysis of fMRI time-series revisited —
again. NeuroImage 2, 173–181.
nt precision in patients with schizophrenia, Schizophrenia


