Embed Size (px)
Citation preview
Functional Diversity of Nematode Communities in
the Nizampatnam Bay, Bay of Bengal
Ch. Vijaya Bhanu, M. Srinivasa Rao, C. Annapurna* & A.Ambedkar
Department of Zoology, Andhra University, Visakhapatnam530003, Andhra Pradesh, INDIA.
*[Email: [email protected]]
Abstract
During the present study the relationship betweentaxonomic and biological trait approaches in relation to theabiotic environment were studied from the nematode samplescollected from 64 subtidal stations during the four seasons inthe Nizampatnam Bay, East coast of India. 19 categories offive biological traits known to represent an importantecological function were employed. These were related tobuccal morphology, tail shape, body size, body shape and lifehistory strategy. Data on trait membership was provided bybiological information on species and genera. A total of 34different trait combinations were recorded. In the presentstudy, the most common morphotypes were non-selective depositfeeding nematodes, with colonizing abilities of 2-4 (in ascale of 1-5). Their abundance was correlated with depth.Inspite of a high turnover of species, functional diversity ofassemblages did not change notably in space and time. Acomparison of spatial and temporal patterns of nematodefunctional diversity between Nizampatnam Bay and other semienclosed Bays in temperate and tropical regions suggests thattwo features are common: (1) in detecting spatial patterns,taxonomic approach offers more powerful than biological traitapproach; (2) biological trait approach offers more reliablecorrelative links with environmental factors than taxonomicone.
Key words: Nematodes, meiobenthos, tropical environment,marine ecology, species diversity.
Introduction
Analyses of biological traits of species and subsequent
creation of functional groups have been introduced in studies
focusing on assemblage structure. This relatively new approach
allows obtaining insight into the functioning of ecosystems14
and reveals additional relationships in assemblages18. They
detected a positive relationship between number of species and
functional diversity. An additional interesting point is that
the relationship is also present at smaller spatial scales
(i.e. few kilometers within a Bay) and in tropical ecosystems.
The stations where nematode species were encountered in all
the four seasons were considered for biological trait analyses
and the matrix (numerical abundance vs. locations) was
prepared on the basis of seasonal data from the overall mean
derived for each location (see Table 1).
Marine nematode assemblages are generally compared by
diversity indices and other species abundance patterns12
regardless of the autecological requirements or identity of
the taxa23. Species in functional groups share morphological
traits that are thought or known to represent an important
ecological function6. In the present study 19 categories of
five biological traits were used to represent an important
ecological function. These were related to buccal morphology,
tail shape, body size, body shape and life history strategy. A
biological trait matrix was constructed by assigning to each
nematode species / genus its affinity to each trait category.
The biological trait matrix was then raised by the relative
species abundance to give abundance – weighted trait matrices
for each station (Table 1).
Study Area
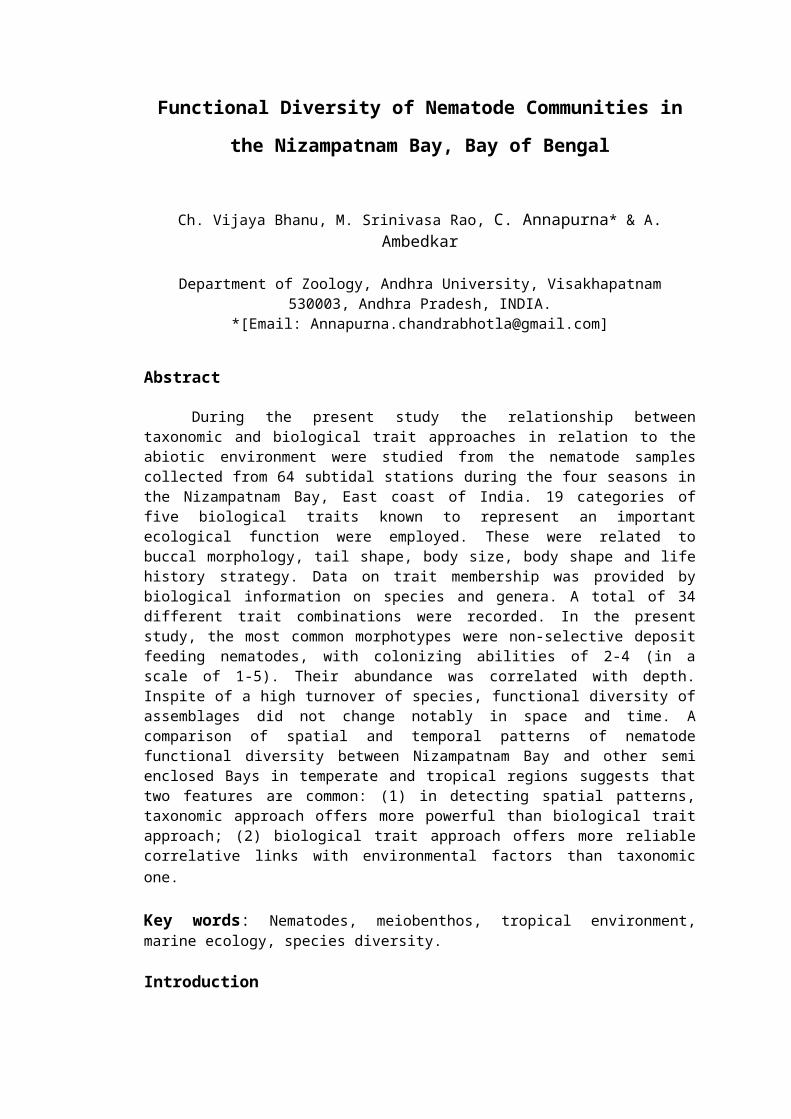
Nizampatnam Bay is an embayment in the Bay of Bengal and
adjoins the Krishna river delta. The bay occupies an area of
1825 Sq.km in between latitudes 150 25’ to 150 55’ N and
longitudes 800 01’ to 800 50’ E (Fig. 1). The coastline extends
for about 122 Km from Kottapatnam in the southwest to False
Divi point in the northeast. The river Krishna flows across
the coastal plains and joins the sea at the northern end of
the bay.
Material and methods
Sediment samples were collected during four seasons, pre
– monsoon I, October, 2006 (N=80), post- monsoon I, March 2007
(N = 48), pre-monsoon II, November, 2007 (N =60) and post-
monsoon II, March 2008 (N=60) between latitudes 150 28’ to 150
48’ N and longitudes 800 17’ to 800 47’ E in the province of
Nizampatnam Bay were used in the study. A total number of 64
GPS located stations were covered during the four seasons. At
each station, a glass corer (3.6 cm inner diameter) was used
for collecting sediment samples of 10 cm long cores from grab
(van Veen grab, 0.1m²) hauls. The van Veen grab has an opening
lid at the top, which facilitates the core sample to be taken
out without disturbing the sediment. Replicate sub samples
were collected from each haul. The samples were in Toto
transferred to polythene containers, labeled and material
preserved in 4% neutral formalin with Rose Bengal for further
examination.
Observations on the physicochemical characteristics of the
sea water (temperature, dissolved oxygen, salinity) were made
according to Barnes1. Sediments (sub-samples) were oven dried
(60°C) onboard and stored until further analysis. The samples
were subjected to sieving and sediment texture (Master sizer
2000, Melvin Instruments, Germany) and proportions of sand,
silt, and clay (%) were calculated and values were plotted on
triangular graphs according to the nomenclature suggested by
Sheppard19. Organic matter was estimated by the wet oxidation
method of Walkey-Black but as modified by Gaudette et al 9.
Biological traits of the nematode assemblagesTo determine the proportions of nematodes with different
biological traits, free-living marine nematode genera and
species were classified into a series of biological traits
according to Schratzberger et al18 and references therein. A
total of 19 categories of five biological traits, each of
which was thought or known to represent an important
ecological function, were assigned to each nematode genus or
species. These biological traits were related to buccal
morphology, tail shape, adult body size, body shape and life
history strategy. Based on characteristics of buccal
morphology, Wieser24 devised a classification of feeding types
for nematodes including selective deposit feeders consuming
bacteria and small-sized organic particles (type 1A), non-
selective deposit feeders also feeding on organic deposit but
targeting largersized particles (type 1B), epigrowth feeders
scraping food off surfaces similar to macrobenthic grazers
(type 2A), and predators feeding on nematodes and other small
invertebrates (type 2B). Nematodes were assigned to four tail
shape groups: short/round, elongated/filiform, conical and
clavate, common in free-living marine nematodes from coastal
environments according to Thistle and Sherman21 and Thistle et
al22. Thistle and Sherman21 noted that nematode tails could be
important in locomotion, feeding and reproduction. The adult
length and the length–width ratio for adult nematode species
were also deduced from the taxonomic literature. Nematode
species were assigned to four length groups: <1 mm, 1–2 mm, 2–
4 mm and >4 mm, and three shape categories: stout with a
length–width ratio <18, slender with a length–width ratio of
18–72, and long/thin with a length–width ratio >72. Body size
influences many aspects of an animal, such as its life
history, physiology, energy requirements, and biotic and
abiotic interactions16, 5. Smaller-sized species generally have
higher growth rates16, which are typical of opportunistic
strategists. The differences in body shape of nematodes
reflect an ecological adaptation designed to meet the
conflicting requirements of either increased mobility (in
slender body shape) to physical disturbance or reduced
vulnerability (in stout body shape) to predation20. Nematodes
were also allocated to life history groups according to
Bongers2 and Bongers et al3, 4 where genera were classified on a
five-point scale (1-5) from colonizers (inter alia short life-
cycle, high reproduction rates, high colonization ability and
tolerant to various types of disturbance) to persisters (inter
alia long-life-cycles, low colonization ability, few offspring
and sensitive to disturbances). In contrast to terrestrial
environments, extreme colonizers (colonizer–persister score of
1) and persisters (colonizer–persister score of 5) were rare
or absent in this study.
Maturity index (MI) can be calculated for each habitat/station
based on c-p scores of inhabiting species using the formulae3.
MI = i=1 ΣS (v*f)
Where S= number of species, v = the c-p value of taxon i
and f = the frequency of that taxon.
The index of trophic diversity (ITD), based on the
proportion of each of four feeding types, was calculated
following Heip et al10. ITD values range from 0.25 (highest
trophic diversity with the four trophic groups accounting for
25% each) to 1.0 (lowest trophic diversity when a single
feeding type is present):
ITD =Σθ2
Where θ = percent contribution of each four feeding types
according to Wieser (1953): selective deposit feeders, non-
selective deposit feeders, epistrate feeders and predators.
Results
Among the stations studied in Nizampatnam Bay, depth
ranged from 10 m to 34 m, % sand from 0.06 to 100%, silt
content from 0.1 to 89%, clay content from 3.14 to 56.8%,
organic matter content from 0.25 to 2.205%, mean particle
diameter from 4.826 to 888 µm, bottom water temperature from
25 to 34 0C, salinity from 24.8 to 36.8 0C and dissolved oxygen
from 1.344 to 5.824 ml.l-1 (Table 2).
Analysis of nematode distribution patterns
Non-metric multi-dimensional scaling (MDS) ordination
using Bray-Curtis similarity measure was applied to relative
abundance data to compare spatial patterns in the taxonomic
and functional composition of nematode communities at the 64
sampling locations. Separate resemblance matrices were created
based on the composition of the nematode communities with
respect to species and genus identity, buccal morphology, tail
shape, adult length, adult shape and coloniser-persister
score. A further resemblance matrix was created based on the
abundance-weighted biological traits matrix to summarise
patterns in the functional structure of nematode assemblages
of all species. Analysis of similarities (ANOSIM) was used to
test the significant taxonomic and functional differences
between stations and similarity percentages (SIMPER) procedure
was applied to identify the trait groups that were primarily
responsible for the functional differences observed between
stations. The relationship between the structure of nematode
assemblages and environmental variables was explored by
calculating Spearman rank correlations (rs) between similarity
matrices derived from the faunal data (based on Bray – Curtis
similarity) and matrices derived from various subsets of
environmental data (based on normalized Euclidean Distance),
thereby defining suites of environmental variables which best
explained the biotic structure (BIOENV procedure). A
permutation test was applied to assess the significance of
these relationships.
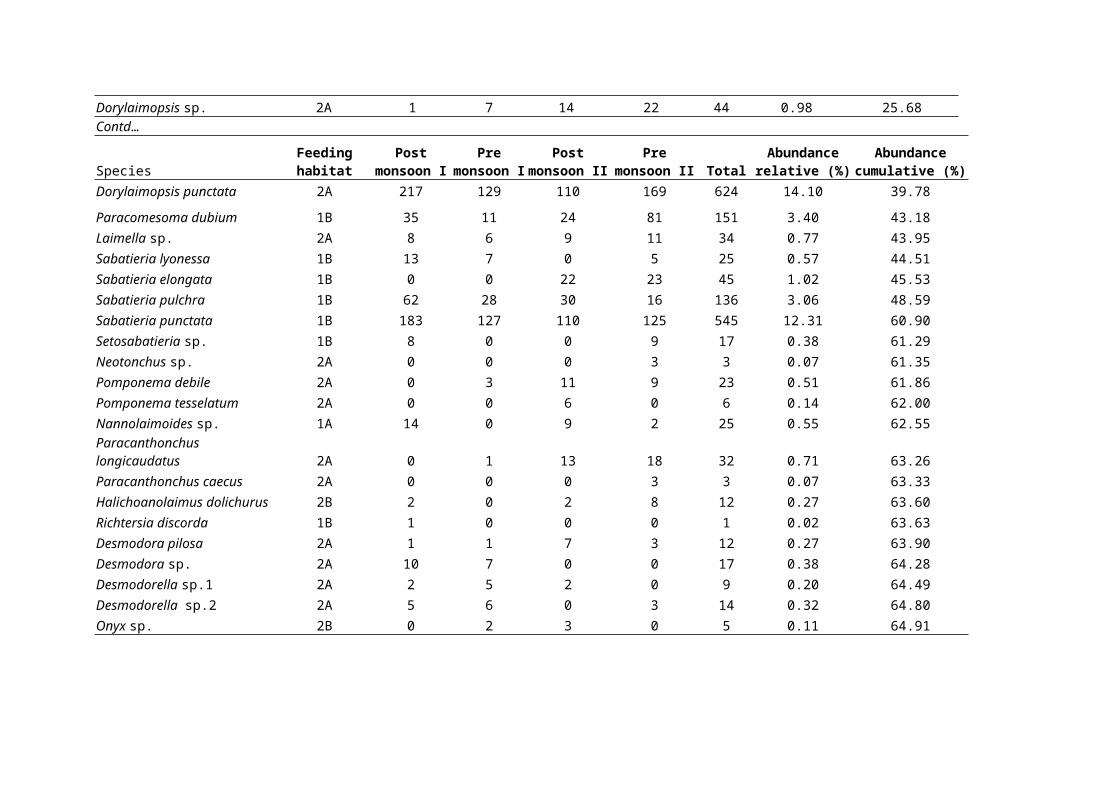
Functional attributes of nematode communities in the
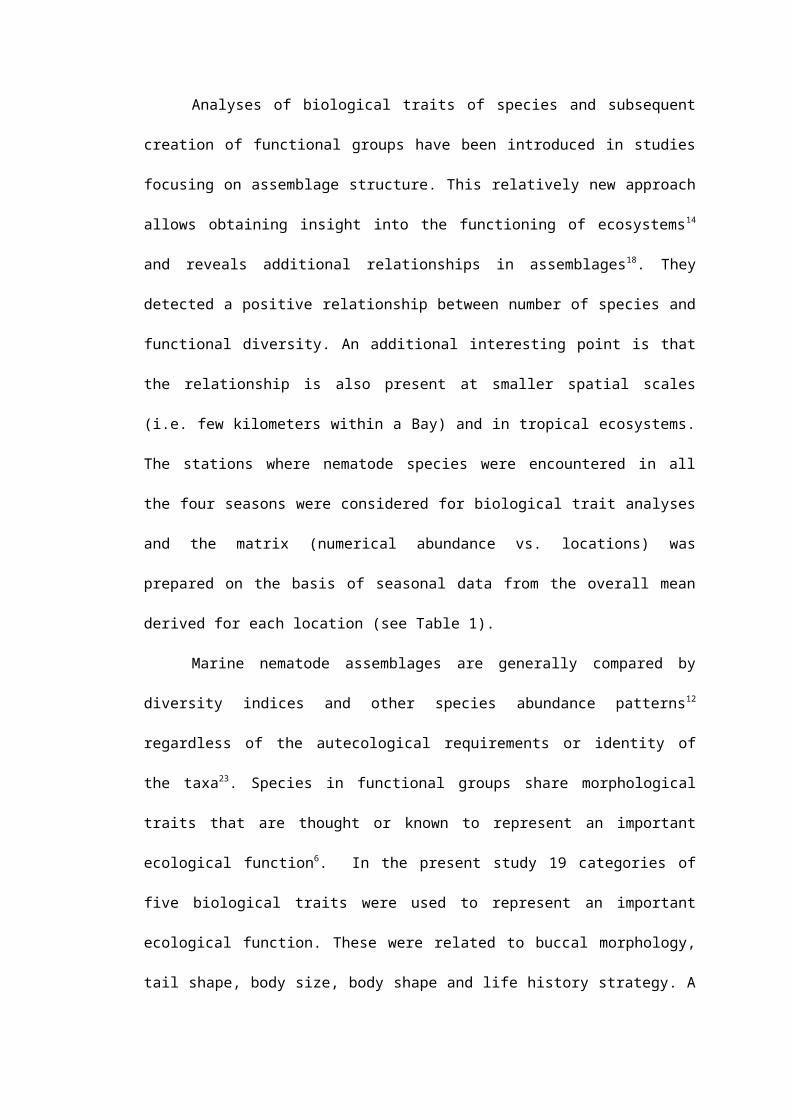
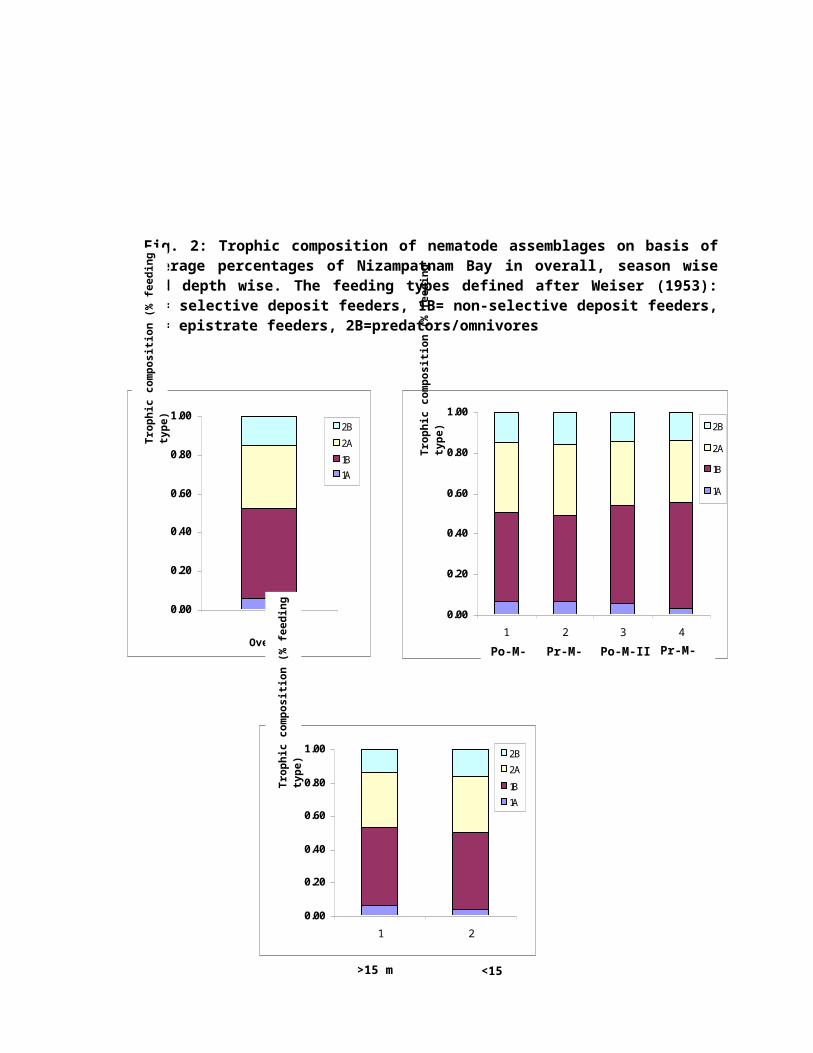
Nizampatnam Bay are listed in Table 3. The proportions of
feeding types of nematodes in this Bay were dominated by non-
selective deposit feeders (1B) and epistrate feeders (2A)
where as proportions of predators (2B) and selective deposit
feeders (1A) were comparatively low at most stations. Season
wise, non-selective deposit feeders and epigrowth feeders were
the first and second abundant groups.
The selective deposit feeders (1A) were Halalaimus gracilis,
Oxystomina asetosa, Nannolaimoides sp., Tricoma brevirostris and Terschellingia
longicaudata, non-selective deposit feeders (1B) include Sabatieria
punctata, Sabatieria lyonessa, Setosabatieria sp., Richtersia discorda, Daptonema
invagiferoum, Daptonema biggi, Daptonema vicinum, Axonolaimus spinosus,
Axonolaimus paraspinosus and Parodontophora sp., The epistrate
feeders (2A) were Dorylaimopsis punctata, Pomponema debile,
Paracanthonchus longicaudatus, Desmodora pilosa and Monoposthia sp.,
where as predators/omnivores (2B) include Enoploides sp.,
Enoplolaimus longicaudatus, Viscosia cobbi, Halichoanolaimus dolichurus and
Sphaerolaimus balticus. Thus, most of the nematodes in Nizampatnam
Bay were non-selective deposit feeders (1B).
Season wise, the ratio was different among stations
ranging from 0.60 (post-monsoon I) to 4.43 (pre-monsoon I).
The highest ratio was observed in the pre-monsoon I and the
lowest ratio was observed in the post-monsoon I. This
indicates that organic detritus was abundant in the pre-
monsoon I and II (Fig. 2).
Clavate tail (type 4) was observed for most of the
nematodes (59.8%) and it was the most prevalent tail shape at
the majority of stations, while the conico cylindrical and
long/filiform tail shaped (type 2 and 3) occupies the second
place (39.9%). Nematodes with long, retractable tails may be
able to feed toward the surface where food is relatively more
abundant while retaining the ability to retreat rapidly17, 8.
They can also avoid surface predators and resuspension in the
noncatastrophic erosive flows. The body shape of the nematodes
was mainly slender occupying 90% of total nematodes and in
less proportion long/thin and stout animals which were shown
in Tables 4 and 5. The slender nematodes were also dominant
(82%) in the North Sea study by Schratzberger et al18 and (93-
98%) dominant in subtropical Hong Kong studied by Liu et al13.
The average adult lengths of nematodes ranged from 0.20
mm to 2.04 mm. The majority (79%) of nematode individuals were
recorded in the length class (<1 mm), followed by the length
class (1-2 mm) was 20% and the nematode individuals for (2-4
mm) length class was 0.5%. In contrast, there was 51% of same
length class occurring in subtropical Hong Kong 13.
Three nematode morphotypes were encountered in the
present study. The majority of nematodes were slender (90%),
followed by long/thin (9%) and stout animals (1%). High
dominance of non-selective deposit feeders (1B) and epistrate
feeders (2A) encountered at stations 4, 12 and 14. The
nematode communities collected at stations 4 and 12 were
highly dominated by individuals with clavate tail, whereas at
station 14, they were highly dominated by the
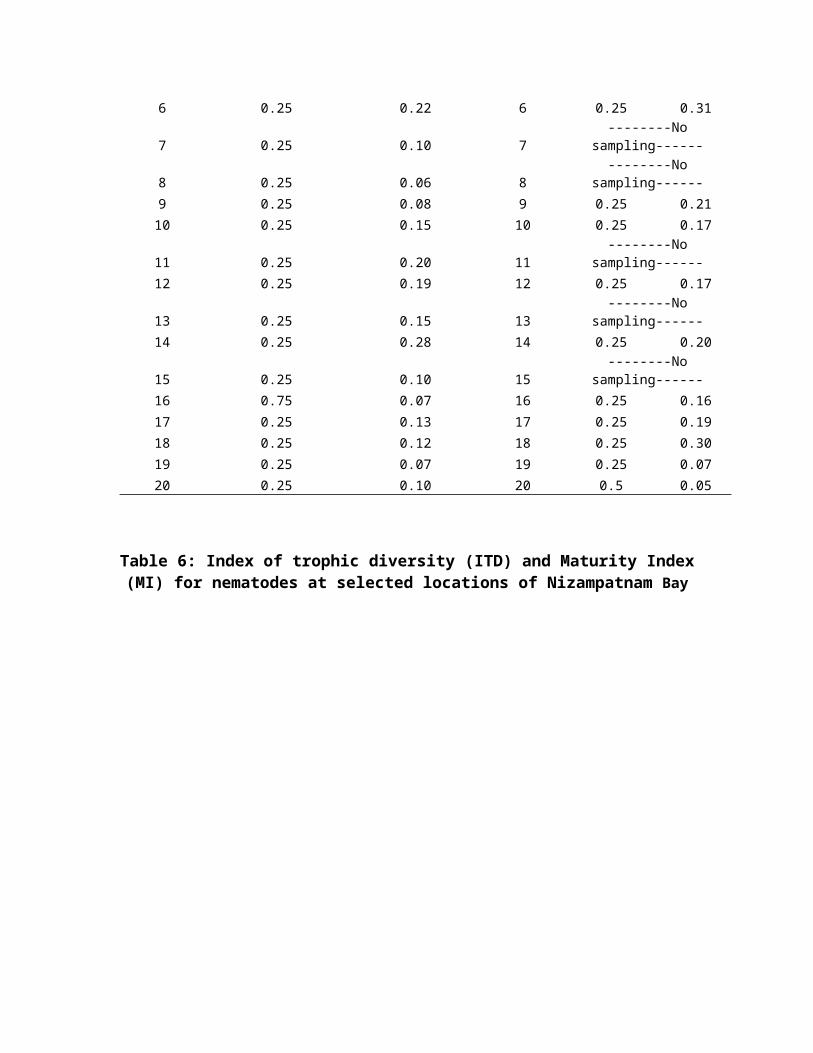
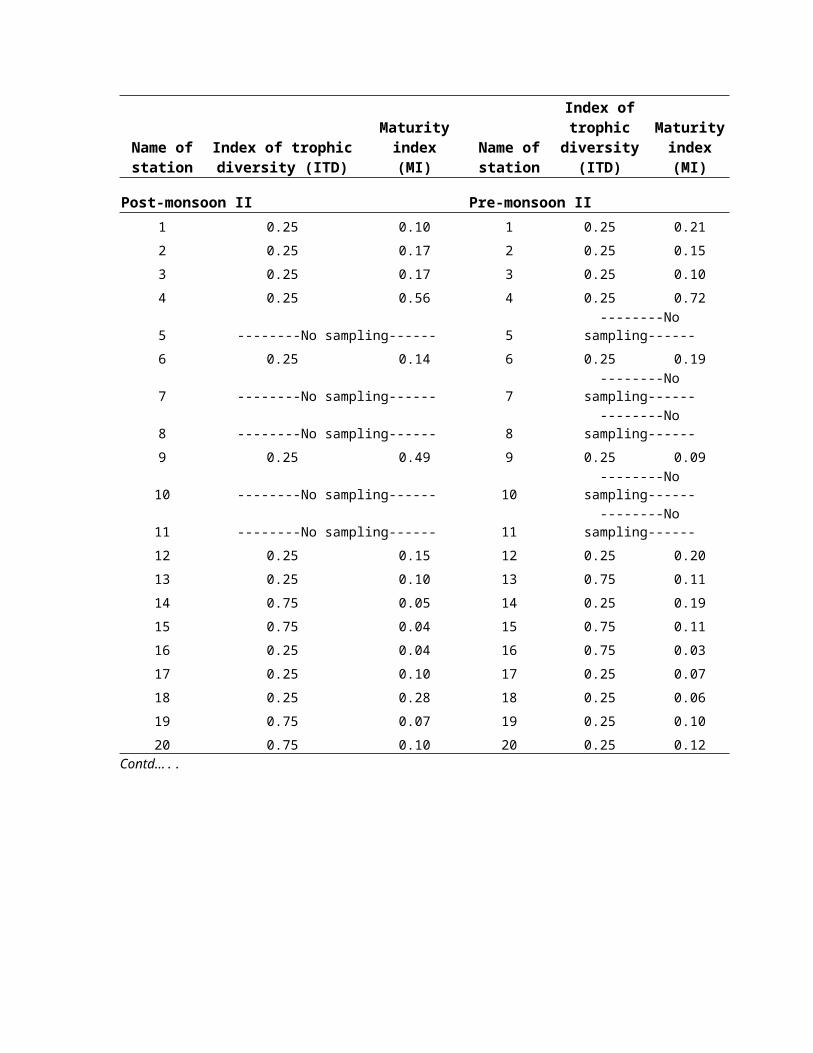
elongated/filiform tail. The Maturity Index (MI) in overall
composition of nematodes varied between 0.008 (sts. 15 and 16,
post-monsoon II) and 0.165 (st.4, pre-monsoon II). In general,
post-monsoon II season have high maturity index (2.28)
followed by pre-monsoon I (2.19), pre-monsoon II (2.17) and
post-monsoon I (2.06).
Spatial differences in the trophic structure of nematode
assemblages were primarily exerted via changes in the
dominance patterns of selective deposit feeders versus non-
selective deposit feeders and epigrowth feeders. Despite these
differences in food selection, the ITD demonstrated similar
values in the Bay. Season wise, ITD values varied
significantly, 0.07 (pre-monsoon I), 0.08 (post-monsoon I),
0.16 (pre-monsoon II) and 0.20 (post-monsoon II) (Table 6).
Over 76% of all identified individuals attained a
coloniser-persister score of 2 while the remaining have a c-p
score of 3 .Extreme persisters (coloniser-persister score of
5), in contrast were either absent or rare. Nematode
communities were clearly dominated by families with colonizer-
persister values of two to four (c-p 2 to 4). In subtropical
Hong Kong, the colonizer-persister (c-p) score 2 was most
dominant (81%)13. However, in the North Sea, over 81% of all
identified individuals attained a colonizer-persister score of
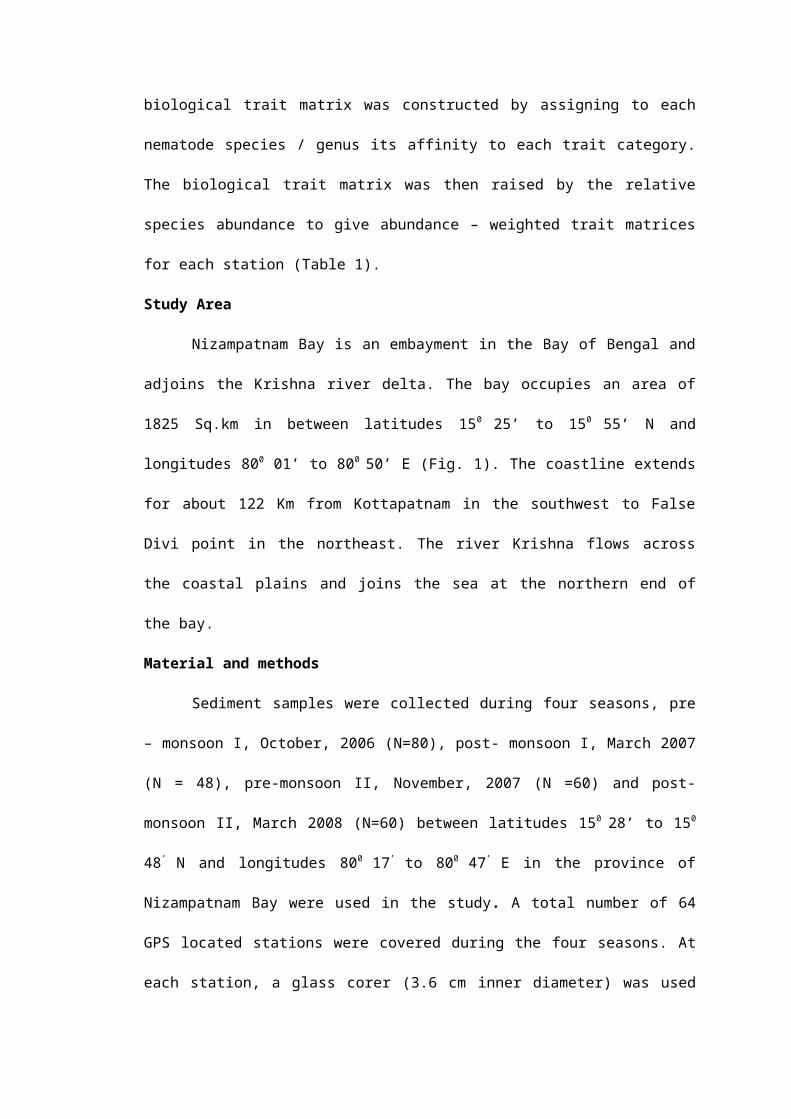
2 or 318. From the data it was possible to plot the data points
in a c-p triangle, as suggested by De Goede et al7, however,
the proportions of c-p 2, c-p 3 and c-p 4 were used as
ordinations to distinguish the sites. In Fig. 3 mainly two
groups can be separated. The stations 1-5, 8-13, 15, 16 and
18-20 shows a higher proportion of c-p 2 taxa namely Enoploides
sp., Enoplolaimus longicaudatus, Spilophorella candida, Sabatieria punctata and
Daptonema biggi, the stations 6, 7, 14 and 17 can clearly be
distinguished from the other sites by its high proportion of
c-p 3 namely Viscosia cobbi, Rhips paraornata, Nannolaimoides sp.,
Halichoanolaimus dolichurus. The colonizer- persister (c-p 5) taxa
Leptostomatum sp., were encountered at stations 2, 3, 4, 6 and 11
(< 15 m depth) and c-p 1 was practically absent.
Coloniser – persister score of 4 represented by 8 genera
(Phanoderma sp., Halalaimus gracilis, Oxystomina asetosa and Pomponema
debile), coloniser – persister score of 3 represented by 13
genera (Viscosia cobbi, Halichoanolaimus dolichurus, Sphaerolaimus balticus and
Terschellingia longicaudata), coloniser – persister score of 2
represented by 17 genera (Enoploides sp., Dorylaimopsis punctata,
Sabatieria punctata and Daptonema vicinum) and coloniser – persister
score of 5 represented by single genera i.e., Leptosomatum sp.
were encountered. A total of 34 different combinations of
biological traits were observed from the 62 species of
nematode communities.
Discussion
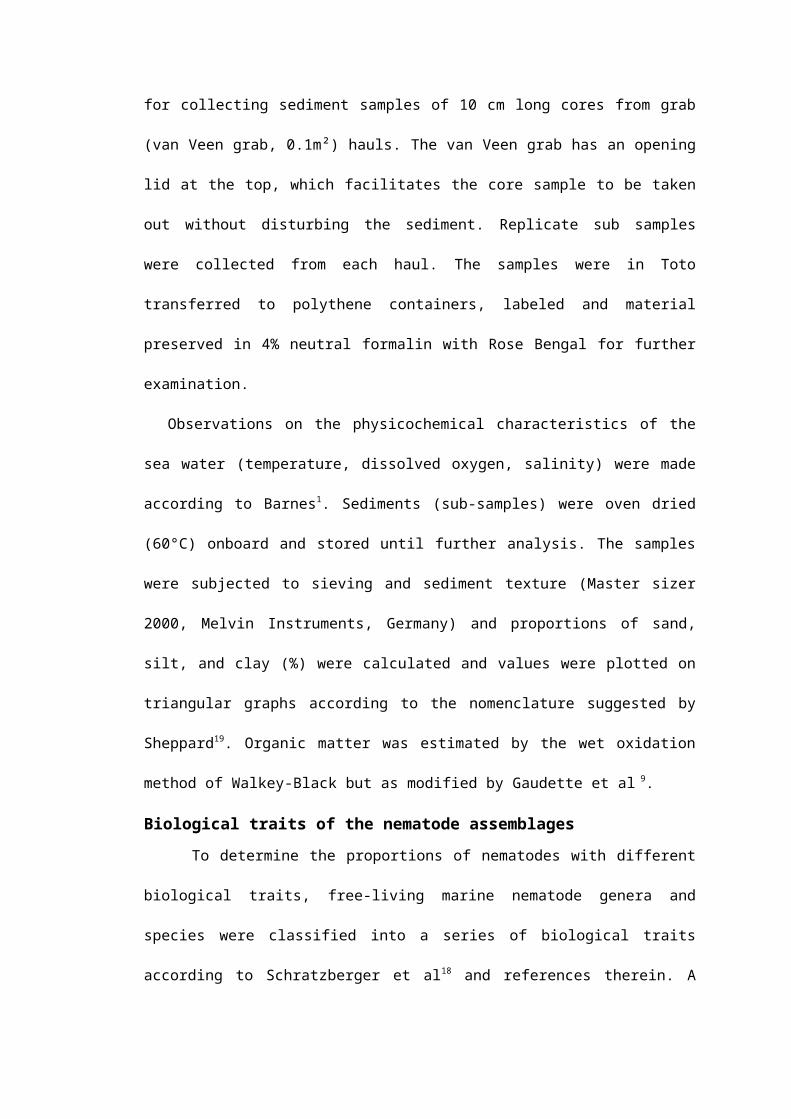
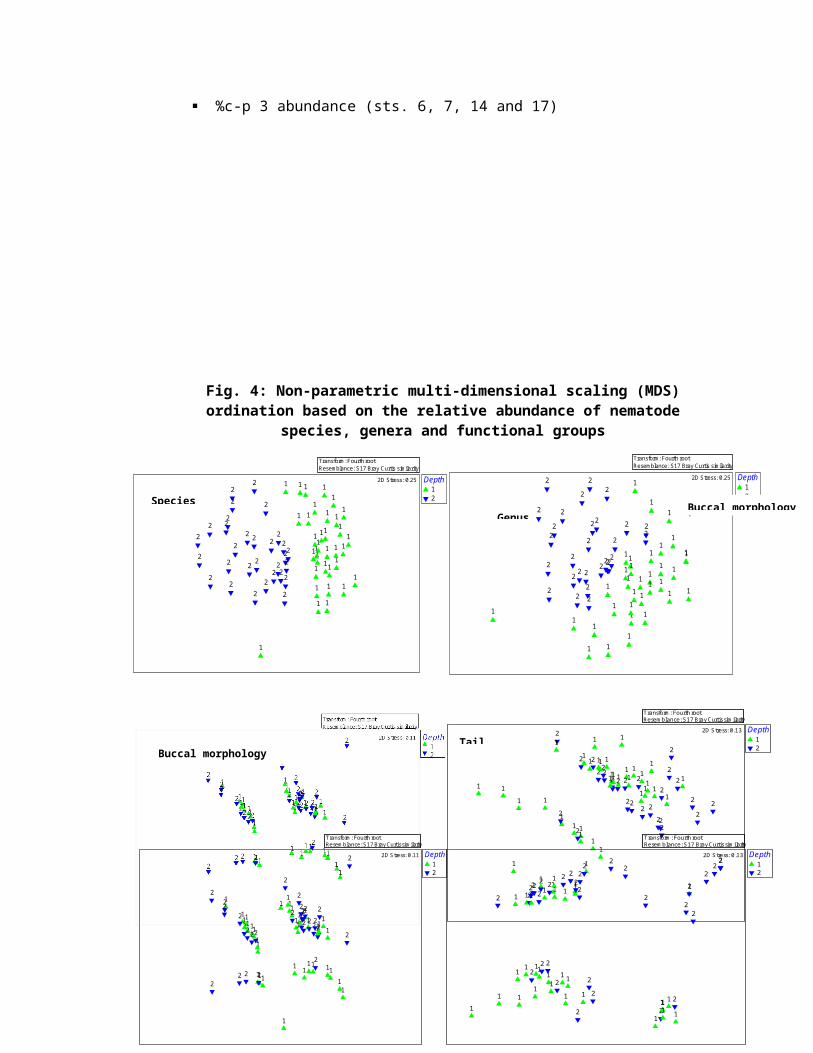
Nematode assemblages collected at the 64 sub tidal
stations differed both taxonomically and functionally but the
ordinations of taxonomic groups did not match the ordinations
based on functional groups and traits. In the ordinations
based on the relative abundance of nematode genera and
species, stations at <15 m (sts. 1 to 12) tended to cluster
into one group and the stations in the >15 m (sts. 13 to 20)
formed into another group. This geographic separation was less
pronounced in the ordinations derived from functional
characteristics of nematode communities (Fig. 4).
A total number of 34 different combinations of biological
traits, and 53 species shared the two most common combinations
of traits (Table 1). The biological matrix revealed several
notable relationships between traits. For example, large
bodied nematodes generally had a high colonizer-persister
score while that for smaller species was low. Equally, in
contrast to the generally small-sized selective deposit
feeders, predators were usually large. While ecologically
implausible trait combinations such as, for example, small
body size combined with a K-selected life history strategy
(i.e. high colonizer-persister score) were absent from the
nematode communities of Nizampatnam Bay. There were no clear
spatial pattern of biological traits (i.e. feeding types, tail
shape and body shape) within the sediments.
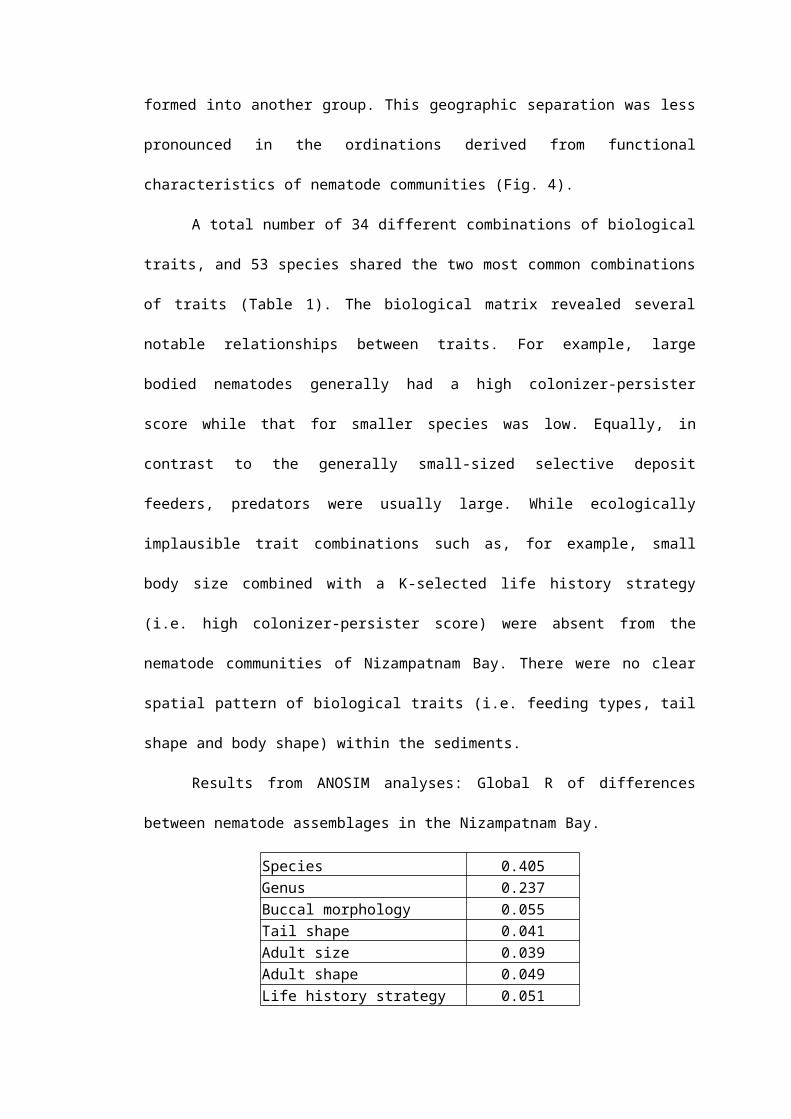
Results from ANOSIM analyses: Global R of differences
between nematode assemblages in the Nizampatnam Bay.
Species 0.405Genus 0.237Buccal morphology 0.055Tail shape 0.041Adult size 0.039Adult shape 0.049Life history strategy 0.051
All R- values were significant at
p<0.01
Nematode distribution patterns based on proportions of
species and biological traits were linked to depth, dissolved
oxygen and salinity. The composition of assemblages in terms
of biological traits was best explained by a combination of
factors like depth, salinity and dissolved oxygen.
Environmental conditions thus influence the importance of
functional complementarity structuring communities11.
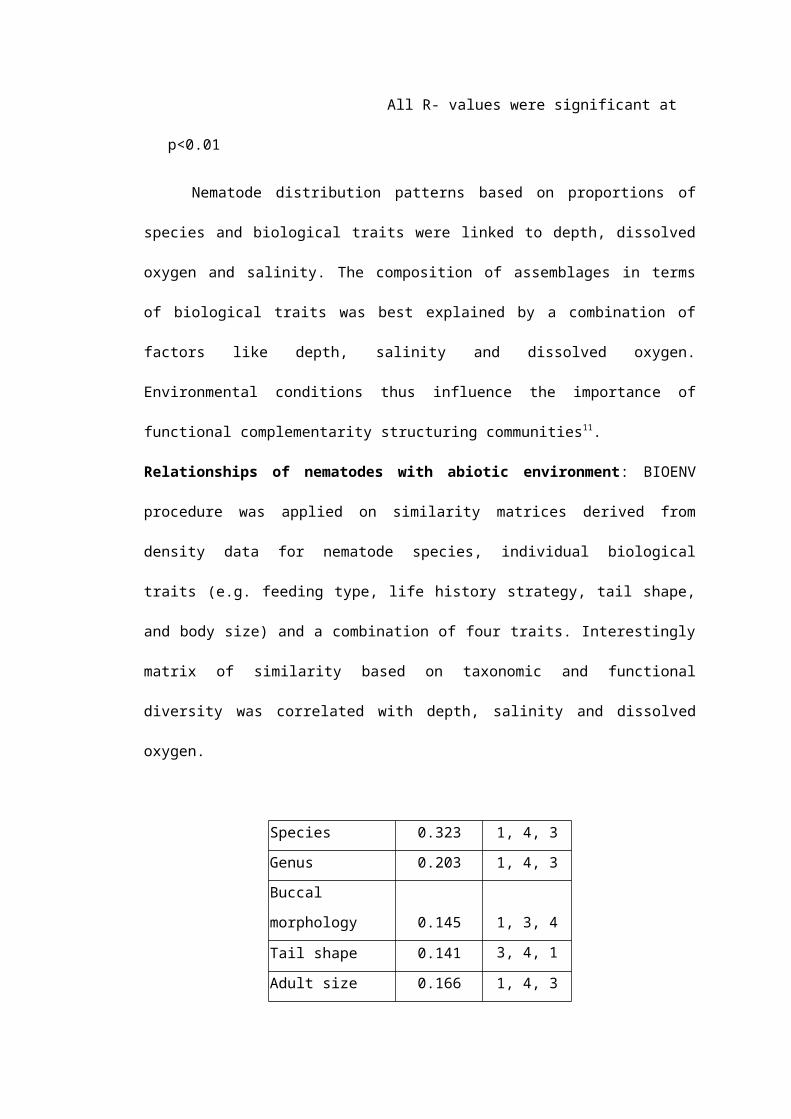
Relationships of nematodes with abiotic environment: BIOENV
procedure was applied on similarity matrices derived from
density data for nematode species, individual biological
traits (e.g. feeding type, life history strategy, tail shape,
and body size) and a combination of four traits. Interestingly
matrix of similarity based on taxonomic and functional
diversity was correlated with depth, salinity and dissolved
oxygen.
Species 0.323 1, 4, 3
Genus 0.203 1, 4, 3
Buccal
morphology 0.145 1, 3, 4
Tail shape 0.141 3, 4, 1
Adult size 0.166 1, 4, 3
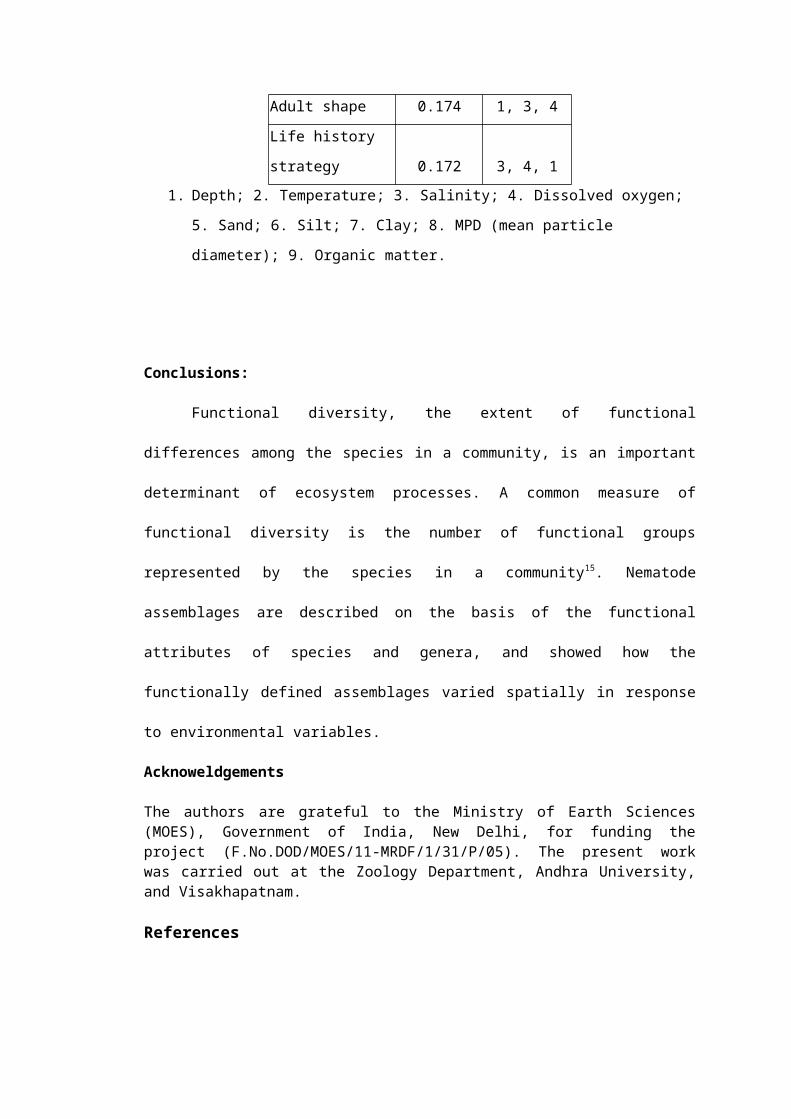
Adult shape 0.174 1, 3, 4
Life history
strategy 0.172 3, 4, 11. Depth; 2. Temperature; 3. Salinity; 4. Dissolved oxygen;
5. Sand; 6. Silt; 7. Clay; 8. MPD (mean particle
diameter); 9. Organic matter.
Conclusions:
Functional diversity, the extent of functional
differences among the species in a community, is an important
determinant of ecosystem processes. A common measure of
functional diversity is the number of functional groups
represented by the species in a community15. Nematode
assemblages are described on the basis of the functional
attributes of species and genera, and showed how the
functionally defined assemblages varied spatially in response
to environmental variables.
Acknoweldgements
The authors are grateful to the Ministry of Earth Sciences(MOES), Government of India, New Delhi, for funding theproject (F.No.DOD/MOES/11-MRDF/1/31/P/05). The present workwas carried out at the Zoology Department, Andhra University,and Visakhapatnam.
References
1. Barnes, Apparatus and methods of Ocenography. Part I.
Chemical. London: George Allen and Unwin limited
(1959) pp.341.
2. Bongers T, The maturity index: an ecological measure of
environmental disturbance based on nematode species
composition. Oecologia 83 (1990) 14–19.
3. Bongers T, Alkemade R, Yeates G W, Interpretation of
disturbance-induced maturity decrease in marine
nematode assemblages by means of the Maturity Index.
Mar Ecol Prog Ser 76 (1991) 135–142.
4. Bongers T, R G N De Goede, G W Korthals and G W Yeates,
Proposed changes of c-p classification of nematodes.
Russian Journal of Nematology 3(1) (1995) 61-62.
5. Calder W A, Size, Function and Life History. Harvard
University press, Cambridge (1984).
6. Chalcraft D R, Resetarits W J, Mapping functional
similarity of predators on the basis of trait
similarities. American Naturalist 162 (2003) 390–402.
7. De Goede R G M, Bongers T, Ettema C H, Graphical
presentation and interpretation of nematode community
structure: c-p triangles. Med Fac Landbouww Univ Gent 58
(1993) 743-750.
8. Fegley S R, Experimental variation of near-bottom current
speeds and its effects on depth distributions of sand-
living meiofauna. Marine Biology 95 (1987) 183-191.
9. Gaudette H E, Wilson R F, Toner L, Folger D W, An
inexpensive titration method for determination of
organic carbon in recent sediments. J Sed Petrol 44 (1974)
249 – 253.
10. Heip C, Vincx M, Vranken G, The Ecology of Marine
Nematodes. Oceanogr Mar Biol Ann Rev 23 (1985) 399-489.
11. Hopper D U, Chapin F S, Ewel J J, Hector A, Inchausti P,
Lovarel S, Lawton J H, Lodge D M, Loreau M, Naeem B,
Schmid B, Setala H, Symstad A J, Vandermeer, Wardle D
A, Effects of biodiversity on ecosystem functioning: a
consensus of current knowledge. Ecological monographs 75
(2005) 3-35.
12. Lambshead P J D, Sub-catastrophic sewage and industrial
waste contamination as revealed by marine nematode
faunal analysis. Marine Ecology Progress Seriers 29 (1986) 247–
260.
13. Liu X S, Chenung S G, Paul K S Shin, Meiofauna with
special reference to nematodes in trawling ground of
subtropical Hong Kong. Baseline/ Marine Pollution Bulletin, 58
(2009) 601-634.
14. Norling K, Rosenberg R, Hulth S, Gre´mare A, Bonsdorff E,
Importance of functional biodiversity and species-
specific traits of benthic fauna for ecosystem
functions in marine sediment. Marine Ecology Progress Seriers
332 (2007) 11–23.
15. Petchey O L, Gaston K J, Functional diversity (FD),
species richness and community composition. Ecology Letters
5 (2002) 402–411.
16. Peters R H, The Ecological Implications of Body Size.
Cambridge University Press, Cambridge (1983).
17. Phleger F B, Patterns of Marsh Foraminifera, Galveston
Bay, Texas. Limnology and Oceanography 10 (1965) 169-184.
18. Phleger F B, Marsh Foraminiferal patterns, Pacific coast
of North America. An institute Biological Unics
National Autonomy, Mexico 38 (1967) 11-38.
19. Ramanadham R, Varadarajulu R, Hydrology and hydrography of
the Krishna estuary. Recent researchers in Estuarine
Biology, edited by Natarajan. Hindustan Publishing
Corporation, Delhi (1973) pp: 151-164.
20. Riemann F, On hemisessile nematodes with flagelliform tail
living in marine soft bottoms and on micro-tubes found
in deep sea sediments. Mikrofauna Meeresbodens
40(1974), 1-15.
21. Schratzberger M, Warr K, Rogers S I, Functional diversity
of nematode communities in the southwestern North Sea.
Marine Environmental Research 63 (2007) 368-389.
22. Sheppard FP, Nomenclature based n sand-silt-clay ratios. J
Sedim Petrol 24 (1954) 151-158.
23. Karline Soetaert 1,*, Agnes Muthumbi 2, Carlo Heip1, Size
and shape of ocean margin nematodes: morphological
diversity and depth-related patterns. Marine Ecology
Progress Seriers Vol. 242 (2002) 179–193.
24. Sreenivasa Rao P, Krishna Rao G, Durga Prasada Rao N V N,
Swamy A S R T, Sedementation and sea level variations
in the Nizampatnam Bay, east coast of India. Indian J Mar
Sci 19 (1990) 261-261.
25. David Thistle, Kevin M. Sherman, The nematode fauna of a
deep sea site exposed to strong near-bottom currents.
Deep Sea Research Part A. Oceanographic Research Papers, Volume
32, Issue 9 (1985) 1077-1088pp.
26. Thistle D, Lambshead P J D, Sherman K M, Nematode tail-
shape groups respond strong near-bottom currents Deep
Sea Research 32 (1995) 1077-1088.
27. Vincx M P, Meire, Heip C, The distribution of nematode
communities in Southern Bight of the North Sea. Cah
Biol Mar 31 (1990) 107-129.
28. Wieser W, Die Beziehung zwischen Mundhöhlengestalt,
Ernährungsweise und Vorkommen bei freilebenden marinen
Nematoden. Arkiv för Zoologi 4 (1953) 439–484.
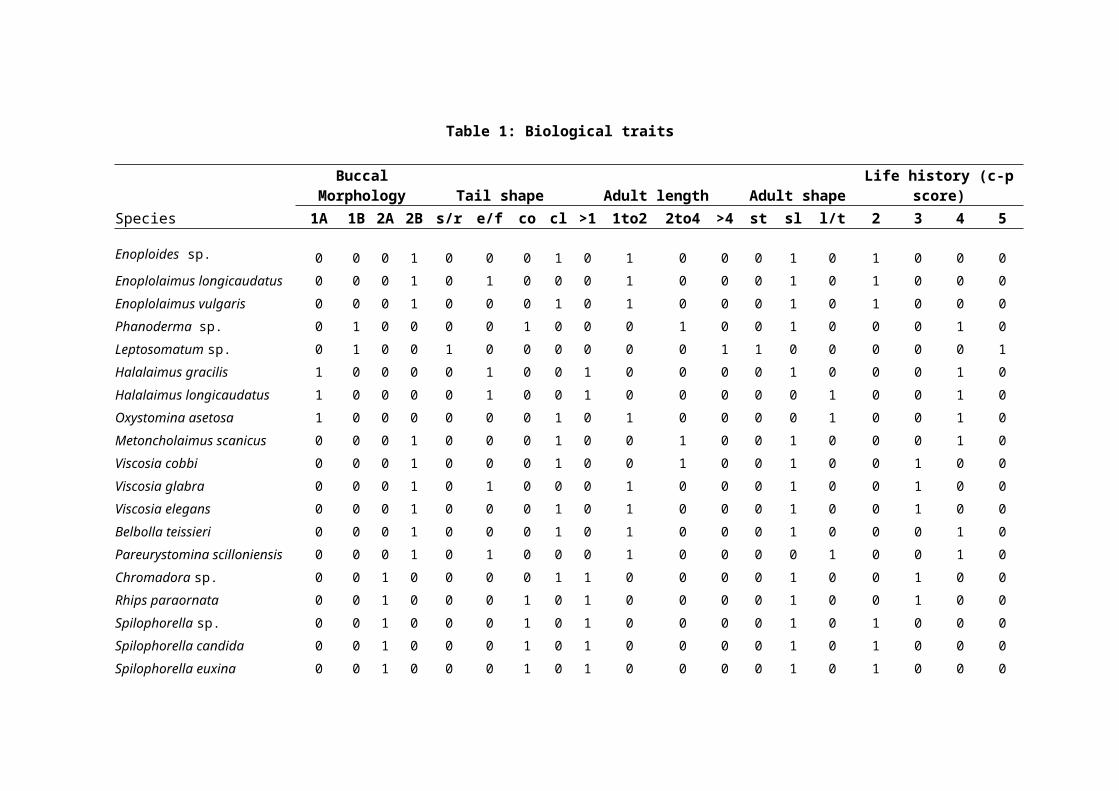
Table 1: Biological traits
Species
BuccalMorphology Tail shape Adult length Adult shape
Life history (c-pscore)
1A 1B 2A 2B s/r e/f co cl >1 1to2 2to4 >4 st sl l/t 2 3 4 5
Enoploides sp. 0 0 0 1 0 0 0 1 0 1 0 0 0 1 0 1 0 0 0Enoplolaimus longicaudatus 0 0 0 1 0 1 0 0 0 1 0 0 0 1 0 1 0 0 0Enoplolaimus vulgaris 0 0 0 1 0 0 0 1 0 1 0 0 0 1 0 1 0 0 0Phanoderma sp. 0 1 0 0 0 0 1 0 0 0 1 0 0 1 0 0 0 1 0Leptosomatum sp. 0 1 0 0 1 0 0 0 0 0 0 1 1 0 0 0 0 0 1Halalaimus gracilis 1 0 0 0 0 1 0 0 1 0 0 0 0 1 0 0 0 1 0Halalaimus longicaudatus 1 0 0 0 0 1 0 0 1 0 0 0 0 0 1 0 0 1 0Oxystomina asetosa 1 0 0 0 0 0 0 1 0 1 0 0 0 0 1 0 0 1 0Metoncholaimus scanicus 0 0 0 1 0 0 0 1 0 0 1 0 0 1 0 0 0 1 0Viscosia cobbi 0 0 0 1 0 0 0 1 0 0 1 0 0 1 0 0 1 0 0Viscosia glabra 0 0 0 1 0 1 0 0 0 1 0 0 0 1 0 0 1 0 0Viscosia elegans 0 0 0 1 0 0 0 1 0 1 0 0 0 1 0 0 1 0 0Belbolla teissieri 0 0 0 1 0 0 0 1 0 1 0 0 0 1 0 0 0 1 0Pareurystomina scilloniensis 0 0 0 1 0 1 0 0 0 1 0 0 0 0 1 0 0 1 0Chromadora sp. 0 0 1 0 0 0 0 1 1 0 0 0 0 1 0 0 1 0 0Rhips paraornata 0 0 1 0 0 0 1 0 1 0 0 0 0 1 0 0 1 0 0Spilophorella sp. 0 0 1 0 0 0 1 0 1 0 0 0 0 1 0 1 0 0 0Spilophorella candida 0 0 1 0 0 0 1 0 1 0 0 0 0 1 0 1 0 0 0Spilophorella euxina 0 0 1 0 0 0 1 0 1 0 0 0 0 1 0 1 0 0 0
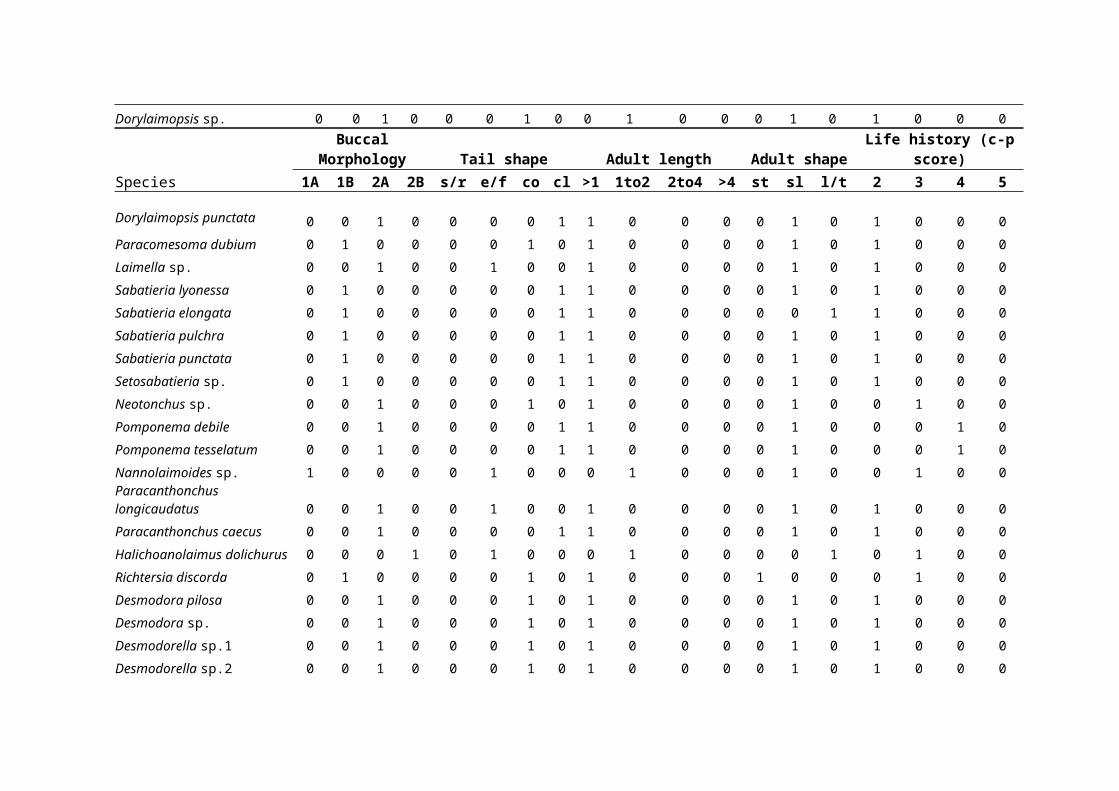
Dorylaimopsis sp. 0 0 1 0 0 0 1 0 0 1 0 0 0 1 0 1 0 0 0
Species
BuccalMorphology Tail shape Adult length Adult shape
Life history (c-pscore)
1A 1B 2A 2B s/r e/f co cl >1 1to2 2to4 >4 st sl l/t 2 3 4 5
Dorylaimopsis punctata 0 0 1 0 0 0 0 1 1 0 0 0 0 1 0 1 0 0 0Paracomesoma dubium 0 1 0 0 0 0 1 0 1 0 0 0 0 1 0 1 0 0 0Laimella sp. 0 0 1 0 0 1 0 0 1 0 0 0 0 1 0 1 0 0 0Sabatieria lyonessa 0 1 0 0 0 0 0 1 1 0 0 0 0 1 0 1 0 0 0Sabatieria elongata 0 1 0 0 0 0 0 1 1 0 0 0 0 0 1 1 0 0 0Sabatieria pulchra 0 1 0 0 0 0 0 1 1 0 0 0 0 1 0 1 0 0 0Sabatieria punctata 0 1 0 0 0 0 0 1 1 0 0 0 0 1 0 1 0 0 0Setosabatieria sp. 0 1 0 0 0 0 0 1 1 0 0 0 0 1 0 1 0 0 0Neotonchus sp. 0 0 1 0 0 0 1 0 1 0 0 0 0 1 0 0 1 0 0Pomponema debile 0 0 1 0 0 0 0 1 1 0 0 0 0 1 0 0 0 1 0Pomponema tesselatum 0 0 1 0 0 0 0 1 1 0 0 0 0 1 0 0 0 1 0Nannolaimoides sp. 1 0 0 0 0 1 0 0 0 1 0 0 0 1 0 0 1 0 0Paracanthonchus longicaudatus 0 0 1 0 0 1 0 0 1 0 0 0 0 1 0 1 0 0 0Paracanthonchus caecus 0 0 1 0 0 0 0 1 1 0 0 0 0 1 0 1 0 0 0Halichoanolaimus dolichurus 0 0 0 1 0 1 0 0 0 1 0 0 0 0 1 0 1 0 0Richtersia discorda 0 1 0 0 0 0 1 0 1 0 0 0 1 0 0 0 1 0 0Desmodora pilosa 0 0 1 0 0 0 1 0 1 0 0 0 0 1 0 1 0 0 0Desmodora sp. 0 0 1 0 0 0 1 0 1 0 0 0 0 1 0 1 0 0 0Desmodorella sp.1 0 0 1 0 0 0 1 0 1 0 0 0 0 1 0 1 0 0 0Desmodorella sp.2 0 0 1 0 0 0 1 0 1 0 0 0 0 1 0 1 0 0 0
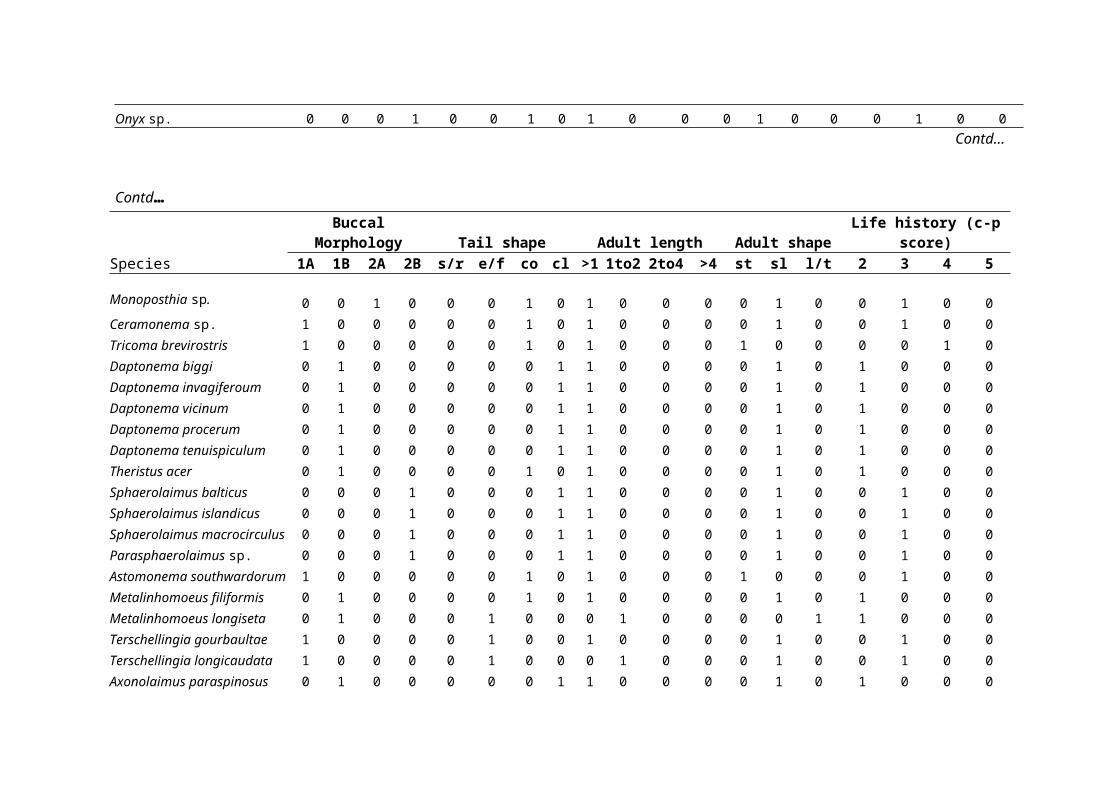
Onyx sp. 0 0 0 1 0 0 1 0 1 0 0 0 1 0 0 0 1 0 0 Contd…
Contd…
Species
BuccalMorphology Tail shape Adult length Adult shape
Life history (c-pscore)
1A 1B 2A 2B s/r e/f co cl >1 1to2 2to4 >4 st sl l/t 2 3 4 5
Monoposthia sp. 0 0 1 0 0 0 1 0 1 0 0 0 0 1 0 0 1 0 0Ceramonema sp. 1 0 0 0 0 0 1 0 1 0 0 0 0 1 0 0 1 0 0Tricoma brevirostris 1 0 0 0 0 0 1 0 1 0 0 0 1 0 0 0 0 1 0Daptonema biggi 0 1 0 0 0 0 0 1 1 0 0 0 0 1 0 1 0 0 0Daptonema invagiferoum 0 1 0 0 0 0 0 1 1 0 0 0 0 1 0 1 0 0 0Daptonema vicinum 0 1 0 0 0 0 0 1 1 0 0 0 0 1 0 1 0 0 0Daptonema procerum 0 1 0 0 0 0 0 1 1 0 0 0 0 1 0 1 0 0 0Daptonema tenuispiculum 0 1 0 0 0 0 0 1 1 0 0 0 0 1 0 1 0 0 0Theristus acer 0 1 0 0 0 0 1 0 1 0 0 0 0 1 0 1 0 0 0Sphaerolaimus balticus 0 0 0 1 0 0 0 1 1 0 0 0 0 1 0 0 1 0 0Sphaerolaimus islandicus 0 0 0 1 0 0 0 1 1 0 0 0 0 1 0 0 1 0 0Sphaerolaimus macrocirculus 0 0 0 1 0 0 0 1 1 0 0 0 0 1 0 0 1 0 0Parasphaerolaimus sp. 0 0 0 1 0 0 0 1 1 0 0 0 0 1 0 0 1 0 0Astomonema southwardorum 1 0 0 0 0 0 1 0 1 0 0 0 1 0 0 0 1 0 0Metalinhomoeus filiformis 0 1 0 0 0 0 1 0 1 0 0 0 0 1 0 1 0 0 0Metalinhomoeus longiseta 0 1 0 0 0 1 0 0 0 1 0 0 0 0 1 1 0 0 0Terschellingia gourbaultae 1 0 0 0 0 1 0 0 1 0 0 0 0 1 0 0 1 0 0Terschellingia longicaudata 1 0 0 0 0 1 0 0 0 1 0 0 0 1 0 0 1 0 0Axonolaimus paraspinosus 0 1 0 0 0 0 0 1 1 0 0 0 0 1 0 1 0 0 0
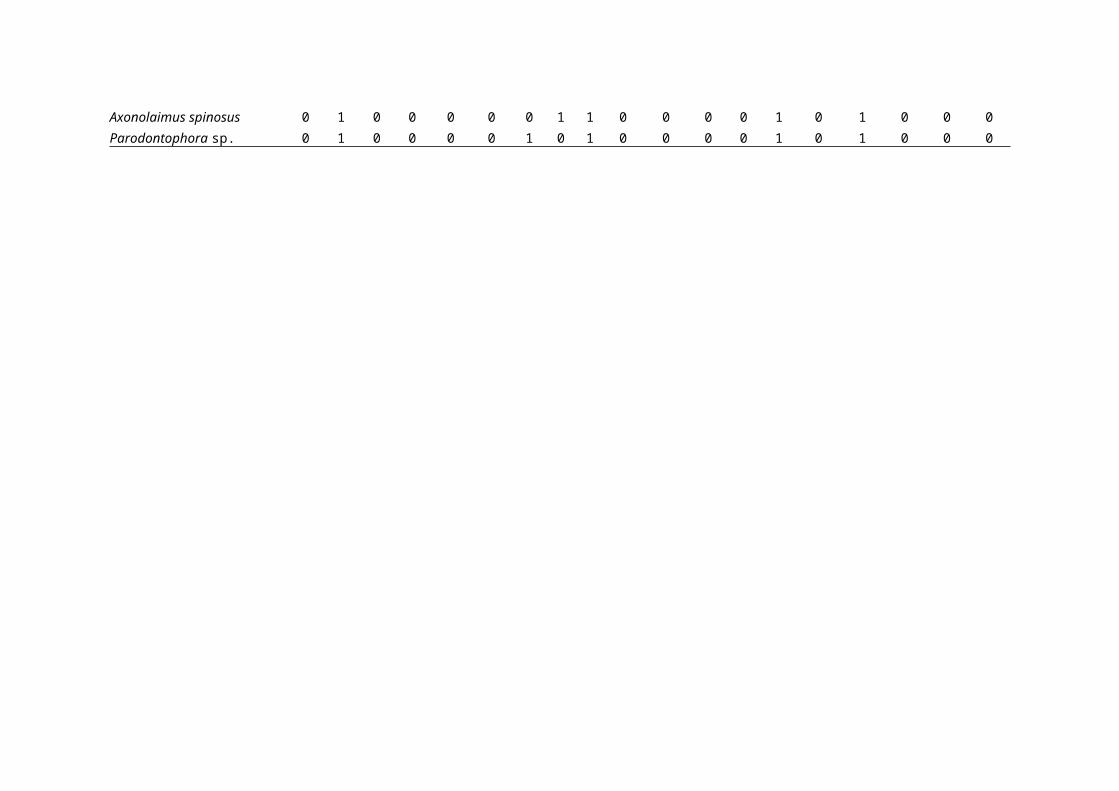
Axonolaimus spinosus 0 1 0 0 0 0 0 1 1 0 0 0 0 1 0 1 0 0 0Parodontophora sp. 0 1 0 0 0 0 1 0 1 0 0 0 0 1 0 1 0 0 0
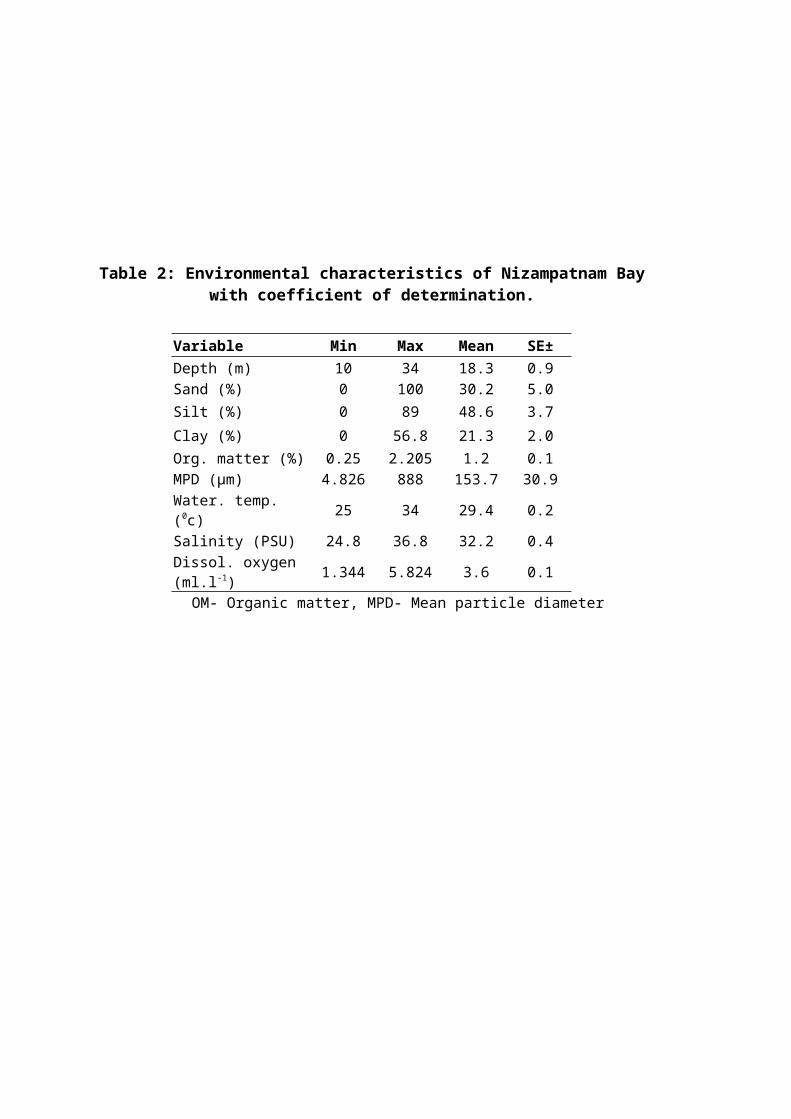
Table 2: Environmental characteristics of Nizampatnam Baywith coefficient of determination.
Variable Min Max Mean SE±Depth (m) 10 34 18.3 0.9Sand (%) 0 100 30.2 5.0Silt (%) 0 89 48.6 3.7Clay (%) 0 56.8 21.3 2.0Org. matter (%) 0.25 2.205 1.2 0.1MPD (µm) 4.826 888 153.7 30.9Water. temp. (0c) 25 34 29.4 0.2
Salinity (PSU) 24.8 36.8 32.2 0.4Dissol. oxygen (ml.l-1) 1.344 5.824 3.6 0.1
OM- Organic matter, MPD- Mean particle diameter
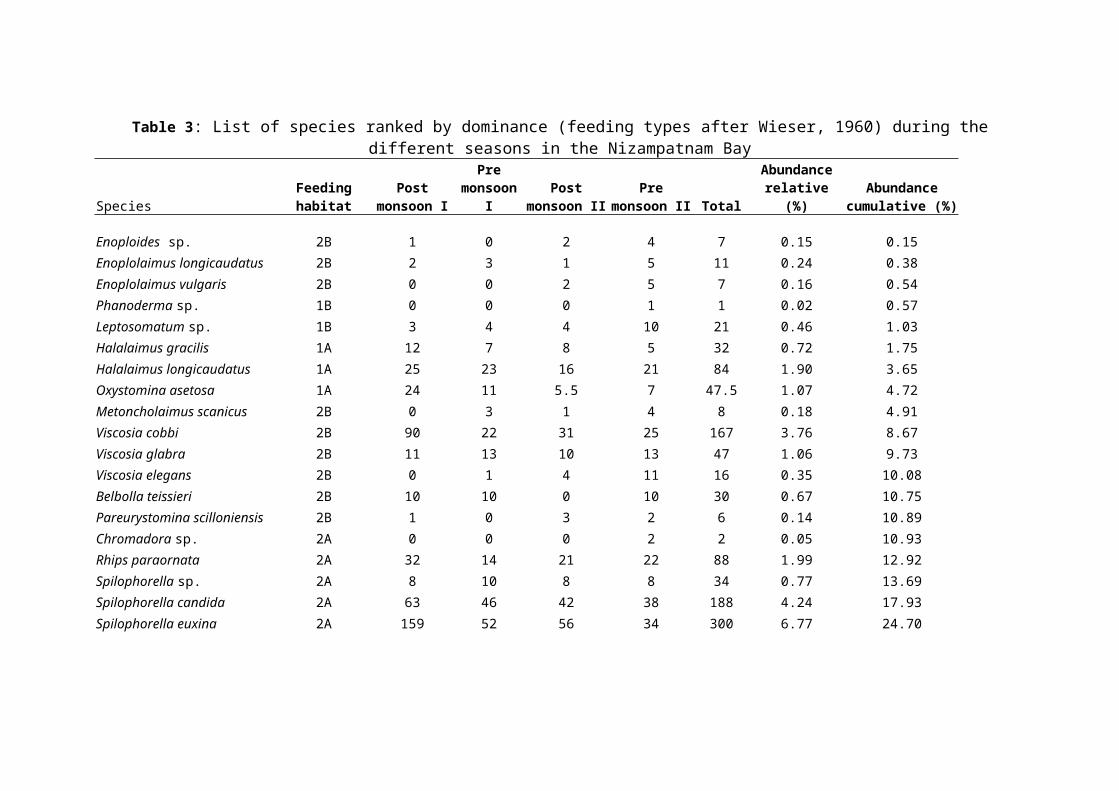
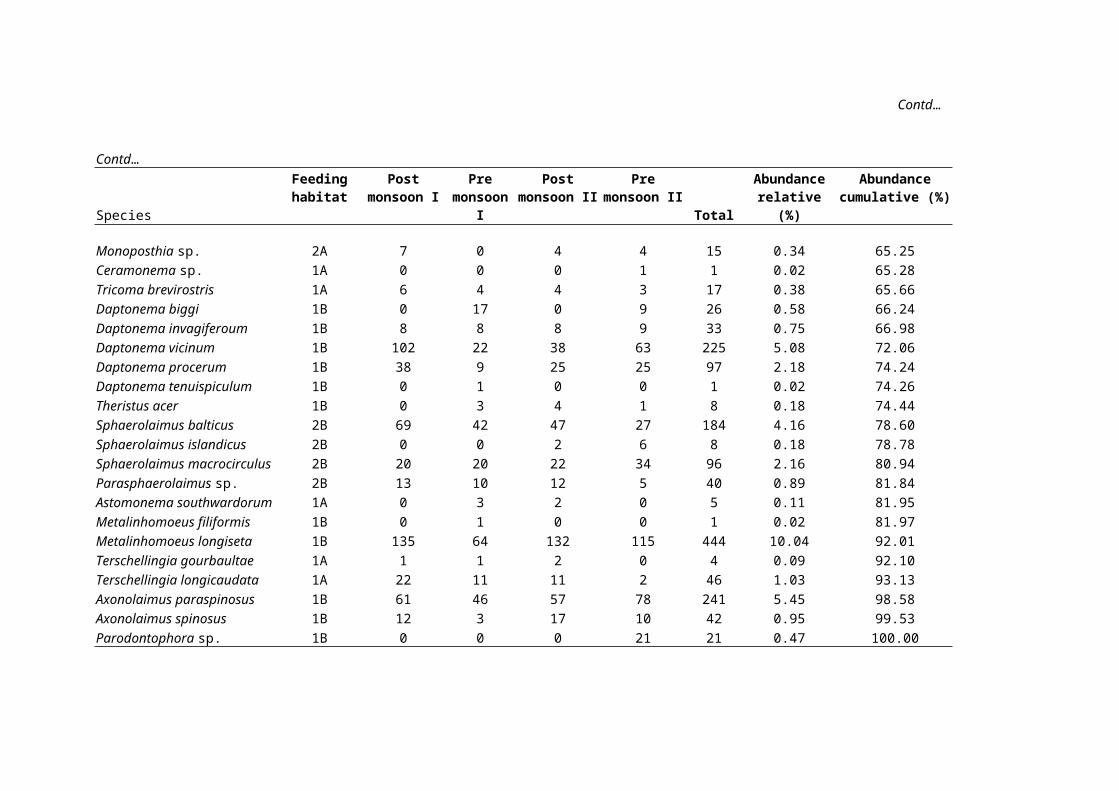
Table 3: List of species ranked by dominance (feeding types after Wieser, 1960) during thedifferent seasons in the Nizampatnam Bay
SpeciesFeedinghabitat
Postmonsoon I
Premonsoon
IPost
monsoon IIPre
monsoon II Total
Abundancerelative
(%)Abundance
cumulative (%)
Enoploides sp. 2B 1 0 2 4 7 0.15 0.15Enoplolaimus longicaudatus 2B 2 3 1 5 11 0.24 0.38Enoplolaimus vulgaris 2B 0 0 2 5 7 0.16 0.54Phanoderma sp. 1B 0 0 0 1 1 0.02 0.57Leptosomatum sp. 1B 3 4 4 10 21 0.46 1.03Halalaimus gracilis 1A 12 7 8 5 32 0.72 1.75Halalaimus longicaudatus 1A 25 23 16 21 84 1.90 3.65Oxystomina asetosa 1A 24 11 5.5 7 47.5 1.07 4.72Metoncholaimus scanicus 2B 0 3 1 4 8 0.18 4.91Viscosia cobbi 2B 90 22 31 25 167 3.76 8.67Viscosia glabra 2B 11 13 10 13 47 1.06 9.73Viscosia elegans 2B 0 1 4 11 16 0.35 10.08Belbolla teissieri 2B 10 10 0 10 30 0.67 10.75Pareurystomina scilloniensis 2B 1 0 3 2 6 0.14 10.89Chromadora sp. 2A 0 0 0 2 2 0.05 10.93Rhips paraornata 2A 32 14 21 22 88 1.99 12.92Spilophorella sp. 2A 8 10 8 8 34 0.77 13.69Spilophorella candida 2A 63 46 42 38 188 4.24 17.93Spilophorella euxina 2A 159 52 56 34 300 6.77 24.70
Dorylaimopsis sp. 2A 1 7 14 22 44 0.98 25.68Contd…
SpeciesFeedinghabitat
Postmonsoon I
Premonsoon I
Postmonsoon II
Premonsoon II Total
Abundancerelative (%)
Abundancecumulative (%)
Dorylaimopsis punctata 2A 217 129 110 169 624 14.10 39.78Paracomesoma dubium 1B 35 11 24 81 151 3.40 43.18Laimella sp. 2A 8 6 9 11 34 0.77 43.95Sabatieria lyonessa 1B 13 7 0 5 25 0.57 44.51Sabatieria elongata 1B 0 0 22 23 45 1.02 45.53Sabatieria pulchra 1B 62 28 30 16 136 3.06 48.59Sabatieria punctata 1B 183 127 110 125 545 12.31 60.90Setosabatieria sp. 1B 8 0 0 9 17 0.38 61.29Neotonchus sp. 2A 0 0 0 3 3 0.07 61.35Pomponema debile 2A 0 3 11 9 23 0.51 61.86Pomponema tesselatum 2A 0 0 6 0 6 0.14 62.00Nannolaimoides sp. 1A 14 0 9 2 25 0.55 62.55Paracanthonchus longicaudatus 2A 0 1 13 18 32 0.71 63.26Paracanthonchus caecus 2A 0 0 0 3 3 0.07 63.33Halichoanolaimus dolichurus 2B 2 0 2 8 12 0.27 63.60Richtersia discorda 1B 1 0 0 0 1 0.02 63.63Desmodora pilosa 2A 1 1 7 3 12 0.27 63.90Desmodora sp. 2A 10 7 0 0 17 0.38 64.28Desmodorella sp.1 2A 2 5 2 0 9 0.20 64.49Desmodorella sp.2 2A 5 6 0 3 14 0.32 64.80Onyx sp. 2B 0 2 3 0 5 0.11 64.91
Contd…
Contd…
Species
Feedinghabitat
Postmonsoon I
Premonsoon
I
Postmonsoon II
Premonsoon II
Total
Abundancerelative
(%)
Abundancecumulative (%)
Monoposthia sp. 2A 7 0 4 4 15 0.34 65.25Ceramonema sp. 1A 0 0 0 1 1 0.02 65.28Tricoma brevirostris 1A 6 4 4 3 17 0.38 65.66Daptonema biggi 1B 0 17 0 9 26 0.58 66.24Daptonema invagiferoum 1B 8 8 8 9 33 0.75 66.98Daptonema vicinum 1B 102 22 38 63 225 5.08 72.06Daptonema procerum 1B 38 9 25 25 97 2.18 74.24Daptonema tenuispiculum 1B 0 1 0 0 1 0.02 74.26Theristus acer 1B 0 3 4 1 8 0.18 74.44Sphaerolaimus balticus 2B 69 42 47 27 184 4.16 78.60Sphaerolaimus islandicus 2B 0 0 2 6 8 0.18 78.78Sphaerolaimus macrocirculus 2B 20 20 22 34 96 2.16 80.94Parasphaerolaimus sp. 2B 13 10 12 5 40 0.89 81.84Astomonema southwardorum 1A 0 3 2 0 5 0.11 81.95Metalinhomoeus filiformis 1B 0 1 0 0 1 0.02 81.97Metalinhomoeus longiseta 1B 135 64 132 115 444 10.04 92.01Terschellingia gourbaultae 1A 1 1 2 0 4 0.09 92.10Terschellingia longicaudata 1A 22 11 11 2 46 1.03 93.13Axonolaimus paraspinosus 1B 61 46 57 78 241 5.45 98.58Axonolaimus spinosus 1B 12 3 17 10 42 0.95 99.53Parodontophora sp. 1B 0 0 0 21 21 0.47 100.00
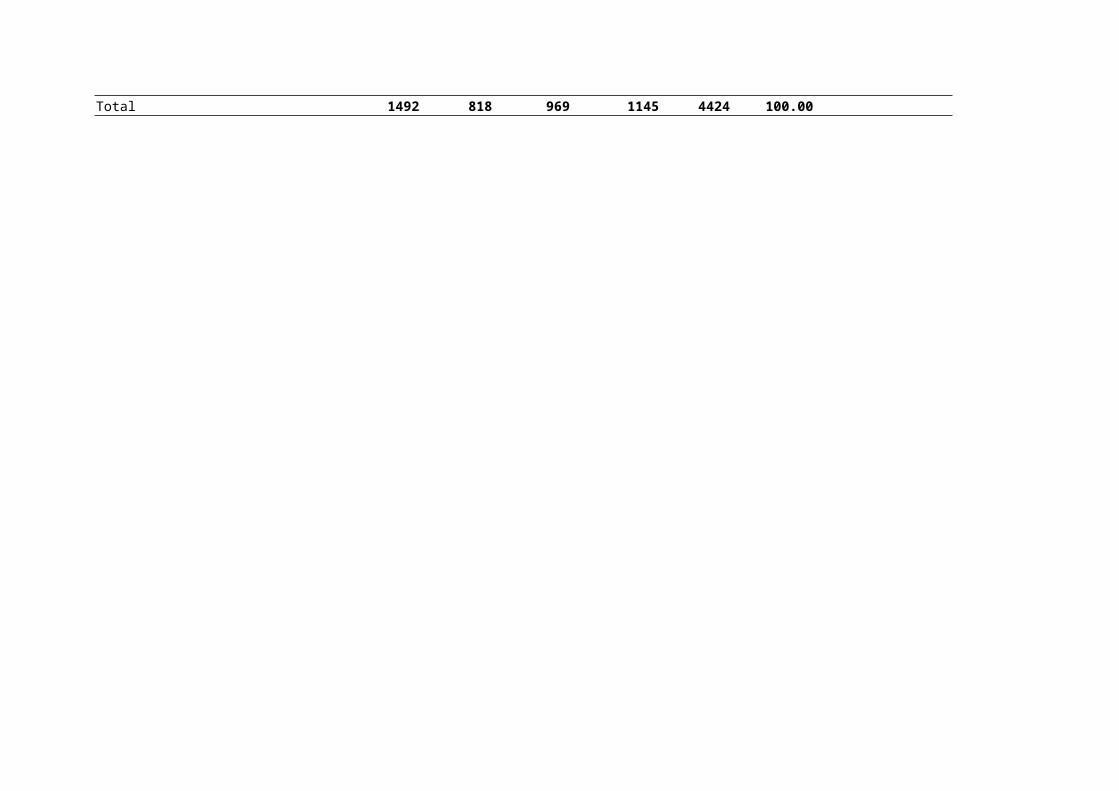
Total 1492 818 969 1145 4424 100.00
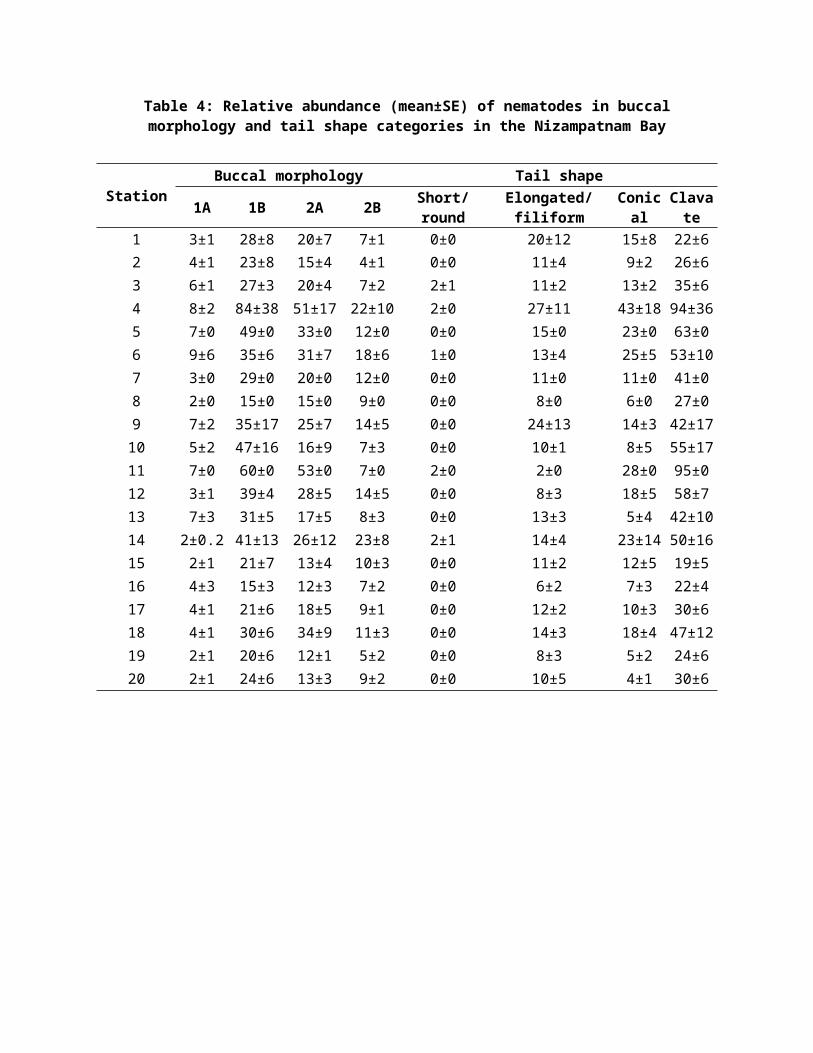
Table 4: Relative abundance (mean±SE) of nematodes in buccalmorphology and tail shape categories in the Nizampatnam Bay
StationBuccal morphology Tail shape
1A 1B 2A 2B Short/round
Elongated/filiform
Conical
Clavate
1 3±1 28±8 20±7 7±1 0±0 20±12 15±8 22±62 4±1 23±8 15±4 4±1 0±0 11±4 9±2 26±63 6±1 27±3 20±4 7±2 2±1 11±2 13±2 35±64 8±2 84±38 51±17 22±10 2±0 27±11 43±18 94±365 7±0 49±0 33±0 12±0 0±0 15±0 23±0 63±06 9±6 35±6 31±7 18±6 1±0 13±4 25±5 53±107 3±0 29±0 20±0 12±0 0±0 11±0 11±0 41±08 2±0 15±0 15±0 9±0 0±0 8±0 6±0 27±09 7±2 35±17 25±7 14±5 0±0 24±13 14±3 42±1710 5±2 47±16 16±9 7±3 0±0 10±1 8±5 55±1711 7±0 60±0 53±0 7±0 2±0 2±0 28±0 95±012 3±1 39±4 28±5 14±5 0±0 8±3 18±5 58±713 7±3 31±5 17±5 8±3 0±0 13±3 5±4 42±1014 2±0.2 41±13 26±12 23±8 2±1 14±4 23±14 50±1615 2±1 21±7 13±4 10±3 0±0 11±2 12±5 19±516 4±3 15±3 12±3 7±2 0±0 6±2 7±3 22±417 4±1 21±6 18±5 9±1 0±0 12±2 10±3 30±618 4±1 30±6 34±9 11±3 0±0 14±3 18±4 47±1219 2±1 20±6 12±1 5±2 0±0 8±3 5±2 24±620 2±1 24±6 13±3 9±2 0±0 10±5 4±1 30±6
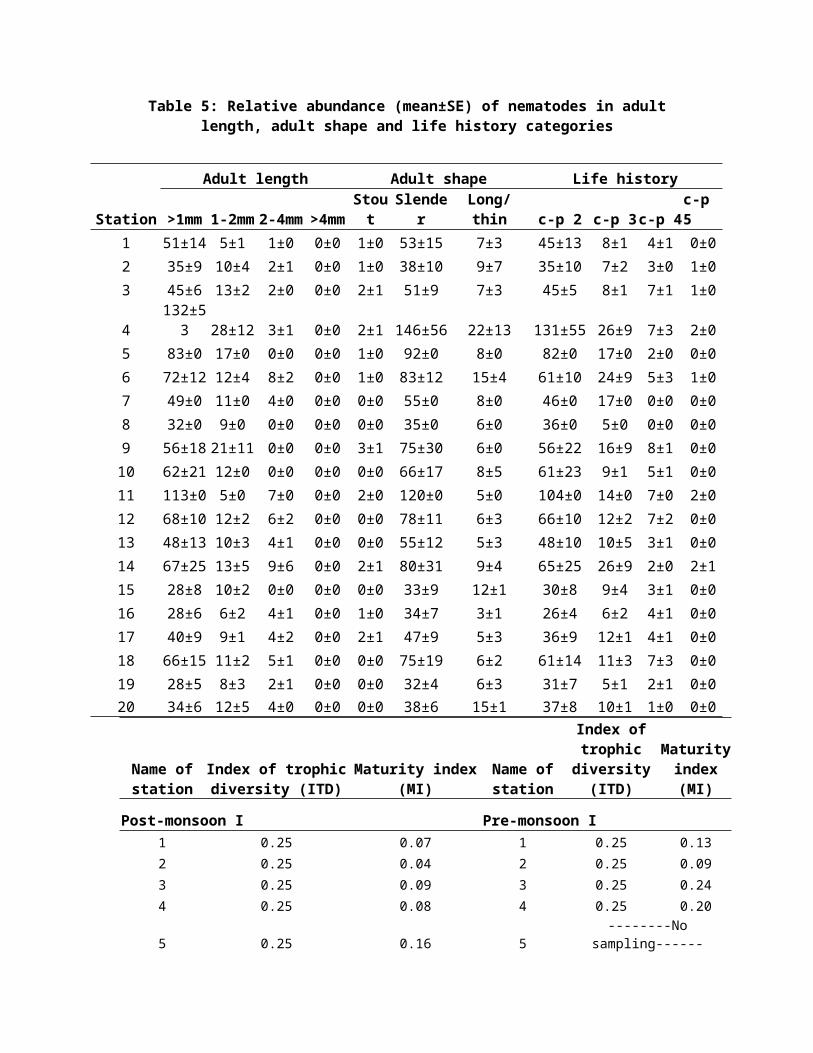
Table 5: Relative abundance (mean±SE) of nematodes in adultlength, adult shape and life history categories
Station
Adult length Adult shape Life history
>1mm 1-2mm 2-4mm >4mmStout
Slender
Long/thin c-p 2 c-p 3c-p 4
c-p 5
1 51±14 5±1 1±0 0±0 1±0 53±15 7±3 45±13 8±1 4±1 0±02 35±9 10±4 2±1 0±0 1±0 38±10 9±7 35±10 7±2 3±0 1±03 45±6 13±2 2±0 0±0 2±1 51±9 7±3 45±5 8±1 7±1 1±0
4132±53 28±12 3±1 0±0 2±1 146±56 22±13 131±55 26±9 7±3 2±0
5 83±0 17±0 0±0 0±0 1±0 92±0 8±0 82±0 17±0 2±0 0±06 72±12 12±4 8±2 0±0 1±0 83±12 15±4 61±10 24±9 5±3 1±07 49±0 11±0 4±0 0±0 0±0 55±0 8±0 46±0 17±0 0±0 0±08 32±0 9±0 0±0 0±0 0±0 35±0 6±0 36±0 5±0 0±0 0±09 56±18 21±11 0±0 0±0 3±1 75±30 6±0 56±22 16±9 8±1 0±010 62±21 12±0 0±0 0±0 0±0 66±17 8±5 61±23 9±1 5±1 0±011 113±0 5±0 7±0 0±0 2±0 120±0 5±0 104±0 14±0 7±0 2±012 68±10 12±2 6±2 0±0 0±0 78±11 6±3 66±10 12±2 7±2 0±013 48±13 10±3 4±1 0±0 0±0 55±12 5±3 48±10 10±5 3±1 0±014 67±25 13±5 9±6 0±0 2±1 80±31 9±4 65±25 26±9 2±0 2±115 28±8 10±2 0±0 0±0 0±0 33±9 12±1 30±8 9±4 3±1 0±016 28±6 6±2 4±1 0±0 1±0 34±7 3±1 26±4 6±2 4±1 0±017 40±9 9±1 4±2 0±0 2±1 47±9 5±3 36±9 12±1 4±1 0±018 66±15 11±2 5±1 0±0 0±0 75±19 6±2 61±14 11±3 7±3 0±019 28±5 8±3 2±1 0±0 0±0 32±4 6±3 31±7 5±1 2±1 0±020 34±6 12±5 4±0 0±0 0±0 38±6 15±1 37±8 10±1 1±0 0±0
Name ofstation
Index of trophicdiversity (ITD)
Maturity index(MI)
Name ofstation
Index oftrophic
diversity(ITD)
Maturityindex(MI)
Post-monsoon I Pre-monsoon I1 0.25 0.07 1 0.25 0.132 0.25 0.04 2 0.25 0.093 0.25 0.09 3 0.25 0.244 0.25 0.08 4 0.25 0.20
5 0.25 0.16 5--------No
sampling------
6 0.25 0.22 6 0.25 0.31
7 0.25 0.10 7--------No
sampling------
8 0.25 0.06 8--------No
sampling------9 0.25 0.08 9 0.25 0.2110 0.25 0.15 10 0.25 0.17
11 0.25 0.20 11--------No
sampling------12 0.25 0.19 12 0.25 0.17
13 0.25 0.15 13--------No
sampling------14 0.25 0.28 14 0.25 0.20
15 0.25 0.10 15--------No
sampling------16 0.75 0.07 16 0.25 0.1617 0.25 0.13 17 0.25 0.1918 0.25 0.12 18 0.25 0.3019 0.25 0.07 19 0.25 0.0720 0.25 0.10 20 0.5 0.05
Table 6: Index of trophic diversity (ITD) and Maturity Index(MI) for nematodes at selected locations of Nizampatnam Bay
Name ofstation
Index of trophicdiversity (ITD)
Maturityindex(MI)
Name ofstation
Index oftrophic
diversity(ITD)
Maturityindex(MI)
Post-monsoon II Pre-monsoon II1 0.25 0.10 1 0.25 0.212 0.25 0.17 2 0.25 0.153 0.25 0.17 3 0.25 0.104 0.25 0.56 4 0.25 0.72
5 --------No sampling------ 5--------No
sampling------6 0.25 0.14 6 0.25 0.19
7 --------No sampling------ 7--------No
sampling------
8 --------No sampling------ 8--------No
sampling------9 0.25 0.49 9 0.25 0.09
10 --------No sampling------ 10--------No
sampling------
11 --------No sampling------ 11--------No
sampling------12 0.25 0.15 12 0.25 0.2013 0.25 0.10 13 0.75 0.1114 0.75 0.05 14 0.25 0.1915 0.75 0.04 15 0.75 0.1116 0.25 0.04 16 0.75 0.0317 0.25 0.10 17 0.25 0.0718 0.25 0.28 18 0.25 0.0619 0.75 0.07 19 0.25 0.1020 0.75 0.10 20 0.25 0.12
Contd…..
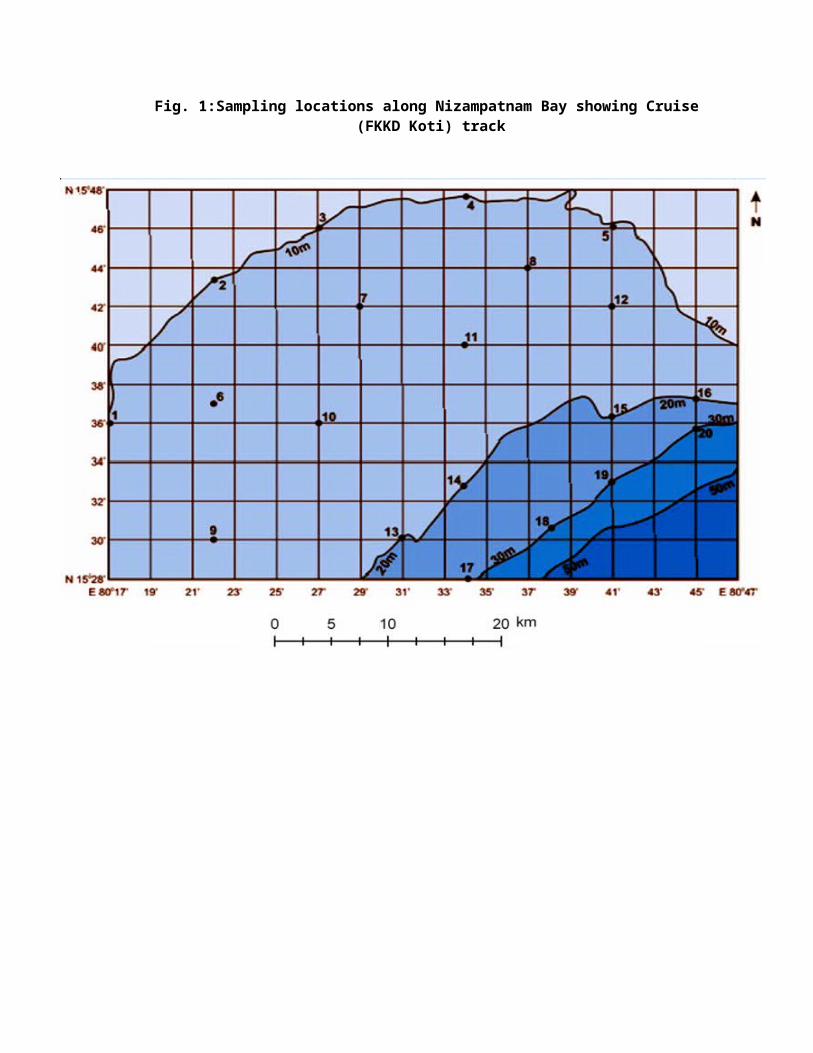
Fig. 1:Sampling locations along Nizampatnam Bay showing Cruise (FKKD Koti) track
0.00
0.20
0.40
0.60
0.80
1.00
1 2
2B2A1B1A
0.00
0.20
0.40
0.60
0.80
1.00
1
2B2A1B1A
0.00
0.20
0.40
0.60
0.80
1.00
1 2 3 4
2B
2A
1B
1A
Fig. 2: Trophic composition of nematode assemblages on basis ofaverage percentages of Nizampatnam Bay in overall, season wiseand depth wise. The feeding types defined after Weiser (1953):1A= selective deposit feeders, 1B= non-selective deposit feeders,2A= epistrate feeders, 2B=predators/omnivores
Trop
hic
comp
ositio
n (% f
eedi
ng
type
)
Overal
Trop
hic
comp
osit
ion
(% f
eeding
ty
pe)
Trop
hic
comp
ositio
n (%
feedi
ng
type
)
>15 m <15m
Po-M- Pr-M- Po-M-II Pr-M-
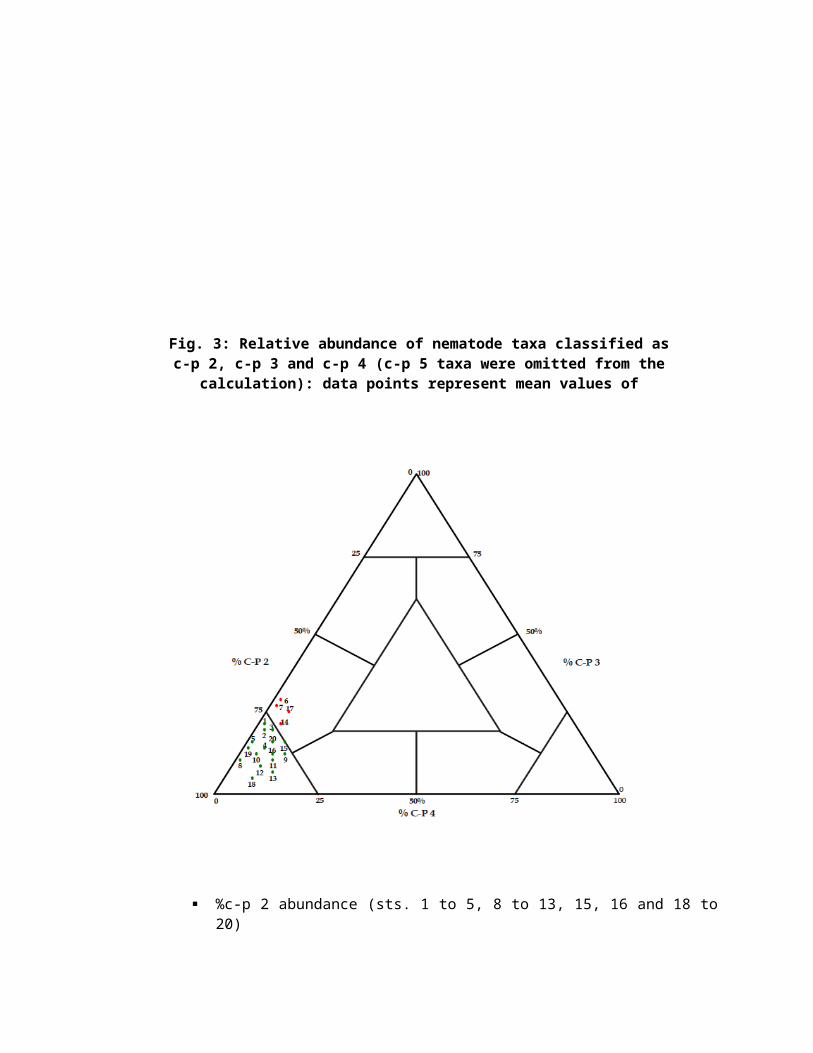
%c-p 2 abundance (sts. 1 to 5, 8 to 13, 15, 16 and 18 to20)
Fig. 3: Relative abundance of nematode taxa classified asc-p 2, c-p 3 and c-p 4 (c-p 5 taxa were omitted from the
calculation): data points represent mean values ofsampling sites
Transform : Fourth rootResem blance: S17 Bray Curtis similarity
Depth12
1
1
1
1
1
1
1
11
1
1
1
2
22
2
2
2
2
21
1
11 1
11 1
2 22 22
2
1
1
1
1
1
1
1
22
2
2
2
2
22
1
11
1
1
1
1
2
2
2
22
2
22
2D Stress: 0.25
Transform : Fourth rootResem blance: S17 Bray Curtis sim ilarity
Depth12
1
111
1
1
11
11
1
1
2
2
2 222
2
2
1
1
1
1
1
1
1
1
2 22
2
2
2
111
1
1
1 1
2
2
222
22
2
1
11
1
1
1
1
22
2
2
2
2
22
2D Stress: 0.13
Transform : Fourth rootResem blance: S17 Bray Curtis sim ilarity
Depth12
1
1
11
1
1
111
1
1
122
222
2
22
11
1
1 1
11
1222
2
2
21
1 1
11
1
12
2
2
2
2
2
2
2
111
1
111
2
2
22
2
2
22
2D Stress: 0.11
Transform : Fourth rootResem blance: S17 Bray Curtis sim ilarity
Depth12
1
1
1
1
11
11
1
1
1
1 222
2
2
222
1
1
11
1
1
1
1
2
2
2
2
22
1
1
1
1
11
12
2
222
2
2
2
11 1
1
1
1
12
22
2
2
2
22
2D Stress: 0.13
Transform: Fourth rootResemblance: S17 Bray Curtis sim ilarity
Depth12
1
1
11
1
1
1
1 1
1
1
12
22
2
2
2
2
2
1
1
111
1
1 1
2
2
22
22
1 111
1
11
2
22
22
2
2 2
1
11
1
1
1
1
2
2
2
2
22
2
2
2D Stress: 0.25
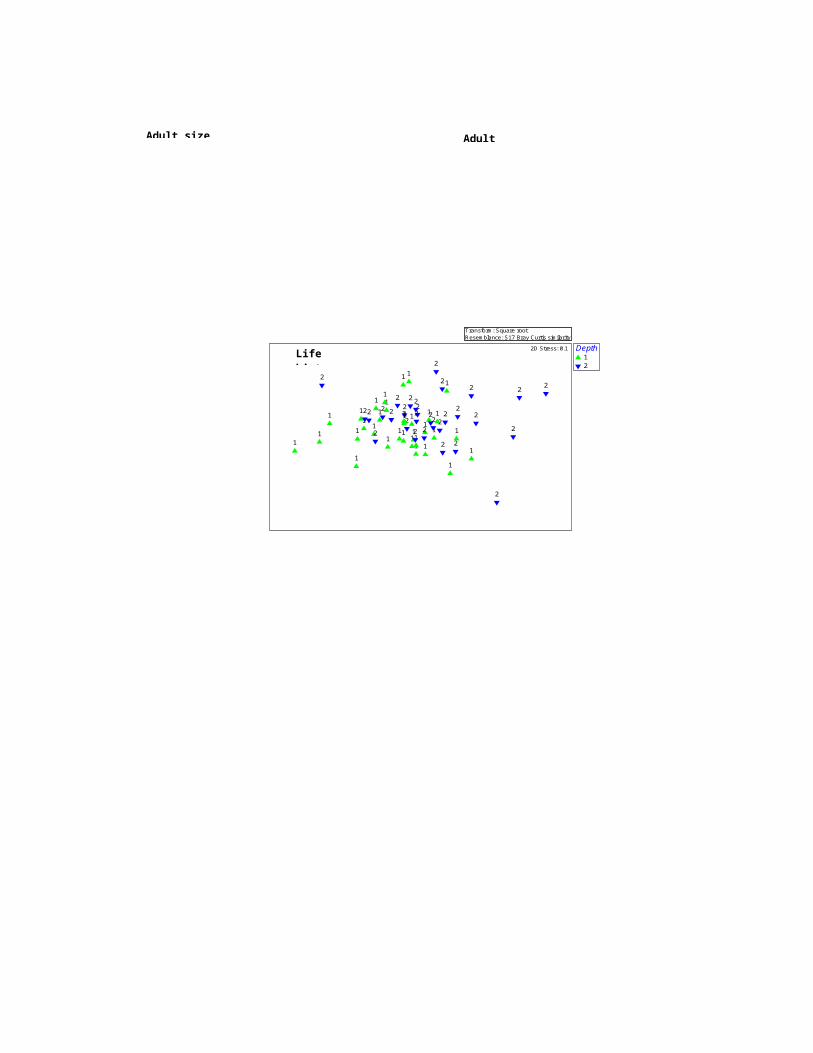
%c-p 3 abundance (sts. 6, 7, 14 and 17)
Fig. 4: Non-parametric multi-dimensional scaling (MDS)ordination based on the relative abundance of nematode
species, genera and functional groups
Buccal morphologyGenus
Tail
Species z
Buccal morphology
Transform: Square rootResem blance: S17 Bray Curtis similarity
Depth12
1
111
1
1
11
1
1
1
1 2
2
22
2
2
2
2
1
11
11
11
12
22
2 2
2
111
1 1
1
1
2
2
2
22
2
22
11
11
1
1
1 2
2 22
2
2
22
2D Stress: 0.1
Adult size Adult
Life history


