Embed Size (px)
Citation preview

FUNCTIONS OF CAVEOLIN-1 AND CAVEOLIN-3 IN
MUSCULAR DYSTROPHY
by
CHEN HUNG-CHIH
A thesis submitted to the
University of Birmingham
for the degree of
DOCTOR OF PHILOSOPHY
College of Life and Environmental Sciences
School of Biosciences
University of Birmingham
November 2013

University of Birmingham Research Archive
e-theses repository This unpublished thesis/dissertation is copyright of the author and/or third parties. The intellectual property rights of the author or third parties in respect of this work are as defined by The Copyright Designs and Patents Act 1988 or as modified by any successor legislation. Any use made of information contained in this thesis/dissertation must be in accordance with that legislation and must be properly acknowledged. Further distribution or reproduction in any format is prohibited without the permission of the copyright holder.

I
Abstract
Duchenne muscular dystrophy (DMD) is an X chromosome-linked disease caused by the
absence of the sarcolemmal protein dystrophin. The skeletal muscles of DMD have disrupted
dystrophin-glycoprotein complex (DGC) and impaired sarcolemma integrity. In this study, we
show that clonally derived dystrophin-deficient myoblasts PD50A are differentiation impaired.
Coculture with osteoblasts improves the differentiation efficiency of PD50A myoblasts. We
also establish that supplementation of combinations of IGF-1/IGF-2, IGF-1/LIF and IGF-
2/LIF in cultured PD50A myoblasts ameliorates the differentiation impairment. We establish
that there are elevated levels of Cav-3 and Cav-1 proteins in dystrophin-deficient myoblasts
and mdx mouse embryos and that Cav-3 and Cav-1 form heterooligomers in adult skeletal
muscles. We show that overexpression of Pax7 suppresses Cav-3 in dystrophin-deficient
myoblasts. Using a genetic mouse model (mdx/cav3+/-) embryo we further establish that
immunohistochemistry staining of Cav-1 and Cav-3 coincides with the mouse heart
development. The DGC of skeletal muscles plays a role in signal transduction and mechanical
response. Here we show that AKT/mTOR and IGF-2/p57kip2 (but not ERK) signalling
pathways are upregulated in dystrophin-deficient myoblasts and mouse embryos. Using
atomic force microscope we show that Cav-1 helps maintain the stiffness of dystrophin-
deficient myotubes while Cav-3 help maintain that of dystrophin-deficient myoblasts. This
study suggests that Cav-1 and Cav-3 have both compensatory and compromising roles in mdx.

II
ACKNOLEDGEMENT
I would like to thank my supervisor Dr. Janet Smith for giving me the opportunity to
participate in research of muscular dystrophy and for her support and guidance through my
research. I would like to thank Dr. Joshua Rappoport and Dr. Francesco Michelangeli for their
useful advice. I would also like to thank Dr. Neil Hotchin and Dr. Chris Thomas for their help
during my PhD study. I would like to thank Dr. Francesco Michelangeli and Dr. Mohammad
Hajihosseini (University of East Anglia) for their time to read through my thesis and advice
for my thesis correction. Meanwhile, I would like to thank Ministry of Education (Taiwan)
and College of Life and Environment Sciences (University of Birmingham, UK) for their
financial support.
I would like to thank Dr. Dean Larner to help me start my laboratory work and the valuable
discussion. I would like to thank Dr. James Bowen for he helped me to deal with the
mechanical property tests. I appreciate the discussion with Professor John Heath, PIs and
colleagues who attend the floor meeting. I would like to thank people on the fifth floor who
have helped me. I would also like to thank James Khoo for proofreading the introduction of
my thesis.
Finally, I would like to give a big thank to my father Chen Fu-Chuan, my mother Su Mei-Chu,
my elder sister Chen Wen-Yu and my uncles for their full support.

III
Table of Contents
Chapter 1. Introduction ......................................................................................1 1.1. Myogenesis.....................................................................................................1 1.1.1. Origin of skeletal muscle during embryogenesis ..........................................1 1.1.2. Two waves of myogenesis.............................................................................5 1.1.3. Myosin heavy chain isoforms of skeletal muscles .........................................6 1.2. Muscle Stem Cells ..........................................................................................7 1.2.1. Satellite cells ...............................................................................................8 1.2.2. Paired-Type Homeobox Transcription Factor (Pax7 and Pax3) and satellite cells ……………………………………………………………………………...10 1.2.3. Heterogeneity of muscle stem cells.............................................................13 1.2.4. Other Markers for quiescent and activated muscle stem cells ....................16 1.2.5. Myogenic Regulatory Factors (MRFs) and Myogenesis .............................17 1.3. Dystrophin-glycoprotein complex .................................................................24 1.4. Duchenne Muscular Dystrophy (DMD), Limb Girdle Muscular Dystrophy type 1C (LGMD-1C) and their animal models...................................................................29 1.4.1. Animal models for DMD............................................................................31 1.4.2. Mouse models of LGMD-1C ......................................................................34 1.5. The mechanical properties of dystrophic myoblasts and muscle fibres ..........34 1.6. Caveolins and caveolae mediated signalling.................................................36 1.7. Growth factors and myogenesis ....................................................................39 1.7.1. Insulin-Like Growth Factors (IGF-1, IGF-2) .............................................40 1.7.2. Leukemia inhibitory factor (LIF) ...............................................................43 1.8. Therapies for Muscular Dystrophy ...............................................................46 1.8.1. Pharmacological therapies ........................................................................47 1.8.2. Molecular-based therapies ........................................................................49 1.8.3. Cell-based therapies ..................................................................................50 1.8.4. Transplantation of embryonic stem (ES) cells and induced pluripotent stem (iPS) cells into mdx mice...............................................................................................52 1.9. Aims and objectives of this project................................................................54
Chapter 2. Material and Methods ....................................................................57 2.1. Cell culture...................................................................................................57 2.1.1. Cell lines and mouse strains: .....................................................................57 2.1.2. Cell culture for myoblasts:.........................................................................58 2.1.3. Subculture cell lines: .................................................................................59 2.1.4. iPS (induced pluripotent stem) cell culture: ...............................................59 2.1.5. Freezing down cell lines: ...........................................................................63

IV
2.2. Determining cell number: .............................................................................64 2.2.1. Myoblast and osteoblast coculture and growth factor effect experiments: ..65 2.2.2. Cell culture for protein assay:....................................................................66 2.2.3. Analysis of the effects of conditioned medium (OCM) and differentiation medium (DM) on total number of myoblasts:.....................................................................67 2.2.4. Cell culture for mechanical property analysis:...........................................67 2.3. Coverslip preparation- acid etching method .................................................68 2.4. Generation of Pax7-mCherry expression plasmid: ........................................68 2.4.1. Mutagenesis Polymerase Chain Reaction (Mutagenesis PCR): ..................68 2.4.2. E. Coli transformation and culture for plasmid amplification: ...................70 2.4.3. DNA purification:......................................................................................72 2.5. Introduction of expression and shRNA plasmids into mammalian cells .........78 2.5.1. Optimized LipofectamineTM2000 Transfection protocol (24-well plate): .....78 2.5.2. Transfection with Lipofectamine® LTX and PLUS™ Reagents (24-well plate):…80 2.5.3. Stable transfectant selection after transfection...........................................82 2.6. Cell fixation and staining..............................................................................83 2.6.1. Fixing cells with 4% paraformaldehyde: ...................................................83 2.6.2. Leishman's stain: .......................................................................................83 2.6.3. Fluorescent immunostaining:.....................................................................84 2.7. Immunohistochemisry (IHC) method ............................................................86 2.7.1. Embedding Embryos in Paraffin ................................................................86 2.7.2. Microtome Sectioning of Paraffin Blocks ...................................................88 2.7.3. Immunohistochemistry (IHC) (TSA protocol for paraffin embedded sections):…88 2.8. Protein assay ................................................................................................91 2.8.1. Protein extraction:.....................................................................................91 2.8.2. Determining Protein Yield: ........................................................................93 2.9. Protein-protein interaction assay..................................................................94 2.9.1. Immunoprecipitation (IP) assay:................................................................94 2.9.2. Protein A Sepharose CL-4B beads slurry preparation:................................95 2.9.3. GFP-trap assay .........................................................................................96 2.10.Immunoblotting (Western Blotting) ...............................................................96 2.10.1. Electrophoresis:......................................................................................97 2.10.2. Transfer Blotting: ...................................................................................99 2.10.3. Hybridization, Detection and Analysis:.................................................100 2.11. Determining the mechanical property of myoblasts and myotubes using atomic force microscopy .........................................................................................................103 2.12.Sequence alignment ....................................................................................105 2.13.Statistics analysis .......................................................................................106

V
Chapter 3. The osteoblast MC3T3-E1 cell line promotes differentiation of dystrophin-deficient myoblasts...............................................................................................107
3.1. Introduction: ..............................................................................................107 3.2. Results: ...................................................................................................... 110 3.2.1. Differentiation capacity of dystrophin-deficient myoblasts is reduced ...... 110 3.2.2. MC3T3-E1 osteoblasts induce differentiation of both C2C12 and PD50A myoblasts …………………………………………………………………………….112 3.2.3. Fetal calf serum (FCS) promotes differentiation of PD50A myoblasts but suppresses differentiation of C2C12 myoblasts..................................................................... 117 3.2.4. MC3T3-E1 osteoblasts reduce apoptosis of both wt (C2C12) and dystrophin-deficient (PD50A) myoblasts via secreted factors ...............................................124 3.2.5. Insulin-like growth factors promote proliferation and reduce apoptosis of dystrophin-deficient myoblasts: ..........................................................................132 3.2.6. Insulin-like growth factors (IGF-1 and IGF-2) promote differentiation of dystrophin-deficient myoblasts cultured in low mitogen medium ..........................................138 3.2.7. Elevated levels of Cav-1 and Cav-3 proteins in PD50A myoblasts correlate with the lower differentiation induction: ..........................................................................140 3.2.8. IGF-2 signalling pathways are perturbed in dystrophin-deficient myoblasts:…148 3.3. Discussion:.................................................................................................159 3.3.1. Dystrophin-deficient myoblasts have impaired differentiation ..................159 3.3.2. Osteoblasts promote differentiation of dystrophin-deficient myoblasts via cell-cell contact but promote differentiation of wt myoblasts via secreted factors .............160 3.3.3. Treatment of dystrophin-deficient myoblasts with combinations of IGF-2/IGF-1, IGF-1/LIF or IGF-2/LIF promotes their differentiation ......................................161 3.3.4. IGF-2 is a survival factor for differentiating dystrophin-deficient myoblasts…164 3.3.5. Apoptosis correlates with myoblasts differentiation..................................165 3.3.6. Elevated protein levels of Cav-1 and Cav-3 correlate with impairment of differentiation in dystrophin-deficient myoblasts.................................................167 3.3.7. Up-regulation of Pax7 protein level in differentiating dystrophin-deficient myoblasts induced by OCM coincides with reduced apoptosis ............................................169
Chapter 4. Cav-1 and Cav-3 are elevated in dystrophic embryos and play a role in heart development................................................................................................171
4.1. Introduction: ..............................................................................................171 4.2. Results: ......................................................................................................172 4.2.1. Levels of Cav-1 and Pax7 proteins are perturbed in E17.5 dystrophic embryos…172 4.2.2. Cav-1 and Cav-3 localise in skeletal and cardiac muscles and there is a positive correlation between the staining intensities of Cav-1 and Cav-3.........................176 4.2.3. The localisation and staining intensity of Cav-1 in other organs are affected in E17.5

VI
DMhet and cav-3-/- embryos ...............................................................................182 4.2.4. Expression of Cav-1 during the heart development is affected by dystrophin and Cav-3 …………………………………………………………………………….185 4.3. Discussion ..................................................................................................195 4.3.1. E17.5 mdx embryos have elevated levels of Caveolin-1 and Caveolin-3 proteins..195 4.3.2. Cav-1 protein levels correlate with Cav-3 protein levels in E17.5 mouse embryos …………………………………………………………………………….196 4.3.3. Perturbed protein levels of Cav-1 and Cav-3 may contribute to cardiomyopathy in dystrophic mouse models....................................................................................197 4.3.4. Heart development in mdx embryos is delayed.........................................202
Chapter 5. The protein levels of Cav-1, Cav-3 and Pax7 and the IGF-2 signalling are perturbed in mdx mouse and dystrophin-deficient myoblasts ...........................204
5.1. Introduction: ..............................................................................................204 5.2. Results: ......................................................................................................205 5.2.1. IGF-2 and its downstream signalling pathways are perturbed in E17.5 dystrophic embryos …………………………………………………………………………..205 5.2.2. Cav-1 and Cav-3 form hetero-oligomers in the skeletal muscles of both wt and mdx mice …………………………………………………………………………….212 5.2.3. IGF-2 associates with Cav-1....................................................................216 5.2.4. Src and phospho-Src (pSrc) proteins associate with Cav-1 and Cav-3......222 5.2.5. IGF-2 regulates Pax7, Caveolin-1 and Caveolin-3 in C2C12 myoblasts ..226 5.2.6. Altered Pax7 Levels affect levels of Cav-1 and Cav-3 in myoblasts ..........232 5.2.7. Caveolin-1 and Caveolin-3 regulate Pax7 protein levels in myoblasts......237 5.3. Discussion:.................................................................................................240 5.3.1. IGF-2 signalling pathways are perturbed in dystrophic mouse embryos...240 5.3.2. Cav-1 protein associates with Cav-3 protein in skeletal muscles of adult mice…242 5.3.3. Association of IGF-2, Src and pSrc proteins with Cav-1/Cav-3 protein complex may contribute to the pathology of mdx .....................................................................243 5.3.4. Pax7 expression in mdx is affected by Cav-1 and Cav-3...........................246
Chapter 6. Functional analysis of Caveolin-1 and Caveolin-3 in relation to dystrophin deficiency ………………………………………………………………………248
6.1. Introduction: ..............................................................................................248 6.2. Results: ......................................................................................................251 6.2.1. Localisation of Cav-1 and Cav-3 in the sarcolemma regions of embryonic skeletal muscles are perturbed in dystrophin deficiency ..................................................251 6.2.2. Dystrophic myotubes have mislocalisation of Cav-1 and Cav-3 proteins in T-tubules …………………………………………………………………………….257 6.2.3. β-dystroglycan associates with Cav-1/Cav-3 protein complex ..................259

VII
6.2.4. Cav-1 and Cav-3 colocalise with the cytoskeleton architecture (actin filaments) in dystrophin-deficient myoblasts and myotubes .....................................................264 6.2.5. The mechanical properties of myotubes are manipulated by minidystrophin△H2-R19, Cav-1 and Cav-3 ................................................................................................271 6.2.5.1. Knocking down Cav-3 improves formation of dystrophin-deficient (PD50A) myotubes ............................................................................................................273 6.2.5.2. Mminidystrophin△H2-R19 proteins increase the mechanical force modulus of dystrophin-deficient myotubes. ...........................................................................277 6.2.5.3. The levels of Cav-3 affect the stiffness of dystrophin-deficient myotubes…278 6.2.5.4. Cav-1 is important for the maintenance of mechanical properties of dystrophin-deficient myotubes..............................................................................................283 6.2.6. The number of Cav-3(+)My32(+) fibres increases at the expense of Cav-1(+)My32(+) fibres in E15.5 mdx intercostal muscles ........................................285 6.2.7. Modulation of Cav-1, Cav-3 and minidystrophin△H2-R19 also affects the mechanical properties of myoblasts ......................................................................................289 6.2.7.1. Dystrophin-deficient myoblasts have compromised mechanical properties…291 6.2.7.2. Minidystrophin△H2-R19 increases the force modulus of non-dystrophic myoblasts. …………………………………………………………………………….293 6.2.7.3. Fine-tuning of Cav-3 protein levels is required to maintain the mechanical properties of dystrophin-deficient myoblasts.......................................................294 6.2.7.4. Cav-1 is important for the maintenance of mechanical property of dystrophin-deficient myoblasts.............................................................................................300 6.2.8. Modulating IGF-2 in myoblasts affects their mechanical properties.........308 6.3. Discussion:.................................................................................................309 6.3.1. Perturbed localisation of Cav-1 and Cav-3 relative to calsequestrin in dystrophin-deficient myotubes may contribute to impaired development of T-tubules ...........309 6.3.2. Cav-1 and Cav-3 associate with β-dystroglycan and actin filaments- a role for mechanical response ..........................................................................................310 6.3.3. Cav-1 and Cav-3 are important for maintenance of the mechanical properties in dystrophin-deficient myotubes and myoblasts .....................................................312 6.3.4. Cav-3 correlates with the fast myosin heavy chain (FMyHC) expression in muscles …………………………………………………………………………….314 6.3.5. Down-regulation and overexpression of IGF-2 impair the mechanical properties of myoblasts ...........................................................................................................315
Chapter 7. Conclusion and future perspectives..............................................316 7.1. Conclusions................................................................................................316 7.1.3. Perturbed localisation of Cav-1, Cav-3 proteins is related to the impaired organisation of actin filaments and microtubules in dystrophin-deficient myoblasts…323

VIII
7.2. Future work................................................................................................325 Reference ..............................................................................................................328 APPENDIX 1. Material suppliers .......................................................................364 APPENDIX 2. Recipes .........................................................................................370 Appendix 3. Raw data of Chapter 3 ....................................................................373 Appendix 4. Raw data of Chapter 4 and 5 ..........................................................380 Appendix 5. Raw data of Chapter 6 ....................................................................383

IX
List of Figures
Chapter 1. Introduction Figure 1.1 Schematic representation of myotome specification and the siganlling underpin this
process. ......................................................................................................................... 2 Figure 1.2 Anatomic identification of satellite cells within muscle fibres................................ 9 Figure 1.3 Expression of MRFs during myoblast differentiation........................................... 18 Figure 1.4 Time table of the expression of MRFs during mouse embryogenesis. .................. 20 Figure 1.5 MyoD generates feed-forward signalling to regulate expression of muscle specific
genes during myogenesis............................................................................................. 22 Figure 1.6 Dystrophin-glycoprotein complex (DGC) in sarcolemma .................................... 26 Figure 1.7 Signalling cascades downstream the IGF1R/PI3K/AKT ...................................... 40 Figure 1.8 Auto-regulation loop of IGF-2 during myogenesis induced by low mitogen or
nutrients. ..................................................................................................................... 43 Figure 1.9 Signalling pathway mediated by LIF stimulation that promotes myogenesis........ 45 Figure 1.10 Schematical description of the goal and objectives of this thesis. ....................... 55 Chapter 2. Material and Methods Figure 2.1 Mouse iPS cells cultured on feeder cells.............................................................. 62 Figure 2.2 Cell number determination using haemocytometer. ............................................. 64 Figure 2.3 Pax7-mCherry expression plasmid construction. ................................................. 75 Figure 2.4 Selection of iPS cells carrying Oct4 reporter plasmid. ......................................... 81 Figure 2.5 Protein levels of α-tubulin vary in dystrophic embryos. ..................................... 101 Figure 2.6 Illustration of how the atomic force microscopy (AFM) works.......................... 104 Chapter 3. The osteoblast MC3T3-E1 cell line promotes differentiation of dystrophin-deficient myoblasts Figure 3.1 Fusion impairment of mdx derived skeletal myoblasts....................................... 107 Figure 3.2 The differentiation capacity of dystrophin-deficient myoblasts (PD50A) is
impaired under low mitogen condition compared to non-dystrophic myoblasts (C2C12)....................................................................................................................................111
Figure 3.3 Coculture with osteoblasts promotes the differentiation of myoblasts. ............... 113 Figure 3.4 Factors secreted from osteoblasts promote the differentiation of C2C12 myoblasts.
.................................................................................................................................. 115 Figure 3.5 Osteoblasts secrete factors to promote differentiation of C2C12 and PD50A
myoblasts. ................................................................................................................. 120 Figure 3.6 Fetal calf serum (FCS) promotes differentiation of PD50A myoblasts but
suppresses differentiation of C2C12 myoblasts.......................................................... 121 Figure 3.7 Myoblasts in OCM have total cell number fewer than in GM but greater than in
DM. .......................................................................................................................... 123
X
Figure 3.8 Osteoblast-conditioned medium reduces the apoptotic index of PD50A myoblasts................................................................................................................................... 126
Figure 3.9 The ratio of active/inactive caspase 3 decreases in differentiating PD50A myoblasts under osteoblast-conditioned medium (OCM) and increases in those under differentiation medium (DM). ................................................................................... 128
Figure 3.10 Protein levels of Pax7 increase in differentiating PD50A myoblasts induced with osteoblast-conditioned medium (OCM). .................................................................... 130
Figure 3.11 Growth factors increase mitotic index of differentiating myoblasts. ................. 133 Figure 3.12 IGF-2 and LIF, but not IGF-1, reduce the apoptotic index of differentiating
dystrophin-deficient myoblasts. ................................................................................. 135 Figure 3.13 Growth factors promote myotube formation in dystrophic context................... 137 Figure 3.14 Protein levels of Cav-1 isoforms are higher in dystrophic myoblasts under
osteoblast-conditioned medium (OCM) and differentiation medium (DM). ............... 141 Figure 3.15 Protein levels of Caveolin-1 and Caveolin-3 are higher in PD50A cells than in
C2C12 cells under osteoblast-conditioned medium (OCM) and differentiation medium (DM)......................................................................................................................... 145
Figure 3.16 The levels of IGF-2 and p57kip2 decrease in differentiating C2C12 and PD50A myoblasts induced by differentiation medium (DM).................................................. 149
Figure 3.17 AKT/mTOR signalling pathway is perturbed in differentiating PD50A myoblasts cultured in osteoblast-conditioned medium (OCM) and differentiation medium (DM)................................................................................................................................... 152
Figure 3.18 Ratio of phospho-ERK (pERK)/ERK is higher in PD50A myoblasts under osteoblast-conditioned medium (OCM) and differentiation medium (DM) compared with C2C12 myoblasts. ............................................................................................. 157
Chapter 4. Cav-1 and Cav-3 are elevated in dystrophic embryos and play a role in heart development Figure 4.1 Pax7 and Caveolin-1 protein levels are perturbed in E17.5 dystrophic embryos. 173 Figure 4.2 E17.5 mdx embryos have higher staining intensity of Caveolin-3 compared to
nondytrophic mouse embryos. ................................................................................... 177 Figure 4.3 E17.5 mdx embryos have higher staining intensity of Caveolin-1 in skeletal
muscles than that in non-dystrophic mouse embryos.................................................. 180 Figure 4.4 The staining pattern of Caveolin-1 are altered in E17.5 mdx, DMhet and cav3-/-
mouse embryos compared to E17.5 wt mouse embryos. ............................................ 183 Figure 4.5 Illustration of the development of the mouse heart............................................. 185 Figure 4.6 Cav-1 localises in the atrium of developing hearts............................................. 187 Figure 4.7 Structure of the atrial trabeculae is perturbed in mdx, DMhet and cav-3-/- embryos
during development................................................................................................... 189 Figure 4.8 Localisation of Cav-1 in atrial trabeculae changes during heart development..... 191

XI
Figure 4.9 Localisation of Cav-1 changes in ventricles during heart development. ............. 194 Chapter 5. The protein levels of Cav-1, Cav-3 and Pax7 and the IGF-2 signalling are perturbed in mdx mouse and dystrophin-deficient myoblasts Figure 5.1 IGF-2 signalling in mdx is mediated from AKT/mTOR pathway. ...................... 206 Figure 5.2 Caveolin-1 interacts with caveolin-3 in adult skeletal muscles........................... 211 Figure 5.3 The PD50A myoblasts and myotubes have higher coincident expression of Cav-1
and Cav-3 proteins compared to the C2C12 myoblasts and myotubes........................ 213 Figure 5.4 IGF-2 colocalises with Cav-3 in C2C12 and PD50A myoblasts ......................... 215 Figure 5.5 IGF-2 colocalises with Cav-3 in PD50A myotubes ............................................ 217 Figure 5.6 More prepro-IGF-2 associates with Caveolin-1 and Caveolin-3 in the skeletal
muscles of 4-week old mice ...................................................................................... 219 Figure 5.7 pSrc and Src proteins associate with Caveolin-1 and Caveolin-3 in dystrophic
skeletal muscles......................................................................................................... 221 Figure 5.8 pSrc and Src proteins associate with Caveolin-1eGFP in myotubes. .................. 224 Figure 5.9 Down-regulation of IGF-2 affects the Cav-1, Cav-3 and Pax7 protein levels in
myoblasts. ................................................................................................................. 227 Figure 5.10 Pax7-mCherry construct expression in C2C12 and dfd13 myoblasts................ 231 Figure 5.11 Levels of Pax7 protein in myoblasts affect the levels of Cav-1 and Cav-3 in
myoblasts. ................................................................................................................. 233 Figure 5.12 Levels of Cav-1 and Cav-3 in myoblasts affect the levels of Pax7 proteins in
myoblasts. ................................................................................................................. 238 Figure 5.13 A negative feedback loop exists between Src and Cav-1 to regulate signal
transduction............................................................................................................... 244 Chapter 6. Functional analysis of Caveolin-1 and Caveolin-3 in relation to dystrophin deficiency Figure 6.1 Organisation of triads in skeletal muscles .......................................................... 248 Figure 6.2 Caveolin-3 proteins localise to the sarcolemma of embryonic skeletal muscles as
punctate dots corresponding to the triads of muscles.................................................. 250 Figure 6.3 Caveolin-1 localises to the sarcolemma in the skeletal muscles of E15.5 and E17.5
mdx, DMhet and cav-3-/- mouse embryos. ................................................................. 253 Figure 6.4 Mislocalisation of Cav-1 and Cav-3 in T-tubules ............................................... 256 Figure 6.5 β-dystroglycan interacts with caveolin-1 in wt and mdx muscles. ...................... 258 Figure 6.6 Cav-3 but not Cav-1 protein colocalises with β-dystroglycan in myotubes......... 261 Figure 6.7 Cav-3 but not Cav-1 colocalises with actin in C2C12 and PD50A myoblasts..... 263 Figure 6.8 Cav-3 and Cav-1 colocalise with actin in myotubes........................................... 265 Figure 6.9 Sequence alignments of mouse caveloin-1, caveolin-2, caveolin-3 and the partial
actin binding domain (ABD) of dystrophin................................................................ 267 Figure 6.10 Cav-3 and Cav-1 do not colocalise with α-tubulin in myotubes ....................... 269

XII
Figure 6.11 Sequence alignments of mouse caveolin-1, caveolin-2, caveolin-3 and the microtubule binding domain (MBD) of dystrophin. ................................................... 270
Figure 6.12 Minidystrophin-eGFP expression in C2C12 and dfd13 myoblasts.................... 272 Figure 6.13 Morphology of C2C12 and dfd13 transfectants under differentiation condition for
ten days. .................................................................................................................... 274 Figure 6.14 Mini-dystrophin increases the mechanical properties of dystrophin-deficient
myotubes................................................................................................................... 276 Figure 6.15 Over-expressing Cav-3 increases the stiffness of myotubes. ............................ 279 Figure 6.16 Down-regulating Cav-3 increases the mechanical properties of myotubes. ...... 280 Figure 6.17 Overexpressing Cav-1 in myotubes increases the stiffness of dystrophin-deficient
myotubes but impairs the stiffness of non-dystrophic myotubes................................. 282 Figure 6.18 Down-regulation of Cav-1 has reverse effects on the mechanical properties of
non-dystrophic and dystrophin-deficient myotubes.................................................... 284 Figure 6.19 More colocalisation of Cav-3 and Fast MyHC in E15.5 mdx intercostal muscles
compared to E15.5 wt................................................................................................ 286 Figure 6.20 Mechanical properties of non-dystrophic and dystrophin-deficient myoblasts.. 290 Figure 6.21 Mini-dystrophin increases the force modulus of non-dystrophic myoblasts...... 292 Figure 6.22 Over-expressing Cav-3 impairs the mechanical properties of dystrophin-deficient
myoblasts. ................................................................................................................. 295 Figure 6.23 Down-regulating Cav-3 reduces the force modulus of myoblasts..................... 298 Figure 6.24 Over-expression of Cav-1 exerts no effects on mechanical properties of myoblasts.
.................................................................................................................................. 301 Figure 6.25 Down-regulating Cav-1 reduces the stiffness of dystrophin-deficient myoblasts.
.................................................................................................................................. 304 Figure 6.26 Down-regulation of IGF-2 reduces the force modulus of myoblasts................. 306 Chapter 7. Conclusion and future perspectives Figure 7.1 Potential mechanism of how osteoblasts promote myogenesis........................... 319 Figure 7.2 Schematical illustration of potential roles of Cav-1, Cav-3 and Pax7 in the absence
of dystrophin. ............................................................................................................ 321

XIII
List of Tables
Table 1.1 The expression of some common molecular markers found in quiescent and activated satellite cells in adult muscle. ....................................................................... 15
Table 2.1 The number of STO cells needed for feeder cell preparation after mitomycin C treatment. .................................................................................................................... 60
Table 2.2 Reagents needed to freeze down the expected number of vials according to the container used for cell culture...................................................................................... 63
Table 2.3 The forward and reverse primers used in the mutagenesis PCR for the generation of Pax7-mCherry expression plasmid. ............................................................................. 69
Table 2.4 Enzymes used to digest Pax7-mCherry constructs, with expected band sizes ........ 76 Table 2.5 The plasmids used in this thesis and their selection markers for plasmid
amplification in bacterial culture. ................................................................................ 78 Table 2.6 Amount of DNA and transfection reagent (LipofactamineTM2000) required for
different culture condition ........................................................................................... 80 Table 2.7 The antibodies and titres used for the fluorescent immunostaining. ....................... 85 Table 2.8 Fixation, dehydration and clearing incubation times for E10.5-E17.5 staged
embryos in 4% paraformaldehyde, ethanol and xylene respectively. ............................ 87 Table 2.9 The primary, secondary antibodies used for immunohistochemistry. ..................... 91 Table 2.10 The percentage of polyacrylamide used in SDS-PAGE gels to separate different
sized proteins .............................................................................................................. 97 Table 2.11 Primary, secondary and tertiary antibodies used for immunoblotting analysis. ... 102 Table 3.1 The localisation and roles of Cav-1 isoforms during embryogenesis.................... 169 Table 4.1 The summary of the pathologies of mice with caveolin knocked out. .................. 201

XIV
Abbreviations A
AFM = atomic force microscopy
Alpha-MEM = Minimum Essential Medium Alpha
Modification
ANOVA = analysis of variance
APS = ammonium persulfate
B
bHLH = basic helix-loop-helix
BMD = Becker Muscular Dystrophy
BMP4 = bone morphogenetic protein 4
BSA = bovine serum albumin
C
C2C12 = murine myoblast cell line
CAD = caspase-activated DNase
Cav-1 = caveolin-1
Cav-2 = caveolin-2
Cav-3 = caveolin-3
cav-3-/- = Cav-3 null/deficient mouse
CCM = C2C12/MC3T3-E1 conditioned medium
CDKN1A (also known as p21CIP1) = cyclin-
dependent kinase inhibitor 1A
CDKN1C (also known as p57KIP2) = cyclin-
dependent kinase inhibitor 1C
cGMP = cyclic GMP
CNTF = ciliary neurotrophic factor
Csk = C-terminal Src kinase
CSM4B = CD45-Sca-1-Mac-1-CXCR4+β1-integrin+
CT-1 = cardiotrophin-1
CXMD = Canine X-linked Muscular Dystrophy
D
DAB = 3, 3'-diaminobenzidine
DAPI = 4’,6-diamidino-2-phenylindole
DF-12 = DMEM F-12
Dfd13 = murine dystrophic myoblast cell line
DGC = dystrophin-glycoprotein complex
dH2O = distilled water
DM = differentiation medium
DMhet = mdx with heterozygous caveolin-3 (cav-3+/−)
knockout
DMD = Duchenne muscular dystrophy
DMEM = Dulbecco’s Modified Eagles Medium
DMSO = dimethyl sulphoxide
DTT = dithiothreitol
E
E11.5 = embryonic day 11.5
E13.5 = embryonic day 13.5
E15.5 = embryonic day 15.5
E17.5 = embryonic day 17.5
ECM = extracellular matrix
EDL = extensor digitorum longus
ERK = Extracellular signal-regulated kinases
ES cells = embryonic stem cells
F
FACS = fluorescence activated cell sorting
FAK = Focal adhesion kinase
FCS = Fetal calf serum
FMyHC = fast myosin heavy chain
FOXO = transcription factor forkhead box O
G
G418 = Geneticin
GM = growth medium
GSK-3β = Glycogen synthase kinase-3β
H
HAC = human artificial chromosome
HDAC1 = histone deacetylase 1
H2O2 = hydrogen peroxide
HUVECs = human umbilical vein endothelial cells
I
ICM = inner cell mass
Id = inhibition of differentiation
IGEPAL®CA-630 = octylphenyl-polyethylene
glycol

XV
IGF-1 = Insulin-like growth factor 1
IGF1R = type I insulin-like growth factor receptor
IGF-2 = Insulin-like growth factor 2
IGF2R = IGF receptor type 2
IGFBP5 = IGF binding protein-5
IHC = immunohistochemistry
IL6 = interleukin 6
I-mf = inhibitor of MyoD family
IP = Immunoprecipitation
iPS cells = induced pluripotent stem cells
K
KD = knock down
kDa = kilo Dalton
KO = knockout
kPa = kilopascal
L
LB = Luria-Bertani
LGMD 1C= Limb-Girdle Muscular Dystrophy type
1C
LIF = Leukemia inhibitory factor
LIFR = LIF receptor
M
M = Molar
MAPK = mitogen-activated protein kinase
MC3T3-E1 = murine osteoblast cell line
MD = Muscular dystrophy
MDSC = muscle-derived stem cells
mdx= X chromosome-linked muscular dystrophy
mouse model
MEFs = myocyte enhance factors
MP = main population
MPCs = muscle precursor cells
MRFs = myogenic regulatory factors
mTOR = mammalian target of rampmycin
mTORC1 = mTOR complex 1
MyHC = myosin heavy chain
MyHCIIa, MyHCIId/x and MyHCIIb = fast myosin
heavy chain isotypes
MyHCβ = slow myosin heavy chain
Myl = myosin light chain
MW = molecular weight
N
NaCl = sodium chloride
Na2EDTA = Diaminoethanetetra-acetic acid disodium
salt
NCAM = neural cell adhesion molecule
-ve = negative charge
NFAT3c = nuclear factor of activated T cells isoform
3c
NFκB = nuclear factor κB
nN = Nanonewtons
nNOS = Neuronal Nitric Oxide Synthase
O
OCM = osteoblast-conditioned medium
OSM = oncostatin M
P
pAKT = phospho-AKT
Pax3 = Paired-type homeobox transcription factor 3
Pax7 = Paired-type homeobox transcription factor 7
PBS = phosphate buffered saline
PBST = PBS with tween® 20
PD50A = clonal derivative of dfd13 myoblast cell
line
PDCM = PD50A/MC3T3-E1 conditioned medium
PEG = Polyethylene glycol
pERK = phospho-ERK
PFA = paraformaldehyde
PI3K = phophatidylinositol 3-kinase
PKB/AKT = protein kinase B
PKC = protein kinase C
PKG = cGMP-dependent protein kinase
pmTOR = phospho-mTOR
+ve = positive charge
PPXY motif = ww domain-binding motif
P/S = penicillin/streptomycin
pSrc = phospho-Src

XVI
PTPα = protein tyrosine phosphatase-α
R
rAAV = recombinant adeno-associated virus vector
RIPA buffer = RadioImmuno Precipitation Assay
buffer
RNAi = RNA interference
rpm = round per minute
S
SA-HRP = Streptavidin-horseradish peroxidase
SCID = severe combined immunodeficient
SCNT = somatic cells nuclear transfer
SDS = sodium dodecyl sulphate
SDS-PAGE = SDS-polyacrylaminde gel
eletrophoresis
SFM = serum free medium
Shh = sonic hedgehog
shRNA = short hairpin RNA
siRNA = small interference RNA
SMC = vescular smooth muscle cells
SMPs = skeletal muscle precursor cells
SP = side population
Src = nonreceptor tyrosine kinase
SSEA-1 = stage-specific embryonic antigen-1
STAT3 = signal transducer and activator transcription
3
T
TBS = Tris-buffered saline
TBST = TBS with Tween®20
TEMED = N, N, N’, N’-tetramethylethylenediamine
TERT = Telomerase reverse transcriptase
TNB = Tris-NaCl blocking buffer
TGF-β = transforming growth factor-β
TNFα = tumor necrosis factor-α
Triton X-100 = t-octylpheoxypolyethoxyethanol
TSA = Tyramide Siganl Amplification
TSS = transformation and storage solution
V
VCAM-1 = vascular cell adhesion molecule 1
W
Wnt = wingless
wt = wild type
WW domain = a protein-protein interaction motif
containing two conserved tryptophan residues

1
Chapter 1. Introduction
Both the skeletal muscles of DMD patients and mdx mice [mouse model of Duchenne
Muscular Dystrophy (DMD)] have elevated levels of caveolin-3 (Cav-3) (Merrick et al., 2009;
Repetto et al., 1999; Vaghy et al., 1998). The muscle stem cells isolated from DMD patients
or from adult mdx mice have been suggested to differentiate less efficiently than wild-type (wt)
controls in culture (Blau et al., 1983; Delaporte et al., 1984; Schuierer et al., 2005). Primary
muscle stem cells isolated from mdx and cav3-/- [mouse model of Limb Girdle Muscular
Dystrophy type 1C (LGMD-1C)] mouse embryos have elevated rates of proliferation coupled
with elevated apoptosis, suggesting aberrant behaviour of the muscle stem cells (Merrick et
al., 2009). There is attrition of Pax7-positive cells in mdx embryos and this attrition is
exacerbated by reducing the Cav-3 levels in mdx mice (mdxcav-3+/-) (Merrick et al., 2009).
The aim of this project is to understand whether up-regulation of Cav-3 in mdx plays a
compensatory or pathological role in the progress of pathology.
1.1. Myogenesis
1.1.1. Origin of skeletal muscle during embryogenesis
With the exception of the head muscles, the embryonic skeletal muscles of the vertebrate
body are derived from the myotome, which is differentiated from the dorsal part of somite
(Kahane et al., 1998; Venters et al., 1999) (Figure 1.1). The dorsal part of the somite in mouse

2
embryos differentiates into the dermomyotome, and dorsal-medial cells then delaminate from
the dermomyotome and migrate underneath to form the primitive skeletal muscle, myotome
(Venters et al., 1999) (Figure 1.1). Formation of myotome in chick embryos involves two
sequential steps (Gros et al., 2004). In the first phase, progenitors delaminate from the dorsal-
medial lip of dermomyotome, migrate underneath the dermomyotome and elongate
bidirectionally (Gros et al., 2004; Kahane et al., 1998). In the second phase, the myocytes
arise from boarders of the dermomyotome in the sequence of caudal border, rostral border and
ventral-lateral lip (Gros et al., 2004; Kahane et al., 1998) (Figure 1.1).
Figure 1.1 Schematic representation of myotome specification and the siganlling underpin this process. The specification of myotome from dermomyotome is in response to the coordinate signals from the dorsal neural tube (BMP4, Wnt1 and Noggin), notochord (Shh), lateral ectoderm (Wnt7a) and lateral mesoderm (BMP4). (Modified from Marcelle et al., 1997 and Cossu and Borello, 1999)..(Cossu and Borello, 1999)

3
Synthesis of laminin α1 in response to Shh signalling, together with laminin β1γ1, helps the
formation of basement membrane in the myotome, thus defining the structural boundary of
the myotome (Anderson et al., 2009). The molecular markers of the dermomyotome have
been investigated which include Pax3 and Pax7 (paired-typed homeobox transcription factors)
(refer to section 1.2.2 for detail introduction of Pax3 and Pax7) (Goulding et al., 1991;
Stockdale et al., 2000). The somites (both mice and chicks) respond to sonic hedgehog (Shh)
from the notochord; Wnt (wingless) family from dorsal neural tube and dorsal ectoderm, and
BMP4 (bone morphogenetic protein 4) from the lateral mesoderm such that they differentiate
into the dermomyotome and the myotome (Borycki et al., 1999a; Jones et al., 1991; Marcelle
et al., 1997; Pourquie et al., 1996; Spence et al., 1996; Tajbakhsh et al., 1998) (Figure 1.1).
MyoD is a downstream target of Myf5 in progenitors of both epaxial and hypaxial
musculature (Kablar et al., 1997; Tajbakhsh et al., 1997). In mouse and chick embryos, Wnt1
signalling from the dorsal neural tube, which is under the induction of BMP4, activates Myf5
in the expaxial region of newly formed somites; Wnt7a signalling from dorsal ectoderm can
activate MyoD in the hypaxial region with a two-day delay (Cossu et al., 1996; Marcelle et al.,
1997; Tajbakhsh et al., 1998) (refer to section 1.2.5 for detailed introduction of Myf5 and
MyoD) (Figure 1.1). Wnt family proteins have been shown to induce the expression of Myf5
and MyoD in somites by in vitro culture of Wnt-expressing cells with the unsegmented
paraxial mesoderm (UPM; from E9.5 mouse embryos); this UPM expresses myosin heavy

4
chain (MyHC) after 5 days in culture (Tajbakhsh et al., 1998). In both chick and mouse
embryos, the Shh and Wnts signalling pathways also activate Noggin expression in the medial
somites, which antagonises the BMP4 activity from neural tube and lateral mesoderm to form
the barrier, contributing to the formation of dermomyotome (Cossu and Borello, 1999;
Hirsinger et al., 1997; Marcelle et al., 1997; Pourquie et al., 1996) (Figure 1.1). From the
study of chick embryos, it has been demonstrated that deep back muscles originate from the
epaxial dermomyotome (proximal somite) while muscles of the limbs, abdomen and
diaphragm come from the hypaxial dermomyotome (distal somite) (Denetclaw et al., 1997;
Ordahl and Le Douarin, 1992) (Figure 1.1).
The morphogenetic processes of skeletal muscles in limb buds begin when muscle precursor
cells first delaminate from the epithelium of the hypaxial dermomyotome and migrate into the
limb buds (Buckingham et al., 2003). In the mouse embryos, expression of Pax3/Lbx1 (a
homeo-domain containing transcription factor), c-Met receptor tyrosine kinase and Scatter
factor/hepatocyte growth factor (SF/HGF, ligand of c-Met) from embryonic day 9.5 (E9.5)
regulates myoblast specification and migration (from E10.5) from hypaxial dermomyotome
into the limb buds (Dietrich et al., 1999). Appendicular muscle precursor cells in mouse
embryos (E10.5) with Lbx1-/+and Lbx1-/- lose their ability to laterally migrate from the
dermomyotome to limb buds as do those which are deficient in Pax-3 (Gross et al., 2000;
Tremblay et al., 1998). Once migration of cells stops, the myoblasts begin to differentiate and

5
fuse to form multinucleated muscle fibres.
1.1.2. Two waves of myogenesis
During embryonic myogenesis there are two waves of myognesis, primary and secondary
myogenesis (Fredette and Landmesser, 1991; Harris et al., 1989; Ross et al., 1987). In mouse
embryos, the formation of primary myotubes begins at E9.5 while formation of secondary
myotubes commences from E13.5 and continues postnatally (Ashby et al., 1993; Harris et al.,
1989; Merrick et al., 2007). It has been suggested that primary and secondary myotubes come
from distinct precursors (Fredette and Landmesser, 1991; George-Weinstein et al., 1993;
Miller and Stockdale, 1986). Primary myoblasts fuse to form primary myotubes which
secondary myoblasts use as the basis for attachment and as the surface for formation of
secondary myotubes (Wigmore and Dunglison, 1998). Primary myotubes are distinguished
from secondary myotubes in that they are shorter in size but fatter and doughnut-shaped in
cross section (Pedrosa-Domellof and Thornell, 1994; Wigmore and Stickland, 1983). Primary
myotubes express the slow embryonic isoform of myosin heavy chain (MyHC) whilst
secondary myotubes express developmental (embryonic and neonatal) as well as adult fast
MyHC isoforms (Refer to section 1.1.3 for myosin heavy chain isoforms) (Cho et al., 1994;
Merrick et al., 2007; Miller et al., 1985; Pedrosa-Domellof and Thornell, 1994). In addition to
MyHC isoform typing, secondary myotubes in chick embryos can also be identified with the

6
presence of fast Ca2+-ATPase in these myotubes (Fredette and Landmesser, 1991).
1.1.3. Myosin heavy chain isoforms of skeletal muscles
Four major MyHC isoforms have been identified in adult mammalian skeletal muscles; one
slow type (MyHCβ) and three fast types (MyHCIIa, MyHCIId/x and MyHCIIb) (Pette and
Staron, 2000). Appropriate localisation of slow and fast MyHC isoforms to different myotubes
defines the specificity of individual skeletal muscle groups (Harridge, 2007; Pette and Staron,
2000). The MyHC compositions reflect the function of skeletal muscles (Pette and Staron,
2000). The fast muscle fibres have fast rates of contraction and relaxation and they are rich in
enzymes for glycolytic metabolism, such as creatine kinase and glycerol 3-phosphate
dehydrogenase (Okumura et al., 2005; Scott et al., 2001; Vitorino et al., 2007). In postnatal
mice, the fast-twitch extensor digitorum longus (EDL) muscle (the lower anterior limb muscle)
contains 87% of MyHCIIb with only 9% of MyHCIId/x and 4% of slow MyHC (Agbulut et
al., 2003). In contrast, the slow muscle fibres have slow rates of contraction and relaxation
and they are rich in proteins for oxidative metabolism, such as myoglobin and TCA cycle
enzymes (Okumura et al., 2005; Scott et al., 2001; Vitorino et al., 2007). In postnatal mice,
the slow-twitch soleus muscle (the lower posterior limb muscle) consists of about 54%
MyHCβ, 31% MyHCIIa and 15% fast MyHCIId/x (Agbulut et al., 2003). Muscle fibres
expressing different types of MyHC have different sizes (Mantilla et al., 2008; Pullen, 1977).

7
In adult rat EDL muscle, which consists of type I, IIa and IIb fibres, the cross-section areas of
these three fibre types are IIb, I and IIa in the order of large to small (Pullen, 1977). Similarly,
in adult rat soleus muscle which consists of type I and IIa fibres, cross-section areas of type I
fibres are larger than those of type IIa fibres (Pullen, 1977).
In mammalian embryos, the expression of developmental (embryonic and neonatal) MyHC
isoforms is concomitant with adult fast myosin isoforms (Cho et al., 1994; Merrick et al.,
2007). In later stages of embryogenesis, down-regulation and elimination of developmental
myosin isoforms are accompanied with replacement by adult MyHC isoforms in a muscle
type-specific pattern (fibre type specification), a process that begins in the embryo (E15.5)
and is not completed until several weeks after birth (Agbulut et al., 2003; Merrick et al.,
2007). Overexpression of insulin-like growth factor 2 (IGF-2) in mouse has been shown to
increase the number of fast MyHC (FMyHC) positive myotubes in mouse from E15.5 to just
after birth (P1) (Merrick et al., 2007) (Refer to section 1.7 for detailed introduction of IGF-2
and myogenesis).
1.2. Muscle Stem Cells
Stem cells are characterised by their ability to self-renew and their potential to differentiate
into specialized cells. Based on their origin, stem cells can be divided into several categories
comprising; embryonic stem (ES) cells, which are derived from the inner cell mass (ICM) of

8
the blastocysts; embryo-derived stem cells (such as mesoangioblasts and embryonic
myoblasts); adult stem cells; and induced pluripotent stem (iPS) cells derived from
reprogramming the somatic cells (Merrick et al., 2010; Minasi et al., 2002; Okita et al., 2007;
Passier and Mummery, 2003; Smith and Schofield, 1997). Somatic and adult stem cells are
largely tissue specific and reside in specific niches within those tissues; examples of tissue
specific adult stem cells are the neural stem cells and skeletal muscle stem cells (SMSCs; also
referred to as myoblasts, muscle progenitors and satellite cells) (Kim and Morshead, 2003;
Qu-Petersen et al., 2002; Smith and Schofield, 1997; Zammit et al., 2006a). In prenatal
muscle development, the transcription factor Pax3 is important for the function of embryonic
muscle stem cells; however, Pax7 is important for postnatal myogenesis (Refer to section
1.2.2 for detailed introduction of Pax7 and Pax3 in myogenesis) (Hutcheson et al., 2009;
Kassar-Duchossoy et al., 2005; von Maltzahn et al., 2013).
1.2.1. Satellite cells
Postnatal muscle growth, maintenance and repair after injury depend primarily on the muscle
stem cell population (Mauro, 1961; Zammit et al., 2006a). Satellite cells are characterised by
their anatomic position between the sarcolemma and basement membrane of muscle fibres
(Figure 1.3) (Hawke and Garry, 2001). Quiescent satellite cells are reported to be wedge-
shaped whilst activated satellite cells are elongated (Figure 1.2) (Hawke and Garry, 2001). To
9
activate the regeneration response in muscles, quiescent satellite cells are activated to
differentiate and fuse to complete muscle regeneration (Collins et al., 2005; Mauro, 1961). As
a source for muscle growth and repair, satellite cells exhibit the ability to self-renew to
maintain the stem cell pool (Collins et al., 2005; Zammit et al., 2004).
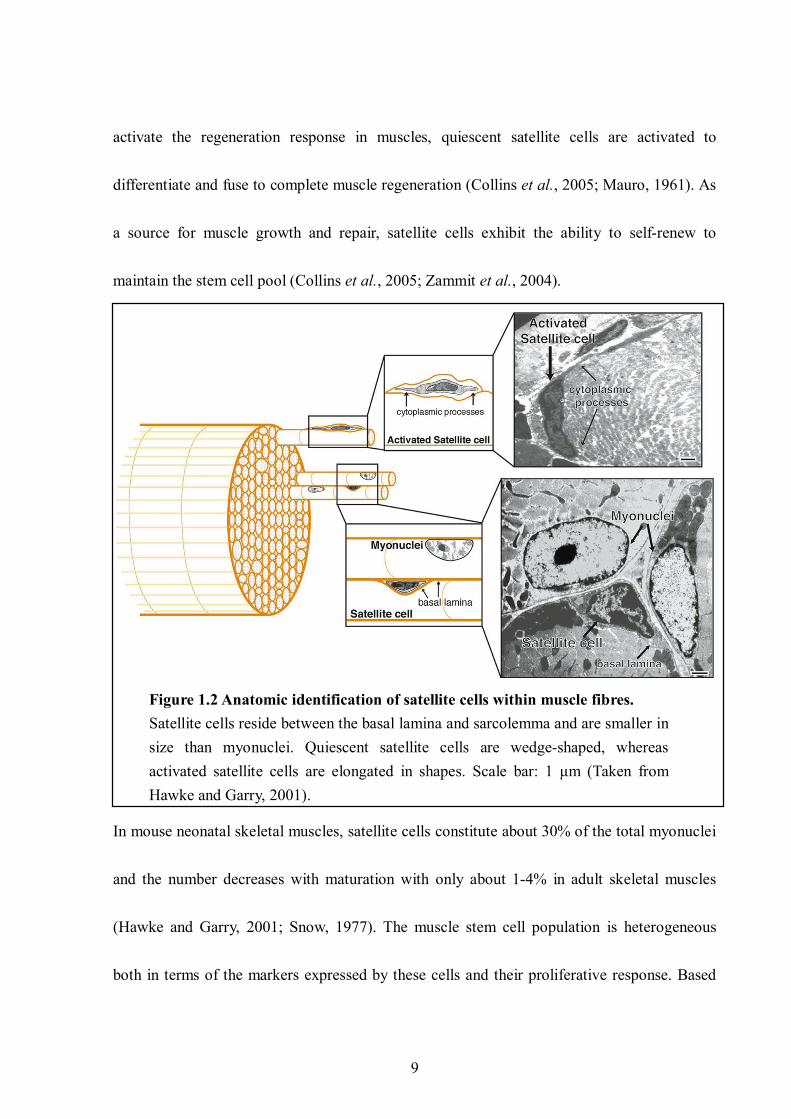
Figure 1.2 Anatomic identification of satellite cells within muscle fibres. Satellite cells reside between the basal lamina and sarcolemma and are smaller in size than myonuclei. Quiescent satellite cells are wedge-shaped, whereas activated satellite cells are elongated in shapes. Scale bar: 1 μm (Taken from Hawke and Garry, 2001).
In mouse neonatal skeletal muscles, satellite cells constitute about 30% of the total myonuclei
and the number decreases with maturation with only about 1-4% in adult skeletal muscles
(Hawke and Garry, 2001; Snow, 1977). The muscle stem cell population is heterogeneous
both in terms of the markers expressed by these cells and their proliferative response. Based

10
upon their proliferation behaviour, myoblasts are divided into the producer satellite cells
which are active in fusion and the reserve (nonfusion) satellite cells which have prolonged
cell-cycle duration (Collins et al., 2005; Schultz, 1996). Through single fiber analysis of the
mitotic satellite cells from adult rat continuously infused with BrdU up to fourteen days, it has
been suggested that the producer satellite cells occupy about 80% of the satellite cell pool and
reserve satellite cells make up the rest 20% of the pool (Schultz, 1996).
1.2.2. Paired-Type Homeobox Transcription Factor (Pax7 and Pax3) and satellite cells
One common molecular marker used to identify satellite cells in adult muscles is the paired-
type homeobox transcription factor Pax7 which is observed both in quiescent and activated
satellite cells in adult muscles (Fukada et al., 2007; Gnocchi et al., 2009; Seale et al., 2000).
However, expression of Pax7 decreases in activated satellite cells (Fukada et al., 2007;
Gnocchi et al., 2009; Seale et al., 2000). A recent study indicates distinct roles of Pax7 and
the related, Pax3 in postnatal and prenatal limb muscle development. In this study Pax3+Pax7-
myogenic progenitor cells in mouse embryos were found to give rise to Pax3-derived Pax7+
cells; ablation of these Pax7+ cells compromises limb fetal myogenesis (Hutcheson et al.,
2009). Pax3, like Pax7, is also expressed in quiescent and activated satellite cells in adult
muscles (Kassar-Duchossoy et al., 2005; Relaix et al., 2006). About 88% of the Pax7-positive
myogenic population in diaphragm expresses Pax3 and about 20% of the Pax7-positive

11
myogenic population in limb muscles is also Pax3 positive (Relaix et al., 2006). See next
section for detailed introduction of functions for Pax7 and Pax3 in myogenesis.
Paired-Type Homeobox Transcription Factor (Pax7 and Pax3):
The paired-type homeobox transcription factors Pax3 and Pax7 play crucial roles in
myogenesis in which they show overlapping functions in most parts of the embryos, including
somite, neural tube, and neural crest (Relaix et al., 2004). However, the functions of Pax3 in
delamination, migration and proliferation of progenitor cells designated to form limbs are not
replaced by Pax7 (Relaix et al., 2004). During embryogenesis, Pax3 is essential for the
development of dermomyotome and myotome (Goulding et al., 1994; Tremblay et al., 1998).
Pax3 deficient mice, the Splotch mouse, have muscle precursor cells but these cells do not
migrate. Consequently the mice lack hypaxial musculature (limb, trunk and diaphragm
muscles) (Tremblay et al., 1998). In addition, the Splotch mouse embryos also show fused
bones (Tremblay et al., 1998). During embryogenesis, Pax3 is crucial for the survival of
somatic cell; somites of Splotch mouse embryos have elevated levels of apoptosis (Borycki et
al., 1999b). It has been reported that, Pax3, homeoproteins Six1 and Six4 are essential for the
expression of Lbx1, c-Met, MRFs and even Pax3; thus regulating cell migration from the
dermomyotome (Dietrich et al., 1999; Grifone et al., 2005). Pax3 is also expressed by a small
population (~3-10%) of muscle stem cells in juvenile diaphragm, triceps and hindlimb
12
muscles (Relaix et al., 2006; Young and Wagers, 2010). Overexpression of Pax3 in this
muscle stem cell population can promote their differentiation (Young and Wagers, 2010).
In mouse embryos at E9.5-10, Pax7 expresses in the closed neural tube and in the
dermomyotome (Horst et al., 2006; Jostes et al., 1990). The expression of Pax7 in dorsal
neural tube and the anterior regions of somites is inhibited by Pax3 such that Pax7 is found in
the medial region of neural tubes and the central region of dorsal dermomyotome (Borycki et
al., 1999b; Horst et al., 2006; Jostes et al., 1990). In Splotch mice, Pax7 misexpresses in the
dorsal neural tube and dorsomedial lip of dermomyotome where Pax3 normally expresses in
the wt mice (Borycki et al., 1999b). In the absence of Pax7 (Pax7−/− mice), about 97% of the
Pax7−/− mice die within three weeks after birth with no obvious reason (Mansouri et al.,
1996). Juvenile Pax7−/− mice show reduction of satellite cell number and increased satellite
cell apoptosis, suggesting the role of Pax7 for the survival of adult satellite cells (Oustanina et
al., 2004; Relaix et al., 2006; Seale et al., 2000). In addition, Pax7−/− mice exhibit defects of
the skeletal structures derived from cephalic neural crest cells, such as shorter upper jaw
(Mansouri et al., 1996). A recent report using Tamoxifen-inducible NICDOE (overexpression
of constitutive activated Notch 1 intracellular domain) mice suggests that constitutive
activation of Notch induces Pax7 expression in satellite cells leading to impairment of muscle
regeneration after injury (Wen et al., 2012).

13
1.2.3. Heterogeneity of muscle stem cells
The heterogeneity of muscle stem cells is represented by the diverse expression of their
molecular markers. It has been suggested that two distinct populations of muscle precursor
cells take part in the formation of myotome during embryogenesis; one population expresses
both Myf-5 and MyoD while the other population expresses MyoD (Gensch et al., 2008; Ott
et al., 1991; Tajbakhsh et al., 1996). Using immunolabeling together with in situ hybridization
of single mouse muscle fibers, the established hematopoietic stem cell marker CD34 and the
myoblast marker Myf-5 were identified as markers for quiescent satellite cells in adult
muscles, some of which also expresses MyoD (Beauchamp et al., 2000). M-cadherin and c-
met are also identified to be candidate markers for adult muscle stem cells (Cornelison and
Wold, 1997; Irintchev et al., 1994). However, satellite cells expressing M-cadherin, Myf5 and
CD34 represent only about 80% of total quiescent satellite cells within the muscle fibre
(Beauchamp et al., 2000). The expression of Myf5 and CD34 in satellite cells declines in
activated satellite cells while the expression of M-cadherin increases in activated satellite
cells (Beauchamp et al., 2000; Cornelison and Wold, 1997) (Refer to section 1.2.5 for detail
introduction of Myf-5 and MyoD). It has been reported that muscle stem cells isolated from
mouse skeletal muscles using SM/C-2.6 antibody (antigen: VCAM) are also CD34 positive
but they make up only about 18% of the CD34 positive muscle stem cell population (Fukada
et al., 2004; Fukada et al., 2007). The receptor for HGF/SF, c-met, is present in quiescent

14
muscle stem cells and its expression continues when the muscle stem cells are activated
(Cornelison and Wold, 1997; Tatsumi et al., 1998). Expression patterns of these markers in
postnatal myoblasts and the population of myoblasts expressing them are summarised in table
1.1.

15
Molecular marker
Quiescent satellite
cells
Activated satellite
cells
Proportion of myoblasts expressing
Reference
Caveolin-1 ++ + Also express Pax7 Gnocchi et al., 2009; Volonte et al., 2005
CD34 ++ + Also express Myf5 and M-cadherin; 80% of satellite cells
Beauchamp et al., 2000;
c-met ++ ++ Also express M-cadherin and syndecan
Cornelison and Wold, 1997; Tatsumi et al., 1998
CTR + + Emerin ++ ++ Integrin α7 ++ ++
Also express Pax7
Jagged-1 - ++ Also express MyoD Lamin A/C ++ ++ Also express Pax7
Gnocchi et al., 2009
M-cadherin + ++ Also express Myf5, CD34 and c-met; 80% of satellite cells
Cornelison and Wold, 1997; Irintchev et al., 1994
MRF4 - ++ Cornelison and Wold, 1997
Myf5 ++ +
Also express CD34 and M-cadherin; 80% of satellite cells
Beauchamp et al., 2000; Cornelison and Wold, 1997; Ott et al., 1991; Gensch et al., 2008; Tajbakhsh et al., 1996 ; Gayraud-Morel et al., 2012
MyoD + ++ Also express Pax7 Cornelison and Wold, 1997; Gnocchi et al., 2009; Ott et al., 1991; Gensch et al., 2008
myogenin - ++ Also express myoD Cornelison and Wold, 1997; Gnocchi et al., 2009
NCAM - ++ Also express syndecan Capkovic et al., 2008
Pax3 ++ - 10% of Pax7(+) cells Relaix et al., 2006
Pax7 ++ + 90% of these cells express Myf5
Gnocchi et al., 2009; Fukada et al., 2004; Seale et al., 2000; Gayraud-Morel et al., 2012
SM/C-2.6 (antigen: VCAM)
++ Express in 18% of the CD34 positive satellite cells
Fukada et al., 2004; Fukada et al., 2007
Syndecan-3 and Syndecan-4
++ ++ Also express c-met
Cornelison et al., 2001
Table 1.1 The expression of some common molecular markers found in quiescent and activated satellite cells in adult muscle. The absence of individual marker is marked by “-” whereas their presence is marked by “ +.” The number of “+” indicates increased or decreased expression of individual marker. Although Pax3 and Pax7 are expressed in activated satellite cells, their expression is down-regulated once the activated satellite cells are committed to differentiation.
16
1.2.4. Other Markers for quiescent and activated muscle stem cells
Expression pattern of the following markers and the cell population expressing them are
summarised in table 1.1. The c-met positive quiescent and activated satellite cells also express
two heparan sulfate proteoglycans (syndecan-3 and syndecan-4) (Cornelison et al., 2001). In
that report, the authors suggested that proliferation and differentiation of satellite cells of
isolated muscle fibres induced by HGF/SF and FGF require the formation of a complex which
comprises the growth factors, their receptors and the syndecans (Cornelison et al., 2001).
Caveolin-1 (Cav-1), integrin α7, calcitonin receptor (CTR) and two nuclear envelope proteins
lamin A/C and emerin are also expressed in Pax7-positive muscle stem cells; they are present
in both quiescent and activated satellite cells (Gnocchi et al., 2009). 90% of these Pax7-
positive cells also express Myf5 (Gayraud-Morel et al., 2012). Although the protein levels of
Cav-1 and CTR decrease in activated satellite cells, the level of Cav-1 recovers from day
three onward after induction of differentiation and it is also present in myotubes (Gnocchi et
al., 2009; Volonte et al., 2005). NCAM and Jagged-1 (the Notch ligand) are expressed in
activated satellite cells only, and thus can be used as markers for activated satellite cells in
addition to MyoD, myogenin and MRF4 (Capkovic et al., 2008; Cornelison and Wold, 1997;
Gnocchi et al., 2009). For a more detailed review of MyoD, MRF4 and myogenin see section
1.2.5.
Another population of the myogenic stem cells (called muscle-derived stem cells or MDSC)

17
isolated from subpopulation of reserve satellite cells is characterised by long-term
proliferative capacity, strong self-renewal ability and multipontent differentiation (Gussoni et
al., 1999; Qu-Petersen et al., 2002). The MDSCs are divided, according to Hoechst 33342
(H33342) staining and fluorescence activated cell sorting (FACS) method, into a population
of stem cells with low H33342 staining which was called side population (SP) to distinguish
from the brightly stained main population (MP) (Gussoni et al., 1999). This population of
muscle stem cells is not well understood.
1.2.5. Myogenic Regulatory Factors (MRFs) and Myogenesis
Myoblast differentiation begins with cell cycle withdrawal which is followed by expression of
contractile proteins and ends when syncytial myotubes are formed (Figure 1.3) (Andres and
Walsh, 1996). The skeletal muscle differentiation process requires the expression of muscle
specific genes (such as MyHC) under the control of myogenic regulatory factors (MRFs) in
cooperation with myocyte enhance factors (MEFs) (Blais et al., 2005; Molkentin et al., 1995;
Pownall et al., 2002). The MRFs, including Myf5, MyoD, myogenin and MRF4, are
transcription factors that share conserved basic helix-loop-helix (bHLH) DNA binding motifs
and recognize E-box (consensus sequence of E-box is CANNTG) (Blackwell and Weintraub,
1990; Davis et al., 1987; Rhodes and Konieczny, 1989; Wright et al., 1989). MRFs cooperate
with E proteins (including HEB/HTF4, E2-2/ITF-2, and E12/E47) and the myocyte enhancer

18
factors (MEFs; e.g. MEF2) to regulate the expression of genes specific for myogenesis and to
promote myogenic differentiation (Blackwell and Weintraub, 1990; Blais et al., 2005;
Molkentin et al., 1995). Myogenesis can be negatively regulated by helix-loop-helix Id
proteins; Id dimerizes with E protein through its helix-loop-helix domain which then disrupts
the transcriptional activity of MRFs and inhibits myogenesis (Jen et al., 1992; Sun et al.,
1991).
Figure 1.3 Expression of MRFs during myoblast differentiation. Expression of Myf5 and MyoD preceding MRF4 and myogenin leads to myoblast differentiation. Myf5 levels regulate renewal of satellite cells. Myogenin expression regulates terminal differentiation of myoblasts to myotubes. (Modified from Zammit et al., 2006)
Forced expression of Myf5, MyoD, myogenin and MRF4 in fibroblasts can drive these cells
to commit to the myogenic lineage (Braun et al., 1989; Davis et al., 1987; Rhodes and
Konieczny, 1989; Wright et al., 1989). Myf5 and MyoD express early before myoblasts

19
undergo myogenesis and promote the determination of myoblasts whereas MRF4 and
myogenin take part in fusion during myoblast differentiation (Figure 1.3) (Ferri et al., 2009;
Pownall et al., 2002). MyoD has been reported to mediate the transition between quiescent
satellite cells to activated myogenic precursor cells during postnatal myogenesis (Figure 1.3)
(Sabourin et al., 1999). Levels of Myf5 protein correlate with cell fate decision of myoblasts;
such that wild-type myoblasts undergo differentiation whereas myoblasts with Myf5
heterozygous knock-out commit to self-renewal, which maintains a reservoir of
undifferentiated satellite cells (Gayraud-Morel et al., 2012) (Figure 1.3). In C2C12 myoblasts,
MRFs (Myf5, MyoD, myogenin and MRF4) can be detected in the cytosol of non-
differentiated myoblasts; these MRFs translocate into the nucleus to act as transcription
factors when myoblasts enter differentiation (Ferri et al., 2009). This cytoplasmic-nuclear
shuttling mechanism during myogenesis has been reported in NIH3T3 fibroblasts to be
orchestrated via I-mf (inhibitor of MyoD family) in that I-mf proteins retain MRFs in the
cytoplasm by masking the NLS signals of MRFs (Chen et al., 1996). I-mf is also employed in
the sclerotome portion (precursor of skeleton) of the somite to prevent muscle differentiation
(Chen et al., 1996).
Myf5:
During vertebrate embryonic myogenesis, Myf5 is the first expressed myogenic regulatory
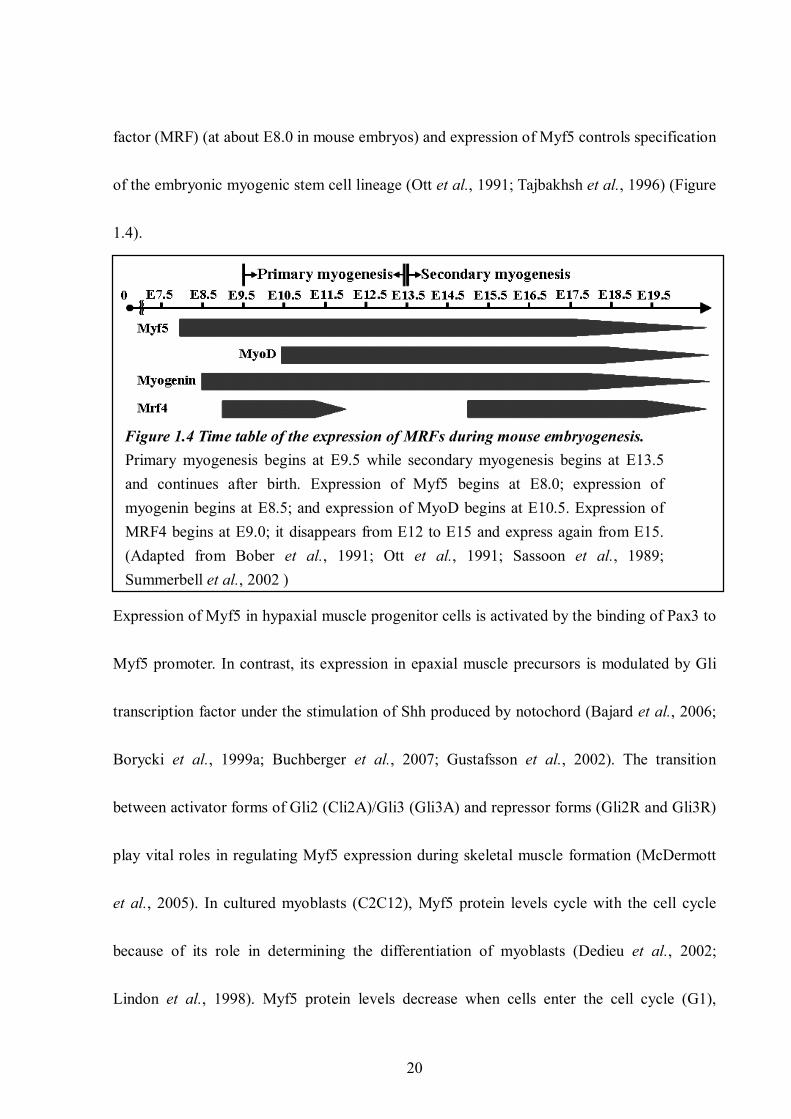
20
factor (MRF) (at about E8.0 in mouse embryos) and expression of Myf5 controls specification
of the embryonic myogenic stem cell lineage (Ott et al., 1991; Tajbakhsh et al., 1996) (Figure
1.4).
Figure 1.4 Time table of the expression of MRFs during mouse embryogenesis. Primary myogenesis begins at E9.5 while secondary myogenesis begins at E13.5 and continues after birth. Expression of Myf5 begins at E8.0; expression of myogenin begins at E8.5; and expression of MyoD begins at E10.5. Expression of MRF4 begins at E9.0; it disappears from E12 to E15 and express again from E15. (Adapted from Bober et al., 1991; Ott et al., 1991; Sassoon et al., 1989; Summerbell et al., 2002 )
Expression of Myf5 in hypaxial muscle progenitor cells is activated by the binding of Pax3 to
Myf5 promoter. In contrast, its expression in epaxial muscle precursors is modulated by Gli
transcription factor under the stimulation of Shh produced by notochord (Bajard et al., 2006;
Borycki et al., 1999a; Buchberger et al., 2007; Gustafsson et al., 2002). The transition
between activator forms of Gli2 (Cli2A)/Gli3 (Gli3A) and repressor forms (Gli2R and Gli3R)
play vital roles in regulating Myf5 expression during skeletal muscle formation (McDermott
et al., 2005). In cultured myoblasts (C2C12), Myf5 protein levels cycle with the cell cycle
because of its role in determining the differentiation of myoblasts (Dedieu et al., 2002;
Lindon et al., 1998). Myf5 protein levels decrease when cells enter the cell cycle (G1),

21
increase at G2 to levels comparable to cells at G0 and then decrease at G2/M transition
(Dedieu et al., 2002; Lindon et al., 1998). Cytosol-to-nucleus translocation of Myf5 during
differentiation may correlate with the regulation of Myf5 activity; ubiquitination and
proteosomoe degradation of nuclear Myf5 is triggered by phosphorylation of Myf5 by
CDK1/cyclinB (Doucet et al., 2005; Ferri et al., 2009).
MyoD:
MyoD which is critical for the development of epaxial (trunk) and hypaxial (limb and
branchial arch muscles) muscles during embryonic myogenesis is activated by both Myf5 and
Pax3 (Berkes and Tapscott, 2005; Tajbakhsh et al., 1997). It is first detected in mouse
embryos at E10.5 in myotomes and at E11.5 in limb buds (Sassoon et al., 1989) (Figure 1.4).
In C2C12 myoblasts, MyoD expression is up-regulated by codependent binding of Pax3/7 and
FoxO3 to the promoter element of MyoD during myoblast fusion (Dedieu et al., 2002; Hu et
al., 2008). MyoD up-regulates the expression of the muscle specific genes Desmin (Des),
Myosin Light Chains 1 and 2 (Myl1, Myl2), and embryonic myosin heavy chain (MyH3) by
binding coordinately with MEF2 (myocyte enhancer factor 2) to the promoter regions of these
genes via a feed-forward signalling in which MyoD promotes expression and activates p38
mitogen-activated protein kinase (MAPK), which in turn promotes binding of MyoD and
MEF2 to promoters of muscle specific genes (Figure 1.5) (Penn et al., 2004).

22
Figure 1.5 MyoD generates feed-forward signalling to regulate expression of muscle specific genes during myogenesis.
MyoD/MEF2 activity in non-differentiated C2C12 myoblasts is inhibited by the
transcriptional repressor prohibitin 2 (PHB2); this inhibition is released when Akt binds to
PHB2 during myoblast differentiation (Sun et al., 2004). MyoD-dependent transcription of
genes with E-boxes during C2C12 myoblasts differentiation is assisted by binding of
transcriptional coactivator P300/BPC and histone acetyltransferase PCAF (Puri et al., 1997;
Yuan et al., 1996). Studies on myoD-/- primary myoblasts show that MyoD induced expression
of microRNA-1 (miR-1)/miR-206 down-regulates Pax3 and this causes down-regulation of
anti-apoptotic factors Bcl-2 and Bcl-xL, leading to elevated apoptosis in myoblasts
undergoing differentiation (Hirai et al., 2010).
Myogenin:
Myogenin becomes expressed in myotomes at E8.5 (two days prior to MyoD in myotomes
and 12 hours later than Myf5), and is subsequently expressed in limb buds at E11.5 (Ott et al.,

23
1991; Sassoon et al., 1989) (Figure 1.4). Expression of myogenin in embryos or in myoblasts
during myogenesis is triggered by cooperative binding of MyoD and calcineurin (a
calcium/calmodulin-dependent protein phosphatase)-NFAT3c (nuclear factor of activated T
cells isoform 3c) to the promoter region of myogenin (Armand et al., 2008). Upon occupying
the promoter region of myogenin, MyoD associates with histone deacetylase 1 (HDAC1) to
repress the expression of myogenin in proliferating C2C12 myoblasts and works with PCAF
(histone acetyltransferase) to up-regulate myogenin expression during C2C12 myoblast
differentiation (Mal and Harter, 2003). Unlike myf5-/- and myoD-/- mice, myogenin null mice
die neonatally; these mice exhibit a severe reduction of myotubes and extensive loss of
skeletal muscle fibres although they have abundant mononucleate myogenic cells comparable
to the residual myoblast population in wt counterparts (Hasty et al., 1993; Nabeshima et al.,
1993). This suggests that myogenin plays a key role in the fusion stage of embryonic skeletal
muscle differentiation (Hasty et al., 1993; Nabeshima et al., 1993). During C2C12 myoblast
differentiation, myogenin expression precedes the MyoD–induced expression of Cyclin-
dependent kinase inhibitors (p21CIP1 and p57KIP2) that promote cell cycle withdrawal, a
process required for myogenic differentiation (Andres and Walsh, 1996; Busanello et al., 2012;
Guo et al., 1995; Halevy et al., 1995; Zhang et al., 1999).

24
MRF4:
MRF4 becomes expressed at E9.0 in somites and the expression of MRF4 is undetectable
between E12-15 in mouse embryos (Bober et al., 1991; Kassar-Duchossoy et al., 2004;
Summerbell et al., 2002) (Figure 1.4). MRF4 has not been identified in the hypaxial muscles
of mouse embryos (Bober et al., 1991). The levels of MRF4 are high in differentiated
myofibers and also in adult skeletal muscles compared to the other three MRFs (MyoD, Myf5
and myogenin) (Hinterberger et al., 1991; Rhodes and Konieczny, 1989; Sambasivan et al.,
2013). In myf5-/- mouse embryos, MRF4 expression precedes and is required for the
expression of MyoD (Kassar-Duchossoy et al., 2004). Expression of MRF4 in mfy5:myoD
double null mice is required for skeletal muscle formation as myf5 null mice with no MRF4
have no myogenesis, suggesting its role in determination of myogenic lineage (Kassar-
Duchossoy et al., 2004). Expression of MRF4 can be regulated by MyoD, Myf5 and
myogenin; these MRFs recognize an E-box in the MRF4 promoter region and work
synergistically with MEF2 to activate MRF4 transcription (Naidu et al., 1995).
1.3. Dystrophin-glycoprotein complex
The dystrophin-glycoprotein complex (DGC) is a transmembrane structure in the sarcolemma
(plasma membrane of skeletal muscles) that links the extracellular matrix (ECM) through
dystroglycan and actin cytoskeleton via dystrophin (Ervasti and Campbell, 1993). This pivotal

25
positioning of the DGC enables it to play roles both in sarcolemmal stabilization and in
signalling modulation, such as signals from Neuronal Nitric Oxide Synthase (nNOS) and the
PI3K/AKT pathway (Glass, 2005; Judge et al., 2006; Langenbach and Rando, 2002;
Rybakova et al., 2000). Dystrophin, the largest gene in the mammalian genome, is encoded by
14-Kb (kilo-base) cDNA spanning 2.4 Mb (mega-base) of chromosome Xp21 and consisting
of 79 exons (Blake et al., 2002; Lapidos et al., 2004). The N-terminus of dystrophin protein
consists of F-actin binding site, followed by a rod domain of 24 spectrin-like repeats, a
cysteine-rich domain and the C-terminal domain (Blake et al., 2002) (Figure 1.6 A). Other
components of the DGC include the glycoproteins dystroglycan, sarcoglycan and sarcospan
(Figure 1.6 B) (Lovering et al., 2005). Dystrophin associates with β-subunit of dystroglycan
through the carboxyl terminal WW domain (a protein-protein interaction motif containing two
conserved tryptophan residues) (Lovering et al., 2005; Suzuki et al., 1992).

26
Figure 1.6 Dystrophin-glycoprotein complex (DGC) in sarcolemma. (A) The dystrophin and utrophin proteins share common features, including N-terminal actin binding domain, spectrin-like rod repeats, cysteine-rich domain and C-terminal coiled-coil (CC) domain. The cysteine-rich regions contain WW domains, EF domains and ZZ domains all of which are able to bind to β-dystroglycan (DG). (B) DGC links cytoskeleton F-actin within cells and laminin of the extracellular matrix (ECM) to provide integrity of sarcolemma. (C) Without dystrophin, β-dystroglycan is subject to tyrosine phosphorylation at position 892. Phosphorylated β-dystroglycan undergoes ubiquitination and degradation, accompanied by the elevation of caveolin-3 (Cav3) levels. SYN: syntrophin; DFB: dystrophin family binding site (Figure A is adapted from Blake et al., 2002; Bonuccelli et al., 2003; Ilsley et al., 2001)
Dystrophin:
The expression of dystrophin in mouse embryos begins at E9.0 in the heart and subsequently
in the myotome at E9.5 (Houzelstein et al., 1992). In zebrafish, absence of dystrophin leads to

27
the detachment of muscle fibres and apoptosis of the detached muscle fibres, an indication of
its role in stabilizing the myotendinous junctions (Bassett et al., 2003). Interaction between
dystrophin and β-dystroglycan is mediated by the binding of WW-domain in dystrophin to
two PPXY motifs (WW-binding domain) in β-dystroglycan; phosphorylation of the tyrosine
residue in the WW-binding domain of dystrophin abrogates the interaction between
dystrophin and β-dystroglycan (Ilsley et al., 2001; Yatsenko et al., 2007) (Figure 1.6 B and C).
Cav-3 also interacts with β-dystroglycan through the WW domain (Sotgia et al., 2000) (refer
to section 1.6 for Cav-3). The stability of dystrophin-glycoprotein complex is regulated by the
phosphorylation status of WW-binding domain in β-dystroglycan (Sotgia et al., 2001). In the
presence of dystrophin, the phosphorylation site on β-dystroglycan is covered by dystrophin
and the whole complex remains stable whereas in the absence of dystrophin, Src-family
tyrosine kinases phosphorylate β-dystroglycan and induce ubiquitination and degradation of
β-dystroglycan through proteasome (Bonuccelli et al., 2003; Ilsley et al., 2001; Sotgia et al.,
2001). The consequences of β-dystroglycan degradation are the disruption of DGC complex
(Bonuccelli et al., 2003) (Figure 1.6 B and C).
Utrophin:
Utrophin, an autosomal homologue of dystrophin, is localized to human chromosome 6q21
and encoded by a cDNA of 13 kb (Love et al., 1989). Utrophin protein is very similar in

28
structure to dystrophin, consisting of an N-terminal actin binding domain, central rod-like
repeats and a C-terminal coiled-coil domain; there is an 80% sequence homology between
dystrophin and utrophin in the N-terminal actin binding domain and C-terminus region (Blake
et al., 2002; Tinsley et al., 1992) (Figure 1.6 A). The greatest variation between utrophin and
dystrophin lies in the rod domain which in utrophin lacks the domains corresponding to the
actin-binding domain (spectrin-like repeats 15 and 19) in dystrophin (Amann et al., 1999;
Pearce et al., 1993). During mouse embryonic development, utrophin is first identified in the
neural groove at E8.5 and is later expressed in most tissues of the embryos, including brain,
smooth muscle and both skeletal and cardiac muscles (Schofield et al., 1993). Utrophin
localises around the sarcolemma in embryonic skeletal muscles (Schofield et al., 1993). In
adult skeletal muscles, utrophin is largely absent from the sarcolemma (except for in
regenerating fibres) becoming restricted exclusively to the neuromuscular junction in the
sarcolemma and to the myotendinous junction, blood vessels, brain and peripheral nerves
found between and within muscle fibres (Khurana et al., 1990; Khurana et al., 1991;
Ohlendieck et al., 1991; Pons et al., 1991). Like dystrophin, utrophin also interacts with the β-
dystroglycan complex in the neuromuscular junction and sarcolemma (Matsumura et al.,
1992). Expression of utrophin proteins is upregulated in regenerating muscle fibers of both
non-dystrophic and dystrophic subjects [Duchenne muscular dystrophy (DMD) and the mouse
model mdx] (Refer to section 1.4 for muscular dystrophy) (Galvagni et al., 2002; Helliwell et

29
al., 1992; Khurana et al., 1991; Rigoletto et al., 1995; Weir et al., 2004). The level of utrophin
in DMD can be negatively correlated with the clinical severity of the disease (i.e. age at
becoming wheelchair-bound), suggesting a possible role for utrophin in compensation for the
lack of dystrophin (Kleopa et al., 2006). Mice lacking both dystrophin and utrophin (dko mice)
have muscular dystrophy phenotype, including reduced body weight, delayed bone healing,
kyphosis (curvature of the spine, causing hunchback phenotype), slack posture, weak hind
limbs, laboured breathing, fibrosis, cardiomyopathy and premature death (by 20 weeks of age)
(Deconinck et al., 1997; Grady et al., 1997; Janssen et al., 2005).
1.4. Duchenne Muscular Dystrophy (DMD), Limb Girdle Muscular Dystrophy type 1C
(LGMD-1C) and their animal models
Dysfunction of components of the trans-sarcolemmal DGC (Figure 1.6) results in a series of
heritable Muscular Dystrophies (MD), including Becker Muscular Dystrophy (BMD;
Dystrophin rod truncation mutation), sarcoglycanopathies (Limb Girdle Muscular Dystrophy
type 2; LGMD 2A, 2B, 2C and 2D) and the severest (and commonest) form, Duchenne
Muscular Dystrophy (DMD) (Lovering et al., 2005). DMD is caused by the complete lack of
function of the dystrophin protein (stop codon mutation) and is characterised by progressive
loss of function of the entire skeletal musculature (Lovering et al., 2005). The disruption of
skeletal muscle function in DMD begins early from about four years of age; patients suffer

30
from progressive muscle weakness leading to wheelchair confinement (Parker et al., 2005;
Sanyal et al., 1978). A recent study on mouse model of DMD, the mdx mice, suggests an
embryonic origin of this disease (Refer to section 1.4.1 for animal models of DMD) (Merrick
et al., 2009). The muscles of hips, shoulders, legs and the heart are affected in DMD patients
(Brooke et al., 1989). Patients also suffer from scoliosis (lateral curvature of the spine) caused
by muscle weakness (Brooke et al., 1989). Eventually respiratory failure and/or
cardiomyopathy cause death of DMD patients in their adolescence (Parker et al., 2005). A
majority of DMD patients die of complications of respiratory muscle failure; however, 98% of
DMD patients who receive ventilation support develop overt cardiomyopathy by 18 years of
age which progresses and causes the death of 40% of patients between 10 to 30 years of age
(Gnecchi-Ruscone et al., 1999; Melacini et al., 1996; Parker et al., 2005). The skeletal
muscles of DMD and mdx mice have elevated levels of caveolin-3 (Cav-3), suggesting the
contribution of Cav-3 to the pathology of the disease (Refer to section 1.4.1 and 1.6 for
further discussion of Cav-3) (Merrick et al., 2009; Repetto et al., 1999). LGMD-1C (limb
girdle muscular dystrophy type 1C), an early onset skeletal muscle dystrophy affecting
hypaxial muscles particularly in the limb and limb girdle, is caused by loss of function of
Cav-3 (Refer to section 1.6 for Cav-3) (Minetti et al., 2002; Minetti et al., 1998). LGMD-1C
patients show muscle pain, weakness of upper and lower limb muscles, hypertrophy, and
elevated levels of serum creatine kinase (Aboumousa et al., 2008). Unlike DMD, LGMD-1C

31
patients show no cardiomyopathy although cardiomyopathy is reported in some Cav-3
deficient mice (2-4 months of age), including the mutant used in this study (Aboumousa et al.,
2008; Merrick et al., 2009; Woodman et al., 2002).
1.4.1. Animal models for DMD
X chromosome-linked muscular dystrophy (Mdx) in mice:
The mdx mouse, a spontaneously originating X chromosome-linked mutant, is a murine
model of DMD and was found in a screening program for discovering enzymatic activity
mutants of glycolysis (Bulfield et al., 1984). The mdx mouse has a nonsense point mutation in
exon 23 of dystrophin gene that creates a premature stop codon in the dystrophin transcript
(Ryder-Cook et al., 1988; Sicinski et al., 1989). mdx mice show pathologies similar to DMD,
particularly in the diaphragm muscles and juvenile growth phase (Stedman et al., 1991).
Pathology includes severe fibrosis, fatty infiltration, reduced muscle strength and fiber length
(Stedman et al., 1991; Torres and Duchen, 1987). The muscles of mdx mice of more than 3
weeks old have more number of centrally nucleated muscle fibres in limb and diaphragm
muscles compared to non-dystrophic counterparts, suggesting muscle regeneration of mdx
mice (Niebrqj-Dobosz et al., 1997; Tanabe et al., 1986; Torres and Duchen, 1987). In addition,
the number of small-sized fibres increases in mdx diaphragm and limb muscles compared to
non-dystrophic mice, suggesting impairment of the regenerative capacity in mdx mice

32
(Niebrqj-Dobosz et al., 1997; Tanabe et al., 1986; Torres and Duchen, 1987). Detail analysis
of the skeletal muscle function on mdx mice, such as locomotion and muscle strength (specific
force and absolute power output) tests, shows significant muscle function impairment
compared to age-matched non-dystrophic mice (Lynch et al., 2001; Rafael et al., 2000).
Impairment of muscle function has also been shown by identifying the branched fibres in
aged (6-7 months) mdx EDL muscles; these muscles have reduced specific force after
lengthening contraction (Refer to section 1.5 for mechanical properties of muscle fibres)
(Chan et al., 2007).
Embryonic origin of muscular dystrophy:
Recently, it has been shown that pathology of the mdx mouse originates early in embryos
(Merrick et al., 2009). Pax7-positive cell attrition is evident in the proximal limbs of both mdx
and mdxcav3+/- mouse embryos at E15.5 to E17.5 (Merrick et al., 2009). Myf-5 positive
myoblasts isolated from E11.5-E17.5 mdx embryos exhibit elevated rates of apoptosis and
proliferation compared to age-matched non-dystrophic embryos (Merrick et al., 2009).
Muscle fibre splitting is observed in both mdx embryos and adult mdx skeletal muscles (Chan
et al., 2007; Head, 2010; Merrick et al., 2009). The skeletal muscle fibres of mdx embryos
show misalignment (Merrick et al., 2009). In addition, the ratio of fast myosin heavy chain
(FMyHC) in mdx mice increases from E15.5 to E17.5 compared to non-dystrophic mouse

33
(Merrick et al., 2009). mdx mouse embryos at E13.5 to E17.5 also show dilation of the
ventricular wall and abnormality in atrial trabecular formation, suggesting the development of
cardiomyopathy in mdx embryos (Merrick et al., 2009).
Canine X-linked Muscular Dystrophy (CXMD):
Canine X-linked Muscular Dystrophy (CXMD) is the result of a point mutation in intron 6 of
the dystrophin gene, which causes skipping of exon 7, resulting in a premature termination
codon (Sharp et al., 1992). Like DMD and mdx, CXMD is characterised by elevated serum
creatine kinase levels, progressive muscle degeneration and necrosis, fibrosis and fatty
infiltration; additionally the dog has features not found in mdx such as distortion of the spinal
column and thoracic wall (Cooper et al., 1988; Valentine et al., 1990; Valentine et al., 1988).
Histopathologically, CXMD shows cytoplasmic disorganization, fiber size variation,
alteration of fibre types (similar to DMD and mdx, regenerated muscle fibres of CXMD have
predominance of type IIC fibres), severe fibrosis and fat infiltration (Valentine et al., 1990).
Despite the pathological similarities between CXMD and DMD, this canine model exhibits
variations in severity of clinical signs between different litters and it is expensive to raise this
canine model (Cooper et al., 1988; Nakamura and Takeda, 2011).
34
1.4.2. Mouse models of LGMD-1C
Cav-3 deficient (cav-3-/-) mice exhibit pathologies similar to LGMD-1C, including skeletal
muscle degeneration and T-tubule defects (Galbiati et al., 2001a; Hagiwara et al., 2000;
Herrmann et al., 2000; Minetti et al., 2002). Isolated Myf-5 positive embryonic myoblasts
from E13.5 cav3-/- mouse embryos exhibit elevated rates of apoptosis and proliferation
compared to age-matched wt embryos (Merrick et al., 2009). Adult cav-3-/- mice (5-30 weeks
of age) have degeneration-regeneration cycles in their diaphragm and skeletal muscles
(Hagiwara et al., 2000). Cav-3 null mice also show embryonic pathology comprising attrition
of Pax7-positive cells (E15.5 to E17.5) and cardiomyopathy (dilation of the ventricular wall
and abnormalities in atrial trabecular formation from E13.5 to E17.5) (Merrick et al., 2009).
In contrast to mdx mice, however, the cav3-/- mouse embryos does not exhibit muscle fibre
misalignment and splitting (refer to section 1.4.1 for mdx model) (Merrick et al., 2009). Nor
does it have defects in movement and growth from 8-30 weeks (Hagiwara et al., 2000). In
addition, protein levels of FMyHC in cav3-/- mouse embryos decrease from E15.5 to E17.5
which is the opposite to that seen in mdx mice at E15.5-E17.5 where FMyHC is elevated
(Merrick et al., 2009).
1.5. The mechanical properties of dystrophic myoblasts and muscle fibres
The muscle functions of mdx mice have been studied in various ways. The grip strength can

35
be easily measured and has been used to assess the muscle strength of mdx mice which show
force impairment of their forelimbs (van Putten et al., 2012). The normalised isometric tetanic
force and output power of mdx hindlimb muscles (EDL and soleus) are in average 15-30%
and 33% less than non-dystrophic limb muscles respectively (Chan et al., 2007; Lynch et al.,
2001). The specific tetanic force of isolated diaphragm strips from mdx mice (9-12 weeks) is
40% less than the age-matched controls (Stevens and Faulkner, 2000).
In addition to the force measurements by grip test or electrical stimulation, the atomic force
microscopy (AFM) has been used to measure the local mechanical properties (e.g. stiffness)
of myoblasts and myotubes (Collinsworth et al., 2002). For example, the cortical stiffness of
differentiating C2C12 myoblasts increases 4 fold from undifferentiated myoblasts to
differentiated myotubes (Collinsworth et al., 2002). It has also been used with a glass stylus to
measure the stiffness of mdx myotubes which is only 1/4 that of non-dystrophic myotubes
(Pasternak et al., 1995), suggesting a potential role for dystrophin in response to mechanical
stress in myotubes. In fibroblasts, response to mechanical stress is thought to be mediated
through actin and microtubule remodelling (Heidemann et al., 1999). It has been reported that
the change of cortical stiffness of muscle cells and fibres involves actin and microtubule
remodelling (Collinsworth et al., 2002; Hofmann et al., 1997; Khairallah et al., 2012). In
addition, impairment of microtubule remodelling in the skeletal muscles of mdx results in
production of reactive oxygen species (ROS) after stretch, leading to increased influx of Ca2+

36
(Claflin and Brooks, 2008; Khairallah et al., 2012; Suchyna and Sachs, 2007). Hindlimb
muscles isolated from mdx mice show the longitudinal separation of muscle fibres after
isometric tetanic contractions which is not observed in non-dystrophic controls, suggesting
reduced coupling between intracellular cytoskeleton and extracellular matrix in mdx muscles
(Claflin and Brooks, 2008). This stress-induced muscle fibre separation is correlated to the
elevated intracellular Ca2+ concentration (Claflin and Brooks, 2008; Suchyna and Sachs,
2007).
1.6. Caveolins and caveolae mediated signalling
Caveolae are small vesicular invaginations of plasma membrane with diameters of 50-100 nm
(Severs, 1988). They play roles in transporting lipids (e.g. cholesterol and sphingolipids),
endocytosis and concentrating signalling transducers, thus regulating signal transduction
pathways (Kim and Bertics, 2002; Okamoto et al., 1998; Schlegel et al., 2000; Singh et al.,
2003). The principle components of caveolae are caveolins whose molecular weights are 17-
24 kDa (Glenney and Soppet, 1992). Three members of the caveolin protein family have been
recognized; caveolin-1 (Cav-1), caveolin-2 (Cav-2) and caveolin-3 (Cav-3) (Couet et al.,
2001). Two isoforms of caveolin-1 (Cav-1α and Cav-1β) are derived from distinct
transcription initiation (Kogo and Fujimoto, 2000). Cav-1β lacks the first 31 amino acid
residues of the N-terminus which is present in Cav-1α (Kogo and Fujimoto, 2000; Scherer et

37
al., 1995). Cav-1α can form homo-oligomers and hetero-oligomers with Cav-2 or Cav-3
through the scaffolding domain (amino acid residue 61-101) (Sargiacomo et al., 1995; Scherer
et al., 1997; Volonte et al., 2008). Cav-1α and Cav-2 express in many types of cells, mainly
adipocytes, fibroblasts and endothelial cells while Cav-3 is predominantly found in different
types of muscle cells; skeletal, cardiac and smooth muscle cells (Scherer et al., 1997; Song et
al., 1996). Levels of Cav-3 protein affect myotube formation such that down-regulation of
Cav-3 inhibits both activation of focal adhesion kinase (FAK) and myotube formation
(Galbiati et al., 1999; Quach et al., 2009; Volonte et al., 2003). In zebrafish, knocking down
Cav-3 expression shows aberrant myofibril organization and impaired myoblast fusion (Nixon
et al., 2005). This is consistent with the fact that expression of Cav-3 is linked to two types of
muscular dystrophy, DMD and LGMD-1C (Refer to section 1.4 for muscular dystrophy).
In addition to roles in regulating signalling pathways and endocytosis, caveolins also
participate in the regulation of cell response to mechanical stress (refer to section 1.5 for
introduction for mechanical properties of muscles). Phorbol ester induced contraction of
vascular smooth muscle is mediated through binding between Cav-1α scaffold domain with
protein kinase C (PKC), which in turn activates downstream ERK1/2 signalling pathway (Je
et al., 2004). Activation of ERK1/2 pathway leads to the phosphorylation of actin-binding
protein caldesmon (CaD) which releases from actin and leave actin for interaction with
myosin (Je et al., 2004). Treating myoblasts with hypotonic solution or stretch causes

38
flattening of caveolae and this has been shown to be mediated by Cav-3 redistribution on the
plasma membrane (Gervasio et al., 2011; Sinha et al., 2011). Stress-induced deformation of
caveolae leads to Src activation (Gervasio et al., 2011). In skeletal muscles, Cav-3 has been
demonstrated, via the WW domain, to bind to the PPXY motif in the c-terminal tail of β-
dystroglycan that also recognizes and binds to dystrophin, suggesting a competition between
Cav-3 and dystrophin for β-dystroglycan (Jung et al., 1995; Sotgia et al., 2000).
Misregulation of caveolin-1 has been shown to result in oncogenic transformation, but this
role is cell type specific; Cav-1α protein levels increase in osteosarcoma but decrease in
rhabdomyosarcoma (Sainz-Jaspeado et al., 2011). Transformed NIH3T3 fibroblasts show a
reduction of Cav-1α protein levels compared to the normal NIH3T3 fibroblasts (Koleske et al.,
1995); on the other hand when Cav-1α is introduced into human breast cancer cells which
have reduced level of Cav-1, growth of these tumor cells is inhibited (Lee et al., 1998). This
implies Cav-1α can act as tumor suppressor. Missense mutations of Cav-1α (e.g. P132L,
Y148S and Y148H) that resemble Cav-1 null mutation have been found in human breast
cancer, especially those with estrogen receptor α-positive breast cancer (Li et al., 2006); loss
of active Cav-1α in these breast cancer cells promotes their metastasis to lung in mouse
(Williams et al., 2004). Overexpression of Cav-1α in CHO (Chinese hamster ovary) cells and
NIH3T3 fibroblasts leads to cell cycle arrest of cells in G0 and G1 phases which is mediated
via the p53 pathway leading to repression of cyclin D1 gene transcription (Galbiati et al.,

39
2001b; Hulit et al., 2000). In addition, aortic smooth muscle cells isolated from Cav-1α
knockout mice show elevated proliferation and migration compared to their wt counterparts
(Hassan et al., 2006). This implies that Cav-1α, when over-expressed in fibroblasts, acts as a
suppressor of proliferation in fibroblasts through regulating the cell cycle (Galbiati et al.,
2001b; Hulit et al., 2000; Volonte et al., 2002).
1.7. Growth factors and myogenesis
Expression of insulin-like growth factor-2 (IGF-2) and leukemia inhibitory factor (LIF)
increases in mdx muscles, suggesting that IGF-2 and LIF may play a role in muscle
regeneration in mdx mice (Porter et al., 2003; Reardon et al., 2000; Tkatchenko et al., 2000).
IGF-2 acts as a survival factor for dystrophin-deficient myoblasts and plays key roles in the
differentiation and survival pathways of skeletal muscles, particularly in embryos (DeChiara
et al., 1990; Florini et al., 1991; Merrick et al., 2007; Prelle et al., 2000; Smith et al., 1995).
Insulin-like growth factor-1 (IGF-1) is primarily a mitogen for the postnatal growth of mice
(Baker et al., 1993). Leukemia inhibitory factor (LIF) has been reported to participate in the
regeneration of rat muscle fibres after injury (Kami et al., 2000). Expression of LIF also
increases immediately after exercise in human skeletal muscles and its level then decreases
along with time (Broholm et al., 2008).

40
1.7.1. Insulin-Like Growth Factors (IGF-1, IGF-2)
After binding to type I insulin-like growth factor receptor (IGF1R), IGFs (IGF-1 and IGF-2)
signalling is passed down through the PI3K signalling pathway which exerts its effect by
promoting the phosphorylation of Akt/protein kinase B (PKB), a serine-threonine kinase and
therefore promotes myogenesis (Coolican et al., 1997; Jiang et al., 1999; Jiang et al., 1998;
Kaliman et al., 1998). The known downstream targets of PI3K/Akt signalling cascades
include FOXO (transcription factor forkhead box O), mTOR and GSK-3β (Glycogen synthase
kinase-3β) (Puente et al., 2006; Shiojima and Walsh, 2006) (Figure 1.7).
Figure 1.7 Signalling cascades downstream the IGF1R/PI3K/AKT. Whereas activation of mTOR by AKT promotes signals related to cell proliferation; phosphorylation of GSK3β inhibits its negative role on the target genes. FOXO, whose target genes participate in regulation of cell death is inactivated when phosphorylated by AKT. (Modified from Shiojima and Walsh, 2006) (Shiojima and Walsh, 2006)
41
Differentiation of myoblasts is stimulated in the presence of IGF-1 when the negative role of
GSK-3β is inhibited through phosphorylation by Akt/PKB which releases the inhibition of
GSK-3β on NFAT and thus contributes to an increase in muscle size (van der Velden et al.,
2006; Vyas et al., 2002) (Figure 1.7). mTOR (mammalian target of rampmycin) signalling
regulates muscle fibre hypertrophy by phosphorylation and activation of downstream
ribosomal p70S6K and PHAS-1/4E-BP1; both genes are crucial for protein synthesis (Bodine et
al., 2001; Pallafacchina et al., 2002). Moreover, myogenic differentiation can also be
promoted through mTOR mediated IGF-2 expression during myogenesis (Erbay and Chen,
2001; Erbay et al., 2003; Shu et al., 2002; Yoon and Chen, 2008) (Figure 1.7).
Phosphorylation of FOXO by Akt/PKB disturbs its role in prompting p27kip1 expression;
binding of p27kip1 to cyclin E/Cdk2 complex causes G0/G1 arrest and induces expression of
BIM, leading to programmed cell death (Burgering and Medema, 2003; Gilley et al., 2003).
Phosphorylated FOXO is exported from the nucleus and binds to 14-3-3 (Burgering and
Medema, 2003). Phosphorylation status of FOXO also modulates myoblast differentiation in
that FOXO1 induces degradation of Raptor, the component of mTOR complex 1 (mTORC1);
this indicates that FOXO1 may regulate myogenesis by down-regulating IGF-2 (Hribal et al.,
2003; Wu et al., 2008) (Figure 1.7).
In vitro administration of IGF-1 to L6E9 myoblasts demonstrates that IGF-1 plays a role in
both proliferation and differentiation of myoblasts (Engert et al., 1996; Kaliman et al., 1998).
42
The mitogenic signalling from IGF-1 is mediated via the MAP kinase pathway and precedes
the myogenic signalling mediated via the phophatidylinositol 3-kinase (PI3K) signalling
pathway (Coolican et al., 1997; Engert et al., 1996; Kaliman et al., 1998). Muscle-specific
expression of IGF-1 induces hypertrophy of mdx skeletal muscles (Barton et al., 2002).
Systematic administration of IGF-1 in mdx mice (1 mg/kg/day for 8 weeks) improves the
contractile function of mdx diaphragm muscles by 30% (Gregorevic et al., 2002; Schertzer et
al., 2006). IGF-2 is a survival factor for dystrophin-deficient myoblasts; treating mdx mice or
cultured myoblasts derived from mdx mice with IGF-2 (1-20 ng/mL) reduces apoptosis of
dystrophin-deficient muscle stem cells (Smith et al., 1995). Apoptosis is also significantly
reduced in a transgenic mouse model mdxBlast which overexpresses IGF-2; overexpression of
IGF-2 ameliorates skeletal muscle programmed cell death of these dystrophin-deficient mice
(Smith et al., 2000).
IGF-2 is up-regulated during myogenesis induced by serum withdrawal via an auto-regulation
loop involving IGF binding protein-5 (IGFBP5) and the mTOR signalling pathway (Figure
1.8) (Erbay et al., 2003; Florini et al., 1991; Ren et al., 2008). Myoblasts under low mitogen
have elevated levels of IGFBP5 protein which help concentrate IGF-2 to some threshold to
trigger the signalling mediated via IGF1R/PI3K/AKT/mTOR pathway, leading to the
expression of IGF-2 and myogenesis (Ren et al., 2008) (Figure 1.8). It has been reported that
IGF-2 (290 ng/ml) administration in rat biceps after myotoxin damage delays the early
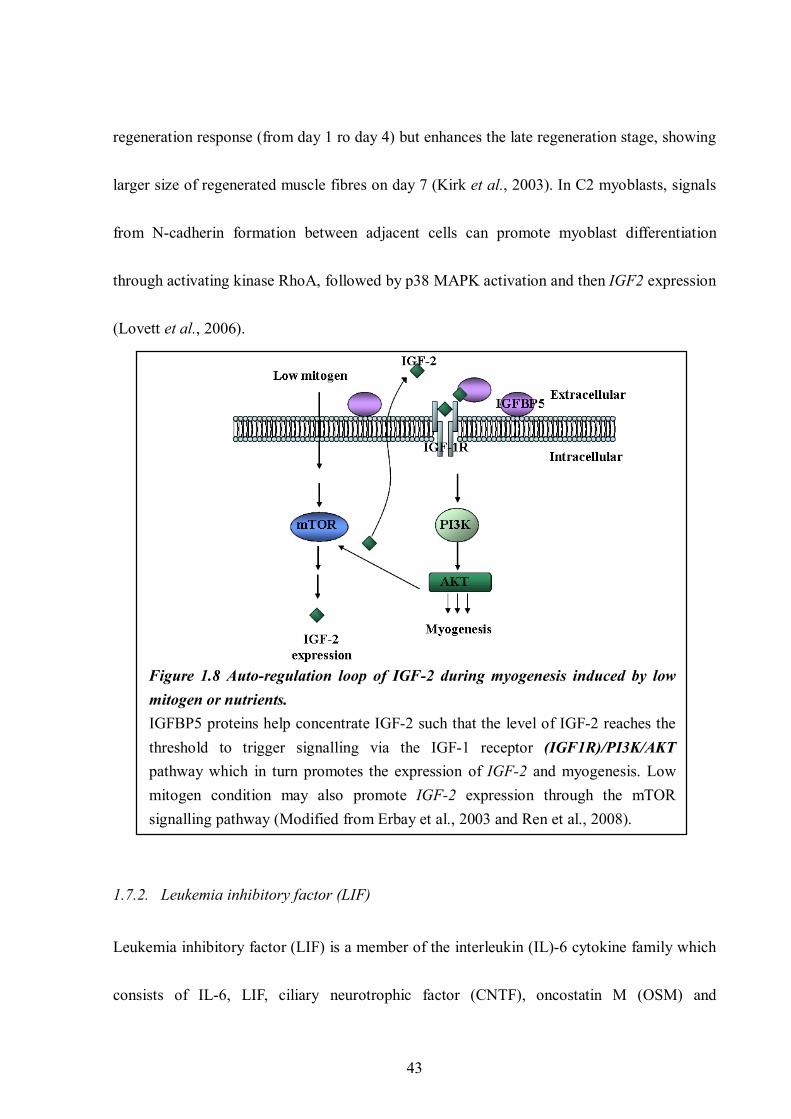
43
regeneration response (from day 1 ro day 4) but enhances the late regeneration stage, showing
larger size of regenerated muscle fibres on day 7 (Kirk et al., 2003). In C2 myoblasts, signals
from N-cadherin formation between adjacent cells can promote myoblast differentiation
through activating kinase RhoA, followed by p38 MAPK activation and then IGF2 expression
(Lovett et al., 2006).
Figure 1.8 Auto-regulation loop of IGF-2 during myogenesis induced by low mitogen or nutrients. IGFBP5 proteins help concentrate IGF-2 such that the level of IGF-2 reaches the threshold to trigger signalling via the IGF-1 receptor (IGF1R)/PI3K/AKT pathway which in turn promotes the expression of IGF-2 and myogenesis. Low mitogen condition may also promote IGF-2 expression through the mTOR signalling pathway (Modified from Erbay et al., 2003 and Ren et al., 2008).
1.7.2. Leukemia inhibitory factor (LIF)
Leukemia inhibitory factor (LIF) is a member of the interleukin (IL)-6 cytokine family which
consists of IL-6, LIF, ciliary neurotrophic factor (CNTF), oncostatin M (OSM) and

44
cardiotrophin-1 (CT-1); they share gp130 as a common receptor subunit (Heinrich et al.,
1998). These cytokines participate in various cellular processes, including gene regulation,
proliferation and differentiation (Heinrich et al., 1998). It has been reported that continuous
delivery of LIF (7 unit/μl for 7 days) in mdx mice via a catheter increases not only fibre size
but also number of fibres in regenerating areas (Kurek et al., 1996a). In vivo analysis shows
elevated LIF and IL-6 mRNA expression in mdx compared to wt mice in non-regenerating
muscles; it also shows increased mRNA production of LIF and IL-6 in regenerating skeletal
muscles after injury (Kurek et al., 1996b), suggesting participation of LIF in muscle
regeneration. Involvement of LIF in muscle regeneration following injury is reinforced by
data showing that LIF receptor (LIFR) mRNA is expressed in the nucleus of muscle precursor
cells after muscle injury but is absent in myotubes (myonuclei) (Kami et al., 2000). In LIF-/-
mouse, the size of regenerating muscle is only half of that in wt mice (Kurek et al., 1997).
Though smaller body weights are found in LIF-/- mice than in wt mice, they appear normal in
most respects with the exceptions that LIF-/- mice have reduced muscle regeneration after
crush-injury and that female LIF-/- mice are sterile (Kurek et al., 1997; Stewart et al., 1992).
Sterility of the female LIF-/- mice is due to the failure of blastocyst implantation and
decidualisation which are attributed to the lack of maternal LIF signalling responses (Chen et
al., 2000a; Mohamet et al., 2009; Stewart et al., 1992).
Research on C2C12 myoblasts and isolated satellite cells indicates that the effect LIF exerts

45
on muscle regeneration is mainly through the promotion of cell proliferation (Spangenburg
and Booth, 2002; Vakakis et al., 1995; Wang et al., 2008; White et al., 2001). The effect of
LIF during muscle regeneration may be mediated through the ERK and the signal transducer
and activator transcription 3 (STAT3) signalling pathways whose phosphorylation coincides
with myoblast proliferation (Jo et al., 2005; Kami and Senba, 2002) (Figure 1.9).
Figure 1.9 Signalling pathway mediated by LIF stimulation that promotes myogenesis. LIF exerts its effect through the JAK/STAT3 as well as the ERK signalling pathway. This pathway inhibits the expression of CDO/BOC and STAT3 can associate with MyoD. CDO/BOC and MyoD form a positive feedback loop to promote myogenesis. (Adapted from Jo et al., 2005; Kami and Senba, 2002; Yang et al., 2009; Kang et al., 2002; Snyder et al., 2008)
Function of the STAT3 signalling pathway in muscle differentiation may be regulated via the
interaction of STAT3 and MyoD since STAT3 has been reported to bind to MyoD (Yang et al.,
2009) (Figure 1.9). Furthermore, regulation of myoblast proliferation and differentiation can
be mediated by direct targeting of STAT3 to CDO (CAM-related/downregulated by
oncogenes; member of Ig/fibronectin type III repeat subfamily) and BOC (brother of CDO;

46
member of Ig/fibronectin type III repeat subfamily), which form complexes with N- and M-
cadherins during myoblast differentiation and promote myogenesis via a positive feedback
loop with MyoD (Kang et al., 2003; Kang et al., 2002; Kang et al., 1998; Snyder et al., 2008)
(Figure 1.10). LIF is also used to maintain pluripotency of embryonic stem cells and induced
pluripotent stem (iPS) cells which is mediated through the STAT3 signalling pathway (Niwa
et al., 1998; Smith et al., 1988; Takahashi and Yamanaka, 2006; Williams et al., 1988).
1.8. Therapies for Muscular Dystrophy
Several potential therapies for muscular dystrophy are proposed and have been investigated.
The pharmacological strategies are to improve the phenotypes of muscular dystrophy (e.g.
decrease inflammation) (Khurana and Davies, 2003). The molecular-based therapies involve
delivery of dystrophin gene (full-length or truncated mini-/micro-dystrophin) or antisense
RNA (that cause exon skipping) to replace or restore the defect dystrophin gene in dystrophin-
deficient muscles (Chakkalakal et al., 2005). Cell-based therapies require transplantation of
cells that can differentiate into myogenic lineages into dystrophic recipients; it includes
muscle stem cells, embryonic stem cells and iPS cells (Strober, 2006). There are alternative
routes such as induction of utrophin expression or administration of growth factors (e.g. IGF-
1 and IGF-2) in dystrophin-deficient muscles (Krag et al., 2004; Smith et al., 2000).

47
1.8.1. Pharmacological therapies
Treating DMD patients with glucocorticoids, such as the corticosteroid, prednisone and its
analogue, deflazacort, has been shown to slow down the progress of DMD, retarding
respiratory and ventricular dysfunctions (Biggar et al., 2001; Bonifati et al., 2000; Markham
et al., 2008). Treating mdx mice with deflazacort and prednisone along with nitric oxide donor
(NO donor, such as L-arginine, MyoNovin and isosorbide dinitrate) shows better efficacy than
treatment of glucocorticoids alone (Archer et al., 2006; Mizunoya et al., 2011). In one report
from two Canadian provinces of Nova Scotia and Prince Edward Island, better survival rate
could be achieved in DMD patients treated with steroids (prednisone or deflazocort) along
with bisphosphonate than in patients treated solely with steroids (Gordon et al., 2011).
Oxandrolone, an anabolic steroid, has also been shown to be beneficial for slowing the
progress and increasing the muscle strength of DMD patients, mainly through up-regulation
of the anabolism of fast myosin heavy chains (Balagopal et al., 2006; Fenichel et al., 1997).
Although treatment with corticosteroids causes significant side effects in patients, such as
weight gain, hypertension and osteoporosis, a long-term study (14 years) of five DMD
patients reports that early treatment (at the age of 2-4 years) of prednisone prolonged walking
ability and preserved both pulmonary and cardiac functions for four of these DMD patients
(Ames et al., 2005; Merlini et al., 2012).

48
There are several pharmacological therapies being tested in mdx mice. Intervention of IGF-1
(1 mg/kg/day for 8 weeks) in mdx mice via osmotic pump improves the force output of treated
mdx diaphragm muscles (Gregorevic et al., 2002). Application of IGF-1 as a therapy for DMD
has been in phase 1 clinical trials in the U.S. since 2010 (ClinicalTrials.gov Identifier:
NCT01207908; Children's Hospital Medical Center, Cincinnati). Mdx mice with an IGF-2
transgene (MdxBlast) have reduced programmed cell death of myoblasts, improved
maturation (decrease of centrally nucleated muscle fibres) and an ameliorated
histopathological phenotype (Smith et al., 2000). Mdx mice injected with myostatin
propeptide, which inhibits the activity of myostatin, also show ameliorated dystrophic
pathology, especially in the improvement of muscle function as indicated by an increase in
specific force (Bogdanovich et al., 2005). Mdx mice treated with an antibody (Remicade®)
which specifically inhibits activity of tumor necrosis factor-α (TNFα) have decreased
inflammatory cell infiltration and necrosis, indicating the therapeutic potential of this
antibody therapy (Grounds and Torrisi, 2004). Administrating mdx mice with the small
peptide heregulin has been reported to ameliorate the dystrophic phenotype of mdx, mainly
via reduction of degeneration of muscle fibres (Krag et al., 2004). These pharmacological
therapies slow down the pathologenesis and improve the life quality of DMD patients.
Besides, they can be applied in concert with cell-based or molecular based therapies to obtain
a synergistic efficacy (also refer to section 1.7 growth factors and myogenesis).

49
1.8.2. Molecular-based therapies
In direct gene delivery therapy, a functional dystrophin gene is inserted into a viral delivery
vector and directly introduced into dystrophin-deficient muscle (Xiao et al., 1996). Even
though the recombinant adeno-associated virus (rAAV) vector shows long-term persistence in
recipients, packing capacity of rAAV is only about 5 kb which is far less than the full length
dystrophin cDNA of 14 kb (Lapidos et al., 2004; Xiao et al., 1996). The therapeutic potential
of truncated forms of dystrophin (mini- and micro-dystrophin which lacks the majority of the
central rod-domain) has been examined by expressing the truncated dystrophin in transgenic
mdx mice and transiently transfecting into dystrophic mice or muscle explants from these
mice (Fabb et al., 2002; Jorgensen et al., 2009; Phelps et al., 1995). There, however, exists a
risk of causing an immune response against the newly expressed viral products and the
product of the transferred gene while utilizing rAAV as the vector, which results in
diminishment of transduced cells and thus limits the efficacy of this clinical application
(Wang et al., 2007; Yang et al., 1996). An alternative gene delivery therapy is to correct the
mutated dystrophin RNA transcript by antisense RNA which modulates pre-mRNA splicing
by skipping the mutated exon containing the premature stop codon (Denti et al., 2006;
Popplewell et al., 2010; van Deutekom et al., 2001). In addition to the antisense
oligonucleotide-based exon skipping, treating mdx mice with aminoglycoside antibiotics
gentamycin or the dipeptide antibiotic negamycin can also cause read-through of premature

50
stop codon and therefore recover part of dystrophin expression (Arakawa et al., 2003; Malik
et al., 2010). Overexpression of utrophin in mdx mice has also been reported to improve
phenotype of these mice (i.e. fibre regeneration, force development and resistance to stretch)
(Tinsley et al., 1998). The main issues of these gene-therapies are low transfection and
delivery efficiency of the therapeutic genes, short lasting period and immune responses of
recipients against the gene products and/or the virus vectors (Uchida et al., 2005; Wang et al.,
2007; Yang et al., 1996).
1.8.3. Cell-based therapies
Intra-arterial injection of CD34+/Sca1+ stem cells derived from forelimb and hindlimb
muscles of normal mice into mdx mice exhibits transplant efficiency of about 12% after 21
days (Torrente et al., 2001). 20-71% of tibialis anterior (TA) muscles of mdx mice injected
with a mdx-clonally derived muscle cell line (PD50A) are positive for incorporation of
PD50A cells which persist up to 12 months after transplantation (Smith and Schofield, 1997).
We used this PD50A cells in the present study. DMD patients who received 5 weeks of
consecutive implantation of normal myoblasts to the biceps have an incorporation efficiency
of mostly less than 1%; only one patient in twelve who received the transplantation had
incorporation efficiency reached 10% after 12 month of implantation (Mendell et al., 1995).
Immunosuppressive treatments have been administrated to recipients along with
51
transplantated human mesenchymal stem cells and human myoblasts to suppress an immune
response; these treatments increase the efficacy of myoblast transplantation (De Bari et al.,
2003; Guerette et al., 1997; Mendell et al., 1995). Polymorphonuclear LFA-1 (lymphocyte
fusion-associated antigen 1) positive T-cells are found among the infiltrating cells after
myoblast transplantation and inhibition of these LFA-1 positive cells by anti-FLA-1 antibody
can improve the survival of myoblast transplants (Guerette et al., 1997). Transplantation of
cells other than myoblasts, such as embryonic stem cell-derived satellite-like cells (Pax7-
positive cells derived from embryoid bodies) and mesoangioblasts (vessel-associated stem
cells capable of giving rise to most mesoderm cell types) has also been reported to promote
better survival of the donor cells in immunocompetent mice (Chang et al., 2009; Sampaolesi
et al., 2003). It has been reported that human mesenchymal stem cells fuse with myoblasts
isolated from DMD patients and contribute to myotube formation of these dystrophic
myoblasts in cell culture experiments (Goncalves et al., 2006). This suggests that
transplantation of human mesenchymal stem cells can be a potential therapy for DMD. In one
promising study, mesenchymal stem cells derived from the synovial membrane of adult
human knee joints showed long-term persistence and contributed to the satellite cell pool after
being transplanted into the TA muscles of nude mice, which suggests potential use of these
cells in DMD therapy (De Bari et al., 2001; De Bari et al., 2003). 60% of the injected TA
muscels are positive for the transplanted mesenchymal stem cells into the TA muscles 4 weeks

52
after transplantation (De Bari et al., 2003). A subset of Pax7-positive satellite cells, which are
marked with CD45-Sca-1-Mac-1-CXCR4+β1-integrin+ (CSM4B; skeletal muscle precursor
cells or SMPs) surface markers, show high efficiency in restoring dystrophin-positive
myotubes and they are also found in the satellite cell niche when transplanted into mdx mice
(Cerletti et al., 2008).
1.8.4. Transplantation of embryonic stem (ES) cells and induced pluripotent stem (iPS) cells
into mdx mice
Embryonic stem (ES) cells are cells isolated from the inner cell mass (ICM) of blastocysts
(Evans and Kaufman, 1981; Martin, 1981; Thomson et al., 1998). They are characterised by
their ability to self-renew, known as pluripotency (Chambers and Smith, 2004; Nagy et al.,
1990). When mouse ES cells are aggregated with diploid or tetraploid embryos they form
foetal cells of three germ layers (ectoderm, mesoderm and endoderm) but not the
extraembryonic lineage (Chambers and Smith, 2004; Nagy et al., 1990). The ability to
differentiate to cell types derived from three embryonic germ layers is also demonstrated by
the formation of teratomas when ES cells are injected into severe combined immunodeficient
(SCID) mice or when ES cells are cultured in specific conditions (Martin, 1981; Odorico et
al., 2001; Reubinoff et al., 2000; Thomson et al., 1998). The pluripotency of ES cells makes
them a candidate for transplantation therapy in DMD. However, isolation of ES cells involves

53
destruction of embryos which is considered unethical by some ethicists (Mertes et al., 2006).
The main scientific concern of using ES cells for therapeutic purpose is their tumorigenicity,
thus it is necessary to differentiate ES (and iPSc; see next section) into precursor cell types to
eliminate ES cell tumourigenicity (Denker, 2006).
Reprogramming patient specific somatic cells back to pluripotent status produces the induced
pluripotent stem (iPS) cells which bypass the ethical issues (Holm, 2008). iPS cells have been
successfully produced by virally introducing Oct3/4, Klf4, Sox2 and c-Myc into adult mouse
and human fibroblasts (Meissner et al., 2007; Takahashi et al., 2007; Takahashi and
Yamanaka, 2006) and by introducing Oct4, Sox2, Nanog, Lin28 into human fibroblasts (Yu et
al., 2007). iPS cells share morphological similarities with ES cells, including round shape,
large nuclei and scant cytoplasm (Takahashi et al., 2007; Takahashi and Yamanaka, 2006). iPS
cells exhibit similar pluripotency to ES cells; they form teratomas comprising tissues from
endoderm, mesoderm and ectoderm when injected into SCID mice; they can also be induced
to differentiate into specific cell lineages such as neural cells and cardiomyocytes and skeletal
muscle cells (Awaya et al., 2012; Kaichi et al., 2010; Meissner et al., 2007; Takahashi et al.,
2007; Takahashi and Yamanaka, 2006; Yu et al., 2007). The iPS cells derived from mdx have
been genetically engineered to carry human artificial chromosome (HAC) with the full length
dystrophin gene [mdx-iPS (DYS-HAC)] (Kazuki et al., 2009). Chimeric mice generated from
these mdx-iPS (DYS-HAC) cells have been shown to express the full length dystrophin gene
54
in skeletal muscles (Kazuki et al., 2009). The clinical applications of iPS cells are still limited
because of the poor understanding of the detailed mechanisms of how the reprogramming
process is regulated. Duplication and deletion of chromosomes has been reported in mouse
iPS cells (Pasi et al., 2011). In addition, the iPS cells may form tumors if the ectopic
reprogramming factors (c-Myc, Klf4, Sox2 and Oct4) are not silenced since c-Myc is an
oncogene (Okita et al., 2007; Ramos-Mejia et al., 2010). In addition, the products of
correcting genes (e.g. full length dystrophin gene) carried by the iPS cells may also be
recognised as an antigen and thus trigger an immune response (Fairchild, 2010; Mendell et al.,
2010).
1.9. Aims and objectives of this project
The main goal of this project is to understand whether elevated levels of Cav-3 play a
compensatory or compromising role in dystrophin-deficient myoblasts and mouse embryos.
(Figure 1.10).
A novel way to differentiate dystrophin-deficient myoblasts (Figure 1.10)
The first objective is to study the differentiation capacity of dystrophin-deficient myoblasts. In
a previous study (unpublished data of Leah Foley and Dr. Janet Smith), preliminary data
suggested that co-culture of C2C12 (the non-dystrophic myoblast cell line) with an osteoblast
cell line (MC3T3-E1) promoted the differentiation of C2C12 cells. This promotion could also

55
be seen, to a lesser extent, in co-cultures of MC3T3-E1 cells with PD50A myoblasts (a
dystrophin-deficient myoblast line derived from mdx mouse). In this objective I develop the
coculture protocol for differentiation of dystrophin-deficient myoblasts.
Figure 1.10 Schematical description of the goal and objectives of this thesis. The goal of this project is to study the role of elevated Cav-3 in mdx. The first objective is to examine the differentiation capacity of the dystrophin-deficient myoblasts. The second objective is to investigate the protein levels of Pax7 and Cav-3 in differentiating dystrophin-deficient myoblasts and also in embryos. The third objective is to study the mechanical responses of dystrophin-deficient myoblasts and myotubes.
The role of elevated Cav-3 in dystrophin-deficient myoblasts and mdx embryos (Figure 1.10)
There are elevation of Cav-3 protein levels and attrition of Pax7-positive cells in mdx mouse
embryos (Merrick et al., 2009); the second objective is to study roles of Pax7 and elevated
Cav-3 in dystrophin-deficiency. This was achieved by using immunohistochemistry (IHC) and
immunoblotting to examine the expression patterns of Cav-3 and Pax7 in dystrophin-deficient

56
myoblasts and mouse embryos. Molecular manipulation including overexpression and
knockdown of genes of interest (Cav-3 or Pax7) in both wt and dystrophin-deficient
myoblasts was also used to examine the relationships between Cav-3 and Pax7.
Mechanical properties of dystrophin-deficient myoblasts and myotubes (Figure 1.10)
It has been reported that there is impairment of the specific force of mdx skeletal muscles
(Chan et al., 2007; Lynch et al., 2001; van Putten et al., 2012); the third objective is to
examine the relations between the levels of caveolins and the function (mechanical
response/the stiffness) of myoblasts/myotubes. This was achieved by using the atomic force
microscope (AFM). The goal of this objective is to understand whether elevated levels of
caveolin in dystrophin-deficient myoblasts have pathological or compensatory roles for
dystrophin deficiency in terms of mechanical properties.

57
Chapter 2. Material and Methods
2.1. Cell culture
2.1.1. Cell lines and mouse strains:
Myoblast cell lines used were C2C12, a subclone of adult mouse myoblast C2 cell line
derived from thigh muscles of 2-month-old mice (Yaffe and Saxel, 1977); dfd13 derived from
5-week-old mdx mouse and PD50A cells which are a clonal derivative of dfd13 cells (Smith
and Schofield, 1994; Smith and Schofield, 1997). Osteoblast MC3T3-E1 cell line is a cell line
derived from newborn mouse calvaria (Sudo et al., 1983). WT (C57BL/10), isogenic mdx and
cav-3−/− mouse strains were used. mdx and C57BL/10 mice were generated in-house. The
Cav-3 knockout (cav-3−/− dystrophic) mice on a C57BL/10 background were from Dr.
Yoshito Hagiwara (Tokyo) (Hagiwara et al., 2000). Double mutant het mice (mdxcav-3+/− or
DMhet) are null for dystrophin (mdx) and heterozygous for Cav-3 (cav-3+/−); this strain was
generated by intercrossing mdx and cav-3−/− mice by Dr. Merrick during her PhD (Merrick,
2006; Merrick et al., 2009). The mouse iPS cell line JBL6 4F3 which was made by
introducing four transcription factors, Oct4, Sox2, cMyc and Klf4 into mouse embryonic
fibroblasts (MEF from C57BL/6J mouse) and the MEF cells were gifts from Dr. James
Dutton, Minnesota (iPS cell facility, Stem Cell Institute, University of Minnesota, USA). The
mouse embryonic fibroblast cell line STO was used as the feeder cells for iPS cell culture.

58
2.1.2. Cell culture for myoblasts:
Cell stocks were removed from liquid nitrogen and thawed briefly at 37°C in a water bath
[Grants Instruments (Cambridge) Ltd, UK] prior to use. Cell solution was transferred into a
15-ml falcon tube (Falcon; Becton Dickinson Labware, USA) containing 5 ml of fresh
medium and spun at 1000 rpm (round per minute) for 3 minutes by centrifuge [labofuge 300
Heraeus centrifuge (Kendro Laboratory Products, Germany)]. Dimethyl Sulphoxide (DMSO
HYBRI-MAXR; Sigma-Aldrich, UK) was added in cell stock to help prevent formation of ice
crystals and stabilize cell membrane when cells were frozen, but it is toxic when at 37°C.
Supernatant was aspirated and the cell pellet was resuspended in 5 ml of appropriate culture
medium. For murine C2C12 myoblasts, the medium employed was Dulbecco's Modified
Eagles Medium (DMEM; Invitrogen Ltd, UK) with 10% FCS (Sigma-Aldrich, UK), 1%
Penicillin/Streptomycin (P/S; Sigma-Aldrich, UK) and 1% L-Glutamine (Sigma-Aldrich, UK).
Dulbecco's Modified Eagles Medium (DMEM-F12 or DF-12; Invitrogen Ltd, UK) with 10%
FCS, 1% P/S and 1% L-Glutamine was used for dfd13 and PD50A cell lines. For MC3T3-E1
cell line, the preferential medium is Minimum Essential Medium Alpha Modification (Alpha-
MEM; Sigma-Aldrich, UK) with 10% FCS, 1% P/S and 1% L-Glutamine. Cell suspension
was placed in a 25 cm2 plastic culture flask (Nunc Plasticware, UK) and the flask was placed
into a 37°C Heraeus incubator (5% CO2; Kenodro Laboratory Products, Germany). The
following day after cells were plated, the medium was replaced with 10 ml of fresh medium.

59
2.1.3. Subculture cell lines:
Cells were subcultured when they reached approximate 80% confluence. Old culture medium
was first aspirated and cells were gently washed with warm PBS (phosphate buffered saline;
see appendix 2 for recipe). After washing twice with PBS, 1 ml of trypsin (porcine trypsin in
0.2% EDTA‧4Na, 0.9% Sodium Chloride; Sigma-Aldrich Company, UK) was added into
the flask. The flask was placed for 2 to 3 minutes to allow trypsin time to act and cells were
monitored by an inverted microscope (Leica DMIRB, Leica, UK) to determine when
detachment and individual cell separation had taken place. Then 9 ml of prewarmed medium
was added into the flask to stop the trypsinization. 1 ml of the cell mixture was transferred to
a new flask with fresh medium to keep the cell line. Cell number of the rest cell mixture was
determined (see section 2.2. for cell number determination) for further experiments.
2.1.4. iPS (induced pluripotent stem) cell culture:
Gelatin coated flask preparation:
The flasks for iPS cell culture were first treated with 0.1% gelatin. 3 ml of 0.1% gelatin
(Sigma-Aldrich, UK) was added into the flask and this flask was placed at 4°C for 15-30
minutes; alternatively the flask could be placed at 37 °C for 1 hour. The solution was aspirated
and the flask was used for iPS cell culture.
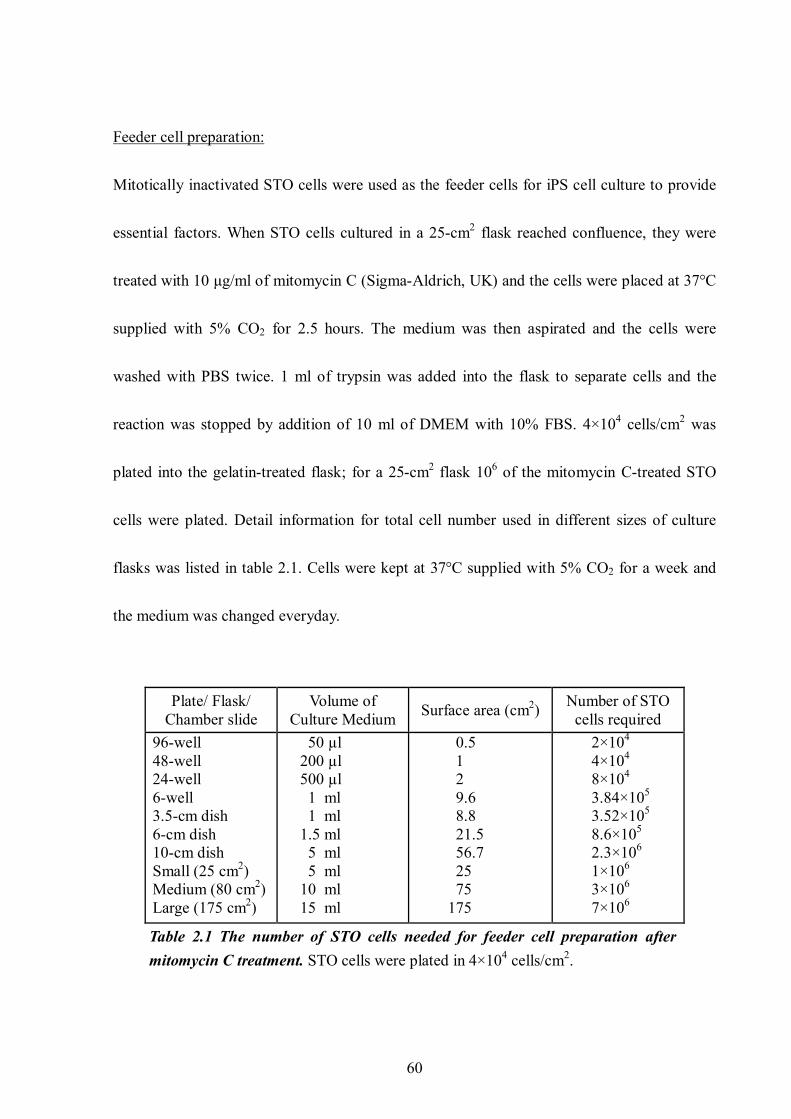
60
Feeder cell preparation:
Mitotically inactivated STO cells were used as the feeder cells for iPS cell culture to provide
essential factors. When STO cells cultured in a 25-cm2 flask reached confluence, they were
treated with 10 μg/ml of mitomycin C (Sigma-Aldrich, UK) and the cells were placed at 37°C
supplied with 5% CO2 for 2.5 hours. The medium was then aspirated and the cells were
washed with PBS twice. 1 ml of trypsin was added into the flask to separate cells and the
reaction was stopped by addition of 10 ml of DMEM with 10% FBS. 4×10⁴ cells/cm2 was
plated into the gelatin-treated flask; for a 25-cm2 flask 106 of the mitomycin C-treated STO
cells were plated. Detail information for total cell number used in different sizes of culture
flasks was listed in table 2.1. Cells were kept at 37°C supplied with 5% CO2 for a week and
the medium was changed everyday.
Plate/ Flask/ Chamber slide
Volume of Culture Medium Surface area (cm2) Number of STO
cells required 96-well 48-well 24-well 6-well 3.5-cm dish 6-cm dish 10-cm dish Small (25 cm2) Medium (80 cm2) Large (175 cm2)
50 µl 200 µl 500 µl
1 ml 1 ml
1.5 ml 5 ml 5 ml
10 ml 15 ml
0.5 1 2 9.6 8.8 21.5 56.7 25 75
175
2×10⁴ 4×10⁴ 8×10⁴ 3.84×10⁵ 3.52×10⁵ 8.6×10⁵ 2.3×10⁶ 1×10⁶ 3×10⁶ 7×10⁶
Table 2.1 The number of STO cells needed for feeder cell preparation after mitomycin C treatment. STO cells were plated in 4×10⁴ cells/cm2.

61
Mitomycin C is a carcinogen and therefore it must be handled carefully. Lab coat, goggle and
two pairs of gloves were worn while handling mitomycin C. The whole process was
performed in a spill tray covered with foil. All the wastes were treated with concentrated
sodium hypochlorite (VWR, UK) for 24 hours and then collected in an autoclave bag.
iPS cell culture
iPS cell stock was brought up as normal cell culture method mentioned in section 2.1.2. These
iPS cells were maintained on feeder cells (see section above for feeder cell preparation) in iPS
cell culture medium [knockout-DMEM (KO-DMEM; Invitrogen Ltd., UK) supplemented
with 10% knockout-Serum Replacer (KO-Serum Replacer; Invitrogen Ltd., UK), 10% FBS,
1% MEM non-essential amino acids (Invitrogen Ltd., UK), 2-mercaptoethanol (2-ME; 3.5 μl
in 500 ml medium; Sigma-Aldrich, UK), 1% P/S and leukemia inhibitory factor (ESGRO-LIF
107 units; 1000 units/ml medium, Millipore Ltd., UK)]. The medium without LIF was filter
sterile through Acrodisc 0.45 μm filter (PALL Life Sciences, UK), stored at 4°C and used
within 10 days. Filtered medium added with LIF can be stored at 4°C and must be used within
5 days. Medium of iPS cells was replenished everyday to get rid of the waste and provide the
nutrients. The iPS cells formed compact cell clusters on the feeder cells (Figure 2.1).

62
Figure 2.1 Mouse iPS cells cultured on feeder cells. Mouse induced pluripotent stem (iPS) cells formed compact cell clusters in the presence of feeder cells (mitotic-inactiavted STO cells).
iPS cell subculture
The iPS cells were expanded and cultured in a larger flask when they reach confluence.
Trypsinization followed the instruction of Dr. James Dutton. The old medium was aspirated
and the cells were washed twice with PBS. Cells were incubated at 37°C for 2 minutes before
the second wash of PBS was aspirated. 1 ml of trypsin was added into the flask and the cells
were incubated at 37°C for 5 minutes. The cells were examined under the inverted microscope
and trypsinization was stopped when the iPS cells were beginning to float free whereas the
feeder cells were detaching. 9 ml of iPS cell culture medium was added into the flask to stop
trypsinization and the cell clumps were broken down by gently pipetting the mixture multiple
times. The cell mixture was then transferred into a proper size of flask with mitomycin C-
treated feeder cells and incubated at 37°C with 5% CO2. Medium was refreshed everyday to
provide the iPS cells necessary nutrients and to remove the wastes.

63
2.1.5. Freezing down cell lines:
Cells were separated into individual cells by subculture method (section 2.1.3.) when they
reached about 80% of confluence. Single cell suspension was first spun at 1000 rpm for 3
minutes and supernatant was aspirated. The cell pellet was resuspended in 10 ml of freezing
medium (10% DMSO in corresponding culture medium) and spun at 1000 rpm for further 3
minutes. The supernatant was removed and the cell pellet was resuspended in appropriate
amount of freezing medium. 0.5 ml of the cell suspension was aliquoted into each labelled
CryoTubeTM vial (Nunc plasticware, UK). The vials were immediately frozen at -80°C
overnight and then transferred to the liquid nitrogen in the following day for long term storage.
For example (see table 2.2), cells in a large flask were divided into 8 labelled CryoTubeTM
vials and immediately placed at -80°C overnight. The vials were transferred to liquid nitrogen
the following day for long-term storage.
Plate/ Flask/ Chamber slide
Volume of Culture Medium PBS washes Volume of
trypsin Number of freeze down CryoTubes
96-well 48-well 24-well 6-well Small (25 cm2) Medium (75 cm2) Large (175 cm2) Chamber well
50 µl 150 µl 500 µl
2 ml 10 ml 10 ml 30 ml 500 µl
2×100 µl 2×200 µl 2×700 µl 2×3 ml 2×10 ml 2×15 ml 2×20 ml 2×500 µl
25 µl 50 µl 200 µl 500 µl 1 ml 3 ml 5 ml 100 µl
N/A N/A N/A 1 2 4 8 N/A
Table 2.2 Reagents needed to freeze down the expected number of vials according to the container used for cell culture. N/A= not applicable, as cell numbers were too low to freeze down (modified from the thesis of Dr. Deborah Merrick, P47, Table 2.1, 2006)

64
2.2. Determining cell number:
Cell number was determined using a haemocytometer (Fisher Scientific Ltd, UK). The
coverslip was mounted onto the haemocytometer base by a gentle, but firm, sliding action. 10
μl of cell suspension was added to each counting chamber (Figure 2.2).
Figure 2.2 Cell number determination using haemocytometer. Cell densities were determined by counting cells in the four squares on the haemocytometer. (A) Side view of haemocytometer. (B) Above view of haemocytometer and the sample loading site. (C) View of grids (counting chamber) under microscope. (D) Cell number calculation when using haemocytometer.
Haemocytometer with cell suspension was placed on an inverted microscope to visualise the
counting chamber. Cell suspension would be diluted so that cells in counting chamber should
not overlap. There should be 100 or more cells in each chamber to obtain statistically
significant counts. The final cell concentration was obtained by multiplying total number of

65
cells counted in the 4 large squares by 2500 to give a value of number of cells/ml (i.e. Total
100 cells counted: 100×2500 = 2.5× 10⁵ cells/ml) (Figure 2.2)
2.2.1. Myoblast and osteoblast coculture and growth factor effect experiments:
Cell number used for coculture experiment is based on Leah Foley’s preliminary experiment
(unpublished data of Leah Foley and Dr. Janet Smith). 2.625×10⁴ of MC3T3-E1 osteoblasts
and 1.5×10⁴ of myoblasts (C2C12 and PD50A cell lines respectively) were plated on acid-
etched coverslips (see section 2.3 for coverslip preparation) in 48-well plates (Nunc
plasticware, UK) in the presence of Alpha-MEM with 10% FCS, 1% P/S and 1% L-
Glutamine. 1.5×10⁴ of myoblasts were plated on coverslips in 48-well plates in the presence
of growth medium (GM; DMEM + 10% FCS + 1% P/S + 1% L-Glutamine) as the negative
control. Myoblasts in differentiation medium [DM; DMEM + 1% L-Glutamine + 1% P/S +
2% Horse serum (HS batch tested; Sigma-Aldrich, UK)] serve as the positive control. Cells
were also treated with MC3T3-E1 cell-conditioned medium (OCM; half osteoblast-
conditioned medium and half DM). Alpha-MEM with 10% FCS, 1% P/S and 1% L-
Glutamine were used to culture MC3T3-E1 cells; this conditioned medium was used to treat
C2C12 and PD50A myoblasts when MC3T3-E1 cells reach >85% of confluence. Conditioned
medium from coculture of C2C12 cells with MC3T3-E1 cells (CCM) or from coculture of
PD50A cells with MC3T3-E1 cells (PDCM) were also tested (CCM and PDCM were

66
collected when cells reached >85% of confluence). For growth factor test, myoblasts in DM
were supplemented with 20 ng/ml of IGF-II (insulin-like growth factor-II; R & D systems,
UK), 100 ng/ml of IGF-I (insulin-like growth factor-I; R & D systems, UK) or 1000 unit/ml
LIF (Millipore Ltd, UK) respectively. For determining the number of myonuclei in fusing
under different treatments, myoblats were plated directly in the 48-well plate for four days
and stained with Leishman’s stain (Refer to section 2.6.2 for Leishman’s stain). Myoblasts in
coculture experiment were also cultured for ten days, and the myotubes were labelled with
anti-pan-myosin antibody (see section 2.6.3 for fluorescent immunostaining).
2.2.2. Cell culture for protein assay:
C2C12 and PD50A myoblasts were plated in 10-cm dishes (Nunc plasticware, UK) with
8.5×10⁵ cells per dish (1.5×10⁴ cells/cm2) in growth medium. Cells were washed twice with
PBS and serum starved for 30 minutes when they attached. Cells were then shifted to DM or
OCM. Whole cell protein extracts from C2C12 and PD50A myoblasts were collected at 24-
hour intervals respectively for further immunoblotting analysis (see section 2.8 for protein
assay and section 2.10 for immunoblotting).

67
2.2.3. Analysis of the effects of conditioned medium (OCM) and differentiation medium (DM)
on total number of myoblasts:
The effect of osteoblast conditioned medium on total cell number of myoblasts was analysed
by plating 1.5×10⁴ of myoblasts (both C2C12 and PD50A cell lines) in a 48-well plate.
Myoblasts were cultured in GM, DM or OCM respectively for 4 days. Total cell number was
determined at 24-hour intervals (Refer to section 2.2 for detailed method of cell number
determination).
2.2.4.Cell culture for mechanical property analysis:
Myoblasts (non-dystrophic, dystrophin-deficient and transfected) were plated in 6-cm dishes
(Nunc plasticware, UK) with 9.0×10⁴ cells per dish (1.5×10⁴ cells/cm2) in growth medium.
Cells were cultured for four days and the mechanical properties were analised with the atomic
force microscope (AFM). For investigating the mechanical property of myotubes,
transfectants were first plated in 60-mm petri dishes. Cells were shifted to low mitogen
medium (alpha-MEM with 1% P/S, 1% L-Glutamine and 2% horse serum) when they reached
>80% of confluence. They were kept in low mitogen for 13-14 days for myotube formation
because the AFM machine was heavily booked and time available for measurement was
limited. These myotubes were then subjected to AFM for analysis of their mechanical
properties. (Refer to section 2.11 for details of mechanical property analysis)

68
2.3. Coverslip preparation- acid etching method
80 pieces of 9-mm2 coverslips (VWR International, UK) were placed in a 1-litre beaker
without overlapping with each other. Approximate 5 ml of concentrated nitric acid (Fisher
Scientific, UK) was carefully added into the beaker in a fumehood to etch the coverslips for 5
minutes. After 5 minutes, nitric acid was transferred into a 2-litre beaker filled with water and
poured off in the sink with copious water. Acid-etched coverslips were then placed under
running water for at least 1 hour to wash off the residual nitric acid. Clean coverslips were
soaked in small amount of methanol (100%; Fisher Scientific, UK) and then transferred onto
a piece of clean tissue to allow complete evaporation of the methanol. These coverslips were
transferred into a clean container and put into oven to finish sterilization.
2.4. Generation of Pax7-mCherry expression plasmid:
2.4.1. Mutagenesis Polymerase Chain Reaction (Mutagenesis PCR):
Mutagenesis PCR was performed to introduce restriction enzyme site (AgeI site) to the
Pax7/loxP-His-FLAG expression construct (kind gift from Dr. Michael A. Rudnicki;
Department of Cellular and Molecular Medicine, University of Ottawa, Canada) so that it
could be used to create the construct expressing fusion proteins with mCherry tag. In order to
create the in frame mCherry construct the reverse primer was designed with addition of an
extra nucleotide cytosine just ahead of AgeI restriction site. Also the ATC was substituted by

69
GGT in the forward primer to create the AgeI cutting site (the primers used are listed in table
2.3).
Primer name Primer sequence
Pax7-His/FLAG (Forward)
5'CTACCTCGAGCATCACCATCCACCGGTACGATTATGATATTC 3'
Pax7-His/FLAG (Reverse-insert C before AgeI site, ATC1554GGT)
5'GAATATCATAATCGTACCGGTGGATGGTGATGCTCGAGGTAG 3’
Table 2.3 The forward and reverse primers used in the mutagenesis PCR for the generation of Pax7-mCherry expression plasmid. The AgeI restriction site is underlined, the insertion base is labeled in red and the substitution bases are in bold label (Primers were ordered from AltaBiosciences Ltd, UK).
Pfu DNA polymerase (Promega, UK) was utilized to prevent mutations on the backbone of
the plasmid during PCR amplification. 5 μl of DNA template (10 ng/μl) was added in a PCR
tube followed by addition of 45 μl master mix to give total volume of 50 μl.
5 μl -10×Buffer with MgSO4 (Promega, UK)
5 μl -dNTP mix (10 mM dATP, dCTP, dGTP and dTTP respectively)(Qiagen)
1.5 μl -each primer (10 μM)
1 μl -Pfu DNA polymerase (Promega, UK)
31 μl -dH2O
Samples were placed in a PCR machine (Veriti® 96-Well Thermal Cycler; AB Applied
Biosystems, UK) and the program started. The following program was used according to the
instruction for PCR using Pfu DNA polymerase.

70
1 cycle - 95°C for 2 minutes
- annealing temp (50°C) for 30 seconds
- 72°C (2 minutes/kb; 13.6 mins)
20 cycles - 95°C for 30 seconds
- annealing temp (50°C) for 30 seconds
- 72°C (2 minutes/kb; 13.6 mins)
Final step - 72°C for 5 minutes
2.4.2. E. Coli transformation and culture for plasmid amplification:
2.4.2.1. Competent cell preparation
Bacterial E. coli (DH5α strain) competent cell preparation was based on Chung’s method
published in 1989 (Chung et al., 1989). Single colony was picked up from LB (Luria-Bertani)
plate [for 250 ml LB agar, 9.25 g Luria Agar powder (Invitrogen, UK), add dH2O up to 250
ml] and transferred into 3 ml of LB medium for 16 hours of incubation at 37°C in an
incubator rotor (INNOVATM 433 refrigerated incubator shaker; New Brunswick Scientific).
200 μl of medium containing bacteria was transferred into 20 ml of fresh LB medium and
incubated at 37°C with vigorous shaking for 2 to 2.5 hours to reach 0.3-0.4 of OD600 value.
Bacterial cultures were put in ice for 20 minutes before spun down with centrifugation at
4,000 rpm (AvantiTM 30 centrifuge; Beckman Coulter, UK) at 4°C for 10 minutes. After

71
supernatant was removed, the pellet was resuspended with 2 ml of cold TSS [transformation
and storage solution; 50 mM MgCl2 (BDH, UK), 85% LB medium (Invitrogen, UK), 10%
PEG (Polyethylene glycol; molecular weight 8,000; Sigma-Aldrich, UK), 5% DMSO (Sigma-
Aldrich, UK), adjust pH to 6.5)]. The cell mixture was then aliquoted into 150 μl aliquot per
Eppendorf tube and was stored at -80°C before use.
2.4.2.2. E. coli Transformation
Competent cells were removed from -80°C and thawed on ice prior to use. 5 μl of Pax7/loxP-
His-FLAG (see section 2.4.1 for mutagenesis PCR) PCR product was added into competent
cells and the mixture was placed on ice for 30 minutes. Competent cells were then heat
shocked at 45°C (Thermomixer; Eppendorf, UK) for 90 seconds and placed on ice for another
2 minutes. 1 ml of fresh LB medium was added into the Eppendorf tube and competent cells
were incubated at 37°C with vigorous shaking for 1 hour. The cells were then spun down by
centrifugation at 13,000 rpm (Labofuge 300 Heraeus centrifuge; Kendro Laboratory Products
Plc, UK). The cell pellet was resuspended with fresh LB medium and plated on LB plate with
100 μg/ml ampicillin (Sigma-Aldrich, UK). The plate was placed in an incubator set at 37°C
(Heraeus Incubator D-6450; Kendro Laboratory Products Plc, UK) for 14 to 16 hours for
bacterial colony formation.

72
2.4.3. DNA purification:
2.4.3.1. Small scale plasmid DNA purification using QIAprep Spin Miniprep Kit
To obtain enough DNA of the mutagenesis product, a single bacteria colony was picked up
from the transform plate and incubated in 3 ml of LB medium containing 100 μg/ml
ampicillin for 12-16 hours at 37°C with vigorous shaking. Bacterial cells were collected in an
Eppendorf tube by centrifugation at 13,000 rpm for 1 minute. The plasmid DNA was then
purified using QIAprep Spin Miniprep Kit (QIAGEN, UK), following the manufacturer’s
instruction. Bacterial cells were first resuspended in 250 μl of Buffer P1 and then lysed by
adding 250 μl of Buffer P2. The mixture was mixed thoroughly by gently inverting the tube
4–6 times and reaction was neutralized with 350 μl of Buffer N3 by inverting the tube 4–6
times. Precipitate was spun down by centrifugation at 13,000 rpm for 10 minutes and
supernatant was transferred directly into the QIAprep spin column. Column was centrifuged
at 13,000 rpm for 1 minute and flow-through was discarded. Column was then washed with
0.75 ml of Buffer PE and centrifuged for 1 minute. After flow-through was discarded, the
column was centrifuged for another minute to remove the residual wash buffer. The QIAprep
column was placed in a clean Eppendorf tube. Plasmid DNA was eluted by addition of 20 μl
of ddH2O and centrifuged at 13,000 rpm for 1 minute. The elution step was repeated once to
increase yield.

73
2.4.3.2. Band purification for construction of Pax7 plasmids
Pax7/loxP-His-FLAG mutagenetic plasmid and pmCherry-N1 plasmid were digested with
restriction enzymes EcoRI and AgeI (New England BioLabs, UK) supplemented with
NEBuffer 1 at 37°C for 8 hours. Digested Pax7 insert fragment and pmCherry-N1 vector were
separated on 1% agarose (multi-purpose, molecular grade; BioLine Ltd, UK) gels [1 g
Agarose dissolved in 100 ml TBE with a 750W microwave (Panasonic UK Ltd)] containing
0.5 μg/ml of Ethidiun Bromide (10 mg/ml stock; Invitrogen, UK). Ethidium Bromide (a
known carcinogen) was added with great care after gel had cooled down slightly at room
temperature for 5 minutes. The gel was poured into a horizontal electrophoresis casting tray
(HORIZON®58; Invitrogen, UK) and gel combs placed at one end. Gel was allowed to cool
for about 30 minutes or until it had solidified. The gel was placed in an electrophoresis tank
(HORIZON®58; Invitrogen, UK) and covered thoroughly in TBE [9.3 g Na2EDTA
(Diaminoethanetetra-acetic acid disodium salt; Fisher Scientific, UK), 55 g Boric acid (Fisher
Scientific, UK), 108 g Tris made up to 1 litre with dH2O]. To visualize the leading front of the
sample, 6×loading buffer (2.5% Ficoll-400, 11 mM EDTA, 3.3 mM Tris-HCl pH 8.0, 0.017%
SDS and 0.015% bromophenol blue; New England Biolabs, UK) was added to each sample.
Samples were then loaded onto the 1% agarose gel. After separation for 1 hour at 130V at
room temperature, gel was removed from the horizontal electrophoresis tank and visualized
under uv light (uvitec, Jenkons Scientific Ltd, UK). The images were captured utilizing a

74
Sony gel imaging camera with video graphic printer (Sony, UK). The DNA band
corresponding to the Pax7 fragment (~1.5 kb) was carefully excised with a clean, sharp
scalpel (Swann-Morton, UK) and transferred to a pre-weighed Eppendorf tube. The Pax7
insert fragment and pmCherry-N1 vector were recovered from agarose gel using QIAquick®
Gel Extraction kit (QIAGEN, UK).
The gel slice was weighed and 3 volumes of Buffer QG (QIAGEN, UK) was added (e.g. add
300 μl of Buffer QG to each 100 mg of gel.). Gel slice was then incubated at 50°C for 10
minutes and the tube was vortexed every 2-3 minutes until gel slice has completely dissolved.
1 volume of isopropanol (2-propanol; Fisher Scientific, UK) was added into the sample to
promote DNA precipitation and the mixture was thoroughly mixed by inverting the tube
several times. The Sample was transferred onto a QIAquick column and centrifuged at 13,000
rpm for 1 minute to let DNA bind to the resin. 0.75 ml of Buffer PE was added to the column
and centrifuged at 13,000 rpm for 1 minute to wash the sample. The QIAquick column was
further centrifuged at 13,000 rpm for 1 minute to remove the residual buffer. Column was
then transferred to a clean Eppendorf tube. 15 μl of ddH2O was added onto the column and
then centrifuged at 13,000 rpm for 1 minute to elute the DNA. The elution step was repeated
once to obtain higher yield.

75
2.4.3.3. Plasmid ligation
Digested Pax7 insert fragment and mCherry vector were ligated in a ratio of 4 versus 1 (ratio
of molecules) to create the Pax7-mCherry expression plasmid (Figure 2.3 A). T4 DNA ligase
(New England BioLab, UK) was used to ligate the fragments; the reaction was kept at 16 °C
in a PCR machine overnight. Half of the ligation product was transformed into E. coli
competent cells (Refer to section 2.4.2.2 for E. coli transformation) and the resulting colonies
were picked and amplified to isolate plasmid DNA (see section 2.4.3.1 for small scale plasmid
DNA purification using QIAprep Spin Miniprep Kit).
Pax7-mCherry6236 bp
pCMV EI
Kanr/NeormPax7d
mCherryAgeI (2181)
Ase I (8)
BamHI (643)
Bsp EI (987)
EcoRI (630)
HpaI (3024)
NdeI (235)NheI (592)
SalI (797)
XbaI (2915)
ApaLI (2254)
ApaLI (5865)
Bst BI (628)
BstBI (4943)
BstEII (2349)
BstEII (2520)
HindIII (623)
HindIII (2104)
XhoI (614)
XhoI (2164)
Figure 2.3 Pax7-mCherry expression plasmid construction. (A) The construct map of Pax7-mCherry. (B) The Pax7-mcherry was checked by BspEI and AseI restriction map analysis.
DNA was digested to confirm the constructs were expected. DNA was digested by placing in
a clean Eppendorf tube with enzyme, buffer and water (detailed in table 2.4 and Figure 2.3 B)
and incubated at 37°C overnight. Samples were run on 1% agarose gels containing 0.5 μg/ml
A B

76
of Ethidium Bromide.
Pax7-mCherry
Uncut (control) –
3 μl DNA
0.8 μl Buffer 3
4.2 μl Water
Single digest -
3 μl DNA
0.8 μl Buffer 3
0.5 μl enzyme BspEI
3.7 μl Water
Expected band (bp)
– ~6.2kb
Double digest –
3 μl DNA
0.8 μl Buffer 3
0.5 μl enzyme BspEI
0.5 μl enzyme AseI
3.2 μl Water
Expected bands (bp)
– ~1kb, ~5.2kb
Table 2.4 Enzymes used to digest Pax7-mCherry constructs, with expected band sizes (All restriction enzymes and buffers were from New England Biolabs Ltd, UK).
2.4.3.4. QIAfilter MidiPrep of plasmids for transfection
To isolate plasmid DNA for transfection, glycerol stock was scraped with the tip of a pipette,
spread on LB agar plates containing 100 μg/ml antibiotics [(kanamycin; Invitrogen, UK) or
(Ampicillin; Sigma-Aldrich, UK)] and incubated in an incubator (37°C) overnight
(approximately 18 hours). Single colonies were picked up and added to 3 ml of LB medium
containing antibiotics in 10 ml sterile falcon tubes and placed in a rotating incubator (37°C)
for 8 hours. 200 μl of the mixture was transferred to 50 ml LB and then placed back to
incubator (37°C) overnight (16 hours). The Pax7-mCherry plasmid was subsequently purified
using QIAfilter Midiprep kit (Qiagen, UK), following the manufacturer’s instruction.
Bacterial cells were harvested by centrifugation at 6000×g at 4°C for 15 minutes. Supernatant

77
was removed and the bacterial pellet was re-suspended in 4 ml of Buffer P1. 4 ml of Buffer
P2 was added into bacterial suspension and the mixture was inverted vigorously and
incubated at room temperature for no more than 5 minutes to lyse the cells. QIAfilter Midi
Cartridges were prepared during incubation with the caps screwed onto the outlet nozzle of
the cartridges. 4 ml of chilled Buffer 3 was added to the lysate and mixed immediately and
thoroughly by vigorously inverting 4 to 6 times. The mixtures were poured into cartridge
directly and incubated at room temperature for 10 minutes. During this period, QIAGEN-tip
100 columns were equilibrated with 4 ml of Buffer QBT, allowing the column to empty by
gravity flow. Cell lysates were then filtered into the equilibrated QIAGEN-tip columns by
gently inserting the plungers into the cartridges and cleared lysates were allowed to enter the
resin by gravity flow. The QIAGEN-tip columns were washed with 10 ml of Buffer QC twice
and DNA was eluted with 5 ml of Buffer QF and collected in clean tubes. DNA was
precipitated by addition of 3.5 ml of room temperature isopropanol (0.7 volumes) and the
mixture was centrifuged at 15,000×g at 4°C for 30 minutes. Supernatant was decanted
carefully and DNA pellets were washed with 2 ml of room temperature 70% ethanol. Samples
were centrifuged further at 15,000×g for 10 minutes and the supernatant was decanted
carefully. The DAN pellets were air-dried for 5-10 minutes (until the pellets were transparent)
and then re-dissolved in a suitable volume of dH2O (normally 400 μl; depends on the size of
DNA pellet) at 4°C overnight, before stored at -20°C. DNA concentration was established

78
using Camspec M501 Single Beam Scanning UV/Visible Spectrophotometer (Spectronic
Camspec Ltd, UK). The Plasmids used in this thesis were listed in table 2.5.
Plasmid Antibiotic selection marker Neomycin resistant (G418 selection)
Cav1-eGFP +
Cav3-eGFP +
pCR3.1-eGFP-minidystrophin +
peGFP-N1 +
pmCherry N1 +
Pax7-mcherry +
pSHAG-Cav3sh _
pSHAG-cav7 (Cav1sh plasmid) _
pSHAG-dsGFPsh
Kanamycin
_
pLKO.1-Pax7-sh Ampicillin _
Table 2.5 The plasmids used in this thesis and their selection markers for plasmid amplification in bacterial culture. Cav1-eGFP expression plasmid is a gift from Dr. Joshua Rappoport (University of Birmingham). Cav3-eGFP along with eGFP plasmids were acquired from Dr. A. Krüttgen (RWTH Aachen University School of Medicine). eGFP-minidystrophin constrcut was obtained from Dr. Jacques P. Tremblay (Université Laval et Membre de l'Axe Neurosciences). pmCherry plasmid was a gift from Professor John Heath (University of Birmingham). Cav1sh expression construct was obtained from Dr. Jane Sottile (University of Rochester). Pax7sh expression plasmid was a gift from Professor Andrew Lassar (Harvard Medical School).
2.5. Introduction of expression and shRNA plasmids into mammalian cells
2.5.1. Optimized LipofectamineTM2000 Transfection protocol (24-well plate):
3×10⁵ of myoblasts were plated in a 24-well plate (Nunc Plasticware, UK) and cultured for 18
hours to reach 80% - 100% confluence before transfection. 0.8 μg of interest plasmid DNA
79
was added into 50 μl of DMEM with 1% Glutamine only (serum free medium, SFM) and
mixed gently. 2 μl of LipofectamineTM2000 (Invitrogen, UK) was diluted in 50 μl of SFM,
gently mixed and then incubated at room temperature for 5 minutes. After 5 minutes, the
liposome solution was added into DNA/SFM mixture with gentle mixing and the
DNA/liposome mixture was incubated at room temperature for another 20 minutes to allow
formation of DNA-LipofectamineTM2000 complex. Lipofectamine TM2000 is used at a strict
ratio to DNA (liposome: DNA = 2.5:1) and plate area (1.6 μl liposome/cm2).
For shRNA constructs, pmCherry plasmid was cotransfected as a selection marker. The ratio
of pmCherry plasmid and shRNA plasmid was 1:7 (0.1 μg of pmCherry plasmid and 0.7 μg of
shRNA plasmid). 5 minutes before addition of the DNA-liposome complex onto the cells, the
culture medium was aspirated from the plate and cells were washed with SFM. 100 μl of
DNA-liposome mixture was added into each well. After 16 hours (overnight) of incubation,
100 μl of fresh culture medium containing 20% FCS and 2% P/S was added into each well.
Cells were cultured for at least 24 hours before they were selected with G418 for stable clones
(See section 2.5.3). Table 2.6 shows the volume of LipofectamineTM2000 and the amount of
DNA applied to each plate size and cell density used in this thesis.

80
Table 2.6 Amount of DNA and transfection reagent (LipofactamineTM2000) required for different culture condition (Adapted from the thesis of Dr. Deborah Merrick, P54, Table 2.2, 2006).
2.5.2. Transfection with Lipofectamine® LTX and PLUS™ Reagents (24-well plate):
The minidystrophin-eGFP expression plasmids and the Oct4 reporter plasmid were
respectively introduced into myoblasts and iPS cells with Lipofectamine®LTX PLUSTM
reagents (Invitrogen, UK). 3×10⁵ of myoblasts were plated in a 24-well plate. Cells were
transfected with minidystrophin-eGFP expression plasmid when they reach 80-100%
confluence. 1.5 μg of purified plasmid DNA was diluted with 100 μl of SFM along with 1.5 μl
of PLUSTM (1 μl PLUSTM /μg DNA).
The iPS cells in a 25-cm2 flask were subcultured (section 2.1.4 for iPS cell subculture) and
plated into the wells of a feeder cell free/gelatin-coated 24-well plate. The pOEIN construct
(Oct4 reporter plasmid; gift from Dr. Masahiro Sato of Kagoshima University, Japan; Figure
2.4 A) was linearised with NotI (NEB, UK) before transfection. 0.5 μg of purified plasmid
Culture vessel Culture area Plating Density (Cells/cm2)
DNA(diluted from SFM)
LipofectamineTM2000 (diluted in SFM)
96 well plate 0.33 cm2/well 1.5x10⁵ 0.2 μg (25 μl) 0.5 μl (25 μl)
Chamber slide 0.8 cm2/well 1.5x10⁵ 0.5 μg (33 μl) 1.25 μl (33 μl)
48 well plate 1.1 cm2/well 1.5x10⁵ 0.7 μg (50 μl) 1.75 μl ( 50 μl)
24 well plate 1.9 cm2/well 1.5x10⁵ 0.8 μg (100 μl) 2 μl (100 μl)
6 well plate 9.6 cm2/well 1.5x10⁵ 4 μg (250 μl) 10 μl (250 μl)
3.5 cm dish 8.8 cm2/well 1.5x10⁵ 3.7 μg ( 500 μl) 9.3 μl ( 500 μl)
6 cm dish 21.5 cm2/well 1.5x10⁵ 9 μg ( 500 μl) 22.5 μl ( 500 μl)

81
DNA was diluted with 50 μl of SEM along with 0.5μl of PLUSTM (1 μl PLUSTM /μg DNA).
Figure 2.4 Selection of iPS cells carrying Oct4 reporter plasmid. (A) The map of Oct4 reporter plasmid pOEIN, a kind gift from Dr. Masahiro Sato of Kagoshima University, Japan. (B) iPS cells bearing the pOEIN reporter plasmid gave green fluorescence as an indication of pluripotent status.
The DNA- PLUSTM mixture was mixed well and stay at room temperature for 5 minutes.
Lipofectamine®LTX in the ratio of 2.5 μl /μg DNA was then added into the DNA-PLUSTM
mixture; they were mixed and stay at room temperature for 20 minutes for DNA-liposome
complex formation. Cells were washed with SFM during DNA-liposome complex formation.
After 20 minutes of incubation, the DNA-liposome complex was added dropwise onto cells
A
B

82
and the cells were incubated at 37°C for at least 16 hours. The medium was replaced with
fresh medium and the cells were cultured further for at least 24 hours before selection of
stable clones (section 2.5.3).
2.5.3. Stable transfectant selection after transfection
Two days after transfection of the expression plasmids or shRNAi vehicles (see table 2.5),
myoblasts which stably express the plasmid were selected with 800 μg/ml of G418 (Geneticin;
Invitrogen, UK). For shRNA expression vehicles, which have no neomycin resistant gene,
pmCherry expression plasmid was co-transfected for G418 selection. The iPS cells carrying
the pOEIN (Figure 2.4 B) were selected with 400 μg/ml of G418. Medium was changed every
three days for the myoblast transfectants and every two days for the iPS transfectants until
colonies derived from the transfectants appeared. Those non-transfected cells died after G418
treatment; cells detached from the culture plates and were washed away. Colonies were
picked and transfered into the 25-cm2 culture flasks to expand the cell line. Expressions of the
epigenes were confirmed by immunoblotting. The stable transfectants were frozen down and
kept in liquid nitrogen. The myoblast transfectants were later used for protein extraction
(section 2.8.1) or mechanical tests (section 2.11).

83
2.6. Cell fixation and staining
2.6.1. Fixing cells with 4% paraformaldehyde:
Cells were fixed in 4% paraformaldehyde prior to fluorescent immunostaining (section 2.6.3).
To prepare 4% paraformaldehyde solution, 4 grams (g) of paraformaldehyde (PFA; Sigma-
Aldich, UK) was weighed out and added to 100 ml of sterile PBS. A face-mask was worn
whilst weighing out the paraformaldehyde to prevent inhalation. The solution was heated and
gently shaken in a hybridization oven/shaker (Stuart Scientific, UK) at constant temperature
(below 65°C) until the powder dissolved. Before fixation, the culture medium was removed
and cells were washed with PBS at room temperature for 5 minutes on a Gyro-Rocker®
shaker (STR9 Bibby; Stuart, UK). Approximately 0.2 ml of 4% paraformaldehyde was added
to each well and the 48-well plate was placed on a shaker at room temperature for 15 minutes.
Following this, each well was rinsed in PBS with 30 mM glycine (Fisher Scientific Ltd, UK)
twice.
2.6.2. Leishman's stain:
Cells plated in a 48-well plate were fixed with 4% PFA (refer to section 2.6.1 for fixation).
Approximately 0.2 ml of Leishman's stain [0.15% Leishman's stain (Leishman’s stain, Eosin-
polychrome methylene blue; Sigma-Aldrich, UK) in methanol] was added to each well and
the plate was placed on a Gyro-Rocker® shaker for 5 minutes. After 5 minutes, 0.2 ml of

84
dH2O was added to each well for dye fixation and the plate was placed on the shaker for
another 5 minutes. The mixture was removed and the plate was put under running tap water.
This should be done carefully without letting water hit the cell surface directly to prevent the
cells from damage. The plate was dried before examination under an inverted microscope.
2.6.3. Fluorescent immunostaining:
The immunostaining method used in this thesis is based on the method published previously
(Merrick et al., 2009). Adhered cells were first fixed with 4% PFA in PBS (see section 2.6.1.)
for 10-15 minutes and then rinsed in PBS with 30 mM glycine twice. Fixed cells were
permeabilized with 0.25% Triton-X-100 (Sigma-Aldrich, UK) in PBS for 5 minutes and
rinsed with PBS twice. Cells were blocked with 5% BSA (sigma-Aldrich, UK) in PBS for at
least 30 minutes and then incubated with primary antibody at 4°C overnight. The second day,
samples were washed for 10 minutes three times in PBST [PBS + 150 mM NaCl (Fisher
Scientific, UK) + 0.05% Tween20® (Sigma-Aldrich, UK)] and were incubated with
secondary antibody at room temperature for 1 hour. Samples labelled with biotinylated
secondary antibodies were then washed with PBST for 10 minutes three times and probed
with Streptavidin-Texas Red (1:1,000; PerkinElmer, UK) for 30 minutes at room temperature
if applicable and protected from light. DAPI (Sigma-Aldrich, UK) (10 μg/ml) was added into
the sample to label the nuclei for 3 minutes. Cells were rinsed in PBST for 10 minutes three

85
times. A final rinse in PBS was applied to remove excess salt. Slides were mounted in
Dakocytomation Fluorescence Mounting Medium (Dako UK Ltd, UK). Samples were
examined with Nikon ECLIPSE Ti inverted microscope (Nikon UK Limited, UK). The
antibodies and titres used are listed in table 2.7.
Primary Antibody (Titre) Secondary Antibody (Titre) Tertiary Antibody (Titre)
Mouse anti-calsequestrin antibody (1:20); gift from Dr. Francesco Michelangeli of University of Birmingham Mouse monoclonal anti-IGF2 antibody; Upstate Biotechnology, USA (1:500) MANDRA1 - MOUSE ANTI- Dystrophin Clone No.7A10; CIND (1:4) anti-MF-20, mouse anti-pan myosin antibody; DSHB, USA (1:500)
Biotinylated Anti-mouse IgG (whole antibody from goat); Amersham Pharmacia Biotech, UK (1:1,000)
Biotinylated Anti-mouse IgG (whole antibody from goat); Amersham, UK (1:1,000)
Streptavidin-Texas Red; PerkinElmer, UK (1:1,000)
Mouse monoclonal anti-caveolin 3 antibody; Becton Dickinson, UK (1:500)
Alexa Fluor® 488 F(ab')2 fragment of goat anti-mouse IgG (H+L); Invitrogen, UK (1:500)
N/A
Biotinylated anti-rabbit Ig antibody; Amersham Pharmacia Biotech, UK (1:1,000)
Streptavidin-Texas Red; PerkinElmer, UK (1:1,000)
Rabbit polyclonal anti caveolin-1 antibody; BD Biosciences, UK (1:1,000)
Alexa Fluor® 488 F(ab')2 fragment of goat anti-rabbit IgG (H+L); Invitrogrn, UK (1:1000)
N/A
Rhodamine Phalloidin; Sigma-Aldrich, UK (2 μg/ml)
N/A N/A
Monoclonal Anti-α-Tubulin antibody produced in mouse; Sigma- Aldrich, UK (1:2,000)
Biotinylated Anti-mouse IgG (whole antibody from goat); Amersham, UK (1:1,000)
Streptavidin-Texas Red; PerkinElmer, UK (1:1,000)
Table 2.7 The antibodies and titres used for the fluorescent immunostaining. Titres of antibodies used are shown in parenthens. (N/A: not applicable)

86
2.7. Immunohistochemisry (IHC) method
2.7.1. Embedding Embryos in Paraffin
Paraffin-embedded embryos and adult skeletal muscle blocks were fixed and embedded by Dr.
Dean Larner, during his doctoral research in Dr. Janet Smith’s lab (Larner, 2012) following
the protocol described below; all sectioning was performed by myself (Hung-Chih Chen).
Embryos were dissected and placed in 4% PFA solution on a Gyro-Rocker® shaker at 4°C
(cold room) for the optimal period of time (3-24 hrs, depending on embryonic stage shown in
table 2.8). E11.5-E16.5 embryos were washed twice in sterile PBS for 10 minutes at room
temperature. After wash with PBS, the embryos were dehydrated in serial washes of ethanol
(40%, 70%, 95% and 100% respectively; made up in tap water) for a length of time that
corresponded to the embryonic stage of the embryo (Refer to table 2.8). Embryos were then
switched from plastic universal tubes to 20 ml glass bottles and ethanol was cleaned with
xylene (Fisher Scientific, UK) (refer to table 2.8). For E17.5 embryos, an additional step of
decalcification was carried out prior to dehydration. Decalcification was carried out by
washing embryos in 0.5 M of EDTA solution (pH7.5) for 3 days at 4°C (solution was replaced
daily), followed by washing in dH2O overnight. After decalcification, E17.5 embryos were
dehydrated in accordance with table 2.8. Adult muscle samples were processed as for E17.5
embryos except that they did not undergo decalcification.

87
STEP SOLUTION E11.5 E12.5 E13.5 E14.5 E15.5 E16.5 E17.5
1 2 3 4 5 6
4% PFA (4˚C) 40% EtoH 70% EtOH 95% EtOH 100% EtOH Xylene
3 hrs 30 mins 30 mins 30 mins 3 x 30 mins* 3 x 30mins
5 hrs 30 mins 30 mins 30 mins 3 x 30 mins* 3 x 30 mins
20 hrs 1 hr 1 hr 1 hr 3 x1 hr* 3x1 hr
20 hrs 1 hr 1 hr 1 hr 3 x1 hr* 3x1 hr
20 hrs 1.5 hrs 1.5 hrs 1.5 hrs 3x 1.5hrs* 3x 1.5 hrs
24 hrs 1.5 hrs 1.5 hrs 1.5 hrs 3x 1.5hrs* 3x 1.5 hrs
24 hrs --------- 1 day 1 day 1 day 2 days 3 days
Table 2.8 Fixation, dehydration and clearing incubation times for E10.5-E17.5 staged embryos in 4% paraformaldehyde, ethanol and xylene respectively. All of the above steps were carried out at room temperature, excluding step 1, which was carried out at 4°C. EtOH = Ethanol (all dilutions were prepared in tap water; * = final wash was overnight at 4°C; ---- = decalcification step for E17.5 embryos. (Taken from the thesis of Dr. Deborah Merrick, 2006)
Following clearing with xylene, xylene was removed from the embryo and disposed of as
non-halogenated waste solvent (special waste). Molten wax (60°C paramat; Fisher Scientific,
UK) placed in a 60°C oven (Carbolite Incubator; Carbolite, UK) was poured into the glass
bottles with embryos inside. The bottles were placed in an oven (Stuart Scientific, UK;
Hybridisation oven/shaker S120H). E11.5-E13.5 embryos had 2-3 changes of wax over a 24-
hour interval and E14.5-E17.5 embryos had 3 changes over an interval of 24-48 hours.
Embryos were thereafter removed from the wax using heated forceps. Forceps were heated to
prevent wax from solidifying too quickly that could cause attachment of the forceps to the
embryos, resulting in tissue damage. Embryos were orientated as required in 22 mm × 22 mm
square peel-away disposable embedding molds (Fisher Scientific, UK), labelled, and then
immersed in molten wax. Blocks were left to cool for 6-8 hours and then placed at 4°C until

88
required for sectioning using a microtome (section 2.7.2).
2.7.2. Microtome Sectioning of Paraffin Blocks
A water bath [Grants Instruments (Cam) Ltd, UK] was set at 30°C (no more than 50°C) and
an incubator was set to 37°C prior to sectioning. Paraffin blocks were removed from 4°C
storage and excess wax was carefully removed from around the embryo with a razor blade.
The block was clamped into the Reichert-Jung 1150/Autocut microtome (Leica Microsystems
Ltd, UK) and aligned parallel to the blade. Sections were carefully cut at 5 μm thick and
placed on top of water in the 30°C water bath. Sections were then collected on to superfrost
slides (VWR International, UK). Excess water between sections and slide was carefully
cleaned with tissue. Slides were placed in the 37°C oven overnight to ensure sections became
firmly attached to the slide surface (particularly important when using the pressure cooker
immunohistochemical labelling technique).
2.7.3. Immunohistochemistry (IHC) (TSA protocol for paraffin embedded sections):
Paraffin embedded sections on the slides (see section 2.7.2 microtome sectioning) were
washed consecutively with xylene in 2 separate glass containers for 10 minutes and 5 minutes
respectively to remove paraffin wax. These wax-removed sections were then rehydrated in
ethanol with sequence of 100% ethanol for 2 minutes twice, 95% ethanol for 2 minutes, 70%

89
for 2 minutes, 50% for 2 minutes and 30% for 2 minutes. Slides were washed in PBS for 10
minutes before antigen retrieval. The protein bonds created via PFA fixation were broken
down (antigen retrieval) using a pressure cooker (Meyer Prestige Ltd., UK). Slides were
placed in boiling antigen retrieval buffer [10 mM Sodium Citrate (Fisher Scientific, UK),
pH6]. The lid was locked and the solution was brought to pressure before incubation of
sectioned sample/slides for 1.5 minutes under pressure (check pressure achieved by pressure
cooker), followed by cooling the pressure cooker under cold running water for approximately
3 minutes. Sections were transferred to a glass container and washed in fresh PBS for 10
minutes. After the PBS wash, individual sections were isolated by drawing around them with
wax barrier pen (Vector Laboratories Ltd., UK), allowing multiple sections to be stained with
different reagents on the same slide. The endogenous hydrogen peroxidase was blocked by
first treating the sections with 3% Hydrogen Peroxide (H2O2) (Sigma-Aldrich, UK) in tap
water (50 ml total; 5 ml of 30% H2O2 stock made up to 50 ml with tap water) for 5 minutes
and then with 0.5% Hydrogen Peroxide in methanol (50 ml total; 833 μl of 30% H2O2 stock
made up to 50 ml with methanol) for 1 hour. Sections were washed in PBST (0.05%
Tween®20 in PBS; 1 ml Tween®20 in 2 litre PBS) for 10 minutes trice and then blocked with
TNB [Tris-NaCl blocking buffer; 50 mM Tris base pH7.5, 75 mM NaCl , 0.25% Blocking
reagent (TSA kit)] for 30 minutes at room temperature. TNB was tipped off and the sections
were incubated with primary antibody overnight at 4° C in humidity chamber (lidded tray
90
with filter paper soaked in PBS).
The next day primary antibody was removed and the slides washed with PBST for 10 minutes.
After three PBST wash, biotinylated secondary antibody was applied to the sections for 1
hour at room temperature. Nonspecific binding was washed away with PBST for 10 minutes
trice. To amplify the signal, TSA (Tyramide Signal Amplification) amplification method was
used. Sections were incubated with Streptavidin-horseradish peroxidase (SA-HRP; TSA kit)
diluted 1/500 in TNB for 30 min at room temperature and then washed with PBST three times,
10 minutes each time. Biotinyl tyramide (Amplication reagent; TSA kit), diluted 1:50 with
diluent in kit, was added to each section for 12 minutes. The slides were washed in PBST for
10 minutes trice and incubated with SA-HRP diluted 1/500 in TNB for 30 minutes at room
temperature followed by further PBST washes for 10 minutes trice. To visualise the labelled
antigen, DAB (3, 3'-diaminobenzidine; Dako, UK) was applied to the sections using a Pasteur
pipette for 5 minutes. 1 μl of H2O2 was added to 1 ml DAB (1 tablet of DAKO®DAB
chromogen dissolved in 10 ml of PBS) right prior to use. DAB is a carcinogen; therefore two
pairs of gloves were worn during the process with great care. Slides were then washed in tap
water twice (5 minutes for each wash). The first wash was in a plastic container and the 2nd
wash was in a glass container on shaker. The used water and equipments from the 1st wash
were cleaned with bleach (sodium hypochlorite) to de-activate DAB washed away from the
slides. The water from the 2nd wash was disposed of down the sink with copious amount of
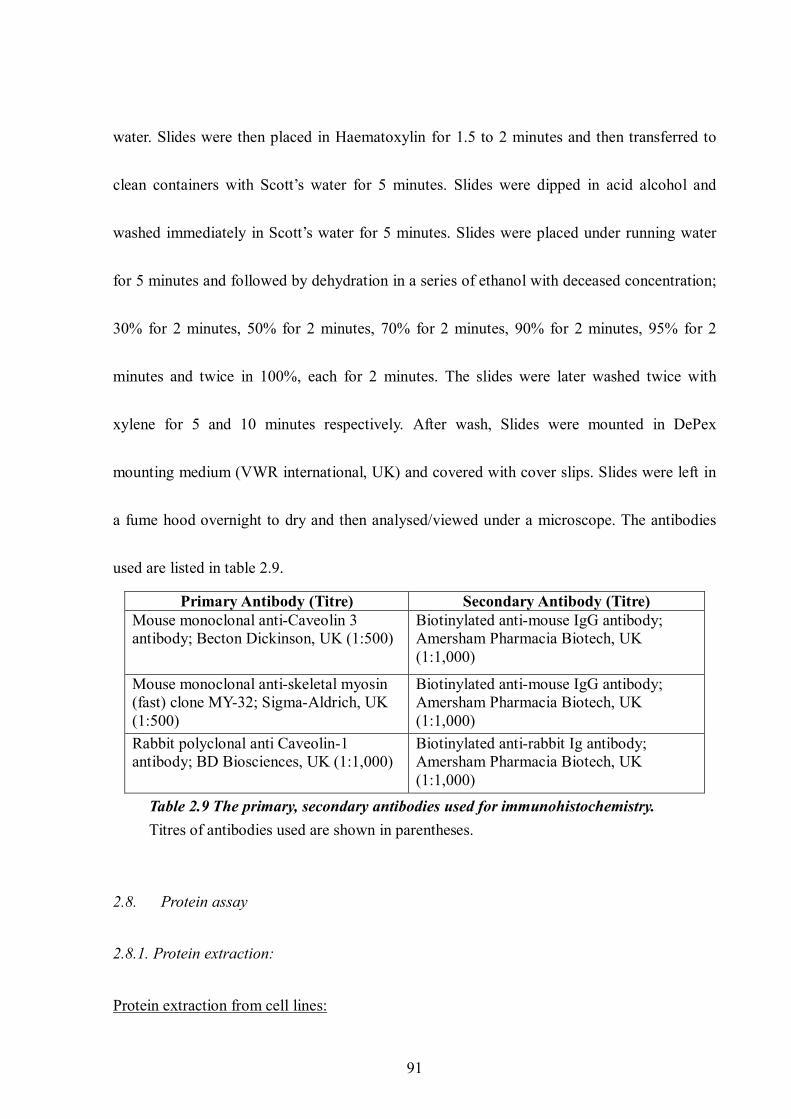
91
water. Slides were then placed in Haematoxylin for 1.5 to 2 minutes and then transferred to
clean containers with Scott’s water for 5 minutes. Slides were dipped in acid alcohol and
washed immediately in Scott’s water for 5 minutes. Slides were placed under running water
for 5 minutes and followed by dehydration in a series of ethanol with deceased concentration;
30% for 2 minutes, 50% for 2 minutes, 70% for 2 minutes, 90% for 2 minutes, 95% for 2
minutes and twice in 100%, each for 2 minutes. The slides were later washed twice with
xylene for 5 and 10 minutes respectively. After wash, Slides were mounted in DePex
mounting medium (VWR international, UK) and covered with cover slips. Slides were left in
a fume hood overnight to dry and then analysed/viewed under a microscope. The antibodies
used are listed in table 2.9.
Primary Antibody (Titre) Secondary Antibody (Titre) Mouse monoclonal anti-Caveolin 3 antibody; Becton Dickinson, UK (1:500)
Biotinylated anti-mouse IgG antibody; Amersham Pharmacia Biotech, UK (1:1,000)
Mouse monoclonal anti-skeletal myosin (fast) clone MY-32; Sigma-Aldrich, UK (1:500)
Biotinylated anti-mouse IgG antibody; Amersham Pharmacia Biotech, UK (1:1,000)
Rabbit polyclonal anti Caveolin-1 antibody; BD Biosciences, UK (1:1,000)
Biotinylated anti-rabbit Ig antibody; Amersham Pharmacia Biotech, UK (1:1,000)
Table 2.9 The primary, secondary antibodies used for immunohistochemistry. Titres of antibodies used are shown in parentheses.
2.8. Protein assay
2.8.1. Protein extraction:
Protein extraction from cell lines:

92
Protein was extracted from cells plated in 10-cm dishes with 8.5×10⁵ cells/dish density at 24,
48 and 96 hours after cultured with osteoblast-conditioned medium or differentiation medium
respectively (see section 2.2.2). The old medium was removed and cells were washed twice
with PBS. After washing, 100 μl of lysis buffer containing 15 μl of protease inhibitor solution
(Roche Diagnostic Ltd, UK) (the Radio Immuno Precipitation Assay or RIPA buffer) [50 mM
Tris (Fisher scientific, UK), 150 mM NaCl, 1% IGEPAL® CA-630 (Sigma-Aldrich, UK),
0.5% deoxycolic acid (Sigma-Aldrich, UK), sterile H2O to 100 ml; 1 protease inhibitor
tablet/1.5 ml dH2O added to 8.5 ml buffer for working solution](refer to APPENDIX 2 for
recipe) was added into the plate and cells were removed by cell scraper (SARSTEDT Ltd.,
UK) and collected in Eppendorf tubes on ice. The cell mixture was then subjected to a soni-
pre150 machine (Sonicator; Sanyo, UK) for 3-minute sonication with 10 amplitude/dunce one
to two times. The mixture was centrifuged at 13,000 rpm at 4°C for 2 minutes (Mikro20
Heltich, Zentrifugen). The supernatant was collected into Eppendorf tubes in small aliquots
and stored at -20°C for further use.
Protein extraction from embryos and adult limb muscles:
All the embryonic protein extracts and adult tissue extracts were prepared by Dr. Dean Larner
(Larner, 2012).

93
Embryonic stage E17.5 [C57BL10, mdx, cav3-/- and mdxcav3+/- (double mutant het; DMhet)]
pregnant mice were culled and uterus removed. Embryos were dissected and ground using a
mortar and pestle. RIPA buffer sufficient to just fully immerse the embryo (3 ml) was added
and the embryos were homogenized. These samples were then aliquoted into 5 ml bijoux
tubes. For adult muscle samples, triceps and quadriceps were removed from 4 week and 9
week mice (C57BL10, mdx, and cav3-/-). The muscles were just fully immersed with RIPA
buffer (1 ml) and homogenized. The homogenate was drawn into syringe using an 18 gauge
needle (1.2×40 mm; Terumo, UK) and extruded into labelled Eppendorf tubes (1.5 ml). To
remove any residual tissue the mixture was then spun at 14,000 rpm at 4°C for 20 minutes and
the supernatant aliquoted into labelled Eppendorf tubes for storage at -20 °C before use.
2.8.2. Determining Protein Yield:
Unknown samples were diluted and compared to a set of bovine serum albumin standards
(BSA; Pierce, UK). BSA standards were diluted with sterile ddH2O to obtain concentrations
of 0, 1, 2, 5, 10, 15 and 25 μg/ml. 100 μl of each standard was plated into a 96-well plate
(Nunc plasticware, UK) in duplicate. Unknown samples were diluted with sterile ddH2O in
1:100 and 1:400 ratios and 100 μl of each sample was plated into the 96-well plate along side
the standards. Equal volume of Coomassie® Protein assay reagent (Pierce, UK) was added
into each well and mixed well with protein samples. The plate was allowed to stand for 20

94
minutes at room temperature. The 96-well plate was read at λ=595 nm on Emax precision
microplate reader (Molecular Devices Ltd, UK) to obtain the standard curve for estimating the
sample concentrations. The samples were stored in small aliquots (40 μl/aliquot).
2.9. Protein-protein interaction assay
2.9.1. Immunoprecipitation (IP) assay:
Immunoprecipitation assay was performed following Dr. Lisanti’s protocol with subtle
modifications of the IP buffer (0.5% CHAPS was replaced with 1% IGEPAL® CA-630)
(Sotgia et al., 2000). Lysate samples used were limb muscle tissues from adult (4 week and 9
week) wt, cav3-/- and mdx mice (see section 2.8.1 for protein preparation from limb muscle
tissues). 100 μg of respective tissue lysates were diluted with 800 μl of IP buffer [50 mM
Hepes (Sigma-Aldrich, UK), pH 7.5, 1 mM EDTA, 1 mM dithiothreitol (DTT; Sigma-Aldrich,
UK), 1% IGEPAL® CA-630 (Sigma-Aldrich, UK), protease inhibitors]. 20 μl of Protein A
Sepharose CL-4B beads slurry (see section 2.9.2 for Protein A Sepharose CL-4B beads slurry
preparation) was added to preclean the lysates, avoiding non-specific binding of proteins to
the beads. 4 μl of rabbit polyclonal antibody directly against Cav-1 (1 μg; BD biosciences,
UK) were added into the precleared lysates and the lysates were incubated at 4°C for 2 hours.
30 μl of Protein A Sepharose CL-4B beads slurry was then applied to each sample to
immunoprecipitate Cav-1 and the associating complex at 4°C overnight. The bead-protein
95
complexes were spun down at 2500 rpm for 1 minute and the lysates were collected for future
use. The bead-protein complexes were washed with IP buffer for three times. After extensive
washing, equal amount (30 μl) of IP buffer containing sodium dodecyl sulphate (SDS) loading
buffer was added into each sample and the mixture was heat denatured at 100°C for 5 minutes.
After denaturation, samples were spun down at 13000 rpm and 15 μl of each sample were
separated by SDS-polyacrylaminde eletrophoresis gels (SDS-PAGE) with 12% acrylamide gel.
Separated proteins were transferred onto the nitrocellulose membrane. Blots were then probed
with antibodies directed against Cav-1, Cav-3, IGF-2 and Src, phospho-Src and b-
dystroglycan. Refer to section 2.10 for detailed description of immunoblotting.
2.9.2. Protein A Sepharose CL-4B beads slurry preparation:
0.25 g of Protein A Sepharose CL-4B powder (Amersham, UK) was suspended in distilled
water by gentle swirling. To wash away water soluble stabilization agents (i.e. alkaline used in
production of Sepharose CL-4B), approximately 50 ml of distilled water was added to the
beads suspension and the swollen beads were spun down at 2500 rpm (or less than 500×g),
decanting off the supernatant. The wash step was repeated three times, using fresh distilled
water each time. The swollen beads were kept in 20% ethanol (thus the Protein A Sepharose
CL-4B slurry) at 4°C to prevent the beads from being re-dried.

96
2.9.3. GFP-trap assay
Stable transfectants of non-dystrophic (C2C12-Cav1eGFP and C2C12-eGFP) and dystrophin-
deficient (dfd13-Cav1eGFP and dfd13-eGFP) myoblasts were cultured in DM for fourteen
days to form myotubes (see section 2.5.3 for stable clone selection). Protein was harvested
and the concentration was determined as described above in section 2.8. 30 μl of GFP-Trap®
beads slurry (ChromoTek GmbH, Germany) was washed with 500 μl of dilution buffer (10
mM Tris-Cl pH7.5, 150 mM NaCl, 0.5 mM EDTA) trice and spun at 2,500 rpm for 2 minutes
at 4°C. 300 μg of protein samples were aliquoted into GFP-Trap® beads. IP buffer (50 mM
Hepes, pH 7.5, 1 mM EDTA, 1 mM dithiothreitol, 1% IGEPAL® CA-630, protease inhibitors)
was added to the beads-protein mixture up to 1 ml and the mixture was incubated at 4°C
overnight. Complexes were spun at 2,500 rpm for 2 minutes at 4°C and supernatant was
collected. Complexes were washed twice with 500 μl of IP buffer and collected by
centrifugation at 2,500 rpm for 2 minutes at 4°C. 30μl of RIPA buffer with 1×SDS loading
buffer was aliquoted into the complexes. This mixture was first boiled at 100°C for 10
minutes and placed on ice prior to immunoblotting.
2.10. Immunoblotting (Western Blotting)
Protein samples were separated on SDS-PAGE. SDS is present in both the loading buffer and
gels used in this method and acts as a reducing agent to unfold the secondary structure of

97
proteins. SDS works by coating proteins with negative charge in proportion to the protein
length such that proteins were separated by molecular weight (MW) (Towbin et al., 1979).
The percentage of acrylamide in the resolving gel depends on the sizes of the proteins to be
separated (Table 2.10).
Percentage (%) Acrylaminde
Range of protein separation (kDa)
5 57-212 7.5 36-94 10 16-68 12 13-50 15 12-43
Table 2.10 The percentage of polyacrylamide used in SDS-PAGE gels to separate different sized proteins. (Taken from Amersham Pharmacia Biotech UK Ltd HybondTMECLTM Nitrocellulose Membrane reference manual)
2.10.1. Electrophoresis:
BioRad Mini-Protein II gel apparatus (Bio-Rad Laboratories Ltd, UK) was employed for
vertical electrophoresis. Glass plates were cleaned and assembled into the gel holder with
same size spacers. The gel holder was clipped to the gel-casting tray and the mixture of
acrylaminde was poured in between the glass plates for poly-acrylaminde gel preparation. Gel
percentage used depends on size of protein(s) of interest (Table 2.10). Once proper separation
was achieved, proteins were transferred from gel to the nitrocellulose membrane (Amersham,
UK) and the membrane was cut in half if needed. Membrane containing proteins with
molecular weight lower than 30 kDa was probed for molecules such as Cav-3, Cav-1 and
active IGF-2; membrane containing proteins with molecular weight above 40 kDa was probed

98
for molecules such as Erk, phospo-Erk, Akt, phospho-Akt and Pax7.
The molecular weights of Cav-3 and Cav-1 are 17.5 kDa and 22 kDa respectively; therefore a
12% resolving gel was chosen to separate the protein samples. One 12% resolving gel was
made by gently and thoroughly mixing 1.6 ml of dH2O, 2.0 ml of 30% acrylamide (Protogel;
Geneflow Ltd, UK), 1.3 ml of 1.5 M Tris-HCl (pH8.8; Tris base, Fisher scientific, UK), 50 μl
of 10% SDS (Fisher Scientific, UK), 50 μl of Ammonium Persulfate (APS; Sigma-Aldrich,
UK), and 2 μl of N,N,N',N'-Tetramethylethylenediamine (TEMED; Sigma-Aldrich, UK).
Acylaminde polimerization is initiated and accelerated respectively by APS and TEMED so
that APS and TEMED were added right before the mixture was poured in between the glass
plates. The mixture was poured in between two glass plates until the mixture reached 3/4 of
the way up the plates. A small amount of isopropanol was added to level the gel surface and
the gel was set for approximately 30 minutes (or until solid) at room temperature. A 5%
stacking gel was prepared by mixing 1.4 ml of dH2O, 0.33 ml of 30% acrylamide, 0.25 ml of
1.0 M Tris-HCl (pH6.8), 20 μl of 10% SDS, 20 μl of APS and 8.5 μl of TEMED. This mixture
was poured on top of the resolving gel and the gel comb then slid in between the two glass
plates, avoiding bubbles and before the stacking gel had set. The Gel was allowed to set for
approximately 30 minutes (or until solid) at room temperature.
Protein samples were prepared whilst gel was set to solidify. 20 μg of total protein extract
from cell samples and 15 μg of total protein extract from embryonic samples (see section

99
2.8.2 for protein yield determination) were mixed with 2.5 μl of 6×SDS Sample Buffer (see
appendix 2 for 6×SDS Sample Buffer recipe) to reach a final volume of 15 μl. Sample
mixture was boiled at 100°C for 5 minutes and then placed on ice. The mixture was
centrifuged at 13,000 rpm for 1 minute and kept on ice for loading.
Combs were removed after gels solidified completely. The gel holder was un-clipped from
gel-casting tray and was placed into the electrophoresis tank (BioRad Laboratories Ltd, UK).
Chambers inner and outer were filled with SDS running buffer [3 g of Tris, 14.42 g of glycine,
1 g of SDS and dH2O to 1 Litre]. Samples and 4 μl prestained protein marker (New England
Biolabs Ltd, UK) were loaded into individual wells. Gel was run at 70 V (constant voltage)
first and the voltage was changed to 110V once the dye was stacked and started to enter the
resolving gel. The gel was run on ice until the marker was separated properly or when the dye
front reaches the end of the gel.
2.10.2. Transfer Blotting:
Running apparatus was dismantled and glass plates were removed from gel holder. The gel
was removed from glass plates and the stacking gel was cut away by scalpel. One piece of
HybondTMECLTM Nitrocellulose membrane (Amersham Life Science, UK) cut to the same
size as the gel was soaked in dH2O for 1 minute to activate the membrane, and then placed
into transfer buffer [0.03 g of Tris, 14.4 g of glycine, 200 ml of Methanol and dH2O to 1 litre]

100
until used. The Membrane was cut on the upright corner allowing subsequent orientation and
placed on top of the gel with copious transfer buffer to prevent bubbles. The Gel and
membrane were then sandwiched between four pieces of filter paper and two pieces of sponge
pads (two pieces of filter paper and one piece of sponge pad each side). The sandwich was
placed into a mini transfer blotting cassette (BioRad Laboratories Ltd, UK) with the gel side
being positioned to the black-side of the transfer cassette case (-ve/negative charge) and the
membrane side next to the clear/transparent side (+ve/positive charge). The cassette was
clipped shut and placed into the blotting apparatus with the black side facing the black (-ve)
electrode. Transfer buffer was added to the tank and the tank was connected to the power
supply. Transfer was run at 100 V (constant current 220 mA) at 4°C (cold room) for 75
minutes.
2.10.3. Hybridization, Detection and Analysis:
The transfer equipment was dismantled and the gel was discarded. The membrane was
incubated in blocking buffer [50 ml of TBS (see appendix 2 for TBS recipe), 2.5 g of non-fat
milk (5% w/V; Marvel, UK) and 50 μl of Tween®20] at room temperature for 1 hour. The
primary antibody (see table 2.10) was diluted in blocking buffer and overlaid to the membrane
before being sealed into a plastic bag. The membrane was incubated overnight at 4°C with
vigorous agitation on an orbital shaker (IKA® KS 130 shakers; GmbH & Co. KG, Germany).

101
The following day, the membrane was washed trice (10 minutes each time) in wash buffer
(TBST; TBS with 0.1% Tween®20) and then probed with biotinylated secondary antibody
(diluted in blocking buffer) appropriate to the primary antibody (table 2.10). The membrane
was incubated at room temperature for 1 hour with vigorous agitation and after washing with
TBS trice (10 minutes each time) was probed with streptavidin-conjugated DyLight(TM) 800
(Fisher Scientific Ltd, UK) for 30 minutes at room temperature in the dark to amplify the
signal. The membrane was then washed with TBS trice (10 minutes each time) to remove the
detergent and the signal was detected using an Odyssey® infrared imaging system (LI-COR
Biotechnology, UK). As the levels of tubulin vary in dystrophic embryos, we used coomassie
blue staining of the nitrocellulose membranes as loading control (Figure 2.5).
Figure 2.5 Protein levels of α-tubulin vary in dystrophic embryos. Whole protein extracts were collected from decapitated E17.5 embryos of wt, mdx, cav-3-/- and DMhet. Proteins were harvested by grinding the fresh embryos in RIPA buffer. (Refer to section 2.8.1 for detail) (A) 15 μg of each protein sample was loaded for immunoblotting of Cav-1, Cav-3 and Pax7 and α-tubulin. (B) Levels of α-tubulin protein increase in mdx and DMhet but decrease in cav-3-/- compared with wt (n = 2). Cav-1: caveolin-1; Cav-3: caveolin-3; cav-3-/-: Cav-3 knockout; DMhet: mdx with cav-3 heterozygous knockout.
A B

102
The primary and secondary antibodies used and their titre are listed in table 2.11.
Primary Antibody (Titre) Secondary Antibody (Titre) Tertiary Antibody (Titre) (applied when biotinylated
2nd Ab was used) Mouse monoclonal anti-β- actin antibody (1:20,000)
Biotinated Anti-mouse IgG antibody (1:20,000)
Mouse anti-β-dystroglycan antibody [MANDAG1 (7A11)] (1:1,000) Anti-p-ERK (E-4) mouse monoclonal antibody (1:1000) Mouse anti-mannose 6-phosphate / IGF II receptor, cation-independent (86F7) (1:1,000) Mouse monoclonal anti-Pax7 antibody; DSHB, USA (1:500)
Biotinylated anti-mouse IgG antibody (1:1,000)
Mouse monoclonal anti-IGF2 antibody (1:500)
Biotinated Anti-mouse IgG antibody (1:100) Biotinylated anti-mouse IgG antibody (1:500) (for cell samples)
Mouse monoclonal anti- caveolin 3 antibody (1:500)
Odyssey anti-mouse IRDye® 680 (1:1,000) (for embryonic samples)
Anti-Src (L4A1) Mouse monoclonal antibody (1:500) Monoclonal Anti-α-Tubulin antibody produced in mouse (1:10,000)
Odyssey anti-mouse IRDye® 680 (1:1,000)
Rabbit anti-mouse Akt antibody (recognize Akt1, Akt2 and Akt3) (1:500) Rabbit anti-mouse phospho-Akt (Ser473) antibody (recognize Akt1, Akt2, Akt3) (1:1,000) Rabbit anti-caspase 3 antibody (1:2,000) Anti-ERK1(K-23) rabbit polyclonal antibody (1:1000) Phospho-mTOR (ser2448) rabbit monoclonal antibody (1:1,000) mTOR (7C10) rabbit monoclonal antibody (1:1,000) Rabbit anti-Phospho-Src Family (Tyr416) antibody (1:500)
Biotinylated anti-rabbit Ig antibody (1:1,000)
Odyssey anti-rabbit IRDye® 680 (1:500) (for cell samples)
Rabbit polyclonal anti Cav-1 antibody (1:5,000)
Biotinylated anti-rabbit Ig antibody (1:1,000) (for embryonic samples)
Goat anti-Kip2 p57 (M-20) (1:500) Anti-Sheep/goat Ig biotinylated (1:1,000)
DyLight(TM) 800 Conjugates-Streptavidin (1:20,000)
Table 2.11 Primary, secondary and tertiary antibodies used for immunoblotting analysis. Titres of antibodies used are shown in parentheses.

103
2.11. Determining the mechanical property of myoblasts and myotubes using atomic force
microscopy
The mechanical properties of dystrophin-deficient and non-dystrophic myoblasts/myotubes
were determined using a NanoWizard II atomic force microscope (AFM; JPK, Germany) at
18°C in collaboration with Dr. James Bowen (School of Chemical Engineering, the University
of Birmingham). Additional lighting from a LED light source (Schott, UK) was applied from
the bottom of the microscope for the purpose of finding the target cells easily through the
poly(styrene) Petri dishes. The measurements required the use of a CellHesion module (JPK,
Germany), affording an increased vertical scanning distance of up to 100 μm. Data acquisition
was performed using rectangular Si cantilevers (type CONT-L, NanoWorld AG, Switzerland)
which exhibited sphericonical tips with 2 μm nominal radii of curvature. As the cantilever
approaches the cell surface and contacts it, tip-sample interactions lead to a vertical deflection
of the cantilever (figure 2.6 A).
A C

104
Figure 2.6 Illustration of how the atomic force microscopy (AFM) works. (A) The illustration of how the probe of AFM scans across the material surface. (B) A representative picture of the scanned force map and the corresponding force-displacement curve. (C) A representative picture of the cell height. Scheme (A) was taken from the JPK website.
The height of the contact point was recorded, representing one pixel in the image, which was
converted into a map of surface topography. A maximum compressive load of 10 nN
(Nanonewtons) was applied to the surface during data acquisition, which corresponded to a
small strain during the indentation of a cell. The deflection (x) was converted to force (F)
using Hooke’s law;
F = −kx
Here k is the cantilever spring constant which was in the range 0.1-0.2 N/m, and was
calibrated by Dr. James Bowen according to the method reported previously (Bowen, 2010).
The force maps were scanned with a resolution of 60×60 pixels (Figure 2.6 B). From each cell,
B

105
9 pixels were selected and those force-displacement curves were analysed using a Hertzian
model to obtain a mean Young's modulus for each cell. The mechanical properties of wild
type and dystrophin-deficient myoblast cell lines were tested three times with 10 cells
examined each time. The mechanical properties are reported in kilopascal (kPa). The
mechanical property test of myolasts/myotubes was performed with the help of Dr. James
Bowen (School of Chemical Engineering, University of Birmingham).
AM2 acknowledgement
The atomic force microscope used in this research was obtained, through Birmingham
Science City: Innovative Uses for Advanced Materials in the Modern World (West Midlands
Centre for Advanced Materials Project 2), with support from Advantage West Midlands
(AWM) and part funded by the European Regional Development Fund (ERDF) awarded to
School of Chemical Engineering, the University of Birmingham.
2.12. Sequence alignment
The alignment of caveolin amino acid sequences was performed using the alignment tools of
Biology Workbench developed by the San Diego Supercomputer Center (SDSC), Department
of Bioengineering at University of California, San Diego. The amino acid sequences of mouse

106
caveolin-1, 2 and 3 were obtained from the National Center for Biotechnology Information
(NCBI) website; the accession numbers are NP_031642, NP_058596 and NP_031643
respectively. The mouse dystrophin amino acid sequence (accession number: NP_031894)
was also obtained from NCBI but only the actin binding domain of dystrophin (amino acids
14-240) was used for alignment via NCBI Basic Local Alignment search tool (BLAST). The
resulting actin binding sequence which has homologous counterpart in caveolin was then used
for final alignment by alignment tool from SDSC Biology Workbench.
2.13. Statistics analysis
All western experiments were at least three repeats of different protein samples obtained at
different times (unless mentioned), except the embryonic samples (n is indicated in each
figure legend). For fusion index and apoptosis index analysis of myoblasts, each data point
was triplicate with two repeats (total six samples for each data point). Standard error was
obtained using analysis of variance (ANOVA) using Microsoft excel.

107
Chapter 3. The osteoblast MC3T3-E1 cell line promotes differentiation of dystrophin-
deficient myoblasts
3.1. Introduction:
Muscle fibre size variation is found in the skeletal muscles of DMD mouse model mdx mice
compared to the non-dystrophic mice, especially an increase in the number of small size fibres
in adult mdx mice and lower fibre density in embryonic mdx mice (Merrick et al., 2009;
Tanabe et al., 1986; Torres and Duchen, 1987). These small fibres found in mdx suggest
impairment of muscle fibre differentiation and maturation as a significant component of the
progressive pathology in mdx and DMD. In a preliminary study, we found fusion impairment
of skeletal myoblasts derived from 4 week-old mdx mice (Figure 3.1).
Figure 3.1 Fusion impairment of mdx derived skeletal myoblasts. Primary skeletal myoblasts were isolated from 4 week-old mdx and wt mice. The fusion capacity of the myoblasts was investigated in proportion to the total number of myoblasts in cultures (%). (-): no fusion; (+, ++, +++) different degrees of fusion. This is unpublished data of Dr. Janet Smith. Skeletal myoblasts derived from 4 week-old mdx mice showed impairment of fusion.

108
It has been reported that DMD myoblasts isolated from twelve DMD patients with age of 3-11
produced myotubes which are shorter, thinner and have fewer myonuclei compared to those
from age-matched controls when these myoblasts were treated with low mitogen medium for
21 days (Delaporte et al., 1984). However, a report suggests that dystrophin-deficient
myoblasts exhibit no impairment of differentiation. Frances Chandler’s group (Blau et al.,
1983) suggested that myoblasts isolated from six DMD patients between the age of 1-13
showed differentiation ability comparable to those isolated from age-matched controls
through the analysis of myotube morphology and the level of acetylcholine receptors on the
myotube surface. When quantitated by staining for pan-MyHC, myoblasts isolated from mdx
mice of 2, 6 and 12 months old showed a similar differentiation efficiency to non-dystrophic
controls (Schuierer et al., 2005). The Chandler’s and Hughe’s groups adapted protocol
differred from the Fardeau’s group by culturing the muscle stem cells respectively on collagen
and matrigel (Blau et al., 1983; Delaporte et al., 1984; Schuierer et al., 2005). PD50A
myoblasts, a clonally mdx-derived (5 week-old) skeletal myoblast cell line, has been shown in
vivo to be able to fuse with myofibers and rehabitat the satellite cell positions when they are
transplanted into mdx mice (Smith and Schofield, 1994; Smith and Schofield, 1997). In this
report I examined in vitro whether the dystrophin-deficient (PD50A) differentiating myoblasts
have fusion impairment.
Elevated apoptosis and proliferation have been reported in both primary and clonally derived

109
myoblasts isolated from dystrophic (mdx and cav3-/-) adult/juvenile mice and embryos
compared to those from age-matched controls (Merrick et al., 2009; Smith et al., 1995;
Woods et al., 2000). It has also been reported that myoblast differentiation is accompanied by
apoptosis (Wang and Walsh, 1996). Several reports show that IGF-1 and IGF-2 can promote
myoblast differentiation (Engert et al., 1996; Florini et al., 1991; Kaliman et al., 1998).
Inhibition of AKT or ERK pathway that downstream IGF-1 and IGF-2 signalling reduces
myoblast differentiation and proliferation respectively (Coolican et al., 1997). IGF-2 is also a
survival factor for dystrophin-deficient myoblasts (Smith et al., 1995). IGF-2 is genetically
linked to a cell cycle inhibitor p57kip2 (Cyclin-dependent kinase inhibitor 1c or CDKN1c;
homologue of p21CIP1) in a cluster of imprinted genes in human chromosome 11p15.5 and
down-regulates p57kip2 (Caspary et al., 1999; Grandjean et al., 2000; Matsuoka et al., 1996).
It thus has alternate signalling pathway acting via p57kip2, which is not activated by IGF-1,
and which is active in skeletal muscle cells. In addition, LIF can promote skeletal muscle
regeneration in vivo (Kurek et al., 1997). To establish the relationship between differentiation
and apoptosis in dystrophin-deficient myoblasts, I examined the effects of IGF-1, IGF-2 and
LIF on myoblast differentiation.
It has been reported that Cav-1 is present predominantly in proliferating myoblasts, whereas
Cav-3 is present in differentiating myoblasts and myotubes (Volonte et al., 2005). In DMD
and mdx, there is elevated level of Cav-3 (Merrick et al., 2009; Repetto et al., 1999; Vaghy et

110
al., 1998). In the present report, I examined whether there are differential expressions of Cav-
1 and Cav-3 between differentiating dystrophin-deficient and non-dystrophic myoblasts and
whether these have a functionally significant effect on differentiation.
3.2. Results:
To establish whether the PD50A (dystrophin-deficient) myoblasts has impaired differentiation,
I counted the number of myotubes and myonuclei of PD50A myoblasts treated with low
mitogen medium for seven days. The number of myotubes were normalised to the surface
area covered by differentiating myoblasts. The number of myonuclei is presented as the
number of nuclei in myotubes per cm2 of surface area.
3.2.1.Differentiation capacity of dystrophin-deficient myoblasts is reduced
The number of myonuclei (number of nuclei in myotubes/cm2) of C2C12 myoblasts under
low mitogen condition (differentiation medium or DM; DMEM with 2% horse serum) is
about four fold higher than that in PD50A myoblasts under the same condition. The number
of myonuclei is 2727 ± 235 in differentiating C2C12 myoblasts vs. 672 ± 110 in
differentiating PD50A myoblasts (Figure 3.2 A, B and C; p= 6.09×10⁻⁹). There are fewer
myotubes (less than a third) formed from PD50A (193 ± 29 myotubes/cm2) myoblasts than
C2C12 myoblasts (603 ± 33 myotubes/cm2) (Figure 3.2 A, B and D; p= 1.26×10⁻⁶).

111
Figure 3.2 The differentiation capacity of dystrophin-deficient myoblasts (PD50A) is impaired under low mitogen condition compared to non-dystrophic myoblasts (C2C12). (A) C2C12 (wt) and (B) dystrophin-deficient/dystrophic (PD50A) myoblast cell lines were subjected to DMEM medium with 2% horse serum (DM) for 7 days. Cells were fixed in 4% paraformaldehyde (PFA) and stained with Leishmain’s stain to label the nuclei. Representative multinucleated myotubes are indicated by red arrows. (C) Myonuclei is defined as the number of nuclei in myotubes per area surface (cm2). (D) Myotube number is normalised to surface area. ANOVA; * * p < 0.05 ; Data presented are the average of triplicate. Scale bar = 100 μm.
C D
A B

112
In addition, Leishman’s stain shows that the width and length of myotubes formed from
PD50A myoblasts appear to be less than those formed from C2C12 myoblasts (Figure 3.2 A
and B). From these data, it appears that the differentiation capacity of PD50A dystrophin-
deficient myoblasts is impaired in culture compared to the non-dystrophic myoblast line
C2C12.
3.2.2. MC3T3-E1 osteoblasts induce differentiation of both C2C12 and PD50A
myoblasts
Because the dystrophic myoblasts induced by the standard (mitogen withdrawal) method
differentiate poorly (section 3.2.1; Figure 3.2), I tried to find a method that can promote
myoblast differentiation better than the low mitogen treatment, especially for the dystrophin-
deficient myoblasts. Previous study in our lab (unpublished data of Leah Foley and Dr. Janet
Smith) suggests that osteoblasts MC3T3-E1 have the potential for inducing myoblast
differentiation when they were co-cultured with non-dystrophic and dystrophin-deficient
myoblasts. To establish this method, MC3T3-E1 cells were plated together with C2C12 or
PD50A cells for 4 days. The resulting myotubes were fixed and stained with Leishman’s stain,
which labels the nuclei; the differentiation capability of these cells was determined by scoring
multinucleated myotubes and was represented as the number of myonuclei and the number of
myotubes normalised with surface area (cm2).

113
Figure 3.3 Coculture with osteoblasts promotes the differentiation of myoblasts. Myoblasts were fixed with 4% PFA and then stained with Leishman’s stain on day 4 to investigate differentiation capability. (A) C2C12 and (B) PD50A myoblasts were treated with DM for 4 days; myotubes are indicated by red arrows. (C) Coculture with MC3T3-E1 osteoblasts increases the myonuclei of C2C12 cells though less effective than DM induction. Coculture with osteoblasts increases the myonuclei of PD50A myoblasts. (D) Coculture with osteoblasts increases the number of myotubes of C2C12 and PD50A myoblasts. ANOVA; ﹟ p< 0.05 ; ﹟﹟,** p< 0.01 ; * C2C12 vs. PD50A; ﹟ compared with GM) Data presented are the average of two repeats with triplicate for each; n = 6. Scale bar = 100 μm.
A B
C
D

114
In the early stages of differentiation (cultured in DM for 4 days), differentiating PD50A
myoblasts had significantly fewer myonuclei (number of nuclei in myotubes/cm2) (1117 ± 80)
compared to the differentiating C2C12 myoblasts (2527 ± 223) (Figure 3.3 C; p= 4.98×10⁻²).
Similarly, the total number of myotubes formed from PD50A myoblasts treated with DM
(DMEM with 2% horse serum) (391 ± 57) is about 42% of that formed from C2C12
myoblasts (917 ± 150) (Figure 3.3 D; p= 4.89×10⁻³). Coculture with osteoblasts increases
differentiation efficiency for PD50A compared to the DM treatment; the number of myonulcei
(1656 ± 253; p= 4.99×10⁻²) increases by 45% and the total number of myotubes (602 ± 53; p=
1.45×10⁻²) increases by 50% for PD50A (Figure 3.3 C and D). For C2C12 myoblasts,
coculture with osteoblasts also induces differentiation of C2C12 myoblasts but it is less
efficient as DM such that the number of myonuclei (1239 ± 89; p= 1.50×10⁻⁴) reduces by 50%
and total number of myotubes (514 ± 59; p= 2.08×10⁻²) reduces by 44% compared to those
treated with DM (Figure 3.3 C and D). These data suggest that coculture with osteoblasts can
induce the differentiation of both PD50A and C2C12 myoblasts and that coculture with
osteoblasts induces differentiation of PD50A myoblasts most effectively.

115
Figure 3.4 Factors secreted from osteoblasts promote the differentiation of C2C12 myoblasts. Myoblasts were fixed with 4% PFA and then stained with Leishman’s stain on day 4 to investigate differentiation capability. Osteoblasts and C2C12 secrete factors that promote PD50A differentiation while PD50A secrete factors that inhibit myoblast differentiation. The differentiation capability of myoblasts is presented as (A) number of myonuclei and (B) number of myotubes. All conditioned medium treatments were performed in the presence of 2% HS plus 5% FCS. C2C12 and PD50A myoblasts treated with DM+5 (2% HS+ 5% FCS) serve as controls for determining the effects of conditioned medium. Differentiation ability of myoblasts were examined under osteoblast-conditioned medium (OCM), conditioned medium from C2C12-osteoblast coculture (CCM) and conditioned medium from PD50A-osteoblast coculture (PDCM) for 4 days. ANOVA; ﹟ p<0.05 ; ﹟﹟,** p<0.01 ; * C2C12 vs. PD50A; ﹟ compared to the DM+5 treatment. Data presented are the average of two repeats with triplicate for each; n = 6.
A
B

116
Osteoblast-myoblast contact is required for induction of differentiation for PD50A myoblasts
To test whether this osteoblast induction effect came from osteoblast-myoblast contact or
from secreted factors produced by osteoblasts, PD50A and C2C12 were cultured in the
presence of conditioned medium from osteoblasts [OCM; 50% osteoblast-conditioned
medium with 50% differentiation medium (DM)]. This 50% conditioned medium protocol
which has been established previously maintains the myoblast culture without compromising
their ability to differentiate under appropriate induction (Smith and Schofield, 1994). As the
conditioned medium collected from osteoblasts culture contained 10% FCS, medium with 2%
HS and 5% FCS (DM+5) were used as control. After cultured for 4 days, the number of both
myonuclei (2203 ± 299; p= 2.40×10⁻³) and myotubes (818 ± 181; p= 4.17×10⁻²) produced by
C2C12 is 2 fold more in OCM treatment than in DM+5 control (myonuclei: 987 ± 141;
myotubes: 412 ± 60) (Figure 3.4 A). However, it has no effect on the number of myonuclei
and myotubes in differentiating PD50A myoblasts compared to the DM+5 control (Figure 3.4
A). These data suggest that osteoblast-myoblast contact is required for induction of
differentiation by osteoblasts in PD50A and that factors secreted from osteoblasts are capable
of promoting the differentiation of C2C12 myoblasts. However, the effects of FCS on
myoblast differentiation can not be excluded (refer to section 3.2.3; Figure 3.6).
To further examine whether osteoblast-myoblast coculture secretes factors that have an effect
on myoblast differentiation, I collected conditioned medium from C2C12-osteoblast coculture

117
(CCM) and PD50A-osteoblast coculture (PDCM) respectively. Myoblasts (both C2C12 and
PD50A) were treated with either CCM or PDCM for 4 days before the myotubes were fixed
and stained with Leishman’s stain.
PD50A myoblasts treated with CCM display 2 fold more myonuclei (2533 ± 296) and
myotubes (985 ± 95) compared to those treated with DM+5 (Figure 3.4 A and B; p = 1.18×10-
3 for myonuclei; p= 6.69×10⁻³ for myotubes). Similarly, C2C12 myoblasts treated with CCM
exhibit differentiation capacity (myonuclei 1895 ± 330; number of myotubes 851 ± 150) 2
fold more than those treated with DM+5 (Figure 3.4 A and B). Conversely, PDCM treatment
has no effects on the number of myonuclei and myotubes for PD50A and C2C12 myoblasts
compared to the DM+5 controls (Figure 3.4 A and B). These data suggest that C2C12-
osteoblast coculture produces soluble differentiation promoting factors which PD50A-
osteoblast coculture do not. The data also suggest that there is disruption of signalling in
dystrophin-deficient myoblasts.
3.2.3. Fetal calf serum (FCS) promotes differentiation of PD50A myoblasts but suppresses
differentiation of C2C12 myoblasts
In section 3.2.2, myoblasts and osteoblasts coculture was supplementd with 10% FCS and
myoblasts cultured in conditioned medium was also supplemented with 5% FSC. To study the
effect of FCS on myoblast differentiation, I examined the fusion index of myoblasts

118
supplemented with 0, 0.5, 5 and 10% FCS. The fusion index is scored by immunostaining the
myotubes with anti-pan-myosin (MF20) antibody after ten days of culture and defined as the
ratio of nuclei in myotubes versus total nuclei.
I first scored the fusion index of myoblasts cocultured with osteoblasts (Figure 3.5). C2C12
myoblasts show higher fusion index than PD50A myoblasts under growth permissive (GM) or
low-mitogen (DM) differentiation conditions (Figure 3.5 A, B and C), demonstrating that
dystrophin-deficient myoblasts (PD50A) have lower differentiation efficiency compared to
the wt myoblasts (C2C12). For PD50A myoblasts, coculture with osteoblasts induces 8 fold
more myotube formation compared to GM control (Fusion indices are 12.62 ± 0.90% and
1.41 ± 0.51% respectively) (Figure 3.5 B and C; p= 1.36×10⁻²). Fusion index for PD50A
myoblasts under OCM is comparable to that of PD50A cocultured with osteoblasts and is
about 2 fold that of PD50A under DM+5 (6.11 ± 0.81%) (Figure 3.5 B and C; p= 2.94×10⁻³).
Coculture of C2C12 myoblasts with osteoblasts leads to 4.26 fold more induction of
differentiation compared to those treated with GM (Fusion indices are 14.36 ± 1.07% and
3.37 ± 0.58% respectively) (Figure 3.5 A and C; p= 8.40×10⁻⁴). C2C12 myoblasts treated with
OCM (12.91 ± 0.69%) show fusion index comparable to that of coculture (Figure 3.5 A and
C). Together, data here indicate that in later stages of differentiation (10 days after
differentiation induction), osteoblasts can effectively induce differentiation of both
dystrophin-deficient and non-dystrophic myoblasts.
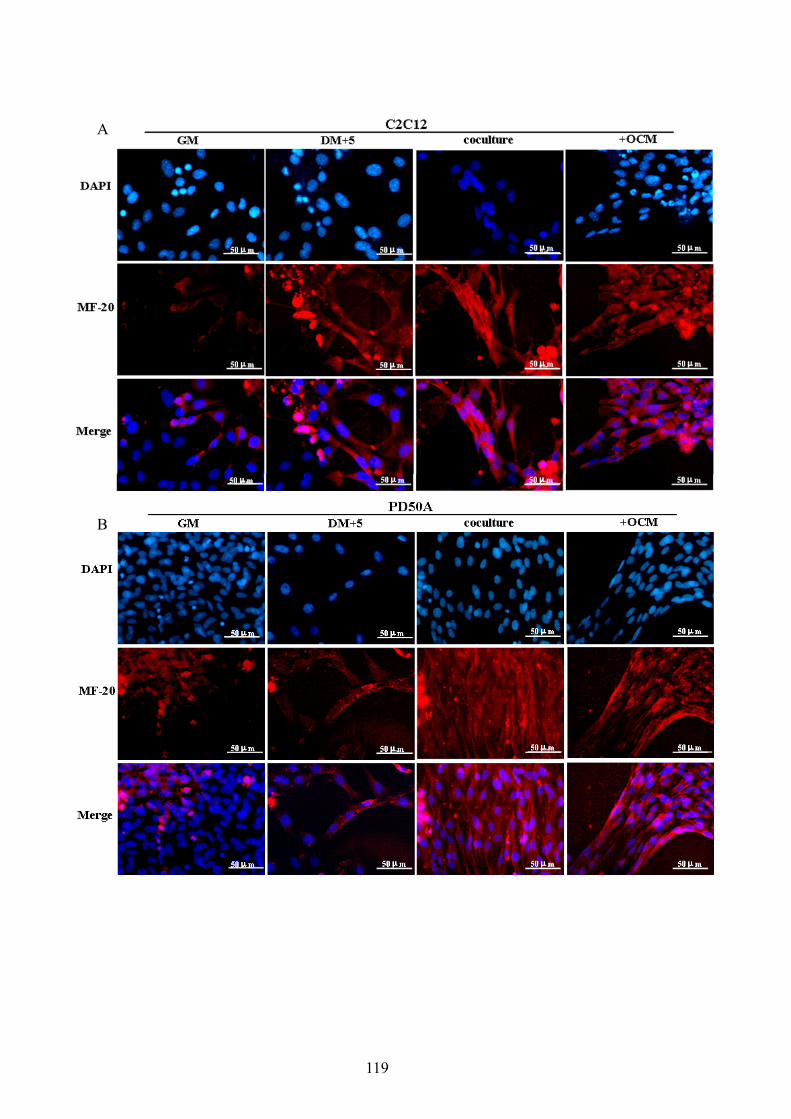
119
B
A

120
Figure 3.5 Osteoblasts secrete factors to promote differentiation of C2C12 and PD50A myoblasts. Myoblasts (1.5×10⁴) plated in 48-well plates were treated with GM, DM and OCM or cocultured with MC3T3-E1 osteoblasts. Because myosin heavy chain (labeled by MF-20) expresses in differentiated myotubes, myoblasts were cultured for 10 days to obtain myotubes for MF-20 labelling. The myotubes were fixed with 4% PFA and stained with anti-pan-myosin (MF-20) antibody. (A) C2C12 myotubes are positive for MF-20. (B) PD50A myoblasts in coculture and OCM form more myotubes than in GM and DM; revealed by MF-20 staining. Ten different regions of each treatment were selected randomly and more than one hundred and fifty cells were counted. Data presented here are triplicates for each treatment. (C) The differentiation induction potential of osteoblasts for C2C12 and PD50A myoblasts is presented as fusion index. The fusion index is defined in percentage as the ratio of nuclei in myotubes versus total nuclei. (ANOVA; *,﹟p <0.05; ﹟﹟p <0.01; ﹟compared to the control; *compared to the C2C12; n = 3). GM: growth medium (with 10% FCS); DM+5: differentiation medium with 5% FCS; OCM: osteoblast-conditioned medium
C

121
Figure 3.6 Fetal calf serum (FCS) promotes differentiation of PD50A myoblasts but suppresses differentiation of C2C12 myoblasts. Myoblasts (1.5×10⁴) plated in 48-well plates were treated with DM supplemented with 0, 0.5, 5 and 10% fetal calf serum (FCS) to examine the effect of FCS on myoblast differentiation. Myoblasts were cultured for 4 days to test the effect of FCS on early stage of myoblast differentiation. The myotubes were fixed with 4% PFA and stained with anti-pan-myosin (MF-20) antibody. Ten different regions of each treatment were selected randomly and more than two hundred and fifty cells were counted. The differentiation efficiency for C2C12 and PD50A myoblasts is presented as fusion index. The fusion index is defined in percentage as the ratio of nuclei in myotubes versus total nuclei. FCS promotes fusion of PD50A myoblasts but suppresses fusion of C2C12 myoblasts (ANOVA;﹟p <0.05; **,﹟﹟p <0.01; ﹟compared to the control; *compared to C2C12; n = 5). DM: differentiation medium; DMEM with 2% horse serum

122
I then examined the effect of FCS on myoblasts differentiation by scoring the fusion index of
myoblasts supplemented with 0, 0.5, 5 and 10% FCS. FCS has a positive effect on the
differentiation of dystrophin-deficient PD50A myoblasts. The fusion indices of PD50A
myoblasts supplemented with 5 (fusion index: 7.28 ± 0.6%; p=4.46×10⁻⁵) and 10% (fusion
index: 7.76 ± 0.44%; p=2.37×10⁻⁶) FCS increase by 2.6 fold compared to those without FCS
supplement (Figure 3.6). Conversely, FCS has a negative effect on the differentiation of
C2C12 myoblasts. Supplementing 0.5% FCS in C2C12 culture (fusion index: 5.69 ± 0.63%)
suppresses the fusion index by 40% compared to those without FCS supplement (fusion index:
9.32 ± 0.28%) (Figure 3.6; p= 3.8×10⁻⁴). The fusion indices of C2C12 myoblasts
supplemented with 5 (fusion index: 4.58 ± 0.44%; p=8.2×10⁻⁶) and 10% (fusion index: 3.56 ±
0.15%; p=4.2×10⁻⁸) FCS decrease respectively by 51% and 62% compared to those without
FCS supplement (Figure 3.6). These data can help explain why differentiation efficiency of
PD50A myoblasts is higher in coculture with osteoblasts than in OCM whereas that of C2C12
myoblasts is higher in OCM than in coculture with osteoblasts (section 3.2.2).

123
Figure 3.7 Myoblasts in OCM have total cell number fewer than in GM but greater than in DM. 1.5×10⁴ of myoblasts were plated 4 hours before they were shifted to GM, DM and OCM. Total cell number was determined in 24-hour intervals by haemocytometer for 4 days (refer to section 2.2). (A) C2C12 myoblasts in OCM have greater total cell number compared to C2C12 myoblasts in DM on day 4. (B) PD50A myoblasts in OCM have greater total cell number compared to the PD50A myoblasts in DM from day 3. Each column represents an average of two repeats; each repeat has triplicates. (ANOVA; *
compared to DM; *p<0.05; **p<0.01; n = 6). GM: growth medium (with 10% FCS); DM: differentiation medium (with 2% HS); OCM: osteoblast-conditioned medium. The cells under 50% OCM used DM (DMEM with 2% horse serum) as the rest 50%.
B
A

124
3.2.4.MC3T3-E1 osteoblasts reduce apoptosis of both wt (C2C12) and dystrophin-deficient
(PD50A) myoblasts via secreted factors
In addition to the differentiation promotion effect (refer to section 3.2.2), the effect of
osteoblast-conditioned medium on the total cell number of myoblasts was also determined
(Figure 3.7). The total number of C2C12 myoblasts in OCM increases with time (Figure 3.7
A). From day 2 to day 4, the total number of C2C12 myoblasts treated with OCM is greater
than those treated with low-mitogen differentiation medium (DM) (Figure 3.7 A). The total
cell number of PD50A myoblasts increases with time when they were treated with either DM
or OCM (Figure 3.7 B). From day 3 to day 4, total cell number of PD50A treated with OCM
lies between those treated with GM and DM (Figure 3.7 B). One thing noteworthy is that total
cell number of PD50A myoblasts is higher than that of C2C12 myoblasts under the conditions
examined (treated with GM, DM or OCM) from day 3 to day 4 (Figure 3.7; compare A and B).
As total cell number is the balance between cell survival and proliferation, greater total
number of cells observed in dystrophin-deficient myoblasts treated with OCM compared to
non-dystrophic myoblasts could be attributed to effects of OCM on either cell proliferation
rate or cell survival which is further investigated in the following section.

125
Oestoblast-conditioned medium reduces the apoptosis of myoblasts
To establish whether osteoblast-conditioned medium (OCM) has effect on myoblast survival,
I scored the apoptotic index of myoblasts treated with OCM at 24-hour intervals for 4 days.
The nuclei of myoblasts were labelled with DAPI and the apoptotic nuclei (apoptotic body)
can be identified as condensed chromatin (Figure 3.8 A and B, arrows). Both wt (C2C12) and
dystrophin-deficient (PD50A) myoblasts exhibit an increased apoptotic index under low
mitogen condition (DM) (Figure 3.8 B and C). The apoptotic indices of C2C12 and PD50A
treated with DM lie respectively between 1.88 ± 0.24% to 5.44 ± 0.88% and 1.74 ± 0.34% to
9.95 ± 0.85% (Figure 3.8 B and C). In contrast, C2C12 myoblasts treated with OCM show
reduced apoptotic index compared to those treated with DM; the apoptotic index of the
C2C12 treated with OCM is between 0.88 ± 0.1% and 2.4 ± 0.23% (Figure 3.8 B). Similarly,
PD50A myoblasts treated with OCM exhibit reduced apoptotic index compared to those
treated with DM, with the apoptotic index between 0.44 ± 0.08% and 3.0 ± 0.36% (Figure 3.8
C). These data suggest that the increase in total myoblast number induced by OCM (Figure
3.7) may partly be attributed to its effect on the reduction of apoptosis in both C2C12 and
PD50A myoblasts.

126
Figure 3.8 Osteoblast-conditioned medium reduces the apoptotic index of PD50A myoblasts. 1.5×10⁴ of myoblasts were plated 4 hours before shifted to the following conditions. The Cells were labelled with 10 μg/ml of DAPI for 3 minutes to label DNA; apoptotic body is recognised as condensed DNA. The number of apoptotic bodies was scored at 24-hour intervals for 4 days. Apoptotic index is defined as the number of apoptotic bodies divided by total cell number. (A) Representative images of C2C12 and PD50A myoblasts in DM on day 4. The apoptotic body is indicated by arrows. (B) OCM reduces apoptosis of C2C12 cells compared to DM. (C) PD50A myoblasts in OCM have reduced apoptotic index compared to PD50A myoblasts in DM. Each point represents an average of two repeats; each contains triplicates (ANOVA; *p<0.05 ;** p<0.01 ; *compared with DM treatment; n = 6). DM: differentiation medium (DMEM with 2% HS); OCM: osteoblast conditioned medium (with 5% FCS).

127
B
A
C

128
Figure 3.9 The ratio of active/inactive caspase 3 decreases in differentiating PD50A myoblasts under osteoblast-conditioned medium (OCM) and increases in those under differentiation medium (DM). Cells were washed twice with PBS and then serum starved for 30 minutes before they were shifted to OCM or DM. Medium was changed every 2 days. (A) Whole cell extracts were harvested and immunoblotted with caspase 3 specific antibody to detect the ratio of active/cleaved and inactive/full length caspase 3 which reveals the progression of apoptosis. (B) Ratio of active/inactive caspase 3 decreases in C2C12 treated with DM while increases in PD50A treated with DM. Ratio of active/inactive caspase 3 decreases in PD50A in OCM. (ANOVA; *, ﹟ p<0.05 ; ﹟﹟ p<0.01 ; * compared to C2C12 myoblasts; ﹟compared to nondifferentiated control; n=3). Each column in (B) represents an average of three repeats. OCM: osteoblast-conditioned medium (with 5% FCS); DM: differentiation medium (with 2% HS)
B
A

129
Osteoblast-condition medium (OCM) treatment reduced caspase 3 activity of differentiating
dystrophin-deficient myoblasts
Caspase 3 is the key effector of the apoptosis pathway. The ratio of cleaved (active)/full
length (inactive) caspase 3 proteins is an important indicator of apoptosis mediated through
the caspase cascade. Although the protein levels of active and inactive caspase 3 of C2C12
myoblasts treated with OCM decrease with time, the ratio of active/inactive caspase 3 is
comparable to that of non-differentiated control (Figure 3.9 A and B). Differentiating PD50A
myoblasts induced with OCM have 36% reduction of the ratio of active/inactive caspase 3
compared to those induced with DM on the fourth day of induction for differentiation (Figure
3.9 A and B; p= 4.22×10⁻²). The reduced caspase 3 activity in PD50A myoblasts treated with
OCM suggests the anti-apoptosis effect of OCM shown in Figure 3.8. Conversely, C2C12
myoblasts induced to differentiate by DM have a decreased ratio of active/inactive caspase 3;
the ratio of active/inactive caspase 3 decreases by 34% at 96 hours compared to the non-
differentiated control (Figure 3.9 A and B; p= 1.41×10⁻²). These data suggest an inverse
relationship between myoblast differentiation and apoptosis. It further suggests that the
increased apoptosis seen in PD50A myoblasts is a consequence of defects in differentiation
caused by lack of dystrophin.
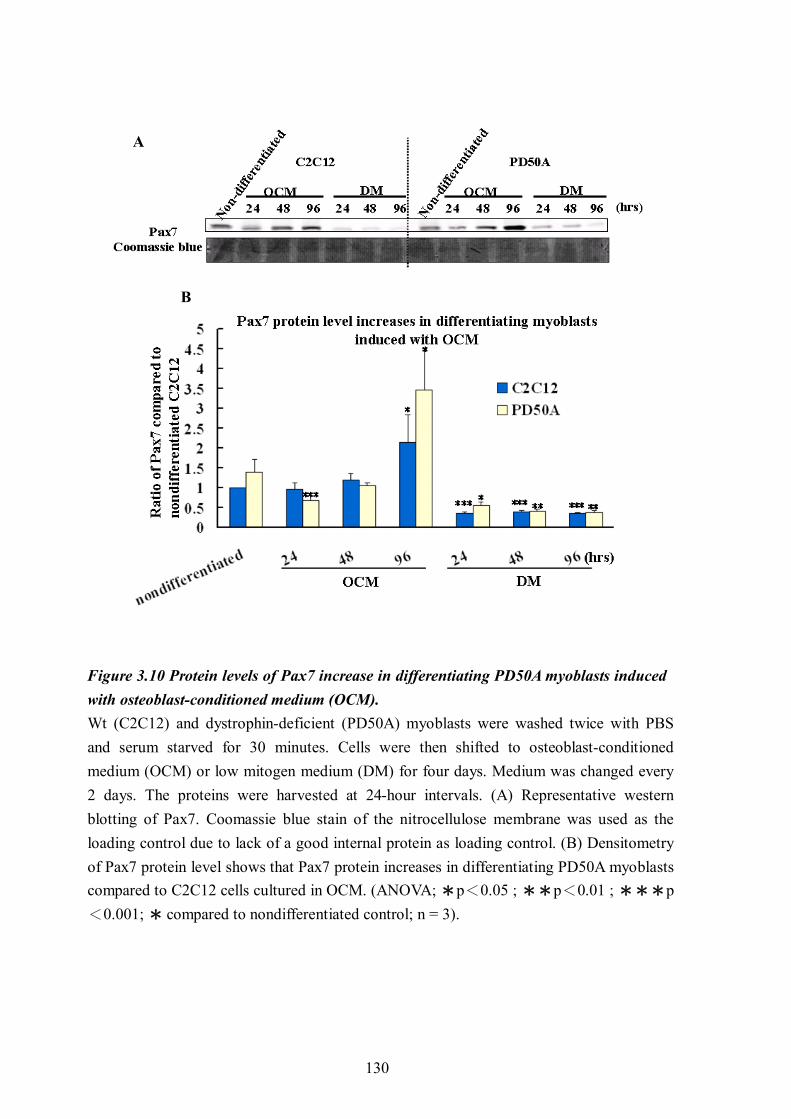
130
Figure 3.10 Protein levels of Pax7 increase in differentiating PD50A myoblasts induced with osteoblast-conditioned medium (OCM). Wt (C2C12) and dystrophin-deficient (PD50A) myoblasts were washed twice with PBS and serum starved for 30 minutes. Cells were then shifted to osteoblast-conditioned medium (OCM) or low mitogen medium (DM) for four days. Medium was changed every 2 days. The proteins were harvested at 24-hour intervals. (A) Representative western blotting of Pax7. Coomassie blue stain of the nitrocellulose membrane was used as the loading control due to lack of a good internal protein as loading control. (B) Densitometry of Pax7 protein level shows that Pax7 protein increases in differentiating PD50A myoblasts compared to C2C12 cells cultured in OCM. (ANOVA; *p<0.05 ; **p<0.01 ; ***p<0.001; * compared to nondifferentiated control; n = 3).
A
B

131
The level of Pax7 protein correlates with reduced apoptosis of myoblasts induced by
osteoblast-conditioned medium
It has been reported that Pax7 is required for the survival of satellite cells in postnatal mice
(Relaix et al., 2006). Previous reports showed that there is a decrease in the level of
transcription factor Pax7 protein and an attrition of Pax7-positive cells in mouse embryos of
mdx (mouse model of DMD) and cav3-/- (mouse model of limb girdle muscular dystrophy
type 1C) (Merrick et al., 2009). This down-regulation of Pax7 protein level correlates with the
increased level of apoptosis in myoblasts isolated from mdx and cav3-/- embryos (Merrick et
al., 2009). However, a detailed relationship between Pax7 protein level and apoptosis is not
established in differentiating myoblasts. I examined the expression patterns of Pax7 in
differentiating myoblasts (both C2C12 and PD50A) induced with low mitogen medium (DM)
or osteoblast-conditioned medium (OCM). I found that Pax7 protein levels in differentiating
C2C12 and PD50A myoblasts decrease with time when myoblasts were induced with DM but
not OCM (Figure 3.10 A and B). Surprisingly, there is an elevation of the level of Pax7
protein in both differentiating C2C12 and PD50A myoblasts induced with OCM; the levels
increase with time, particularly in differentiating PD50A myoblasts at 96 hours which show 3
fold more Pax7 compared to nondifferentiated controls (p= 4.83×10⁻²) (Figure 3.10 A and B).
These data suggest that levels of Pax7 in differentiating myoblasts correlate with the reduced
apoptosis seen in C2C12 and PD50A myoblasts treated with OCM (Figure 3.8).

132
3.2.5. Insulin-like growth factors promote proliferation and reduce apoptosis of dystrophin-
deficient myoblasts:
I have shown that osteoblast-conditioned medium (OCM) can promote the differentiation
(section 3.2.2) and reduce the apoptosis of myoblasts (section 3.2.4). One candidate for the
effects on differentiation and apoptosis is the presence of growth factors in the conditioned
medium. It has been shown that physiological concentrations of IGF-2 have a survival effect
for dystrophin-deficient myoblasts (Smith et al., 1995; Smith et al., 2000). Supraphysiological
concentration of IGF-1 can promote cell survival of IGF-2-deficient myoblasts in low
mitogen medium and proliferation of L6E9 myoblasts in the absence of serum (Engert et al.,
1996; Lawlor and Rotwein, 2000). IGF-1 exerts its mitogenic effect through insulin-like
growth factor receptor type 1 (IGF-1R) while the mitogenic effect of IGF-2 is mediated by
IGF-1R and insulin receptor (IR) (Morrione et al., 1997). However, Supraphysiological
concentration of IGF-1 activate IGF-1R, IR and insulin-like growth factor receptor type2
(IGF-2R) (Ballard et al., 1986). I have shown that conditioned media from osteoblasts (OCM)
and C2C12-osteoblast coculture (CCM) promote differentiation of PD50A myoblasts,
suggesting that growth factors have an effect on the induction of myoblast differentiation. To
understand the effects of IGF-1, IGF-2 and LIF on differentiating myoblasts, I cultured
PD50A and C2C12 myoblasts in DM supplemented with IGF-2 (20 ng/ml; physiological
concentration), IGF-1 (100 ng/ml; supraphysiological concentration) or LIF (1000 units/ml).

133
Figure 3.11 Growth factors increase mitotic index of differentiating myoblasts. C2C12 and PD50A myoblasts were cultured in DM supplemented with 100 ng/ml of IGF1 (supraphysiological concentration), 20 ng/ml of IGF2 (physiological concentration) or 1000 units/ml of LIF. Medium was changed every 2 days. The number of mitotic bodies was scored on the fourth day. Cells were fixed with 4% PFA and then labelled with 10 μg/ml of DAPI to score the mitotic index. The mitotic index is defined as the number of mitotic bodies divided by total cell number. (A) Representative image of mitotic body of PD50A in DM is indicated by arrows. (B) Growth factors (IGF-1, IGF-2 or LIF) increase the mitotic index of C2C12 and PD50A myoblasts. Each column represents an average of two repeats; each repeat contains triplicates (ANOVA; ﹟and *, p<0.05 ; ﹟﹟and ** p<0.01 ; ﹟ compared to DM control; * compared to C2C12 cells; n = 6). IGF1: insulin-like growth factor 1; IGF2: insulin-like growth factor 2; LIF: leukaemia inhibitory factor.
A
B

134
I first examined the mitogenic effect of growth factors on differentiating myoblasts (Figure
3.11). The mitotic nuclei were labelled with DAPI and scored (Figure 3.11 A). IGF-1
increases the mitotic index of C2C12 myoblasts by 9 fold compared to the DM control
(Figure 3.11 B; p= 2.74×10⁻²). IGF-2 and LIF also induce proliferation of C2C12 myoblasts
by 14 and 17 fold respectively compared to the DM control (Figure 3.11 B; p= 1.68×10⁻³ for
IGF-2 and p= 1.31×10⁻³ for LIF). Growth factors (IGF-1, IGF-2 or LIF) do not have a
significant effect on proliferation of PD50A myoblasts (Figure 3.11 B). One noteworthy thing
is that growth factors have a greater mitogenic effect on PD50A myoblasts than on C2C12
myoblasts (Figure 3.11 B). These data suggest that IGF-1, IGF-2 or LIF can induce
proliferation of both C2C12 and PD50A myoblasts. A greater effect of growth factors on the
proliferation of PD50A myoblasts than C2C12 myoblasts suggests that either there may be
upregulation of receptors in PD50A myoblasts or signalling cascades induced by these growth
factors are perturbed in PD50A myoblasts (e.g. feedback loop of IGF-2/mTOR signalling;
section 3.2.8).

135
Figure 3.12 IGF-2 and LIF, but not IGF-1, reduce the apoptotic index of differentiating dystrophin-deficient myoblasts. C2C12 and PD50A myoblasts were cultured in DM supplemented with 100 ng/ml of IGF1, 20 ng/ml of IGF2 or 1000 units/ml of LIF for four days. Medium was changed every two days. The number of apoptotic bodies was scored on the fourth day. Cells were fixed with 4% PFA and then labelled with 10 μg/ml of DAPI to examine the apoptotic body. Apoptotic index is defined as the number of apoptotic bodies divided by total cell number. (A) Representative images of apoptotic bodies of C2C12 and PD50A myoblasts in DM. Representative apoptotic bodies are indicated by arrows. (B) IGF-2 and LIF reduces the apoptosis of differentiating PD50A myoblasts. Each column represents an average of two repeats; each repeat contains triplicates (ANOVA; ﹟and * p<0.05 ; ﹟﹟and ** p<0.01 ; ﹟ compared to DM control; * compared to C2C12 cells; n = 6). IGF1: insulin-like growth factor 1; IGF2: insulin-like growth factor 2; LIF: leukaemia inhibitory factor.
A
B

136
The effect of IGF-1, IGF-2 and LIF on myoblast apoptosis
Treatment of C2C12 with supraphysiological concentration of IGF-1 (100 ng/ml) exert no
effects on the apoptotic index of differentiating C2C12 myoblasts compared to those cultured
in low mitogen medium (DM) (Figure 3.12 B). The differentiating C2C12 myoblasts
supplemented with IGF-2 have apoptotic index comparable to those cultured in DM (Figure
3.12 B). However, LIF induces apoptosis of differentiating C2C12 myoblasts about 1.5 fold
(p= 4.92×10⁻²) that of non-dystrophic myoblasts cultured in DM (Figure 3.12 B). These
different effects of growth factors on C2C12 myoblasts suggest that different signalling
pathways are induced in response to these growth factors or that the same pathway but with
different components is activated. IGF-1 has no effects on the apoptotic index of
differentiating PD50A myoblasts (Figure 3.12 B). Conversely, IGF-2 and LIF reduce
apoptosis of differentiating PD50A myoblasts by 54% (p= 6.1×10⁻⁵) and 74% (p= 2.2×10⁻⁶)
respectively compared to dystrophin-deficient myoblasts cultured in DM (Figure 3.12 B).
These data suggest that both IGF-2 and LIF can reduce apoptosis of differentiating
dystrophin-deficient myoblasts. These data also suggest that LIF is the only second survival
factor identified other than IGF-2 for myoblasts (Smith et al., 1995; Smith et al., 2000).

137
Figure 3.13 Growth factors promote myotube formation in dystrophic context. C2C12 and PD50A myoblasts in DM were supplemented with 100 ng/ml of IGF-1, 20 ng/ml of IGF-2 or 1000 units/ml of LIF for four days. Medium was changed every 2 days. Cells were fixed with 4% PFA and then stained with Leishman’s stain to score the fusion index on the fourth day. The number of (A) myonuclei and (B) myotubes produced by the myoblasts supplemented with growth factors were scored. Myonuclei is defined as the number of nuclei in myotubes normalised with the surface area (cm2). Differentiation ability of myoblasts was examined in the following growth factor conditions. In single growth factor condition, only IGF-2 promotes differentiation of PD50A myoblasts. Combinations of any two growth factors promote myotube formation of PD50A myoblasts. Administration of all three growth factors suppresses differentiation of PD50A myoblasts. Each column represents an average of two repeat; each has triplicates. (ANOVA; *, ﹟p<
0.05 ;**, ﹟﹟p<0.01 ; *compared to C2C12 myoblasts; ﹟compared to DM treatment; n = 6). Data are also analysed with.IGF-1: insulin-like growth factor 1; IGF2: insulin-like growth factor 2; LIF: leukaemia inhibitory factor.
B
A

138
3.2.6. Insulin-like growth factors (IGF-1 and IGF-2) promote differentiation of dystrophin-
deficient myoblasts cultured in low mitogen medium
IGF-1 and IGF-2 have been reported to induce myoblast differentiation (Florini et al., 1991;
Kaliman et al., 1998). In vivo LIF-/- mouse have impaired skeletal muscle regeneration after
injury, suggesting that LIF can promote skeletal muscle regeneration (Kurek et al., 1997).
However, primary human myoblasts in culture showed impairment of myotube formation in
response to LIF (10 ng/ml) (Wang et al., 2008). To study the effects of these growth factors on
myoblast differentiation, I cultured myoblasts (C2C12 and PD50A) in low mitogen medium
(DM) supplemented with IGF-1, IGF-2 and/or LIF (alone or in combinations) for four days
and scored the number of myonuclei and myotubes (Figure 3.13). The number of myonuclei
(1823 ± 247) and myotubes (544 ± 17) produced by C2C12 myoblasts supplemented with
IGF-2 is not significantly different from those treated with DM (Figure 3.13 A and B). IGF-1
reduces the number of myonuclei of C2C12 myoblasts by 60% (p= 3.0×10⁻⁴) and LIF reduces
the number of myonuclei by 66% (p= 1.5×10⁻⁴) compared to the DM control (Figure 3.13 A).
LIF suppresses the myotube formation of C2C12 myoblasts by 32% compared to DM control
(Figure 3.13 B; p= 1.5×10⁻⁴). These data are consistent with the report that LIF suppresses the
differentiation of myoblasts (Wang et al., 2008).
In contrast, there is neither increase nor decrease in the number of myonuclei and myotubes of
PD50A myoblasts supplemented with IGF-1 and LIF compared to DM control (Figure 3.13 A

139
and B). However, IGF-2 promotes differentiation of PD50A myoblasts by increasing the
number of myonuclei by 38% (p= 3.15×10⁻²) and the number of myotubes by 64% (p=
1.15×10⁻²) compared to DM control (Figure 3.13 A and B). This suggests that IGF-2 may be a
myogenic factor for dystrophin-deficient myoblasts. Different responses of C2C12 and
PD50A myoblasts to IGF-2 or LIF suggest that the signalling pathways induced by IGF-2 or
LIF are perturbed in dystrophin-deficient myoblasts.
The number of myonuclei and the number of myotubes of C2C12 myoblasts supplemented
with a combination of IGF-2/LIF reduce respectively by 55% (p= 1.4×10⁻⁴) and 28% (p=
5.11×10⁻³) compared to the DM control (Figure 3.13 A and B). The number of myonuclei of
C2C12 supplemented with a combination of IGF-1/LIF reduces by 64% (p= 3.9×10⁻⁴)
compared to DM control (Figure 3.13 A). Conversely, combinations of growth factors induce
differentiation of PD50A myoblasts (Figure 3.13). The number of myonuclei and the number
of myotubes of PD50A cells supplemented with a combination of IGF-1/LIF increase by more
than 2 fold compared to DM control (Figure 3.13 A and B; p= 2.12×10⁻³ for myonuclei; p=
6.92×10⁻⁵ for myotubes). The number of myonuclei increases by 1.8 fold in PD50A myoblasts
supplemented with a combination of IGF-1/IGF-2 compared to DM control (Figure 3.13 A;
p= 1.38×10⁻³). Similarly, the number of myonuclei and the number of myotubes for PD50A
myoblasts supplemented with a combination of IGF-2/LIF increase by 1.7 fold compared to
DM control (Figure 3.13 A and B; p= 7.08×10⁻³ for myonuclei; p= 6.77×10⁻³ for myotubes).

140
These data suggest that there exist synergistic effects for IGF-1/IGF-2, IGF-1/LIF or IGF-
2/LIF, which can be used to supplement differentiation medium (DM) and promote the
differentiation of PD50A myoblasts. One thing noteworthy is that a combination of IGF-1,
IGF-2 and LIF together strongly suppresses the differentiation of C2C12 myoblasts compared
to low mitogen medium; the number of myonuclei decreases by 77% (p= 2.7×10⁻⁵) and the
number of myotubes decreases by 56% (p= 1.1×10⁻⁵) (Figure 3.13 A and B). These data
suggest that a combination of IGF-1/IGF-2, IGF-1/LIF or IGF-2/LIF has a synergistic effect
on dystrophin-deficient myoblast differentiation and that there may be crosstalks among
signalling via IGF-1, IGF-2 and LIF pathways.
3.2.7. Elevated levels of Cav-1 and Cav-3 proteins in PD50A myoblasts correlate with the
lower differentiation induction:
It has been reported that Cav-3 protein is detected in myotubes whereas Cav-1 protein is
detected in myoblasts and its level decreases in the first day of differentiation in
differentiating C2C12 myoblasts using immunoblotting (Volonte et al., 2005). To establish the
expression pattern of Cav-1 and Cav-3 proteins in the differentiating dystrophin-deficient
myoblasts induced with osteoblast-conditioned medium (OCM), I cultured C2C12 and
PD50A myoblasts in the presence of DM or OCM for four days and examined the expression
pattern of Cav-1 and Cav-3.

141
Figure 3.14 Protein levels of Cav-1 isoforms are higher in dystrophic myoblasts under osteoblast-conditioned medium (OCM) and differentiation medium (DM). Non-dystrophic (C2C12) and dystrophin-deficient (PD50A) cells were washed twice with PBS and then serum starved for 30 minutes. Myoblasts were shifted to OCM or DM for 4 days. Medium was changed every 2 days. (A) Whole cell extracts were harvested at 24-hour intervals for immunoblotting. (B) PD50A myoblasts have more Cav-1α than C2C12 myoblasts. (C) PD50A myoblasts have more Cav-1β than C2C12 myoblasts. (D) Ratio of Cav-1β/Cav-1α is similar in C2C12 and PD50A myoblasts. Each column represents an average of three repeats from different samples. (ANOVA; *, ﹟p<0.05 ; **p<0.01 ; ***p<0.001; ﹟compared to C2C12 myoblasts; *compared to non-differentiated control; n = 3). OCM: osteoblast-conditioned medium; DM: differentiation medium

142
A
B
C
D

143
There are two isoforms of Cav-1 termed alpha (Cav-1α; 24 kDa) and beta (Cav-1β; 21 kDa),
which are derived from distinct transcription initiation sites (Kogo and Fujimoto, 2000;
Scherer et al., 1995). I examined the protein levels of Cav-1α and β in differentiating
dystrophin-deficient and non-dystrophic myoblasts cultured in OCM or DM. Protein levels of
both Cav-1α and β are consistently higher in PD50A compared to C2C12 myoblasts under
these conditions (Figure 3.14 A, B and C).
The levels of both Cav-1α and β decrease in the first 24 hours and then increase from 48-96
hours in C2C12 myoblasts cultured in OCM or DM (Figure 3.14 A, B and C), suggesting a
role for Cav-1 isoforms in the process of myoblast differentiation. Although the level of Cav-
1α protein remains high for 96 hours in PD50A myoblasts cultured in DM or OCM, the level
of Cav-1β protein decreases at the first 24 hours before then increasing between 48-96 hours
in PD50A compared to the nondifferentiated control (Figure 3.14 A, B and C). The ratio of
Cav-1α/β in both differentiating PD50A and C2C12 myoblasts cultured in OCM or DM
shows no significant difference compared to the nondifferentiated controls (Figure 3.14 D).
These data suggest that modulating the protein level of Cav-1 plays a role in myoblast
differentiation and that OCM and DM induced differentiation is mediated via distinct
signalling pathways.

144
The regulation of Cav-1 and Cav-3 is perturbed in differentiating dystrophin-deficient
myoblasts
To study the relationship between Cav-1 and Cav-3 in differentiating dystrophin-deficient
myoblasts, I examined the expression pattern of Cav-3 and Cav-1 proteins in differentiating
C2C12 and PD50A myoblasts treated with low mitogen medium (DM) or osteoblast-
conditioned medium (OCM). In the present report, I show in myoblast culture that
dystrophin-deficient myoblasts have higher level of Cav-1 protein compared to non-
dystrophic myoblasts (Figure 3.15 A and B; also Figure 3.14). Surprisingly I found that Cav-1
protein levels decrease in the first 24 hours of induction and Cav-1 levels increase between
24-96 hours in differentiating C2C12 myoblasts cultured in OCM or DM (Figure 3.15 A and
B). This is consistent with the report which shows that Cav-1 protein levels decrease on the
first day of muscle regeneration and increase from day 3 to day 10 (Volonte et al., 2005).
Cav-1 protein levels also decrease in the first 24 hours and increases from 48-96 hours in
differentiating PD50A myoblasts treated with DM (Figure 3.15 A and B). For differentiating
PD50A myoblasts cultured in OCM, Cav-1 protein levels increase substantially along with
time; the Cav-1 protein levels at 96 hours of OCM treatment are higher compared to
nondifferentiated control (Figure 3.15 A and B). These data suggest that Cav-1 plays a role in
the differentiation process and that signalling cascades response to DM and OCM
differentiation induction are perturbed in dystrophin-deficient myoblasts.

145
Figure 3.15 Protein levels of Caveolin-1 and Caveolin-3 are higher in PD50A cells than in C2C12 cells under osteoblast-conditioned medium (OCM) and differentiation medium (DM). Myoblasts were washed twice with PBS and serum starved for 30 minutes. Myoblasts were then shifted to OCM or DM. Medium was changed every 2 days. Whole cell extracts were collected for western blotting at 24-hour intervals. (A) Representative immunoblotting of Cav-1 and Cav-3. Coomassie blue stain of nitrocellulose membrane is used as loading control. (B) PD50A myoblasts have higher Cav-1 protein levels than C2C12 in DM or OCM. (C) Cav-3 protein levels are higher in PD50A than in C2C12 myoblasts; both in OCM or DM. (D) The ratio of Cav-3/Cav-1 is higher in PD50A than C2C12 myoblasts under OCM or DM treatments. (ANOVA; *, ﹟p<0.05 ; **,﹟﹟p< 0.01 ; * * * p<0.001; ﹟ compared to C2C12 myoblasts; * compared to nondifferentiated control; n = 3). Cav-1: caveolin-1; Cav-3: caveolin-3; OCM: osteoblast-conditioned medium; DM: differentiation medium
A

146
B
D
C

147
Compared to nondifferentiated myoblasts with time, PD50A myoblasts have higher level of
Cav-3 protein compared to C2C12 (Figure 3.15 A and C); consistent with the up-regulation of
Cav-3 expression in mdx mice (Merrick et al., 2009; Vaghy et al., 1998). I was unable to
detect Cav-3 protein in nondifferentiated C2C12 myoblasts by immunoblotting with our
present techniques but I showed expression of Cav-3 protein in nondifferentiated C2C12
myoblasts by immunofluorescent method in chapter 5 (Figure 5.3). Cav-3 protein expression
increases by 96 hours after C2C12 myoblasts were induced for differentiation in DM (Figure
3.15 A and C). This is consistent with previous report that Cav-3 protein is expressed in
differentiated myotubes (Volonte et al., 2003). The protein level of Cav-3 in differentiating
PD50A myoblasts treated with both OCM and DM decreases in the first 24-48 hours of
switching to differentiation and then increases from 48 to 96 hours (Figure 3.15 A and C).
These data suggest that higher levels of Cav-3 protein in differentiating PD50A myoblasts
may correlate with the lower differentiation efficiency observed in the dystrophin-deficient
myoblasts cultured in DM (refer to section 3.2.1).
The ratio of Cav-3/Cav-1 for C2C12 myoblasts increases during differentiation induction; this
is evidence of a decrease of Cav-1 protein level and an increase of Cav-3 protein level in
differentiating C2C12 myoblasts treated with DM or OCM (Figure 3.15 D). However, the
ratio of Cav-3/Cav-1 in differentiating PD50A myoblasts cultured in OCM or DM is not
significantly different (Figure 3.15 D). These data suggest that the expression of Cav-1 and

148
Cav-3 in differentiating dystrophin-deficient myoblasts is perturbed compared to the
differentiating C2C12 myoblasts. The perturbed expression of Cav-1 and Cav-3 in
differentiating dystrophin-deficient myoblasts may contribute to their impaired differentiation.
3.2.8. IGF-2 signalling pathways are perturbed in dystrophin-deficient myoblasts:
I have shown that dystrophin-deficient (PD50A) myoblasts have impaired differentiation
profiles compared to C2C12 myoblasts (refer to section 3.2.1) and that differentiating PD50A
myoblasts display elevated apoptosis and proliferation compared to C2C12 myoblasts (refer
to section 3.2.5). IGF-2 has been shown to serve as an autocrine factor for C2 myoblasts and
its level is elevated in mdx (Florini et al., 1991; Marotta et al., 2009; Merrick and Smith,
unpublished). Previous reports and unpublished data (Sarbjit Nijjar and Janet Smith) show
that IGF-2 conveys signals through AKT/mTOR and ERK (Extracellular signal-regulated
kinases) pathways to regulate myoblast differentiation (Erbay et al., 2003). The cell cycle
inhibitor p57kip2 (or CDKN1c) is negatively regulated by IGF-2 (Grandjean et al., 2000). To
understand whether the IGF-2/AKT/mTOR and ERK signalling is perturbed in dystrophin-
deficient myoblasts, I examined proteins involved in IGF-2, AKT and ERK signal
transduction in differentiating C2C12 and PD50A myoblasts cultured in OCM or DM (Figure
3.16 and 3.16). IGF-2 is expressed as pro-IGF-2 (23-26 kDa) which is post-translationally
cleaved and glycosylated to form the active IGF-2 (14-18 kDa) (Duguay et al., 1998).
149
Figure 3.16 The levels of IGF-2 and p57kip2 decrease in differentiating C2C12 and PD50A myoblasts induced by differentiation medium (DM). Dystrophin-deficient (PD50A) and wt (C2C12) myoblasts were washed twice with PBS and then serum starved for 30 minutes. Medium was changed every 2 days. (A) Whole cell extracts were collected for immunoblotting at 24-hour intervals. Coomassie blue stain of the nitrocellulose membrane serves as the loading control. (B) PD50A myoblasts have higher protein levels of mature IGF-2 in DM and OCM at 96 hours compared to C2C12 myoblasts. The mature/active IGF-2 is of 14.3 kDa. (C) PD50A myoblasts have higher protein level of p57kip2 in OCM and DM at 96 hours compared to C2C12. Each column represents an average of at least three repeats from different samples. (ANOVA; *, ﹟p<0.05 ; **, ﹟﹟p<0.01; ***p<0.001; *compared to non-differentiated control; ﹟compared to C2C12 myoblasts n≧3). IGF-2: Insulin-like growth factor-2

150
A
B
C

151
In both differentiating C2C12 and PD50A myoblasts treated with OCM, active IGF-2
decreases from the first 24 hours and then increases between 48-96 hours (Figure 3.16 A and
B). The levels of active IGF-2 decrease in differentiating C2C12 and PD50A myoblasts
cultured in low mitogen medium (DM) compared to their nondifferentiated controls (Figure
3.16 A and B). Although there is no significant difference in the p57kip2 protein levels in
differentiating C2C12 myoblasts treated with OCM compared to the nondifferentiated control,
the levels of p57kip2 decrease in differentiating C2C12 myoblasts cultured in DM (Figure 3.16
A and C). Differentiating PD50A myoblasts cultured in OCM at 96 hours have higher levels
of p57kip2 protein compared to differentiating C2C12 myoblasts under these conditions
(Figure 3.16 A and C). These data are consistent with the higher mitotic index in
differentiating PD50A myoblasts compared to differentiating C2C12 myoblasts in response to
IGF-2 treatment (Figure 3.11).
AKT/mTOR signalling pathway is activated in differentiating myoblasts treated with
osteoblast-conditioned medium (OCM)
I then examined the downstream pathways of IGF-2 signalling. The levels of AKT and
phosphorylated AKT (pAKT) proteins decrease in both differentiating C2C12 and PD50A
myoblasts cultured in DM compared to their nondifferentiated controls (Figure 3.17 A).

152
Figure 3.17 AKT/mTOR signalling pathway is perturbed in differentiating PD50A myoblasts cultured in osteoblast-conditioned medium (OCM) and differentiation medium (DM). C2C12 (wt) and PD50A (dystrophin-deficient) myoblasts were washed twice with PBS and then serum starved for 30 minutes. Cells were shifted to OCM or DM for four days. Medium was changed every 2 days. (A) Whole cell extracts were collected for immunoblotting at 24-hour intervals. Coomassie blue stain of nitrocellulose membrane serves as the loading control. (B) PD50A myoblasts have higher pAKT/AKT ratio than C2C12 myoblasts in OCM or DM conditions. (C) C2C12 myoblasts have higher ratio of pmTOR/mTOR in OCM while PD50A myoblasts have higher pmTOR/mTOR ratio in DM. Each column represents an average of three repeats from different samples. (ANOVA; *, ﹟p<0.05; **, ﹟﹟p<0.01; ﹟compared to C2C12 myoblasts;*compared to non-differentiated control; n=3). pAKT: phospho-AKT; mTOR: mammalian target of rapamycin

153
A
B
C

154
The levels of both AKT and pAKT are higher in differentiating PD50A myoblasts cultured in
DM compared to differentiating C2C12 myoblasts under this condition (Figure 3.17 A). In
contrast, protein levels of pAKT and AKT increase in both differentiating C2C12 and PD50A
myoblasts treated with OCM for 96 hours (Figure 3.17 A). The levels of both AKT and pAKT
proteins are higher in differentiating C2C12 myoblasts cultured in OCM compared to
differentiating PD50A myoblasts under this condition (Figure 3.17 A). This suggests that AKT
signalling is more active in myoblasts under OCM than under DM. Activity of AKT signalling
can be examined through the pAKT/AKT ratio in cells. The ratio of pAKT/AKT is higher in
differentiating PD50A myoblasts treated with OCM or DM compared to differentiating
C2C12 myoblasts under these conditions (Figure 3.17 A and B). However, this is not
statistically significant. These data suggest that higher activity of AKT signalling in
differentiating myoblasts under OCM than under DM may correlate with the effect of OCM
on induction of myoblast differentiation; both wt and dystrophin-deficient (refer to Figure 3.4).
The downstream target of AKT signalling pathway, mTOR, has been reported to respond to
IGF-2 induction and form a feedback loop to up-regulate IGF-2 (Erbay et al., 2003). I
examined the protein levels of phospho-mTOR (pmTOR) and mTOR in differentiating wt and
dystrophin-deficient myoblasts. Differentiating PD50A myoblasts cultured in OCM or DM
have higher levels of both mTOR and pmTOR proteins compared to differentiating C2C12
myoblasts under these conditions (Figure 3.17 A). In both differentiating C2C12 and PD50A

155
myoblasts under OCM for 96 hours, the protein levels of mTOR and pmTOR increase
compared to nondifferentiated controls (Figure 3.17 A). In contrast, the protein levels of
mTOR and pmTOR decrease in differentiating C2C12 and PD50A myoblasts treated with DM
(Figure 3.17 A). Expression of pmTOR and mTOR is consistent with the change of pAKT in
myoblasts cultured with OCM or DM (Figure 3.17 A). The observation that more pmTOR and
mTOR proteins in differentiating PD50A myoblasts treated with OCM or DM compared to
differentiating C2C12 myoblasts under these conditions correlates with the higher total cell
numebr of PD50A myoblasts compared to C2C12 myoblasts (Figure 3.7). I examined the
ratio of pmTOR/mTOR in differentiating myoblasts which can serve as an indicator for
mTOR signalling activity. While differentiating PD50A myoblasts cultured in DM have
higher pmTOR/mTOR ratio compared to differentiating C2C12 myoblasts treated with DM,
differentiating PD50A myoblasts treated with OCM have lower pmTOR/mTOR ratio
compared to differentiating C2C12 myoblasts cultured in OCM (Figure 3.17 A and C). These
data suggest that OCM and DM induce myoblast differentiation through distinct signalling
cascades.
ERK signalling pathway in differentiating myoblasts is not affected by osteoblast-conditioned
medium (OCM) or low mitogen medium (DM)
In unpublished microarray and immunoblotting data (Sarbjit Nijjar and Dr. Janet Smith), we

156
found that treating myoblasts with IGF-2 can induce the ERK signalling. Therefore I
examined this downstream target of IGF-2 in differentiating wt and dystrophin-deficient
myoblasts treated with osteoblast-conditioned medium (OCM) or low mitogen medium (DM).
Protein levels of total ERK1/2 (ERK1 molecular weight of 44 kDa and ERK2 molecular
weight of 42 kDa) showed no difference in differentiating PD50A myoblasts induced by
either OCM and DM (Figure 3.18 A). Although the level of total ERK1/2 in differentiating
PD50A myoblasts is slightly higher compared to differentiating C2C12 myoblasts, there is no
statistical significance (Figure 3.18 A). The levels of both phosphorylated ERK1 (pERK1)
and phosphorylated ERK2 (pERK2) proteins are higher in differentiating PD50A myoblasts
cells treated with OCM or DM compared to C2C12 myoblasts cultured in OCM or DM
(Figure 3.18 A). The levels of both pERK1 and pERK2 proteins increase in differentiating
PD50A myoblasts cultured in OCM or DM (Figure 3.18 A); in contrast, the levels of pERK1
and pERK2 proteins decrease in differentiating C2C12 myoblasts under these conditions
(Figure 3.18 A). The ratio of pERK2/ERK2 is higher in differentiating PD50A myoblasts
cultured in either OCM or DM compared to differentiating C2C12 myoblasts under these
conditions (Figure 3.18 B). Similarly, the ratio of pERK1/ERK1 is also higher in
differentiating PD50A myoblasts than in C2C12 myoblasts under OCM or DM conditions
(Figure 3.18 C). These data suggest that IGF2/ERK signalling is up-regulated in
differentiating dystrophin-deficient myoblasts.

157
Figure 3.18 Ratio of phospho-ERK (pERK)/ERK is higher in PD50A myoblasts under osteoblast-conditioned medium (OCM) and differentiation medium (DM) compared with C2C12 myoblasts. Dystrophin-deficient (PD50A) and wt (C2C12) myoblasts were washed twice with PBS and then serum starved for 30 minutes. Cells were treated with OCM or DM for 4 days. Medium was changed every 2 days. (A) Whole cell extracts were collected for immunoblotting at 24-hour intervals. Coomassie blue stain of the nitrocellulose membrane serves as the loading control. The ERK proteins detected were of 42 (ERK2) and 44 (ERK1) kDa respectively. (B) Ratio of pERK2/ERK2 (pERK42/ERK42) is higher in PD50A compared to C2C12 myoblasts. (C) Ratio of pERK1/ERK1 (pERK44/ERK44) is higher in PD50A compared to C2C12 myoblasts. Each column represents an average of three repeats from different samples. (ANOVA; * p < 0.05; * compared to nondifferentiated control; n = 3). pEKR: phospho-ERK; ERK: Extracellular signal-regulated kinases

158
A
B
C

159
3.3. Discussion:
3.3.1. Dystrophin-deficient myoblasts have impaired differentiation
In this report I established impairment of differentiation in the clonally derived dystrophin-
deficient myoblasts (PD50A) on the basis of morphology and the expression of a muscle
specific marker (myosin heavy chain; MyHC) (Figure 3.1 and 3.5). Differentiation
impairment in dystrophin-deficient myoblasts observed in my study is consistent with
previous reports that also determine the differentiation ability by the morphological change
(Blau et al., 1983; Delaporte et al., 1984). However, Hughes’ group (Schuierer et al., 2005)
reported that there is no significant difference in the differentiation between control and
dystrophin-deficient myoblasts from mice of more than 2 months old. This inconsistency
between my result and the Hughes’ group (Schuierer et al., 2005) may be due to different
methods applied in these two experiments. I differentiated isolated clonal muscle stem cells
from 5 week-old mice while they activated the satellite cells in cultured single muscle fibre
from mice of more than 2 months old. In addition, they plated muscle stem cells on Matrigel
substrate which may affect the adhesion properties of the muscle stem cells (Schuierer et al.,
2005). This also implies that the differentiation impairment of dystrophin-deficient myoblasts
reported may be attributed to the lack of dystrophin, as dystrophin is a bridge to link the
extracellular matrix and the intracellular cytoskeleton (Ervasti and Campbell, 1993). However,

160
whether Matrigel can overcome the signal defect in dystrophin-deficient myoblasts requires
further investigation.
3.3.2. Osteoblasts promote differentiation of dystrophin-deficient myoblasts via cell-cell
contact but promote differentiation of wt myoblasts via secreted factors
I established that MC3T3-E1 osteoblasts can induce differentiation of both wt (C2C12) and
dystrophin-deficient (PD50A) myoblasts and this promotion likely comes from the factor(s)
secreted from osteoblasts. This provides a useful method to differentiate the dystrophin-
deficient myoblasts, which are otherwise difficult to induce to differentiate under
conventional differentiation induction (i.e. low mitogen stimulation). In contrast, C2C12
myoblasts cultured in OCM have higher efficiency of differentiation compared to those
cocultured with osteoblasts (Figure 3.3 and 3.4), suggesting there may be an inhibitory effect
from cell-cell contact. As C2C12 myoblasts were cocultured with osteoblasts supplemented
with 10% foetal calf serum (FCS); factors from FCS may also have contributed to the
inhibition of differentiation in C2C12 myoblasts (Figure 3.6). PD50A myoblasts cultured in
OCM show lower efficiency of differentiation induction compared to C2C12 myoblasts under
this condition (Figure 3.4). In cocultures with osteoblasts, PD50A myoblasts show greater
differentiation ability compared to low mitogen treatment (Figure 3.3). This suggests that
continuing secreted factors from osteoblasts or cell-cell contact/effectors is needed to

161
maintain the differentiation of PD50A cells. Overexpression of integrin α7β1 in mdx mice has
been shown to protect the mdx skeletal muscles from sarcolemmal damages; this further
supports the importance of cell-cell contact for differentiation of PD50A myoblasts which
lack dystrophin (Liu et al., 2012). In addition, C2C12 myoblasts overexpressing integrin α7β1
have increased proliferation and resistance to apoptosis (Liu et al., 2008). The idea that
coculture system continuously provides secreted myogenic factors is supported by
observation that conditioned medium from osteoblasts-C2C12 myoblast coculture (CCM)
induces better differentiation of PD50A myoblasts compared to those treated with osteoblast-
conditioned medium (Figure 3.4). This is further supported by the observation that FCS
promotes differentiation of PD50A myoblasts (Figure 3.6).
3.3.3. Treatment of dystrophin-deficient myoblasts with combinations of IGF-2/IGF-1, IGF-
1/LIF or IGF-2/LIF promotes their differentiation
I show that IGF-2 alone can promote the differentiation of dystrophin-deficient myoblasts in
low mitogen medium (Figure 3.13) and that combinations of IGF-1/IGF-2, IGF-1/LIF or IGF-
2/LIF act synergistically to promote differentiation of dystrophin-deficient myoblasts to a
greater extent than the single growth factors (Figure 3.13), suggesting a synergistic effect of
these factors on differentiation induction in dystrophin-deficient myoblasts. IGF-2 has been
reported to induce the spontaneous differentiation of C2 myoblasts (approximately 80%

162
confluence) cultured in low mitogen medium by autocrine mechanisms (Florini et al., 1991;
Merrick et al., 2007). IGF-2 secreted from C2 myoblasts can further up-regulate the
expression of IGF-2 through mTOR pathway in C2 myoblasts, establishing a feedback loop
(Erbay et al., 2003). Elevated levels of IGF-1 can lead to muscle hypertrophy through the
mTOR/p70S6K pathway; this effect is pronounced in young mice with growing muscles and
diseased mice (e.g. mdx) with regenerating muscles, suggesting the effect of IGF-1 on
myoblast differentiation may be cell density dependent (Shavlakadze et al., 2010; Song et al.,
2005). Previous reports show that osteoblasts in culture secrete both IGF-1 and IGF-2
(McCarthy et al., 1992; Nakasaki et al., 2008). Here I observed elevated levels of IGF-2
protein in differentiating C2C12 and PD50A myoblasts treated with osteoblast-conditioned
medium (OCM) (Figure 3.16). In addition, the downstream signalling pathway of IGFs, the
AKT/mTOR signalling, is also activated in response to OCM stimulation. This suggests that
in our dystrophin-deficient myoblast-osteoblasts coculture, osteoblasts may secrete IGF-2
which activates the IGF-2/mTOR signalling pathway in the dystrophin-deficient myoblasts.
Secreted IGF-2 induces production of IGF2 in dystrophin-deficient myoblasts and promotes
differentiation of these myoblasts. However, osteoblasts may also secreted myogenic factors
other than IGF-2, such as IGF-1 and LIF.
C2C12 myoblasts cultured in low mitogen medium (DM) supplemented with IGF-1, IGF-2 or
a combination of IGF-1 and IGF-2 differentiate less efficiently compared to the DM control

163
(Figure 3.13). This may be attributed to the proliferative effect of IGF-1 and IGF-2 since IGF-
1 and IGF-2 can increase the mitotic index of differentiating C2C12 myoblasts cultured in
DM (Figure 3.11). Treating rats with IGF-2 after muscle damage suggests a role of IGF-2
during muscle regeneration in that IGF-2 administration delays the early regeneration (from
day 1 to day 4) but enhances the late regeneration, showing larger size of regenerated muscle
fibres on day 7 (Kirk et al., 2003). Similar biphasic effects on myoblast differentiation was
also found in rat skeletal myoblasts L6E9 treated with IGF-1 which induced the
phosphorylation of ERK1/2 in the first 24 hours and subsequently inhibited ERK1/2
phosphorylation after 24 hours onward (Adi et al., 2002).
Our unpublished data (Sarbjit Nijjar and Dr. Janet Smith) that LIF (leukaemia inhibitory
factor) mRNA level is elevated in mdx and DMD is consistent with previous reports (Kurek et
al., 1996b; Reardon et al., 2000). In vitro, LIF has been reported to induce proliferation and
survival of myoblasts cultured in DMEM supplemented with 5% foetal calf serum (Alter et
al., 2008; Spangenburg and Booth, 2002; White et al., 2001). In the present report, I
demonstrate that LIF increases the mitotic index of both differentiating wt and dystrophin-
deficient myoblasts cultured in DMEM supplemented with 2% horse serum (DM) (Figure
3.11). I also show LIF reduces apoptosis in differentiating dystrophin-deficient myoblasts
cultured in DM (Figure 3.12). From the present report, I show that other factors are required
for LIF to boost the promotion effects on muscle regeneration, since under low mitogen
164
condition, LIF failed to induce differentiation of C2C12 myoblasts. In addition, the opposite
responses to LIF in non-dystrophic and dystrophin-deficient myoblasts indicate the signalling
pathways induced by LIF may be perturbed in the dystrophin-deficient myoblasts.
3.3.4. IGF-2 is a survival factor for differentiating dystrophin-deficient myoblasts
In the present study, I established that IGF-2 can reduce apoptosis in differentiating PD50A
myoblasts cultured in low mitogen medium (Figure 3.12). It has been reported that IGF-2 is a
survival factor that ameliorates dystrophic phenotype and reduces apoptosis of mdx muscles
(in vitro and in vivo) (Smith et al., 1995; Smith et al., 2000; Stewart and Rotwein, 1996). It
has been suggested that myoblast differentiation is accompanied by cell cycle withdrawal and
apoptosis; following mitogen deprivation, C2C12 myoblasts that can not induce Cdk inhibitor
p21CIP1 expression undergo apoptosis instead of terminal differentiation (Wang and Walsh,
1996). This differentiation induced apoptosis involves the DNase γ which causes the
nucleosomal DNA fragmentation (Shiokawa et al., 2002). In the present study, I show that
osteoblast-condition medium (OCM) induces higher protein levels of p57KIP2 in both
differentiating C2C12 and PD50A myoblasts compared to the conventional low mitogen
induced differentiation (differentiation medium; DM) (Figure 3.16), suggesting that more
myoblasts treated with OCM exit the cell cycle compared to DM. It has been reported that
p57KIP2 protein increases in differentiating C2C12 myoblasts and acts to stabilize MyoD

165
(Reynaud et al., 1999). Although higher induction of p57KIP2 protein is observed in
differentiating PD50A myoblasts treated with OCM for 96 hours compared to differentiating
C2C12 myoblasts under this condition, the fusion index for PD50A myoblasts cultured in
OCM is still lower than that for C2C12 myoblasts under similar condition (Figure 3.4). These
data connect apoptosis and differentiation and also suggest a mode of action for IGF-2,
distinct from IGF-1, which could depend on receptor availability, extent of differentiation
contingent on signalling defects or on the lack of another CDK inhibitor such as p21CIP1.
3.3.5. Apoptosis correlates with myoblasts differentiation
The observation that PD50A myoblasts under growth permissive (GM) and differentiating
(DM and OCM) conditions have higher total number of cells compared to C2C12 myoblasts
under these conditions (Figure 3.7) is consistent with the high rate of proliferation found in
the primary myoblasts isolated from mdx embryos (Merrick et al., 2009). Higher apoptosis in
differentiating myoblasts induced by DM (Figure 3.8) supports the hypothesis that myoblasts
which fail to be induced to differentiate undergo apoptosis (Wang and Walsh, 1996). The
observation that OCM treatment reduces apoptosis and promotes myoblast differentiation
(Figure 3.4, 3.5 and 3.8) further supports the coupling of apoptosis and differentiation of
myoblasts. Investigation of the protein level of caspase 3, which is an effector of apoptosis
(Kuribayashi et al., 2006), shows that there is higher ratio of cleaved/uncleaved caspase 3 (i.e.

166
caspase 3 activity) in differentiating PD50A myoblasts induced by DM than in differentiating
C2C12 myoblasts under the same condition (Figure 3.9). This is consistent with the higher
apoptotic index in PD50A myoblasts in DM compared to C2C12 myoblasts in DM (Figure
3.8). A lower ratio of cleaved/uncleaved caspase 3 in PD50A myoblasts under OCM
compared to DM (Figure 3.9) suggests that OCM has a survival effect on dystrophin-deficient
myoblasts which reduces apoptosis of differentiating PD50A myoblasts, providing a means to
overcome differentiation block. This is supported by the effect of OCM on reducing the
apoptosis of both dystrophin-deficient and wt myoblasts (Figure 3.8). The increased ratio of
cleaved/uncleaved caspase 3 in differentiating C2C12 myoblasts cultured in OCM suggests a
new role for caspase 3 during myoblast differentiation other than as an effector of apoptosis. It
has been reported that caspases also play a role in myoblast differentiation through the non-
apoptosis mechanism (Larsen et al., 2010; Murray et al., 2008). Caspase 9 activates caspase 3
which in turn activates caspase-activated DNase (CAD) to create DNA strand breaks; the
change of DNA micro-environment leads to the activation of p21CIP promoter, producing
p21CIP and promoting myoblast differentiation (Larsen et al., 2010; Murray et al., 2008). The
survival effects of osteoblast-conditioned medium on differentiating myoblats and the
coupling of apoptosis/differentiation of myoblasts need to be further investigated by methods
such as TUNEL (Terminal deoxynucleotidyl transferase dUTP nick end labelling) assay to
label the fragmented DNA and propidium iodide (PI) flow cytometric assay (Borycki et al.,

167
1999b; Wang and Walsh, 1996).
3.3.6. Elevated protein levels of Cav-1 and Cav-3 correlate with impairment of
differentiation in dystrophin-deficient myoblasts
It has been reported that over-expression or targeted down-regulation of Cav-3 impairs
myoblast fusion (Galbiati et al., 1999; Volonte et al., 2003). In the present study, Cav-3
protein level is down-regulated in differentiating PD50A myoblasts treated with both OCM
and DM, suggesting the level of Cav-3 is crucial for the differentiation effect induced by
OCM (Figure 3.15). The protein level of Cav-1 has previously been shown to decrease in
myoblasts during the first day of differentiation induction and then to increase again (Volonte
et al., 2005). Similarly, I found that Cav-1 is down-regulated in differentiating C2C12
myoblasts induced by OCM or DM in the first 24 hours and is up-regulated between 48-96
hours in the present study (Figure 3.15). The levels of Cav-1 protein are considerably higher
in differentiating PD50A myoblasts treated with both OCM and DM compared to
differentiating C2C12 myoblasts under the same conditions (Figure 3.14 and 3.15). This
finding suggests that aberrant regulation in Cav-1 protein levels and ratio of Cav-1 to Cav-3
may contribute to the lower differentiation of PD50A myoblasts compared to C2C12
nyoblasts. However, I cannot exclude that mis-regulation of Cav-1 in differentiating PD50A
myoblasts may also compensate for the lack of dystrophin (refer to chapter 6 for mechanical

168
properties and caveolins). In addition, it has been reported that in adipocytes, IGF1R
signalling (insulin like growth factor receptor type 1) is mediated through caveolae (Huo et al.,
2003). Higher levels of Cav-1 protein in differentiating PD50A myoblasts compared to
differentiating C2C12 myoblasts may explain the higher activity of IGF-2/AKT/mTOR and
IGF-2/ERK signalling in differentiating dystrophin-deficient myoblasts compared to
differentiating non-dystrophic myoblasts (Figure 3.15, 3.16 and 3.17). In addition, the
elevated Cav-1 levels found in differentiating PD50A myoblasts compared to differentiating
C2C12 myoblasts in the present study may contribute to the higher levels of apoptosis in
these cells compared to differentiating non-dystrophic C2C12 myoblasts since Cav-1 has been
shown to activate the PI3K/Akt/GSK3 signalling pathway which causes cells to sensitize to
stress, such as TGF-α, H2O2 and arsenite, and leads to cell death (Ono et al., 2004; Shack et
al., 2003).
Both Cav-1α and Cav1-β express in the heart, notochord and somite of zebrafish during
development (Fang et al., 2006). In zebrafish, knocking down either Cav-1α or Cav1-β leads
to somite, neural and eye defects (Fang et al., 2006). Whereas Cav-1α expresses in the kidney,
gut and lung endothelial cells in mice, Cav1-β expresses in the lung alveolar epithelial cells in
mice (Kogo et al., 2004; Ramirez et al., 2002). In the present report, I examined the protein
levels of Cav-1α and Cav-1β in differentiating myoblasts. Interestingly, the levels of Cav-1β
protein increase during differentiation of both wt and dystrophin-deficient myoblasts induced

169
by OCM and DM; this has not been reported previuously (Figure 3.14). The observation that
the levels of both isoforms change in differentiating C2C12 and PD50A myoblasts suggests
regulation of both isoforms is important during myoblasts differentiation. These data also
suggest that both Cav-1α and Cav-1β express in skeletal muscles. Summary of localisation of
Cav-1 isoforms is listed in table 3.1.
Localisation Role in developments Reference
Cav-1α
Heart, pharyngeal vasculature, notochord, somites, skin, neuromast tissue, intestinal epithelial (zebrafish) Kidney, gut and lung endothelial cells (mouse)
KO causes neural and tail tissues defect
(Fang et al., 2006) (Kogo et al., 2004; Ramirez et al., 2002)
Cav-1β
Heart, pharyngeal vasculature, notochord, somites, skin, neuromast tissue (zebrafish) Lung alveolar epithelial cells (mouse)
KO causes neural tissue defect
(Fang et al., 2006) (Kogo et al., 2004)
Table 3.1 The localisation and roles of Cav-1 isoforms during embryogenesis
3.3.7. Up-regulation of Pax7 protein level in differentiating dystrophin-deficient myoblasts
induced by OCM coincides with reduced apoptosis
Over-expression of Pax7 in myoblasts inhibits myogenesis and promotes cell cycle
progression in myoblasts (Halevy et al., 2004; Olguin and Olwin, 2004; Zammit et al., 2006b).
Persistent levels of Pax7 in PD50A myoblasts treated with low mitogen medium (DM)
(Figure 3.10) may explain in part the reduced rate of differentiation seen in dystrophin-
deficient myoblasts. In addition, increased levels of Pax7 protein in both C2C12 and PD50A

170
myoblasts treated with OCM may well explain the reduced apoptosis of both C2C12 and
PD50A myoblasts under OCM (Figure 3.8) since Pax7 has been reported to promote satellite
cell survival (Relaix et al., 2006). Up-regulation of Pax7 in differentiating myoblasts (both
dystrophin-deficient and non-dystrophic) treated with OCM also correlates with the increased
total cell number (Figure 3.7) as Pax7 has been reported to regulate the self-renewal of
postnatal satellite cells (Oustanina et al., 2004).

171
Chapter 4. Cav-1 and Cav-3 are elevated in dystrophic embryos and play a role in
heart development
4.1. Introduction:
DMD patients suffer from cardiomyopathy which is also reported in mdx embryos (Merrick et
al., 2009; Parker et al., 2005). Although limb girdle muscular dystrophy type 1C (LGMD-1C)
do not have cardiomyopathy, the mouse model (Cav-3 knockout mice) develops
cardiomyopathy (Aboumousa et al., 2008; Minetti et al., 1998; Woodman et al., 2002). In
addition, mice lacking Cav-1 exhibit cardiomyopathy (Jasmin et al., 2011; Zhao et al., 2002).
In chapter 3 and our previous report, we found elevated Cav-3 protein levels in both mdx
embryos and dystrophin-deficient myoblasts compared to their non-dystrophic counterparts
(Merrick et al., 2009; Figure 3.14). The level of Cav-3 protein is critical for the function of
embryonic skeletal muscles. mdx mice with heterozygous Cav-3 (cav-3+/-) knockout
(mdx/cav-3+/-; double mutant het or DMHet) have been shown to exacerbate the pathology of
mdx mice, including attrition of Pax7-positive cells in skeletal muscles and reduction of
intercostal fibre density (Merrick et al., 2009). These DMHet mice have a reduced level of
Cav-3 protein than mdx (Merrick et al., 2009). In the present study I found increased levels of
Cav-1 protein in cultured clonally derived PD50A myoblast line compared to C2C12
myoblasts (Figure 3.14 and 3.15). To further understand the roles of Cav-1 and Cav-3 during

172
development, I conducted immunohistochemistry of embryonic sections to determine the
localisation of Cav-1 and Cav-3 in dystrophic and non-dystrophic (C57BL10; wt) mouse
embryos.
4.2. Results:
4.2.1. Levels of Cav-1 and Pax7 proteins are perturbed in E17.5 dystrophic embryos
In a previous report, embryonic Cav-3 protein levels in mdx mice were found to be higher
compared to wt mice and the levels of Pax7 protein are down-regulated in dystrophin-
deficient mouse embryos (Merrick et al., 2009). In chapter 3, I showed that protein levels of
Pax7, Cav-1 and Cav-3 are perturbed in differentiating PD50A myoblasts (clonally derived
myoblasts isolated from 5-week old mdx mice) (Figure 3.10, 3.14 and 3.15). To establish the
relationship between Cav-1 and Cav-3 in dystrophin-deficient mouse embryos, I examined the
levels of Cav-1 and Cav-3 proteins in E17.5 embryonic protein extracts (Figure 4.1).
Increased levels of Cav-3 protein in dystrophin-deficient mice (mdx; mouse model of DMD)
compared to wt embryos are consistent with Merrick et al. (2009) (Figure 4.1 A and B).

173
Figure 4.1 Pax7 and Caveolin-1 protein levels are perturbed in E17.5 dystrophic embryos. Whole protein extracts were collected from decapitated E17.5 embryos of wt, mdx, DMhet and cav-3-/-. Proteins were harvested by grinding the fresh embryos in RIPA buffer. (Refer to section 2.8.1 for detail) (A) 15 μg of each protein sample was loaded for immunoblotting of Cav-1, Cav-3 and Pax7. (B) Cav-3 protein levels are elevated in E17.5 mdx compared to wt embryos (wt). (C) Levels of Pax7 protein are reduced in E17.5 mdx, cav-3-/- and DMhet compared to wt. (D) Cav-1 protein levels connect with Cav-3 protein levels in E17.5 mdx, cav-3-/- and DMhet embryos. (E) Cav-1/Cav-3 ratio increases in E17.5 dystrophic embryos. Coomassie blue stain of nitrocellulose membranes was used as loading control. (ANOVA; ** p<0.01; *** P<0.001; n = 4). Cav-1: caveolin-1; Cav-3: caveolin-3; cav-3-/-: Cav-3 knockout; DMhet: mdx with cav-3 heterozygous knockout.
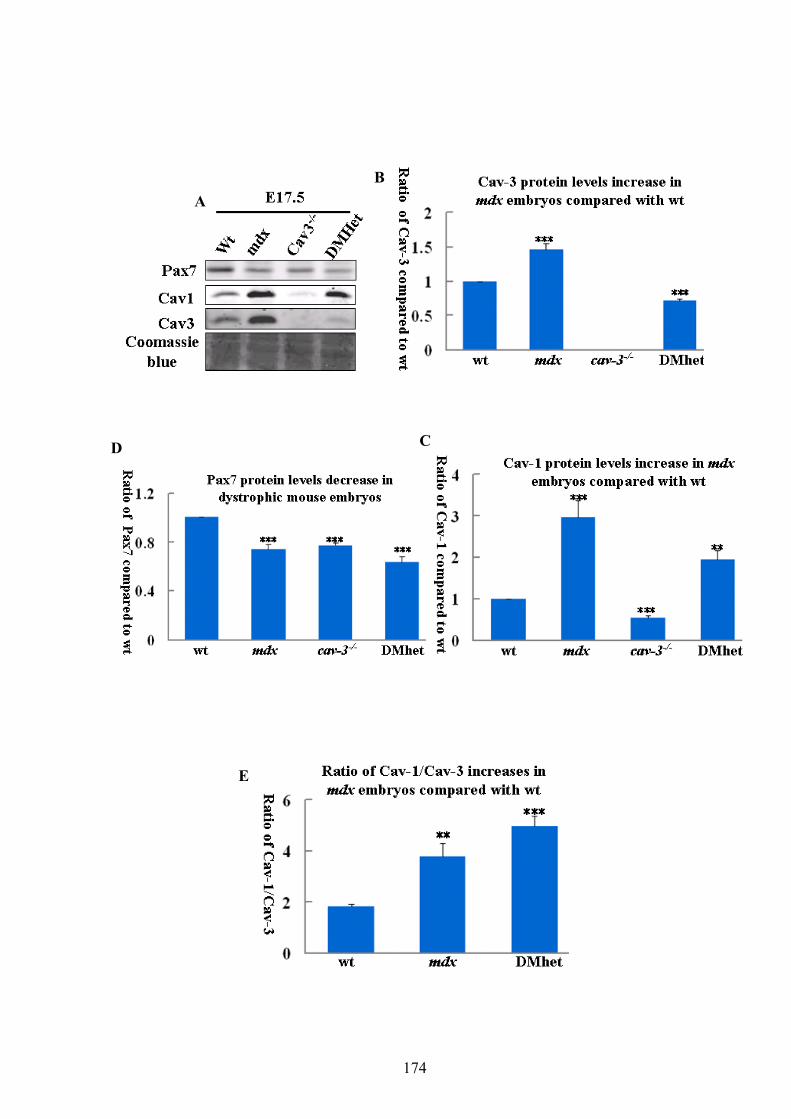
174
A B
D
E
C

175
In E17.5 DMhet, protein levels of Cav-3 reduce by 30% compared to wt mouse embryos
(Figure 4.1 A and B; p= 8.2×10⁻⁶). Decreased levels of Pax7 protein in E17.5 mdx and Cav-3
null (cav-3-/-; mouse model of LGMD-1C) mouse embryos compared to wt embryos are
consistent with previous report (Figure 4.1 A and C) (Merrick et al., 2009). In E17.5 DMhet,
levels of Pax7 protein decrease by 37% compared to wt embryos (Figure 4.1 A and C; p=
1.3×10⁻⁴).
In chapter 3, I used immunoblotting to demonstrate that Cav-1 protein levels are elevated in
differentiating PD50A myoblasts (Figure 3.14 and 3.15). To further establish the levels of
Cav-1 protein in dystrophic mouse embryos, I examined the levels of Cav-1 protein in E17.5
mouse embryos. The levels of Cav-1 protein increase by 3-fold in mdx (p= 3.4×10⁻⁴) and 2-
fold (p= 2.0×10⁻⁵) in DMhet embryos compared to the wt embryos (Figure 4.1 A and D). In
contrast, the levels of Cav-1 protein in cav-3-/- is only half (p= 2.1×10⁻³) of that in wt embryos
(Figure 4.1 A and D). This suggests that the levels of Cav-1 correlate with the levels of Cav-3
in dystrophic context (Figure 4.1 E).

176
4.2.2. Cav-1 and Cav-3 localise in skeletal and cardiac muscles and there is a positive
correlation between the staining intensities of Cav-1 and Cav-3
In section 4.2.1, I established that there are elevated levels of Cav-1 and Cav-3 proteins in
E17.5 mdx and DMhet mouse embryos (Figure 4.1). To further establish the relationship
between Cav-3 and Cav-1 in embryos, I examined the localisation of Cav-3 and Cav-1 in
E17.5 wt, mdx, cav-3-/- and DMhet (mdxcav-3+/-) mouse embryos via immunohistochemistry.
I first established the localisation of Cav-3 protein in E17.5 mouse embryos.
Cav-3 localises to the epaxial (back), diaphragm, intercostal and cardiac muscles of wt mouse
embryos (Figure 4.2 A, B, C and D). In nondystrophic mouse embryos, the staining intensity
of Cav-3 is stronger in respiratory muscles (diaphragm and intercostals) compared to epaxial
and cardiac muscles (Figure 4.2 A, B, C and D). Cav-3 is expressed in the epaxial, diaphragm,
intercostal and cardiac muscles of mdx (Figure 4.2 E, F, G and H). The staining intensity of
Cav-3 is higher in the skeletal and cardiac muscles of mdx compared to wt embryos (compare
Figure 4.2 E, F, G and H with Figure 4.2 A, B, C and D). The E17.5 mdx embryos also show
heterogeneity of Cav-3 staining in the muscles, with more intense staining of Cav-3 in the
epaxial and diaphragm muscles (Figure 4.2 E, F, G and H).

177
Figure 4.2 E17.5 mdx embryos have higher staining intensity of Caveolin-3 compared to nondytrophic mouse embryos. E17.5 wt, mdx, cav-3-/- and DMhet embryos were fixed and embedded in paraffin wax (prepared by Dr. Dean Larner). The embryo wax blocks were microtome dissected in 5 μm and stained with anti-Cav-3 antibody to determine the expression pattern of Cav-3. In epaxial (back) muscles, (E) mdx has higher staining intensity of Cav-3 than (A) wt; the staining intensity of Cav-3 in (M) DMhet is between that in (E) mdx and (A) wt; (I) cav-3-/- has no Cav-3. In diaphragm, (F) mdx has higher staining intensity of Cav-3 than (B) wt; the staining intensity of Cav-3 in (N) DMhet is comparable to that in (F) mdx; (J) cav-3-/- has no Cav-3. In intercostal muscles, the staining intensity of Cav-3 is higher in (G) mdx than in (C) wt; the staining intensity of Cav-3 in (O) DMhet is comparable to that in (C) wt; (O) cav-3-/- has no Cav-3. In cardiac muscles, (H) mdx has higher staining intensity of Cav-3 than (D) wt; (P) DMhet has staining intensity of Cav-3 comparable to that in (D) wt; (L) cav-3-/- has no Cav-3. Images are representative Cav-3 immunohistochemistry of two mouse embryos. (Q) The regions examined is labeled in the representative section of E17 embryo (taken from e-Mouse Atlas project).

178

179
In E17.5 DMhet epaxial muscles, the staining intensity of Cav-3 is between that in E17.5 mdx
and wt embryos (Figure 4.2 A, E and M). In the E17.5 DMhet diaphragm, the staining
intensity of Cav-3 is comparable to that of mdx (Figure 4.2 F and N). The intercostal and
cardiac muscles of the E17.5 DMhet have comparable intensity of Cav-3 staining to that in
the wt embryos (Figure 4.2 O and P; compare with Figure 4.2 C and D). As expected, the cav-
3-/- embryos have no staining of Cav-3 (Figure 4.2 I, J, K and L). Similar to the wt and mdx
embryos, the DMhet embryos also exhibit heterogeneity in Cav-3 staining; the DMhet
diaphragm muscles have more intense Cav-3 staining than the other muscles examined
(Figure 4.2 M, N, O and P). The heterogeneity of Cav-3 staining may correlate with the fibre
type distribution which is addressed in chapter 6 (Figure 6. 19). The greater staining intensity
of Cav-3 in the skeletal and cardiac muscles of E17.5 mdx and DMhet embryos compared to
the wt embryos is consistent with the previous report that mdx has elevated levels of Cav-3
protein compared to wt embryos and that DMhet has Cav-3 protein levels less than mdx in
embryos (Merrick et al., 2009). The localisation of Cav-3 in skeletal and cardiac muscles is
also consistent with reports that Cav-3 is predominantly in the muscles (Song et al., 1996;
Way and Parton, 1995).

180
Figure 4.3 E17.5 mdx embryos have higher staining intensity of Caveolin-1 in skeletal muscles than that in non-dystrophic mouse embryos. E17.5 wt, mdx, cav-3-/- and DMhet embryos were fixed and embedded in paraffin wax (prepared by Dr. Dean Larner). Embryo wax blocks were microtome dissected in 5 μm and the localisation of Cav-1 in muscles was determined by immunohistochemistry staining with anti-Cav-1 antibody. In epaxial (back) muscles, compared to (A) wt embryos, (D) mdx has higher staining intensity of Cav-1 while (G) cav-3-/- has lower staining intensity of Cav-1; the staining intensity of Cav-1 in (J) DMhet is in between (D) mdx and (A) wt embryos. In diaphragm, the staining intensity of Cav-1 in (E) mdx is comparable to that in (B) the wt embryos; Cav-1 localises on the edge of (H) cav-3-/- diaphragm; (K) DMhet has lower staining intensity of Cav-1 than (A) the wt embryos. In cardiac muscles (F) mdx has more intense staining of Cav-1 than (C) the wt embryos; (I) cav-3-/- and (L) DMhet have lower staining intensity of Cav-1 compared to the (A) wt embryos. Images are representative Cav-1 immunohistochemistry of two embryos.

181
Caveolin-1 localises in the skeletal and cardiac muscles of E17.5 mouse embryos
In chapter 3, I observed elevated protein levels of Cav-1 in dystrophin-deficient myoblasts
which also have elevated levels of Cav-3 protein (Figure 3.14 and 3.15). I also established
that there are elevated levels of Cav-1 protein in E17.5 mdx and DMhet embryos which have
elevated levels of Cav-3 (Figure 4.1). There is no report on the immunohistochemistry of
Cav-1 in mouse skeletal muscles. To establish whether there is staining of Cav-1 in skeletal
and cardiac muscles of mdx and DMhet mouse embryos where the staining of Cav-3 is intense,
I examined the localization of Cav-1 in E17.5 wt, mdx, DMhet and cav-3-/- mouse embryos.
Cav-1 localises in the epaxial (back), diaphragm and cardiac muscles in E17.5 wt embryos
(Figure 4.3 A, B and C) with the strongest staining in the diaphragm (Figure 4.3 B). In the wt
heart, Cav-1 localises in trabeculae (Figure 4.3 C). A larger number of the epaxial (back)
muscles in mdx are positive for Cav-1 compared to the wt embryos (Figure 4.3 A and D). In
mdx, Cav-1 protein concentrates around the sarcolemma of muscle fibres in diaphragm
(Figure 4.3 B). Different from the wt heart, Cav-1 proteins localise around the edge of heart
trabeculae in mdx embryos (Figure 4.3 F). A larger number of E17.5 DMhet epaxial muscles
are positive for Cav-1 compared to wt embryos (Figure 4.3 A and J). The proportion of Cav-1
positive fibres in the E17.5 DMhet diaphragm muscles is comparable to those in the wt mouse
embryos (Figure 4.3 B and K). Cav-1 localises to the sarcolemma of cardiac muscles in E17.5
DMhet embryos (Figure 4.3 L). Except for the diaphragm muscles where the intensity of Cav-

182
1 staining is the stongest in mdx and the weakest in DMhet, skeletal and cardiac muscles of
mdx have the strongest intensity of Cav-1 staining and those of the wt embryos have the
weakest intensity of Cav-1 staining (Figure 4.3 A-F and J-L). These data demonstrate that
E17.5 dystrophin-deficient (mdx and DMhet) mouse embryos have elevated levels of Cav-1
and Cav-3 (also refer to Figure 4.1). In E17.5 cav-3-/- embryos, Cav-1 proteins localise mainly
on the edge of the epaxial, diaphragm and heart trabeculae (Figure 4.3 G, H and I). The
staining intensity of Cav-1 proteins in the epaxial muscles, diaphragm and cardiac muscles of
E17.5 cav-3-/- embryos is low compared to those in the wt, mdx and DMhet mouse embryos
(Figure 4.3 G, H and I). These data suggest that the levels of Cav-1 in skeletal and cardiac
muscles are affected by the levels of Cav-3 and dystrophin.
4.2.3. The localisation and staining intensity of Cav-1 in other organs are affected in E17.5
DMhet and cav-3-/- embryos
Previous reports on immunoblotting of mouse tissues and established cell lines suggest that
Cav-1 is in lung and adipose tissues (Scherer et al., 1997; Song et al., 1996). It has also been
reported that Cav-1 is in the kidney, the gut and vascular endothelium of the lung in normal
mouse embryos at E14.5-E15.5 (Kogo et al., 2004; Ramirez et al., 2002). To examine the
specificity of the Cav-1 antibody used, I examined the localisation of Cav-1 in lung, kidney,
liver and intestines of E17.5 wt, mdx, cav-3-/- and DMhet mouse embryos (Figure 4.4).

183
Figure 4.4 The staining pattern of Caveolin-1 are altered in E17.5 mdx, DMhet and cav3-/- mouse embryos compared to E17.5 wt mouse embryos. E17.5 wt, mdx, cav-3-/- and DMhet mouse embryos were fixed and embedded in paraffin wax (prepared by Dr. Dean Larner). Embryo wax blocks were microtome dissected in 5 μm and localization of caveolin-1 (Cav-1) in internal organs was determined by immunohistochemistry staining with anti-Cav-1 antibody. In the lungs of (A) non-dystrophic and (E) mdx embryos, Cav-1 localises in the epithelium lining of aveolae; (I) cav-3-/- and (M) DMhet embryos have no detectable Cav-1 staining in the lungs. Cav-1 localises to the smooth muscle layer of small intestines in (B) wt, (F) mdx, (J) cav-3-/- and (N) DMhet embryos. Cav-1 localises to the parenchyma of livers in (C) wt, (G) mdx and (O) DMhet embryos. (K) cav-3-/- has no detectable Cav-1 staining in the liver. Cav-1 localises to the tubular structures of kidneys in (D) wt and (H) mdx embryos; (L) cav-3-/- and (P) DMhet have lower staining intensity of Cav-1 in the kidneys compared to (D) wt embryos. Images are representative Cav-1 staining of two embryos.

184
Consistent with previous report, Cav-1 localises to the lung, gut, and kidney of wt mouse
embryos (Kogo et al., 2004; Ramirez et al., 2002; Figure 4.4 A, B and D). I also establish that
Cav-1 localises to the liver of wt mouse embryos (Figure 4.4 C). Cav-1 localises in the
vascular endothelium and the epithelium lining of alveolae of the lungs in both E17.5 wt and
mdx (Figure 4.4 A and E). Surprisingly I found no Cav-1 in the lungs of the E17.5 DMhet
mouse embryos (Figure 4.4 M). In E17.5 wt, mdx and DMhet intestines, Cav-1 localises in the
smooth muscle layer (Figure 4.4 B, F and N). The staining intensity of Cav-1 in intestines is
higher in mdx compared to those in the wt and DMhet mouse embryos (Figure 4.4 B, F and
N). The intensity of Cav-1 staining is comparable in intestine smooth muscles of E17.5 wt and
DMhet mouse embryos (Figure 4.4 B and N). Cav-1 localises to the parenchyma of liver in
E17.5 wt and mdx mouse embryos, with stronger staining intensity in mdx (Figure 4.4 C and
G). The staining of Cav-1 in liver parenchyma is sporadic in both mdx and wt mouse embryos
whereas it is distributed diffusely in the DMhet mouse embryos (Figure 4.4 C, G and O). Cav-
1 localises in the tubular structures of kidneys in E17.5 wt and mdx, especially in the
condensed epithelial mesenchyme (Figure 4.4 D and H). The staining intensity of Cav-1 in the
E17.5 DMhet kidney is much lower compared to the wt and mdx mouse embryos (Figure 4.4
D, H and P). Cav-1 also localises in the smooth muscle layer of E17.5 cav-3-/- intestines and
the staining intensity of Cav-1 in the intestines of E17.5 cav-3-/- mouse embryos is lower
compared to the wt, mdx and DMhet mouse embryos (Figure 4.4 B, F, J and N). Cav-1 is not

185
detected in the lung, liver and kidney of E17.5 cav-3-/- mouse embryos (Figure 4.4 I, K and L).
Overall, Cav-1 is up-regulated in the lung, intestine, liver and kidney of E17.5 mdx embryos
which also have elevated levels of Cav-3. DMhet, which has Cav-3 level in between mdx and
wt embryos and is dystrophin-deficient, has reduced Cav-1 levels and disrupted localisation in
the lung, intestine, liver and kidney. These data suggest that the levels of Cav-1 in these
organs are also affected by dystrophin.
4.2.4. Expression of Cav-1 during the heart development is affected by dystrophin and Cav-3
Our previous report showed that cardiomyopathy of mdx begins during cardiogenesis
(Merrick et al., 2009).
Figure 4.5 Illustration of the development of the mouse heart. Heart development begins at E7.5 as the cardiac crescent (a and b). The cardiac crescent develops into the linear hear tube at E8.25 (c and d). At E10.5 the linear heart tube folds into loop (e and f). The looping heart remodels to form the heart with left/right ventricles and atriums at E12.5 (g and h). (Taken from Harvey, 2002)

186
The development of mouse heart begins at E7.5 as the cardiac crescent, followed by linear
heart tube at E8.25, looping heart at E10.5 and remodelled heart with left/right ventricles and
atriums at E12.5 (Harvey, 2002) (Figure 4.5). In section 4.2.2, I found more intense staining
of Cav-1 in the heart of mdx compared to the heart of the wt mouse embryos at E17.5 (Figure
4.3 C, F, I and L). It has been reported that Cav-1 protein localises in endothelium of heart in
E14.5 wt mouse (Ramirez et al., 2002). To better understand the localisation of Cav-1 during
heart development, I examined the staining patterns of Cav-1 in the hearts of wt, mdx, DMhet
and cav-3-/- embryos from E11.5 to E17.5 (Figure 4.6). In the heart of wt embryos, Cav-1
localises to the atrium as early as at E11.5 (Figure 4.6 A). Surprisingly at E11.5, the DMhet
embryo has looping heart and mdx embryo has linear heart tube, suggesting a one-day and
three-day delays in the heart development respectively (Figure 4.6 B and D). Cav-1 localises
to a small region in the atrium of E11.5 mdx heart and in the heart loop of E11.5 DMeht
embryos (Figure 4.6 B and D). The staining intensity of Cav-1 in the atrium of the wt
embryos increases at E13.5 and then decrease from E15.5 to E17.5 (Figure 4.6 E, I and M).

187
Figure 4.6 Cav-1 localises in the atrium of developing hearts Wt, mdx, cav-3-/- and DMhet embryos of E11.5-E17.5 were fixed and embedded in paraffin wax (prepared by Dr. Dean Larner). Embryo wax blocks were microtome dissected in 5 μm and localisation of Cav-1 in hearts was determined by immunohistochemistry stain with anti-Cav-1 antibody. At E11.5, Cav-1 protein is detected in the atrium of hearts in (A) wt, (B) mdx, (C) cav-3-/- and (D) DMhet embryos. The intensities of Cav-1 staining in the atrium at E13.5 are comparable in (E) wt, (F) mdx and (G) cav3-/-; staining intensity is lower in (H) DMhet compared to (E) wt embryos. At E15.5, the staining intensity of Cav-1 in (J) mdx atrium are higher than (I) wt embryos; the intensity of Cav-1 staining is comparable in (I) wt and (L) DMhet atria; the staining intensity of Cav-1 is higher in (K) cav3-/- atrium compared to (I) wt atrium. At E17.5, the staining intensities of Cav-1 are comparable in the atria of (M) wt, and (N) mdx embryos; the intensity of Cav-1 staining in (O) cav3-/- atrium is lower compared to that in (M) wt atrium; the staining intensity of Cav-1 in (P) DMhet atrium is comparable to that in (O) cav3-/- atrium. Images are representative Cav-1 immunohistochemistry of two embryos.
188
Cav-1 localises to the wall and trabeculae in both mdx atrium and DMhet atrum between
E13.5-E17.5 (Figure 4.6 F, J and N; H, L and P). Similar to the non-dystrophic atrium, the
staining intensity of Cav-1 in mdx atrium and DM het atrium in E13.5 mdx atrium increases
between E13.5-E15.5 and then decreases between E15.5-E17.5 (Figure 4.6 F, J and N; H, L
and P). In the atrium at E15.5, the intensity of Cav-1 staining is higher in mdx compared to
the non-dystrophic and DMhet embryos (Figure 4.6 I, J and L).
Cav-1 localises in the ventricle and atrium of the E11.5 cav-3-/- heart; the staining intensity is
higher in the ventricle than in the atrium (Figure 4.6 C). In the atrium of the cav-3-/- embryos,
Cav-1 localises to the wall of cav3-/- atrium trabeculae between E13.5-E17.5 (Figure 4.6 G, K
and O). The intensity of Cav-1 staining increases between E13.5 to E15.5 and decreases at
E17.5 (Figure 4.6 G, K and O). There is more intense staining of Cav-1 in the cav3-/- atrium at
E15.5 and less in the cav3-/- atrium at E17.5 compared to the non-dystrophic atrium at the
same stages (Figure 4.6 I, K, M and O). There is hypercellularity of the atrium in mdx and
cav3-/- embryos compared to non-dystrophic embryos at E15.5 (Figure 4.6 I, J and K). These
data suggest that both Cav-1 and Cav-3 may play a role in the heart development.

189
Figure 4.7 Structure of the atrial trabeculae is perturbed in mdx, DMhet and cav-3-/- embryos during development. Wt, mdx, cav-3-/- and DMhet embryos of E11.5-E17.5 were fixed and embedded in paraffin wax (prepared by Dr. Dean Larner). Embryo wax blocks were microtome dissected in 5 μm and immunohistochemically stained with anti-Cav-1 antibody. The structure of atrial trabeculae was then examined. Cav-1 localises in the wt atrial trabeculae at (A) E11.5, (E) E13.5, (I) E15.5 and (M) E17.5. Compared to the wt atrial trabeculae, the mdx atrial trabeculae are longer at (B) E11.5, (F) 13.5, (J) E15.5 and (N) E17.5. The cav-3-/- atrial trabeculae are short and fat at (C) E11.5, (G) E13.5 and (O) E17.5 but was long and thin at (K) E15.5 compared to the wt embryos at the same stages. The DMhet atrial trabeculae are thin and long at (D) E11.5, (H) E13.5, (L) E15.5 and (P) E17.5 compared to the wt embryos at the same stages. Images are representative Cav-1 immunohistochemistry of two embryos.
190
Cav-1 localises in atrial trabeculae
Our previous report has established that the atrial trabeculae in E17.5 mdx are long and
hooked and those in E17.5 cav-3-/- are short and stubby (Merrick et al., 2009). To further
establish the localisation of Cav-1 in the heart and the relationship of Cav-1 and
cardiomyopathy in muscular dystrophy, I examined the Cav-1 staining in the atrium of hearts
from wt, mdx, DMhet and cav-3-/- embryos. Cav-1 localises in the atrial trabeculae of wt, mdx,
DMhet and cav-3-/- hearts at E11.5, E13.5, E15.5 and E17.7 (Figure 4.7). The atrial trabeculae
of mdx (Figure 4.7 B, F, J and N) are longer than those of the wt mouse embryos (Figure 4.7
A, E, I and M) at E11.5, E13.5, E15.5 and E17.5. Similarly, the atrial trabeculae of DMhet are
also thinner and longer compared to the wt atrial trabeculae at E11.5, E13.5, E15.5 and E17.5
(Figure 4.7 D, H, L and P; compare with Figure 4.7 A, E, I and M). Compared to the wt atrial
trabeculae, the atrial trabeculae of both mdx (Figure 4.7 B, F, J and N; compare to Figure 4.7
A, E, I and M) and DMhet embryos (Figure 4.7 D, H, L and P; compare to Figure 4.7 A, E, I
and M) are hooked at all stages examined. The atrial trabeculae of the cav-3-/- embryos are
short and fat at E11.5, E13.5 and E17.5 compared to the wt atrial trabeculae at the same stages
(Figure 4.7 C, G, and O; compare to Figure 4.7 A, E and M). However, the atrial trabeculae of
E15.5 cav3-/- embryos are long and thin compared to the atrial trabeculae of E15.5 wt
embryos (Figure 4.7 K; compare to Figure 4.7 I). These data suggest that both Cav-1 and Cav-
3 may play a role in the progress of cardiomyopathy in the dystrophic embryos. .

191
Figure 4.8 Localisation of Cav-1 in atrial trabeculae changes during heart development Wt, mdx, cav-3-/- and DMhet embryos of E11.5-E17.5 were fixed and embedded in paraffin wax (prepared by Dr. Dean Larner). Embryo wax blocks were microtome dissected in 5 μm; Cav-1 in atrial trabeculae was immunohistochemically labeled with anti-Cav-1 antibody. Cav-1 localises in constraint regions in the wt atrial trabeculae at (A) E11.5, (E) E13.5, (I) E15.5but diffuses at (M) E17.5. In mdx atrial trabeculae, Cav-1 widely spreads from (B) E11.5 to (F) 13.5 and concentrates at the edge from (J) E15.5 to (N) E17.5. In the cav-3-/- atrial trabeculae, Cav-1 is not found at (C) E11.5. In cav-3-/- embryos, Cav-1 is widespread punctate staining in (G) E13.5 atrial trabeculae, and localises at the edge of the atrial trabeculae at (K) E15.5 and (O) E17.5. Cav-1 in the DMhet atrial trabeculae spreads widely at (D) E11.5, is punctate staining at (H) E13.5and (L) E15.5 and diffuses at (P) E17.5. Images are representative Cav-1 immunohistochemistry of two embryos.

192
Determining the localisation of Cav-1 in atrial trabeculae in higher magnitude
I examined further the localisation of Cav-1 in atrial trabeculae in higher magnitude (Figure
4.8). In the non-dystrophic atrial trabeculae, Cav-1 distributes widely at E11.5 and E15.5 and
represents as punctate staining at E13.5 (Figure 4.8 A, E and I). In the E17.5 wt atrium, Cav-1
staining is diffused and within the trabeculae (Figure 4.8 M). Cav-1 staining is widespread
within the mdx atrial trabeculae at E11.5 (Figure 4.8 B). Cav-1 staining is dispersed within the
mdx trabeculae at E13.5 and then concentrates to the edge of the muscles in mdx trabeculae
from E15.5 to E17.5 (Figure 4.8 F, J and N). The localisation of Cav-1 in the DMhet atrial
trabeculae is similar to that in mdx at all stages examined (Figure 4.8 B, F, J and N; Figure 4.8
D, H, L and P). In the DMhet embryos, Cav-1 is dispersed within the atrial trabeculae at
E11.5, localises on the edge of the atrial trabeculae at E13.5 and E15.5, and diffuses within
the atrial trabeculae at E17.5 (Figure 4.8 D, H, L and P).
At E11.5, Cav-1 staining is not detected in the atrial trabeculae of cav-3-/- hearts (Figure 4.8
C). At E13.5, Cav-1 staining distributes dispersedly in the cav-3-/- atrial trabeculae (Figure 4.8
G). At E15.5 and E17.5, Cav-1 staining is confined to the edge of the cav-3-/- atrial trabeculae
(Figure 4.8 K and O). Difference in the localisation of Cav-1 in the heart trabeculae of mdx,
cav-3-/- and DMhet embryos compared to the wt embryos correlates with the perturbed atrial
trabeculae structure observed in the present study (Figure 4.7) and our previous report
(Merrick et al., 2009). These data suggest that Cav-1 together with Cav-3 may contribute to

193
the cardiomyopathy reported in muscular dystrophy and the mouse models (Merrick et al.,
2009; Woodman et al., 2002). The presence of Cav-1 protein at as early as the heart tube stage
(E13.5 of DMhet) suggests it may participate in the heart development though this would
need to be confirmed in nondystrophic mouse embryos at earlier stages.
Cav-1 localisation in the developing heart ventricles
I also examined the localisation and staining intensity of Cav-1 in the heart ventricles during
development (Figure 4.9). At E13.5, the staining intensity of Cav-1 is greater in mdx
ventricles compared to the wt ventricles at the same stage (Figure 4.9 A and B). Ventricles of
E13.5 DMhet have intensity of Cav-1 staining comparable to that in the wt ventricles at the
same stage (Figure 4.9 A and D). Cav-1 staining spreads widely in the trabeculae of the non-
dystrophic, mdx and DMhet heart ventricles at E13.5 (Figure 4.9 A, B and D). At E15.5, the
staining intensity of Cav-1 in the ventricles of the wt, mdx and DMhet hearts decreases
compared to the wt, mdx and DMhet ventricles at E13.5 (Figure 4.9 E, F and H). At E17.5,
Cav-1 localises to the edge of the trabeculae in the wt and mdx ventricles (Figure 4.9 I and J).
The intensity of Cav-1 staining in the wt and mdx ventricles is comparable at this stage
(Figure 4.9 I and J). The staining intensity of Cav-1 is lower in the ventricles of E17.5 DMhet
compared to the E17.5 wt ventricles (Figure 4.9 I and L).

194
Figure 4.9 Localisation of Cav-1 changes in ventricles during heart development. The non-dystrophic, mdx, cav-3-/- and DMhet embryos of E13.5-E17.5 were fixed and embedded in paraffin wax (prepared by Dr. Dean Larner). Embryo wax blocks were microtome dissected in 5 μm. Cav-1 in the heart ventricles was immunohistochemically labeled with anti-Cav-1 antibody. At 13.5, the staining intensity of Cav-1 is higher in the (B) mdx ventricles compared to the (A) wt heart ventricles; the staining intensity of Cav-1 in the (C) cav-3-/- ventricles is weaker than the wt control; the (D) DMhet heart ventricles have intensity of Cav-1 staining comparable to that of the (A) wt ventricles. The staining intensity of Cav-1 decreases in ventricles of the E15.5 (E) wt, (F) mdx, (G) cav3-/- and (H) DMhet hearts compared to the ventricles of (A) wt, (B) mdx, (C) cav3-/- and (D) DMhet hearts at E13.5. At 17.5, the intensity of Cav-1 staining is comparable in the (I) wt and (J) mdx ventricles; (K) cav3-/- and (L) DMhet ventricles have lower intensity of Cav-1 staining compared to the (I) wt ventricles. Images are representative Cav-1 immunohistochemistry of two embryos.

195
Cav-1 localises in the outer region of the cav-3-/- ventricle at E13.5 (Figure 4.9 C) and the
intensity of Cav-1 staining in the cav-3-/- ventricle decreases at E15.5 and E17.5 (Figure 4.8 G
and K). There is hypercellularity in ventricles of mdx and cav3-/- at all stages examined
(Figure 4.9 B, C, F, G, J and K). Furthermore, the long hooked ventricle trabeculae in mdx and
DMhet hearts as well as the short and stubby trabeculae in the cav-3-/- ventricles at E13.5 and
E15.5 are consistent with our previous report (Merrick et al., 2009). Here I further established
that at E17.5, the ventricular trabeculae of mdx and DMhet hearts are long hooked while those
of the cav-3-/- hearts are short and stubby (Figure 4.9 J, K and L). These data suggest that Cav-
1 plays a role in the development of heart ventricles. These data also suggest that the
localisation and the staining intensity of Cav-1 in the heart ventricles are affected by Cav-3.
4.3. Discussion
4.3.1. E17.5 mdx embryos have elevated levels of Caveolin-1 and Caveolin-3 proteins
Previous reports suggested that levels of Cav-1 protein in skeletal and cardiac muscles are not
altered when Cav-3 is knocked down; however, they did not provide reliable loading controls
in these reports (Galbiati et al., 2001a; Volonte et al., 2008). In the present study, I established
a positive correlation between the protein levels of Cav-3 and Cav-1 in that elevated Cav-3
protein levels in mdx are accompanied by the increased protein levels of Cav-1 (Figure 4.1).
196
With the absence of or reduced levels of Cav-3 protein, Cav-1 levels are concomitantly down-
regulated (Figure 4.1). The effect of Cav-3 on the protein levels of Cav-1 is supported by an
immunohistochemistry analysis of Cav-1 localisation in E17.5 embryos, which reveal
elevated intensity of Cav-1 staining in mdx and decreased intensity of Cav-1 staining in
DMhet and cav-3-/- (Figure 4.2 and 4.3).
4.3.2. Cav-1 protein levels correlate with Cav-3 protein levels in E17.5 mouse embryos
Previous report showed that Cav-1 is expressed in the lung, kidney and gut of E15 mouse
embryos (Ramirez et al., 2002). Here I established the localisation of Cav-1 in heart, lung, gut,
kidney and liver in E17.5 wt and dystrophin-deficient mdx mouse embryos (Figure 4.3 and
4.4). Using immunohistochemistry I established the localisation of Cav-1 to the epithelium
lining of lung, the smooth muscle layer of gut, the parenchyma of liver and the tubular
structure of kidney of both E17.5 wt and mdx mouse embryos (Figure 4.4). The staining
intensity of Cav-1 is elevated in heart, lung, gut, kidney and liver of E17.5 dystrophin-
deficient mdx embryos, which have elevated levels of Cav-3 protein (Figure 4.1 and 4.2).
With no or reduced Cav-3 staining (E17.5 cav-3-/- or DMhet), there is concomitant reduction
of Cav-1 staining intensity in heart, lung, gut and kidney (Figure 4.1 and 4.4). This suggests
that levels of Cav-3 protein affect the levels of Cav-1 protein in organisms. Cav-3 has long
been reported to be the predominant caveolin in striated (skeletal and cardiac) and smooth

197
muscles (Scherer et al., 1997; Song et al., 1996). It has been reported that Cav-3 also
expresses in the lung, kidney and liver of 3 to 4-week old mice using immunohistochemistry
and in the brain and kidney of 10 to 12-week old rats by RT-PCR (Galbiati et al., 2000; Park
et al., 2012). Therefore, the expression of Cav-3 may be low in tissues other than muscles,
making detection of Cav-3 protein in other tissues difficult. The maintenance of a balance
between protein levels of Cav-1 and Cav-3 could be important for the homeostasis of signal
transduction within tissues such that down-regulation of one type of caveolin leads to the
reduction of the other type.
4.3.3. Perturbed protein levels of Cav-1 and Cav-3 may contribute to cardiomyopathy in
dystrophic mouse models
The patients of Duchenne muscular dystrophy (DMD) suffer from cardiomyopathy (Parker et
al., 2005). The mouse model mdx which has elevated levels of Cav-3 also displays
cardiomyopathy (Merrick et al., 2009). It has been reported that Cav-1 null mice display
dilation and hypertrophy of ventricles and atria as well as the failure of heart function (Cohen
et al., 2003; Jasmin et al., 2011; Zhao et al., 2002) (Table 4.1). Cardiomyopathy has also been
reported in cav-3-/- mice, including left ventricle hypertrophy, chamber dilation and reduced
heart function (Woodman et al., 2002) (Table 4.1). Furthermore, the cav-1/cav-3 double
knocked out mice have cardiac hypertrophy and cardiac myocyte disorganisation, suggesting

198
that both Cav-1 and Cav-3 proteins are important for the function and development of hearts
(Park et al., 2002) (Table 4.1). In the present study I established that protein levels of Cav-1
are elevated along with Cav-3 up-regulation in mdx heart (Figure 4.2 and 4.3). Other
pathologies of caveolin knocked-out mice are summarised in table 4.1.
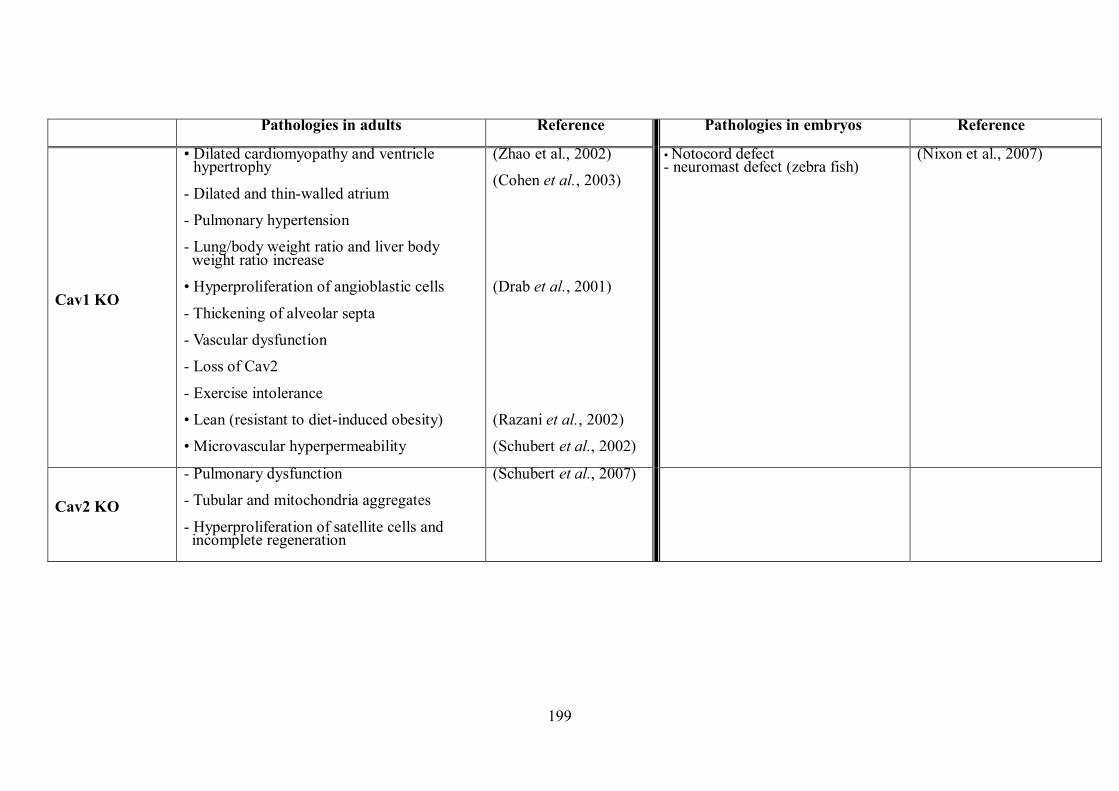
199
Pathologies in adults Reference Pathologies in embryos Reference
Cav1 KO
• Dilated cardiomyopathy and ventricle hypertrophy
- Dilated and thin-walled atrium
- Pulmonary hypertension
- Lung/body weight ratio and liver body weight ratio increase
• Hyperproliferation of angioblastic cells
- Thickening of alveolar septa
- Vascular dysfunction
- Loss of Cav2
- Exercise intolerance
• Lean (resistant to diet-induced obesity)
• Microvascular hyperpermeability
(Zhao et al., 2002)
(Cohen et al., 2003)
(Drab et al., 2001)
(Razani et al., 2002)
(Schubert et al., 2002)
Notocord defect - neuromast defect (zebra fish)
(Nixon et al., 2007)
Cav2 KO
- Pulmonary dysfunction
- Tubular and mitochondria aggregates
- Hyperproliferation of satellite cells and incomplete regeneration
(Schubert et al., 2007)

200
Pathologies in adults Reference Pathologies in embryos Reference
Cav3 KO
• Whole body adiposity increase – insulin resistance
-Decreased level of insulin receptor (IR) and hyperphosphorylation of IR
• Dilation and wall thickness of left ventricles
(Capozza et al., 2005b)
(Woodman et al., 2002)
Muscle
- Hypertrophy
- Fibre density increase
- Myonuclei displacement
Muscle stem cell
- Hyperproliferation (E15.5)
- Increased apoptosis (E15.5)
- Pax7+ cell loss
Heart
- Left ventricular wall thickening
- Long and hooked atrium trabeculae
(Merrick et al., 2009)
(Merrick et al., 2009) and the present report
Cav1/Cav3 KO
- Cardiac hypertrophy
- Cardiac myocyte disorganization
- Lack Cav2
(Park et al., 2002)
mdx/cav-3+/- (DMhet)
Muscle
- Decreased muscle fibre density of intercostal muscles
- Increased Fast MyHC positive fibres
Muscle stem cells
(Merrick et al., 2009)
(Merrick et al., 2009)

201
Pathologies in adults Reference Pathologies in embryos Reference
- Attrition of Pax7-positive cells
Heart
- Delayed heart development by 1 day
- long and hooked atrial and ventricular trabeculae
- hypercellularity of ventricles
The present report
Table 4.1 The summary of the pathologies of mice with caveolin knocked out.

202
In the present study, I found abnormal trabeculae in atria and ventricles and hypercellularity in
ventricles (Figure 4.7 and 4.9; table 4.1). Trabeculae in both mdx and DMhet mice hearts at
E13.5 are long and hooked; this phenotype persists to E17.5 (Figure 4.7 and 4.9; table 4.1).
Trabeculae in cav-3-/- mice from E13.5 to 17.5 are short and stubby (Figure 4.7 and 4.9; table
4.1). Moreover, different localisations of Cav-1 in atrial and ventricular trabeculae of wt and
dystrophic (mdx, cav-3-/- and DMhet) mouse embryos correlate with the cardiomyopathy
observed in dystrophic embryos (Figure 4.8 and 4.9). It is likely that both Cav-1 and Cav-3
proteins take part in the progression of cardiomyopathy in mdx.
4.3.4. Heart development in mdx embryos is delayed
In the present study, I observed a linear heart tube in E11.5 mdx which represents a three-day
delay during heart development (Figure 4.6). However, immunohistochemical staining of
Cav-1 for wt mice at earlier stages is required to confirm the delayed heart development of
dystrophin-deficient mice. This suggests that dystrophin, Cav-1 and Cav-3 are important in
heart patterning as mdx mice are dystrophin-deficient and have elevated levels of Cav-3 and
Cav-1 proteins (Figure 4.1).
Involvement of dystrophin in the development of cardiomyopathy is further supported by
mdx/cav-3+/- (DMhet) embryos with reduced levels of Cav-3 protein than mdx (Figure 4.1).
DMhet mouse embryos exhibit looping hearts at E11.5 which is two-day more mature than

203
the E11.5 mdx heart but one-day less mature than the documented E11.5 wt heart (Figure 4.6).
There is no delay of heart development for E11.5 cav-3-/- heart (Figure 4.6). Since there is still
Cav-1 staining in the heart of E11.5 cav-3-/- mouse embryo (Figure 4.6), it is likely that
development of heart in the cav-3-/- mouse is maintained by the presence of Cav-1 proteins.
This suggests that Cav-3 play a role in the delay of heart development in these mice.

204
Chapter 5. The protein levels of Cav-1, Cav-3 and Pax7 and the IGF-2 signalling are
perturbed in mdx mouse and dystrophin-deficient myoblasts
5.1. Introduction:
Primary myoblasts from mdx embryos and juvenile mdx exhibit aberrant behaviours,
including elevated proliferation rate and increased apoptosis (Merrick et al., 2009; Smith et
al., 1995; Smith and Schofield, 1994). These mis-regulated stem cell behaviours may account
in part for the pathology of mdx mouse as these occur earlier in myogenesis. In chapter 3, I
showed that impaired differentiation of dystrophin-deficient myoblasts is related to the
perturbation of the levels of transcription factor Pax7, the levels of Cav-1 and Cav-3 and the
levels of growth factor IGF-2 and related signalling pathways (p57kip2, AKT/mTOR and ERK)
(section 3.2.7 and 3.2.8). IGF-2 is expressed and glycosylated as prepro-IGF-2 (67 kDa),
which after subsequent post-translational cleavage produces pro-IGF-2 (23-26 kDa) and
mature/active IGF-2 (14-18 kDa) (Duguay et al., 1998). To further understand the expression
patterns of these key genes in vivo, I conducted immunoblotting of protein extracts from
dystrophin-deficient and wt mouse embryos. I also conducted immnuoprecipitation of extracts
from juvenile and adult skeletal muscle tissues to demonstrate the relationship that Cav-3
level affects the level of Cav-1.

205
5.2. Results:
5.2.1. IGF-2 and its downstream signalling pathways are perturbed in E17.5 dystrophic
embryos
In chapter 3, I found that the levels of IGF-2 protein and its downstream signalling pathways
are perturbed in differentiating PD50A myoblasts (section 3.2.8). It has also been established
in chapter 3 (Figure 3.12) and in previous work that IGF-2 is a survival factor for cultured
PD50A myoblasts (Smith et al., 1995). In a previous report using transgenic mice which
overexpress IGF-2, we showed that IGF-2 is required for the differentiation of fast skeletal
muscle fibres during fibre type specification (E15.5-P1) (Merrick et al., 2007). We have also
reported previously that the number of fast skeletal muscle fibres increases in E17.5 mdx
embryos compared to wt (Merrick et al., 2009). To establish whether IGF-2 signalling
pathways are also perturbed in E17.5 dystrophic embryos, I examined the expression of IGF-2
protein and its downstream targets (Figure 5.1). I was unable to detect the active IGF-2
peptide in the E17.5 mouse embryos with our present immunoblotting technology. However, I
was able to detect the levels of prepro- and pro-IGF-2 in the E17.5 mouse embryos. Levels of
prepro-IGF-2 (67 kDa) in E17.5 mdx and DMhet mouse embryos increase respectively by
20% (p= 8.27×10⁻³) and 24% (p= 1.4×10⁻⁴) compared to wt embryos (Figure 5.1 A and B). In
contrasts, the level of prepro-IGF-2 (67 kDa) in the E17.5 cav-3-/- mouse embryos is only
around 90% (p= 8.46×10⁻³) of that in the wt embryos (Figure 5.1 A and B).

206
Figure 5.1 IGF-2 signalling in mdx is mediated from AKT/mTOR pathway. Whole protein extracts were collected for decapitated E17.5 embryos of wt, mdx, DMhet and cav-3-/-. Proteins were harvested by grinding the fresh embryos in RIPA buffer. (Refer to section 2.8.1 for detail) (A) 15 μg of each protein sample was loaded for immunoblotting of IGF-2, pmTOR, pAKT/AKT and pERK/ERK. Prepro-IGF-2 (67 kDa) and pro-IGF-2 (23-26 kDa) were detected here. (B) At E17.5, mdx and DMhet embryos have higher pro-IGF-2 protein levels while the cav-3-/- embryos have lower pro-IGF-2 compared to the wt embryos. (C) p57kip2 protein levels decrease in mdx, cav-3-/- and DMhet embryos compared to wt mouse embryos at E17.5. (D) At E17.5, AKT signaling is perturbed in the dystrophic embryos. (E) Levels of pmTOR protein increase in mdx and DMhet embryos while levels of mTOR protein decrease in the cav-3-/- embryos. (F) Erk signaling is perturbed in the E17.5 dystrophic embryos. (ANOVA; *: p <0.05; **p<0.01; ***P<0.001; compared to wt embryos; n≧4). Igf2: insulin-like growth factor 2; CDKN1c (p57kip2): Cyclin-dependent kinase inhibitor 1c; pmTOR: phospho-mTOR; Erk: Extracellular signal-regulated kinases; pErk: phospho-Erk; cav-3-/-: Cav-3 knockout; DMhet: mdx with Cav-3 heterozygous knockout.

207
A
B
C D
E F

208
Protein levels of pro-IGF-2 (23-26 kDa) remain constant in E17.5 mdx, DMhet and cav-3-/-
embryos but are 13-18% lower compared to wt embryos (Figure 5.1 A and B; p= 7.89×10⁻⁵,
6.36×10⁻³ and 3.64×10⁻⁵ respectively), suggesting that different isoforms may have distinct
functions in embryos. The perturbed IGF-2 expression in E17.5 mdx adds to our
immunohistochemistry data, which show abnormal expression/localisation of IGF-2 in mdx
compared to the wt control (unpublished data of Dr. Deborah Merrick and Dr. Janet Smith),
by showing that ratios between prepro-IGF-2 and pro-IGF-2 increase in E17.5 mdx.
p57kip2 (Cdk inhibitor; CDKN1c) is negatively regulated by IGF-2 (Grandjean et al., 2000;
Matsuoka et al., 1995; Matsuoka et al., 1996). In differentiating PD50A myoblasts, I found
the levels of p57kip2 protein are perturbed (Figure 3.16). To study whether the levels of p57kip2
protein are affected by IGF-2 in the dystrophic embryos, I examined the expression of p57kip2
protein in the E17.5 wt, mdx, DMhet and cav-3-/- embryos (Figure 5.1 A and C). Levels of
p57kip2 protein are down-regulated in E17.5 mdx by 20% (p= 2.78×10⁻⁴), in cav-3-/- by 18%
(p= 3.79×10⁻⁴) and in DMhet by 35% (p= 2.63×10⁻⁴) compared to the wt embryos (Figure 5.1
A and C). Decreased protein levels of p57kip2 in the E17.5 mdx and DMhet embryos are
consistent with the up-regulation of IGF-2 in these dystrophic embryos (Figure 5.1 A, B and
C). These data suggest that IGF-2/p57kip2 pathway may be essential to normal embryonic
myogenesis and that its misregulation may contribute to the dystrophic pathology.

209
IGF-2 signalling is mediated via AKT/mTOR pathway in mdx
I have established that IGF-2/AKT/mTOR signalling pathway is perturbed in the
differentiating PD50A myoblasts (Figure 3.17). To establish whether the AKT/mTOR
signalling is perturbed in dystrophic embryos, I examined levels of AKT, phosphorylated
AKT (pAKT) and phosphorylated mTOR (pmTOR) proteins in the E17.5 wt, mdx, DMhet
and cav-3-/- embryos (Figure 5.1 A, D and E). At E17.5, protein levels of total AKT increase
by 30% in mdx (p= 3.29×10⁻³) and by by 50% in DMhet embryos (where Cav-3 is reduced;
p= 8.33×10⁻³) compared to the wt embryos (Figure 5.1 A). In E17.5 cav-3-/- embryos, the
levels of total AKT decrease by 53% (p= 6.41×10⁻⁸) compared to the wt embryos (Figrue 5.1
A), suggesting that there is a feedback loop for Cav-3 and AKT pathway. The levels of active
AKT (pAKT) increase by 26% in E17.5 mdx (p=3.7×10-2) and by 20% in E17.5 DMhet
(p=1.13×10⁻⁴) compared to wt (Figure 5.1A). At E17.5, the levels of pAKT decrease by 44%
in cav-3-/- embryos (p=1.93×10⁻⁸) compared to wt (Figure 5.1 A). However, the ratio of
pAKT/AKT is comparable in the E17.5 mdx, DMhet, cav-3-/- and non-dystrophic embryos
(Figure 5.1 A and D), suggesting that this pathway may not substantially contribute the
pathology of muscular dystrophy.
Phospho-mTOR (pmTOR) protein, a target of AKT signalling but also a positive regulator of
Igf-2 expression, increases in both E17.5 mdx and E17.5 DMhet embryos, by 1.6 fold (p=
2.59×10⁻³) and 2.8 fold (p= 1.42×10⁻³) respectively compared to wt embryos (Figure 5.1 A

210
and E). Increased activity in mTOR is consistent with the elevated levels of IGF-2 protein in
the E17.5 mdx and DMhet embryos (Figure 5.1 A, B, D and E). In E17.5 cav-3-/-, the level of
pmTOR decrease by 43% (p= 1.77×10⁻²) compared to the wt embryos (Figure 5.1 A and E).
Decreased activity of AKT/mTOR correlates with the decrease in IGF-2 protein levels in
E17.5 cav-3-/- (Figure A, B, D and E). These data suggest that IGF-2/mTOR signalling
pathways are perturbed in the E17.5 dystrophic embryos.
Erk signalling pathway is perturbed in the dystrophic mouse embryos
In chapter 3, I showed that ERK signalling pathways are perturbed during in differentiating
PD50A myoblasts (Figure 3.18). To establish whether the ERK signalling is also perturbed in
dystrophic embryos, I examined protein expression of ERK42 and ERK44 in E17.5
dystrophic embryos. The ratios of pERK42/ERK42 and pERK44/ERK44 in mdx decrease by
28% (p= 2.31×10⁻³) and 36% (p= 1.1×10⁻⁴) respectively compared to the wt embryos (Figure
5.1 A and F). In E17.5 DMhet, the ratio of pERK42/ERK42 increases by 33% (p= 1.32×10⁻²)
compared to wt embryos while the ratio of pERK44/ERK44 is not significantly different from
that in wt embryos (Figure 5.1 A and F). In the E17.5 cav-3-/- embryos, the ratios of
pERK42/ERK42 and pERK44/ERK44 are comparable to those in wt embryos (Figure 5.1 A
and F). These data suggest that Cav-3 suppresses the ERK signalling pathways in E17.5 mdx
embryos.

211
Figure 5.2 Caveolin-1 interacts with caveolin-3 in adult skeletal muscles. 100 μg of skeletal muscle tissue extracts from wt, cav-3-/- and mdx mice were used for immunoprecipitation. The Cav-1 protein complex in extract was pulled down with anti-caveolin-1 antibody and Protein A Sepharose CL-4B beads. There are muscle tissue extracts from 4 weeks (A) and 9 weeks (B) old mice. 10 μg of each extract were loaded as input control and rabbit Igs were applied as the negative control for IP. Pulled-down complexes were aliquoted into two; one of which was treated with 8 M urea and 5 mM DTT at 37 ° C for 30 minutes to break down the complexes. Components of pulled-down complex were detected with anti-Cav-3 antibody. (A) More Cav-3 proteins bind to the Cav-1 protein complexes in 4-week mdx skeletal muscles. (B) In 9-week mdx skeletal muscles, Cav-1 protein complexes have more Cav-3 within.
A
B

212
5.2.2. Cav-1 and Cav-3 form hetero-oligomers in the skeletal muscles of both wt and mdx
mice
In chapter 3 and 4, I established that there were elevated levels of Cav-3 in PD50A myoblasts
and mdx embryos using immunoblotting (Figure 3.15 and 4.1). I also established that levels of
Cav-1 (together with Cav-3) are up-regulated in PD50A myoblasts and mdx embryos (Figure
3.14 and 4.1). Through immunohistochemistry, I found that staining of both caveolins is more
intense in mdx and DMhet embryos compared to wt embryos (Figure 4.2 and 4.3). It has been
reported that Cav-1 interacts with Cav-3 in atrial cardiac myocytes and in fibroblasts
overexpressing Cav-3 using a Triton insolubility assay and immunoprecipitation (IP)
(Capozza et al., 2005a; Volonte et al., 2008). There is pathological crisis between 4 weeks
(late juvenile) to 9 weeks (adult) of skeletal muscles in mdx mice; characterised by increases
in the number of hypertrophic fibres and the number of split fibres (Tanabe et al., 1986). To
establish whether Cav-1 and Cav-3 form heteroligomers in dystrophin-deficient skeletal
muscles, I used adult muscle tissue samples from 4- and 9-week old mice (non-dystrophic,
cav-3-/- and mdx) (Figure 5.2). Cav-3 proteins are pulled down with Cav-1 in the wt and mdx
skeletal muscles from both 4- and 9-week old mice (Figure 5.2 A and B), suggesting the
potential of Cav-1 and Cav-3 to form hetero-oligomers. Both the levels of Cav-1 and Cav-3
increase in mdx (Figure 5.2 A and B), and this is consistent with the immunoblotting results
from E17.5 embryos (Figure 4.1).

213
Figure 5.3 The PD50A myoblasts and myotubes have higher coincident expression of Cav-1 and Cav-3 proteins compared to the C2C12 myoblasts and myotubes. Localisation of Cav-1 and Cav-3 was investigated in the myoblasts and myotubes (C2C12 and PD50A). Myotubes were obtained by shifting the 80% confluent myoblasts to low mitogen medium for 14 days. (A) Cav-1 colocalises with Cav-3 in PD50A myoblasts. (B) Cav-1 colocalises with Cav-3 in perinuclear region of PD50A myotubes. (a)(e) Nuclei were labelled with 10 μg/ml of DAPI. (b)(f) Cav-1 proteins were labeled with Alexa Fluor 488. (c)(g) Cav-3 proteins were labeled with Texas Red. Merged images are shown in (d) and (h). (A (c)) The fluorescent signals for Cav-3 are hardly visible in C2C12 myoblasts. Arrows in the insets of A (h) and B (f) suggests the colocalisation of Cav1 and Cav-3 in the PD50A myblast and myotube; the arrow in the inset of B (d) suggests the colocalisation of both caveolins in the C2C12 myotube.
B
A

214
Cav-1 and Cav-3 colocalise in the non-dystrophic and dystrophic myoblasts and myotubes
I have shown in Figure 5.2 that there is a functional relationship between Cav-1 and Cav-3 in
skeletal muscles. I then doubly labelled both caveolins in myoblasts and myotubes (both
C2C12 and PD50A) (Figure 5.3). In undifferentiated myoblasts, Cav-1 protein localises
predominantly in the plasma membrane of both PD50A and C2C12 myoblasts (Figure 5.3 A
(b) and (f)). Staining of Cav-3 in the non-dystrophic and dystrophin-deficient myoblasts forms
a pattern of distinct punctate dots which are also in the plasma membrane of myoblasts
(Figure 5.3 A (c) and (g)). There are more cytosolic Cav-1 and Cav-3 in PD50A myoblasts
compared to C2C12 controls (Figure 5.3 A (b), (c), (g) and (f)). Cav-1 colocalises with Cav-3
in PD50A myoblasts; however, no obvious colocalisation of Cav-1 and Cav-3 is observed in
C2C12 myoblasts (Figure 5.3 A (d) and (h)).
Cav-1 proteins are presented as punctate structure along the sarcolemma of C2C12 myotubes
while the majority of Cav-1 are cytosolic in PD50A myotubes (Figure 5.3 B (b) and (f)). Cav-
3 localises to the sarcolemma of C2C12 myotubes but it is predominately in perinuclear
regions in PD50A myotubes (Figure 5.3 B (c) and (g)). In both C2C12 and PD50A myotubes,
Cav-3 proteins colocalise with Cav-1 (Figure 5.3 B (d) and (h)). These data are consistent
with the IP result shown in Figure 5.2 which shows more Cav-3 proteins associate with Cav-1
in the mdx skeletal muscles.
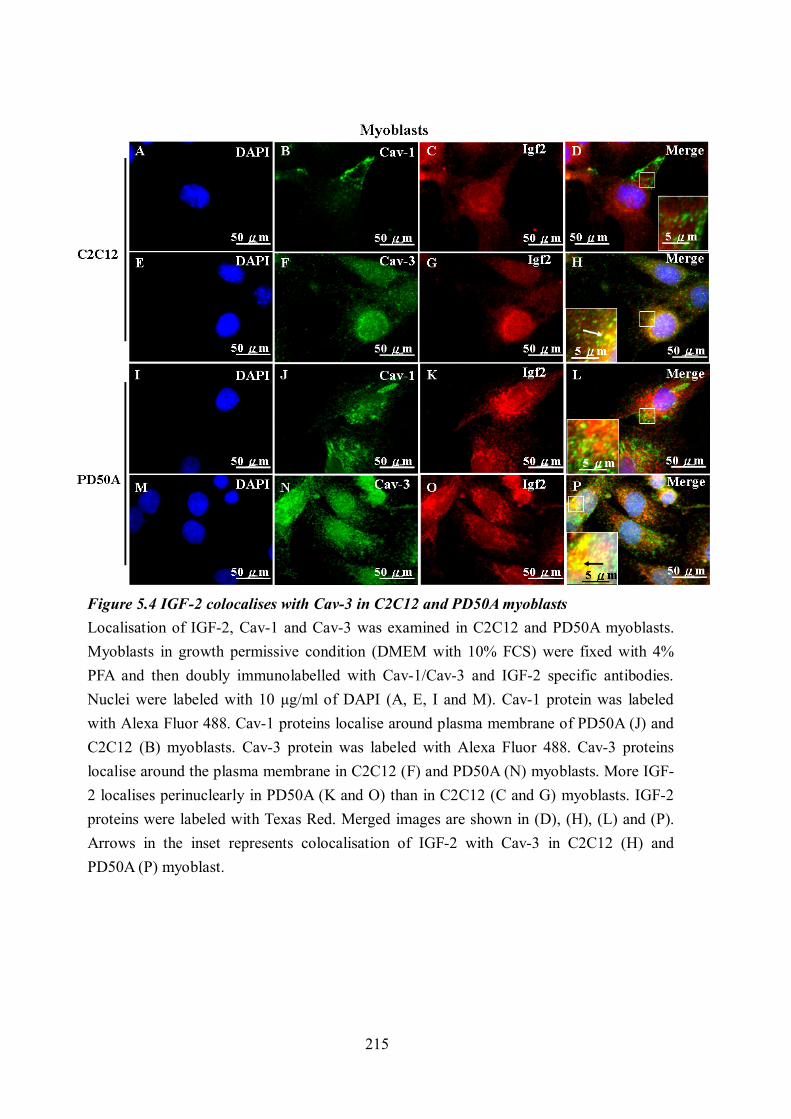
215
Figure 5.4 IGF-2 colocalises with Cav-3 in C2C12 and PD50A myoblasts Localisation of IGF-2, Cav-1 and Cav-3 was examined in C2C12 and PD50A myoblasts. Myoblasts in growth permissive condition (DMEM with 10% FCS) were fixed with 4% PFA and then doubly immunolabelled with Cav-1/Cav-3 and IGF-2 specific antibodies. Nuclei were labeled with 10 μg/ml of DAPI (A, E, I and M). Cav-1 protein was labeled with Alexa Fluor 488. Cav-1 proteins localise around plasma membrane of PD50A (J) and C2C12 (B) myoblasts. Cav-3 protein was labeled with Alexa Fluor 488. Cav-3 proteins localise around the plasma membrane in C2C12 (F) and PD50A (N) myoblasts. More IGF-2 localises perinuclearly in PD50A (K and O) than in C2C12 (C and G) myoblasts. IGF-2 proteins were labeled with Texas Red. Merged images are shown in (D), (H), (L) and (P). Arrows in the inset represents colocalisation of IGF-2 with Cav-3 in C2C12 (H) and PD50A (P) myoblast.

216
5.2.3. IGF-2 associates with Cav-1
Immunofluorescent double labelling of Cav-1 and Cav-3 in the myoblasts
In chapter 3, I observed perturbed IGF-2 signalling in PD50A myoblasts (Figure 3.16). I also
demonstrated that there were elevated levels of both Cav-1 and Cav-3 in PD50A myoblasts
(Figure 3.15). To study whether the perturbed IGF-2 signalling is related to the elevated levels
of Cav-1 and Cav-3, I doubly labelled the myoblasts (C2C12 and PD50A) with either Cav-
1/IGF-2 or Cav-3/IGF-2 (Figure 5.4). In C2C12 myoblasts, IGF-2 localises to the plasma
membrane and more is perinuclear (Figure 5.4 C and G). IGF-2 colocalises with Cav-3 in
C2C12 myoblasts (Figure 5.4 D and H). In PD50A myoblasts, IGF-2 predominantly localises
to the perinuclear region (Figure 5.4 K and O). Similar to C2C12 myoblasts, IGF-2
colocalises with Cav-3 in PD50A myoblasts (Figure 5.4 L and P).

217
Figure 5.5 IGF-2 colocalises with Cav-3 in PD50A myotubes C2C12 and PD50A myoblasts were cultured in low mitogen medium (DMEM with 2% horse serum) for fourteen days for myotube formation. Localisation of IGF-2, Cav-1 and Cav-3 was examined in the C2C12 and PD50A myotubes. Myotubes were fixed with 4% PFA and then doubly immunolabeled with either Cav-1/IGF-2 or Cav-3/IGF-2 specific antibodies. Nuclei were labeled with 10 μg/ml of DAPI (A, E, I and M). Cav-1 is labeled with Alexa Fluor 488. Cav-1 localises around the sarcolemma of PD50A (J) and C2C12 (B) myotubes. Cav-3 is labeled with Alexa Fluor 488. Cav-3 localises around the sarcolemma of C2C12 (F) and PD50A (N) myotubes. More IGF-2 localises perinuclearly in PD50A (K and O) than in C2C12 (C and G) myotubes. IGF-2 was labeled with Texas Red. Merged images are shown in (D), (H), (L) and (P). Arrows in the insets represent the colocalization of (L) IGF-2 with Cav-1 and (P) IGF-2 with Cav-3 in PD50A myotubes.

218
IGF-2 colocalises with Cav-3 in myotubes
In Figure 5.1, I established that IGF-2 signalling is perturbed in E17.5 dystrophic embryos
(mdx and DMhet). I also established that there were elevated levels of Cav-1 and Cav-3 in
E17.5 mdx embryos (Figure 4.1). To establish whether IGF-2 also colocalises with Cav-1 or
Cav-3 in myotubes, I examined the localisation of IGF-2, Cav-1 and Cav-3 in C2C12 and
PD50A myotubes (Figure 5.5). In C2C12 myotubes, IGF-2 staining is predominantly
perinuclear (Figure 5.5 C and G). There is no obvious colocalisation of IGF-2 with neither
Cav-1 nor Cav-3 in C2C12 myotubes (Figure 5.5 D and H). In PD50A myotubes, IGF-2 is
also perinuclear (Figure 5.5 K and O). Although only a minority of IGF-2 colocalise with
Cav-1 in PD50A myotubes (Figure 5.5 L; inset), the majority of IGF-2 colocalises with Cav-3
in PD50A myotubes (Figure 5.5 P; inset). These data suggest that the localisation of IGF-2 to
Cav-3 may contribute to the perturbed IGF-2 signalling found in PD50A myoblasts and mdx
embryos (Figure 3.16 and 5.1).

219
Figure 5.6 More prepro-IGF-2 associates with Caveolin-1 and Caveolin-3 in the skeletal muscles of 4-week old mice 100 μg of skeletal muscle tissue extracts from wild type (wt), cav-3-/- and mdx mice were used for immunoprecipitation. The Cav-1 protein complex in extract was pulled down with anti-caveolin-1 antibody and Protein A Sepharose CL-4B beads. There are muscle tissue extracts from 4 weeks (A) and 9 weeks (B) old mice (non-dystrophic, mdx and cav3-/-). 10 μg of each extract were loaded as input control and rabbit Igs were used as the negative control for IP. Components of the complex pulled down were detected by anti-IGF-2 antibody. (A) Prepro-IGF-2 (46-50 kDa) associate with Cav-1 and Cav-3 in skeletal muscles from 4-week adult mice. (B) Fewer prepro-IGF-2 (46-50 kDa) associates with Cav-1 and Cav-3 in skeletal muscles from 9-week compared to 4-week adult mice. (n=3) The prepro-IGF-2 (46-50 kDa) is indicated by arrows. IGF-2: insulin-like growth factor
A
B

220
IGF-2 proteins coprecipitate with Cav-1
To further investigate whether IGF-2 functionally interacts with Cav-1 and Cav-3 in skeletal
muscles, I examined the association of IGF-2 with Cav-1 and Cav-3 by immunoprecipitation
using anti-Cav-1 antibody (Figure 5.6). In the skeletal muscle tissues from both 4- and 9-week
old mice (wt, mdx and cav-3-/-), prepro-IGF-2 peptides (46-50 kDa) associate with Cav-1 and
Cav-3 (Figure 5.6 A and B). The prepro-IGF-2 (46-50kDa) was found in skeletal muscles of
both 4-week and 9-week old mice (Figure 5.6 A and B). The bands for prepro-IGF-2 (46-
50kDa) pulled down together with Cav-1 and/or Cav-3 are more intense in 4-week old mdx
and cav-3-/- mice compared to 4-week old wt mice (Figure 5.6 A and B). In addition, the band
intensity for prepro-IGF-2 (46-50kDa) pulled down together with Cav-1 and/or Cav-3 is more
intense in skeletal muscle tissues of 4-week old mice (wt, mdx and cav-3-/-) compared to 9-
week old mice (Figure 5.6 A and B). These data suggest that IGF-2 signalling may be
mediated by Cav-1 and Cav-3 in skeletal muscles, especially via Cav-1. However, 2-
dimentional native gel analysis is required to confirm whether IGF-2, Cav-1 and Cav-3 form
complexes.

221
Figure 5.7 pSrc and Src proteins associate with Caveolin-1 and Caveolin-3 in dystrophic skeletal muscles. 100 μg of muscle tissue extracts from wt, cav-3-/- and mdx mice were used for immunoprecipitation. Cav-1 protein complex in extract was pulled down with anti-caveolin-1 antibody (rabbit origin) and Protein A Sepharose CL-4B beads. There were muscle tissue extracts from 4 weeks (4w) (A) and 9 weeks (9w) (B) old mice (non-dystrophic, mdx, and cav-3-/-). 10 μg of each extract were loaded as input control and rabbit Igs were applied to the extracts as the negative control for IP. (C) The amount of pSrc co-immunoprecipitated with Cav-1 is more in both the 4w and 9w mdx muscles compared to the 9w and 4w wt muscles (D) The amount of Src co-immunoprecipitated with Cav-1 is more in both the 4w and 9w mdx muscles compared to the 4w and 9w wt muscles (E) Ratio of pSrc/Src decreases in 9w mdx skeletal muscle tissues. (ANOVA; *compared to wt; *p<0.05; **p<0.01; n = 4).
A B
C D
E

222
5.2.4. Src and phospho-Src (pSrc) proteins associate with Cav-1 and Cav-3
Src has been reported to associate with Cav-1 and this interaction inhibits
autophosphorylation of Src (Li et al., 1996a; Li et al., 1996b). In myotubes, Src can associate
with Cav-3 (Smythe et al., 2003); however, whether Cav-1 associates with Src in the
myotubes has not been reported. To establish whether Src or Phospho-Src (pSrc) associates
with Cav-1 and Cav-3 in 4w and 9w skeletal muscles (wt, mdx and cav-3-/-), Cav-1 IP
products were immunoblotted with pSrc and Src specific antibodies. The amount of Src and
pSrc in the complex was examined to identify the correlation of Src/pSrc proteins with the
levels of Cav-3. Both Src and pSrc proteins associate with Cav-1 and Cav-3 in skeletal muscle
tissues of both 4- and 9-week old mice (wt, mdx and cav3-/-) (Figure 5.7 A and B).
Although the amount of p-Src and Src proteins identified by Cav-1 pull-down is very low
compared to Cav-3 in the pull-down, I was able to establish that more pSrc and Src proteins
associated with Cav-1 and Cav-3 in both 4-week (1.6 fold for pSrc, p= 3.88×10⁻²; 1.8 fold for
Src, p= 1.33×10⁻³) and 9-week (1.3 fold for pSrc, p= 2.74×10⁻³; 1.3 fold for Src, p= 1.14×10⁻³)
old mdx skeletal muscles compared to wt skeletal muscles of the same ages (Figure 5.7 A, B,
C and D). In 4-week old cav-3-/- skeletal muscles, association of pSrc and Src with Cav-1 is
elevated by 1.1 (p= 3.88×10⁻²) and 1.3 (p= 3.18×10⁻²) fold respectively compared to wt
skeletal muscles (Figure 5.7 A, C and D). The ratio of pSrc/Src remains constant between wt
and dystrophic (cav-3-/- and mdx) skeletal muscles (Figure 5.7 E). These differences in pSrc

223
and Src that associate with Cav-1 and/or Cav-3 suggest that Src signalling is disturbed in the
dystrophic skeletal muscles. Lower levels of pSrc and Src associate with Cav-1 in skeletal
muscles of 9-week old cav-3-/- is consistent with previous report that muscle cells with TFT
mutation of Cav-3, which results in LGMD-1C, lose membrane localisation of Src (Smythe et
al., 2003).

224
Figure 5.8 pSrc and Src proteins associate with Caveolin-1eGFP in myotubes. C2C12-Cav-1eGFP and dfd13-Cav-1eGFP stable cells were cultured in DM for 14 day for myotube formation. Proteins were harvested and concentration was determined (Refer to section 2.8). 300 μg of extracts from myotubes were used for GFP-trap (Refer to section 2.9.3). Cav-1eGFP protein complex in extract was pulled down with GFP-Trap®A beads. (A) The pulled-down Cav-1eGFP complex was immunoblotted with pSrc, Src and β-dystroglycan specific antibodies. 20 μg of each extract was loaded as input control. (B) More Src proteins associate with Cav-1eGFP proteins in dfd13-Cav-1eGFP myotubes compared to C2C12-Cav-1eGFP myotubes. (C) More pSrc proteins associate with Cav-1eGFP proteins in dfd13-Cav-1eGFP myotubes compared to C2C12-Cav-1eGFP myotubes. This experiment was performed only once due to the lack of protein extracts.
C B
A

225
GFP-trap with whole cell extracts of the Cav-1eGFP overexpressing C2C12 myotubes
GFP-trap assay is used to pull down the GFP-tagged proteins together with the partners
associate with them (Metzger et al., 2012); thus is a useful tool to establish the interactions
between GFP-tagged proteins (Cav-1eGFP in this study) and the target proteins we are
interested in. To further test the specificity of the association of pSrc and Src with Cav-1, I
isolated stable transfectants with Cav-1eGFP, both non-dystrophic (C2C12-Cav-1eGFP) and
dystrophin-deficient (dfd13-Cav-1eGFP) (Refer to section 2.5.1 for transfection and 2.5.3 for
stable transfectant selection). The transfectants reaching more than 80% confluence were
cultured in low mitoegen medium to induce the formation of myotubes, and the whole cell
extracts were collected to perform GFP-trap (Refer to section 2.9.3 for method) (Figure 5.8).
This GFP-trap assay was performed only once due to the limited amounts of whole cell
extracts available. There is an increase association of pSrc and Src with Cav-1eGFP in dfd13-
Cav-1eGFP myotubes compared to C2C12-Cav-1eGFP myotubes (Figure 5.8 A); this is
consistent with the results from skeletal muscle tissues of 4- and 9-week old mice (Figure 5.7).
Although there is some non-specific binding of Src and pSrc proteins to the GFP-Trap® A
beads, there is more association of Src and pSrc proteins with Cav-1eGFP (Figure 5.8 A, B
and C). These data suggest that association of pSrc and Src to the Cav-1 is specific.

226
5.2.5. IGF-2 regulates Pax7, Caveolin-1 and Caveolin-3 in C2C12 myoblasts
In Figure 5.1, I demonstrated that IGF-2 protein is significantly elevated in E17.5 mdx
embryos. In chapter 4 (Figure 4.1), I showed that these embryos (E17.5 mdx) also have altered
protein expression of Pax7, Cav-1 and Cav-3 compared to wt controls. To establish whether
these proteins are functionally linked, I used shRNAi (short hairpin RNA interference) to
knock down IGF-2 [RNAi-igf-2 and RNAi-gfp (target gfp; control)] and MIG to overexpress
IGF-2 in C2C12 myoblasts [C2MIG and C2MG (control)] (Merrick et al., 2007) to examine
the effect of IGF-2 on the protein levels of Pax7, Cav-1 and Cav-3. MIG is an IGF-2
expression vehicle driven by mCK (muscle creatine kinase) promoter which is expressed
during myoblast differentiation and MG is the control vehicle.
We have previous reported that C2MIG myoblasts have higher levels of IGF2 RNA compared
to the C2MG control and that IGF-2-RNAi effectively knocks down the IGF-2 RNA (Merrick
et al., 2007). Here I established that C2MIG myoblasts have 2.5 fold more active IGF-2
compared to C2MG myoblasts (Figure 5.9 A and B; p= 2.22×10⁻²; gfp-shRNAi controls).
IGF-2-RNAi reduces the levels of active IGF-2 by 38% in C2MIG myoblasts compared to the
control myoblasts (Figure 5.9 A and B; p= 7.16×10⁻²).

227
Figure 5.9 Down-regulation of IGF-2 affects the Cav-1, Cav-3 and Pax7 protein levels in myoblasts. IGF-2 in control (C2MG) and IGF-2-overexpressing (C2MIG) myoblasts were knocked down with igf2-shRNAi (or gfp-shRNAi as control). The myoblasts were cultured in GM (DMEM + 10% FCS). (A) Protein extracts were harvested and immunoblotted with antibodies recognizing IGF-2, Pax7, myogenin, Cav-1 and Cav-3. β-actin is used as a loading control. (B) Densitometry of prepro-IGF-2 (64 kDa) and mature IGF-2 (17.5 kDa). (C) The levels of myogenin increases in C2MG and C2MIG myoblasts when IGF-2 was knocked down. (D) Down-regulating of IGF-2 induces expression of Pax7 proteins. (E) IGF-2 over-expression reduces expression of Cav-1 proteins. (F) Elevated IGF-2 protein levels lead to increase of Cav-3 proteins. (G) There is a negative correlation between the levels of Cav-1 and active IGF-2. (ANOVA; *<0.05; **<0.01 compared to gfpRNAi controls; n=3). Each column represents an average of three repeats from different samples. MIG: IGF-2 expression vehicle driven by muscle creatine kinase promoter; MG: control expression vehicle without IGF-2 gene; RNAi-igf2: short hairpin RNA expression vehicle targeting IGF2; RNAi-gfp: control short hairpin RNA expression vehicle targeting GFP
A

228
D
C
E
F
B
G
229
The level of myogenin increases in C2MIG myoblasts compared to C2MG myoblasts (Figure
5.9 A and C); this is consistent with previous report that C2MIG myoblasts differentiate
spontaneously at high cell density (Merrick et al., 2007). These data suggest that
differentiation of C2C12 myoblasts is influenced by the levels of IGF-2 within the myoblasts.
Knocking down IGF-2 in C2MG myoblasts leads to an increase of Pax7 protein level by 2.7
fold compared to control myoblasts (Figure 5.9 A and D; p= 2.44×10⁻³). Similarly, the levels
of Pax7 in C2MIG myoblasts increase by 2.2 fold when IGF-2 was knocked down compared
to the control myoblasts (5.8 A and D; p= 6.35×10⁻³). Together these data show that Pax7
protein levels are negatively regulated by IGF-2 in myoblasts and this relates to differentiation
status (Figure 3.10).
Overexpressing IGF-2 in myoblasts (C2MIG) leads to the decrease of Cav-1 compared to
control myoblasts (C2MG); the levels of Cav-1 decrease by 57% (p= 1.96×10⁻²) in C2MIG
control myoblasts and by 45% (p= 2.09×10⁻³) in C2MIG myoblasts with IGF-2 knock-down
(Figure 5.9 A and E). The ratio of Cav-1/active IGF-2 shows that there is a negative
correlation between level of IGF-2 and the level of Cav-1 in myoblasts (Figure 5.9 G) which
correlates with differentiation status. The effect of IGF-2 on Cav-3 is opposite to that on Cav-
1 such that, over-expression of IGF-2 in myoblasts results in an up-regulation of Cav-3
(Figure 5.9 A and F). Cav-3 increases by 1.74 fold (p= 4.4×10⁻³) in the C2MIG (gfp-shRNAi
control) myoblasts (compared to the C2MG gfp-shRNAi control) whereas Cav-1 is down-

230
regulated (Figure 5.9 A, E and F); thus causing a shift in Cav-1/Cav-3 ratio which correlates
with differentiation status (Figure 3.15). These data suggest that IGF-2 positively regulates the
levels of Cav-3. The ratio of Cav-3/active IGF-2 increases by 1.5 fold (p= 1.06×10⁻²) in
C2MIG myoblasts with IGF2 knock-down compared to control myoblasts (Figure 5.9 G).
Overall, these data suggest that IGF-2 has reverse effects on the levels of Cav-1 and Cav-3
and that the ratio of Cav-1/3 may be important for the progression of myoblast differentiation.

231
Figure 5.10 Pax7-mCherry construct expression in C2C12 and dfd13 myoblasts. C2C12 and dfd13 myoblasts were transfected with Pax7-mCherry expression plasmid and stable transfectants were selected with 800 μg/ml of G418. pmCherry transfection was applied as the transfection control. mCherry proteins are cytosolic in both (A) non-dystrophic (C2C12-mCherry) and (C) dystrophic (dystrophin-deficient; dfd13-mCherry) myoblast transfectants. Pax7-mCherry fusion proteins are nuclear in both (B) non-dystrophic (C2C12-Pax7mCherry) and (D) dystrophic (dfd13-Pax7mCherry) transfectants.

232
5.2.6. Altered Pax7 Levels affect levels of Cav-1 and Cav-3 in myoblasts
In chapter 3 and 4, I demonstrated attenuated protein levels of Pax7 and elevated levels of
Cav-1 and Cav-3 proteins in both PD50A myoblasts and E17.5 mdx embryos (Figure 3.10,
3.15 and 4.1). To directly study the effect of Pax7 on Cav-1 and Cav-3 protein expression, I
introduced a Pax7-mCherry expression construct (CMV promoter-drived) into myoblasts and
knocked down endogenous Pax7 with short hairpin RNA interference (Pax7sh) (Refer to
section 2.4 for Pax7-mCherry construct generation). Since PD50A myoblasts are resistant to
G418 selection, the parental line of PD50A, dfd13, was used for these experiments to enable
G418 selection of Pax-7mCherry-transfected mdx derived myoblasts. C2C12 and dfd13
myoblasts were transfected with Pax7-mCherry or the control plasmid pmCherry and selected
with G418 in order to obtain stable transfectants for Pax7-mCherry (Figure 5.10). Pax7-
mcherry proteins localise to the nuclei of both C2C12 and dfd13 myoblasts, consistent with
the known localisation of Pax7 which is a transcription factor (Figure 5.10 B and D). Pax7-
mCherry fusion protein appears in the transfectants (both C2C12 and dfd13) 24 hours after
transfection; however, expression of the fusion protein decreases thereafter such that few
Pax7-mCherry positive cells were found for selection. Medium with 20% FCS was used to
expand these Pax7-mCherry transfectants to usable quantities.
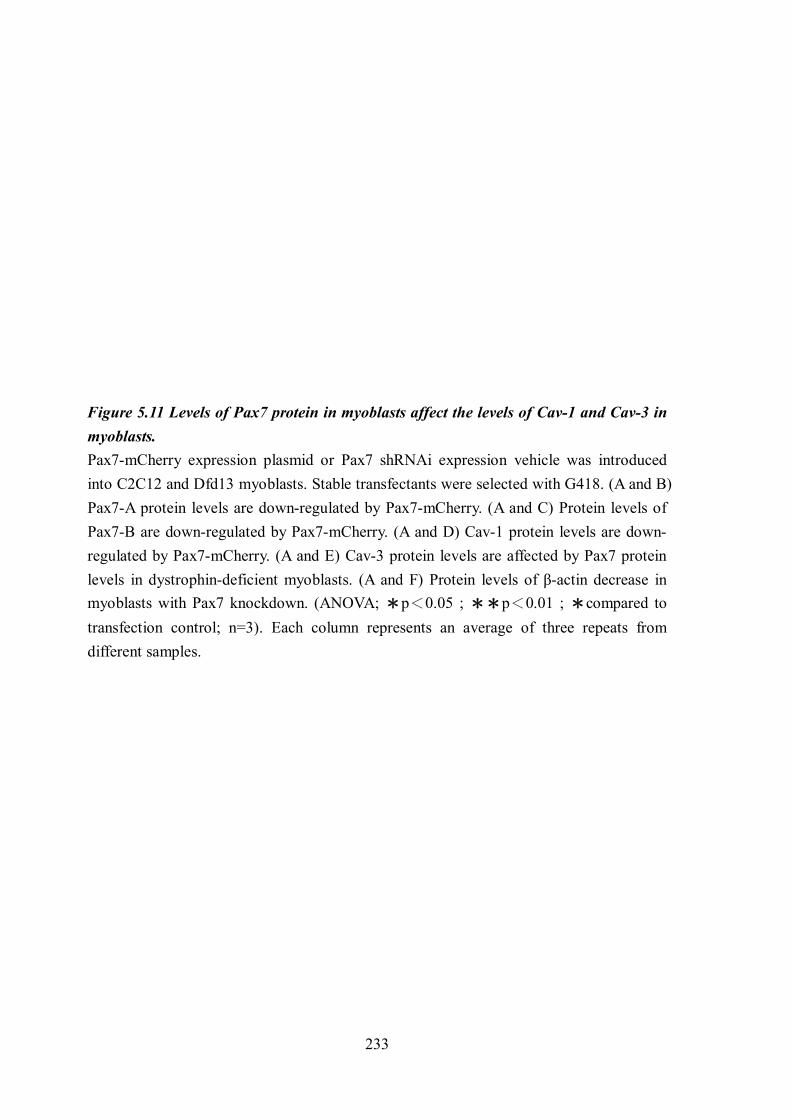
233
Figure 5.11 Levels of Pax7 protein in myoblasts affect the levels of Cav-1 and Cav-3 in myoblasts. Pax7-mCherry expression plasmid or Pax7 shRNAi expression vehicle was introduced into C2C12 and Dfd13 myoblasts. Stable transfectants were selected with G418. (A and B) Pax7-A protein levels are down-regulated by Pax7-mCherry. (A and C) Protein levels of Pax7-B are down-regulated by Pax7-mCherry. (A and D) Cav-1 protein levels are down-regulated by Pax7-mCherry. (A and E) Cav-3 protein levels are affected by Pax7 protein levels in dystrophin-deficient myoblasts. (A and F) Protein levels of β-actin decrease in myoblasts with Pax7 knockdown. (ANOVA; *p<0.05 ; **p<0.01 ; *compared to transfection control; n=3). Each column represents an average of three repeats from different samples.

234
B
C D
E
A
F

235
Two isoforms of Pax7 have been identified in the human rhabdomyosarcoma cell line Rh1;
Pax7-A (molecular weight 57 kDa) and a shorter isoform Pax7-B (molecular weight 54 kDa)
are derived from alternative splicing events (Vorobyov and Horst, 2004). Both Pax7-A and
Pax7-B express in undifferentiated and differentiated C2C12 myoblasts; the level of both
isoforms decrease in differentiated C2C12 (Charytonowicz et al., 2011). I examined both
Pax7-A and Pax7-B isoforms (Figure 5.11 A). The Predicted molecular weight of Pax7-
mCherry fusion protein is about 83 kDa. However, there is nonspecific band with similar size
such that I was unable to identify Pax7-mCherry fusion protein with immunoblotting (Figure
5.11 A). Over-expression of Pax7-mCherry (isoform A) down-regulates Pax7-A protein levels
by 63% (p= 9.08×10⁻⁵) in C2C12 myoblasts compared to control myoblasts (Figure 5.11 A
and B). Protein levels of Pax7-A decrease by 47% (p= 3.06×10⁻²) in dfd13 wich overexpresses
Pax7-mCherry compared to control myoblasts (Figure 5.11 A and B). Protein levels of Pax7-B
decrease by 65% in C2C12 (p= 4.7×10⁻⁴) and dfd13 (p= 2.15×10⁻³) myoblasts with Pax7-
mCherry overexpression compared to their respective controls (Figure 5.11 A and C). Protein
levels of beta-actin are down-regulated in C2C12 myoblasts with Pax7 knock-down and in
dfd13 myoblasts with Pax7-mCherry overexpression, with the severest reduction observed in
C2C12 myoblasts with Pax7 knock-down (Figure 5.11 A and F).
In C2C12 myoblasts, Pax7-mCherry overexpression leads to a decrease in the protein level of
Cav-1 by 85% compared to control (Figure 5.11 A and D; p= 2.73×10⁻⁶). Cav-1 protein levels

236
also decrease in C2C12 myoblasts with Pax7 knock-down by 57% compared to control
(Figure 5.11 A and D; p= 5.53×10⁻⁴). dfd13 myoblasts with Pax7-mCherry over-expression
have the levels of Cav-1 reduced by 32% (Figure 5.11 A and D; p= 4.31×10⁻³). It is worth
noting that both up- and down-regulation of Pax7 in dfd13 myoblasts lead to reduction of
Cav-1β isoform protein levels in dystrophin-deficient myoblasts (Figure 5.11 A; lower band in
the panel of Cav-1 western blotting). This reduction of Cav-1 protein level in C2C12
myoblasts with Pax7-mCherry overexpression is consistent with previous report that Pax7
over-expression inhibits Cav-1 gene expression in C2C12 myoblasts (Soleimani et al., 2012).
Over-expressing Pax7-mCherry or knocking down Pax7 in C2C12 myoblasts has no effect on
the levels of Cav-3 protein compared to their respective controls (Figure 5.11 A and E).
Conversely, Cav-3 protein levels in dfd13 myoblasts with Pax7-mCherry overexpression are
only 22% of those in control myoblasts (Figure 5.11 A and E; p= 1.67×10⁻⁵). Knocking down
Pax7 in dfd13 myoblasts increases Cav-3 protein levels by 2.3 fold compared to control
myoblasts (Figure 5.11 A and E; p= 4.11×10⁻³). Data above suggest that Pax7 negatively
regulates Cav-1 expression in C2C12 myoblasts while negatively regulates Cav-3 expression
in dfd13 myoblasts. This down-regulation of Cav-3 by Pax7 in dfd13 myoblasts is likely to be
an indirect regulation and this may be related to dystrophin-deficiency in dfd13 myoblasts,
suggesting a role of dystrophin in signal transduction.

237
5.2.7. Caveolin-1 and Caveolin-3 regulate Pax7 protein levels in myoblasts
To further study whether up- or down-regulation of Cav-1 and Cav-3 affects Pax7 protein
levels, dystrophin-deficient (dfd13) and non-dystrophic (C2C12) myoblasts were introduced
with the following expression vehicles; eGFP, Cav-1eGFP, Cav-3eGFP, dsgfpshRNAi, Cav-
1shRNAi and Cav-3shRNAi. Stable transfectants were selected with G418 for further
experiments. Levels of Cav-1 and Cav-3 proteins are down-regulated respectively in Cav-
1shRNAi and Cav-3shRNAi transfected cells showing that RNAi knocks down Cav-1 and
Cav-3 in myoblasts (Figure 5.12 A). Protein levels of Pax7 decrease by 46% in C2C12-
Cav1eGFP transfectants (p= 1.09×10-2) and by 55% in C2C12-Cav3eGFP transfectants (p=
1.34×10⁻²) compared to C2C12-eGFP transfectants (Figure 5.12 B and D). Tthe levels of Pax7
protein increase by 18% (p= 3.58×10⁻³) in dfd13-Cav1eGFP transfectants and by 1.3 fold in
dfd13-Cav3eGFP transfectants (though not significant; p= 0.1) compared to dfd13eGFP
control (Figure 5.12 B and D). Knocking down Cav-1 or Cav-3 in C2C12 myoblasts (C2C12-
Cav1KD and C2C12-Cav3KD respectively) has no effect on the levels of Pax7 compared to
C2C12-dsgfpsh control (Figure 5.12 C and E). In contrast, knocking down Cav-1 or Cav-3 in
dfd13 myoblasts leads to an increase of the levels of Pax7 protein compared to dfd13-dsgfpsh
control; 39% in dfd13-Cav1KD myoblasts (p= 5.2×10⁻⁴) and 46% in dfd13-Cav3KD
myoblasts (p= 6.61×10⁻³) (Figure 5.12 C and E).

238
Figure 5.12 Levels of Cav-1 and Cav-3 in myoblasts affect the levels of Pax7 proteins in myoblasts. C2C12 and Dfd13 myoblasts were transfected with the following expression vehicles; eGFP, Cav-1eGFP, Cav-3eGFP, Cav-1shRNAi or Cav-3shRNAi. Stable transfectants were selected with G418 for these experiments. Whole cell extracts were harvested and immunoblotted with Pax7, Cav-1 and Cav-3 specific antibodies. Coomassie blue stain of the nitrocellulose membrane is used as loading control. (A) Cav-1 and Cav-3 proteins in myoblasts are labelled with Alexa Fluor 488. (B and D) Overexpressing Cav-1 or Cav-3 reduces Pax7 in C2C12 myoblasts; however overexpression of Cav-3 increases level of Pax7 in dfd13 myoblasts. (C and E) Down-regulation of Cav-1 or Cav-3 has no effect on levels of Pax7 protein in C2C12 and dfd13 myoblasts. (B and F) Overexpressing Cav-3 down-regulates Cav-1 protein levels in C2C12 myoblasts but up-regulates Cav-1 protein levels in dfd13 myoblasts. (C and G) Down-regulating Cav-3 has no effect on the protein level of Cav-1 in C2C12 and dfd13 myobasts. (B and H) Overexpressing Cav-1 has no effect on protein levels of Cav-1 in C2C12 and dfd13 myoblasts. (C and I) Down-regulating Cav-1 has no effect on protein levels of Cav-1 in C2C12 and dfd13 myoblasts. (ANOVA; *p<0.05 ; **p<0.01 ; *compared to transfection control; n=3). Each column represents an average of three repeats from different samples.
A
B C

239
D E
G F
H I

240
The levels of Cav-1 protein decrease by 44% in C2C12 myoblasts with Cav-3 overexpression
(C2C12-Cav3eGFP; p= 3.77×10-2) and by 40% in C2C12 myoblasts with Cav-3 knock-down
(C2C12-Cav3KD; p= 4.89×10⁻³) compared to control myoblasts (Figure 5.12 B, C, F and G).
Overexpression of Cav-3 leads to an increase by 50% (p=0.09) in dfd13 myoblasts while
down-regulation of Cav-3 has no effect on the level of Cav-1 protein in dfd13 myoblasts
compared to control myoblasts (Figure 5.12 B, C, F and G). The levels of Cav-3 in C2C12 or
dfd13 myolasts which overexpress Cav-1 are comparable to their respective controls (Figure
5.12 B, C, H and I). However, knocking down Cav-1 causes decreases in the levels of Cav-3
protein by 24% in C2C12 myoblasts (p= 3.15×10-3) and by 34% in dfd13 myoblasts (p=
4.39×10⁻²) comparable to those in their respective controls (Figure 5.12 B, C, H and I). These
data suggest that in dfd13 myoblasts, which have elevated levels of Cav-1 and Cav-3 proteins
(Figrue 3.15), Pax7 protein levels are up-regulated by Cav-3 as well as Cav-1. However, in
C2C12 myoblasts, Cav-3 proteins negatively regulate the levels of Pax7 protein.
5.3. Discussion:
5.3.1. IGF-2 signalling pathways are perturbed in dystrophic mouse embryos
I demonstrate up-regulated mTOR-IGF2 signalling in E17.5 mdx (Figure 5.1), suggesting a
feedback loop between IGF-2 and mTOR in mdx embryos. This is consistent with the up-
regulation of IGF-2 reported in mdx (eight weeks old) and DMD (six to nine years old) from

241
DNA micro-array analysis (Chen et al., 2000b; Porter et al., 2002) and our unpublished data
(unpublished data of Dr. Deborah Merric and Dr. Janet Smith). It has been reported that
transgenic mice, which over-express IGF-2, down-regulates p57kip2 (Grandjean et al., 2000). I
established that the E17.5 mdx and mdx/cav-3+/- (DMhet) mouse embryos which show
elevated levels of IGF-2 have down-regulated levels of cyclin-dependent kinase inhibitor
p57kip2 (Figure 5.1). In E17.5 cav-3-/- embryos where IGF-2 is down-regulated, the levels of
p57kip2 protein also decrease, suggesting that regulation of p57kip2 protein levels is perturbed
in E17.5 cav-3-/- embryos (Figure 5.1). Decreased level of p57kip2 may contribute to the high
growth rate of myoblasts isolated from E17.5 cav-3-/- and mdx mouse embryos (Merrick et al.,
2009). Although the proliferation rate of myoblasts from DMhet has not been reported, these
data predict to be similar to or greater than the elevated rates of those myoblasts from mdx and
cav-3-/- mice due to the low levels of p57kip2 protein.
It has been reported that activated AKT/mTOR signalling pathway can cause skeletal muscle
hypertrophy (Bodine et al., 2001). Erk6 signalling is reported to be down-regulated in DMD
patients of 6-9 years of age (Chen et al., 2000b). It has also been reported that 6-week old mdx
mice diaphragm muscles have higher mTOR activity compared to the non-dystrophic mice
(Eghtesad et al., 2011). I established elevated activity of AKT/mTOR signalling in E17.5 mdx
and DMhet mouse embryos in the present study (Figure 5.1). I also established down-
regulated Erk1/2 signalling in E17.5 mdx (Figures 5.1). The perturbed Erk1/2 and

242
mTOR/IGF-2/p57kip2 signalling pathways in E17.5 mdx, cav-3-/- and DMhet mice may help to
explain the elevated proliferation of primary muscle stem cells from dystrophic (mdx, DMhet
and cav-3-/-) mouse embryos (Merrick et al., 2009). It also further supports, in the molecular
level, the early (embryonic) onset of muscular dystrophy reported by our group earlier
(Merrick et al., 2009).
5.3.2. Cav-1 protein associates with Cav-3 protein in skeletal muscles of adult mice
Cav-1 can form homodimers and heterodimers with Cav-2 (Sargiacomo et al., 1995; Scherer
et al., 1997). An interaction between Cav-1 and Cav-3 has also been reported in cardiac
myocytes (Capozza et al., 2005a; Volonte et al., 2008), but interaction between Cav-1 and
Cav-3 has not previously been determined directly in skeletal muscle tissue. In the present
study, I established colocalisation of endogenous Cav-1 proteins with Cav-3 proteins in
myoblasts and myotubes (both dystrophin-deficient and non-dystrophic) using
immunofluorescent double labelling of Cav-1 and Cav-3 proteins (Figure 5.3). I also observed
association of Cav-1 and Cav-3 proteins from wt and mdx adult (4-week and 9-week) mouse
skeletal muscle tissues using co-immunoprecipitation (Figure 5.2). Stronger bands of Cav-1
and Cav-3 in the complex were observed in skeletal muscle tissues of 9-week than 4-week
mdx (Figure 5.2), which have cycles of degeneration and regeneration between 4 weeks and 9
weeks old (Tanabe et al., 1986). The observation that strong correlation is found in the 9-week

243
mdx skeletal muscles suggests that the Cav-1/Cav-3 ratio may contribute to the pathology of
mdx.
5.3.3. Association of IGF-2, Src and pSrc proteins with Cav-1/Cav-3 protein complex may
contribute to the pathology of mdx
In the present study, I found that phospho-Src (pSrc) proteins associate with the Cav-1 and
Cav-3 proteins (Figure 5.7 and 5.8). Association of pSrc with the caveolin complex is stronger
in the skeletal muscles of 4-week mdx relative to the 9-week mdx (Figure 5.7), suggesting a
difference in the signalling pathways between the early and late progress of mdx pathology or
a decrease in the Src/Cav-1/Cav-3 mediated signalling in the late progress of mdx pathology.
The presence of pSrc in the cav3-/- adult skeletal muscle tissues suggests that the interaction
between pSrc and the Cav-1/Cav-3 complex is through the interaction with Cav-1 (Figure 5.7).
Binding of Src to Cav-1 and Cav-2 and the subsequent phosphorylation of tyrosine 14 of Cav-
1 and tyrosine 19 of Cav-2 has been reported (Lee et al., 2002; Lee et al., 2000; Li et al.,
1996b). Recruitment of Src to caveolae can positively regulate the signal transduction of
insulin receptor and Na+/K+ ATPase (Liu et al., 2003; Yamamoto et al., 1998). Nevertheless,
phospho-Cav-1 recruits the C-terminal Src kinase (Csk) which phosphorylates Src at Tyr527
and inactivates Src associated with Cav-1, forming a negative feedback loop (Cao et al., 2002;
Li et al., 1996a; Radel and Rizzo, 2005). Cav-3 proteins or peptide representative of the

244
scaffolding domain of Cav-3 can inhibit the activity of Src (Li et al., 1996a; Smythe et al.,
2003). In the present study I found more pSrc and Src proteins associate with the caveolin
complex in mdx skeletal muscles which have elevated levels of Cav-1 and Cav-3; whereas
association of pSrc and Src with the caveolin complex in skeletal muscles of cav3-/- mice is
comparable to wt skeletal muscles (Figure 5.7). These data explain opposite roles of Cav-1
and Cav-3 in regulating Src activity in skeletal muscle; Cav-3 recruitment of pSrc may help
concentrate the signalling molecules to activate and/or maintain the signalling while Cav-1 in
caveolae then inactivates the activity of pSrc, maintaining homeostasis of Src signal
transduction (Figure 5.13). This suggests that Cav-1 and Cav-3 may act antagonistically in
skeletal muscles.
Figure 5.13 A negative feedback loop exists between Src and Cav-1 to regulate signal transduction. (Adapted from Cui et al., 2005; Boney et al., 2001; Lieskovska et al., 2006; Lu et al., 2002; Lee et al., 2002; Radel and Rizzo, 2005)
It has been reported that Src responds to IGF-1 which mediates proliferation of vascular

245
smooth muscle cells (SMC) and 3T3-L1 preadipocytes via the MAPK signalling pathway
(Boney et al., 2001; Lieskovska et al., 2006). Src has also been reported to mediate the effect
of IGF-1 on survival of oligodendrocytes through the PI3K/AKT signalling pathways (Cui et
al., 2005). Down-regulation of Cav-1 in rat cardiomyoblasts and HUVECs (human umbilical
vein endothelial cells) inhibits the AKT signalling pathway downstream of the IGF-1 receptor
(IGF1R), suggesting a link between Cav-1, IGF-1 and Src (Salani et al., 2008). In myoblasts,
differentiation signals from IGF-1 and IGF-2 have been shown to be mediated through IGF-
1R and downstream AKT signalling (Galvin et al., 2003). In addition, overexpression or
underexpression of protein tyrosine phosphatase-α (PTPα), which dephosphorylates c-Src at
tyrosine 527 and regulates c-Src activity, affects myoblast differentiation (Lu et al., 2002).
Therefore, disturbed AKT/mTOR/IGF-2 and ERK1/2 signalling cascades in E17.5 mdx as
well as cav-3-/- mouse embryos observed in the present study (Figure 5.1) may correlate with
the perturbed association of the component within Cav-1/Cav-3 protein complex, including
pSrc/Src proteins. In response to Cav-3 deficiency, protein extracts from hearts of cav3-/-
mouse showed hyperactivation of the ERK1/2 cascade (Woodman et al., 2002). However, in
the present study, I did not observe hyperactivated ERK1/2 cascade in the protein extracts
from E17.5 cav3-/- embryos (Figure 5.1). This discrepancy may be attributed to the stages of
the animals; they used 2-month and 4-month old mice while I used E17.5 mouse embryos
(Woodman et al., 2002). In addition, they examined the heart only while I used decapitated

246
embryos containing both cardiac and skeletal musculature in addition to other tissues
(Woodman et al., 2002).
5.3.4. Pax7 expression in mdx is affected by Cav-1 and Cav-3
The observation that modulation of Pax7 expression in myoblasts exerted influence on the
protein levels of caveolins is intriguing (Figure 5.11). It has been reported that over-
expression of Pax7 represses the gene expression of Cav-1 but not Cav-3 in C2C12 myoblasts
by direct binding to the promoter region of Cav-1 gene; binding of Pax7 to the promoter
region of Cav-3 was not observed (Soleimani et al., 2012). My data provide further evidence
that Cav-1 protein levels are down-regulated by Pax7 in C2C12 myoblasts (Figure 5.11).
PD50A (dystrophin-deficient) myoblasts, however, have elevated levels of both Cav-1 and
Cav-3 as well as Cav-3/Cav-1 ratio compared to wt myoblasts (Figure 3.14 and 3.15). The
reduced level of Pax7 proteins in dystrophin-deficient mdx embryos may be attributed to the
elevated levels of Cav-1 and Cav-3 in them (Figure 4.1). In dfd13 (dystrophin-deficient)
myoblasts, overexpression of Cav-3 up-regulates the levels of Pax7 protein (Figure 5.12).
However, overexpression of both Cav-1 and Cav-3 in C2C12 myoblasts down-regulates Pax7
protein levels in theses cells, suggesting that the ratio of Cav-1/Cav-3 in myoblasts is crucial
for regulation of Pax7 protein levels. In dystrophin-deficient myoblasts, Pax7 negatively
regulates the level of Cav-3 protein (Figure 5.11). Furthermore, both knockdown and

247
overexpression of Cav-3 leads to up-regulation of Pax7 protein levels in dystrophin-deficient
myoblasts (Figure 5.12), suggesting that molecular mechanisms that modulate the
homeostasis of Pax7/Cav-1/Cav-3 are disturbed in dystrophin-deficient myoblasts. These data
also suggest that a new homeostasis of Pax7/Cav-1/Cav-3 levels is achieved in the
dystrophin-deficient myoblasts where there are decreased level of Pax7 and elevated levels of
Cav-1/Cav-3 compared to nondystrophic myoblasts.
I demonstrate in this chapter that protein levels of Pax7 in myoblasts are negatively regulated
by the level of IGF-2 in that down-regulating IGF-2 leads to the up-regulation of Pax7 in
myoblasts (Figure 5.9). In addition, I also found elevated protein levels of IGF-2 in E17.5
mdx embryos (Figure 5.1). These data suggest that up-regulation of IGF-2 protein levels
correlates with the perturbed expression of Pax7/Cav-1/Cav-3 noted in E17.5 mdx (Figure
4.1). As IGF-2 associate with Cav-1 and Cav-3 in dystrophin-deficient myoblasts and skeletal
muscles (Figure 5.4, 5.5 and 5.6), it is possible that the effect of IGF-2 on level of Pax7 is
mediated through Cav-1 and Cav-3. Reduced protein levels of Pax7 in mdx, cav-3-/- and
DMhet (mdx/cav-3+/-) (Figure 4.1) together with attrition of pax-7(+) myoblasts in these
embryos (Merrick et al., 2009) suggests the number of Pax7-positive cells responsible for
muscle regeneration is impaired in these mutants.

248
Chapter 6. Functional analysis of Caveolin-1 and Caveolin-3 in relation to dystrophin
deficiency
6.1. Introduction:
In chapter 3 and 4, I established elevated levels of Cav-1 and Cav-3 in dystrophin-deficient
mdx embryos and PD50A myoblasts (Figure 3.14, 3.15 and 4.1). Triads are membrane
structures of muscle fibres which consist of T-tubule accompanied by terminal cisternae of the
sarcoplasmic reticulum (SR) and are marked by the presence of dihydropyridine receptor
(DHPR) and ryanodine receptors (RyRs) (Franzini-Armstrong et al., 1987) (Figure 6.1).
Figure 6.1 Organisation of triads in skeletal muscles Triads of the muscles consist of transverse tubules (T-tubule) each accompanied by two terminal cisternae of sarcoplamic reticulum (SR) on either side. Interaction between dihydropyridine receptors (DHPRs) on T-tubule membrane and ryanodine receptors (RyRs) on SR membrane creates channels for calcium (Ca2+). Cav-3 proteins associate with RyRs on the SR membrane and are involved in the development of T-tubules (Galbiati et al., 2001a). Calsequestrin (CSQ) linked to RyR can help maintain Ca2+ in SR lumen (Lanner et al., 2010).
Calsequestrin localises on the lumen face of sarcoplasmic reticulum (SR) membrane adjacent

249
to T-tubule (Figure 6.1). Cav-3 has been reported to participate in the development of T-
tubules in skeletal muscles and down-regulating Cav-3 impairs T-tubule formation (Figure 6.1)
(Galbiati et al., 2001a; Parton et al., 1997). I examined the localisation of Cav-1 and Cav-3 in
embryonic skeletal muscle fibres using immunohistochemistry and in myotubes using
immunofluorescent double labelling to establish the relationship between Cav-1/Cav-3 and t-
tubules in dystrophin deficiency.
Cav-3 can interact with β-dystroglycan (a component of the dystrophin-glycoprotein complex;
DGC) which plays a role in mediating mechanical response and signalling transduction of
muscles (Ervasti and Campbell, 1993; Glass, 2005; Sotgia et al., 2000). Redistribution of
caveolins in response to mechanical stress (i.e. stretching and osmosis pressure) has been
reported; Cav-3 is reported to enhance stretch-induced phosphorylation of Src in myoblasts
(Gervasio et al., 2011; Sinha et al., 2011). To understand whether different levels of caveolins
(Cav-1 and Cav-3) in dystrophin-deficient myotubes/myoblasts have effect on the mechanical
properties, functional analysis of wt and dystrophin-deficient myotubes/myoblasts was
performed with atomic force microscope.

250
Figure 6.2 Caveolin-3 proteins localise to the sarcolemma of embryonic skeletal muscles as punctate dots corresponding to the triads of muscles. (A) E15.5 and (B) E17.5 wild type, mdx, cav-3-/- and DMhet embryos were fixed and embedded in paraffin wax. Embryo wax sections were cut in 5 μm. I examined Cav-3 protein localisation in the skeletal muscle fibers of epaxial (back) skeletal muscles using immunohistochemistry. (C) The red rectangle in the E17 embryo section represents the region examined (taken from e-Mouse Atlas Project website). The localisation of Cav-3 protein in skeletal muscles of E15.5 [A (a) and inset] and E17.5 [B (a) and inset] wt embryos is in subsarcolemma region as punctate corresponding to triads. Cav-3 widely spreads along the sarcolemma of skeletal muscles in E15.5 A [(b) and inset] and E17.5 [B (b) and inset] mdx embryos. E15.5 [A (c)] and E17.5 [B (c)] cav-3-/- embryos have no staining for Cav-3. The Localisation of Cav-3 is in the subsarcolemma region of E15.5 DMhet skeletal muscles as punctate corresponding to the triads [A (d) and inset]; Cav-3 is widespread in the sarcolemma of E17.5 DMhet skeletal muscles [B (d) and inset]. Images are representative immunohistochemistry labelling of Cav-3 proteins from two individual embryos. cav-3-/-: mouse with caveolin-3 knocked out; DMhet: mdx mouse with heterozygous caveolin-3 knockout.
A) E15.5 B) E17.5

251
6.2. Results:
6.2.1. Localisation of Cav-1 and Cav-3 in the sarcolemma regions of embryonic
skeletal muscles are perturbed in dystrophin deficiency
In chapter 5, I have established that Cav-1 and Cav-3 colocalise in dystrophin-deficient
myoblasts and myotubes and that the localisation of Cav-1 and Cav-3 to the plasma
membrane is heterogeneous (Figure 5.3). To functionally analyse the role of Cav-1 and Cav-3
in the skeletal muscles, I examined the localisation of Cav-1 and Cav-3 proteins in the epaxial
(back) skeletal muscle fibres of E15.5 and E17.5 wt, mdx, cav-3-/- and DMhet embryos using
immunohistochemistry (Figure 6.2 and 6.3).
The localisation of Cav-3 to sarcolemma is heterogeneous in the skeletal muscle fibres of
E15.5 and E17.5 wt, mdx, cav-3-/- and DMhet embryos (Figure 6.2). In wt skeletal muscles
from both E15.5 and E17.5 embryos, Cav-3 is localised to the subsarcolemma region and
represented as punctate dots with regular distance which is similar to the triads of the
sarcolemma (Figure 6.2 A (a) and B (a)). In E15.5 mdx and DMhet skeletal muscles, Cav-3 is
also localised to the sarcolemma as punctate dots corresponding to the triads and the staining
intensity is stronger compared to wt (Figure 6.2 A (b) and (d)).
At E17.5, Cav-3 becomes widespread in the subsarcolemma of mdx and DMhet skeletal
muscles (Figure 6.2 B (b) and (d)). As expected, no staining for Cav-3 is detected in the E15.5

252
and E17.5 cav3-/- skeletal muscles, demonstrating the specificity of anti-caveolin-3 antibody
used here (Figure 6.2 A (c) and B (c)). These data suggest that Cav-3 is localised to the triads
of skeletal muscles of E15.5 (wt, mdx and DMhet) and E17.5 wt mouse embryos. These data
also demonstrate that the localisation of Cav-3 is perturbed in the skeletal muscles of E17.5
mdx and DMhet mouse embryos.
Localisation of Cav-1 in the subsarcolemma is perturbed in mdx, DMhet and cav-3-/-
embryonic skeletal muscles
Similarly to Cav-3, the localisation of Cav-1 in embryonic skeletal muscles is also
heterogeneous such that some of the fibres in the skeletal muscle are positive for Cav-1 while
others in the same skeletal muscle are not labelled for Cav-1 (Figure 6.3). Cav-1 is localised
evenly to the sarcolemma of E15.5 wt skeletal muscles (Figure 6.3 A (a)). At E17.5 wt and
mdx embryos, Cav-1 is localised to the sarcolemma of skeletal muscles and the plasma
membrane of myoblasts as punctate staining (Figure 6.3 B (a) and (b)); this is consistent with
the localisation of Cav-1 to the plasma membrane of cultured myoblasts (Figure 5.3) and
additionally demonstrates that Cav-1 is also present in the sarcolemma of differentiated
embryonic myotubes which has not previously been demonstrated. The staining for Cav-1 is
weak in E15.5 mdx skeletal muscles compared to the nondystrophic control (Figure 6.3 A (b)).

253
Figure 6.3 Caveolin-1 localises to the sarcolemma in the skeletal muscles of E15.5 and E17.5 mdx, DMhet and cav-3-/- mouse embryos. (A) E15.5 and (B) E17.5 wild type, mdx, cav-3-/- and DMhet embryos were fixed and embedded in paraffin wax. Embryos were sectioned in 5 μm. I examined the localisation of Cav-1 proteins in the skeletal muscle fibers of epaxial (back) muscles using immunohistochemistry. (C) The red rectangle in the E17 embryo section represents the region examined (taken from e-Mouse Atlas Project website). [A (a) and inset] Cav-1 is localised to the sarcolemma of some of the E15.5 wt embryonic skeletal muscles; [B (a) and inset] Cav-1 localises to the sarcolemma of E17.5 wt embryonic skeletal muscles as punctate dots. [A (b) and inset] There is weak labelling for Cav-1 in the sarcolemma of E15.5 mdx embryonic skeletal muscles. [B (b) and inset] E17.5 mdx embryonic skeletal muscles have more Cav-1 labelling compred to E17.5 wt; Cav-1 localises to the sarcolemma region as punctate dots. Cav-1 localises to the subsarcolemma region as punctate dots in the embryonic skeletal muscles of both E15.5 cav-3-/- [A (c) and inset] and E15.5 DMhet [A (d) and inset]. [B (c) and inset] There is weak labelling for Cav-1 in the sarcolemma of E17.5 cav-3-/- embryonic skeletal muscles. [B (d) and inset] Cav-1 is widespread in the sarcolemma of E17.5 DMhet embryonic skeletal muscles. Images are representative immuno-histochemistry labelling of Cav-1 of two individual embryos. cav-3-/-: mouse with caveolin-3 knocked out; DMhet: mdx mouse with heterozygous caveolin-3 knockout.

254
A) E15.5 B) E17.5

255
In both E15.5 DMhet and cav-3-/- skeletal muscles, Cav-1 is localised to the subsarcolemma
region and appears to be punctate dots (Figure 6.3 A (c) and (d)). There is weak labelling for
Cav-1 to the sarcolemma of E17.5 cav-3-/- skeletal muscles (Figure 6.3 B (c)). In E17.5
DMhet skeletal muscles, Cav-1 is widespread in the subsarcolemma (Figure 6.3 B (d)).

256
Figure 6.4 Mislocalisation of Cav-1 and Cav-3 in T-tubules C2C12 and PD50A myoblasts (80% confluence) were shifted to DM (DMEM+2% horse serum) for fourteen days to induce myotube formation. Location of Cav-1 and Cav-3 relative to the T-tubules is determined by the colocalisation of Cav-1 or Cav-3 with calsequestrin. (B and J) Cav-1 in C2C12 and PD50A myotubes was labelled with Alexa Fluor 488. (F and N) Cav-3 in C2C12 and PD50A myotubes was labelled with Alexa Fluor 488. (C, G, K and O) Calsequestrin in C2C12 and PD50A myotubes was labelled with Texas Red. (A, E, I and M) Nuclei of the myotubes were labelled with 10 μg/ml of DAPI for three minutes. The merged images were shown in (D), (H), (L) and (P). (D; inset) Cav-1 but not (H; inset) Cav-3 colocalises with calsequetrin in C2C12 myotubes. (P; inset) Cav-3 but not (L; inset) Cav-1 colocalises with calsequestrin in PD50A myotubes. Arrows in the inset represent (D) colocalisation of Cav-1 and calsequestrin in C2C12 myotubes and (P) colocalisation of Cav-3 and calsequestrin in PD50A myotubes.

257
6.2.2. Dystrophic myotubes have mislocalisation of Cav-1 and Cav-3 proteins in T-tubules
Cav-3 has been reported to express in the developing T-tubules and is absent from the mature
T-tubules in skeletal muscles (Galbiati et al., 2001a; Parton et al., 1997). I have established
that both Cav-1 and Cav-3 are localised to the sub-sarcolemma of E17.5 wt embryonic
skeletal muscles showing punctate staining corresponding to the triads of the skeletal muscles
(Figure 6.2 and 6.3). I have also established that Cav-3 can associate with Cav-1 in 4-week
and 9-week wt skeletal muscles (Figure 5.2). To establish the localisation of Cav-1 and Cav-3
relative to the T-tubules, I doubly labelled either Cav-1 or Cav-3 with calsequestrin (a marker
for T-tubules; Figure 6.1) in the wt (C2C12) and dystrophin-deficient (PD50A) myotubes
(Figure 6.4). Localisation of calsequestrin is similar in both C2C12 and PD50A myotubes
(Figure 6.4 C, G, K and O).
In C2C12 myotubes, Cav-1 colocalises with calsequestrin (Figure 6.4 D and H).
Colocalisation of Cav-1 and calsequestrin in C2C12 myotubes is mainly perinuclear (Figure
6.4 D). In PD50A myotubes, both Cav-1 and Cav-3 staining is found perinulcear and in the
cytoplasm (Figure 6.4 B and F; compare with J and N). In contrast to C2C12 myotubes, there
is more Cav-3 than Cav-1 colocalises with calsequestrin in PD50A myotubes (Figure 6.4 L
and P). Perturbed localisation of Cav-1 and Cav-3 relative to calsequestrin in dystrophin-
deficient myotubes may help to explain the impaired T-tubule function in mdx reported
previously (Lovering et al., 2009).

258
Figure 6.5 β-dystroglycan interacts with caveolin-1 in wt and mdx muscles. 100 μg of muscle tissue extracts from wild type (wt), cav-3-/- and mdx mice were used for immunoprecipitation (IP). Cav-1 and associated proteins were pulled down with anti-caveolin-1 antibody and Protein A Sepharose CL-4B beads. The muscle tissue extracts were from (A) 4 weeks and (B) 9 weeks old mice. 10 μg of each extract was loaded as input control and rabbit Igs were applied as the negative control for IP. Components pulled down using anti-Cav-1 antibody were detected by anti-Cav-3 and anti-β-dystroglycan antibodies respectively. (A) The band for β-dystroglycan is stronger in skeletal muscles of 4-week cav-3-/- mouse. (B) The band for β-dystroglycan is stronger in skeletal muscles of 9-week mdx mouse.
A
B

259
6.2.3. β-dystroglycan associates with Cav-1/Cav-3 protein complex
β-dystroglycan of the Dystrophin-dystroglycan complex (DGC) links the intracellular actin
filament and extracellular matrix of muscle fibres (Ervasti and Campbell, 1993). It has
previously been suggested that Cav-1 and Cav-3 respectively regulate the mechanical
responses of epithelial cells and myoblasts (Gervasio et al., 2011; Sinha et al., 2011). In
skeletal muscles and smooth muscles respectively, Cav-3 and Cav-1 have been reported to
associate with β-dystroglycan (Jung et al., 1995; Sharma et al., 2010; Sotgia et al., 2000). In
the present study, I established that there were elevated protein levels of both Cav-1 and Cav-
3 in dystrophin-deficient myoblasts and embryos (Figure 3.15 and 4.1). I also established that
there were more cytosolic Cav-1 and Cav-3 in dystrophin-deficient myotubes which indicate
these caveolins are targeted to degradation (Figure 6.4). To understand whether Cav-1
interacts with β-dystroglycan in skeletal muscles, I examined the components pulled-down by
anti-Cav-1 antibody from skeletal muscle tissue extracts of 4-week and 9-week wt, mdx and
cav-3-/- mice (Figure 6.5).
β-dystroglycan associates with Cav-1 in skeletal muscles from 4-week and 9-week wt, mdx
and cav-3-/- mice (Figure 6.5 A and B). The intensity of the band for β-dystroglycan in the
pull-down is in proportion to that for Cav-1 (Figure 6.5 A and B). The intensities of bands for
β-dystroglycan and Cav-1 in the pull-down are higher in cav-3-/- than in mdx in the skeletal
muscles of 4-week-old mice while those are lower in cav-3-/- than mdx in the skeletal muscles

260
of 9-week-old mice (Figure 6.5 A and B). These data suggest that Cav-1 may be responsible
for the degradation of β-dystroglycan in dystrophin-deficient muscles as I demonstrate that
there was more cytosolic Cav-1 in the dystrophin-deficient myotubes (Figure 6.4). .
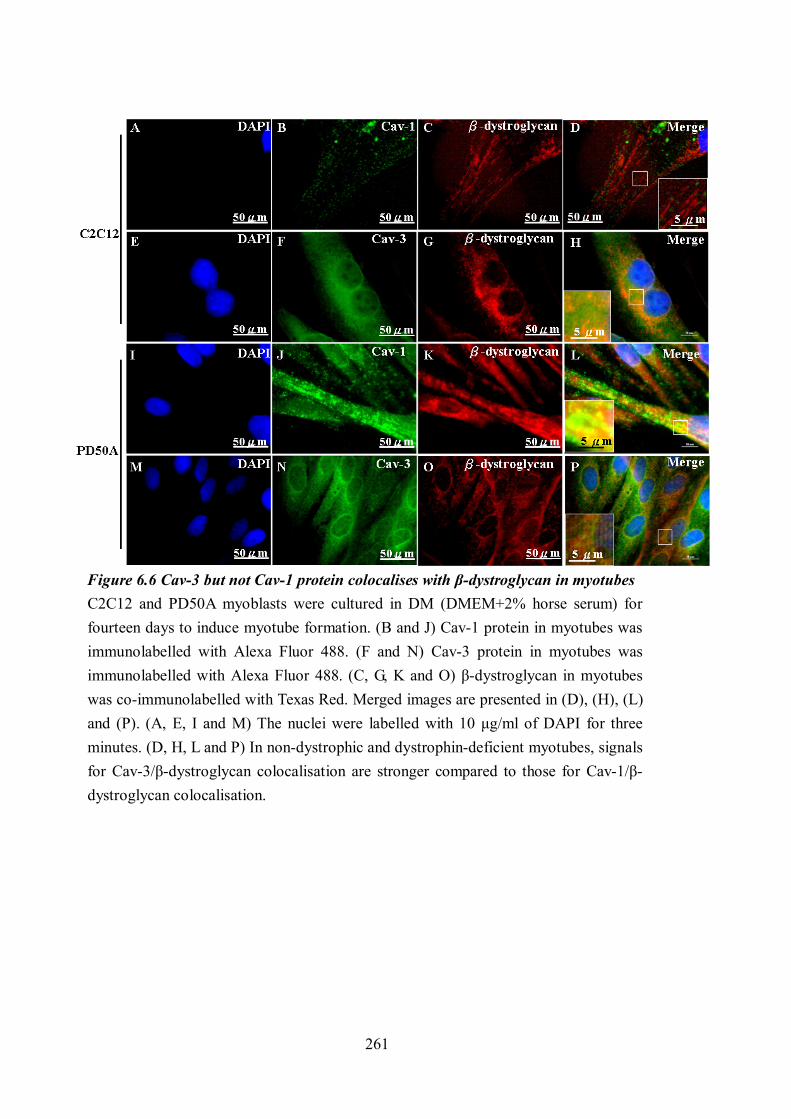
261
Figure 6.6 Cav-3 but not Cav-1 protein colocalises with β-dystroglycan in myotubes C2C12 and PD50A myoblasts were cultured in DM (DMEM+2% horse serum) for fourteen days to induce myotube formation. (B and J) Cav-1 protein in myotubes was immunolabelled with Alexa Fluor 488. (F and N) Cav-3 protein in myotubes was immunolabelled with Alexa Fluor 488. (C, G, K and O) β-dystroglycan in myotubes was co-immunolabelled with Texas Red. Merged images are presented in (D), (H), (L) and (P). (A, E, I and M) The nuclei were labelled with 10 μg/ml of DAPI for three minutes. (D, H, L and P) In non-dystrophic and dystrophin-deficient myotubes, signals for Cav-3/β-dystroglycan colocalisation are stronger compared to those for Cav-1/β-dystroglycan colocalisation.

262
Cav-3 colocalises with β-dystroglycan in myotubes
I then examined the localisation of Cav-1, Cav-3 and β-dystroglycan proteins in myotubes
through Immunofluorescent labelling of differentiated cultured myoblasts (Figure 6.6). There
is both sarcolemmal and cytoplasmic labelling for β-dystroglycan in C2C12 myotubes (Figure
6.6 C and G). This evenly spread-out localisation of β-dystroglycan in C2C12 myotubes
suggests the presence of an intact DGC and synthesis. In dystrophin-deficient (PD50A)
myotubes, β-dystroglycan proteins are cytoplasmic, suggesting that these are targeted for
degradation (Figure 6.6 K and O). Cav-1 does not colocalise with β-dystroglycan in C2C12
myotubes (Figure 6.6 D). Cav-3, on the other hand, colocalises with β-dystroglycan in C2C12
myotubes (Figure 6.6 H). However, colocalisation of Cav-3 and β-dystroglycan is cytoplasmic
(Figure 6.6 H). This suggests that interaction between Cav-3 and β-dystroglycan occurs in a
cellular compartment distinct from that between dystrophin and β-dystroglycan. In PD50A
myotubes, there is extensive colocalisation of Cav-1 with β-dystroglycan (Figure 6.6 L),
suggesting that Cav-1 may play a role in the degradation of β-dystroglycan. Furthermore,
more β-dystroglycan colocalises with Cav-3 around the nuclei of dystrophin-deficient
myotubes (Figure 6.6 P). Perinuclear localisation of Cav-3 and β-dystroglycan in dystrophin-
deficient myotubes suggests that these may be newly synthesized or are targeted for
degradation.

263
Figure 6.7 Cav-3 but not Cav-1 colocalises with actin in C2C12 and PD50A myoblasts Localisation of actin, Cav-1 and Cav-3 was examined in C2C12 and PD50A myoblasts. Myoblasts were fixed with 4% PFA and immunofluorescently doubly labelled with Cav-1/phalloidin-rhodamine or Cav-3/phalloidin-rhodamine. Cav-1 in (B) C2C12 and (J) PD50A myoblasts was labelled with Alexa Fluor 488. Cav-3 in (F) C2C12 and (N) PD50A myoblasts was labeled with Alexa Fluor 488. Actin filaments in (C and G) C2C12 and (K and O) PD50A myoblasts were labelled with phalloidin-rhodamine. (A, E, I and M) Nuclei were labelled with 10 μg/ml of DAPI for three minutes. Merged images are shown in (D), (H), (L) and (P). Cav-1 does not colocalise with actin filament in both (D and inset) C2C12 and (L and inset) PD50A myoblasts. Cav-3 colocalises with actin filament in both (H and inset) C2C12 and (P and inset) PD50A myoblasts. Arrows in insets represent colocalisation of Cav-3 with actin-filament.

264
6.2.4. Cav-1 and Cav-3 colocalise with the cytoskeleton architecture (actin filaments)
in dystrophin-deficient myoblasts and myotubes
Dystrophin-dystroglycan complex (DGC) plays an important role in transducing the force
between actin filament and extracellular matrix (Ervasti and Campbell, 1993). Dystrophin
binds to cytoskeleton architecture (stress fibres), filamentous actin (F-actin) and microtubules,
to regulate the cortical stiffness of muscle cells (Ervasti and Campbell, 1993; Pasternak et al.,
1995; Prins et al., 2009). It has been reported that dystrophin deficiency causes
disorganisation of costameric actin which connects the sarcomere of the muscles to the cell
membrane (Rybakova et al., 2000). In the present study, I established that there are more
cytoplasmic Cav-1 and Cav-3 in dystrophin-deficient myotubes (Figure 6.4 and 6.6). To study
whether Cav-1 and Cav-3 interact with actin filaments in skeletal muscles, I examined the
localisation of Cav-1, Cav-3 and actin in wt (C2C12)/dystrophin-deficient (PD50A)
myoblasts and myotubes (Figure 6.7 and 6.8). Actin filament is labelled with phalloidin-
rhodamine. In C2C12 myoblasts, Cav-3 but not Cav-1 colocalises with actin filaments (Figure
6.7 D and H). In PD50A myoblasts, Cav-1 does not colocalise with actin filaments (Figure 6.7
L). Cav-3 colocalises with actin filaments in PD50A myoblasts (Figure 6.7 P).

265
Figure 6.8 Cav-3 and Cav-1 colocalise with actin in myotubes C2C12 and PD50A myoblasts were cultured in DM (DMEM+2% horse serum) for fourteen days to induce myotube formation. (B and J) Cav-1 in myotubes was immunolabelled with Alexa Fluor 488. (F and N) Cav-3 in myotubes was immunolabelled with Alexa Fluor 488. (C, G, K and O) Myotubes were co-immunolabelled with phalloidin-rhodamine that recognizes actin. (A, E, I and M) Nuclei were labelled with 10 μg/ml of DAPI for three minutes. Merged images are presented in (D), (H), (L) and (P). (D and H) Cav-1 and Cav-3 colocalise with actin filament in C2C12 myotubes. (L and P) Cav-1 and Cav-3 colocalise with actin filament in PD50A myotubes. The patterns of Cav-1, Cav-3 and actin filaments in PD50A myotubes are disorganized compared to C2C12 myotubes (D, H, L and P). Arrows in insets represent (D and L) colocalisation of Cav-1 with actin filament and (H and P) colocalisation of Cav-3 with actin filaments.

266
Cav-1 and Cav-3 colocalise with actin filaments in myotubes
The actin filaments found in dystrophin-deficient (PD50A) myotubes are short and irregularly
orientated compared to non-dystrophic myotubes (Figure 6.8 C, G, K and O). This is
consistent with previous report that the actin filament is distorted in mdx skeletal muscle
fibres (Rybakova et al., 2000). In C2C12 myotubes, both Cav-1 and Cav-3 colocalise with
actin filaments (Figure 6.8 D and H). Cav-1 and Cav-3 also colocalise with actin filaments in
PD50A myotubes (Figure 6.8 L and P). Colocalisation of Cav-1/actin filaments and Cav-
3/actin filaments in PD50A myotubes is less extensive compared to C2C12 myotubes (Figure
6.8 D, H, L and P). The patterns of Cav-1, Cav-3 and actin-filaments localisation are
disorganised in PD50A myotubes compared to C2C12 myotubes (Figure 6.8 D, H, L and P).
These data suggest that, Cav-1 and Cav-3 may participate in the mechanical stress response in
myotubes in addition to playing roles in mediating DGC associated signal transduction (refer
to section 6.2.5).
It has been reported that Cav-1, Cav-3 and dystrophin bind to β-dystroglycan through WW
domains (Jung et al., 1995; Sharma et al., 2010; Sotgia et al., 2000). Dystrophin can direct
bind to actin filaments through the actin-binding domain within the spectrin-like repeats 11-17
(Rybakova et al., 2006). To establish whether Cav-1 and Cav-3 interact with actin filament
with similar actin-binding domain, I aligned the amino acid sequences of Cav-1, Cav-2 and
Cav-3 with the actin-binding domain of dystrophin (Figure 6.9).
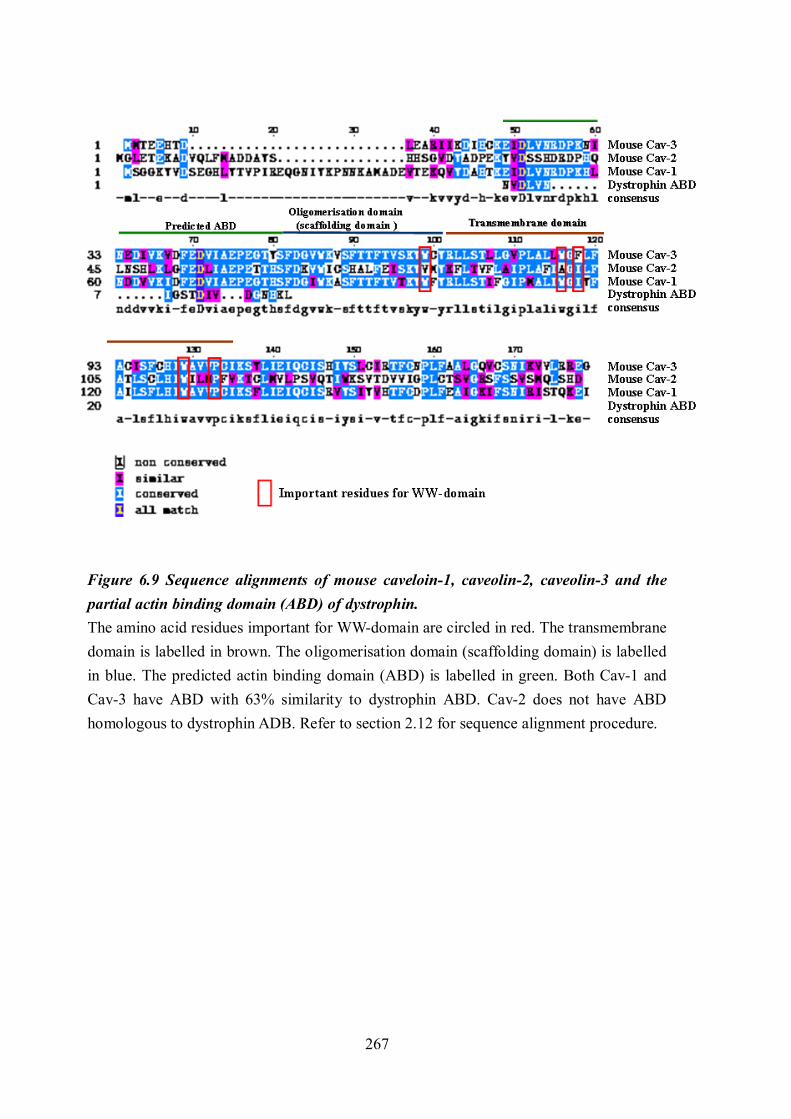
267
Figure 6.9 Sequence alignments of mouse caveloin-1, caveolin-2, caveolin-3 and the partial actin binding domain (ABD) of dystrophin. The amino acid residues important for WW-domain are circled in red. The transmembrane domain is labelled in brown. The oligomerisation domain (scaffolding domain) is labelled in blue. The predicted actin binding domain (ABD) is labelled in green. Both Cav-1 and Cav-3 have ABD with 63% similarity to dystrophin ABD. Cav-2 does not have ABD homologous to dystrophin ADB. Refer to section 2.12 for sequence alignment procedure.

268
I identified actin binding sequences preceding the scaffolding (oligomerisation) domain of
Cav-1 and Cav-3 which show 63% similarity to actin-binding domain in dystrophin (Figure
6.9; highlighted in green). Such actin-binding sequences are absent in Cav-2 (Figure 6.9).
Together with the immunofluorescent labelling results (Figure 6.7 and 6.8), these data show
that Cav-1 and Cav-3 can interact with actin filaments and the interaction may be mediated by
the actin-binding sequence identified here (Figure 6.9).
Cav-1 and Cav-3 do not colocalise with microtubules in myotubes
It has been reported that the organisation of microtubules in mdx skeletal muscles is perturbed
(Khairallah et al., 2012; Prins et al., 2009). It has also been reported that stretch induced
injury of mdx skeletal muscles is mediated by microtubule-dependent activation of NADPH
oxidase-dependent production of ROS (reactive oxygen species) which cause Ca2+ influx
(Khairallah et al., 2012). To examine whether Cav-1 and Cav-3 proteins interact with
microtubules in myotubes, I doubly labelled Cav-1 or Cav-3 with α-Tubulin, a key constituent
of microtubules (Figure 6.10). The microtubule in the PD50A myotubes is disorganised as the
actin filament compared to C2C12 myotubes (Figure 6.10 C, G, K and O; Figure 6.8 C, G, K
and O), suggesting that the mechanical properties may be compromised in PD50A myotubes.
In C2C12 and PD50A myotubes, neither Cav-1 nor Cav-3 colocalises with tubulin (Figure
6.10 D, H, L and P).
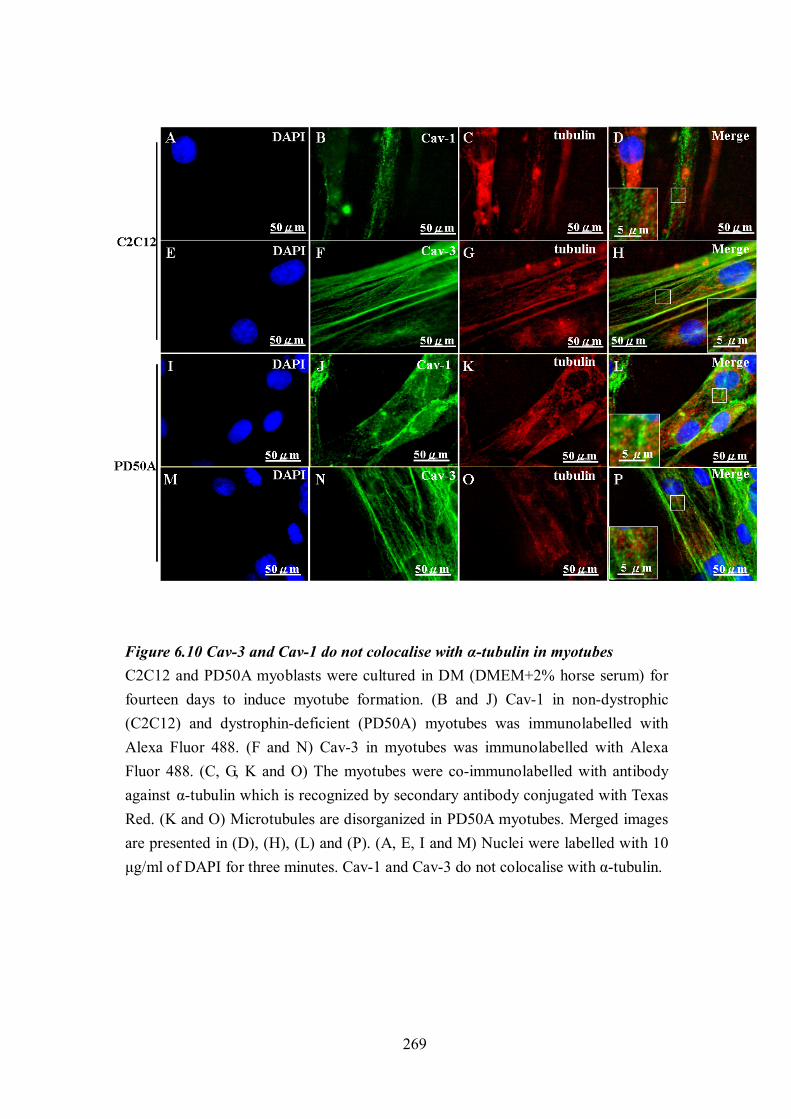
269
Figure 6.10 Cav-3 and Cav-1 do not colocalise with α-tubulin in myotubes C2C12 and PD50A myoblasts were cultured in DM (DMEM+2% horse serum) for fourteen days to induce myotube formation. (B and J) Cav-1 in non-dystrophic (C2C12) and dystrophin-deficient (PD50A) myotubes was immunolabelled with Alexa Fluor 488. (F and N) Cav-3 in myotubes was immunolabelled with Alexa Fluor 488. (C, G, K and O) The myotubes were co-immunolabelled with antibody against α-tubulin which is recognized by secondary antibody conjugated with Texas Red. (K and O) Microtubules are disorganized in PD50A myotubes. Merged images are presented in (D), (H), (L) and (P). (A, E, I and M) Nuclei were labelled with 10 μg/ml of DAPI for three minutes. Cav-1 and Cav-3 do not colocalise with α-tubulin.

270
Figure 6.11 Sequence alignments of mouse caveolin-1, caveolin-2, caveolin-3 and the microtubule binding domain (MBD) of dystrophin. The amino acid residues important for WW-domain are circled in red. The transmembrane domain is labeled in brown. The oligomerisation domain (scaffolding domain) is labeled in blue. Cav-1, Cav-2 and Cav-3 have no microtubule binding domain homologous to that of dystrophin. Refer to section 2.12 for sequence alignment procedure.
271
The sequence alignment with the microtubule binding domain of dystrophin shows that Cav-1,
Cav-2 and Cav-3 share no homologous microtubule binding domain with dystrophin (Figure
6.11). It also suggests that dystrophin has a direct role in regulating the organisation of
microtubules.
6.2.5. The mechanical properties of myotubes are manipulated by minidystrophin△H2-
R19, Cav-1 and Cav-3
mdx skeletal muscles have been reported to have impaired force output (Chan et al., 2007;
Lynch et al., 2001). An earlier study using atomic force microscope (AFM) showed that
myotubes formed from primary myoblasts of mdx mice (2-8 week) is less stiffer than non-
dystrophic control (Pasternak et al., 1995). In the present study, I demonstrated that the
localization of Cav-1 and Cav-3 as well as the architecture of cytoskeleton are disorganized in
dystrophin-deficient (PD50A) myotubes (Figure 6.8 and 6.10). To study the roles of Cav-1
and Cav-3 in the mechanical properties of dystrophin-deficient myotubes, I examined the
force modulus of wt (C2C12) and dystrophin-deficient (dfd13, parental cell line of PD50A
myoblasts) myotubes by AFM in collaboration with Dr. James Bowen (School of Chemical
Engineering, the University of Birmingham).

272
Figure 6.12 Minidystrophin-eGFP expression in C2C12 and dfd13 myoblasts. Human minidystrophin tagged with eGFP was introduced into C2C12 and dfd13 myoblasts (Refer to section 2.5.2 for details of minidystrophin transfection). Stable clones were selected with G418 for further experiments. (A, E, I and M) Nuclei were labeled with DAPI (10 μg/ml). (B and J) The control transfectants express eGFP. (F and J) The stable transfectants express eGFP-tagged human minidystrophin△H2-R19. (C, G, K and O) Dystrophin or minidystrophin △ H2-R19 was labelled with MANDRA1 7A10 antibody specific for dystrophin (labeled with Texas Red). Merged images are presented in (D), (H), (L) and (P). minidys: minidystrophin△H2-R19 (Chapdelaine et al., 2000).

273
6.2.5.1. Knocking down Cav-3 improves formation of dystrophin-deficient
(PD50A) myotubes
To study the effect of Cav-1, Cav-3 and minidystrophin△H2-R19 on the force modulus of
myotubes, I generated the stable myoblast transfectants with overexpression of Cav-1 or Cav-
3, with knockdown of Cav-1 or Cav-3 and with eGFP-tagged human minidystrophin△H2-R19
(Figure 6.12; stable transfectants with overexpression of Cav-1 or Cav-3 and with knockdown
of Cav-1 or Cav-3 have been described in chapter 5; Figure 5.12). Dystrophin expresses in
C2C12-eGFP myoblasts but not in dystrophin-deficient dfd13-eGFP myoblasts (Figure 6.12 C
and K). The expression of minidystrophin△H2-R19–eGFP in dystrophin-deficient and non-
dystrophic stable transfectants was confirmed using an antibody specific for dystrophin
(Figure 6.12 F, G, J and K).

274
Figure 6.13 Morphology of C2C12 and dfd13 transfectants under differentiation condition for ten days. Stable transfectants were cultured under GM (DMEM+10% FCS) and then, when cells reached more than 80% confluence, were shifted to DM (DMEM+2% horse serum) to induce myotube formation. Images were taken at day ten of differentiation induction before these myotubes were subjected to mechanical testing using atomic force microscope. Myotubes obtained from (A) C2C12-eGFP, (E) dfd13-eGFP, (I) C2C12-gfpsh and (L) dfd13-gfpsh transfectants were used as controls. Myotubes derived from both (B) wt C2C12-Cav1eGFP and (F) dystrophin-deficient dfd13-Cav1eGFP, myoblasts which were overexpressing Cav-1 are larger compared to eGFP control tranfectants (A) C2C12-eGFP and (E) dfd13-eGFP. Myoblast transfectants form smaller myotubes compared to (A and E) controls when Cav-3 is over-expressed [(C) C2C12-Cav3eGFP and (G) dfd13-Cav3eGFP]. (D) C2C12-minidys-eGFP and (H) dfd13-minidys-eGFP transfectants form larger myotubes compared to controls (A and E). (J) C2C12-Cav1KD and (M) dfd13-Cav1KD transfectants form larger myotubes compared to (I) C2C12-gfpsh and (L) dfd13-gfpsh controls. Myoblasts form larger myotubes compared to (I and L) controls when Cav-3 in knocked down [(K) C2C12-Cav3KD and (N) dfd13-Cav3KD].

275
I then differentiated these stable transfectants to obtain myotubes (Figure 6.13). C2C12-Cav-
1eGFP and dfd13-Cav-1eGFP myoblasts form larger myotubes compared to their respective
controls (C2C12-eGFP and dfd13-eGFP) (Figure 6.13 A, B, E and F). Conversely,
overexpression of Cav-3 (C2C12-Cav-3eGFP and dfd13-Cav-3eGFP) form myotubes with
lower efficiency compared to their respective controls (C2C12-eGFP and dfd13eGFP) (Figure
6.13 A, C, E and G). C2C12-minidys-eGFP and dfd13-minidys-eGFP myoblasts form larger
myotubes compared to their respective controls (C2C12-eGFP and dfd13-eGFP) (Figure 6.13
A, D, E and H). When Cav-1 was down-regulated in C2C12 myoblasts, the C2C12-Cav1KD
myoblasts produce myotubes with the most mature morphology among the transfectants
examined (Figure 6.13 J). For dfd13-Cav1KD transfectants, they are also more prone to line
up and form myotubes compared to dfd13-dsgfpsh controls (Figure 6.13 M). Down-regulation
of Cav-3 in myoblasts (both wt and dystrophin-deficient) induces the formation of myotubes
compared to their respective controls (C2C12-gfpsh and dfd13-gfpsh) (Figure 6.13 I, K, L and
N). These data suggest that elevated levels of Cav-1 and Cav-3 in dystrophin-deficient
myoblasts impair their ability to form myotubes.

276
Figure 6.14 Mini-dystrophin increases the mechanical properties of dystrophin-deficient myotubes. Stable transfectants (more than 80% confluence) were cultured in 6-cm dishes in DM (DMEM+2% horse serum) to induce myotube formation. Myoblasts were cultured in DM for 12-14 days for myotube formation. Force modulus of the myotubes was measured by atomic force microscope (AFM). The experiment was repeated three times with 10 cells analysed each time (Refer to section 2.11). (A) Minidystrophin increases the stiffness of dystrophin-deficient myotubes but decreases the stiffness of wt myotubes. (B) Force modulus distribution of minidystrophin over-expressing myotubes. The red lines represent means of each cell line. (ANOVA; **<0.01; *compared to controls; n=30).
A
B

277
6.2.5.2. Mminidystrophin△H2-R19 proteins increase the mechanical force modulus
of dystrophin-deficient myotubes.
Dystrophin has been reported to play a role in mediating the force exerted to muscle fibres
(Ervasti and Campbell, 1993). Therefore I examined the force modulus of myotubes which
overexpress a shorter dystrophin-eGFP fusion protein, minidystrophin H2△ -R19 (Figure 6.14).
C2C12-minidys-eGFP myotubes have reduced stiffness which is only half that of C2C12-
eGFP controls (force modulus for C2C12-minidys-eGFP and C2C12-eGFP myotubes are 2.78
± 0.59 kPa and 5.72 ± 0.54 kPa respectively) (Figure 6.14 A; p= 4.1×10⁻⁴). C2C12-minidys-
eGFP myotubes have a force modulus between 0-5 kPa while C2C12-eGFP myotubes have a
force modulus between 1-11 kPa (Figure 6.14 B). One thing noteworthy is that while testing
the mechanical properties of C2C12-minidys-eGFP myotubes, I noticed that the myotubes
were less stably attached to the petri dish than control, suggesting that overexpression of
mini-dystrophin may be detrimental to the function of non-dystrophic myotubes. The average
force modulus of dfd13-minidys-eGFP myotubes (4.54 ± 1.36 kPa) is not significantly
different from the dfd13-eGFP controls (2.48 ± 0.23 kPa) although the mean force modulus is
doubled in dfd13-minidys-eGFP myotubes (Figure 6.14 A). This is because the variation is
much greater in dfd13-minidys-eGFP myotubes. However, distribution of force modulus
shifts from 1-6 kPa for dfd13-eGFP myotubes to 1-9 kPa for dfd13-minidys-eGFP myotubes
(Figure 6.14 B). These data suggest that minidystrophin increases stiffness of dystrophin-

278
deficient myotubes but to what extent may depend on the expression efficiency. This may also
be because some cultures were not given enough time to differentiate, supporting the impaired
differentiation of dystrophin-deficient myoblasts (Figure 3.2).
6.2.5.3. The levels of Cav-3 affect the stiffness of dystrophin-deficient myotubes
It has been reported that Cav-3 proteins may participate in stress response of cells (Gervasio
et al., 2011; Sinha et al., 2011). In section 6.2.4, I established that Cav-1 and Cav-3 colocalise
with actin filaments in dystrophin-deficient myotubes (Figure 6.8). To study the effect of Cav-
3 on the mechanical properties of myotubes, I measured the force modulus of myotubes which
over-express Cav-3 or have down-regulation of Cav-3 (Figure 6.15 and 6.16). Although the
average force modulus of C2C12-Cav-3eGFP myotubes (7.40 ± 0.86 kPa) is not significantly
different from that of C2C12-eGFP myotubes, the distribution of modulus shifts from 2-8 kPa
(C2C12-eGFP) to 2-10 kPa (C2C12-Cav-3eGFP) (Figure 6.15 A and B). Some C2C12-Cav-
3eGFP myotubes were found to have stiffness up to 22 kPa (Figure 6.15 B). The average
force modulus of dfd13-Cav-3eGFP myotubes (2.95 ± 0.38 kPa) is not significantly different
from that of dfd13-eGFP myotubes (Figure 6.15 A). However, the modulus distribution shifts
downwards in dfd13-eGFP myotubes to between 1-6 kPa compared to 0-8 kPa in dfd13-Cav-
3eGFP myotubes (Figure 6.15 B). These data suggest that overexpression of Cav-3 increases
the stiffness of non-dystrophic myotubes but has no effect on dystrophin-deficient myotubes.

279
Figure 6.15 Over-expressing Cav-3 increases the stiffness of myotubes. Myoblasts plated in 6-cm dishes (more than 80% confluence) were cultured in DM (DMEM+2% horse serum) to induce the formation of myotubes. Myotubes were cultured in DM for 12-14 days. Force modulus of myotubes was obtained with atomic force microscope (AFM). The experiment was repeated three times with 10 cells analysed each time. (A) Cav-3 over-expression increases the stiffness of non-dystrophic myotubes. (B) Distribution of force modulus shifts to higher force modulus in both C2C12-Cav-3eGFP and dfd13-Cav-3eGFP compared to the controls. The red lines represent means of each cell line (ANOVA; *<0.05; *compared to controls; n=30).
A
B

280
Figure 6.16 Down-regulating Cav-3 increases the mechanical properties of myotubes. Myoblasts plated in 6-cm dishes (more than 80% confluence) were cultured in DM (DMEM+2% horse serum) to induce the formation of myotubes. Myotubes were cultured in DM for 12-14 days. Force modulus was acquired with atomic force microscope (AFM). The experiment was repeated three times with 10 cells analysed each time. (A) Cav-3 down-regulation increases the stiffness of dystrophin-deficient myotubes. (B) Force modulus distribution of myotubes with down-regulated Cav-3. The red lines represent means of each cell line. (ANOVA; **<0.01; *compared to controls; n=30).
A
B

281
The force modulus increases in both non-dystrophic and dystrophin-deficient myotubes with
down-regulation of Cav-3 compared to controls (Figure 6.16). The force modulus of C2C12-
Cav3KD myotubes (3.62 ± 0.44 kPa) is comparable to C2C12-dsgfpsh controls (2.75 ± 0.15)
(Figure 6.16 A). I have shown in chapter 3 that there are elevated levels of Cav-3 in PD50A
myoblasts which are clonally derived from dfd13 myoblasts (Figure 3.15). The force modulus
of dfd13-Cav-3KD myotubes (6.44 ± 0.36 kPa) increases by 60% compared to dfd13-dsgfpsh
controls (3.94 ± 0.29 kPa) (Figure 6.16 A; p= 1.03×10⁻⁶). Force modulus shifts upwards from
1-4 kPa in C2C12-gfpsh myotubes to 0-10 kPa in C2C12-Cav3KD myotubes and (a modest
increase) upwards from 1-6 kPa in dfd13-gfpsh myotubes to 2-9 kPa in dfd13-Cav3 KD
myotubes (Figure 6.16 B). These data suggest that down-regulation of Cav-3 increases the
stiffness of dystrophin-deficient myotubes. They also suggest that Cav-3 levels are critical for
the maintenance of mechanical properties and that this effect is not necessarily dependent on
dystrophin.

282
Figure 6.17 Overexpressing Cav-1 in myotubes increases the stiffness of dystrophin-deficient myotubes but impairs the stiffness of non-dystrophic myotubes. Myoblasts plated in 6-cm dishes (more than 80% confluence) were cultured in DM (DMEM+2% horse serum) for 12-14 days to induce myotube formation. The force modulus of myotubes was acquired with atomic force microscope (AFM). The experiment was repeated three times with 10 cells analysed each time. (A) Cav-1 overexpression has opposite effects on the stiffness of dystrophin-deficient and non-dystrophic myotubes. (B) dfd13-Cav-1eGFP myotubes have more cells with higher modulus compared to C2C12-Cav-1eGFP myotubes. The red lines represent means of each cell line. (ANOVA; **<0.01; *compared to controls; n=30).
A
B
283
6.2.5.4. Cav-1 is important for the maintenance of mechanical properties of
dystrophin-deficient myotubes
Rapid disassembly of Cav-1 in caveolae has been reported in fibroblasts in response to stretch
or osmotic stress (Gervasio et al., 2011; Sinha et al., 2011). In chapter 3, I have shown that
there are elevated levels of Cav-1 in PD50A myoblasts (clonally derived from dfd13
myoblasts) (Figure 3.14). To establish whether levels of Cav-1 in myotubes affect their
mechanical properties, I examined the effect of Cav-1 on the force modulus of non-dystrophic
(C2C12) and dystrophin-deficient (dfd13) myotubes (Figure 6.17). The force modulus of
C2C12-Cav1-eGFP myotubes (3.60 ± 0.43 kPa) decreases by 37% compared to C2C12-eGFP
myotubes (Figure 6.17 A; p= 2.68×10⁻³). Conversely, the force modulus of dfd13-Cav1-eGFP
myotubes (5.25 ± 0.49 kPa) increases by 2 fold compared to dfd13-eGFP myotubes (Figure
6.17 A; p = 2.86×10⁻⁶). These data strongly suggest that the elevation of Cav-1 found in
dystrophin-deficient myotubes has a compensatory effect on myotube function and provide
further evidence to support the idea that the differentiation process in dystrophin-deficient
myoblasts is significantly compromised (Figure 3.14). The force modulus of C2C12-Cav-1-
eGFP and dfd13-Cav1-eGFP myotubes falls respectively in 0-8 kPa and 2-9 kPa (Figure 6.17
B).

284
Figure 6.18 Down-regulation of Cav-1 has reverse effects on the mechanical properties of non-dystrophic and dystrophin-deficient myotubes. Myoblasts plated in 6-cm dishes (more than 80% confluence) were shifted to DM (DMEM+2% horse serum) to induce the formation of myotubes. Myotubes were in DM for 12-14 days. Force modulus of myotubes was acquired with the atomic force microscope (AFM). The experiment was repeated three times with 10 cells analysed each time. (A) Cav-1 down-regulation impairs the stiffness of dystrophin-deficient myotubes but promotes the stiffness of non-dystrophic myoblasts. (B) C2C12-Cav-1KD myotubes have more cells with higher force modulus than dfd13-Cav1KD myotubes. The red lines represent means of each cell line. (ANOVA; **<0.01; *compared to controls; n=30).
B
A

285
Knocking down Cav-1 in myotubes has opposite effects on the stiffness of non-dystrophic and
dystrophin-deficient myotubes (Figure 6.18). The force modulus of C2C12-Cav-1KD
myotubes (5.48 ± 0.55 kPa) increases compared to C2C12-dsgfpsh myotubes (Figure 6.18 A;
p=8.56×10⁻⁶). In dfd13-Cav-1KD myotubes, however, the force modulus (1.89 ± 0.26 kPa) is
significantly reduced compared to dfd13-dsgfpsh myotubes (Figure 6.18 A; p= 1.62×10⁻⁶).
C2C12-Cav-1KD myotubes have force modulus within 1-12 kPa while dfd13-Cav-1KD
myotubes have force modulus within 0-5 kPa (Figure 6.18 B). These data show that increased
levels of Cav-1 may be compensatory in dystrophin-deficient myotubes.
6.2.6. The number of Cav-3(+)My32(+) fibres increases at the expense of Cav-1(+)My32(+)
fibres in E15.5 mdx intercostal muscles
It has been reported that intercostal and diaphragm muscles of mdx (E13.5 and E17.5) have
perturbed localisation of fast myosin heavy chain (FMyHC or My32) (Merrick et al., 2009).
This may correlate with force deficit of adult mdx skeletal muscles in previous report (Lynch
et al., 2001). In addition, a recent report suggests that up-regulation of FMyHC in
gastrocnemius muscles after exercise correlates with increase expression of Cav-3 gene (Park
et al., 2012). We have shown in previous report that there was no difference in the number of
FMyHC-positive (My32-positive) fibres in the E15.5 mdx intercostal (Merrick et al., 2009).

286
Figure 6.19 More colocalisation of Cav-3 and Fast MyHC in E15.5 mdx intercostal muscles compared to E15.5 wt. Paraffin wax embedded E15.5 wt and mdx embryos were consecutively sectioned in 5 μm thick. Sections were immunohistochemically labelled for Cav-1, Cav-3 and fast myosin heavy chain. Two embryos were used for each strain and six intercostal regions from each section were examined. Myofibres positive for Cav-1, Cav-3 and/or My32 were scored. (A) Representative images of wt and mdx intercostal muscles labelled with Cav-1, Cav-3 and My32. (B) mdx intercostal muscles have comparable number of Cav-1(+) and Cav-3(+) fibres compared to wt. (C) mdx intercostal muscles have more Cav-3(+)My32(+) fibres and fewer Cav-1(+)My32(+) fibres compared to wt. My32: fast myosin heavy chain. (ANOVA; *compared with mdx; *P< 0.05; ***P<0.001; n=12).

287
B
C

288
In chapter 4, I established that there were elevated levels of Cav-1 and Cav-3 in mdx embryos
(Figure 4.1). To investigate the relationship among Cav-1, Cav-3 and FMyHC in E15.5 mdx
embryos, I examined the localisation of Cav-1, Cav-3 and FMyHC proteins in intercostal
muscles of E15.5 mdx embryos (Figure 6.19).
The number of Cav-3-positive fibres [Cav-3(+)] in mdx intercostal muscles is not
significantly different from that in wt (38.83 ± 3.64 for wt and 43.75 ± 4.45 for mdx) (Figure
6.19 A and B). As reported earlier (Merrick et al., 2009), the number of My32-positive
[My32(+)] fibres is comparable in wt and mdx intercostal muscles (53.50 ± 3.78 for wt and
54.08 ± 4.95 for mdx) (Figure 6.19 A and B). However, the intensity of My32 staining is
weaker in mdx compared to wt (Figure 6.19 A). The number of Cav-1-positive [Cav-1(+)]
fibres in mdx intercostal muscles is comparable to wt counterparts (Figure 6.19 A and B). In
wt intercostal muscles, muscle fibres positive for both Cav-3 and My32 [Cav-3(+)My32(+);
30.44 ± 1.44% relative to My32 positive fibres] outnumbered those positive for both Cav-1
and My32 [Cav-1(+)My32(+); 7.30 ± 0.92% relative to My32-positive fibres] (Figure 6.19 C;
p= 1.97×10⁻¹³). Proportion of Cav-3(+)My32(+) fibres in mdx intercostal muscles increases by
55% (47.15 ± 3.10% relative to My32-positive fibres) compared to wt intercostal muscles
(Figure 6.19 C; p= 3.09×10⁻⁵). In addition, proportion of Cav-1(+)My32(+) fibres in mdx
intercostal decreases by 66% compared to wt intercostal muscles (2.46 ± 0.68% relative to
My32-positive fibres) (Figure 6.19 C; p= 2.98×10⁻⁴). There is only few proportion of muscle
289
fibers positive for Cav-1/Cav-3/My32 [Cav-1(+)Cav-3(+)My32(+)] in wt and mdx intercostal
muscles (5.35 ± 3.10% for wt and 1.42 ± 0.59% for mdx) (Figure 6.19 C). Colocalisation of
Cav-3 and FMyHC in both wt and mdx muscles supports a previous report that shows
correlation between Cav-3 and FMyHC proteins in gastrocnemius muscles after exercise
(Park et al., 2012). These data suggest that altered localisation of Cav-3/My32 proteins and
Cav-1/My32 proteins in mdx intercostal muscles relative to wt counterparts may contribute to
the impairment of respiratory function in mdx (Huang et al., 2011).
6.2.7. Modulation of Cav-1, Cav-3 and minidystrophin△H2-R19 also affects the mechanical
properties of myoblasts
In chapter 3, I established that there were elevated levels of Cav-1 and Cav-3 in dystrophin-
deficient myoblasts (Figure 3.15). I also established that dystrophin expresses in C2C12
myoblasts (Figure 6.12). To study whether modulation of Cav-1, Cav-3 and human
minidystrophin△H2-R19 affects the mechanical properties of myoblasts, I examined the force
modulus of stable transfectants which overexpress human minidystrophin△H2-R19, Cav-1 or
Cav-3 and knock down Cav-1 or Cav-3.

290
Figure 6.20 Mechanical properties of non-dystrophic and dystrophin-deficient myoblasts. 9×10⁴ of myoblasts were plated in 6-cm dishes for 4 days and the mechanical properties of myoblasts were analysed by atomic force microscope (AFM). The experiment was repeated three times with 10 cells each time. (A) Force modulus of dystrophin-deficient (dfd13) myoblasts is impaired compared to non-dystrophic myoblasts (C2C12). (B) Dystrophin-deficient myoblasts have a wider distribution of force modulus compared to non-dystrophic myoblasts. (C) The height of dystrophin-deficient myoblasts increases compared to non-dystrophic myoblasts. The red lines represent means of each cell line. (ANOVA; ﹟<0.05; ﹟C2C12 cells compared to dfd13 cells; n=30).
A B
C

291
6.2.7.1. Dystrophin-deficient myoblasts have compromised mechanical properties
In Figure 6.14, I established that the force modulus of dystrophin-deficient myotubes is
impaired. To establish whether the mechanical property of dystrophin-deficient (dfd13)
myoblasts is also impaired, I examined the force modulus of dfd13 and non-dystrophic
(C2C12) myoblasts. The force modulus of dfd13 myoblasts (3.99 ± 0.37 kPa) is lower than
C2C12 myoblasts (5.04 ± 0.53 kPa); but this is not significantly different (Figure 6.20 A; p=
6.58×10⁻²). dfd13 myoblasts have a wider range of modulus distribution which is between 1-8
kPa (Figure 6.20 B). The modulus distribution of dfd13 myoblasts falls in between 3-7 kPa
(Figure 6.20 B). Distribution of cell height (thickness of the myoblasts; or the distance from
the attachment to the upmost cell surface) correlates with the distribution of modulus (Figure
6.20 C). The heights of C2C12 myoblasts fall between 0-3 μm and the heights of the majority
of dfd13 myoblasts fall between 2-3 μm. These data suggest that the mechanical properties in
dystrophin-deficient myoblasts have altered.

292
Figure 6.21 Mini-dystrophin increases the force modulus of non-dystrophic myoblasts. 9×10⁴ of myoblasts were plated in 6-cm dishes for 4 days and the force modulus was measured by atomic force microscope (AFM). The experiment was repeated three times with 10 cells each time. Myoblasts transfected with eGFP expression vehicles were used as controls. (A) Minidystrophin (eGFP tagged) increases the force modulus of C2C12 myoblasts. (B) Minidystrophin expressing cells have wider distribution of force modulus. (C) Cell height distribution of myoblasts. The red lines represent means of each cell line. (ANOVA; **<0.01; *compared to controls; n=30).
B
C
A

293
6.2.7.2. Minidystrophin△H2-R19 increases the force modulus of non-dystrophic myoblasts.
In section 6.2.5.2, I established that minidystrophin△H2-R19 increases the force modulus of
dystrophin-deficient myotubes (Figure 6.14). I also established that dystrophin expresses in
C2C12 myoblasts using immunofluorescent labelling (Figure 6.12). To determine the effect of
minidystrophin△H2-R19 on the mechanical properties of myoblasts, I examined the force
modulus of myoblasts overexpressing minidystrophin△H2-R19 (Figure 6.21). The expression
levels of minidystrophin△H2-R19–eGFP are low in C2C12-minidys-eGFP and dfd13-minidys-
eGFP myoblasts. In addition, overexpression of minidystrophin△H2-R19 does not cause
spontaneous differentiation in both C2C12 and dfd13 myoblasts at the cell density examined.
The force modulus of C2C12 myoblasts expressing minidystrophin△H2-R19–eGFP (C2C12-
minidys-eGFP; 4.79 ± 0.56 kPa) increases by 1.7 fold compared to C2C12-eGFP myoblasts
(2.78 ± 0.25 kPa) (Figure 6.21 A; p= 1.41×10⁻³). The force modulus of dystrophin-deficient
myoblasts which over-express minidystrophin△H2-R19–eGFP (dfd13-minidys-eGFP; 4.36 ±
0.43 kPa) is comparable to dfd13-eGFP myoblasts (4.83 ± 0. 34 kPa) (Figure 6.21 A).
C2C12-eGFP myoblasts have a modulus distribution ranging between 1-4 kPa while C2C12-
minidys-eGFP myoblasts exhibited a wider modulus distribution ranging between 1-12 kPa
(Figure 6.21 B). Both dfd13-eGFP and dfd13-minidys-eGFP myoblasts have a modulus
distribution of within the range between 2-6 kPa (Figure 6.21 B). The modulus distribution
shifts downwards from myoblasts to myotubes in C2C12-minidys-eGFP and upwards in

294
dfd13-minidys-eGFP (Figrue 6.14 B and 6.21 B), supporting the role of dystrophin in the
maintenance of mechanical properties in skeletal muscles (Ervasti and Campbell, 1993).
Distribution of cell heights falls within the range of 4-9 μm for C2C12-eGFP myoblasts, 2-8
μm for C2C12-minidys-eGFP myoblasts, 2-7 μm for dfd13-eGFP myoblasts and 2-10 μm for
dfd13-minidys-eGFP myoblasts (Figure 6.21 C). The cell height distribution is in reverse to
the modulus distribution; lower range of modulus distribution in myoblasts is accompanied
with higher range distribution of heights. The altered cell height distribution may suggest that
the cytoskeleton architecture is re-organised in the myobalsts.
6.2.7.3. Fine-tuning of Cav-3 protein levels is required to maintain the mechanical
properties of dystrophin-deficient myoblasts
In section 6.2.5.3, I established that knocking down Cav-3 increases the force modulus of
dystrophin-deficient myotubes (Figure 6.16). To study whether the levels of Cav-3 also affect
the mechanical properties of myoblasts, I examined the force modulus of myoblasts with Cav-
3 overexpression or Cav-3 knockdown (Figure 6.22). The force modulus of C2C12-Cav-
3eGFP myoblasts (5.48 ± 0.43 kPa) is 2 fold that of C2C12-eGFP myoblasts (Figure 6.22 A;
p= 8.74×10⁻⁷). The force modulus of dfd13-Cav3-eGFP myoblasts (2.46 ± 0.20 kPa) is only
half that of dfd13-eGFP myoblasts (Figure 6.22 A; p= 1.19×10⁻⁷).

295
Figure 6.22 Over-expressing Cav-3 impairs the mechanical properties of dystrophin-deficient myoblasts. 9×10⁴ of myoblasts were plated in 6-cm dishes for 4 days. The force modulus was obtained by atomic force microscope (AFM). The experiment was repeated three times with 10 cells analysed each time. (A) Cav-3 overexpression promotes the foce modulus of non-dystrophic (C2C12) myoblasts but compromises that of dystrophin-deficient (dfd13) myoblasts. (B) The modulus distribution shifts upwards from 1-4 kPa in C2C12-eGFP to 3-8 kPa in C2C12-Cav-3eGFP. The modulus distribution shifts downwards from 2-6 in dfd13-eGFP to 0-4 in dfd13-Cav-3eGFP. (C) C2C12-Cav-3eGFP myoblasts have higher cell height compared to C2C12-eGFP myoblasts. The red lines reprent means of each cell lines. (ANOVA; **<0.01; *compared to controls; n=30).

296
A
C
B

297
The modulus distribution shifts upwards from 1-4 kPa in C2C12-eGFP to 3-11 kPa in C2C12-
Cav-3-eGFP myoblasts (Figure 6.22 B). For dystrophin-deficient myoblasts, the modulus
distribution shifts downwards from 2-6 kPa in dfd13-eGFP myoblats to 0-4 kPa in dfd13-Cav-
3-eGPF myoblasts (Figure 6.22 B).The distribution of cell heights shifts from 4-9 μm in
C2C12-eGFP myoblasts to 3-7 μm in C2C12-Cav-3-eGFP myoblasts (Figure 6.22 C). The
cell height distribution is between 3-5 μm in dfd13-eGFP myoblasts and between 2-7 μm in
dfd13-Cav-3-eGFP myoblasts (Figure 6.22 C). These data suggest that Cav-3 improves the
force modulus of non-dystrophic myoblasts while impairs that of dystrophin-deficient
myoblasts where there is significantly elevated levels of Cav-3 (Figure 3.15).
To further determine the effect of Cav-3 on the mechanical properties of myoblasts, I
examined the effect of knocking down Cav-3 on the force modulus in myoblasts (Figure 6.23).
The force modulus of C2C12-Cav3KD myoblasts (1.73 ± 0.09 kPa) is only half that of
C2C12-dsgfpsh myoblasts (3.44 ± 0.14 kPa) (Figure 6.23 A; p= 1.74×10⁻¹²). The force
modulus of dfd13-Cav-3KD myoblasts (2.02 ± 0.11 kPa) is reduced by 50% compared to
dfd13-dsgfpsh myoblasts (3.95 ± 0.33 kPa) (Figure 6.23 A; p= 5.45×10⁻⁷). The modulus
distribution shifts downwards from 1-5 kPa in C2C12-dsgfpsh myoblasts to 1-2 kPa in
C2C121-Cav-3KD myoblasts (Figure 6.23 B). For dystrophin-deficient myoblasts, the
modulus distribution shifts downwards from 1-5 kPa in dfd13-dsgfpsh myoblasts to 1-3 kPa
in dfd13-Cav3KD myoblasts (Figure 6.23 B).

298
Figure 6.23 Down-regulating Cav-3 reduces the force modulus of myoblasts. 9×10⁴ of myoblasts were plated in 6-cm dishes for 4 days. Force modulus was acquired with atomic force microscope (AFM). The experiment was repeated three times with 10 cells analysed each time. (A) Down-regulation of Cav-3 reduces the stiffness of both non-dystrophic and dystrophin-deficient myoblasts. (B) The force modulus shifts to lower range in Cav-3 knockdown myoblasts. (C) The distribution of cell heights in myoblasts with Cav-3 down-regulation. The red lines represent means of each cell line. (ANOVA; **<0.01; *compared to controls; n=30).

299
A
B
C

300
The distributions of cell heights for C2C12-dsgfpsh and C2C12-Cav3KD myoblasts are
similar, ranging from 3-7 μm (Figure 6.23 C). Similarly, the distribution of cell heights in
dfd13-dsgfpsh myoblasts is comparable to dfd13-Cav3KD myoblasts, ranging from 2-8 μm
(Figure 6.23 C). These suggest that down-regulation of Cav-3 in myoblasts reduces the force
modulus of both dystrophin-deficient and non-dystrophic myoblasts. Both overexpression and
down-regulation of Cav-3 reduce the force modulus of dystrophin-deficient myoblasts (Figure
6.22 and 6.23 A), suggesting that a fine-tuning of Cav-3 levels in dystrophin-deficient
myoblasts is required for the maintenance of mechanical properties in these myoblasts.
6.2.7.4. Cav-1 is important for the maintenance of mechanical property of dystrophin-
deficient myoblasts
In section 6.2.5.4, I established that Cav-1 is important for the maintenance of force modulus
in dystrophin-deficient myotubes (Figure 6.17 and 6.18). I have shown in chapter 3 that there
are elevated levels of Cav-1 in dystrophin-deficient myoblasts (Figure 3.14). To determine the
function of Cav-1 in dystrophin-deficient myoblasts, I examined the effect of Cav-1
overexpression on the force modulus of non-dystrophic (C2C12) and dystrophin-deficient
(dfd13) myoblasts (Figure 6.24).

301
Figure 6.24 Over-expression of Cav-1 exerts no effects on mechanical properties of myoblasts. 9×10⁴ of myoblasts were plated in 6-cm dishes for 4 days. Force modulus was acquired with atomic force microscope (AFM). The experiment was repeated three times with 10 cells analysed each time. (A) Cav-1 over-expression has no effects on the force modulus of myoblasts. (B) More dystrophin-deficient myoblasts have higher force modulus compared to non-dystrophic myoblast. (C) Non-dystrophic myoblasts have wider distribution of cell heights compared to the dystrophin-deficient myoblasts. The red lines represent means of each cell line. (ANOVA; n=30).

302
C
B
A

303
The stiffness of either C2C12-Cav1-eGFP or dfd13-Cav1-eGFP myoblasts is not affected by
the elevated levels of Cav-1 in these myoblasts (Figure 6.24 A). The force modulus for
C2C12-Cav1-eGFP and dfd13-Cav1-eGFP myoblasts is 3.03 ± 0.35 kPa and 4.82 ± 0.49 kPa
respectively (Figure 6.24 A). The modulus distribution for C2C12-eGFP and C2C12-Cav1-
eGFP myoblasts is within the range of 1-4 kPa (Figure 6.24 B). The modulus distribution of
dfd13-Cav-1-eGFP and dfd13-eGFP myoblasts falls within 2-6 kPa (Figure 6.24 B). The cell
height distribution is within 2-10 μm for C2C12-Cav-1-eGFP and 2-5 μm for dfd13-Cav1-
eGFP myoblasts (Figure 6.24 C).
I then examined the effect of Cav-1 knockdown on force modulus of myoblasts (Figure 6.25).
The force modulus of C2C12-Cav1KD myoblasts (3.91 ± 0.36 kPa) is not significantly
different from that of C2C12-dsgfpsh myoblasts (Figure 6.25 A). The force modulus of dfd13-
Cav1KD (3.05 ± 0.26 kPa) is reduced by 23% compared to dfd13-dsgfpsh myoblasts (Figure
6.25 A; p= 3.56×10⁻²). The force modulus of C2C12-Cav1KD myoblasts falls within 1-8 kPa
while that of dfd13-Cav1KD myoblasts falls within 0-4 kPa (Figure 6.25 B). The cell height
distribution falls within 3-12 μm in C2C12-Cav1KD myoblasts and within 2-9 μm in dfd13-
Cav1KD myoblasts (Figure 6.25 C). These data suggest that the elevated levels of Cav-1
found in dystrophin-deficient myoblasts (Figure 3.14) are important for the maintenance of
force modulus in these myoblasts.

304
Figure 6.25 Down-regulating Cav-1 reduces the stiffness of dystrophin-deficient myoblasts. 9×10⁴ of myoblasts were plated in 6-cm dishes for 4 days to examine the force modulus with an atomic force microscope (AFM). The experiment was repeated three times with 10 cells analysed each time. (A) Cav-1 knockdown reduces the stiffness of dystrophin-deficient myoblasts but increases that of non-dystrophic myoblasts. (B) C2C12-Cav1KD myoblasts have more cells with higher stiffness compared to dfd13-Cav-1KD myoblasts. (C) Non-dystrophic myoblasts are thicker than the dystrophin-deficient myoblasts. The red lines represent means of cell lines (ANOVA; *<0.05; *compared with controls; n=30).

305
B
A
C

306
Figure 6.26 Down-regulation of IGF-2 reduces the force modulus of myoblasts. 9×10⁴ of myoblasts (C2MG-RNAi-gfp, C2MG-RNAi-igf2, C2MIG-RNAi-gfp or C2MIG-RNAi-igf2) were plated in 6-cm dishes in GM (DMEM+10%FCS) for 4 days. Force modulus of myoblasts was acquired with atomic force microscope (AFM). 10 cells were analysed and the experiment was repeated three times. (A) Stiffness of myoblasts reduces with IGF-2 down-regulation. (B) IGF-2 down-regulated myoblasts have smaller force modulus. (C) IGF-2 down-regulated myoblasts are thicker compared to controls. The red lines represent means of each cell line. MIG: IGF-2 expression vehicle driven by muscle creatine kinase promoter; MG: control expression vehicle without IGF-2 gene; RNAi-igf2: short hairpin RNA expression vehicle targeting IGF-2; RNAi-gfp: control short hairpin RNA expression vehicle targeting GFP. (ANOVA; **<0.01; *compared to gfpRNAi controls; n=30 for force modulus; n≧24 for cell height).

307
A
C
B

308
6.2.8. Modulating IGF-2 in myoblasts affects their mechanical properties
In section 5.2.5, I established that IGF-2 suppresses Cav-1 but promotes Cav-3 expression in
myoblasts (Figure 5.9 A, E, F and G). I also established that there were elevated levels of
IGF-2 in dystrophin-deficient myoblasts and E17.5 mdx embryos (Figure 3.16 and 5.1). In
addition, I established that Cav-1 and Cav-3 levels are important for the maintenance of force
modulus in dystrophin-deficient myoblasts (section 6.2.7.3 and 6.2.7.4; Figure 6.22-6.25). To
determine whether IGF-2 manipulation affects the mechanical properties of myoblasts, I
examined the force modulus of myoblasts which overexpress or down-regulate IGF-2 (Figure
6.26).
C2C12 myoblasts stably transfected with IGF-2 expression vehicle (C2MIG-gfpRNAi
myoblasts) have higher levels of prepro-IGF-2 (64kDa) and active IGF-2 (17kDa) compared
to the control cell line (C2MG-gfpRNAi) (Figure 5.9). The force modulus of C2MIG-
gfpRNAi myoblasts decreases by 45% (4245.82 ± 531.87 kPa) compared to the C2MG-
gfpRNAi myoblasts (9421.36 ± 580.10 kPa) (Figure 6.26 A; p= 9.76×10⁻⁹). C2MG (C2MG-
RNAi-igf2) and C2MIG (C2MIG-RNAi-igf2) myoblasts with IGF-2 knockdown have
reduced force modulus compared to their respective controls (C2MG-RNAi-gfp and C2MIG-
RNAi-gfp) (Figure 6.26 A). The force modulus of C2MG-RNAi-igf2 myoblasts (1774.86 ±
143.57 kPa) decreases by 82% compared to C2MG-RNAi-gfp myoblasts (Figure 6.26 A; p=
7.49×10⁻¹⁹). Similarly, the force modulus of C2MIG-RNAi-igf2 myoblasts (2217.83 ± 198.61

309
kPa) decreases by 48% compared to C2MIG-RNAi-gfp myoblasts (Figure 6.26 A; p=
5.95×10⁻⁴). The distribution of force modulus shifts from 6-14 kPa in C2MG-RNAi-gfp
myoblasts to 1-3 kPa in C2MG-RNAi-igf2 myoblasts (Figure 6.26 B); it also shifts from 0-7
kPa in C2MIG-RNAi-gfp myoblasts to 0-3 kPa in C2MIG-RNAi-igf2 myoblasts (Figure 6.26
B). C2MG-RNAi-gfp myoblasts have thickness within 2-3 μm while C2MG-RNAi-igf2
myoblasts have thickness within 3-12 μm (Figure 6.26 C). The distribution of cell thickness
falls within 2-7 μm for C2MIG-RNAi-gfp myoblasts and within 3-15 μm for C2MIG-RNAi-
igf2 myoblasts (Figure 6.26 C). Shifts of the cell thickness suggest remodelling of the
cytoskeleton within these myoblasts. These data suggest that IGF-2 may play a role on
regulating the mechanical response of myoblasts.
6.3. Discussion:
6.3.1. Perturbed localisation of Cav-1 and Cav-3 relative to calsequestrin in dystrophin-
deficient myotubes may contribute to impaired development of T-tubules
It has been reported that Cav-3 associates with developing T-tubule in the skeletal muscles
and T-tubules are disorganised in the skeletal muscles of cav-3-/- mice (Galbiati et al., 2001a;
Parton et al., 1997). In section 6.2.1, I established that Cav-3 and Cav-1 localise to the
subsarcolemma of embryonic skeletal muscles and staining appears to be punctate
corresponding to the triads of skeletal muscles (Figure 6.2 and 6.3). Such a distribution

310
suggests that Cav-1 and Cav-3 may localise in areas such as T-tubules. The perturbed
localisation of Cav-1 and Cav-3 in mdx embryonic skeletal muscles suggest that there may be
impairment of T-tubules in mdx. I further established the association among Cav-1, Cav-3 and
T-tubule in the myotubes derived from non-dystrophic (C2C12) and dystrophin-deficient
(PD50A) myoblasts in that the relative localisation of Cav-1 and Cav-3 to T-tubules is
perturbed in dystrophin-deficient myotubes (section 6.2.2; Figure 6.4). Calsequestrin is in the
lumen of sarcoplasmic reticulum and associates with the ryanodine receptor at triads
(Franzini-Armstrong et al., 1987). Colocalisation of Cav-1 with calsequestrin in the in vitro
generated C2C12 myotubes suggests that Cav-1 and Cav-3 play different roles during T-
tubule development. This localisation is consistent with a previous report that Cav-3 but not
Cav-1 associates with T-tubules in differentiating mouse skeletal muscles (Parton et al., 1997).
In addition, perturbed localisation of Cav-1 and Cav-3 relative to calsequestrin in the in vitro
dystrophin-deficient myotubes (Figure 6.4) suggests that formation of T-tubules is perturbed
in dystrophin-deficiency. These data also suggest that the clonally derived dystrophin-
deficient myobast line (PD50A) is a good model for mdx/DMD.
6.3.2. Cav-1 and Cav-3 associate with β-dystroglycan and actin filaments- a role for
mechanical response
Dystrophin interacts with β-dystroglycan of the dystrophin-glycoprotein complex (DGC)

311
through the WW-like domain (Jung et al., 1995). It has been reported that Cav-1 associate
with β-dystroglycan in 293T cells which overexpress both proteins; using GST-pull down
assay (Sotgia et al., 2000). It has also been reported that Cav-1 associates with β-dystroglycan
in smooth muscles using immunoprecipitation (Sharma et al., 2010). In section 6.2.3, I pulled
down Cav-1, Cav-3 and β-dystroglycan in the wt and mdx skeletal muscles, suggesting that
these proteins may interact with each other (Figure 6.5). I established an interaction between
Cav-1 and β-dystroglycan in the skeletal muscle tissues of Cav-3 null mice (Figure 6.5). I also
established that both Cav-1 and Cav-3 colocalise with β-dystroglycan in dystrophin-deficient
myoblasts (Figure 6.6). In addition, I identified that both Cav-1 and Cav-3 have conserved
WW-like domains through which they could interact with β-dystroglycan (Figure 6.9). These
data suggest that both Cav-1 and Cav-3 can associate with β-dystroglycan in skeletal muscles
and that elevated levels of Cav-1 and Cav-3 in dystrophin-deficient myoblasts/myotubes may
in part compensate for the lack of dystrophin.
Dystrophin in skeletal muscles is considered to support cells against the mechanical stress and
to mediate signal transduction (Ervasti and Campbell, 1993; Glass, 2005; Pasternak et al.,
1995). In addition to dystrophin, reassembly of caveolins (both Cav-1 and Cav-3) also
contributes to the response to stretching and osmosis pressure of cells (Gervasio et al., 2011;
Sinha et al., 2011). Remodelling of actin filaments and microtubule has also been reported to
mediate the cortical stiffness change of muscle cells and fibres (Collinsworth et al., 2002;

312
Hofmann et al., 1997; Khairallah et al., 2012). In this chapter, I observed that organisation of
actin filaments and microtubules is impaired in dystrophin-deficient myotubes (Figure 6.8 and
6.10). I also found a correlation of impaired cytoskeleton architecture and impaired stiffness
in dystrophin-deficient myoblasts and myotubes (Figure 6.14 and 6.20). I predicted that there
is an actin binding domain adjacent to the scaffolding domain of Cav-1 and Cav-3, which is
supported by the colocalisation of Cav-1 and Cav-3 with actin filaments in myoblasts and
myotubes (Figure 6.7, 6.8 and 6.9). These data suggest that Cav-1, Cav-3 and actin filaments
may play a role in regulating the mechanical properties of skeletal muscles. Over-expression
of Cav-3 in mouse disrupts the DGC in the skeletal muscles of this mouse (Galbiati et al.,
2000). In addition, although knocking down Cav-3 in mouse does not alter the expression
level and sarcolemmal localisation of DGC components, the localisation of the DGC within
the cholesterol-sphingolipid raft is compromised (Galbiati et al., 2001a). The current data
suggest that fine-tune regulation of Cav-1 and Cav-3 levels is necessary to maintain the
proper localisation and function of DGC.
6.3.3. Cav-1 and Cav-3 are important for maintenance of the mechanical properties in
dystrophin-deficient myotubes and myoblasts
It has been reported that overexpressing Cav-3 in mouse results in the disruption of DGC in
skeletal muscles (Galbiati et al., 2000). In section 6.2.5.3, I established that overexpression of

313
Cav-3 increases the stiffness of both wt (C2C12) and dystrophin-deficient (dfd13) myotubes
(Figure 6.15). I also demonstrated that down-regulation of Cav-3 increases the stiffness of
both non-dystrophic and dystrophin-deficient myotubes (Figure 6.16). This suggests that Cav-
3 is important for the maintenance of force modulus in both C2C12 and dfd13 myotubes.
Overexpression of Cav-1 decreases the stiffness of C2C12 myotubes while down-regulation
of Cav-1 increases that of C2C12 myotubes (Figure 6.17 and 6.18). Conversely, Cav-1
overexpression increases the stiffness of dfd13 myotubes while Cav-1 down-regulation
decreases that of dfd13 myotubes (Figure 6.17 and 6.18). These data suggest that Cav-1 is
important for dystrophin-deficient but not non-dystrophic myotubes to maintain their
mechanical properties. Together these data suggest that a fine-tune regulation of Cav-1 and
Cav-3 levels (and perhaps the ratio between Cav-1 and Cav-3) is required to maintain
myotube function.
In section 6.2.7.3, I established that down-regulation of Cav-3 impairs the stiffness of C2C12
myoblasts while overexpression of Cav-3 promotes that of C2C12 myoblasts (Figure 6.22 and
6.23). I also established that both down-regulation and overexpression of Cav-3 impair the
stiffness of dfd13 myoblasts (Figure 6.22 and 6.23). These data suggest that elevated levels of
Cav-3 in dystrophin-deficient myoblasts may contribute to the mechanical response but
impair the differentiation of these myoblasts. Although overexpression of Cav-1 has no effects
on the stiffness of C2C12 and dfd13 myoblasts, down-regulation of Cav-1 reduces that of

314
dfd13 myoblasts, suggesting a contribution of the elevated Cav-1 in dystrophin-deficient
myoblasts to the response of mechanical stress (Figure 6.24 and 6.25).
6.3.4. Cav-3 correlates with the fast myosin heavy chain (FMyHC) expression in muscles
In 10-12 weeks old rats after exercise, myosin heavy chain (MyHC) composition changes in
gastrocnemius muscles such that there are increased expressions of MyHCIIx (fast myosin) in
male and MyHCIIa (fast myosin) in female (Park et al., 2012). Along with the elevated levels
of fast MyHC isoforms, expression of Cav-3 gene also increases (Park et al., 2012). This
suggests that levels of Cav-3 may influence the levels of fast MyHC (FMyHC) isoforms. In
mdx mouse embryos, there is substantial excess expression of FMyHC from E15.5 to E17.5
(Merrick et al., 2009). In chapter 4 and our previous report, we showed that there were
elevated levels of Cav-3 in E17.5 mdx embryos (Merrick et al., 2009; Figure 4.1). In section
6.2.6, I further established that there is correlation between Cav-3 and FMyHC proteins in
intercostal muscles of E15.5 mdx embryos; there are more Cav-3(+)/My32(+) (FMyHC)
muscle fibres in embryonic intercostal muscles of E15.5 mdx compared to E15.5 wt embryos
(Figure 6.19). Conversely, there are more Cav-1(+)/My32(+) muscle fibres in the intercostal
muscles of E15.5 wt embryos compared to E15.5 mdx embryos (Figure 6.19). These data
suggest that modulating Cav-1 and Cav-3 expression has an influence on the mechanical
properties of skeletal muscles.

315
6.3.5. Down-regulation and overexpression of IGF-2 impair the mechanical properties of
myoblasts
It has been reported that IGF-2 mediates the transition of myosin heavy chain from slow to
fast types (Merrick et al., 2007). It has also been reported that Cav-3 expression correlates
with FMyHC expression in skeletal muscles after exercise (Park et al., 2012). In chapter 5 and
our unpublished data (Sarbjit Nijjar and Dr. Janet Smith), I established that there was elevated
IGF-2 expression in mdx (Figure 5.1). I also established that IGF-2 increases levels of Cav-3
but reduces levels of Cav-1 in myoblasts (Figure 5.9), suggesting that IGF-2 levels may
modulate signal transduction mediated by Cav-1 and Cav-3. In section 6.2.6, I established that
expression of Cav-3 in embryonic muscle fibres correlates with the expression of FMyHC
(Figure 6.19). It is likely that reduction of force modulus in IGF-2 manipulated myoblasts
observed in section 6.2.8 (Figure 6.26) is partly mediated by the effects of IGF-2 on the
expression of Cav-1, Cav-3 and MyHC. These data suggest that signal induction changes and
mechanical force changes are interrelated.

316
Chapter 7. Conclusion and future perspectives
7.1. Conclusions
Dystrophin has been demonstrated to play roles in both signal transduction (Lapidos et al.,
2004) and force transmission between extracellular matrix and intracellular actin filaments to
mediate mechanical response of muscle/myotube (Ervasti and Campbell, 1993). However,
these two proposed functions for dystrophin have not previously been mechanistically linked.
I establish that there are elevated levels of Cav-1 and Cav-3 in both dystrophin-deficient
myoblasts (Figure 3.15) and mdx mouse embryos (Figure 4.1; Merrick et al., 2009) which had
not previously been reported. The elevated levels of Cav-1 and Cav-3 may compensate for the
role of dystrophin in modulating mechanical stress and signal transduction in dystrophin-
deficient myoblasts (refer to section 7.1.2). Previous reports have shown that the force output
(measured by stretching the muscle fibres) of mdx skeletal muscle fibres is compromised
(Chan et al., 2007; Lynch et al., 2001). Using AFM, I demonstrate that the force modulus is
impaired in both dystrophin-deficient myoblasts and myotubes (Figure 6.14 and 6.20). In
addition, I demonstrate that modifying the levels of Cav-1 and Cav-3 affects the force
modulus of dystrophin-deficient myotubes (Figure 6.15-6.18) and myoblasts (Figure 6.22-
6.25). I also demonstrate that modulating Cav-1 and Cav-3 levels in both dystrophin-deficient
and nondystrophic myoblasts affects the levels of Pax7 (Figure 5.12). These data support the
roles of dystrophin in mechanical response and signalling transduction (Ervasti and Campbell,

317
1993; Glass, 2005) but also suggest that part of its roles in signalling and mechanical response
may be compensated by elevated levels of Cav-1 and Cav-3 in dystrophin-deficient myoblasts
and myotubes.
Cav-1 expresses in the kidney, gut, lung and smooth and skeletal muscles in E14.5-15.5
mouse embryos (Kogo et al., 2004; Ramirez et al., 2002). I further demonstrate that Cav-1
expresses in the hearts of mouse embryos at as early as E11.5 (Figure 4.5), suggesting Cav-1
may play a role in heart development. Localisation of Cav-1 and Cav-3 to the atrial and
ventricle trabeculae (Figure 4.2, 4.6 and 4.8) suggests that both caveolins may contribute to
the progression of cardiomyopathy in mdx (Merrick et al., 2009). Immunohistochemical
staining (Figure 4.3) and immunoblotting (Figure 4.1) of E17.5 mouse embryonic samples
suggest that the levels of Cav-1 are positively regulated by Cav-3. In addition,
immunoprecipitation using adult skeletal muscles (Figure 5.2) and immunofluorescent
labelling of myoblasts/myotubes (Figure 5.3) demonstrate that Cav-1 and Cav-3 can form
hetero-oligomers in skeletal muscles.
I demonstrate that the clonally derived dystrophin-deficient (PD50A) myoblast cell line has
attenuated levels of Pax7 (Figure 3.10), elevated levels of Cav-1 and Cav-3 (Figure 3.15) as
well as perturbed IGF-2/p57kip2 and mTOR signalling pathways (Figure 3.16 and 3.17); all of
which are also found in mdx mouse embryos (Figure 4.1 and 5.1). In addition, I demonstrate
that differentiation capacity of this cell line is impaired (Figure 3.2). I also demonstrate that
318
the force modulus of the dystrophin-deficient myoblasts/myotubes is impaired compared to
the nondystrophic control (Figure 6.14 and 6.20) which may help explain the force deficit of
mdx skeletal muscle fibres (Chan et al., 2007; Lynch et al., 2001). These data suggest the
dystrophin-deficient PD50A cell line is a useful in vitro model for the study of DMD.
Although the cell lines used in this thesis are muscle stem cells with self-renewal ability, I
found that the differentiation capacity of both wt and dystrophin-deficient myoblasts is
affected by passage number. Therefore, it will be helpful to isolate primary muscle stem cells
for future experiment. In addition, as muscle regeneration may also be influenced by the
signals from the micro-environment of regenerating site, using cell culture system could not
reconstitute the micro-environment. In vivo analysis will be necessary to investigate whether
the results from cell culture system are also discovered in animal models.
7.1.1. A novel protocol for differentiation of dystrophin-deficient myoblasts by myoblast-
osteoblast coculture
It has been reported that there was fusion impairment in primary myoblasts isolated from
DMD patients (Delaporte et al., 1984). In chapter 3, I demonstrate that both the number of
myotubes and the number of myonuclei decrease in the dystrophin-deficient PD50A cell line
(Figure 3.2). I report a novel protocol to effectively differentiate the clonally derived
dystrophin-deficient PD50A myoblasts (Refer to section 3.2.2). This coculture protocol is

319
performed in the presence of 10% FCS which can partly mimic the physiological situations
myoblasts encounter during regeneration. To mimic more closely the physiological situations,
the cells must be cultured under reduced oxygen. Based upon previous literature and my data
in the present study, I propose a possible mechanism of how osteoblast-secreted factors
promote the myoblast differentiation (Figure 7.1):
Figure 7.1 Potential mechanism of how osteoblasts promote myogenesis (A) Osteoblasts produce IGFs to promote the differentiation of myoblasts. (B) IGF-2 secreted from osteoblasts induces a feedforward signalling in the recipient myoblasts through mTOR pathway to produce more IGF-2.
It has been shown that primary osteoblasts secrete IGF-1 and IGF-2 in culture (McCarthy et
al., 1992). The secreted IGF-1 and IGF-2 induce both nondystrophic and dystrophin-deficient
A
B

320
myoblasts in coculture to undergo myogenesis (Figure 7.1 A). When myoblasts receive
stimulation of IGFs from osteoblasts, especially IGF-2, this IGF-2 signalling is relayed via the
mTOR signalling pathway; this leads to the production of more IGF-2 from the myoblasts
forming a feedforward loop (Figure 7.1 B). The IGF-2/mTOR signalling is up-regulated in
differentiating myoblasts (both C2C12 and PD50A) treated with OCM (Figure 3.16 and 3.17).
In addition, the differentiation capacity of dystrophin-deficient myoblasts is higher in
coculture compared to osteoblast-conditioned medium treatment (Figure 3.3 and 3.4). These
data suggest that dystrophin may play a role in regulating IGF-2 signalling and that cell-cell
contact is important for differentiation of dystrophin-deficient myoblasts.
7.1.2. Dual roles of caveolin-1 and caveolin-3 in muscular dystrophy
The relationship among Cav-3, Cav-1 and dystrophin is complex; my data presented here
suggest that the elevated protein levels of Cav-1 and Cav-3 observed in mdx and in
dystrophin-deficient myoblasts (Figure 3.15 and 4.1) do not simply compensate or
compromise dystrophin deficiency. Instead, elevated levels of Cav-1 and Cav-3 may
compensate dystrophin-deficiency in terms of mechanical properties of myotubes but
compromise differentiation of dystrophin-deficient myoblasts. In addition, the amounts of
IGF-2, Src and pSrc pulled down along with Cav-1 are greater in adult mdx skeletal muscles
compared to nondystrophic controls (Figure 5.6 and 5.7). These data further support the role

321
of dystrophin in signalling transduction and in mechanical response. Based upon our data in
the present study and previous literature, I propose a negative correlation between Cav-1/Cav-
3 and Pax7 in skeletal muscles (Figure 7.2).
Figure 7.2 Schematical illustration of potential roles of Cav-1, Cav-3 and Pax7 in the absence of dystrophin.
In wt muscles, the DGC associates with caveolae consisting of Cav-3 and Cav-1 proteins
(Sharma et al., 2010; Sotgia et al., 2000; Figure 6.5) which may help to recruit signalling
molecules (such as IGF-2, Src and pSrc) to the DGC (Figure 5.6-5.8). In mdx muscles,
dystrophin deficiency causes an elevation of both Cav-3 (Merrick et al., 2009; Vaghy et al.,
1998; Figure 3.15 and 4.1) and Cav-1 (Figure 3.15 and 4.1) protein levels to compensate for
part of the structural and signalling functions dystrophin plays in muscles by recruiting
signalling molecules such as IGF-2, Src and pSrc (Figure 5.6 and 5.7) and by regulating
cytoskeleton organisation (refer to section 7.1.3). In this dystrophin-deficient context, Cav-1
and Cav-3 are likely to play dual roles (Figure 7.2). On one hand, the elevated levels of Cav-1

322
and Cav-3 in mdx inhibit myoblast differentiation and induce cycles of regeneration and
hyperproliferation, which contribute to the dystrophic pathology of mdx (Merrick et al., 2009;
Niebrqj-Dobosz et al., 1997; Tanabe et al., 1986). This could be attributed to the inhibitory
roles of Cav-1 and Cav-3 for signalling molecules such as Src since the kinase activity of Src
is inhibited by binding to Cav-1 (Li et al., 1996a).
In addition, I have demonstrated that attenuated Pax7 protein levels cause elevated levels of
Cav-3 in dystrophin-deficient myoblasts which then inhibit the expression of Pax7 (Figure
5.11 and 5.12). This may lead to the development of pathology observed in mdx embryos,
such as reduced number of Pax7(+) cells and increase apoptosis of myoblasts since Pax7 has
been shown to suppress myoblast apoptosis (Merrick et al., 2009; Relaix et al., 2006). On the
other hand, increased levels of Cav-1 and Cav-3 in dystrophin deficiency may compensate for
the poor response to mechanical stress of dystrophin-deficient myoblats and myotubes (Figure
7.2). It is clear from these data that fine-tuning the levels of Cav-1 and Cav-3 is essential for
normal functioning of both myoblasts and myotubes since both overexpression and down-
regulation of Cav-1 or Cav-3 impair the mechanical properties of dystrophin-deficient
myotubes (Figure 6.15-6.18) as well as their signal transduction (and cell cycle) response
(Figure 5.1).

323
7.1.3. Perturbed localisation of Cav-1, Cav-3 proteins is related to the impaired organisation
of actin filaments and microtubules in dystrophin-deficient myoblasts
It has been reported that dynamic remodelling of actin filaments and microtubules is
responsible for the directional migration of cells such as fibroblasts and astrocytes
(Manneville et al., 2010; Watanabe et al., 2004). In fibroblasts, this regulation requires the
activity of Rho family GTPases, Cdc-42 and Rac1, which through the effector IQGAP1
recruits APC (adenomatous polyposis coli) to microtubule plus end, forming a network with
the cortical actin filaments (Watanabe et al., 2004). In myoblasts, elongation and fusion
during differentiation require the microtubule binding protein EB-3 to regulate microtubule
dynamics (Manneville et al., 2007). In the present study, I established that the localisation of
Cav-1 and Cav-3 to cytoskeleton (actin filaments and microtubules) is perturbed in
dystrophin-deficient myoblasts and myotubes (Figure 6.7, 6.8 and 6.10). I also established
that actin filaments and microtubules in dystrophin-deficient myoblasts and myotubes are
disorganised (Figure 6.7, 6.8 and 6.10), suggesting dystrophin is required for proper
organisation of microtubule and actin filaments in both myoblasts and myotubes. These data
thus also, indirectly, suggest that loss of dystrophin may have a direct impact on the
differentiation process (refer to section 7.1.2). The perturbed organisation of cytoskeleton
architecture in dystrophin-deficient myotubes is also consistent with previous reports showing
the presence of disorganised actin filaments and microtubules in mdx skeletal muscle fibres in
324
vivo (Prins et al., 2009; Rybakova et al., 2000).
It has been reported that metastasis of malignant glioma is mediated by activated Src
(phosphorylated Src or pSrc) which modulates actin dynamics (Angers-Loustau et al., 2004).
pSrc-mediated arrangement of the actin cytoskeleton has also been reported to regulate the
cell migration induced by growth factor, such as epithelial growth factor (EGF) (Chang et al.,
1995; Destaing et al., 2008). The activity of Src is inhibited by binding to Cav-1 (Grande-
Garcia et al., 2007). Activated Src regulates the cytoskeleton in dynamics by increasing the
activity of Rho GTPase and inhibiting the activity of Rac and Cdc42 (Grande-Garcia et al.,
2007). In chapter 5, I found elevated levels of Cav-1 protein in adult dystrophin-deficient
(mdx) skeletal muscles (2.3 fold increase in 4-week and 1.6 fold increase in 9-week mdx)
(Figure 5.2). I also established increased association of pSrc and Src with Cav-1 in
dystrophin-deficient skeletal muscles and myoblasts (Figure 5.7 and 5.8). These data suggest
alteration of the signalling pathway involving Src and Cav-1; the Src signalling may be
suppressed by elevated levels of Cav-1 in dystrophin-deficient myoblasts. These may help to
explain the disorganised actin filaments in dystrophin-deficient myoblasts (Figrue 6.7). These
data also suggest that migration of dystrophin-deficient myoblasts may be affected. As
migration of myoblasts to the injured site is required for muscle regeneration, cell migration
analysis on dystrophin-deficient compared to non-dystrophic myoblasts will further provide
information on how muscle regeneration is affected by dystrophin-deficiency.

325
7.2. Future work
I demonstrate that a clonally derived dystrophin-deficient PD50A myoblast cell line is a
useful in vitro model to study the pathology and therapy of DMD. Transcription activator-like
effector nucleases (TALENs) can be used to specifically remove the mutation sites on
dystrophin (Ousterout et al., 2013) which can then be corrected by nonhomologus end-joining
or homologous recombination directed by exogenous DNA fragments. The PD50A cell line is
a useful model for this therapy as they have lacZ reporter and have been demonstrated to be
able to integrate into the skeletal muscle of mdx mouse (Smith and Schofield, 1997).
An unexpected and also a key finding in sections 3.2.7 and 4.2.1 (Figure 3.14 and 4.1) was an
increase of both Cav-1α and β in dystrophin-deficient myoblasts and mdx mouse embryos.
Since Cav-1α activity depends on phosphorylation of tyrosine 14 by Src and since the
majority of Cav-1 data in the present report is total Cav-1, it will be useful to introduce Cav-
1α with mutations at tyrosine 14 into myoblasts because Cav-1β lacks the first 31 amino acids
(includes Y14) that are present in Cav-1α (Scherer et al., 1995). Further investigation of
differentiation capacity, the mechanical properties and the apoptosis of myoblasts with
mutated Cav-1 proteins will give better understanding of the role of Cav-1α in myoblasts. To
this end I have isolated stable myoblast transfectants (both non-dystrophic and dystrophin-
deficient) which respectively, overexpress or down-regulate Cav-1 (section 5.2.7). Analysis
and characterisation of their properties, including correlations between Cav-3 and Pax7, will

326
help understand in more detail the role of elevated Cav-1 in dystrophin-deficient myoblasts
and myotubes.
A novel function of Cav-1 as a secreted factor has been reported in patients with prostate
cancer and analysed with prostate cancer cell line (Tahir et al., 2001). The secretory role of
Cav-1 was first suggested in pancreatic exocrine cells from which Cav-1 is secreted in a
complex with lipid (Liu et al., 1999). When secreted from the prostate cancer cells, Cav-1 acts
as a paracrine factor that promotes survival of cancer cells and contributes to metastasis of
prostate cancer cells (Tahir et al., 2001; Tahir et al., 2008; Watanabe et al., 2009). It has also
been reported that in skeletal muscles Cav-1 is not restricted to the sarcolemma; instead Cav-1
is also found in the cytoplasm (Li et al., 2001). In the present study, I demonstrate that there
are elevated levels of Cav-1 protein in dystrophin-deficient myoblasts and embryos (Figure
3.15 and 4.1) and cytosolic localisation of Cav-1 and Cav-3 in dystrophin-deficient myoblasts
and myotubes (Figure 5.3). Investigating whether Cav-1 could be secreted in mdx skeletal
muscle and the role of the secreted Cav-1 (e.g. effect on the survival and migration of
myoblasts) will be beneficial to the understanding of mdx pathogenesis.
Somatic cell reprogramming makes it possible to generate patient-specific stem cells which
may be useful for therapeutic application. To obtain myogenic lineages from iPS cells and
isolate cells which can be utilized in stem cell transplantation for muscular dystrophy, I
generated mouse iPS cells expressing a pluripotent reporter (Oct-4) (section 2.1.4, Figure 2.1;

327
section 2.5.2, Figure 2.4). Future work with this iPS cell line could include the forced
commitment of these iPS cells to a muscle stem cell lineage by introducing Pax7 expression
plasmid (the mCherry construct generated in this thesis work). By doing so the effect of Pax7
over-expression will also be examined and this will add to the understanding of whether Pax7
is a critical transcription factor for myogenic lineage determination. These iPS cells could be
used to generate Pax7(+) cells which could be used as a source for therapeutic transplantation.

328
Reference Aboumousa, A., Hoogendijk, J., Charlton, R., Barresi, R., Herrmann, R., Voit, T., Hudson, J.,
Roberts, M., Hilton-Jones, D., Eagle, M., Bushby, K. and Straub, V. (2008) Caveolinopathy--new mutations and additional symptoms. Neuromuscul Disord, 18, 572-578.
Adi, S., Bin-Abbas, B., Wu, N.Y. and Rosenthal, S.M. (2002) Early stimulation and late inhibition of extracellular signal-regulated kinase 1/2 phosphorylation by IGF-I: a potential mechanism mediating the switch in IGF-I action on skeletal muscle cell differentiation. Endocrinology, 143, 511-516.
Agbulut, O., Noirez, P., Beaumont, F. and Butler-Browne, G. (2003) Myosin heavy chain isoforms in postnatal muscle development of mice. Biol Cell, 95, 399-406.
Alter, J., Rozentzweig, D. and Bengal, E. (2008) Inhibition of myoblast differentiation by tumor necrosis factor alpha is mediated by c-Jun N-terminal kinase 1 and leukemia inhibitory factor. J Biol Chem, 283, 23224-23234.
Amann, K.J., Guo, A.W. and Ervasti, J.M. (1999) Utrophin lacks the rod domain actin binding activity of dystrophin. J Biol Chem, 274, 35375-35380.
Ames, W.A., Hayes, J.A. and Crawford, M.W. (2005) The role of corticosteroids in Duchenne muscular dystrophy: a review for the anesthetist. Paediatr Anaesth, 15, 3-8.
Anderson, C., Thorsteinsdottir, S. and Borycki, A.G. (2009) Sonic hedgehog-dependent synthesis of laminin alpha1 controls basement membrane assembly in the myotome. Development, 136, 3495-3504.
Andres, V. and Walsh, K. (1996) Myogenin expression, cell cycle withdrawal, and phenotypic differentiation are temporally separable events that precede cell fusion upon myogenesis. J Cell Biol, 132, 657-666.
Angers-Loustau, A., Hering, R., Werbowetski, T.E., Kaplan, D.R. and Del Maestro, R.F. (2004) SRC regulates actin dynamics and invasion of malignant glial cells in three dimensions. Mol Cancer Res, 2, 595-605.
Arakawa, M., Shiozuka, M., Nakayama, Y., Hara, T., Hamada, M., Kondo, S., Ikeda, D., Takahashi, Y., Sawa, R., Nonomura, Y., Sheykholeslami, K., Kondo, K., Kaga, K., Kitamura, T., Suzuki-Miyagoe, Y., Takeda, S. and Matsuda, R. (2003) Negamycin restores dystrophin expression in skeletal and cardiac muscles of mdx mice. J Biochem, 134, 751-758.
Archer, J.D., Vargas, C.C. and Anderson, J.E. (2006) Persistent and improved functional gain in mdx dystrophic mice after treatment with L-arginine and deflazacort. Faseb J, 20, 738-740.
Armand, A.S., Bourajjaj, M., Martinez-Martinez, S., el Azzouzi, H., da Costa Martins, P.A., Hatzis, P., Seidler, T., Redondo, J.M. and De Windt, L.J. (2008) Cooperative synergy between NFAT and MyoD regulates myogenin expression and myogenesis. J Biol

329
Chem, 283, 29004-29010. Ashby, P.R., Wilson, S.J. and Harris, A.J. (1993) Formation of primary and secondary
myotubes in aneural muscles in the mouse mutant peroneal muscular atrophy. Dev Biol, 156, 519-528.
Awaya, T., Kato, T., Mizuno, Y., Chang, H., Niwa, A., Umeda, K., Nakahata, T. and Heike, T. (2012) Selective development of myogenic mesenchymal cells from human embryonic and induced pluripotent stem cells. PLoS One, 7, e51638.
Bajard, L., Relaix, F., Lagha, M., Rocancourt, D., Daubas, P. and Buckingham, M.E. (2006) A novel genetic hierarchy functions during hypaxial myogenesis: Pax3 directly activates Myf5 in muscle progenitor cells in the limb. Genes Dev, 20, 2450-2464.
Baker, J., Liu, J.P., Robertson, E.J. and Efstratiadis, A. (1993) Role of insulin-like growth factors in embryonic and postnatal growth. Cell, 75, 73-82.
Balagopal, P., Olney, R., Darmaun, D., Mougey, E., Dokler, M., Sieck, G. and Hammond, D. (2006) Oxandrolone enhances skeletal muscle myosin synthesis and alters global gene expression profile in Duchenne muscular dystrophy. Am J Physiol Endocrinol Metab, 290, E530-539.
Ballard, F.J., Read, L.C., Francis, G.L., Bagley, C.J. and Wallace, J.C. (1986) Binding properties and biological potencies of insulin-like growth factors in L6 myoblasts. Biochem J, 233, 223-230.
Barton, E.R., Morris, L., Musaro, A., Rosenthal, N. and Sweeney, H.L. (2002) Muscle-specific expression of insulin-like growth factor I counters muscle decline in mdx mice. J Cell Biol, 157, 137-148.
Bassett, D.I., Bryson-Richardson, R.J., Daggett, D.F., Gautier, P., Keenan, D.G. and Currie, P.D. (2003) Dystrophin is required for the formation of stable muscle attachments in the zebrafish embryo. Development, 130, 5851-5860.
Beauchamp, J.R., Heslop, L., Yu, D.S., Tajbakhsh, S., Kelly, R.G., Wernig, A., Buckingham, M.E., Partridge, T.A. and Zammit, P.S. (2000) Expression of CD34 and Myf5 defines the majority of quiescent adult skeletal muscle satellite cells. J Cell Biol, 151, 1221-1234.
Berkes, C.A. and Tapscott, S.J. (2005) MyoD and the transcriptional control of myogenesis. Semin Cell Dev Biol, 16, 585-595.
Biggar, W.D., Gingras, M., Fehlings, D.L., Harris, V.A. and Steele, C.A. (2001) Deflazacort treatment of Duchenne muscular dystrophy. J Pediatr, 138, 45-50.
Blackwell, T.K. and Weintraub, H. (1990) Differences and similarities in DNA-binding preferences of MyoD and E2A protein complexes revealed by binding site selection. Science, 250, 1104-1110.
Blais, A., Tsikitis, M., Acosta-Alvear, D., Sharan, R., Kluger, Y. and Dynlacht, B.D. (2005) An initial blueprint for myogenic differentiation. Genes Dev, 19, 553-569.

330
Blake, D.J., Weir, A., Newey, S.E. and Davies, K.E. (2002) Function and genetics of dystrophin and dystrophin-related proteins in muscle. Physiol Rev, 82, 291-329.
Blau, H.M., Webster, C., Chiu, C.P., Guttman, S. and Chandler, F. (1983) Differentiation properties of pure populations of human dystrophic muscle cells. Exp Cell Res, 144, 495-503.
Bober, E., Lyons, G.E., Braun, T., Cossu, G., Buckingham, M. and Arnold, H.H. (1991) The muscle regulatory gene, Myf-6, has a biphasic pattern of expression during early mouse development. J Cell Biol, 113, 1255-1265.
Bodine, S.C., Stitt, T.N., Gonzalez, M., Kline, W.O., Stover, G.L., Bauerlein, R., Zlotchenko, E., Scrimgeour, A., Lawrence, J.C., Glass, D.J. and Yancopoulos, G.D. (2001) Akt/mTOR pathway is a crucial regulator of skeletal muscle hypertrophy and can prevent muscle atrophy in vivo. Nat Cell Biol, 3, 1014-1019.
Bogdanovich, S., Perkins, K.J., Krag, T.O., Whittemore, L.A. and Khurana, T.S. (2005) Myostatin propeptide-mediated amelioration of dystrophic pathophysiology. Faseb J, 19, 543-549.
Boney, C.M., Sekimoto, H., Gruppuso, P.A. and Frackelton, A.R., Jr. (2001) Src family tyrosine kinases participate in insulin-like growth factor I mitogenic signaling in 3T3-L1 cells. Cell Growth Differ, 12, 379-386.
Bonifati, M.D., Ruzza, G., Bonometto, P., Berardinelli, A., Gorni, K., Orcesi, S., Lanzi, G. and Angelini, C. (2000) A multicenter, double-blind, randomized trial of deflazacort versus prednisone in Duchenne muscular dystrophy. Muscle Nerve, 23, 1344-1347.
Bonuccelli, G., Sotgia, F., Schubert, W., Park, D.S., Frank, P.G., Woodman, S.E., Insabato, L., Cammer, M., Minetti, C. and Lisanti, M.P. (2003) Proteasome inhibitor (MG-132) treatment of mdx mice rescues the expression and membrane localization of dystrophin and dystrophin-associated proteins. Am J Pathol, 163, 1663-1675.
Borycki, A.G., Brunk, B., Tajbakhsh, S., Buckingham, M., Chiang, C. and Emerson, C.P., Jr. (1999a) Sonic hedgehog controls epaxial muscle determination through Myf5 activation. Development, 126, 4053-4063.
Borycki, A.G., Li, J., Jin, F., Emerson, C.P. and Epstein, J.A. (1999b) Pax3 functions in cell survival and in pax7 regulation. Development, 126, 1665-1674.
Bowen, J., Cheneler, D., Walliman, D., Arkless, S.G., Zhang, Z., Ward, M.C.L., Adams, M.J. (2010) On the calibration of rectangular atomic force microscope cantilevers modified by particle attachment and lamination. Measurement Science and Technology, 21, 115106.
Braun, T., Buschhausen-Denker, G., Bober, E., Tannich, E. and Arnold, H.H. (1989) A novel human muscle factor related to but distinct from MyoD1 induces myogenic conversion in 10T1/2 fibroblasts. EMBO J, 8, 701-709.
Broholm, C., Mortensen, O.H., Nielsen, S., Akerstrom, T., Zankari, A., Dahl, B. and Pedersen,

331
B.K. (2008) Exercise induces expression of leukaemia inhibitory factor in human skeletal muscle. J Physiol, 586, 2195-2201.
Brooke, M.H., Fenichel, G.M., Griggs, R.C., Mendell, J.R., Moxley, R., Florence, J., King, W.M., Pandya, S., Robison, J., Schierbecker, J. and et al. (1989) Duchenne muscular dystrophy: patterns of clinical progression and effects of supportive therapy. Neurology, 39, 475-481.
Buchberger, A., Freitag, D. and Arnold, H.H. (2007) A homeo-paired domain-binding motif directs Myf5 expression in progenitor cells of limb muscle. Development, 134, 1171-1180.
Buckingham, M., Bajard, L., Chang, T., Daubas, P., Hadchouel, J., Meilhac, S., Montarras, D., Rocancourt, D. and Relaix, F. (2003) The formation of skeletal muscle: from somite to limb. J Anat, 202, 59-68.
Bulfield, G., Siller, W.G., Wight, P.A. and Moore, K.J. (1984) X chromosome-linked muscular dystrophy (mdx) in the mouse. Proc Natl Acad Sci U S A, 81, 1189-1192.
Burgering, B.M. and Medema, R.H. (2003) Decisions on life and death: FOXO Forkhead transcription factors are in command when PKB/Akt is off duty. J Leukoc Biol, 73, 689-701.
Busanello, A., Battistelli, C., Carbone, M., Mostocotto, C. and Maione, R. (2012) MyoD regulates p57kip2 expression by interacting with a distant cis-element and modifying a higher order chromatin structure. Nucleic Acids Res, 40, 8266-8275.
Cao, H., Courchesne, W.E. and Mastick, C.C. (2002) A phosphotyrosine-dependent protein interaction screen reveals a role for phosphorylation of caveolin-1 on tyrosine 14: recruitment of C-terminal Src kinase. J Biol Chem, 277, 8771-8774.
Capkovic, K.L., Stevenson, S., Johnson, M.C., Thelen, J.J. and Cornelison, D.D. (2008) Neural cell adhesion molecule (NCAM) marks adult myogenic cells committed to differentiation. Exp Cell Res, 314, 1553-1565.
Capozza, F., Cohen, A.W., Cheung, M.W., Sotgia, F., Schubert, W., Battista, M., Lee, H., Frank, P.G. and Lisanti, M.P. (2005a) Muscle-specific interaction of caveolin isoforms: differential complex formation between caveolins in fibroblastic vs. muscle cells. Am J Physiol Cell Physiol, 288, C677-691.
Capozza, F., Combs, T.P., Cohen, A.W., Cho, Y.R., Park, S.Y., Schubert, W., Williams, T.M., Brasaemle, D.L., Jelicks, L.A., Scherer, P.E., Kim, J.K. and Lisanti, M.P. (2005b) Caveolin-3 knockout mice show increased adiposity and whole body insulin resistance, with ligand-induced insulin receptor instability in skeletal muscle. Am J Physiol Cell Physiol, 288, C1317-1331.
Caspary, T., Cleary, M.A., Perlman, E.J., Zhang, P., Elledge, S.J. and Tilghman, S.M. (1999) Oppositely imprinted genes p57(Kip2) and igf2 interact in a mouse model for Beckwith-Wiedemann syndrome. Genes Dev, 13, 3115-3124.

332
Cerletti, M., Jurga, S., Witczak, C.A., Hirshman, M.F., Shadrach, J.L., Goodyear, L.J. and Wagers, A.J. (2008) Highly efficient, functional engraftment of skeletal muscle stem cells in dystrophic muscles. Cell, 134, 37-47.
Chakkalakal, J.V., Thompson, J., Parks, R.J. and Jasmin, B.J. (2005) Molecular, cellular, and pharmacological therapies for Duchenne/Becker muscular dystrophies. Faseb J, 19, 880-891.
Chambers, I. and Smith, A. (2004) Self-renewal of teratocarcinoma and embryonic stem cells. Oncogene, 23, 7150-7160.
Chan, S., Head, S.I. and Morley, J.W. (2007) Branched fibers in dystrophic mdx muscle are associated with a loss of force following lengthening contractions. Am J Physiol Cell Physiol, 293, C985-992.
Chang, H., Yoshimoto, M., Umeda, K., Iwasa, T., Mizuno, Y., Fukada, S., Yamamoto, H., Motohashi, N., Miyagoe-Suzuki, Y., Takeda, S., Heike, T. and Nakahata, T. (2009) Generation of transplantable, functional satellite-like cells from mouse embryonic stem cells. Faseb J, 23, 1907-1919.
Chang, J.H., Gill, S., Settleman, J. and Parsons, S.J. (1995) c-Src regulates the simultaneous rearrangement of actin cytoskeleton, p190RhoGAP, and p120RasGAP following epidermal growth factor stimulation. J Cell Biol, 130, 355-368.
Chapdelaine, P., Moisset, P.A., Campeau, P., Asselin, I., Vilquin, J.T. and Tremblay, J.P. (2000) Functional EGFP-dystrophin fusion proteins for gene therapy vector development. Protein Eng, 13, 611-615.
Charytonowicz, E., Matushansky, I., Castillo-Martin, M., Hricik, T., Cordon-Cardo, C. and Ziman, M. (2011) Alternate PAX3 and PAX7 C-terminal isoforms in myogenic differentiation and sarcomagenesis. Clin Transl Oncol, 13, 194-203.
Chen, C.M., Kraut, N., Groudine, M. and Weintraub, H. (1996) I-mf, a novel myogenic repressor, interacts with members of the MyoD family. Cell, 86, 731-741.
Chen, J.R., Cheng, J.G., Shatzer, T., Sewell, L., Hernandez, L. and Stewart, C.L. (2000a) Leukemia inhibitory factor can substitute for nidatory estrogen and is essential to inducing a receptive uterus for implantation but is not essential for subsequent embryogenesis. Endocrinology, 141, 4365-4372.
Chen, Y.W., Zhao, P., Borup, R. and Hoffman, E.P. (2000b) Expression profiling in the muscular dystrophies: identification of novel aspects of molecular pathophysiology. J Cell Biol, 151, 1321-1336.
Cho, M., Hughes, S.M., Karsch-Mizrachi, I., Travis, M., Leinwand, L.A. and Blau, H.M. (1994) Fast myosin heavy chains expressed in secondary mammalian muscle fibers at the time of their inception. J Cell Sci, 107 ( Pt 9), 2361-2371.
Chung, C.T., Niemela, S.L. and Miller, R.H. (1989) One-step preparation of competent Escherichia coli: transformation and storage of bacterial cells in the same solution.

333
Proc Natl Acad Sci U S A, 86, 2172-2175. Claflin, D.R. and Brooks, S.V. (2008) Direct observation of failing fibers in muscles of
dystrophic mice provides mechanistic insight into muscular dystrophy. Am J Physiol Cell Physiol, 294, C651-658.
Cohen, A.W., Park, D.S., Woodman, S.E., Williams, T.M., Chandra, M., Shirani, J., Pereira de Souza, A., Kitsis, R.N., Russell, R.G., Weiss, L.M., Tang, B., Jelicks, L.A., Factor, S.M., Shtutin, V., Tanowitz, H.B. and Lisanti, M.P. (2003) Caveolin-1 null mice develop cardiac hypertrophy with hyperactivation of p42/44 MAP kinase in cardiac fibroblasts. Am J Physiol Cell Physiol, 284, C457-474.
Collins, C.A., Olsen, I., Zammit, P.S., Heslop, L., Petrie, A., Partridge, T.A. and Morgan, J.E. (2005) Stem cell function, self-renewal, and behavioral heterogeneity of cells from the adult muscle satellite cell niche. Cell, 122, 289-301.
Collinsworth, A.M., Zhang, S., Kraus, W.E. and Truskey, G.A. (2002) Apparent elastic modulus and hysteresis of skeletal muscle cells throughout differentiation. Am J Physiol Cell Physiol, 283, C1219-1227.
Coolican, S.A., Samuel, D.S., Ewton, D.Z., McWade, F.J. and Florini, J.R. (1997) The mitogenic and myogenic actions of insulin-like growth factors utilize distinct signaling pathways. J Biol Chem, 272, 6653-6662.
Cooper, B.J., Winand, N.J., Stedman, H., Valentine, B.A., Hoffman, E.P., Kunkel, L.M., Scott, M.O., Fischbeck, K.H., Kornegay, J.N., Avery, R.J. and et al. (1988) The homologue of the Duchenne locus is defective in X-linked muscular dystrophy of dogs. Nature, 334, 154-156.
Cornelison, D.D., Filla, M.S., Stanley, H.M., Rapraeger, A.C. and Olwin, B.B. (2001) Syndecan-3 and syndecan-4 specifically mark skeletal muscle satellite cells and are implicated in satellite cell maintenance and muscle regeneration. Dev Biol, 239, 79-94.
Cornelison, D.D. and Wold, B.J. (1997) Single-cell analysis of regulatory gene expression in quiescent and activated mouse skeletal muscle satellite cells. Dev Biol, 191, 270-283.
Cossu, G. and Borello, U. (1999) Wnt signaling and the activation of myogenesis in mammals. EMBO J, 18, 6867-6872.
Cossu, G., Kelly, R., Tajbakhsh, S., Di Donna, S., Vivarelli, E. and Buckingham, M. (1996) Activation of different myogenic pathways: myf-5 is induced by the neural tube and MyoD by the dorsal ectoderm in mouse paraxial mesoderm. Development, 122, 429-437.
Couet, J., Belanger, M.M., Roussel, E. and Drolet, M.C. (2001) Cell biology of caveolae and caveolin. Adv Drug Deliv Rev, 49, 223-235.
Cui, Q.L., Zheng, W.H., Quirion, R. and Almazan, G. (2005) Inhibition of Src-like kinases reveals Akt-dependent and -independent pathways in insulin-like growth factor I-mediated oligodendrocyte progenitor survival. J Biol Chem, 280, 8918-8928.
334
Davis, R.L., Weintraub, H. and Lassar, A.B. (1987) Expression of a single transfected cDNA converts fibroblasts to myoblasts. Cell, 51, 987-1000.
De Bari, C., Dell'Accio, F., Tylzanowski, P. and Luyten, F.P. (2001) Multipotent mesenchymal stem cells from adult human synovial membrane. Arthritis Rheum, 44, 1928-1942.
De Bari, C., Dell'Accio, F., Vandenabeele, F., Vermeesch, J.R., Raymackers, J.M. and Luyten, F.P. (2003) Skeletal muscle repair by adult human mesenchymal stem cells from synovial membrane. J Cell Biol, 160, 909-918.
DeChiara, T.M., Efstratiadis, A. and Robertson, E.J. (1990) A growth-deficiency phenotype in heterozygous mice carrying an insulin-like growth factor II gene disrupted by targeting. Nature, 345, 78-80.
Deconinck, A.E., Rafael, J.A., Skinner, J.A., Brown, S.C., Potter, A.C., Metzinger, L., Watt, D.J., Dickson, J.G., Tinsley, J.M. and Davies, K.E. (1997) Utrophin-dystrophin-deficient mice as a model for Duchenne muscular dystrophy. Cell, 90, 717-727.
Dedieu, S., Mazeres, G., Cottin, P. and Brustis, J.J. (2002) Involvement of myogenic regulator factors during fusion in the cell line C2C12. Int J Dev Biol, 46, 235-241.
Delaporte, C., Dehaupas, M. and Fardeau, M. (1984) Comparison between the growth pattern of cell cultures from normal and Duchenne dystrophy muscle. J Neurol Sci, 64, 149-160.
Denetclaw, W.F., Jr., Christ, B. and Ordahl, C.P. (1997) Location and growth of epaxial myotome precursor cells. Development, 124, 1601-1610.
Denker, H.W. (2006) Potentiality of embryonic stem cells: an ethical problem even with alternative stem cell sources. J Med Ethics, 32, 665-671.
Denti, M.A., Rosa, A., D'Antona, G., Sthandier, O., De Angelis, F.G., Nicoletti, C., Allocca, M., Pansarasa, O., Parente, V., Musaro, A., Auricchio, A., Bottinelli, R. and Bozzoni, I. (2006) Body-wide gene therapy of Duchenne muscular dystrophy in the mdx mouse model. Proc Natl Acad Sci U S A, 103, 3758-3763.
Destaing, O., Sanjay, A., Itzstein, C., Horne, W.C., Toomre, D., De Camilli, P. and Baron, R. (2008) The tyrosine kinase activity of c-Src regulates actin dynamics and organization of podosomes in osteoclasts. Mol Biol Cell, 19, 394-404.
Dietrich, S., Abou-Rebyeh, F., Brohmann, H., Bladt, F., Sonnenberg-Riethmacher, E., Yamaai, T., Lumsden, A., Brand-Saberi, B. and Birchmeier, C. (1999) The role of SF/HGF and c-Met in the development of skeletal muscle. Development, 126, 1621-1629.
Doucet, C., Gutierrez, G.J., Lindon, C., Lorca, T., Lledo, G., Pinset, C. and Coux, O. (2005) Multiple phosphorylation events control mitotic degradation of the muscle transcription factor Myf5. BMC Biochem, 6, 27.
Duguay, S.J., Jin, Y., Stein, J., Duguay, A.N., Gardner, P. and Steiner, D.F. (1998) Post-translational processing of the insulin-like growth factor-2 precursor. Analysis of O-glycosylation and endoproteolysis. J Biol Chem, 273, 18443-18451.

335
Eghtesad, S., Jhunjhunwala, S., Little, S.R. and Clemens, P.R. (2011) Rapamycin ameliorates dystrophic phenotype in mdx mouse skeletal muscle. Mol Med, 17, 917-924.
Engert, J.C., Berglund, E.B. and Rosenthal, N. (1996) Proliferation precedes differentiation in IGF-I-stimulated myogenesis. J Cell Biol, 135, 431-440.
Erbay, E. and Chen, J. (2001) The mammalian target of rapamycin regulates C2C12 myogenesis via a kinase-independent mechanism. J Biol Chem, 276, 36079-36082.
Erbay, E., Park, I.H., Nuzzi, P.D., Schoenherr, C.J. and Chen, J. (2003) IGF-II transcription in skeletal myogenesis is controlled by mTOR and nutrients. J Cell Biol, 163, 931-936.
Ervasti, J.M. and Campbell, K.P. (1993) A role for the dystrophin-glycoprotein complex as a transmembrane linker between laminin and actin. J Cell Biol, 122, 809-823.
Evans, M.J. and Kaufman, M.H. (1981) Establishment in culture of pluripotential cells from mouse embryos. Nature, 292, 154-156.
Fabb, S.A., Wells, D.J., Serpente, P. and Dickson, G. (2002) Adeno-associated virus vector gene transfer and sarcolemmal expression of a 144 kDa micro-dystrophin effectively restores the dystrophin-associated protein complex and inhibits myofibre degeneration in nude/mdx mice. Hum Mol Genet, 11, 733-741.
Fairchild, P.J. (2010) The challenge of immunogenicity in the quest for induced pluripotency. Nat Rev Immunol, 10, 868-875.
Fang, P.K., Solomon, K.R., Zhuang, L., Qi, M., McKee, M., Freeman, M.R. and Yelick, P.C. (2006) Caveolin-1alpha and -1beta perform nonredundant roles in early vertebrate development. Am J Pathol, 169, 2209-2222.
Fenichel, G., Pestronk, A., Florence, J., Robison, V. and Hemelt, V. (1997) A beneficial effect of oxandrolone in the treatment of Duchenne muscular dystrophy: a pilot study. Neurology, 48, 1225-1226.
Ferri, P., Barbieri, E., Burattini, S., Guescini, M., D'Emilio, A., Biagiotti, L., Del Grande, P., De Luca, A., Stocchi, V. and Falcieri, E. (2009) Expression and subcellular localization of myogenic regulatory factors during the differentiation of skeletal muscle C2C12 myoblasts. J Cell Biochem, 108, 1302-1317.
Florini, J.R., Magri, K.A., Ewton, D.Z., James, P.L., Grindstaff, K. and Rotwein, P.S. (1991) "Spontaneous" differentiation of skeletal myoblasts is dependent upon autocrine secretion of insulin-like growth factor-II. J Biol Chem, 266, 15917-15923.
Franzini-Armstrong, C., Kenney, L.J. and Varriano-Marston, E. (1987) The structure of calsequestrin in triads of vertebrate skeletal muscle: a deep-etch study. J Cell Biol, 105, 49-56.
Fredette, B.J. and Landmesser, L.T. (1991) Relationship of primary and secondary myogenesis to fiber type development in embryonic chick muscle. Dev Biol, 143, 1-18.
Fukada, S., Higuchi, S., Segawa, M., Koda, K., Yamamoto, Y., Tsujikawa, K., Kohama, Y., Uezumi, A., Imamura, M., Miyagoe-Suzuki, Y., Takeda, S. and Yamamoto, H. (2004)

336
Purification and cell-surface marker characterization of quiescent satellite cells from murine skeletal muscle by a novel monoclonal antibody. Exp Cell Res, 296, 245-255.
Fukada, S., Uezumi, A., Ikemoto, M., Masuda, S., Segawa, M., Tanimura, N., Yamamoto, H., Miyagoe-Suzuki, Y. and Takeda, S. (2007) Molecular signature of quiescent satellite cells in adult skeletal muscle. Stem Cells, 25, 2448-2459.
Galbiati, F., Engelman, J.A., Volonte, D., Zhang, X.L., Minetti, C., Li, M., Hou, H., Jr., Kneitz, B., Edelmann, W. and Lisanti, M.P. (2001a) Caveolin-3 null mice show a loss of caveolae, changes in the microdomain distribution of the dystrophin-glycoprotein complex, and t-tubule abnormalities. J Biol Chem, 276, 21425-21433.
Galbiati, F., Volonte, D., Chu, J.B., Li, M., Fine, S.W., Fu, M., Bermudez, J., Pedemonte, M., Weidenheim, K.M., Pestell, R.G., Minetti, C. and Lisanti, M.P. (2000) Transgenic overexpression of caveolin-3 in skeletal muscle fibers induces a Duchenne-like muscular dystrophy phenotype. Proc Natl Acad Sci U S A, 97, 9689-9694.
Galbiati, F., Volonte, D., Engelman, J.A., Scherer, P.E. and Lisanti, M.P. (1999) Targeted down-regulation of caveolin-3 is sufficient to inhibit myotube formation in differentiating C2C12 myoblasts. Transient activation of p38 mitogen-activated protein kinase is required for induction of caveolin-3 expression and subsequent myotube formation. J Biol Chem, 274, 30315-30321.
Galbiati, F., Volonte, D., Liu, J., Capozza, F., Frank, P.G., Zhu, L., Pestell, R.G. and Lisanti, M.P. (2001b) Caveolin-1 expression negatively regulates cell cycle progression by inducing G(0)/G(1) arrest via a p53/p21(WAF1/Cip1)-dependent mechanism. Mol Biol Cell, 12, 2229-2244.
Galvagni, F., Cantini, M. and Oliviero, S. (2002) The utrophin gene is transcriptionally up-regulated in regenerating muscle. J Biol Chem, 277, 19106-19113.
Galvin, C.D., Hardiman, O. and Nolan, C.M. (2003) IGF-1 receptor mediates differentiation of primary cultures of mouse skeletal myoblasts. Mol Cell Endocrinol, 200, 19-29.
Gayraud-Morel, B., Chretien, F., Jory, A., Sambasivan, R., Negroni, E., Flamant, P., Soubigou, G., Coppee, J.Y., Di Santo, J., Cumano, A., Mouly, V. and Tajbakhsh, S. (2012) Myf5 haploinsufficiency reveals distinct cell fate potentials for adult skeletal muscle stem cells. J Cell Sci, 125, 1738-1749.
Gensch, N., Borchardt, T., Schneider, A., Riethmacher, D. and Braun, T. (2008) Different autonomous myogenic cell populations revealed by ablation of Myf5-expressing cells during mouse embryogenesis. Development, 135, 1597-1604.
George-Weinstein, M., Foster, R.F., Gerhart, J.V. and Kaufman, S.J. (1993) In vitro and in vivo expression of alpha 7 integrin and desmin define the primary and secondary myogenic lineages. Dev Biol, 156, 209-229.
Gervasio, O.L., Phillips, W.D., Cole, L. and Allen, D.G. (2011) Caveolae respond to cell stretch and contribute to stretch-induced signaling. J Cell Sci, 124, 3581-3590.

337
Gilley, J., Coffer, P.J. and Ham, J. (2003) FOXO transcription factors directly activate bim gene expression and promote apoptosis in sympathetic neurons. J Cell Biol, 162, 613-622.
Glass, D.J. (2005) A signaling role for dystrophin: inhibiting skeletal muscle atrophy pathways. Cancer Cell, 8, 351-352.
Glenney, J.R., Jr. and Soppet, D. (1992) Sequence and expression of caveolin, a protein component of caveolae plasma membrane domains phosphorylated on tyrosine in Rous sarcoma virus-transformed fibroblasts. Proc Natl Acad Sci U S A, 89, 10517-10521.
Gnecchi-Ruscone, T., Taylor, J., Mercuri, E., Paternostro, G., Pogue, R., Bushby, K., Sewry, C., Muntoni, F. and Camici, P.G. (1999) Cardiomyopathy in duchenne, becker, and sarcoglycanopathies: a role for coronary dysfunction? Muscle Nerve, 22, 1549-1556.
Gnocchi, V.F., White, R.B., Ono, Y., Ellis, J.A. and Zammit, P.S. (2009) Further characterisation of the molecular signature of quiescent and activated mouse muscle satellite cells. PLoS One, 4, e5205.
Goncalves, M.A., de Vries, A.A., Holkers, M., van de Watering, M.J., van der Velde, I., van Nierop, G.P., Valerio, D. and Knaan-Shanzer, S. (2006) Human mesenchymal stem cells ectopically expressing full-length dystrophin can complement Duchenne muscular dystrophy myotubes by cell fusion. Hum Mol Genet, 15, 213-221.
Gordon, K.E., Dooley, J.M., Sheppard, K.M., Macsween, J. and Esser, M.J. (2011) Impact of bisphosphonates on survival for patients with duchenne muscular dystrophy. Pediatrics, 127, e353-358.
Goulding, M., Lumsden, A. and Paquette, A.J. (1994) Regulation of Pax-3 expression in the dermomyotome and its role in muscle development. Development, 120, 957-971.
Goulding, M.D., Chalepakis, G., Deutsch, U., Erselius, J.R. and Gruss, P. (1991) Pax-3, a novel murine DNA binding protein expressed during early neurogenesis. EMBO J, 10, 1135-1147.
Grady, R.M., Teng, H., Nichol, M.C., Cunningham, J.C., Wilkinson, R.S. and Sanes, J.R. (1997) Skeletal and cardiac myopathies in mice lacking utrophin and dystrophin: a model for Duchenne muscular dystrophy. Cell, 90, 729-738.
Grande-Garcia, A., Echarri, A., de Rooij, J., Alderson, N.B., Waterman-Storer, C.M., Valdivielso, J.M. and del Pozo, M.A. (2007) Caveolin-1 regulates cell polarization and directional migration through Src kinase and Rho GTPases. J Cell Biol, 177, 683-694.
Grandjean, V., Smith, J., Schofield, P.N. and Ferguson-Smith, A.C. (2000) Increased IGF-II protein affects p57kip2 expression in vivo and in vitro: implications for Beckwith-Wiedemann syndrome. Proc Natl Acad Sci U S A, 97, 5279-5284.
Gregorevic, P., Plant, D.R., Leeding, K.S., Bach, L.A. and Lynch, G.S. (2002) Improved contractile function of the mdx dystrophic mouse diaphragm muscle after insulin-like

338
growth factor-I administration. Am J Pathol, 161, 2263-2272. Grifone, R., Demignon, J., Houbron, C., Souil, E., Niro, C., Seller, M.J., Hamard, G. and
Maire, P. (2005) Six1 and Six4 homeoproteins are required for Pax3 and Mrf expression during myogenesis in the mouse embryo. Development, 132, 2235-2249.
Gros, J., Scaal, M. and Marcelle, C. (2004) A two-step mechanism for myotome formation in chick. Dev Cell, 6, 875-882.
Gross, M.K., Moran-Rivard, L., Velasquez, T., Nakatsu, M.N., Jagla, K. and Goulding, M. (2000) Lbx1 is required for muscle precursor migration along a lateral pathway into the limb. Development, 127, 413-424.
Grounds, M.D. and Torrisi, J. (2004) Anti-TNFalpha (Remicade) therapy protects dystrophic skeletal muscle from necrosis. Faseb J, 18, 676-682.
Guerette, B., Asselin, I., Skuk, D., Entman, M. and Tremblay, J.P. (1997) Control of inflammatory damage by anti-LFA-1: increase success of myoblast transplantation. Cell Transplant, 6, 101-107.
Guo, K., Wang, J., Andres, V., Smith, R.C. and Walsh, K. (1995) MyoD-induced expression of p21 inhibits cyclin-dependent kinase activity upon myocyte terminal differentiation. Mol Cell Biol, 15, 3823-3829.
Gussoni, E., Soneoka, Y., Strickland, C.D., Buzney, E.A., Khan, M.K., Flint, A.F., Kunkel, L.M. and Mulligan, R.C. (1999) Dystrophin expression in the mdx mouse restored by stem cell transplantation. Nature, 401, 390-394.
Gustafsson, M.K., Pan, H., Pinney, D.F., Liu, Y., Lewandowski, A., Epstein, D.J. and Emerson, C.P., Jr. (2002) Myf5 is a direct target of long-range Shh signaling and Gli regulation for muscle specification. Genes Dev, 16, 114-126.
Hagiwara, Y., Sasaoka, T., Araishi, K., Imamura, M., Yorifuji, H., Nonaka, I., Ozawa, E. and Kikuchi, T. (2000) Caveolin-3 deficiency causes muscle degeneration in mice. Hum Mol Genet, 9, 3047-3054.
Halevy, O., Novitch, B.G., Spicer, D.B., Skapek, S.X., Rhee, J., Hannon, G.J., Beach, D. and Lassar, A.B. (1995) Correlation of terminal cell cycle arrest of skeletal muscle with induction of p21 by MyoD. Science, 267, 1018-1021.
Halevy, O., Piestun, Y., Allouh, M.Z., Rosser, B.W., Rinkevich, Y., Reshef, R., Rozenboim, I., Wleklinski-Lee, M. and Yablonka-Reuveni, Z. (2004) Pattern of Pax7 expression during myogenesis in the posthatch chicken establishes a model for satellite cell differentiation and renewal. Dev Dyn, 231, 489-502.
Harridge, S.D. (2007) Plasticity of human skeletal muscle: gene expression to in vivo function. Exp Physiol, 92, 783-797.
Harris, A.J., Duxson, M.J., Fitzsimons, R.B. and Rieger, F. (1989) Myonuclear birthdates distinguish the origins of primary and secondary myotubes in embryonic mammalian skeletal muscles. Development, 107, 771-784.

339
Harvey, R.P. (2002) Patterning the vertebrate heart. Nat Rev Genet, 3, 544-556. Hasty, P., Bradley, A., Morris, J.H., Edmondson, D.G., Venuti, J.M., Olson, E.N. and Klein,
W.H. (1993) Muscle deficiency and neonatal death in mice with a targeted mutation in the myogenin gene. Nature, 364, 501-506.
Hawke, T.J. and Garry, D.J. (2001) Myogenic satellite cells: physiology to molecular biology. J Appl Physiol, 91, 534-551.
Head, S.I. (2010) Branched fibres in old dystrophic mdx muscle are associated with mechanical weakening of the sarcolemma, abnormal Ca2+ transients and a breakdown of Ca2+ homeostasis during fatigue. Exp Physiol, 95, 641-656.
Heidemann, S.R., Kaech, S., Buxbaum, R.E. and Matus, A. (1999) Direct observations of the mechanical behaviors of the cytoskeleton in living fibroblasts. J Cell Biol, 145, 109-122.
Heinrich, P.C., Behrmann, I., Muller-Newen, G., Schaper, F. and Graeve, L. (1998) Interleukin-6-type cytokine signalling through the gp130/Jak/STAT pathway. Biochem J, 334 ( Pt 2), 297-314.
Helliwell, T.R., Man, N.T., Morris, G.E. and Davies, K.E. (1992) The dystrophin-related protein, utrophin, is expressed on the sarcolemma of regenerating human skeletal muscle fibres in dystrophies and inflammatory myopathies. Neuromuscul Disord, 2, 177-184.
Herrmann, R., Straub, V., Blank, M., Kutzick, C., Franke, N., Jacob, E.N., Lenard, H.G., Kroger, S. and Voit, T. (2000) Dissociation of the dystroglycan complex in caveolin-3-deficient limb girdle muscular dystrophy. Hum Mol Genet, 9, 2335-2340.
Hinterberger, T.J., Sassoon, D.A., Rhodes, S.J. and Konieczny, S.F. (1991) Expression of the muscle regulatory factor MRF4 during somite and skeletal myofiber development. Dev Biol, 147, 144-156.
Hirai, H., Verma, M., Watanabe, S., Tastad, C., Asakura, Y. and Asakura, A. (2010) MyoD regulates apoptosis of myoblasts through microRNA-mediated down-regulation of Pax3. J Cell Biol, 191, 347-365.
Hirsinger, E., Duprez, D., Jouve, C., Malapert, P., Cooke, J. and Pourquie, O. (1997) Noggin acts downstream of Wnt and Sonic Hedgehog to antagonize BMP4 in avian somite patterning. Development, 124, 4605-4614.
Hofmann, U.G., Rotsch, C., Parak, W.J. and Radmacher, M. (1997) Investigating the cytoskeleton of chicken cardiocytes with the atomic force microscope. J Struct Biol, 119, 84-91.
Holm, S. (2008) Time to reconsider stem cell ethics--the importance of induced pluripotent cells. J Med Ethics, 34, 63-64.
Horst, D., Ustanina, S., Sergi, C., Mikuz, G., Juergens, H., Braun, T. and Vorobyov, E. (2006) Comparative expression analysis of Pax3 and Pax7 during mouse myogenesis. Int J

340
Dev Biol, 50, 47-54. Houzelstein, D., Lyons, G.E., Chamberlain, J. and Buckingham, M.E. (1992) Localization of
dystrophin gene transcripts during mouse embryogenesis. J Cell Biol, 119, 811-821. Hribal, M.L., Nakae, J., Kitamura, T., Shutter, J.R. and Accili, D. (2003) Regulation of
insulin-like growth factor-dependent myoblast differentiation by Foxo forkhead transcription factors. J Cell Biol, 162, 535-541.
Hu, P., Geles, K.G., Paik, J.H., DePinho, R.A. and Tjian, R. (2008) Codependent activators direct myoblast-specific MyoD transcription. Dev Cell, 15, 534-546.
Huang, P., Cheng, G., Lu, H., Aronica, M., Ransohoff, R.M. and Zhou, L. (2011) Impaired respiratory function in mdx and mdx/utrn(+/-) mice. Muscle Nerve, 43, 263-267.
Hulit, J., Bash, T., Fu, M., Galbiati, F., Albanese, C., Sage, D.R., Schlegel, A., Zhurinsky, J., Shtutman, M., Ben-Ze'ev, A., Lisanti, M.P. and Pestell, R.G. (2000) The cyclin D1 gene is transcriptionally repressed by caveolin-1. J Biol Chem, 275, 21203-21209.
Huo, H., Guo, X., Hong, S., Jiang, M., Liu, X. and Liao, K. (2003) Lipid rafts/caveolae are essential for insulin-like growth factor-1 receptor signaling during 3T3-L1 preadipocyte differentiation induction. J Biol Chem, 278, 11561-11569.
Hutcheson, D.A., Zhao, J., Merrell, A., Haldar, M. and Kardon, G. (2009) Embryonic and fetal limb myogenic cells are derived from developmentally distinct progenitors and have different requirements for beta-catenin. Genes Dev, 23, 997-1013.
Ilsley, J.L., Sudol, M. and Winder, S.J. (2001) The interaction of dystrophin with beta-dystroglycan is regulated by tyrosine phosphorylation. Cell Signal, 13, 625-632.
Irintchev, A., Zeschnigk, M., Starzinski-Powitz, A. and Wernig, A. (1994) Expression pattern of M-cadherin in normal, denervated, and regenerating mouse muscles. Dev Dyn, 199, 326-337.
Janssen, P.M., Hiranandani, N., Mays, T.A. and Rafael-Fortney, J.A. (2005) Utrophin deficiency worsens cardiac contractile dysfunction present in dystrophin-deficient mdx mice. Am J Physiol Heart Circ Physiol, 289, H2373-2378.
Jasmin, J.F., Rengo, G., Lymperopoulos, A., Gupta, R., Eaton, G.J., Quann, K., Gonzales, D.M., Mercier, I., Koch, W.J. and Lisanti, M.P. (2011) Caveolin-1 deficiency exacerbates cardiac dysfunction and reduces survival in mice with myocardial infarction. Am J Physiol Heart Circ Physiol, 300, H1274-1281.
Je, H.D., Gallant, C., Leavis, P.C. and Morgan, K.G. (2004) Caveolin-1 regulates contractility in differentiated vascular smooth muscle. Am J Physiol Heart Circ Physiol, 286, H91-98.
Jen, Y., Weintraub, H. and Benezra, R. (1992) Overexpression of Id protein inhibits the muscle differentiation program: in vivo association of Id with E2A proteins. Genes Dev, 6, 1466-1479.
Jiang, B.H., Aoki, M., Zheng, J.Z., Li, J. and Vogt, P.K. (1999) Myogenic signaling of

341
phosphatidylinositol 3-kinase requires the serine-threonine kinase Akt/protein kinase B. Proc Natl Acad Sci U S A, 96, 2077-2081.
Jiang, B.H., Zheng, J.Z. and Vogt, P.K. (1998) An essential role of phosphatidylinositol 3-kinase in myogenic differentiation. Proc Natl Acad Sci U S A, 95, 14179-14183.
Jo, C., Kim, H., Jo, I., Choi, I., Jung, S.C., Kim, J., Kim, S.S. and Jo, S.A. (2005) Leukemia inhibitory factor blocks early differentiation of skeletal muscle cells by activating ERK. Biochim Biophys Acta, 1743, 187-197.
Jones, C.M., Lyons, K.M. and Hogan, B.L. (1991) Involvement of Bone Morphogenetic Protein-4 (BMP-4) and Vgr-1 in morphogenesis and neurogenesis in the mouse. Development, 111, 531-542.
Jorgensen, L.H., Larochelle, N., Orlopp, K., Dunant, P., Dudley, R.W., Stucka, R., Thirion, C., Walter, M.C., Laval, S.H. and Lochmuller, H. (2009) Efficient and fast functional screening of microdystrophin constructs in vivo and in vitro for therapy of duchenne muscular dystrophy. Hum Gene Ther, 20, 641-650.
Jostes, B., Walther, C. and Gruss, P. (1990) The murine paired box gene, Pax7, is expressed specifically during the development of the nervous and muscular system. Mech Dev, 33, 27-37.
Judge, L.M., Haraguchiln, M. and Chamberlain, J.S. (2006) Dissecting the signaling and mechanical functions of the dystrophin-glycoprotein complex. J Cell Sci, 119, 1537-1546.
Jung, D., Yang, B., Meyer, J., Chamberlain, J.S. and Campbell, K.P. (1995) Identification and characterization of the dystrophin anchoring site on beta-dystroglycan. J Biol Chem, 270, 27305-27310.
Kablar, B., Krastel, K., Ying, C., Asakura, A., Tapscott, S.J. and Rudnicki, M.A. (1997) MyoD and Myf-5 differentially regulate the development of limb versus trunk skeletal muscle. Development, 124, 4729-4738.
Kahane, N., Cinnamon, Y. and Kalcheim, C. (1998) The origin and fate of pioneer myotomal cells in the avian embryo. Mech Dev, 74, 59-73.
Kaichi, S., Hasegawa, K., Takaya, T., Yokoo, N., Mima, T., Kawamura, T., Morimoto, T., Ono, K., Baba, S., Doi, H., Yamanaka, S., Nakahata, T. and Heike, T. (2010) Cell line-dependent differentiation of induced pluripotent stem cells into cardiomyocytes in mice. Cardiovasc Res, 88, 314-323.
Kaliman, P., Canicio, J., Shepherd, P.R., Beeton, C.A., Testar, X., Palacin, M. and Zorzano, A. (1998) Insulin-like growth factors require phosphatidylinositol 3-kinase to signal myogenesis: dominant negative p85 expression blocks differentiation of L6E9 muscle cells. Mol Endocrinol, 12, 66-77.
Kami, K., Morikawa, Y., Sekimoto, M. and Senba, E. (2000) Gene expression of receptors for IL-6, LIF, and CNTF in regenerating skeletal muscles. J Histochem Cytochem, 48,

342
1203-1213. Kami, K. and Senba, E. (2002) In vivo activation of STAT3 signaling in satellite cells and
myofibers in regenerating rat skeletal muscles. J Histochem Cytochem, 50, 1579-1589. Kang, J.S., Feinleib, J.L., Knox, S., Ketteringham, M.A. and Krauss, R.S. (2003)
Promyogenic members of the Ig and cadherin families associate to positively regulate differentiation. Proc Natl Acad Sci U S A, 100, 3989-3994.
Kang, J.S., Mulieri, P.J., Hu, Y., Taliana, L. and Krauss, R.S. (2002) BOC, an Ig superfamily member, associates with CDO to positively regulate myogenic differentiation. EMBO J, 21, 114-124.
Kang, J.S., Mulieri, P.J., Miller, C., Sassoon, D.A. and Krauss, R.S. (1998) CDO, a robo-related cell surface protein that mediates myogenic differentiation. J Cell Biol, 143, 403-413.
Kassar-Duchossoy, L., Gayraud-Morel, B., Gomes, D., Rocancourt, D., Buckingham, M., Shinin, V. and Tajbakhsh, S. (2004) Mrf4 determines skeletal muscle identity in Myf5:Myod double-mutant mice. Nature, 431, 466-471.
Kassar-Duchossoy, L., Giacone, E., Gayraud-Morel, B., Jory, A., Gomes, D. and Tajbakhsh, S. (2005) Pax3/Pax7 mark a novel population of primitive myogenic cells during development. Genes Dev, 19, 1426-1431.
Kazuki, Y., Hiratsuka, M., Takiguchi, M., Osaki, M., Kajitani, N., Hoshiya, H., Hiramatsu, K., Yoshino, T., Kazuki, K., Ishihara, C., Takehara, S., Higaki, K., Nakagawa, M., Takahashi, K., Yamanaka, S. and Oshimura, M. (2009) Complete genetic correction of ips cells from Duchenne muscular dystrophy. Mol Ther, 18, 386-393.
Khairallah, R.J., Shi, G., Sbrana, F., Prosser, B.L., Borroto, C., Mazaitis, M.J., Hoffman, E.P., Mahurkar, A., Sachs, F., Sun, Y., Chen, Y.W., Raiteri, R., Lederer, W.J., Dorsey, S.G. and Ward, C.W. (2012) Microtubules underlie dysfunction in duchenne muscular dystrophy. Sci Signal, 5, ra56.
Khurana, T.S. and Davies, K.E. (2003) Pharmacological strategies for muscular dystrophy. Nat Rev Drug Discov, 2, 379-390.
Khurana, T.S., Hoffman, E.P. and Kunkel, L.M. (1990) Identification of a chromosome 6-encoded dystrophin-related protein. J Biol Chem, 265, 16717-16720.
Khurana, T.S., Watkins, S.C., Chafey, P., Chelly, J., Tome, F.M., Fardeau, M., Kaplan, J.C. and Kunkel, L.M. (1991) Immunolocalization and developmental expression of dystrophin related protein in skeletal muscle. Neuromuscul Disord, 1, 185-194.
Kim, M. and Morshead, C.M. (2003) Distinct populations of forebrain neural stem and progenitor cells can be isolated using side-population analysis. J Neurosci, 23, 10703-10709.
Kim, Y.N. and Bertics, P.J. (2002) The endocytosis-linked protein dynamin associates with caveolin-1 and is tyrosine phosphorylated in response to the activation of a

343
noninternalizing epidermal growth factor receptor mutant. Endocrinology, 143, 1726-1731.
Kirk, S.P., Oldham, J.M., Jeanplong, F. and Bass, J.J. (2003) Insulin-like growth factor-II delays early but enhances late regeneration of skeletal muscle. J Histochem Cytochem, 51, 1611-1620.
Kleopa, K.A., Drousiotou, A., Mavrikiou, E., Ormiston, A. and Kyriakides, T. (2006) Naturally occurring utrophin correlates with disease severity in Duchenne muscular dystrophy. Hum Mol Genet, 15, 1623-1628.
Kogo, H., Aiba, T. and Fujimoto, T. (2004) Cell type-specific occurrence of caveolin-1alpha and -1beta in the lung caused by expression of distinct mRNAs. J Biol Chem, 279, 25574-25581.
Kogo, H. and Fujimoto, T. (2000) Caveolin-1 isoforms are encoded by distinct mRNAs. Identification Of mouse caveolin-1 mRNA variants caused by alternative transcription initiation and splicing. FEBS Lett, 465, 119-123.
Koleske, A.J., Baltimore, D. and Lisanti, M.P. (1995) Reduction of caveolin and caveolae in oncogenically transformed cells. Proc Natl Acad Sci U S A, 92, 1381-1385.
Krag, T.O., Bogdanovich, S., Jensen, C.J., Fischer, M.D., Hansen-Schwartz, J., Javazon, E.H., Flake, A.W., Edvinsson, L. and Khurana, T.S. (2004) Heregulin ameliorates the dystrophic phenotype in mdx mice. Proc Natl Acad Sci U S A, 101, 13856-13860.
Kurek, J., Bower, J., Romanella, M. and Austin, L. (1996a) Leukaemia inhibitory factor treatment stimulates muscle regeneration in the mdx mouse. Neurosci Lett, 212, 167-170.
Kurek, J.B., Bower, J.J., Romanella, M., Koentgen, F., Murphy, M. and Austin, L. (1997) The role of leukemia inhibitory factor in skeletal muscle regeneration. Muscle Nerve, 20, 815-822.
Kurek, J.B., Nouri, S., Kannourakis, G., Murphy, M. and Austin, L. (1996b) Leukemia inhibitory factor and interleukin-6 are produced by diseased and regenerating skeletal muscle. Muscle Nerve, 19, 1291-1301.
Kuribayashi, K., Mayes, P.A. and El-Deiry, W.S. (2006) What are caspases 3 and 7 doing upstream of the mitochondria? Cancer Biol Ther, 5, 763-765.
Langenbach, K.J. and Rando, T.A. (2002) Inhibition of dystroglycan binding to laminin disrupts the PI3K/AKT pathway and survival signaling in muscle cells. Muscle Nerve, 26, 644-653.
Lanner, J.T., Georgiou, D.K., Joshi, A.D. and Hamilton, S.L. (2010) Ryanodine receptors: structure, expression, molecular details, and function in calcium release. Cold Spring Harb Perspect Biol, 2, a003996.
Lapidos, K.A., Kakkar, R. and McNally, E.M. (2004) The dystrophin glycoprotein complex: signaling strength and integrity for the sarcolemma. Circ Res, 94, 1023-1031.

344
Larner, D.P. (2012) A role for caveolin-3 in the pathogenesis of the mdx mouse. PhD Thesis, University of Birmoingham.
Larsen, B.D., Rampalli, S., Burns, L.E., Brunette, S., Dilworth, F.J. and Megeney, L.A. (2010) Caspase 3/caspase-activated DNase promote cell differentiation by inducing DNA strand breaks. Proc Natl Acad Sci U S A, 107, 4230-4235.
Lawlor, M.A. and Rotwein, P. (2000) Coordinate control of muscle cell survival by distinct insulin-like growth factor activated signaling pathways. J Cell Biol, 151, 1131-1140.
Lee, H., Park, D.S., Wang, X.B., Scherer, P.E., Schwartz, P.E. and Lisanti, M.P. (2002) Src-induced phosphorylation of caveolin-2 on tyrosine 19. Phospho-caveolin-2 (Tyr(P)19) is localized near focal adhesions, remains associated with lipid rafts/caveolae, but no longer forms a high molecular mass hetero-oligomer with caveolin-1. J Biol Chem, 277, 34556-34567.
Lee, H., Volonte, D., Galbiati, F., Iyengar, P., Lublin, D.M., Bregman, D.B., Wilson, M.T., Campos-Gonzalez, R., Bouzahzah, B., Pestell, R.G., Scherer, P.E. and Lisanti, M.P. (2000) Constitutive and growth factor-regulated phosphorylation of caveolin-1 occurs at the same site (Tyr-14) in vivo: identification of a c-Src/Cav-1/Grb7 signaling cassette. Mol Endocrinol, 14, 1750-1775.
Lee, S.W., Reimer, C.L., Oh, P., Campbell, D.B. and Schnitzer, J.E. (1998) Tumor cell growth inhibition by caveolin re-expression in human breast cancer cells. Oncogene, 16, 1391-1397.
Li, S., Couet, J. and Lisanti, M.P. (1996a) Src tyrosine kinases, Galpha subunits, and H-Ras share a common membrane-anchored scaffolding protein, caveolin. Caveolin binding negatively regulates the auto-activation of Src tyrosine kinases. J Biol Chem, 271, 29182-29190.
Li, S., Seitz, R. and Lisanti, M.P. (1996b) Phosphorylation of caveolin by src tyrosine kinases. The alpha-isoform of caveolin is selectively phosphorylated by v-Src in vivo. J Biol Chem, 271, 3863-3868.
Li, T., Sotgia, F., Vuolo, M.A., Li, M., Yang, W.C., Pestell, R.G., Sparano, J.A. and Lisanti, M.P. (2006) Caveolin-1 mutations in human breast cancer: functional association with estrogen receptor alpha-positive status. Am J Pathol, 168, 1998-2013.
Li, W.P., Liu, P., Pilcher, B.K. and Anderson, R.G. (2001) Cell-specific targeting of caveolin-1 to caveolae, secretory vesicles, cytoplasm or mitochondria. J Cell Sci, 114, 1397-1408.
Lieskovska, J., Ling, Y., Badley-Clarke, J. and Clemmons, D.R. (2006) The role of Src kinase in insulin-like growth factor-dependent mitogenic signaling in vascular smooth muscle cells. J Biol Chem, 281, 25041-25053.
Lindon, C., Montarras, D. and Pinset, C. (1998) Cell cycle-regulated expression of the muscle determination factor Myf5 in proliferating myoblasts. J Cell Biol, 140, 111-118.
Liu, J., Burkin, D.J. and Kaufman, S.J. (2008) Increasing alpha 7 beta 1-integrin promotes

345
muscle cell proliferation, adhesion, and resistance to apoptosis without changing gene expression. Am J Physiol Cell Physiol, 294, C627-640.
Liu, J., Milner, D.J., Boppart, M.D., Ross, R.S. and Kaufman, S.J. (2012) beta1D chain increases alpha7beta1 integrin and laminin and protects against sarcolemmal damage in mdx mice. Hum Mol Genet, 21, 1592-1603.
Liu, L., Mohammadi, K., Aynafshar, B., Wang, H., Li, D., Liu, J., Ivanov, A.V., Xie, Z. and Askari, A. (2003) Role of caveolae in signal-transducing function of cardiac Na+/K+-ATPase. Am J Physiol Cell Physiol, 284, C1550-1560.
Liu, P., Li, W.P., Machleidt, T. and Anderson, R.G. (1999) Identification of caveolin-1 in lipoprotein particles secreted by exocrine cells. Nat Cell Biol, 1, 369-375.
Love, D.R., Hill, D.F., Dickson, G., Spurr, N.K., Byth, B.C., Marsden, R.F., Walsh, F.S., Edwards, Y.H. and Davies, K.E. (1989) An autosomal transcript in skeletal muscle with homology to dystrophin. Nature, 339, 55-58.
Lovering, R.M., Michaelson, L. and Ward, C.W. (2009) Malformed mdx myofibers have normal cytoskeletal architecture yet altered EC coupling and stress-induced Ca2+ signaling. Am J Physiol Cell Physiol, 297, C571-580.
Lovering, R.M., Porter, N.C. and Bloch, R.J. (2005) The muscular dystrophies: from genes to therapies. Phys Ther, 85, 1372-1388.
Lovett, F.A., Gonzalez, I., Salih, D.A., Cobb, L.J., Tripathi, G., Cosgrove, R.A., Murrell, A., Kilshaw, P.J. and Pell, J.M. (2006) Convergence of Igf2 expression and adhesion signalling via RhoA and p38 MAPK enhances myogenic differentiation. J Cell Sci, 119, 4828-4840.
Lu, H., Shah, P., Ennis, D., Shinder, G., Sap, J., Le-Tien, H. and Fantus, I.G. (2002) The differentiation of skeletal muscle cells involves a protein-tyrosine phosphatase-alpha-mediated C-Src signaling pathway. J Biol Chem, 277, 46687-46695.
Lynch, G.S., Hinkle, R.T., Chamberlain, J.S., Brooks, S.V. and Faulkner, J.A. (2001) Force and power output of fast and slow skeletal muscles from mdx mice 6-28 months old. J Physiol, 535, 591-600.
Mal, A. and Harter, M.L. (2003) MyoD is functionally linked to the silencing of a muscle-specific regulatory gene prior to skeletal myogenesis. Proc Natl Acad Sci U S A, 100, 1735-1739.
Malik, V., Rodino-Klapac, L.R., Viollet, L. and Mendell, J.R. (2010) Aminoglycoside-induced mutation suppression (stop codon readthrough) as a therapeutic strategy for Duchenne muscular dystrophy. Ther Adv Neurol Disord, 3, 379-389.
Manneville, J.B., Jehanno, M. and Etienne-Manneville, S. (2007) Dlg1 binds GKAP to control dynein association with microtubules, centrosome positioning, and cell polarity. J Cell Biol, 191, 585-598.
Manneville, J.B., Jehanno, M. and Etienne-Manneville, S. (2010) Dlg1 binds GKAP to

346
control dynein association with microtubules, centrosome positioning, and cell polarity. J Cell Biol, 191, 585-598.
Mansouri, A., Stoykova, A., Torres, M. and Gruss, P. (1996) Dysgenesis of cephalic neural crest derivatives in Pax7-/- mutant mice. Development, 122, 831-838.
Mantilla, C.B., Sill, R.V., Aravamudan, B., Zhan, W.Z. and Sieck, G.C. (2008) Developmental effects on myonuclear domain size of rat diaphragm fibers. J Appl Physiol, 104, 787-794.
Marcelle, C., Stark, M.R. and Bronner-Fraser, M. (1997) Coordinate actions of BMPs, Wnts, Shh and noggin mediate patterning of the dorsal somite. Development, 124, 3955-3963.
Markham, L.W., Kinnett, K., Wong, B.L., Woodrow Benson, D. and Cripe, L.H. (2008) Corticosteroid treatment retards development of ventricular dysfunction in Duchenne muscular dystrophy. Neuromuscul Disord, 18, 365-370.
Marotta, M., Ruiz-Roig, C., Sarria, Y., Peiro, J.L., Nunez, F., Ceron, J., Munell, F. and Roig-Quilis, M. (2009) Muscle genome-wide expression profiling during disease evolution in mdx mice. Physiol Genomics, 37, 119-132.
Martin, G.R. (1981) Isolation of a pluripotent cell line from early mouse embryos cultured in medium conditioned by teratocarcinoma stem cells. Proc Natl Acad Sci U S A, 78, 7634-7638.
Matsumura, K., Ervasti, J.M., Ohlendieck, K., Kahl, S.D. and Campbell, K.P. (1992) Association of dystrophin-related protein with dystrophin-associated proteins in mdx mouse muscle. Nature, 360, 588-591.
Matsuoka, S., Edwards, M.C., Bai, C., Parker, S., Zhang, P., Baldini, A., Harper, J.W. and Elledge, S.J. (1995) p57KIP2, a structurally distinct member of the p21CIP1 Cdk inhibitor family, is a candidate tumor suppressor gene. Genes Dev, 9, 650-662.
Matsuoka, S., Thompson, J.S., Edwards, M.C., Bartletta, J.M., Grundy, P., Kalikin, L.M., Harper, J.W., Elledge, S.J. and Feinberg, A.P. (1996) Imprinting of the gene encoding a human cyclin-dependent kinase inhibitor, p57KIP2, on chromosome 11p15. Proc Natl Acad Sci U S A, 93, 3026-3030.
Mauro, A. (1961) Satellite cell of skeletal muscle fibers. J Biophys Biochem Cytol, 9, 493-495. McCarthy, T.L., Centrella, M. and Canalis, E. (1992) Constitutive synthesis of insulin-like
growth factor-II by primary osteoblast-enriched cultures from fetal rat calvariae. Endocrinology, 130, 1303-1308.
McDermott, A., Gustafsson, M., Elsam, T., Hui, C.C., Emerson, C.P., Jr. and Borycki, A.G. (2005) Gli2 and Gli3 have redundant and context-dependent function in skeletal muscle formation. Development, 132, 345-357.
Meissner, A., Wernig, M. and Jaenisch, R. (2007) Direct reprogramming of genetically unmodified fibroblasts into pluripotent stem cells. Nat Biotechnol, 25, 1177-1181.
Melacini, P., Vianello, A., Villanova, C., Fanin, M., Miorin, M., Angelini, C. and Dalla Volta,

347
S. (1996) Cardiac and respiratory involvement in advanced stage Duchenne muscular dystrophy. Neuromuscul Disord, 6, 367-376.
Mendell, J.R., Campbell, K., Rodino-Klapac, L., Sahenk, Z., Shilling, C., Lewis, S., Bowles, D., Gray, S., Li, C., Galloway, G., Malik, V., Coley, B., Clark, K.R., Li, J., Xiao, X., Samulski, J., McPhee, S.W., Samulski, R.J. and Walker, C.M. (2010) Dystrophin immunity in Duchenne's muscular dystrophy. N Engl J Med, 363, 1429-1437.
Mendell, J.R., Kissel, J.T., Amato, A.A., King, W., Signore, L., Prior, T.W., Sahenk, Z., Benson, S., McAndrew, P.E., Rice, R. and et al. (1995) Myoblast transfer in the treatment of Duchenne's muscular dystrophy. N Engl J Med, 333, 832-838.
Merlini, L., Gennari, M., Malaspina, E., Cecconi, I., Armaroli, A., Gnudi, S., Talim, B., Ferlini, A., Cicognani, A. and Franzoni, E. (2012) Early corticosteroid treatment in 4 Duchenne muscular dystrophy patients: 14-year follow-up. Muscle Nerve, 45, 796-802.
Merrick, D., Chen, H.C., Larner, D. and Smith, J. (2010) Adult and embryonic skeletal muscle microexplant culture and isolation of skeletal muscle stem cells. J Vis Exp.
Merrick, D. and Smith, J. (unpublished). Merrick, D., Stadler, L.K., Larner, D. and Smith, J. (2009) Muscular dystrophy begins early in
embryonic development deriving from stem cell loss and disrupted skeletal muscle formation. Dis Model Mech, 2, 374-388.
Merrick, D., Ting, T., Stadler, L.K. and Smith, J. (2007) A role for Insulin-like growth factor 2 in specification of the fast skeletal muscle fibre. BMC Dev Biol, 7, 65.
Mertes, H., Pennings, G. and Van Steirteghem, A. (2006) An ethical analysis of alternative methods to obtain pluripotent stem cells without destroying embryos. Hum Reprod, 21, 2749-2755.
Metzger, T., Gache, V., Xu, M., Cadot, B., Folker, E.S., Richardson, B.E., Gomes, E.R. and Baylies, M.K. (2012) MAP and kinesin-dependent nuclear positioning is required for skeletal muscle function. Nature, 484, 120-124.
Miller, J.B., Crow, M.T. and Stockdale, F.E. (1985) Slow and fast myosin heavy chain content defines three types of myotubes in early muscle cell cultures. J Cell Biol, 101, 1643-1650.
Miller, J.B. and Stockdale, F.E. (1986) Developmental origins of skeletal muscle fibers: clonal analysis of myogenic cell lineages based on expression of fast and slow myosin heavy chains. Proc Natl Acad Sci U S A, 83, 3860-3864.
Minasi, M.G., Riminucci, M., De Angelis, L., Borello, U., Berarducci, B., Innocenzi, A., Caprioli, A., Sirabella, D., Baiocchi, M., De Maria, R., Boratto, R., Jaffredo, T., Broccoli, V., Bianco, P. and Cossu, G. (2002) The meso-angioblast: a multipotent, self-renewing cell that originates from the dorsal aorta and differentiates into most mesodermal tissues. Development, 129, 2773-2783.
Minetti, C., Bado, M., Broda, P., Sotgia, F., Bruno, C., Galbiati, F., Volonte, D., Lucania, G.,

348
Pavan, A., Bonilla, E., Lisanti, M.P. and Cordone, G. (2002) Impairment of caveolae formation and T-system disorganization in human muscular dystrophy with caveolin-3 deficiency. Am J Pathol, 160, 265-270.
Minetti, C., Sotgia, F., Bruno, C., Scartezzini, P., Broda, P., Bado, M., Masetti, E., Mazzocco, M., Egeo, A., Donati, M.A., Volonte, D., Galbiati, F., Cordone, G., Bricarelli, F.D., Lisanti, M.P. and Zara, F. (1998) Mutations in the caveolin-3 gene cause autosomal dominant limb-girdle muscular dystrophy. Nat Genet, 18, 365-368.
Mizunoya, W., Upadhaya, R., Burczynski, F.J., Wang, G. and Anderson, J.E. (2011) Nitric-oxide donors improve prednisone effects on muscular dystrophy in the mdx mouse diaphragm. Am J Physiol Cell Physiol.
Mohamet, L., Heath, J.K. and Kimber, S.J. (2009) Determining the LIF-sensitive period for implantation using a LIF-receptor antagonist. Reproduction, 138, 827-836.
Molkentin, J.D., Black, B.L., Martin, J.F. and Olson, E.N. (1995) Cooperative activation of muscle gene expression by MEF2 and myogenic bHLH proteins. Cell, 83, 1125-1136.
Morrione, A., Valentinis, B., Xu, S.Q., Yumet, G., Louvi, A., Efstratiadis, A. and Baserga, R. (1997) Insulin-like growth factor II stimulates cell proliferation through the insulin receptor. Proc Natl Acad Sci U S A, 94, 3777-3782.
Morris, G.E., Sedgwick, S.G., Ellis, J.M., Pereboev, A., Chamberlain, J.S. and Nguyen thi, M. (1998) An epitope structure for the C-terminal domain of dystrophin and utrophin. Biochemistry, 37, 11117-11127.
Murray, T.V., McMahon, J.M., Howley, B.A., Stanley, A., Ritter, T., Mohr, A., Zwacka, R. and Fearnhead, H.O. (2008) A non-apoptotic role for caspase-9 in muscle differentiation. J Cell Sci, 121, 3786-3793.
Nabeshima, Y., Hanaoka, K., Hayasaka, M., Esumi, E., Li, S. and Nonaka, I. (1993) Myogenin gene disruption results in perinatal lethality because of severe muscle defect. Nature, 364, 532-535.
Nagy, A., Gocza, E., Diaz, E.M., Prideaux, V.R., Ivanyi, E., Markkula, M. and Rossant, J. (1990) Embryonic stem cells alone are able to support fetal development in the mouse. Development, 110, 815-821.
Naidu, P.S., Ludolph, D.C., To, R.Q., Hinterberger, T.J. and Konieczny, S.F. (1995) Myogenin and MEF2 function synergistically to activate the MRF4 promoter during myogenesis. Mol Cell Biol, 15, 2707-2718.
Nakamura, A. and Takeda, S. (2011) Mammalian models of Duchenne Muscular Dystrophy: pathological characteristics and therapeutic applications. J Biomed Biotechnol, 2011, 184393.
Nakasaki, M., Yoshioka, K., Miyamoto, Y., Sasaki, T., Yoshikawa, H. and Itoh, K. (2008) IGF-I secreted by osteoblasts acts as a potent chemotactic factor for osteoblasts. Bone, 43, 869-879.

349
Nguyen, T.M., Ginjaar, I.B., van Ommen, G.J. and Morris, G.E. (1992) Monoclonal antibodies for dystrophin analysis. Epitope mapping and improved binding to SDS-treated muscle sections. Biochem J, 288 ( Pt 2), 663-668.
Niebrqj-Dobosz, I., Fidzianska, A., Glinka, Z. and al., e. (1997) Comparative Studies of Hind Limb and Diaphragm Muscles of mdx Mice. Basic and applied myology 7, 381-386.
Niwa, H., Burdon, T., Chambers, I. and Smith, A. (1998) Self-renewal of pluripotent embryonic stem cells is mediated via activation of STAT3. Genes Dev, 12, 2048-2060.
Nixon, S.J., Carter, A., Wegner, J., Ferguson, C., Floetenmeyer, M., Riches, J., Key, B., Westerfield, M. and Parton, R.G. (2007) Caveolin-1 is required for lateral line neuromast and notochord development. J Cell Sci, 120, 2151-2161.
Nixon, S.J., Wegner, J., Ferguson, C., Mery, P.F., Hancock, J.F., Currie, P.D., Key, B., Westerfield, M. and Parton, R.G. (2005) Zebrafish as a model for caveolin-associated muscle disease; caveolin-3 is required for myofibril organization and muscle cell patterning. Hum Mol Genet, 14, 1727-1743.
Odorico, J.S., Kaufman, D.S. and Thomson, J.A. (2001) Multilineage differentiation from human embryonic stem cell lines. Stem Cells, 19, 193-204.
Ohlendieck, K., Ervasti, J.M., Matsumura, K., Kahl, S.D., Leveille, C.J. and Campbell, K.P. (1991) Dystrophin-related protein is localized to neuromuscular junctions of adult skeletal muscle. Neuron, 7, 499-508.
Okamoto, T., Schlegel, A., Scherer, P.E. and Lisanti, M.P. (1998) Caveolins, a family of scaffolding proteins for organizing "preassembled signaling complexes" at the plasma membrane. J Biol Chem, 273, 5419-5422.
Okita, K., Ichisaka, T. and Yamanaka, S. (2007) Generation of germline-competent induced pluripotent stem cells. Nature, 448, 313-317.
Okumura, N., Hashida-Okumura, A., Kita, K., Matsubae, M., Matsubara, T., Takao, T. and Nagai, K. (2005) Proteomic analysis of slow- and fast-twitch skeletal muscles. Proteomics, 5, 2896-2906.
Olguin, H.C. and Olwin, B.B. (2004) Pax-7 up-regulation inhibits myogenesis and cell cycle progression in satellite cells: a potential mechanism for self-renewal. Dev Biol, 275, 375-388.
Ono, K., Iwanaga, Y., Hirayama, M., Kawamura, T., Sowa, N. and Hasegawa, K. (2004) Contribution of caveolin-1 alpha and Akt to TNF-alpha-induced cell death. Am J Physiol Lung Cell Mol Physiol, 287, L201-209.
Ordahl, C.P. and Le Douarin, N.M. (1992) Two myogenic lineages within the developing somite. Development, 114, 339-353.
Ott, M.O., Bober, E., Lyons, G., Arnold, H. and Buckingham, M. (1991) Early expression of the myogenic regulatory gene, myf-5, in precursor cells of skeletal muscle in the

350
mouse embryo. Development, 111, 1097-1107. Oustanina, S., Hause, G. and Braun, T. (2004) Pax7 directs postnatal renewal and propagation
of myogenic satellite cells but not their specification. EMBO J, 23, 3430-3439. Ousterout, D.G., Perez-Pinera, P., Thakore, P.I., Kabadi, A.M., Brown, M.T., Qin, X., Fedrigo,
O., Mouly, V., Tremblay, J.P. and Gersbach, C.A. (2013) Reading Frame Correction by Targeted Genome Editing Restores Dystrophin Expression in Cells From Duchenne Muscular Dystrophy Patients. Mol Ther.
Pallafacchina, G., Calabria, E., Serrano, A.L., Kalhovde, J.M. and Schiaffino, S. (2002) A protein kinase B-dependent and rapamycin-sensitive pathway controls skeletal muscle growth but not fiber type specification. Proc Natl Acad Sci U S A, 99, 9213-9218.
Park, D.S., Woodman, S.E., Schubert, W., Cohen, A.W., Frank, P.G., Chandra, M., Shirani, J., Razani, B., Tang, B., Jelicks, L.A., Factor, S.M., Weiss, L.M., Tanowitz, H.B. and Lisanti, M.P. (2002) Caveolin-1/3 double-knockout mice are viable, but lack both muscle and non-muscle caveolae, and develop a severe cardiomyopathic phenotype. Am J Pathol, 160, 2207-2217.
Park, S., Hong, Y., Lee, Y., Won, J. and Chang, K.T. (2012) Differential expression of caveolins and myosin heavy chains in response to forced exercise in rats. Lab Anim Res, 28, 1-9.
Parker, A.E., Robb, S.A., Chambers, J., Davidson, A.C., Evans, K., O'Dowd, J., Williams, A.J. and Howard, R.S. (2005) Analysis of an adult Duchenne muscular dystrophy population. Qjm, 98, 729-736.
Parton, R.G., Way, M., Zorzi, N. and Stang, E. (1997) Caveolin-3 associates with developing T-tubules during muscle differentiation. J Cell Biol, 136, 137-154.
Pasi, C.E., Dereli-Oz, A., Negrini, S., Friedli, M., Fragola, G., Lombardo, A., Van Houwe, G., Naldini, L., Casola, S., Testa, G., Trono, D., Pelicci, P.G. and Halazonetis, T.D. (2011) Genomic instability in induced stem cells. Cell Death Differ, 18, 745-753.
Passier, R. and Mummery, C. (2003) Origin and use of embryonic and adult stem cells in differentiation and tissue repair. Cardiovasc Res, 58, 324-335.
Pasternak, C., Wong, S. and Elson, E.L. (1995) Mechanical function of dystrophin in muscle cells. J Cell Biol, 128, 355-361.
Pearce, M., Blake, D.J., Tinsley, J.M., Byth, B.C., Campbell, L., Monaco, A.P. and Davies, K.E. (1993) The utrophin and dystrophin genes share similarities in genomic structure. Hum Mol Genet, 2, 1765-1772.
Pedrosa-Domellof, F. and Thornell, L.E. (1994) Expression of myosin heavy chain isoforms in developing human muscle spindles. J Histochem Cytochem, 42, 77-88.
Penn, B.H., Bergstrom, D.A., Dilworth, F.J., Bengal, E. and Tapscott, S.J. (2004) A MyoD-generated feed-forward circuit temporally patterns gene expression during skeletal muscle differentiation. Genes Dev, 18, 2348-2353.

351
Pereboev, A.V., Ahmed, N., thi Man, N. and Morris, G.E. (2001) Epitopes in the interacting regions of beta-dystroglycan (PPxY motif) and dystrophin (WW domain). Biochim Biophys Acta, 1527, 54-60.
Pette, D. and Staron, R.S. (2000) Myosin isoforms, muscle fiber types, and transitions. Microsc Res Tech, 50, 500-509.
Phelps, S.F., Hauser, M.A., Cole, N.M., Rafael, J.A., Hinkle, R.T., Faulkner, J.A. and Chamberlain, J.S. (1995) Expression of full-length and truncated dystrophin mini-genes in transgenic mdx mice. Hum Mol Genet, 4, 1251-1258.
Pons, F., Augier, N., Leger, J.O., Robert, A., Tome, F.M., Fardeau, M., Voit, T., Nicholson, L.V., Mornet, D. and Leger, J.J. (1991) A homologue of dystrophin is expressed at the neuromuscular junctions of normal individuals and DMD patients, and of normal and mdx mice. Immunological evidence. FEBS Lett, 282, 161-165.
Popplewell, L.J., Adkin, C., Arechavala-Gomeza, V., Aartsma-Rus, A., de Winter, C.L., Wilton, S.D., Morgan, J.E., Muntoni, F., Graham, I.R. and Dickson, G. (2010) Comparative analysis of antisense oligonucleotide sequences targeting exon 53 of the human DMD gene: Implications for future clinical trials. Neuromuscul Disord, 20, 102-110.
Porter, J.D., Khanna, S., Kaminski, H.J., Rao, J.S., Merriam, A.P., Richmonds, C.R., Leahy, P., Li, J., Guo, W. and Andrade, F.H. (2002) A chronic inflammatory response dominates the skeletal muscle molecular signature in dystrophin-deficient mdx mice. Hum Mol Genet, 11, 263-272.
Porter, J.D., Merriam, A.P., Leahy, P., Gong, B. and Khanna, S. (2003) Dissection of temporal gene expression signatures of affected and spared muscle groups in dystrophin-deficient (mdx) mice. Hum Mol Genet, 12, 1813-1821.
Pourquie, O., Fan, C.M., Coltey, M., Hirsinger, E., Watanabe, Y., Breant, C., Francis-West, P., Brickell, P., Tessier-Lavigne, M. and Le Douarin, N.M. (1996) Lateral and axial signals involved in avian somite patterning: a role for BMP4. Cell, 84, 461-471.
Pownall, M.E., Gustafsson, M.K. and Emerson, C.P., Jr. (2002) Myogenic regulatory factors and the specification of muscle progenitors in vertebrate embryos. Annu Rev Cell Dev Biol, 18, 747-783.
Prelle, K., Wobus, A.M., Krebs, O., Blum, W.F. and Wolf, E. (2000) Overexpression of insulin-like growth factor-II in mouse embryonic stem cells promotes myogenic differentiation. Biochem Biophys Res Commun, 277, 631-638.
Prins, K.W., Humston, J.L., Mehta, A., Tate, V., Ralston, E. and Ervasti, J.M. (2009) Dystrophin is a microtubule-associated protein. J Cell Biol, 186, 363-369.
Puente, L.G., Voisin, S., Lee, R.E. and Megeney, L.A. (2006) Reconstructing the regulatory kinase pathways of myogenesis from phosphopeptide data. Mol Cell Proteomics, 5, 2244-2251.

352
Pullen, A.H. (1977) The distribution and relative sizes of three histochemical fibre types in the rat tibialis anterior muscle. J Anat, 123, 1-19.
Puri, P.L., Sartorelli, V., Yang, X.J., Hamamori, Y., Ogryzko, V.V., Howard, B.H., Kedes, L., Wang, J.Y., Graessmann, A., Nakatani, Y. and Levrero, M. (1997) Differential roles of p300 and PCAF acetyltransferases in muscle differentiation. Mol Cell, 1, 35-45.
Qu-Petersen, Z., Deasy, B., Jankowski, R., Ikezawa, M., Cummins, J., Pruchnic, R., Mytinger, J., Cao, B., Gates, C., Wernig, A. and Huard, J. (2002) Identification of a novel population of muscle stem cells in mice: potential for muscle regeneration. J Cell Biol, 157, 851-864.
Quach, N.L., Biressi, S., Reichardt, L.F., Keller, C. and Rando, T.A. (2009) Focal adhesion kinase signaling regulates the expression of caveolin 3 and beta1 integrin, genes essential for normal myoblast fusion. Mol Biol Cell, 20, 3422-3435.
Radel, C. and Rizzo, V. (2005) Integrin mechanotransduction stimulates caveolin-1 phosphorylation and recruitment of Csk to mediate actin reorganization. Am J Physiol Heart Circ Physiol, 288, H936-945.
Rafael, J.A., Nitta, Y., Peters, J. and Davies, K.E. (2000) Testing of SHIRPA, a mouse phenotypic assessment protocol, on Dmd(mdx) and Dmd(mdx3cv) dystrophin-deficient mice. Mamm Genome, 11, 725-728.
Ramirez, M.I., Pollack, L., Millien, G., Cao, Y.X., Hinds, A. and Williams, M.C. (2002) The alpha-isoform of caveolin-1 is a marker of vasculogenesis in early lung development. J Histochem Cytochem, 50, 33-42.
Ramos-Mejia, V., Munoz-Lopez, M., Garcia-Perez, J.L. and Menendez, P. (2010) iPSC lines that do not silence the expression of the ectopic reprogramming factors may display enhanced propensity to genomic instability. Cell Res, 20, 1092-1095.
Razani, B., Combs, T.P., Wang, X.B., Frank, P.G., Park, D.S., Russell, R.G., Li, M., Tang, B., Jelicks, L.A., Scherer, P.E. and Lisanti, M.P. (2002) Caveolin-1-deficient mice are lean, resistant to diet-induced obesity, and show hypertriglyceridemia with adipocyte abnormalities. J Biol Chem, 277, 8635-8647.
Reardon, K.A., Kapsa, R.M., Davis, J., Kornberg, A.J., Austin, L., Choong, P. and Byrne, E. (2000) Increased levels of leukemia inhibitory factor mRNA in muscular dystrophy and human muscle trauma. Muscle Nerve, 23, 962-966.
Relaix, F., Montarras, D., Zaffran, S., Gayraud-Morel, B., Rocancourt, D., Tajbakhsh, S., Mansouri, A., Cumano, A. and Buckingham, M. (2006) Pax3 and Pax7 have distinct and overlapping functions in adult muscle progenitor cells. J Cell Biol, 172, 91-102.
Relaix, F., Rocancourt, D., Mansouri, A. and Buckingham, M. (2004) Divergent functions of murine Pax3 and Pax7 in limb muscle development. Genes Dev, 18, 1088-1105.
Ren, H., Yin, P. and Duan, C. (2008) IGFBP-5 regulates muscle cell differentiation by binding to IGF-II and switching on the IGF-II auto-regulation loop. J Cell Biol, 182, 979-991.
353
Repetto, S., Bado, M., Broda, P., Lucania, G., Masetti, E., Sotgia, F., Carbone, I., Pavan, A., Bonilla, E., Cordone, G., Lisanti, M.P. and Minetti, C. (1999) Increased number of caveolae and caveolin-3 overexpression in Duchenne muscular dystrophy. Biochem Biophys Res Commun, 261, 547-550.
Reubinoff, B.E., Pera, M.F., Fong, C.Y., Trounson, A. and Bongso, A. (2000) Embryonic stem cell lines from human blastocysts: somatic differentiation in vitro. Nat Biotechnol, 18, 399-404.
Reynaud, E.G., Pelpel, K., Guillier, M., Leibovitch, M.P. and Leibovitch, S.A. (1999) p57(Kip2) stabilizes the MyoD protein by inhibiting cyclin E-Cdk2 kinase activity in growing myoblasts. Mol Cell Biol, 19, 7621-7629.
Rhodes, S.J. and Konieczny, S.F. (1989) Identification of MRF4: a new member of the muscle regulatory factor gene family. Genes Dev, 3, 2050-2061.
Rigoletto, C., Prelle, A., Ciscato, P., Moggio, M., Comi, G., Fortunato, F. and Scarlato, G. (1995) Utrophin expression during human fetal development. Int J Dev Neurosci, 13, 585-593.
Ross, J.J., Duxson, M.J. and Harris, A.J. (1987) Formation of primary and secondary myotubes in rat lumbrical muscles. Development, 100, 383-394.
Rybakova, I.N., Humston, J.L., Sonnemann, K.J. and Ervasti, J.M. (2006) Dystrophin and utrophin bind actin through distinct modes of contact. J Biol Chem, 281, 9996-10001.
Rybakova, I.N., Patel, J.R. and Ervasti, J.M. (2000) The dystrophin complex forms a mechanically strong link between the sarcolemma and costameric actin. J Cell Biol, 150, 1209-1214.
Ryder-Cook, A.S., Sicinski, P., Thomas, K., Davies, K.E., Worton, R.G., Barnard, E.A., Darlison, M.G. and Barnard, P.J. (1988) Localization of the mdx mutation within the mouse dystrophin gene. EMBO J, 7, 3017-3021.
Sabourin, L.A., Girgis-Gabardo, A., Seale, P., Asakura, A. and Rudnicki, M.A. (1999) Reduced differentiation potential of primary MyoD-/- myogenic cells derived from adult skeletal muscle. J Cell Biol, 144, 631-643.
Sainz-Jaspeado, M., Martin-Liberal, J., Lagares-Tena, L., Mateo-Lozano, S., Garcia del Muro, X. and Tirado, O.M. (2011) Caveolin-1 in sarcomas: friend or foe? Oncotarget, 2, 305-312.
Salani, B., Briatore, L., Garibaldi, S., Cordera, R. and Maggi, D. (2008) Caveolin-1 down-regulation inhibits insulin-like growth factor-I receptor signal transduction in H9C2 rat cardiomyoblasts. Endocrinology, 149, 461-465.
Sambasivan, R., Comai, G., Le Roux, I., Gomes, D., Konge, J., Dumas, G., Cimper, C. and Tajbakhsh, S. (2013) Embryonic founders of adult muscle stem cells are primed by the determination gene Mrf4. Dev Biol.
Sampaolesi, M., Torrente, Y., Innocenzi, A., Tonlorenzi, R., D'Antona, G., Pellegrino, M.A.,

354
Barresi, R., Bresolin, N., De Angelis, M.G., Campbell, K.P., Bottinelli, R. and Cossu, G. (2003) Cell therapy of alpha-sarcoglycan null dystrophic mice through intra-arterial delivery of mesoangioblasts. Science, 301, 487-492.
Sanyal, S.K., Johnson, W.W., Thapar, M.K. and Pitner, S.E. (1978) An ultrastructural basis for electrocardiographic alterations associated with Duchenne's progressive muscular dystrophy. Circulation, 57, 1122-1129.
Sargiacomo, M., Scherer, P.E., Tang, Z., Kubler, E., Song, K.S., Sanders, M.C. and Lisanti, M.P. (1995) Oligomeric structure of caveolin: implications for caveolae membrane organization. Proc Natl Acad Sci U S A, 92, 9407-9411.
Sassoon, D., Lyons, G., Wright, W.E., Lin, V., Lassar, A., Weintraub, H. and Buckingham, M. (1989) Expression of two myogenic regulatory factors myogenin and MyoD1 during mouse embryogenesis. Nature, 341, 303-307.
Scherer, P.E., Lewis, R.Y., Volonte, D., Engelman, J.A., Galbiati, F., Couet, J., Kohtz, D.S., van Donselaar, E., Peters, P. and Lisanti, M.P. (1997) Cell-type and tissue-specific expression of caveolin-2. Caveolins 1 and 2 co-localize and form a stable hetero-oligomeric complex in vivo. J Biol Chem, 272, 29337-29346.
Scherer, P.E., Tang, Z., Chun, M., Sargiacomo, M., Lodish, H.F. and Lisanti, M.P. (1995) Caveolin isoforms differ in their N-terminal protein sequence and subcellular distribution. Identification and epitope mapping of an isoform-specific monoclonal antibody probe. J Biol Chem, 270, 16395-16401.
Schertzer, J.D., Ryall, J.G. and Lynch, G.S. (2006) Systemic administration of IGF-I enhances oxidative status and reduces contraction-induced injury in skeletal muscles of mdx dystrophic mice. Am J Physiol Endocrinol Metab, 291, E499-505.
Schlegel, A., Pestell, R.G. and Lisanti, M.P. (2000) Caveolins in cholesterol trafficking and signal transduction: implications for human disease. Front Biosci, 5, D929-937.
Schofield, J., Houzelstein, D., Davies, K., Buckingham, M. and Edwards, Y.H. (1993) Expression of the dystrophin-related protein (utrophin) gene during mouse embryogenesis. Dev Dyn, 198, 254-264.
Schubert, W., Frank, P.G., Woodman, S.E., Hyogo, H., Cohen, D.E., Chow, C.W. and Lisanti, M.P. (2002) Microvascular hyperpermeability in caveolin-1 (-/-) knock-out mice. Treatment with a specific nitric-oxide synthase inhibitor, L-NAME, restores normal microvascular permeability in Cav-1 null mice. J Biol Chem, 277, 40091-40098.
Schubert, W., Sotgia, F., Cohen, A.W., Capozza, F., Bonuccelli, G., Bruno, C., Minetti, C., Bonilla, E., Dimauro, S. and Lisanti, M.P. (2007) Caveolin-1(-/-)- and caveolin-2(-/-)-deficient mice both display numerous skeletal muscle abnormalities, with tubular aggregate formation. Am J Pathol, 170, 316-333.
Schuierer, M.M., Mann, C.J., Bildsoe, H., Huxley, C. and Hughes, S.M. (2005) Analyses of the differentiation potential of satellite cells from myoD-/-, mdx, and PMP22 C22
355
mice. BMC Musculoskelet Disord, 6, 15. Schultz, E. (1996) Satellite cell proliferative compartments in growing skeletal muscles. Dev
Biol, 175, 84-94. Scott, W., Stevens, J. and Binder-Macleod, S.A. (2001) Human skeletal muscle fiber type
classifications. Phys Ther, 81, 1810-1816. Seale, P., Sabourin, L.A., Girgis-Gabardo, A., Mansouri, A., Gruss, P. and Rudnicki, M.A.
(2000) Pax7 is required for the specification of myogenic satellite cells. Cell, 102, 777-786.
Severs, N.J. (1988) Caveolae: static inpocketings of the plasma membrane, dynamic vesicles or plain artifact? J Cell Sci, 90 ( Pt 3), 341-348.
Shack, S., Wang, X.T., Kokkonen, G.C., Gorospe, M., Longo, D.L. and Holbrook, N.J. (2003) Caveolin-induced activation of the phosphatidylinositol 3-kinase/Akt pathway increases arsenite cytotoxicity. Mol Cell Biol, 23, 2407-2414.
Sharma, P., Ghavami, S., Stelmack, G.L., McNeill, K.D., Mutawe, M.M., Klonisch, T., Unruh, H. and Halayko, A.J. (2010) beta-Dystroglycan binds caveolin-1 in smooth muscle: a functional role in caveolae distribution and Ca2+ release. J Cell Sci, 123, 3061-3070.
Sharp, N.J., Kornegay, J.N., Van Camp, S.D., Herbstreith, M.H., Secore, S.L., Kettle, S., Hung, W.Y., Constantinou, C.D., Dykstra, M.J., Roses, A.D. and et al. (1992) An error in dystrophin mRNA processing in golden retriever muscular dystrophy, an animal homologue of Duchenne muscular dystrophy. Genomics, 13, 115-121.
Shavlakadze, T., Chai, J., Maley, K., Cozens, G., Grounds, G., Winn, N., Rosenthal, N. and Grounds, M.D. (2010) A growth stimulus is needed for IGF-1 to induce skeletal muscle hypertrophy in vivo. J Cell Sci, 123, 960-971.
Shiojima, I. and Walsh, K. (2006) Regulation of cardiac growth and coronary angiogenesis by the Akt/PKB signaling pathway. Genes Dev, 20, 3347-3365.
Shiokawa, D., Kobayashi, T. and Tanuma, S. (2002) Involvement of DNase gamma in apoptosis associated with myogenic differentiation of C2C12 cells. J Biol Chem, 277, 31031-31037.
Shu, L., Zhang, X. and Houghton, P.J. (2002) Myogenic differentiation is dependent on both the kinase function and the N-terminal sequence of mammalian target of rapamycin. J Biol Chem, 277, 16726-16732.
Sicinski, P., Geng, Y., Ryder-Cook, A.S., Barnard, E.A., Darlison, M.G. and Barnard, P.J. (1989) The molecular basis of muscular dystrophy in the mdx mouse: a point mutation. Science, 244, 1578-1580.
Singh, R.D., Puri, V., Valiyaveettil, J.T., Marks, D.L., Bittman, R. and Pagano, R.E. (2003) Selective caveolin-1-dependent endocytosis of glycosphingolipids. Mol Biol Cell, 14, 3254-3265.
Sinha, B., Koster, D., Ruez, R., Gonnord, P., Bastiani, M., Abankwa, D., Stan, R.V., Butler-
356
Browne, G., Vedie, B., Johannes, L., Morone, N., Parton, R.G., Raposo, G., Sens, P., Lamaze, C. and Nassoy, P. (2011) Cells respond to mechanical stress by rapid disassembly of caveolae. Cell, 144, 402-413.
Smith, A.G., Heath, J.K., Donaldson, D.D., Wong, G.G., Moreau, J., Stahl, M. and Rogers, D. (1988) Inhibition of pluripotential embryonic stem cell differentiation by purified polypeptides. Nature, 336, 688-690.
Smith, J., Fowkes, G. and Schofield, P.N. (1995) Programmed cell death in dystrophic (mdx) muscle is inhibited by IGF-II. Cell Death Differ, 2, 243-251.
Smith, J., Goldsmith, C., Ward, A. and LeDieu, R. (2000) IGF-II ameliorates the dystrophic phenotype and coordinately down-regulates programmed cell death. Cell Death Differ, 7, 1109-1118.
Smith, J. and Schofield, P.N. (1994) The effects of fibroblast growth factors in long-term primary culture of dystrophic (mdx) mouse muscle myoblasts. Exp Cell Res, 210, 86-93.
Smith, J. and Schofield, P.N. (1997) Stable integration of an mdx skeletal muscle cell line into dystrophic (mdx) skeletal muscle: evidence for stem cell status. Cell Growth Differ, 8, 927-934.
Smythe, G.M., Eby, J.C., Disatnik, M.H. and Rando, T.A. (2003) A caveolin-3 mutant that causes limb girdle muscular dystrophy type 1C disrupts Src localization and activity and induces apoptosis in skeletal myotubes. J Cell Sci, 116, 4739-4749.
Snow, M.H. (1977) The effects of aging on satellite cells in skeletal muscles of mice and rats. Cell Tissue Res, 185, 399-408.
Snyder, M., Huang, X.Y. and Zhang, J.J. (2008) Identification of novel direct Stat3 target genes for control of growth and differentiation. J Biol Chem, 283, 3791-3798.
Soleimani, V.D., Punch, V.G., Kawabe, Y., Jones, A.E., Palidwor, G.A., Porter, C.J., Cross, J.W., Carvajal, J.J., Kockx, C.E., van, I.W.F., Perkins, T.J., Rigby, P.W., Grosveld, F. and Rudnicki, M.A. (2012) Transcriptional dominance of Pax7 in adult myogenesis is due to high-affinity recognition of homeodomain motifs. Dev Cell, 22, 1208-1220.
Song, K.S., Scherer, P.E., Tang, Z., Okamoto, T., Li, S., Chafel, M., Chu, C., Kohtz, D.S. and Lisanti, M.P. (1996) Expression of caveolin-3 in skeletal, cardiac, and smooth muscle cells. Caveolin-3 is a component of the sarcolemma and co-fractionates with dystrophin and dystrophin-associated glycoproteins. J Biol Chem, 271, 15160-15165.
Song, Y.H., Godard, M., Li, Y., Richmond, S.R., Rosenthal, N. and Delafontaine, P. (2005) Insulin-like growth factor I-mediated skeletal muscle hypertrophy is characterized by increased mTOR-p70S6K signaling without increased Akt phosphorylation. J Investig Med, 53, 135-142.
Sotgia, F., Lee, H., Bedford, M.T., Petrucci, T., Sudol, M. and Lisanti, M.P. (2001) Tyrosine phosphorylation of beta-dystroglycan at its WW domain binding motif, PPxY, recruits

357
SH2 domain containing proteins. Biochemistry, 40, 14585-14592. Sotgia, F., Lee, J.K., Das, K., Bedford, M., Petrucci, T.C., Macioce, P., Sargiacomo, M.,
Bricarelli, F.D., Minetti, C., Sudol, M. and Lisanti, M.P. (2000) Caveolin-3 directly interacts with the C-terminal tail of beta -dystroglycan. Identification of a central WW-like domain within caveolin family members. J Biol Chem, 275, 38048-38058.
Spangenburg, E.E. and Booth, F.W. (2002) Multiple signaling pathways mediate LIF-induced skeletal muscle satellite cell proliferation. Am J Physiol Cell Physiol, 283, C204-211.
Spence, M.S., Yip, J. and Erickson, C.A. (1996) The dorsal neural tube organizes the dermamyotome and induces axial myocytes in the avian embryo. Development, 122, 231-241.
Stedman, H.H., Sweeney, H.L., Shrager, J.B., Maguire, H.C., Panettieri, R.A., Petrof, B., Narusawa, M., Leferovich, J.M., Sladky, J.T. and Kelly, A.M. (1991) The mdx mouse diaphragm reproduces the degenerative changes of Duchenne muscular dystrophy. Nature, 352, 536-539.
Stevens, E.D. and Faulkner, J.A. (2000) The capacity of mdx mouse diaphragm muscle to do oscillatory work. J Physiol, 522 Pt 3, 457-466.
Stewart, C.E. and Rotwein, P. (1996) Insulin-like growth factor-II is an autocrine survival factor for differentiating myoblasts. J Biol Chem, 271, 11330-11338.
Stewart, C.L., Kaspar, P., Brunet, L.J., Bhatt, H., Gadi, I., Kontgen, F. and Abbondanzo, S.J. (1992) Blastocyst implantation depends on maternal expression of leukaemia inhibitory factor. Nature, 359, 76-79.
Stockdale, F.E., Nikovits, W., Jr. and Christ, B. (2000) Molecular and cellular biology of avian somite development. Dev Dyn, 219, 304-321.
Strober, J.B. (2006) Therapeutics in duchenne muscular dystrophy. NeuroRx, 3, 225-234. Suchyna, T.M. and Sachs, F. (2007) Mechanosensitive channel properties and membrane
mechanics in mouse dystrophic myotubes. J Physiol, 581, 369-387. Sudo, H., Kodama, H.A., Amagai, Y., Yamamoto, S. and Kasai, S. (1983) In vitro
differentiation and calcification in a new clonal osteogenic cell line derived from newborn mouse calvaria. J Cell Biol, 96, 191-198.
Summerbell, D., Halai, C. and Rigby, P.W. (2002) Expression of the myogenic regulatory factor Mrf4 precedes or is contemporaneous with that of Myf5 in the somitic bud. Mech Dev, 117, 331-335.
Sun, L., Liu, L., Yang, X.J. and Wu, Z. (2004) Akt binds prohibitin 2 and relieves its repression of MyoD and muscle differentiation. J Cell Sci, 117, 3021-3029.
Sun, X.H., Copeland, N.G., Jenkins, N.A. and Baltimore, D. (1991) Id proteins Id1 and Id2 selectively inhibit DNA binding by one class of helix-loop-helix proteins. Mol Cell Biol, 11, 5603-5611.
Suzuki, A., Yoshida, M., Yamamoto, H. and Ozawa, E. (1992) Glycoprotein-binding site of

358
dystrophin is confined to the cysteine-rich domain and the first half of the carboxy-terminal domain. FEBS Lett, 308, 154-160.
Tahir, S.A., Yang, G., Ebara, S., Timme, T.L., Satoh, T., Li, L., Goltsov, A., Ittmann, M., Morrisett, J.D. and Thompson, T.C. (2001) Secreted caveolin-1 stimulates cell survival/clonal growth and contributes to metastasis in androgen-insensitive prostate cancer. Cancer Res, 61, 3882-3885.
Tahir, S.A., Yang, G., Goltsov, A.A., Watanabe, M., Tabata, K., Addai, J., Fattah el, M.A., Kadmon, D. and Thompson, T.C. (2008) Tumor cell-secreted caveolin-1 has proangiogenic activities in prostate cancer. Cancer Res, 68, 731-739.
Tajbakhsh, S., Borello, U., Vivarelli, E., Kelly, R., Papkoff, J., Duprez, D., Buckingham, M. and Cossu, G. (1998) Differential activation of Myf5 and MyoD by different Wnts in explants of mouse paraxial mesoderm and the later activation of myogenesis in the absence of Myf5. Development, 125, 4155-4162.
Tajbakhsh, S., Rocancourt, D. and Buckingham, M. (1996) Muscle progenitor cells failing to respond to positional cues adopt non-myogenic fates in myf-5 null mice. Nature, 384, 266-270.
Tajbakhsh, S., Rocancourt, D., Cossu, G. and Buckingham, M. (1997) Redefining the genetic hierarchies controlling skeletal myogenesis: Pax-3 and Myf-5 act upstream of MyoD. Cell, 89, 127-138.
Takahashi, K., Tanabe, K., Ohnuki, M., Narita, M., Ichisaka, T., Tomoda, K. and Yamanaka, S. (2007) Induction of pluripotent stem cells from adult human fibroblasts by defined factors. Cell, 131, 861-872.
Takahashi, K. and Yamanaka, S. (2006) Induction of pluripotent stem cells from mouse embryonic and adult fibroblast cultures by defined factors. Cell, 126, 663-676.
Tanabe, Y., Esaki, K. and Nomura, T. (1986) Skeletal muscle pathology in X chromosome-linked muscular dystrophy (mdx) mouse. Acta Neuropathol, 69, 91-95.
Tatsumi, R., Anderson, J.E., Nevoret, C.J., Halevy, O. and Allen, R.E. (1998) HGF/SF is present in normal adult skeletal muscle and is capable of activating satellite cells. Dev Biol, 194, 114-128.
Thomson, J.A., Itskovitz-Eldor, J., Shapiro, S.S., Waknitz, M.A., Swiergiel, J.J., Marshall, V.S. and Jones, J.M. (1998) Embryonic stem cell lines derived from human blastocysts. Science, 282, 1145-1147.
Tinsley, J., Deconinck, N., Fisher, R., Kahn, D., Phelps, S., Gillis, J.M. and Davies, K. (1998) Expression of full-length utrophin prevents muscular dystrophy in mdx mice. Nat Med, 4, 1441-1444.
Tinsley, J.M., Blake, D.J., Roche, A., Fairbrother, U., Riss, J., Byth, B.C., Knight, A.E., Kendrick-Jones, J., Suthers, G.K., Love, D.R. and et al. (1992) Primary structure of dystrophin-related protein. Nature, 360, 591-593.

359
Tkatchenko, A.V., Le Cam, G., Leger, J.J. and Dechesne, C.A. (2000) Large-scale analysis of differential gene expression in the hindlimb muscles and diaphragm of mdx mouse. Biochim Biophys Acta, 1500, 17-30.
Torrente, Y., Tremblay, J.P., Pisati, F., Belicchi, M., Rossi, B., Sironi, M., Fortunato, F., El Fahime, M., D'Angelo, M.G., Caron, N.J., Constantin, G., Paulin, D., Scarlato, G. and Bresolin, N. (2001) Intraarterial injection of muscle-derived CD34(+)Sca-1(+) stem cells restores dystrophin in mdx mice. J Cell Biol, 152, 335-348.
Torres, L.F. and Duchen, L.W. (1987) The mutant mdx: inherited myopathy in the mouse. Morphological studies of nerves, muscles and end-plates. Brain, 110 ( Pt 2), 269-299.
Towbin, H., Staehelin, T. and Gordon, J. (1979) Electrophoretic transfer of proteins from polyacrylamide gels to nitrocellulose sheets: procedure and some applications. Proc Natl Acad Sci U S A, 76, 4350-4354.
Tremblay, P., Dietrich, S., Mericskay, M., Schubert, F.R., Li, Z. and Paulin, D. (1998) A crucial role for Pax3 in the development of the hypaxial musculature and the long-range migration of muscle precursors. Dev Biol, 203, 49-61.
Uchida, Y., Maeda, Y., Kimura, E., Yamashita, S., Nishida, Y., Arima, T., Hirano, T., Uyama, E., Mita, S. and Uchino, M. (2005) Effective repetitive dystrophin gene transfer into skeletal muscle of adult mdx mice using a helper-dependent adenovirus vector expressing the coxsackievirus and adenovirus receptor (CAR) and dystrophin. J Gene Med, 7, 1010-1022.
Vaghy, P.L., Fang, J., Wu, W. and Vaghy, L.P. (1998) Increased caveolin-3 levels in mdx mouse muscles. FEBS Lett, 431, 125-127.
Vakakis, N., Bower, J. and Austin, L. (1995) In vitro myoblast to myotube transformations in the presence of leukemia inhibitory factor. Neurochem Int, 27, 329-335.
Valentine, B.A., Cooper, B.J., Cummings, J.F. and de Lahunta, A. (1990) Canine X-linked muscular dystrophy: morphologic lesions. J Neurol Sci, 97, 1-23.
Valentine, B.A., Cooper, B.J., de Lahunta, A., O'Quinn, R. and Blue, J.T. (1988) Canine X-linked muscular dystrophy. An animal model of Duchenne muscular dystrophy: clinical studies. J Neurol Sci, 88, 69-81.
van der Velden, J.L., Langen, R.C., Kelders, M.C., Wouters, E.F., Janssen-Heininger, Y.M. and Schols, A.M. (2006) Inhibition of glycogen synthase kinase-3beta activity is sufficient to stimulate myogenic differentiation. Am J Physiol Cell Physiol, 290, C453-462.
van Deutekom, J.C., Bremmer-Bout, M., Janson, A.A., Ginjaar, I.B., Baas, F., den Dunnen, J.T. and van Ommen, G.J. (2001) Antisense-induced exon skipping restores dystrophin expression in DMD patient derived muscle cells. Hum Mol Genet, 10, 1547-1554.
van Putten, M., Hulsker, M., Nadarajah, V.D., van Heiningen, S.H., van Huizen, E., van Iterson, M., Admiraal, P., Messemaker, T., den Dunnen, J.T., t Hoen, P.A. and

360
Aartsma-Rus, A. (2012) The effects of low levels of dystrophin on mouse muscle function and pathology. PLoS One, 7, e31937.
Venters, S.J., Thorsteinsdottir, S. and Duxson, M.J. (1999) Early development of the myotome in the mouse. Dev Dyn, 216, 219-232.
Vitorino, R., Ferreira, R., Neuparth, M., Guedes, S., Williams, J., Tomer, K.B., Domingues, P.M., Appell, H.J., Duarte, J.A. and Amado, F.M. (2007) Subcellular proteomics of mice gastrocnemius and soleus muscles. Anal Biochem, 366, 156-169.
Volonte, D., Liu, Y. and Galbiati, F. (2005) The modulation of caveolin-1 expression controls satellite cell activation during muscle repair. Faseb J, 19, 237-239.
Volonte, D., McTiernan, C.F., Drab, M., Kasper, M. and Galbiati, F. (2008) Caveolin-1 and caveolin-3 form heterooligomeric complexes in atrial cardiac myocytes that are required for doxorubicin-induced apoptosis. Am J Physiol Heart Circ Physiol, 294, H392-401.
Volonte, D., Peoples, A.J. and Galbiati, F. (2003) Modulation of myoblast fusion by caveolin-3 in dystrophic skeletal muscle cells: implications for Duchenne muscular dystrophy and limb-girdle muscular dystrophy-1C. Mol Biol Cell, 14, 4075-4088.
Volonte, D., Zhang, K., Lisanti, M.P. and Galbiati, F. (2002) Expression of caveolin-1 induces premature cellular senescence in primary cultures of murine fibroblasts. Mol Biol Cell, 13, 2502-2517.
von Maltzahn, J., Jones, A.E., Parks, R.J. and Rudnicki, M.A. (2013) Pax7 is critical for the normal function of satellite cells in adult skeletal muscle. Proc Natl Acad Sci U S A, 110, 16474-16479.
Vorobyov, E. and Horst, J. (2004) Expression of two protein isoforms of PAX7 is controlled by competing cleavage-polyadenylation and splicing. Gene, 342, 107-112.
Vyas, D.R., Spangenburg, E.E., Abraha, T.W., Childs, T.E. and Booth, F.W. (2002) GSK-3beta negatively regulates skeletal myotube hypertrophy. Am J Physiol Cell Physiol, 283, C545-551.
Wang, J. and Walsh, K. (1996) Resistance to apoptosis conferred by Cdk inhibitors during myocyte differentiation. Science, 273, 359-361.
Wang, X., Wu, H., Zhang, Z., Liu, S., Yang, J., Chen, X. and Fan, M. (2008) Effects of interleukin-6, leukemia inhibitory factor, and ciliary neurotrophic factor on the proliferation and differentiation of adult human myoblasts. Cell Mol Neurobiol, 28, 113-124.
Wang, Z., Kuhr, C.S., Allen, J.M., Blankinship, M., Gregorevic, P., Chamberlain, J.S., Tapscott, S.J. and Storb, R. (2007) Sustained AAV-mediated dystrophin expression in a canine model of Duchenne muscular dystrophy with a brief course of immunosuppression. Mol Ther, 15, 1160-1166.
Watanabe, M., Yang, G., Cao, G., Tahir, S.A., Naruishi, K., Tabata, K., Fattah, E.A.,

361
Rajagopalan, K., Timme, T.L., Park, S., Kurosaka, S., Edamura, K., Tanimoto, R., Demayo, F.J., Goltsov, A.A. and Thompson, T.C. (2009) Functional analysis of secreted caveolin-1 in mouse models of prostate cancer progression. Mol Cancer Res, 7, 1446-1455.
Watanabe, T., Wang, S., Noritake, J., Sato, K., Fukata, M., Takefuji, M., Nakagawa, M., Izumi, N., Akiyama, T. and Kaibuchi, K. (2004) Interaction with IQGAP1 links APC to Rac1, Cdc42, and actin filaments during cell polarization and migration. Dev Cell, 7, 871-883.
Way, M. and Parton, R.G. (1995) M-caveolin, a muscle-specific caveolin-related protein. FEBS Lett, 376, 108-112.
Weir, A.P., Morgan, J.E. and Davies, K.E. (2004) A-utrophin up-regulation in mdx skeletal muscle is independent of regeneration. Neuromuscul Disord, 14, 19-23.
Wen, Y., Bi, P., Liu, W., Asakura, A., Keller, C. and Kuang, S. (2012) Constitutive Notch activation upregulates Pax7 and promotes the self-renewal of skeletal muscle satellite cells. Mol Cell Biol, 32, 2300-2311.
White, J.D., Davies, M. and Grounds, M.D. (2001) Leukaemia inhibitory factor increases myoblast replication and survival and affects extracellular matrix production: combined in vivo and in vitro studies in post-natal skeletal muscle. Cell Tissue Res, 306, 129-141.
Wigmore, P.M. and Dunglison, G.F. (1998) The generation of fiber diversity during myogenesis. Int J Dev Biol, 42, 117-125.
Wigmore, P.M. and Stickland, N.C. (1983) Muscle development in large and small pig fetuses. J Anat, 137 (Pt 2), 235-245.
Williams, R.L., Hilton, D.J., Pease, S., Willson, T.A., Stewart, C.L., Gearing, D.P., Wagner, E.F., Metcalf, D., Nicola, N.A. and Gough, N.M. (1988) Myeloid leukaemia inhibitory factor maintains the developmental potential of embryonic stem cells. Nature, 336, 684-687.
Williams, T.M., Medina, F., Badano, I., Hazan, R.B., Hutchinson, J., Muller, W.J., Chopra, N.G., Scherer, P.E., Pestell, R.G. and Lisanti, M.P. (2004) Caveolin-1 gene disruption promotes mammary tumorigenesis and dramatically enhances lung metastasis in vivo. Role of Cav-1 in cell invasiveness and matrix metalloproteinase (MMP-2/9) secretion. J Biol Chem, 279, 51630-51646.
Woodman, S.E., Park, D.S., Cohen, A.W., Cheung, M.W., Chandra, M., Shirani, J., Tang, B., Jelicks, L.A., Kitsis, R.N., Christ, G.J., Factor, S.M., Tanowitz, H.B. and Lisanti, M.P. (2002) Caveolin-3 knock-out mice develop a progressive cardiomyopathy and show hyperactivation of the p42/44 MAPK cascade. J Biol Chem, 277, 38988-38997.
Woods, K., Marrone, A. and Smith, J. (2000) Programmed cell death and senescence in skeletal muscle stem cells. Ann N Y Acad Sci, 908, 331-335.

362
Wright, W.E., Sassoon, D.A. and Lin, V.K. (1989) Myogenin, a factor regulating myogenesis, has a domain homologous to MyoD. Cell, 56, 607-617.
Wu, A.L., Kim, J.H., Zhang, C., Unterman, T.G. and Chen, J. (2008) Forkhead box protein O1 negatively regulates skeletal myocyte differentiation through degradation of mammalian target of rapamycin pathway components. Endocrinology, 149, 1407-1414.
Xiao, X., Li, J. and Samulski, R.J. (1996) Efficient long-term gene transfer into muscle tissue of immunocompetent mice by adeno-associated virus vector. J Virol, 70, 8098-8108.
Yaffe, D. and Saxel, O. (1977) Serial passaging and differentiation of myogenic cells isolated from dystrophic mouse muscle. Nature, 270, 725-727.
Yamamoto, M., Toya, Y., Schwencke, C., Lisanti, M.P., Myers, M.G., Jr. and Ishikawa, Y. (1998) Caveolin is an activator of insulin receptor signaling. J Biol Chem, 273, 26962-26968.
Yang, Y., Haecker, S.E., Su, Q. and Wilson, J.M. (1996) Immunology of gene therapy with adenoviral vectors in mouse skeletal muscle. Hum Mol Genet, 5, 1703-1712.
Yang, Y., Xu, Y., Li, W., Wang, G., Song, Y., Yang, G., Han, X., Du, Z., Sun, L. and Ma, K. (2009) STAT3 induces muscle stem cell differentiation by interaction with myoD. Cytokine, 46, 137-141.
Yatsenko, A.S., Gray, E.E., Shcherbata, H.R., Patterson, L.B., Sood, V.D., Kucherenko, M.M., Baker, D. and Ruohola-Baker, H. (2007) A putative Src homology 3 domain binding motif but not the C-terminal dystrophin WW domain binding motif is required for dystroglycan function in cellular polarity in Drosophila. J Biol Chem, 282, 15159-15169.
Yoon, M.S. and Chen, J. (2008) PLD regulates myoblast differentiation through the mTOR-IGF2 pathway. J Cell Sci, 121, 282-289.
Young, A.P. and Wagers, A.J. (2010) Pax3 induces differentiation of juvenile skeletal muscle stem cells without transcriptional upregulation of canonical myogenic regulatory factors. J Cell Sci, 123, 2632-2639.
Yu, J., Vodyanik, M.A., Smuga-Otto, K., Antosiewicz-Bourget, J., Frane, J.L., Tian, S., Nie, J., Jonsdottir, G.A., Ruotti, V., Stewart, R., Slukvin, II and Thomson, J.A. (2007) Induced pluripotent stem cell lines derived from human somatic cells. Science, 318, 1917-1920.
Yuan, W., Condorelli, G., Caruso, M., Felsani, A. and Giordano, A. (1996) Human p300 protein is a coactivator for the transcription factor MyoD. J Biol Chem, 271, 9009-9013.
Zammit, P.S., Golding, J.P., Nagata, Y., Hudon, V., Partridge, T.A. and Beauchamp, J.R. (2004) Muscle satellite cells adopt divergent fates: a mechanism for self-renewal? J Cell Biol, 166, 347-357.
Zammit, P.S., Partridge, T.A. and Yablonka-Reuveni, Z. (2006a) The skeletal muscle satellite cell: the stem cell that came in from the cold. J Histochem Cytochem, 54, 1177-1191.

363
Zammit, P.S., Relaix, F., Nagata, Y., Ruiz, A.P., Collins, C.A., Partridge, T.A. and Beauchamp, J.R. (2006b) Pax7 and myogenic progression in skeletal muscle satellite cells. J Cell Sci, 119, 1824-1832.
Zhang, P., Wong, C., Liu, D., Finegold, M., Harper, J.W. and Elledge, S.J. (1999) p21(CIP1) and p57(KIP2) control muscle differentiation at the myogenin step. Genes Dev, 13, 213-224.
Zhao, Y.Y., Liu, Y., Stan, R.V., Fan, L., Gu, Y., Dalton, N., Chu, P.H., Peterson, K., Ross, J., Jr. and Chien, K.R. (2002) Defects in caveolin-1 cause dilated cardiomyopathy and pulmonary hypertension in knockout mice. Proc Natl Acad Sci U S A, 99, 11375-11380.

364
APPENDIX 1. Material suppliersAB Applied Biosystems (Life Technologies Ltd, 3
Fountain Drive, Inchinnan Business Park,
Paisley, PA4 9RF, UK)
Veriti® 96-Well Thermal Cycler
Alta Bioscience Ltd (AltaBioscience, Building
Y10, University of Birmingham, Edgbaston,
Birmingham, B15 2TT, UK)
Pax7-His/FLAG (Forward):
5'CTACCTCGAGCATCACCATCCACCGGTACG
ATTATGATATTC 3'
Pax7-His/FLAG (Reverse-insert C before AgeI site,
ATC1554GGT):
5'GAATATCATAATCGTACCGGTGGATGGTGA
TGCTCGAGGTAG 3’
Amersham Pharmacia Biotech UK Ltd
(Amersham Place, Little Chalfont,
Buckinghamshire, HP7 9NA, UK)
Anti-Sheep/goat Ig biotinylated whole antibody
from donkey (Cat No. RPN1025V; Lot No. 306822)
Anti-Rabbit Ig biotinylated species specific F(ab)2
fragment from Donkey (Cat No. RPN1064; Batch:
46)
Biotinylated Anti-mouse IgG (whole antibody from
goat) (Cat No. RPN1177; Lot No. 322761)
HybondTMECLTMNitrocellulose Membrane (Cat
NO. RPN203D; Lot No. 1899/66/0407)
Protein A Sepharose CL-4B beads (Cat No.
17078001; Lot No. 10043746)
Beckman Coulter (UK) Ltd ( Oakley Court,
Kingsmead Business Park, London Road, High
Wycombe HP11 1JU, UK)
AvantiTM 30 centrifuge
Becton Dickinson UK Ltd (The Danby Building,
Edmund Halley Road, Oxford Science Park,
Oxford, Oxfordshire OX4 4DQ)
Purified mouse anti-Caveolin 3 monoclonal
Antibody (Cat No. 610420; Lot No. 59391)
Rabbit polyclonal anti-Caveolin 1 Antibody (Cat
No. 610060) Becton Dickinson Labware (Becton Dickinson
Company, Frankline Lakes, NJ, USA)
15 ml falcon tubes BLUEMAXTM Polypropylene
Conical tube (Cat No. 35-2096)
50 ml falcon tubes BLUEMAXTM Polypropylene
Conical tube (Cat No. 35-2070)
Bio-Rad Laboratories Ltd (Bio-Rad House,
Maxted Road, Hemel Hempstead, Hertfordshire,
HP2 7DX, UK)
Mini Protean II Electrophoresis Cell (Cat No. 165-
3301)
Mini Trans-blot blotting Cell (Cat No. 170-3930)
BIOLINE (Unit 16, The Edge Business Centre,
Humber Road, London NW2 6EW, UK)
Agarose molecular grade (Cat No. BIO41025; Lot
No. AG5109K)
Carbolite (Parsons Lane, Hope, Hope Valley, S33
6RB, UK)
Carbolite Incubator
Cell Signalling (Distributed by New England
BioLab in the UK)
mTOR (7C10) rabbit monoclonal antibody (Cat No.
2983P)
Phospho-mTOR (ser2448) rabbit monoclonal
antibody (Cat No. 5536P; Lot No. 1)
Rabbit anti-caspase 3 antibody (Cat No. 9662S)
Rabbit anti-mouse Akt antibody (recognize Akt1,
Akt2 and Akt3) (Cat No. 9272)
Rabbit anti-mouse phospho-Akt (Ser473) antibody
(recognize Akt1, Akt2, Akt3) (Cat No. 9277)
Rabbit anti-Phospho-Src Family (Tyr416) antibody
(Cat No. 2101L)
Src (L4A1) Mouse monoclonal antibody (Cat No.
2110S)
ChromoTek GmbH (Am Klopferspitz 19, 82152

365
Planegg-Martinsried, Germany)
GFP-Trap®A (Cat No. gta-20)
Dako UK Ltd (Dako UK Ltd, Cambridge House,
St. Thomas Place, Ely Cambridgeshire CB7 4EX)
Dakocytomation Fluorescence Mounting Medium
(Cat No. S3023; Lot No. 301514EFG 010104)
DAB chromogen (Cat No. S3000; Lot No.
10032888)
Rabbit serum (normal) (Cat No. X0902; Lot No.
087 (101))
Developmental Studies Hybridoma Bank (DSHB,
Department of Biological Science, University of
Iowa, 007 Biology Building East, Iowa City,
IA52242, USA)
Anti-MF20, Mouse Monoclonal
Mouse anti-mannose 6-phosphate / IGF II receptor,
cation-independent (86F7)
Mouse monoclonal anti-Pax7 antibody
Eppendorf (Eppendorf UK Ltd, Endurance
House, Vision Park, Chivers Way, Histon,
Cambridge CB24 9ZR, UK)
Thermomixer 5436
Fisher Scientific UK Ltd (Bishop Meadow Road,
Loughborough, Leicestershire, LE11 5RG, UK)
Boric Acid (Cat No. B380053; Batch: 0760056)
Chromatography paper 460* 570 mm (Cat No.
FB59515)
Diaminoethanetetra-acetate acid disodium salt
(EDTA) (Cat No. D070053; Batch: 0935537)
DyLight(TM) 800 Conjugates-Streptavidin Thermo
Scientific Pierce (Cat NO. PN21851; Lot NO.
KG137713)
Ethanol, Class 3, analytical reagent grade (Cat No.
E/0650DF/17)
Glycine (Cat No. G/P460/53)
Haemocytometer (Cat No. 0630030; Lot No. 18801)
Methanol (Cat No. M/4000/PK4; Batch No.
0927206)
Nitric acid S.G. 1.42 (70%) (Cat No. N/2300/PB17;
Batch No. 0129758)
Pelletised Paraffin Wax (Cat No. 9774006)
Shandon* Peel-A-Way Disposable Embedding
Molds (Cat No. 2219)
Sodium Chloride (Cat No. 102415K; Batch No.
K3113723 236)
Tri-Sodium Citrate (Cat No. S332053; Batch:
0552934)
Sodium dodecyl sulphate (SDS; Cat No. S/5200/53;
Batch No.0398855)
2-propanol (iosopropanal; Cat No. P/7490/17;
Batch No. 0380943)
TRIS (hydroxylmethyl methylamine; Cat
No.T/P630/53)
Xylene (Cat No. 1330207)
Geneflow Ltd (Fradley Business Centre,
WoodEnd Lane, Fradley, Staffordshire, WS13
8NF, UK)
Protein and sequencing, Electrophoresis Grade (Cat
No. EC-890; Lot No.02-07-16) Protogel, 30%
Acrylaminde, 0.8% (w/V) Bis-Acrylaminde Stock
Solution (37.5:1)
GMBH & CO. KG (Janke & Kunkel-Str. 10,
79219 Staufen, Germany / Deutschland)
IKA®KS 130 basic orbital shaker
Grants Instruments (Cambridge) Ltd, UK (29
Station Road, Shepreth, Cambridgeshire, SG8
6GB, UK)
Water Bath
Invitrogen Ltd (Inchinnan Business Park, 3
Fountain Drive, Paisley, PA4 9RF, UK)
Alexa Fluor® 488 F(ab')2 fragment of goat anti-
mouse IgG (H+L)(Cat No. A11017; Lot No.
991633)
Alexa Fluor® 488 F(ab')2 fragment of goat anti-
rabbit IgG (H+L)(Cat No. A11070; Lot No.
1040038)
366
Dulbecco's Modified Eagle Medium (1×) without
Glutamine (Cat No. 21969-035; Lot No. 670323)
Dulbecco's MEN/Nutrient mix F-12 (Cat No.
21331-046; Lot No. 652053)
Ethdium Bromide Solution (Cat No. 15585011; Lot
No. KH6901)
Geneticin (G418 sulphate)(Cat No. 11811-031; Lot
No. 3068712)
GIBCO BRL 58 horizontal electrophoresis
apparatus
Kanamycine sulfate (Cat No. 11815-024; Lot No.
3053853)
KnockoutTM DMEM (Cat No. 10829; Lot No.
701212)
KNOCKOUTTM Serum Replacer (Cat No. 10828;
Lot No. 637873)
LipofectamineTM 2000 (Cat No. 11668-027; Lot No.
867692)
LipofectamineTM LTX & Plus Reagent (Cat No.
A12621)
Luria Agar (Cat No. 12945028; Lot No. 80235043)
Luria Bruth Base (Cat No. 12795027; Lot No.
80245231))
MEM Non-Essential Amino Acids 100× (Cat No.
11140; Lot No. 709172)
2-Mercaptoethanol (50MM) (Cat No. 31350010;
Lot No. 26F0140)
Jenkons (Scientific) Ltd (Cherrycourt Way,
Stanbridge Road, Leighton Buzzard,
Bedforshire, LU7 4UA, UK)
Uvitec, UV light box
JPK Instruments Limited (Unit 7223,
Cambridge Research Park, Waterbeach,
Cambridge CB25 9TL, UK)
NanoWizard II atomic force microscope
Kendro Laboratory Products Plc (Stortford Hall
Park, Bishop's Sortford, Hertfordshire, CM23
5GZ, UK)
Labofuge 300 Heraeus centrifuge
Heraeus Incubator (D-6450)
Leica Microsystems Ltd, UK (Davy Avenue,
Knowlhill, Milton Keynes, MK5 8LB, UK)
Inverted microscope-Leica DMIRB
Reichert-Jung 1150/Autocut microtome
LI-COR Biotechnology - UK Ltd (St. John's
Innovation Centre, Cowley Road, Cambridge,
CB4 0WS, UK)
Odyssey® infrared imaging system
Odyssey anti-mouse IRDye® 680 (Cat No. 926-
32220; Lot No. B80908_011)
Odyssey anti-rabbit IRDye® 680 (Cat No. 926-
32221; Lot No. B80814-01)
Marval [Premier International Foods (UK) Ltd,
Bridge Road, Long Sutton, Spalding, Lincs PE12
9 EQ, UK]
Non-fat milk
Meyer Prestige Ltd. (Meyer Group Ltd., Wirral
International Business Park, Riverview Road,
Bromborough, Wirral, CH62 3RH, England)
Smart Plus Pressure Cooker
Millipore Ltd (Millipore Ltd, Suite 3 & 5,
Building 6, Croxley Green Business Park,
Watford, WD18 8YH, UK)
ESGRO® (LIF) (Cat No. ESG1107; Lot No.
ME9BN6983)
Molecular Device Ltd (135 Wharfedale Road,
Winnersh Triangle, Winersh, Wokingham, RG41
5RB, UK)
Emax microplate reader
NanoWorld AG (Rue Jaquet-Droz 1, CH-2002
Neuchâtel, Switzerland )
Rectangular Si cantilevers type CONT-L
New Brunswick Scientific (Eppendorf UK Ltd,
Endurance House, Vision Park, Chivers Way,
Histon, Cambridge CB24 9ZR, UK)
INNOVATM 433 refrigerated incubator shaker

367
New England BioLabs (UK) Ltd (75/77 Knowl
Piece, Wilbury Way, Hitchin, Herts. SG4 0TY,
UK)
AgeI (Cat No. Ro552S; Lot No. 36)
AseI (Cat No. R0526S; Lot No. 6)
BspEI (Cat No. R0540S; Lot No. 4)
EcoRI (Cat No. 101S; Lot No. 28)
Gel loading Dye Blue 6x (Cat No. B7021S; Lot No.
0010912)
NEBuffer 1 (Cat No. B7001S; Lot No. 0503, 598)
NEBuffer 3 (Cat No. B7003S; Lot No. 0902, 0303)
NotI (Cat No. R0189S; Lot No. 50)
Prestained Protein Marker, Broad Range (7-175
kDa) (Cat No. P7708S; Lot NO. 0520807)
T4 DNA ligase (Cat No. M0202S; Lot No. 75)
10×Buffer for T4 DNA ligase (Cat No. B02025;
Lot No. 0303A)
Nikon UK Limited (380 Richmond Road,
Kingston Upon Thames, Surrey, KT2 5PR, UK)
Eclipse Ti inverted microscope
Nunc Plasticware (Life Technologies Ltd., 3
Fountain Drive, Ichinnan Business Park, Paisley,
PA4 9RF, UK)
CryoTubeTM vials (Cat No. 375353)
Large culture flasks (175 cm2) (Cat No. 147589A)
Medium culture flasks (75 cm2) (Cat No. 156462)
Small culture flasks (25 cm2) (Cat No. 156367)
30 mm polystyrene petri dish (Cat No. 150318; Lot
No. 116031)
60 mm polystyrene petri dish (Cat No. 150288; Lot
No. 068689)
10 cm polystyrene petri dish (Cat No. 150350; Lot
No. 104912)
24-well plates (Cat No. 143982A)
48-well plates (Cat No. 150787)
96-well plates (Cat No. 167008A)
PALL Life Sciences (Europa House, Havant
Street, Portsmouth, Hampshire, PO1 3PD, UK)
Sterile Acrodisc® Syringe 32 mm Filters with 0.45
μm Supor® Membrane (Cat No. 4654; Lot No.
101084)
Panasonic (Panasonic House, Willoughby Road,
Bracknell, Berkshire RG12 8FP, UK)
microwave
PerkinElmer (PerkinElmer, Saxon Way Bar Hill,
Cambridge, Cambridgeshire, CB23 8SL, UK)
Streptavidin-Texas Red® (Cat No. NEL721001EA;
Lot No. 552578)
TSA™ Biotin System, for 50-150 Slides (Cat No.
NEL700A00 1KL; Lot No. 596949)
Pierce (Perbio Sciences UK Ltd, Century House,
High Street, Tattenhall, Cheshire, CH3 9RJ, UK)
Albumin Standard Samples (Cat No. 23209; Lot No.
EB61479)
Coomassie® Protein Assay Reagent (Cat No.
1856209; Lot No. EC60857)
Polysciences Inc. (Polysciences Europe GmbH,
Handelsstrasse 3, D-69214 Eppelheim, Germany)
Peel-A-Way® Embedding Mold (Square - S22)
(Cat No. 18646A-1)
Promega (Delta House, Southampton Science
Park, Southampton SO16 7NS, UK)
Pfu DNA polymerase (Cat No. M7741; Lot No.
279515)
QIAGEN (QIAGEN House, Fleming Way,
Crawley, West Sussex, RH10 9NQ)
dNTP Mix (10mM each) (Cat No. 201900; Lot No.
124114769)
QIAprep Spin Miniprep Kit (Cat No. 27104)
QIAquick® Gel Extraction Kit (Cat No. 28704)
QIAfilter Plasmid Midi Kit (Cat No. 12243)
R & D systems (R&D Systems Europe Ltd, 19
Barton Lane, Abingdon Science Park, Abingdon,
OX14 3NB, UK)
Recombinant Human IGF-I (Cat No. 291-G1-200)
Recombinant Mouse IGF-II (Cat No. 792-MG-050;

368
Lot No. DFK1709031)
Roche Diagnostic Ltd (Bell Lane, Lewes, East
Sussex, BN7 1LG, UK)
Protease Inhibitor Cocktail tablets (Cat No.
1836153)
Santa Cruz Biotechnology, Inc. (Bergheimer Str.
89-2, 69115 Heidelberg, Germany)
Anti-ERK1(K-23) rabbit polyclonal antibody (Cat
No. sc-94; Lot No. 0609)
Anti-p-ERK (E-4) mouse monoclonal antibody (Cat
No. sc-7383; Lot No. 0910)
Goat anti-Kip2 p57 (M-20) (Cat No. sc-1039; Lot
No. B169, G226)
Sanyo (1-300 Applewood Cres. Concord. Ont,
L4K 5C7, UK)
Soni-pre150 machine (Sonicator)
SARSTEDT (SARSTEDT Ltd, 68 Boston Road,
Beaumont Leys, Leicester LE4 1AW, UK)
Cell scraper (Cat No. 83.1830;Lot no. 7253400)
School of Bioscience Stores, Birmingham
University, UK (University of Birmingham,
Edgbaston, Birmingham, B15 2TT, UK)
Foil, 450 Caterwrap (Cat No. FOI11CC/WRA1)
5 ml bijoux tube
SCHOTT UK Ltd. ( Drummond Road, ST16
3EL Stafford, UK)
LED light source
Sigma-Aldrich (Sigma-Aldrich Company Ltd,
Fancy Road, Poole, Dorest, BD12 4QH, UK)
Ammonium Persulfate (APS; Cat No. A3678; Lot
No.022K1258 )
Ampicillin (Cat No. A9518; Lot No. 062K0843)
Bovine Serum Albumin (BSA) Fraction V (Cat No.
A3059; Lot No. 086K0674)
4’,6-Diamidino-2-phenylindole dihydrochloride
(DAPI) (Cat NO. D8417; Lot No. 123K4013)
Dimethyl Sulfoxide (DMSO)(Cat No. D2650; Lot
No. 53K2342)
Dithiothreitol (DTT) (Cat No. D9779; Lot No.
072K0916)
Fetal Bovine Serum (FBS)-Heat inactivated (Cat
No. F9665; Lot No. 91K3357)
Gelatin (Cat No. G1890; Lot No. 27H0557)
L-Glutamine 200 mM (Cat No. G7513; Lot No.
103K2385)
Glycerol (Cat No. G5516; Lot No. 0773DD)
HEPES (Cat No. H4034; Lot No. 062K5438)
Horse Serum (HS)-Heat inactivated (Cat No.
H1138; Lot No. 061K8408)
Hydrogen Peroxide Solution (Cat No. H1009; Lot
No. S86968-419)
IGEPAL® CA-630 (Octylphenyl-polyethylene
glycol) (Cat No. I8896; Lot No. 048K0712)
Insulin-like Growth Factor-II (IGF-II) human
recombinant, expressed in Escherichia coli (≧97%;
HPLC and SDS-PAGE), cell culture tested (Cat No.
I-2526; Lot No. 082K0708)
Leishman’s Stain (Eosin-polychrome methylene
blue) (Cat No, L-6254; Lot No. 93H3690)
2-Mercaptoethanol (Cat No. M7522-100ML; Lot
No. 01496DK)
Minimum Essential Medium Eagle (MEM)-Alpha
Modification (1×) (Cat No. M4526; Lot No.
127K2413)
Mitomycin C (Cat No. M4728-2MG; Lot No.
01M0665)
Monoclonal Anti-α-Tubulin antibody produced in
mouse (Cat No. T9026; Lot No. 096K4779)
Monoclonal Anti-β-actin antibody produced in
mouse (Cat No. A2228; Lot No. 129K4753)
Mouse monoclonal anti-skeletal myosin (fast) clone
MY-32 (Cat No. M4276; Lot No. 050M4805)
Mitomycin C (Cat No. M4287-2MG; Lot No.
o1M0665)
t-octylpheoxypolyethoxyethanol (Triton X-100)
(Cat No.T9284; Lot No.61K0126)

369
Paraformaldehyde (Cat No. 76240; Lot No.
1065696 12104020)
Penicillin/Streptomycin solution (100×), cell
culture tested (Cat No. P0781)
Phalloidin, Tetramethylrhodamine B isothiocyanate
(Cat No. P1951)
Polyethylene glycol MW 8,000 (Cat No. 81268;
Lot No. 2034733)
Polyethylene glycol sorbitan monolaurate
(Tween®20) (Cat No. P7949; Lot No. 028K01853)
Potassium Chloride KCl (Cat No. P9333; Lot No.
7447407)
Sodium phosphate Dibasic Na2HPO4 (Cat No.
S7907; Lot No. 7558794)
Sodium phosphate Monobasic NaH2PO4 (Cat No.
S8282; Lot No. 7558807)
N,N,N',N'-Tetramethylethylenediamine
(TEMED;Cat No. T9281; Lot No.38H0438 )
Trypsin (porcine trypsin in 0.2% EDTA‧4Na,
0.9% Sodium Chloride (Cat No. T4174))
Sony (Pipersway, Thatcham, Berkshire RG19
4LZ, UK)
Gel imaging camera, video graphic printer (UP-
860LE)
Spectronic Camspec Ltd (Tudor House, Barley
Hill Road, Garforth, Leeds LS25 1DX, UK)
Camspec M501 Single Beam Scanning UV/Visible
Spectrophotometer
Stuart Scientific Co. Ltd (Holmethorpe
Industrial Estate, Redhill, Surrey RH1 2NB, UK)
Gyro-Rocker Shaker (STR9)
Hybridization Oven/Shaker (SI 20H)
Swann-Morton Ltd (Swann-Morton Limited,
Owlerton Green, Sheffield, S6 2BJ, UK)
Sterile Disposable Scalpel (Cat No.0508; Lot No.
6750310)
Terumo UK Ltd (3 Unily Grove, Off School
Lane, Knowsley Industrials Park, Knowsley,
Merseyside, L34 9GI, UK)
18 gauge needles (1.2×40 mm) (Cat No. NN-1838R)
Upstate Biotechnology, Inc (1100 Winter Street
Suite 2300, Waltham, Massachusetts 02451, USA)
Mouse monoclonal anti-IGF2 antibody (Cat No.
05-166; Lot No. 21240)
VECTOR LABORATORIES LTD. (VECTOR
LABORATORIES LTD. 3 Accent Park,
Bakewell Road, Orton Southgate, Peterborough,
PE2 6XS, United Kingdom)
ImmEdge Hydrophobic Barrier Pen (Cat No. H-
4000)
VWR International, Formerly “BDH” (Merk
Ltd, Hunter Boulevard, Magna Park,
Lutterworth, Leics, LE17 4XN, UK)
Coverglass- 24 mm × 50 mm (Cat No. 406-0188-82)
Glass Coverslips-9mm2 (Cat No. 631-0169)
DePex mounting medium (Cat No. 361252B; Lot
No. HX896062)
Hematoxylin solution modified acc. to Gill III (Cat
No. 1.05174.0500)
Magnesium Chloride 6-hydrate (Cat No. 101494V;
Lot No. A407233311)
Sodium Azide (Cat No.10369 2K; Lot No.
K23188106693)
Sodium Hypochlorite (Cat No. 301696S;Batch No.
08K270507)
Superfrost Plus Microscope Slides (Cat No.
6310108 ; Lot No. 0201119)
The Wolfson Centre for Inherited
Neuromuscular Disease (CIND)
Mouse anti-β-dystroglycan antibody (MANDAG1
7A11) (Pereboev et al., 2001)
Mouse anti-dystrophin antibody (MANDRA1 7A10)
(Morris et al., 1998; Nguyen et al., 1992)

370
APPENDIX 2. Recipes Cell culture medium and buffer preparation: In-vitro cell culture: C2C12 cell culture medium
DMEM + 10% FCS + 1% P/S + 1%L-Glutamine
450 ml Dulbecco's Modified Eagles Medium
(DMEM; Invitrogen Ltd, UK),
50 ml Fetal Bovine Serum (FCS) Batch tested
(Sigma-Aldrich, UK),
5 ml L-Glutamine (Sigma-Aldrich, UK),
5 ml Penicillin/Streptomycin (P/S; Sigma-Aldrich,
UK)
PD50A cell culture medium:
DMEM-F12+ 10% FCS + 1% P/S + 1%L-Glutamine
450 ml Dulbecco's Modified Eagles/Nutrient mix F-
12 Medium (DMEM-F12; Invitrogen Ltd, UK),
50 ml Foetal Bovine Serum,
5 ml L-Glutamine,
5 ml Penicillin/Streptomycin
MC3T3-E1 cell culture medium:
alpha-MEM + 10% FCS + 1% P/S + 1% L-
Glutamine
450 ml Minimum Essential Medium Alpha
Modification (Alpha-MEM; Sigma Aldrich, UK),
50 ml Foetal Bovine Serum,
5 ml L-Glutamine,
5 ml penicillin/Streptomycin
Differentiation medium for coculture experiment:
DMEM + 2% HS + 1% P/S + 1% L-Glutamine
450 ml DMEM
10 ml Horse serum (HS batched tested; Sigma-
Aldrich, UK),
5 ml L-Glutamine,
5 ml penicillin/Streptomycin
iPS (induced pluripotent stem) cell culture
medium
KO-MEM+ KO-SR+ FCS + MEM NEAA+ 2-ME
400 ml Knock-out Minimum Essential Medium (KO-
MEM; Invitrogen Ltd, UK),
50 ml Knock-out Serum Replacer (KO-SR;
Invitrogen Ltd, UK),
50 ml Fetal Bovine Serum (FCS) Batch tested
5 ml MEM Non-essential amino acid (MEM NEAA;
Invitrogen Ltd, UK),
3.5 μl 2-mercaptoethanol (2-ME; Sigma-Aldrich,
UK),
5 ml Penicillin/Streptomycin,
The medium was filtered with 0.45 μm filter and
stored at 4°C
5 μl LIF (ESGRO®-LIF)/ 500 ml media was added
before use and the medium can be stored at 4°C for 5
days.
0.1% Gelatin preparation:
0.2 g of Gelatin (Sigma-Aldrich, UK) + 200 ml dH2O
The solution needed to be autoclaved within 1 hour
after the gelatin powder dissolved completely.
10× PBS (phosphate buffered saline)
8 g NaCl (Fisher Scientific, UK),
0.2 g KCl (Sigma-Aldrich, UK),
1.15 g Na2HPO4 (Sigma-Aldrich, UK),
0.2 g NaH2PO4 (Sigma-Aldrich, UK),
100 ml dH2O (PH7.4)
Trypsin:
Trypsin (porcine trypsin in 0.9% sodium chloride
solution; Sigma-Aldrich, UK) in PBS
Immunostaining:
Fixation
4 g Paraformaldehyde + 100 ml 1× sterile PBS
Weight 4g Paraformadehyde (Sigma-Aldrich, UK)
with care, wearing a facemask. Add the PFA to pre-
heated (60°C) PBS in a fumehood and allow
dissolving in 65°C rocking oven, ensuring
temperature did not go above 70 °C, as PFA is
explosive at high temperatures.

371
PBST
PBS + 150 mM NaCl + 0.05% Tween20®
500 ml PBS,
1.46 g NaCl,
0.25 ml Tween20® (Sigma-Aldrich, UK)
Immunohistochemistry (IHC):
Acidic-Alcohol
400 ml 70% Ethanol (Fisher Scientific, UK)
2 ml concentrated HCl (Fisher Scientific, UK)
Antigen retrieval buffer
4.7 g Sodium Citrate (Fisher Scientific, UK) and 1.6
litre distilled water
Adjusted to pH6 with Conc. HCl (Fisher Scientific,
UK)
DAB (3, 3'-diaminobenzidine) preparation:
1 tablet of DAKO®DAB (DAKO, UK) chromogen
10 ml of PBS
The DBA solution was aliquoted to universal tubes
with 1 ml per tube with great care. The solution was
stored at -20°C.
Wash Buffer (PBST)
100 ml 10× PBS (see above),
900 ml dH2O,
1 ml Tween®20
Scott’s water
50 μl Sodium Hydroxide (Fisher Scientific, UK)
400 ml tap water
TNB (Tris-NaCl blocking buffer)
0.61 g TRIS in 100 ml dH2O (pH7.5)
0.44 g NaCl
0.25g Blocking reagent (TSA kit)
Protein Extraction and Blotting:
Lysis Buffer (850 ul) and Protease Inhibitors (150
ul)(Radio Immuno Precipitation Assay or RIPA
Buffer)
Lysis Buffer (store at 4C for 2-3 months)
50 mM Tris (Fisher Scientific, UK),
150 mM NaCl,
1% IGEPAL® CA-630 (chemically indistinguishable
from NP-40) (Sigma-Aldrich, UK),
0.5% deoxycolic acid (Sigma-Aldrich, UK),
Made up to 100 ml with sterile dH2O
Protease Inhibitors (store at -20°C for 2-3 months)
1 protease inhibitor tablet (Roche Diagnostic Ltd, UK)
1.5 ml sterile dH2O
6× SDS Sample Buffer
For 10 ml:
7ml 0.6 M Tris-HCl pH 6.8,
3 ml glycerol,
1 g SDS,
0.93g DTT (Dithiothreitol) (Sigma-Aldrich, UK),
1.2 mg bromophenol blue
Running Buffer
3 g Tris (Fisher Scientific Ltd, UK),
14.42 g Glycine (Fisher Scientific Ltd, UK),
1 g SDS (Fisher Scientific Ltd, UK)
Made up to 1 litre with dH2O
Transfer Buffer
3.03 g Tris,
14.4 g Glycine,
200 ml Methanol (Fisher Scientific Ltd, UK),
Made up to 1 litre with dH2O
pH to 8.5 with Concentrated HCl (Fisher Scientific
Ltd, UK)
1.5 M Tris-HCl
18.17 g Tris
Made up to 100 ml with dH2O
pH to 8.8 with concentrated HCl (Fisher Scientific
Ltd, UK)
1.0 M Tris-HCl
12.1 g Tris
Made up to 100 ml with dH2O
pH to 6.8 with concentrated HCl (Fisher Scientific
Ltd, UK)
10% SDS
10 g SDS made up to 100 ml with dH2O

372
10X TBS (Tris-buffered saline)
24.2 g Tris,
80 g NaCl
Made up to 100 ml with dH2O
pH to 7.6 with concentrated HCl
Blocking Buffer
15 ml 10× TBS (see above)
135 ml dH2O,
0.15 ml Tween®20,
7.5 g non-fat dry milk (Marvel, UK)
Wash Buffer (TBST)
100 ml 10× TBS (see above),
900 ml dH2O,
1 ml Tween®20
Primary Antibody Dilution Buffer
2 ml 10× TBS,
18 ml dH2O,
20 ul Tween®20,
1 g BSA (Sigma-Aldrich, UK) Bacteria culture and storage:
LB (Luria-Bertani) medium
12.5 g Luria Bruth Base powder (Invitrogen, UK)
Made up to 500 ml with dH2O
The medium was autoclaved and kept at 4°C
LB agar plate
9.25 g Luria Agar (Invitrogen, UK)
Made up to 250 ml with dH2O
The agar mixture was autoclaved. Appropriate
antibiotics was added when the agar was lukewarm
and then poured into petri dishes.
TSS buffer (Transformation amd storage solution
for chemical transformation)
1.25 g Luria Bruth Base powder
5 g Polyethylene glycol MW 8,000 (PEG) (Sigma-
Aldrich, UK)
2.5 ml DMSO (Sigma-Aldrich, UK)
0. 508 g MgCl2 (BDH)
Add up to 50 ml with dH2O and adjust pH to ~6.5
The solution was protected from light and autoclaved.
The cooled solution was kept at 4°C for no more than
2 weeks.
Electrophoresis analysis for DNA:
TBE (Tris/Borate/EDTA) buffer (5×)
46.5 g Na2EDTA (Fisher Scientific Ltd, UK)
275 g Boric acid (Fisher Scientific Ltd, UK)
540 g Tris (Fisher Scientific Ltd, UK)
Made up to 1 litre with dH2O
The working concentration was 0.5× which was made
by dilute the stock 10 times with dH2O.
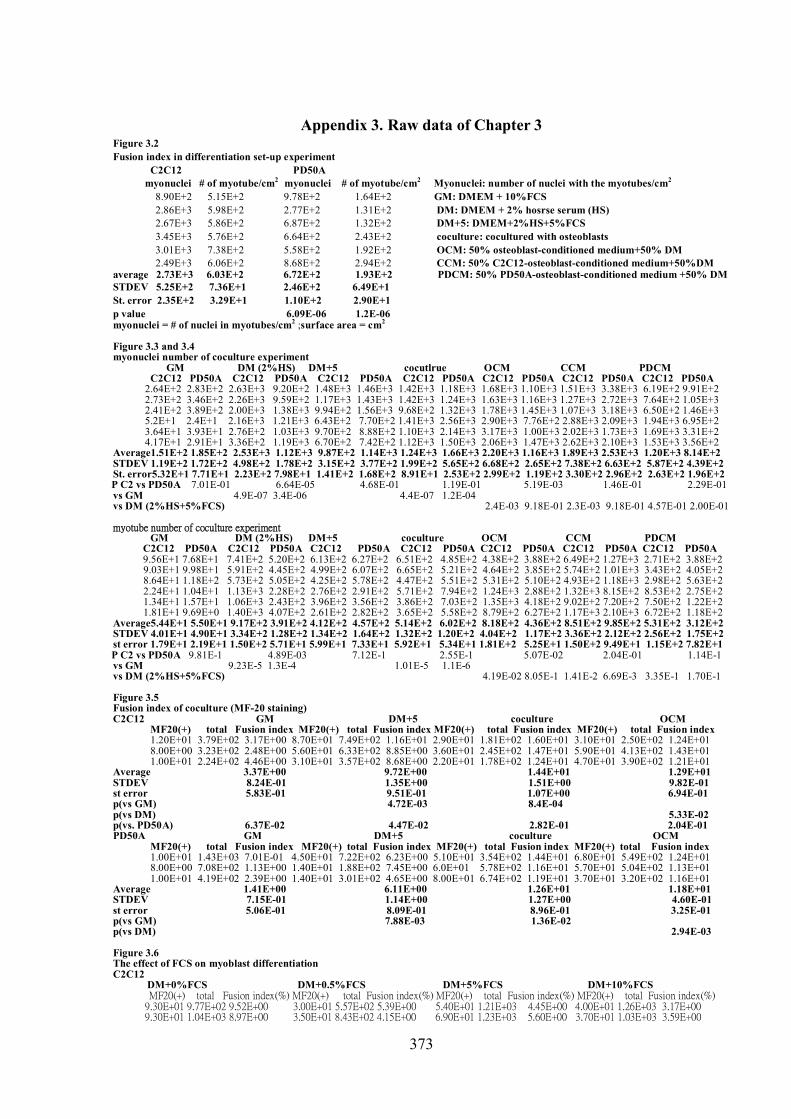
373
Appendix 3. Raw data of Chapter 3 Figure 3.2 Fusion index in differentiation set-up experiment
C2C12 PD50A myonuclei # of myotube/cm2 myonuclei # of myotube/cm2 Myonuclei: number of nuclei with the myotubes/cm2
8.90E+2 5.15E+2 9.78E+2 1.64E+2 GM: DMEM + 10%FCS 2.86E+3 5.98E+2 2.77E+2 1.31E+2 DM: DMEM + 2% hosrse serum (HS)
2.67E+3 5.86E+2 6.87E+2 1.32E+2 DM+5: DMEM+2%HS+5%FCS 3.45E+3 5.76E+2 6.64E+2 2.43E+2 coculture: cocultured with osteoblasts 3.01E+3 7.38E+2 5.58E+2 1.92E+2 OCM: 50% osteoblast-conditioned medium+50% DM 2.49E+3 6.06E+2 8.68E+2 2.94E+2 CCM: 50% C2C12-osteoblast-conditioned medium+50%DM
average 2.73E+3 6.03E+2 6.72E+2 1.93E+2 PDCM: 50% PD50A-osteoblast-conditioned medium +50% DM STDEV 5.25E+2 7.36E+1 2.46E+2 6.49E+1 St. error 2.35E+2 3.29E+1 1.10E+2 2.90E+1 p value 6.09E-06 1.2E-06 myonuclei = # of nuclei in myotubes/cm2 ;surface area = cm2 Figure 3.3 and 3.4 myonuclei number of coculture experiment
GM DM (2%HS) DM+5 cocutlrue OCM CCM PDCM C2C12 PD50A C2C12 PD50A C2C12 PD50A C2C12 PD50A C2C12 PD50A C2C12 PD50A C2C12 PD50A
2.64E+2 2.83E+2 2.63E+3 9.20E+2 1.48E+3 1.46E+3 1.42E+3 1.18E+3 1.68E+3 1.10E+3 1.51E+3 3.38E+3 6.19E+2 9.91E+2 2.73E+2 3.46E+2 2.26E+3 9.59E+2 1.17E+3 1.43E+3 1.42E+3 1.24E+3 1.63E+3 1.16E+3 1.27E+3 2.72E+3 7.64E+2 1.05E+3 2.41E+2 3.89E+2 2.00E+3 1.38E+3 9.94E+2 1.56E+3 9.68E+2 1.32E+3 1.78E+3 1.45E+3 1.07E+3 3.18E+3 6.50E+2 1.46E+3 5.2E+1 2.4E+1 2.16E+3 1.21E+3 6.43E+2 7.70E+2 1.41E+3 2.56E+3 2.90E+3 7.76E+2 2.88E+3 2.09E+3 1.94E+3 6.95E+2 3.64E+1 3.93E+1 2.76E+2 1.03E+3 9.70E+2 8.88E+2 1.10E+3 2.14E+3 3.17E+3 1.00E+3 2.02E+3 1.73E+3 1.69E+3 3.31E+2 4.17E+1 2.91E+1 3.36E+2 1.19E+3 6.70E+2 7.42E+2 1.12E+3 1.50E+3 2.06E+3 1.47E+3 2.62E+3 2.10E+3 1.53E+3 3.56E+2
Average1.51E+2 1.85E+2 2.53E+3 1.12E+3 9.87E+2 1.14E+3 1.24E+3 1.66E+3 2.20E+3 1.16E+3 1.89E+3 2.53E+3 1.20E+3 8.14E+2 STDEV 1.19E+2 1.72E+2 4.98E+2 1.78E+2 3.15E+2 3.77E+2 1.99E+2 5.65E+2 6.68E+2 2.65E+2 7.38E+2 6.63E+2 5.87E+2 4.39E+2 St. error5.32E+1 7.71E+1 2.23E+2 7.98E+1 1.41E+2 1.68E+2 8.91E+1 2.53E+2 2.99E+2 1.19E+2 3.30E+2 2.96E+2 2.63E+2 1.96E+2 P C2 vs PD50A 7.01E-01 6.64E-05 4.68E-01 1.19E-01 5.19E-03 1.46E-01 2.29E-01 vs GM 4.9E-07 3.4E-06 4.4E-07 1.2E-04 vs DM (2%HS+5%FCS) 2.4E-03 9.18E-01 2.3E-03 9.18E-01 4.57E-01 2.00E-01 myotube number of coculture experiment
GM DM (2%HS) DM+5 coculture OCM CCM PDCM C2C12 PD50A C2C12 PD50A C2C12 PD50A C2C12 PD50A C2C12 PD50A C2C12 PD50A C2C12 PD50A 9.56E+1 7.68E+1 7.41E+2 5.20E+2 6.13E+2 6.27E+2 6.51E+2 4.85E+2 4.38E+2 3.88E+2 6.49E+2 1.27E+3 2.71E+2 3.88E+2 9.03E+1 9.98E+1 5.91E+2 4.45E+2 4.99E+2 6.07E+2 6.65E+2 5.21E+2 4.64E+2 3.85E+2 5.74E+2 1.01E+3 3.43E+2 4.05E+2 8.64E+1 1.18E+2 5.73E+2 5.05E+2 4.25E+2 5.78E+2 4.47E+2 5.51E+2 5.31E+2 5.10E+2 4.93E+2 1.18E+3 2.98E+2 5.63E+2 2.24E+1 1.04E+1 1.13E+3 2.28E+2 2.76E+2 2.91E+2 5.71E+2 7.94E+2 1.24E+3 2.88E+2 1.32E+3 8.15E+2 8.53E+2 2.75E+2 1.34E+1 1.57E+1 1.06E+3 2.43E+2 3.96E+2 3.56E+2 3.86E+2 7.03E+2 1.35E+3 4.18E+2 9.02E+2 7.20E+2 7.50E+2 1.22E+2 1.81E+1 9.69E+0 1.40E+3 4.07E+2 2.61E+2 2.82E+2 3.65E+2 5.58E+2 8.79E+2 6.27E+2 1.17E+3 2.10E+3 6.72E+2 1.18E+2
Average5.44E+1 5.50E+1 9.17E+2 3.91E+2 4.12E+2 4.57E+2 5.14E+2 6.02E+2 8.18E+2 4.36E+2 8.51E+2 9.85E+2 5.31E+2 3.12E+2 STDEV 4.01E+1 4.90E+1 3.34E+2 1.28E+2 1.34E+2 1.64E+2 1.32E+2 1.20E+2 4.04E+2 1.17E+2 3.36E+2 2.12E+2 2.56E+2 1.75E+2 st error 1.79E+1 2.19E+1 1.50E+2 5.71E+1 5.99E+1 7.33E+1 5.92E+1 5.34E+1 1.81E+2 5.25E+1 1.50E+2 9.49E+1 1.15E+2 7.82E+1 P C2 vs PD50A 9.81E-1 4.89E-03 7.12E-1 2.55E-1 5.07E-02 2.04E-01 1.14E-1 vs GM 9.23E-5 1.3E-4 1.01E-5 1.1E-6 vs DM (2%HS+5%FCS) 4.19E-02 8.05E-1 1.41E-2 6.69E-3 3.35E-1 1.70E-1 Figure 3.5 Fusion index of coculture (MF-20 staining) C2C12 GM DM+5 coculture OCM
MF20(+) total Fusion index MF20(+) total Fusion index MF20(+) total Fusion index MF20(+) total Fusion index 1.20E+01 3.79E+02 3.17E+00 8.70E+01 7.49E+02 1.16E+01 2.90E+01 1.81E+02 1.60E+01 3.10E+01 2.50E+02 1.24E+01 8.00E+00 3.23E+02 2.48E+00 5.60E+01 6.33E+02 8.85E+00 3.60E+01 2.45E+02 1.47E+01 5.90E+01 4.13E+02 1.43E+01 1.00E+01 2.24E+02 4.46E+00 3.10E+01 3.57E+02 8.68E+00 2.20E+01 1.78E+02 1.24E+01 4.70E+01 3.90E+02 1.21E+01
Average 3.37E+00 9.72E+00 1.44E+01 1.29E+01 STDEV 8.24E-01 1.35E+00 1.51E+00 9.82E-01 st error 5.83E-01 9.51E-01 1.07E+00 6.94E-01 p(vs GM) 4.72E-03 8.4E-04 p(vs DM) 5.33E-02 p(vs. PD50A) 6.37E-02 4.47E-02 2.82E-01 2.04E-01 PD50A GM DM+5 coculture OCM
MF20(+) total Fusion index MF20(+) total Fusion index MF20(+) total Fusion index MF20(+) total Fusion index 1.00E+01 1.43E+03 7.01E-01 4.50E+01 7.22E+02 6.23E+00 5.10E+01 3.54E+02 1.44E+01 6.80E+01 5.49E+02 1.24E+01 8.00E+00 7.08E+02 1.13E+00 1.40E+01 1.88E+02 7.45E+00 6.0E+01 5.78E+02 1.16E+01 5.70E+01 5.04E+02 1.13E+01 1.00E+01 4.19E+02 2.39E+00 1.40E+01 3.01E+02 4.65E+00 8.00E+01 6.74E+02 1.19E+01 3.70E+01 3.20E+02 1.16E+01
Average 1.41E+00 6.11E+00 1.26E+01 1.18E+01 STDEV 7.15E-01 1.14E+00 1.27E+00 4.60E-01 st error 5.06E-01 8.09E-01 8.96E-01 3.25E-01 p(vs GM) 7.88E-03 1.36E-02 p(vs DM) 2.94E-03 Figure 3.6 The effect of FCS on myoblast differentiation C2C12 DM+0%FCS DM+0.5%FCS DM+5%FCS DM+10%FCS MF20(+) total Fusion index(%) MF20(+) total Fusion index(%) MF20(+) total Fusion index(%) MF20(+) total Fusion index(%)
9.30E+01 9.77E+02 9.52E+00 3.00E+01 5.57E+02 5.39E+00 5.40E+01 1.21E+03 4.45E+00 4.00E+01 1.26E+03 3.17E+00 9.30E+01 1.04E+03 8.97E+00 3.50E+01 8.43E+02 4.15E+00 6.90E+01 1.23E+03 5.60E+00 3.70E+01 1.03E+03 3.59E+00
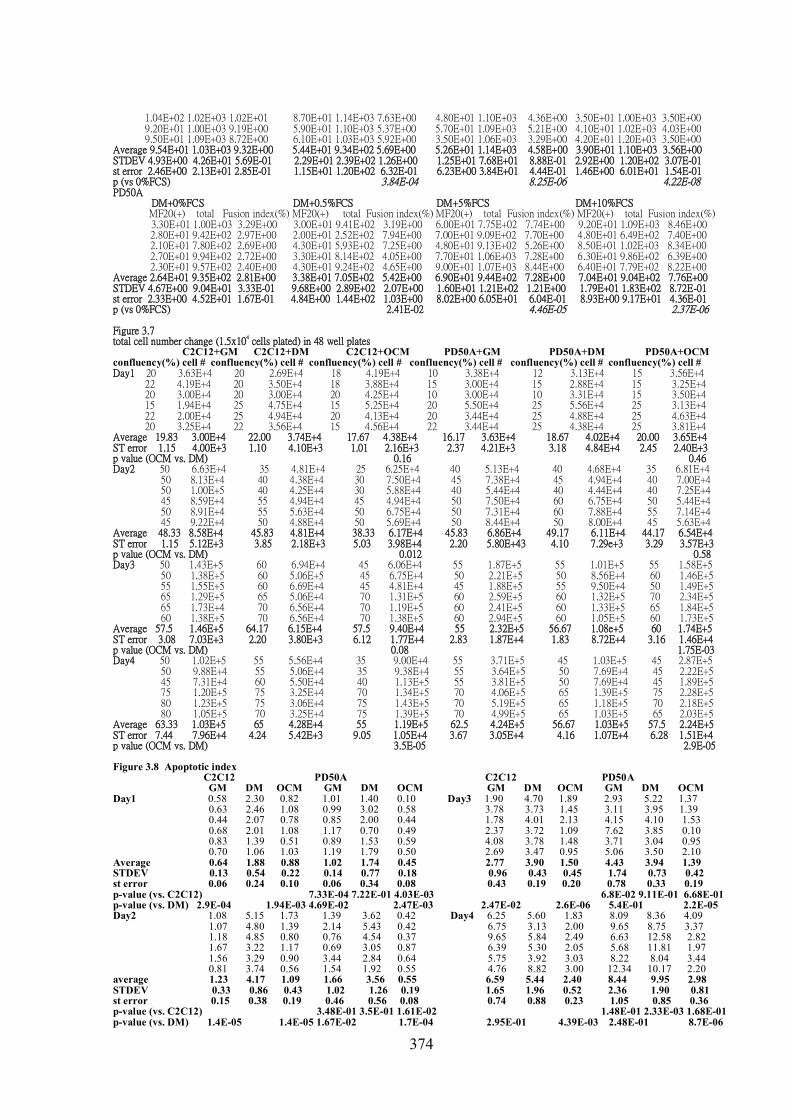
374
1.04E+02 1.02E+03 1.02E+01 8.70E+01 1.14E+03 7.63E+00 4.80E+01 1.10E+03 4.36E+00 3.50E+01 1.00E+03 3.50E+00 9.20E+01 1.00E+03 9.19E+00 5.90E+01 1.10E+03 5.37E+00 5.70E+01 1.09E+03 5.21E+00 4.10E+01 1.02E+03 4.03E+00 9.50E+01 1.09E+03 8.72E+00 6.10E+01 1.03E+03 5.92E+00 3.50E+01 1.06E+03 3.29E+00 4.20E+01 1.20E+03 3.50E+00
Average 9.54E+01 1.03E+03 9.32E+00 5.44E+01 9.34E+02 5.69E+00 5.26E+01 1.14E+03 4.58E+00 3.90E+01 1.10E+03 3.56E+00 STDEV 4.93E+00 4.26E+01 5.69E-01 2.29E+01 2.39E+02 1.26E+00 1.25E+01 7.68E+01 8.88E-01 2.92E+00 1.20E+02 3.07E-01 st error 2.46E+00 2.13E+01 2.85E-01 1.15E+01 1.20E+02 6.32E-01 6.23E+00 3.84E+01 4.44E-01 1.46E+00 6.01E+01 1.54E-01 p (vs 0%FCS) 3.84E-04 8.25E-06 4.22E-08 PD50A DM+0%FCS DM+0.5%FCS DM+5%FCS DM+10%FCS MF20(+) total Fusion index(%) MF20(+) total Fusion index(%) MF20(+) total Fusion index(%) MF20(+) total Fusion index(%) 3.30E+01 1.00E+03 3.29E+00 3.00E+01 9.41E+02 3.19E+00 6.00E+01 7.75E+02 7.74E+00 9.20E+01 1.09E+03 8.46E+00
2.80E+01 9.42E+02 2.97E+00 2.00E+01 2.52E+02 7.94E+00 7.00E+01 9.09E+02 7.70E+00 4.80E+01 6.49E+02 7.40E+00 2.10E+01 7.80E+02 2.69E+00 4.30E+01 5.93E+02 7.25E+00 4.80E+01 9.13E+02 5.26E+00 8.50E+01 1.02E+03 8.34E+00 2.70E+01 9.94E+02 2.72E+00 3.30E+01 8.14E+02 4.05E+00 7.70E+01 1.06E+03 7.28E+00 6.30E+01 9.86E+02 6.39E+00 2.30E+01 9.57E+02 2.40E+00 4.30E+01 9.24E+02 4.65E+00 9.00E+01 1.07E+03 8.44E+00 6.40E+01 7.79E+02 8.22E+00
Average 2.64E+01 9.35E+02 2.81E+00 3.38E+01 7.05E+02 5.42E+00 6.90E+01 9.44E+02 7.28E+00 7.04E+01 9.04E+02 7.76E+00 STDEV 4.67E+00 9.04E+01 3.33E-01 9.68E+00 2.89E+02 2.07E+00 1.60E+01 1.21E+02 1.21E+00 1.79E+01 1.83E+02 8.72E-01 st error 2.33E+00 4.52E+01 1.67E-01 4.84E+00 1.44E+02 1.03E+00 8.02E+00 6.05E+01 6.04E-01 8.93E+00 9.17E+01 4.36E-01 p (vs 0%FCS) 2.41E-02 4.46E-05 2.37E-06 Figure 3.7 total cell number change (1.5x10
4 cells plated) in 48 well plates
C2C12+GM C2C12+DM C2C12+OCM PD50A+GM PD50A+DM PD50A+OCM confluency(%) cell # confluency(%) cell # confluency(%) cell # confluency(%) cell # confluency(%) cell # confluency(%) cell # Day1 20 3.63E+4 20 2.69E+4 18 4.19E+4 10 3.38E+4 12 3.13E+4 15 3.56E+4
22 4.19E+4 20 3.50E+4 18 3.88E+4 15 3.00E+4 15 2.88E+4 15 3.25E+4 20 3.00E+4 20 3.00E+4 20 4.25E+4 10 3.00E+4 10 3.31E+4 15 3.50E+4 15 1.94E+4 25 4.75E+4 15 5.25E+4 20 5.50E+4 25 5.56E+4 25 3.13E+4 22 2.00E+4 25 4.94E+4 20 4.13E+4 20 3.44E+4 25 4.88E+4 25 4.63E+4 20 3.25E+4 22 3.56E+4 15 4.56E+4 22 3.44E+4 25 4.38E+4 25 3.81E+4
Average 19.83 3.00E+4 22.00 3.74E+4 17.67 4.38E+4 16.17 3.63E+4 18.67 4.02E+4 20.00 3.65E+4 ST error 1.15 4.00E+3 1.10 4.10E+3 1.01 2.16E+3 2.37 4.21E+3 3.18 4.84E+4 2.45 2.40E+3 p value (OCM vs. DM) 0.16 0.46 Day2 50 6.63E+4 35 4.81E+4 25 6.25E+4 40 5.13E+4 40 4.68E+4 35 6.81E+4
50 8.13E+4 40 4.38E+4 30 7.50E+4 45 7.38E+4 45 4.94E+4 40 7.00E+4 50 1.00E+5 40 4.25E+4 30 5.88E+4 40 5.44E+4 40 4.44E+4 40 7.25E+4 45 8.59E+4 55 4.94E+4 45 4.94E+4 50 7.50E+4 60 6.75E+4 50 5.44E+4 50 8.91E+4 55 5.63E+4 50 6.75E+4 50 7.31E+4 60 7.88E+4 55 7.14E+4 45 9.22E+4 50 4.88E+4 50 5.69E+4 50 8.44E+4 50 8.00E+4 45 5.63E+4
Average 48.33 8.58E+4 45.83 4.81E+4 38.33 6.17E+4 45.83 6.86E+4 49.17 6.11E+4 44.17 6.54E+4 ST error 1.15 5.12E+3 3.85 2.18E+3 5.03 3.98E+4 2.20 5.80E+43 4.10 7.29e+3 3.29 3.57E+3 p value (OCM vs. DM) 0.012 0.58 Day3 50 1.43E+5 60 6.94E+4 45 6.06E+4 55 1.87E+5 55 1.01E+5 55 1.58E+5
50 1.38E+5 60 5.06E+5 45 6.75E+4 50 2.21E+5 50 8.56E+4 60 1.46E+5 55 1.55E+5 60 6.69E+4 45 4.81E+4 45 1.88E+5 55 9.50E+4 50 1.49E+5 65 1.29E+5 65 5.06E+4 70 1.31E+5 60 2.59E+5 60 1.32E+5 70 2.34E+5 65 1.73E+4 70 6.56E+4 70 1.19E+5 60 2.41E+5 60 1.33E+5 65 1.84E+5 60 1.38E+5 70 6.56E+4 70 1.38E+5 60 2.94E+5 60 1.05E+5 60 1.73E+5
Average 57.5 1.46E+5 64.17 6.15E+4 57.5 9.40E+4 55 2.32E+5 56.67 1.08e+5 60 1.74E+5 ST error 3.08 7.03E+3 2.20 3.80E+3 6.12 1.77E+4 2.83 1.87E+4 1.83 8.72E+4 3.16 1.46E+4 p value (OCM vs. DM) 0.08 1.75E-03 Day4 50 1.02E+5 55 5.56E+4 35 9.00E+4 55 3.71E+5 45 1.03E+5 45 2.87E+5
50 9.88E+4 55 5.06E+4 35 9.38E+4 55 3.64E+5 50 7.69E+4 45 2.22E+5 45 7.31E+4 60 5.50E+4 40 1.13E+5 55 3.81E+5 50 7.69E+4 45 1.89E+5 75 1.20E+5 75 3.25E+4 70 1.34E+5 70 4.06E+5 65 1.39E+5 75 2.28E+5 80 1.23E+5 75 3.06E+4 75 1.43E+5 70 5.19E+5 65 1.18E+5 70 2.18E+5 80 1.05E+5 70 3.25E+4 75 1.39E+5 70 4.99E+5 65 1.03E+5 65 2.03E+5
Average 63.33 1.03E+5 65 4.28E+4 55 1.19E+5 62.5 4.24E+5 56.67 1.03E+5 57.5 2.24E+5 ST error 7.44 7.96E+4 4.24 5.42E+3 9.05 1.05E+4 3.67 3.05E+4 4.16 1.07E+4 6.28 1.51E+4 p value (OCM vs. DM) 3.5E-05 2.9E-05 Figure 3.8 Apoptotic index
C2C12 PD50A C2C12 PD50A GM DM OCM GM DM OCM GM DM OCM GM DM OCM
Day1 0.58 2.30 0.82 1.01 1.40 0.10 Day3 1.90 4.70 1.89 2.93 5.22 1.37 0.63 2.46 1.08 0.99 3.02 0.58 3.78 3.73 1.45 3.11 3.95 1.39 0.44 2.07 0.78 0.85 2.00 0.44 1.78 4.01 2.13 4.15 4.10 1.53 0.68 2.01 1.08 1.17 0.70 0.49 2.37 3.72 1.09 7.62 3.85 0.10 0.83 1.39 0.51 0.89 1.53 0.59 4.08 3.78 1.48 3.71 3.04 0.95 0.70 1.06 1.03 1.19 1.79 0.50 2.69 3.47 0.95 5.06 3.50 2.10
Average 0.64 1.88 0.88 1.02 1.74 0.45 2.77 3.90 1.50 4.43 3.94 1.39 STDEV 0.13 0.54 0.22 0.14 0.77 0.18 0.96 0.43 0.45 1.74 0.73 0.42 st error 0.06 0.24 0.10 0.06 0.34 0.08 0.43 0.19 0.20 0.78 0.33 0.19 p-value (vs. C2C12) 7.33E-04 7.22E-01 4.03E-03 6.8E-02 9.11E-01 6.68E-01 p-value (vs. DM) 2.9E-04 1.94E-03 4.69E-02 2.47E-03 2.47E-02 2.6E-06 5.4E-01 2.2E-05 Day2 1.08 5.15 1.73 1.39 3.62 0.42 Day4 6.25 5.60 1.83 8.09 8.36 4.09
1.07 4.80 1.39 2.14 5.43 0.42 6.75 3.13 2.00 9.65 8.75 3.37 1.18 4.85 0.80 0.76 4.54 0.37 9.65 5.84 2.49 6.63 12.58 2.82 1.67 3.22 1.17 0.69 3.05 0.87 6.39 5.30 2.05 5.68 11.81 1.97 1.56 3.29 0.90 3.44 2.84 0.64 5.75 3.92 3.03 8.22 8.04 3.44 0.81 3.74 0.56 1.54 1.92 0.55 4.76 8.82 3.00 12.34 10.17 2.20
average 1.23 4.17 1.09 1.66 3.56 0.55 6.59 5.44 2.40 8.44 9.95 2.98 STDEV 0.33 0.86 0.43 1.02 1.26 0.19 1.65 1.96 0.52 2.36 1.90 0.81 st error 0.15 0.38 0.19 0.46 0.56 0.08 0.74 0.88 0.23 1.05 0.85 0.36 p-value (vs. C2C12) 3.48E-01 3.5E-01 1.61E-02 1.48E-01 2.33E-03 1.68E-01 p-value (vs. DM) 1.4E-05 1.4E-05 1.67E-02 1.7E-04 2.95E-01 4.39E-03 2.48E-01 8.7E-06

375
Figure 3.9 cleaved caspase 3/ uncleaved caspas 3 (normalized with coomassie blue) C2C12 OCM DM PD50A OCM DM
Nondifferentiated 24 48 96 24 48 96 nondifferentiated 24 48 96 24 48 96 (hrs) 3.81 2.33 2.28 3.32 4.54 2.68 2.10 3.33 1.97 3.19 2.90 5.42 2.33 5.14 3.17 3.10 3.04 3.47 3.22 2.39 2.44 3.21 2.38 2.67 2.43 2.48 3.20 3.25 3.02 2.82 2.66 4.34 4.51 2.25 2.12 3.32 1.97 3.04 1.86 5.48 4.23 5.67
Average 3.33 2.75 2.66 3.71 4.09 2.44 2.22 3.29 2.11 2.97 2.40 4.46 3.26 4.69 STDEV 0.42 0.39 0.38 0.55 0.76 0.22 0.19 0.07 0.23 0.27 0.52 1.71 0.95 1.27 st error 0.30 0.28 0.27 0.39 0.53 0.15 0.14 0.05 0.17 0.19 0.37 1.21 0.67 0.90 p value (vs. C2) 8.70E-01 7.1E-02 3.16E-01 4.0E-2 7.48E-01 2.21E-01 2.94E-02 p value (vs. time 0)1.53E-01 1.09E-01 4.0E-01 2.05E-01 3.09E-02 1.41E-02 1.11E-03 1.16E-01 4.22E-02 3.03E-01 9.53E-01 1.3E-01 Figure 3.11 Growth factor effects: Mitotic index
C2C12 PD50A DM IGF-1 IGF-2 LIF DM IGF-1 IGF-2 LIF
9.43E-02 2.93E-01 2.35E-01 4.64E-01 5.36E-01 9.53E-01 4.81E-01 5.63E-01 0.00E+00 3.18E-01 4.02E-01 1.90E-01 3.95E-01 3.82E-01 8.66E-01 8.69E-01 0.00E+00 1.94E-01 2.68E-01 1.01E-01 1.92E-01 3.96E-01 1.71E-01 2.91E-01 0.00E+00 1.99E-01 2.00E-01 3.55E-01 2.88E-01 4.48E-01 3.84E-01 1.45E+00 0.00E+00 0.00E+00 1.20E-01 2.95E-01 1.96E-01 5.44E-01 3.98E-01 2.93E-01 0.00E+00 0.00E+00 9.43E-02 1.83E-01 9.66E-02 4.43E-01 5.93E-01 3.97E-01
Average 1.57E-02 1.67E-01 2.20E-01 2.64E-01 2.84E-01 5.28E-01 4.82E-01 6.44E-01 STDEV 3.85E-02 1.39E-01 1.11E-01 1.33E-01 1.60E-01 2.16E-01 2.34E-01 4.52E-01 st error 1.72E-02 6.20E-02 4.97E-02 5.93E-02 7.14E-02 9.66E-02 1.04E-01 2.02E-01 p-value (vs. C2C12) 2.51E-03 6.33E-03 3.22E-02 7.63E-02 p-value (vs. DM) 2.74E-02 1.68E-03 1.31E-03 5.04E-02 1.17E-01 9.52E-02 Figure 3.12 Growth Factor effects: Apoptotic index
C2C12 PD50A DM IGF-1 IGF-2 LIF DM IGF-1 IGF-2 LIF 5.75 6.15 8.23 14.38 9.29 5.32 2.69 3.38 6.02 7.00 8.84 11.37 8.50 8.41 5.54 1.56 5.78 4.76 10.74 10.88 7.41 9.91 2.65 2.62 13.51 8.16 21.88 16.43 9.69 4.92 3.84 1.69 9.05 4.79 21.90 7.47 6.26 8.01 2.59 2.05 10.71 14.98 15.94 17.50 7.44 7.17 3.36 1.19
average 8.47 7.64 14.59 13.00 8.10 7.29 3.45 2.08 STDEV 3.21 3.82 6.28 3.79 1.30 1.90 1.14 0.80 st error 1.43 1.71 2.81 1.69 0.58 0.85 0.51 0.36 p-value (vs. C2C12) 7.97E-01 8.47E-01 1.62E-03 4.1E-06 p-value (vs. DM) 6.91E-01 5.95E-02 4.92E-02 4.11E-01 6.1E-05 2.2E-06

376
Figure 3.10 Pax7 level in myoblasts (compared to nondifferentiated C2C12) C2C12 OCM DM PD50A OCM DM
Nondifferentiated 24 48 96 24 48 96 nondifferentiated 24 48 96 24 48 96 (hrs) 1 8.97E-01 9.52E-01 1.76 3.95E-01 3.43E-01 2.87E-01 8.65E-01 6.97E-01 1.01 2.05 4.10E-01 3.77E-01 3.06E-01 1 1.21 1.44 1.19 3.74E-01 4.37E-01 3.40E-01 1.05 8.38E-01 1.05 4.99 6.95E-01 4.60E-01 3.47E-01
1 7.56E-01 1.16 1.42 3.90E-01 3.56E-01 3.78E-01 1.19 5.06E-01 1.13 3.30 5.37E-01 4.32E-01 4.77E-01 Average 1 9.53E-01 1.18 2.14 3.56E-01 3.96E-01 3.59E-01 1.39 6.81E-01 1.07 3.44 5.47E-01 4.23E-01 3.76E-01 STDEV 0 2.30E-01 2.44E-01 9.72E-01 4.54E-02 5.78E-02 2.65E-02 4.75E-01 1.67E-01 6.00E-02 1.48 1.43E-01 4.25E-02 8.91E-02 st error 0 1.63E-01 1.72E-01 6.88E-01 3.21E-02 4.09E-02 1.87E-02 3.36E-01 1.18E-01 4.25E-02 1.05 1.01E-01 3.00E-02 6.30E-02 p value (vs. time 0) 7.41E-01 2.67E-01 5.0E-01 1.63E-05 2.99E-05 1.46E-05 4.49E-04 9.07E-02 5.55E-03 3.05E-05 9.21E-08 1.65E-04 p value (vs. C2C12) 7.38E-01 1.73E-01 4.68E-01 8.37E-02 9.18E-02 3.14E-01 5.13E-04 Figure 3.13 Growth factor effects: myonuclei number
DM IGF1 IGF2 LIF IGF1+IGF2 IGF1+LIF IGF2+LIF IGF1+IGF2+LIF C2C12 PD50A C2C12 PD50A C2C12 PD50A C2C12 PD50A C2C12 PD50A C2C12 PD50A C2C12 PD50A C2C12 PD50A 2.07E+3 1.75E+3 1.24E+3 1.10E+3 2.02E+3 1.28E+3 1.03E+3 1.05E+3 2.10E+3 2.82E+2 1.03E+3 4.30E+3 7.83E+2 2.04E+3 6.01E+2 7.16E+2 1.62E+3 1.16E+3 8.45E+2 1.24E+3 2.03E+3 1.39E+3 8.39E+2 8.71E+2 2.08E+3 1.97E+3 1.05E+3 2.76E+3 8.47E+2 2.08E+3 5.61E+2 7.27E+2 2.63E+3 1.19E+3 9.81E+2 1.16E+3 1.93E+3 1.82E+3 1.00E+3 1.27E+3 2.24E+3 1.80E+3 9.96E+2 2.70E+3 8.75E+2 3.08E+3 5.21E+2 9.80E+2 3.34E+3 7.54E+2 9.44E+2 8.58E+2 2.59E+3 2.01E+3 6.66E+2 8.40E+2 1.41E+3 2.54E+3 1.03E+3 2.27E+3 9.71E+2 1.58E+3 5.04E+2 7.99E+2 2.01E+3 9.31E+2 8.52E+2 9.65E+2 1.11E+3 1.83E+3 5.84E+2 1.04E+3 1.24E+3 2.21E+3 1.07E+3 2.38E+3 8.28E+2 2.16E+3 4.66E+2 9.68E+2 2.22E+3 1.46E+3 7.14E+2 6.65E+2 1.25E+3 1.69E+3 6.13E+2 9.46E+2 1.19E+3 1.65E+3 1.03E+3 2.14E+3 7.32E+2 1.64E+3 4.99W+2 1.09E+3
Average 2.32E+3 1.21E+3 9.30E+2 9.99E+2 1.82E+3 1.67E+3 7.88E+2 1.00E+3 1.71E+3 2.17E+3 1.03E+3 2.76E+3 8.39E+2 2.10E+3 5.25E+2 8.80E+2 STDEV 6.01E+2 3.57E+2 1.80E+2 2.14E+2 5.52E+3 2.81E+2 1.96E+2 1.55E+2 4.80E+2 4.49E+2 2.46E+1 7.92E+2 8.18E+1 5.40E+2 4.83E+1 1.54E+1 st. error 2.69E+2 1.60E+2 8.03E+1 9.55E+1 2.47E+2 1.26E+2 8.78E+1 6.95E+1 2.15E+2 2.01E+2 1.10E+1 3.54E+2 3.66E+1 2.42E+2 2.16E+1 6.91E+1 p (C2 vs. PD) 3.00E-03 5.59E-01 5.57E-01 6.21E-02 1.19E-01 3.3E-04 2.2E-04 3.1E-04 p ( vs. DM) N/A N/A 3.0E-04 2.51E-01 1.70E-01 3.15E-02 1.5E-04 2.32E-01 8.23E-02 2.12E-03 3.9E-04 1.38E-03 1.4E-04 7.08E-03 2.7E-05 6.79E-02 Myotube umber
DM IGF1 IGF2 LIF IGF1+IGF2 IGF1+LIF IGF2+LIF IGF1+IGF2+LIF C2C12 PD50A C2C12 PD50A C2C12 PD50A C2C12 PD50A C2C12 PD50A C2C12 PD50A C2C12 PD50A C2C12 PD50A 4.66E+02 6.20E+02 5.11E+02 4.24E+02 5.75E+02 5.12E+02 4.27E+02 3.68E+02 5.98E+02 8.23E+02 4.16E+02 1.27E+03 3.21E+02 5.55E+02 2.22E+02 2.34E+02 3.91E+02 4.00E+02 3.48E+02 4.51E+02 5.12E+02 4.67E+02 3.50E+02 3.12E+02 5.17E+02 5.88E+02 4.26E+02 8.31E+02 3.22E+02 5.81E+02 2.08E+02 2.41E+02 4.48E+02 4.34E+02 4.02E+02 4.37E+02 5.80E+02 6.91E+02 4.29E+02 4.72E+02 5.69E+02 5.52E+02 4.09E+02 8.28E+02 3.49E+02 8.79E+02 1.98E+02 3.48E+02 6.38E+02 2.35E+02 4.37E+02 3.74E+02 5.27E+02 8.73E+02 2.96E+02 3.42E+02 6.42E+02 1.08E+03 4.68E+02 9.75E+02 4.35E+02 6.62E+02 2.32E+02 3.46E+02 5.06E+02 2.97E+02 3.89E+02 3.92E+02 4.93E+02 7.87E+02 2.60E+02 4.37E+02 5.59E+02 8.92E+02 4.88E+02 1.02E+03 3.82E+02 9.22E+02 2.14E+02 4.15E+02 5.17E+02 4.94E+02 3.25E+02 2.67E+02 5.78E+02 7.41E+02 2.65E+02 3.94E+02 5.38E+02 6.91E+02 4.75E+02 9.44E+02 3.33E+02 6.24E+02 2.29E+02 4.68E+02
Average 4.94E+02 4.13E+02 4.02E+02 3.91E+02 5.44E+02 6.79E+02 3.38E+02 3.88E+02 5.70E+02 7.71E+02 4.47E+02 9.78E+02 3.57E+02 7.04E+02 2.17E+02 3.42E+02 STDEV 8.33E+01 1.17E+02 6.64E+01 6.71E+01 3.83E+01 1.59E+02 7.68E+01 5.97E+01 4.46E+01 2.01E+02 3.40E+01 1.62E+02 4.43E+01 1.57E+02 1.27E+01 9.28E+01 st. error 3.73E+01 6.17E+01 2.97E+01 3.00E+01 1.71E+01 7.11E+01 3.44E+01 2.67E+01 1.99E+01 8.98E+01 1.52E+01 7.25E+01 1.98E+01 7.04E+01 5.67E+00 4.15E+01 p (C2 vs. PD) 2.47E-01 7.79E-01 7.21E-02 2.37E-01 3.81E-02 1.39E-05 4.01E-04 8.44E-03 p ( vs. DM) N/A N/A 5.97E-02 7.26E-01 2.12E-01 1.15E-02 6.91E-03 6.81E-01 7.67E-02 7.67E-02 2.27E-02 6.92E-05 5.11E-03 6.77E-03 1.1E-05 3.18E-01 Figure 3.14 Cav1α and Cav-1β levels in myoblasts (nomalised with nondifferentiated C2C12)
C2C12 OCM DM PD50A OCM DM Nondifferentiated 24 48 96 24 48 96 Nondifferentiated 24 48 96 24 48 96 (hrs)
Cav1α 1.00E+00 1.04E+00 1.07E+00 1.29E+00 1.02E+00 9.19E-01 1.11E+00 1.43E+00 1.30E+00 1.35E+00 2.15E+00 1.65E+00 1.53E+00 1.17E+00 1.00E+00 9.74E-01 8.15E-01 1.11E+00 9.44E-01 1.13E+00 1.13E+00 5.23E-01 1.66E+00 2.45E+00 2.37E+00 1.86E+00 5.29E-01 1.35E+00 1.00E+00 7.16E-01 8.50E-01 1.13E+00 7.41E-01 8.93E-01 1.22E+00 1.21E+00 1.33E+00 1.98E+00 1.36E+00 1.28E+00 1.29E+00 1.22E+00
Average 1.00E+00 9.11E-01 9.13E-01 1.17E+00 9.02E-01 9.80E-01 1.15E+00 1.06E+00 1.43E+00 1.93E+00 1.96E+00 1.59E+00 1.12E+00 1.25E+00 STDEV 0.00E+00 1.72E-01 1.41E-01 9.66E-02 1.45E-01 1.29E-01 5.83E-02 4.74E-01 2.01E-01 5.54E-01 5.31E-01 2.94E-01 5.24E-01 9.35E-02 st error 0.00E+00 1.21E-01 9.96E-02 6.83E-02 1.03E-01 9.09E-02 4.12E-02 3.35E-01 1.42E-01 3.91E-01 3.76E-01 2.08E-01 3.70E-01 6.61E-02 p value (vs.C2) 8.5E-01 2.71E-02 3.72E-02 6.52E-02 2.17E-02 6.8E-01 2.02E-01 p value (vs. time 0) 4.18E-01 3.46E-01 3.55E-02 3.09E-01 7.98E-01 1.1E-02 2.75E-01 1.07E-01 9.24E-02 1.69E-01 8.85E-01 5.28E-01 Cav1β 1.00E+00 8.36E-01 8.65E-01 9.06E-01 8.42E-01 8.19E-01 8.06E-01 1.05E+00 8.54E-01 1.71E+00 1.85E+00 8.75E-01 1.06E+00 1.05E+00
1.00E+00 1.07E+00 9.34E-01 1.12E+00 6.98E-01 1.07E+00 8.03E-01 1.50E+00 1.05E+00 1.03E+00 1.35E+00 1.16E+00 1.29E+00 9.75E-01 1.00E+00 7.37E-01 7.72E-01 9.68E-01 8.18E-01 7.67E-01 8.64E-01 1.59E+00 1.11E+00 1.34E+00 1.70E+00 1.12E+00 1.25E+00 1.68E+00

377
Average 1.00E+00 8.81E-01 8.57E-01 9.99E-01 7.86E-01 8.86E-01 8.25E-01 1.38E+00 1.01E+00 1.36E+00 1.63E+00 1.05E+00 1.20E+00 1.24E+00 STDEV 0.00E+00 1.71E-01 8.17E-02 1.11E-01 7.75E-02 1.63E-01 3.43E-02 2.91E-01 1.35E-01 3.39E-01 2.54E-01 1.54E-01 1.23E-01 3.88E-01 st error 0.00E+00 1.21E-01 5.78E-02 7.83E-02 5.48E-02 1.15E-01 2.42E-02 2.06E-01 9.58E-02 2.40E-01 1.80E-01 1.09E-01 8.71E-02 2.74E-01 p value (vs.C2) 8.69E-02 3.75E-01 6.67E-02 1.65E-02 5.59E-02 5.77E-02 1.42E-01 p value (vs.time 0) 2.93E-01 3.87E-02 9.83E-01 8.74E-03 2.94E-01 9.0E-04 1.14E-01 9.46E-01 3.16E-01 1.59E-01 3.77E-01 5.34E-01 Cav1β/α 1.73E+00 7.19E-01 7.21E-01 6.32E-01 7.38E-01 7.99E-01 6.54E-01 6.55E-01 6.77E-01 5.83E-01 5.94E-01 6.20E-01 6.19E-01 6.72E-01
1.67E+00 1.08E+00 1.14E+00 1.21E+00 1.59E+00 1.41E+00 7.84E-01 7.66E-01 1.06E+00 1.21E+00 1.49E+00 7.74E-01 1.34E+00 4.77E-01 1.41E+00 1.60E+00 1.28E+00 1.46E+00 1.55E+00 1.21E+00 1.20E+00 1.48E+00 1.18E+00 8.76E-01 9.54E-01 1.23E+00 9.54E-01 1.21E+00
Average 1.60E+00 1.13E+00 1.04E+00 1.10E+00 1.29E+00 1.14E+00 8.80E-01 9.66E-01 9.70E-01 8.89E-01 1.01E+00 8.76E-01 9.71E-01 7.86E-01 STDEV 1.73E-01 4.40E-01 2.89E-01 4.24E-01 4.81E-01 3.12E-01 2.86E-01 4.46E-01 2.61E-01 3.12E-01 4.51E-01 3.20E-01 3.62E-01 3.78E-01 st error 1.22E-01 3.11E-01 2.04E-01 3.00E-01 3.40E-01 2.21E-01 2.03E-01 3.15E-01 1.85E-01 2.20E-01 3.19E-01 2.26E-01 2.56E-01 2.67E-01 p value (vs.C2) 8.24E-02 6.11E-01 5.58E-01 8.17E-01 2.79E-01 5.75E-01 7.48E-01 p value (vs. time 0) 1.61E-01 4.55E-02 1.31E-01 3.54E-01 8.81E-02 2.01E-02 9.90E-01 8.17E-01 9.04E-01 7.91E-01 9.88E-01 6.21E-01 Figure 3.15 Average Cav-1 level in myoblasts (normalized with nondifferentiated C2C12)
C2C12 OCM DM PD50A OCM DM Nondifferentiated 24 48 96 24 48 96 Nondifferentiated 24 48 96 24 48 96 (hrs)
1 7.87E-01 6.12E-01 8.01E-01 7.82E-01 6.28E-01 7.64E-01 1.71 1.75 1.36 3.24 2.44 1.88 2.64 1 8.80E-01 8.18E-01 8.20E-01 8.13E-01 7.94E-01 8.41E-01 2.44 9.87E-01 1.14 1.38 1.09 1.45 4.98 1 8.02E-01 8.39E-01 9.65E-01 8.63E-01 8.46E-01 1.10 6.11 4.07 2.74 7.51 2.61 3.93 4.82 1 8.59E-01 1.01 9.31E-01 9.02E-01 3.85E-01 1.34 7.37 3.44 2.53 8.82 4.18 1.22 2.45
Average 1 8.32E-01 8.19E-01 8.79E-01 8.40E-01 8.20E-01 1.01 4.41 2.56 1.94 5.24 2.58 2.12 3.72 STDEV 0 4.45E-02 1.62E-01 8.07E-02 5.30E-02 1.58E-01 2.63E-01 2.76 1.43 8.10E-01 3.51 1.27 1.24 1.36 st error 0 2.57E-02 9.37E-02 4.66E-02 3.06E-02 9.15E-02 1.52E-01 1.59 8.28E-01 4.68E-01 2.02 7.31E-01 7.14E-01 7.87E-01 p value (vs. C2) 4.83E-02 5.28E-02 3.47E-02 4.75E-02 3.36E-01 5.92E-02 7.94E-03 p value (vs. time 0) 2.80E-04 6.75E-02 2.43E-02 9.40E-04 6.35E-02 9.35E-01 2.79E-01 1.37E-01 7.23E-01 2.73E-01 1.81E-01 6.70E-01 Average Cav-3 level in myoblasts (normalized with nondifferentiated PD50A)
C2C12 OCM DM PD50A OCM DM Nondifferentiated 24 48 96 24 48 96 Nondifferentiated 24 48 96 24 48 96(hrs)
4.25E-03 1.52E-02 4.83E-02 8.08E-02 1.60E-02 9.11E-02 1.65E-01 1 4.78E-01 3.65E-01 3.00E-01 5.94E-01 7.24E-01 1.35E+00 5.33E-02 0 4.46E-02 9.97E-02 4.27E-02 3.04E-03 9.59E-02 1 6.87E-01 4.09E-01 5.46E-01 7.64E-01 8.87E-01 5.39E-01
0 0 1.06E-01 2.89E-03 0 0 6.51E-02 1 4.53E-01 1.39E+00 3.74E-01 5.10E-01 3.81E-01 5.15E-01 Average 1.92E-02 5.07E-03 6.63E-02 6.11E-02 1.96E-02 3.14E-02 1.09E-01 1 5.39E-01 7.22E-01 4.07E-01 6.22E-01 6.64E-01 8.02E-01 STDEV 2.96E-02 8.77E-03 3.45E-02 5.13E-02 2.16E-02 5.17E-02 5.12E-02 0 1.28E-01 5.80E-01 1.27E-01 1.29E-01 2.59E-01 4.76E-01 st error 2.09E-02 6.20E-03 2.44E-02 3.63E-02 1.53E-02 3.66E-02 3.62E-02 0 9.08E-02 4.10E-01 8.95E-02 9.13E-02 1.83E-01 3.37E-01 p value (vs. C2) 5.53E-07 1.98E-03 1.23E-01 1.18E-02 1.34E-03 1.42E-02 6.63E-02 p value (vs. time 0) 4.73E-01 1.47E-01 2.87E-01 9.87E-01 7.41E-01 5.88E-02 3.42E-03 4.53E-01 1.25E-03 7.15E-03 8.77E-02 5.11E-01 Average Cav3/Cav1
C2C12 OCM DM PD50A OCM DM Nondifferentiated 24 48 96 24 48 96 Nondifferentiated 24 48 96 24 48 96(hrs)
0 0 0.21 1.11 0.39 0.72 1.40 2.79 3.27 1.22 1.54 1.98 1.07 3.03 4.71E-02 0.28 0.39 0.65 0.53 0.10 1.31 4.70 4.01 3.52 1.94 3.06 1.42 3.63 9.36E-02 0 4.45E-02 2.93 0.75 7.65E-03 0.85 2.20 3.61 2.77 1.70 3.59 1.87 2.68
Average 4.69E-02 9.24E-02 0.22 1.56 0.56 0.49 1.19 3.23 3.63 2.50 1.73 2.87 1.45 3.11 STDEV 4.68E-02 0.16 0.18 1.20 0.18 0.34 0.30 1.31 0.37 1.18 0.20 0.82 0.40 0.48 st error 3.31E-02 0.11 0.12 0.85 0.13 0.24 0.21 0.92 0.26 0.83 0.14 0.58 0.28 0.34 p value (vs. C2) 1.35E-02 1.27E-02 2.91E-02 8.26E-01 9.02E-03 2.19E-02 4.05E-03 p value (vs. time 0) 6.61E-01 1.8E-01 9.5E-02 9.51E-03 3.65E-01 2.75E-03 6.39E-01 5.13E-01 1.2E-01 7.06E-01 8.72E-02 8.88E-01

378
Figure 3.16 IGF-2 levels in myoblasts (normalized with coomassie blue) C2C12 OCM DM PD50A OCM DM
Nondifferentiated 24 48 96 24 48 96 Nondifferentiated 24 48 96 24 48 96 (hrs) 1 8.79E-01 7.37E-01 8.11E-01 8.26E-01 9.34E-01 5.46E-01 9.16E-01 5.69E-01 8.73E-01 2.03E+00 5.91E-01 8.70E-01 1.82E+00 1 7.90E-01 8.81E-01 8.83E-01 8.60E-01 8.40E-01 8.53E-01 1.01 7.33E-01 7.11E-01 1.02 6.75E-01 7.70E-01 6.89E-01 1 9.46E-01 9.78E-01 9.84E-01 7.58E-01 7.66E-01 6.65E-01 1.06 7.29E-01 9.96E-01 1.19 7.87E-01 7.13E-01 9.57E-01 1 9.07E-01 9.66E-01 9.20E-01 8.62E-01 7.46E-01 7.42E-01 7.64E-01 6.22E-01 7.37E-01 1.23 7.69E-01 7.51E-01 1.16 1 8.24E-01 8.41E-01 8.93E-01 6.54E-01 7.53E-01 5.06E-01 8.01E-01 5.18E-01 6.44E-01 8.09E-01 5.57E-01 6.59E-01 8.85E-01
Average 1 8.69E-01 8.80E-01 8.98E-01 7.92E-01 8.08E-01 6.62E-01 9.10E-01 6.34E-01 7.92E-01 1.26 6.76E-01 7.53E-01 1.16 STDEV 0 6.27E-02 9.86E-02 6.27E-02 8.77E-02 8.00E-02 1.42E-01 1.27E-01 9.56E-02 1.41E-01 4.64E-01 1.03E-01 7.80E-02 4.35E-01 st error 0 3.14E-02 4.93E-02 3.13E-02 4.39E-02 4.00E-02 7.11E-02 6.36E-02 4.78E-02 7.05E-02 2.32E-01 5.15E-02 3.90E-02 2.17E-01 p value (vs. C2) 1.51E-01 1.77E-03 2.84E-01 1.25E-01 9.07E-02 3.00E-01 6.36E-02 p value (vs. time 0) 1.61E-02 2.66E-02 6.67E-03 7.30E-04 6.80E-04 7.20E-04 4.72E-03 2.03E-01 1.46E-01 1.27E-02 4.63E-02 3.69E-01 p57kip2 level in myoblasts (normalized with nondifferentiated C2C12)
C2C12 OCM DM PD50A OCM DM Nondifferentiated 24 48 96 24 48 96 Nondifferentiated 24 48 96 24 48 96 (hrs)
1 1.10 1.14 1.86 5.99E-01 5.39E-01 5.14E-01 1.26 9.03E-01 1.10 1.67 7.20E-01 5.65E-01 4.74E-01 1 1.68 1.20 1.48 4.90E-01 4.81E-01 6.12E-01 1.30 1.28 9.29E-01 3.37 6.61E-01 5.68E-01 5.64E-01 1 1.48 1.14 1.52 5.85E-01 4.85E-01 4.67E-01 1.15 1.18 1.18 2.55 8.75E-01 7.35E-01 5.97E-01
Average 1 1.42 1.16 1.62 5.58E-01 5.02E-01 5.31E-01 1.24 1.12 1.07 2.53 7.52E-01 6.23E-01 5.45E-01 STDEV 0 2.95E-01 3.61E-02 2.06E-01 5.94E-02 3.28E-02 7.41E-02 7.72E-02 1.96E-01 1.27E-01 8.46E-01 1.10E-01 9.76E-02 6.36E-02 st error 0 2.09E-01 2.55E-02 1.45E-01 4.20E-02 2.32E-02 5.24E-02 5.46E-02 1.38E-01 8.98E-02 5.98E-01 7.80E-02 6.90E-02 4.50E-02 p value (vs. C2) 6.01E-03 2.18E-01 3.01E-01 1.45E-01 5.53E-02 1.12E-01 8.2E-01 p value (vs. time 0) 6.93E-02 1.59E-03 6.31E-03 2.09E-04 1.24E-05 3.95E-04 3.96E-01 1.20E-01 5.77E-02 3.36E-03 1.03E-03 2.8E-04 Figure 3.17 pAKT and AKT levels in myoblasts (normalized with coomassie blue)
C2C12 OCM DM PD50A OCM DM Nondifferentiated 24 48 96 24 48 96 Nondifferentiated 24 48 96 24 48 96
pAKT 2.93E-02 4.06E-02 7.92E-02 1.10E-01 1.10E-02 9.92E-03 9.13E-03 3.55E-02 3.23E-02 4.39E-02 1.12E-01 1.98E-02 1.77E-02 1.25E-02 2.61E-02 3.29E-02 5.23E-02 6.17E-02 1.26E-02 1.26E-02 1.19E-02 2.19E-02 1.55E-02 2.45E-02 4.28E-02 1.55E-02 1.47E-02 1.24E-02 2.76E-02 2.29E-02 8.09E-02 9.41E-02 1.86E-02 1.57E-02 1.44E-02 5.36E-02 3.96E-02 5.83E-02 8.87E-02 2.44E-02 2.22E-02 1.87E-02 1.85E-01 4.41E-02 5.45E-02 6.25E-02 1.07E-02 8.56E-03 7.57E-03 5.36E-02 3.56E-02 4.86E-02 7.47E-02 1.38E-02 1.00E-02 6.88E-03
Average 6.70E-02 3.51E-02 6.67E-02 8.22E-02 1.32E-02 1.17E-02 1.07E-02 4.11E-02 3.07E-02 4.39E-02 7.95E-02 1.84E-02 1.62E-02 1.26E-02 STDEV 7.87E-02 9.37E-03 1.54E-02 2.41E-02 3.66E-03 3.17E-03 3.03E-03 1.54E-02 1.06E-02 1.42E-02 2.88E-02 4.75E-03 5.14E-03 4.83E-03 st error 4.55E-02 5.41E-03 8.90E-03 1.39E-02 2.12E-03 1.83E-03 1.75E-03 8.90E-03 6.10E-03 8.22E-03 1.66E-02 2.74E-03 2.97E-03 2.79E-03 p value (vs. C2) 5.42E-01 5.57E-01 7.20E-02 8.91E-01 1.38E-01 1.90E-01 5.37E-01 p value (vs. time 0) 4.52E-01 9.94E-01 7.26E-01 2.21E-01 2.10E-01 2.03E-01 3.08E-01 8.05E-01 5.74E-02 3.01E-02 2.18E-02 1.23E-02 AKT 5.30E-02 6.58E-02 7.93E-02 9.77E-02 1.74E-02 1.66E-02 1.77E-02 5.40E-02 6.29E-02 1.32E-01 4.08E-02 3.70E-02 3.78E-02 2.19E-02
4.72E-02 5.24E-02 8.14E-02 3.11E-02 2.28E-02 1.94E-02 1.76E-02 5.74E-02 5.56E-02 7.54E-02 5.25E-02 3.89E-02 2.88E-02 3.34E-02 5.10E-02 3.27E-02 4.12E-02 1.15E-01 1.89E-02 2.02E-02 1.50E-02 6.25E-02 4.88E-02 2.93E-02 9.32E-02 2.01E-02 1.33E-02 1.77E-02 4.44E-02 2.54E-02 1.03E-01 3.64E-02 2.08E-02 1.95E-02 9.09E-03 3.06E-02 2.27E-02 6.71E-02 4.18E-02 2.56E-02 2.43E-02 2.14E-02
Average 4.89E-02 4.41E-02 7.61E-02 7.01E-02 2.00E-02 1.89E-02 1.48E-02 5.11E-02 4.75E-02 5.09E-02 5.71E-02 3.04E-02 2.61E-02 2.36E-02 STDEV 3.82E-03 1.84E-02 2.55E-02 4.26E-02 2.34E-03 1.61E-03 4.03E-03 1.41E-02 1.75E-02 2.37E-02 2.47E-02 9.05E-03 1.02E-02 6.81E-03 st error 1.91E-03 9.22E-03 1.28E-02 2.13E-02 1.17E-03 8.05E-04 2.02E-03 7.06E-03 8.74E-03 1.19E-02 1.23E-02 4.53E-03 5.08E-03 3.40E-03 p value (vs. C2) 7.72E-01 7.96E-01 9.99E-01 6.17E-01 6.74E-02 2.15E-01 6.89E-02 p value (vs. time 0) 6.26E-01 7.97E-02 3.61E-01 1.3E-05 6.8E-06 1.8E-05 7.58E-01 3.08E-01 6.90E-01 4.82E-02 2.8E-02 1.26E-02 pAKT/AKT 5.53E-01 6.28E-01 6.43E-01 6.31E-01 4.85E-01 5.11E-01 5.17E-01 6.17E-01 1.18E+00 6.85E-01 4.86E-01 8.06E-01 1.10E+00 7.00E-01
5.53E-01 7.02E-01 6.67E-01 7.49E-01 6.68E-01 6.24E-01 6.73E-01 7.60E-01 9.84E-01 8.34E-01 8.15E-01 7.70E-01 9.15E-01 8.75E-01 5.42E-01 7.66E-01 7.89E-01 8.18E-01 8.78E-01 8.07E-01 8.33E-01 8.57E-01 8.11E-01 8.69E-01 9.52E-01 9.55E-01 9.08E-01 7.84E-01
Average 5.49E-01 6.99E-01 7.00E-01 7.33E-01 6.77E-01 6.47E-01 6.75E-01 7.45E-01 9.93E-01 7.96E-01 7.51E-01 8.44E-01 8.65E-01 7.86E-01 STDEV 6.70E-03 6.92E-02 7.83E-02 9.45E-02 1.97E-01 1.50E-01 1.58E-01 1.21E-01 1.87E-01 9.75E-02 2.39E-01 9.82E-02 8.04E-02 8.74E-02 st error 4.73E-03 4.89E-02 5.54E-02 6.68E-02 1.39E-01 1.06E-01 1.12E-01 8.54E-02 1.32E-01 6.90E-02 1.69E-01 6.94E-02 5.69E-02 6.18E-02 p value (vs. C2) 4.88E-02 6.26E-02 2.52E-01 9.08E-01 2.58E-01 3.8E-02 3.44E-01 p value (vs. time 0) 2.05E-02 2.97E-02 2.84E-02 3.25E-01 3.2E-01 2.43E-01 1.26E-01 5.98E-01 9.71E-01 3.33E-01 7.16E-02 6.56E-01

379
pmTOR and mTOR levels in myoblasts (normalized with nondifferentiated C2C12)
C2C12 OCM DM PD50A OCM DM Nondifferentiated 24 48 96 24 48 96 Nondifferentiated 24 48 96 24 48 96(hrs)
pmTOR 3.30E-02 1.23E-02 1.46E-02 2.22E-02 9.36E-03 8.76E-03 8.32E-03 3.54E-02 1.95E-02 2.09E-02 5.06E-02 1.43E-02 1.03E-02 9.25E-03 3.52E-02 1.41E-02 1.83E-02 3.31E-02 1.02E-02 1.04E-02 9.79E-03 3.67E-02 2.05E-02 2.47E-02 4.08E-02 1.70E-02 1.42E-02 1.20E-02 4.00E-02 1.55E-02 1.58E-02 1.95E-02 8.46E-03 8.90E-03 8.95E-03 3.15E-02 3.29E-02 1.71E-02 2.56E-02 1.80E-02 1.62E-02 1.27E-02 3.56E-02 1.74E-02 2.41E-02 3.12E-02 9.08E-03 8.45E-03 7.62E-03 2.25E-02 2.22E-02 2.68E-02 4.23E-02 1.66E-02 1.06E-02 8.40E-03
Average 3.59E-02 1.98E-02 2.34E-02 3.80E-02 1.02E-02 8.83E-03 8.48E-03 2.62E-02 2.20E-02 2.63E-02 4.78E-02 1.52E-02 1.28E-02 1.15E-02 STEDV 2.95E-03 8.40E-03 8.75E-03 2.10E-02 2.10E-03 1.14E-03 1.09E-03 1.25E-02 8.46E-03 8.04E-03 2.42E-02 4.12E-03 3.66E-03 4.00E-03 st error 1.70E-03 4.85E-03 5.05E-03 1.21E-02 1.21E-03 6.58E-04 6.28E-04 7.22E-03 4.88E-03 4.64E-03 1.40E-02 2.38E-03 2.11E-03 2.31E-03 p value (vs. C2) 2.55E-01 3.41E-02 2.16E-01 7.46E-02 1.5E-04 4.68E-02 1.44E-01 p value (vs. time 0) 2.5E-05 4.6E-04 4.14E-02 2.2E-06 2.2E-06 2.1E-06 1.33E-01 5.56E-02 2.22E-01 3.85E-03 1.78E-03 8.1E-04 mTOR 1.02E-02 1.26E-02 1.33E-02 1.51E-02 5.53E-03 8.93E-03 8.17E-03 1.65E-02 9.07E-03 9.16E-03 4.51E-02 8.14E-03 1.08E-02 1.01E-02
1.04E-02 1.03E-02 1.03E-02 1.98E-02 5.85E-03 7.09E-03 7.33E-03 1.18E-02 1.21E-02 1.60E-02 1.37E-02 1.01E-02 1.02E-02 8.75E-03 1.37E-02 1.18E-02 8.62E-03 9.64E-03 1.06E-02 7.30E-03 1.06E-02 7.66E-03 7.22E-03 8.32E-03 3.45E-02 1.37E-02 7.90E-03 9.22E-03 1.17E-02 1.05E-02 7.91E-03 1.38E-02 7.57E-03 8.87E-03 1.08E-02 8.03E-03 7.98E-03 8.81E-03 3.69E-02 6.87E-03 8.17E-03 9.97E-03
Average 1.15E-02 1.13E-02 1.00E-02 1.46E-02 7.38E-03 8.05E-03 9.22E-03 1.10E-02 9.09E-03 1.06E-02 3.26E-02 9.71E-03 9.25E-03 1.38E-02 STEDV 1.62E-03 1.10E-03 2.42E-03 4.18E-03 2.31E-03 9.87E-04 1.74E-03 4.12E-03 2.14E-03 3.61E-03 1.34E-02 3.00E-03 1.43E-03 6.58E-03 st error 2.46E-04 1.68E-04 3.68E-04 2.41E-03 1.33E-03 5.70E-04 1.00E-03 2.38E-03 1.24E-03 2.09E-03 7.73E-03 1.73E-03 8.25E-04 3.80E-03 p value (vs. C2) 8.24E-01 1.17E-01 8.15E-01 4.27E-02 2.63E-01 2.15E-01 7.66E-01 p value (vs. time 0) 8.31E-01 3.47E-01 2.21E-01 2.61E-02 1.06E-02 1.02E-01 4.43E-01 8.79E-01 2.17E-02 6.32E-01 4.55E-01 5.03E-01 pmTOR/mTOR3.45E+00 1.12E+00 1.37E+00 2.20E+00 9.26E-01 1.05E+00 1.03E+00 2.22E+00 1.55E+00 1.94E+00 1.87E+00 1.32E+00 1.61E+00 1.68E+00
3.85E+00 8.34E-01 2.00E+00 1.41E+00 1.25E+00 1.07E+00 9.21E-01 1.25E+00 7.24E-01 7.64E-01 1.18E+00 9.27E-01 1.59E+00 1.46E+00 3.42E+00 8.48E-01 9.48E-01 1.59E+00 1.20E+00 9.52E-01 7.07E-01 1.88E+00 8.43E-01 7.16E-01 1.15E+00 8.79E-01 1.13E+00 8.64E-01
Average 3.57E+00 9.35E-01 1.44E+00 1.73E+00 1.12E+00 1.02E+00 8.86E-01 1.78E+00 1.04E+00 1.14E+00 1.40E+00 1.04E+00 1.44E+00 1.33E+00 STEDV 2.37E-01 1.63E-01 5.27E-01 4.11E-01 1.74E-01 6.20E-02 1.64E-01 4.93E-01 4.45E-01 6.92E-01 4.10E-01 2.40E-01 2.69E-01 4.20E-01 st error 1.68E-01 1.15E-01 3.73E-01 2.91E-01 1.23E-01 4.38E-02 1.16E-01 3.49E-01 3.15E-01 4.89E-01 2.90E-01 1.70E-01 1.90E-01 2.97E-01 p value (vs. C2) 4.8E-03 7.25E-01 5.83E-01 3.79E-01 6.5E-01 5.79E-02 1.62E-01 p value (vs. time 0) 9.15E-05 3.07E-03 2.56E-03 1.34E-04 5.56E-05 8.62E-05 1.24E-01 2.59E-01 3.59E-01 7.89E-02 3.53E-01 2.93E-01 Figure 3.18 pERK1/2 vs. ERK1/2 in myoblasts
C2C12 OCM DM PD50A OCM DM Nondifferentiated 24 48 96 24 48 96 Nondifferentiated 24 48 96 24 48 96(hrs)
pERK42/ERK42 8.08E-02 6.31E-02 4.38E-02 5.97E-02 7.19E-02 1.12E-01 8.53E-02 1.02E-01 1.54E-01 1.71E-01 9.34E-02 1.21E-01 1.56E-01 2.04E-01 3.26E-02 2.83E-02 2.30E-02 3.07E-02 3.16E-02 3.25E-02 3.12E-02 2.21E-02 2.40E-02 2.07E-02 2.91E-02 2.61E-02 2.22E-02 2.78E-02 1.30E-01 1.16E-01 1.03E-01 1.25E-01 1.14E-01 1.38E-01 1.29E-01 9.93E-02 9.40E-02 8.68E-02 1.01E-01 1.06E-01 1.00E-01 1.21E-01
Average 8.11E-02 6.92E-02 5.65E-02 7.17E-02 7.24E-02 9.41E-02 8.17E-02 7.44E-02 9.08E-02 9.29E-02 7.46E-02 8.46E-02 9.30E-02 1.18E-01 STDEV 4.86E-02 4.43E-02 4.14E-02 4.81E-02 4.10E-02 5.49E-02 4.88E-02 4.53E-02 6.52E-02 7.53E-02 3.96E-02 5.13E-02 6.74E-02 8.84E-02 st error 3.44E-02 3.13E-02 2.93E-02 3.40E-02 2.90E-02 3.88E-02 3.45E-02 3.21E-02 4.61E-02 5.33E-02 2.80E-02 3.62E-02 4.76E-02 6.25E-02 p value (vs. C2) 8.71E-01 6.6E-01 5.05E-01 9.39E-01 7.63E-01 9.84E-01 5.71E-01 p value (vs. time 0) 7.71E-01 5.42E-01 8.24E-01 8.24E-01 7.74E-01 9.89E-01 7.39E-01 7.35E-01 9.96E-01 8.09E-01 7.12E-01 4.31E-01 pERE44/ERK44 6.11E-02 8.38E-02 4.92E-02 7.45E-02 1.28E-01 1.15E-01 8.11E-02 1.97E-01 3.73E-01 4.25E-01 2.28E-01 2.55E-01 3.40E-01 4.02E-01
1.68E-02 3.25E-02 2.06E-02 2.85E-02 3.04E-01 2.46E-01 3.18E-02 3.00E-01 5.19E-01 3.73E-01 5.68E-01 4.68E-01 4.58E-01 3.53E-01 5.74E-02 1.54E-01 8.24E-02 1.01E-01 1.73E-01 1.78E-01 1.37E-01 6.03E-02 7.38E-02 5.27E-02 5.78E-02 7.45E-02 5.53E-02 6.73E-02
Average 4.51E-02 9.01E-02 5.07E-02 6.80E-02 2.02E-01 1.80E-01 8.32E-02 1.86E-01 3.22E-01 2.83E-01 2.85E-01 2.66E-01 2.84E-01 2.74E-01 STDEV 2.46E-02 6.09E-02 3.09E-02 3.67E-02 9.15E-02 6.53E-02 5.25E-02 1.20E-01 2.27E-01 2.02E-01 2.60E-01 1.97E-01 2.07E-01 1.81E-01 st error 1.74E-02 4.31E-02 2.18E-02 2.60E-02 6.47E-02 4.62E-02 3.71E-02 8.50E-02 1.61E-01 1.43E-01 1.84E-01 1.39E-01 1.46E-01 1.28E-01 p value (vs. C2) 1.18E-01 1.63E-01 1.19E-02 2.26E-01 6.35E-01 4.51E-01 1.54E-01 p value (vs. time 0) 3.01E-01 8.17E-01 4.19E-01 4.58E-02 2.88E-02 3.19E-01 4.1E-01 5.1E-01 5.81E-01 5.79E-01 5.15E-01 5.19E-01

380
Appendix 4. Raw data of Chapter 4 and 5 Figure 4.1 Cav-3 level in E17.5 embryos (normalized with wt) Cav-1 level in E17.5 embryos (normalized with wt)
Wt mdx cav3-/- DMhet Wt mdx cav3-/- DMhet 1 1.28 0 6.71E-01 1 3.04 4.65E-01 1.43 1 1.57 0 7.31E-01 1 2.57 6.20E-01 2.02 1 1.44 0 6.41E-01 1 3.55 4.78E-01 1.83 1 1.43 0 7.27E-01 1 2.40 5.84E-01 2.24
Average 1 1.46 0 7.14E-01 Average 1 2.97 5.47E-01 1.95 STDEV 0 1.55E-01 0 4.39E-02 STDEV 0 7.00E-01 7.22E-02 3.82E-01 st error 0 3.51E-04 0 2.54E-02 st error 0 4.04E-01 4.17E-02 2.20E-01 p-value (vs. wt) 3.30E-04 N/A 8.17E-06 p-value (vs. wt) 3.41E-03 1.97E-05 2.10E-03 Cav1/Cav3 in E17.5 embryos Pax7 level in E17.5 embryos (normalized with wt)
Wt mdx DMhet Wt mdx cav3-/- DMhet 1.91E+00 4.52E+00 4.07E+00 1 6.59E-01 7.73E-01 6.23E-01 1.97E+00 3.22E+00 5.44E+00 1 7.09E-01 7.59E-01 5.37E-01 1.84E+00 4.54E+00 5.25E+00 1 8.49E-01 8.12E-01 7.04E-01 1.68E+00 2.82E+00 5.17E+00 1 7.67E-01 8.22E-01 7.11E-01
Average 1.85E+00 3.77E+00 4.98E+00 Average 1 7.41E-01 7.72E-01 6.39E-01 STDEV 1.25E-01 8.88E-01 6.18E-01 STDEV 0 6.49E-02 3.95E-02 6.88E-02 st error 7.20E-02 5.13E-01 3.57E-01 st error 0 3.75E-02 2.28E-02 3.97E-02 p-value (vs. wt) 5.09E-03 5.96E-05 p-value (vs. wt) 7.97E-04 9.38E-06 1.26E-04 Figure 5.1 IGF-2 levels in E17.5 embryos (normalized with wt) high MW Wt mdx cav3-/- DMhet low MW Wt mdx cav3-/- DMhet
1 1.05 0.90 1.19 1 0.75 0.80 0.85 1 1.37 0.95 1.30 1 0.87 0.97 0.87 1 1.17 0.92 1.78 1 0.86 0.95 0.84 1 1.26 0.79 1.32 1 0.82 0.89 0.81
Average 1 1.21 0.89 1.40 1 0.93 1.00 0.91 STDEV 0 1.38E-01 7.15E-02 2.62E-01 1 0.89 0.94 0.90 st. error 0 7.95E-02 4.13E-02 1.51E-01 Average 1 0.85 0.92 0.87 p-value (vs. wt) 2.22E-02 2.17E-02 2.3E-02 STDEV 0 5.66E-02 6.70E-02 4.37E-02
st error 0 2.53E-02 3.00E-02 1.96E-02 p-value (vs. wt) 2.00E-04 2.56E-02 5.70E-06
p57kip2 level in E17.5 embryos (normalized with wt)
Wt mdx cav3-/- DMhet 1 7.62E-01 8.87E-01 5.99E-01 1 8.77E-01 8.12E-01 7.58E-01 1 7.91E-01 8.30E-01 6.93E-01 1 7.68E-01 7.68E-01 5.56E-01
Average 1 8.00E-01 8.24E-01 6.51E-01 STDEV 0 5.30E-02 4.92E-02 9.13E-02 st error 0 3.06E-02 2.84E-02 5.27E-02 p-value (vs. wt) 2.78E-04 3.79E-04 2.63E-04 pmTOR level in E17.5 embryos (normalized with wt) pAKT levels in E17.5 embryos (normalized with wt)
Wt mdx cav3-/- DMhet Wt mdx cav3-/- DMhet 1 1.44 5.03E-01 2.93 1 1.50 5.80E-01 1.17 1 1.61 6.58E-01 1.89 1 1.33 5.38E-01 1.15 1 1.74 4.69E-01 3.43 1 1.21 5.86E-01 1.25
Average 1 1.65 5.69E-01 2.82 1 1.02 5.54E-01 1.22 STDEV 0 1.86 1.65E-01 5.74E-01 Average 1 1.27 5.65E-01 1.20 st error 0 1.32E-01 1.17E-01 4.06E-01 STDEV 0 1.99E-01 2.24E-02 4.45E-02 p-value (vs. wt) 2.59E-03 1.42E-03 1.77E-02 st error 0 1.15E-01 1.29E-02 2.57E-02
p-value (vs. wt) 3.70E-02 1.93E-08 1.13E-04 AKT level and pAKT/AKT ration in E17.5 embryos (normalized with wt)
AKT Wt mdx cav3-/- DMhet pAKT/AKT Wt mdx cav3-/- Dmhet 1 1.21 5.08E-01 1.40 1.31E+00 1.62E+00 1.49E+00 1.09E+00 1 1.21 4.30E-01 1.25 1.27E+00 1.40E+00 1.60E+00 1.18E+00 1 1.33 4.72E-01 1.87 5.78E-01 5.30E-01 7.18E-01 3.86E-01 1 1.48 4.86E-01 1.54 6.11E-01 4.21E-01 6.95E-01 4.85E-01
Average 1 1.31 4.74E-01 1.51 Average 9.43E-01 9.94E-01 1.13E+00 7.86E-01 STDEV 0 1.30E-01 3.31E-02 2.66E-01 STDEV 4.03E-01 6.07E-01 4.86E-01 4.08E-01 st error 0 7.52E-02 1.91E-02 1.53E-01 st error 2.32E-01 3.50E-01 2.81E-01 2.36E-01 p-value (vs. wt) 3.29E-03 6.41E-08 8.33E-03 p-value (vs. wt) 8.94E-01 5.83E-01 6.03E-01 pERK42/ERK42 and pERK44/ERK44 ratios in E17.5 embryos pErk42/Erk42 Wt mdx cav3-/- DMhet pErk44/Erk44 Wt mdx cav3-/- DMhet
2.47E-01 2.07E-01 2.26E-01 4.05E-01 2.30E-01 1.78E-01 2.11E-01 2.87E-01 3.13E-01 2.38E-01 2.38E-01 4.23E-01 2.36E-01 1.56E-01 2.23E-01 3.00E-01 4.33E-01 2.22E-01 2.36E-01 4.08E-01 2.72E-01 1.63E-01 2.26E-01 2.56E-01 2.83E-01 2.05E-01 2.53E-01 3.71E-01 2.47E-01 1.60E-01 2.70E-01 2.73E-01
Average 3.19E-01 2.18E-01 2.38E-01 4.02E-01 Average 2.46E-01 1.64E-01 2.33E-01 2.79E-01 STDEV 8.08E-02 1.55E-02 1.12E-02 2.18E-02 STDEV 1.85E-02 9.67E-03 2.59E-02 1.88E-02 st error 5.71E-02 1.09E-02 7.91E-03 1.54E-02 st error 1.31E-02 6.84E-03 1.83E-02 1.33E-02 p-value (vs. wt) 4.92E-02 9.54E-02 9.52E-02 p-value (vs. wt) 2.20E-04 4.19E-01 4.98E-02 Figure 5.7 pSrc/Src in 4-week and 9-week adult skeletal muscle tissues
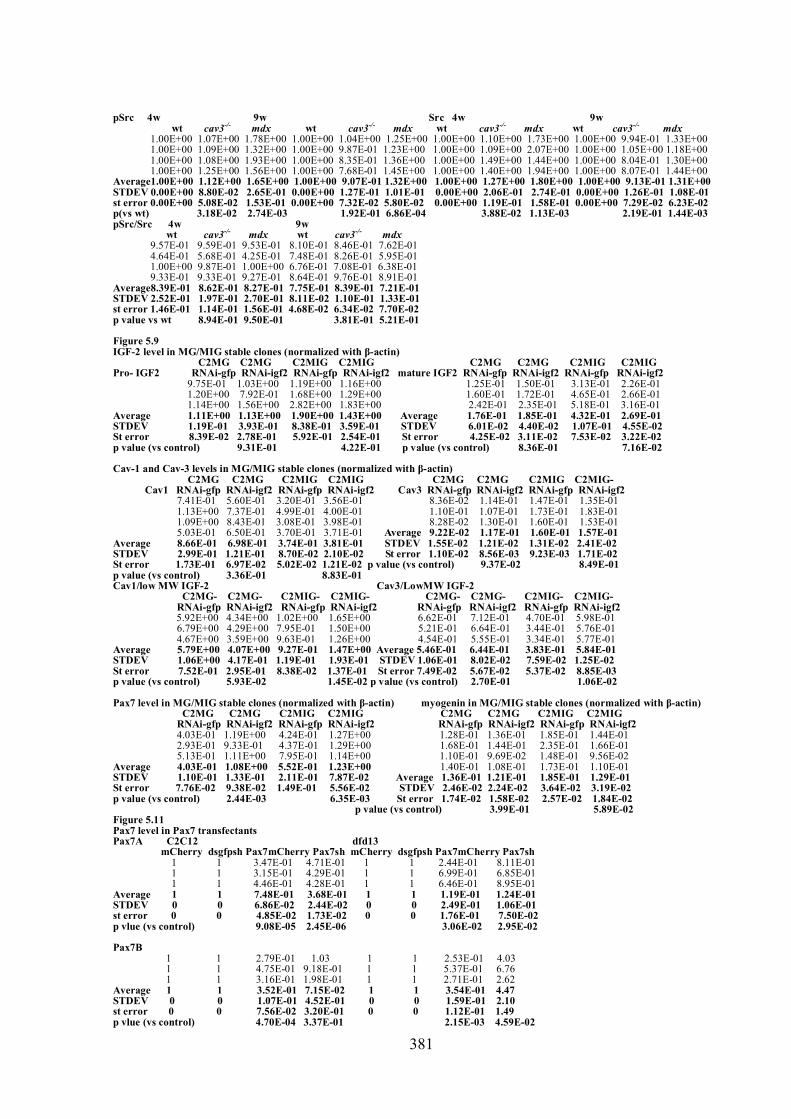
381
pSrc 4w 9w Src 4w 9w wt cav3-/- mdx wt cav3-/- mdx wt cav3-/- mdx wt cav3-/- mdx
1.00E+00 1.07E+00 1.78E+00 1.00E+00 1.04E+00 1.25E+00 1.00E+00 1.10E+00 1.73E+00 1.00E+00 9.94E-01 1.33E+00 1.00E+00 1.09E+00 1.32E+00 1.00E+00 9.87E-01 1.23E+00 1.00E+00 1.09E+00 2.07E+00 1.00E+00 1.05E+00 1.18E+00 1.00E+00 1.08E+00 1.93E+00 1.00E+00 8.35E-01 1.36E+00 1.00E+00 1.49E+00 1.44E+00 1.00E+00 8.04E-01 1.30E+00 1.00E+00 1.25E+00 1.56E+00 1.00E+00 7.68E-01 1.45E+00 1.00E+00 1.40E+00 1.94E+00 1.00E+00 8.07E-01 1.44E+00
Average1.00E+00 1.12E+00 1.65E+00 1.00E+00 9.07E-01 1.32E+00 1.00E+00 1.27E+00 1.80E+00 1.00E+00 9.13E-01 1.31E+00 STDEV 0.00E+00 8.80E-02 2.65E-01 0.00E+00 1.27E-01 1.01E-01 0.00E+00 2.06E-01 2.74E-01 0.00E+00 1.26E-01 1.08E-01 st error 0.00E+00 5.08E-02 1.53E-01 0.00E+00 7.32E-02 5.80E-02 0.00E+00 1.19E-01 1.58E-01 0.00E+00 7.29E-02 6.23E-02 p(vs wt) 3.18E-02 2.74E-03 1.92E-01 6.86E-04 3.88E-02 1.13E-03 2.19E-01 1.44E-03 pSrc/Src 4w 9w
wt cav3-/- mdx wt cav3-/- mdx 9.57E-01 9.59E-01 9.53E-01 8.10E-01 8.46E-01 7.62E-01 4.64E-01 5.68E-01 4.25E-01 7.48E-01 8.26E-01 5.95E-01 1.00E+00 9.87E-01 1.00E+00 6.76E-01 7.08E-01 6.38E-01 9.33E-01 9.33E-01 9.27E-01 8.64E-01 9.76E-01 8.91E-01
Average8.39E-01 8.62E-01 8.27E-01 7.75E-01 8.39E-01 7.21E-01 STDEV 2.52E-01 1.97E-01 2.70E-01 8.11E-02 1.10E-01 1.33E-01 st error 1.46E-01 1.14E-01 1.56E-01 4.68E-02 6.34E-02 7.70E-02 p value vs wt 8.94E-01 9.50E-01 3.81E-01 5.21E-01 Figure 5.9 IGF-2 level in MG/MIG stable clones (normalized with β-actin)
C2MG C2MG C2MIG C2MIG C2MG C2MG C2MIG C2MIG Pro- IGF2 RNAi-gfp RNAi-igf2 RNAi-gfp RNAi-igf2 mature IGF2 RNAi-gfp RNAi-igf2 RNAi-gfp RNAi-igf2
9.75E-01 1.03E+00 1.19E+00 1.16E+00 1.25E-01 1.50E-01 3.13E-01 2.26E-01 1.20E+00 7.92E-01 1.68E+00 1.29E+00 1.60E-01 1.72E-01 4.65E-01 2.66E-01 1.14E+00 1.56E+00 2.82E+00 1.83E+00 2.42E-01 2.35E-01 5.18E-01 3.16E-01
Average 1.11E+00 1.13E+00 1.90E+00 1.43E+00 Average 1.76E-01 1.85E-01 4.32E-01 2.69E-01 STDEV 1.19E-01 3.93E-01 8.38E-01 3.59E-01 STDEV 6.01E-02 4.40E-02 1.07E-01 4.55E-02 St error 8.39E-02 2.78E-01 5.92E-01 2.54E-01 St error 4.25E-02 3.11E-02 7.53E-02 3.22E-02 p value (vs control) 9.31E-01 4.22E-01 p value (vs control) 8.36E-01 7.16E-02 Cav-1 and Cav-3 levels in MG/MIG stable clones (normalized with β-actin)
C2MG C2MG C2MIG C2MIG C2MG C2MG C2MIG C2MIG- Cav1 RNAi-gfp RNAi-igf2 RNAi-gfp RNAi-igf2 Cav3 RNAi-gfp RNAi-igf2 RNAi-gfp RNAi-igf2
7.41E-01 5.60E-01 3.20E-01 3.56E-01 8.36E-02 1.14E-01 1.47E-01 1.35E-01 1.13E+00 7.37E-01 4.99E-01 4.00E-01 1.10E-01 1.07E-01 1.73E-01 1.83E-01 1.09E+00 8.43E-01 3.08E-01 3.98E-01 8.28E-02 1.30E-01 1.60E-01 1.53E-01 5.03E-01 6.50E-01 3.70E-01 3.71E-01 Average 9.22E-02 1.17E-01 1.60E-01 1.57E-01
Average 8.66E-01 6.98E-01 3.74E-01 3.81E-01 STDEV 1.55E-02 1.21E-02 1.31E-02 2.41E-02 STDEV 2.99E-01 1.21E-01 8.70E-02 2.10E-02 St error 1.10E-02 8.56E-03 9.23E-03 1.71E-02 St error 1.73E-01 6.97E-02 5.02E-02 1.21E-02 p value (vs control) 9.37E-02 8.49E-01 p value (vs control) 3.36E-01 8.83E-01 Cav1/low MW IGF-2 Cav3/LowMW IGF-2
C2MG- C2MG- C2MIG- C2MIG- C2MG- C2MG- C2MIG- C2MIG- RNAi-gfp RNAi-igf2 RNAi-gfp RNAi-igf2 RNAi-gfp RNAi-igf2 RNAi-gfp RNAi-igf2
5.92E+00 4.34E+00 1.02E+00 1.65E+00 6.62E-01 7.12E-01 4.70E-01 5.98E-01 6.79E+00 4.29E+00 7.95E-01 1.50E+00 5.21E-01 6.64E-01 3.44E-01 5.76E-01 4.67E+00 3.59E+00 9.63E-01 1.26E+00 4.54E-01 5.55E-01 3.34E-01 5.77E-01
Average 5.79E+00 4.07E+00 9.27E-01 1.47E+00 Average 5.46E-01 6.44E-01 3.83E-01 5.84E-01 STDEV 1.06E+00 4.17E-01 1.19E-01 1.93E-01 STDEV 1.06E-01 8.02E-02 7.59E-02 1.25E-02 St error 7.52E-01 2.95E-01 8.38E-02 1.37E-01 St error 7.49E-02 5.67E-02 5.37E-02 8.85E-03 p value (vs control) 5.93E-02 1.45E-02 p value (vs control) 2.70E-01 1.06E-02 Pax7 level in MG/MIG stable clones (normalized with β-actin) myogenin in MG/MIG stable clones (normalized with β-actin)
C2MG C2MG C2MIG C2MIG C2MG C2MG C2MIG C2MIG RNAi-gfp RNAi-igf2 RNAi-gfp RNAi-igf2 RNAi-gfp RNAi-igf2 RNAi-gfp RNAi-igf2 4.03E-01 1.19E+00 4.24E-01 1.27E+00 1.28E-01 1.36E-01 1.85E-01 1.44E-01 2.93E-01 9.33E-01 4.37E-01 1.29E+00 1.68E-01 1.44E-01 2.35E-01 1.66E-01 5.13E-01 1.11E+00 7.95E-01 1.14E+00 1.10E-01 9.69E-02 1.48E-01 9.56E-02
Average 4.03E-01 1.08E+00 5.52E-01 1.23E+00 1.40E-01 1.08E-01 1.73E-01 1.10E-01 STDEV 1.10E-01 1.33E-01 2.11E-01 7.87E-02 Average 1.36E-01 1.21E-01 1.85E-01 1.29E-01 St error 7.76E-02 9.38E-02 1.49E-01 5.56E-02 STDEV 2.46E-02 2.24E-02 3.64E-02 3.19E-02 p value (vs control) 2.44E-03 6.35E-03 St error 1.74E-02 1.58E-02 2.57E-02 1.84E-02
p value (vs control) 3.99E-01 5.89E-02 Figure 5.11 Pax7 level in Pax7 transfectants Pax7A C2C12 dfd13
mCherry dsgfpsh Pax7mCherry Pax7sh mCherry dsgfpsh Pax7mCherry Pax7sh 1 1 3.47E-01 4.71E-01 1 1 2.44E-01 8.11E-01 1 1 3.15E-01 4.29E-01 1 1 6.99E-01 6.85E-01 1 1 4.46E-01 4.28E-01 1 1 6.46E-01 8.95E-01
Average 1 1 7.48E-01 3.68E-01 1 1 1.19E-01 1.24E-01 STDEV 0 0 6.86E-02 2.44E-02 0 0 2.49E-01 1.06E-01 st error 0 0 4.85E-02 1.73E-02 0 0 1.76E-01 7.50E-02 p vlue (vs control) 9.08E-05 2.45E-06 3.06E-02 2.95E-02 Pax7B
1 1 2.79E-01 1.03 1 1 2.53E-01 4.03 1 1 4.75E-01 9.18E-01 1 1 5.37E-01 6.76 1 1 3.16E-01 1.98E-01 1 1 2.71E-01 2.62
Average 1 1 3.52E-01 7.15E-02 1 1 3.54E-01 4.47 STDEV 0 0 1.07E-01 4.52E-01 0 0 1.59E-01 2.10 st error 0 0 7.56E-02 3.20E-01 0 0 1.12E-01 1.49 p vlue (vs control) 4.70E-04 3.37E-01 2.15E-03 4.59E-02

382
Cav-3 level in Pax7 transfectants C2C12 dfd13 mCherry dsgfpsh Pax7mCherry Pax7sh mCherry dsgfpsh Pax7mCherry Pax7sh
1 1 7.22E-01 1.01 1 1 2.67E-01 2.56 1 1 7.22E-01 8.19E-01 1 1 1.63E-01 2.52 1 1 1.03 6.50E-01 1 1 2.46E-01 1.87
Average 1 1 8.25E-01 8.26E-01 1 1 2.25E-01 2.32 STDEV 0 0 1.79E-01 1.80E-01 0 0 5.49E-02 3.86E-01 st error 0 0 1.27E-01 1.27E-01 0 0 3.88E-02 2.73E-01 p vlue (vs control) 1.66E-01 1.70E-01 1.67E-05 4.11E-03 Cav-1 level in Pax7 transfectants
C2C12 dfd13 mCherry dsgfpsh Pax7mCherry Pax7sh mCherry dsgfpsh Pax7mCherry Pax7sh
1 1 1.10E-01 4.93E-01 1 1 6.37E-01 9.19E-01 1 1 1.59E-01 4.87E-01 1 1 6.19E-01 1.12 1 1 1.85E-01 3.21E-01 1 1 7.91E-01 9.47E-01
Average 1 1 1.52E-01 4.34E-01 1 1 6.82E-01 9.95E-01 STDEV 0 0 3.82E-02 9.77E-02 0 0 9.44E-02 1.07E-01 st error 0 0 2.70E-02 6.91E-02 0 0 6.67E-02 7.57E-02 p vlue (vs control) 2.73E-06 5.53E-04 4.31E-03 9.34E-01 b-actin level in Pax7 transfectants
C2C12 dfd13 mCherry dsgfpsh Pax7mCherry Pax7sh mCherry dsgfpsh Pax7mCherry Pax7sh
1 1 7.63E-01 9.49E-02 1 1 6.25E-01 4.83E-01 1 1 1.02 6.18E-02 1 1 6.22E-01 6.96E-01 1 1 8.74E-01 1.78E-01 1 1 7.27E-01 1.00
Average 1 1 8.84E-01 1.12E-01 1 1 6.58E-01 7.28E-01 STDEV 0 0 1.27E-01 5.99E-02 0 0 5.99E-02 2.62E-01 st error 0 0 8.95E-02 4.24E-02 0 0 4.24E-02 1.85E-01 p vlue (vs control) 1.88E-01 1.37E-05 5.89E-04 1.46E-01 Figure 5.12 Pax7 level in Cav-1/Cav-3 transfectants
C2C12 dfd13 eGFP Cav1eGFP Cav3eGFP dsgfpsh Cav1KD Cav3KD eGFP Cav1eGFP Cav3eGFP dsgfpsh Cav1KD Cav3KD
1 4.67E-01 3.42E-01 1 9.29E-01 1.65 1 1.24 5.14 1 1.42 1.46 1 7.43E-01 7.11E-01 1 9.49E-01 1.06 1 1.16 1.21 1 1.32 1.61 1 4.15E-01 3.08E-01 1 1.07 2.38 1 1.41 3.75 1 1.44 1.31
Average 1 5.42E-01 4.54E-01 1 9.83E-01 1.70 1 1.18 3.37 1 1.39 1.46 st error 0 1.25E-01 1.58E-01 0 5.46E-02 4.67E-01 0 3.56E-02 1.41 0 4.71E-02 1.08E-01 p vlue (vs control) 1.09E-02 1.34E-02 7.27E-01 1.41E-01 3.58E-03 1.09E-01 5.20E-04 6.61E-03 Cav-1 level in Cav-1/Cav-3 transfectants
C2C12 dfd13 eGFP Cav1eGFP Cav3eGFP dsgfpsh Cav1KD Cav3KD eGFP Cav1eGFP Cav3eGFP dsgfpsh Cav1KD Cav3KD
1 9.03E-01 5.33E-01 1 1.03 7.47E-01 1 8.82E-01 1.79 1 7.60E-01 6.05E-01 1 1.33 3.23E-01 1 1.38 5.67E-01 1 1.27 1.69 1 8.02E-01 9.41E-01 1 2.44 8.20E-01 1 2.74 5.20E-01 1 7.86E-01 1.05 1 6.43E-01 8.75E-01
Average 1 2 5.59E-01 1 1.72 6.11E-01 1 9.80E-01 1.51 1 7.35E-01 8.07E-01 st error 0 7.68E-01 1.77E-01 0 6.36E-01 8.45E-02 0 1.82E-01 2.82E-01 0 5.83E-02 1.26E-01 p vlue (vs control) 5. 26E-01 3.77E-02 2.39E-01 4.89E-03 8.99E-01 9.13E-02 5.11E-03 1.34E-01 Cav-3 level in Cav-1/Cav-3 transfectants
C2C12 dfd13 eGFP Cav1eGFP Cav3eGFP dsgfpsh Cav1KD Cav3KD eGFP Cav1eGFP Cav3eGFP dsgfpsh Cav1KD Cav3KD
1 1.12 9.75E-01 1 7.28E-01 6.47E-01 1 6.29E-01 1.43 1 4.64E-01 7.91E-01 1 1.05 6.08E-01 1 7.22E-01 7.05E-01 1 1.03 9.40E-01 1 6.65E-01 6.61E-01 1 9.15E-01 9.34E-01 1 8.37E-01 9.92E-01 1 8.12E-01 1.49 1 8.64E-01 5.66E-01
Average 1 1.03 8.39E-01 1 7.63E-01 7.81E-01 1 8.24E-01 1.29 1 6.64E-01 6.73E-01 st error 0 7.50E-02 1.42E-01 0 4.58E-02 1.31E-01 0 1.42E-01 2.14E-04 0 1.42E-01 8.01E-02 p vlue (vs control) 6.63E-01 2.38E-01 3.15E-03 1.10E-01 2.03E-01 1.75E-01 4.39E-02 7.45E-03

383
Appendix 5. Raw data of Chapter 6 Mechanical test of MG/MIG stable clones Modulus distribution of MG/MIG stable clones
C2MG C2MG C2MIG C2MIG C2MG C2MG C2MIG C2MIG gfpRNAi igf2RNAi gfpRNAi igf2RNAi gfpRNAi igf2RNAi gfpRNAi igf2RNAi 3.25E+03 1.54E+03 1.89E+03 3.50E+03 0 1 4 4.62E+03 1.27E+03 8.72E+02 4.05E+02 1 24 2 10 4.90E+03 1.51E+03 1.21E+03 1.92E+03 2 2 4 7 11 5.01E+03 2.63E+03 3.36E+03 8.37E+02 3 8 1 10 4 3.34E+03 2.92E+03 2.73E+03 9.77E+02 4 6 4 7.90E+03 1.67E+03 4.72E+03 3.82E+03 5 4 1 1 1 2.77E+03 1.42E+03 3.17E+03 2.05E+03 6 3 1 5.45E+03 1.69E+03 2.82E+03 1.99E+03 7 1 1 2.65E+03 1.40E+03 3.29E+03 1.41E+03 8 4 2.11E+03 2.80E+03 3.95E+03 8.65E+02 9 1 8.47E+03 1.43E+03 3.34E+03 1.52E+03 10 2 3.59E+03 1.00E+03 3.14E+03 2.14E+03 11 8.43E+03 1.12E+03 3.42E+03 1.86E+03 12 2 3.53E+03 1.43E+03 3.13E+03 2.25E+03 Total 30 30 30 30 6.37E+03 1.30E+03 2.38E+03 3.40E+03 4.20E+03 1.43E+03 2.32E+03 2.02E+03 Cell height distribution of MG/MIG stable clones 3.26E+03 1.79E+03 3.16E+03 2.40E+03 C2MG C2MG C2MIG C2MIG 5.79E+03 1.74E+03 2.79E+03 1.98E+03 height (μm) gfpRNAi igf2RNAi gfpRNAi igf2RNAi 4.12E+03 1.04E+03 2.87E+03 2.16E+03 2 1 6 3.04E+03 1.83E+03 2.08E+03 1.88E+03 3 11 1 10 1 6.82E+03 1.42E+03 3.42E+03 2.47E+03 4 10 1 11 3 8.21E+03 1.32E+03 4.38E+03 1.97E+03 5 5 2 7 8 4.26E+03 1.32E+03 4.31E+03 1.60E+03 6 5 4 4 3 8.22E+03 1.36E+03 6.03E+03 2.62E+03 7 2 10 4 11 3.98E+03 1.56E+03 4.93E+03 2.61E+03 8 4 5 1.09E+04 2.65E+03 1.28E+04 3.95E+03 9 6.43E+03 3.01E+03 7.29E+03 5.86E+03 10 4 3 4.78E+03 1.91E+03 5.62E+03 1.81E+03 11 1 2 2 1.19E+04 1.13E+03 1.24E+04 2.02E+03 12 1 1 1 5.40E+03 4.59E+03 9.56E+03 2.25E+03 13 1 1
Average (Pa) 5.50E+03 1.77E+03 4.25E+03 2.22E+03 14 STDEV 2.42E+03 7.73E+02 2.86E+03 1.07E+03 15 1 st error 4.49E+02 1.44E+02 5.32E+02 1.99E+02 16 vs. control 7.49E-19 5.95E-04 17 1 vs. MG 9.76E-09 7.11E-02 Total 37 28 44 39 E15.5 wt intercostal
My32(+) Cav3(+) Cav3(+) % of My32(+) Cav1(+) Cav1(+) % of My32(+) Cav1(+)Cav3(+) % of My32(+) My32(+) My32(+) My32(+)
3.40E+01 1.20E+01 2.00E+01 3.53E+01 4.00E+00 1.20E+01 1.18E+01 4.00E+00 1.18E+01 5.30E+01 1.80E+01 3.20E+01 3.40E+01 2.00E+00 9.00E+00 3.77E+00 2.00E+00 3.77E+00 7.00E+01 2.00E+01 4.70E+01 2.86E+01 4.00E+00 1.40E+01 5.71E+00 2.00E+00 2.86E+00 4.10E+01 1.20E+01 3.20E+01 2.93E+01 3.00E+00 1.00E+01 7.32E+00 2.00E+00 4.88E+00 4.50E+01 1.10E+01 4.00E+01 2.44E+01 2.00E+00 1.00E+01 4.44E+00 2.00E+00 4.44E+00 5.70E+01 1.50E+01 4.10E+01 2.63E+01 2.00E+00 1.30E+01 3.51E+00 3.00E+00 5.26E+00 3.80E+01 1.00E+01 2.30E+01 2.63E+01 2.00E+00 1.00E+01 5.26E+00 2.00E+00 5.26E+00 6.60E+01 2.20E+01 6.30E+01 3.33E+01 8.00E+00 2.50E+01 1.21E+01 5.00E+00 7.58E+00 6.40E+01 2.40E+01 4.80E+01 3.75E+01 7.00E+00 2.50E+01 1.09E+01 4.00E+00 6.25E+00 6.70E+01 1.80E+01 4.40E+01 2.69E+01 5.00E+00 1.30E+01 7.46E+00 3.00E+00 4.48E+00 6.20E+01 2.00E+01 4.60E+01 3.23E+01 4.00E+00 2.00E+01 6.45E+00 2.00E+00 3.23E+00 4.50E+01 1.40E+01 3.00E+01 3.11E+01 4.00E+00 1.30E+01 8.89E+00 2.00E+00 4.44E+00
Average 5.35E+01 1.63E+01 3.88E+01 3.04E+01 3.92E+00 1.45E+01 7.30E+00 2.75E+00 5.35E+00 STDEV 1.25E+01 4.64E+00 1.20E+01 4.11E+00 1.98E+00 5.68E+00 3.03E+00 1.06E+00 2.39E+00 st error 3.78E+00 1.40E+00 3.63E+00 1.24E+00 5.96E-01 1.71E+00 9.15E-01 3.18E-01 7.20E-01 p(vs mdx) 9.23E-01 3.82E-01 3.09E-05 9.53E-02 2.08E-04 2.15E-04 15.5 mdx intercostal
My32(+) Cav3(+) Cav3(+) % of My32(+) Cav1(+) Cav1(+) % of My32(+) Cav1(+)Cav3(+) % of My32(+) My32(+) My32(+) My32(+)
2.30E+01 1.30E+01 2.70E+01 5.65E+01 0.00E+00 1.60E+01 0.00E+00 0.00E+00 0.00E+00 4.80E+01 2.20E+01 3.30E+01 4.58E+01 0.00E+00 1.60E+01 0.00E+00 0.00E+00 0.00E+00 7.10E+01 3.30E+01 4.90E+01 4.65E+01 1.00E+00 2.60E+01 1.41E+00 0.00E+00 0.00E+00 7.70E+01 2.50E+01 3.50E+01 3.25E+01 1.00E+00 1.90E+01 1.30E+00 1.00E+00 1.30E+00 4.40E+01 1.40E+01 2.50E+01 3.18E+01 0.00E+00 1.30E+01 0.00E+00 0.00E+00 0.00E+00 5.20E+01 2.10E+01 7.00E+01 4.04E+01 3.00E+00 1.60E+01 5.77E+00 2.00E+00 3.85E+00 5.70E+01 3.10E+01 5.10E+01 5.44E+01 3.00E+00 2.00E+01 5.26E+00 0.00E+00 0.00E+00 6.50E+01 3.90E+01 5.80E+01 6.00E+01 2.00E+00 1.40E+01 3.08E+00 2.00E+00 3.08E+00 7.80E+01 4.80E+01 6.50E+01 6.15E+01 3.00E+00 1.80E+01 3.85E+00 3.00E+00 3.85E+00 5.20E+01 2.00E+01 3.60E+01 3.85E+01 2.00E+00 1.90E+01 3.85E+00 0.00E+00 0.00E+00 4.20E+01 1.80E+01 3.40E+01 4.29E+01 0.00E+00 1.70E+01 0.00E+00 0.00E+00 0.00E+00 4.00E+01 2.20E+01 4.20E+01 5.50E+01 2.00E+00 2.00E+01 5.00E+00 2.00E+00 5.00E+00
Average 5.41E+01 2.55E+01 4.38E+01 4.71E+01 1.42E+00 1.78E+01 2.46E+00 8.33E-01 1.42E+00

384
STDEV 1.64E+01 1.04E+01 1.48E+01 1.03E+01 1.24E+00 3.41E+00 2.26E+00 1.11E+00 1.94E+00 St error 4.95E+00 3.14E+00 4.46E+00 3.10E+00 3.74E-01 1.03E+00 6.81E-01 3.36E-01 5.85E-01

385
Figure 6.14-6.18 Modulus of myotubes C2C12 C2C12-mCherry C2C12 C2C12-mCherry C2C12 C2C12-mCherry C2C12- dfd13 dfd13-mCherry dfd13- dfd13-mCherry dfd13- dfd13-mCherry dfd13- -eGFP -dsGFP(shag) -Cav1eGFP Cav1KD -Cav3eGFP Cav3KD minidys-eGFP -eGFP -dsGFP(shag) Cav1eGFP Cav1KD Cav3eGFP Cav3KD minidys-eGFP
7.94E+03 3.01E+03 1.21E+04 1.92E+03 1.60E+04 1.66E+03 3.80E+03 2.72E+03 2.65E+03 5.21E+03 1.12E+03 5.15E+03 9.68E+03 4.54E+03 7.24E+03 2.33E+03 2.37E+03 4.89E+03 2.30E+03 1.34E+03 8.37E+03 4.78E+03 2.85E+03 5.15E+03 2.96E+03 4.36E+03 2.34E+03 2.71E+03 1.04E+04 1.33E+03 4.11E+03 5.55E+03 1.07E+04 4.58E+03 1.63E+04 3.34E+03 3.54E+03 5.68E+03 9.18E+02 3.85E+03 8.23E+03 4.21E+04 9.95E+03 1.82E+03 2.44E+03 3.71E+03 6.61E+03 3.90E+03 3.34E+03 1.90E+03 2.97E+03 6.91E+03 5.42E+02 4.92E+03 6.94E+03 3.67E+03 9.31E+03 3.86E+03 3.74E+03 4.16E+03 5.86E+03 2.11E+03 1.17E+03 1.58E+03 2.87E+03 3.22E+03 2.58E+02 4.02E+03 4.21E+03 9.05E+03 5.38E+03 3.47E+03 3.30E+03 2.60E+03 4.18E+03 5.37E+03 7.78E+02 2.27E+03 5.45E+03 4.43E+03 3.08E+03 2.15E+03 5.46E+03 3.14E+03 7.64E+03 4.70E+03 3.36E+03 2.12E+03 7.02E+03 8.12E+03 2.60E+03 6.86E+03 1.12E+03 7.47E+03 3.49E+02 3.08E+03 8.73E+03 5.59E+03 4.88E+03 1.69E+03 6.45E+03 4.48E+03 1.01E+04 3.95E+03 2.39E+03 2.59E+03 4.17E+03 2.85E+03 2.40E+02 8.78E+03 4.07E+03 2.41E+03 5.98E+03 1.72E+03 3.77E+03 5.68E+03 8.87E+03 4.08E+03 3.91E+03 1.36E+03 3.22E+03 6.77E+03 4.53E+02 1.32E+03 3.46E+03 3.38E+03 6.51E+03 1.34E+03 2.76E+03 9.86E+03 4.61E+03 8.49E+03 7.25E+02 2.17E+03 3.42E+03 3.42E+03 5.85E+03 2.25E+03 9.93E+03 8.10E+03 4.21E+03 3.19E+03 6.78E+02 6.70E+03 2.27E+04 4.78E+03 1.15E+03 2.44E+03 2.96E+03 9.66E+03 2.48E+03 1.81E+03 9.32E+03 2.70E+03 3.34E+03 2.84E+03 1.46E+03 8.00E+03 8.04E+03 1.98E+03 1.07E+03 1.71E+03 4.65E+03 4.26E+03 1.44E+03 3.13E+03 7.48E+03 3.07E+03 1.20E+04 3.52E+03 3.83E+03 2.08E+03 6.27E+03 9.88E+03 1.29E+03 1.21E+03 6.77E+03 5.49E+03 1.95E+03 3.42E+03 5.94E+03 1.49E+03 8.61E+03 1.57E+03 2.32E+03 4.99E+03 1.03E+04 2.07E+03 1.99E+03 3.20E+03 3.22E+03 2.29E+03 4.25E+03 2.31E+03 6.30E+03 4.10E+03 4.61E+03 3.96E+03 2.26E+03 6.02E+03 1.84E+04 2.22E+03 8.53E+02 2.14E+03 2.75E+03 9.74E+03 1.71E+03 2.32E+03 3.24E+03 1.51E+03 4.31E+03 2.52E+03 5.34E+03 4.02E+03 6.35E+03 5.04E+03 4.54E+03 3.86E+03 5.61E+03 3.86E+03 1.92E+03 2.62E+03 7.54E+03 2.71E+03 5.64E+03 2.43E+03 3.13E+03 3.16E+03 5.17E+03 7.37E+03 1.35E+03 2.12E+03 2.72E+03 2.31E+03 5.99E+02 8.90E+03 5.76E+03 3.28E+03 7.81E+03 2.49E+03 2.00E+03 1.21E+03 4.60E+03 2.42E+03 9.68E+02 1.74E+03 3.18E+03 4.05E+03 1.25E+03 2.40E+03 7.16E+03 3.49E+03 4.94E+03 2.92E+03 5.51E+03 4.56E+03 7.90E+03 1.09E+03 1.07E+03 1.47E+03 2.82E+03 1.43E+04 5.24E+03 2.19E+03 5.48E+03 2.32E+03 2.97E+03 2.84E+03 1.89E+03 1.90E+03 6.85E+03 2.62E+03 3.16E+03 3.16E+03 5.53E+03 6.09E+03 3.66E+03 1.21E+03 5.27E+03 1.18E+03 4.82E+03 3.41E+03 3.85E+03 1.22E+04 6.07E+03 2.20E+03 3.69E+03 1.58E+03 3.62E+03 6.85E+03 1.49E+03 2.32E+03 6.30E+03 1.52E+03 2.19E+03 2.56E+03 2.31E+03 6.16E+03 7.67E+03 9.29E+02 1.18E+03 3.24E+03 2.88E+03 3.55E+03 9.94E+02 2.27E+03 7.94E+03 2.68E+03 2.22E+03 3.30E+03 2.53E+03 8.95E+03 2.79E+03 2.31E+03 2.38E+03 2.01E+03 1.92E+03 2.51E+03 9.47E+02 5.18E+03 5.71E+03 1.20E+03 2.14E+03 3.39E+03 1.53E+03 9.74E+03 1.68E+03 5.12E+03 9.15E+02 1.28E+03 4.75E+03 5.16E+03 2.24E+03 1.64E+03 7.35E+03 2.48E+03 2.33E+03 2.61E+03 6.30E+02 1.16E+04 4.89E+03 8.22E+02 1.43E+03 2.15E+03 5.12E+03 2.39E+03 1.26E+03 1.04E+03 6.40E+03 1.28E+03 2.40E+03 2.66E+03 3.73E+03 7.93E+03 4.22E+03 1.40E+03 1.36E+03 3.96E+03 3.84E+03 2.99E+03 1.60E+03 1.28E+03 5.16E+03 3.13E+03 6.08E+03 2.37E+03 5.10E+03 7.79E+03 7.09E+03 4.75E+03 2.94E+03 1.44E+03 6.98E+03 2.60E+03 1.72E+03 1.46E+03 6.30E+03 3.35E+03 3.02E+03 2.67E+03 3.10E+03 4.69E+03 6.96E+03 1.43E+03 1.12E+03 1.33E+03 7.84E+03 5.45E+03 2.20E+03 9.98E+02 9.05E+03 2.60E+03 1.91E+03 3.13E+03 4.33E+03 5.42E+03 3.15E+03 3.68E+03 4.45E+02 3.08E+03 5.65E+03 6.96E+03 2.04E+03 5.00E+02 7.69E+03 5.37E+03 1.10E+04 2.90E+03 8.04E+03 2.26E+03 4.65E+03 3.02E+03 7.18E+03 1.60E+03 3.15E+03 5.74E+03 1.96E+03 1.51E+03 4.63E+03 1.96E+03
Average 5.72E+03 2.75E+03 3.60E+03 5.48E+03 7.40E+03 3.62E+03 2.78E+03 2.48E+03 3.94E+03 5.25E+03 1.89E+03 2.95E+03 6.44E+03 4.54E+03 STDEV 2.92E+03 7.95E+02 2.29E+03 2.95E+03 4.62E+03 2.38E+03 3.16E+03 1.23E+03 1.57E+03 2.66E+03 1.40E+03 2.04E+03 1.95E+03 7.32E+03 st error 5.41E+02 1.48E+02 4.26E+02 5.49E+02 8.58E+02 4.42E+02 5.87E+02 2.28E+02 2.92E+02 4.93E+02 2.60E+02 3.78E+02 3.61E+02 1.36E+03 p value (vs.C2C12) 5.6E-07 4.77E-04 1.28E-02 1.62E-06 1.05E-05 5.50E-06 2.33E-01 p value (vs.control) 2.68E-03 8.56E-06 9.86E-02 6.20E-02 4.1E-04 2.86E-06 1.30E-07 2.83E-01 1.03E-06 1.34E-01 Figure 6.14-6.18 Modulus distribution of myotubes
C2C12 C2C12-mCherry C2C12 C2C12-mCherry C2C12 C2C12-mCherry C2C12- dfd13 dfd13-mCherry dfd13- dfd13-mCherry dfd13- dfd13-mCherry dfd13- -eGFP -dsGFP(shag) -Cav1eGFP Cav1KD -Cav3eGFP Cav3KD minidys-eGFP -eGFP -dsGFP(shag) Cav1eGFP Cav1KD Cav3eGFP Cav3KD minidys-eGFP
Modulous (Force) 0 2 2 6 9 2 1 1 6 4 3 1 5 12 12 2 11 8 7 2 6 13 8 4 2 7 4 9 9 7 5 9 1 8 3 2 10 9 2 1 4 5 7 8 4 2 4 2 8 4 6 1 2 7 6 4 1 1 3 3 1 3 3 2 5 3 3 3 2 3 5 7 2 2 7 2 6 2 1 3 6 1 2 5 5 7 4 3 4 1 1 1 1 6 8 1 1 1 2 2 1 2 2 1 9 2 2 1 2 4 1 10 2 3 1 11 1 1 12 1

386
13 14 1 15 1 18 1 22 1 Figure 6.20-6.25 Mechanical test
C2C12 C2C12mock C2C12-mCherry C2C12-eGFP C2C12-mCherry C2C12-Cav3eGFP C2C12-mCherry C2C12-Cav1eGFP C2C12-mCherry C2C12-minidys-eGFP transfection -dsGFP(shag) Cav3KO Cav1KO
2.82E+03 1.66E+03 4.41E+03 3.53E+03 3.23E+03 3.85E+03 1.54E+03 3.26E+03 4.55E+03 1.73E+03 6.82E+03 2.47E+03 6.52E+03 2.06E+03 1.88E+03 3.94E+03 2.57E+03 2.85E+03 3.94E+03 1.70E+03 4.03E+03 1.34E+03 3.99E+03 2.36E+03 2.89E+03 5.58E+03 1.07E+03 4.59E+02 4.46E+03 2.06E+03 2.65E+03 2.33E+03 3.40E+03 2.11E+03 3.75E+03 4.34E+03 1.93E+03 2.74E+03 1.92E+03 2.21E+03 3.12E+03 3.05E+03 5.76E+03 2.71E+03 1.76E+03 3.81E+03 1.77E+03 2.99E+03 1.69E+03 1.88E+03 4.12E+03 1.26E+03 4.13E+03 3.21E+03 1.99E+03 4.81E+03 1.89E+03 3.95E+03 1.97E+03 1.72E+03 2.73E+03 2.26E+03 6.60E+03 2.25E+03 4.26E+03 3.05E+03 1.78E+03 2.35E+03 2.58E+03 3.18E+03 4.11E+03 2.82E+03 3.47E+03 1.78E+03 3.15E+03 3.16E+03 1.08E+03 2.78E+03 3.25E+03 1.95E+03 3.89E+03 2.02E+03 9.77E+03 1.73E+03 3.30E+03 6.21E+03 1.97E+03 3.18E+03 2.38E+03 1.86E+03 4.13E+03 3.08E+03 4.53E+03 2.09E+03 1.69E+03 3.99E+03 1.18E+03 5.73E+02 3.45E+03 4.29E+03 3.55E+03 1.66E+03 7.21E+03 2.55E+03 3.77E+03 8.89E+03 2.42E+03 2.76E+03 1.20E+03 4.27E+03 2.68E+03 6.51E+03 5.58E+03 3.49E+03 3.65E+03 6.04E+03 2.78E+03 3.72E+03 2.02E+03 4.49E+03 4.85E+03 2.41E+03 5.63E+03 4.40E+03 3.00E+03 6.39E+03 2.12E+03 2.21E+03 4.18E+03 5.06E+03 3.17E+03 2.80E+03 8.18E+03 2.56E+03 4.09E+03 4.59E+03 2.35E+03 4.74E+03 2.67E+03 3.34E+03 4.16E+03 1.47E+03 1.03E+04 2.66E+03 4.52E+03 7.50E+03 2.17E+03 2.39E+03 2.50E+03 4.61E+03 3.52E+03 2.62E+03 1.37E+04 3.70E+03 3.76E+03 5.62E+03 2.19E+03 2.62E+03 3.89E+03 1.15E+04 4.68E+03 7.29E+03 8.72E+03 8.96E+03 3.18E+03 1.13E+04 1.54E+03 1.60E+03 2.71E+03 2.63E+03 4.11E+03 6.40E+03 7.23E+03 1.86E+03 2.73E+03 1.78E+03 1.61E+03 1.99E+03 1.68E+03 3.49E+03 2.76E+03 4.60E+03 4.74E+03 2.91E+03 3.40E+03 3.48E+03 1.40E+03 2.87E+03 2.64E+03 6.87E+03 6.86E+03 1.58E+03 6.39E+03 2.72E+03 3.33E+03 1.04E+04 1.79E+03 1.25E+03 1.95E+03 1.88E+03 5.21E+03 1.77E+03 9.94E+03 3.53E+03 2.74E+03 5.23E+03 1.19E+03 6.53E+03 8.03E+03 9.07E+03 4.51E+03 2.14E+03 9.63E+03 1.88E+03 2.93E+03 6.35E+03 1.52E+03 5.49E+03 7.31E+03 7.11E+03 7.70E+03 3.08E+03 5.03E+03 3.21E+03 4.96E+03 3.44E+03 1.33E+03 6.33E+03 5.89E+03 1.22E+04 3.92E+03 1.38E+03 5.37E+03 2.06E+03 3.52E+03 8.32E+03 1.37E+03 6.12E+03 3.36E+03 8.88E+03 3.86E+03 1.45E+03 4.79E+03 2.17E+03 3.85E+03 6.64E+03 1.07E+03 3.88E+03 5.50E+03 8.55E+03 4.26E+03 2.61E+03 8.79E+03 2.36E+03 4.47E+03 3.64E+03 2.04E+03 7.85E+03 6.23E+03 7.58E+03 6.08E+03 1.98E+03 9.02E+03 1.66E+03 3.11E+03 3.92E+03 2.08E+03 5.68E+03 6.52E+03 2.83E+03 3.06E+03 1.31E+03 5.65E+03 2.11E+03 5.45E+03 4.55E+03 1.74E+03 3.15E+03 5.77E+03 4.40E+03 7.67E+03 1.77E+03 4.58E+03 2.71E+03 3.10E+03 9.61E+03 1.31E+03 4.54E+03 5.76E+03 7.07E+03 3.23E+03 1.30E+03 4.57E+03 1.88E+03 3.53E+03 3.99E+03 1.06E+03 2.81E+03 7.21E+03 5.45E+03
Average (Pa) 4.28E+03 2.61E+03 6.59E+03 2.77E+03 3.44E+03 5.48E+03 1.73E+03 3.03E+03 3.91E+03 4.79E+03 STDEV 1.44E+03 1.58E+03 2.47E+03 1.35E+03 7.74E+02 2.33E+03 4.77E+02 1.86E+03 1.94E+03 3.01E+03 st error 2.67E+02 2.94E+02 4.59E+02 2.51E+02 1.44E+02 4.33E+02 8.85E+01 3.46E+02 3.61E+02 5.60E+02 p value (vs control) 8.74E-07 1.74E-12 1.00E-01 1.71E-01 1.41E-03 vs dfd13 6.58E-02 8.26E-02 4.79E-04 7.97E-06 1.15E-01 2.58E-08 3.57E-02 2.18E-02 5.68E-02 9.15E-01 Figure 6.20-6.25 Modulus distribution of C2C12 myoblasts Modulous (Force) C2C12 C2C12-mCherry C2C12-eGFP C2C12-mCherry C2C12-Cav3eGFP C2C12-mCherry C2C12-Cav1eGFP C2C12-mCherry C2C12-minidys-eGFP
-dsGFP(shag) Cav3KO Cav1KD 0 2 1 6 4 1 21 3 6 7 2 5 16 5 9 11 7 4 3 9 3 6 15 11 6 5 3 4 10 7 1 5 4 2 3 5 5 1 6 1 3 2 4 2 6 3 3 5 3 2 1 7 2 2 1 1 2 3

387
8 3 1 2 1 2 9 4 1 1 10 1 1 11 1 1 12 1 13 1 Total 30 30 30 30 30 30 30 30 30 Figure 6.20-6.25 Cell heights of C2C12 myoblasts height (um) C2C12 C2C12 mock C2C12-mCherry C2C12-eGFP C2C12-mCherry C2C12-Cav3eGFP C2C12-mCherry C2C12-Cav1eGFP C2C12-mCherry C2C12-minidys-eGFP
transfection -dsGFP(shag) Cav3KD Cav1KD 0 1 1 2 6 6 3 4 2 3 13 7 21 2 5 4 7 6 4 4 9 7 11 4 8 10 7 7 8 8 5 15 12 9 7 12 3 10 3 8 6 6 3 4 6 10 3 7 7 4 4 7 2 1 4 8 4 2 5 6 4 8 1 2 3 5 2 1 3 9 1 1 5 8 2 3 1 10 1 1 1 3 2 1 2 11 2 3 1 2 12 2 3 1 1 1 13 1 1 13 1 14 1 15 2 16 17 1 Total 51 36 52 40 66 38 40 30 37 34 Modulus distribution of dfd13 myoblasts
dfd13 dfd13 mock dfd13-mCherry dfd13-eGFP dfd13-mCherry dfd13-mCherry dfd13-Cav3eGFP dfd13-mCherry dfd13-Cav1eGFP dfd13-minidyseGFP transfection -dsGFP(shag) Cav3KD Cav1KD
0 1 2 1 1 5 10 2 15 11 5 1 2 6 5 4 2 8 12 9 13 6 7 3 5 5 12 10 8 2 5 6 5 8 4 5 3 2 8 6 3 4 10 5 5 4 3 7 4 4 2 1 6 1 3 2 4 1 2 2 7 3 1 1 1 8 1 2 1 1 4 9 1 1 1 10 1 1 2 11 1 Total 30 30 30 30 30 30 30 30 30 30 Cell heights of dfd13 myoblasts Height (μm) dfd13 dfd13 mock dfd13-mCherry dfd13-eGFP dfd13-mCherry dfd13-mCherry dfd13-Cav3eGFP dfd13-mCherry dfd13-Cav1eGFP dfd13-minidyseGFP
transfection -dsGFP(shag) Cav3KD Cav1KD 0 1 1 2 7 4 1 4 6 2 8 9 2 5 3 14 15 11 18 11 11 11 13 16 10

388
4 1 5 9 18 9 20 9 8 10 3 5 4 2 10 6 14 5 1 10 3 6 2 2 6 1 4 5 3 1 2 7 3 3 1 3 2 4 2 1 2 4 8 1 1 3 2 1 1 9 1 1 3 4 10 1 5 11 2 12 13 14 1 Total 27 33 27 60 38 58 40 38 45 38 Mechanical test of dfd13 myoblasts
dfd13 dfd13 mock dfd13-mCherry dfd13-eGFP dfd13-mCherry dfd13-mCherry dfd13-Cav3eGFP dfd13-mCherry dfd13-Cav1eGFP dfd13-minidyseGFP transfection -dsGFP(shag) Cav3KD Cav1KD
3.78E+03 1.54E+03 4.08E+03 4.14E+03 3.96E+03 1.79E+03 2.30E+03 2.07E+03 3.69E+03 2.74E+03 4.02E+03 6.38E+03 3.97E+03 4.50E+03 3.39E+03 1.31E+03 1.66E+03 3.18E+03 4.55E+03 4.34E+03 2.99E+03 5.19E+03 6.00E+03 5.43E+03 2.74E+03 6.12E+02 8.74E+02 1.75E+03 5.30E+03 3.19E+03 1.14E+03 3.37E+03 3.95E+03 3.34E+03 2.35E+03 1.97E+03 3.42E+03 3.03E+03 3.60E+03 2.50E+03 2.82E+03 4.58E+03 2.79E+03 3.73E+03 4.48E+03 2.15E+03 4.38E+03 2.77E+03 5.93E+03 3.18E+03 6.76E+03 3.90E+03 5.59E+03 4.38E+03 2.87E+03 1.78E+03 2.45E+03 2.19E+03 6.98E+03 3.66E+03 3.08E+03 6.09E+03 2.59E+03 4.41E+03 3.41E+03 1.69E+03 1.11E+03 8.54E+02 1.66E+03 6.22E+03 4.49E+03 6.22E+03 8.43E+03 3.49E+03 4.79E+03 1.78E+03 1.28E+03 1.53E+03 4.67E+03 4.50E+03 3.67E+03 5.16E+03 3.10E+03 6.50E+03 8.82E+03 2.02E+03 3.96E+03 1.74E+03 4.74E+03 2.57E+03 4.06E+03 5.68E+03 3.59E+03 4.47E+03 4.58E+03 2.08E+03 3.65E+03 2.47E+03 6.09E+03 3.33E+03 2.86E+03 4.59E+03 7.82E+03 3.33E+03 2.50E+03 3.19E+03 4.55E+03 2.28E+03 2.58E+03 3.02E+03 1.64E+03 2.84E+03 6.19E+03 2.46E+03 2.70E+03 2.21E+03 2.81E+03 2.82E+03 4.13E+03 2.57E+03 1.49E+03 3.62E+03 8.07E+03 3.42E+03 2.25E+03 2.71E+03 3.86E+03 2.12E+03 2.68E+03 6.86E+03 2.14E+03 1.59E+03 4.84E+03 5.86E+03 2.38E+03 2.96E+03 4.38E+03 1.28E+03 2.36E+03 3.03E+03 5.16E+03 1.48E+03 5.83E+03 5.20E+03 5.46E+03 2.41E+03 1.73E+03 2.54E+03 4.09E+03 2.68E+03 7.09E+03 1.64E+03 5.83E+03 3.45E+03 2.09E+03 3.20E+03 6.50E+02 2.51E+03 4.38E+03 4.51E+03 2.38E+03 8.94E+02 5.82E+03 6.96E+03 5.22E+03 1.80E+03 1.61E+03 2.71E+03 7.46E+03 2.75E+03 2.19E+03 1.73E+03 5.95E+03 3.67E+03 1.88E+03 1.83E+03 1.43E+03 1.33E+03 2.42E+03 3.39E+03 1.33E+03 1.90E+03 5.53E+03 3.34E+03 1.94E+03 1.61E+03 2.48E+03 3.27E+03 8.85E+03 2.19E+03 1.46E+03 1.71E+03 3.97E+03 4.56E+03 3.11E+03 2.92E+03 1.76E+03 2.06E+03 1.40E+04 3.01E+03 7.38E+03 1.22E+03 3.69E+03 9.17E+03 4.36E+03 1.78E+03 3.00E+03 3.91E+03 3.42E+03 5.69E+03 7.05E+03 1.94E+03 3.39E+03 3.58E+03 5.56E+03 1.65E+03 2.97E+03 5.47E+03 2.50E+03 7.84E+03 5.75E+03 2.48E+03 3.35E+03 5.77E+03 3.22E+03 2.39E+03 2.56E+03 4.50E+03 3.17E+03 8.35E+03 8.48E+03 1.18E+03 3.62E+03 6.95E+03 3.32E+03 1.44E+03 2.68E+03 5.79E+03 2.73E+03 9.42E+03 4.58E+03 2.53E+03 3.09E+03 6.29E+03 5.46E+03 1.99E+03 1.40E+03 5.18E+03 4.81E+03 4.09E+03 5.43E+03 3.63E+03 2.79E+03 2.90E+03 3.41E+03 1.19E+03 1.93E+03 3.94E+03 4.78E+03 8.98E+03 3.01E+03 2.85E+03 3.78E+03 4.62E+03 9.30E+03 1.77E+03 1.79E+03 3.94E+03 4.75E+03 1.01E+04 3.89E+03 2.89E+03 2.58E+03 4.49E+03 3.83E+03 2.10E+03 2.09E+03 5.67E+03 4.52E+03 8.15E+03 4.37E+03 3.15E+03 6.68E+03 3.57E+03 4.40E+03 2.26E+03 1.83E+03 5.68E+03 1.06E+04 8.31E+03 5.15E+03 4.10E+03 3.22E+03 1.08E+04 4.61E+03 2.05E+03 3.14E+03 2.98E+03 3.26E+03 4.93E+03
Average (Pa) 3.99E+03 3.20E+03 4.67E+03 4.83E+03 3.95E+03 2.02E+03 2.46E+03 3.05E+03 4.82E+03 4.36E+03 STDEV 1.99E+03 1.66E+03 1.69E+03 1.85E+03 1.78E+03 5.78E+02 1.09E+03 1.42E+03 2.63E+03 2.32E+03 st error 3.70E+02 3.09E+02 3.14E+02 3.44E+02 3.30E+02 1.07E+02 2.02E+02 2.63E+02 4.89E+02 4.32E+02 vs control 5.45E-07 1.19E-07 3.56E-02 9.97E-01 9.36E-01


