Embed Size (px)
Citation preview
RESEARCH ARTICLE Open Access
Gene expression profiling in the Cynomolgusmacaque Macaca fascicularis shows variationwithin the normal birth rangeBright Starling Emerald1,4*, Keefe Chng1, Shinya Masuda1, Deborah M Sloboda2, Mark H Vickers2, Ravi Kambadur1,3
and Peter D Gluckman1,2
Abstract
Background: Although an adverse early-life environment has been linked to an increased risk of developing themetabolic syndrome, the molecular mechanisms underlying altered disease susceptibility as well as their relevanceto humans are largely unknown. Importantly, emerging evidence suggests that these effects operate within thenormal range of birth weights and involve mechanisms of developmental palsticity rather than pathology.
Method: To explore this further, we utilised a non-human primate model Macaca fascicularis (Cynomolgusmacaque) which shares with humans the same progressive history of the metabolic syndrome. Using microarraywe compared tissues from neonates in the average birth weight (50-75th centile) to those of lower birth weight (5-25th centile) and studied the effect of different growth trajectories within the normal range on gene expressionlevels in the umbilical cord, neonatal liver and skeletal muscle.
Results: We identified 1973 genes which were differentially expressed in the three tissue types between averageand low birth weight animals (P < 0.05). Gene ontology analysis identified that these genes were involved inmetabolic processes including cellular lipid metabolism, cellular biosynthesis, cellular macromolecule synthesis,cellular nitrogen metabolism, cellular carbohydrate metabolism, cellular catabolism, nucleotide and nucleic acidmetabolism, regulation of molecular functions, biological adhesion and development.
Conclusion: These differences in gene expression levels between animals in the upper and lower percentiles ofthe normal birth weight range may point towards early life metabolic adaptations that in later life result indifferences in disease risk.
BackgroundClinical, experimental and epidemiological studies havehighlighted a link between the early-life environmentand the health and well-being of offspring in later life.An adverse maternal environment has been linked to anincreased risk of developing metabolic and cardiovascu-lar disorders including type 2 diabetes, obesity, hyperli-pidemia, insulin resistance and hypertension [1-7]. Animportant feature of these studies is that these relation-ships exist within the normative birth range and do notdepend on extremes of birth weight. This has led to the
proposal that later life disease risk is the result of mala-daptive consequences of plastic mechanisms whichwould normally be adaptive [8,9].It is proposed that developmental plasticity determines
the trajectory of development through epigenetic pro-cesses such that the fetus attempts to match its laterphenotype to the environment [10]. It has been pro-posed that low birth weight is a marker of a poor earlylife nutritional environment [11] and thus a smallerfetus is more likely to develop a metabolic capacityappropriate for a low nutrient postnatal environment.But, if faced with a high nutrient environment it is morelikely to become obese and insulin resistant [12].Although, epigenetic processes have been increasinglyimplicated largely from rodent studies involving
* Correspondence: [email protected], Development and Metabolism Programme, Singapore Institute forClinical Sciences, Brenner Centre for Molecular Medicine, 30 Medical Drive,SingaporeFull list of author information is available at the end of the article
Emerald et al. BMC Genomics 2011, 12:509http://www.biomedcentral.com/1471-2164/12/509
© 2011 Emerald et al; licensee BioMed Central Ltd. This is an Open Access article distributed under the terms of the Creative CommonsAttribution License (http://creativecommons.org/licenses/by/2.0), which permits unrestricted use, distribution, and reproduction inany medium, provided the original work is properly cited.
nutritional manipulation of the dam [13,14] the molecu-lar mechanisms underlying altered disease susceptibilityare largely unknown. There is also some evidence thatthese developmental trajectories, and associated long-term gene expression and epigenetic changes can bereversed by the administration of the adipokine leptin tothe neonatal rat although the concentrations used werehigher than physiological levels [10,12,15,16]. These datasuggest that a better understanding of the molecularevents associated with impaired early life developmentmay help in designing future intervention strategies.To identify the possible molecular pathways associated
with variations in the fetal environment, we have utiliseda non-human primate (NHP) model, the Macaca fasci-cularis (Cynomolgus macaque) to elucidate whether var-iations within the normal birth weight range areassociated with differential gene expressions patterns.Cynomolgus macaques share with humans the sameprogressive history of the metabolic syndrome [17]which makes this model directly relevant to humansand importantly, Cynomolgus macaque is a monotocousspecies in which spontaneous variation in fetal growthrather than experimental manipulation can be investi-gated. This study therefore we have investigated theeffect of spontaneous lower birth weight on geneexpression in key tissues (umbilical cord, hepatic tissueand skeletal muscle) from female Cynomolgus macaqueneonates.
MethodsCollection of Umblical cordsSixty-five pregnant Cynomolgus macaque dams, sirednaturally by one male, were monitored prior to deliveryat the Vietnam Primate Breeding and Development Cor-poration. After birth, dams were sedated (ketamine-HCl;7 mg/kg) to facilitate collection of the umbilical cord.The cords were collected and immediately snap-frozenin liquid nitrogen and stored at -80°C for later analyses.Neonates were weighed at birth and promptly returnedto the dams. All animal procedures were approved byNafovanny, subsidiary of the Ministry of Forestry, Viet-nam, and performed in accordance with the guidelinesset by the national advisory committee for laboratoryanimal research (NACLAR) of Singapore.
Collection of hepatic and skeletal muscle samplesThe normative birth range was assessed from these 65pregnancies and 8 neonates were selected based on theirbirth weights to comprise 2 groups: 1) lower birthweight group (LBW); n = 4 classified as those that werewithin the 5th to 25th birth weight percentile, birthweight range 299-317 g and 2) average birth weightgroup (ABW); n = 4 classified as those that were withinthe 50th to 75th birth weight percentile, birth weight
range 358-398 g. The normal gestation of Cynomolgusmacaque is approximately 155-170 days [18]. We haveestimated the gestational age based on early ultrasoundmeasurements (greatest length of the embryo at thetime of pregnancy detection) and used those pregnan-cies where fetuses were within normal distribution forfull term Cynomolgus macaques [18]. On postnatal day5, neonates were sedated with an intramuscular injec-tion of ketamine-HCl (15 mg/kg), and exsanguinatedunder anesthesia. Liver and skeletal muscle (bicepsfemoris) were collected and immediately snap frozen inliquid nitrogen and stored at -80°C for later analyses
Preparation of Total RNATotal RNA was isolated from umbilical cords and neo-natal tissues using TRIzol reagent according to the man-ufacturer’s instructions (Invitrogen). RNA integrity wasconfirmed by bio analyzer 2100 (Agilent Technologies,Santa Clara, USA). An RNA Integrity Number (RIN)value of 7.5 above was considered acceptable and usedin further experiments.
Microarray analysisFor microarray analysis, RNA from 6 groups of samples(Cord: ABW and LBW; Liver: ABW and LBW; skeletalmuscle: ABW and LBW) were labeled using QuickAmp1-color labeling kit (Agilent Technologies) according tomanufacturer’s protocol. The Cy3 labeled cRNA weresubsequently hybridized to Agilent Rhesus Macaque(G2519F-015421) Gene Expression microarray. TheRhesus macaque gene expression microarray used inthis study represented 43,803 Rhesus monkey probessynthesized as 60-mers spotted using the Agilent Sure-Print technology (Agilent Technologies). The microar-rays were scanned with Agilent High resolution Scannerand the images were feature extracted using FE softwareversion 10.5 (Agilent Technologies).Data analysis was performed using Genespring GX
ver10 (Agilent Technologies). The raw signal intensityfrom each samples is global normalized to 75th percen-tile and base-line transformed. Probes flagged with pre-sent call in at least 75% of the samples in any of the 6groups were used for subsequent data analysis.Two-way ANOVA was performed with p value cut-off
at 0.05 to identify genes that are differentially expressedin the tissue type and birth weight. Due to limited anno-tation of Rhesus Monkey genome, the microarray probesare annotated against human genes and ontology. Formapping against the human genome, the probes fromthe monkey microarray were re-annotated using AgilenteARRAY. The probe sequences were aligned to humangenome (hg18) using BLAST based algorithm and theassociated human annotation was extracted from thedatabase.
Emerald et al. BMC Genomics 2011, 12:509http://www.biomedcentral.com/1471-2164/12/509
Page 2 of 17
To study the gene expression profile of the birthweight in each of the tissue type, Welch T-Test with p-value cut off of 0.05 and fold change of 1.5X was per-formed between the ABW and LBW samples in each ofthe tissue groups.Complete microarray data is available at the Gene
Expression Omnibus (GEO) database under the acces-sion number GSE32069.
Network AnalysisThe microarray data was imported into Pathway Studioversion 7 (Ariadne Genomics, Rockville, USA) for net-work analysis. Gene Set Enrichment Analysis (GSEA)was performed on ABW vs LBW in the respective tissueusing Kolmogorov-Smirnov algorithm with p-value cut-off at 0.05. In addition, Network Enrichment Analysis(NEA) was performed to identify expression hub of thetreatment. Sub network was generated by connectingentities to their expression target network using theResnet 7 Mammalian database.
Quantitative RT-PCRFive up-regulated and two down regulated genes wereselected for verification using qRT-PCR. The primerswere designed using the Cynomolgus if available or Rhe-sus macaque sequences using the primer 3 software ifnot available [19]. The gene symbols and the primersare listed in Table 1.We used skeletal muscle RNA to verify the array.
Briefly, total RNA was extracted as mentioned abovefrom four ABW and four LBW neonates and werereverse transcribed using Applied Biosystem’s high-capa-city cDNA reverse transcription kit using 1 μg of totalRNA in a reaction volume of 20 μl. The PCR reactionswere carried out in 25 μl of SYBR Green Master Mixwith 200 ng of cDNA using 7500 real time PCR system(Applied Biosystems, CA, USA). The comparative Ctmethod was used to calculate the relative gene expres-sion [20]. 18S RNA was used as the internal controlwhich was validated using the method described inSchmittgen and Livak [20] and found to be stable andconsistent.
ResultsMicroarray analysisTwo-way factorial ANOVA identified 1973 genes whichwere differentially expressed in the three tissue typesbetween ABW and LBW neonates (P < 0.05). Of these,1141 genes were up regulated in the LBW sampleswhile 832 genes were down-regulated in the LBW sam-ples compared to ABW (Figure 1).Gene expression profiles of umbilical cord, liver and
skeletal muscle were also compared using Welch-t-test.There were 250 genes significantly and differently
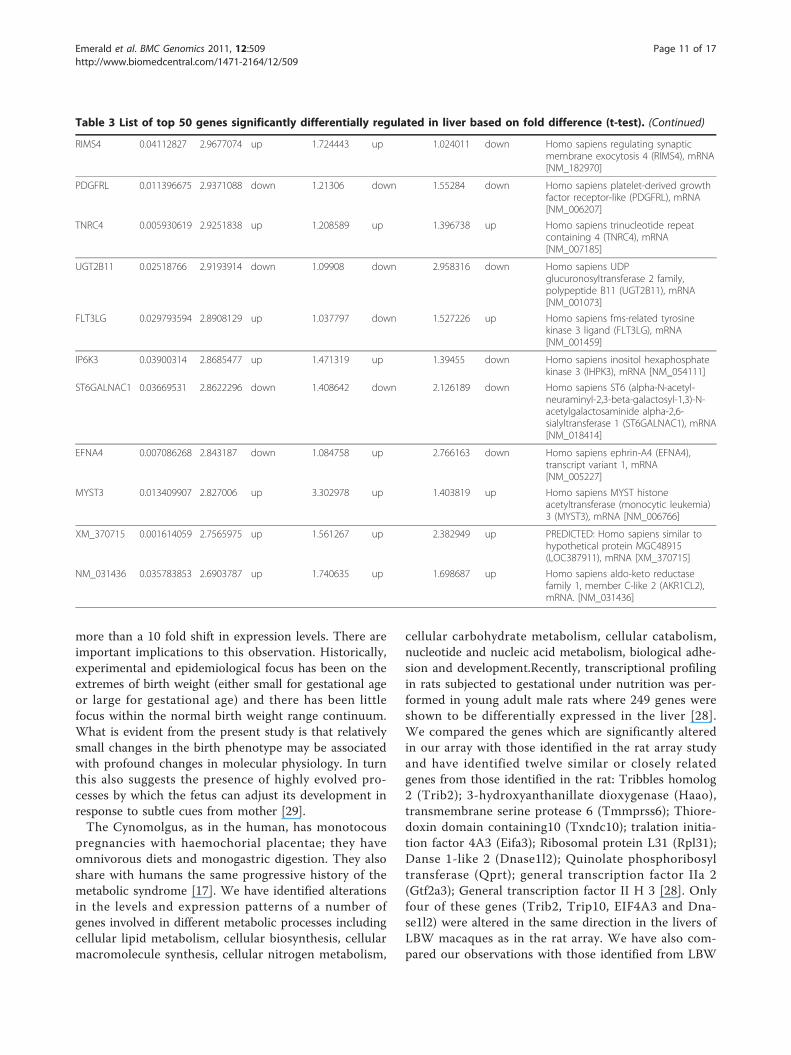
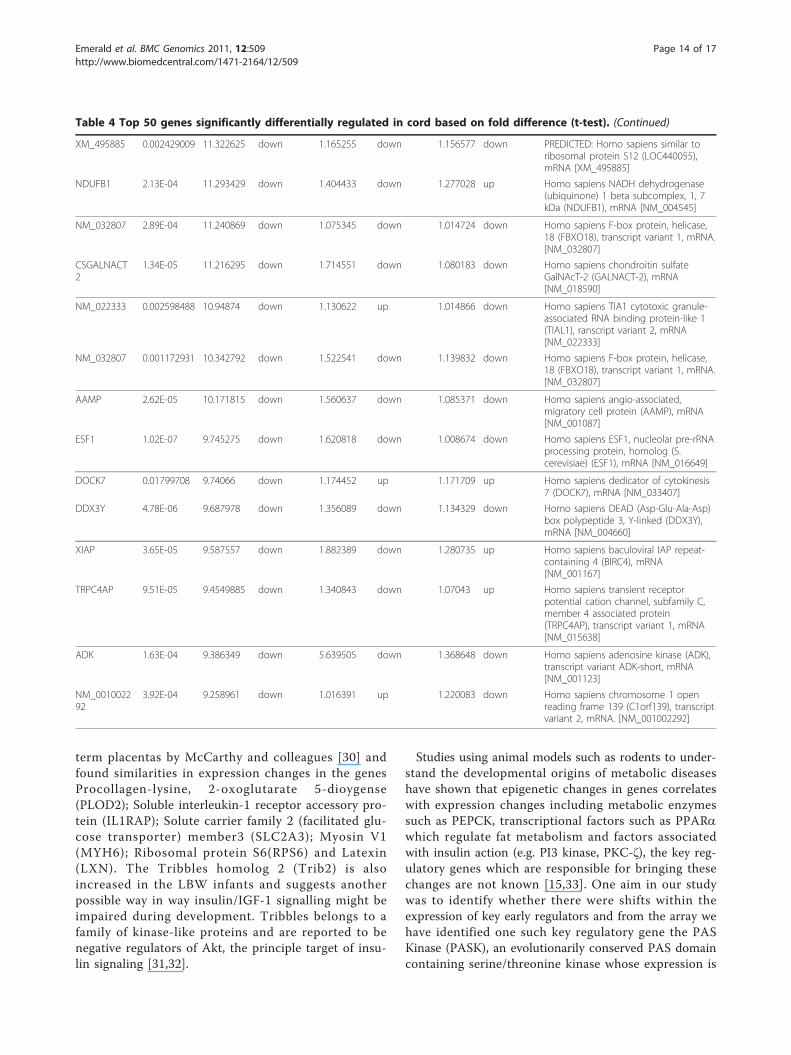
expressed in the liver, 850 genes significantly and differ-ently expressed in the skeletal muscle and 891 genes sig-nificantly and differently expressed in cord samples (P <0.05, >1.5 fold difference) (Figure 2, 3). The top 50genes whose gene expression levels changed in each tis-sue based on their fold difference based on Welch T-test are given in Tables 2, 3, 4.Of the 250 genes which were differently expressed in
the liver, 182 genes were unique to the liver (115 genesup regulated in the LBW group and 67 genes down-regulated in the LBW group). There were 19 geneswhich were significantly and differently expressedbetween liver and skeletal muscle (16 up regulated inLBW skeletal muscle and 15 genes up regulated in liverand 3 down-regulated in the LBW skeletal muscle and 4down regulated in LBW liver). There were 5 geneswhich are significantly and differently expressed betweenliver and cord (3 up regulated in LBW liver and 2 genesup regulated in LBW cord and 2 down regulated inLBW liver and 3 down regulated in the cord).Of the 850 genes significantly and differently
expressed in skeletal muscle, 733 genes were specific tothe skeletal muscle; i.e. showed altered regulation onlyin the skeletal muscle (584 genes up regulated in theLBW samples and 149 genes down regulated in theLBW group). There were 94 genes which were
Table 1 Sequences of primers used for qRT-PCR:
PASK F 5’ CTACTCCGGGAGCTGCTATC 3’
PASK R5’ AGCAGCAGAACAGAGGTGTG 3’
116936 F5’ GCACATCTGCCTGAAGTGAA 3’
116936 R5’ GAGCAGCTTGTCCAGGAAGT 3’
ADK F5’ TGGTGGCTCTACCCAGAACT 3’
ADK R5’ CATCTACATGGGCTTCAGCA 3’
ELMO F5’ AGCTCTGTGTGGCTTGGTTT 3’
ELMO R5’ CGGTGTGAATAACGGAGTCCT 3’
SIX1 F5’ GTTTAAGAACCGGAGGCAAA 3’
SIX1 R5’ GGAGAGAGTTGGTTCTGCTTG 3’
SLC12A9 F5’ GGCTTCAACAGCAGTACCCT 3’
SLC12A9 R5’ AAGAGGACAGCAAAGACGCT 3’
RBL1 F5’ TAGCCTGACCAACATGGAGA 3’
RBL1 R5’ GTTCAAGCAATTCTGCCTCA 3’
Uni18SrRNA F5’ AGTCCCTGCCCTTTGTACACA 3’
Uni18SrRNA R5’ GATCCGAGGGCCTCACTAAAC 3’
Emerald et al. BMC Genomics 2011, 12:509http://www.biomedcentral.com/1471-2164/12/509
Page 3 of 17
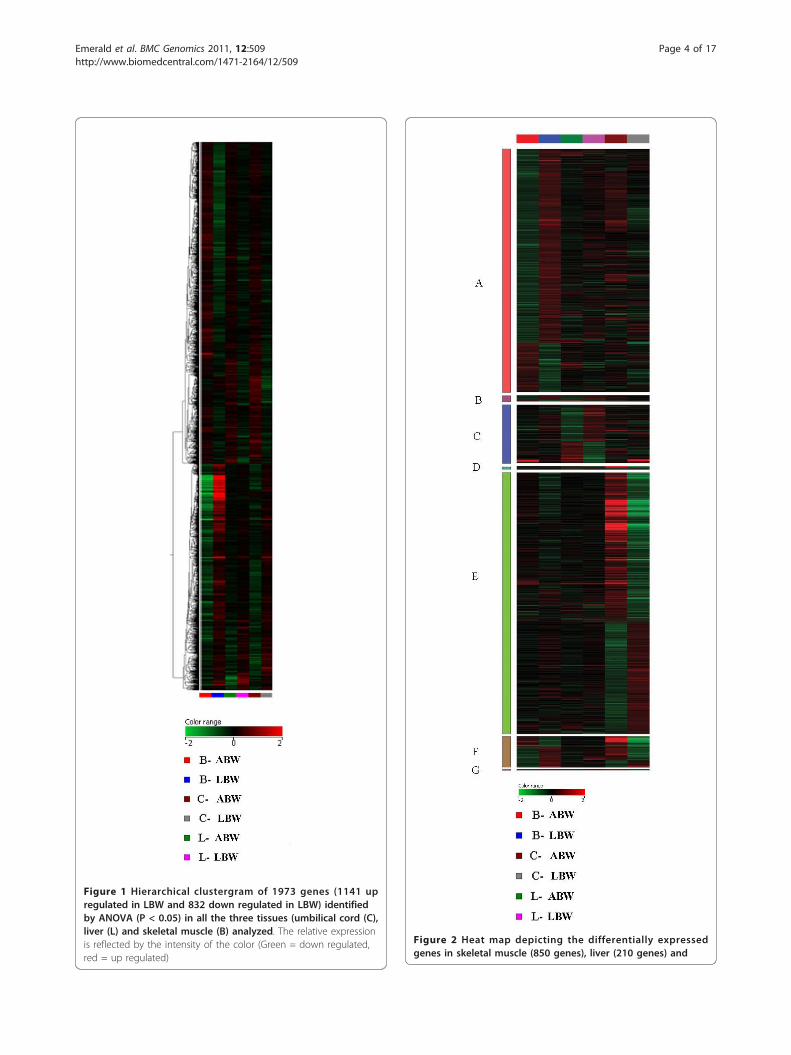
Figure 1 Hierarchical clustergram of 1973 genes (1141 upregulated in LBW and 832 down regulated in LBW) identifiedby ANOVA (P < 0.05) in all the three tissues (umbilical cord (C),liver (L) and skeletal muscle (B) analyzed. The relative expressionis reflected by the intensity of the color (Green = down regulated,red = up regulated)
Figure 2 Heat map depicting the differentially expressedgenes in skeletal muscle (850 genes), liver (210 genes) and
Emerald et al. BMC Genomics 2011, 12:509http://www.biomedcentral.com/1471-2164/12/509
Page 4 of 17
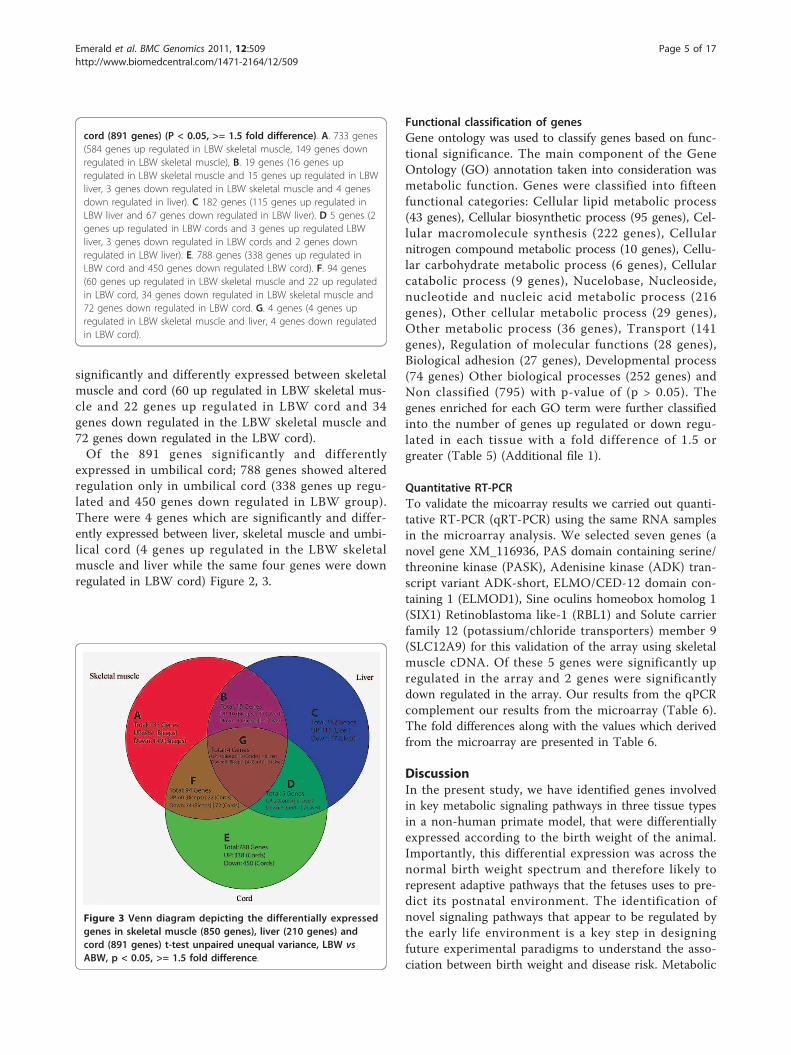
significantly and differently expressed between skeletalmuscle and cord (60 up regulated in LBW skeletal mus-cle and 22 genes up regulated in LBW cord and 34genes down regulated in the LBW skeletal muscle and72 genes down regulated in the LBW cord).Of the 891 genes significantly and differently
expressed in umbilical cord; 788 genes showed alteredregulation only in umbilical cord (338 genes up regu-lated and 450 genes down regulated in LBW group).There were 4 genes which are significantly and differ-ently expressed between liver, skeletal muscle and umbi-lical cord (4 genes up regulated in the LBW skeletalmuscle and liver while the same four genes were downregulated in LBW cord) Figure 2, 3.
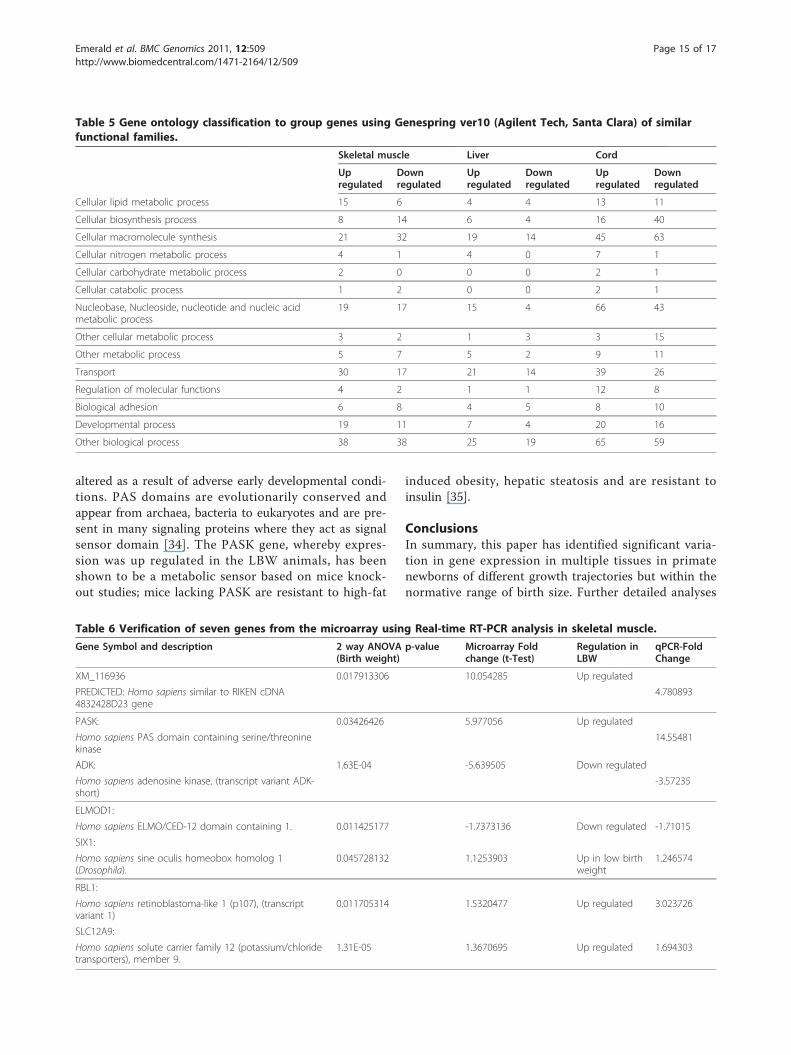
Functional classification of genesGene ontology was used to classify genes based on func-tional significance. The main component of the GeneOntology (GO) annotation taken into consideration wasmetabolic function. Genes were classified into fifteenfunctional categories: Cellular lipid metabolic process(43 genes), Cellular biosynthetic process (95 genes), Cel-lular macromolecule synthesis (222 genes), Cellularnitrogen compound metabolic process (10 genes), Cellu-lar carbohydrate metabolic process (6 genes), Cellularcatabolic process (9 genes), Nucelobase, Nucleoside,nucleotide and nucleic acid metabolic process (216genes), Other cellular metabolic process (29 genes),Other metabolic process (36 genes), Transport (141genes), Regulation of molecular functions (28 genes),Biological adhesion (27 genes), Developmental process(74 genes) Other biological processes (252 genes) andNon classified (795) with p-value of (p > 0.05). Thegenes enriched for each GO term were further classifiedinto the number of genes up regulated or down regu-lated in each tissue with a fold difference of 1.5 orgreater (Table 5) (Additional file 1).
Quantitative RT-PCRTo validate the micoarray results we carried out quanti-tative RT-PCR (qRT-PCR) using the same RNA samplesin the microarray analysis. We selected seven genes (anovel gene XM_116936, PAS domain containing serine/threonine kinase (PASK), Adenisine kinase (ADK) tran-script variant ADK-short, ELMO/CED-12 domain con-taining 1 (ELMOD1), Sine oculins homeobox homolog 1(SIX1) Retinoblastoma like-1 (RBL1) and Solute carrierfamily 12 (potassium/chloride transporters) member 9(SLC12A9) for this validation of the array using skeletalmuscle cDNA. Of these 5 genes were significantly upregulated in the array and 2 genes were significantlydown regulated in the array. Our results from the qPCRcomplement our results from the microarray (Table 6).The fold differences along with the values which derivedfrom the microarray are presented in Table 6.
DiscussionIn the present study, we have identified genes involvedin key metabolic signaling pathways in three tissue typesin a non-human primate model, that were differentiallyexpressed according to the birth weight of the animal.Importantly, this differential expression was across thenormal birth weight spectrum and therefore likely torepresent adaptive pathways that the fetuses uses to pre-dict its postnatal environment. The identification ofnovel signaling pathways that appear to be regulated bythe early life environment is a key step in designingfuture experimental paradigms to understand the asso-ciation between birth weight and disease risk. Metabolic
Figure 3 Venn diagram depicting the differentially expressedgenes in skeletal muscle (850 genes), liver (210 genes) andcord (891 genes) t-test unpaired unequal variance, LBW vsABW, p < 0.05, >= 1.5 fold difference.
cord (891 genes) (P < 0.05, >= 1.5 fold difference). A. 733 genes(584 genes up regulated in LBW skeletal muscle, 149 genes downregulated in LBW skeletal muscle), B. 19 genes (16 genes upregulated in LBW skeletal muscle and 15 genes up regulated in LBWliver, 3 genes down regulated in LBW skeletal muscle and 4 genesdown regulated in liver). C 182 genes (115 genes up regulated inLBW liver and 67 genes down regulated in LBW liver). D 5 genes (2genes up regulated in LBW cords and 3 genes up regulated LBWliver, 3 genes down regulated in LBW cords and 2 genes downregulated in LBW liver). E. 788 genes (338 genes up regulated inLBW cord and 450 genes down regulated LBW cord). F. 94 genes(60 genes up regulated in LBW skeletal muscle and 22 up regulatedin LBW cord, 34 genes down regulated in LBW skeletal muscle and72 genes down regulated in LBW cord. G. 4 genes (4 genes upregulated in LBW skeletal muscle and liver, 4 genes down regulatedin LBW cord).
Emerald et al. BMC Genomics 2011, 12:509http://www.biomedcentral.com/1471-2164/12/509
Page 5 of 17
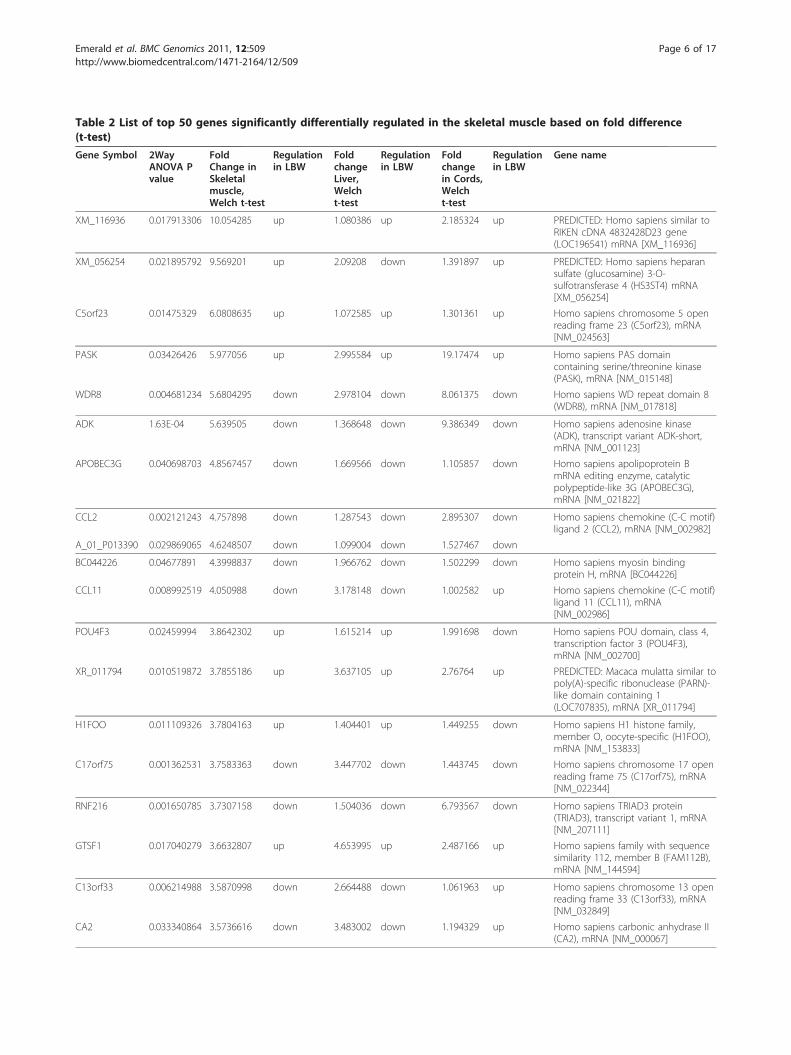
Table 2 List of top 50 genes significantly differentially regulated in the skeletal muscle based on fold difference(t-test)
Gene Symbol 2WayANOVA Pvalue
FoldChange inSkeletalmuscle,Welch t-test
Regulationin LBW
FoldchangeLiver,Welcht-test
Regulationin LBW
Foldchangein Cords,Welcht-test
Regulationin LBW
Gene name
XM_116936 0.017913306 10.054285 up 1.080386 up 2.185324 up PREDICTED: Homo sapiens similar toRIKEN cDNA 4832428D23 gene(LOC196541) mRNA [XM_116936]
XM_056254 0.021895792 9.569201 up 2.09208 down 1.391897 up PREDICTED: Homo sapiens heparansulfate (glucosamine) 3-O-sulfotransferase 4 (HS3ST4) mRNA[XM_056254]
C5orf23 0.01475329 6.0808635 up 1.072585 up 1.301361 up Homo sapiens chromosome 5 openreading frame 23 (C5orf23), mRNA[NM_024563]
PASK 0.03426426 5.977056 up 2.995584 up 19.17474 up Homo sapiens PAS domaincontaining serine/threonine kinase(PASK), mRNA [NM_015148]
WDR8 0.004681234 5.6804295 down 2.978104 down 8.061375 down Homo sapiens WD repeat domain 8(WDR8), mRNA [NM_017818]
ADK 1.63E-04 5.639505 down 1.368648 down 9.386349 down Homo sapiens adenosine kinase(ADK), transcript variant ADK-short,mRNA [NM_001123]
APOBEC3G 0.040698703 4.8567457 down 1.669566 down 1.105857 down Homo sapiens apolipoprotein BmRNA editing enzyme, catalyticpolypeptide-like 3G (APOBEC3G),mRNA [NM_021822]
CCL2 0.002121243 4.757898 down 1.287543 down 2.895307 down Homo sapiens chemokine (C-C motif)ligand 2 (CCL2), mRNA [NM_002982]
A_01_P013390 0.029869065 4.6248507 down 1.099004 down 1.527467 down
BC044226 0.04677891 4.3998837 down 1.966762 down 1.502299 down Homo sapiens myosin bindingprotein H, mRNA [BC044226]
CCL11 0.008992519 4.050988 down 3.178148 down 1.002582 up Homo sapiens chemokine (C-C motif)ligand 11 (CCL11), mRNA[NM_002986]
POU4F3 0.02459994 3.8642302 up 1.615214 up 1.991698 down Homo sapiens POU domain, class 4,transcription factor 3 (POU4F3),mRNA [NM_002700]
XR_011794 0.010519872 3.7855186 up 3.637105 up 2.76764 up PREDICTED: Macaca mulatta similar topoly(A)-specific ribonuclease (PARN)-like domain containing 1(LOC707835), mRNA [XR_011794]
H1FOO 0.011109326 3.7804163 up 1.404401 up 1.449255 down Homo sapiens H1 histone family,member O, oocyte-specific (H1FOO),mRNA [NM_153833]
C17orf75 0.001362531 3.7583363 down 3.447702 down 1.443745 down Homo sapiens chromosome 17 openreading frame 75 (C17orf75), mRNA[NM_022344]
RNF216 0.001650785 3.7307158 down 1.504036 down 6.793567 down Homo sapiens TRIAD3 protein(TRIAD3), transcript variant 1, mRNA[NM_207111]
GTSF1 0.017040279 3.6632807 up 4.653995 up 2.487166 up Homo sapiens family with sequencesimilarity 112, member B (FAM112B),mRNA [NM_144594]
C13orf33 0.006214988 3.5870998 down 2.664488 down 1.061963 up Homo sapiens chromosome 13 openreading frame 33 (C13orf33), mRNA[NM_032849]
CA2 0.033340864 3.5736616 down 3.483002 down 1.194329 up Homo sapiens carbonic anhydrase II(CA2), mRNA [NM_000067]
Emerald et al. BMC Genomics 2011, 12:509http://www.biomedcentral.com/1471-2164/12/509
Page 6 of 17
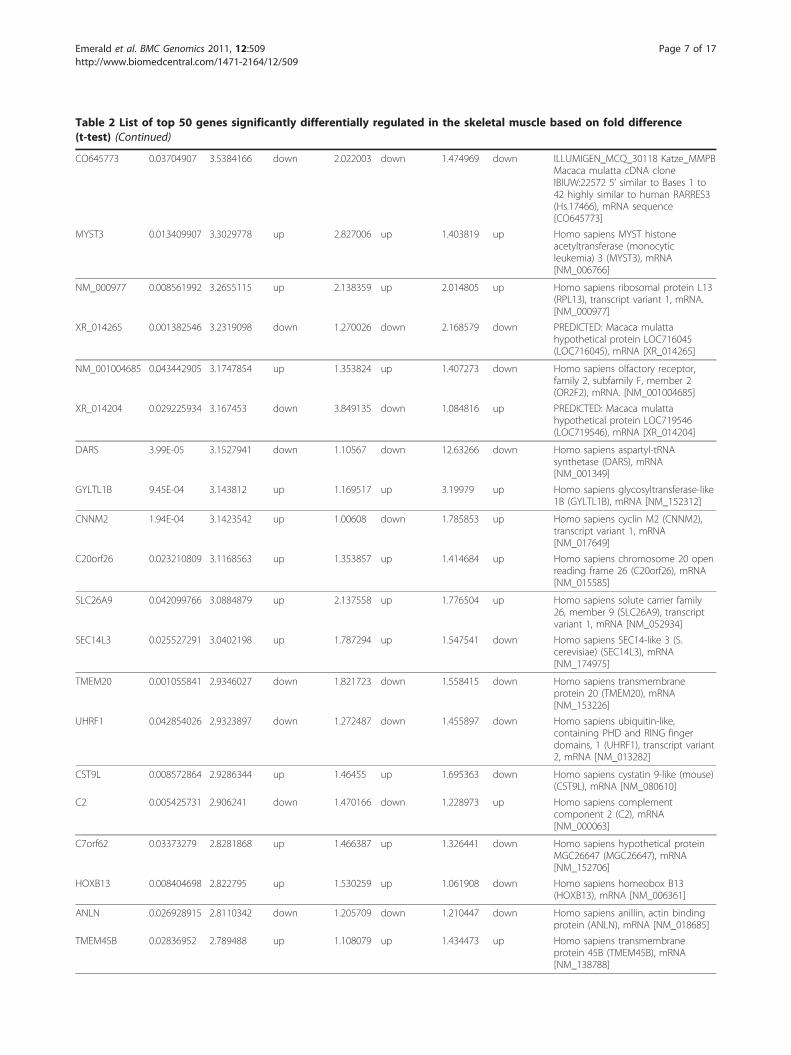
Table 2 List of top 50 genes significantly differentially regulated in the skeletal muscle based on fold difference(t-test) (Continued)
CO645773 0.03704907 3.5384166 down 2.022003 down 1.474969 down ILLUMIGEN_MCQ_30118 Katze_MMPBMacaca mulatta cDNA cloneIBIUW:22572 5’ similar to Bases 1 to42 highly similar to human RARRES3(Hs.17466), mRNA sequence[CO645773]
MYST3 0.013409907 3.3029778 up 2.827006 up 1.403819 up Homo sapiens MYST histoneacetyltransferase (monocyticleukemia) 3 (MYST3), mRNA[NM_006766]
NM_000977 0.008561992 3.2655115 up 2.138359 up 2.014805 up Homo sapiens ribosomal protein L13(RPL13), transcript variant 1, mRNA.[NM_000977]
XR_014265 0.001382546 3.2319098 down 1.270026 down 2.168579 down PREDICTED: Macaca mulattahypothetical protein LOC716045(LOC716045), mRNA [XR_014265]
NM_001004685 0.043442905 3.1747854 up 1.353824 up 1.407273 down Homo sapiens olfactory receptor,family 2, subfamily F, member 2(OR2F2), mRNA. [NM_001004685]
XR_014204 0.029225934 3.167453 down 3.849135 down 1.084816 up PREDICTED: Macaca mulattahypothetical protein LOC719546(LOC719546), mRNA [XR_014204]
DARS 3.99E-05 3.1527941 down 1.10567 down 12.63266 down Homo sapiens aspartyl-tRNAsynthetase (DARS), mRNA[NM_001349]
GYLTL1B 9.45E-04 3.143812 up 1.169517 up 3.19979 up Homo sapiens glycosyltransferase-like1B (GYLTL1B), mRNA [NM_152312]
CNNM2 1.94E-04 3.1423542 up 1.00608 down 1.785853 up Homo sapiens cyclin M2 (CNNM2),transcript variant 1, mRNA[NM_017649]
C20orf26 0.023210809 3.1168563 up 1.353857 up 1.414684 up Homo sapiens chromosome 20 openreading frame 26 (C20orf26), mRNA[NM_015585]
SLC26A9 0.042099766 3.0884879 up 2.137558 up 1.776504 up Homo sapiens solute carrier family26, member 9 (SLC26A9), transcriptvariant 1, mRNA [NM_052934]
SEC14L3 0.025527291 3.0402198 up 1.787294 up 1.547541 down Homo sapiens SEC14-like 3 (S.cerevisiae) (SEC14L3), mRNA[NM_174975]
TMEM20 0.001055841 2.9346027 down 1.821723 down 1.558415 down Homo sapiens transmembraneprotein 20 (TMEM20), mRNA[NM_153226]
UHRF1 0.042854026 2.9323897 down 1.272487 down 1.455897 down Homo sapiens ubiquitin-like,containing PHD and RING fingerdomains, 1 (UHRF1), transcript variant2, mRNA [NM_013282]
CST9L 0.008572864 2.9286344 up 1.46455 up 1.695363 down Homo sapiens cystatin 9-like (mouse)(CST9L), mRNA [NM_080610]
C2 0.005425731 2.906241 down 1.470166 down 1.228973 up Homo sapiens complementcomponent 2 (C2), mRNA[NM_000063]
C7orf62 0.03373279 2.8281868 up 1.466387 up 1.326441 down Homo sapiens hypothetical proteinMGC26647 (MGC26647), mRNA[NM_152706]
HOXB13 0.008404698 2.822795 up 1.530259 up 1.061908 down Homo sapiens homeobox B13(HOXB13), mRNA [NM_006361]
ANLN 0.026928915 2.8110342 down 1.205709 down 1.210447 down Homo sapiens anillin, actin bindingprotein (ANLN), mRNA [NM_018685]
TMEM45B 0.02836952 2.789488 up 1.108079 up 1.434473 up Homo sapiens transmembraneprotein 45B (TMEM45B), mRNA[NM_138788]
Emerald et al. BMC Genomics 2011, 12:509http://www.biomedcentral.com/1471-2164/12/509
Page 7 of 17
disease particularly, has been strongly with early lifeadversity [21,22]. Our data begin to shed light on thekey signaling pathways that are vulnerable to subtlechanges in the early life environment.The strength of our study, despite its small size, is that
we have focused on infants whose growth was notexperimentally manipulated but lay within normal birthweight range. Many experimental models have manipu-lated pregnancy in an effort to produce fetal growthrestriction. Such studies have shown that offspringwhich are born growth restricted catch-up in growthwith their normally nourished counterparts and inadulthood are obese, hypertensive, hyperinsulinemic,leptin resistant and display sedentary behavior [23-25].Investigations into underlying mechanisms and thedetermination of gene expression levels that may explainthese altered phenotypes have produced conflictingresults [26-28] which may reflect variations in themodel systems used and the gender of the animals used[28]. Taken together, although these studies have estab-lished the link between early life nutritional adversity to
later pathophysiology, there are limitations in the inter-pretation of rodent studies in development as applied tohumans.In the present study we aimed to study the molecular
associates of growth variation within the normativerange and exclude pathology. This is because the grow-ing literature on developmental outcomes highlightsthat the importance of variation in risk is associatedwith non-pathological developmental environments.Accordingly we studied relatively small infants bornbetween the 5th and 25th centile but excluded the smal-lest neonates, which may reflect obstetrical abnormal-ities. These infants were compared to infants in themiddle of the normative range (50th-75th centile) andaccordingly we excluded infants who may have hadmacrosomia as a result of the mother’s being over-nour-ished by being maintained in captivity. Thus we are con-fident that we have excluded pathological influences anddemonstrated that within the normative range patternsof gene expression may vary considerably with variablebirth weights. Indeed we found a number of genes with
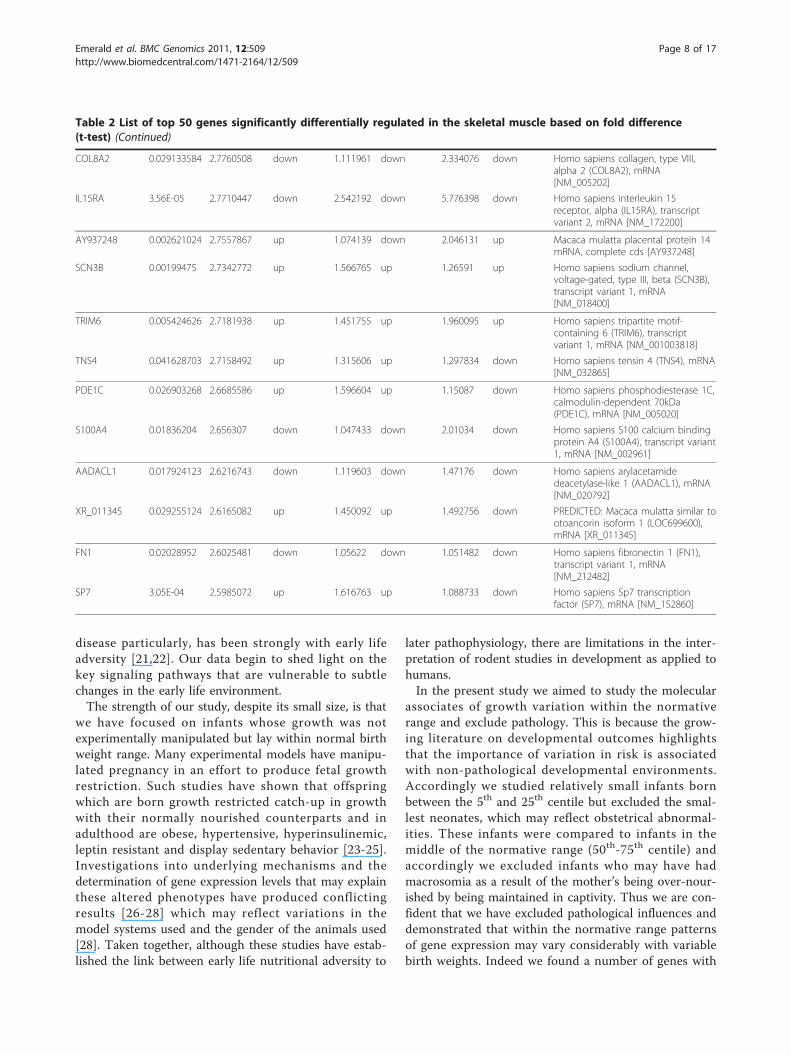
Table 2 List of top 50 genes significantly differentially regulated in the skeletal muscle based on fold difference(t-test) (Continued)
COL8A2 0.029133584 2.7760508 down 1.111961 down 2.334076 down Homo sapiens collagen, type VIII,alpha 2 (COL8A2), mRNA[NM_005202]
IL15RA 3.56E-05 2.7710447 down 2.542192 down 5.776398 down Homo sapiens interleukin 15receptor, alpha (IL15RA), transcriptvariant 2, mRNA [NM_172200]
AY937248 0.002621024 2.7557867 up 1.074139 down 2.046131 up Macaca mulatta placental protein 14mRNA, complete cds [AY937248]
SCN3B 0.00199475 2.7342772 up 1.566765 up 1.26591 up Homo sapiens sodium channel,voltage-gated, type III, beta (SCN3B),transcript variant 1, mRNA[NM_018400]
TRIM6 0.005424626 2.7181938 up 1.451755 up 1.960095 up Homo sapiens tripartite motif-containing 6 (TRIM6), transcriptvariant 1, mRNA [NM_001003818]
TNS4 0.041628703 2.7158492 up 1.315606 up 1.297834 down Homo sapiens tensin 4 (TNS4), mRNA[NM_032865]
PDE1C 0.026903268 2.6685586 up 1.596604 up 1.15087 down Homo sapiens phosphodiesterase 1C,calmodulin-dependent 70kDa(PDE1C), mRNA [NM_005020]
S100A4 0.01836204 2.656307 down 1.047433 down 2.01034 down Homo sapiens S100 calcium bindingprotein A4 (S100A4), transcript variant1, mRNA [NM_002961]
AADACL1 0.017924123 2.6216743 down 1.119603 down 1.47176 down Homo sapiens arylacetamidedeacetylase-like 1 (AADACL1), mRNA[NM_020792]
XR_011345 0.029255124 2.6165082 up 1.450092 up 1.492756 down PREDICTED: Macaca mulatta similar tootoancorin isoform 1 (LOC699600),mRNA [XR_011345]
FN1 0.02028952 2.6025481 down 1.05622 down 1.051482 down Homo sapiens fibronectin 1 (FN1),transcript variant 1, mRNA[NM_212482]
SP7 3.05E-04 2.5985072 up 1.616763 up 1.088733 down Homo sapiens Sp7 transcriptionfactor (SP7), mRNA [NM_152860]
Emerald et al. BMC Genomics 2011, 12:509http://www.biomedcentral.com/1471-2164/12/509
Page 8 of 17
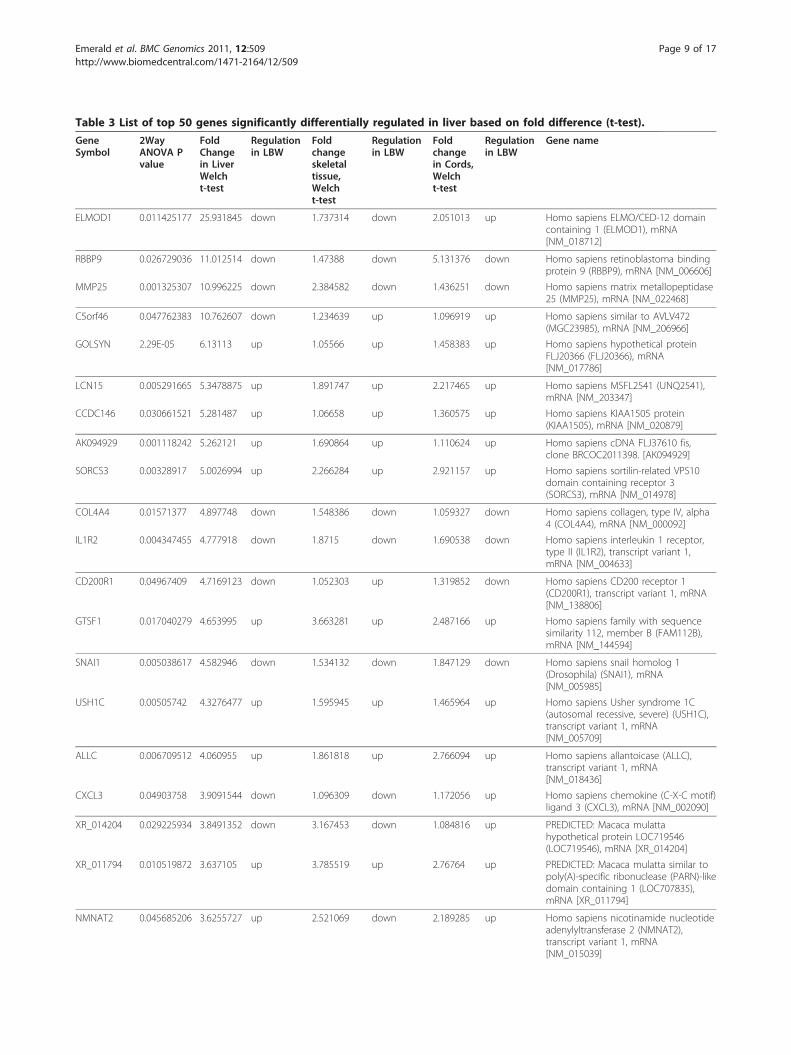
Table 3 List of top 50 genes significantly differentially regulated in liver based on fold difference (t-test).
GeneSymbol
2WayANOVA Pvalue
FoldChangein LiverWelcht-test
Regulationin LBW
Foldchangeskeletaltissue,Welcht-test
Regulationin LBW
Foldchangein Cords,Welcht-test
Regulationin LBW
Gene name
ELMOD1 0.011425177 25.931845 down 1.737314 down 2.051013 up Homo sapiens ELMO/CED-12 domaincontaining 1 (ELMOD1), mRNA[NM_018712]
RBBP9 0.026729036 11.012514 down 1.47388 down 5.131376 down Homo sapiens retinoblastoma bindingprotein 9 (RBBP9), mRNA [NM_006606]
MMP25 0.001325307 10.996225 down 2.384582 down 1.436251 down Homo sapiens matrix metallopeptidase25 (MMP25), mRNA [NM_022468]
C5orf46 0.047762383 10.762607 down 1.234639 up 1.096919 up Homo sapiens similar to AVLV472(MGC23985), mRNA [NM_206966]
GOLSYN 2.29E-05 6.13113 up 1.05566 up 1.458383 up Homo sapiens hypothetical proteinFLJ20366 (FLJ20366), mRNA[NM_017786]
LCN15 0.005291665 5.3478875 up 1.891747 up 2.217465 up Homo sapiens MSFL2541 (UNQ2541),mRNA [NM_203347]
CCDC146 0.030661521 5.281487 up 1.06658 up 1.360575 up Homo sapiens KIAA1505 protein(KIAA1505), mRNA [NM_020879]
AK094929 0.001118242 5.262121 up 1.690864 up 1.110624 up Homo sapiens cDNA FLJ37610 fis,clone BRCOC2011398. [AK094929]
SORCS3 0.00328917 5.0026994 up 2.266284 up 2.921157 up Homo sapiens sortilin-related VPS10domain containing receptor 3(SORCS3), mRNA [NM_014978]
COL4A4 0.01571377 4.897748 down 1.548386 down 1.059327 down Homo sapiens collagen, type IV, alpha4 (COL4A4), mRNA [NM_000092]
IL1R2 0.004347455 4.777918 down 1.8715 down 1.690538 down Homo sapiens interleukin 1 receptor,type II (IL1R2), transcript variant 1,mRNA [NM_004633]
CD200R1 0.04967409 4.7169123 down 1.052303 up 1.319852 down Homo sapiens CD200 receptor 1(CD200R1), transcript variant 1, mRNA[NM_138806]
GTSF1 0.017040279 4.653995 up 3.663281 up 2.487166 up Homo sapiens family with sequencesimilarity 112, member B (FAM112B),mRNA [NM_144594]
SNAI1 0.005038617 4.582946 down 1.534132 down 1.847129 down Homo sapiens snail homolog 1(Drosophila) (SNAI1), mRNA[NM_005985]
USH1C 0.00505742 4.3276477 up 1.595945 up 1.465964 up Homo sapiens Usher syndrome 1C(autosomal recessive, severe) (USH1C),transcript variant 1, mRNA[NM_005709]
ALLC 0.006709512 4.060955 up 1.861818 up 2.766094 up Homo sapiens allantoicase (ALLC),transcript variant 1, mRNA[NM_018436]
CXCL3 0.04903758 3.9091544 down 1.096309 down 1.172056 up Homo sapiens chemokine (C-X-C motif)ligand 3 (CXCL3), mRNA [NM_002090]
XR_014204 0.029225934 3.8491352 down 3.167453 down 1.084816 up PREDICTED: Macaca mulattahypothetical protein LOC719546(LOC719546), mRNA [XR_014204]
XR_011794 0.010519872 3.637105 up 3.785519 up 2.76764 up PREDICTED: Macaca mulatta similar topoly(A)-specific ribonuclease (PARN)-likedomain containing 1 (LOC707835),mRNA [XR_011794]
NMNAT2 0.045685206 3.6255727 up 2.521069 down 2.189285 up Homo sapiens nicotinamide nucleotideadenylyltransferase 2 (NMNAT2),transcript variant 1, mRNA[NM_015039]
Emerald et al. BMC Genomics 2011, 12:509http://www.biomedcentral.com/1471-2164/12/509
Page 9 of 17
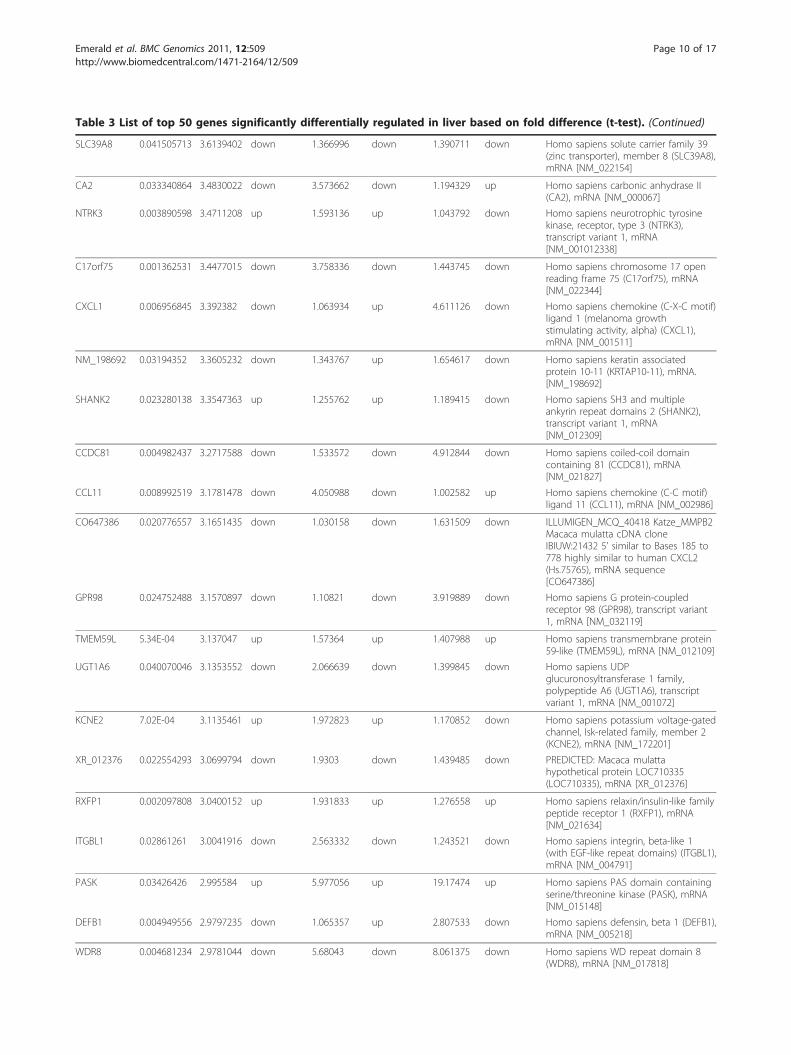
Table 3 List of top 50 genes significantly differentially regulated in liver based on fold difference (t-test). (Continued)
SLC39A8 0.041505713 3.6139402 down 1.366996 down 1.390711 down Homo sapiens solute carrier family 39(zinc transporter), member 8 (SLC39A8),mRNA [NM_022154]
CA2 0.033340864 3.4830022 down 3.573662 down 1.194329 up Homo sapiens carbonic anhydrase II(CA2), mRNA [NM_000067]
NTRK3 0.003890598 3.4711208 up 1.593136 up 1.043792 down Homo sapiens neurotrophic tyrosinekinase, receptor, type 3 (NTRK3),transcript variant 1, mRNA[NM_001012338]
C17orf75 0.001362531 3.4477015 down 3.758336 down 1.443745 down Homo sapiens chromosome 17 openreading frame 75 (C17orf75), mRNA[NM_022344]
CXCL1 0.006956845 3.392382 down 1.063934 up 4.611126 down Homo sapiens chemokine (C-X-C motif)ligand 1 (melanoma growthstimulating activity, alpha) (CXCL1),mRNA [NM_001511]
NM_198692 0.03194352 3.3605232 down 1.343767 up 1.654617 down Homo sapiens keratin associatedprotein 10-11 (KRTAP10-11), mRNA.[NM_198692]
SHANK2 0.023280138 3.3547363 up 1.255762 up 1.189415 down Homo sapiens SH3 and multipleankyrin repeat domains 2 (SHANK2),transcript variant 1, mRNA[NM_012309]
CCDC81 0.004982437 3.2717588 down 1.533572 down 4.912844 down Homo sapiens coiled-coil domaincontaining 81 (CCDC81), mRNA[NM_021827]
CCL11 0.008992519 3.1781478 down 4.050988 down 1.002582 up Homo sapiens chemokine (C-C motif)ligand 11 (CCL11), mRNA [NM_002986]
CO647386 0.020776557 3.1651435 down 1.030158 down 1.631509 down ILLUMIGEN_MCQ_40418 Katze_MMPB2Macaca mulatta cDNA cloneIBIUW:21432 5’ similar to Bases 185 to778 highly similar to human CXCL2(Hs.75765), mRNA sequence[CO647386]
GPR98 0.024752488 3.1570897 down 1.10821 down 3.919889 down Homo sapiens G protein-coupledreceptor 98 (GPR98), transcript variant1, mRNA [NM_032119]
TMEM59L 5.34E-04 3.137047 up 1.57364 up 1.407988 up Homo sapiens transmembrane protein59-like (TMEM59L), mRNA [NM_012109]
UGT1A6 0.040070046 3.1353552 down 2.066639 down 1.399845 down Homo sapiens UDPglucuronosyltransferase 1 family,polypeptide A6 (UGT1A6), transcriptvariant 1, mRNA [NM_001072]
KCNE2 7.02E-04 3.1135461 up 1.972823 up 1.170852 down Homo sapiens potassium voltage-gatedchannel, Isk-related family, member 2(KCNE2), mRNA [NM_172201]
XR_012376 0.022554293 3.0699794 down 1.9303 down 1.439485 down PREDICTED: Macaca mulattahypothetical protein LOC710335(LOC710335), mRNA [XR_012376]
RXFP1 0.002097808 3.0400152 up 1.931833 up 1.276558 up Homo sapiens relaxin/insulin-like familypeptide receptor 1 (RXFP1), mRNA[NM_021634]
ITGBL1 0.02861261 3.0041916 down 2.563332 down 1.243521 down Homo sapiens integrin, beta-like 1(with EGF-like repeat domains) (ITGBL1),mRNA [NM_004791]
PASK 0.03426426 2.995584 up 5.977056 up 19.17474 up Homo sapiens PAS domain containingserine/threonine kinase (PASK), mRNA[NM_015148]
DEFB1 0.004949556 2.9797235 down 1.065357 up 2.807533 down Homo sapiens defensin, beta 1 (DEFB1),mRNA [NM_005218]
WDR8 0.004681234 2.9781044 down 5.68043 down 8.061375 down Homo sapiens WD repeat domain 8(WDR8), mRNA [NM_017818]
Emerald et al. BMC Genomics 2011, 12:509http://www.biomedcentral.com/1471-2164/12/509
Page 10 of 17
more than a 10 fold shift in expression levels. There areimportant implications to this observation. Historically,experimental and epidemiological focus has been on theextremes of birth weight (either small for gestational ageor large for gestational age) and there has been littlefocus within the normal birth weight range continuum.What is evident from the present study is that relativelysmall changes in the birth phenotype may be associatedwith profound changes in molecular physiology. In turnthis also suggests the presence of highly evolved pro-cesses by which the fetus can adjust its development inresponse to subtle cues from mother [29].The Cynomolgus, as in the human, has monotocous
pregnancies with haemochorial placentae; they haveomnivorous diets and monogastric digestion. They alsoshare with humans the same progressive history of themetabolic syndrome [17]. We have identified alterationsin the levels and expression patterns of a number ofgenes involved in different metabolic processes includingcellular lipid metabolism, cellular biosynthesis, cellularmacromolecule synthesis, cellular nitrogen metabolism,
cellular carbohydrate metabolism, cellular catabolism,nucleotide and nucleic acid metabolism, biological adhe-sion and development.Recently, transcriptional profilingin rats subjected to gestational under nutrition was per-formed in young adult male rats where 249 genes wereshown to be differentially expressed in the liver [28].We compared the genes which are significantly alteredin our array with those identified in the rat array studyand have identified twelve similar or closely relatedgenes from those identified in the rat: Tribbles homolog2 (Trib2); 3-hydroxyanthanillate dioxygenase (Haao),transmembrane serine protease 6 (Tmmprss6); Thiore-doxin domain containing10 (Txndc10); tralation initia-tion factor 4A3 (Eifa3); Ribosomal protein L31 (Rpl31);Danse 1-like 2 (Dnase1l2); Quinolate phosphoribosyltransferase (Qprt); general transcription factor IIa 2(Gtf2a3); General transcription factor II H 3 [28]. Onlyfour of these genes (Trib2, Trip10, EIF4A3 and Dna-se1l2) were altered in the same direction in the livers ofLBW macaques as in the rat array. We have also com-pared our observations with those identified from LBW
Table 3 List of top 50 genes significantly differentially regulated in liver based on fold difference (t-test). (Continued)
RIMS4 0.04112827 2.9677074 up 1.724443 up 1.024011 down Homo sapiens regulating synapticmembrane exocytosis 4 (RIMS4), mRNA[NM_182970]
PDGFRL 0.011396675 2.9371088 down 1.21306 down 1.55284 down Homo sapiens platelet-derived growthfactor receptor-like (PDGFRL), mRNA[NM_006207]
TNRC4 0.005930619 2.9251838 up 1.208589 up 1.396738 up Homo sapiens trinucleotide repeatcontaining 4 (TNRC4), mRNA[NM_007185]
UGT2B11 0.02518766 2.9193914 down 1.09908 down 2.958316 down Homo sapiens UDPglucuronosyltransferase 2 family,polypeptide B11 (UGT2B11), mRNA[NM_001073]
FLT3LG 0.029793594 2.8908129 up 1.037797 down 1.527226 up Homo sapiens fms-related tyrosinekinase 3 ligand (FLT3LG), mRNA[NM_001459]
IP6K3 0.03900314 2.8685477 up 1.471319 up 1.39455 down Homo sapiens inositol hexaphosphatekinase 3 (IHPK3), mRNA [NM_054111]
ST6GALNAC1 0.03669531 2.8622296 down 1.408642 down 2.126189 down Homo sapiens ST6 (alpha-N-acetyl-neuraminyl-2,3-beta-galactosyl-1,3)-N-acetylgalactosaminide alpha-2,6-sialyltransferase 1 (ST6GALNAC1), mRNA[NM_018414]
EFNA4 0.007086268 2.843187 down 1.084758 up 2.766163 down Homo sapiens ephrin-A4 (EFNA4),transcript variant 1, mRNA[NM_005227]
MYST3 0.013409907 2.827006 up 3.302978 up 1.403819 up Homo sapiens MYST histoneacetyltransferase (monocytic leukemia)3 (MYST3), mRNA [NM_006766]
XM_370715 0.001614059 2.7565975 up 1.561267 up 2.382949 up PREDICTED: Homo sapiens similar tohypothetical protein MGC48915(LOC387911), mRNA [XM_370715]
NM_031436 0.035783853 2.6903787 up 1.740635 up 1.698687 up Homo sapiens aldo-keto reductasefamily 1, member C-like 2 (AKR1CL2),mRNA. [NM_031436]
Emerald et al. BMC Genomics 2011, 12:509http://www.biomedcentral.com/1471-2164/12/509
Page 11 of 17
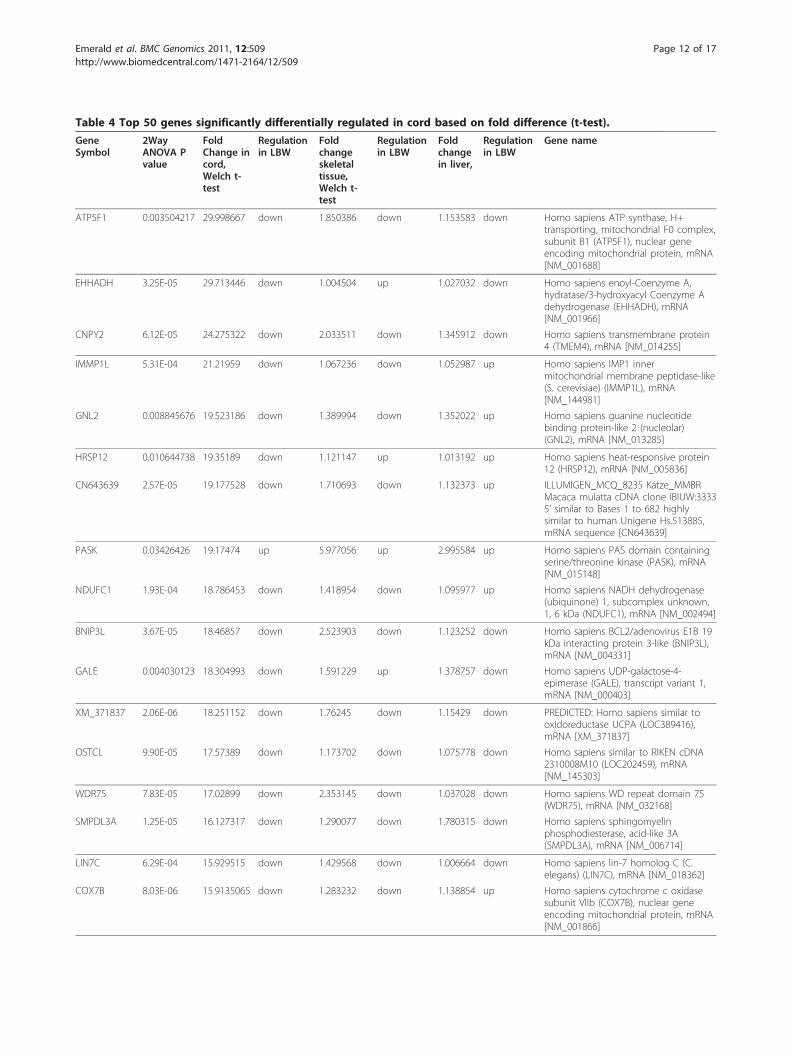
Table 4 Top 50 genes significantly differentially regulated in cord based on fold difference (t-test).
GeneSymbol
2WayANOVA Pvalue
FoldChange incord,Welch t-test
Regulationin LBW
Foldchangeskeletaltissue,Welch t-test
Regulationin LBW
Foldchangein liver,
Regulationin LBW
Gene name
ATP5F1 0.003504217 29.998667 down 1.850386 down 1.153583 down Homo sapiens ATP synthase, H+transporting, mitochondrial F0 complex,subunit B1 (ATP5F1), nuclear geneencoding mitochondrial protein, mRNA[NM_001688]
EHHADH 3.25E-05 29.713446 down 1.004504 up 1.027032 down Homo sapiens enoyl-Coenzyme A,hydratase/3-hydroxyacyl Coenzyme Adehydrogenase (EHHADH), mRNA[NM_001966]
CNPY2 6.12E-05 24.275322 down 2.033511 down 1.345912 down Homo sapiens transmembrane protein4 (TMEM4), mRNA [NM_014255]
IMMP1L 5.31E-04 21.21959 down 1.067236 down 1.052987 up Homo sapiens IMP1 innermitochondrial membrane peptidase-like(S. cerevisiae) (IMMP1L), mRNA[NM_144981]
GNL2 0.008845676 19.523186 down 1.389994 down 1.352022 up Homo sapiens guanine nucleotidebinding protein-like 2 (nucleolar)(GNL2), mRNA [NM_013285]
HRSP12 0.010644738 19.35189 down 1.121147 up 1.013192 up Homo sapiens heat-responsive protein12 (HRSP12), mRNA [NM_005836]
CN643639 2.57E-05 19.177528 down 1.710693 down 1.132373 up ILLUMIGEN_MCQ_8235 Katze_MMBRMacaca mulatta cDNA clone IBIUW:33335’ similar to Bases 1 to 682 highlysimilar to human Unigene Hs.513885,mRNA sequence [CN643639]
PASK 0.03426426 19.17474 up 5.977056 up 2.995584 up Homo sapiens PAS domain containingserine/threonine kinase (PASK), mRNA[NM_015148]
NDUFC1 1.93E-04 18.786453 down 1.418954 down 1.095977 up Homo sapiens NADH dehydrogenase(ubiquinone) 1, subcomplex unknown,1, 6 kDa (NDUFC1), mRNA [NM_002494]
BNIP3L 3.67E-05 18.46857 down 2.523903 down 1.123252 down Homo sapiens BCL2/adenovirus E1B 19kDa interacting protein 3-like (BNIP3L),mRNA [NM_004331]
GALE 0.004030123 18.304993 down 1.591229 up 1.378757 down Homo sapiens UDP-galactose-4-epimerase (GALE), transcript variant 1,mRNA [NM_000403]
XM_371837 2.06E-06 18.251152 down 1.76245 down 1.15429 down PREDICTED: Homo sapiens similar tooxidoreductase UCPA (LOC389416),mRNA [XM_371837]
OSTCL 9.90E-05 17.57389 down 1.173702 down 1.075778 down Homo sapiens similar to RIKEN cDNA2310008M10 (LOC202459), mRNA[NM_145303]
WDR75 7.83E-05 17.02899 down 2.353145 down 1.037028 down Homo sapiens WD repeat domain 75(WDR75), mRNA [NM_032168]
SMPDL3A 1.25E-05 16.127317 down 1.290077 down 1.780315 down Homo sapiens sphingomyelinphosphodiesterase, acid-like 3A(SMPDL3A), mRNA [NM_006714]
LIN7C 6.29E-04 15.929515 down 1.429568 down 1.006664 down Homo sapiens lin-7 homolog C (C.elegans) (LIN7C), mRNA [NM_018362]
COX7B 8.03E-06 15.9135065 down 1.283232 down 1.138854 up Homo sapiens cytochrome c oxidasesubunit VIIb (COX7B), nuclear geneencoding mitochondrial protein, mRNA[NM_001866]
Emerald et al. BMC Genomics 2011, 12:509http://www.biomedcentral.com/1471-2164/12/509
Page 12 of 17
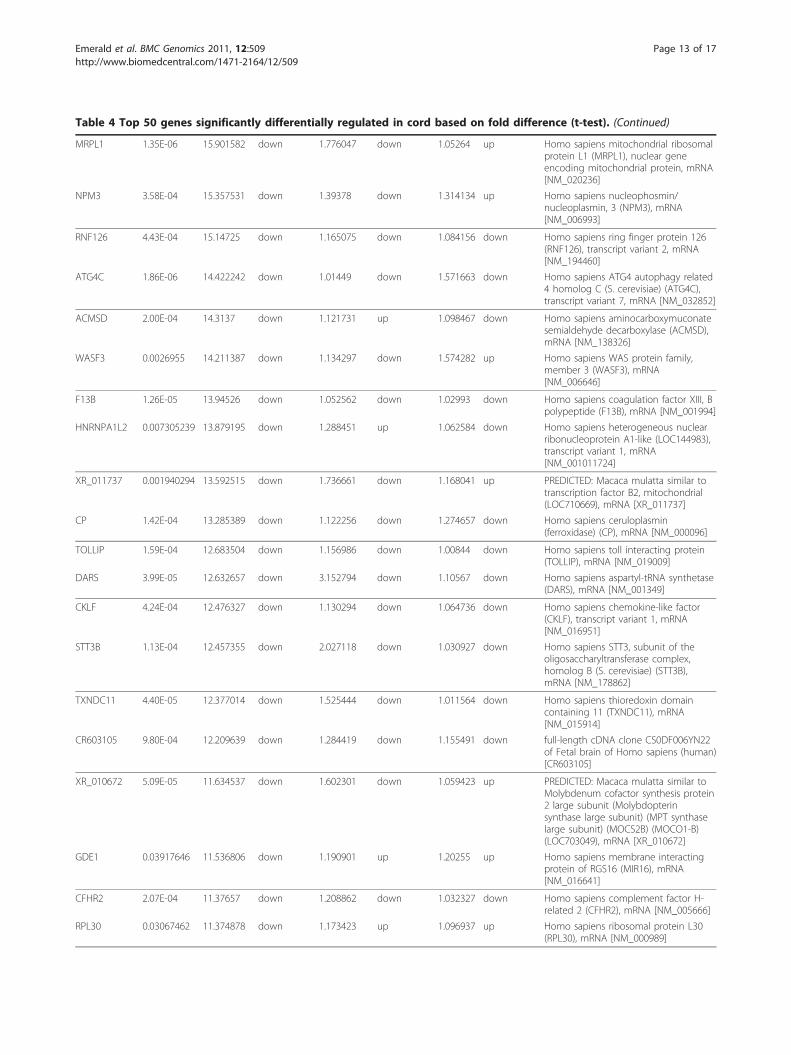
Table 4 Top 50 genes significantly differentially regulated in cord based on fold difference (t-test). (Continued)
MRPL1 1.35E-06 15.901582 down 1.776047 down 1.05264 up Homo sapiens mitochondrial ribosomalprotein L1 (MRPL1), nuclear geneencoding mitochondrial protein, mRNA[NM_020236]
NPM3 3.58E-04 15.357531 down 1.39378 down 1.314134 up Homo sapiens nucleophosmin/nucleoplasmin, 3 (NPM3), mRNA[NM_006993]
RNF126 4.43E-04 15.14725 down 1.165075 down 1.084156 down Homo sapiens ring finger protein 126(RNF126), transcript variant 2, mRNA[NM_194460]
ATG4C 1.86E-06 14.422242 down 1.01449 down 1.571663 down Homo sapiens ATG4 autophagy related4 homolog C (S. cerevisiae) (ATG4C),transcript variant 7, mRNA [NM_032852]
ACMSD 2.00E-04 14.3137 down 1.121731 up 1.098467 down Homo sapiens aminocarboxymuconatesemialdehyde decarboxylase (ACMSD),mRNA [NM_138326]
WASF3 0.0026955 14.211387 down 1.134297 down 1.574282 up Homo sapiens WAS protein family,member 3 (WASF3), mRNA[NM_006646]
F13B 1.26E-05 13.94526 down 1.052562 down 1.02993 down Homo sapiens coagulation factor XIII, Bpolypeptide (F13B), mRNA [NM_001994]
HNRNPA1L2 0.007305239 13.879195 down 1.288451 up 1.062584 down Homo sapiens heterogeneous nuclearribonucleoprotein A1-like (LOC144983),transcript variant 1, mRNA[NM_001011724]
XR_011737 0.001940294 13.592515 down 1.736661 down 1.168041 up PREDICTED: Macaca mulatta similar totranscription factor B2, mitochondrial(LOC710669), mRNA [XR_011737]
CP 1.42E-04 13.285389 down 1.122256 down 1.274657 down Homo sapiens ceruloplasmin(ferroxidase) (CP), mRNA [NM_000096]
TOLLIP 1.59E-04 12.683504 down 1.156986 down 1.00844 down Homo sapiens toll interacting protein(TOLLIP), mRNA [NM_019009]
DARS 3.99E-05 12.632657 down 3.152794 down 1.10567 down Homo sapiens aspartyl-tRNA synthetase(DARS), mRNA [NM_001349]
CKLF 4.24E-04 12.476327 down 1.130294 down 1.064736 down Homo sapiens chemokine-like factor(CKLF), transcript variant 1, mRNA[NM_016951]
STT3B 1.13E-04 12.457355 down 2.027118 down 1.030927 down Homo sapiens STT3, subunit of theoligosaccharyltransferase complex,homolog B (S. cerevisiae) (STT3B),mRNA [NM_178862]
TXNDC11 4.40E-05 12.377014 down 1.525444 down 1.011564 down Homo sapiens thioredoxin domaincontaining 11 (TXNDC11), mRNA[NM_015914]
CR603105 9.80E-04 12.209639 down 1.284419 down 1.155491 down full-length cDNA clone CS0DF006YN22of Fetal brain of Homo sapiens (human)[CR603105]
XR_010672 5.09E-05 11.634537 down 1.602301 down 1.059423 up PREDICTED: Macaca mulatta similar toMolybdenum cofactor synthesis protein2 large subunit (Molybdopterinsynthase large subunit) (MPT synthaselarge subunit) (MOCS2B) (MOCO1-B)(LOC703049), mRNA [XR_010672]
GDE1 0.03917646 11.536806 down 1.190901 up 1.20255 up Homo sapiens membrane interactingprotein of RGS16 (MIR16), mRNA[NM_016641]
CFHR2 2.07E-04 11.37657 down 1.208862 down 1.032327 down Homo sapiens complement factor H-related 2 (CFHR2), mRNA [NM_005666]
RPL30 0.03067462 11.374878 down 1.173423 up 1.096937 up Homo sapiens ribosomal protein L30(RPL30), mRNA [NM_000989]
Emerald et al. BMC Genomics 2011, 12:509http://www.biomedcentral.com/1471-2164/12/509
Page 13 of 17
term placentas by McCarthy and colleagues [30] andfound similarities in expression changes in the genesProcollagen-lysine, 2-oxoglutarate 5-dioygense(PLOD2); Soluble interleukin-1 receptor accessory pro-tein (IL1RAP); Solute carrier family 2 (facilitated glu-cose transporter) member3 (SLC2A3); Myosin V1(MYH6); Ribosomal protein S6(RPS6) and Latexin(LXN). The Tribbles homolog 2 (Trib2) is alsoincreased in the LBW infants and suggests anotherpossible way in way insulin/IGF-1 signalling might beimpaired during development. Tribbles belongs to afamily of kinase-like proteins and are reported to benegative regulators of Akt, the principle target of insu-lin signaling [31,32].
Studies using animal models such as rodents to under-stand the developmental origins of metabolic diseaseshave shown that epigenetic changes in genes correlateswith expression changes including metabolic enzymessuch as PEPCK, transcriptional factors such as PPARawhich regulate fat metabolism and factors associatedwith insulin action (e.g. PI3 kinase, PKC-ζ), the key reg-ulatory genes which are responsible for bringing thesechanges are not known [15,33]. One aim in our studywas to identify whether there were shifts within theexpression of key early regulators and from the array wehave identified one such key regulatory gene the PASKinase (PASK), an evolutionarily conserved PAS domaincontaining serine/threonine kinase whose expression is
Table 4 Top 50 genes significantly differentially regulated in cord based on fold difference (t-test). (Continued)
XM_495885 0.002429009 11.322625 down 1.165255 down 1.156577 down PREDICTED: Homo sapiens similar toribosomal protein S12 (LOC440055),mRNA [XM_495885]
NDUFB1 2.13E-04 11.293429 down 1.404433 down 1.277028 up Homo sapiens NADH dehydrogenase(ubiquinone) 1 beta subcomplex, 1, 7kDa (NDUFB1), mRNA [NM_004545]
NM_032807 2.89E-04 11.240869 down 1.075345 down 1.014724 down Homo sapiens F-box protein, helicase,18 (FBXO18), transcript variant 1, mRNA.[NM_032807]
CSGALNACT2
1.34E-05 11.216295 down 1.714551 down 1.080183 down Homo sapiens chondroitin sulfateGalNAcT-2 (GALNACT-2), mRNA[NM_018590]
NM_022333 0.002598488 10.94874 down 1.130622 up 1.014866 down Homo sapiens TIA1 cytotoxic granule-associated RNA binding protein-like 1(TIAL1), ranscript variant 2, mRNA[NM_022333]
NM_032807 0.001172931 10.342792 down 1.522541 down 1.139832 down Homo sapiens F-box protein, helicase,18 (FBXO18), transcript variant 1, mRNA.[NM_032807]
AAMP 2.62E-05 10.171815 down 1.560637 down 1.085371 down Homo sapiens angio-associated,migratory cell protein (AAMP), mRNA[NM_001087]
ESF1 1.02E-07 9.745275 down 1.620818 down 1.008674 down Homo sapiens ESF1, nucleolar pre-rRNAprocessing protein, homolog (S.cerevisiae) (ESF1), mRNA [NM_016649]
DOCK7 0.01799708 9.74066 down 1.174452 up 1.171709 up Homo sapiens dedicator of cytokinesis7 (DOCK7), mRNA [NM_033407]
DDX3Y 4.78E-06 9.687978 down 1.356089 down 1.134329 down Homo sapiens DEAD (Asp-Glu-Ala-Asp)box polypeptide 3, Y-linked (DDX3Y),mRNA [NM_004660]
XIAP 3.65E-05 9.587557 down 1.882389 down 1.280735 up Homo sapiens baculoviral IAP repeat-containing 4 (BIRC4), mRNA[NM_001167]
TRPC4AP 9.51E-05 9.4549885 down 1.340843 down 1.07043 up Homo sapiens transient receptorpotential cation channel, subfamily C,member 4 associated protein(TRPC4AP), transcript variant 1, mRNA[NM_015638]
ADK 1.63E-04 9.386349 down 5.639505 down 1.368648 down Homo sapiens adenosine kinase (ADK),transcript variant ADK-short, mRNA[NM_001123]
NM_001002292
3.92E-04 9.258961 down 1.016391 up 1.220083 down Homo sapiens chromosome 1 openreading frame 139 (C1orf139), transcriptvariant 2, mRNA. [NM_001002292]
Emerald et al. BMC Genomics 2011, 12:509http://www.biomedcentral.com/1471-2164/12/509
Page 14 of 17
altered as a result of adverse early developmental condi-tions. PAS domains are evolutionarily conserved andappear from archaea, bacteria to eukaryotes and are pre-sent in many signaling proteins where they act as signalsensor domain [34]. The PASK gene, whereby expres-sion was up regulated in the LBW animals, has beenshown to be a metabolic sensor based on mice knock-out studies; mice lacking PASK are resistant to high-fat
induced obesity, hepatic steatosis and are resistant toinsulin [35].
ConclusionsIn summary, this paper has identified significant varia-tion in gene expression in multiple tissues in primatenewborns of different growth trajectories but within thenormative range of birth size. Further detailed analyses
Table 5 Gene ontology classification to group genes using Genespring ver10 (Agilent Tech, Santa Clara) of similarfunctional families.
Skeletal muscle Liver Cord
Upregulated
Downregulated
Upregulated
Downregulated
Upregulated
Downregulated
Cellular lipid metabolic process 15 6 4 4 13 11
Cellular biosynthesis process 8 14 6 4 16 40
Cellular macromolecule synthesis 21 32 19 14 45 63
Cellular nitrogen metabolic process 4 1 4 0 7 1
Cellular carbohydrate metabolic process 2 0 0 0 2 1
Cellular catabolic process 1 2 0 0 2 1
Nucleobase, Nucleoside, nucleotide and nucleic acidmetabolic process
19 17 15 4 66 43
Other cellular metabolic process 3 2 1 3 3 15
Other metabolic process 5 7 5 2 9 11
Transport 30 17 21 14 39 26
Regulation of molecular functions 4 2 1 1 12 8
Biological adhesion 6 8 4 5 8 10
Developmental process 19 11 7 4 20 16
Other biological process 38 38 25 19 65 59
Table 6 Verification of seven genes from the microarray using Real-time RT-PCR analysis in skeletal muscle.
Gene Symbol and description 2 way ANOVA p-value(Birth weight)
Microarray Foldchange (t-Test)
Regulation inLBW
qPCR-FoldChange
XM_116936 0.017913306 10.054285 Up regulated
PREDICTED: Homo sapiens similar to RIKEN cDNA4832428D23 gene
4.780893
PASK: 0.03426426 5.977056 Up regulated
Homo sapiens PAS domain containing serine/threoninekinase
14.55481
ADK: 1.63E-04 -5.639505 Down regulated
Homo sapiens adenosine kinase, (transcript variant ADK-short)
-3.57235
ELMOD1:
Homo sapiens ELMO/CED-12 domain containing 1. 0.011425177 -1.7373136 Down regulated -1.71015
SIX1:
Homo sapiens sine oculis homeobox homolog 1(Drosophila).
0.045728132 1.1253903 Up in low birthweight
1.246574
RBL1:
Homo sapiens retinoblastoma-like 1 (p107), (transcriptvariant 1)
0.011705314 1.5320477 Up regulated 3.023726
SLC12A9:
Homo sapiens solute carrier family 12 (potassium/chloridetransporters), member 9.
1.31E-05 1.3670695 Up regulated 1.694303
Emerald et al. BMC Genomics 2011, 12:509http://www.biomedcentral.com/1471-2164/12/509
Page 15 of 17
may improve our understanding of how alterations insuch genes due to adverse early life environment predis-poses towards metabolic syndrome. These data givestrength to the hypothesis that developmental plasticityoperating within the normative range of birth weightscan influence metabolic and other physiological systemsin a way that might have later health consequences. Itemphasizes that the concept of developmental program-ming need not involve pathological changes in growthtrajectories to have molecular and presumably functionalconsequences.
Additional material
Additional file 1: Genes which were differentially regulatedbetween the ABW and LBW groups classified based on GO terms.Genes with a ≥ 1.5 fold change at least in one tissue with a p value of ≥0.5 identified from the array with the GO terms
AcknowledgementsBSE, RK, PDG, KC, SM are supported by Agency for Science, Technology andresearch (Singapore). PDG, DMS, MHV are funded by the National ResearchCentre for Growth and Development, University of Auckland (New Zealand).
Author details1Growth, Development and Metabolism Programme, Singapore Institute forClinical Sciences, Brenner Centre for Molecular Medicine, 30 Medical Drive,Singapore. 2Liggins Institute and the National Research Centre for Growthand Development, The University of Auckland, Private Bag 92019, Auckland1142, New Zealand. 3Division of Molecular Genetics & Cell Biology, School ofBiological Sciences, Nanyang Technological University, Singapore, Singapore.4Department of Anatomy, Faculty of medicine and Health Sciences, UAEUniversity, Tawam Medical Campus, PO BOX 17666, Al ain, UAE.
Authors’ contributionsBSE, RK and PDG conceived the study. KC, DMS and MHV coordinated andcollected the animal samples. BSE and SM undertook the molecular biology.BSE and PDG wrote the manuscript. BSE, KC, DMS, SM, MHV, RK and PDGreviewed/edited manuscript. All authors read and approved the finalmanuscript.
Competing interestsThe authors declare that they have no competing interests.
Received: 22 February 2011 Accepted: 16 October 2011Published: 16 October 2011
References1. Barker DJ, Winter PD, Osmond C, Margetts B, Simmonds SJ: Weight in
infancy and death from ischaemic heart disease. Lancet 1989,2(8663):577-80.
2. Barker DJP: The fetal and infant origins of adult disease, London. BritishMedical Journal Publishing 1993, 1-343.
3. Barker DJ, Gluckman PD, Godfrey KM, Harding JE, Owens JA, Robinson JS:Fetal nutrition and cardiovascular disease in adult life. Lancet 1993,341(8850):938-41.
4. Phillips P, Wilson D, Taylor A, Esterman A, Wakefield M: Cardiovascular riskfactors in South Australians with diabetes. Aust J Public Health 1994,18(4):445-9.
5. Curhan GC, Chertow GM, Willett WC, Spiegelman D, Colditz GA, Manson JE,Speizer FE, Stampfer MJ: Birth weight and adult hypertension and obesityin women. Circulation 1996, 94(6):1310-5.
6. Curhan GC, Willett WC, Rimm EB, Spiegelman D, Ascherio AL, Stampfer MJ:Birth weight and adult hypertension, diabetes mellitus, and obesity inUS men. Circulation 1996, 94(12):3246-50.
7. Burdge GC, Lillycrop KA: Nutrition, epigenetics, and developmentalplasticity: implications for understanding human disease. Annu Rev Nutr2010, 30:315-39.
8. Gluckman PD, Hanson MA, Bateson P, Beedle AS, Law CM, Bhutta ZA,Anokhin KV, Bougnères P, Chandak GR, Dasgupta P, Smith GD, Ellison PT,Forrester TE, Gilbert SF, Jablonka E, Kaplan H, Prentice AM, Simpson SJ,Uauy R, West-Eberhard MJ: Towards a new developmental synthesis:adaptive developmental plasticity and human disease. Lancet 2009,373(9675):1654-7.
9. Gluckman PD, Hanson MA: Living with the past: evolution, development,and patterns of disease. Science 2004, 305(5691):1733-6.
10. Gluckman PD, Hanson MA, Beedle AS: Early life events and theirconsequences for later disease: a life history and evolutionaryperspective. Am J Hum Biol 2007, 19(1):1-19.
11. Hales CN, Barker DJ: The thrifty phenotype hypothesis. Br Med Bull 2001,60:5-20.
12. Gluckman PD, Hanson MA, Cooper C, Thornburg KL: Effect of in utero andearly-life conditions on adult health and disease. N Engl J Med 2008,359(1):61-73.
13. Burdge GC, Hanson MA, Slater-Jefferies JL, Lillycrop KA: Epigeneticregulation of transcription: a mechanism for inducing variations inphenotype (fetal programming) by differences in nutrition during earlylife? Br J Nutr 2007, 97(6):1036-46.
14. Lillycrop KA, Slater-Jefferies JL, Hanson MA, Godfrey KM, Jackson AA,Burdge GC: Induction of altered epigenetic regulation of the hepaticglucocorticoid receptor in the offspring of rats fed a protein-restricteddiet during pregnancy suggests that reduced DNA methyltransferase-1expression is involved in impaired DNA methylation and changes inhistone modifications. Br J Nutr 2007, 97:1064-73.
15. Vickers MH, Gluckman PD, Coveny AH, Hofman PL, Cutfield WS, Gertler A,Breier BH, Harris M: Neonatal leptin treatment reverses developmentalprogramming. Endocrinology 2005, 146(10):4211-6.
16. Vickers MH, Gluckman PD, Coveny AH, Hofman PL, Cutfield WS, Gertler A,Breier BH, Harris M: The effect of neonatal leptin treatment on postnatalweight gain in male rats is dependent on maternal nutritional statusduring pregnancy. Endocrinology 2008, 149(4):1906-13.
17. Wagner JE, Kavanagh K, Ward GM, Auerbach BJ, Harwood HJ Jr, Kaplan JR:Old world nonhuman primate models of type 2 diabetes mellitus. ILAR J2006, 47(3):259-71.
18. Tarantal AF, HendrickX AG: Charecterization of prenatal growth anddevelopment in the Crab-eating macaque (Macaca fasicularis) byultrasound. The Anatomical record 1988, 222:177-184.
19. Rozen S, Skaletsky H: Primer3 on the WWW for general users and forbiologist programmers. Methods mol Biol 2000, 132:365-386.
20. Schmittgen TD, Livak KJ: Analyzing real-time PCR data by thecomparative C(T) method. Nat Protoc 2008, 3(6):1101-8.
21. Gluckman PD, Hanson MA: Maternal constraint of fetal growth and itsconsequences. Semin Fetal Neonatal Med 2004, 9(5):419-25.
22. Godfrey KM, Gluckman PD, Hanson MA: Developmental origins ofmetabolic disease: life course and intergenerational perspectives. TrendsEndocrinol Metab 2010, 21(4):199-205.
23. Vickers MH, Breier BH, Cutfield WS, Hofman PL, Gluckman PD: Fetal originsof hyperphagia, obesity, and hypertension and postnatal amplificationby hypercaloric nutrition. Am J Physiol Endocrinol Metab 2000, 279(1):E83-7.
24. Vickers MH, Reddy S, Ikenasio BA, Breier BH: Dysregulation of theadipoinsular axis-a mechanism for the pathogenesis of hyperleptinemiaand adipogenic diabetes induced by fetal programming. J Endocrinol2001, 170(2):323-32.
25. Vickers MH, Breier BH, McCarthy D, Gluckman PD: Sedentary behaviorduring postnatal life is determined by the prenatal environment andexacerbated by postnatal hypercaloric nutrition. Am J Physiol Regul IntegrComp Physiol 2003, 285(1):R271-3.
26. Lillycrop KA, Phillips ES, Jackson AA, Hanson MA, Burdge GC: Dietaryprotein restriction of pregnant rats induces and folic acidsupplementation prevents epigenetic modification of hepatic geneexpression in the offspring. J Nutr 2005, 135(6):1382-6.
27. Lillycrop KA, Rodford J, Garratt ES, Slater-Jefferies JL, Godfrey KM,Gluckman PD, Hanson MA, Burdge GC: Maternal protein restriction with
Emerald et al. BMC Genomics 2011, 12:509http://www.biomedcentral.com/1471-2164/12/509
Page 16 of 17
or without folic acid supplementation during pregnancy alters thehepatic transcriptome in adult male rats. Br J Nutr 2010, 103(12):1711-9.
28. Morris TJ, Vickers M, Gluckman P, Gilmour S, Affara N: Transcriptionalprofiling of rats subjected to gestational undernourishment: implicationsfor the developmental variations in metabolic traits. PLoS One 2009, 4(9):e7271.
29. Gluckman PD, Hanson MA, Morton SM, Pinal CS: Life-long echoes–a criticalanalysis of the developmental origins of adult disease model. BiolNeonate 2005, 87(2):127-39.
30. McCarthy C, Cotter FE, McElwaine S, Twomey A, Mooney EE, Ryan F,Vaughan J: Altered gene expression patterns in intrauterine growthrestriction: potential role of hypoxia. Am J Obstet Gynecol 2007, 196(1):70.e1-6.
31. Du K, Herzig S, Kulkarni RN, Montminy M: TRB3: a tribbles homolog thatinhibits Akt/PKB activation by insulin in liver. Science 2003,300(5625):1574-7.
32. Hegedus Z, Czibula A, Kiss-Toth E: Tribbles: a family of kinase-like proteinswith potent signalling regulatory function. Cell Signal 2007, 19(2):238-50.
33. Godfrey KM, Lillycrop KA, Burdge GC, Gluckman PD, Hanson MA: Epigeneticmechanisms and the mismatch concept of the developmental origins ofhealth and disease. Pediatr Res 2007, 61:5R-10R.
34. Rutter J, Michnoff CH, Harper SM, Gardner KH, McKnight SL: PAS kinase: anevolutionarily conserved PAS domain-regulated serine/threonine kinase.Proc Natl Acad Sci USA 2001, 98(16):8991-6.
35. Hao HX, Cardon CM, Swiatek W, Cooksey RC, Smith TL, Wilde J, Boudina S,Abel ED, McClain DA, Rutter J: PAS kinase is required for normal cellularenergy balance. Proc Natl Acad Sci USA 2007, 104(39):15466-71.
doi:10.1186/1471-2164-12-509Cite this article as: Emerald et al.: Gene expression profiling in theCynomolgus macaque Macaca fascicularis shows variation within thenormal birth range. BMC Genomics 2011 12:509.
Submit your next manuscript to BioMed Centraland take full advantage of:
• Convenient online submission
• Thorough peer review
• No space constraints or color figure charges
• Immediate publication on acceptance
• Inclusion in PubMed, CAS, Scopus and Google Scholar
• Research which is freely available for redistribution
Submit your manuscript at www.biomedcentral.com/submit
Emerald et al. BMC Genomics 2011, 12:509http://www.biomedcentral.com/1471-2164/12/509
Page 17 of 17


