Embed Size (px)
Citation preview
AMER. ZOOL., 26:51-69 (1986)
Generalist Herbivore Foraging and Its Role inCompetitive Interactions1
GARY E. BELOVSKY
School of Natural Resources, The University of Michigan,Ann Arbor, Michigan 48109-1115
SYNOPSIS. Whether herbivores are food limited and compete interspecifically for foodhas been debated by population/community ecologists. To examine this proposition, amechanistic approach based upon autecological observations is employed:
1) 45 foraging studies of 20 species of generalist herbivores indicate that the herbivoresbehave as energy maximizers in their diet selection, as determined by a linear programmingmodel.
2) The constraints that determine the forager's energy maximizing diet can be usedto determine whether a food item should be consumed, based upon a minimum digestibilitythat determines energy value and a minimum item size or abundance that determinescropping rate.
3) Population densities of a number of herbivore species depend upon the biomass ofplants in the environment that satisfy the minimum characteristics sought by the herbivore.
4) Using experimental populations for several herbivore species that are known to befood limited, it can be demonstrated that these species compete with each other. Thecompetitive isoclines are non-linear and arise from the fractions of each forager's foodresources that it shares and exclusively uses, which depend upon each species' minimumfood characteristics.
The results indicate that a mechanistic approach can provide considerable insights intoherbivore community structure. The foraging constraints underlying the entire analysismay be body size dependent, providing a more general view.
INTRODUCTION
Community ecologists strive to under-stand the reasons that plant and animalspecies vary in their distributions andabundances, and how they are assembledinto biological communities. This quest hasranged from "holistic-supraorganismic"views (e.g., Odum, 1969; Patten, 1982) toreductionist autecological explanations(e.g., Hutchinson, 1959; Brown, 1981) tothe invocation of chance (e.g., Strong etal.,1979; Simberloff, 1983). Interest in thisquestion and the various explanations con-tinues. The evolutionary ecology approachas formulated by G. E. Hutchinson (1959)in his "Homage to Santa Rosalia" is areductionist community ecology protocolthat is based upon "building blocks" aris-ing from species autecology and interac-tions, as presumably formed by naturalselection (Brown, 1981). Although notbeyond criticism (Brown, 1981; Lewin,
1 From the Symposium on Mechanistic Approaches tothe Study of Natural Communities presented at the AnnualMeeting of the American Society of Zoologists, 27-30 December 1983, at Philadelphia, Pennsylvania.
1983a, b), this latter approach has had somesuccess and is attractive in its explanations.
Attempts to define sets of "buildingblocks" from autecology and species inter-actions that determine the assembly rulesfor species in a community should be con-cerned with two qualities. A wider rangeof species than congeners should be stud-ied and these species should account for asubstantial portion of energy/mattertransfers in the ecosystem, if we are to claimthat the "building blocks" are of generalimportance to ecological systems. Withthese qualities in mind, the guild of gen-eralist herbivores, those herbivores thatconsume a wide range of plant parts andspecies, in various communities was stud-ied using the "building block" approachfor the following reasons. First, the naturalhistory, physiology and anatomy of the tax-onomically diverse generalist herbivoreshave received considerable attention fromboth theoretical and applied ecologists.This information provides an initial database, even though disagreements exist onsuch basic matters as the details of diges-tion of plant tissue in ruminant and caecaldigestive tracts (e.g., McBee, 1971; Baile
51
Dow
nloaded from https://academ
ic.oup.com/icb/article/26/1/51/114009 by guest on 28 D
ecember 2021
52 GARY E. BELOVSKY
and Forbes, 1974; Belovsky, 1984a). Sec-ond, generalist herbivores are the majorconsumers of primary production in manyecosystems (e.g., Lock, 1972; Chew, 1974;Mattson and Addy, 1975; French et al.,1979; McNaughton, 1979; Norton-Grif-fiths, 1979; Scott et al., 1979), making theman important component of energy/mat-ter transfers.
Background
Two alternative hypotheses for thestructure of generalist herbivore commu-nities can be found in the ecological liter-ature. Hairston et al. (1960) and Slobodkinet al. (1967) proposed that the distributionsand abundances of herbivores are limitedby predation, not food plant abundance.This hypothesis was derived from the sim-ple observation that the world would notbe green if herbivores were food limited,because massive defoliation would other-wise occur. In contrast, other ecologistssuggest that herbivores are food limitedand the reason that the world is green isbecause all plants are not edible, due toeither nutritional unacceptability or tox-icity from secondary compounds (VanValen, 1973; Fretwell, 1977). Therefore,to study the assembly rules of generalistherbivore guilds (hereafter called "herbi-vores"), we are faced with the alternativesof studying either their predators or theirforaging behavior, if we subscribe to sim-ple alternative explanations.
There is increasing evidence that somepopulations of herbivores, especially ver-tebrates, may be food limited (e.g., Sinclair,1975, 1979; White, 1976, 1978; Hansson,1979; Hilborn and Sinclair, 1979; Belov-sky, 1981; Caughley and Lawton, 1981).One might argue that many of these stud-ies deal with larger mammalian species,whose predators have either been exter-minated or seriously reduced in numberby man; however, some of the studies indi-cate food limitation at sites known for theirpredator—prey interactions (e.g., Seren-geti, East Africa, and Isle Royle NationalPark, Michigan). Furthermore, some casesof accepted predator limitation for herbi-vores have been questioned and food lim-itation has been offered as an equally plau-
sible explanation (e.g., Kaibab deer herd,Caughley [1970]).
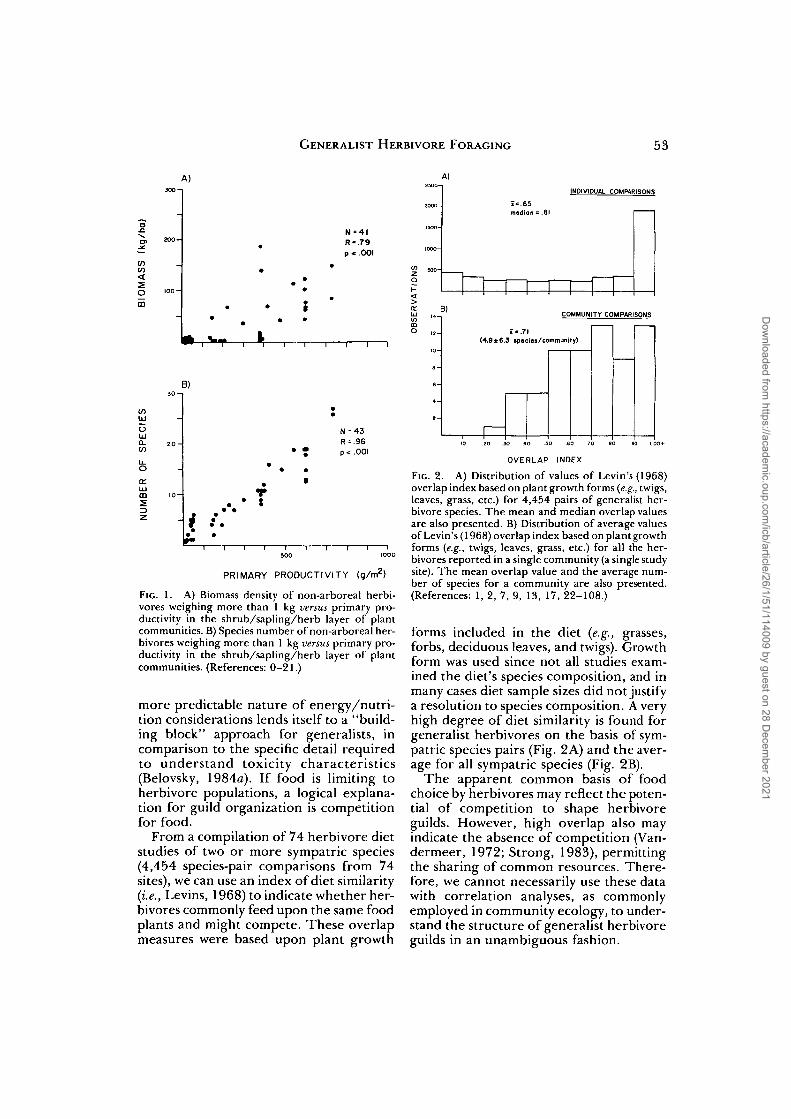
A search of the literature provides acompilation of biomass and species num-ber values for large (> 1 kg) non-arborealmammalian herbivores from different sitesin the world. Non-arboreal herbivores wereselected because they afforded the largersample size. There is a positive correlationbetween an area's primary production andherbivore biomass/species number (Fig.1A, B). In forested areas, primary produc-tivity is restricted to the shrub/sapling/herb layer excluding the canopy which isbeyond reach of the herbivores. This wasaccomplished using values reported in theliterature for comparable plant commu-nities (Ovington, 1962; Bray and Dudkie-wicz, 1963; Odum, 1969; Whittaker, 1970;Garg and Vyas, 1975; Klinge et al, 1975;Malaisse et al., 1975). Even though largepredator abundance and diversity are alsocorrelated with primary productivity, thisglobal comparison suggests that herbivoresare food limited, and their diversity (speciesnumber) is associated in some unknownfashion with food abundance.
If food does limit herbivore populationsand guild organization, we must under-stand herbivore food choices. This leads toan additional set of simple alternativehypotheses: food choice based uponenergy/nutrition or upon food plant tox-icity/herbivore detoxification ability.These are not strictly alternatives; how-ever, different researchers tend to empha-size one over the other (e.g., Freeland andJanzen, 1974; Westoby, 1974, 1978; Gil-bert and Raven, 1975; Feeny, 1976;Rhoades and Cates, 1976; Rosenthal andJanzen, 1979; Owen-Smith and Novellie,1982; Belovsky, 1984a). Because of thesedifferent emphases, I have limited the anal-ysis to herbivores that select a generalrather than a specialized diet. Specialistssuch as many lepidoptera appear morelikely to select diets primarily on the basisof plant toxicity and detoxifying abilities;while generalists, although their foodchoice is potentially limited by toxins(Freeland and Janzen, 1974), may be morestrongly influenced by energy/nutritionconsiderations (Belovsky, 1984a). The
Dow
nloaded from https://academ
ic.oup.com/icb/article/26/1/51/114009 by guest on 28 D
ecember 2021
GENERALIST HERBIVORE FORAGING 53
A)
toCO
2O
N°4I
R-.79
p<.OOI
(O
Q_(O
Q:
m
3 0 -
2 0 -
1 0 -
3)
• •
Tt
N =
P<
43
.96
.001
500 1000
PRIMARY PRODUCTIVITY (g/m2)
FIG. 1. A) Biomass density of non-arboreal herbi-vores weighing more than 1 kg versus primary pro-ductivity in the shrub/sapling/herb layer of plantcommunities. B) Species number of non-arboreal her-bivores weighing more than 1 kg versus primary pro-ductivity in the shrub/sapling/herb layer of plantcommunities. (References: 0-21.)
more predictable nature of energy/nutri-tion considerations lends itself to a "build-ing block" approach for generalists, incomparison to the specific detail requiredto understand toxicity characteristics(Belovsky, 1984a). If food is limiting toherbivore populations, a logical explana-tion for guild organization is competitionfor food.
From a compilation of 74 herbivore dietstudies of two or more sympatric species(4,454 species-pair comparisons from 74sites), we can use an index of diet similarity(i.e., Levins, 1968) to indicate whether her-bivores commonly feed upon the same foodplants and might compete. These overlapmeasures were based upon plant growth
Z5OO-
2 0 0 0 -
l iOO-
ooo-
500-
A)
x-,65median = .81
tz
INDIVIDUAL COMPARISONS
COMMUNITY COMPARISONS
-.71(4.9 ±6.3 spBCiss/community)
OVERLAP INDEX
FIG. 2. A) Distribution of values of Levin's (1968)overlap index based on plant growth forms (e.g., twigs,leaves, grass, etc.) for 4,454 pairs of generalist her-bivore species. The mean and median overlap valuesare also presented. B) Distribution of average valuesof Levin's (1968) overlap index based on plant growthforms {e.g., twigs, leaves, grass, etc.) for all the her-bivores reported in a single community (a single studysite). The mean overlap value and the average num-ber of species for a community are also presented.(References: 1, 2, 7, 9, 13, 17, 22-108.)
forms included in the diet (e.g., grasses,forbs, deciduous leaves, and twigs). Growthform was used since not all studies exam-ined the diet's species composition, and inmany cases diet sample sizes did not justifya resolution to species composition. A veryhigh degree of diet similarity is found forgeneralist herbivores on the basis of sym-patric species pairs (Fig. 2A) and the aver-age for all sympatric species (Fig. 2B).
The apparent common basis of foodchoice by herbivores may reflect the poten-tial of competition to shape herbivoreguilds. However, high overlap also mayindicate the absence of competition (Van-dermeer, 1972; Strong, 1983), permittingthe sharing of common resources. There-fore, we cannot necessarily use these datawith correlation analyses, as commonlyemployed in community ecology, to under-stand the structure of generalist herbivoreguilds in an unambiguous fashion.
Dow
nloaded from https://academ
ic.oup.com/icb/article/26/1/51/114009 by guest on 28 D
ecember 2021
54 GARY E. BELOVSKY
An approach involving the study of aut-ecological and species interaction "build-ing blocks" might provide explicit expres-sions for population dynamics and theinteraction between populations (mecha-nistic models) to help understand the struc-ture of herbivore guilds. To follow thisapproach, the answers to three questionsmay be useful:
1) Do herbivores have a common for-aging goal?
2) Do herbivores select foods by a com-mon set of criteria?, and
3) Can these foraging goals and criteriabe used to understand competition betweengeneralist herbivores, if they are food lim-ited?
I hope to answer these questions anddetermine whether a general hypothesis ofherbivore evolution and guild assembly canbe constructed.
Answers to the questions
1) Do generalist herbivores have a common for-aging goal?
Optimal foraging theory provides apotential starting point to address thisquestion. Belovsky (1984a) points out aseries of potential differences between her-bivores and non-herbivores that must beevaluated in developing foraging models.These differences include constraints onherbivore foraging behavior and the dis-tribution of food items in the environment.
Herbivores potentially may be con-fronted by four constraints on their for-aging behavior: daily digestive capacity,daily feeding time, daily energy demands,and daily nutrient requirements. The firsttwo constraints provide upper limits to anherbivore's actions, while the latter twodefine lower limits.
In many environments food plants withindifferent growth forms (grasses, forbs,browse, etc.) are found to be contagiously(patchily) distributed. In addition, thesepatches of different growth forms are neg-atively associated with each other (Belov-sky, manuscript) because each growth formtends to be better adapted to differentmicrohabitats. This necessitates an herbi-vore foraging upon one growth form at atime because of their spatial separation into
patches. Therefore, an herbivore mustmake decisions to forage on one growthform (patch) or another in a given timeperiod (non-simultaneous search) becauseit cannot be in two places at once. Thistype of time constraint is unlike that (simul-taneous search) in most other foragingmodels (Schoener, 1971; Pyke etal., 1977).
The foraging of an herbivore can be pre-dicted for two alternative goals: feedingtime minimization or energy/nutrientmaximization (Schoener, 1971). A feedingtime minimizer attempts to satisfy itsenergy/nutrient demands in the leastamount of time; presumably because moretime spent in other activities {e.g., mating,grooming, offspring care, etc.), and lessexposure to predators and deleteriousenvironmental conditions, (e.g., hypother-mia, desiccation, etc.) increase fitness morethan does greater ingestion of energy/nutrients. Alternately, an energy/nutrientmaximizer has greater fitness by obtainingmore of the nutritional requirements forreproduction and survival when food is inshort supply than by spending time in non-foraging activities. Either foraging goal canbe solved for using established optimiza-tion techniques. Linear programming is acommonly employed mathematical tech-nique for finding the optimal solution toconstrained problems where the con-straints are linear (Strum, 1972). If theconstraints are non-linear, the more com-plex technique of non-linear programmingwould be applied (Strum, 1972).
As an example of how to model herbi-vore foraging, a linear programming solu-tion to the foraging constraints will be con-structed for an adult Columbian groundsquirrel (Spermophilus columbianus) in Mon-tana during summer (Belovsky, 1985). Thisexample will illustrate how the energy/nutrient-maximizing and time-minimizingsolutions are obtained. The diet will besolved for the dry matter consumption (g-dry wt/day) of two plant growth forms:grasses and forbs in a prairie environment.
Time constraints depend upon the for-ager's daily feeding time (min/day) and itsuse in cropping different foods (min/g-drywt). A ground squirrel's daily feeding timeis dependent upon the thermal environ-
Dow
nloaded from https://academ
ic.oup.com/icb/article/26/1/51/114009 by guest on 28 D
ecember 2021
GENERALIST HERBIVORE FORAGING 55
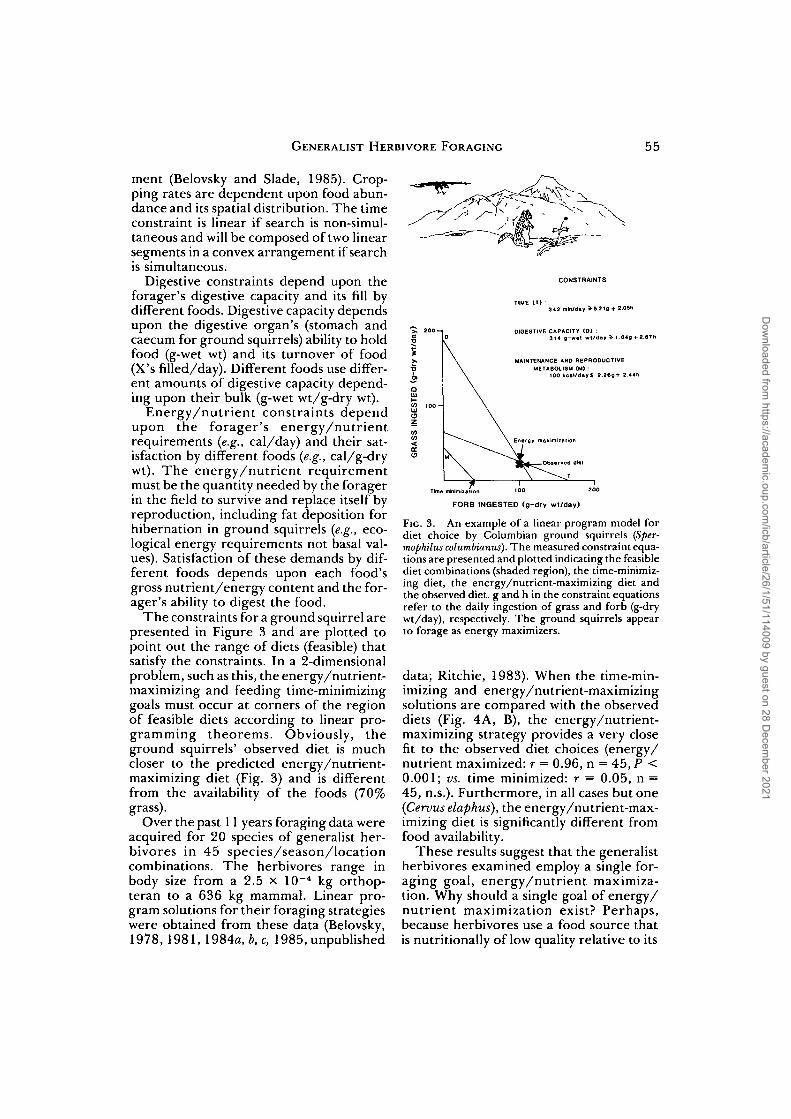
ment (Belovsky and Slade, 1985). Crop-ping rates are dependent upon food abun-dance and its spatial distribution. The timeconstraint is linear if search is non-simul-taneous and will be composed of two linearsegments in a convex arrangement if searchis simultaneous.
Digestive constraints depend upon theforager's digestive capacity and its fill bydifferent foods. Digestive capacity dependsupon the digestive organ's (stomach andcaecum for ground squirrels) ability to holdfood (g-wet wt) and its turnover of food(X's filled/day). Different foods use differ-ent amounts of digestive capacity depend-ing upon their bulk (g-wet wt/g-dry wt).
Energy/nutrient constraints dependupon the forager's energy/nutrientrequirements (e.g., cal/day) and their sat-isfaction by different foods (e.g., cal/g-drywt). The energy/nutrient requirementmust be the quantity needed by the foragerin the field to survive and replace itself byreproduction, including fat deposition forhibernation in ground squirrels (e.g., eco-logical energy requirements not basal val-ues). Satisfaction of these demands by dif-ferent foods depends upon each food'sgross nutrient/energy content and the for-ager's ability to digest the food.
The constraints for a ground squirrel arepresented in Figure 3 and are plotted topoint out the range of diets (feasible) thatsatisfy the constraints. In a 2-dimensionalproblem, such as this, the energy/nutrient-maximizing and feeding time-minimizinggoals must occur at corners of the regionof feasible diets according to linear pro-gramming theorems. Obviously, theground squirrels' observed diet is muchcloser to the predicted energy/nutrient-maximizing diet (Fig. 3) and is differentfrom the availability of the foods (70%grass).
Over the past 11 years foraging data wereacquired for 20 species of generalist her-bivores in 45 species/season/locationcombinations. The herbivores range inbody size from a 2.5 x 10~4 kg orthop-teran to a 636 kg mammal. Linear pro-gram solutions for their foraging strategieswere obtained from these data (Belovsky,1978, 1981, 1984a, b,c, 1985, unpublished
CONSTRAINTS
342 min/day > 5.21Q + 2.0Sh
DIGESTIVE CAPACITY (D) :
Time iuMMzailon '°° 2 0 0
FORB INGESTED (g-dry wt/day)
FIG. 3. An example of a linear program model fordiet choice by Columbian ground squirrels (Sper-mophilus columbianus). The measured constraint equa-tions are presented and plotted indicating the feasiblediet combinations (shaded region), the time-minimiz-ing diet, the energy/nutrient-maximizing diet andthe observed diet, g and h in the constraint equationsrefer to the daily ingestion of grass and forb (g-drywt/day), respectively. The ground squirrels appearto forage as energy maximizers.
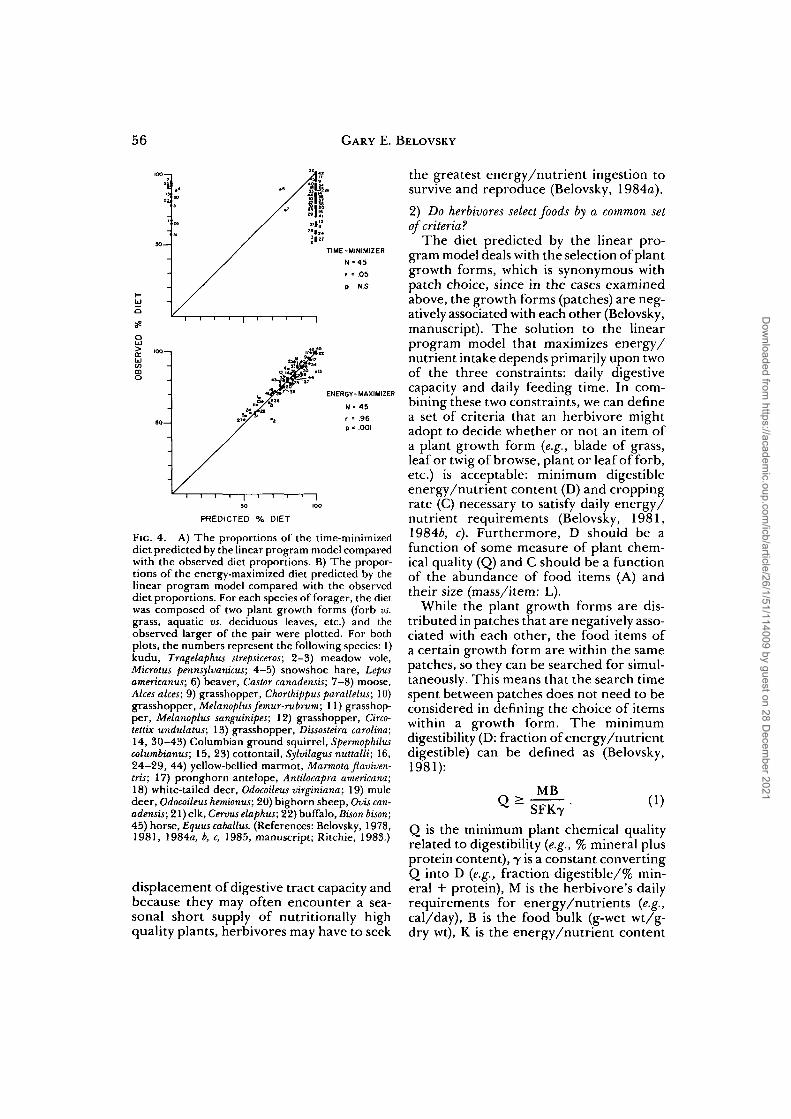
data; Ritchie, 1983). When the time-min-imizing and energy/nutrient-maximizingsolutions are compared with the observeddiets (Fig. 4A, B), the energy/nutrient-maximizing strategy provides a very closefit to the observed diet choices (energy/nutrient maximized: r = 0.96, n = 45, P <0.001; vs. time minimized: r = 0.05, n =45, n.s.). Furthermore, in all cases but one(Cervus elaphus), the energy/nutrient-max-imizing diet is significantly different fromfood availability.
These results suggest that the generalistherbivores examined employ a single for-aging goal, energy/nutrient maximiza-tion. Why should a single goal of energy/nutrient maximization exist? Perhaps,because herbivores use a food source thatis nutritionally of low quality relative to its
Dow
nloaded from https://academ
ic.oup.com/icb/article/26/1/51/114009 by guest on 28 D
ecember 2021
56 GARY E. BELOVSKY
UJ
o
ENERGY- MAXIMIZER
N= 45
r = .96
p < .001
I100
PREDICTED % DIET
FIG. 4. A) The proportions of the time-minimizeddiet predicted by the linear program model comparedwith the observed diet proportions. B) The propor-tions of the energy-maximized diet predicted by thelinear program model compared with the observeddiet proportions. For each species of forager, the dietwas composed of two plant growth forms (forb vs.grass, aquatic vs. deciduous leaves, etc.) and theobserved larger of the pair were plotted. For bothplots, the numbers represent the following species: 1)kudu, Tragelaphus strepsiceros; 2-3) meadow vole,Microtus pennsylvanicus; 4-5) snowshoe hare, Lepusamericanus; 6) beaver, Castor canadensis; 7—8) moose,Alces alces; 9) grasshopper, Chorthippus parallelus; 10)grasshopper, Melanoplus femur-rubrum; 11) grasshop-per, Melanoplus sanguinipes; 12) grasshopper, Circo-tettix undulatus; 13) grasshopper, Dissosteira Carolina;14, 30—43) Columbian ground squirrel, Spermophiluscolumbianus; 15, 23) cottontail, Sylvilagus nuttalli; 16,24-29, 44) yellow-bellied marmot, Marmota flaviven-tris; 17) pronghorn antelope, Antilocapra americana;18) white-tailed deer, Odocoileus virginiana; 19) muledeer, Odocoileus hemionus; 20) bighorn sheep, Ovis can-adensis; 21) elk, Cervus elaphus; 22) buffalo, Bison bison;45) horse, Equus caballus. (References: Belovsky, 1978,1981, 1984a, b, c, 1985, manuscript; Ritchie, 1983.)
displacement of digestive tract capacity andbecause they may often encounter a sea-sonal short supply of nutritionally highquality plants, herbivores may have to seek
the greatest energy/nutrient ingestion tosurvive and reproduce (Belovsky, 1984a).
2) Do herbivores select foods by a common setof criteria?
The diet predicted by the linear pro-gram model deals with the selection of plantgrowth forms, which is synonymous withpatch choice, since in the cases examinedabove, the growth forms (patches) are neg-atively associated with each other (Belovsky,manuscript). The solution to the linearprogram model that maximizes energy/nutrient intake depends primarily upon twoof the three constraints: daily digestivecapacity and daily feeding time. In com-bining these two constraints, we can definea set of criteria that an herbivore mightadopt to decide whether or not an item ofa plant growth form (e.g., blade of grass,leaf or twig of browse, plant or leaf of forb,etc.) is acceptable: minimum digestibleenergy/nutrient content (D) and croppingrate (C) necessary to satisfy daily energy/nutrient requirements (Belovsky, 1981,19846, c). Furthermore, D should be afunction of some measure of plant chem-ical quality (Q) and C should be a functionof the abundance of food items (A) andtheir size (mass/item: L).
While the plant growth forms are dis-tributed in patches that are negatively asso-ciated with each other, the food items ofa certain growth form are within the samepatches, so they can be searched for simul-taneously. This means that the search timespent between patches does not need to beconsidered in defining the choice of itemswithin a growth form. The minimumdigestibility (D: fraction of energy/nutrientdigestible) can be defined as (Belovsky,1981):
MBSFK/y (1)
Q is the minimum plant chemical qualityrelated to digestibility (e.g., % mineral plusprotein content), 7 is a constant convertingQ into D (e.g., fraction digestible/% min-eral + protein), M is the herbivore's dailyrequirements for energy/nutrients (e.g.,cal/day), B is the food bulk (g-wet wt/g-dry wt), K is the energy/nutrient content
Dow
nloaded from https://academ
ic.oup.com/icb/article/26/1/51/114009 by guest on 28 D
ecember 2021
GENERALIST HERBIVORE FORAGING 57
of the plant growth form (e.g., cal/g-drywt), F is the digestive organ's turnover (X's/day) and S is the herbivore's digestive organcapacity. The minimum item size (L: drywt/item) selected by an herbivore can bedenned as (Belovsky, 1981):
L 2:M M
TCCKTQ TCKTQ€A(2)
A is the abundance of items (items/area),C is the cropping rate (items/min), « is aconstant converting A into C (area/min),assuming a linear (Type I) functionalresponse as suggested by Holling (1965)for herbivores, and T c is the herbivore'sdaily feeding time (min/day).
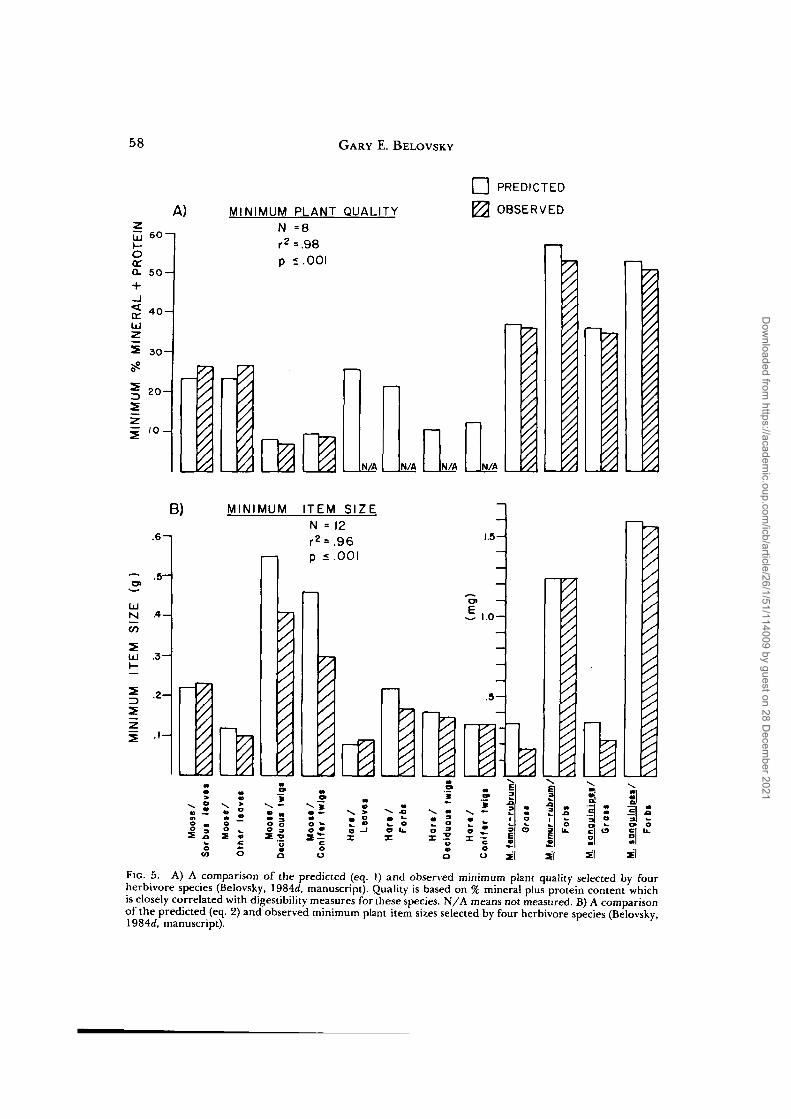
I have measured Q as either the mineralplus protein content of the vegetation orits solubility in HC1 and pepsin which iscorrelated with D (Belovsky, 1981, 1984a,b). L can be measured as the size of an itemor portion of it consumed by herbivores(g-dry wt/item), while A is a measure offood plant item density (leaves, twigs, etc./area). Knowing the availability of Q and Lvalues for items of each plant species com-posing a growth form, the species com-position of an herbivore's diet can be pre-dicted by computing the fraction of itemsof each plant species that satisfies the her-bivore's minimum D and L values (Belov-sky, 1981, 19846, c). In addition, the min-imum Q and L values can be measured asthe smallest 10% of all Q and L valuesselected by an herbivore. The predictedand observed minimum Q and L values canbe compared (Fig. 5), indicating very closeagreement.
If herbivores select food items accordingto minimum Q and L values (eqs. 1 and 2),they will be consuming, on average, itemsof lower Q and L values than will a foragerthat selects items to maximize energy/nutrient intake. Minimum Q and L valuesare set by energy/nutrient requirementsand feeding time, while the energy/nutrient-maximizing forager will selectitems based on the availability of the high-est energy/nutrient items and their crop-ping rates. A diet that maximizes energy/nutrient intake with simultaneous search,as is the case for the selection of items within
a growth form (contingency model [Schoe-ner, 1971; Pyke et ai, 1977]), provides amuch poorer fit with the observed speciescomposition of the diet and observed min-imum Q and L values for moose and snow-shoe hare (Belovsky, 1981, 19846) than eqs.1 and 2. Even though eqs. 1 and 2 mayrepresent sub-optimal decision rules, theserules may minimize the herbivore's chancesof making a dietary mistake, especiallygiven the large number of items an her-bivore will encounter and choose in a day(e.g., a moose in summer selects over 20,000items/day: Belovsky, 1981). If the herbi-vore is unable to integrate the informationon this large number of potential fooditems, the observed decision rules (eqs. 1and 2) may be a form of "risk averse" strat-egy (Caraco, 1980) that minimizes mis-takes.
The answer to the second question seemsto be related to a set of food choice criteriafor each plant growth form based on a min-imum plant quality and item size arisingfrom the herbivore's digestive capacity,feeding time and energy/nutrient require-ments. With the answers to the first twoquestions, we have a foundation for defin-ing how much food is usable by an herbi-vore and what proportion of this food isusable by a potential competitor; this leadsto the third question.
3) Can these foraging goals and criteria beused to understand competition for food betweengeneralist herbivores?
To address this question, a situation inwhich herbivores appear to be food limitedmust be studied. Two such systems havebeen examined: moose and snowshoe hareat Isle Royale National Park, Michigan(Belovsky, 1984d) and two species oforthopterans at the National Bison Range,Montana (Belovsky, manuscript). For eachof the four species' populations in allopa-try, the foraging criteria for minimum fooditem size and quality (eqs. 1 and 2) can beused to predict the quantity of vegetationusable by each species. If the usable foodis positively correlated with observed con-sumption, food limitation may be indicatedand such a relationship is found (Fig. 6).
For field observational data (Isle Roy-
Dow
nloaded from https://academ
ic.oup.com/icb/article/26/1/51/114009 by guest on 28 D
ecember 2021
58 GARY E. BELOVSKY
60—1UJ
orrQ. 5 0 -
A) MINIMUM PLANT QUALITYN =8r2=.98p 5.001
<40-J
3 0 - |
2 0 -
10 —I1—11 N/A IN/A I IN/A I IN/A
PREDICTED
OBSERVED
—
I11—1
11UJN
CO
UJ
• 6 - 1
B) MINIMUM ITEM SIZEN = 12r*=.96
r—i p «.00l. 5 -
A —
. 3 -
. 2 -
. 1 - 1
1.5-
E1.0-
. 5 -
7]1 I§ ; § w li
i5 ^|O
O
I i-oo
FIG. 5. A) A comparison of the predicted (eq. 1) and observed minimum plant quality selected by fourherbivore species (Belovsky, 1984<f, manuscript). Quality is based on % mineral plus protein content whichis closely correlated with digestibility measures for these species. N/A means not measured. B) A comparisonof the predicted (eq. 2) and observed minimum plant item sizes selected by four herbivore species (Belovsky,1984rf, manuscript).
Dow
nloaded from https://academ
ic.oup.com/icb/article/26/1/51/114009 by guest on 28 D
ecember 2021
GENERALIST HERBIVORE FORAGING 59
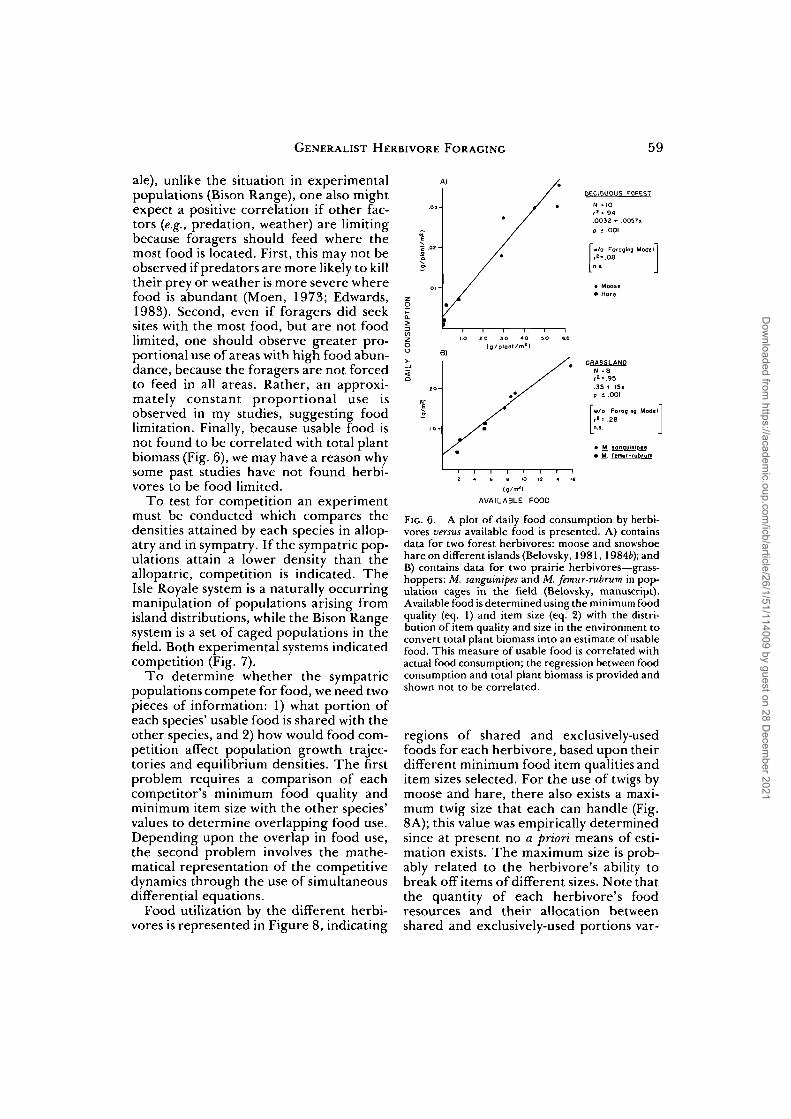
ale), unlike the situation in experimentalpopulations (Bison Range), one also mightexpect a positive correlation if other fac-tors (e.g., predation, weather) are limitingbecause foragers should feed where themost food is located. First, this may not beobserved if predators are more likely to killtheir prey or weather is more severe wherefood is abundant (Moen, 1973; Edwards,1983). Second, even if foragers did seeksites with the most food, but are not foodlimited, one should observe greater pro-portional use of areas with high food abun-dance, because the foragers are not forcedto feed in all areas. Rather, an approxi-mately constant proportional use isobserved in my studies, suggesting foodlimitation. Finally, because usable food isnot found to be correlated with total plantbiomass (Fig. 6), we may have a reason whysome past studies have not found herbi-vores to be food limited.
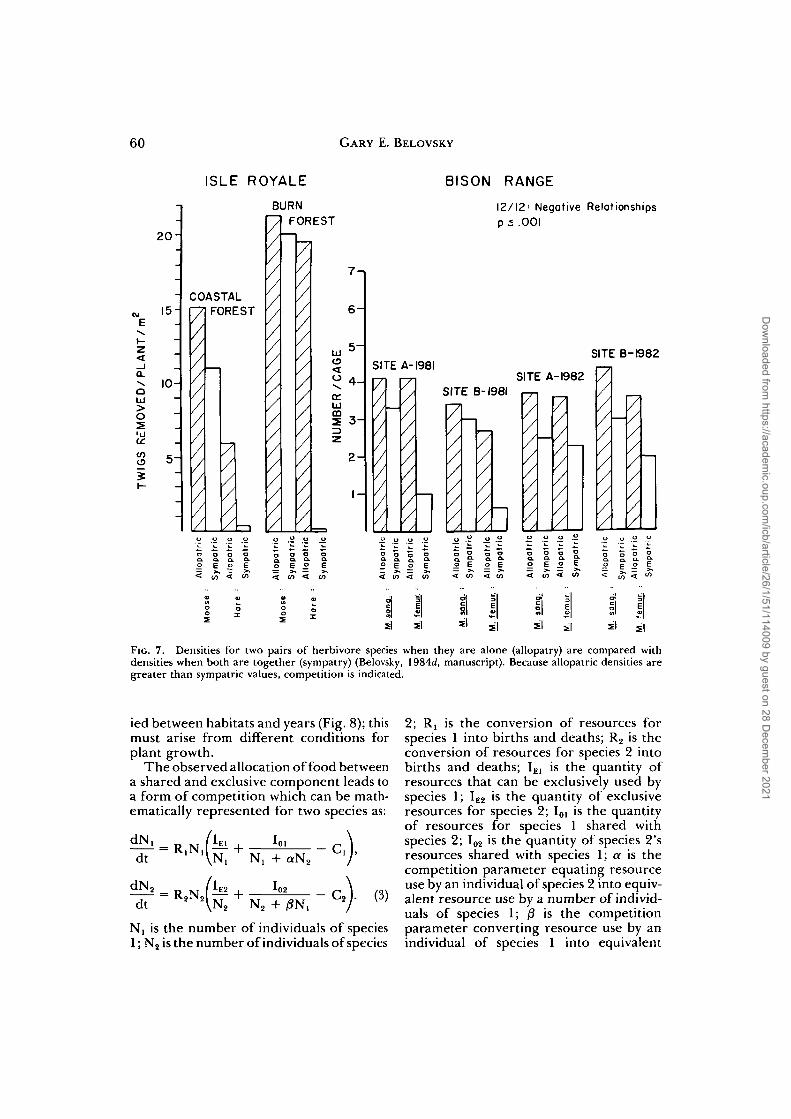
To test for competition an experimentmust be conducted which compares thedensities attained by each species in allop-atry and in sympatry. If the sympatric pop-ulations attain a lower density than theallopatric, competition is indicated. TheIsle Royale system is a naturally occurringmanipulation of populations arising fromisland distributions, while the Bison Rangesystem is a set of caged populations in thefield. Both experimental systems indicatedcompetition (Fig. 7).
To determine whether the sympatricpopulations compete for food, we need twopieces of information: 1) what portion ofeach species' usable food is shared with theother species, and 2) how would food com-petition affect population growth trajec-tories and equilibrium densities. The firstproblem requires a comparison of eachcompetitor's minimum food quality andminimum item size with the other species'values to determine overlapping food use.Depending upon the overlap in food use,the second problem involves the mathe-matical representation of the competitivedynamics through the use of simultaneousdifferential equations.
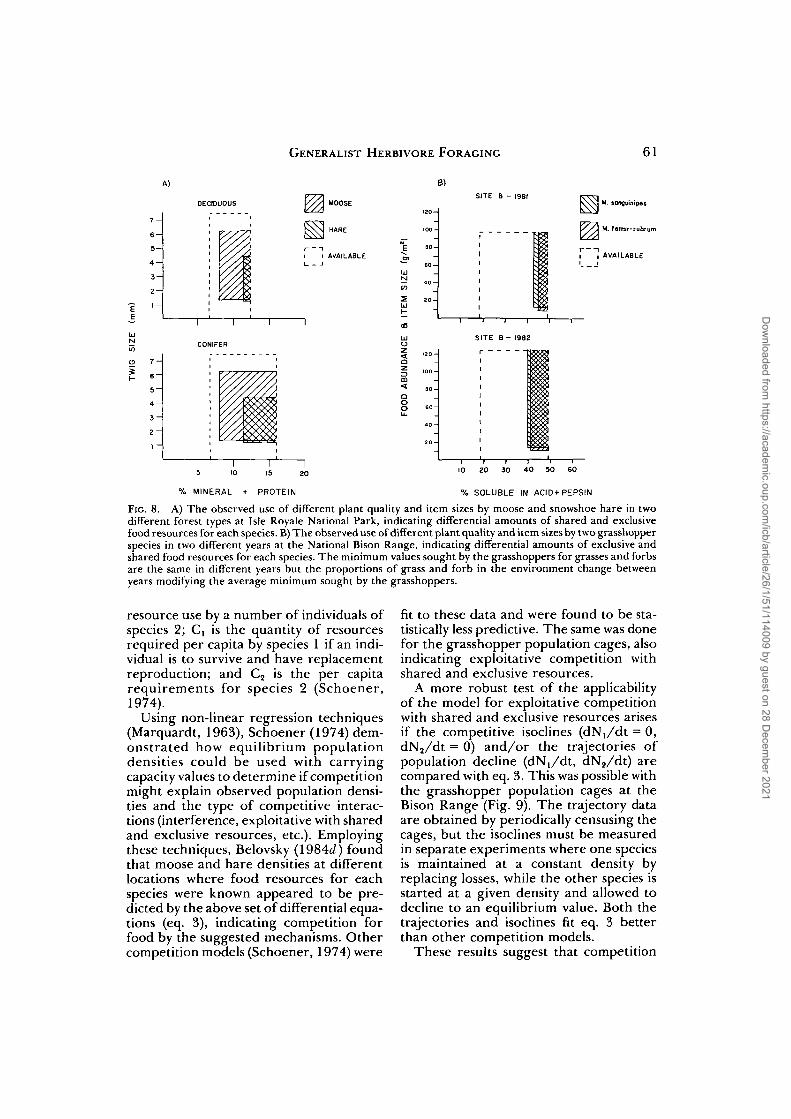
Food utilization by the different herbi-vores is represented in Figure 8, indicating
DECIDUOUS FOREST
AVAILABLE FOOD
FIG. 6. A plot of daily food consumption by herbi-vores versus available food is presented. A) containsdata for two forest herbivores: moose and snowshoehare on different islands (Belovsky, 1981,1984£); andB) contains data for two prairie herbivores—grass-hoppers: M. sanguinipes and M. femur-rubrum in pop-ulation cages in the field (Belovsky, manuscript).Available food is determined using the minimum foodquality (eq. 1) and item size (eq. 2) with the distri-bution of item quality and size in the environment toconvert total plant biomass into an estimate of usablefood. This measure of usable food is correlated withactual food consumption; the regression between foodconsumption and total plant biomass is provided andshown not to be correlated.
regions of shared and exclusively-usedfoods for each herbivore, based upon theirdifferent minimum food item qualities anditem sizes selected. For the use of twigs bymoose and hare, there also exists a maxi-mum twig size that each can handle (Fig.8A); this value was empirically determinedsince at present no a priori means of esti-mation exists. The maximum size is prob-ably related to the herbivore's ability tobreak off items of different sizes. Note thatthe quantity of each herbivore's foodresources and their allocation betweenshared and exclusively-used portions var-
Dow
nloaded from https://academ
ic.oup.com/icb/article/26/1/51/114009 by guest on 28 D
ecember 2021
60 GARY E. BELOVSKY
ISLE ROYALE BISON RANGE
a
2 0 -
15-
10-
5-
COASTALFOREST
/
71
BURNFOREST
12/12 = Negative Relationshipsp < .001
6 -
3 -
2 -
I -
SITE A-1981SITE B-1982
SITE A-1982 v\SITE B-I98I
w /////////
—
v\////////
—
o o o .~
< CO < s. = i.CO < CO
- I. ^ E 2< co <
5 £ .9< co <
o E o E 1
< CO <t CO <
X " S " o| =1
Si Si Si s | Si 5 | sl s|FIG. 7. Densities for two pairs of herbivore species when they are alone (allopatry) are compared withdensities when both are together (sympatry) (Belovsky, 1984d, manuscript). Because allopatric densities aregreater than sympatric values, competition is indicated.
ied between habitats and years (Fig. 8); thismust arise from different conditions forplant growth.
The observed allocation of food betweena shared and exclusive component leads toa form of competition which can be math-ematically represented for two species as:
dt N2
- c ,
- c (3)
Nj is the number of individuals of species1; N2 is the number of individuals of species
2; R[ is the conversion of resources forspecies 1 into births and deaths; R2 is theconversion of resources for species 2 intobirths and deaths; IE1 is the quantity ofresources that can be exclusively used byspecies 1; IE2 is the quantity of exclusiveresources for species 2; IOi is the quantityof resources for species 1 shared withspecies 2; I02 is the quantity of species 2'sresources shared with species 1; a is thecompetition parameter equating resourceuse by an individual of species 2 into equiv-alent resource use by a number of individ-uals of species 1; /3 is the competitionparameter converting resource use by anindividual of species 1 into equivalent
Dow
nloaded from https://academ
ic.oup.com/icb/article/26/1/51/114009 by guest on 28 D
ecember 2021
GENERALIST HERBIVORE FORAGING 61
A) B)SITE B - 1981
— 4 0 -
j M. sanguinipes
j M. feimir-rubrum
] AVAILABLE
SITE B - 1982
m«taoo
I10
[IS
I20
% MINERAL + PROTEIN
20 30 40 50 60
% SOLUBLE IN ACID+PEPSIN
FIG. 8. A) The observed use of different plant quality and item sizes by moose and snowshoe hare in twodifferent forest types at Isle Royale National Park, indicating differential amounts of shared and exclusivefood resources for each species. B) The observed use of different plant quality and item sizes by two grasshopperspecies in two different years at the National Bison Range, indicating differential amounts of exclusive andshared food resources for each species. The minimum values sought by the grasshoppers for grasses and forbsare the same in different years but the proportions of grass and forb in the environment change betweenyears modifying the average minimum sought by the grasshoppers.
resource use by a number of individuals ofspecies 2; C, is the quantity of resourcesrequired per capita by species 1 if an indi-vidual is to survive and have replacementreproduction; and C2 is the per capitarequirements for species 2 (Schoener,1974).
Using non-linear regression techniques(Marquardt, 1963), Schoener (1974) dem-onstrated how equilibrium populationdensities could be used with carryingcapacity values to determine if competitionmight explain observed population densi-ties and the type of competitive interac-tions (interference, exploitative with sharedand exclusive resources, etc.). Employingthese techniques, Belovsky (1984d) foundthat moose and hare densities at differentlocations where food resources for eachspecies were known appeared to be pre-dicted by the above set of differential equa-tions (eq. 3), indicating competition forfood by the suggested mechanisms. Othercompetition models (Schoener, 1974) were
fit to these data and were found to be sta-tistically less predictive. The same was donefor the grasshopper population cages, alsoindicating exploitative competition withshared and exclusive resources.
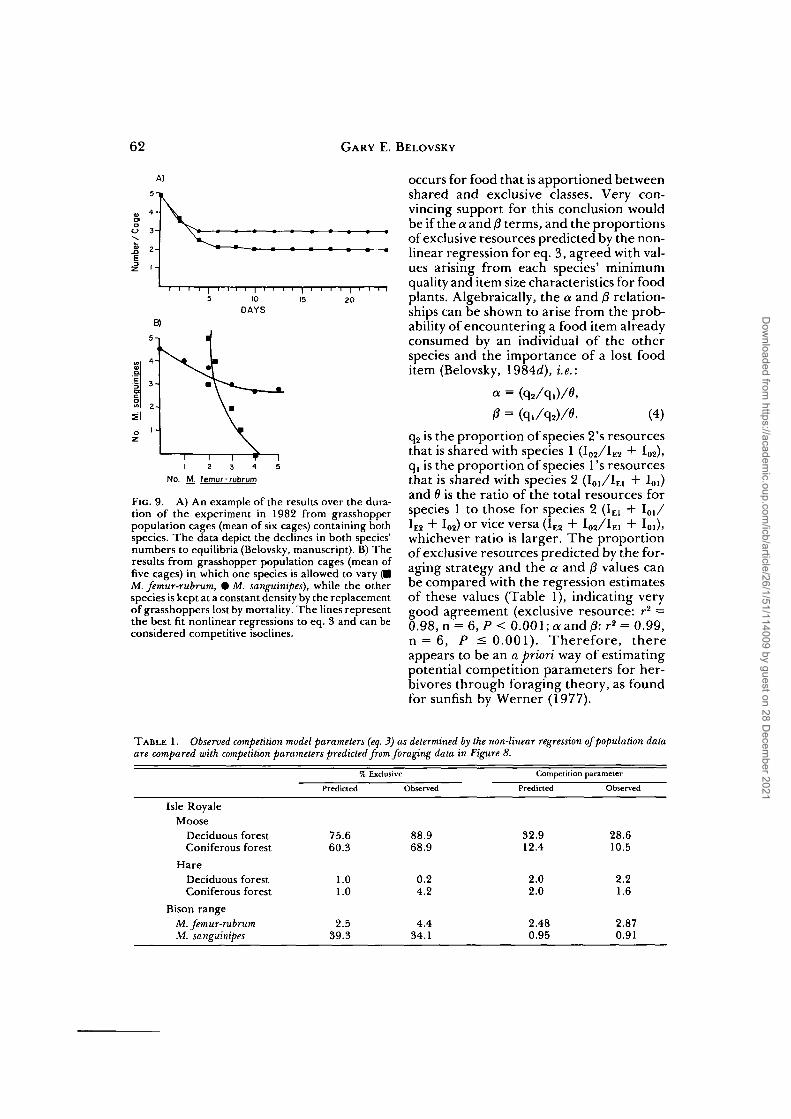
A more robust test of the applicabilityof the model for exploitative competitionwith shared and exclusive resources arisesif the competitive isoclines (dN,/dt = 0,dN2/dt = 0) and/or the trajectories ofpopulation decline (dN,/dt, dN2/dt) arecompared with eq. 3. This was possible withthe grasshopper population cages at theBison Range (Fig. 9). The trajectory dataare obtained by periodically censusing thecages, but the isoclines must be measuredin separate experiments where one speciesis maintained at a constant density byreplacing losses, while the other species isstarted at a given density and allowed todecline to an equilibrium value. Both thetrajectories and isoclines fit eq. 3 betterthan other competition models.
These results suggest that competition
Dow
nloaded from https://academ
ic.oup.com/icb/article/26/1/51/114009 by guest on 28 D
ecember 2021
62 GARY E. BELOVSKY
A)
FIG. 9. A) An example of the results over the dura-tion of the experiment in 1982 from grasshopperpopulation cages (mean of six cages) containing bothspecies. The data depict the declines in both species'numbers to equilibria (Belovsky, manuscript). B) Theresults from grasshopper population cages (mean offive cages) in which one species is allowed to vary (•M. femur-rubrum, 0 M. sanguinipes), while the otherspecies is kept at a constant density by the replacementof grasshoppers lost by mortality. The lines representthe best fit nonlinear regressions to eq. 3 and can beconsidered competitive isoclines.
occurs for food that is apportioned betweenshared and exclusive classes. Very con-vincing support for this conclusion wouldbe if the a and j8 terms, and the proportionsof exclusive resources predicted by the non-linear regression for eq. 3, agreed with val-ues arising from each species' minimumquality and item size characteristics for foodplants. Algebraically, the a and 0 relation-ships can be shown to arise from the prob-ability of encountering a food item alreadyconsumed by an individual of the otherspecies and the importance of a lost fooditem (Belovsky, 1984d), i.e.:
a = (q2/q,)/0,0 = (q,/q2)/0. (4)
q2 is the proportion of species 2's resourcesthat is shared with species 1 (I0 2/IE2 + I02).q, is the proportion of species l's resourcesthat is shared with species 2 (I0l/IEl + IOi)and 8 is the ratio of the total resources forspecies 1 to those for species 2 (IE1 + IOi/IE2 + W or vice versa (IE2 + I02/IEi + I01).whichever ratio is larger. The proportionof exclusive resources predicted by the for-aging strategy and the a and /3 values canbe compared with the regression estimatesof these values (Table 1), indicating verygood agreement (exclusive resource: r2 =0.98,n = 6 , P < 0.001; a and j3: r2 = 0.99,n = 6, P < 0.001). Therefore, thereappears to be an a priori way of estimatingpotential competition parameters for her-bivores through foraging theory, as foundfor sunfish by Werner (1977).
T A B L E 1. Observed competition model parameters (eq. 3) as determined by the non-linear regression of population dataare compared with competition parameters predicted from foraging data in Figure 8.
Isle RoyaleMoose
Deciduous forestConiferous forest
HareDeciduous forestConiferous forest
Bison rangeM. femur-rubrumSi. sanguinipes
Si
Predicted
75.660.3
1.01.0
2.539.3
L Exclusive
Observed
88.968.9
0.24.2
4.434.1
Compet
Predicted
32.912.4
2.02.0
2.480.95
ition parameter
Observed
28.610.5
2.21.6
2.870.91
Dow
nloaded from https://academ
ic.oup.com/icb/article/26/1/51/114009 by guest on 28 D
ecember 2021
GENERALIST HERBIVORE FORAGING 63
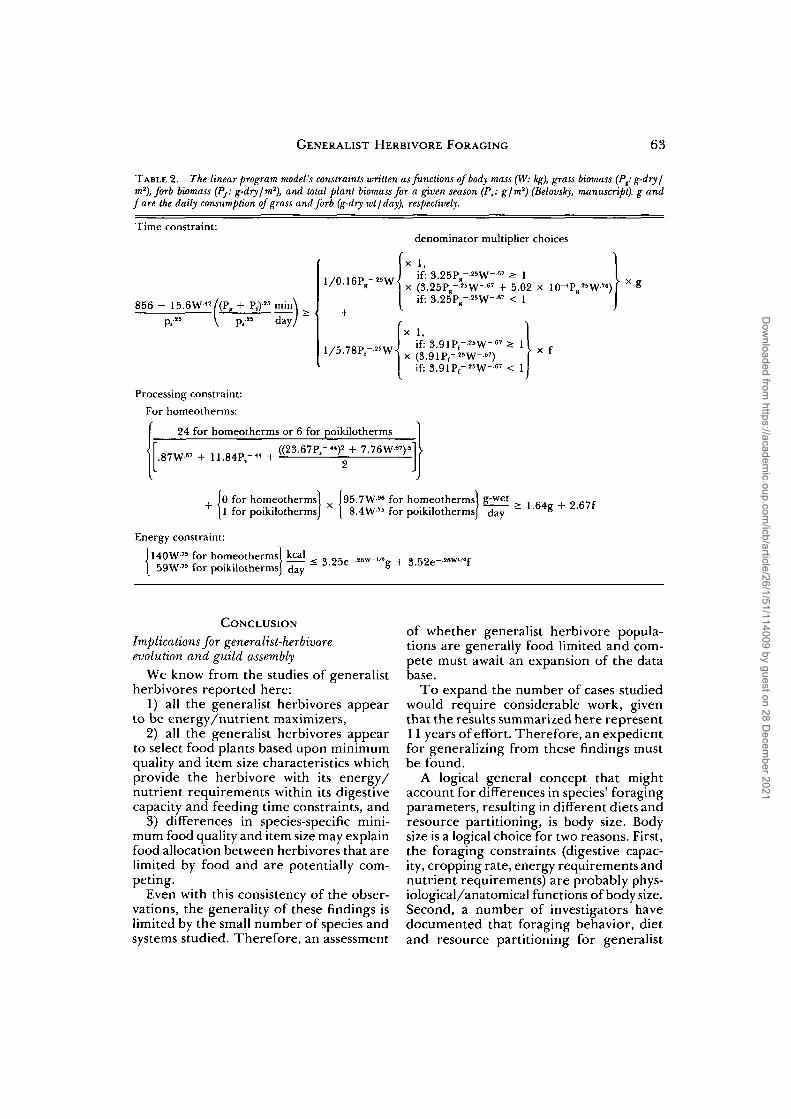
TABLE 2. The linear program model's constraints written as functions of body mass (W: kg), grass biomass (Pt: g-dry/m2),forb biomass (Pf: g-dry /m2), and total plant biomass for a given season (P,: g/m2) (Belovsky, manuscript), g andfare the daily consumption of grass andforb (g-dry wt/day), respectively.
Time constraint:
856 - 15.6W-4»/(P, + Pf)25 min
P.25 \ P,25 day
denominator multiplier choices
V 1
if: 3.25Pg"2 5W-6 7 > 1x (3 .25P g ""W- 6 7 + 5.02 x 10⁻⁴Pg
2SW-76) Iif: 3.25Pg"2 5W-6 7 < 1
1,if' 3 91P --25\v~"67 ^
if: 3.91Pf--"W-6 7 < 1
Processing constraint:
For homeotherms:
( 24 for homeotherms or 6 for poikilotherms
f ((23.67P -4 4) 2 + 7.76W-6'V5i!
.87W-" + 11.84P.-44 + " — ' - — ;
lO for homeothermsl I95.7W96 for homeothermsl g-wet „ fi-f
[1 for poikilothermsj } 8.4W" for poikilotherms} day ~ g
Energy constraint:
J140W" for homeotherms} ^ < „ 2{ 59W" for poikilothermsj day ~ g
CONCLUSION
Implications for generalist-herbivoreevolution and guild assembly
We know from the studies of generalistherbivores reported here:
1) all the generalist herbivores appearto be energy/nutrient maximizers,
2) all the generalist herbivores appearto select food plants based upon minimumquality and item size characteristics whichprovide the herbivore with its energy/nutrient requirements within its digestivecapacity and feeding time constraints, and
3) differences in species-specific mini-mum food quality and item size may explainfood allocation between herbivores that arelimited by food and are potentially com-peting.
Even with this consistency of the obser-vations, the generality of these findings islimited by the small number of species andsystems studied. Therefore, an assessment
of whether generalist herbivore popula-tions are generally food limited and com-pete must await an expansion of the database.
To expand the number of cases studiedwould require considerable work, giventhat the results summarized here represent11 years of effort. Therefore, an expedientfor generalizing from these findings mustbe found.
A logical general concept that mightaccount for differences in species' foragingparameters, resulting in different diets andresource partitioning, is body size. Bodysize is a logical choice for two reasons. First,the foraging constraints (digestive capac-ity, cropping rate, energy requirements andnutrient requirements) are probably phys-iological/anatomical functions of body size.Second, a number of investigators havedocumented that foraging behavior, dietand resource partitioning for generalist
Dow
nloaded from https://academ
ic.oup.com/icb/article/26/1/51/114009 by guest on 28 D
ecember 2021
64 GARY E. BELOVSKY
24,2612)
8 0 -
toGOO
V)in<a:CD
*2I ( 92 2 - 1 | | | |
20 40 60 80 100
% GRASS PREDICTED
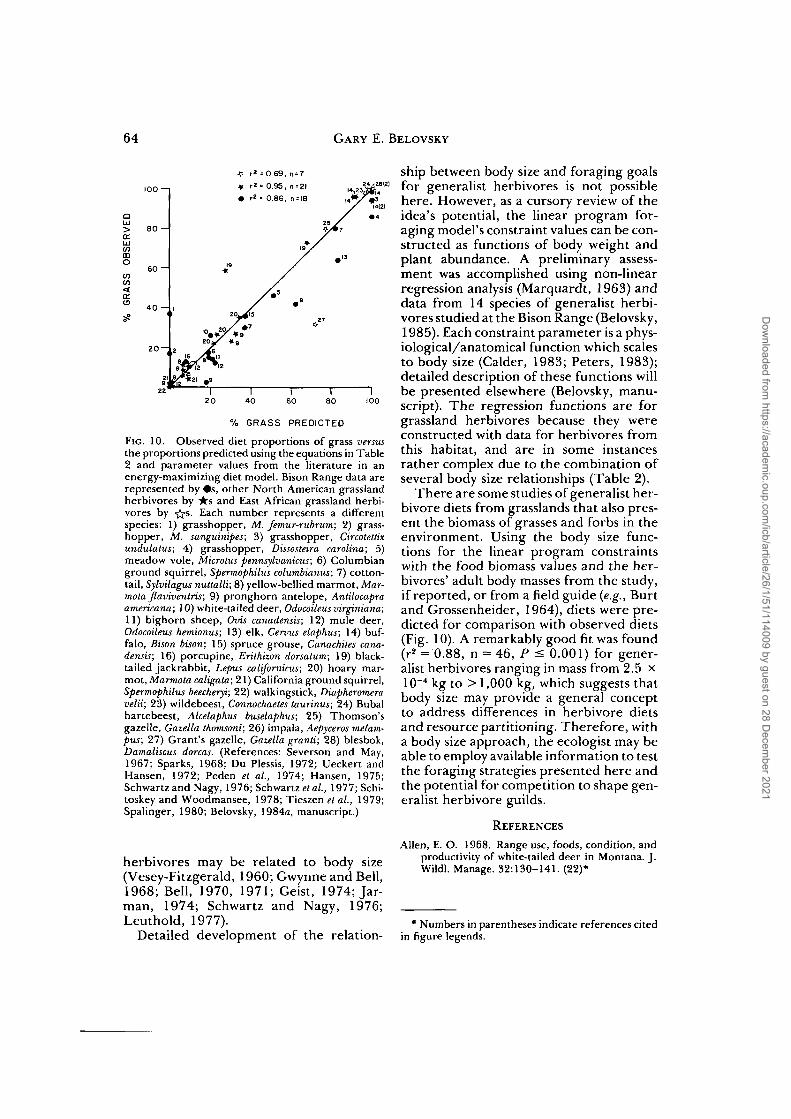
FIG. 10. Observed diet proportions of grass versusthe proportions predicted using the equations in Table2 and parameter values from the literature in anenergy-maximizing diet model. Bison Range data arerepresented by #s, other North American grasslandherbivores by its and East African grassland herbi-vores by -j -s. Each number represents a differentspecies: 1) grasshopper, M. femur-rubrum; 2) grass-hopper, M. sanguinipes; 3) grasshopper, Circotettixundulatus; 4) grasshopper, Dissosteira Carolina; 5)meadow vole, Microtus pennsylvanicus; 6) Columbianground squirrel, Spermophilus columbianus; 7) cotton-tail, Sylvilagus nuttalli; 8) yellow-bellied marmot, Mar-mota flaviventris; 9) pronghorn antelope, Antilocapraamericana; 10) white-tailed deer, Odocoileus virginiana;11) bighorn sheep, Ovis canadensis; 12) mule deer,Odocoileus hemionus; 13) elk, Cervus elaphus; 14) buf-falo, Bison bison; 15) spruce grouse, Canachites cana-densis; 16) porcupine, Erithizon dorsatum; 19) black-tailed jackrabbit, Lepus californicus; 20) hoary mar-mot, Marmota caligata; 21) California ground squirrel,Spermophilus beecheryi; 22) walkingstick, Diapheromeravelii; 23) wildebeest, Connochaeles taurinus; 24) Bubalhartebeest, Alcelaphus buselaphus; 25) Thomson'sgazelle, Gazella thomsoni; 26) impala, Aepyceros melam-pus; 27) Grant's gazelle, Gazella granti; 28) blesbok,Damaliscus dorcas. (References: Severson and May,1967; Sparks, 1968; Du Plessis, 1972; Ueckert andHansen, 1972; Peden et al, 1974; Hansen, 1975;Schwartz and Nagy, 1976; Schwartz et al, 1977; Schi-toskey and Woodmansee, 1978; Tieszen et al, 1979;Spalinger, 1980; Belovsky, 1984a, manuscript.)
herbivores may be related to body size(Vesey-Fitzgerald, 1960; Gwynne and Bell,1968; Bell, 1970, 1971; Geist, 1974; Jar-man, 1974; Schwartz and Nagy, 1976;Leuthold, 1977).
Detailed development of the relation-
ship between body size and foraging goalsfor generalist herbivores is not possiblehere. However, as a cursory review of theidea's potential, the linear program for-aging model's constraint values can be con-structed as functions of body weight andplant abundance. A preliminary assess-ment was accomplished using non-linearregression analysis (Marquardt, 1963) anddata from 14 species of generalist herbi-vores studied at the Bison Range (Belovsky,1985). Each constraint parameter is a phys-iological/anatomical function which scalesto body size (Calder, 1983; Peters, 1983);detailed description of these functions willbe presented elsewhere (Belovsky, manu-script). The regression functions are forgrassland herbivores because they wereconstructed with data for herbivores fromthis habitat, and are in some instancesrather complex due to the combination ofseveral body size relationships (Table 2).
There are some studies of generalist her-bivore diets from grasslands that also pres-ent the biomass of grasses and forbs in theenvironment. Using the body size func-tions for the linear program constraintswith the food biomass values and the her-bivores' adult body masses from the study,if reported, or from a field guide (e.g., Burtand Grossenheider, 1964), diets were pre-dicted for comparison with observed diets(Fig. 10). A remarkably good fit was found(r2 = 0.88, n = 46, P < 0.001) for gener-alist herbivores ranging in mass from 2.5 x10"4 kg to > 1,000 kg, which suggests thatbody size may provide a general conceptto address differences in herbivore dietsand resource partitioning. Therefore, witha body size approach, the ecologist may beable to employ available information to testthe foraging strategies presented here andthe potential for competition to shape gen-eralist herbivore guilds.
REFERENCES
Allen, E. O. 1968. Range use, foods, condition, andproductivity of white-tailed deer in Montana. J.Wildl. Manage. 32:130-141. (22)*
* Numbers in parentheses indicate references citedin figure legends.
Dow
nloaded from https://academ
ic.oup.com/icb/article/26/1/51/114009 by guest on 28 D
ecember 2021
GENERALIST HERBIVORE FORAGING 65
Anthony, R. G. 1976. Influence of drought on dietsand numbers of desert deer. J. Wildl. Manage.40:140-144. (23)
Baile, C. A. and J. M. Forbes. 1974. Control of feedintake and regulation of energy balance in rumi-nants. Physiol. Rev. 54:160-214.
Bannikov, A. G. 1967. Moose in the USSR and itsexploitation. (VIII Int. Congr. Game Biol., Hel-sinki.) Finnish Game Research 30:273-276. (0)
Becker, B. W. 1972. Competition between prong-horn and cattle. Biennial Antelope States Work-shop 5:244-248. (24)
Bell, R. H. V. 1970. The use of the herb layer bygrazing ungulates in the Serengeti. In A. Watson(ed.), Animal populations in relation to their foodresources, pp. 111-123. Blackwell, Oxford. (25)
Bell, R. H. V. 1971. A grazing ecosystem in the Ser-engeti. Sci. Amer. 225:86-93.
Belovsky, G. E. 1978. Diet optimization in a gener-alist herbivore: The moose. Theor. Pop. Biol. 14:105-134.
Belovsky, G. E. 1981. Food plant selection by a gen-eralist herbivore: The moose. Ecology 62:1020-1030.
Belovsky, G. E. 1984a. Herbivore optimal foraging:A comparative test of three models. Amer. Natur.124:97-115.
Belovsky, G. E. 1984i. Snowshoe hare optimal for-aging and its implications for population dynam-ics. Theor. Pop. Biol. 25:235-264.
Belovsky, G. E. 1984c. Summer diet optimization bybeaver. Amer. Midi. Nat. 111:209-222.
Belovsky, G. E. 1984rf. Moose and snowshoe harecompetition and a mechanistic explanation fromforaging theory. Oecologia 61:150-159. (26)
Belovsky, G. E. 1985. Optimal foraging and com-munity structure: Implications for a guild of gen-eralist grassland herbivores. Oecologia. (In press)
Belovsky, G. E. and J. B. Slade. 1985. Time budgetsof grassland herbivores: Body size similarities.Oecologia. (In press)
Berwick, S. 1976. The Gir Forest: An endangeredecosystem. Amer. Sci. 64:28-39. (1)
Blood, D. A. 1966. Range relationships of elk andcattle in Riding Mountain National Park, Mani-toba. Wildl. Manage. Bull. 1(19). Ottawa: Can.Wildl. Serv. (27)
Bookhout, T. A. 1965. Feeding coactions betweensnowshoe hares and white-tailed deer in northernMichigan. Trans. N. Amer. Wildl. Conf. and Nat.Res. 30:321-335. (2)
Bourliere, F. 1963. Observations on the ecology ofsome large African mammals. In F. C. Howelland F. Bourliere (eds.), African ecology and humanevolution, pp. 43-54. Aldine Publ. Co., Chicago.(3)
Bourliere, F. and M. Hadley. 1970. The ecology oftropical savannas. Ann. Rev. Ecol. Syst. 1:125-152.(4)
Bray, J. R. and L. A. Dudkiewicz. 1963. The com-position, biomass and productivity of two Populusforests. Bull. Torrey Bot. Club 90:298-308.
Brown, J. H. 1981. Twodecadesof homage to SantaRosalia: Toward a general theory of diversity.Amer. Zool. 21:877-888.
Bryant, F. C , M. M. Kothmann, and L. B. Merrill.1979. Diets of sheep, angora goats, Spanish goatsand white-tailed deer under excellent range con-ditions. J. Range Manage. 32:412-417. (29)
Burt, W. H. 1957. Mammals of the Great Lakes region.University of Michigan Press, Ann Arbor, Mich-igan. (5)
Burt, W. H. and R. P. Grossenheider. 1964. Afieldguide to the mammals. Houghton Mifflin Company,Boston. (6)
Calder, W. A., III. 1983. Ecological scaling: Mam-mals and birds. Ann. Rev. Ecol. Syst. 14:213-230.
Caraco, T. 1980. On foraging time allocation in astochastic environment. Ecology 61:119-128.
Casebeer, R. L. and G. G. Ross. 1970. Food habitsof wildebeest, zebra, hartebeest and cattle inKenya Masailand. E. Afr. Wildl. J. 8:25-36. (30)
Caughley, G. 1970. Eruption of ungulate popula-tions, with emphasis on Himalayan Thar in NewZealand. Ecology 51:53-71.
Caughley, G. andj . H. Lawton. 1981. Plant-herbi-vore systems. In R. May (ed.), Theoretical ecology:Principles and applications, pp. 132—166. SinauerAssoc, Inc., Sunderland, Massachusetts.
Cederlund, G., H. Ljungqvist, G. Markgren, and F.Stalfelt. 1980. Foods of moose and roe-deer atGrimso in Central Sweden—Results of rumencontent analyses. Viltrevy 11:169-247. (31)
Chew, R. M. 1974. Consumers as regulators of eco-systems: An alternative to energetics. OhioJ. Sci.71:359-369.
Cliff, E. P. 1939. Relationship between elk and muledeer in the Blue Mountains of Oregon. Trans.N. Amer. Wildl. Conf. 4:560-569. (32)
Collins, W.B. and P. J.Urness. 1983. Feedingbehav-ior and habitat selection of mule deer and elk onnorthern Utah summer range. J. Wildl. Manage.47:646-663. (33)
Constan, K. J. 1972. Winter foods and range use ofthree species of ungulates. J. Wildl. Manage. 36:1068-1076. (34)
Cowan, I. McT. 1947. Range competition betweenmule deer, bighorn sheep, and elk in Jasper Park,Alberta. Trans. N. Amer. Wildl. Conf. 12:223-227. (35)
Currie, P. O., D. W. Reichert, J. C. Malechek, andO. C. Wallmo. 1977. Forage selection compar-isons for mule deer and cattle under managedPonderosa pine. J. Range Manage. 30:352-356.(36)
Dailey, T. V. 1980. Diets of tame mountain goatsand bighorn sheep in Colorado. Proc. BiennialSymp. Northern Wild Sheep and Goat Council,p. 382. (37)
DeNio, R. M. 1938. Elk and deer foods and feedinghabits. Trans. N. Amer. Wildl. Conf. 3:421-427.(38)
Dodds, D.G. 1960. Food competition and range rela-tionships of moose and snowshoe hare in New-foundland. J. Wildl. Manage. 24:52-60. (39)
Dorn, R. D. 1970. Moose and cattle food habits insouthwest Montana. J. Wildl. Manage. 34:559—564. (40)
Dunbar, R. I. M. 1978. Competition and niche sep-
Dow
nloaded from https://academ
ic.oup.com/icb/article/26/1/51/114009 by guest on 28 D
ecember 2021
66 GARY E. BELOVSKY
aration in a high altitude herbivore communityin Ethiopia. E. Afr. Wildl. J. 16:183-199. (41)
DuPlessis.S.S. 1972. Ecology of blesbok with specialreference to productivity. Wildl. Monogr. No.30.
Dusek, G. L. 1975. Range relations of mule deer andcattle in prairie habitat. J. Wildl. Manage. 39:605-616. (42)
Edwards, J. 1983. Diet shifts in moose due to pred-ator avoidance. Oecologia 60:185—189.
Egorov, O. V. 1967. Wild Ungulates of Yakutia.Izdatel'stvo "Nauka," Moskva. (M. Fleischman[translated from Russian]; O. Theodor [ed.]).Israel Program for Scientific Translations, Jeru-salem. (7)
Eisenberg.J. F. and G. M. McKay. 1974. Comparisonof ungulate adaptations in the New World andOld World tropical forests with special referenceto Ceylon and the rainforests of Central America.IUCN Publ. New Series, No. 24:585-602. (8)
Feeny, P. 1976. Plant apparency and chemicaldefense. Recent Advances in Phytochemistry 10:1-40.
Field, C. R. 1972. The food habits of wild ungulatesin Uganda by analyses of stomach contents. E.Afr. Wildl. J. 10:17-42. (43)
Field, C. R. 1975. Climate and the food habits ofungulates on Galana Ranch. E. Afr. Wildl. J. 13:203-220. (44)
Fleharty, E. D. and L. E. Olson. 1969. Summer foodhabits of Microtus ochrogaster and Sigmodon hispi-dus. J. Mamm. 50:475-486. (45)
Free, J. C, R. M. Hansen, and P. L. Sims. 1970.Estimating dryweights of foodplants in feces ofherbivores. J. Range Manage. 23:300-302. (46)
Freeland, W. J. and D. H. Janzen. 1974. Strategiesin herbivory by mammals: The role of plant sec-ondary compounds. Amer. Natur. 108:269-289.
French, N. R., R. K. Steinhorst, and D. M. Swift.1979. Grassland biomass trophic pyramids. In N.R. French (ed.), Perspectives in grassland ecology,pp. 59-87. Springer-Verlag, New York.
Fretwell, S. D. 1977. The regulation of plant com-munities by the food chains exploiting them. Per-spectives in Biology and Medicine 20:169-185.
Garg, R. K. and L. N. Vyas. 1975. Litter productionin deciduous forest near Udaipur (South Raja-sthan), India. /tiF.B. Golley and E. Medina (eds.),Tropical ecological systems: Trends in terrestrial andaquatic research, pp. 131 — 135. Springer-Verlag,New York.
Gautier-Hion, A., L. H. Emmons, and G. Dubost.1980. A comparison of the diets of three majorgroups of primary consumers of Gabon (pri-mates, squirrels and ruminants). Oecologia 45:182-189. (47)
Geist, V. 1974. On the relationship of social evolu-tion and ecology in ungulates. Amer. Zool. 14:205-220.
Gilbert, L. E. and P. H. Raven, (eds.) 1975. Coevo-lution of animals and plants. (Symp. V, FirstInternatl. Cong, of Systematic and EvolutionaryBiology, Boulder, CO, 1973.) University of TexasPress, Austin.
Gordon, F. A. 1968. Range relationships of elk and
cattle on elk winter range, Crow Creek, Montana.Job Compl. Rep., Proj. W-73-R-12, 13, 14, andW-98-R-R and 9. Montana Fish and Game Dep.,Helena. (48)
Gwynne, M. D. and R. H. V. Bell. 1968. Selectionof vegetation components by grazing ungulatesin the Serengeti National Park. Nature 220:390-393. (49)
Hairston, N. G., F. E. Smith, and L. B. Slobodkin.1960. Community structure, population control,and competition. Amer. Natur. 94:421-425.
Hanley.T. A. and K. A. Hanley. 1982. Food resourcepartitioning by sympatric ungulates on GreatBasin rangeland. J. Range Manage. 35:152-158.(50)
Hansen, R. M. 1975. Foods of the hoary marmot onKenai Peninsula, Alaska. Amer. Midi. Nat. 94:348-353.
Hansen, R. M. and R. C. Clark. 1977. Foods of elkand other ungulates at low elevations in north-western Colorado. J. Wildl. Manage. 41:76-80.(51)
Hansen, R. M. and I. K. Gold. 1977. Blacktail prairiedogs, desert cottontails and cattle trophic rela-tions on shortgrass range. J. Range Manage. 30:210-213. (52)
Hansen, R.M. and P. S.Martin. 1973. Ungulate dietsin the lower Grand Canyon. J. Range Manage.26:380-381. (53)
Hansen, R. M. and L. D. Reid. 1975. Diet overlapof deer, elk, and cattle in southern Colorado. J.Range Manage. 28:43-47. (54)
Hansen, R. M. and D. N. Ueckert. 1970. Dietarysimilarity of some primary consumers. Ecology51:640-648.(55)
Hansson, L. 1979. Food as a limiting factor for smallrodent numbers: Tests of two hypotheses. Oeco-logia 37:297-314.
Heughley, L. G. 1968. Moose-caribou forage com-petition. In P. T. Hay, G. M. Van Dyne, and R.M. Hansen (eds.), Competition among herbivores, pp.33-37. Range Sci. Dept., Colorado State Uni-versity, Fort Collins. (56)
Hilborn, R. and A. R. E. Sinclair. 1979. A simulationof the wildebeest population, other ungulates,and their predators. In A. R. E. Sinclair and M.Norton-Griffiths (eds.), Serengeti: Dynamics of anecosystem, pp. 287-309. The University of Chi-cago Press, Chicago.
Hobbs, N. T., D. L. Baker, and R. B. Gill. 1983.Comparative nutritional ecology of montaneungulates during winter. J. Wildl. Manage. 47:1-16. (57)
Holling.C.S. 1965. The functional response of pred-ators to prey density and its role in mimicry andpopulation regulation. Mem. Entomol. Soc. Can-ada 45:1-60.
Houston, D. B. 1982. The northern Yellowstone elk:Ecology and management. Macmillan Publishing Co.,Inc., New York. (58)
Howes, S. W. 1977. Evaluation of elk-cattle com-petition on Colockum Creek watershed, Wash-ington. Master's Thesis, Washington State Univ.,Pullman. (59)
Hubbard, R. E. and R. M. Hansen. 1976. Diets of
Dow
nloaded from https://academ
ic.oup.com/icb/article/26/1/51/114009 by guest on 28 D
ecember 2021
GENERALIST HERBIVORE FORAGING 67
wild horses, cattle, and mule deer in the PiceanceBasin, Colorado. J. Range Manage. 29:389-392.(60)
Hutchinson, G. E. 1959. Homage to Santa Rosaliaor why are there so many kinds of animals? Amer.Natur. 93:145-159.
Irwin, L. L. 1975. Deer-moose relationships on aburn in northeastern Minnesota. J. Wildl. Man-age. 39:653-662.(61)
Jarman, P. J. 1971. Diets of large mammals in thewoodlands around Lake Kariba, Rhodesia. Oeco-logia 8:157-178. (9)
Jarman, P. J. 1974. The social organization of ante-lope in relation to their ecology. Behaviour 48:215-267.
Johnson, M. K. 1979. Foods of primary consumerson cold desert shrub-steppe of southcentral Idaho.J. Range Manage. 32:365-368. (62)
Johnson, M. K. and R. M. Hansen. 1979. Foods ofcottontails and woodrats in south-central Idaho.J. Mamm. 60:213-215. (63)
Kahurananga, J. 1981. Population estimates, densi-ties and biomass of large herbivores in SimanjiroPlains, Northern Tanzania. Afr. J. Ecol. 19:225-238. (10)
Klinge, H., W. A. Rodrigues, E. Brunig, and E. J.Fittkau. 1975. Biomass and structure in a centralAmazonian rain forest. In F. B. Golley and E.Medina (eds.), Tropical ecological systems: Trends interrestrial and aquatic research, pp . 115-122 .Springer-Verlag, New York.
Kruuk, H. 1972. The spotted hyena: A study of predationand social behavior. The University of ChicagoPress, Chicago. (11)
Kutikek, M. J. 1974. The density and biomass oflarge mammals in Lake Nakuru National Park.E. Afr. Wildl. J. 12:201-212. (12)
Lamprey, H. F. 1963. Ecological separation of thelarge mammal species in the Tarangire GameReserve, Tanganyika. E. Afr. Wildl. J. 1:63-92.(13)
Lamprey, H. F. 1964. Estimation of the large mam-mal densities, biomass and energy exchange inthe Tarangire Game Reserve and the MasaiSteppe in Tanganyika. E. Afr. Wildl. J. 2:1-46.(64)
Lauer.J. L. andj. M. Peek. 1976. Big game-livestockrelationships on the bighorn sheep winter range,East Fork Salmon River, Idaho. Forest, Wildlifeand Range Experiment Station Bull. No. 12, Univ.of Idaho. (65)
Leuthold, W. 1977. African ungulates: A comparativereview of their ethology and behavioral ecology.Springer-Verlag, Berlin.
Levins, R. 1968. Evolution in changing environments:Some theoretical explorations. Princeton UniversityPress, Princeton, New Jersey.
Lewin, R. 1983a. Santa Rosalia was a goat. Science221:636-639.
Lewin, R. 19836. Predators and hurricanes changeecology. Science 221:737-740.
Lock.J. M. 1972. Theeffectsof hippopotamus graz-ing on grasslands. J. Ecol. 60:445-467.
MacCracken, J. G. and R. M. Hansen. 1981. Dietsof domestic sheep and other large herbivores in
southcentral Colorado. J. Range Manage. 34:242-243. (66)
Mackie, R. J. 1970. Range ecology and relations ofmule deer, elk, and cattle in the Missouri RiverBreaks, Montana. Wildl. Monogr. No. 20. 79 pp.(67)
Malaisse, F., R. Freson, G. Goffinet, and M. Malaisse-Mousset. 1975. Litter fall and litter breakdownin Miombo. In F. B. Golley and E. Medina (eds.),Tropical ecological systems: Trends in terrestrial andaquatic research, pp. 137-152. Springer-Verlag,New York.
Marquardt, D. W. 1963. An algorithm for least-squares estimation of non-linear parameters. J.Soc. Ind. App. Math. 11:431-441.
Martinka, C. J. 1968. Habitat relationships of white-tailed and mule deer in northern Montana. J.Wildl. Manage. 32:558-565. (68)
Mattson, W.J.and N. D. Addy. 1975. Phytophagousinsects as regulators of forest primary produc-tion. Science 190:515-522.
McBee, R. H. 1971. Significance of intestinal micro-flora in herbivory. Ann. Rev. Ecol. Syst. 2:165-176.
McCollough, S. A., A. Y. Cooperrider, and J. A. Bai-ley. 1980. Impact of cattle grazing on bighornsheep habitat at Trickle Mountain, Colorado.Proc. Biennial Symp. Northern Wild Sheep andGoat Council, pp. 42-58. (69)
McCullough, D. R. 1970. Secondary production ofbirds and mammals. In D. E. Reichle (ed.), Anal-ysis of temperate forest ecosystems, pp. 107-130.Springer-Verlag, Berlin. (14)
McCullough, Y. B. 1980. Niche separation of sevenNorth American ungulates on the National BisonRange, Montana. Ph.D. Diss., University of Mich-igan, Ann Arbor. (70)
McMahan, C. A. 1964. Comparative food habits ofdeer and three classes of livestock. J. Wildl. Man-age. 28:798-808. (71)
McNaughton, S. J. 1979. Grassland-herbivoredynamics. In A. R. E. Sinclair and M. Norton-Griffiths (eds.), Serengeti: Dynamics of an ecosystem,pp. 46-81. The University of Chicago Press, Chi-cago.
Miller, F.L., R.H.Russell, and A. Gunn. 1977. Pearycaribou and muskoxen on western Queen Eliza-beth Islands, N.W.T., 1972-74. Canad. Wild. Ser.Rep. Series No. 40. (72)
Mitchell, B. L.,J. B. Shenton, andj. C. M. Uys. 1965.Predation on large mammals in the KafueNational Park, Zambia. Zool. Afr. 1:297-318.(15)
Moen, A. N. 1973. Wildlife ecology: An analyticalapproach. W. H. Freeman and Co., San Francisco.
Morris, M. S. andj . E. Schwartz. 1957. Mule deerand elk food habits on the National Bison Range.J. Wildl. Manage. 21:189-193. (73)
Moss, R. 1974. Winter diets, gut lengths, and inter-specific competition in Alaskan Ptarmigan. Auk91:737-746. (74)
Mulkern,G. B., K. P. Pruess, H. Knutson, A. F. Hagen,J. B. Campbell, andj . D. Lambley. 1969. Foodhabits and preferences of grassland grasshoppers
Dow
nloaded from https://academ
ic.oup.com/icb/article/26/1/51/114009 by guest on 28 D
ecember 2021
68 GARY E. BELOVSKY
of the north central great plains. North DakotaAgr. Exp. Sta. Bull. No. 481. (75)
Nelson, J. R. and D. G. Burnell. 1975. Elk-cattlecompetition in central Washington. In Range mul-tiple use management. University of Idaho, Mos-cow. (76)
Newsome, A. E. 1975. An ecological comparison ofthe two arid-zone kangaroos of Australia, andtheir anomalous prosperity since the introduc-tion of ruminant stock to their environment.Quart. Rev. Biol. 50: 389-424. (77)
Norton-Griffiths, M. 1979. The influence of grazing,browsing, and fire on the vegetation dynamics ofthe Serengeti./n A. R. E. Sinclair and M. Norton-Griffiths (eds.), Serengeti: Dynamics of an ecosystem,pp. 310-352. The University of Chicago Press,Chicago.
Odum, E. P. 1969. The strategy of ecosystem devel-opment. Science 164:262-270.
Olsen, F. W. and R. M. Hansen. 1977. Food relationsof wild free-roaming horses to livestock and biggame, Red Desert, Wyoming. J. Range Manage.30:17-20. (78)
Ovington.J. D. 1962. Quantitative ecology and thewoodland ecosystem concept. Advances in Eco-logical Research 1:103-192.
Owen-Smith, N. and P. Novellie. 1982. Whatshoulda clever ungulate eat? Amer. Natur. 119:151-178.
Patten, B. C. 1982. Environs: Relativistic elementaryparticles for ecology. Amer. Natur. 119:179-219.
Peden, D. G., G. M. Van Dyne, R. W. Rice, and R.M. Hansen. 1974. The trophic ecology of Bisonbison L. on shortgrass plains. J. Appl. Ecol. 11:489-497.
Peters, R. H. 1983. The ecological implications of bodysize. Cambridge University Press, Cambridge.
Pickford, G. D. and E. H. Reid. 1943. Competitionof elk and domestic livestock for summer rangeforage. J. Wildl. Manage. 7:328-332. (79)
Pienaar, U. de V. 1969. Predator-prey relationshipsamongst the larger mammals of the KrugerNational Park. Koedoe 12:108-176. (16)
Pyke, G. H., H. R. Pulliam, and E. L. Charnov. 1977.Optimal foraging: A selective review of theoryand tests. Quart. Rev. Biol. 52:137-154.
Rhoades, D. F. and R. G. Cates. 1976. Toward ageneral theory of plant antiherbivore chemistry.Recent Advances in Phytochemistry 10:168-213.
Ritchie, M. E. 1983. Site variation in Columbianground squirrel foraging and its impact on soci-ality. Master's Thesis, University of Michigan.
Rosenthal, G. A. and D. H. Janzen. 1979. Herbivores:Their interaction with secondary plant metabolites.Academic Press, New York.
Schaller, G. B. 1967. The deer and the tiger. The Uni-versity of Chicago Press, Chicago. (17)
Schitoskey, F., Jr. and S. R. Woodmansee. 1978.Energy requirements and diet of the Californiaground squirrel. J. Wildl. Manage. 42:373-382.
Schoener, T. W. 1971. Theory of feeding strategies.Ann. Rev. Ecol. Syst. 2:369-403.
Schoener, T. W. 1974. Competition and the formof habitat shift. Theor. Pop. Biol. 6:265-307.
Schwartz, C. C. and J. G. Nagy. 1976. Pronghorndiets relative to forage availability in northeast-ern Colorado. J. Wildl. Manage. 40:469-478. (80)
Schwartz, C. C, J. G. Nagy, and R. W. Price. 1977.Pronghorn dietary quality relative to forageavailability and other ruminants in Colorado. J.Wildl. Manage. 41:161-168.
Scott,J. A., N. R. French, andj. W. Leetham. 1979.Patterns of consumption in grasslands. In N. R.French (ed.), Perspectives in grassland ecology, pp.89-105. Springer-Verlag, New York.
Seegmiller.R.F.andR. D.Ohmart. 1981. Ecologicalrelationships of feral burros and desert bighornsheep. Wildl. Monogr. No. 78. (81)
Seiskari, P. 1962. On the winter ecology of the cap-ercaillie, Tetrao urogallus, and the black grouse,Lyrurus tetrix, in Finland. Papers on GameResearch No. 22. (82)
Severson, K. E. and M. May. 1967. Food preferencesof antelope and domestic sheep in Wyoming'sRed Desert. J. Range Manage. 19:21-25. (83)
Severson, K. E., M. May, and W. Hepworth. 1968.Food preferences, carrying capacities, and foragecompetition between antelope and domestic sheepin Wyoming's Red Desert. Univ. Wyoming Agric.Exp. Sta. Sci. Monogr. No. 70. (84)
Simberloff, D. 1983. Competition theory, hypothe-sis-testing, and other community ecological buzz-words. Amer. Natur. 122:626-635.
Sinclair, A. R. E. 1975. The resource limitation oftrophic levels in tropical grassland ecosystems. J.Anim. Ecol. 44:497-520.
Sinclair, A. R. E. 1979. Dynamics of the Serengetiecosystem: Process and pattern. In A. R. E. Sin-clair and M. Norton-Griffiths (eds.), Serengeti:Dynamics of an ecosystem, pp. 1—30. The Universityof Chicago Press, Chicago.
Slobodkin, L. B., F. E. Smith, and N. G. Hairston.1967. Regulation in terrestrial ecosystems, andthe implied balance of nature. Amer. Natur. 101:109-124.
Smith, A. D. 1965. Determining common use graz-ing capacities by application of the key speciesconcept. J. Range Manage. 18:196-201. (85)
Smith, J. G. and O.Julander. 1953. Deer and sheepcompetition in Utah. J. Wildl. manage. 17:101-112.(86)
Spalinger, D. E. 1980. Mule deer habitat evaluationbased upon nutritional modeling. Ph.D. Diss.University of Nevada, Reno.
Sparks, D. R. 1968. Diet of black-tailed jackrabbitson sandhill rangeland in Colorado. J. Range Man-age. 21:203-208.
Stevens, D. R. 1966. Range relationships of elk andlivestock, Crow Creek drainage, Montana. J.Wildl. Manage. 30:349-363. (87)
Stevens, D. R. 1974. Rocky Mountain elk-Shirasmoose range relationships. Naturaliste Canad.101:505-516. (88)
Stewart, D. R. M. and J. Stewart. 1970. Food pref-erence data by faecal analysis for African plainsungulates. Zool. Afr. 5:115-129. (89)
Stewart, D .R. M. and J. Stewart. 1971. Comparativefood preferences of five East African ungulates
Dow
nloaded from https://academ
ic.oup.com/icb/article/26/1/51/114009 by guest on 28 D
ecember 2021
GENERALIST HERBIVORE FORAGING 69
at different seasons. In E. Duffey and A. S. Watt(eds.), The scientific management of animal and plantcommunities for conservation, pp. 351-365. Black-well Scientific Publ., Oxford. (90)
Stewart, D. R. M. and D. R. P. Zaphiro. 1963. Bio-mass and density of wild herbivores in differentEast African habitats. Mammalia 27:483-496. (18)
Strong, D. R. Jr. 1983. Natural variability and themanifold mechanisms of ecological communities.Amer. Natur. 122:636-660.
Strong, D. R., Jr., L. A. Szyska, and D. S. Simberloff.1979. Tests of community-wide character dis-placement against null hypotheses. Evolution 33:897-913.
Strum, J. E. 1972. Introduction to linear programming.Holden-Day, San Francisco.
Taber, R. D. and R. F. Dasmann. 1958. The black-tailed deer of the chaparral. Calif. Fish, and Game,Game Bull. No. 8. (19)
Talbot, L. M. and M. H. Talbot. 1962. Food pref-erences of some East African wild ungulates. E.Afr. Agric. For. J. 27:131-138. (91)
Telfer, E. S. 1967. Comparison of a deer yard anda moose yard in Nova Scotia. Canad. J. Zool. 45:485-490. (92)
Telfer, E. S. 1972. Forage yield and browse utiliza-tion on logged areas in New Brunswick. Canad.J. Forest Res. 2:346-350. (93)
Thetford, F. C , R. D. Pieper, and A. B. Nelson.1971. Botanical and chemical composition of cat-tle and sheep diets on pinyon-juniper grasslandrange. J. Range Manage. 24:425-430. (94)
Tieszen, L. L., D. Hein, and S. A. Qvortrup, J. H.Troughton, and S. K. Imbamba. 1979. Use of6"C values to determine vegetation selectivity inEast African herbivores. Oecologia 37:351-359.(95)
Tieszen, L. L. and S. K. Imbamba. 1980. Photosyn-thetic systems, carbon isotope discrimination andherbivore selectivity in Kenya. Afr. J. Ecol. 18:237-242. (96)
Ueckert, D. N. 1968. Seasonal dry weight compo-sition in grasshopper diets on Colorado herbland.Entomol. Soc. Amer., Ann. 61:1539-1544. (97)
Ueckert, D. N. and R. M. Hansen. 1972. Diet ofwalkingsticks on sandhill rangeland in Colorado.J. Range Manage. 25:111-113.
Ueckert, D. N., R. M. Hansen, and C. Terwilliger,Jr. 1972. Influence of plant frequency and cer-tain morphological variations on diets of range-land grasshoppers. J. Range Manage. 25:61-65.(98)
Vandermeer, J. H. 1972. On the covariance of thecommunity matrix. Ecology 53:187-189.
Van Valen, L. 1973. Pattern and balance of nature.Ecol. Theory 1:31-49.
Vaughan, T. A. 1974. Resource allocation in somesympatric subalpine rodents. J. Mamm. 55:764-795. (99)
Vesey-Fitzgerald, D. F. 1960. Grazing successionamong East African game animals. J. Mamm. 41:161-172. (100)
Walker, J. W., R. M. Hansen, and L. R. Rittenhouse.1981. Diet selection of Hereford, Angus xHereford and Charolais x Hereford cows andcalves. J. Range Manage. 34:243-245. (101)
Watson, R. M. and M. I. M. Turner. 1965. A countof the large mammals of the Manyara NationalPark. E. Afr. Wildl. J. 3:95-98. (20)
Weeden, R. B. 1969. Foods of rock and willow ptar-migan in central Alaska with comments on inter-specific competition. Auk 86:271-281. (102)
Werner, E. E. 1977. Species packing and niche com-plementarity in three sunfishes. Amer. Natur. I l l :553-578.
Westoby, M. 1974. An analysis of diet selection bylarge generalist herbivores. Amer. Natur. 108:290-304.
Westoby, M. 1978. What are the biological bases ofvaried diets? Amer. Natur. 112:627-631.
White, T. C. R. 1976. Weather, food and plagues oflocusts. Oecologia 22:119-134.
White, T. C. R. 1978. The importance of a relativeshortage of food in animal ecology. Oecologia33:71-86.
Whittaker, R. H. 1970. Communities and ecosystems.The Macmillan Company, Collier-Macmillan Ltd.,London.
Wilkinson, P. F., C. C. Shank, and D. F. Penner. 1976.Muskox-caribou summer range relations onBanks Island, N.W.T. J. Wildl. Manage. 40:151-162. (103)
Willms, W., A. W. Bailey, and A. McLean. 1980.Effect of burning or clipping Agropyron spicatumin the autmn on the spring foraging behaviourof mule deer and cattle. J. Appl. Ecol. 17:69-84.(104)
Willms, W., A. McLean, R. Tucker, and R. Ritcey.1979. Interactions between mule deer and cattleon big sagebrush range in British Columbia. J.Range Manage. 32:299-304. (105)
Wilson, D. E. and S. M. Hirst. 1977. Ecology andfactors limiting roan and sable antelope popula-tions in South Africa. Wildl. Monogr. No. 54.(106)
Wood, T.J. 1974. Competition between arctic haresand moose in Gros Morne National Park, New-foundland. North Amer. Moose Conf. and Work-shop, Duluth, Minnesota 10:215-237. (107)
Yoaciel, S. M. 1981. Changes in the populations oflarge herbivores and in the vegetation commu-nity in Mweya Peninsula, Rwenzori National Park,Uganda. Afr. J. Ecol. 19:303-312. (21)
Zimmerman, E. G. 1965. A comparison of habitatand food of two species of Microtus. J. Mamm. 46:605-612.(108)
Dow
nloaded from https://academ
ic.oup.com/icb/article/26/1/51/114009 by guest on 28 D
ecember 2021

Dow
nloaded from https://academ
ic.oup.com/icb/article/26/1/51/114009 by guest on 28 D
ecember 2021


