Embed Size (px)
Citation preview

©FUNPEC-RP www.funpecrp.com.brGenetics and Molecular Research 11 (2): 1217-1229 (2012)
Genetic diversity and assessment of 23 microsatellite markers for parentage testing of Santa Inês hair sheep in Brazil
C.A. Souza1, S.R. Paiva1, C.M. McManus2,3, H.C. Azevedo4,A.S. Mariante1 and D. Grattapaglia1
1EMBRAPA Recursos Genéticos e Biotecnologia, Brasília, DF, Brasil2Departamento de Zootecnia, Universidade Federal do Rio Grande do Sul, Porto Alegre, RS, Brasil3Universidade de Brasília, Campus Darcy Ribeiro, Brasília, DF, Brasil4EMBRAPA Tabuleiros Costeiros, Aracaju, SE, Brasil
Corresponding author: S.R. Paiva E-mail: [email protected]
Genet. Mol. Res. 11 (2): 1217-1229 (2012)Received September 26, 2011Accepted November 28, 2011Published May 8, 2012DOI http://dx.doi.org/10.4238/2012.May.8.4
ABSTRACT. Santa Inês is the most common hair sheep breed in Brazil and probably has the highest genetic diversity among sheep breeds in this country. Successful breeding programs for Brazilian sheep breeds are not common for various reasons, including a lack of control of parentage in
distributed across the central-western and north-eastern regions of Brazil. The marker set included seven microsatellites used in the 2011 International Society for Animal Genetics sheep genotyping comparison tests and all eight microsatellites currently approved by the Brazilian Agricultural
The microsatellites had an average of 10 alleles and a mean expected heterozygosity of 0.745. Combined paternity exclusion probabilities when no parent or one parent was known were >99.99%. A small proportion

1218
©FUNPEC-RP www.funpecrp.com.brGenetics and Molecular Research 11 (2): 1217-1229 (2012)
C.A. Souza et al.
(5.8%) of the existing genetic variation was found to be among the Santa
found that the marker panel proposed by the Agricultural Ministry, although generally useful, should be enhanced by including more markers for improved exclusionary power in parentage testing. This database provides a useful tool for parentage testing of this major Brazilian breed, contributing to improved management and breeding of existing herds.
Key words: Animal Genetic Resources;; Conservation and breeding programs;; Genetic management;; Molecular markers;; Genetic diversity
INTRODUCTION
DNA-based animal parentage testing has become increasingly accessible and is now
information on parent-offspring trios may still be unavailable or erratic, especially in low tech-nology, extensive breeding operations such as those found to be common practice with sheep
the use of multiple-sire natural mating, so that only maternal control is carried out. Parentage inaccuracies may also occur in controlled systems due to human error when natural cross fos-
Under all such scenarios, DNA-based paternity testing provides a powerful tool to carry out
-
and was estimated to be over 35% in Gyr cattle breeding in Brazil (Baron et al., 2002). The certification of pedigrees using DNA markers is a viable option. Microsatel-
lite markers are widely used in paternity testing because of their multiallelic nature, wide genome coverage and easy detection. Microsatellites are typically codominant with ex-
closely related individuals. Due to the specificity of PCR assays and their high informa-tion content, they also allow the determination of identity between individuals based on
The Brazilian Ministry of Agriculture, Livestock and Supply (MAPA) issued accredi-
MAF214;; OMHC1;; SPS113;; D5S2) were suggested at the time for sheep and goat genotyping. No ISAG-recommended loci were yet available. These eight markers were chosen based on available information from the literature on microsatellites used for genotyping related spe-cies such as goats (Luikart et al., 1999), the relatively few reports for wool sheep breeds (Diez-Tascon et al., 2000;; Farid et al., 2000;; Arranz et al., 2001;; Stahlberger-Saitbekova et al., 2001;; Tomasco et al., 2002;; Rychlik et al., 2003) and scant genotype data for some Brazilian animals. Currently, however, the majority of Brazilian animals belong to hair breeds, meaning

1219
©FUNPEC-RP www.funpecrp.com.brGenetics and Molecular Research 11 (2): 1217-1229 (2012)
Parentage testing in Santa Inês sheep
that this set of markers may not be the best choice as far as information content for identity and parentage testing. In this study, we assessed the performance of these markers together with some recently ISAG-recommended microsatellites (Glowatzki-Mullis et al., 2007) for
and the highest genetic diversity among all breeds in the country (Paiva et al., 2005). Based on
sampled across the country. Finally, the genetic data were used to propose an enhancement of the presently recommended MAPA marker panel to improve the current sheep genotyping guidelines in Brazil.
MATERIAL AND METHODS
Animals
region. A set of 21 unrelated animals were sampled from the State of Maranhão, 25 from
animals from the EMBRAPA Conservation Nucleus farm in the State of Sergipe, irrespective of relatedness, were also studied. Genomic DNA was extracted and prepared according to a protocol described earlier (Paiva et al., 2005).
Microsatellite genotyping
In the present study, 23 microsatellite markers were used (Table 1). This set included eight of the 13 ISAG-recommended markers for the 2011 comparison test for sheep (ISAG, 2010) and all eight microsatellites proposed by the MAPA (2004). The MAPA-proposed 8-marker panel was compared to subsets of 15, 10, and 8 markers selected based on polymorphism information con-tent (PIC) and probability of identity (PI) from the initial 23-marker set. The forward primer for
were resolved by capillary electrophoresis on an ABI3700 Genetic analyzer (Applied Biosystems). Genotypes were obtained using Gene Scan and Genotyper (Applied Biosystems).
Data analysis
(Raymond and Rousset, 1995). The web-available softwares Cervus 3.0 (Kalinowski et al.,
basic diversity measures, as well as the power of the microsatellite panels for parentage test-ing using all 23 markers and the proposed subsets. Exclusion probability, combined exclusion probability, PI, expected (HE) and observed (HO) heterozygosities, and PIC were estimated.

1220
©FUNPEC-RP www.funpecrp.com.brGenetics and Molecular Research 11 (2): 1217-1229 (2012)
C.A. Souza et al.
The exclusion power (PE) when both parents are available was calculated using the
Locus Alleles Chromosome N HO HE
BM6526 9 26 264 0.633 0.793 0.764 0.422 0.601 0.110 ** 15BM827 8 3 233 0.627 0.662 0.636 0.274 0.462 0.130 NSD5S2*# 9 5 278 0.543 0.815 0.787 0.454 0.630 0.480 ** 8
13 267 0.315 0.613 0.558 0.207 0.366 0.130 **ILSTS05 11 7 268 0.739 0.835 0.812 0.494 0.666 0.110 ** 8ILSTS11 8 9 276 0.710 0.723 0.677 0.310 0.485 0.096 NS 15ILSTS87 14 28 266 0.827 0.860 0.843 0.555 0.716 0.150 NS 8INRA172# 15 14 261 0.636 0.691 0.652 0.290 0.469 0.220 **INRA23# 11 3 265 0.857 0.863 0.846 0.562 0.722 0.040 NS 8INRA35 8 16 271 0.764 0.807 0.78 0.446 0.624 0.057 NS 15INRA63# 12 14 281 0.815 0.830 0.809 0.499 0.669 0.061 NS 8MAF214*# 5 16 275 0.531 0.469 0.397 0.110 0.222 0.320 **MAF65# 9 15 232 0.961 0.824 0.798 0.471 0.645 0.062 ** 8OARAE129*# 8 5 266 0.459 0.660 0.602 0.238 0.400 0.250 **OARCP20 8 21 281 0.584 0.668 0.635 0.271 0.455 0.330 ** 15OARCP49*# 12 17 276 0.877 0.866 0.849 0.567 0.726 0.060 NS 8OARFCB11*# 8 2 254 0.740 0.784 0.750 0.402 0.581 0.076 NS 15OARFCB20# 13 2 283 0.873 0.729 0.700 0.346 0.530 0.087 **OARFCB304*# 16 19 262 0.740 0.786 0.757 0.422 0.599 0.120 NS 15OARHH35 12 4 257 0.732 0.846 0.827 0.527 0.693 0.055 ** 8OMHC1*# 12 20 270 0.752 0.774 0.753 0.417 0.600 0.060 NS 15SPS113*# 9 10 274 0.500 0.566 0.541 0.189 0.369 0.150 NSSRCRSP05 4 21 253 0.609 0.675 0.603 0.232 0.384 0.170 NSAverage 10 - - 0.688 0.745 0.712 - - -
Table 1. Number of alleles per locus, heterozygosity measures, polymorphism information content, probabilities
each panel (8, 15 or complete) in Santa Inês sheep.
sheep and goats. #Markers recommended by the International Society of Animal Genetics (ISAG). N = number of samples;; HO = observed heterozygosity;; HE = expected heterozygosity;; PIC = polymorphism information content;; PE1 and PE2 = cumulative parentage exclusion probability knowing one (PE1) or both (PE2) parents;; PI = probability
panel of 23 of the present study using 8 or 15 top markers for PIC and PI in Santa Ines breed. All markers from the
After calculation of PE for each locus individually, a combined PE over n independent markers was calculated using the following formula: PE = 1 - (1 - P1) (1 - P2) (1 - P3)…(1 - Pn)
and Smouse, 2006), was used to assess genetic differentiation among the Santa Inês popula--
bor-joining clustering and bootstrap using the Dispan software (Ota, 1993).
RESULTS
Considerable variation was observed in the number of alleles across the 23 mi-

1221
©FUNPEC-RP www.funpecrp.com.brGenetics and Molecular Research 11 (2): 1217-1229 (2012)
Parentage testing in Santa Inês sheep
crosatellites, with an average of 10 alleles per locus, ranging from 4 (SRCRSP05) to 16 (OARFCB304)
and OarFCB20, which displayed excess HO (Table 1).Average PIC and HE estimates were respectively 0.712 and 0.745. HO ranged from a
HE ranged from 0.469 (MAF214) to 0.866 (OARCP49). PIC ranged from 0.397 (MAF214) to 0.849 (OARCP49). The mean PIC for MAPA-recommended microsatellites was 0.6795 while the highest PIC was 0.8214 (Table 2). As expected from theory, estimates of probability of identity were highly correlated to PIC values. The cumulative probabilities of paternity exclusion, with none or one parent is known (PE1 and PE2, respectively), were 99.9999 and 99.9989%, respectively, when all 23 markers were used and decreased to 99.708 and 99.799%, respectively, when only the MAPA-recommended
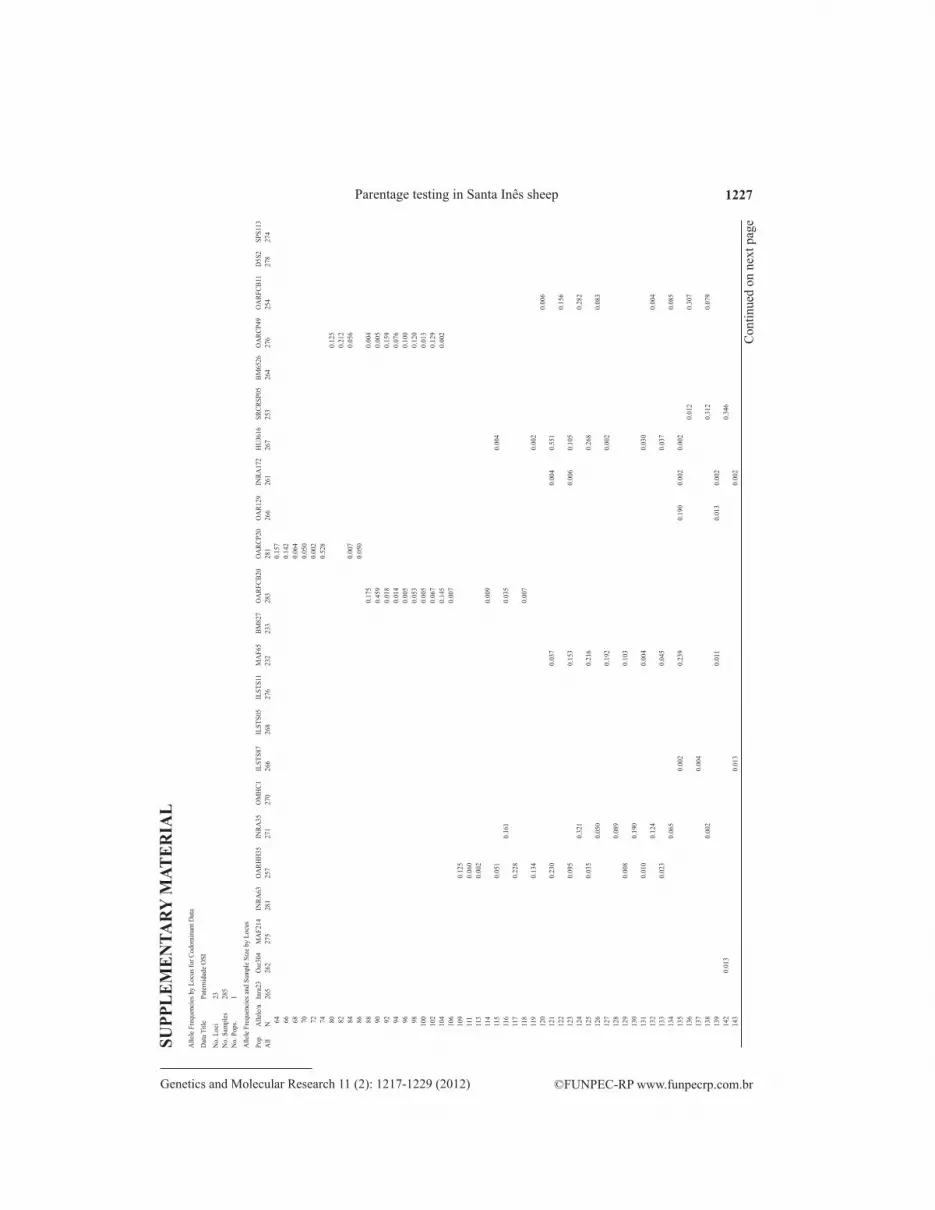
surveyed is provided as Supplementary material.
# Marker set PI PE1 (%) PE2 (%)
All 23 markers 4.2 E-25 99.999 99.99915 with the highest PI value 3.3 E-19 99.992 99.99913 with the highest PI value 2.7 E-17 99.981 99.99910 with the highest PI value 6.4 E-14 99.907 99.999 8 with the highest PI value 1.4 E-11 99.708 99.990 8 proposed by MAPA 1.1 E-8 97.378 99.799
Table 2. Combined estimates of probability of identity and probabilities of exclusion for different microsatellite panels in Santa Inês sheep.
PI = probability of identity;; PE1 and PE2 = combined probability of parentage exclusion knowing one (PE1) or both (PE2) parents;; MAPA = Ministry of Agriculture, Livestock and Supplies.
Examining the diversity between populations (Table 3), the average number of al-leles within each region was lower than the overall mean (6.78), suggesting the occurrence of genetic drift and lower within-region variation. Observed and expected heterozygosities were similar across regions. Estimates of FIS
-ences between the Santa Inês populations corroborating the occurrence of genetic drift.
Flock N NAM HO HE FIS
SE 17 6.53 0.74 0.71 0.045EM 207 9.19 0.72 0.69 0.053*MA 21 6.61 0.79 0.66 0.092CE 25 5.92 0.72 0.71 0.025
Table 3.
Conservation Nucleus;; MA = Maranhão State;; CE = Ceará State. N = Number of samples;; NAM = average number of alleles;; HO = observed heterozygosity, HE = expected heterozygosity;; FIS

1222
©FUNPEC-RP www.funpecrp.com.brGenetics and Molecular Research 11 (2): 1217-1229 (2012)
C.A. Souza et al.
The dendrogram based on genetic distances indicated a closer relationship between -
Figure 1.values above 50%.
DISCUSSION
In 2004, the MAPA issued laboratory accreditation guidelines for animal genotyping services in Brazil. At that time, while microsatellite marker panels were relatively well estab-lished and validated worldwide by ISAG for horse and bovine genotyping, this was not yet the case for goats and sheep. Different markers had been used by different laboratories and no ISAG standard set was available. Nevertheless, the objective of providing initial genotyping guidelines for these animal species was achieved by proposing an eight-marker set based on what the literature provided at the time for wool sheep breeds and on preliminary genotype data obtained for a few animals from local breeds. In this study, we revisited this subject with a
-ber of microsatellite markers for Santa Inês, the most widely raised sheep breed in the country;; 2) to compare some of the most recently ISAG-recommended markers with the marker set
Microsatellite markers
In the Santa Inês populations surveyed, not only all 23 markers were polymorphic (Table 1), but the average number of alleles per marker (10) was considerably higher than that found in sheep populations in Bhutan (Dorji et al., 2010) and Iran (Saberivand et al., 2010), as well as North American and British breeds (Farid et al., 2000). Glowatzki-Mullis et al. (2007) analyzed 10 diverse breeds with a 19-microsatellite multiplex and found an average maximum of 7.79

1223
©FUNPEC-RP www.funpecrp.com.brGenetics and Molecular Research 11 (2): 1217-1229 (2012)
Parentage testing in Santa Inês sheep
alleles for Red Engadin sheep, while Baumung et al. (2006) reported an average of 15 alleles per locus when 25 microsatellite markers were surveyed in 717 animals of 11 Austrian breeds.
and possibly with the accuracy of the genotyping system used, our results indicate that the Santa Inês breed in fact displays relatively high levels of genetic diversity, as expected at the onset of this study.
The overall estimate of average HO (0.688) was lower than the HE -
the possible occurrence of null alleles at some loci, they are most likely derived from some level of -
were analyzed jointly to reach these estimates (see below). Three of the eight MAPA-proposed
these deviations, there seems to be no major issue with any of these 23 microsatellite markers,
The issue remains of selecting those that provide the highest information content for individual
The probability of paternity exclusion estimates the power that the marker provides for excluding a non-parent from paternity or maternity. This parameter was estimated for two common scenarios in Santa Inês breeding, i.e., when no parent (PE1) or one parent is known (PE2) when testing parentage. Overall, the probabilities were high to moderate for all the mic-rosatellites analyzed, with PE2 ranging from 0.222 for the least powerful marker, MAF214, to 0.726 for OARCP49, the most informative one (Table 1). These estimates are generally higher than the estimates reported for 19 microsatellites by Glowatzki-Mullis et al. (2007) when data on 316 sheep from 10 breeds were jointly analyzed resulting in a range of PE2 from 0.073 to 0.573. Eight markers were used in both studies (ILST011, ILST005, INRA63, MAF65, OarCP49, OarFCB20, OarFCB304, and SPS113), allowing a direct comparison. For all these markers except OarFCB20, the estimates of probability of paternity exclusion were higher in Santa Inês than the estimates reported for the above-mentioned 10 breeds.
Combined probabilities of paternity exclusion were estimated for different marker panels starting with the full set of 23 markers tested and subsets of smaller number of markers
current MAPA marker set, while still providing relatively good power for paternity exclusion, can be improved with the addition or substitution of markers. In this respect, the data gathered
and, at the same time, be part of the currently recommended ISAG markers for sheep geno-typing at the international level. Currently, only two MAPA-proposed markers are part of the 13 marker panel recently recommended by ISAG, markers D5S2 and SPS113. A straightfor-ward recommendation would be to add markers INRA172, INRA23, INRA63, MAF65, and OarFBC20, which are part of the ISAG panel to the MAPA 8-marker set, therefore, totaling 13 markers, which would provide an overlap of seven markers with the ISAG set and eight

1224
©FUNPEC-RP www.funpecrp.com.brGenetics and Molecular Research 11 (2): 1217-1229 (2012)
C.A. Souza et al.
markers with previous sheep genotyping carried out in Brazil.
it is important to point out that it assumes random mating and no relatedness between the alleged parent tested and the true parent. In the current sheep breeding scenarios in Brazil, it is com-
schemes. Therefore, for precise paternity determination in such situations, it is probably sensible to use an excess of prior power of exclusion to protect against false-paternity inclusions, i.e., declaring a ram as father when in fact its half-sib or full-sib is the true father. Our results show
Santa Inês breed. However, in special cases, when additional prior evidence exists to consider two alternative related rams as putative fathers, a larger microsatellite panel, with all 23 markers, should be used providing a prior PE in excess of 99.999%. Concerning the combined estimates of probability of identity, any marker panel would provide fully satisfactory ability to discriminate animals or validate the identity of clonal individuals when such a test is demanded.
Genetic diversity in Santa Inês breed
Besides an assessment of the performance of microsatellite marker panels used to date for
-
germplasm collection with a much larger sample had almost twice the average number of alleles
genetically related individuals in the sample, derived from the recurrent use of a small number of rams in an extensive breeding system. This result calls for a greater attention in the management of the EMBRAPA sheep germplasm collection and its potential use in breeding practice. As many as
enrich the genetic base of the collection through future offspring.Results of AMOVA are in agreement with the expectations. Very little, although sig-
nucleus, most likely as a result of genetic drift and some level of selection. Most of the genetic diversity was found within the groups, with the EMBRAPA collection contributing the larg-
District and Sergipe were closely related in the dendrogram plot. This was expected, as most animals in the Federal District were imported from Sergipe due to a lack of Federal sanitary barrier between these States and the action of a strong association of breeders. The type of ani-mal found in both regions is morphologically similar and different from animals found in other places in the Northeast region, as recently reported with morphometric markers (Carneiro et al., 2010). These cited authors noted that the pattern is consistent with the hypothesis for the existence of an “Old Santa Inês” breed versus the “New Santa Inês”. Breeders and technicians classify the Old Santa Inês as smaller more rustic animals, which were predominant in the

1225
©FUNPEC-RP www.funpecrp.com.brGenetics and Molecular Research 11 (2): 1217-1229 (2012)
Parentage testing in Santa Inês sheep
1980s and 1990s. The New Santa Inês, probably originating in Sergipe, are more prevalent
rump and largely black or brown pelts, which has appeared in a large proportion of the popula-tion in the last few years. This has led to reduced heat tolerance (McManus et al., 2009a) and resistance to endoparasites (McManus et al., 2009b). In addition, according to records of these
Conclusions and recommendations
-age testing practice and sheep breed registers of Santa Inês animals across accredited Brazilian laboratories. The results of this study suggest that the MAPA-proposed marker panel, although generally useful, can and should be enhanced by including more markers, thus supplying im-
addition of new markers seems to be an urgent matter, a general consensus based on reliable genetic data derived from nationwide studies of the most relevant breeds should follow. Recom-mendations coming from ISAG comparison tests should also be taken into account in spite of the
fact that such recommendations typically come from studies with wool sheep breeds.
valid for all other sheep breeds raised in Brazil. Based on the existing literature and the recent
be necessary to validate this claim. In practice, however, for the time being, a reasonable
validated markers to the MAPA set, thus totaling 13 to 15 markers. This improved set would provide a rational compromise between the already genotyped animals while abiding with a
improve the reliability of national reports and help direct future breeding and conservation programs. In the meantime, the feasibility of moving from microsatellite- to SNP-based ge-notyping for sheep will receive greater attention and could become the system of choice for the future, provided a drop in infra-structure costs takes place and that a sensible solution is
ACKNOWLEDGMENTS
REFERENCES
Genet.
Sel. Evol. 33: 529-542.

1226
©FUNPEC-RP www.funpecrp.com.brGenetics and Molecular Research 11 (2): 1217-1229 (2012)
C.A. Souza et al.
international comparisons. J. Dairy Sci. 84: 2523-2529.
estimation of breeding value in Gir cattle. Genet. Mol. Biol. 25: 389-394.Baumung R, Cubric-Curik V, Schwend K, Achmann R, et al. (2006). Genetic characterisation and breed assignment in
Austrian sheep breeds using microsatellite marker information. J. Anim. Breed. Genet. 123: 265-271.Carneiro H, Louvandini H, Paiva SR, Macedo F, et al. (2010). Morphological characterization of sheep breeds in Brazil,
Uruguay and Colombia. Small Rum. Res. 94: 58-65.Diez-Tascon C, Littlejohn RP, Almeida PA and Crawford AM (2000). Genetic variation within the Merino sheep breed:
analysis of closely related populations using microsatellites. Anim. Genet. 31: 243-251.
Anim. Sci. J. 81: 145-151.
Can. J. Anim. Sci. 80: 9-17.
goats and 19-plex PCR for sheep. Anim. Genet. 38: 86-88.
Available at [www.isag.us/Docs/Applied_GeneticsSheepGoats_CT.pdf]. ISAG, Edinburgh. Accessed April, 2011. Anim. Genet. 28:
397-400.(2006). DNA microsatellites to ascertain pedigree-
recorded information in a selecting nucleus of Murciano-Granadina dairy goats. Small Rum. Res. 65: 266-273.Kalinowski ST, Taper ML and Marshall TC (2007). Revising how the computer program CERVUS accommodates
genotyping error increases success in paternity assignment. Mol. Ecol. 16: 1099-1106.
multiplexes for parentage testing in goats (Capra hircus). Anim. Genet. 30: 431-438.MAPA (2004). Instrução Normativa No. 74 de 20 de Outubro de 2004. Ministério da Agricultura, Pecuária e Abastecimento,
Brasília.McManus C, Paludo GR, Louvandini H, Gugel R, et al. (2009a). Heat tolerance in Brazilian sheep: physiological and
blood parameters. Trop. Anim. Health Prod. 41: 95-101.McManus C, Louvandini H, Paiva SR, de Oliveira AA, et al. (2009b). Genetic factors of sheep affecting gastrointestinal
parasite infections in the Distrito Federal, Brazil. Vet. Parasitol. 166: 308-313.Ota T (1993). DISPAN: Genetic Distance and Phylogenetic Analysis University Park: Institute of Molecular and
Evolutionary Genetics. The Pennsylvania State University, Pennsylvania.Paiva SR, Silvério VC, Egito AA, Pimentel CMM, et al. (2005). Genetic variability of the Brazilian hair sheep breeds.
Pesq. Agropec. Bras. 40: 887-893.Peakall R and Smouse PE (2006). GenAlEx 6: genetic analysis in Excel. Population genetic software for teaching and
research. Mol. Ecol. Notes. 6: 288-295.Raymond M and Rousset F (1995). Population Genetics Software for Exact Tests and Ecumenicism. J. Hered. 86: 248-
249.Rychlik T, Radko A and Duniec M (2003). Evaluating the usefulness of polymorphism of some genetic markers for
parentage control of sheep. Med. Weterynaryjna 59: 1016-1018.
Vet. Res. Commun. 34: 541-548.
for birth and weaning weights in Hereford cattle. J. Anim. Sci. 82: 2307-2312.
on microsatellite analysis. J. Anim. Breed. Genet. 118: 379-387.
Genet. Mol. Biol. 25: 37-41.
using microsatellite markers and the impact on selection. J. Dairy Sci. 85: 2368-2375.
Israeli Holstein population. J. Dairy Sci. 87: 2627-2640.
1227
©FUNPEC-RP www.funpecrp.com.brGenetics and Molecular Research 11 (2): 1217-1229 (2012)
Parentage testing in Santa Inês sheep
SUPPLEMENTARY MATERIAL
Data Title
Paternidade OSI
No. Loci
23No. Samples
285
No. Pops.
1
All
N
265
262
275
281
257
271
270
266
268
276
232
233
283
281
266
261
267
253
264
276
254
278
274
64
0.157
66
0.142
68
0.064
70
0.050
72
0.002
74
0.528
80
0.125
82
0.212
84
0.007
0.056
86
0.050
88
0.175
0.004
90
0.459
0.005
92
0.018
0.159
94
0.014
0.076
96
0.005
0.100
98
0.053
0.120
100
0.005
0.013
102
0.067
0.129
104
0.145
0.002
106
0.007
109
0.125
111
0.060
113
0.002
114
0.009
115
0.051
0.004
116
0.161
0.035
117
0.228
118
0.007
119
0.134
0.002
120
0.006
121
0.230
0.037
0.004
0.551
122
0.156
123
0.095
0.153
0.006
0.105
124
0.321
0.282
125
0.035
0.216
0.268
126
0.050
0.083
127
0.192
0.002
128
0.089
129
0.008
0.103
130
0.190
131
0.010
0.004
0.030
132
0.124
0.004
133
0.023
0.045
0.037
134
0.065
0.085
135
0.002
0.239
0.190
0.002
0.002
136
0.012
0.307
137
0.004
138
0.002
0.312
0.079
139
0.011
0.013
0.002
142
0.013
0.346
143
0.013
0.002
Continued on next page

1228
©FUNPEC-RP www.funpecrp.com.brGenetics and Molecular Research 11 (2): 1217-1229 (2012)
C.A. Souza et al.
144
0.002
0.330
145
0.190
0.273
147
0.038
0.479
148
0.019
149
0.195
0.030
151
0.053
0.117
153
0.008
0.487
0.345
154
0.004
155
0.164
0.015
0.148
157
0.058
0.010
0.011
158
0.002
159
0.145
0.009
0.203
0.042
160
0.021
0.027
161
0.105
0.034
0.197
162
0.063
0.198
163
0.023
0.004
0.010
0.116
164
0.284
0.018
165
0.004
0.002
0.169
0.023
166
0.004
0.119
167
0.044
0.002
168
0.117
170
0.334
0.036
172
0.076
0.020
173
0.006
174
0.006
0.297
175
0.008
176
0.092
0.105
178
0.015
0.009
179
0.002
180
0.044
0.044
181
0.002
182
0.011
183
0.002
185
0.187
186
0.006
0.011
187
0.042
0.088
188
0.059
0.085
0.218
189
0.675
0.056
190
0.006
0.212
191
0.275
0.170
192
0.131
0.254
193
0.190
194
0.420
0.072
195
0.076
196
0.052
197
0.224
198
0.117
0.016
199
0.047
200
0.009
0.079
201
0.013
0.004
202
0.054
0.135
203
0.055
204
0.069
0.004
205
0.034
206
0.006
207
0.085
208
0.007
209
0.223
0.006
211
0.134
0.062
213
0.134
0.071
215
0.170
0.547
Supplementary material. Continued.
Continued on next page

1229
©FUNPEC-RP www.funpecrp.com.brGenetics and Molecular Research 11 (2): 1217-1229 (2012)
Parentage testing in Santa Inês sheep
217
0.104
0.129
219
0.002
0.077
221
0.090
223
0.005
0.017
225
0.004
234
0.097
236
0.031
240
0.053
242
0.037
244
0.015
246
0.120
248
0.637
250
0.009
254
0.002
264
0.005
266
0.257
270
0.005
272
0.402
274
0.036
276
0.080
278
0.007
280
0.207
Supplementary material. Continued.
Comments:


