Embed Size (px)
Citation preview

Genetic diversity between herds of Alpine and Saanen dairy goatsand the naturalized Brazilian Moxotó breed
Adriana Mello de Araújo1,2,3, Simone Eliza Facioni Guimarães1, Thea Mírian Medeiros Machado1,
Paulo Sávio Lopes1, Carmen Silva Pereira1, Francisco Luiz Ribeiro da Silva2,
Marcelo Teixeira Rodrigues1, Virgínia de Souza Columbiano1, Cleusa Graça da Fonseca4
1Universidade Federal de Viçosa, Departamento de Ciência Animal, Laboratório de Biotecnologia Animal,
Viçosa, MG, Brazil.2 Empresa Brasileira de Pesquisa Agropecuária, Embrapa Caprinos, Sobral, CE, Brazil.3 Empresa Brasileira de Pesquisa Agropecuária, Embrapa Meio Norte, Teresina, PI, Brazil.4Universidade Federal de Minas Gerais, Departamento de Biologia Geral, Belo Horizonte, MG, Brazil.
Abstract
Brazilian naturalized goat breeds are adapted to the semiarid conditions prevalent in the Northeast region of thecountry (which has the largest Brazilian goat heard) and represent an as yet uninvestigated source of genetic diver-sity. Currently, imported goat breeds are crossed with Brazilian naturalized goat breeds, endangering the genetic po-tential of the naturalized breeds. We used 11 microsatellite markers to determine the genetic diversity amongimported (non-naturalized) dairy Alpine and Saanen goats and naturalized Brazilian Moxotó goats. We genotyped292 goats from three herds (one private, one from the University of Minas Gerais and the Moxotó conservation herdfrom Embrapa Caprinos) and found that the general heterozygosity was 0.6952 for Alpine, 0.7043 for Saanen and0.4984 for Moxotó goats. The number of alleles ranged from 5 (INRA005) to 11 (BM3205), with an average of 7 al-leles per locus in the imported breeds and 3.5 alleles per locus in the Moxotó breed. Mean differentiation betweenpopulations was higher for herds (FSTS = 0.0768) than for breeds (FSTP = 0.0263), indicating similarity between theimported breeds and the existence of crosses between them. Nei’s genetic distance was highest between theMoxotó breed and the imported breeds. These indicate that further studies using these molecular markers would befruitful.
Key words: conservation, DNA microsatellite, genetic distance, genetic diversity, goats.
Received: November 22, 2004; Accepted: August 25, 2005.
Introduction
In Brazil the most important dairy goat (Capra
hircus) breeds are of European origin, mainly imported
from France. The Saanen breed is intensively reared, espe-
cially in the Southeastern region, while the Alpine breed is
very numerous in the dairy herds of the Northeast where it
is widely employed for crossing with naturalized breeds to
produce groups of goats called ‘Parda Sertaneja’ in Portu-
guese (Machado, 2000).
The semiarid Northeastern region of Brazil has the
largest goat flock with almost all small farms having at least
one goat, most of which are of undefined breed resulting
from crosses between the different goats brought into the
country during colonization. Another large group is the
Brazilian naturalized standard breeds such as the Moxotó,
Marota, Canindé and Repartida groups which are classified
as naturalized because they are descendants of those ani-
mals introduced during colonization and have undergone
strong natural selection in order to adapt to the semiarid
conditions. Although both undefined breeds and standard
breeds descend from imported goats the recent breeding
history of the standard breeds is known and their character-
istics are more standardized than goats of undefined breed.
The most traditional Brazilian naturalized standard
goat breed is the Moxotó breed, originally developed in the
Brazilian state of Pernambuco (Machado, 2000) and char-
acterized by desirable traits such as disease resistance, fe-
cundity and the ability to produce high quality leather,
although this breed produces only small amounts of milk
and meat. However, crosses between imported breeds and
Moxotó goats make this breed vulnerable and might lead to
Genetics and Molecular Biology, 29, 1, 67-74 (2006)
Copyright by the Brazilian Society of Genetics. Printed in Brazil
www.sbg.org.br
Send correspondence to Adriana Mello de Araújo. Empresa Brasi-leira de Pesquisa Agropecuária, Embrapa Meio Norte, Av. Duquede Caxias 5650, Caixa Postal 01, 64006-220 Teresina, PI, Brazil.E-mail: [email protected].
Research Article

the loss of genetic resources in goat farming in the future,
because of which conservation studies are urgently needed
to determine the genetic diversity of this and other natural-
ized breeds which constitute important genetic resources.
Because their high polymorphism, DNA simple se-
quence repeats (SSRs, microsatellites) are a valuable tool
for the study of genetic diversity between populations
(Moioli et al., 2001). Takezaki and Nei (1996) and
Diez-Táscon et al. (2000) have emphasized the importance
of microsatellites in the study of evolutionary relationships
of closely related populations. However, some problems
may arise with the use of these markers for reasons such as
irregularities in the mutation pattern and polymorphism
differences between populations, because of which caution
is required in extending inferences to populations other
than those used in a specific study (Takeazaki and Nei,
1996).
Igarashi et al. (2000a) published the first study on the
genetic structure of naturalized and imported Brazilian goat
breeds using protein polymorphisms and used two micro-
satellite loci to analyze a subsample of this data, obtaining
the same results (Igarashi et al., 2000b) as in the earlier
study. Machado et al. (2000) investigated morphological
traits suitable for the construction of phylogenetic trees in-
volving a traditional undefined breed goat population from
the Brazilian Northeast and Mediterranean goat breeds.
The study reported in our present paper proposes a
microsatellite system that might be useful not only for the
analyses of genetic distances between goat breeds in Brazil
but also for determining diversity in Alpine, Saanen and
Moxotó herds.
Materials and Methods
Animal sampling and DNA extraction
The following groups of goats were sampled: 121 Al-
pine and 94 Saanen goats from the herd at the Federal Uni-
versity of Viçosa (Universidade Federal do Viçosa (UFV),
Minas Gerais state, Brazil), these goats being designated as
Alpine-UFV and Saanen-UFV; 36 Alpine and 19 Saanen
goats from a private herd in Minas Gerais state, designated
as Alpine-private and Saanen-private; and 22 Moxotó goats
from the Embrapa Goat conservation herd, Ceará State,
Brazil.
For each Alpine and Saanen goat, a vacuum system
was used to collect jugular blood which was then stored at
4 °C for 12 h before extracting the DNA using the phe-
nol/chloroform protocol of Sambrook et al. (1989).
For each Moxotó goat, hair samples collected from
the distal region of the tail and DNA extracted from the fol-
licles using the cetyltrimethylammonium bromide (CTAB)
protocol (Ferreira and Grattapaglia, 1998) in which the
DNA samples were prepared by macerating 10-30 hair fol-
licles in 0.5 mL of 2% (w/v) aqueous CTAB at 65 °C for
60 min with vortexing every 20 min. After maceration the
mixture was centrifuged for 2 min at 14,000 revs min-1 and
the supernatant transferred to a fresh micro-tube containing
0.5 mL of isoamyl alcohol, re-centrifuged and the super-
natant transferred to another micro-tube containing 0.5 mL
of isopropanol and incubate for 30 min at 4 °C to precipitate
the DNA which was pelleted by centrifugation, washed and
dehydrated in ethanol and resuspended in 50 to 100 �L of
Tris-EDTA.
Microsatellite and genotyping system
The loci tested are shown in Table 1, all primers have
previously been used for the construction of the goat ge-
nome linkage map (Vaiman et al., 1996). The reverse prim-
ers were fluorescence labeled with Tet, 6-Fam and Hex
(Applied Biosystem).
Each PCR mixture contained 25 ng genomic DNA,
20 mM Tris-HCl, pH 8.3, 50 mM KCl, 0.2 mM dNTPs,
1.25 to 2.5 mM MgCl2 and 1 unit of Taq polymerase in a fi-
nal volume of 20 �L. The concentration of each primer was
adjusted to permit good readings of the fluorescent peaks
and ranged as describe in Table 1. The amplification proto-
68 Araújo et al.
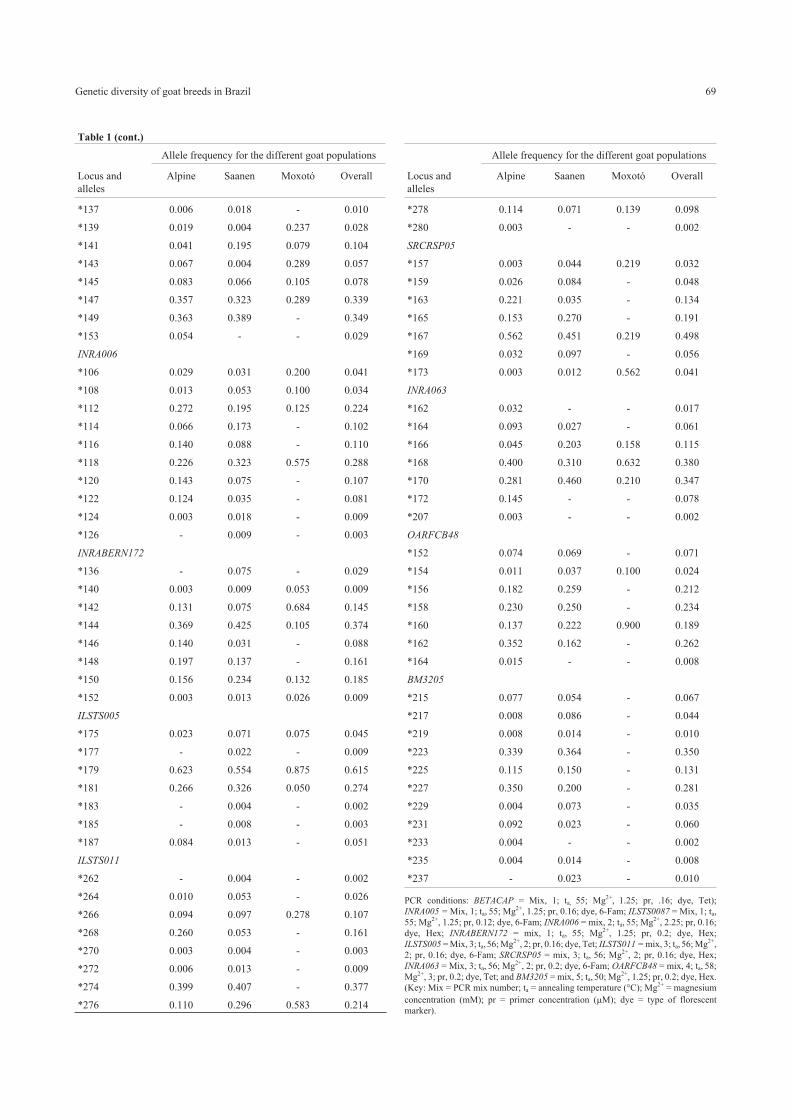
Table 1 - Locus, alleles (*kb) and allele frequencies (F) for the Alpine, Saanen and Moxotó breeds. The last column shows the overall allele frequency.
Alleles undetected in a specific population are indicated by a dash (-) and PCR conditions are given as a footnote.
Allele frequency for the different goat populations
Locus and
alleles
Alpine Saanen Moxotó Overall
BETACAP
*160 0.334 0.345 - 0.318
*162 0.073 0.133 0.361 0.115
*164 0.064 0.040 0.222 0.064
*166 - - 0.333 0.021
*168 0.013 0.013 - 0.012
*170 0.516 0.465 0.083 0.469
*174 - 0.004 - 0.002
Allele frequency for the different goat populations
Locus and
alleles
Alpine Saanen Moxotó Overall
INRA005
*113 0.003 0.004 - 0.003
*115 0.494 0.571 0.800 0.545
*117 0.102 0.252 0.125 0.162
*119 0.366 0.102 0.075 0.243
*121 0.035 0.071 - 0.047
ILSTS0087
*135 0.010 - - 0.005
Genetic diversity of goat breeds in Brazil 69
Table 1 (cont.)
Allele frequency for the different goat populations
Locus and
alleles
Alpine Saanen Moxotó Overall
*137 0.006 0.018 - 0.010
*139 0.019 0.004 0.237 0.028
*141 0.041 0.195 0.079 0.104
*143 0.067 0.004 0.289 0.057
*145 0.083 0.066 0.105 0.078
*147 0.357 0.323 0.289 0.339
*149 0.363 0.389 - 0.349
*153 0.054 - - 0.029
INRA006
*106 0.029 0.031 0.200 0.041
*108 0.013 0.053 0.100 0.034
*112 0.272 0.195 0.125 0.224
*114 0.066 0.173 - 0.102
*116 0.140 0.088 - 0.110
*118 0.226 0.323 0.575 0.288
*120 0.143 0.075 - 0.107
*122 0.124 0.035 - 0.081
*124 0.003 0.018 - 0.009
*126 - 0.009 - 0.003
INRABERN172
*136 - 0.075 - 0.029
*140 0.003 0.009 0.053 0.009
*142 0.131 0.075 0.684 0.145
*144 0.369 0.425 0.105 0.374
*146 0.140 0.031 - 0.088
*148 0.197 0.137 - 0.161
*150 0.156 0.234 0.132 0.185
*152 0.003 0.013 0.026 0.009
ILSTS005
*175 0.023 0.071 0.075 0.045
*177 - 0.022 - 0.009
*179 0.623 0.554 0.875 0.615
*181 0.266 0.326 0.050 0.274
*183 - 0.004 - 0.002
*185 - 0.008 - 0.003
*187 0.084 0.013 - 0.051
ILSTS011
*262 - 0.004 - 0.002
*264 0.010 0.053 - 0.026
*266 0.094 0.097 0.278 0.107
*268 0.260 0.053 - 0.161
*270 0.003 0.004 - 0.003
*272 0.006 0.013 - 0.009
*274 0.399 0.407 - 0.377
*276 0.110 0.296 0.583 0.214
Allele frequency for the different goat populations
Locus and
alleles
Alpine Saanen Moxotó Overall
*278 0.114 0.071 0.139 0.098
*280 0.003 - - 0.002
SRCRSP05
*157 0.003 0.044 0.219 0.032
*159 0.026 0.084 - 0.048
*163 0.221 0.035 - 0.134
*165 0.153 0.270 - 0.191
*167 0.562 0.451 0.219 0.498
*169 0.032 0.097 - 0.056
*173 0.003 0.012 0.562 0.041
INRA063
*162 0.032 - - 0.017
*164 0.093 0.027 - 0.061
*166 0.045 0.203 0.158 0.115
*168 0.400 0.310 0.632 0.380
*170 0.281 0.460 0.210 0.347
*172 0.145 - - 0.078
*207 0.003 - - 0.002
OARFCB48
*152 0.074 0.069 - 0.071
*154 0.011 0.037 0.100 0.024
*156 0.182 0.259 - 0.212
*158 0.230 0.250 - 0.234
*160 0.137 0.222 0.900 0.189
*162 0.352 0.162 - 0.262
*164 0.015 - - 0.008
BM3205
*215 0.077 0.054 - 0.067
*217 0.008 0.086 - 0.044
*219 0.008 0.014 - 0.010
*223 0.339 0.364 - 0.350
*225 0.115 0.150 - 0.131
*227 0.350 0.200 - 0.281
*229 0.004 0.073 - 0.035
*231 0.092 0.023 - 0.060
*233 0.004 - - 0.002
*235 0.004 0.014 - 0.008
*237 - 0.023 - 0.010
PCR conditions: BETACAP = Mix, 1; ta, 55; Mg2+, 1.25; pr, .16; dye, Tet);
INRA005 = Mix, 1; ta, 55; Mg2+, 1.25; pr, 0.16; dye, 6-Fam; ILSTS0087 = Mix, 1; ta,
55; Mg2+, 1.25; pr, 0.12; dye, 6-Fam; INRA006 = mix, 2; ta, 55; Mg2+, 2.25; pr, 0.16;
dye, Hex; INRABERN172 = mix, 1; ta, 55; Mg2+, 1.25; pr, 0.2; dye, Hex;
ILSTS005 = Mix, 3; ta,56; Mg2+, 2; pr, 0.16; dye, Tet; ILSTS011 = mix, 3; ta,56; Mg2+,
2; pr, 0.16; dye, 6-Fam; SRCRSP05 = mix, 3; ta, 56; Mg2+, 2; pr, 0.16; dye, Hex;
INRA063 = Mix, 3; ta, 56; Mg2+, 2; pr, 0.2; dye, 6-Fam; OARFCB48 = mix, 4; ta, 58;
Mg2+, 3; pr, 0.2; dye, Tet; and BM3205 = mix, 5; ta, 50; Mg2+, 1.25; pr, 0.2; dye, Hex.
(Key: Mix = PCR mix number; ta = annealing temperature (°C); Mg2+ = magnesium
concentration (mM); pr = primer concentration (�M); dye = type of florescent
marker).

col consisted of a denaturation step of 3 min at 94 °C, fol-
lowed by 27 cycles of 1 min at 94 °C, 1 min at 50-58 °C
(Table 1), 1 min at 72 °C, and a final extension step of
20 min at 72 °C. All reactions were carried out in a MJ Re-
search PTC-100 thermocycler. Single reactions were used
for the INRA006, OARFCB48 and BM3205 loci, the other
loci being amplified using two multiplex PCR reactions.
The single and multiple PCR products were joined together
and prepared for overall multiplex electrophoresis. Each fi-
nal sample contained 1.0 �L of the amplified material and
0.25 �L of the internal size standard (TAMRA 500, Ap-
plied Biosystem). This reaction was then denatured in
24 �L deionized formamide (HI-DI, Applied Biosystem),
incubated at 94 °C for 5 min and kept on ice. The amplified
fragments were applied to a 9 V capillary electrophoresis
system and subjected to electrophoreses at 60 °C for
22 min. Bands were analyzed using an ABI 310 Genetic
Analyzer the Genescan® software (Applied Biosystem).
Statistical analysis
Allele frequencies, expected (HE) heterozygosity
considering Hardy-Weinberg equilibrium (HWE) and ob-
served heterozygosity (HO) estimates for each locus and the
average over all loci were obtained with the Tools for Popu-
lation Genetic Analyses v 1.3 (TFPGA) program (Miller,
1997). Analyses was performed for breeds and herd of ori-
gin as a within-breed population as follows: Alpine-UFV,
Alpine-private, Saanen-UFV, Saanen-private, and Moxotó.
For the analysis of genetic differentiation between
populations, Wright’s fixation indices were computed
(Weir and Cockerham, 1984) by bootstrapping with a 95%
confidence interval (1000 replicates), where: FIS (consan-
guinity or loss in heterozygosity within population), FST
(measure of differentiation among populations), and FIT
(global loss in heterozygosity). The exact test of Hardy-
Weinberg proportion for multiple alleles (Guo and Thomp-
son, 1992) was performed using the Markov chain proce-
dure (10 batches, 1000 iterations, 1000 dememorization
steps).
The genetic distance (DA) was estimated according to
the method of Nei (1978). The unweighted pair group
method with arithmetic mean (UPGMA) was used for den-
drogram construction. To include a confidence interval in
the constructed tree, a TFGPA bootstrap (1000 replicates)
was performed which provided a percentage of replicates
that were similar to the original data.
Results
292 goats were analyzed from three breeds with 11
molecular markers (Table 1). The overall proportion of
non-analyzed loci was about 5% and the BM3205 locus was
not genotyped in Moxotó animals.
The number of alleles per locus ranged from five for
the INRA005 locus to 11 for the BM3205 locus, the average
per breed being 7.2 for Alpine and Saanen and 3.5 for the
Moxotó goats . The observed heterozygosity HO and ex-
pected heterozygosity (HE) for each locus and goat popula-
tion are shown in Table 2, from which it can be seen that HE
was generally close to HO (direct counting) indicating no
overall loss in heterozygosity (allele fixation). The HE val-
ues were 0.6952 for the Alpine, 0.7043 for the Saanen and
0.4984 for the Moxotó populations. The Alpine and Saanen
goats showed a high degree of observed diversity (i.e. high
70 Araújo et al.
Table 2 - Effective sample size (n) and expected and observed heterozygosity (HE and HO) at each locus for the populations and for the overall sample.
Alleles undetected in a specific population are indicated by a dash (-).
Locus Alpine-UFV
(n = 116)
Alpine-private
(n = 35)
Saanen-UFV
(n = 93)
Saanen-private
(n = 19)
Moxotó
(n = 18)
Overall sample
(n = 288)
BETACAP HE 0.640 0.489 0.668 0.555 0.693 0.663
HO 0.661 0.556 0.660 0.526 0.333 0.618
INRA005 HE 0.628 0.527 0.621 0.422 0.339 0.617
HO 0.628 0.611 0.617 0.526 0.400 0.600
ILSTS087 HE 0.711 0.632 0.688 0.632 0.759 0.742
HO 0.752 0.694 0.681 0.737 0.684 0.716
INRA006 HE 0.817 0.760 0.810 0.731 0.604 0.825
HO 0.901 0.861 0.883 0.947 0.650 0.876
INRABER 172 HE 0.764 0.725 0.706 0.796 0.500 0.772
HO 0.843 0.861 0.766 0.737 0.579 0.796
ILSTS005 HE 0.542 0.469 0.585 0.525 0.226 0.542
HO 0.542 0.611 0.495 0.474 0.150 0.503
ILSTS011 HE 0.749 0.675 0.710 0.737 0.563 0.765
HO 0.797 0.694 0.681 0.842 0.722 0.744

heterozygosity) whereas Moxotó goats were less diverse in
terms of the analyzed loci.
The alleles shared by the populations are listed in Ta-
ble 3. Alpine goats showed some exclusive alleles at loci
ILSTS087 (135 and 153 bp) and INRA063 (162,172, and
207 bp) while Moxotó goats presented a high frequency
(0.333) 166-bp fragment at the BETACAP locus. The
INRA006 locus was the most polymorhic, sharing an aver-
age 5.2 of a total of 10 alleles between populations, while
the ILSTS005 locus was less polymorphic in that it shared
an average 2.7 of a total of 7 alleles. For all the three breeds,
INRA005 and ILSTS005 loci presented the same alleles at
higher frequency. For the other five loci (BETACAP,
ILSTS087, INRABER172, ILSTS011 and SRCRSP05) the
most frequent allele in Alpine goats was also the most fre-
quent in Saanen goats, with both these breeds differing
from the Moxotó breed. Only at locus OARFCB48 did the
most frequent allele differ for the three breeds (Table 3).
The BETACAP, INRABER172, SRCRSP05, INRA063
and OARFCB48 loci showed significant deviation
(p < 0.01) from the overall expected Hardy-Weinberg equi-
librium (HWE). Within breeds, the INRABER172 locus
showed disequilibrium only for Alpine goats (p < 0.01),
while the SRCRSP05 locus showed disequilibrium only for
Saanen goats (p < 0.05) and the BETACAP locus only for
Moxotó goats (p < .01).
Wright’s F statistics for the different goat populations
are given in Table 4. The highest within-population fixation
index (FIS) was observed for the INRA063 and OARFCB48
loci. The global FIS did not differ from zero (95% confi-
dence interval). Mean differentiation among populations
(FST) was 0.0717 when considering the five population sep-
arately and 0.0263 when considering subpopulations ac-
cording to herd. This finding suggests that most variability
occurs between herds of the same breed (FSTS = 0.0768)
rather than between different breeds. Bootstrapping at the
95% confidence interval showed an FST value different
from zero, indicating a significant difference between the
populations studied.
The calculated genetic distance matrix (Nei, 1978) is
shown in Table 5 and is a measure of the diversity between
herds. The similarity between the Alpine-UFV and Saa-
nen-UFV herd was higher than between the Alpine-UFV
and Alpine-private herds and between the Saanen-UFV and
Saanen-private herds.
The Moxotó herd showed the highest distance com-
pared to the other herds, except for the Saanen-private herd,
probably due to the low number of sampled animals in both
herds. A bootstrap of the branch points of the generated tree
(Figure 1) showed 0.433 and 0.417 similarity at points 1
and 2, respectively, and 100% at points 3 and 4. The num-
ber of loci supporting each point were 2, 2, 6 for points 1
and 2 and 10 for points 3 and 4.
Discussion
The precision of estimated genetic diversity is a func-
tion of the number of loci analyzed, the heterozygosity of
these loci and the number of animals sampled in each popu-
lation (Barker, 1994). The Food and Agricultural Organiza-
tion (FAO) recommends that at least 25 randomly selected
animals should be used in population studies (FAO, 1998)
and Barker (1994) suggests that in diversity studies loci
with at least four different alleles should be used to reduce
the standard error of the estimated distance.
Diez-Tascón et al. (2000) studied diversity among
closely related Merino sheep populations with less than 400
years of separation, and showed that it was possible to dis-
tinguish related populations on the basis of microsatellite
analysis.
Diversity studies on goats using microsatellite mark-
ers are rare in the literature, although Maudet et al. (2002)
did investigate the usefulness of various statistical methods
in biodiversity conservation management using Capra ibex
Genetic diversity of goat breeds in Brazil 71
Table 2 (cont.)
Locus Alpine-UFV
(n = 116)
Alpine-private
(n = 35)
Saanen-UFV
(n = 93)
Saanen-private
(n = 19)
Moxotó
(n = 18)
Overall sample
(n = 288)
SRCRSP05 HE 0.588 0.629 0.712 0.663 0.588 0.690
HO 0.636 0.583 0.649 0.632 0.500 0.625
INRA063 HE 0.731 0.663 0.665 0.554 0.532 0.713
HO 0.571 0.444 0.372 0.526 0.263 0.467
OARFCB48 HE 0.777 0.672 0.765 0.661 0.180 0.792
HO 0.657 0.818 0.483 0.579 0.200 0.601
BM3205 HE 0.732 0.561 0.794 0.690 - 0.771
HO 0.740 0.667 0.834 0.706 - 0.767
All loci HE 0.698 0.618 0.702 0.633 0.498 0.717
HO 0.702 0.673 0.648 0.657 0.448 0.665

as a model and demonstrated low genetic variability in this
wild alpine goat species.
Yang et al. (1999) studied diversity among auto-
chthonous goat breeds from China using microsatellite
markers and obtained results that agreed with the history of
the populations. Heterozygosity was high at 6 of the 13 ana-
72 Araújo et al.
Figure 1 - Genetic distance (DA) unrooted (UPGMA) dendrogram for the
different goat pbased on the.Tab
le3
-N
um
ber
ofal
lele
s(N
,see
Tab
le1)per
locu
spre
senti
nea
chgoat
popula
tion
and
shar
edbet
wee
npopula
tions.
All
eles
undet
ecte
din
anin
div
idual
popula
tion
orpai
rofpopula
tions
are
indic
ated
by
adas
h(-
).
Num
ber
of
alle
les
(as
posi
tive
pri
mer
s)per
locu
sfo
und
inth
egoat
popula
tions
Goat
popula
tions
BE
TA
CA
P
(N=
7)
INR
A005
(N=
5)
ILST
S087
(N=
9)
INR
A006
(N=
10)
INR
AB
ER
17
(N=
8)
ILST
S005
(N=
7)
ILST
S011
(N=
10)
SR
CR
SP
05
(N=
7)
INR
A063
(N=
7)
OA
RF
CB
48
(N=
7)
BM
3205
(N=
11)
Mea
n*
(N=
8)
Indiv
idual
popula
tions
Alp
ine-
UF
V5
49
85
48
77
710
6.7
Alp
ine-
pri
vat
e4
46
87
36
55
66
5.5
Saa
nen
-UF
V6
56
10
77
97
46
96.9
Saa
nen
-pri
vat
e4
35
56
34
43
58
4.5
Moxotó
43
54
53
33
32
-3.5
Pai
red
popula
tions#
1an
d2
43
67
53
55
56
65.0
1an
d3
54
69
54
77
46
85.8
1an
d4
43
55
42
44
35
23.7
1an
d5
33
54
33
33
32
-3.2
2an
d3
44
58
62
65
46
65.0
2an
d4
33
54
52
43
35
53.8
2an
d5
33
53
53
31
32
-3.2
3an
d4
43
45
53
44
35
64.2
3an
d5
33
44
43
33
32
-3.1
4an
d5
23
43
42
22
31
-2.6
Mea
nsh
ared
alle
les
3.5
3.2
4.1
5.2
4.6
2.7
4.1
3.7
3.4
4.5
5.5
4.0
*T
his
refe
rsto
the
mea
nnum
ber
of
loci
for
the
11
alle
les.
#K
ey:
1=
Alp
ine-
UF
V;
2=
Alp
ine-
pri
vat
e;3
=S
aanen
-UF
V;
4=
Saa
nen
-pri
vat
e;5
=M
oxotó
.
Table 4 - Within population fixation index (FIS), between population
fixation index (FSTP) and between subpopulations fixation index (FSTS)
and global consanguinity (FIT) obtained for each individual locus and all
loci combined.
Locus FIS FSTS FSTP FIT
BETACAP 0.0246 0.0835 0.0536 0.1060
INRA005 -0.0264 0.0873 0.0597 0.0632
ILSTS087 -0.0270 0.0788 -0.0213 0.0540
INRA006 -0.1041 0.0576 -0.0117 -0.0405
INRABER172 -0.0889 0.0850 0.0563 0.0036
ILSTS005 0.0474 0.0420 0.0200 0.0874
ILSTS011 -0.0324 0.0903 0.0705 0.0608
SRCRSP05 0.0310 0.1111 0.0852 0.1386
INRA063 0.3171 0.0679 0.0491 0.3635
OARFCB48 0.1955 0.0810 -0.0038 0.2606
BM3205 -0.0394 0.0550 -0.0543 0.0178
All loci 0.0252 0.0768 0.0263 0.1000
Upper bootstrap 0.1028 0.0873 0.0511 0.1726
Lower bootstrap -0.0379 0.0672 -0.0014 0.0411
Limits were estimated by bootstrapping at the 95% confidence interval.
Table 5 - Nei’s genetic distance between the populations studied.
Population
Population Alpine-
private
Saanen-
UFV
Saanen-
private
Moxotó
Alpine-UFV 0.1133 0.1010 0.1707 0.5456
Alpine-private 0.1236 0.1477 0.6358
Saanen-UFV 0.1220 0.4468
Saanen-private 0.6139

lyzed loci. Saitbekova et al. (1999) evaluated diversity
among nine domestic Swiss goat herds, Wild Ibex goats
and Bezoar goats. Heterozygosity was higher in the domes-
tic breeds than in the wild goats, with the mean HE ranging
from 0.51 to 0.58 for domestic herds and from 0.17 to 0.19
for the wild species.
In the imported breeds sampled here, high and moder-
ate (HE > 0.70) polymorphism was observed for the set of
loci studied. The Moxotó breed showed lower polymor-
phism, probably because of the smaller sample size and
also due to a certain reduction in within-population genetic
variability. Inbreeding was also indicated from pedigree in-
formation and the closed herd history of the Moxoto breed-
ing nucleus. The low FST value observed for the UFV
Alpine and Saanen herds (lower than that obtained for geo-
graphically isolated herds) suggests that the animals from
the UVF herds resulted from matings between both breeds
leading to genetic similarity between them, these suspi-
cions being confirmed by their mating history. Laval et al.
(2000) state that, for commercial populations, migration
exerts a greater effect than mutation or drift on the reduc-
tion in genetic differentiation between populations.
Our data revealed no deficit or excess of hetero-
zygosity. Deviations from HWE at microsatellite loci have
been reported in various studies (Barker et al., 2001; Laval
et al., 2000; Luikart et al., 1999) and indicate departure
from random mating. This deviation might be the result of
the presence of null or non-amplified alleles, allele group-
ing defects, a sampling structure effect, selection against
heterozygotes or inbreeding.
The INRA063 and OARFCB48 loci showed a higher
within population Fixation index (FIS) than the other loci,
indicating allele fixation. However, analysis of the global
FIS indicated that there was no increase in inbreeding in
these populations. The global consanguinity (FIT) and FIS
were close (Table 4), indicating impairment of inbreeding
within herds.
Wide genetic diversity between imported breeds and
the naturalized Moxotó breed and close similarity between
the Alpine and Saanen breeds were showed by data
analysis. The Embrapa Moxotó herd is composed strictly of
pure native animals, an extremely uncommon situation in
commercial herds were crossbreeding has occurred over a
long period of time. The FSTP value indicates that only
2.6% of the genetic variability is due to differences between
breeds. The UFV Alpine and Saanen herds were more
closely related than the Alpine and Saanen private herds,
demonstrating gene flow between the UFV Alpine and Saa-
nen breeds. In general, the Saanen and Alpine breeds dif-
fered little from one another, probably because of their
common origin. These results agree with those reported by
Igarashi et al. (2000b) and with the history of the breeds.
Our study shows that the imported Alpine and Saanen
breeds have separate genetic identities and are very distant
from the naturalized Brazilian Moxotó breed. Also, the
Moxotó herd showed low genetic diversity which
compromises its potential. A further conclusion is that the
microsatellites analyzed in this study were informative and
should be used in future studies about the genetic diversity
of goats in Brazil.
Acknowledgments
This study was supported by Fundação de Amparo a
Pesquisa de Minas Gerais (FAPEMIG), Conselho Nacional
de Desenvolvimento Tecnológico (CNPq), and Coorde-
nadoria de Aperfeiçoamento de Ensino Superior (CAPES).
We thank Dr. Yves Amiges for help with the design of the
BETACAP, INRA005, INRA006, INRA063 and
INRABER172 primers and Capril Sanri, Florestal, MG,
Brazil for collaboration with this study.
References
Barker JSF (1994) A global protocol for determining genetic dis-
tances among domestic livestock breeds. In: V World Con-
gress on Genetics Applied to Livestock Production, Gelph:
sd, v. 21, pp 501-508.
Barker JSF, Tan SG, Moore SS, Mukherjee TK, Matheson J-L and
Selvaraj OS (2001) Genetic variation within and relation-
ship among populations of Asian goats (Capra hircus). J
Anim Breed Genet 118:213-233.
Diez-Tascón C, Littlejohn RP, Almeida PAR and Crawford AM
(2000) Genetic variation within the Merino sheep breed:
Analysis of closely related populations using micro-
satellites. Anim Genet 31:243-251.
FAO (1998) Secondary Guidelines for Development of National
Farm Animal Genetic Resources Management Plans: Man-
agement of Small Populations at Site. Food and Agricultural
Organization, Rome, 215 pp. http://dad.fao.org/en/refer/li-
brary/guidelin/sml-popn.pdf.
Ferreira MA and Grattapaglia D (1998) Protocolos. In: Introdução
ao Uso de Marcadores Moleculares em Análise Genética. 3rd
ed. Embrapa Cenargen, Brasilia, pp 121-139.
Guo SW and Thompson EA (1992) Performing the exact test of
Hardy-Weinberg proportion for multiple alleles. Biometrics
48:361-372.
Igarashi MLSP, Machado TM, Ferro JA and Contel EPB (2000)
Structure and genetic relationship among Brazilian natural-
ized and imported goat breeds. Biochem Genet 38:353-365.
Igarashi MLSP, Machado TM, Castro SR, Ferro JA and Contel
EPB (2000) Genetic characterization of goats herds of the
Brazil. In: Proceedings of V Global Conference on Conser-
vation of Domestic Animal Genetic Resource, Embrapa,
Brasília, CD-Rom.
Laval G, Iannuccelli N, Legault C, Milan D, Groenen MAM,
Giuffra E, Andersson L, Nissen PH, Jorgensen CB,
Beeckmann P, Geldermann H, Foulley J-L, Chevalet C and
Ollivier L (2000) Genetic diversity of eleven European pig
breeds. Genet Select Evolut 32:187-203.
Luikart G, Biju-Duval M-P, Ertugrul O, Zagdsuren Y, Maudet C
and Taberlet P (1999) Power of 22 microsatellite markers in
fluorescent multiplexes for parentage testing in goats
(Capra hircus). Anim Genet 30:431-438.
Genetic diversity of goat breeds in Brazil 73

Machado TMM (2000) Caprins autochtones du Brésil: L’identi-
fication, la standardisation et la savergarde. In: Proceedings
of VII International Conference on Goats, Tours, INRA, pp
941-943.
Machado TMM, Chakir M and Lauvergne JJ (2000) Genetic dis-
tances and taxonomic trees between goats of Ceará State
(Brazil) and goats of the Mediterranean region (Europe and
Africa). Genet Mol Biol 23:121-125.
Maudet C, Miller C, Bassano B, Breitenmoser-Wursten C,
Gauthier D, Obexer-Ruff G, Michallet B, Taberlet P and
Luikart G (2002) Microsatellite DNA and recent statistical
methods in wildlife conservation management: Applications
in Alpine Ibex (Capra ibex ibex). Mol Ecol 11:421-436.
Miller MP (1997) TFPGA - Tools for Populations Genetics Anal-
yses, version 1.3. A Windows program for the analysis of
allozyme and molecular population genetic data. Depart-
ment of Biological Sciences, Northern Arizona University,
Flagstaff, 53 pp.
Moioli B, Georgoudis A, Napolitano F, Catillo G, Giubilei E,
Ligda CH and Hassanane M (2001) Genetic diversity be-
tween Italian, Greek and Egyptian buffalo populations.
Livest Product Sci 70:203-211.
Nei M (1978) Estimation of average heterozygosity and genetic
distance from a small number of individuals. Genetics
89:583-590.
Saitbekova N, Gaillard C, Obexer-Ruff G and Dolf G (1999) Ge-
netic diversity in Swiss goat breeds based on microsatellite
analysis. Anim Genet 30:36-41.
Sambrook J, Fritsch EF and Maniatis T (1989) Analysis and clon-
ing of eukaryotic genomic DNA. In: Molecular Cloning: A
Laboratory Manual. 2nd ed. Cold Spring Harbor Laboratory
Press, New York, pp 9.14-9.23.
Takezaki N and Nei M (1996) Genetic distances and reconstruc-
tion of phylogenetic trees from microsatellite DNA. Genet-
ics 144:389-399.
Vaiman D, Schibler L, Bourgeois F, Oustry A, Amigues Y and
Cribiu EP (1996) A genetic linkage map of the male goat ge-
nome. Genetics 144:279-305.
Yang L, Zhao SH, Li K, Peng ZZ and Montgomery GW (1999)
Determination of genetic relationships among five indige-
nous Chinese goat breeds with six microsatellite markers.
Anim Genet 30:452-455.
Weir BS and Cockerham C (1984) Estimating F-statistics for
analysis of population structure. Evolution 36:1358-1370.
Associate Editor: Pedro Franklin Barbosa
74 Araújo et al.


