Embed Size (px)
Citation preview

LC
F
DH
dG
LUW
H
rmlGbrtw
Rar
CLI
NIC
AL
LIV
ER
GASTROENTEROLOGY 2012;xx:xxx
Genome-Wide Association Study Identifies Variants Associated WithProgression of Liver Fibrosis From HCV InfectionETIENNE PATIN,*,‡ ZOLTÁN KUTALIK,§,� JULIEN GUERGNON,¶ STÉPHANIE BIBERT,# BERTRAND NALPAS,‡,**EMMANUELLE JOUANGUY,*,‡,‡‡ MONA MUNTEANU,§§ LAURENCE BOUSQUET,‡,** LAURENT ARGIRO,� �
PHILIPPE HALFON,¶¶ ANNE BOLAND,## BEAT MÜLLHAUPT,*** DAVID SEMELA,‡‡‡ JEAN–FRANÇOIS DUFOUR,§§§
MARKUS H. HEIM,� � � DARIUS MORADPOUR,¶¶¶ ANDREAS CERNY,### RAFFAELE MALINVERNI,**** HANS HIRSCH,‡‡‡‡
GLADYS MARTINETTI,§§§§ VIJAYAPRAKASH SUPPIAH,� � � �,¶¶¶¶ GRAEME STEWART,¶¶¶¶ DAVID R. BOOTH,¶¶¶¶
JACOB GEORGE,� � � � JEAN–LAURENT CASANOVA,*,‡,‡‡ CHRISTIAN BRÉCHOT,#### CHARLES M. RICE,*****ANDREW H. TALAL,‡‡‡‡‡ IRA M. JACOBSON,‡‡‡‡‡ MARC BOURLIÈRE,§§§§§ IOANNIS THEODOROU,¶
THIERRY POYNARD,� � � � � FRANCESCO NEGRO,¶¶¶¶¶ STANISLAS POL,‡,** PIERRE–YVES BOCHUD,# andAURENT ABEL*,‡,‡‡ on behalf of the Swiss Hepatitis C Cohort Study Group, the International Hepatitis C Geneticsonsortium, and the French ANRS HC EP 26 Genoscan Study Group
*Laboratory of Human Genetics of Infectious Diseases, Necker Branch, Necker Medical School, INSERM Unité 980, Paris, France; ‡University Paris Descartes, Paris,rance; §Department of Medical Genetics, University of Lausanne, Lausanne, Switzerland; �Swiss Institute of Bioinformatics, Lausanne, Switzerland; ¶Laboratory of
Immunity and Infection, INSERM UMR-S 945, UPMC Université Paris 6, Groupe Hospitalier Pitié-Salpêtrière AP-HP, Paris, France; #Infectious Diseases Service,epartment of Medicine, University Hospital and University of Lausanne, Lausanne, Switzerland; **Département d’Hépatologie, INSERM Unité 1016, Groupeospitalier Cochin-Hôtel Dieu-Broca, Paris, France; ‡‡St Giles Laboratory of Human Genetics of Infectious Diseases, Rockefeller Branch, and *****Center for the
Study of Hepatitis C, Rockefeller University, New York, New York; §§Biopredictive, Paris, France; � �Laboratoire d’Immunologie et de Génétique des MaladiesParasitaires, INSERM-UMR 906/Université de la Méditerranée, Marseilles, France; ¶¶Laboratoire Alphabio, Hôpital Ambroise Paré, Marseilles, France; ##CEA, Institut
e Génomique, Centre National de Génotypage, Evry, France; ***Division of Gastroenterology and Hepatology, University Hospital, Zurich, Switzerland; ‡‡‡Division ofastroenterology, Canton Hospital, St Gallen, Switzerland; §§§Hepatology, Department of Clinical Research, University Clinic for Visceral Surgery and Medicine, Bern,
Switzerland; � � �Division of Gastroenterology and Hepatology, University Hospital, Basel, Switzerland; ¶¶¶Centre Hospitalier Universitaire Vaudois, University ofausanne, Lausanne, Switzerland; ###Clinica Moncucco, Lugano, Switzerland; ****Pourtalès Hospital, Neuchâtel, Switzerland; ‡‡‡‡Institute for Medical Microbiology,niversity Hospital, Basel, Switzerland; §§§§Institute of Medical Microbiology, Bellinzona, Switzerland; � � � �Storr Liver Unit, Westmead Millennium Institute andestmead Hospital, University of Sydney and University of Sydney Medical Foundation, Sydney, Australia; ¶¶¶¶Institute for Immunology and Allergy Research,
Westmead Millennium Institute, University of Sydney, Sydney, Australia; ####INSERM Unité 785, Liver Hepatology Centre, Paul Brousse Hospital, University Paris-XI,Villejuif, France; ‡‡‡‡‡Division of Gastroenterology and Hepatology, Weill Cornell Medical College, New York, New York; §§§§§Service d’Hépato-gastroentérologie,
ôpital Saint-Joseph, Marseilles, France; � � � � �Université Pierre et Marie Curie, Service d’Hépato-gastroentérologie, Hôpital Pitié-Salpêtrière (AP-HP), Paris, France;
and ¶¶¶¶¶Divisions of Gastroenterology and Hepatology and of Clinical Pathology, University Hospital, Geneva, SwitzerlandlTaGHtt
KD
oi
BACKGROUND & AIMS: Polymorphisms in IL28B wereshown to affect clearance of hepatitis C virus (HCV)infection in genome-wide association (GWA) studies.Only a fraction of patients with chronic HCV infectiondevelop liver fibrosis, a process that might also be affectedby genetic factors. We performed a 2-stage GWA study ofliver fibrosis progression related to HCV infection.METHODS: We studied well-characterized HCV-infectedpatients of European descent who underwent liver biop-sies before treatment. We defined various liver fibrosisphenotypes on the basis of METAVIR scores, with andwithout taking the duration of HCV infection into ac-count. Our GWA analyses were conducted on a filteredprimary cohort of 1161 patients using 780,650 singlenucleotide polymorphisms (SNPs). We genotyped 96SNPs with P values �5 � 10�5 from an independenteplication cohort of 962 patients. We then assessed the
ost interesting replicated SNPs using DNA samples col-ected from 219 patients who participated in separate
WA studies of HCV clearance. RESULTS: In the com-ined cohort of 2342 HCV-infected patients, the SNPss16851720 (in the total sample) and rs4374383 (in pa-ients who received blood transfusions) were associatedith fibrosis progression (Pcombined � 8.9 � 10�9 and 1.1 �
10�9, respectively). The SNP rs16851720 is located withinNF7, which encodes an antioxidant that protects againstpoptosis. The SNP rs4374383, together with another
eplicated SNP, rs9380516 (Pcombined � 5.4 � 10�7), wereinked to the functionally related genes MERTK andULP1, which encode factors involved in phagocytosis ofpoptotic cells by macrophages. CONCLUSIONS: OurWA study identified several susceptibility loci forCV-induced liver fibrosis; these were linked to genes
hat regulate apoptosis. Apoptotic control mightherefore be involved in liver fibrosis.
eywords: Genetic Analysis; Risk Factors; Cirrhosis; Liverisease.
End-stage chronic hepatitis C is the leading cause ofliver transplantation in developed countries, and
more than 350,000 people die from hepatitis C virus(HCV)-related liver diseases each year.1 The natural course
f chronic HCV infection is characterized by high levels ofnterindividual variation in disease progression.2 Most
subjects never develop cirrhosis, but some may developsevere fibrosis in less than 20 years. A number of host
Abbreviations used in this paper: FPR, fibrosis progression rate; GWA,genome-wide association; HBV, hepatits B virus; HCV, hepatitis C virus;HIV, human immunodeficiency virus; HR, hazard ratio; IDU, injectingdrug use; ROS, reactive oxygen species; SCCS, Swiss Hepatitis C CohortStudy; SMU, standardized METAVIR units; SNP, single nucleotide poly-morphism.
© 2012 by the AGA Institute0016-5085/$36.00
http://dx.doi.org/10.1053/j.gastro.2012.07.097

gvHdrtasrgvteti
bn
Pat
HHtcwtcspHottWoMrd
CLIN
ICA
LLIV
ER
2 PATIN ET AL GASTROENTEROLOGY Vol. xx, No. x
demographic and clinical characteristics, as well as viralfactors, have been associated with the development ofHCV-related liver fibrosis.2– 4 However, these factors ac-count for only a small proportion of the variability in therate of liver fibrosis development, which overall remainsunpredictable. There is accumulating evidence to suggestthat host genetic factors are involved, although thesefactors remain largely unknown.2,5 A number of candidate
ene approaches have been used in attempts to identifyariants influencing the development of liver disease inCV-infected patients, but most of these studies pro-uced results that were not consistently replicated.5,6 Twoelated studies7,8 investigating �25,000 putative func-ional single nucleotide polymorphisms (SNPs) identifiedpanel of SNPs predicting the risk of developing cirrho-
is; this panel requires validation in prospective studies.8 Aecent study of 36 candidate genes, related to the fibro-enesis/fibrolysis process, identified a single cluster ofariants of the IFNGR2 gene associated with progressiono severe fibrosis.9 The results of these studies are inter-sting, but their approach may have prevented identifica-ion of genes strongly associated with liver fibrosis presentn parts of the genome not tested.
Genome-wide association (GWA) studies provide aroader and unbiased approach for the discovery of ge-etic factors involved in disease susceptibility.10 For ex-
ample, GWA studies identified an SNP cluster in theIL28B gene with a major effect on HCV clearance, eithertreatment induced or spontaneous, whereas this gene hadnever previously been implicated in HCV infection.11 Arecent candidate gene study found that IL28B alleles as-sociated with poor HCV clearance had a protective effectagainst liver inflammation and fibrosis.12 No GWA studyhas yet explored genetic susceptibility to liver fibrosis inpatients with chronic HCV infection. Several GWA studiesof liver disease–related traits showed a role for a nonsyn-onymous variant of the PNPLA3 gene, rs738409 (I148M),in the development of nonalcoholic and alcoholic fattyliver disease and associated disease severity.13–15 The same
NPLA3 risk allele was recently associated with steatosisnd liver fibrosis in patients with chronic HCV infec-ion.16,17 In this study, we performed a 2-stage GWA study
(primary screen followed by a replication study) in acombined cohort of 2342 well-characterized HCV-infectedpatients to identify genetic factors influencing the devel-opment of HCV-related liver fibrosis.
Patients and MethodsPatient SubjectsThe sample used for the primary screen combined data
from 2 cohorts of adult patients of European descent fromFrance and Switzerland with chronic HCV infection. We re-tained only patients who underwent liver biopsy before treat-ment. The French cohort (ANRS Genoscan Study Group) in-cluded patients from the hepatology units of several hospitals inParis and Marseilles; the inclusion criteria applied, including nocoinfection by human immunodeficiency virus (HIV) or hepati-
tis B virus (HBV), have been described elsewhere.9 The Swissepatitis C Cohort Study (SCCS) is a multicenter study ofCV-infected patients enrolled at 8 major Swiss hospitals and
he affiliated local centers. SCCS patient selection and dataollection have also been described elsewhere,3,18 and patientsith known HIV or active HBV coinfection were excluded from
he present study. In total, 1223 patients (490 from the Frenchohort and 733 from the SCCS) were eligible for genetic analy-es. We studied 3 additional cohorts of European-descent adultatients with chronic HCV infection and not coinfected withIV or HBV, with the aim of replicating the principal signals
btained in the primary cohorts. All 962 patients included inhese cohorts underwent biopsy before treatment (Supplemen-ary Table 1). A first cohort of 64 US patients was recruited at
eill-Cornell Medical Center in New York, and a second samplef 256 French patients was recruited from different hospitals inarseilles. The third replication cohort included 642 patients
ecruited from centers in Australia, Germany, the United King-om, and Italy, as described elsewhere.19,20 Finally, the 7 signals
showing evidence of true replication in the cohort combiningprimary and replication cohorts were also tested in an additionalindependent sample of Australian patients consisting of theprimary cohort of a previous GWA study of response to hepatitisC treatment.19 After excluding Australian patients with missingphenotype data, 219 individuals were kept for this analysis(Supplementary Table 1). Clinical risk factors and history ofHCV acquisition and alcohol consumption (assessed using atimeline follow-back interview) were recorded in the correspond-ing cohorts through face-to-face interviews conducted by physi-cians trained in addiction problems. The sampling of all thecohorts was approved by the appropriate institutional reviewboards, and written informed consent was obtained from allpatients.
Determination of Liver Fibrosis PhenotypesThe stage of liver fibrosis in patients with chronic HCV
infection was determined by examination of a liver biopsy spec-imen obtained before treatment, with quantification accordingto the METAVIR score, on a 5-point scale from F0 to F4.21
Fibrosis was assessed by experienced pathologists working in thelocal expert liver centers corresponding to the place of collection,and all biopsy specimens were considered as interpretable byeach local pathologist. The METAVIR scoring system has beenvalidated for many years and highly reproducible for patholo-gists specialized in liver disease.22 For each patient, we used theinformation obtained from a single biopsy specimen, referred toas the reference biopsy specimen. For patients who underwentseveral biopsies, the reference biopsy specimen was defined asfollows. We considered as the reference biopsy the most recentbiopsy obtained in the absence of treatment for patients whohad not spontaneously developed fibrosis (ie, all biopsy resultswithout treatment were F0 or F1); the biopsy with the highestMetavir score for patients who had developed fibrosis (ie, at least1 biopsy result �F2); the earliest biopsy, if there were severalbiopsies with the highest score. We used 3 different approachesto define liver fibrosis phenotype on the basis of the METAVIRscore for the reference biopsy specimen. The first of these ap-proaches was a classic case/control approach in which F0 –1patients were considered as controls and F3– 4 patients as cases.Patients with an intermediate METAVIR score (F2) were dis-carded from this analysis, which was thus a binary F0 –1/F3– 4phenotype analysis. Within this approach, we also used a moreextreme definition of the phenotypes, in which we considered
only F0 patients as controls and F4 patients as cases (binary
MdtbadStsatspa
bs
gnmao
g
crs
CLI
NIC
AL
LIV
ER
Month 2012 LIVER FIBROSIS IN HCV–INFECTED PATIENTS 3
F0/F4 phenotype analysis). In the second approach, we usedsurvival analysis techniques to take into account the individualduration of infection in the analysis. Failure (F3– 4 or only F4)and censored (F0 –1 or only F0) events were defined as in thecase/control study, and the duration of infection was esti-mated from the presumed year of HCV acquisition to the yearin which the biopsy was performed. The estimated date ofHCV acquisition was obtained using the first reported majorevent at risk among blood transfusion, drug use (the first yearof injecting drug use [IDU] was used as the starting point),accidental needle stick, or other invasive medical procedures.In this analysis, the phenotype is denoted duration F0 –1/F3– 4 or duration F0/F4. In the third approach, liver fibrosisprogression was considered as a quantitative phenotype, fi-brosis progression rate (FPR), corresponding to the ratio ofthe METAVIR score to the estimated duration of infection inyears (METAVIR units per year).23,24 Patients with an F2
ETAVIR score were included in this analysis. Given theistribution of FPR, this phenotype was log transformed andhen inverse normal quantile transformed in each cohortefore statistical analysis. The resulting phenotype, denoteds QTF phenotype, was further standardized such that theifferences in mean QTF rates between genotypes for a givenNP could be expressed in standard deviation units, referredo as standardized METAVIR units (SMUs). Posterior to theelection of the 96 followed-up SNPs (see next sections), wenalyzed our primary data by modeling transition probabili-ies between METAVIR stages using a Markov model, de-cribed in Supplementary Materials and Methods. This ap-roach was not further considered because it provided nodditional association signals with P values �5 � 10�6 in our
primary cohort with respect to analyses using the 3 otherphenotype definitions.
Genotyping and Imputation ProceduresDetails of genotyping methods, quality controls, and
imputation procedures are provided in Supplementary Materialsand Methods. Briefly, the French and Swiss primary cohortswere genotyped for �350,000 SNPs and �1,000,000 SNPs, re-spectively, using Illumina HumanCNV370-Duo and Human1M-Duo BeadChips (Illumina, San Diego, CA). Quality control fil-tering of SNPs resulted in a total of 325,624 and 912,765high-quality SNPs, respectively. Genotype imputation was per-formed in the French primary cohort, using the Swiss cohort asa template. This procedure yielded a total of 780,650 high-quality genotyped or imputed SNPs, which were used for allanalyses. Quality control filtering was also performed for indi-viduals, and 1161 filtered individuals were used for GWA anal-yses (Table 1). The 962 subjects of the replication cohorts (Sup-plementary Table 1) were genotyped for 96 followed-up SNPs byIllumina GoldenGate genotyping with VeraCode technology (Il-lumina), as well as our French primary cohort for 33 of the 96SNPs that were initially imputed in this cohort. Eighty-sevenhigh-quality SNPs were tested for replication. Among the 7SNPs showing evidence for true replication, 2 SNPs, rs16851720and rs4374383, were not present in the GWA cohort of 219Australian patients, genotyped by the Illumina InfiniumHumanHap300 or the CNV370-Quad genotyping BeadChips(Illumina). We could impute these 2 SNPs with a high accu-racy of 0.996 and 0.984, respectively (Supplementary Materi-
als and Methods). mStatistical AnalysesFor liver fibrosis considered as binary phenotypes, we
used Fisher exact test and logistic regression. For duration phe-notypes, we used a Cox model considering estimated age atinfection as the starting point and the first biopsy specimenshowing severe fibrosis (failure time) or the last biopsy specimenshowing an absence of severe fibrosis in the absence of treatment(censored time) as the end point. Logistic regression and Coxmodel analyses were used for stratified and multivariate adjustedanalyses, with sex, HCV genotype, age at infection, alcohol con-sumption, and/or mode of HCV acquisition as covariates. Forthe QTF phenotype, linear regression analysis was performed.All statistical analyses were performed with procedures imple-mented in SAS software v.8.2 (SAS Institute, Cary, NC), R soft-ware (http://www.R-project.org/), MATLAB (www.mathworks.com), and PLINK.25 The power of this study was estimated for the
inary F0–1/3–4 and the duration F0–1/3–4 phenotypes, as de-cribed in Supplementary Materials and Methods.
As we conducted several analyses, using different phenotypes,enetic models, and stratified samples, we estimated the effectiveumber of tests in our study by a method detailed in Supple-entary Materials and Methods. Briefly, we estimated that the
nalyses conducted in the whole sample corresponded to a totalf �3 million effective tests. Adjusted and stratified analyses
were performed only on the binary and duration F0 –1/F3– 4phenotypes for the 140,797 SNPs with P values �.05 in theanalyses conducted on these 2 phenotypes in the whole sample,taking 8 strata into account: age at infection �20 years, age atinfection �20 years, male, female, contamination by transfu-sion, contamination by IDU, HCV genotype � 1, and HCVgenotype � 1. The number of effective tests for these stratifiedanalyses was estimated at �1.6 million, giving a total of �4.9million independent tests for our entire GWA analysis. Wetherefore considered P values �10�8 (0.05/4.9 � 106) to indicate
enome-wide significance in our study.
ResultsGenome-Wide Analyses in the Primary CohortGWA analyses were conducted on a filtered pri-
mary cohort of 1161 HCV-infected patients (Table 1),with a total of 780,650 SNPs. We first used the binaryF0 –1/F3– 4 phenotype of liver fibrosis and assumed anadditive genetic model. No significant deviations fromexpectations were observed on quantile-quantile plots be-fore and after correction for population stratification(Supplementary Figure 1), attesting to an absence of dif-ference in ancestry between cases and controls (genomicinflation factor � � 1.013). In addition, none of the first10 principal components of ancestry was associated withcase-control status (Supplementary Figure 2). We there-fore performed all subsequent analyses without adjust-ment for population stratification.
Figure 1A shows the Manhattan plot obtained for anal-ysis of the binary F0 –1/F3– 4 phenotype for the bestamong the 3 genetic models tested (additive, recessive,dominant). P values �10�6 were obtained for 2 SNPs onhromosomes 2 and 8 (Supplementary Table 2). Whenestricting our cohort to the most extreme METAVIRcores (binary F0/F4 phenotype), a single locus on chro-
osome 2, tagged by 4 SNPs in strong linkage disequi-

3aitpFbp
Fg
I�
T
NN
p
CLIN
ICA
LLIV
ER
4 PATIN ET AL GASTROENTEROLOGY Vol. xx, No. x
librium, achieved a P value �10�6 (Supplementary FigureA and Supplementary Table 2). We then performed GWAnalyses, taking into account the estimated duration ofnfection in 1064 subjects for whom follow-up informa-ion was available. Two SNPs on chromosomes 11 and 18rovided P values �10�6 when considering the duration0 –1/F3– 4 phenotype (Figure 1B and Supplementary Ta-le 2). When restricting the analysis to the duration F0/F4henotype, a P value �10�6 was obtained for one SNP on
chromosome 6 (Supplementary Figure 3B and Supple-mentary Table 2). Finally, the GWA analysis of the QTFphenotype identified a single SNP on chromosome 3 witha P value �10�6 (Figure 1C and Supplementary Table 2).
or all phenotypes, 45 additional independent signalsave P values �5 � 10�5 (Supplementary Table 3).
All of the classic risk factors for fibrosis developmentavailable in our sample (ie, sex, alcohol consumption,HCV genotype, HCV mode of acquisition, and age atinfection) were significantly and independently associated
Table 1. Clinical and Demographic Characteristics of the 2 Pr
Covariate Category
SexMaleFemale
METAVIR scoreF0F1F2F3F4
Alcohol consumptionLow (�40 g/d)Highb (�40 g/d)NA
HCV mode of acquisitionIDUBlood transfusionOtherc/NA
HCV genotype1234NA
Age at infectionPatients with available dataAge at infection �20 yAge at infection �20 yMean (SD) age at infection (y)Mean (SD) duration of infection (y)Mean (SD) FPR (METAVIR units/y)
otal
OTE. All values are expressed as n (%) unless otherwise noted.A, not available.
aFrench patients were included if they were not coinfected with HIV orenrolled patients if (1) they had F0–1 or F3–4 METAVIR scores, (2) theirof alcohol consumption. Swiss patients with known HIV or active HBV crelevant factors were retrieved from clinical databases, including sex,bThis category includes past heavy drinkers.cOther modes of HCV acquisition include situations at risk for exposureiercing).
with fibrosis progression in our sample on multivariate o
logistic regression analysis (Supplementary Table 4). Mul-tivariate analyses of our binary and duration F0 –1/F3– 4phenotypes adjusted for these factors did not substan-tially change our previous results (Supplementary Table3). We also performed adjusted and stratified analyses forthe binary and duration F0 –1/F3– 4 phenotypes, usingthe 140,797 SNPs that achieved a P value �.05 in one ofthese 2 analyses. These analyses were performed takinginto account binarized covariables such as sex (male/female), HCV genotype (1/others), or mode of acquisition(blood transfusion/IDU). In analyses with the durationF0 –1/F3– 4 phenotype, 6 SNPs gave P values �10�6, in-cluding 3 with P values �10�7 (Supplementary Table 2).n total, 38 additional independent signals gave P values
5 � 10�5 (Supplementary Table 3).
Replication StudyIn the second phase, we genotyped a total of 96
independent SNPs presenting a P value �5 � 10�5 in one
ry Cohorts
French cohorta Swiss cohorta Total
209 (44.8) 433 (62.4) 642 (55.3)258 (55.2) 261 (37.6) 519 (44.7)
41 (8.8) 77 (11.1) 118 (10.2)244 (52.2) 217 (31.3) 461 (39.7)20 (4.3) 192 (27.7) 212 (18.3)93 (19.9) 86 (12.4) 179 (15.4)69 (14.8) 122 (17.6) 191 (16.5)
399 (85.4) 542 (78.1) 941 (81.1)68 (14.6) 132 (19.0) 200 (17.2)0 (0.0) 20 (2.9) 20 (1.7)
157 (33.6) 290 (41.8) 447 (38.5)205 (43.9) 133 (19.2) 338 (29.1)105 (22.5) 271 (39.0) 376 (32.4)
294 (63.0) 362 (52.2) 656 (56.5)41 (8.8) 67 (9.7) 108 (9.3)75 (16.1) 193 (27.8) 268 (23.1)10 (2.1) 57 (8.2) 67 (5.8)47 (10.1) 15 (2.2) 62 (5.3)
450 (96.4) 614 (88.5) 1064 (91.6)139 (29.8) 304 (43.8) 443 (38.2)311 (66.6) 310 (44.7) 621 (53.5)
28.00 (12.93) 21.20 (10.66) 24.08 (12.14)20.17 (9.25) 22.39 (10.61) 21.45 (10.11)0.11 (0.16) 0.11 (0.15) 0.11 (0.16)
467 694 1161
V and had no coexisting chronic liver disease. We also preferentiallysumed date of HCV acquisition was known, and (3) they had low levelsfection were excluded for the purposes of this study. For both cohorts,e at infection, mode of HCV acquisition, and HCV genotype.
blood (eg, health workers) and invasive protocols (eg, surgery, tattoo,
ima
HBpreoinag
to
f our previous GWA analyses (Supplementary Table 3) in

tip(fid
wio
CLI
NIC
AL
LIV
ER
Month 2012 LIVER FIBROSIS IN HCV–INFECTED PATIENTS 5
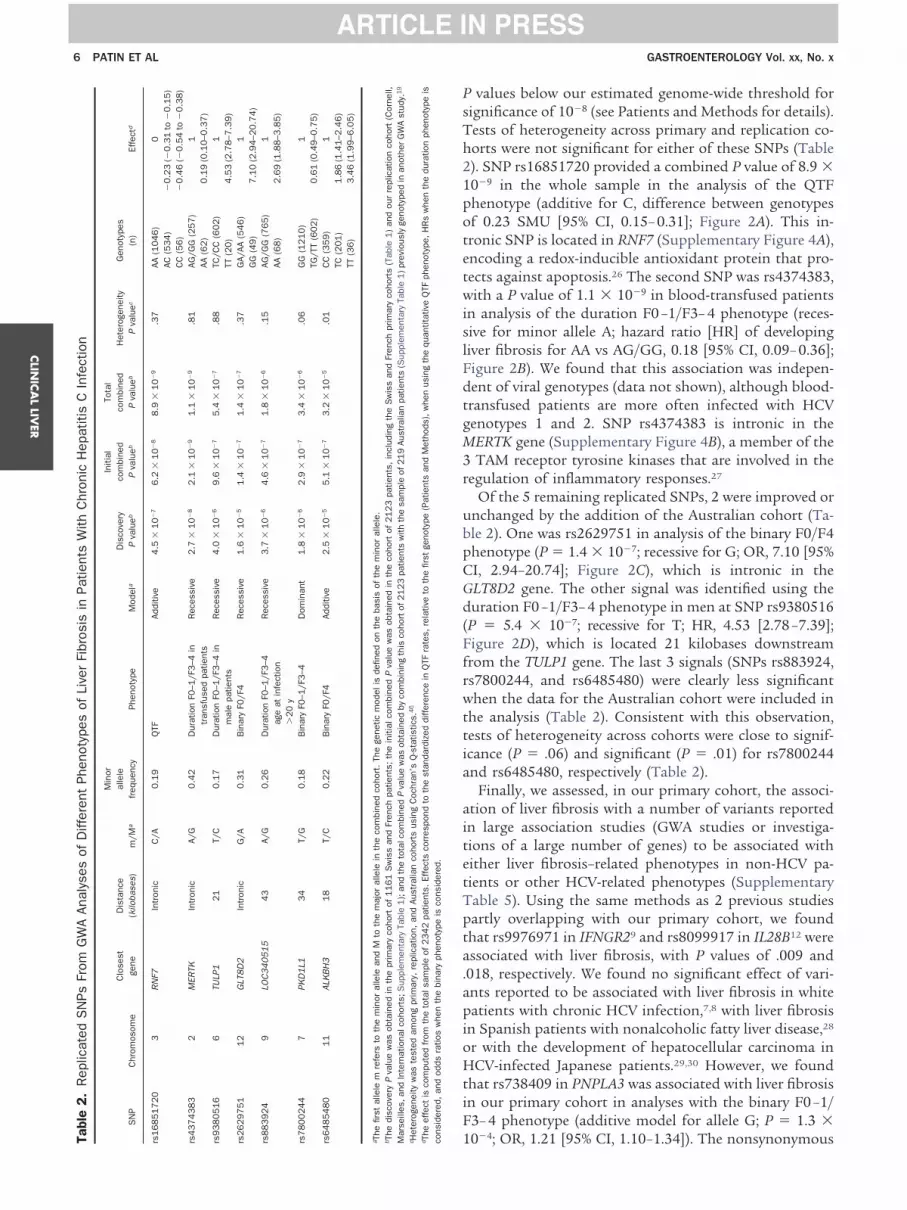
a replication cohort of 962 HCV-infected patients (Sup-plementary Table 1). Eighty-seven of these SNPs satisfyinghe quality control filters were tested for association. Ev-dence for true replication (using the same model as in therimary analysis) at the 0.05 level was obtained for 7 SNPs
Table 2). We further tested these 7 SNPs in an additionalltered cohort of 219 Australian patients with liver biopsy
Figure 1. Manhattan plots ofgenome-wide analyses of liver fi-brosis using (A) the binary F0–1/F3–4 phenotype (949 F0–1/F3–4 patients), (B) the durationF0–1/F3–4 phenotype (872 F0–1/F3–4 patients with availableduration of infection), and (C) theQTF phenotype (1064 patientswith available duration of infec-tion). Larger points correspondto SNPs producing a P value�10�6. All the analyses wereperformed on 780,650 geno-typed or imputed SNPs (Patientsand Methods).
ata (Supplementary Table 1), who were previously geno- s
typed for �310,000 SNPs on Illumina BeadChips in aGWA study of response to chronic hepatitis C treat-ment.19 Of these 7 SNPs, 2 (rs16851720 and rs4374383)
ere not present on the arrays and were successfullymputed in this Australian cohort (Patients and Meth-ds).The combined analysis of these 7 SNPs in the total
ample of 2342 patients identified 2 SNPs (Table 2) with
Th21potet
dtgM3r
bp
Ffrwtti
aitetTpt
ble
2.
Rep
licat
edS
NPs
From
GW
AAn
alys
esof
Diff
eren
tPh
enot
ypes
ofLi
ver
Fibr
osis
inPa
tient
sW
ithC
hron
icH
epat
itis
CIn
fect
ion
SN
PC
hrom
osom
eC
lose
stge
neD
ista
nce
(kilo
base
s)m
/Ma
Min
oral
lele
freq
uenc
yPh
enot
ype
Mod
ela
Dis
cove
ryP
valu
eb
Initi
alco
mbi
ned
Pva
lueb
Tota
lco
mbi
ned
Pva
lueb
Het
erog
enei
tyP
valu
ecG
enot
ypes
(n)
Effe
ctd
851720
3R
NF7
Intr
onic
C/A
0.1
9Q
TFAd
ditiv
e4
.5�
10
�7
6.2
�1
0�
88.9
�10
�9
.37
AA(1
046)
AC(5
34)
CC
(56)
0�
0.2
3(�
0.3
1to
�0.1
5)
�0.4
6(�
0.5
4to
�0.3
8)
74383
2M
ERTK
Intr
onic
A/G
0.4
2D
urat
ion
F0–1
/F3
–4in
tran
sfus
edpa
tient
sR
eces
sive
2.7
�1
0�
82
.1�
10
�9
1.1
�10
�9
.81
AG/G
G(2
57)
AA(6
2)
10.1
9(0
.10–0
.37)
80516
6TU
LP1
21
T/C
0.1
7D
urat
ion
F0–1
/F3
–4in
mal
epa
tient
sR
eces
sive
4.0
�1
0�
69
.6�
10
�7
5.4
�10
�7
.88
TC/C
C(6
02)
TT(2
0)
14.5
3(2
.78–7
.39)
29751
12
GLT
8D
2In
tron
icG
/A0
.31
Bin
ary
F0/F
4R
eces
sive
1.6
�1
0�
51
.4�
10
�7
1.4
�10
�7
.37
GA/
AA(5
46)
GG
(49)
17.1
0(2
.94–2
0.7
4)
3924
9LO
C3
40
51
54
3A/
G0
.26
Dur
atio
nF0
–1/F
3–4
age
atin
fect
ion
�2
0y
Rec
essi
ve3
.7�
10
�6
4.6
�1
0�
71.8
�10
�6
.15
AG/G
G(7
65)
AA(6
8)
12.6
9(1
.88–3
.85)
00244
7PK
D1
L13
4T/
G0
.18
Bin
ary
F0–1
/F3
–4D
omin
ant
1.8
�1
0�
62
.9�
10
�7
3.4
�10
�6
.06
GG
(1210)
TG/T
T(6
02)
10.6
1(0
.49–0
.75)
85480
11
ALK
BH
31
8T/
C0
.22
Bin
ary
F0/F
4Ad
ditiv
e2
.5�
10
�5
5.1
�1
0�
73.2
�10
�5
.01
CC
(359)
TC(2
01)
TT(3
6)
11.8
6(1
.41–2
.46)
3.4
6(1
.99–6
.05)
first
alle
lem
refe
rsto
the
min
oral
lele
and
Mto
the
maj
oral
lele
inth
eco
mbi
ned
coho
rt.
The
gene
ticm
odel
isde
fined
onth
eba
sis
ofth
em
inor
alle
le.
disc
over
yP
valu
ew
asob
tain
edin
the
prim
ary
coho
rtof
11
61
Sw
iss
and
Fren
chpa
tient
s;th
ein
itial
com
bine
dP
valu
ew
asob
tain
edin
the
coho
rtof
21
23
patie
nts,
incl
udin
gth
eS
wis
san
dFr
ench
prim
ary
coho
rts
(Tab
le1
)an
dou
rre
plic
atio
nco
hort
(Cor
nell,
seill
es,a
ndIn
tern
atio
nalc
ohor
ts;S
uppl
emen
tary
Tabl
e1
);an
dth
eto
talc
ombi
ned
Pva
lue
was
obta
ined
byco
mbi
ning
this
coho
rtof
21
23
patie
nts
with
the
sam
ple
of2
19
Aust
ralia
npa
tient
s(S
uppl
emen
tary
Tabl
e1
)pre
viou
sly
geno
type
din
anot
herG
WA
stud
y.19
erog
enei
tyw
aste
sted
amon
gpr
imar
y,re
plic
atio
n,an
dAu
stra
lian
coho
rts
usin
gC
ochr
an’s
Q-s
tatis
tics.
46
effe
ctis
com
pute
dfr
omth
eto
tals
ampl
eof
23
42
patie
nts.
Effe
cts
corr
espo
ndto
the
stan
dard
ized
differ
ence
inQ
TFra
tes,
rela
tive
toth
efir
stge
noty
pe(P
atie
nts
and
Met
hods
),w
hen
usin
gth
equ
antit
ativ
eQ
TFph
enot
ype,
HR
sw
hen
the
dura
tion
phen
otyp
eis
ider
ed,
and
odds
ratio
sw
hen
the
bina
ryph
enot
ype
isco
nsid
ered
.
CLIN
ICA
LLIV
ER
6 PATIN ET AL GASTROENTEROLOGY Vol. xx, No. x
P values below our estimated genome-wide threshold forsignificance of 10�8 (see Patients and Methods for details).
ests of heterogeneity across primary and replication co-orts were not significant for either of these SNPs (Table). SNP rs16851720 provided a combined P value of 8.9 �0�9 in the whole sample in the analysis of the QTFhenotype (additive for C, difference between genotypesf 0.23 SMU [95% CI, 0.15– 0.31]; Figure 2A). This in-ronic SNP is located in RNF7 (Supplementary Figure 4A),ncoding a redox-inducible antioxidant protein that pro-ects against apoptosis.26 The second SNP was rs4374383,
with a P value of 1.1 � 10�9 in blood-transfused patientsin analysis of the duration F0 –1/F3– 4 phenotype (reces-sive for minor allele A; hazard ratio [HR] of developingliver fibrosis for AA vs AG/GG, 0.18 [95% CI, 0.09– 0.36];Figure 2B). We found that this association was indepen-
ent of viral genotypes (data not shown), although blood-ransfused patients are more often infected with HCVenotypes 1 and 2. SNP rs4374383 is intronic in theERTK gene (Supplementary Figure 4B), a member of theTAM receptor tyrosine kinases that are involved in the
egulation of inflammatory responses.27
Of the 5 remaining replicated SNPs, 2 were improved orunchanged by the addition of the Australian cohort (Ta-
le 2). One was rs2629751 in analysis of the binary F0/F4henotype (P � 1.4 � 10�7; recessive for G; OR, 7.10 [95%
CI, 2.94–20.74]; Figure 2C), which is intronic in theGLT8D2 gene. The other signal was identified using theduration F0 –1/F3– 4 phenotype in men at SNP rs9380516(P � 5.4 � 10�7; recessive for T; HR, 4.53 [2.78 –7.39];
igure 2D), which is located 21 kilobases downstreamrom the TULP1 gene. The last 3 signals (SNPs rs883924,s7800244, and rs6485480) were clearly less significanthen the data for the Australian cohort were included in
he analysis (Table 2). Consistent with this observation,ests of heterogeneity across cohorts were close to signif-cance (P � .06) and significant (P � .01) for rs7800244
and rs6485480, respectively (Table 2).Finally, we assessed, in our primary cohort, the associ-
tion of liver fibrosis with a number of variants reportedn large association studies (GWA studies or investiga-ions of a large number of genes) to be associated withither liver fibrosis–related phenotypes in non-HCV pa-ients or other HCV-related phenotypes (Supplementaryable 5). Using the same methods as 2 previous studiesartly overlapping with our primary cohort, we foundhat rs9976971 in IFNGR29 and rs8099917 in IL28B12 were
associated with liver fibrosis, with P values of .009 and.018, respectively. We found no significant effect of vari-ants reported to be associated with liver fibrosis in whitepatients with chronic HCV infection,7,8 with liver fibrosisin Spanish patients with nonalcoholic fatty liver disease,28
or with the development of hepatocellular carcinoma inHCV-infected Japanese patients.29,30 However, we foundthat rs738409 in PNPLA3 was associated with liver fibrosisin our primary cohort in analyses with the binary F0 –1/F3– 4 phenotype (additive model for allele G; P � 1.3 �
10�4; OR, 1.21 [95% CI, 1.10–1.34]). The nonsynonymousTa rs16
rs43
rs93
rs26
rs88
rs78
rs64
a The
b The
Mar
c Het
d The
cons

a
Ssidgem
(g(fiB(ne
CLI
NIC
AL
LIV
ER
Month 2012 LIVER FIBROSIS IN HCV–INFECTED PATIENTS 7
PNPLA3 variant rs738409 has been shown to be associ-ted with several liver-related traits in GWA studies13–15
and with liver steatosis and fibrosis in patients chron-ically infected with HCV in studies based on candidategene approaches.16,17,31
DiscussionWe report the first GWA study investigating liver
fibrosis progression in a large sample of more than 2300HCV-infected patients of European descent. For all pa-tients, liver biopsy data were obtained before treatment.We defined several fibrosis phenotypes on the basis ofhistologic findings because the METAVIR system gradingis not linear21 and because we wished to investigate vari-ous and complementary aspects of the fibrosis process. Inthis context, we also sought to use an additional, moresophisticated approach, involving a Markov model of theprobability of transition between METAVIR stages (Sup-plementary Materials and Methods). This approach pro-vided no additional signals with P values �5 � 10�6 forour primary cohort (data not shown). Overall, our analysescovered a large panel of liver fibrosis phenotypes in a well-characterized sample of HCV-infected patients and identi-fied 4 replicated signals, including two that were significantat the genome-wide level in the combined cohort.
Gene Ontology enrichment analysis of our 4 most in-teresting signals revealed significant enrichment for 2
Figure 2. Genotype/phenotyperelationships for the 4 SNPs mostassociated with liver fibrosis in thefinal combined cohort. (A) SMUsPatients and Methods) for the 3enotypes of SNP rs16851720
located within RNF7), identi-ed using the QTF phenotype.ars represent standard errors
SEM) of each mean SMU. Ge-otype AA was used as the ref-rence (SMU � 0). (B) Survival
curves for SNP rs4374383 (lo-cated within MERTK) identifiedusing the duration F0–1/F3–4phenotype in the subsample oftransfused patients. (C) Propor-tions of all HCV-infected patientswith METAVIR scores of F0 andF4, by genotype at rs2629751 (lo-cated within GLT8D2), a repli-cated SNP identified using thebinary F0/F4 phenotype. (D)Survival curves for SNP rs9380516(located near TULP1), a replicatedSNP identified using the durationF0–1/F3–4 phenotype stratified inmale patients.
categories, “photoreceptor outer segment” and “phagocy-
tosis” (P � 5 � 10�4 and P � 5 � 10�3, respectively, afterBonferroni correction; Supplementary Materials andMethods). This result is explained by 2 SNPs: rs4374383,our most significant signal, and rs9380516, located withinor close to MERTK and TULP1, respectively. Interestingly,rs4374383 is in strong linkage disequilibrium (r2 � 0.9,measured using HapMap phase II data in the CEU Euro-pean-descent population) with 2 MERTK nonsynonymous
NPs, rs7604639 and rs3811635, and rs9380516 is introng linkage disequilibrium (r2 � 0.9 in CEU) with anntronic SNP of TULP1, rs9296155. Although Mendelianefects of these 2 genes affect only the retina,32–34 bothenes have a broader spectrum of expression, with TULP1xpressed in the fetal liver35 and MERTK expressed inacrophages.27 In addition, the MERTK and TULP1 pro-
teins have been shown to interact during the phagocytosisof apoptotic cells.36 In particular, mice lacking specificallythe murine homologue of MERTK display a deficiency inthe clearance of apoptotic thymocytes by macrophages.37
Interestingly, the clearance of apoptotic debris by phago-cytosis can directly stimulate fibrogenesis.38,39 Hepaticstellate cells may play a key role in this process, becausethey have phagocytic functions, including the reducednicotinamide adenine dinucleotide phosphate oxidase ac-tivity required for the production of reactive oxygen spe-cies (ROS).40 Hepatic stellate cells are also found in closeproximity to hepatocytes, a key source of apoptotic debris
during liver injury.41 Overall, our results suggest a possi-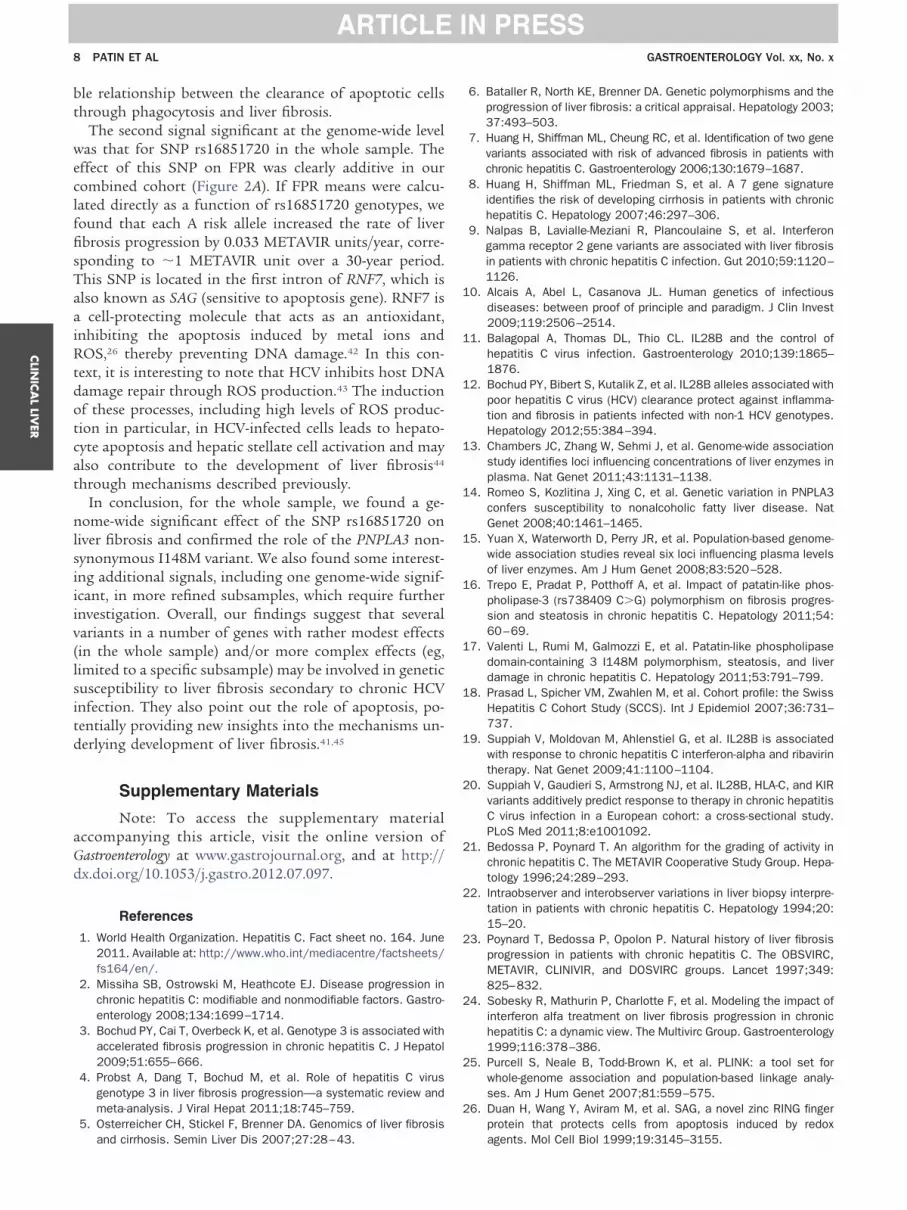
aiR
d
1
CLIN
ICA
LLIV
ER
8 PATIN ET AL GASTROENTEROLOGY Vol. xx, No. x
ble relationship between the clearance of apoptotic cellsthrough phagocytosis and liver fibrosis.
The second signal significant at the genome-wide levelwas that for SNP rs16851720 in the whole sample. Theeffect of this SNP on FPR was clearly additive in ourcombined cohort (Figure 2A). If FPR means were calcu-lated directly as a function of rs16851720 genotypes, wefound that each A risk allele increased the rate of liverfibrosis progression by 0.033 METAVIR units/year, corre-sponding to �1 METAVIR unit over a 30-year period.This SNP is located in the first intron of RNF7, which isalso known as SAG (sensitive to apoptosis gene). RNF7 is
cell-protecting molecule that acts as an antioxidant,nhibiting the apoptosis induced by metal ions andOS,26 thereby preventing DNA damage.42 In this con-
text, it is interesting to note that HCV inhibits host DNAdamage repair through ROS production.43 The inductionof these processes, including high levels of ROS produc-tion in particular, in HCV-infected cells leads to hepato-cyte apoptosis and hepatic stellate cell activation and mayalso contribute to the development of liver fibrosis44
through mechanisms described previously.In conclusion, for the whole sample, we found a ge-
nome-wide significant effect of the SNP rs16851720 onliver fibrosis and confirmed the role of the PNPLA3 non-synonymous I148M variant. We also found some interest-ing additional signals, including one genome-wide signif-icant, in more refined subsamples, which require furtherinvestigation. Overall, our findings suggest that severalvariants in a number of genes with rather modest effects(in the whole sample) and/or more complex effects (eg,limited to a specific subsample) may be involved in geneticsusceptibility to liver fibrosis secondary to chronic HCVinfection. They also point out the role of apoptosis, po-tentially providing new insights into the mechanisms un-derlying development of liver fibrosis.41,45
Supplementary Materials
Note: To access the supplementary materialaccompanying this article, visit the online version ofGastroenterology at www.gastrojournal.org, and at http://
x.doi.org/10.1053/j.gastro.2012.07.097.
References
1. World Health Organization. Hepatitis C. Fact sheet no. 164. June2011. Available at: http://www.who.int/mediacentre/factsheets/fs164/en/.
2. Missiha SB, Ostrowski M, Heathcote EJ. Disease progression inchronic hepatitis C: modifiable and nonmodifiable factors. Gastro-enterology 2008;134:1699–1714.
3. Bochud PY, Cai T, Overbeck K, et al. Genotype 3 is associated withaccelerated fibrosis progression in chronic hepatitis C. J Hepatol2009;51:655–666.
4. Probst A, Dang T, Bochud M, et al. Role of hepatitis C virusgenotype 3 in liver fibrosis progression—a systematic review andmeta-analysis. J Viral Hepat 2011;18:745–759.
5. Osterreicher CH, Stickel F, Brenner DA. Genomics of liver fibrosis
and cirrhosis. Semin Liver Dis 2007;27:28–43.6. Bataller R, North KE, Brenner DA. Genetic polymorphisms and theprogression of liver fibrosis: a critical appraisal. Hepatology 2003;37:493–503.
7. Huang H, Shiffman ML, Cheung RC, et al. Identification of two genevariants associated with risk of advanced fibrosis in patients withchronic hepatitis C. Gastroenterology 2006;130:1679–1687.
8. Huang H, Shiffman ML, Friedman S, et al. A 7 gene signatureidentifies the risk of developing cirrhosis in patients with chronichepatitis C. Hepatology 2007;46:297–306.
9. Nalpas B, Lavialle-Meziani R, Plancoulaine S, et al. Interferongamma receptor 2 gene variants are associated with liver fibrosisin patients with chronic hepatitis C infection. Gut 2010;59:1120–1126.
0. Alcais A, Abel L, Casanova JL. Human genetics of infectiousdiseases: between proof of principle and paradigm. J Clin Invest2009;119:2506–2514.
11. Balagopal A, Thomas DL, Thio CL. IL28B and the control ofhepatitis C virus infection. Gastroenterology 2010;139:1865–1876.
12. Bochud PY, Bibert S, Kutalik Z, et al. IL28B alleles associated withpoor hepatitis C virus (HCV) clearance protect against inflamma-tion and fibrosis in patients infected with non-1 HCV genotypes.Hepatology 2012;55:384–394.
13. Chambers JC, Zhang W, Sehmi J, et al. Genome-wide associationstudy identifies loci influencing concentrations of liver enzymes inplasma. Nat Genet 2011;43:1131–1138.
14. Romeo S, Kozlitina J, Xing C, et al. Genetic variation in PNPLA3confers susceptibility to nonalcoholic fatty liver disease. NatGenet 2008;40:1461–1465.
15. Yuan X, Waterworth D, Perry JR, et al. Population-based genome-wide association studies reveal six loci influencing plasma levelsof liver enzymes. Am J Hum Genet 2008;83:520–528.
16. Trepo E, Pradat P, Potthoff A, et al. Impact of patatin-like phos-pholipase-3 (rs738409 C�G) polymorphism on fibrosis progres-sion and steatosis in chronic hepatitis C. Hepatology 2011;54:60–69.
17. Valenti L, Rumi M, Galmozzi E, et al. Patatin-like phospholipasedomain-containing 3 I148M polymorphism, steatosis, and liverdamage in chronic hepatitis C. Hepatology 2011;53:791–799.
18. Prasad L, Spicher VM, Zwahlen M, et al. Cohort profile: the SwissHepatitis C Cohort Study (SCCS). Int J Epidemiol 2007;36:731–737.
19. Suppiah V, Moldovan M, Ahlenstiel G, et al. IL28B is associatedwith response to chronic hepatitis C interferon-alpha and ribavirintherapy. Nat Genet 2009;41:1100–1104.
20. Suppiah V, Gaudieri S, Armstrong NJ, et al. IL28B, HLA-C, and KIRvariants additively predict response to therapy in chronic hepatitisC virus infection in a European cohort: a cross-sectional study.PLoS Med 2011;8:e1001092.
21. Bedossa P, Poynard T. An algorithm for the grading of activity inchronic hepatitis C. The METAVIR Cooperative Study Group. Hepa-tology 1996;24:289–293.
22. Intraobserver and interobserver variations in liver biopsy interpre-tation in patients with chronic hepatitis C. Hepatology 1994;20:15–20.
23. Poynard T, Bedossa P, Opolon P. Natural history of liver fibrosisprogression in patients with chronic hepatitis C. The OBSVIRC,METAVIR, CLINIVIR, and DOSVIRC groups. Lancet 1997;349:825–832.
24. Sobesky R, Mathurin P, Charlotte F, et al. Modeling the impact ofinterferon alfa treatment on liver fibrosis progression in chronichepatitis C: a dynamic view. The Multivirc Group. Gastroenterology1999;116:378–386.
25. Purcell S, Neale B, Todd-Brown K, et al. PLINK: a tool set forwhole-genome association and population-based linkage analy-ses. Am J Hum Genet 2007;81:559–575.
26. Duan H, Wang Y, Aviram M, et al. SAG, a novel zinc RING fingerprotein that protects cells from apoptosis induced by redox
agents. Mol Cell Biol 1999;19:3145–3155.
CLI
NIC
AL
LIV
ER
Month 2012 LIVER FIBROSIS IN HCV–INFECTED PATIENTS 9
27. Rothlin CV, Ghosh S, Zuniga EI, et al. TAM receptors are pleiotro-pic inhibitors of the innate immune response. Cell 2007;131:1124–1136.
28. Chalasani N, Guo X, Loomba R, et al. Genome-wide associationstudy identifies variants associated with histologic features ofnonalcoholic fatty liver disease. Gastroenterology 2010;139:1567–1576, 1576 e1–6.
29. Kumar V, Kato N, Urabe Y, et al. Genome-wide association studyidentifies a susceptibility locus for HCV-induced hepatocellularcarcinoma. Nat Genet 2011;43:455–458.
30. Miki D, Ochi H, Hayes CN, et al. Variation in the DEPDC5 locus isassociated with progression to hepatocellular carcinoma inchronic hepatitis C virus carriers. Nat Genet 2011;43:797–800.
31. Cai T, Dufour JF, Muellhaupt B, et al. Viral genotype-specific role ofPNPLA3, PPARG, MTTP, and IL28B in hepatitis C virus-associatedsteatosis. J Hepatol 2011;55:529–535.
32. Banerjee P, Kleyn PW, Knowles JA, et al. TULP1 mutation in twoextended Dominican kindreds with autosomal recessive retinitispigmentosa. Nat Genet 1998;18:177–179.
33. Gal A, Li Y, Thompson DA, et al. Mutations in MERTK, the humanorthologue of the RCS rat retinal dystrophy gene, cause retinitispigmentosa. Nat Genet 2000;26:270–271.
34. Hagstrom SA, North MA, Nishina PL, et al. Recessive mutations inthe gene encoding the tubby-like protein TULP1 in patients withretinitis pigmentosa. Nat Genet 1998;18:174–176.
35. Su AI, Wiltshire T, Batalov S, et al. A gene atlas of the mouse andhuman protein-encoding transcriptomes. Proc Natl Acad Sci U S A2004;101:6062–6067.
36. Caberoy NB, Zhou Y, Li W. Tubby and tubby-like protein 1 are newMerTK ligands for phagocytosis. EMBO J 2010;29:3898–3910.
37. Scott RS, McMahon EJ, Pop SM, et al. Phagocytosis and clear-ance of apoptotic cells is mediated by MER. Nature 2001;411:207–211.
38. Canbay A, Taimr P, Torok N, et al. Apoptotic body engulfment by ahuman stellate cell line is profibrogenic. Lab Invest 2003;83:655–663.
39. Lauber K, Bohn E, Krober SM, et al. Apoptotic cells induce migra-tion of phagocytes via caspase-3-mediated release of a lipid at-traction signal. Cell 2003;113:717–730.
40. Bataller R, Schwabe RF, Choi YH, et al. NADPH oxidase signaltransduces angiotensin II in hepatic stellate cells and is critical inhepatic fibrosis. J Clin Invest 2003;112:1383–1394.
41. Canbay A, Friedman S, Gores GJ. Apoptosis: the nexus of liverinjury and fibrosis. Hepatology 2004;39:273–278.
42. Kim SY, Lee JH, Yang ES, et al. Human sensitive to apoptosisgene protein inhibits peroxynitrite-induced DNA damage. BiochemBiophys Res Commun 2003;301:671–674.
43. Machida K, McNamara G, Cheng KT, et al. Hepatitis C virusinhibits DNA damage repair through reactive oxygen and nitrogenspecies and by interfering with the ATM-NBS1/Mre11/Rad50 DNArepair pathway in monocytes and hepatocytes. J Immunol 2010;185:6985–6998.
44. Wang T, Weinman SA. Causes and consequences of mitochon-drial reactive oxygen species generation in hepatitis C. J Gastro-enterol Hepatol 2006;21(Suppl 3):S34–S37.
45. Guicciardi ME, Gores GJ. Apoptosis as a mechanism for liverdisease progression. Semin Liver Dis 2010;30:402–410.
46. Conover WJ. Practical nonparametric statistics. 3rd ed. New York,NY: Wiley, 1999.
Received February 16, 2012. Accepted July 16, 2012.
Reprint requestsAddress requests for reprints to: Pierre-Yves Bochud, MD,
Infectious Diseases Service, Department of Medicine, Institute of
Microbiology, Rue du Bugnon 48, CH-1011 Lausanne CHUV,Switzerland. e-mail: [email protected]; fax: (41) 21 314 4060; or Laurent Abel, MD, PhD, Laboratoire de Génétique Humainedes Maladies Infectieuses, Université Paris Descartes-INSERM Unité980, Faculté de Médecine Necker, 156 rue de Vaugirard, 75015Paris, France. e-mail: [email protected], fax: (33) 0-140615688.
AcknowledgmentsE.P.’s current affiliation is: Human Evolutionary Genetics, CNRS
URA3012, Institut Pasteur, Paris, France.E.P. and Z.K. contributed equally to the work, and P.-Y.B. and L.
Abel jointly directed the work.The authors thank all study subjects, all members of both
branches of the Laboratory of Human Genetics of Infectious Diseasesfor fruitful discussion, and Alain Dessein (INSERM-UMR906/Université de la Méditerranée, Marseilles), Marija Zeremski, andRay Peterson (Division of Gastroenterology and Hepatology, Weill-Cornell Medical College, New York, NY) for helping to collect thedata.
Members of Cohort Study GroupsMembers of the Swiss Hepatitis C Cohort Study Group: Francesco
Negro (Geneva, Chairman), Antoine Hadengue (Geneva, Chairman ofScientific Committee), Laurent Kaiser, Laura Rubbia-Brandt (Geneva);Darius Moradpour, Cristina Cellerai (Lausanne); Martin Rickenbach(Lausanne Data Center); Andreas Cerny, Gladys Martinetti (Lugano);Jean-François Dufour, Meri Gorgievski, Virginie Masserey Spicher(Berne); Markus Heim, Hans Hirsch (Basel); Beat Müllhaupt, BeatHelbling, Stephan Regenass (Zurich); Raffaele Malinverni (Neuchatel);David Semela, Guenter Dollenmaier (St Gallen); Gieri Cathomas(Liestal).
Members of the International Hepatitis C Genetics Consortium:Vijayaprakash Suppiah (Sydney, Australia), Thomas Berg (Leipzig,Germany), Martin Weltman (Sydney, Australia), Maria Lorena Abate(Turin, Italy), Ulrich Spengler (Bonn, Germany), Margaret Bassendine(Newcastle upon Tyne, England), Gregory J. Dore (Sydney, Australia),William L. Irving (Nottingham, England), Elizabeth Powell(Wooloongabba, Australia), Stephen Riordan (Sydney, Australia), GoloAhlenstiehl (Sydney, Australia), Graeme Stewart (Sydney, Australia),David R. Booth (Sydney, Australia), Jacob George (Sydney, Australia).
Members of the French ANRS HC EP 26 Genoscan Study Group:Bertrand Nalpas (Paris), Laurent Abel (Paris), Mona Monteanu(Paris), Laurence Bousquet (Paris), Yen Ngo (Paris), Pascal Lebray(Paris), Joseph Moussalli (Paris), Yves Benhamou (Paris), DominiqueThabut (Paris), Anaïs Vallet-Pichard (Paris), Hélène Fontaine (Paris),Vincent Mallet (Paris), Philippe Sogni (Paris), Jean-Baptiste Trabut(Paris), Marc Bourlière (Marseilles), Ioannis Theodorou (Paris), Jean-François Delfraissy (Paris), Thierry Poynard (Paris), Stanislas Pol(Paris).
Conflicts of interestThe authors disclose no conflicts.
FundingThe Swiss Hepatitis C Cohort Study is supported by grants from
the Swiss National Science Foundation (3347C0-108782/1), theSwiss Federal Office for Education and Sciences (03.0599), and theEuropean Commission (LSHM-CT-2004-503359; VIRGIL Network ofExcellence on Antiviral Drug Resistance). The French cohort and E.P.are supported and sponsored by the National Agency for Researchon AIDS and Viral Hepatitis (ANRS Study HC EP 26 Genoscan). E.J.received funding from Rockefeller University Center for Clinical andTranslational Science Grant Award number UL1RR0241443. C.M.R.,A.H.T., and I.M.J. are supported in part by the Greenberg MedicalResearch Institute and the Starr Foundation. F.N. is supported by theSwiss National Science Foundation (314730-130498). P.-Y.B. issupported by the Swiss National Foundation (32003B-127613), the
Leenaards Foundation, and the Santos-Suarez Foundation.
Gtshccw((sccatqt
r
(oew
Ofwp
SCwncctt
dc
erAHCsaAptcc
9.e1 PATIN ET AL GASTROENTEROLOGY Vol. xx, No. x
Supplementary Materials and Methods
Genotyping and Quality ControlsThe French primary cohort was genotyped for
�350,000 SNPs by the Post-Genomics Platform of thePitié-Salpêtrière Hospital (Paris, France) using IlluminaHumanCNV370-Duo BeadChips, and the Swiss primarycohort was genotyped for �1,000,000 SNPs by the
enomics Platform of the National Center for Compe-ence in Research “Frontiers in Genetics” at the Univer-ity of Geneva (Geneva, Switzerland) using Illuminauman1M-Duo BeadChips. Genotype calling and qualityontrol filters were applied in French and Swiss primaryohorts independently. Genotype calling was performedith the default settings of the BeadStudio software
Illumina). For genetic markers, we discarded SNPs with1) a genotype clustering score (ie, the Illumina GenTraincore, which quantifies for a given SNP the quality oflustering of samples in 3 separate genotypes) �0.2, (2) aall rate �90%, (3) a minor allele frequency (MAF) �1%,nd (4) a Hardy–Weinberg P value �10�7. Quality con-rol filtering led to a total of 325,624 and 912,765 high-uality SNPs in the French and Swiss cohorts, respec-ively.
For individuals, we discarded subjects with (1) a callate �95% (n � 4 and n � 6 in French and Swiss cohorts,
respectively); (2) a sex mismatch when comparing the sexreported in the clinical databases with the one deter-mined from chromosome X heterozygosity rate and fromthe ratio of chromosome X to chromosome Y meanfluorescence intensity of monomorphic probes (n � 0and n � 24); (3) evidence of cryptic relatedness, definedby relatedness coefficients �0.125 (n � 6 and n � 0); and4) a marked difference in genetic ancestry with theverall cohort (n � 13 and n � 9). Calculation of relat-dness coefficients and stratification in our entire sampleere assessed using EIGENSOFT v3.0,1 selecting only
SNPs that were present in both BeadChips and that werein linkage equilibrium (r2 � 0.1). Ancestry outliers wereremoved by EIGENSTRAT default removal procedure.After outlier removal, none of the 10 first principal com-ponents produced a significant difference in ancestrybetween cases and controls (Supplementary Figure 2).
verall, a total of 1161 filtered individuals (23 excludedrom the French cohort and 39 from the Swiss cohort)ere used for genome-wide statistical analyses. Table 1resents the characteristics of these 1161 subjects.Replication cohorts were genotyped for 96 followed-up
NPs with Illumina GoldenGate genotyping on Vera-ode technology. As to primary cohorts, the Swiss cohortas not genotyped again for any of the 96 SNPs, becauseo SNPs were imputed in this cohort and the minimalall rate for these SNPs was �0.99. The French primaryohort was genotyped for the 33 SNPs (of these 96 SNPs)hat were initially imputed in this cohort (see next sec-
ion). Nine SNPs (including 4/33 imputed SNPs) wereiscarded based on the following quality control filters:all rate �90%, Hardy–Weinberg P value �.05, or a low-
quality genotype clustering (evaluated by visual inspec-tion). No individuals were excluded based on genotypingcall rate.
Genotype ImputationAlmost all of the SNPs (98.8%) of the French
cohort were genotyped in the Swiss cohort, leading to atotal of 321,744 common high-quality SNPs. To homog-enize the analysis of the 2 cohorts, genotype imputationwas performed in the French primary cohort with MACHv1.0,2 using the Swiss primary cohort as the templatepanel. SNPs with low imputation accuracy (ie, r2-hat�0.3; r2-hat is a correlation coefficient that quantifiesimputation accuracy, calculated by comparing imputedgenotypes to theoretical expectations) and allele discrep-ancies were discarded, yielding 458,906 untyped markersconfidently imputed in the French cohort. The analyseswere therefore conducted on a total of 780,650 SNPs. Incase of the additive genetic model, allele dosages wereused. We also considered dominant and recessive geneticmodels (when using the binary and duration pheno-types), for which the most likely genotype was inferred(by MACH). Whenever the posterior probability was�80%, the genotype was assigned to be missing.
Among the 96 SNPs selected for replication, 33 SNPswere initially imputed in the French primary cohort.These 33 SNPs were thus genotyped in the French cohortfor validation. For the 29 SNPs that passed quality con-trols, the overall concordance rate between imputed andgenotyped SNPs was �94%. Among the 7 SNPs showingvidence for true replication, 2 SNPs, rs16851720 ands4374383, were not present in the filtered cohort of 219ustralian patients, genotyped by the Illumina InfiniumumanHap300 or the CNV370-Quad genotyping Bead-hips (Illumina). We imputed these 2 SNPs using the
ame procedure as described previously. The imputationccuracy (r2-hat) of rs16851720 and rs4374383 in theustralian cohort was 0.996 and 0.984, respectively. Im-ortantly, the concordance rates between imputed geno-ypes and true genotypes for these 2 SNPs in the Frenchohort were 0.962 and 0.951, confirming the high effi-iency of the imputation procedure.
Power CalculationThe power of this study was estimated using the
CaTS program3 for the binary F0 –1/3– 4 phenotype andusing the power calculator of the Massachusetts GeneralHospital’s Biostatistical Center (http://hedwig.mgh.har-vard.edu/biostatistics/node/19) for the duration F0 –1/3– 4 phenotype, assuming an additive genetic model forboth phenotypes. When considering � � 5 � 10�8 (usu-ally considered as significant at the genome-wide level),our GWA study of the binary F0 –1/F3– 4 phenotype had
80% power to detect an SNP with an MAF of 0.10, 0.30,
dvcrFMon
pftaF
etmmvndiFtattise
e
eia
ad
wpii
Month 2012 LIVER FIBROSIS IN HCV–INFECTED PATIENTS 9.e2
or 0.50, providing a relative risk (RR) of 2.17, 1.75, or1.71, respectively. As to the duration F0 –1/F3– 4 pheno-type, at the same � level, our study had 80% power to
etect an SNP with an MAF of 0.10, 0.30, or 0.50, pro-iding an HR of 2.43, 1.77, or 1.69, respectively. Whenonsidering � � 5 � 10�5 (the threshold used for oureplication study), our GWA study of the binary F0 –1/3– 4 phenotype had 80% power to detect an SNP with anAF of 0.10, 0.30, or 0.50, providing an RR of 1.86, 1.55,
r 1.52, respectively. As to the duration F0 –1/F3– 4 phe-otype, at the same � level, our study had 80% power to
detect an SNP with an MAF of 0.10, 0.30, or 0.50, pro-viding an HR of 1.97, 1.57, or 1.51, respectively.
Analysis Strategy and Effective Number ofTestsThe whole-sample analysis was conducted on
780,650 SNPs with (1) binary F0 –1/F3– 4, binary F0/F4,duration F0 –1/F3– 4, and duration F0/F4 phenotypes,testing the additive, recessive, and dominant models (inblack in Supplementary Figure 5), and (2) the quantitative
henotype for fibrosis progression (QTF), with testingor the additive model only (in dark gray in Supplemen-ary Figure 5). We then performed adjusted and stratifiednalyses only for the binary F0 –1/F3– 4 and duration0 –1/F3– 4 phenotypes on the 140,797 SNPs, giving a P
value �.05 in the analyses conducted on these 2 pheno-types for the whole sample (in light gray in SupplementaryFigure 5). These analyses were conducted for additive,recessive, and dominant models, taking 8 strata intoaccount: age at infection �20 years, age at infection �20years, male, female, contamination by transfusion, con-tamination by intravenous drug use, HCV genotype � 1,and HCV genotype � 1.
Because these tests are not independent, we assessedthe effective number of tests with a method similar tothat described in Johnson et al,4 based on the method ofNyholt.5 This approach made it possible to calculate anffective number of tests based on the observed correla-ion between test statistics. Using this method, we esti-
ated that (1) testing additive, dominant, and recessiveodels corresponds to 2.16 effective tests (with very little
ariation for different phenotypes); (2) analyzing the bi-ary F0 –1/F3– 4, binary F0/F4, duration F0 –1/F3– 4, anduration F0/F4 phenotypes is equivalent to testing 2.85
ndependent traits; (3) analyzing the binary and duration0 –1/F3– 4 phenotypes in stratified analyses is equivalento testing 1.74 independent traits; and (4) conductingnalyses in the 8 strata corresponds to 5.69 independentests. Finally, we estimated, as described by Li et al,6 thatesting 780,650 SNPs is equivalent to testing �420,000ndependent SNPs and that the selected 140,797 SNPselected for stratified analyses represent a conservativestimate of �75,000 independent tests.
Based on these results, we estimated the numbers of
ffective tests as follows:● For analysis of the whole sample with the QTFphenotype: 420,000 tests (in dark gray in Supplemen-tary Figure 5)
● For analysis on the whole sample with the otherphenotypes using 3 genetic models: 2.85 � 2.16 �420,000 � 2,585,520 tests (in black in Supplemen-tary Figure 5)
● For adjusted analyses with the binary and durationF0 –1/F3– 4 phenotypes: 1.74 � 2.16 � 75,000 �281,880 tests (in light gray in Supplementary Figure5).
● For stratified analyses with the binary and durationF0 –1/F3– 4 phenotypes: 1.74 � 2.16 � 5.69 �75,000 � 1,603,897 tests (in light gray in Supplemen-tary Figure 5).
Therefore, the total number of independent tests wasstimated at 4,891,297, giving a corrected P value signif-cance threshold of 0.05/4,891,297 � 1.02 � 10�8. Thus,fter correction for multiple testing, a P value �10�8 in
our GWA study was considered as genome-wide signifi-cant.
Markov Model of Liver Fibrosis ProgressionWe also analyzed our data by modeling transition
probabilities between METAVIR stages using a Markovmodel. This approach is a simplified version of a previ-ously reported method.7 Briefly, the Markov model usedin this study represents disease process as a series ofhealth states. Health states are defined as mild fibrosis(F0 –1) and severe fibrosis (F3– 4). The model consists ofhealth states (F0 –1 and F3– 4), allowable transitions be-tween health states (F0 –1 ¡ F3– 4), and a parameterdescribing the transition rate between health states,called �. The larger the �, the faster the transition. We
ssumed that the time spent in F0 –1 is exponentiallyistributed with parameter �. Thus, for every individual,
the probability of being in stage F0 –1 is e–�T, where T isthe duration of the infection. Subsequently, the chanceof being in stage F3– 4 is 1 – e–�T. We tested the hypothesis
hether the speed of transition � is associated with anyarticular genotype, that is, if a genotype predisposes an
ndividual to faster progression to severe fibrosis. Hence,n our model, we substituted � with (�0 � �1 � SNP),
where SNP represents the allele dosage coded as 0/1/2.Finally, we used maximum likelihood estimation and thelikelihood ratio test to establish the strength of the effectof each SNP on the transition rate. All computationswere performed using an in-house code developed inMATLAB (www.mathworks.com).
Gene Ontology AnalysisWe performed Gene Ontology overrepresentation
analysis for the genes closest to the 4 most associated
SNPs in our final combined cohort using GeneTrail
rp
9.e3 PATIN ET AL GASTROENTEROLOGY Vol. xx, No. x
(http://genetrail.bioinf.uni-sb.de/index.php).8 The over-epresentation analysis implemented in GeneTrail com-ares a set of genes of interest (here, RNF7, MERTK,
TULP1, and GLT8D2) with a reference set (here, all hu-man genes). This method determines whether a givenfunctional category is overrepresented or underrepre-sented in the set of interest and the likelihood of theobserved pattern being due to chance. P values are Bon-ferroni corrected for multiple testing to take into accountthe number of Gene Ontology categories tested.
Supplementary References
1. Price AL, Patterson NJ, Plenge RM, et al. Principal componentsanalysis corrects for stratification in genome-wide associationstudies. Nat Genet 2006;38:904–909.
2. Li Y, Willer CJ, Ding J, et al. MaCH: using sequence and genotypedata to estimate haplotypes and unobserved genotypes. GenetEpidemiol 2010;34:816–834.
3. Skol AD, Scott LJ, Abecasis GR, et al. Joint analysis is moreefficient than replication-based analysis for two-stage genome-wide association studies. Nat Genet 2006;38:209–213.
4. Johnson T, Gaunt TR, Newhouse SJ, et al. Blood pressure lociidentified with a gene-centric array. Am J Hum Genet 2011;89:688–700.
5. Nyholt DR. A simple correction for multiple testing for single-nucleotide polymorphisms in linkage disequilibrium with eachother. Am J Hum Genet 2004;74:765–769.
6. Li MX, Yeung JM, Cherny SS, et al. Evaluating the effectivenumbers of independent tests and significant p-value thresholdsin commercial genotyping arrays and public imputation referencedatasets. Hum Genet 2012;131:747–756.
7. Yi Q, Wang PP, Krahn M. Improving the accuracy of long-termprognostic estimates in hepatitis C virus infection. J Viral Hepat2004;11:166–174.
8. Backes C, Keller A, Kuentzer J, et al. GeneTrail—advanced geneset enrichment analysis. Nucleic Acids Res 2007;35:W186–W192.
9. Pruim RJ, Welch RP, Sanna S, et al. LocusZoom: regional visual-ization of genome-wide association scan results. Bioinformatics2010;26:2336–2337.
10. Romeo S, Kozlitina J, Xing C, et al. Genetic variation in PNPLA3confers susceptibility to nonalcoholic fatty liver disease. NatGenet 2008;40:1461–1465.
11. Chalasani N, Guo X, Loomba R, et al. Genome-wide associationstudy identifies variants associated with histologic features ofnonalcoholic fatty liver disease. Gastroenterology 2010;139:1567–1576.
12. Ge D, Fellay J, Thompson AJ, et al. Genetic variation in IL28Bpredicts hepatitis C treatment-induced viral clearance. Nature2009;461:399–401.
13. Miki D, Ochi H, Hayes CN, et al. Variation in the DEPDC5 locus isassociated with progression to hepatocellular carcinoma in
chronic hepatitis C virus carriers. Nat Genet 2011;43:797–800.14. Kumar V, Kato N, Urabe Y, et al. Genome-wide association studyidentifies a susceptibility locus for HCV-induced hepatocellularcarcinoma. Nat Genet 2011;43:455–458.
15. Nalpas B, Lavialle-Meziani R, Plancoulaine S, et al. Interferongamma receptor 2 gene variants are associated with liver fibrosisin patients with chronic hepatitis C infection. Gut 2010;59:1120–1126.
16. Huang H, Shiffman ML, Cheung RC, et al. Identification of twogene variants associated with risk of advanced fibrosis in pa-tients with chronic hepatitis C. Gastroenterology 2006;130:1679–1687.
17. Huang H, Shiffman ML, Friedman S, et al. A 7 gene signatureidentifies the risk of developing cirrhosis in patients with chronichepatitis C. Hepatology 2007;46:297–306.
18. Chambers JC, Zhang W, Sehmi J, et al. Genome-wide associationstudy identifies loci influencing concentrations of liver enzymes inplasma. Nat Genet 2011;43:1131–1138.
19. Kamatani Y, Matsuda K, Okada Y, et al. Genome-wide associa-tion study of hematological and biochemical traits in a Japanesepopulation. Nat Genet 2010;42:210–215.
20. Yuan X, Waterworth D, Perry JR, et al. Population-based genome-wide association studies reveal six loci influencing plasma levelsof liver enzymes. Am J Hum Genet 2008;83:520–528.
21. Tian C, Stokowski RP, Kershenobich D, et al. Variant in PNPLA3is associated with alcoholic liver disease. Nat Genet 2010;42:21–23.
22. Cai T, Dufour JF, Muellhaupt B, et al. Viral genotype-specific roleof PNPLA3, PPARG, MTTP, and IL28B in hepatitis C virus-associ-ated steatosis. J Hepatol 2011;55:529–535.
23. Trepo E, Pradat P, Potthoff A, et al. Impact of patatin-like phos-pholipase-3 (rs738409 C�G) polymorphism on fibrosis progres-sion and steatosis in chronic hepatitis C. Hepatology 2011;54:60–69.
24. Valenti L, Rumi M, Galmozzi E, et al. Patatin-like phospholipasedomain-containing 3 I148M polymorphism, steatosis, and liverdamage in chronic hepatitis C. Hepatology 2011;53:791–799.
25. Suppiah V, Moldovan M, Ahlenstiel G, et al. IL28B is associatedwith response to chronic hepatitis C interferon-alpha and ribavirintherapy. Nat Genet 2009;41:1100–1104.
26. Tanaka Y, Nishida N, Sugiyama M, et al. Genome-wide associa-tion of IL28B with response to pegylated interferon-alpha andribavirin therapy for chronic hepatitis C. Nat Genet 2009;41:1105–1109.
27. Rauch A, Kutalik Z, Descombes P, et al. Genetic variation inIL28B is associated with chronic hepatitis C and treatment fail-ure: a genome-wide association study. Gastroenterology 2010;138:1338–1345, 45e1–7.
28. Thomas DL, Thio CL, Martin MP, et al. Genetic variation in IL28Band spontaneous clearance of hepatitis C virus. Nature 2009;461:798–801.
29. Bochud PY, Bibert S, Kutalik Z, et al. IL28B alleles associatedwith poor hepatitis C virus (HCV) clearance protect against in-flammation and fibrosis in patients infected with non-1 HCV
genotypes. Hepatology 2012;55:384–394.
H
H
A
T
NN
e to blood (eg, health workers) and invasive protocols (eg, tattoo, piercing).
Month 2012 LIVER FIBROSIS IN HCV–INFECTED PATIENTS 9.e4
Supplementary Table 1. Cinical and Demographic Characteri
Covariate Category Cornell coh
SexMale 33 (51.6Female 31 (48.4
METAVIR scoreF0 8 (12.5F1 27 (42.2F2 —F3 24 (37.5F4 5 (7.8)
Alcoholconsumption
Low (�40 g/d) 53 (82.8Higha (�40 g/d) 11 (17.2NA —
CV mode ofacquisition
IDU 25 (39.1Blood transfusion 15 (23.4Otherb/NA 24 (37.5
CV genotype1 46 (71.92 11 (17.23 6 (9.4)4 1 (1.6)Other/NA —
ge at infectionPatients with available data 37 (57.8Age at infection �20 y 12 (18.8Age at infection �20 y 25 (39.1Mean (SD) age at infection (y) 25.05 (10.2Mean (SD) duration of infection (y) 25.78 (9.57Mean (SD) FPR (METAVIR units/y) 0.13 (0.28
otal 64
OTE. Values are expressed as n (%) unless otherwise noted.A, not available.
aThis category includes past heavy drinkers.bOther modes of HCV acquisition include situations at risk for exposur
stics of the Studied Replication Cohorts
ortMarseilles
cohortInternational
cohortAustralian
cohort Total
) 160 (62.5) 261 (40.7) 155 (70.8) 609 (51.6)) 96 (37.5) 381 (59.3) 64 (29.2) 572 (48.4)
) 33 (12.9) 112 (17.4) 13 (5.9) 166 (14.1)) 87 (34.0) 247 (38.5) 65 (29.7) 426 (36.1)
70 (27.3) 162 (25.2) 73 (33.3) 305 (25.8)) 37 (14.5) 65 (10.1) 32 (14.6) 158 (13.4)
29 (11.3) 56 (8.7) 36 (16.4) 126 (10.7)
) 217 (84.8) — — 270 (22.9)) 27 (10.5) — — 38 (3.2)
12 (4.7) 642 (100.0) 219 (100.0) 873 (73.9)
) — 135 (21.0) — 160 (13.5)) — 33 (5.1) — 48 (4.1)) 256 (100.0) 474 (73.8) 219 (100.0) 973 (82.4)
) 169 (66.0) — 219 (100.0) 434 (36.7)) 6 (2.3) — — 17 (1.4)
48 (18.8) — — 54 (4.6)13 (5.1) — — 14 (1.2)20 (7.8) 642 (100.0) — 662 (56.1)
) 125 (48.8) 292 (45.5) 219 (100.0) 673 (57.0)) 51 (19.9) 62 (9.7) 3 (1.4) 128 (10.8)) 73 (28.5) 141 (22.0) 216 (98.6) 455 (38.5)0) 24.36 (12.65) 28.87 (14.21) 42.21 (8.26) 32.66 (13.92)) 22.90 (9.50) 16.95 (11.16) 20.20 (8.48) 19.60 (10.30)) 0.11 (0.20) 0.21 (0.37) 0.12 (0.12) 0.16 (0.28)
256 642 219 1181

9.e5 PATIN ET AL GASTROENTEROLOGY Vol. xx, No. x
Supplementary Figure 1. Quantile-quantile plots of GWA of liverfibrosis using the binary F0–1/F3–4 phenotype. This analysis includes949 patients genotyped or imputed for 780,650 SNPs using an additivegenetic model. (A) P values using logistic regression and (B) P valuesusing logistic regression adjusted on the first 4 principal components ofthe principal component analysis (Supplementary Figure 2). No signifi-cant deviations from expectations were observed. The genomic infla-
tion factor � was equal to 1.013.
Month 2012 LIVER FIBROSIS IN HCV–INFECTED PATIENTS 9.e6
Supplementary Figure 2. Principal component (PC) analysis of the 2 primary cohorts analyzed in this study. Stratification was assessed usingEIGENSOFT v3.0,1 selecting only SNPs that were present in both BeadChips and that were in linkage equilibrium (r2 � 0.1). Ancestry outliers wereremoved by EIGENSOFT default removal procedure. After outlier removal, none of the 10 first principal components produced a significant difference
in ancestry between cases and controls. Of note, a slight difference between the French and Swiss cohorts was observed on PC2.Supplementary Table 2. SNPs Achieving P � 10�6 Using the Different Fibrosis Phenotypes in the Primary Cohort of 1161Patients With Chronic HCV Infection
SNP Chromosome Position Closest geneDistance
(kilobases) m/Ma MAF Phenotype ModelaGenotypes
(n) Effectb P value
rs1371500 2 35262635 AC013442.1 35 G/A 0.42 Binary F0–1/F3–4 Dominant AA (312)GG/GA (637)
10.49 (0.36–0.65)
3.2 � 10�7
rs6469209 8 109948039 TMEM74 79 A/G 0.34 Binary F0–1/F3–4 Additive GG (411)AG (428)AA (110)
11.62 (1.33–1.97)2.62 (1.77–3.88)
9.3 � 10�7
rs1861612 2 230230642 DNER Intronic G/A 0.44 Binary F0/F4 Dominant AA (84)GG/GA (225)
14.50 (2.57–8.00)
1.7 � 10�8
rs11217879 11 119846933 ARHGEF12 Intronic C/T 0.23 Duration F0–1/F3–4 Recessive CT/TT (850)CC (21)
15.87 (3.08–11.21)
5.8 � 10�7
rs585663 18 56321863 MC4R 131 G/A 0.37 Duration F0–1/F3–4 Additive AA (335)GA (423)GG (114)
11.52 (1.29–1.80)2.31 (1.66–3.24)
7.9 � 10�7
rs4374383 2 112487241 MERTK Intronic A/G 0.41 Duration F0–1/F3–4HCV acquisition �
transfusion
Recessive GG/GA (232)AA (59)
10.27 (0.15–0.49)
2.7 � 10�8
rs4546191 4 140066658 CCRN4L 90 G/A 0.21 Duration F0–1/F3–4Age at infection �20 y
Dominant AA (315)GG/GA (194)
12.17 (1.64–2.87)
8.2 � 10�8
rs17395886 4 162498835 FSTL5 26 A/C 0.14 Duration F0–1/F3–4HCV genotype � 1
Dominant CC (373)AA/AC (128)
12.61 (1.88–3.64)
8.6 � 10�8
rs2986018 10 105208349 CALHM1 Synonymous T/C 0.24 Duration F0–1/F3–4Age at infection �20 y
Recessive CC/CT (459)TT (28)
13.87 (2.49–6.03)
3.2 � 10�7
rs4712036 6 53528462 GCLC 11 C/A 0.25 Duration F0–1/F3–4Sex � female
Additive AA (223)AC (181)CC (20)
12.06 (1.55–2.72)4.24 (2.40–7.40)
7.9 � 10�7
rs4855890 3 118194883 AC092415.1 50 G/A 0.45 Duration F0–1/F3–4Age at infection �20 y
Dominant AA (146)GG/GA (369)
10.47 (0.35–0.63)
9.3 � 10�7
rs11967920 6 22853269 HDGFL1 175 T/C 0.27 Duration F0/F4 Additive CC (153)TC (97)TT (18)
11.93 (1.50–2.89)3.72 (2.25–8.35)
9.3 � 10�7
rs16851720 3 142945988 RNF7 Intronic C/A 0.20 QTF Additive AA (678)CA (351)CC (35)
0�0.26 (�0.37 to �0.15)�0.52 (�0.63 to �0.41)
4.5 � 10�7
aThe first allele m refers to the minor allele and M refers to the major allele in the combined cohort. The genetic model is defined on the basis of the minor allele.b
Effects correspond to odds ratios when the binary phenotype is considered, HRs when the duration phenotype is considered, and the standardized difference in QTF rates, relative to the firstgenotype (Patients and Methods), when the quantitative QTF phenotype is considered.
9.e7 PATIN ET AL GASTROENTEROLOGY Vol. xx, No. x
Supplementary Figure 3. Manhattan plots of genome-wide analyses of liver fibrosis using (A) the binary F0/F4 phenotype (309 F0/F4 patients) and(B) the duration F0/F4 phenotype (268 F0/F4 patients with available duration of infection). Larger points correspond to SNPs producing a P value�10�6. All the analyses included 780,650 genotyped or imputed SNPs. Additive, dominant, and recessive genetic models were tested for each SNP,
and the P value for the best model is reported.
Supplementary Table 3. List of the 96 SNPs Selected for Replication
SNPa m Chromosome Position Closest gene Distanceb M MAFDiscoveryP value Effectc Model Phenotype Stratum
ReplicationP valued Effectc,e
rs1371500 G 2 35262635 AC013442.1 35 A 0.42 3.2 � 10�7 0.49 (0.36–0.65) Dominant Binary F0–1/F3–4 — .13 0.72 (0.40–1.29)rs6469209 A 8 109948039 TMEM74 79 G 0.34 9.3 � 10�7 1.62 (1.33–1.97) Additive Binary F0–1/F3–4 — .72 —rs7800244 T 7 47746494 PKD1L1 34 G 0.18 1.8 � 10�6 0.49 (0.37–0.66) Dominant Binary F0–1/F3–4 — .012 0.67 (0.47–0.95)rs3797713 T 5 168961059 CCDC99 0 C 0.31 2.8 � 10�6 1.57 (1.30–1.91) Additive Binary F0–1/F3–4 — .97 —rs2889360 T 4 189194794 ZFP42 32 G 0.39 2.9 � 10�6 1.57 (1.30–1.90) Additive Binary F0–1/F3–4 — .57 —rs621996 G 1 70356477 LRRC7 0 A 0.38 5.3 � 10�6 0.52 (0.40–0.69) Dominant Binary F0–1/F3–4 — NA NArs10254637 A 7 43091718 Y_RNA.355 11 C 0.37 5.8 � 10�6 0.38 (0.25–0.59) Recessive Binary F0–1/F3–4 — NA NArs612422 G 1 101369817 S1PR1 105 A 0.23 1.1 � 10�5 3.95 (2.09–7.49) Recessive Binary F0–1/F3–4 — .45 1.05 (0.48–2.26)rs4142278 T 7 133955966 BPGM 26 C 0.29 1.1 � 10�5 0.55 (0.42–0.72) Dominant Binary F0–1/F3–4 — .09 0.80 (0.58–1.11)rs3788684 T 22 45215256 CELSR1 0 C 0.32 1.4 � 10�5 0.30 (0.16–0.53) Recessive Binary F0–1/F3–4 — .80 —rs4670450 A 2 35288608 AC011748.1 806 G 0.47 1.6 � 10�5 0.53 (0.39–0.70) Dominant Binary F0–1/F3–4 — .25 0.88 (0.62–1.26)rs1861612 G 2 230230642 DNER 0 A 0.44 1.7 � 10�8 4.50 (2.57–8.00) Dominant Binary F0/F4 — .99 —rs7833092 T 8 124272396 FAM83A 0 C 0.21 1.6 � 10�6 3.46 (2.05–5.84) Dominant Binary F0/F4 — .27 1.20 (0.66–2.16)rs9294445 A 6 90459203 MDN1 0 G 0.49 3.1 � 10�6 0.26 (0.14–0.48) Dominant Binary F0/F4 — .42 0.94 (0.51–1.72)rs7606036 T 2 181022764 CWC22 443 G 0.48 3.8 � 10�6 0.25 (0.13–0.47) Dominant Binary F0/F4 — .07 0.62 (0.34–1.15)rs17503541 T 2 47661656 KCNK12 11 C 0.13 8.5 � 10�6 7.21 (2.48–20.94) Additive Binary F0/F4 — .42 1.05 (0.66–1.68)rs7115499 A 11 74383250 NEU3 0 G 0.09 1.0 � 10�5 4.62 (2.10–10.16) Dominant Binary F0/F4 — .07 2.32 (0.89–6.22)rs2629751 G 12 102945938 GLT8D2 0 A 0.32 1.6 � 10�5 11.24 (2.64–47.89) Recessive Binary F0/F4 — .003 4.47 (1.36–14.71)rs10503274 T 8 4593218 AC009707.1 716 C 0.37 2.2 � 10�5 2.74 (1.71–4.41) Dominant Binary F0/F4 — .32 1.14 (0.67–1.94)rs6485480 T 11 43917108 ALKBH3 18 C 0.23 2.5 � 10�5 2.62 (1.71–4.00) Additive Binary F0/F4 — .032 1.54 (1.00–2.42)rs7812662 T 8 31645322 NRG1 0 A 0.37 3.8 � 10�5 0.51 (0.36–0.72) Additive Binary F0/F4 — .05 0.72 (0.49–1.06)rs322193 G 17 22726565 WSB1 62 T 0.39 4.8 � 10�5 0.48 (0.32–0.70) Additive Binary F0/F4 — .27 0.88 (0.57–1.33)rs369328 T 6 90621963 CASP8AP2 0 C 0.48 5.4 � 10�5 0.33 (0.19–0.60) Dominant Binary F0/F4 — .98 —rs11217879 C 11 119846933 ARHGEF12 0 T 0.23 5.8 � 10�7 5.87 (3.08–11.21) Recessive Duration F0–1/F3–4 — .88 —rs585663 G 18 56321863 MC4R 131 A 0.37 7.9 � 10�7 1.52 (1.29–1.80) Additive Duration F0–1/F3–4 — .16 1.15 (0.87–1.52)rs1288697 C 3 71407714 hsa-mir-1284 266 T 0.38 2.2 � 10�6 1.39 (1.19–1.62) Dominant Duration F0–1/F3–4 — .64 —rs1889192 T 1 227917279 RP11–108F13.2 25 C 0.18 3.1 � 10�6 1.59 (1.32–1.92) Additive Duration F0–1/F3–4 — .86 —rs7997656 T 13 52721099 AL450423.1 119 C 0.48 3.3 � 10�6 0.69 (0.59–0.80) Additive Duration F0–1/F3–4 — .09 0.82 (0.62–1.09)rs7962629 G 12 7037031 C1S 0 A 0.14 3.3 � 10�6 1.72 (1.39–2.14) Additive Duration F0–1/F3–4 — .42 1.04 (0.68–1.60)rs191963 T 21 19840379 C1QBPP 213 C 0.31 3.5 � 10�6 0.33 (0.20–0.57) Recessive Duration F0–1/F3–4 — .17 0.71 (0.34–1.47)rs6717002 C 2 62488871 TMEM17 92 A 0.39 4.4 � 10�6 1.45 (1.24–1.70) Additive Duration F0–1/F3–4 — .90 —rs2689700 A 10 95936510 PLCE1 0 G 0.18 4.5 � 10�6 3.54 (2.24–5.60) Recessive Duration F0–1/F3–4 — NA NArs10805539 A 5 29967494 7SK.199 17 G 0.36 4.8 � 10�6 1.73 (1.37–2.20) Dominant Duration F0–1/F3–4 — NA NArs11807102 G 1 80040322 RP11–339A11.1 290 A 0.14 5.0 � 10�6 0.07 (0.01–0.48) Recessive Duration F0–1/F3–4 — NA NArs2045008 A 4 72293261 SLC4A4 0 G 0.1 5.1 � 10�6 21.21 (8.60–52.32) Recessive Duration F0–1/F3–4 — NA NArs7012730 G 8 135131419 RP11–513H8.1 161 A 0.04 5.8 � 10�6 2.27 (1.66–3.12) Additive Duration F0–1/F3–4 — NA NArs17050970 C 4 141025471 MAML3 0 T 0.06 1.1 � 10�5 0.43 (0.28–0.67) Additive Duration F0–1/F3–4 — .83 —rs7716424 G 5 52002870 PELO 117 A 0.24 1.2 � 10�5 1.49 (1.24–1.79) Additive Duration F0–1/F3–4 — .66 —rs1022956 T 14 46631086 MDGA2 0 C 0.15 1.4 � 10�5 1.70 (1.35–2.13) Dominant Duration F0–1/F3–4 — .70 —rs7521424 G 1 101248489 DPH5 0 A 0.29 3.8 � 10�5 2.17 (1.55–3.04) Recessive Duration F0–1/F3–4 — .66 —rs11967920 T 6 22853269 HDGFL1 175 C 0.27 9.3 � 10�7 1.93 (1.50–2.49) Additive Duration F0/F4 — .23 1.13 (0.82–1.55)rs17801257 A 20 58325915 hsa-mir-646 9 G 0.13 1.3 � 10�6 2.40 (1.70–3.38) Dominant Duration F0/F4 — .69 —rs17886182 T 10 101954526 CHUK 0 G 0.03 6.0 � 10�6 0.15 (0.05–0.40) Additive Duration F0/F4 — .31 0.82 (0.38–1.78)rs2288002 T 16 70614783 DHODH 0 C 0.4 2.1 � 10�5 1.59 (1.27–2.00) Additive Duration F0/F4 — .38 1.05 (0.76–1.45)rs9366415 T 6 21971878 RP3–322L4.2 261 C 0.36 2.5 � 10�6 2.38 (1.67–3.39) Additive Binary F0–1/F3–4 Age at infection �20 y .34 1.15 (0.59–2.23)rs4778582 G 15 78208021 FAH 24 A 0.31 2.8 � 10�6 1.83 (1.40–2.39) Additive Binary F0–1/F3–4 Sex � male .14 1.21 (0.85–1.71)rs7791822 A 7 120046754 KCND2 0 G 0.17 3.9 � 10�6 2.11 (1.52–2.92) Additive Binary F0–1/F3–4 HCV genotype � 1 .45 1.04 (0.57–1.89)rs908988 C 16 84542101 IRF8 28 T 0.33 5.0 � 10�6 0.42 (0.30–0.60) Additive Binary F0–1/F3–4 Sex � female .58 —rs1441807 T 14 87584615 GPR65 36 C 0.26 5.5 � 10�6 0.49 (0.36–0.67) Additive Binary F0–1/F3–4 Age at infection �20 y .49 0.99 (0.60–1.63)rs3742578 T 14 56742468 AL391152.1 0 C 0.15 7.4 � 10�6 0.41 (0.28–0.61) Additive Binary F0–1/F3–4 HCV genotype � 1 .25 0.81 (0.43–1.51)rs9821978 C 3 167471088 BCHE 433 T 0.47 2.5 � 10�5 1.72 (1.33–2.22) Additive Binary F0–1/F3–4 HCV genotype � 1 .40 1.06 (0.68–1.64)rs4374383 A 2 112487241 MERTK 0 G 0.41 2.7 � 10�8 0.27 (0.15–0.49) Recessive Duration F0–1/F3–4 HCV acquisition � transfusion .013 0.19 (0.02–0.98)rs4546191 G 4 140066658 CCRN4L 90 A 0.21 8.2 � 10�8 2.17 (1.64–2.87) Dominant Duration F0–1/F3–4 Age at infection �20 y .99 —rs17395886 A 4 162498835 FSTL5 26 C 0.15 8.6 � 10�8 2.61 (1.88–3.64) Dominant Duration F0–1/F3–4 HCV genotype � 1 .17 1.45 (0.68–3.11)rs2986018 T 10 105208349 CALHM1 0 C 0.25 3.2 � 10�7 3.87 (2.49–6.03) Recessive Duration F0–1/F3–4 Age at infection �20 y .72 —rs4712036 C 6 53528462 GCLC 11 A 0.25 7.9 � 10�7 2.06 (1.55–2.72) Additive Duration F0–1/F3–4 Sex � female .29 1.14 (0.72–1.80)rs4855890 G 3 118194883 AC092415.1 50 A 0.45 9.3 � 10�7 0.47 (0.35–0.63) Dominant Duration F0–1/F3–4 Age at infection �20 y .64 —
Month
20
12
LIVERFIB
RO
SIS
INH
CV–IN
FECTED
PA
TIENTS
9.e8

Supplementary Table 3. Continued
SNPa m Chromosome Position Closest gene Distanceb M MAFDiscoveryP value Effectc Model Phenotype Stratum
ReplicationP valued Effectc,e
rs7662010 A 4 41528389 PHOX2B 83 G 0.04 1.7 � 10�6 5.90 (3.14–11.10) Additive Duration F0–1/F3–4 Age at infection �20 y .06 2.61 (0.87–7.89)rs3740088 C 10 44753151 TMEM72 1 A 0.23 1.9 � 10�6 2.68 (1.80–3.99) Dominant Duration F0–1/F3–4 Age at infection �20 y .68 —rs630760 C 3 125631864 KALRN 0 T 0.38 1.9 � 10�6 2.75 (1.89–3.98) Recessive Duration F0–1/F3–4 Sex � male .88 —rs2769151 T 9 111648531 PALM2 0 C 0.29 2.4 � 10�6 3.16 (2.05–4.86) Recessive Duration F0–1/F3–4 HCV genotype � 1 .95 —rs730453 C 8 138166751 FAM135B 1045 T 0.13 2.9 � 10�6 1.99 (1.53–2.60) Additive Duration F0–1/F3–4 Age at infection �20 y .09 1.39 (0.88–2.22)rs12623569 C 2 214502988 SPAG16 0 A 0.29 3.0 � 10�6 0.43 (0.30–0.62) Dominant Duration F0–1/F3–4 Sex � female .27 0.83 (0.46–1.49)rs1927640 C 9 16446965 BNC2 0 T 0.25 3.2 � 10�6 4.81 (2.78–8.32) Recessive Duration F0–1/F3–4 Sex � male .51 —rs7148759 G 14 46603845 MDGA2 0 A 0.16 3.6 � 10�6 2.07 (1.54–2.78) Additive Duration F0–1/F3–4 Sex � female .56 —rs883924 A 9 92221351 LOC340515 43 G 0.23 3.7 � 10�6 3.86 (2.31–6.43) Recessive Duration F0–1/F3–4 Age at infection �20 y .004 2.39 (1.30–4.38)rs2118036 G 4 148935940 ARHGAP10 0 A 0.09 3.8 � 10�6 20.29 (7.24–56.88) Recessive Duration F0–1/F3–4 HCV acquisition � transfusion .06 9.14 (0.83–100.84)rs9380516 T 6 35610180 TULP1 21 C 0.18 4.0 � 10�6 4.44 (2.61–7.53) Recessive Duration F0–1/F3–4 Sex � male .041 4.71 (1.13–19.66)rs6948054 A 7 136331341 CHRM2 0 G 0.33 4.0 � 10�6 0.51 (0.38–0.68) Dominant Duration F0–1/F3–4 Sex � male .90 —rs6883997 T 5 169026257 DOCK2 0 C 0.34 4.2 � 10�6 1.67 (1.34–2.07) Additive Duration F0–1/F3–4 Sex � male .79 —rs1552458 A 17 40654171 FMNL1 1 G 0.31 4.8 � 10�6 2.77 (1.87–4.10) Recessive Duration F0–1/F3–4 Sex � male .72 —rs2041545 A 9 125690336 DENND1A 0 G 0.16 5.2 � 10�6 0.46 (0.33–0.65) Dominant Duration F0–1/F3–4 Sex � male .68 —rs10759021 G 9 8931696 PTPRD 0 A 0.33 5.6 � 10�6 3.16 (1.99–5.00) Recessive Duration F0–1/F3–4 HCV genotype � 1 .85 —rs7869926 A 9 75300174 AL449083.1 204 G 0.03 8.4 � 10�6 0.10 (0.02–0.41) Additive Duration F0–1/F3–4 HCV genotype � 1 .32 0.78 (0.27–2.27)rs1959815 C 14 46615792 MDGA2 0 T 0.16 1.0 � 10�5 2.02 (1.50–2.72) Additive Duration F0–1/F3–4 Sex � female .57 —rs818927 C 5 162029260 GABRG2 514 A 0.15 1.2 � 10�5 19.71 (6.76–57.49) Recessive Duration F0–1/F3–4 HCV genotype � 1 .83 —rs1280396 T 15 55519020 CGNL1 0 C 0.17 1.3 � 10�5 7.59 (3.77–15.28) Recessive Duration F0–1/F3–4 HCV acquisition � IDU .58 —rs1489381 T 6 75072447 RP11–9G10.1 23 C 0.17 1.5 � 10�5 1.84 (1.43–2.37) Additive Duration F0–1/F3–4 Sex � male .29 1.16 (0.70–1.90)rs8097746 C 18 44894780 DYM 0 T 0.4 1.8 � 10�5 0.58 (0.45–0.74) Additive Duration F0–1/F3–4 HCV genotype � 1 .06 0.44 (0.15–1.29)rs2878902 G 18 44904435 DYM 0 T 0.26 2.0 � 10�5 0.52 (0.38–0.70) Additive Duration F0–1/F3–4 HCV genotype � 1 .12 0.59 (0.22–1.53)rs582970 C 18 56315439 MC4R 124 T 0.37 2.0 � 10�5 1.54 (1.30–1.82) Additive Duration F0–1/F3–4 HCV genotype � 1 .39 1.16 (0.44–3.02)rs1456087 G 4 27113504 AC097380.1 131 A 0.43 4.5 � 10�5 1.49 (1.23–1.80) Additive Duration F0–1/F3–4 Age at infection �20 y .25 1.13 (0.78–1.64)rs6959619 G 7 135453094 AC009784.1 127 A 0.15 3.5 � 10�6 2.35 (1.64–3.37) Dominant Adjusted binary F0–1/F3–4 — .49 1.02 (0.19–5.43)rs16879352 G 5 51343828 ISL1 618 A 0.26 1.0 � 10�5 1.41 (1.19–1.89) Additive Adjusted binary F0–1/F3–4 — .80 —rs9314362 A 8 28132190 ELP3 28 C 0.35 2.4 � 10�5 1.43 (1.11–1.84) Additive Adjusted binary F0–1/F3–4 — .63 —rs1800849 T 11 73397813 UCP3 0 C 0.22 3.6 � 10�5 0.53 (0.39–0.72) Additive Adjusted binary F0–1/F3–4 — .45 0.90 (0.19–4.18)rs2625904 C 12 33972446 Y_RNA.315 54 T 0.02 6.2 � 10�5 5.76 (2.44–13.59) Dominant Adjusted binary F0–1/F3–4 — .51 —rs697315 C 11 35595348 FJX1 1 A 0.34 2.5 � 10�7 0.34 (0.21–0.55) Recessive Adjusted duration F0–1/F3–4 — .17 0.59 (0.18–1.91)rs16851720 C 3 142945988 RNF7 0 A 0.2 4.5 � 10�7 �0.28 (0.06) Additive QTF — .009 �0.16 (0.07)rs1472487 A 8 118375544 SNORA31.18 19 G 0.09 2.1 � 10�6 0.28 (0.06) Additive QTF — NA NArs830672 G 5 165524399 AC013400.1 382 T 0.18 2.1 � 10�6 0.27 (0.06) Additive QTF — .11 0.09 (0.07)rs10249472 G 7 136049718 PSMC1P3 0 A 0.46 3.1 � 10�6 �0.17 (0.04) Additive QTF — NA NArs106380 G 8 9072488 PPP1R3B 27 C 0.42 7.8 � 10�6 0.27 (0.06) Additive QTF — .80 —rs1409697 C 9 32872911 APTX 90 T 0.33 2.0 � 10�5 �0.19 (0.05) Additive QTF — .12 �0.07 (0.06)rs1852008 C 7 77704647 MAGI2 0 A 0.14 2.9 � 10�5 �0.35 (0.08) Additive QTF — .06 �0.12 (0.07)rs6980978 T 8 11311964 C8orf12 0 C 0.4 6.8 � 10�5 0.18 (0.05) Additive QTF — .22 0.04 (0.05)
m, minor allele; M, major allele.aAll SNPs presented a P value �5 � 10�5 in one of the genome-wide analyses of our primary cohort, that is, using the binary F0–1/F3–4 and F0/F4 phenotypes, the duration F0–1/F3–4 and F0/F4 phenotypes, or the QTF phenotype, as well as adjusted and stratifiedanalyses of the 140,797 SNPs providing P � .05 for the binary and duration F0–1/F3–4 phenotypes. SNPs in linkage disequilibrium (r2 � 0.1) with best signals were not considered in the selection. Adjusted analyses were performed on sex, HCV genotype, HCVmode of acquisition, and age at infection covariates.bDistances to the closest gene are reported in kilobases.cEffects correspond to odds ratios (and 95% confidence interval in parentheses) when the binary phenotype is considered, HRs (and 95% confidence interval in parentheses) when the duration phenotype is considered, and linear regression coefficients (and SE inparentheses) when the QTF phenotype is considered. NA stands for not available, corresponding to genotyped SNPs that did not pass quality control filters.dP values in our replication cohort (n � 962) were obtained using the same phenotype and model as the one used to identify the SNPs in the primary cohort (one-sided test). Consequently, P values �.5 were obtained for SNPs showing association in the oppositedirection with respect to the association in the primary cohort. P values of the 7 SNPs showing true replication (P � .05) are in bold.eWe only reported the effects of SNPs that were in the same direction as the one of the association in the primary cohort.
9.e9
PA
TINET
AL
GA
STR
OEN
TERO
LOG
YVol.
xx,N
o.x

a
Month 2012 LIVER FIBROSIS IN HCV–INFECTED PATIENTS 9.e10
Supplementary Table 4. Association With Liver Fibrosis of Demographic and Clinical Characteristics of HCV-Infected Patientsin the Primary Cohort Using Multivariate Logistic Regression
Covariate Covariate classes Class at riska Odds ratioa (95% CI) P valuea
Sex Male/female Male 1.13 (1.04–1.22) 2.1 � 10�3
Alcohol consumption Low/high High (�40 g/d) 1.14 (1.03–1.26) 1.2 � 10�2
HCV mode of acquisition IDU/blood transfusion Blood transfusion 1.14 (1.05–1.24) 1.6 � 10�3
HCV genotype 1/non-1 Non-1 1.10 (1.02–1.19) 1.1 � 10�2
Age at infection �20 y/�20 y �20 y 1.12 (1.03–1.21) 5.1 � 10�3
The binary F0–1/F3–4 phenotype was used as the dependent variable.
Supplementary Figure 4. Regional plots for (A) rs16851720 (located within RNF7) and (B) rs4374383 (located within MERTK), the 2 SNPs thatprovided genome-wide significant evidence for association with liver fibrosis progression in the combined cohort. The 2 most associated SNPs arerepresented by purple dots. Colors of the other SNPs are scaled by r2 value with the 2 most associated SNPs. The blue line represents variation in
recombination rate. Plots were generated by LocusZoom.9
H
Isw
t
t
9.e11 PATIN ET AL GASTROENTEROLOGY Vol. xx, No. x
Supplementary Table 5. Tests for Replication of Signals Previously Identified in Large Association Studies of Liver Fibrosis–Related Phenotypes in Non-HCV Patients or Other HCV-Related Phenotypes
Initial study Reference PhenotypeCohort HCV
status Best signalCandidate
gene Ra
Our study
Rb Phenotypeb Modelb P valueb
Romeo et al,2008c
10 Nonalcoholic fatty liver disease Negative rs738409 PNPLA3 G G Binary Additive .00013
Chalanasi etal, 2010
11 Nonalcoholic fatty liverdisease–related liver fibrosis
Negative rs343064 HERPUD2 A G Binary Dominant .58
Ge et al,2009d
12 Chronic HCVinfection/clearance
Positive rs8099917 IL28B Ge Te QTF Additive .018
Miki et al,2011
13 Hepatocellular carcinoma Positive rs1012068 DEPDC5 G T Binary Additive .23
Kumar et al,2011
14 Hepatocellular carcinoma Positive rs2596542 MICA A G Duration Recessive .55
Nalpas et al,2010f
15 Liver fibrosis Positive rs9976971 IFNGR2 A A Duration Recessive .0094
Huang et al,2006
16 Liver fibrosis Positive rs3179861g DDX5 C C Binary Recessive .75
Huang et al,2006
16 Liver fibrosis Positive rs17610395 CPT1A A A Binary Dominant .06
Huang et al,2007
17 Liver fibrosis Positive rs4986791 TLR4 C C Binary Dominant .57
Huang et al,2007
17 Liver fibrosis Positive rs886277 TRPM5 C C Binary Recessive .43
Huang et al,2007
17 Liver fibrosis Positive rs2290351 — A A Binary Recessive .73
Huang et al,2007
17 Liver fibrosis Positive rs4290029h — G G Binary Dominant .19
uang et al,2007
17 Liver fibrosis Positive rs17740066 — A A Binary Recessive .71
Huang et al,2007
17 Liver fibrosis Positive rs2878771 AQP2 G G Binary Dominant 1.00
NOTE. These studies include GWA studies of liver diseases in non-HCV patients (rows 1 and 2), GWA studies of HCV-related phenotypes other than liver fibrosis (rows3–5), and large studies of candidate genes for HCV-induced liver fibrosis (rows 6–14).aThe risk allele in the initial study.bFor the first 5 rows in this table, exact replication could not be tested because phenotypes of the initial studies were not directly comparable to stages of liver fibrosis.n these 5 cases, we tested in our primary cohort the binary F0–1/F3–4, duration F0–1/F3–4, and QTF phenotypes. For the 9 remaining rows corresponding totudies of HCV-induced liver fibrosis, exact replication was tested in our primary cohort (ie, the allele at risk, fibrosis phenotype, and genetic models of the initial studyere used to test replication).
cThe PNPLA3 rs738409 SNP has also been associated with GWA studies of liver fat content9 and levels of alanine aminotransferase liver enzyme18–20 and bycandidate gene approaches with alcoholic liver disease21 and liver steatosis and fibrosis in patients with chronic HCV infection.22–24 Of note, rs738409 was imputedin our primary cohort, with an imputation accuracy of 0.985.dThe IL28B rs8099917 SNP was associated with both treatment-induced HCV clearance12,25,26 and spontaneous HCV clearance.27,28
eEffects for IL28B rs8099917 SNP are in opposite directions: the allele G associated with poor HCV clearance protects against liver fibrosis, as recently reportedby Bochud et al.29 Of note, cohort samples of our study and this previous study are largely overlapping.fCohort samples of our study and this previous study are overlapping.gThe initially reported SNP rs3179861 was neither genotyped nor imputed in our primary cohort. We thus used SNP rs17651039, the available SNP that presentedhe highest linkage disequilibrium levels with rs3179861 (r2 � 0.391 in CEU).
h
The initially reported SNP rs4290029 was neither genotyped nor imputed in our primary cohort. We thus used SNP rs10916489, the available SNP that presentedhe highest linkage disequilibrium levels with rs4290029 (r2 � 0.951 in CEU).
c
Month 2012 LIVER FIBROSIS IN HCV–INFECTED PATIENTS 9.e12
Supplementary Figure 5. Association analysis strategy. The table reports genome-wide analyses of HCV-induced liver fibrosis that wereonducted using different phenotype definitions and genetic models (in columns), subsamples (in rows), and number of SNPs (in colors). Analyses
colored in dark gray and black were conducted on all SNPs, while analyses colored in light gray were conducted on a restricted set of 75,000 SNPs.


