Embed Size (px)
Citation preview

Australian Journal of Earth Sciences
(2002)
49
,
1011–1039
Geodynamic modelling of the Century deposit, Mt Isa Province, Queensland
A. ORD,
1
* B. E. HOBBS,
1
Y. ZHANG,
1
G. C. BROADBENT,
2
M. BROWN,
1
G. WILLETTS,
1
P. SORJONEN-WARD,
1
J. L. WALSHE
1
AND C. ZHAO
1
1
CSIRO Exploration and Mining, PO Box 1130, Bentley, WA 6102, Australia.
2
Rio Tinto Exploration, PO Box 175, Belmont, WA 6104, Australia.
This paper is concerned with an example of quantitative modelling of orebody formation as a guideto reducing the risk for future mineral exploration. Specifically, the paper presents a detailed 3-Dnumerical model for the formation of the Century zinc deposit in northern Queensland. The modelcouples fluid flow with deformation, thermal transport and chemical reactions. The emphasis of thestudy is a systems approach where the holistic mineralising system is considered rather than concen-trating solely on the mineral deposit. In so doing the complete plumbing system for mineralisation isconsidered with a view to specifying the critical conditions responsible for the ore deposit occurringwhere it does and having the size and metal grades that are observed. The numerical model is basedon detailed geological, tectonic, isotopic and mineralogical data collected over the past 20 years.The conclusions are that the Century zinc deposit is located where it is because of the followingfactors: (i) a thermal anomaly is associated with the Termite Range Fault due to advection of heat fromdepth by fluid flow up the Termite Range Fault; (ii) bedding-plane fissility in the shale rocks hosting theCentury zinc deposit has controlled the wavelength and nature of D
1
folding in the vicinity of thedeposit and has also controlled increases in permeability due to hydrofracture of the shales; suchhydrofracture is also associated with the production of hydrocarbons as these shales passed throughthe ‘oil-window’; (iii) Pb–Zn leached from crustal rocks in the stratigraphic column migrated up alongfaults normal to the Termite Range Fault driven by topographic relief associated with inversion at theend of the Isan Orogeny; these fluids mixed with H
2
S derived at depth moving up the Termite RangeFault to mix with the crustal fluids to precipitate Pb–Zn in a plume downstream from the point of mixing.Critical factors to be used as exploration guides are high temperatures, carbonaceous fissile shalesnow folded into relatively tight D
1
folds, fault-controlled plumbing systems that enable fluid mixing,depletion of metals upstream of the deposit and, in particular, a very wide Fe-depletion halo upstreamof the deposit.
KEY WORDS: Century zinc deposit, chemical reactions, deformation, fluid flow, geodynamicmodelling.
INTRODUCTION: PURPOSE AND SOME DEFINITIONS
The purpose of this paper is to explore the potential appli-cations of geodynamic modelling to mineral explorationvia a specific example, namely, the Century zinc deposit innorthern Queensland. We discuss the insights that onemight gain from such modelling and the contribution suchmodelling may provide towards decreasing risk in anexploration program. We are particularly interested inthose physical and chemical processes that lead to theformation of high-grade, high-tonnage, high-quality oredeposits. In general these processes involve: (i) the gener-ation of heat and the transfer of this heat by conduction orby advection during deformation, or in fluids, includingmagmas; (ii) the generation of metal-bearing fluids and thetransport of these fluids; (iii) the dissolution and transportof metals and the deposition of minerals in sites thatenable economically interesting concentrations of metalsto accumulate; and may involve (iv) deformation to highstrains with the development of zones of high dilation andhence increased permeability and decreased fluid porepressure.
Geodynamic modelling provides a framework tointerrogate geological, geophysical and geochemical dataat all scales and build thoroughly integrated and quanti-tative models of ore formation. This holistic view of the oresystem is the key to a powerful new conceptual tool forunderstanding the formation of ore deposits and indesigning and evaluating exploration programs. A ‘softmodel’–‘hard model’ approach has been developed, integ-rating available data from the regional, deposit and micro-scales into ‘soft’ or conceptual models of the hydrothermalsystems, which then form the basis for ‘hard’ numericalmodels. The modelling process begins by asking fivequestions about the system: (i) what was the size andstructural–lithological architecture of the system; (ii) whatwas the P–T and geodynamic history; (iii) what was thenature of fluid reservoirs in the system; (iv) what mechan-isms advected/convected/focused fluids; and (v) what werethe metal transport/depositional mechanisms of oreformation? Qualitative answers to these five questions
*Corresponding author: [email protected]

1012
A. Ord
et al.
generate the ‘soft’ (or conceptual) models that in turnprovide a framework for the ‘hard’ (or quantitative)models.
The quantitative modelling (the ‘hard’ modelling)involves coupling between fluid flow, heat transport, rockdeformation and chemical reaction. The hard modelling isa tool to answer the ‘what-if ’ questions and scenarios thatenable us to assess a whole range of hypotheses or scen-arios. It provides us with a new basis for designing andevaluating exploration programs—the essence of a newparadigm in predictive mineral exploration. In this paperwe proceed to attempt to answer these five questions for theCentury zinc deposit in northern Queensland and thenproceed to quantitatively model the mineralising system inorder to extract the critical exploration criteria. This
approach rapidly highlights what is and what is not knownabout a particular mineral system, establishes the criticalexploration criteria, and efficiently establishes a prioritylist of critical issues that need to be addressed in order todecrease the risks involved in an exploration program. TheCentury mineral system is an ideal example of thisapproach because the geology is relatively simple and aconsiderable amount of the critical data has been assem-bled in recent times (Carr
et al
. 1996; Andrews 1998;Broadbent
et al
. 1998). Nevertheless there remain somefundamental unanswered questions, particularly regard-ing the origin and timing of the Century deposit, and theanswers to these questions will help to develop newapproaches to exploration for Pb–Zn deposits in thenorthern part of Australia.
Figure 1
Location and geology of the Lawn Hill region and the Century deposit (after Andrews 1998).

Geodynamic modelling, Century zinc deposit
1013
CENTURY ZINC MINERAL SYSTEM
The Century zinc deposit, located on the Lawn HillPlatform
(Figure 1)
in
the
important
sediment-hostedPb–Zn terrain of northwestern Queensland, containsapproximately 120 Mt of ore with grades of 10.2% Zn, 1.5%Pb and 36 ppm Ag. The geology of the deposit has been welldescribed in Waltho
et al
. (1993) and Broadbent
et al
. (1998),thus only major features of the mineralisation are sum-marised here. The deposit is hosted in shale and siltstoneof the Proterozoic Lawn Hill Formation, the uppermostpreserved formation of the upper McNamara Group. Thestratiform mineralisation at Century consists essentiallyof fine-grained sphalerite and siderite with minor galenaand pyrite. Typically, the sphalerite occurs as very thinlamellae replacing quartz and pyrobitumens in blackshales. Mineralisation is broadly zoned away from aprominent regional structure, the Termite Range Fault,from a central core rich in galena outwards into asphalerite-rich zone, then into a pyrite-rich zone andfinally into a siderite-rich zone (Figure 2). The sphaleriteis iron-poor (1% Fe) whereas the siderite typically containsboth Zn and Mn. Details of the mineralogy are given byBroadbent
et al
. (1998). The lower part of the mineralisedzone has abundant pyrobitumen, evidenced by a distinc-tively textured fine-grained steel-grey sphalerite known as‘porous’ sphalerite.
Pyrobitumen-poor, pale sphalerite, known as ‘non-porous’ sphalerite, is more abundant in the upper portion/top of the mineralisation. The highest grade mineralis-ation is approximately coincident with the interfacebetween these two major sphalerite types, and overalltransgresses the deposit lithostratigraphy from southeastto northwest (Figure 2). In plan view, this gives systematicchanges in grade from lower to higher lithostratigraphicunits from southeast to northwest, as shown between unit4.3 (lower) and unit 2 (higher) on Figure 3. This pattern issuperimposed on a systematic decline in grade that occursin all units from northeast to southwest away from theTermite Range Fault, the presumed main feeder conduitfor the mineralisation. Lead is strikingly clustered in thesoutheastern corner of the deposit. Although detailed leaddistribution is more erratic, it still shows similar cross-
stratigraphic migration and grade distribution trends tozinc.
The geology of the region surrounding the Centurydeposit area is presented in Figure 1, and isotopic ageconstraints on principal rock units and events are listed inTable 1. For abbreviations and thickness estimates forlithostratigraphic units refer to Table 2. A major north-west-striking fault, the Termite Range Fault (Broadbent
et al
. 1998; Andrews 1998; Betts
et al
. 1998), is one of thedominant structural elements of the area (Figure 1). TheTermite Range Fault is a long-lived (>140 million years)transverse fault (Betts
et al
. 1999) that periodicallyinfluenced the pattern of sedimentation throughout thehistory of the upper McNamara Group. The Termite RangeFault was active for at least the period between
ca
1708 Ma(corresponding to the lowermost units of the upperMcNamara Group) up until
ca
1595 Ma (corresponding tothe uppermost units of the upper McNamara Group). In theearly part of this period the movement history of theTermite Range Fault in the Lawn Hill Platform is poorlyknown (Andrews 1998; Betts
et al
. 1998). It is possible thatup until the deposition of the Termite Range Formation, athicker sediment package and depositional half-grabensformed to the southwest of the Termite Range Fault, atleast during deposition of the
ca
1650–1643 Ma RiversleighSiltstone. The 1636–1626 Ma Termite Range Formationforms a continuous sheet across the Termite Range Fault,indicating quiescence of the structure at this time.Following the deposition of the Termite Range Formation,the fault reversed polarity to a northeast-block-down senseof movement and a sedimentary depocentre was localised
Figure 2
Diagrammatic sulfide zoning from northwest tosoutheast (pre-faulting geometry, late in fold history, afterBroadbent
et al
. 1998).
Figure 3
Distribution of lead and zinc in selected stratigraphicunits of the Century deposit (after Broadbent
et al
. 2002). Symbolsare proportionally scaled between the indicative sizes shown.Note the declining grade trends from northeast to southwest inunit 4.3, the superimposed pronounced increase in zinc gradefrom southeast to northwest in unit 2, and the concentration ofhigh lead grades in the southeastern core of the deposit. Thesetrends reflect the cross-stratigraphic migration of the maincentre of metal concentration in the deposit. TRF, Termite RangeFault.

1014
A. Ord
et al.
to the northeast of the Termite Range Fault during depo-sition of the lower units of the Lawn Hill Formation(Andrews 1998 figure 15).
Unit Pmh4 of the Lawn Hill Formation (= H4 + H4s ofAndrews 1998), which hosts the Century deposit (corres-ponding to the boundary between the Term and WideSupersequences of Krassay
et al
. 2000), displays a signifi-cant change in the pattern and style of sedimentation. Thischange is recorded by lateral variations in thickness andsedimentary facies in Unit H4s at Century, attributed to theformation of a small pullapart sub-basin, controlled bynortheast–southwest-trending faults that were probablyparasitic to the Termite Range Fault; according toBroadbent
et al
. (1998 p. 1270) ‘changes in thickness andcharacter of siltstone beds in the orebody area suggest thatthere was possible local growth fault control on sedimen-tation along northeast–southwest trends in the immediatedeposit environment’. As would be expected in a distalmarine-shelf environment in which density-currentsediments are focused into topographic lows, Unit H4sthickens considerably in the sub-basin and consists oflaminated black shale alternating on a fine scale with
millimetre- and centimetre-scale silty turbidite beds.Waltho and Andrews (1993) also noted an increase in thesilty component of Unit H4s approaching the TermiteRange Fault from the west, whereas Krassay
et al
. (2000)presented evidence for a subtle decrease in grainsize andabundance of silty turbidites at greater distances, outsidethe Century sub-basin.
Unit Pmh5 (Widdallion Sandstone Member) of the LawnHill Formation, which immediately overlies the Pmh4Century
host
sequence,
is
a
thick
(>550 m)
accumu-lation of rapidly deposited turbiditic sandstone (Andrews1998).
Where
preserved,
this
major
package
appears
tobe of uniform thickness throughout the Century district.Although it is not known to be preserved immediately tothe northeast of the Termite Range Fault, it appears tomaintain constant thickness on seismic sections 50–100 kmnorth of Century (Scott
et al
. 2000). Therefore, it is assumedto have been of relatively constant thickness throughoutthe model area, and further that it was not disrupted byunderlying fault structures during sedimentation. Pmh5sandstone is pervasively cemented by diagenetic chloriteand illite (Andrews 1998) and contrary to convention, is
Table 1
Geochronological constraints on the geodynamic history of the Century mineralising system.
Event Age (Ma) Reference
Lead model age for Century deposit 1570
±
5 Carr
et al
. 1996. Note that Carr
et al
. (1996) quoted a model age of 1575 Ma.However, G. R. Carr (pers. comm. 2000) has recently refined this to 1570
±
5 Ma.Century host sediments 1595
±
6 Page
et al
. 1994.Isan Orogeny 1595–1500 Blake 1987; O’Dea
et al
. 1997a.Paradise Creek Formation 1653
±
7 Page and Sweet 1998.Fiery Creek Volcanics intruded into
Termite Range Fault1708
±
2 Betts
et al
. 1999.
Fiery Creek Volcanics 1708
±
2 Page and Sweet 1998.Isa SuperBasin Formation 1710–1595 O’Dea
et al
. 1997b; Betts
et al
. 1998, 1999.Mt Isa Rift Event (E-W Extension) 1710–1653 O’Dea
et al
. 1997b; Betts
et al
. 1998.Myally Rift Event (N-S Extension) 1760–1750 O’Dea
et al
. 1997a, b.Leichhardt Rift Event 1780–1760 Derrick 1982; O’Dea
et al
. 1997a, b.Kamarga Volcanics 1800–1780 Jones 1986.Yeldham Granite 1800–1820 Page
et al
. 1994.Barramundi Orogeny 1870 Etheridge
et al
. 1987; Wyborn and Page 1988.
Table 2
Stratigraphy and thicknesses used in modelling Architecture A.
Unit 3-D model unit Thickness (m)
Layer 1 H6 + (post Pmh5 sediments) Top Unit of Lawn Hill 2850Layer 2 H5 (Pmh5, Widdallion Sandstone Member) (shale)Layer 3 H4s (Century host sequence in Unit 4 of Lawn Hill) H4S – hydrofract. 100–300; 200 modelledLayer 4 H4r (in Unit 4 of Lawn Hill Formation) H4r (Lawn Hill; shale) 600Layer 5 H3s (in Unit 2/3 of Lawn Hill Formation) H3s + H2r 200Layer 6 H2r (in Unit 2/3 of Lawn Hill Formation) (Lawn Hill; sandstone)Layer 7 H1r (Unit 1 of Lawn Hill Formation) H1r (Lawn Hill; shale) 250–1500Layer 8 TRFm (Termite Range Formation) TRFm 300–1100Layer 9 Riv (Riversleigh Siltstone Formation) Riversleigh 700–3200Layer 10 SB (Shady Bore Quartzite) Shady Bore 300Layer 11 LL (Lady Loretta Formation) Lady Loretta 1800Layer 12 LMG (Lower McNamara Group) LMG 2000Layer 13 FCV (Fiery Creek Volcanics) FCV 1000Layer 14 Basement Base At least 10 000
The stratigraphic nomenclature used is from Andrews (1998) and Hutton and Sweet (1982). Layers 1–10, upper McNamara Group;Layers 11–14, lower McNamara Group.

Geodynamic modelling, Century zinc deposit
1015
interpreted to have acted as a regional aquiclude or top sealto the Century mineralising fluid system (Broadbent
et al
.1998). The Century deposit itself lies immediately adjacentto, and southwest of, the Termite Range Fault (Figure 1).
The scenario we follow here is based on the interpre-tation of Broadbent
et al
. (1998) and Broadbent (1999), witha central premise of the model being that the Centurydeposit developed as the result of tectonically triggeredmigration of zinc-bearing basinal fluids into an over-pressured shale succession.
Initiation of the hydrothermal fluid system responsiblefor main-stage mineralisation at Century apparentlyoccurred during the first stage of basin inversion (local D
1
),with compression directed from southeast to northwest.Fluid mobilisation continued into later east–west stages ofinversion in the Lawn Hill region (local D
2
); this phase ofthe regional fluid system was largely responsible for thecluster of regional base-metal lodes. These occupy pre-dominantly northeast-striking fault structures in the
~
10
�
20 km area to the southwest of the Termite RangeFault (Figure 1) (Bresser & Myers 1993), consistent withevidence for mineralised veins overprinting the main
deposit. It is inferred that there was a progressive overalldecline in fluid volumes through the life span of theregional fluid system.
Local D
2
east–west folding and faulting events in theLawn Hill region, including folding of main-stagemineralisation at Century and activation of the structuresthat host regional lode mineralisation, are correlated withthe main stage of regional D
2
(after Bell 1983) compressionof the Isan Orogeny. The southeast–northwest localCentury D
1
, which is interpreted to be synchronous withmain-stage mineralisation, is indirectly correlated withthe final stages of the north–south D
1
(after Bell 1983) eventof the Isan Orogeny. This correlation is based on thepremise that regional D
1
, in part, represents the finalcontractional stages of sedimentation in the basin, pro-gressing to active shortening, over a protracted time periodfrom approximately 1600–1570 Ma.
Tectonic loading associated with the initial phases ofdevelopment of the Isan Orogen several hundred kilo-metres to the southeast is, therefore, postulated to haveprovided the initial stimulus for regional fluid mobilis-ation. However, sustained fluid flow over this scale
Figure 4 (a, b) Diagrams ofchanges in fluid-movementpathways with changing regionalfar-field stress patterns (inspiredby Oliver 1986 and Garven &Freeze 1984a, b). TRF, TermiteRange Fault.
Figure 5 Sulfur isotope data forthe Century deposit and regionallodes (modified from Broadbentet al. 1998). Data for regionallodes is discriminated by individ-ual paragenetic stages (Bresser1992). Note the progression toincreased �34S values with timein the Century deposit, whichextends into the regional lodemineralisation. This is interpre-ted to mean that the Century andregional lodes were the productof a commonly evolving regionalfluid system (after Broadbentet al. 1998).

1016
A. Ord
et al.
requires a mechanism for fluid recharge. A component ofgravity-driven recharge with meteoric water influx ispostulated to maintain fluid throughput over the life spanof the entire Century system (Figure 4).
Boundary conditions governing input model para-meters may, therefore, be summarised as follows: (i) D
1
deformation: initial shortening of approximately 15% fromsoutheast to northwest; peak D
1
is interpreted to be coin-cident with the main stage of the Century mineralisation(Broadbent 1999); (ii) hydraulic head gradient from south-east to northwest of the region corresponding to approxi-mately 2 km of topographic relief to provide fluid flow; and(iii) deformation (D
2
) then shifts progressively to give afurther shortening of approximately 10% or less.
Critical aspects of this ‘soft’ model are first reviewed byanswering the five questions posed above and then (underthe section headed ‘Quantitative modelling of the Centurysystem’) by presenting the results of quantitative geo-dynamic modelling.
What is the architecture and size of the total mineralising system?
At a crustal scale, the dominant influence on the positionof the Century deposit appears to be the Termite Range
Fault (Andrews 1998; Betts
et al
. 1998; Broadbent
et al
.1998). The Termite Range Fault is a long lived (>140 millionyears) feature (Betts
et al
. 1999) that influenced patterns ofsedimentation throughout the entire depositional historyof the upper McNamara Group. Broadbent
et al
. (1998)proposed that the Termite Range Fault acted as a fluidconduit for the supply of Zn
2+
, Pb
2+
and SO
42–
during theformation of the Century deposit. This conclusion is basedon the rapid decay in metal grades away from the positionof the Termite Range Fault and the higher lead gradescloser to the fault (Figure 3).
Critical aspects of size and architecture of the systemthat any credible numerical model must simulate are the:(i) apparent tight focusing of fluids into a very limitedstrike length of the
~
150 km long Termite Range Fault; (ii)approximate 400 km
2
extent of the genetically related, butlater and syn-D
2
cluster of regional lode mineralisation;and (iii) different fold styles on either side of the TermiteRange Fault. Lower amplitude, more regularly distributed,D
1
and D
2
folds occur on the southwest side of the TermiteRange Fault, giving a series of ‘dome and basin’ closures ofvarying size (Figure 1). This contrasts to higher amplitude,more widely spaced D
1
folds to the northeast of the TermiteRange Fault that appear to penetrate deeply into under-lying basin stratigraphy (Figure 1). D
2
structures to thenortheast of the Termite Range Fault consist of widelyspaced north to south kink-fold corridors, with much of theD
2
shortening being accommodated by strike-slip andthrust movements along pre-existing northeast strikingfaults that localised D
1
folds (Broadbent 1999).As discussed previously, faults are assumed to have not
been active during deposition of units Pmh5 and above, andtherefore are not continued as penetrative structures athigher stratigraphic levels of the model. The BarramundiFault (Figure 1) is assumed to have continued (as an activefault) on the southwest side of the Termite Range Faultprior to deposition of the Termite Range Formation. Thisbasically extrapolates the rapid southwards-thickening ofthe Riversleigh Siltstone seen on the northeast side of theTermite Range Fault (Andrews 1998) to the southwestacross the Termite Range Fault: the extrapolation has been
Figure 6
Plumbing system for (a) Scenario 1 and (b) Scenario 2:simple supply of SO
42–
, Zn
2+
, Pb
2+
and Fe
2+
from single oxidisedfluid source
vs
two-fluid model involving additional supply of H
2Sand CO2 from a deep basinal/crustal source.
Figure 7 Schematic diagram forsulfur isotope fractionation with-in a deep fluid reservoir (>200�C).Catagenic CH4 continually pro-duced from thin shale faciesduring deep burial reacts withSO4
2– in oxidised fluid reservoir toproduce H2S. �32S preferentiallypartitions into H2S, which diffusesupward into aquifer facies and isthen transported laterally beforebeing transported upward by asteep basin-fault conduit to higherbasin levels. Progressive Rayleighfractionation within the fluidreservoir acts to enrich �34S in res-idual pore-fluid reservoir (andultimately the derived H2S) withtime. TRF, Termite Range Fault;TSR, Thermochemical sulfatereduction.

Geodynamic modelling, Century zinc deposit 1017
made to simplify construction of the model. Short strike-length northeast-trending faults on the southwest side ofthe Termite Range Fault near the deposit do not extend tothe full depth of the model, but terminate at the RiversleighSiltstone. This appears reasonable, as they only have aminimal effect on the thickness of the Termite RangeFormation and appear of insufficient strike length topenetrate to any substantial depth. The longer strike-length northeast-trending faults on the northeast sideof the Termite Range Fault cut the Lady LorettaFormation (Figure 1), so are extended to greater depthsin the model.
The stratigraphic architecture used to construct themodel is based on the lithostratigraphic variationsrecorded by Andrews (1998). Assumed thicknesses andproperties are treated at length below.
What is the geodynamic history that lead to the evolution of rock pressure, fluid pressure, temperature and permeability distribution?
Details of the geodynamic history of the Century mineralsystem are given in Betts et al. (1998, 1999), Broadbent et al.(1998) and Andrews (1998). The important geochrono-logical constraints are summarised in Table 1 and indicatea prolonged interval of at least 160 million years betweenthe Barramundi Orogeny and the commencement of theformation of the Isa Superbasin. During this period twomajor rifting events occurred and were followed by the MtIsa Rift Event occurring (in part) synchronously with theformation of the basal units of the rocks of the Lawn HillPlatform (namely, the Fiery Creek Volcanics). The TermiteRange Fault appears to have already been in existence atthis time (1708 Ma) because the Fiery Creek Volcanics areintruded into the fault (Betts et al. 1999).
Derrick (1996) has proposed that the architecture thatdeveloped during this 160 million year period of rift form-ation, and perhaps structures that developed during theBarramundi Orogeny, had a strong influence on thedevelopment of structures in younger rocks such as theMcNamara Group and, in particular, formed an integralpart of the plumbing system for later fluids associated withmineralisation. The rocks of the McNamara Group weredeposited over an approximately 113 million-year timespan lasting from 1708 Ma (the Fiery Creek Volcanics) tojust after 1595 Ma (the deposition of the shale unit hostingthe Century zinc deposit). As noted above, the TermiteRange Fault has a history of activity spanning at least thistime period.
The shale horizon hosting the Century zinc deposit waslaid down at approximately the same time as the IsanOrogeny commenced to the southeast (1595 Ma). Page et al.(1994) have pointed out that the upper McNamara Groupsediments contain a detrital zircon population dominatedby 1820–1800 Ma Yeldham Granite ages, consistent withexposure of these rocks to the southeast of the sedimentarybasin during deposition of the upper McNamara Group.Presumably, the inversion of structures developed on theLawn Hill Platform occurred during later stages of the IsanOrogeny, which continued for nearly 100 million yearsuntil 1500 Ma. Therefore, it is significant that the model agefor the Century deposit is 1570 Ma rather than the 1595 Ma
deposition age of the host rocks. This model age is com-patible with the proposal of Broadbent et al. (1998), that theCentury deposit formed during early inversion of thestructures that had previously controlled deposition onthe Lawn Hill Platform up until 1595 Ma.
What were the physical and chemical characteristics of the fluids involved in the system?
Broadbent et al. (1998) interpreted a stratigraphic cover forthe Century deposit of between 800 and 3000 m. From thedescriptions of Andrews (1998), the thickness of the pres-ently preserved section indicates a minimum strati-graphic cover thickness of 1 km; it is likely that at leastthis much again was removed by post-mineralisation ero-sion, so a minimum depth of burial of 2000–3000 m isassumed at the time of main-stage mineralisation.
The temperature associated with the formation of theCentury deposit is problematic. Pyrobitumen reflectancegives Ro values of 2.1–2.7% (Broadbent et al. 1998), implyingmaximum palaeoburial temperatures of 180–250�C. Fluidinclusion studies give homogenisation temperaturesbetween 110 and 140�C (Broadbent et al. 1998). It may beconcluded that temperatures of fluids associated with oreformation were relatively high, probably above 200�C.
It appears, from the ubiquitous deposit-scale micro-fracturing infilled by sulfides, that fluids associated withmineralisation were overpressured. Broadbent et al. (1998)proposed that the chlorite-cemented arkose of theWiddallion Sandstone Member could have acted as aseal for the system.
Carr et al. (1996) and Sun et al. (1996) have shown that Pbfrom the major sediment-hosted Zn–Pb deposits of theProterozoic in northern Australia, including Mt Isa,Hilton, HYC, Century and Lady Loretta, lies on a singlecrustal evolution curve indicating derivation of Pb fromupper crustal rocks. Therefore, the proposal followingBroadbent et al. (1998) is that Pb and Zn were leached fromthe local crustal succession.
Carbon isotopes from the Century deposit occupy twopopulations: the first consists of �13C values of organiccarbon and pyrobitumen in the range –30 to –33‰; thesevalues are considered as typical of organically derivedcarbon and, hence, the traditional interpretation is thatthese values are consistent with pyrobitumen derivationby the breakdown of organic carbon in the immediatelyadjacent carbonaceous shales at temperatures in the rangeof 100–200�C.
The second population of carbon isotopes, fromsiderites associated with the mineralisation, has �13Cvalues in the range of –8 to +5‰. The siderite is an integralpart of the alteration history of the mineralised rocks. Itappears to post-date compaction of the sediments andis synchronous with stylolite development involvingextensive dissolution of quartz and rock-forming silicates.The siderite composition evolves over time from earlyMn-, Zn-rich siderites to late Fe-, Mg-rich and Mn-, Zn-poorsiderites. The �13C values appear to decrease as this timesequence evolves to –5.0 to –6.3‰ (Broadbent et al. 1998).
These �13C values for siderite are inconclusive inestablishing a unique source for the carbon. The range in

1018 A. Ord et al.
values is consistent with derivation of CO2 from theMcNamara Group and progressive incorporation ofbiogenic(?) carbon from the local rock column as inter-preted by Broadbent et al. (1998). However, a source of CO2
involving devolatilisation in the lower crust followed bysome mixing with inorganic carbon derived from the localrock column cannot be ruled out by the existing data.Sulfur isotopes from sphalerite, galena and pyrite in theCentury deposit have �34S values between +5 and +14‰,with values for younger cross-cutting regional lodesranging from +17 to +30‰ (Figure 5). Again, these sulfurisotope characteristics are not diagnostic of a uniquesource or process. The data are consistent with the pro-posal of Broadbent et al. (1998) that the sulfur is derivedfrom evaporitic (i.e. seawater) sulfate and has been reducedduring the formation of the main Century deposit. In con-trast, the data are also consistent with mixing of sulfurderived from evaporitic sulfate with lighter sulfur derivedfrom deep crustal sources. If this is the case, then the trendto heavier values of �34S with time indicates a waning of thelighter sulfur source, and even enrichment in �34S toexplain the extreme values in the regional lodes as theinversion history proceeded.
Thus, the isotopic composition of the Century depositleaves us with two alternative scenarios for the sources ofthe fluids.
(1) Zinc and lead derived from crustal sourcestogether with sulfate ions are supplied to the mineralisedsite via the Termite Range Fault: sulfate reduced bymethane (thermochemical sulfate reduction) generated ator near the site of mineralisation produces H2S for metalprecipitation; CO2 is generated as a by-product of thermo-chemical sulfate reduction (Broadbent et al. 1998). Aproblem with this scenario is that the available data(Ohmoto & Lasaga 1982) indicate that at 200�C the rate ofsulfate reduction would be prohibitively low.
(2) Zinc and lead derived from upper crustal or basinalsources together with sulfate ions: H2S and CO2 derivedfrom lower crustal or deep basinal sources, with thesedifferent fluids independently supplied to the mineralisedsite via the Termite Range Fault and related cross-structures (Figure 6).
However, the extreme �34S values from 25 to 30‰ (CañonDiablo Troilite) of the final stage regional lode mineralis-ation cannot be explained easily by either scenario. Thesevalues must represent products of a fluid that was enrichedin �34S well beyond the accepted composition of normalMesoproterozoic marine sulfate. Progressive removal of�32S (by pyrite cementation or H2S loss) from a deep sulfatereservoir could have fractionated residual pore-watersulfate to higher �34S, particularly as fluid supply declinedin the later stages of the mineralising system (Figure 7). Inthis model, isotopically lighter H2S could continually havebeen generated by deep-level thermochemical sulfatereduction in one portion of the deep basin stratigraphy,migrated into aquifer facies, and been continually bled offalong regional fault conduits. Because the regional lodesand Century mineralisation have no barite, the deep fluidreservoir responsible for metal transport presumablyremained buffered to oxidising conditions. Release ofmetal- and sulfate-rich fluid could have occurred epi-sodically along differently oriented conduits or perhaps
even from different basin compartments accessed bydifferent conduits.
To summarise, although thermochemical sulfate reduc-tion in the immediate Century ore-forming environmentmay be questioned on kinetic grounds, an alternativesubsurface reduction model may be adapted and invoked toexplain sulfate reduction and progressive evolution ofisotopically heavier H2S at deep levels in the basin strata,as per Scenario 2. A key controlling factor on H2S liber-ation in this model will be the amount of available iron indeep subsurface aquifer facies and/or fluid-flow pathways,which will reduce H2S actively due to pyrite precipitation.Once the available reactive Fe in the aquifer/fluid conduitis exhausted, H2S will be free to leave the system. If the fluidpathways exit directly to a major conduit, such as theTermite Range Fault, only a very small volume of inter-vening rock between the H2S ‘kitchen’ and the eventualmixing site need interact with the fluid, and early stage,isotopically light, H2S can ascend to higher basin levels inquantity. Regardless of the mechanism of sulfur isotopeevolution, the two major model scenarios of in situ reduc-tion or fluid mixing are examined by chemical modellingbelow.
What were the mechanisms driving fluid flow?
The rate of mineralisation, and hence the grade, in ore-bodies generated by gradient reactions is controlled by therate at which metal species flow across a region in whichthere are strong gradients in the equilibrium solubilitiesof appropriate metals making up the orebody (Phillips1991). In the case of the Century deposit, in which the Znand Pb comprising the orebody have been derived from thebasinal rock volume (as indicated by the Pb isotopic data),the delivery rates are controlled by fluid flow through thehighest permeability rock units in the succession. Thelikely contenders here are the predominantly sandstone orevaporitic carbonate units rather than the shale aqui-cludes of the McNamara Group. These include, in partic-ular, the Lady Loretta Formation and probably theParadise Creek Formation low in the McNamara Groupand the Termite Range Formation higher in the sequence.Fault networks may also be important in that high perme-abilities are to be anticipated along fault zones, at least ina transient manner, coupled to episodes of fault movement.In contrast, competing processes, such as vein precipi-tation, may also result in faults with lower permeabilities.
Following Broadbent et al. (1998) we propose that fluidflow of relict basinal fluids in these aquifers was driven bythe hydraulic head generated by highlands created to thesoutheast post-1595 Ma by mid to late stages of the IsanOrogeny (Figure 4a, b). In this respect, basinal fluid flow isdriven by mechanisms similar to those proposed by Garvenand Freeze (1984a, b) for the origin of some MississippiValley type deposits.
The resultant model, therefore, combines aspects of theclassic models of Garven and Freeze (1984a, b) and the‘tectonic squeegee’ hypothesis of Oliver (1986) into a geo-dynamic model for the development of regional fluid flow.Conjectural changes in fluid movement pathways withchanging regional far-field stress patterns are shown inFigure 4a and b.

Geodynamic modelling, Century zinc deposit
1019
At the time of mineralisation, the carbon-rich horizons,such as those within Pmh4 in the Lawn Hill Formation,would have generated abundant hydrocarbons as theyentered the ‘oil-window’ at approximately 100
�
C (burialdepths of 2–3 km). The internal fluid pressure in thesehorizons combined with the stress field generated duringearly basinal inversion leads to hydrofracture within theseunits, thus generating permeability in what would other-wise be very low permeability units. ‘Source-reservoir’hydrocarbon reservoirs in porcelanites of the MontereyFormation (California) are known to have measured per-meabilities as high as 0.8 mD (
~
10
–15
m
2
) and porositiesfrom 17 to 19% (Reid & McIntyre 2001). This mechanicallyinduced permeability was probably important in localisingmineralisation, but secondary permeability induced bymineralisation-related chemical reactions may have alsobeen locally important. In addition to flow within thedominant aquifers and within hydrofracturing shale units,possibly prominent cross-stratal fluid conduits appear tohave been the Termite Range Fault and other faults at rightangles to the Termite Range Fault, such as the Barramundiand Ploughed Mountain Faults (Figure 1), in particular thepopulation of smaller northeast faults that hosts theregional lode cluster.
Unit Pmh5, the thick, chlorite-cemented sandstonepackage immediately overlying Century is assumed tohave anomalously low porosity and permeability becauseof the abundant evidence for it having been cemented veryearly in diagenesis (Andrews 1998).
What were the mechanisms and processes involved in metal dissolution, metal transport and metal precipitation?
Figure 8 shows the equilibrium solubilities of zinc in achloride solution for a range of pH and Eh conditions.Superimposed on this diagram are a range of solid mineralphases, gaseous phases and species in aqueous solutions ofinterest in the Century deposit. The situation is plotted for150
�
C. Note that mixing of fluids in which SO
42–
is the stablespecies with fluids in which H
2
S is the stable species is apowerful mechanism of decreasing the equilibriumsolubility of Zn
2+
. This is essentially the process modelledin this paper.
TWO MODELS FOR THE CENTURY DEPOSIT
Accepting the field and microstructural relationshipsdocumented by Broadbent
et al
. (1998) and the geochrono-logical data of Carr
et al
. (1996) (Table 1), we follow thescenario that the Century deposit was formed 20–25 million years after sedimentation, during the firststages of inversion of the northern part of the Isa Super-basin associated with the Isan Orogeny. However, therestill remain two different chemical models within thisbroad scenario.
(a)
In situ thermochemical reduction
In this model(proposed by Broadbent
et al
. 1998) SO
42–
ions are supplied
Figure 8
Equilibrium
solubilities
of
zinc
in
a
chloride
solution
(10
equilibrium
wt%
NaCl)
for
a
range
of
pH
and
Eh
conditions at150
�
C.

1020
A. Ord
et al.
to the site of mineralisation together with Zn
2+
, Pb
2+
andFe
2+
ions, the supply conduit being the Termite RangeFault. The sulfate is reduced by hydrocarbons at the site ofmineralisation to produce H
2
S and HCO
3–
ions that react toform sphalerite and siderite. Thus, the complete set ofchemical reactions associated with the mineralising eventis proposed to be:
SO
42
–
+ CH
4
h
H
2
S + HCO
3
–
+ OH
–
(1)
Zn
2 +
+ H
2
S
h
ZnS + 2H
+
(2)
Zn
2 +
+ Fe
2 +
+ 2HCO
3
–
h
ZnFe (CO
3
)
2
+ 2H
+
(3)
SiO
2
+ 2H
2
O
h
H
3
SiO
4
–
+ H
+
(4)
In this model, the sulfur is derived from deep evaporitefacies and should have had initial
�
34
S values of +10 to+30‰, which are considered representative of Proterozoicmarine sulfate at 1570 Ma (Claypool
et al
. 1980). The pro-posal in this model is that reduced sulfur for sulfide form-ation took place by thermochemical sulfate reduction byreaction with methane to produce the observed
�
34
S valuesof +5 to +14‰. Although the geological setting of theCentury deposit is strongly supportive of such a process,
the real question is the magnitude of the effect. Theprocess of thermochemical reduction at low temperaturesis the subject of considerable debate in the literature(Machel
et al
. 1995) and the kinetics of the process appearto be too slow to be geologically significant below 200
�
C(Ohmoto & Lasaga 1982). Again, the carbon in this modelis derived from organic sources associated with the pro-duction of pyrobitumen and should initially have
�
13
Cvalues of approximately
–
30‰ (as is observed for theCentury pyrobitumens). The model proposes that theobserved
�
13
C values of
–
8 to +3‰ in mineralisation-relatedsiderite gangue phases are due to mixing of marinecarbonate signatures from the deep evaporite-sourcedfluid with isotopically light bicarbonate produced duringthermochemical oxidation of organic carbon phases. Asketch of this plumbing system is shown in Figure 6a.
(b)
Addition of H
2
S and CO
2
from a deep basinal orcrustal source
In this model, H
2
S and CO
2
are supplied tothe mineralising site via the Termite Range Fault in anaqueous fluid. The source of H
2
S could be from thermo-chemical sulfate reduction in the McNamara Group(Figure 7) or even from devolatilisation deep in the crust.Zn
2+
, Pb
2+
and Fe
2+
ions are supplied from circulating
Figure 9 Location map showingthe boundaries of the model area,superimposed on the districtgeology map from Andrews(1998).

Geodynamic modelling, Century zinc deposit
1021
crustal brines from an independent source, presumablycarrying SO
42–
ions.The reactions involved now are:
Zn
2 +
+ H
2
S
h
ZnS + 2H
+
(2)
Zn
2 +
+ Fe
2 +
+ 2CO
2
+ 2H
2
O
h
ZnFe (CO
3
)
2
+ 4H
+
(5)
SiO
2
+ 2H
2
O
h
H
3
SiO
4
–
+ H
+
(4)
The regional plumbing system in this model is more com-plicated than in model (a) because the Zn
2+
, Pb
2+
, Fe
2+
ionshave to be supplied to the site of mineralisation within thePmh4 unit via a conduit that is not the Termite RangeFault, it being assumed to be the conduit for H
2
S and CO
2
.We have modelled this metal-bearing conduit as one ormore of the northeast–southwest-trending faults that tendto occur to the northeast of the Termite Range Fault (e.g.the Archie Creek Fault or the Little Archie Creek Fault:Andrews 1998). A sketch of this plumbing system is shownin Figure 6b.
QUANTITATIVE MODELLING OF THE CENTURY MINERALISING SYSTEM
Introduction
Numerical modelling of deformation and fluid flow hasbeen concerned mostly with mineralising systems inwhich fluid flow at the presently exposed level was associ-ated with modest deformation increments, and in terraneswhere there has been limited structural reworking since
the mineralising event. This usually means that far-fieldstresses can be inferred with some degree of confidenceand that the present architecture can be used as a basis formodelling at the time of mineralisation. Vein systems ingold deposits have been particularly amenable to this kindof approach (Holyland & Ojala 1997; Mair
et al
. 2000;Schaubs & Zhao 2002; Sorjonen-Ward
et al
. 2002).In this paper, we extend numerical modelling to systems
in which mineralisation is disseminated through specificstratigraphic units, rather than in fault-controlled veins,and where the main hypothesis for testing proposes thatthe mineralising event was bracketed by two regionaldeformation phases. The Century Zn–Pb deposit providesan excellent opportunity for modelling a mineralisingsystem formed in an active orogenic regime, albeit at lowtemperatures and within a relatively distal, low-strainenvironment. Because the overall deformation history isrelatively straightforward, and metamorphic grade is low,this also enables the initial architecture and character-istics of sedimentary units to be determined and, hence,models based on an architecture just prior to basininversion can be constructed with a reasonable degree ofconfidence.
Because compelling evidence has been published forexhalative or sub-sea-floor replacement mineralisation atHYC and Lady Loretta (Large
et al
. 1998), the possibility ofa distinct mineralisation event related to inversion andcompressive orogeny or, alternatively, of differentmineralisation styles occurring in different parts of asingle province is of considerable interest in developingfuture exploration strategies.
Figure 10 Characteristic plansections (100 � 50 km) throughthe Century model area at differ-ent depths. Position of Centuryshown by star. (a) Schematic ofmain faults and D1, D2 directionsand the amount of shortening.(b) Plan section at the depth of theRiversleigh Siltstone Formationof the Upper McNamara Group.

1022 A. Ord et al.
Methodology
MODEL GEOMETRY
A series of horizontal geological sections through theCentury area at different depths forms the basis forbuilding the geometry of the 3-D numerical model(Figures 9, 10). Positions of the major faults selected(Figure 11) have been interpolated to straight lines tosimplify model construction. From plan sections such asthese (Figure 10), the architecture of the model, includinggeological structures (e.g. faults) and stratigraphic thick-ness, are built and the numerical mesh developed aroundthis skeleton.
The 3-D models we adopt here for the Century zincmineral system are 100 km long, in a northwest directionparallel to the Termite Range Fault, 50 km wide and 25 kmthick (Figure 12). Stratigraphic thicknesses used in themodelling (Table 2) and variations in the thicknesses of theunits have been adopted from Andrews (1998) and Huttonand Sweet (1982).
Details of mechanical and hydraulic properties forindividual stratigraphic units are given in Table 3: broadly,the rock units are represented as temperature-independentMohr–Coulomb materials that can exhibit elasticitytogether with non-hardening plastic flow after a yield pointis reached. The plastic deformation involves dilatancy so
Figure 11 Architecture (Model A)of faults. Exposed fault surfacesfrom Century 3-D block showingstratigraphic geometries. Modeldimensions 100 � 50 km.
Figure 12 Three-dimensional geo-metry of Model A. Stratigraphy andstructure of the Century 3-D ver-tical fault block model viewed fromthe southwest. Two small windowshave been exposed to illustrate thethickness of the H4s shale unit.

Geodynamic modelling, Century zinc deposit
1023
that these materials obey non-associative flow rules(Vermeer & de Borst 1984).
Values for material properties such as average strengthand permeability are then applied to the relevant domainsof the model according to the geological interpretation; andare based on the results of physical experiments, theor-etical relationships for descriptions of the behaviour ofrocks during deformation and fluid flow, and past pub-lished and unpublished experience. The major issue is thatthe values should be those considered to be relevant for thetime of deformation and mineralisation, not present-dayproperties. First we describe qualitatively the relevantproperties of the stratigraphy. Depth intervals quoted arefrom the assumed palaeosurface at the time of mineralis-ation.
Layer 1. H6+ (post-Pmh5 sediments of the upperMcNamara Group)
Strength, porosity and permeabilityproperties of a mixed sand–mudrock succession typical ofsedimentary basin sections in modern oil basins wereassumed.
Layer 2. H5 (Pmh5 or Widdallion Sandstone Member ofthe upper McNamara Group)
This unit is the primaryregional seal to the fluid system. It has been clay–chloritecemented during early diagenesis, thus, porosity/perme-ability will be closer to a typical mudrock or shale.Assumed to have strength properties typical of a massivesandstone succession that was deposited and normallycompacted to a depth of 2300–2850 m.
Layer 3. H4s (Century host succession in unit 4 of theLawn Hill Formation of the upper McNamaraGroup)
Century
is
interpreted
to
have
been
hostedby a thicker wedge of H4s sediment 300 m thick
~
5000
�
~
5000 m, bounded to the northeast by the TermiteRange Fault and to the east by the Zinc Hills Fault.Although data are not well constrained to the northeast ofCentury, we nevertheless use the observations describedabove as the basis for assigning different materialproperties to Unit H4s on either side of the Termite RangeFault; the alternating black shales and silty turbidites
impart an additional degree of anisotropy that not onlyinfluenced mechanical behaviour, but may have alsofocused and enhanced fluid flow (in the absence ofconstraints on timing of compaction and diageneticcementation). The host succession is assumed to have thetypical strength of a mixed siltstone–shale succession thatwas deposited and normally compacted to a depth of 2850–3000 m. The permeability of this unit is one of the keyvariables for manipulation during modelling. We initiallyassume low permeability (1e-20 m
2
) for this unit, similar toother shale units in the model. However, a hydrofracturingprocess is made possible for this unit (see descriptionbelow), and through this mechanism the permeability ofthe hydrofractured part of the unit can be increased to avalue of 2e-13 m
2
.
Layer 4. H4r (in Unit 4 of the Lawn Hill Formation of theupper McNamara Group)
Taken to have propertiestypical of a black shale succession that was deposited andnormally compacted to a depth of 3000–3550 m. Porosityand permeability are equivalent to that of a typical shalesuccession (low).
Layer 5. H3s (in Unit 2/3 of the Lawn Hill Formation ofthe upper McNamara Group)
Massive sandstone succes-sion. Strength, porosity and permeability are typical of asandstone sequence (deposited and normally compacted toa depth of 3550–3600 m).
Layer 6. H2r (in Unit 2/3 of the Lawn Hill Formation ofthe upper McNamara Group)
Strength propertiesassumed to be typical of a shale succession that was depo-sited and normally compacted to a depth of 3600–3700 m.Porosity and permeability assumed to be slightly higherthan that of a typical shale succession because of thehigher silt content and abundant evidence of regional fluidmovement in this unit regionally (Andrews 1998).
Layer 7. H1r (Unit 1 of the Lawn Hill Formation of theupper McNamara Group)
Strength, porosity and perme-ability is low, assigned to be equivalent to a typical shalesuccession subject to normal compaction to a depth of3200–4500 m.
Table 3
Material properties for Model A.
Bulk modulus Shear modulus Cohesion (Pa) Tensile strength (Pa) Permeability (m
2
) Density(kg m
–
3
)
Layer 1, 2 1.11e10 8.33e9 1.0e7 1.0e6 1.0e-20 2500Layer 3 2.22e11 1.666e11 2.0e8 1.0e5 1.0e-20/2.0e-13 2500Layer 4 1.11e10 8.33e9 1.0e7 1.0e6 1.0e-20 2500Layer 5, 6 2.00e10 1.2e10 1.5e7 1.5e6 2.0e-15 2450Layer 7 1.11e10 8.33e9 1.0e7 1.0e6 1.0e-20 2500Layer 8 2.66e10 1.6e10 2.5e7 2.5e6 2.0e-15 2450Layer 9 1.11e10 8.33e9 1.0e7 1.0e6 1.0e-20 2500Layer 10 2.66e10 1.6e10 2.5e7 2.5e6 2.0e-15 2450Layer 11 3.66e10 2.2e10 3.5e7 3.5e6 2.0e-14 2600Layer 12 3.33e10 2.0e10 3.0e7 3.0e6 1.0e-16 2550Layer 13 4.00e10 2.4e10 4.0e7 4.0e6 3.0e-19 2900Layer 14 4.66e10 2.8e10 5.0e7 5.0e6 2.0e-19 2650
Table 4
Material properties for faults in Model A.
Bulk modulus Shear modulus Cohesion (Pa) Tensile strength (Pa) Permeability (m
2
) Density(kg m
–
3
)
Termite Range Fault 4.76e9 4.35e9 8.0e6 8.0e5 2.0e-14 2400Other faults 4.44e11 3.2e11 4.0e8 3.0e6 2.0e-14 2400

1024 A. Ord et al.
Layer 8. TRFm (Termite Range Formation of the upperMcNamara Group) Porosity and permeability givenslightly higher values than that of a typical sandstonesuccession compacted to a depth of 4500–5500 m; strengthgiven typical values.
Layer 9. Riv (Riversleigh Siltstone of the upperMcNamara Group) Assumed typical strength of a shale–minor sandstone succession that has been deposited andnormally compacted to a depth of 5500–6500 m. Assumedlow porosity and permeability as those of a typical low-strength mudstone succession.
Layer 10. SB (Shady Bore Quartzite of the upperMcNamara Group) Clean orthoquartzite and quartzitesands, fining-upwards into Riversleigh mudrocks.Strength, porosity and permeability assumed to be fairlyhigh—properties of a typical oil reservoir or basin aquiferat depths of 6500–6800 m.
Layer 11. LL (Lady Loretta Formation of the lowerMcNamara Group) Massive evaporitic dolomite unit thathas been compacted to a depth of 6800–8600 m. Firstoxidised unit at depth: first(?) source of SO4-rich fluidswhen compared to more highly reduced, sulfate-poor over-lying mudrocks of the upper McNamara Group. Highporosity and permeability; porosity 10%.
Layer 12. LMG (lower McNamara Group) Strength,porosity and permeability assumed to be that of a typicalmixed carbonate–clastic succession at a burial depth of8600–10 600 m.
Layer 13. FCV (Fiery Creek Volcanics, below theMcNamara Group) Basic volcanic – minor sandstonesuccession at a depth of 10 600–12 000 m. Strong rocks,permeable in part because of sandstone interbeds, butoverall permeability is low because of the large amount ofvolcanics.
Layer 14. Basement Typical strength, porosity, perme-ability of mixed granite–metamorphic lithologies (highstrength, low porosity/permeability).
We assume that the Termite Range Fault is a basementfault and that other faults only penetrate various shallowersuccessions (Figures 11, 12). The geometries of bothvertical and 45�-dipping faults have been simulated invarious model scenarios (see later). Table 3 providesnumerical values for the relevant parameters.
Various properties were homogeneously distributedthroughout all units and were kept constant during thedeformation, including dilation angle at 4�, friction angle at30� and porosity at 0.3.
The shale units in the Lawn Hill Formation (H1r, H4r,H4s, and H5/H6) on the southwest side of the TermiteRange Fault were given properties simulating a ubiquitoushorizontal bedding-plane fissility with homogeneouslydistributed foliation properties. This was done to give abetter fit to the observed pattern of fold wavelengths andinterface geometries (refer previous discussion) on thesouthwest side of the fault. Model runs in which the shaleswere given properties simulating either a consistent hori-zontal foliation, or no foliation did not give as good a fitwith the observed deformation patterns, although broadlysimilar patterns of fracturing and fluid mobility wereobtained. Therefore, for these rock units, in addition to thebulk materials given to the formation as defined in Table 3,a group of properties for foliation (see Table 5) were also
incorporated, such as the friction angle of 12� on foliation.The host unit H4s was simulated as a mechanicallyrelatively stronger layer, but with a high potential forbrittle hydrofracturing. This is expressed by its values ofelastic constants, cohesion and tensile strength (Table 3).
The bulk material within the faults has properties as inTable 4, with dilation and friction angles respectively of 4�and 30�. These specifications simulate a Termite RangeFault that can slide relatively more easily than other faults.This allows structural styles to develop more independ-ently in the model domains on both sides of the TermiteRange Fault. This is an important point because, as pre-viously discussed, the distribution of rock units in Figure 2show considerable variations in fold wavelength, steepnessand fault spacing on either side of the Termite Range Fault.
The following points describe other important featuresof the model.
(1) The H4s unit, a layer with high potential for hydro-fracturing, is only allowed to undergo hydrofracturingonce the effective stress touches the tensile yield surface. Arule is incorporated that results in increased permeabilityat a point only if the rock at that point is at yield; once thematerial unloads to an elastic state, the permeability dropsback to the initial permeability. This process simulateslayer-parallel crack-seal behaviour during episodic over-pressure events.
(2) Fluid flow follows Darcy’s law with temperature-independent viscosity for the fluid. It is possible to incor-porate multiphase flow, but this is not considered here.
(3) A vertical temperature gradient of approximately30�C km–1 is imposed on the model with the surface temper-ature fixed at 25�C, but with a basal thermal flux imposedso as to generate basal temperatures around 325�C. Nointernal radioactive heat generation is incorporated here.
(4) If the carbonaceous shales of the Pmh4 unit in theLawn Hill Formation are above ~100�C in temperature thenfluid sources internal to the carbonaceous shales aregenerated. This leads to increased fluid pressure withinthis unit, resulting in decreased effective stress andultimately hydrofracturing accompanied by increasedpermeability at the point of hydrofracture. Again, once theeffective stress increases to the stage at which the materialis only loaded elastically, the permeability is returned to itsinitial low value.
(5) The Widdallion Sandstone Member is treated as apressure seal that can fracture once at yield and below thathorizon the basinal fluid is overpressured, but with ahydrostatic fluid pressure gradient initially. A gradient inhydraulic head is imposed from high in the southeast tolower in the northwest to simulate the proposed topograph-ically driven master control to the regional fluid system.This results in northwest-directed fluid flow in the perme-able horizons.
(6) In one scenario, a high-pressure fluid source(arising from devolatilisation at depth) is imposed at thebase of the model. Because the Termite Range Fault is theonly high permeability feature to intersect the base, all ofthis high-pressure fluid is focused into the Termite RangeFault.
(7) To simulate the regional D1 event (as understood byBroadbent 1999), the model is shortened with constantvelocity boundaries in a northwest–southeast direction.

Geodynamic modelling, Century zinc deposit 1025
This results in a shortening strain rate relative to initialdimensions of 10–14 s–1 and inversion of the initial geometryensues. The faults undergo dilation, with an accompanyingpermeability increase, as they deform.
(8) After 15% shortening during D1, the shorteningdirection is changed to east–west to simulate D2 deform-ation.
Results of coupled mechanical – fluid-flow – thermal-transport modellingMODEL A
The results of shortening model A (Figure 12) 15% in anortheast–southwest direction are shown in Figures 13–17.
It should be appreciated that understanding exactly whathas happened in these 3-D models is much the sameproblem as conducting a real-life exploration program, inthat it is difficult to look into the model and explore allaspects of the deformation, fluid flow and mineralisingpatterns.
A significant feature of the model is the folding to thesouthwest of the Termite Range Faults compared to minorthickening of the stratigraphy to the north of the fault,similar to the observations described above. This is clearlydiscernible in the surface topography (Figure 13) of themodel and in a comparison of Sections 1 and 2 (Figure 13a).Figure 13b shows that the surface structure is developedalso at depth by folding of the H4s shale unit. The difference
Figure 13 (a) Century 3-D blockmodel viewed from the southwestshowing traces of northwest–southeast cross-sections. Sec-tions 1 (b) and 2 (c) lie either sideof the Termite Range Fault, to thesouthwest and to the northeast,respectively.
Figure 14 Cross-sections (a) Sec-tion 1 in Figure 13 and (b) a sec-tion further to the southwestthan section 1 in Figure 13 show-ing instantaneous Darcy flowvectors.

1026
A. Ord
et al.
in behaviour on the south side of the Termite Range Faultis a combined result of the existence of bedding-planefissility and the faults being active south of the TermiteRange Fault, but not to its north. The difference in behav-
iour of the different parts of the stratigraphy is a functionof the different mechanical properties of the rock units, aswell as of their thickness (see Zhang
et al
. 2000 for furtherinformation and references). Foliation promotes the
Figure 15 Plan view of H4s shaleunit showing resultant hydro-fracturing and instantaneousflow vectors at progressive incre-ments of D1 deformation. All flowvectors are scaled to a maximumof 5e-7 ms–1. Maximum fluid flow(msec–1) rates and percentageshortening are: (a) 4.3e-7 at 5%;(b) 6.1e-7 at 8%; (c) 1.8e-6 at 10%;(d) 7.6e-7 at 12%; (e) 1.8e-6 at 14%;and (f) 1.1e-7 at 17%. Darker grey(hydrofractured locations), whiteand grey indicate the perme-abilities of 2 � 10–13, 2 � 10–14 and1 � 10–20 m2, respectively. PM,Ploughed Mountain Fault; LAC,Little Archie Creek Fault; AC,Archie Creek Fault; DC, DinnerCreek Fault; B, BarramundiFault; W, Wangunda Fault Zone;LR, Little Range Fault; NZH,North Zinc Hills Fault; ZH, ZincHills Fault; WL, Watson’s Lode.
Figure 16 Plan view of H4s shaleunit showing resultant hydro-fracturing and instantaneousflow vectors at progressive incre-ments of D2 deformation. Maxi-mum flow fluid (msec–1) rates andD2 percentage shortening are: (a)1.3e-6 and 2.6%, (b) 1.1e-6 and3.8% and (c) 7e-6 and 4.8%, respec-tively. All flow vectors are scaledto a maximum of 5e-7msec–1.Darker grey (hydrofractured lo-cations), white and grey indicatethe permeabilities of 2 � 10–13,2 � 10–14 and 1 � 10–20 m2, respec-tively. See Figure 15 caption for adescription of abbreviations.

Geodynamic modelling, Century zinc deposit 1027
development of folding and strain localisation, particularlynear faults. Thinner rock units tend to develop folds withsmaller wavelengths and also promote strain localisation.In addition, the asymmetric behaviour has consequencesfor fluid flow accompanying deformation.
A northwest–southeast loading imposed on the model,together with the gradient in hydraulic head from south-east to northwest, referred to above, results in fluidfocusing and hydrofracturing in the H4s unit as shown inFigures 14 and 15. The overall fluid flow is from southeastto northwest in the Lady Loretta Formation, best seensoutheast of the Barramundi Fault in Figure 14. The boldfluid-flow vectors show upward flow from the TermiteRange Formation into the faults, and predominantly down-ward flow from the surface along the faults. This leads tofluid mixing at the H4s level. The maximum instantaneousfluid flow is associated with thin rectangle-shaped areas of
hydrofractured H4s, mostly between the Zinc Hills andWatson’s Lode Faults, although some flow occurs north-west of the Zinc Hills Fault in Figure 14a, close to theTermite Range Fault. The distribution of hydrofracturingin the H4s shale unit is demonstrated in Figure 15 forvarious amounts of shortening. The magnitudes of theinstantaneous fluid-flow vectors are normalised so thattheir relative magnitudes are obvious from the figure: slowat 5% shortening, faster at greater shortening and pro-moted by hydrofracturing. From 5% to 17% shortening,fluid flow is along the Termite Range Fault, and out fromthe Termite Range Fault into all other faults. However,hydrofracturing of regions of H4s is promoted in differentregions generally southwest of the Termite Range Fault, atdifferent degrees of deformation. The linear region mostconsistently favoured lies southwest of the Dinner CreekFault, the fluid flow apparently interacting with the flow
Figure 17 Plan view of H4r shaleunit showing pore pressure con-tours at 14% D1 shortening. SeeFigure 15 caption for a descrip-tion of abbreviations.
Figure 18 Architecture (ModelB) of faults. Fault surfaces fromthe Century 3-D block modelshowing fault and stratigraphicgeometries. Model dimensions100 � 50 km.

1028 A. Ord et al.
along the Watson’s Lode Fault. Other areas of interest liesoutheast of the Watson’s Lode Fault and southwest of theTermite Range Fault; and southeast of the BarramundiFault. Hydrofracturing in the region of the Century depositis best developed in Figure 15e (14% shortening). Hydro-fracturing is not promoted in the region of the Centurydeposit once D2 (loading west–east) is imposed, although itcontinues around the length of the Watson’s Lode Fault(Figure 16). Fluid-pressure contours associated with thefluid flow of Figure 15e are shown in Figure 17, with alow concentrated around the Watson’s Lode Fault,spreading northwest towards Century, and lows associatedwith the Barramundi and North Zinc Hills Faults to thesouthwest away from the Termite Range Fault. Thesepressure lows reflect the effects of hydrofracturing atthese locations.
MODELS B AND C
Here, we explore some different models for variations instructural style and stratigraphic thickness to examinesensitivities related to alternative geological interpre-tations. We consider current uncertainties in the depthgeometries of faults, notably whether vertical or inclined,and to what depth particular faults controlled depositionalthickness as growth faults and during reactivation.
The main faults in the region are incorporated asshown in Figure 18. This is similar to the fault structuresimulated in the previous model (see Figure 11). However,fault penetration depths in the current models changed asa result of changes in stratigraphic configuration.
We explore the consequences both of assuming thefaults to be vertical (Model B), and that they dip at 45� to the
Figure 19 (a) Stratigraphy andstructure of the Century 3-Dvertical fault block model B. Twosmall windows have been expos-ed to illustrate the thickness ofthe H4s shale unit. (b) Strati-graphy and structure of theCentury 3-D block model C with45� dipping fault. Two smallwindows have been exposedabove and below the H4s silt-stone–shale layer to illustrate theinternal structure.

Geodynamic modelling, Century zinc deposit
1029
northwest (Model C). The stratigraphy (after Andrews1998) has been incorporated as shown in Figure 19a(vertical faults Model B) and Figure 19b (45
�
-dipping faultModel C). Note the increased model thickness for theMcNamara Group as a result of increases in the assumedthicknesses of several units. Approximation has also beenmade for Lawn Hill Formation such that only H4s wasdifferentiated within a homogenous Lawn Hill Formationunit (Figure 19).
Mechanical and hydraulic properties for individualstratigraphic units are mostly identical to those adopted inmodel A for corresponding units (see Table 3). However, thetensile strength of the H4s unit is 1
�
10
6
Pa, the same asthe value for the Lawn Hill Formation. For the set ofmodels
with
faults
dipping
at
45
�
Model
C
we
haveexplored
the
consequences
of
having
faults
with
different strengths, namely weak and intermediate-strength faults. This is achieved by adopting the propertiesshown in Tables 6 and 7. More specifically, in order topromote
sliding
along
faults
in
the
models
with
weakand intermediate-strength faults, a ubiquitous foliationparallel to faults is incorporated into the faults (see Table 7for foliation properties); the model with strong faults doesnot involve foliation in faults and only uses the propertiesin Table 6.
Various properties were homogeneously distributedthroughout all units and were kept constant during thedeformation, including dilation angle at 4
�
, friction angle at30
�
and porosity at 0.3.As for model A, the units in the Lawn Hill Formation
are shales, and the domains of the formation at the south-west side of the Termite Range Fault are given properties
Table 5
Material properties for foliation in shale units in Lawn Hill Formation.
Orientation Friction angle Cohesion (Pa) Tensile strength (Pa) Dilation angle
Shale units Horizontal 12 5.0e6 0.5e6 4
Table 6
Material properties for faults in Models B and C.
Bulk modulus Shear modulus Cohesion (Pa) Tensile strength (Pa) Permeability (m
2
) Density(kg m
–
3
)
Termite Range Fault 4.76e9 4.35e9 8.0e6 5.0e5 2.0e-14 2400Other faults 4.44e11 3.2e11 4.0e8 3.0e6 2.0e-14 2400
Table 7
Material properties for weak and intermediate strength faults (the ubiquitous foliation) with Models B and C.
Foliation orientation Friction angle Cohesion (Pa) Tensile strength (Pa) Dilation angle
Weak faults Parallel to faults 15 20e6 0.1e6 4Intermediate strength faults Parallel to faults 15 90e6 0.1e6 4
Figure 20 The Century 3-Dvertical fault block model B at15% shortening, illustrating (a)stratigraphy and position ofnorthwest–southeast cross-sec-tions 1(b) and 2(c).

1030 A. Ord et al.
simulating a ubiquitous bedding-plane fissility, with folia-tion properties given in Table 5.
Variations in structural style
First, Model B with relatively strong, vertical faults wastaken to a D1 shortening of approximately 15% (Figure 20).Folding is focused around the faults southwest of theTermite Range Fault. This feature is consistent withthe result of the previous model (Figure 13), whichinvolves different stratigraphic thicknesses. However,fold amplitude and wavelength are both larger in thecurrent model, reflecting more active folding. This isbecause larger stratigraphic thicknesses reduce themechanical interaction of the H4s unit (a majorfolding unit) with the underlying mechanicallycompetent layers and this further enhances the foldingof a single layer.
Figures 21–23 show three scenarios for Model C (faultsdip 45� to the northwest). The difference between themodels lies in the relative strength of the faults comparedto the surrounding bulk rocks—relatively strong(Figure 21), intermediate (Figure 22) and relatively weak(Figure 23).
It is noted that the results of the scenario with relativelystrong faults (Figure 21) are consistent with model B withvertical strong faults (Figure 20). Bulk shortening ispredominantly accommodated by folding rather thanfaulting. As a result, more distributed folding is developed.In contrast, bulk shortening in the model with weak faults(Figure 23) is predominantly accommodated by reversefaulting, with little folding. The model with intermediatestrength faults (Figure 22) gives an intermediate resultbetween the two end cases, that is, with both folding andreverse faulting. Further details of how buckling initiatesand develops in such elastic–plastic materials may befound in Zhang et al. (1996, 2000).
Fluid flow
The fluid-flow scenarios are developed below according tothe complexity of the scenario, as examples of the testing-of-multiple-scenarios methodology. The first scenariosimply explores the consequences of changing the overallfluid-pressure regime through the crust. The secondscenario shows the consequence for fluid flow of imposingan initial lateral fluid-pressure gradient through the crust.The third scenario includes a model in which the H4s layer
Figure 21 The Century 3-D 45�fault block model C (a) at 19%shortening with relatively strongfaults. Sections 1 (b) and 2 (c) lieeither side of the Termite RangeFault, to the southwest and to thenortheast, respectively. Viewingin all cases is towards the north.
Figure 22 The Century 3-D 45�fault block model C (a) at 19%shortening with intermediatestrength faults. Sections 1 (b) and2 (c) lie either side of the TermiteRange Fault, to the southwestand to the northeast, respec-tively. Viewing in all cases istowards the north.

Geodynamic modelling, Century zinc deposit 1031
of the Lawn Hill Formation is made slightly stronger thanthe surrounding rocks, and this layer is allowed to hydro-fracture when its tensile strength is overcome. The fourthscenario explores the consequences of D2 shortening onthe fluid-flow regime.
Scenario 1: varying vertical fluid-pressure gradients
Three fluid-flow regimes were considered: (i) a lithostaticfluid-pressure gradient; (ii) a fluid-pressure gradient 50%greater than a hydrostatic fluid-pressure gradient; and (iii)
a fluid pressure gradient 10% greater than a hydrostaticfluid pressure gradient. Figure 24 shows the consequencesfor fluid flow on sections parallel (a, c, e) and normal(b, d, f) to the Termite Range Fault. As might have beenexpected, fluid flow is forced up the Termite Range Faultunder the first regime (a, b) in which a lithostatic fluid-pressure gradient is involved. The second regime (c, d)involved a fluid-pressure gradient less than the lithostaticgradient, but still significantly larger than the hydrostaticgradient. The corresponding fluid flow is still dominatedby upflow, but some downflow is observed near the surface
Figure 23 The Century 3-D 45�fault block model C (a) at 19%shortening with relatively weakfaults. Sections 1 (b) and 2 (c) lieeither side of the Termite RangeFault, to the southwest and to thenortheast, respectively. Viewingin all cases is towards the north.
Figure 24 Northwest–southeastcross sections (a, c, e) from theCentury 3-D 45� block model (c)viewed towards the northeastand southwest–northeast cross-sections (b, d, f) of H4s showinginstantaneous Darcy flowvectors. (a, b) have initial porepressures that are lithostaticwith a maximum flow rate(msec–1) of (a) 2.3 � 10–7 and (b)2.3 � 10–7; (c, d) have initial porepressures that are 50% greaterthan hydrostatic with a maxi-mum flow rate (msec–1) of (c)1.0 � 10–7 and (d) 1.4 � 10–7; and(e, f) have initial pore pressuresthat are 10% greater than hydro-static with a maximum flow rate(msec–1) of (e) 1.2 � 10–7 and (f)0.5 � 10–7.

1032 A. Ord et al.
and overall flow rates are reduced. The third regime (e, f)is very much closer to the hydrostatic pressure gradient.The flow field is dominated by slow downflow. The flow inthis case appears to be more controlled by the differingstrengths of the rocks as well as their different perme-abilities, so that fluid is forced through and out of theTermite Range Fault into the Fiery Creek Volcanics.
Scenario 2: addition of lateral gradient
The overall hydraulic scheme is developed for a modelwith an initial lateral fluid-pressure gradient; relativelystrong faults dipping at 45� (Model C); and no hydrofractur-
ing. Fluid flow from southeast to northwest, as a result ofthe topographically imposed gradient in hydraulic head, isfavoured along the Lady Loretta and Termite RangeFormations. Upflow, along all the faults (e.g. BarramundiFault) out of the stratigraphic units with strong northwestlateral flow, is predicted.
Scenario 3: addition of deformation-enhanced permeability
The plan views in Figure 25 (as in Figures 14, 15) and cross-section plots in Figure 26 illustrate regions that haveundergone hydrofracture and, hence, increased theirpermeability. Figure 25a, in particular, illustrates the
Figure 25 Plan view of hydro-fracturing and instantaneousDarcy flow vectors in H4s silt-stone shale layer. (a) Model Bwith relatively strong, verticalfaults; maximum fluid flow rate(msec–1) 4.3e-6. (b) Model C withrelatively strong faults, dippingat 45�; maximum fluid flow rate6.7e-7. (c) Model C with inter-mediate-strength faults, dippingat 45�; maximum fluid flow rate7.3e-7. (d) Model C with relativelyweak faults, dipping at 45�; maxi-mum fluid flow rate 5e-7. Darkergrey (hydrofractured locations),white and grey indicate the per-meabilities of 2 � 10–13, 2 � 10–14
and 1 � 10–20 m2, respectively.These diagrams are not scaledconsistently and only the centralsegments of the H4s horizon areplotted. See Figure 15 caption fora description of abbreviations.
Figure 26 Northwest–southeastcross-sections showing hydro-fracturing and instantaneousDarcy flow vectors on the south-west side of the Termite RangeFault, looking to the northeast.(a) Model B with relativelystrong, vertical faults; maximumfluid flow rate (msec–1) 7e-7. (b)Model C with relatively strongfaults, dipping at 45� to the north-west; maximum fluid flow rate5e-7.

Geodynamic modelling, Century zinc deposit 1033
fluid-flow pattern closely associated with the siting of aCentury-type deposit.
This modelling reveals the following features: (i) fluidflow is mainly confined to the Lady Loretta Formation withDarcy velocities of approximately l m y–1; (ii) fluid flow isdirected up the ‘cross-faults’ such as the Archie and LittleArchie Faults (see Figure 26); (iii) fluid flow is also directedup the Termite Range Fault; (iv) hydrofracturing in thePmh4 unit is confined to regions in which folding begins tobe prominent (Figures 26, 27), which coincides with partsof the Pmh4 unit that are not closely intersected by faults;in this model this region is restricted to a narrow strip afew kilometres wide, to the southwest of the Termite RangeFault; the model with weak faults involves little foldingand as a result shows minor hydrofracturing (Figure 25d);and (v) fluids flow from the Termite Range Fault andfrom the cross-faults into this hydrofractured part of thePmh4 unit.
Scenario 4: changing stress regime to simulate D2
The influence of D2 shortening on hydrofracturingand fluid flow is explored. Model B with vertical faultsis taken to 15� shortening as D1 (Figures 25a, 27a) and thenD2 is imposed (Figure 27b–d). In the D2 shortening regime,the fluid focusing is gradually turned off (see changes fromFigure 27a to d). This phenomenon is also consistentlyobserved in the scenarios for Model C with 45�-dippingfaults (Figure 28). Hydrofracturing and related fluid-flow focusing are clearly turned off during the D2
deformation (Figure 28b, d, f).We note that during D2 deformation the pore pressure
decrease and the increase in the minimum principal stressresult in the rocks no longer being at tensile yield, so thatthis state is associated with a decrease in the hydrofrac-turing of the layer, and an associated decrease in fluid flowand its focusing.
High-temperature problem at Century
A clear issue for the Century deposit is the origin ofrelatively high temperatures (probably greater than 200�C)at shallow depths (probably ~1 km). Such a situationassociated with the formation of a giant orebody clearlyrequires the influx of high-temperature solutions over anextended period of time.
The obvious conduit for the influx of high-temperaturesolutions is the Termite Range Fault. Here, we explore theresult of high-temperature fluids being focused into theTermite Range Fault at various crustal levels and theperturbation this can produce to an initial geotherm.
This kind of problem has been investigated by anumber of workers including Emerman et al. (1986),Brady (1989), Deloule and Turcotte (1989), Hoisch (1991),Pedersen et al. (1997) and Connolly (1997). In all of thesepapers the increase in temperature above the ambient rocktemperature, due to upward fluid flow in a crack-likeconduit, is relatively small. Of these various models, thatof Connolly (1997) is most instructive in the presentcontext.
The Connolly model involves derivation of fluids bydevolatilisation of lower crustal rocks at temperaturesgreater than 1000�C. The assumed intrinsic geothermalgradient is 33�C km–1. The calculations indicate thatdehydration of a relatively biotite-rich rock results in amass-flow rate q*, of 10–9 kg m–2 s–1 and this flow rate is usedas a benchmark. This mass flux is to be compared withestimates made by Walther and Orville (1982), Peacock(1989) and Brady (1989) who reported mass fluxes inmetamorphic terranes of approximately 10 q*. Connolly(1997) explored the influence of mass fluxes up to 100 q* inproducing thermal anomalies, but the maximum anomalyfor a crack-like conduit appears to be approximately 50�Cover a distance of approximately 3 km either side of theconduit.
Figure 27 Plan view of modelswith strong vertical faults illus-trating D1 to D2 hydrofracturingand instantaneous Darcy flowvectors in H4s siltstone shalelayer. Maximum fluid flow(msec–1) and shortening rates are:(a) 4.3e-6 at 15% D1; (b) 1.3e-6 at 2%D2; (c) 6.2e-6 at 6% D2; and (d)5.1e-7 at 10% D2. Darker grey(hydrofractured locations), whiteand grey indicate the permeabil-ities of 2 � 10–13, 2 � 10–14 and1 � 10–20 m2, respectively. Thesediagrams are not scaled con-sistently and only the centralsegments of the H4s horizon areplotted. See Figure 15 caption fora description of abbreviations.

1034 A. Ord et al.
In all of the existing models, mentioned above, thefundamental assumption is that all of the fluid isfocused into the crack-like conduit and that thesurrounding rocks are impermeable so that no heat isadvected in the surrounding rocks by fluid transport; thisassumes that the geotherm in the surrounding rocksquite close to the conduit is the steady-state conductivegeotherm.
We explore two scenarios here, similar to the treatmentby Connolly (1997), but differing in that heat can beadvected with moving fluid in the surrounding rocks. Thishas the effect of increasing the geothermal gradient in thesurrounding rocks so that the fluid moving in the crack-like conduit does not lose as much heat by conduction tothe surrounding rocks as it would if these rocks had onlythe conductive geotherm.
The two scenarios shown in Figure 29 relate to the twofluid-source hypotheses discussed earlier. Scenario 1considers lateral fluid flow derived by orogenic uplift,whereas scenario 2 deals with fluids derived from depth. InFigure 29a, overpressured fluid flowing in the Lady LorettaFormation is modelled flowing up the Termite Range Faultdriven by a hydraulic head imposed by Isan highlands tothe southeast.
The base of the Lady Loretta Formation is at a depth of10 km (Andrews 1998) so that with a thermal gradient of30�C km–1 and a surface temperature of 25�C, the base ofthis formation is at 325�C. For the other parameters shownin Figure 29a, the resulting temperature distribution isshown in Figure 29b, giving a temperature at the level ofthe site of the Century deposit of 200�C near the TermiteRange Fault, decreasing horizontally to 150�C 3 km fromthe fault. This process can clearly produce the temper-atures observed in the Century deposit.
The second scenario is presented in Figure 29c in whichfluids at lithostatic pressure are injected into the base of a40 km-thick crust; the geothermal gradient is 25�C km–1 sothat the Moho temperature is 1025�C. The crust below theLady Loretta Formation has a permeability of 4 � 10–18 m2,otherwise the geometry and various parameters are iden-tical to those in Figure 29a. Given the permeabilities shownin Figure 29c the fluid-pressure gradient is lithostatic up tothe base of the Lady Loretta Formation, and is hydrostaticor close to hydrostatic above the base of this formation (seeZhao et al. 2002 for a discussion of such systems).
The resultant temperature distribution is shown inFigure 29d; the conductive geotherm is only slightly per-turbed by the upward mass flux below the Lady Loretta
Figure 28 Plan view of D1(a,c,e)–D2(b,d,f) hydrofracturing andinstantaneous Darcy flow vectorsin H4s siltstone shale layer.Model B (a) and (b), has relativelystrong, vertical faults with amaximum fluid flow rate (msec–1)4.3e-6, and 5.1e-7 at 10% D2,respectively. Model C (c) and (d),has relatively strong faults, dip-ping at 45� with a maximumfluid flow rate (msec–1) 6.7e-7, and3.7e-7 at 3.8% D2, respectively.Model C (e) and (f), has inter-mediate strength faults, dippingat 45� with a maximum fluidflow rate (msec–1) 7.3e-7, and5.2e-7 at 3.2% D2, respectively.Darker grey (hydrofractured loc-ations), white and grey indicatethe permeabilities of 2 � 10–13,2 � 10–14 and 1 � 10–20 m2, respec-tively. These diagrams are notscaled consistently and only thecentral segments of the H4shorizon are plotted. See Figure 15caption for a description ofabbreviations.
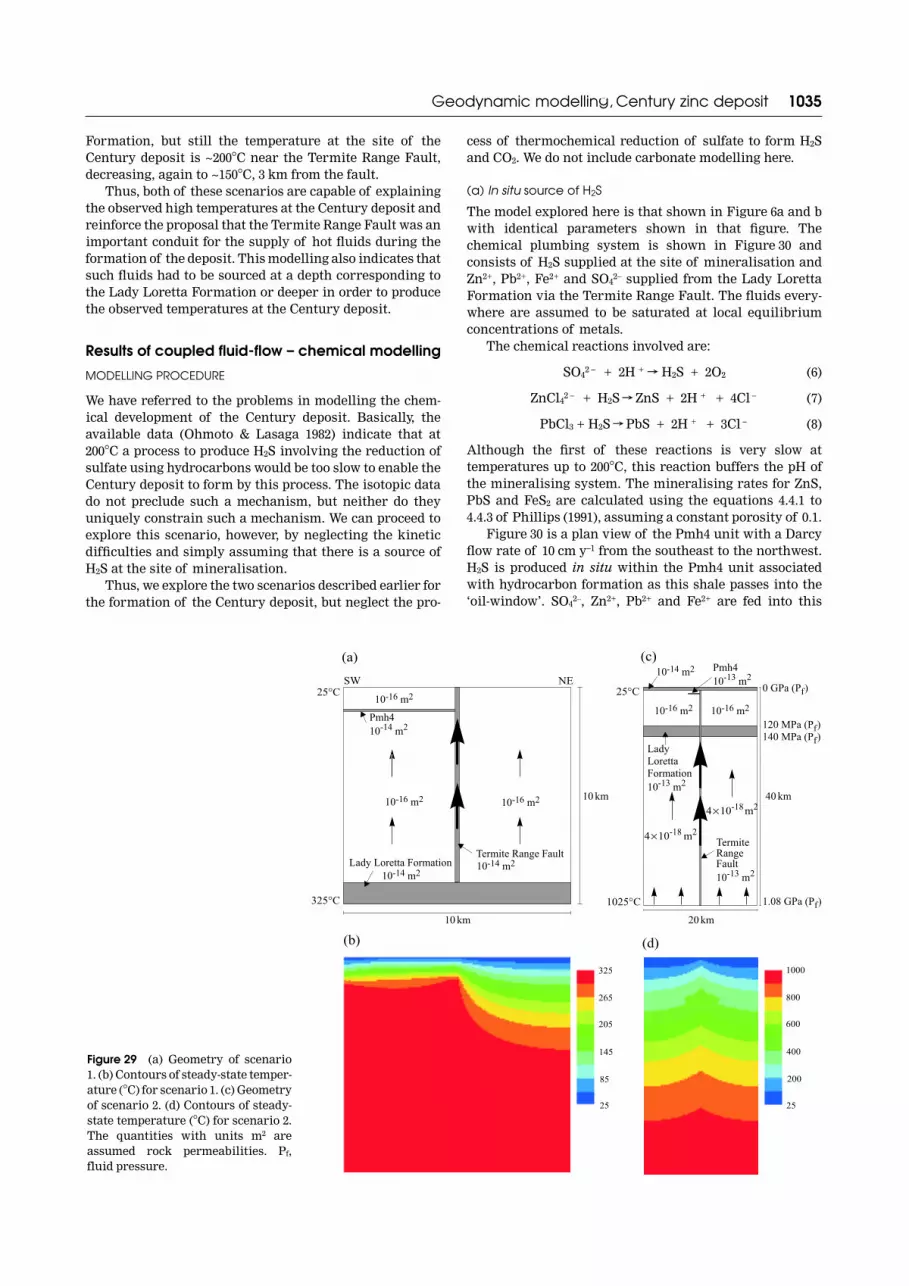
Geodynamic modelling, Century zinc deposit 1035
Formation, but still the temperature at the site of theCentury deposit is ~200�C near the Termite Range Fault,decreasing, again to ~150�C, 3 km from the fault.
Thus, both of these scenarios are capable of explainingthe observed high temperatures at the Century deposit andreinforce the proposal that the Termite Range Fault was animportant conduit for the supply of hot fluids during theformation of the deposit. This modelling also indicates thatsuch fluids had to be sourced at a depth corresponding tothe Lady Loretta Formation or deeper in order to producethe observed temperatures at the Century deposit.
Results of coupled fluid-flow – chemical modelling
MODELLING PROCEDURE
We have referred to the problems in modelling the chem-ical development of the Century deposit. Basically, theavailable data (Ohmoto & Lasaga 1982) indicate that at200�C a process to produce H2S involving the reduction ofsulfate using hydrocarbons would be too slow to enable theCentury deposit to form by this process. The isotopic datado not preclude such a mechanism, but neither do theyuniquely constrain such a mechanism. We can proceed toexplore this scenario, however, by neglecting the kineticdifficulties and simply assuming that there is a source ofH2S at the site of mineralisation.
Thus, we explore the two scenarios described earlier forthe formation of the Century deposit, but neglect the pro-
cess of thermochemical reduction of sulfate to form H2Sand CO2. We do not include carbonate modelling here.
(a) In situ source of H2S
The model explored here is that shown in Figure 6a and bwith identical parameters shown in that figure. Thechemical plumbing system is shown in Figure 30 andconsists of H2S supplied at the site of mineralisation andZn2+, Pb2+, Fe2+ and SO4
2– supplied from the Lady LorettaFormation via the Termite Range Fault. The fluids every-where are assumed to be saturated at local equilibriumconcentrations of metals.
The chemical reactions involved are:
SO42 – + 2H + h H2S + 2O2 (6)
ZnCl42 – + H2S h ZnS + 2H + + 4Cl – (7)
PbCl3 + H2S h PbS + 2H + + 3Cl – (8)
Although the first of these reactions is very slow attemperatures up to 200�C, this reaction buffers the pH ofthe mineralising system. The mineralising rates for ZnS,PbS and FeS2 are calculated using the equations 4.4.1 to4.4.3 of Phillips (1991), assuming a constant porosity of 0.1.
Figure 30 is a plan view of the Pmh4 unit with a Darcyflow rate of 10 cm y–1 from the southeast to the northwest.H2S is produced in situ within the Pmh4 unit associatedwith hydrocarbon formation as this shale passes into the‘oil-window’. SO4
2–, Zn2+, Pb2+ and Fe2+ are fed into this
Figure 29 (a) Geometry of scenario1. (b) Contours of steady-state temper-ature (�C) for scenario 1. (c) Geometryof scenario 2. (d) Contours of steady-state temperature (�C) for scenario 2.The quantities with units m2 areassumed rock permeabilities. Pf,fluid pressure.

1036 A. Ord et al.
horizon via the Termite Range Fault as shown in Figure 30.A temperature gradient is maintained with a temperatureof 300�C at the Termite Range Fault and 100�C, 5 km to thesouthwest. The rates of precipitation of ZnS, PbS and FeS2
are negligible and no orebody is generated. This is true,independent of the magnitude of the Darcy velocity. Thefact that no mineralisation is produced arises because anygradient in the equilibrium concentrations of Zn2+, Pb2+
and Fe2+ in solution arises solely from the temperaturegradient and the Darcy flow velocity vector is normal tothis gradient. The model proposed by Broadbent et al.(1998) is, therefore, critically dependant on the flux of H2Savailable to the system and requires an unrealistic concen-tration of H2S to be available in the local deposit area. Untilnew data emerges about the rates of thermochemicalsulfate reduction at low (~200�C) temperatures thisscenario will not be examined further.
(b) Addition of H2S from a deep crustal source
The model explored here is that shown in Figure 6, with aplumbing system identical to those shown in that figure.The chemical reactions and calculation procedure are asfollowed in (a) and the results are shown in Figure 31b–d.
Figure 31a is a plan view of the Pmh4 unit with a Darcyflow rate of 10 cm y–1 from the southeast to the northwest.A temperature gradient is maintained with 300�C at theTermite Range Fault and 100�C, 5 km to the southwest. H2Sis added at the Termite Range Fault whereas SO4
2–, Zn2+,Pb2+ and Fe2+ are added via a narrow conduit that corres-ponds to one of the cross-faults to the northeast of theTermite Range Fault. The rates of precipitation of ZnS, PbS
Figure 30 Local fluid-flow patterns associated with a Century-type deposit.
Figure 31 (a) Geometry of thechemical model (also see Figure 6).(b) Steady-state precipitation ofZnS. (c) Steady-state precipitationof PbS. (d) Steady-state precipi-tation of FeS2. The unit of precipi-tation rate is wt% per millionyears. Blue/green tones (negativevalues) represent precipitation;red/yellow tones (positive values)represent dissolution of the rele-vant species if present.

Geodynamic modelling, Century zinc deposit 1037
and FeS2 are shown in Figure 31b–d. In contrast to thesituation in Figure 30, a plume of mixed fluids is set upmainly downstream of the injection point for SO4
2–, Zn2+,Pb2+ and Fe2+ creating plume-like gradient patterns for theequilibrium solubilities of metal species. Figure 31b–dshows a core of galena-rich material zoned outwards tosphalerite-rich and finally to a rim of pyrite-richmaterial.
These calculations show that metal grades corres-ponding to the Century deposit could develop in two tothree million years. Notice that the region upstream fromthe inlet vent is noticeably depleted in Zn, Pb and Fe.Increasing the Darcy flow rate in this situation to 1 m y–1
results in a very small, but rich, sphalerite–galena–pyriteorebody, with no zoning, a few hundred metres downstreamfrom the injection point.
Other models
We explored other models including, in particular:(1) A vertical section through the Pmh4 unit involving
the supply of SO42–, Zn2+, Pb2+ and Fe2+ ions from a source to
the northeast of the Termite Range Fault and H2S up theTermite Range Fault. This results in a zoned orebodywithin Pmh4 that cross-cuts the stratigraphy in exactly themanner of the Century deposit (see Figure 1).
(2) A horizontal plan view in which H2S is suppliedfrom the Termite Range Fault, but SO4
2–, Zn2+, Pb2+ and Fe2+
are supplied from one of the faults normal to the TermiteRange Fault at a Darcy flowrate of 10 cm y–1. This results innegligible mineralisation except for a small, high-gradedeposit at the intersection of the two faults.
Discussion of coupled fluid-flow – chemical modelling
The coupled fluid-flow – chemical modelling presentedhere enables the following conclusions.
(1) A scenario that involved generation of H2S in situwithin the Pmh4 unit synchronous with hydrocarbongeneration together with the supply of metals along theTermite Range Fault produces negligible mineralisation inthe Pmh4 unit. Moreover, there is little in such a scenarioto distinguish one side of the Termite Range Fault from theother with respect to mineralising potential.
(2) A scenario that involves supply of H2S along theTermite Range Fault together with supply of metalsalong one or more of the faults that are normal to theTermite Range Fault and to the northeast of the TermiteRange Fault, leads to the development of an orebody thatis identical to the Century deposit in its gross character-istics: namely, the orebody is zoned outwards fromgalena-rich at its core to sphalerite-rich to pyrite-rich andthe orebody is transgressive to bedding in the verticalsection. These calculations show that an orebody approxi-mately the size of the Century deposit would form, in thisscenario, at the observed metal grades, in three to fourmillion years. In this scenario, significant mineralisationoccurs only on the southwest of the Termite Range Fault,downstream from the vent that is the conduit for metalsupply.
(3) As indicated above, the scenario described underpoint 2 produces a deposit of significant size and grade onlyon the southwest side of the Termite Range Fault;
mineralisation on the northeast side of the Termite RangeFault is negligible as a result of this scenario.
CONCLUSIONS
In this paper we have presented a holistic, systemsapproach to predicting the grade, tonnage and geo-graphical localisation of an orebody given a particularscenario regarding the origin of that orebody. This differsfrom conventional approaches in that it: (i) deals with thecomplete system responsible for orebody formation ratherthan site-specific, individual ore deposit studies; (ii) aimsto be quantitative rather than qualitative and to this endaims to rigorously and quantitatively answer the fivequestions posed at the beginning of this paper before pro-ceeding to detailed computer modelling of the proposedscenarios; (iii) aims to model grade, tonnage and localis-ation for a particular scenario and, hence, become a power-ful predictive system and one that allows the testing ofexploration models before embarking on an expensive fieldor drilling program; and (iv) aims to decrease the risk and,hence, add confidence in exploration programs by pro-viding well-defined quantitative models for predicting size,grade and siting and for clearly defined lists of what dataneeds to be collected before deciding between one proposedexploration model and another.
These characteristics truly define the approach as anew paradigm in predictive mineral exploration.
The conclusions are that the Century zinc deposit islocated where it is because of the following factors: (i) athermal anomaly is associated with the Termite RangeFault due to advection of heat from depth by fluid flow upthe Termite Range Fault; (ii) bedding-plane fissility in theshale rocks hosting the Century zinc deposit has controlledthe wavelength and nature of D1 folding in the vicinity ofthe deposit and has also controlled increases in perme-ability due to hydrofracture of the shales; such hydro-fracture is also associated with the production ofhydrocarbons as these shales passed through the ‘oil-window’; (iii) Pb–Zn leached from crustal rocks in thestratigraphic column migrated up along faults normal tothe Termite Range Fault driven by topographic reliefassociated with inversion at the end of the Isan Orogeny;these fluids mixed with H2S derived at depth moving up theTermite Range Fault to mix with the crustal fluids toprecipitate Pb–Zn in a plume downstream from the point ofmixing. Critical factors to be used as exploration guidesare high temperatures, carbonaceous fissile shales nowfolded into relatively tight D1 folds, fault-controlledplumbing systems that enable fluid mixing, depletion ofmetals upstream of the deposit and, in particular, a verywide Fe-depletion halo upstream of the deposit.
ACKNOWLEDGEMENTS
We acknowledge the financial support of the AustralianGeodynamics Cooperative Research Centre during theconception, design and early implementation of thisresearch. We thank Barry Murphy and Russell Korsch fortheir competent and heartening reviews.

1038 A. Ord et al.
REFERENCES
ANDREWS S. J. 1998. Stratigraphy and depositional setting of the upperMcNamara Group, Lawn Hills region, Northwest Queensland.Economic Geology and the Bulletin of the Society of EconomicGeologists 93, 1132–1152.
BELL T. H. 1983. Thrusting and duplex formation at Mount Isa,Queensland, Australia. Nature 304, 493–497.
BETTS P. G., LISTER G. S. & O’DEA M. G. 1998. Asymmetric extension ofthe middle Proterozoic lithosphere, Mount Isa Terrane, Queens-land, Australia. Tectonophysics 296, 293–316.
BETTS P. G., LISTER G. S. & POUND K. S. 1999. Architecture of aPalaeoproterozoic rift system: evidence from the Fiery CreekDome region, Mt Isa Terrane. Australian Journal of EarthSciences 46, 533–554.
BLAKE D. H. 1987. Geology of the Mount Isa inlier and environs,Queensland and Northern Territory. Bureau of Mineral ResourcesBulletin 225.
BRADY J. 1989. The role of volatiles in the thermal history of meta-morphic terranes. Journal of Petrology 29, 1187–1213.
BRESSER H. A. 1992. Origin of base metal vein mineralization in theLawn Hill mineral field, north western Queensland. BSc (Hons)thesis, James Cook University, Townsville (unpubl.).
BRESSER H. & MYERS R. E. 1993. Timing of brine migration in the LawnHill Platform: evidence from the Lawn Hill Mineral Field. Geo-logical Society of Australia Abstracts 34, 10.
BROADBENT G. C. 1999. Geology and origin of shale-hosted Zn–Pb–Agmineralization at the Century deposit, northwest Queensland,Australia. PhD thesis, James Cook University, Townsville(unpubl.).
BROADBENT G. C., ANDREWS S. J. & KELSO I. J. 2002. A decade of newideas: geology and exploration history of the Century Zn–Pb–Agdeposit, north western Queensland, Australia. In: Goldfarb R. J.& Nielsen R. L. eds. Integrated Methods for Discovery: GlobalExploration in the Twenty-First Century, pp. 119–140. Society ofEconomic Geologists Special Publication 9.
BROADBENT G. C., MYERS R. E. & WRIGHT J. V. 1998. Geology and originof shale-hosted Zn–Pb–Ag mineralization at the Century deposit,northwest Queensland, Australia. Economic Geology and theBulletin of the Society of Economic Geologists 93, 1264–1294.
CARR G. R., SUN S-S., PAGE R. W. & HINMAN M. 1996. Recent develop-ments in the use of Pb isotopes in Proterozoic terrains. In:Baker T., Rotherham J., Richmond J., Mark G. & Williams P. eds.MIC 96, Extended Conference Abstracts, New Developments inMetallogenic Research: the McArthur, Mt Isa, Cloncurry MineralsProvince, pp. 33–35. James Cook University, Economic GeologyResearch Unit Contribution 55.
CLAYPOOL G. E., HOLSER W. T., KAPLAN I. R., SAKAI H. & ZAK I. 1980. Theage curves of sulfur and oxygen isotopes in marine sulfate andtheir mutual interpretation. Chemical Geology 28, 199–260.
CONNOLLY J. A. D. 1997. Mid-crustal focused fluid movement: thermalconsequences and silica transport. In: Jamtveit B. & YardleyB. W. D. eds. Fluid Flow and Transport in Rocks: Mechanisms andEffects, pp. 236–250. Chapman & Hall, London.
DELOULE E. & TURCOTTE D. L. 1989. The flow of hot brines in cracks andthe formation of ore deposits. Economic Geology 84, 2217–2225.
DERRICK G. M. 1982. A Proterozoic rift zone at Mount Isa, Queensland,and implications for mineralisation. BMR Journal of AustralianGeology & Geophysics 7, 81–92.
DERRICK G. M. 1996. The ‘geophysical’ approach to metallogeny of theMt. Isa Inlier; what sort of orebody do you want? AustralasianInstitute of Mining and Metallurgy Publication 1/96, 349–366.
EMERMAN S. H., TURCOTTE D. L. & SPENCE D. A. 1986. Transport ofmagma and hydrothermal solutions by laminar and turbulentfluid fracture. Physics of the Earth and Planetary Interiors 41,249–259.
ETHERIDGE M. A., RUTLAND R. W. R. & WYBORN L. A. I. 1987. Orogenesisand tectonic process in the early to middle Proterozoic ofnorthern Australia. American Geophysical Union GeodynamicSeries 17, 131–147.
GARVEN G. & FREEZE R. A. 1984a. Theoretical analysis of the role ofgroundwater flow in the genesis of stratabound ore deposits: 1,Mathematical and numerical model. American Journal of Science284, 1085–1124.
GARVEN G. & FREEZE R. A. 1984b. Theoretical analysis of the role ofgroundwater flow in the genesis of stratabound ore deposits: 2,Quantitative results. American Journal of Science 284, 1125–1174.
HOISCH T. D. 1991. The thermal effects of pervasive and channelizedfluid flow in the deep crust. Journal of Geology 99, 69–80.
HOLYLAND P. W. & OJALA V. J. 1997. Computer-aided structuraltargeting in mineral exploration: two- and three-dimensionalstress mapping. Australian Journal of Earth Sciences 44, 421–432.
HUTTON L. J. & SWEET I. P. 1982. Geological evolution, tectonic style,and economic potential of the Lawn Hill Platform cover,northwest Queensland. BMR Journal of Australian Geology &Geophysics 7, 125–134.
JONES D. A. 1986. Stratabound zinc–lead mineralisation in the MiddleProterozoic McNamara Group, Northwest Queensland. PhDthesis, University of New England, Armidale (unpubl.).
KRASSAY A. A., DOMAGALA J., BRADSHAW B. E. & SOUTHGATE P. N. 2000.Lowstand ramps, fans and deep-water Palaeoproterozoic andMesoproterozoic facies of the Lawn Hill Platform: the Term,Lawn, Wide and Doom supersequences of the Isa Superbasin,northern Australia. Australian Journal of Earth Sciences 47,563–597.
LARGE R. R., BULL S. W., COOKE D. R. & MCGOLDRICK P. J. 1998. A geneticmodel for the H.Y.C. Deposit, Australia: based on regionalsedimentology, geochemistry, and sulfide-sediment relationships.Economic Geology and the Bulletin of the Society of EconomicGeologists 93, 1345–1368.
MACHEL H. G., KROUSE H. R. & SASSEN R. 1995. Products and distin-guishing criteria of bacterial and thermochemical sulfatereduction. Applied Geochemistry 10, 373–389.
MAIR J. L., OJALA V. J., SALIER B. P., GROVES D. I. & BROWN S. M. 2000.Application of stress mapping in cross-section to under-standing ore geometry, predicting ore zones and development ofdrilling strategies. Australian Journal of Earth Sciences 47,895–912.
O’DEA M. G., LISTER G. S., BETTS P. G. & POUND K. S. 1997a. A shortenedintraplate rift system in the Proterozoic Mount Isa Terrane, NWQueensland, Australia. Tectonics 16, 425–441.
O’DEA M. G., LISTER G. S., MACCREADY T., BETTS P. G., OLIVER N. H. S.,POUND K. S., HUANG W. & VALENTA R. K. 1997b. Geodynamicevolution of the Proterozoic Mount Isa Terrain. In: Burg J. P. &Ford M. eds. Orogeny through Time, pp. 99–122. Geological Societyof London Special Publication 121.
OHMOTO H. & LASAGA A. C. 1982. Kinetics of reactions betweenaqueous sulfates and sulfides in hydrothermal systems.Geochimica et Cosmochimica Acta 46, 1727–1745.
OLIVER J. 1986. Fluids expelled tectonically from orogenic belts: theirrole in hydrocarbon migration and other geologic phenomena.Geology 14, 99–102.
PAGE R., SUN S-S. & CARR G. 1994. Proterozoic sediment-hosted lead–zinc–silver deposits in northern Australia: U–Pb zircon and Pbisotope studies. Geological Society of Australia Abstracts 37,334–335.
PAGE R. W. & SWEET I. P. 1998. Geochronology of basin phases in thewestern Mt Isa Inlier, and correlation with the McArthur Basin.Australian Journal of Earth Sciences 45, 219–232.
PEACOCK S. M. 1989. Numerical constraints on rates of metamorphism,fluid production, and fluid flux during regional metamorphism.Geological Society of America Bulletin 101, 476–485.
PEDERSEN T., WANGEN M. & JOHNSON H. 1997. Flow along fractures insedimentary basins. In: Jamtveit B. & Yardley B. W. D. eds. FluidFlow and Transport in Rocks: Mechanisms and Effects, pp. 213–233.Chapman & Hall, London.
PHILLIPS O. M. 1991. Flow and Reactions in Permeable Rocks.Cambridge University Press, Cambridge.
REID S. A. & MCINTYRE J. L. 2001. Monterey Formation porcelanitereservoirs of the Elk Hills Field, Kern County, California.American Association of Petroleum Geologists Bulletin 85,169–189.
SCHAUBS P. M. & ZHAO C. 2002. Numerical models of gold-depositformation in the Bendigo–Ballarat Zone, Victoria, Australia.Australian Journal of Earth Sciences 49, 1077–1095.
SCOTT D. L., RAWLINGS D. J., PAGE R. W., TARLOWSKI C. Z., IDNURM M.,JACKSON M. J. & SOUTHGATE P. N. 2000. Basement framework andgeodynamic evolution of the Palaeoproterozoic superbasins ofnorth-central Australia: an integrated review of geochemical,

Geodynamic modelling, Century zinc deposit 1039
geochronological, and geophysical data. Australian Journal ofEarth Sciences 47, 341–380.
SORJONEN-WARD P., ZHANG Y. & ZHAO C. 2002. Numerical modelling oforogenic processes and gold mineralisation in the southeasternpart of the Yilgarn Craton, Western Australia. Australian Journalof Earth Sciences 49, 935–964.
SUN S-S., CARR G. R. & PAGE R. W. 1996. A continued effort to improvelead-isotope model ages. AGSO Research Newsletter 24, 19–20.
VERMEER P. A. & DE BORST R. 1984. Non-associated plasticity for soils,concrete and rock. Heron 29, 1–64.
WALTHER J. V. & ORVILLE P. M. 1982. Volatile production and transportin regional metamorphism. Contributions to Mineralogy andPetrology 79, 252–257.
WALTHO A. E., ALLNUTT S. L. & RADOJKOVIC A. M. 1993. Geology of theCentury zinc deposit, Northwest Queensland. AustralasianInstitute of Mining and Metallurgy Publication 7/93, 111–129.
WALTHO A. E. & ANDREWS S. J. 1993. The Century zinc–lead deposit,northwest Queensland. In: Proceedings Australasian InstituteOf Mining and Metallurgy, Centenary Conference, Adelaide,pp. 41–61.
WYBORN L. A. I. & PAGE R. W. 1988. Petrology, geochronology andisotope geochemistry of the post-1820 Ma granites of the MountIsa Inlier: mechanisms for the generation of Proterozoic anoro-genic granites. Precambrian Research 40/41, 509–541.
ZHANG Y., HOBBS B. E., ORD A. & MÜHLHAUS H. B. 1996. Computersimulation of single-layer buckling. Journal of Structural Geology18, 643–655.
ZHANG Y., MANCKTELOW N. S., HOBBS B. E., ORD A. & MÜHLHAUS H. B.2000. Numerical modelling of single-layer folding: clarification ofan issue regarding the possible effect of computer codes and theinfluence of initial irregularities. Journal of Structural Geology22, 1511–1522.
ZHAO C., LIN G., HOBBS B. E., MÜHLHAUS H. B., ORD A. & WANG Y. 2002.Finite element modelling of heat transfer through permeablecracks in hydrothermal systems with upward throughflow.Engineering Computations 18, 996–1011.
Received 1 December 2001; accepted 16 August 2002


