Embed Size (px)
Citation preview
2020–2021
GEORGIA HEPATITIS
ELIMINATION PROGRAM
PROGRESS REPORT
2
TABLE OF CONTENTSACKNOWLEDGMENTS .................................................................................... 4
ABBREVIATIONS .............................................................................................. 5
ORIENTATION TO THE REPORT .................................................................. 6
PROGRESS TOWARDS HCV AND HBV ELIMINATION IN GEORGIA ........................................................................... 7
STRATEGY 1. IMPROVE ADVOCACY, AWARENESS, EDUCATION, AND PARTNERSHIPS FOR HCV-ASSOCIATED RESOURCE MOBILIZATION ........................................................................... 10
STRATEGY 2. PREVENT HCV TRANSMISSION THROUGH HARM REDUCTION, BLOOD SAFETY, AND INFECTION PREVENTION AND CONTROL ...................................................................... 12
STRATEGY 3. IDENTIFY PERSONS INFECTED WITH HCV AND LINK THEM TO CARE .............................................................................17
STRATEGY 4. IMPROVE HCV LABORATORY DIAGNOSTICS ...............20
STRATEGY 5. PROVIDE COMPREHENSIVE HCV CARE AND TREATMENT ................................................................................23
3
STRATEGY 6. IMPROVE HCV SURVEILLANCE ........................................25
MONITORING AND EVALUATION .............................................................29
RESEARCH AND SCIENCE ..........................................................................42
TECHNICAL ADVISORY GROUP RECOMMENDATIONS ....................56
APPENDIX 1. HEPATITIS C DIAGNOSTIC METHODS AND KITS AVAILABLE IN GEORGIA .............................................................70
APPENDIX 2. TREATMENT ALGORITHMS .................................................71
APPENDIX 3. SCIENTIFIC MEETING PRESENTATIONS OF THE GEORGIA HEPATITIS C ELIMINATION PROGRAM ....................73
i. ABSTRACTS ........................................................................................73
ii. POSTERS .............................................................................................94
iii. ORAL PRESENTATIONS ................................................................98
APPENDIX 4. PUBLICATIONS OF THE GEORGIA HEPATITIS C ELIMINATION PROGRAM.......................................................99
4
Ministry of Internally Displaced Persons from the Occupied Territories Labour, Health, and Social AffairsEkaterine Tikaradze, Zurab Azarashvili, Tamar Gabunia, Eka Adamia, Marina Baidauri
Social Service AgencyTamar Kavteladze
National Center for Disease Control and Public Health (NCDC)Amiran Gamkrelidze, Paata Imnadze, Khatuna Zakhashvili, Maia Tsereteli, Vladimer Getia, Marina Topuridze, Maia Alkhazashvili, Nazibrola Chitadze, David Tsereteli, Babilina Turkia, Giorgi Chakhunashvili, Tamar Samadashvili, Nino Berishvili, Ketevan Galdavadze
Global Fund to Fight AIDS, Tuberculosis, and Malaria, NCDCIrma Khonelidze, Ketevan Stvilia, Alexander Asatiani
Technical Advisory GroupCarolyn Wester, U.S. CDC; Evan Bloch, Johns Hopkins University School of Medicine; Carlos del Rio, Emory University; Graham Foster, Queen Mary University of London; Margaret Hellard, Burnet Institute; Sharon Hutchinson, Glasgow Caledonian University; Jeff Lazarus, Barcelona Institute for Global Health, European Association for the Study of the Liver; Jorge Mera, Cherokee Nation Health Services; Antons Mozalevskis, WHO-EURO; Priti Patel, U.S. CDC; Tatjana Reic, Croatian Society for Liver Diseases; Anders Widell, Lund University
U.S. CDC, Eastern Europe and Central Asia Regional OfficeCharles Vitek, Lia Gvinjilia, Steven Becknell
U.S. CDC, Division of Viral HepatitisPaige Armstrong, Shaun Shadaker, Senad Handanagic, Nancy Glass, Jan Drobeniuc, Geoff Beckett, Nathan Furukawa, Irina Tskomelidze, Tatia Kuchuloria*, Davit Baliashvili, Sophia Surrguladze
Infectious Diseases, AIDS and Clinical Immunology Research CenterTengiz Tsertsvadze, Akaki Abutidze, Nikoloz Chkhartishvili
Hepatology Clinic HepaLali Sharvadze
Medical Center MrcheveliDavid Metreveli, Jaba Zarqua, Mamuka Zakalashvili
Health Research UnionMaia Butsashvili
NeolabGeorge Kamkamidze
Georgian Harm Reduction NetworkMarine Gogia, Khatuna Kutateladze
*Previous appointment
The information presented in this report is the work of individuals and does not necessarily represent the position of the US Centers for Disease Control and Prevention.
ACKNOWLEDGMENTSThe continued support and commitment from the Georgian Government has been critical to the success and sustainability of the Georgia Hepatitis C Elimination Program. We must also acknowledge the invaluable contributions of the Scientific Committee members, TAG members, and clinicians and researchers who continue to advance the science and care for hepatitis. Hepatitis elimination in Georgia is possible because of the collective efforts of these individuals.
5
ABBREVIATIONSAASLD American Association for the Study of Liver Diseases
Anti-HBc Antibody to Hepatitis B core
Anti-HCV Antibody to HCV
CDC Centers for Disease Control and Prevention
Core Ag Core Antigen
DAA Direct-Acting Antiviral
EASL European Association for the Study of the Liver
ECHO Extension for Community Healthcare Outcomes
EIDSS Electronic Integrated Disease Surveillance System
EQA External Quality Assurance
FDA U.S. Food and Drug Administration
FIND Foundation for Innovative New Diagnostics
GHOST Global Hepatitis Outbreak Surveillance Technology
GHRN Georgia Harm Reduction Network
HBsAg Hepatitis B surface Antigen
HBV Hepatitis B Virus
HCC Hepatocellular Carcinoma
HCV Hepatitis C Virus
HCW Healthcare Worker
HDV Hepatitis D Virus
HIV Human Immunodeficiency Virus
HR Harm Reduction
IBBSS Integrated Bio-Behavioural Surveillance Study
IPC Infection Prevention and Control
M&E Monitoring and Evaluation
MoIDPLHSA Georgia Ministry of Internally Displaced Persons from the Occupied Territories, Health, Labour, and Social Affairs
MSM Men who have Sex with Men
NAT Nucleic Acid Testing
NCD Non-Communicable Disease
NCDC National Center for Disease Control and Public Health
NSP Needle and Syringe Program
OST Opioid Substitution Therapy
PDI Peer-Driven Intervention
PHC Primary Healthcare Center
PPE Personal Protective Equipment
PSE Population Size Estimate
PWID People Who Inject Drugs
PLHIV People Living with HIV
RDT Rapid Diagnostic Test
SC Scientific Committee
SOP Standard Operating Procedure
SVR Sustained Virologic Response
TAG Technical Advisory Group
TTI Transfusion Transmitted Infections
TB Tuberculosis
WHO World Health Organization
6
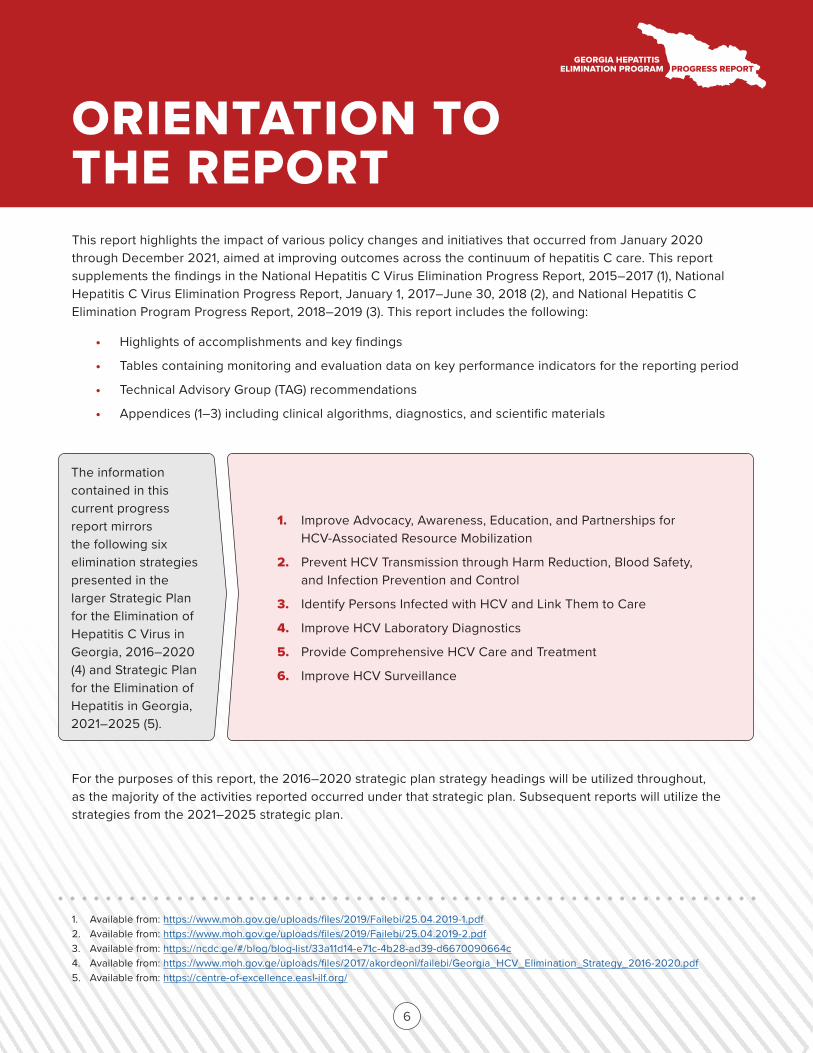
This report highlights the impact of various policy changes and initiatives that occurred from January 2020 through December 2021, aimed at improving outcomes across the continuum of hepatitis C care. This report supplements the findings in the National Hepatitis C Virus Elimination Progress Report, 2015–2017 (1), National Hepatitis C Virus Elimination Progress Report, January 1, 2017–June 30, 2018 (2), and National Hepatitis C Elimination Program Progress Report, 2018–2019 (3). This report includes the following:
• Highlights of accomplishments and key findings
• Tables containing monitoring and evaluation data on key performance indicators for the reporting period
• Technical Advisory Group (TAG) recommendations
• Appendices (1–3) including clinical algorithms, diagnostics, and scientific materials
For the purposes of this report, the 2016–2020 strategic plan strategy headings will be utilized throughout, as the majority of the activities reported occurred under that strategic plan. Subsequent reports will utilize the strategies from the 2021–2025 strategic plan.
ORIENTATION TO THE REPORT
1. Available from: https://www.moh.gov.ge/uploads/files/2019/Failebi/25.04.2019-1.pdf2. Available from: https://www.moh.gov.ge/uploads/files/2019/Failebi/25.04.2019-2.pdf3. Available from: https://ncdc.ge/#/blog/blog-list/33a11d14-e71c-4b28-ad39-d6670090664c4. Available from: https://www.moh.gov.ge/uploads/files/2017/akordeoni/failebi/Georgia_HCV_Elimination_Strategy_2016-2020.pdf5. Available from: https://centre-of-excellence.easl-ilf.org/
The information contained in this current progress report mirrors the following six elimination strategies presented in the larger Strategic Plan for the Elimination of Hepatitis C Virus in Georgia, 2016–2020 (4) and Strategic Plan for the Elimination of Hepatitis in Georgia, 2021–2025 (5).
2. Prevent HCV Transmission through Harm Reduction, Blood Safety, and Infection Prevention and Control
3. Identify Persons Infected with HCV and Link Them to Care
4. Improve HCV Laboratory Diagnostics
5. Provide Comprehensive HCV Care and Treatment
6. Improve HCV Surveillance
1. Improve Advocacy, Awareness, Education, and Partnerships for HCV-Associated Resource Mobilization
7
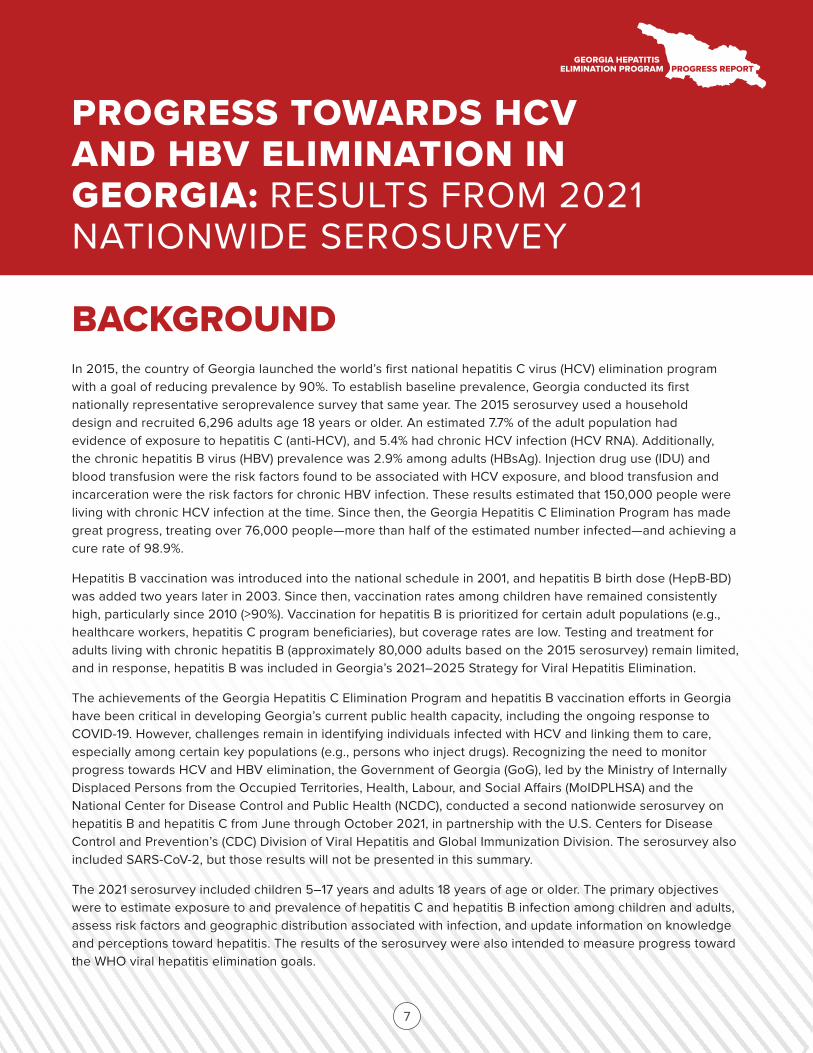
BACKGROUND In 2015, the country of Georgia launched the world’s first national hepatitis C virus (HCV) elimination program with a goal of reducing prevalence by 90%. To establish baseline prevalence, Georgia conducted its first nationally representative seroprevalence survey that same year. The 2015 serosurvey used a household design and recruited 6,296 adults age 18 years or older. An estimated 7.7% of the adult population had evidence of exposure to hepatitis C (anti-HCV), and 5.4% had chronic HCV infection (HCV RNA). Additionally, the chronic hepatitis B virus (HBV) prevalence was 2.9% among adults (HBsAg). Injection drug use (IDU) and blood transfusion were the risk factors found to be associated with HCV exposure, and blood transfusion and incarceration were the risk factors for chronic HBV infection. These results estimated that 150,000 people were living with chronic HCV infection at the time. Since then, the Georgia Hepatitis C Elimination Program has made great progress, treating over 76,000 people—more than half of the estimated number infected—and achieving a cure rate of 98.9%.
Hepatitis B vaccination was introduced into the national schedule in 2001, and hepatitis B birth dose (HepB-BD) was added two years later in 2003. Since then, vaccination rates among children have remained consistently high, particularly since 2010 (>90%). Vaccination for hepatitis B is prioritized for certain adult populations (e.g., healthcare workers, hepatitis C program beneficiaries), but coverage rates are low. Testing and treatment for adults living with chronic hepatitis B (approximately 80,000 adults based on the 2015 serosurvey) remain limited, and in response, hepatitis B was included in Georgia’s 2021 –2025 Strategy for Viral Hepatitis Elimination.
The achievements of the Georgia Hepatitis C Elimination Program and hepatitis B vaccination efforts in Georgia have been critical in developing Georgia’s current public health capacity, including the ongoing response to COVID-19. However, challenges remain in identifying individuals infected with HCV and linking them to care, especially among certain key populations (e.g., persons who inject drugs). Recognizing the need to monitor progress towards HCV and HBV elimination, the Government of Georgia (GoG), led by the Ministry of Internally Displaced Persons from the Occupied Territories, Health, Labour, and Social Affairs (MoIDPLHSA) and the National Center for Disease Control and Public Health (NCDC), conducted a second nationwide serosurvey on hepatitis B and hepatitis C from June through October 2021, in partnership with the U.S. Centers for Disease Control and Prevention’s (CDC) Division of Viral Hepatitis and Global Immunization Division. The serosurvey also included SARS-CoV-2, but those results will not be presented in this summary.
The 2021 serosurvey included children 5–17 years and adults 18 years of age or older. The primary objectives were to estimate exposure to and prevalence of hepatitis C and hepatitis B infection among children and adults, assess risk factors and geographic distribution associated with infection, and update information on knowledge and perceptions toward hepatitis. The results of the serosurvey were also intended to measure progress toward the WHO viral hepatitis elimination goals.
PROGRESS TOWARDS HCV AND HBV ELIMINATION IN GEORGIA: RESULTS FROM 2021 NATIONWIDE SEROSURVEY
8
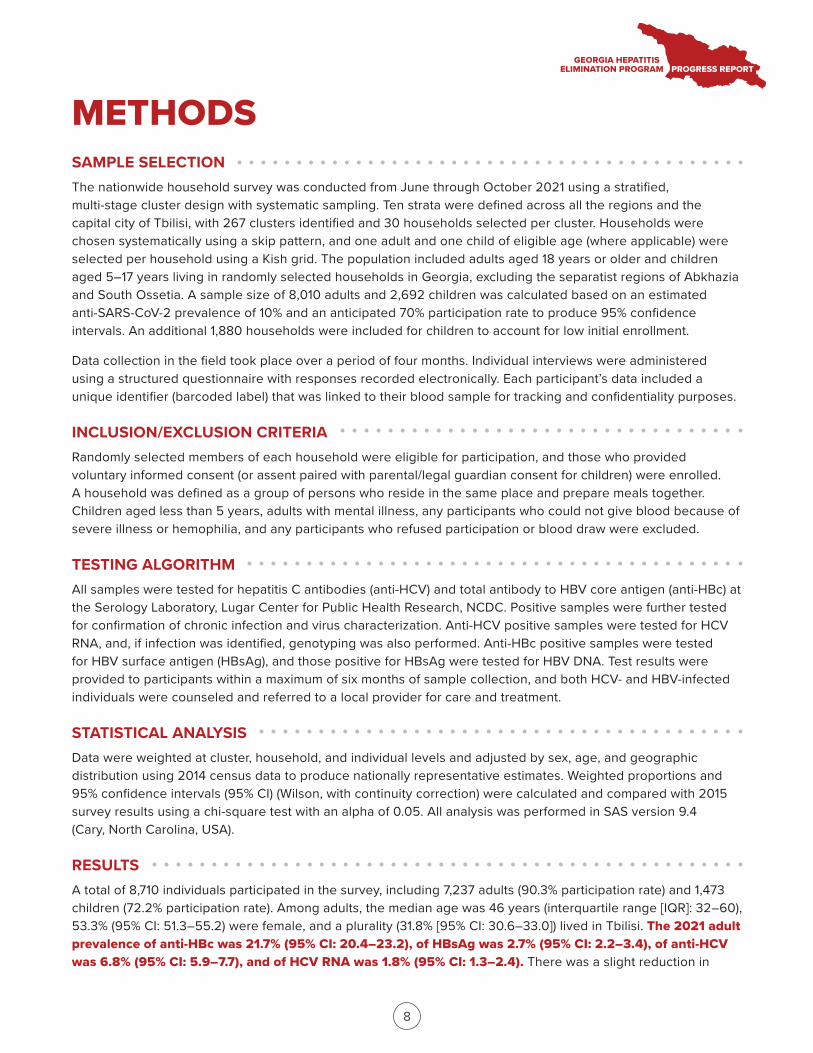
METHODSSAMPLE SELECTION The nationwide household survey was conducted from June through October 2021 using a stratified, multi-stage cluster design with systematic sampling. Ten strata were defined across all the regions and the capital city of Tbilisi, with 267 clusters identified and 30 households selected per cluster. Households were chosen systematically using a skip pattern, and one adult and one child of eligible age (where applicable) were selected per household using a Kish grid. The population included adults aged 18 years or older and children aged 5–17 years living in randomly selected households in Georgia, excluding the separatist regions of Abkhazia and South Ossetia. A sample size of 8,010 adults and 2,692 children was calculated based on an estimated anti-SARS-CoV-2 prevalence of 10% and an anticipated 70% participation rate to produce 95% confidence intervals. An additional 1,880 households were included for children to account for low initial enrollment.
Data collection in the field took place over a period of four months. Individual interviews were administered using a structured questionnaire with responses recorded electronically. Each participant’s data included a unique identifier (barcoded label) that was linked to their blood sample for tracking and confidentiality purposes.
INCLUSION/EXCLUSION CRITERIA Randomly selected members of each household were eligible for participation, and those who provided voluntary informed consent (or assent paired with parental/legal guardian consent for children) were enrolled. A household was defined as a group of persons who reside in the same place and prepare meals together. Children aged less than 5 years, adults with mental illness, any participants who could not give blood because of severe illness or hemophilia, and any participants who refused participation or blood draw were excluded.
TESTING ALGORITHMAll samples were tested for hepatitis C antibodies (anti-HCV) and total antibody to HBV core antigen (anti-HBc) at the Serology Laboratory, Lugar Center for Public Health Research, NCDC. Positive samples were further tested for confirmation of chronic infection and virus characterization. Anti-HCV positive samples were tested for HCV RNA, and, if infection was identified, genotyping was also performed. Anti-HBc positive samples were tested for HBV surface antigen (HBsAg), and those positive for HBsAg were tested for HBV DNA. Test results were provided to participants within a maximum of six months of sample collection, and both HCV- and HBV-infected individuals were counseled and referred to a local provider for care and treatment.
STATISTICAL ANALYSISData were weighted at cluster, household, and individual levels and adjusted by sex, age, and geographic distribution using 2014 census data to produce nationally representative estimates. Weighted proportions and 95% confidence intervals (95% CI) (Wilson, with continuity correction) were calculated and compared with 2015 survey results using a chi-square test with an alpha of 0.05. All analysis was performed in SAS version 9.4 (Cary, North Carolina, USA).
RESULTSA total of 8,710 individuals participated in the survey, including 7,237 adults (90.3% participation rate) and 1,473 children (72.2% participation rate). Among adults, the median age was 46 years (interquartile range [IQR]: 32–60), 53.3% (95% CI: 51.3–55.2) were female, and a plurality (31.8% [95% CI: 30.6–33.0]) lived in Tbilisi. The 2021 adult prevalence of anti-HBc was 21.7% (95% CI: 20.4–23.2), of HBsAg was 2.7% (95% CI: 2.2–3.4), of anti-HCV was 6.8% (95% CI: 5.9–7.7), and of HCV RNA was 1.8% (95% CI: 1.3–2.4). There was a slight reduction in
9
anti-HBc prevalence compared to 2015 (25.9% [95% CI: 24.1–27.6]; p<0.001), while the prevalence of HBsAg (2.9% [95% CI: 2.4–3.5] in 2015; p=0.62) and anti-HCV (7.7% [95% CI: 6.6–8.8] in 2015; p=0.20) remained stable. There was a substantial decrease in HCV RNA prevalence from 2015 (5.4% [95% CI: 4.5–6.3], p<0.0001), representing a 67% reduction in chronic HCV infection among adults since the start of the Georgia Hepatitis C Elimination Program. Prevalence of chronic HCV infection decreased among all age groups, but most notably among those aged 40–49 years (from 9.8% in 2015 to 2.7% in 2021) and 50–59 years (from 8.7% to 1.6%). Those aged 40–49 years had the highest positivity rate (2.7%), while the lowest positivity rate was among those aged 18–29 years (0.9%). Substantial decreases were also observed for both males (from 9.0% to 3.1%) and females (from 2.2% to 0.6%).
Independent risk factors for hepatitis C in 2015 included history of IDU and receipt of a blood transfusion. Rates of both risk factors decreased in 2021: the rate of reported lifetime IDU decreased from 4.2% (95% CI: 3.4–5.1) in 2015 to 3.0% (95% CI: 2.3–3.9) in 2021, p=0.03, and blood transfusions decreased from 7.0% (95% CI: 6.1–7.8) to 4.7% (95% CI: 3.9–5.5), p<0.001. Among those reporting risk factors, the proportion with chronic HCV infection also decreased substantially, from 51.1% to 17.8% among injection drug users, 13.1% to 3.8% among those who received a blood transfusion. Those with a history of incarceration also declined from 32.3% to 14.6%.
Despite the ongoing Georgia Hepatitis C Elimination Program, awareness of the hepatitis C virus decreased from 73.0% (95% CI: 71.1–74.9) in 2015 to 66.1% (95% CI: 63.9–68.2) in 2021 (p<0.0001). However, among those who had heard of the virus in 2021, significantly more were aware it could be cured with medications (77.2% [95% CI: 75.1–79.2] in 2021 vs. 70.5% [95% CI: 68.5–72.6] in 2015; p<0.0001). Additionally, as a testament to the program, among those aware of their own HCV infection, 79.9% (95% CI: 71.4–86.4) reported having been treated, up from just 28.1% (95% CI: 18.2–37.9) in 2015. Knowledge of the hepatitis B virus remained stable between the two surveys; 34.9% (95% CI: 32.6–37.4) had heard of the virus in 2021 compared to 36.5% (95% CI: 34.4–38.6) in 2015 (p=0.36). Among those who had heard of HBV in 2021, 46.0% (95% CI: 42.4–49.6) knew it could be treated with medication, compared to 42.8% (95% CI: 39.9–45.8) in 2015 (p=0.32).
Among children, the median age was 10 years (IQR: 7–13), 52.3% (95% CI: 48.8–55.8) were male, and 33.0% (95% CI: 30.5–35.6) lived in Tbilisi. The child prevalence of anti-HBc was 0.7% (95% CI: 0.3–1.6), and HBsAg prevalence was 0.03% (95%CI: 0.0–0.2), much lower than the European regional hepatitis B control target of <0.5%. Only one child in the sample tested positive for HBsAg. The child was born in 2013 when there was a HepB-BD vaccine shortage and had received only one dose of hepatitis B vaccine at 2 months of age. No children in the sample tested positive for anti-HCV or HCV RNA.
CONCLUSIONSThe prevalence of HCV RNA among adults is now 1.8%, which corresponds to approximately 48,600 people with chronic HCV infection. Since the beginning of the Georgia Hepatitis C Elimination Program in 2015, there has been a 67% reduction in chronic HCV infections, while rates of anti-HCV, anti-HBc, and HBsAg among adults have remained relatively stable. Unlike in 2015, children were included in the current study; none tested positive for hepatitis C, and only one child tested positive for chronic HBV infection, confirming good coverage with hepatitis B vaccination and demonstrating achievement of regional hepatitis B control targets. Among those aware of their HCV infection, the proportion reporting having been treated increased from 28% to 80%. Among those reporting IDU, the proportion of chronic HCV infection has declined considerably (from 51.1% to 17.8%). These results demonstrate substantial progress toward HCV elimination in Georgia, as well as the achievement of regional control targets for hepatitis B and success of the vaccination program.
10
The government of Georgia has supported communication campaigns to raise awareness about the importance of early HCV diagnosis and to ensure that all Georgians can be tested and receive highly effective treatment for free. A variety of activities were undertaken with the contribution of numerous stakeholders working across a range of settings to increase professional and public understanding of hepatitis C and to help find patients who are undiagnosed and untreated.
KEY ACCOMPLISHMENTS AND FINDINGS• From 2020 through 2021, social media, government websites (https://www.moh.gov.ge/ and https://www.ncdc.ge/), and TV media were used to provide real-time information about the Georgia Hepatitis C Elimination Program to the general population, high-risk subgroups, patients, healthcare professionals, and international partners. Activities included the following:
о Social media:
♦ Sixty HCV-related blog posts, 20 banners, 10 video blogs, and more than 10 live streaming videos of campaign activities on Facebook
☐ https://www.facebook.com/hepatitiscgeorgia
♦ Five HCV treatment providers’ live chats on Facebook responding to questions
♦ Five social media influencer-led live discussion sessions targeting the general population; posts shared on three popular social media groups with more than 100,000 participants
♦ Two animated videos produced for social media outlets:
☐ https://www.facebook.com/hepatitiscgeorgia/videos/936870560574004
☐ https://www.facebook.com/hepatitiscgeorgia/videos/339230304257407
о Television, radio, and print:
♦ More than 20 television reports and shows with invited guests (hepatitis experts, Ministry and NCDC leadership, physicians, and patient associations) to provide information to the general population on HBV, HCV, how to access the Georgia Hepatitis C Elimination Program, and program progress
♦ One video clip was produced for a television campaign:
☐ https://www.youtube.com/watch?v=rYHFRDkMUFg
♦ Five radio shows, 12 articles, and 10 reports in print and online media
♦ Media advertisements (six radio and seven television) conducted for one month
ACCOMPLISHMENTS BY STRATEGIC DIRECTION
STRATEGY 1.IMPROVE ADVOCACY, AWARENESS, EDUCATION, AND PARTNERSHIPS FOR HCV-ASSOCIATED RESOURCE MOBILIZATION
11
о A small-scale pre- and post-test survey was conducted among general population (300 participants) to evaluate the effectiveness of the social media, television, radio, and print campaign. According to the survey, awareness and knowledge of key aspects of the Georgia Hepatitis C Elimination Program services and the disease have increased; low risk perception and stigma remained the most frequently named barriers to being tested or enrolling in the treatment program.
• During 2021, the Hepatitis C Cured Patient Association and their partners carried out population-based interventions, including the following:
о Held 10 informational meetings with different target groups (e.g., vulnerable populations, ethnic minorities) throughout the country.
о Identified 20 Elimination Program Ambassadors who participated in a train-the-trainer program on hepatitis awareness, media communication, and peer-to-peer consulting techniques led by health promotion and strategic communication specialists. The Ambassadors trained 185 people and participated in five community outreach testing campaigns conducted in five regions of the country, including among ethnic minority groups (Azerbaijani and Armenian population).
о Disseminated 30,000 flyers and 1,000 posters during testing campaigns carried out by Hepatitis C Cured Patient Association, local governments, public health organizations, and primary healthcare specialists.
• During World Hepatitis Day 2020 and 2021 campaigns, several communication activities were conducted throughout the country, including
о Press conference with participation from policymakers, service providers, and media.
о Public screening campaign in the streets by the Hepatitis C Cured Patient Association and their partners.
о Television and radio specials featuring hepatitis guest speakers.
12
Preventing new HCV infections is crucial to achieving elimination goals. Although increased awareness of the risks associated with hepatitis C transmission can support prevention efforts, coordinated efforts are also needed in other areas, including integration of HCV services at harm reduction sites; provision of services and monitoring of coverage provided at needle and syringe programs (NSP) and opioid substitution treatment (OST) programs; and robust blood bank and infection, prevention, and control (IPC) practices.
HARM REDUCTION KEY ACCOMPLISHMENTS AND FINDINGS
• Harm reduction (HR) services have been expanded considerably in both scope and scale through the addition of service delivery locations:
о HCV and HBV antibody screening is available at 14 NSP sites and 9 mobile units, employing over 200 HR workers. Stationary HR sites provide services to 11 cities and cover more than 45 cities with mobile outreach.
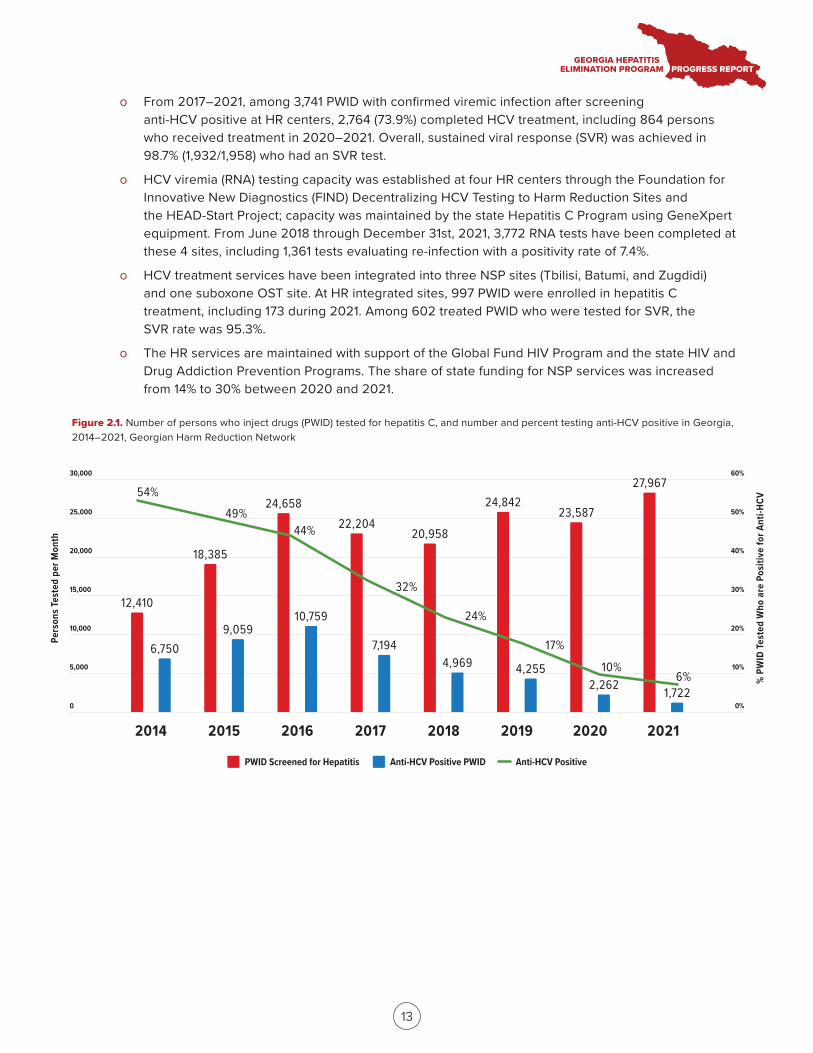
о The screening efforts among PWID substantially increased the total number of PWID aware of their HCV infection status, from 17,103 in 2016 to 27,967 in 2021 (Georgian Harm Reduction Network data). The proportion of PWID testing positive for anti-HCV decreased from 25% in 2016 to 6% in 2021.
о The number of PWID tested for HBsAg increased from 16,755 to 31,098 during the last five years, with positivity rates decreasing from 5.7% in 2016 to 2.5% in 2021. The overall number of anti-HBV- positive PWID identified during the last five years is 4,849.
о HCV and HBV screening are provided as part of the pre-enrollment process at all 22 OST clinics, with a total capacity of 13,000–14,000 beneficiaries. The number of patients enrolled in the program has increased from 7,381 in 2017 to 11,515 in 2021.
о During the last five years, among persons in the screening registry who screened anti-HCV positive at HR centers, 4,489 were tested for HCV viremia (RNA and core antigen), including 1,112 tested in 2020–2021. Overall, 3,741 PWID were confirmed as having active HCV infection, including 891 cases confirmed in 2020–2021.
ACCOMPLISHMENTS BY STRATEGIC DIRECTION
STRATEGY 2.PREVENT HCV TRANSMISSION THROUGH HARM REDUCTION, BLOOD SAFETY, AND INFECTION PREVENTION AND CONTROL
2014 2015 2016 2017 2018 2019 2020 2021
5,000
10,000
15,000
20,000
25,000
30,000
Pers
ons T
este
d pe
r Mon
th
60%
50%
40%
30%
20%
10%
0%
27,96724,658
22,20420,958
24,84223,587
18,385
12,410
9,05910,759
6,750 7,1944,969 4,255
2,262 1,722
54%49%
44%
32%
24%
17%
10%6%
0
PWID Screened for Hepatitis Anti-HCV Positive PWID Anti-HCV Positive%
PW
ID Te
sted
Who
are
Pos
itive
for A
nti-H
CV
13
о From 2017–2021, among 3,741 PWID with confirmed viremic infection after screening anti-HCV positive at HR centers, 2,764 (73.9%) completed HCV treatment, including 864 persons who received treatment in 2020–2021. Overall, sustained viral response (SVR) was achieved in 98.7% (1,932/1,958) who had an SVR test.
о HCV viremia (RNA) testing capacity was established at four HR centers through the Foundation for Innovative New Diagnostics (FIND) Decentralizing HCV Testing to Harm Reduction Sites and the HEAD-Start Project; capacity was maintained by the state Hepatitis C Program using GeneXpert equipment. From June 2018 through December 31st, 2021, 3,772 RNA tests have been completed at these 4 sites, including 1,361 tests evaluating re-infection with a positivity rate of 7.4%.
о HCV treatment services have been integrated into three NSP sites (Tbilisi, Batumi, and Zugdidi) and one suboxone OST site. At HR integrated sites, 997 PWID were enrolled in hepatitis C treatment, including 173 during 2021. Among 602 treated PWID who were tested for SVR, the SVR rate was 95.3%.
о The HR services are maintained with support of the Global Fund HIV Program and the state HIV and Drug Addiction Prevention Programs. The share of state funding for NSP services was increased from 14% to 30% between 2020 and 2021.
Figure 2.1. Number of persons who inject drugs (PWID) tested for hepatitis C, and number and percent testing anti-HCV positive in Georgia, 2014–2021, Georgian Harm Reduction Network
14
• Other projects conducted from 2020 through 2021 focusing on PWID include the following:
о Survey of PWID using WHO and UNAID simplified behavioral surveillance survey (BSS) methodology—BSS lite (sample size: 2,000 PWID) began in seven cities in November 2021 (data will be available in Spring 2022) to define the proportion of the population not utilizing HR and HCV services and identify approaches to improve access to and utilization of these services by PWID.
о HCV Self-testing (HCVST) Feasibility and Acceptability Study among PWID and MSM was implemented with support of FIND in Tbilisi. A total of 200 participants (100 from each target population) took part in the study to determine the acceptability of and preferences for HCV self- testing among MSM and PWID populations and the ability to correctly perform the test and interpret results. HCVST was acceptable for more than 96% of the participants from both population groups, although more MSM (98%) were able to complete the self-test correctly than PWID (82%).
о A randomized control trial of home-based HCV self-testing in MSM and PWID populations using an online recruitment and reporting platform—ongoing with support of FIND in Tbilisi and Batumi. A total of 750 MSM and 500 PWID are being randomly assigned to either intervention or control groups. Individuals in the intervention group will receive HCV self-tests at home through courier service or peer delivery. The individuals enrolled in the control group will be asked to follow the standard-of-care path to get anti-HCV testing at a community-based organization or a medical facility.
о A study of risk factors for HCV re-infection among PWID was approved by the Scientific Committee and is underway. It will examine the risk factors for HCV re-infection among PWID who were treated through the Georgia Hepatitis C Elimination Program and achieved SVR.
BLOOD SAFETYKEY ACCOMPLISHMENTS AND FINDINGS
• In January 2020, the European Union (EU) Twinning Project on Strengthening the Blood Safety System in Georgia was launched. In November 2021, as part of the Twinning Project, a draft of the Law on the Quality and Safety of Blood and Blood Components was submitted to the Government of Georgia including the following:
о Designating a lead agency responsible for supervision of all transfusion practices at the national level.
о Reducing the number of blood banks in Georgia to three by 2025: one National Blood Center and two additional blood banks.
о Consolidating testing from 23 blood banks to the National Blood Center by 2025.
о Prohibiting profit-based management by moving to only voluntary non-remunerated donations.
о Establishing a National Hemovigilance System.
• Since January 2020, nucleic acid testing (NAT) has been performed on blood donations at the Lugar Center for the three major transfusion transmitted infections (TTIs)—HIV, HBV, and HCV; since April 2020, all donations have been screened with NAT. Serologic testing for TTIs and syphilis is performed in each blood bank. Overall, 12.3% of NAT-positive donations were serology negative (NAT yield 1:897).
15
• Since April 2020, all 23 blood banks participate in the State Safe Blood Program.
• In December 2020, an assessment of the existing blood banks was performed. The assessment found
о The volume of donations varies considerably between existing blood banks (500–12,000 per year) and percentage of non-remunerated donors (from 0% to 100%).
о The estimated total number of non-remunerated donations at all blood banks is 30,000 (33%).
о There are no standardized quality assurance systems or universal quality standards across the 23 blood banks. Test systems are not validated, and there are no uniform confirmation testing algorithms in place.
о The equipment used by the majority of blood banks is partially or fully non-compliant with the modern standards of blood production and testing.
о 27% of blood banks perform serologic testing with fully automatic equipment, while 73% use semi-automatic ELISA methods.
о A majority of blood banks perform immunohematological testing manually.
• In 2021, the Georgian government began taking steps to establish a National Blood Center for the centralization of blood services. The Center will incorporate blood processing and centralized testing facilities, including serology, molecular testing, and immunohematology laboratories, and clinical and blood component quality assurance laboratories.
• A Communication Strategy was drafted in November 2021 for the transition to 100% non-remunerated donation and will be implemented in 2022
INFECTION PREVENTION AND CONTROLKEY ACCOMPLISHMENTS AND FINDINGS
• A new guideline, “Infection Control in Medical Facilities,” was approved by the MoIDPLHSA (Decree № 01-455/o, September 14, 2020) to ensure standardized IPC practices, including safety measures based on transmission routes, hand hygiene, disinfection and sterilization of instruments, safe injection practices and procedures, and safe blood banking and transfusion practices at all medical facilities.
• IPC regulations were updated based on a Ministerial order for prevention and management of novel SARS-CoV-2, but they also benefit populations impacted by HCV. The guidelines address
о Confirmed or suspected cases of COVID-19 at dialysis units
о Dental clinics
о Infection control measures upon the death of a COVID-19-infected patient
о Dermatology/cosmetology service providers
о The use of personal protective equipment at a medical facility for the management of possible and confirmed cases and other safety measures
16
• In May 2020, the Regulation Agency for Medical and Pharmaceutical Activities implemented a monitoring system for adherence to IPC recommendations in dental clinics using a new questionnaire and check list.
о A total of 1,048 dental clinics were evaluated, of which 989 met the requirements and could provide scheduled services. The other clinics were given an individual timeframe based on the types of adjustments needed and were shut down if they did not meet the requirements in the given timeframe.
• The Georgian Dental Association provided IPC training to more than 800 dentists, dental nurses, and staff responsible for decontamination procedures.
• With technical support from the US CDC, a tool was piloted for evaluating the IPC systems in inpatient hospitals, evaluating more than 26 medical facilities based on the supportive supervision principle.1
• As part of a UNICEF project, IPC system assessments were conducted in 82 perinatal units based on the supportive supervision principle.
о 24% of perinatal facilities were in full compliance with all criteria of IPC system organizational support.
о 29% of perinatal facilities were in full compliance with all criteria for sterilization/disinfection.
о Deficiencies were identified related to the requirements of sterilization planning and the prevention of the crossing of “dirty” and “clean” streams, especially during the stages of pre-sterilization processing and sterilization of instruments subject to sterilization.
• A total of 268 non-medical facilities (e.g., nail salons, tattoo parlors) were assessed by NCDC and regional public health centers for IPC compliance in non-healthcare settings. Of these, non-compliance was observed in 43% (n=115) of facilities, and these sites were provided with recommendations for improvement in a two-week timeframe. Upon a repeat visit, if improvements were not made, the site would be fined or closed.
• In 2021, an e-learning IPC curriculum and course was developed for physicians, personnel responsible for infection control, epidemiologists, clinical managers, and nurses.
• In-person IPC trainings have taken place in more than 60 medical facilities, with a total of 6,340 medical workers (epidemiologists, doctors, and nurses) trained.
1 Supportive supervision is a process of helping staff to improve their own work performance continuously. It is carried out in a respectful and non-authoritarian way with a focus on using supervisory visits as an opportunity to improve health staff’s knowledge and skills.
17
Reaching HCV elimination requires a comprehensive scale-up of high-quality HCV screening and access to treatment. Within the Georgia Hepatitis C Elimination Program, over 75,000 persons initiated treatment with a high cure rate; nevertheless, patient enrollment in treatment has declined over time and throughout the COVID-19 pandemic. The government of Georgia has prioritized developing the most optimal model for linkage to care. The program is intended to improve HCV case finding by screening the general population, conducting targeted screening of high-risk populations, and using enhanced screening in regions with known high HCV prevalence.
KEY ACCOMPLISHMENTS AND FINDINGS• As of December 2021, 2.2 million people 18 years of age or older had been screened, and 146,778 (6.8%) were HCV antibody positive. An additional 18,586 screened anti-HCV positive using an anonymous 15-digit code, so their inclusion in the general population screening results cannot be confirmed. Overall, men aged 40–49 years had the highest rate of anti-HCV positivity at 20.8%, followed by men aged 50–59 years (17.4%) and 30–39 years (11.4%). Among women, anti-HCV prevalence was highest in those aged 50–59 years (4.6%), 60–69 years (4.3%), and over 70 years (4.5%).
• From January 2015 through December 2021, 355,905 children under 18 years of age were screened, and 971 (0.3%) were HCV antibody positive.
• An integrated TB/HIV/HCV screening program at primary healthcare centers (PHC) was piloted in the Samegrelo-Zemo Svaneti region in April 2018 with financial support from The Global Fund to Fight AIDS, Tuberculosis, and Malaria (GFATM). The program has since been expanded to every region across the country. In 2020, 252,500 persons were screened, and 877 (0.3%) were positive. In 2021, 173,100 were screened, and 308 (0.2%) tested positive.
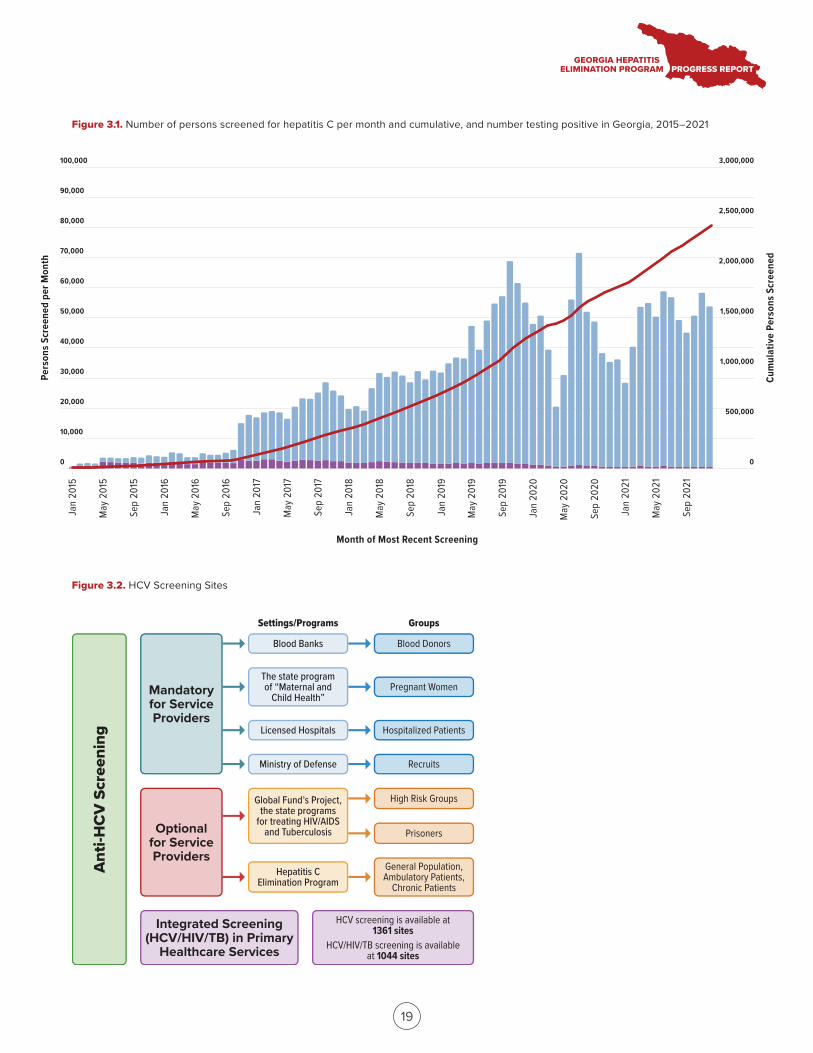
• HCV screening is available at 1,361 locations with 1,849 providers performing anti-HCV screening reported in the system during 2021. Sites and programs are presented in figure 3.2.
• As of December 31st, 2021, 20,889 people have screened positive for anti-HCV but have not had viremia testing performed. An additional 19,067 people who are HCV RNA positive have not yet started treatment. To increase identification of these individuals and their linkage to care, a previously piloted project was expanded to the entire program in 2021. The project had the following targets: conduct viremia testing on 70% (14,000 persons) who screened anti-HCV positive and engage 50% of those who are HCV RNA positive in treatment. Activities completed during 2020–2021:
ACCOMPLISHMENTS BY STRATEGIC DIRECTION
STRATEGY 3.IDENTIFY PERSONS INFECTED WITH HCV AND LINK THEM TO CARE
18
о All medical facilities participating in the project were provided with updated information and material, including linkage questionnaires and methodology on how to communicate with patients lost to follow-up.
о Sixty medical facilities were included in the project:
♦ Contracts were established to provide funding and ensure participation in the project.
♦ Trainings on how to follow up and link people who screened HCV positive to care were conducted with 112 epidemiologists and providers from the harm reduction network and primary healthcare system.
♦ An additional six PHCs were included in cities where there were more than 200 individuals in need of linkage to care.
♦ Five regional coordinators were hired to facilitate connection and guide epidemiologists.
о The following activities took place to identify all persons in need of linkage to care:
♦ Comprehensive lists were created from the Georgia Hepatitis C Elimination Program databases based on the following criteria: 1) screening was performed ≥3 months ago and no viremia testing was completed; 2) person is aged 18–75 years; 3) person cannot be found in death registry; and 4) address or telephone number is identified.
♦ Based on the criteria, 18,082 persons were identified. Relevant lists were sent to the 60 medical facilities, 1 HR site, and 6 PHCs for active follow-up
о As of December 31, 2021, contact was attempted at least one time via phone or a visit by an epidemiologist for 9,989 persons. Successful contact was made with 5,397, and viremia testing was performed on 1,841 (18%). Of those, 1,023 (55.6 %) were HCV viremia positive, and 572 (55.9%) who were HCV viremia positive were enrolled in treatment.
Pers
ons S
cree
ned
per M
onth
Cum
ulat
ive
Pers
ons S
cree
ned
0
10,000
20,000
30,000
40,000
50,000
60,000
70,000
80,000
90,000
100,000
0
500,000
1,000,000
1,500,000
2,000,000
2,500,000
3,000,000
Positive Negative Cumulative Persons Screened
Month of Most Recent Screening
Jan
2015
May
201
5
Sep
2015
Jan
2016
May
201
6
Sep
2016
Jan
2017
May
201
7
Sep
2017
Jan
2018
May
201
8
Sep
2018
Jan
2019
May
201
9
Sep
2019
Jan
2020
May
202
0
Sep
2020
Jan
2021
May
202
1
Sep
2021
HCV screening is available at 1361 sites
HCV/HIV/TB screening is available at 1044 sites
Ant
i-HC
V S
cree
ning
Mandatory for Service Providers
Optional for Service Providers
Integrated Screening (HCV/HIV/TB) in Primary
Healthcare Services
Groups
Blood Donors
Pregnant Women
Hospitalized Patients
Recruits
High Risk Groups
Prisoners
General Population, Ambulatory Patients,
Chronic Patients
Settings/Programs
Blood Banks
The state program of “Maternal and
Child Health”
Licensed Hospitals
Ministry of Defense
Hepatitis C Elimination Program
19
Figure 3.1. Number of persons screened for hepatitis C per month and cumulative, and number testing positive in Georgia, 2015–2021
Figure 3.2. HCV Screening Sites
Global Fund’s Project, the state programs
for treating HIV/AIDS and Tuberculosis
20
Access to quality diagnostic services is crucial for surveillance, accurate and timely detection of hepatitis C infection, ensuring appropriate follow-up care for those infected with HCV, and documenting cure from infection. NCDC uses its laboratory network to improve Georgians’ access to HCV screening and to provide external quality assurance for laboratories (both public and private) licensed to perform HCV diagnostic and monitoring tests.
KEY ACCOMPLISHMENTS AND FINDINGS• As of December 31, 2021, more than 1,000 laboratories providing hepatitis C and other diagnostic testing (including screening) were registered in the MoIDPLHSA database.2
• From 2020 through 2021, the government purchased a total of 600,000 HCV Rapid Diagnostic Test (RDT) kits from Healgen as part of the Georgia Hepatitis C Elimination Program. The performance of these RDT kits was assessed at the Lugar Center and showed 100% sensitivity and specificity.
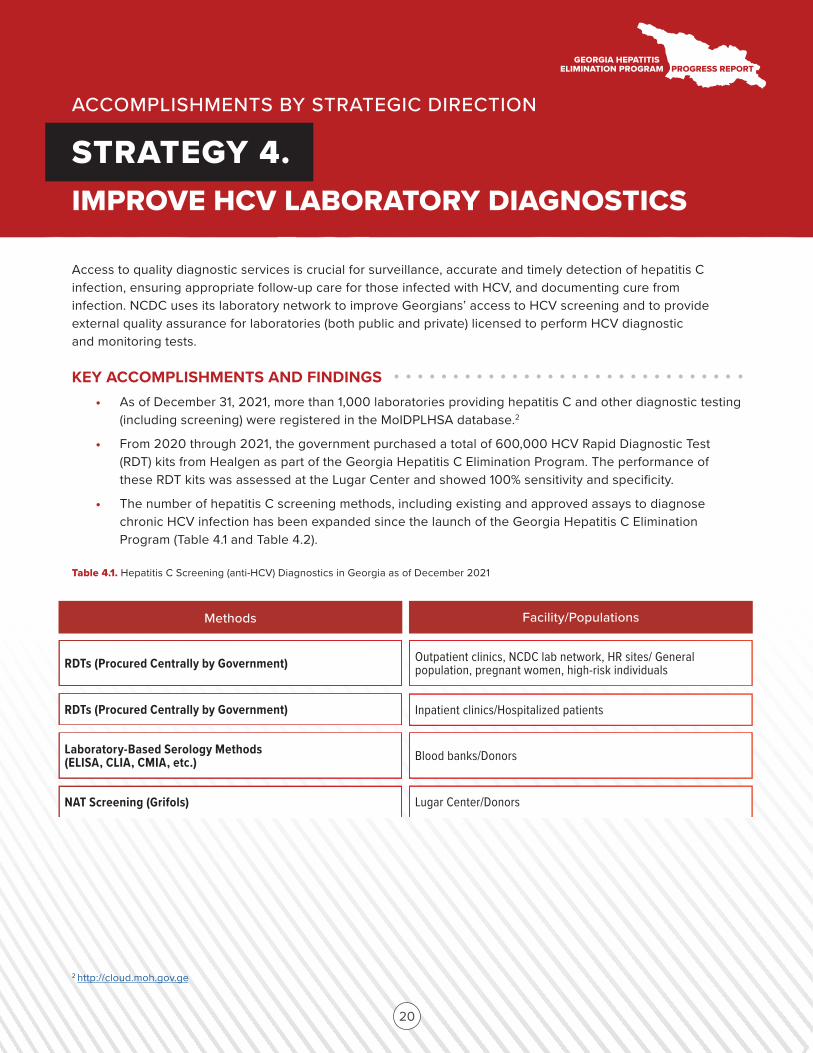
• The number of hepatitis C screening methods, including existing and approved assays to diagnose chronic HCV infection has been expanded since the launch of the Georgia Hepatitis C Elimination Program (Table 4.1 and Table 4.2).
Table 4.1. Hepatitis C Screening (anti-HCV) Diagnostics in Georgia as of December 2021
ACCOMPLISHMENTS BY STRATEGIC DIRECTION
STRATEGY 4.IMPROVE HCV LABORATORY DIAGNOSTICS
2 http://cloud.moh.gov.ge
Methods Facility/Populations
RDTs (Procured Centrally by Government) Outpatient clinics, NCDC lab network, HR sites/ General population, pregnant women, high-risk individuals
RDTs (Procured Centrally by Government) Inpatient clinics/Hospitalized patients
Laboratory-Based Serology Methods (ELISA, CLIA, CMIA, etc.) Blood banks/Donors
NAT Screening (Grifols) Lugar Center/Donors
Aug
2019
Sep
2019
Oct 2
019
Nov 2
019
Dec 2
019
Jan
2020
Feb
2020
Mar
202
0
Apr 2
020
May
202
0
Jun
2020
Jul 2
020
Aug
2020
Sep
2020
Oct 2
020
Nov 2
020
Dec 2
020
Jan
2021
Feb
2021
Mar
202
1
Apr 2
021
May
202
1
Jun
2021
Jul 2
021
Aug
2021
Sep
2021
Oct 2
021
0
500
1,000
1,500
2,000
2,500
3,000
Pers
ons T
este
d pe
r Mon
th
RNA CoreAg GeneXpert
Month of Earliest Viremia Test
*with CoreAG Initial Test Prioritized Over Confirmation Method
Methods Facility/Populations
Quantitative HCV RNA• Different Platforms• GeneXpert® HCV VL• GeneXpert® FS HCV VL
Qualitative HCV RNA
HCV cAg
NAT Discriminatory Testing
• HCV treatment provider sites/Lugar Center, NCDC• HR sites/Lugar Center, NCDC• HR sites/Lugar Center, NCDC
HCV treatment provider sites
Lugar Center, NCDC
Lugar Center, NCDC
21
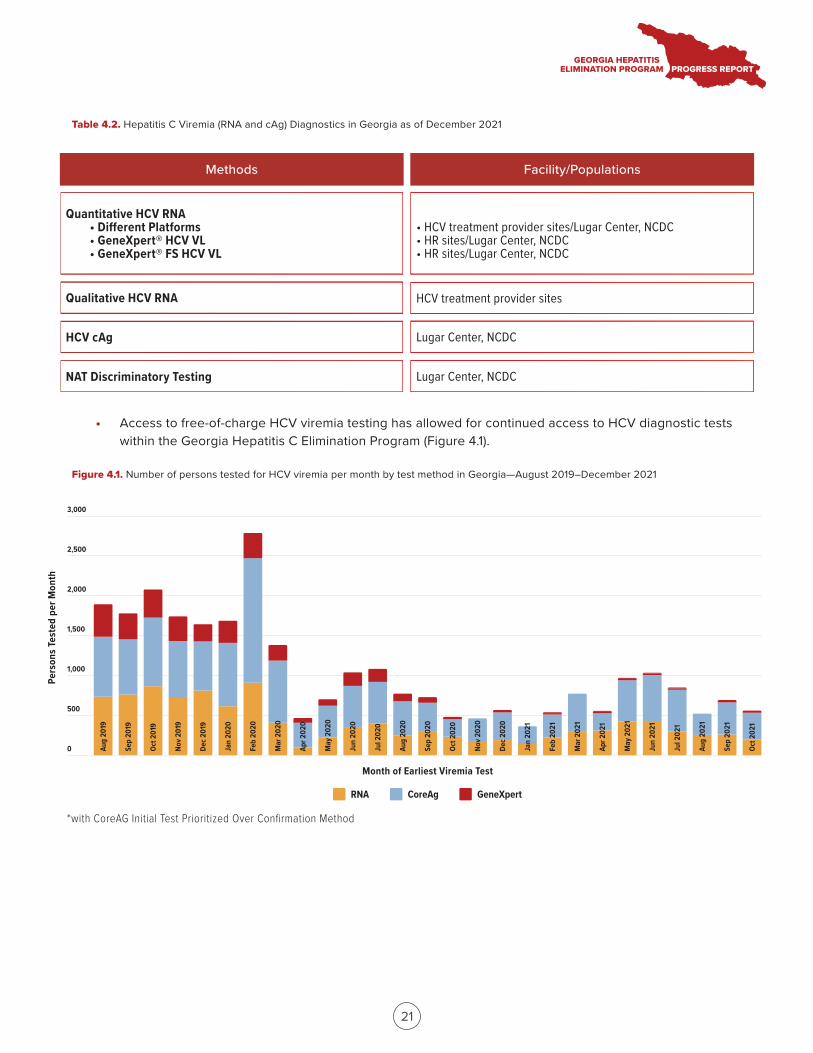
• Access to free-of-charge HCV viremia testing has allowed for continued access to HCV diagnostic tests within the Georgia Hepatitis C Elimination Program (Figure 4.1).
Table 4.2. Hepatitis C Viremia (RNA and cAg) Diagnostics in Georgia as of December 2021
Figure 4.1. Number of persons tested for HCV viremia per month by test method in Georgia—August 2019–December 2021
22
• From 2017 through 2021, 18 laboratories (including the Lugar Center [National Reference Laboratory]) were enrolled in the National External Quality Assurance (EQA) Program. From 2020 through 2021, HCV proficiency test (PT) panels were distributed five times to each laboratory.
о A total of 13 labs in 2020 and 10 labs in 2021 participated in at least one of the scheduled PT rounds and performed HCV RNA viral load tests. Four labs performed genotyping in 2020, and none performed genotyping in 2021 (the program removed genotyping as a requirement secondary to pangenotypic regimens being in place for treatment). In 2020, 12 of the 13 laboratories performed qualitative HCV RNA tests.
о The cumulative 2020 EQA program results for quantitative HCV RNA viral load were excellent in 73.1% of all PT specimens, good in 11.8%, acceptable in 4.2%, and not acceptable in 10.9%.
о The cumulative 2021 EQA program results for quantitative HCV RNA viral load were excellent in 78.1% of all PT specimens, good in 14.2%, acceptable in 4.5%, and not acceptable in 3.2%. The problems identified were related to improper use of quantitative HCV PCR calibrators or non-compliance with the manufacturer’s recommendations on PCR platform-reagent combinations.
• In 2021, a new EQA program for TTI serology was introduced in the country, and 18 blood banks each received a PT panel for analysis of HCV, HBV, HIV, and syphilis three times. Two discrepancies were found in the first round related to HIV (one false negative and one false positive). All results were acceptable in the remaining rounds.
• CDC funded a project to strengthen the National Laboratory System and the national EQA Program by establishing a laboratory training hub and the ECHO Hepatitis C Diagnostics Laboratory Community. Curricula were developed and the Lugar Center held trainings on implementing quality management systems and achieving immediate, measurable improvement.
• The National EQA Program expertise and framework played a key role in the rapid scale up of COVID-19 diagnostics in Georgia.
• The second National EQA Program Workshop was held on September 10, 2021. During the meeting, the need for short- and middle-term strategies for synergistic collaboration between the participants of the HCV, COVID-19, and blood safety EQA programs was identified, and recommendations were developed for the Georgia Hepatitis C Elimination Program and the COVID-19 Emergency Response to improve laboratory capacity. Recommendations were made related to the regulatory framework of clinical laboratory technical requirements, including mandatory certification/accreditation requirements, mandatory participation in the EQA programs, and updates to diagnostic algorithms.
23
Since June 2016, all HCV-infected persons have been eligible for treatment regardless of liver disease severity. Curative antiviral therapy is provided free of charge through a partnership with Gilead Sciences. Initially, all participants received sofosbuvir (SOF)-based antiviral treatment regimens, in combination with ribavirin alone or with pegylated interferon and ribavirin. Beginning in March 2016, the majority of patients began receiving sofosbuvir/ledipasvir (SOF/LED)-based regimens. From December 2018, the pangenotypic regimen Velpatasvir/Sofosbuvir (VEL/SOF) had been available for patients.
KEY ACCOMPLISHMENTS AND FINDINGS• As of December 2021, there are 35 HCV treatment centers, including four HR sites (three NSP and one OST) and ten PHC sites.
• All HCV cases requiring treatment are reviewed by the treatment inclusion committee. Since August 1, 2018, cases are reviewed electronically in real time to reduce delay to treatment initiation. In the 6 months prior to August 1, 2018, the median time between committee review and treatment initiation was 28 days (IQR 21–38), compared to 6 days (IQR: 3–15) after the implementation of electronic committee review (August 2018–December 2021). For the period of January 2020–December 2021, the median time was 7 days (IQR 3–17).
• As of December 2021, all patients were receiving the pangenotypic regimen VEL/SOF with or without ribavirin, eliminating the need for genotyping and allowing for simplified treatment and monitoring algorithms (Appendix 2).
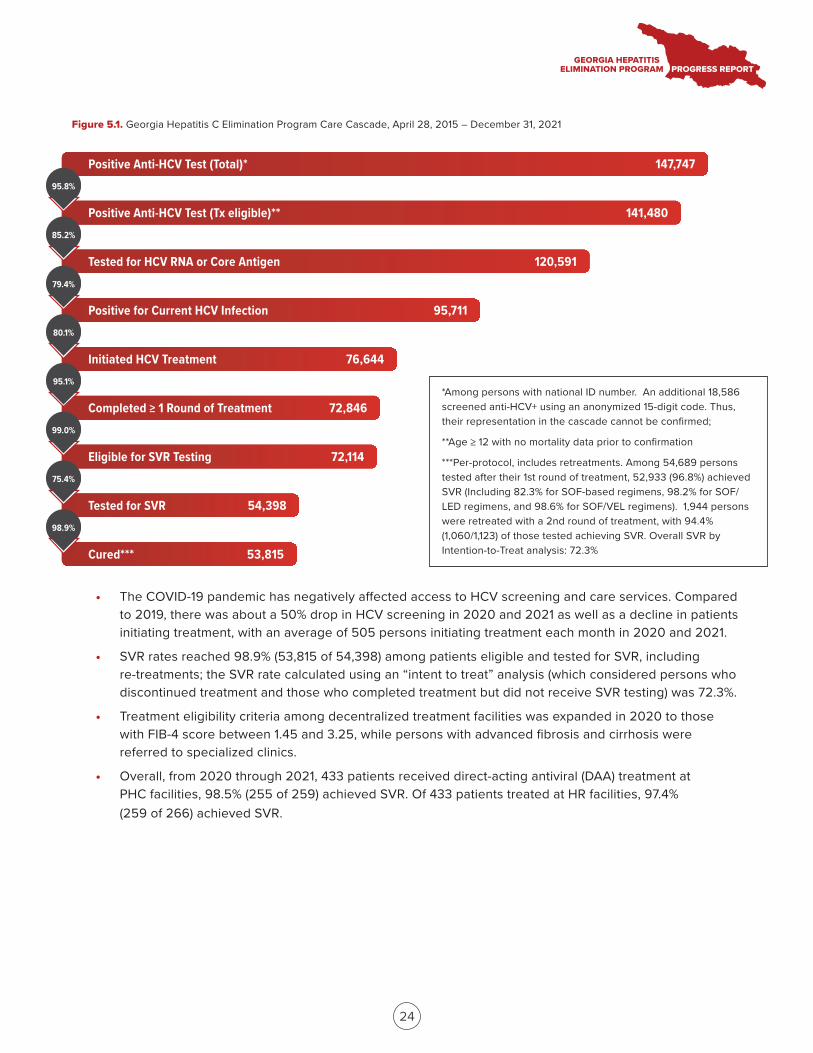
• The national screening registry and HCV treatment database allow for clinical monitoring and program evaluation across the care cascade. As of December 31, 2021, 147,747 persons screened positive for HCV antibodies; of those, 120,591 (81.6%) underwent HCV viremia testing. A total of 95,711 (79.4%) persons tested had active HCV infection (RNA or core antigen positive)—63.8% of the estimated 150,000 adults living with chronic HCV infection in Georgia. A total of 76,644 persons initiated treatment—59.8% of the estimated target population to be treated (128,250). Of the 54,398 patients who were evaluated for SVR, 53,815 (98.9%) tested negative for HCV by PCR, representing 44.2% of the population based on the 2020 90-95-95 goal (121,837).
ACCOMPLISHMENTS BY STRATEGIC DIRECTION
STRATEGY 5.PROVIDE COMPREHENSIVE HCV CARE AND TREATMENT
Positive Anti-HCV Test (Total)*
Positive Anti-HCV Test (Tx eligible)**
Tested for HCV RNA or Core Antigen
Positive for Current HCV Infection
Initiated HCV Treatment
Completed ≥ 1 Round of Treatment
Eligible for SVR Testing
Tested for SVR
Cured***
147,747
141,480
120,591
95,711
76,644
72,846
72,114
54,398
53,815
95.8%
85.2%
79.4%
80.1%
95.1%
99.0%
75.4%
98.9%
*Among persons with national ID number. An additional 18,586 screened anti-HCV+ using an anonymized 15-digit code. Thus, their representation in the cascade cannot be confirmed;
**Age ≥ 12 with no mortality data prior to confirmation
***Per-protocol, includes retreatments. Among 54,689 persons tested after their 1st round of treatment, 52,933 (96.8%) achieved SVR (Including 82.3% for SOF-based regimens, 98.2% for SOF/LED regimens, and 98.6% for SOF/VEL regimens). 1,944 persons were retreated with a 2nd round of treatment, with 94.4% (1,060/1,123) of those tested achieving SVR. Overall SVR by Intention-to-Treat analysis: 72.3%
24
• The COVID-19 pandemic has negatively affected access to HCV screening and care services. Compared to 2019, there was about a 50% drop in HCV screening in 2020 and 2021 as well as a decline in patients initiating treatment, with an average of 505 persons initiating treatment each month in 2020 and 2021.
• SVR rates reached 98.9% (53,815 of 54,398) among patients eligible and tested for SVR, including re-treatments; the SVR rate calculated using an “intent to treat” analysis (which considered persons who discontinued treatment and those who completed treatment but did not receive SVR testing) was 72.3%.
• Treatment eligibility criteria among decentralized treatment facilities was expanded in 2020 to those with FIB-4 score between 1.45 and 3.25, while persons with advanced fibrosis and cirrhosis were referred to specialized clinics.
• Overall, from 2020 through 2021, 433 patients received direct-acting antiviral (DAA) treatment at PHC facilities, 98.5% (255 of 259) achieved SVR. Of 433 patients treated at HR facilities, 97.4% (259 of 266) achieved SVR.
Figure 5.1. Georgia Hepatitis C Elimination Program Care Cascade, April 28, 2015 – December 31, 2021
25
The epidemiological surveillance system for viral hepatitis in Georgia requires urgent notification of each acute viral hepatitis (HAV, HBV, HEV) case by healthcare institutions/laboratories and PHCs. Chronic hepatitis B and acute and chronic hepatitis C are reported through a special form with aggregated monthly notifications. Acute and chronic cases of infectious diseases registered in the Electronic Integrated Diseases Surveillance System (EIDSS) are automatically collected and accumulated in the monthly report. In addition, the treatment registry and screening database was developed to allow for real-time monitoring of screening; it links with the other databases that are part of the Georgia Hepatitis C Elimination Program.
KEY ACCOMPLISHMENTS AND FINDINGS• In 2020, acute and chronic HBV and HCV sentinel surveillance was established under the Surveillance State Program at four infectious disease hospitals (Tbilisi, Kutaisi, Zugdidi, and Batumi). Only three are currently functioning, and each is managed by a Sentinel Supervision Coordinator.
о Within the sentinel surveillance project, a series of meetings was conducted with PHC personnel to update surveillance-related policy papers, case definitions, reporting forms, and guidelines.
о During the project’s implementation, training was conducted in three sentinel clinics (Kutaisi, Batumi and Zugdidi) and in three PHCs (Batumi, Zugdidi, Telavi) to introduce updated definitions of viral hepatitis cases and sentinel surveillance protocols to 32 doctors and epidemiologists.
• In 2020, the Lugar Center became the first regional lab to utilize Global Hepatitis Outbreak Surveillance Technology (GHOST).
о A study evaluating re-infection and transmission networks among PWID has enrolled 100 persons from all participating study sites.
о Transmission networks and co-infections were detected, indicating a long history of HCV infection in Georgia.
• An evaluation of the current EIDSS showed that the existing disease surveillance system has shortcomings in terms of both acute HBV case reporting and epidemiology, and the system needs to be updated and improved.
о In 2020, 47 cases of acute hepatitis B were reported through the EIDSS. Ten cases were reported by sentinel sites, and 7 of those cases coincided with EIDSS.
о In 2021, 19 cases of acute hepatitis B were reported in the EIDSS. Twenty-four cases were reported by the sentinel sites, and 10 of those cases coincided with EIDSS.
ACCOMPLISHMENTS BY STRATEGIC DIRECTION
STRATEGY 6.IMPROVE HCV SURVEILLANCE
26
• A repeat nationwide serosurvey was conducted from June through October 2021 to assess the burden of hepatitis B and C among adults and children aged 5 years and older.
о 7,237 adults and 1,473 children participated in the survey.
о Results show 1.8% prevalence of chronic HCV infection among adults, a 67% reduction from 2015. No children were positive for anti-HCV or HCV RNA.
о The burden of chronic HBV infection among adults is stable at 2.7% HBsAg (2.9% in 2015); anti-HBc prevalence was 21.7%.
о The prevalence of anti-HBc in children was 0.7%, and the prevalence of HBsAg was 0.03%, exemplifying good vaccination coverage.
о The number of people reporting risk factors associated with HCV and HBV (IDU, transfusion, past incarceration) has declined since 2015.
о Chronic HCV infection is still apparent among PWID.
• A project to improve HCV and HBV surveillance was implemented:
о All HCV seroconversion cases from January 2019 through November 2020 were identified in the HCV screening database and analyzed. Overall, there were 1,008 seroconversions, of which 89 died. Of the seroconversions, 803 had phone numbers available and 299 were randomly selected for follow-up.
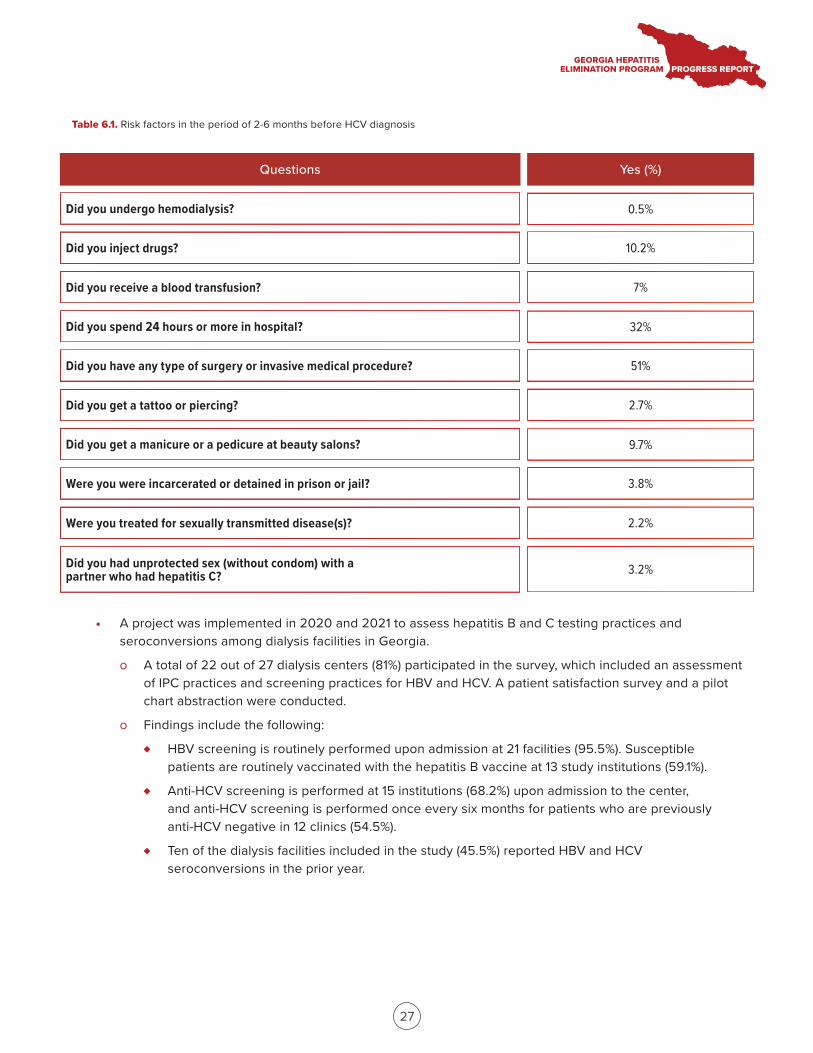
о Telephone interviews were conducted to collect risk factor data and understand behaviors associated with transmission of HCV and HBV. Out of 299 selected for follow-up, 73% (n=219) of respondents with an age range of 26–94 years were interviewed. Remaining findings are presented in Table 6.1.
Questions Yes (%)
27
• A project was implemented in 2020 and 2021 to assess hepatitis B and C testing practices and seroconversions among dialysis facilities in Georgia.
о A total of 22 out of 27 dialysis centers (81%) participated in the survey, which included an assessment of IPC practices and screening practices for HBV and HCV. A patient satisfaction survey and a pilot chart abstraction were conducted.
о Findings include the following:
♦ HBV screening is routinely performed upon admission at 21 facilities (95.5%). Susceptible patients are routinely vaccinated with the hepatitis B vaccine at 13 study institutions (59.1%).
♦ Anti-HCV screening is performed at 15 institutions (68.2%) upon admission to the center, and anti-HCV screening is performed once every six months for patients who are previously anti-HCV negative in 12 clinics (54.5%).
♦ Ten of the dialysis facilities included in the study (45.5%) reported HBV and HCV seroconversions in the prior year.
Table 6.1. Risk factors in the period of 2-6 months before HCV diagnosis
Did you undergo hemodialysis? 0.5%
Did you inject drugs? 10.2%
Did you receive a blood transfusion? 7%
Did you spend 24 hours or more in hospital? 32%
Did you have any type of surgery or invasive medical procedure? 51%
Did you get a tattoo or piercing? 2.7%
Did you get a manicure or a pedicure at beauty salons? 9.7%
Were you were incarcerated or detained in prison or jail? 3.8%
Were you treated for sexually transmitted disease(s)? 2.2%
Did you had unprotected sex (without condom) with a partner who had hepatitis C? 3.2%
28
• A project was initiated to estimate the risk of HCV transmission by diagnostic endoscopic procedures:
о Monitoring visits were conducted at four selected endoscopic units, and 1,030 patients were tested between April and September 2021.
о The project includes follow-up screening at six months to assess seroconversion rate; follow-up testing is ongoing.
• In 2020, NCDC implemented a project to develop and establish a sustainable surveillance system for children born to women with chronic HCV infection.
о Initial data from pregnant women registered in the birth registry from 2017 through 2020 showed 707 women were anti-HCV positive, and 580 (82%) of those received viremia testing out of which 450 (78%) were confirmed having chronic HCV infection. Of those, 355 (79%) were treated, with 116 receiving treatment prior to pregnancy.
о A study is underway to assess barriers that women who are anti-HCV positive face to seeking care in the Georgia Hepatitis C Elimination Program and to link children born to mothers with HCV infection to hepatitis C diagnostic services.
29
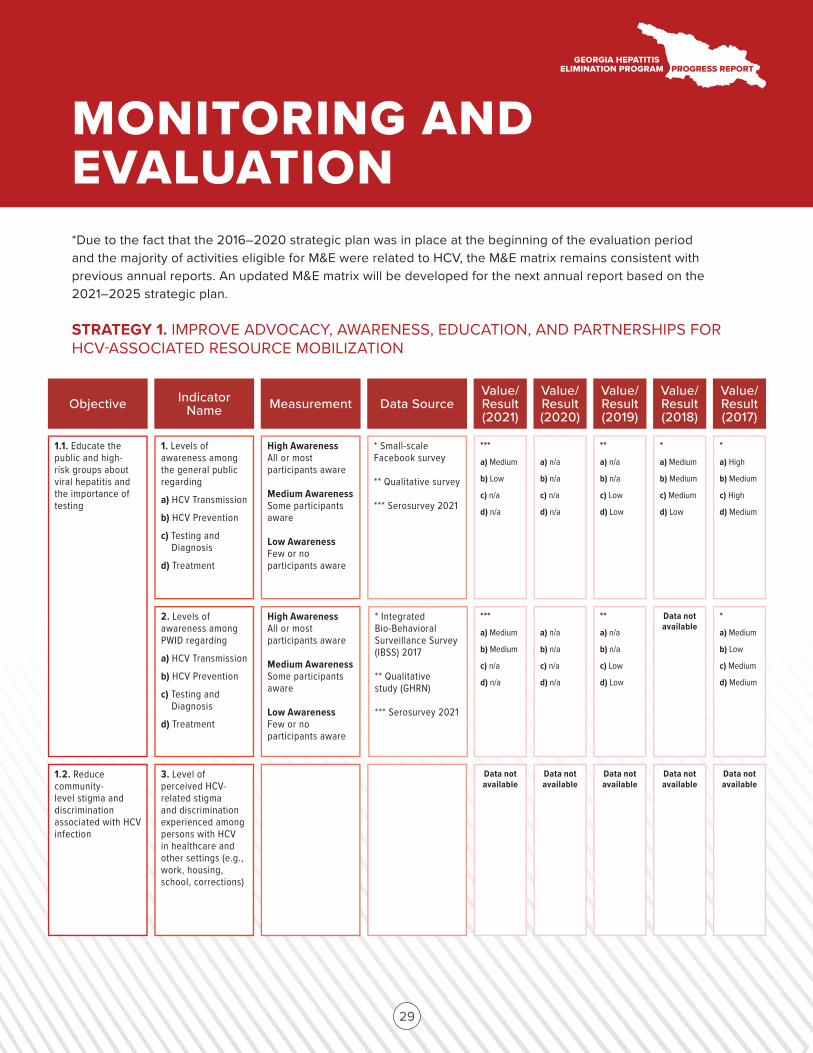
1.1. Educate the public and high-risk groups about viral hepatitis and the importance of testing
Objective Indicator Name Measurement Data Source
Value/ Result (2021)
Value/ Result (2020)
Value/ Result (2019)
Value/ Result (2018)
Value/ Result (2017)
1. Levels of awareness among the general public regarding
a) HCV Transmission
b) HCV Prevention
c) Testing and Diagnosis
d) Treatment
High Awareness All or most participants aware
Medium Awareness Some participants aware
Low Awareness Few or no participants aware
* Small-scale Facebook survey
** Qualitative survey
*** Serosurvey 2021
***
a) Medium
b) Low
c) n/a
d) n/a
a) n/a
b) n/a
c) n/a
d) n/a
**
a) n/a
b) n/a
c) Low
d) Low
*
a) Medium
b) Medium
c) Medium
d) Low
*
a) High
b) Medium
c) High
d) Medium
1.2. Reduce community-level stigma and discrimination associated with HCV infection
3. Level of perceived HCV-related stigma and discrimination experienced among persons with HCV in healthcare and other settings (e.g., work, housing, school, corrections)
Data not available
Data not available
Data not available
Data not available
Data not available
2. Levels of awareness among PWID regarding
a) HCV Transmission
b) HCV Prevention
c) Testing and Diagnosis
d) Treatment
High Awareness All or most participants aware
Medium Awareness Some participants aware
Low Awareness Few or no participants aware
* Integrated Bio-Behavioral Surveillance Survey (IBSS) 2017
** Qualitative study (GHRN)
*** Serosurvey 2021
***
a) Medium
b) Medium
c) n/a
d) n/a
a) n/a
b) n/a
c) n/a
d) n/a
**
a) n/a
b) n/a
c) Low
d) Low
Data not available
*
a) Medium
b) Low
c) Medium
d) Medium
*Due to the fact that the 2016–2020 strategic plan was in place at the beginning of the evaluation period and the majority of activities eligible for M&E were related to HCV, the M&E matrix remains consistent with previous annual reports. An updated M&E matrix will be developed for the next annual report based on the 2021–2025 strategic plan.
STRATEGY 1. IMPROVE ADVOCACY, AWARENESS, EDUCATION, AND PARTNERSHIPS FOR HCV-ASSOCIATED RESOURCE MOBILIZATION
MONITORING AND EVALUATION
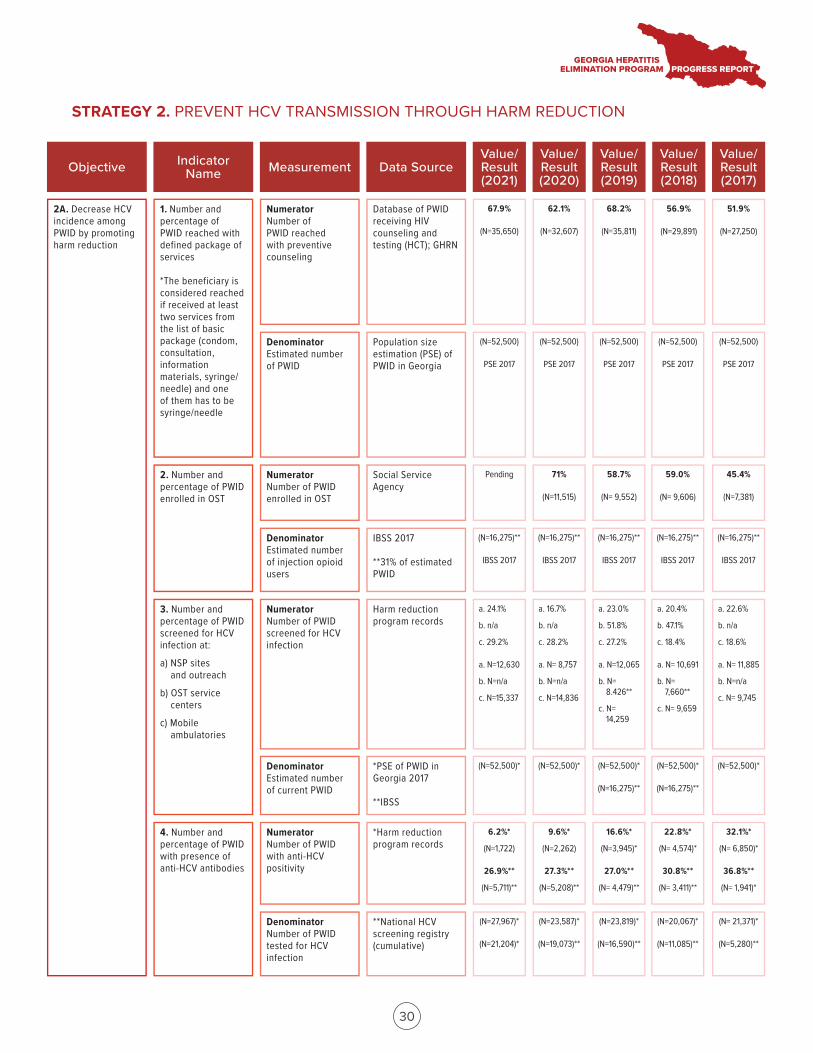
2A. Decrease HCV incidence among PWID by promoting harm reduction
Objective Indicator Name Measurement Data Source
Value/ Result (2021)
Value/ Result (2020)
Value/ Result (2019)
Value/ Result (2018)
Value/ Result (2017)
1. Number and percentage of PWID reached with defined package of services
*The beneficiary is considered reached if received at least two services from the list of basic package (condom, consultation, information materials, syringe/needle) and one of them has to be syringe/needle
Numerator Number of PWID reached with preventive counseling
Database of PWID receiving HIV counseling and testing (HCT); GHRN
67.9%
(N=35,650)
3. Number and percentage of PWID screened for HCV infection at:
a) NSP sitesand outreach
b) OST servicecenters
c) Mobileambulatories
2. Number and percentage of PWID enrolled in OST
Denominator Estimated number of PWID
(N=52,500)
PSE 2017
4. Number and percentage of PWID with presence of anti-HCV antibodies
Numerator Number of PWID enrolled in OST
Denominator Estimated number of injection opioid users
Numerator Number of PWID screened for HCV infection
Denominator Estimated number of current PWID
Numerator Number of PWID with anti-HCV positivity
Denominator Number of PWID tested for HCV infection
Population size estimation (PSE) of PWID in Georgia
Social Service Agency
IBSS 2017
**31% of estimated PWID
Harm reduction program records
*PSE of PWID in Georgia 2017
**IBSS
*Harm reduction program records
**National HCV screening registry (cumulative)
62.1%
(N=32,607)
(N=52,500)
PSE 2017
68.2%
(N=35,811)
(N=52,500)
PSE 2017
(N=52,500)
PSE 2017
(N=52,500)
PSE 2017
56.9%
(N=29,891)
51.9%
(N=27,250)
Pending 71%
(N=11,515)
58.7%
(N= 9,552)
59.0%
(N= 9,606)
45.4%
(N=7,381)
(N=16,275)**
IBSS 2017
(N=16,275)**
IBSS 2017
(N=16,275)**
IBSS 2017
(N=16,275)**
IBSS 2017
(N=16,275)**
IBSS 2017
a. 24.1%
b. n/a
c. 29.2%
a. N=12,630
b. N=n/a
c. N=15,337
a. 16.7%
b. n/a
c. 28.2%
a. N= 8,757
b. N=n/a
c. N=14,836
a. 23.0%
b. 51.8%
c. 27.2%
a. N=12,065
b. N=8.426**
c. N=14,259
a. 20.4%
b. 47.1%
c. 18.4%
a. N= 10,691
b. N=7,660**
c. N= 9,659
a. 22.6%
b. n/a
c. 18.6%
a. N= 11,885
b. N=n/a
c. N= 9,745
(N=52,500)* (N=52,500)* (N=52,500)*
(N=16,275)**
(N=52,500)*
(N=16,275)**
(N=52,500)*
6.2%*
(N=1,722)
26.9%**
(N=5,711)**
9.6%*
(N=2,262)
27.3%**
(N=5,208)**
16.6%*
(N=3,945)*
27.0%**
(N= 4,479)**
22.8%*
(N= 4,574)*
30.8%**
(N= 3,411)**
32.1%*
(N= 6,850)*
36.8%**
(N= 1,941)*
(N=27,967)*
(N=21,204)*
(N=23,587)*
(N=19,073)**
(N=23,819)*
(N=16,590)**
(N=20,067)*
(N=11,085)**
(N= 21,371)*
(N=5,280)**
30
STRATEGY 2. PREVENT HCV TRANSMISSION THROUGH HARM REDUCTION
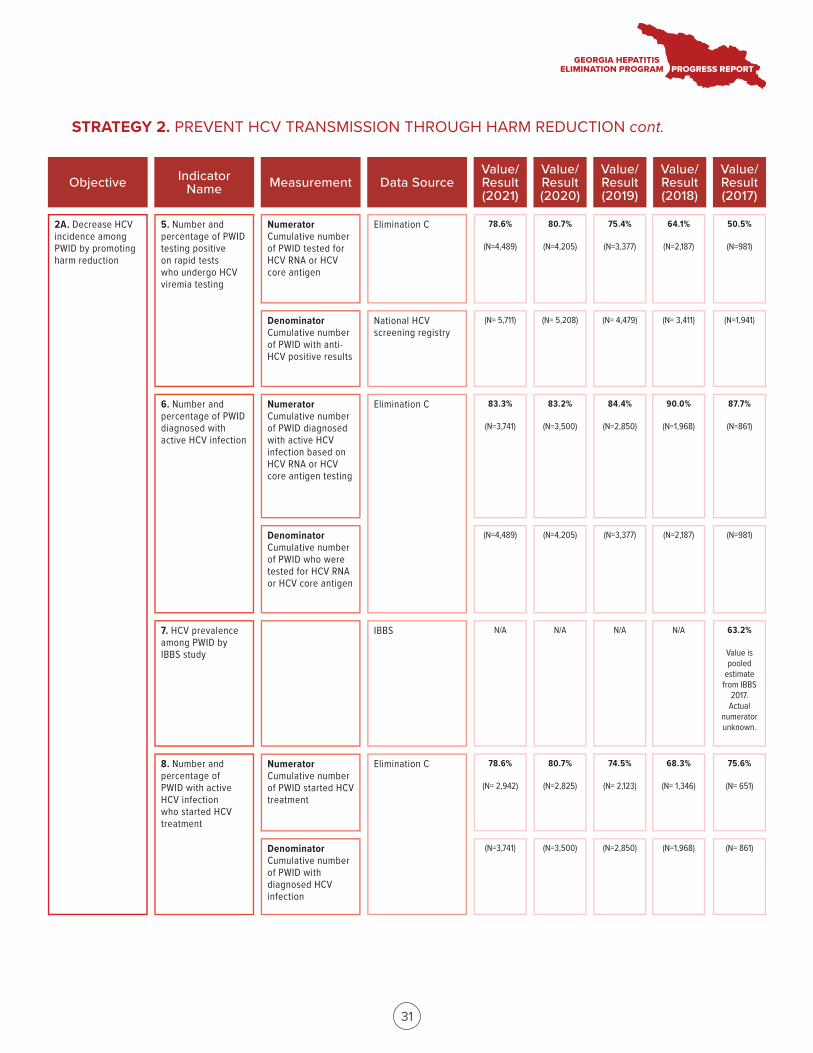
5. Number and percentage of PWID testing positive on rapid tests who undergo HCV viremia testing
6. Number and percentage of PWID diagnosed with active HCV infection
7. HCV prevalence among PWID by IBBS study
8. Number and percentage of PWID with active HCV infection who started HCV treatment
Numerator Cumulative number of PWID tested for HCV RNA or HCV core antigen
Denominator Cumulative number of PWID with anti-HCV positive results
Numerator Cumulative number of PWID diagnosed with active HCV infection based on HCV RNA or HCV core antigen testing
Denominator Cumulative number of PWID who were tested for HCV RNA or HCV core antigen
Numerator Cumulative number of PWID started HCV treatment
Denominator Cumulative number of PWID with diagnosed HCV infection
Elimination C
National HCV screening registry
Elimination C
IBBS
Elimination C
78.6%
(N=4,489)
80.7%
(N=4,205)
75.4%
(N=3,377)
64.1%
(N=2,187)
50.5%
(N=981)
(N= 5,711) (N= 5,208) (N= 4,479) (N= 3,411) (N=1,941)
83.3%
(N=3,741)
83.2%
(N=3,500)
84.4%
(N=2,850)
90.0%
(N=1,968)
87.7%
(N=861)
(N=4,489) (N=4,205) (N=3,377) (N=2,187) (N=981)
N/A N/A N/A N/A 63.2%
Value is pooled
estimate from IBBS
2017. Actual
numerator unknown.
78.6%
(N= 2,942)
80.7%
(N=2,825)
74.5%
(N= 2,123)
68.3%
(N= 1,346)
75.6%
(N= 651)
(N=3,741) (N=3,500) (N=2,850) (N=1,968) (N= 861)
2A. Decrease HCV incidence among PWID by promoting harm reduction
Objective Indicator Name Measurement Data Source
Value/ Result (2021)
Value/ Result (2020)
Value/ Result (2019)
Value/ Result (2018)
Value/ Result (2017)
31
STRATEGY 2. PREVENT HCV TRANSMISSION THROUGH HARM REDUCTION cont.
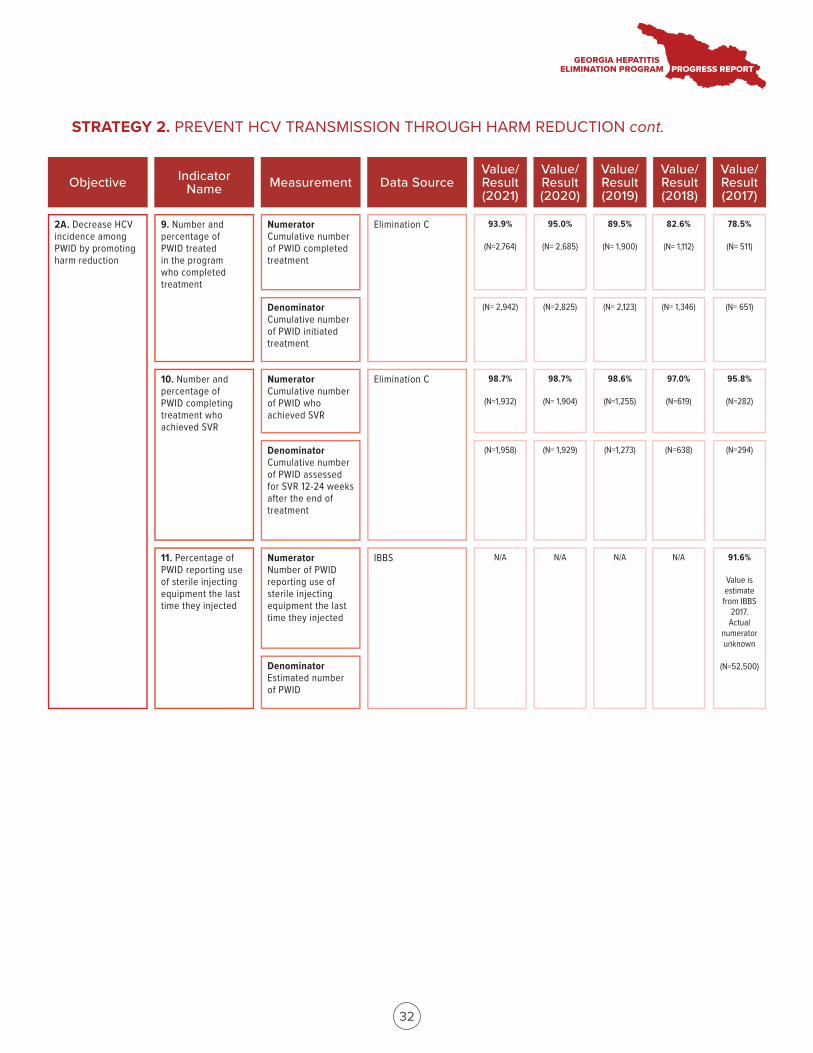
9. Number and percentage of PWID treated in the program who completed treatment
10. Number and percentage of PWID completing treatment who achieved SVR
11. Percentage of PWID reporting use of sterile injecting equipment the last time they injected
Numerator Cumulative number of PWID completed treatment
Denominator Cumulative number of PWID initiated treatment
Numerator Cumulative number of PWID who achieved SVR
Denominator Cumulative number of PWID assessed for SVR 12-24 weeks after the end of treatment
Numerator Number of PWID reporting use of sterile injecting equipment the last time they injected
Denominator Estimated number of PWID
Elimination C
Elimination C
IBBS
93.9%
(N=2,764)
95.0%
(N= 2,685)
89.5%
(N= 1,900)
82.6%
(N= 1,112)
78.5%
(N= 511)
(N= 2,942) (N=2,825) (N= 2,123) (N= 1,346) (N= 651)
98.7%
(N=1,932)
98.7%
(N= 1,904)
98.6%
(N=1,255)
97.0%
(N=619)
95.8%
(N=282)
(N=1,958) (N= 1,929) (N=1,273) (N=638) (N=294)
N/A N/A N/A N/A 91.6%
Value is estimate
from IBBS 2017. Actual
numerator unknown
(N=52,500)
2A. Decrease HCV incidence among PWID by promoting harm reduction
Objective Indicator Name Measurement Data Source
Value/ Result (2021)
Value/ Result (2020)
Value/ Result (2019)
Value/ Result (2018)
Value/ Result (2017)
32
STRATEGY 2. PREVENT HCV TRANSMISSION THROUGH HARM REDUCTION cont.
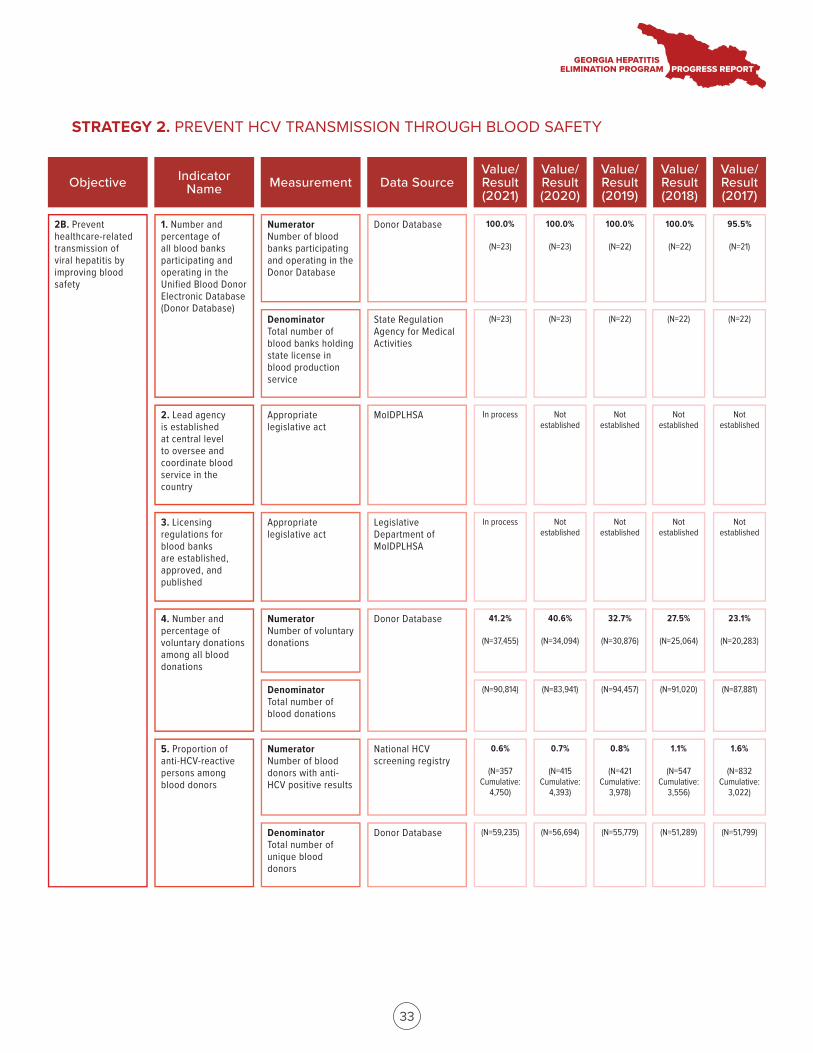
2B. Prevent healthcare-related transmission of viral hepatitis by improving blood safety
Objective Indicator Name Measurement Data Source
Value/ Result (2021)
Value/ Result (2020)
Value/ Result (2019)
Value/ Result (2018)
Value/ Result (2017)
1. Number and percentage of all blood banks participating and operating in the Unified Blood Donor Electronic Database (Donor Database)
Numerator Number of blood banks participating and operating in the Donor Database
Donor Database 100.0%
(N=23)
3. Licensing regulations for blood banks are established, approved, and published
2. Lead agency is established at central level to oversee and coordinate blood service in the country
Denominator Total number of blood banks holding state license in blood production service
(N=23)
4. Number and percentage of voluntary donations among all blood donations
5. Proportion of anti-HCV-reactive persons among blood donors
Appropriate legislative act
Appropriate legislative act
Numerator Number of voluntary donations
Denominator Total number of blood donations
Numerator Number of blood donors with anti-HCV positive results
Denominator Total number of unique blood donors
State Regulation Agency for Medical Activities
MoIDPLHSA
Legislative Department of MoIDPLHSA
Donor Database
National HCV screening registry
Donor Database
100.0%
(N=23)
(N=23)
100.0%
(N=22)
(N=22) (N=22) (N=22)
100.0%
(N=22)
95.5%
(N=21)
In process Not established
Not established
Not established
Not established
In process Not established
Not established
Not established
Not established
41.2%
(N=37,455)
40.6%
(N=34,094)
32.7%
(N=30,876)
27.5%
(N=25,064)
23.1%
(N=20,283)
(N=90,814) (N=83,941) (N=94,457) (N=91,020) (N=87,881)
0.6%
(N=357 Cumulative:
4,750)
0.7%
(N=415 Cumulative:
4,393)
0.8%
(N=421 Cumulative:
3,978)
1.1%
(N=547 Cumulative:
3,556)
1.6%
(N=832 Cumulative:
3,022)
(N=59,235) (N=56,694) (N=55,779) (N=51,289) (N=51,799)
33
STRATEGY 2. PREVENT HCV TRANSMISSION THROUGH BLOOD SAFETY
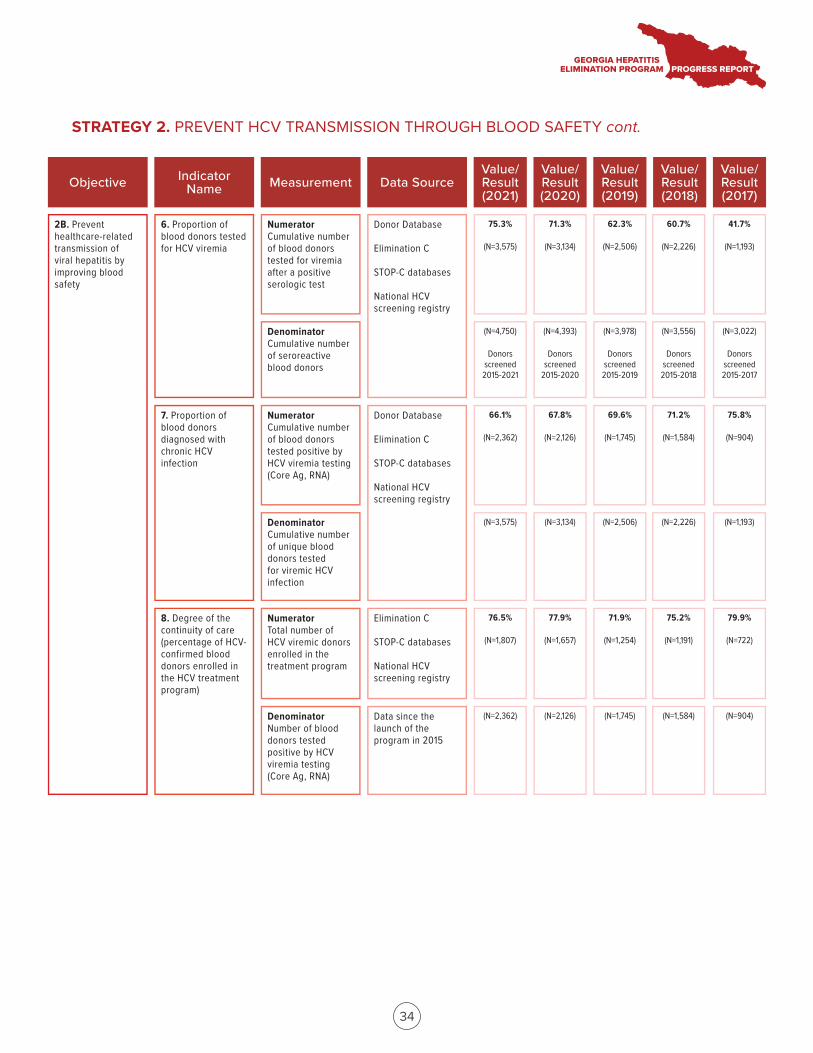
6. Proportion of blood donors tested for HCV viremia
8. Degree of the continuity of care (percentage of HCV-confirmed blood donors enrolled in the HCV treatment program)
Numerator Cumulative number of blood donors tested for viremia after a positive serologic test
Denominator Cumulative number of seroreactive blood donors
Numerator Total number of HCV viremic donors enrolled in the treatment program
Denominator Number of blood donors tested positive by HCV viremia testing (Core Ag, RNA)
Donor Database
Elimination C
STOP-C databases
National HCV screening registry
Elimination C
STOP-C databases
National HCV screening registry
75.3%
(N=3,575)
71.3%
(N=3,134)
62.3%
(N=2,506)
60.7%
(N=2,226)
41.7%
(N=1,193)
(N=4,750)
Donors screened
2015-2021
(N=4,393)
Donors screened
2015-2020
(N=3,978)
Donors screened
2015-2019
(N=3,556)
Donors screened
2015-2018
(N=3,022)
Donors screened 2015-2017
76.5%
(N=1,807)
77.9%
(N=1,657)
71.9%
(N=1,254)
75.2%
(N=1,191)
79.9%
(N=722)
(N=2,362) (N=2,126) (N=1,745) (N=1,584) (N=904)
7. Proportion of blood donors diagnosed with chronic HCV infection
Numerator Cumulative number of blood donors tested positive by HCV viremia testing (Core Ag, RNA)
Denominator Cumulative number of unique blood donors tested for viremic HCV infection
Donor Database
Elimination C
STOP-C databases
National HCV screening registry
66.1%
(N=2,362)
67.8%
(N=2,126)
69.6%
(N=1,745)
71.2%
(N=1,584)
75.8%
(N=904)
(N=3,575) (N=3,134) (N=2,506) (N=2,226) (N=1,193)
Data since the launch of the program in 2015
Objective Indicator Name Measurement Data Source
Value/ Result (2021)
Value/ Result (2020)
Value/ Result (2019)
Value/ Result (2018)
Value/ Result (2017)
2B. Prevent healthcare-related transmission of viral hepatitis by improving blood safety
34
STRATEGY 2. PREVENT HCV TRANSMISSION THROUGH BLOOD SAFETY cont.
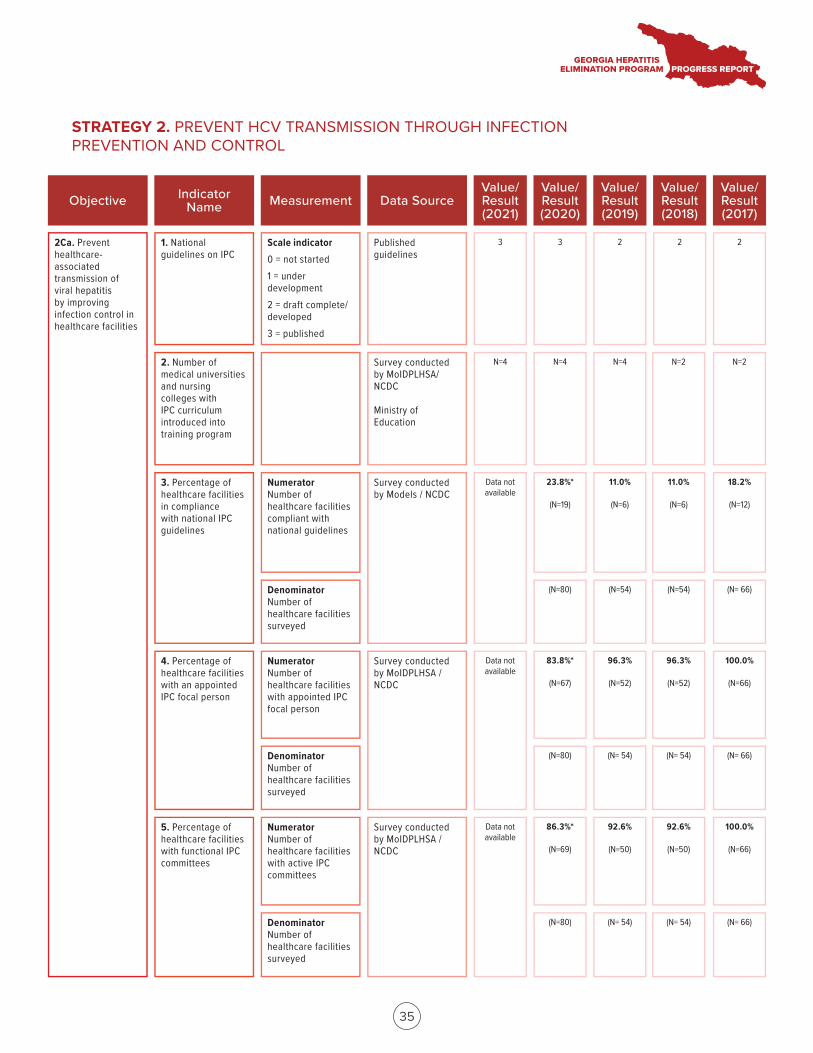
2Ca. Prevent healthcare- associated transmission of viral hepatitis by improving infection control in healthcare facilities
Objective Indicator Name Measurement Data Source
Value/ Result (2021)
Value/ Result (2020)
Value/ Result (2019)
Value/ Result (2018)
Value/ Result (2017)
1. National guidelines on IPC
Scale indicator 0 = not started1 = under development2 = draft complete/ developed3 = published
Published guidelines
3
3. Percentage of healthcare facilities in compliance with national IPC guidelines
2. Number of medical universities and nursing colleges with IPC curriculum introduced into training program
4. Percentage of healthcare facilities with an appointed IPC focal person
5. Percentage of healthcare facilities with functional IPC committees
Numerator Number of healthcare facilities with appointed IPC focal person
Denominator Number of healthcare facilities surveyed
Numerator Number of healthcare facilities with active IPC committees
Denominator Number of healthcare facilities surveyed
Survey conducted by MoIDPLHSA/ NCDC
Ministry of Education
Survey conducted by Models / NCDC
Survey conducted by MoIDPLHSA / NCDC
Survey conducted by MoIDPLHSA / NCDC
3 2 2 2
N=4 N=4 N=4 N=2 N=2
Data not available
Data not available
83.8%*
(N=67)
96.3%
(N=52)
96.3%
(N=52)
100.0%
(N=66)
(N=80) (N= 54) (N= 54) (N= 66)
86.3%*
(N=69)
92.6%
(N=50)
92.6%
(N=50)
100.0%
(N=66)
Data not available
(N=80) (N= 54) (N= 54) (N= 66)
Numerator Number of healthcare facilities compliant with national guidelines
Denominator Number of healthcare facilities surveyed
23.8%*
(N=19)
11.0%
(N=6)
11.0%
(N=6)
18.2%
(N=12)
(N=80) (N=54) (N=54) (N= 66)
35
STRATEGY 2. PREVENT HCV TRANSMISSION THROUGH INFECTION PREVENTION AND CONTROL
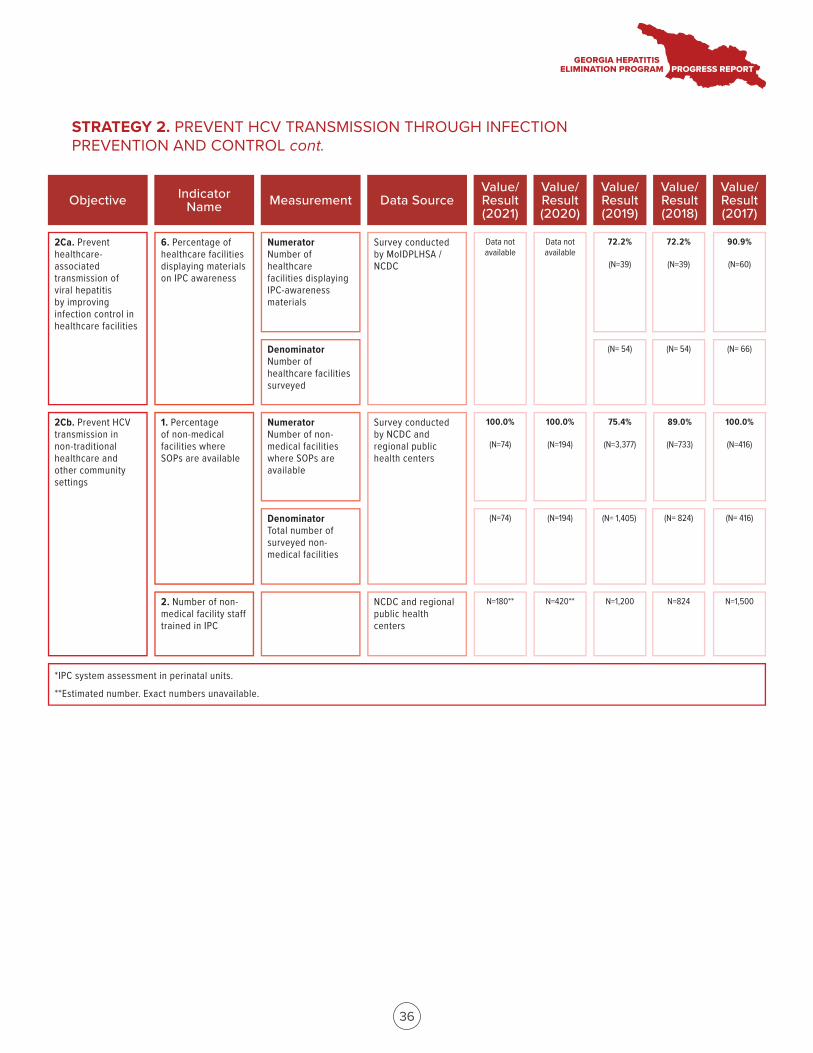
6. Percentage of healthcare facilities displaying materials on IPC awareness
Numerator Number of healthcare facilities displaying IPC-awareness materials
Denominator Number of healthcare facilities surveyed
Survey conducted by MoIDPLHSA / NCDC
72.2%
(N=39)
72.2%
(N=39)
90.9%
(N=60)
Data not available
(N= 54) (N= 54) (N= 66)
1. Percentage of non-medical facilities where SOPs are available
Numerator Number of non-medical facilities where SOPs are available
Survey conducted by NCDC and regional public health centers
100.0%
(N=74)
2. Number of non-medical facility staff trained in IPC
Denominator Total number of surveyed non-medical facilities
(N=74)
NCDC and regional public health centers
100.0%
(N=194)
(N=194)
75.4%
(N=3,377)
(N= 1,405) (N= 824) (N= 416)
89.0%
(N=733)
100.0%
(N=416)
N=180** N=420** N=1,200 N=824 N=1,500
2Cb. Prevent HCV transmission in non-traditional healthcare and other community settings
*IPC system assessment in perinatal units.
**Estimated number. Exact numbers unavailable.
Objective Indicator Name Measurement Data Source
Value/ Result (2021)
Value/ Result (2020)
Value/ Result (2019)
Value/ Result (2018)
Value/ Result (2017)
2Ca. Prevent healthcare- associated transmission of viral hepatitis by improving infection control in healthcare facilities
Data not available
36
STRATEGY 2. PREVENT HCV TRANSMISSION THROUGH INFECTION PREVENTION AND CONTROL cont.
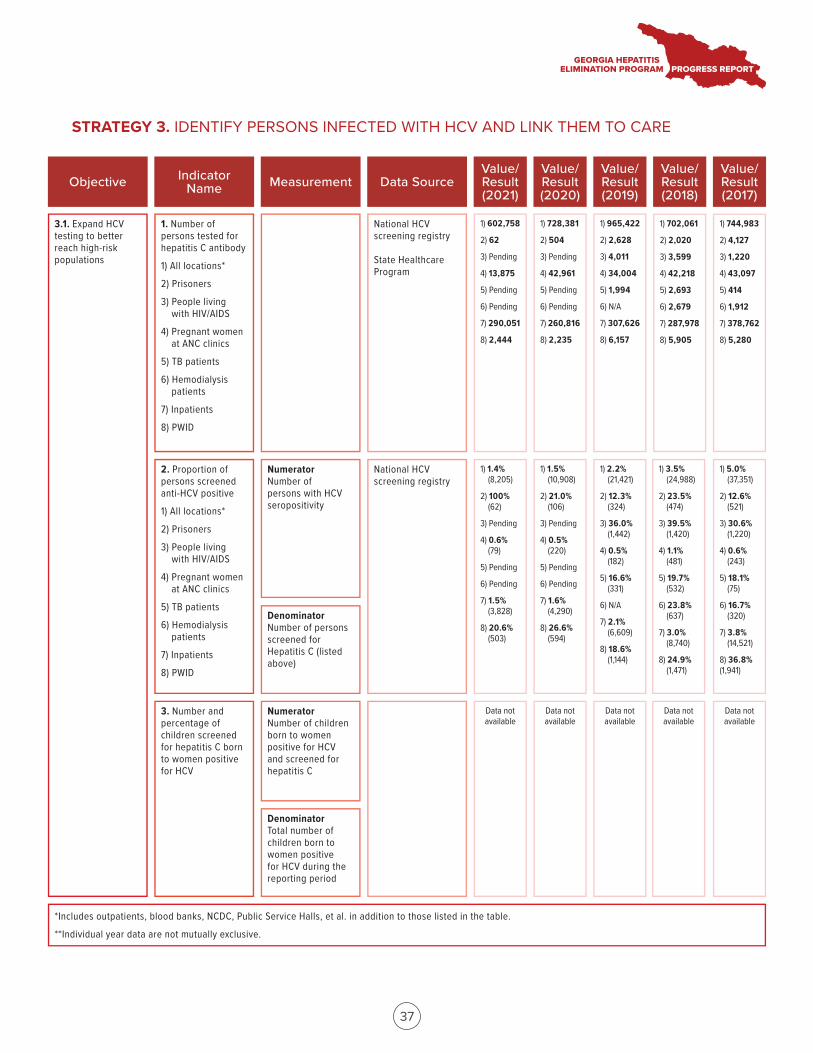
3.1. Expand HCV testing to better reach high-risk populations
Objective Indicator Name Measurement Data Source
Value/ Result (2021)
Value/ Result (2020)
Value/ Result (2019)
Value/ Result (2018)
Value/ Result (2017)
1. Number of persons tested for hepatitis C antibody
1) All locations*
2) Prisoners
3) People livingwith HIV/AIDS
4) Pregnant womenat ANC clinics
5) TB patients
6) Hemodialysispatients
7) Inpatients
8) PWID
National HCV screening registry
State Healthcare Program
1) 602,758
2) 62
3) Pending
4) 13,875
5) Pending
6) Pending
7) 290,051
8) 2,444
3. Number and percentage of children screened for hepatitis C born to women positive for HCV
2. Proportion of persons screened anti-HCV positive
1) All locations*
2) Prisoners
3) People livingwith HIV/AIDS
4) Pregnant womenat ANC clinics
5) TB patients
6) Hemodialysispatients
7) Inpatients
8) PWID
National HCV screening registry
1) 728,381
2) 504
3) Pending
4) 42,961
5) Pending
6) Pending
7) 260,816
8) 2,235
1) 965,422
2) 2,628
3) 4,011
4) 34,004
5) 1,994
6) N/A
7) 307,626
8) 6,157
1) 702,061
2) 2,020
3) 3,599
4) 42,218
5) 2,693
6) 2,679
7) 287,978
8) 5,905
1) 744,983
2) 4,127
3) 1,220
4) 43,097
5) 414
6) 1,912
7) 378,762
8) 5,280
1) 1.4%(8,205)
2) 100%(62)
3) Pending
4) 0.6%(79)
5) Pending
6) Pending
7) 1.5%(3,828)
8) 20.6%(503)
1) 1.5%(10,908)
2) 21.0%(106)
3) Pending
4) 0.5%(220)
5) Pending
6) Pending
7) 1.6%(4,290)
8) 26.6%(594)
1) 2.2%(21,421)
2) 12.3%(324)
3) 36.0%(1,442)
4) 0.5%(182)
5) 16.6%(331)
6) N/A
7) 2.1%(6,609)
8) 18.6%(1,144)
1) 3.5%(24,988)
2) 23.5%(474)
3) 39.5%(1,420)
4) 1.1% (481)
5) 19.7%(532)
6) 23.8% (637)
7) 3.0% (8,740)
8) 24.9% (1,471)
1) 5.0%(37,351)
2) 12.6% (521)
3) 30.6% (1,220)
4) 0.6%(243)
5) 18.1% (75)
6) 16.7% (320)
7) 3.8%(14,521)
8) 36.8%(1,941)
Data not available
Numerator Number of children born to women positive for HCV and screened for hepatitis C
Denominator Total number of children born to women positive for HCV during the reporting period
*Includes outpatients, blood banks, NCDC, Public Service Halls, et al. in addition to those listed in the table.
**Individual year data are not mutually exclusive.
Numerator Number of persons with HCV seropositivity
Denominator Number of persons screened for Hepatitis C (listed above)
Data not available
Data not available
Data not available
Data not available
37
STRATEGY 3. IDENTIFY PERSONS INFECTED WITH HCV AND LINK THEM TO CARE
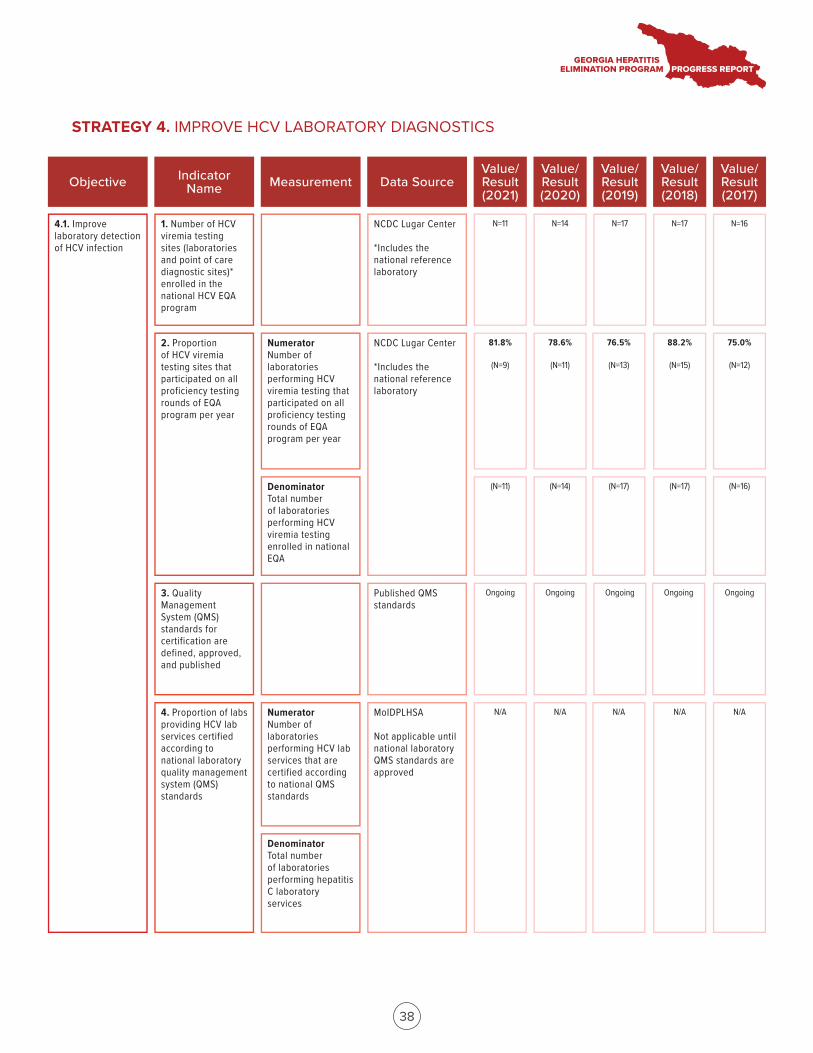
4.1. Improve laboratory detection of HCV infection
Objective Indicator Name Measurement Data Source
Value/ Result (2021)
Value/ Result (2020)
Value/ Result (2019)
Value/ Result (2018)
Value/ Result (2017)
1. Number of HCV viremia testing sites (laboratories and point of care diagnostic sites)* enrolled in the national HCV EQA program
NCDC Lugar Center
*Includes the national reference laboratory
N=11
3. Quality Management System (QMS) standards for certification are defined, approved, and published
2. Proportion of HCV viremia testing sites that participated on all proficiency testing rounds of EQA program per year
NCDC Lugar Center
*Includes the national reference laboratory
Published QMS standards
N=14 N=17 N=17 N=16
Ongoing
Numerator Number of laboratories performing HCV viremia testing that participated on all proficiency testing rounds of EQA program per year
Denominator Total number of laboratories performing HCV viremia testing enrolled in national EQA
Ongoing Ongoing Ongoing Ongoing
81.8%
(N=9)
78.6%
(N=11)
76.5%
(N=13)
88.2%
(N=15)
(N=11) (N=14) (N=17) (N=17)
75.0%
(N=12)
(N=16)
4. Proportion of labs providing HCV lab services certified according to national laboratory quality management system (QMS) standards
MoIDPLHSA
Not applicable until national laboratory QMS standards are approved
Numerator Number of laboratories performing HCV lab services that are certified according to national QMS standards
Denominator Total number of laboratories performing hepatitis C laboratory services
N/A N/A N/A N/A N/A
38
STRATEGY 4. IMPROVE HCV LABORATORY DIAGNOSTICS
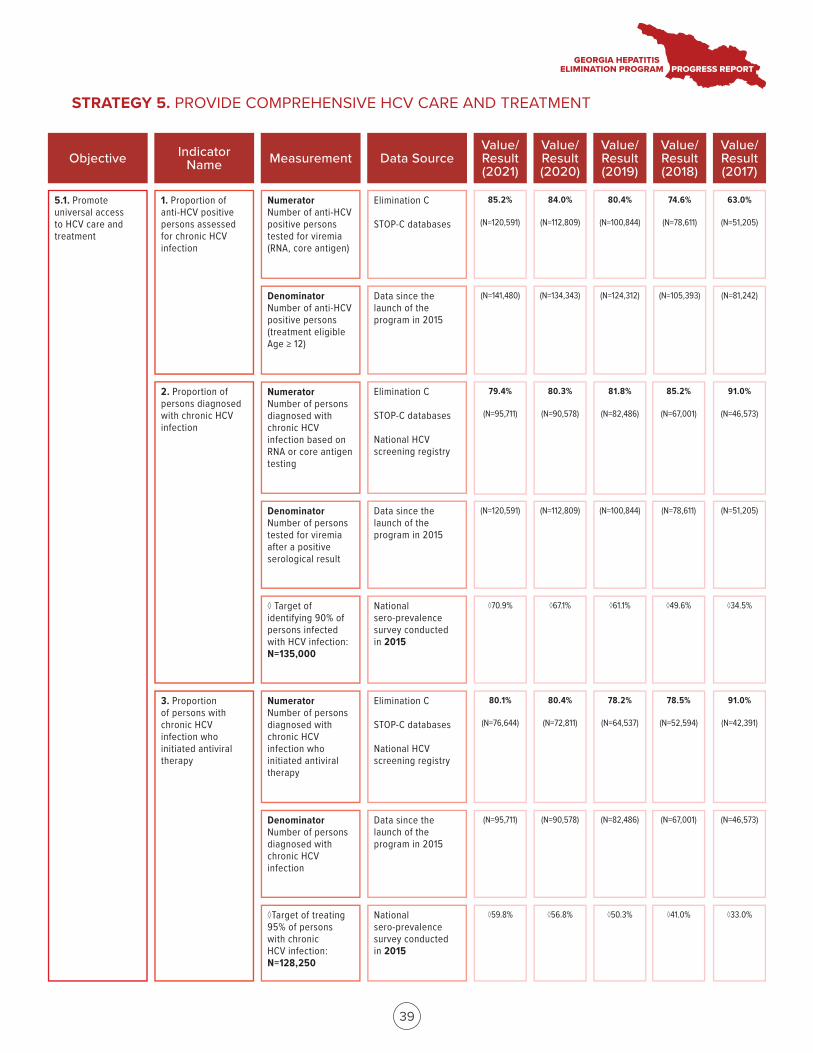
5.1. Promote universal access to HCV care and treatment
Objective Indicator Name Measurement Data Source
Value/ Result (2021)
Value/ Result (2020)
Value/ Result (2019)
Value/ Result (2018)
Value/ Result (2017)
1. Proportion of anti-HCV positive persons assessed for chronic HCV infection
Elimination C
STOP-C databases
85.2%
(N=120,591)
3. Proportion of persons with chronic HCV infection who initiated antiviral therapy
2. Proportion of persons diagnosed with chronic HCV infection
Elimination C
STOP-C databases
National HCV screening registry
84.0%
(N=112,809)
80.4%
(N=100,844)
74.6%
(N=78,611)
63.0%
(N=51,205)
79.4%
(N=95,711)
80.3%
(N=90,578)
81.8%
(N=82,486)
85.2%
(N=67,001)
91.0%
(N=46,573)
Numerator Number of persons diagnosed with chronic HCV infection who initiated antiviral therapy
Denominator Number of persons diagnosed with chronic HCV infection
Numerator Number of anti-HCV positive persons tested for viremia (RNA, core antigen)
Denominator Number of anti-HCV positive persons (treatment eligible Age ≥ 12)
Data since the launch of the program in 2015
(N=141,480) (N=134,343) (N=124,312) (N=105,393) (N=81,242)
Numerator Number of persons diagnosed with chronic HCV infection based on RNA or core antigen testing
Denominator Number of persons tested for viremia after a positive serological result
◊ Target of identifying 90% of persons infected with HCV infection: N=135,000
Data since the launch of the program in 2015
National sero-prevalence survey conducted in 2015
(N=120,591) (N=112,809) (N=100,844) (N=78,611) (N=51,205)
◊70.9% ◊67.1% ◊61.1% ◊49.6% ◊34.5%
◊Target of treating 95% of persons with chronic HCV infection: N=128,250
Elimination C
STOP-C databases
National HCV screening registry
Data since the launch of the program in 2015
National sero-prevalence survey conducted in 2015
80.1%
(N=76,644)
80.4%
(N=72,811)
78.2%
(N=64,537)
78.5%
(N=52,594)
91.0%
(N=42,391)
(N=95,711) (N=90,578) (N=82,486) (N=67,001) (N=46,573)
◊59.8% ◊56.8% ◊50.3% ◊41.0% ◊33.0%
39
STRATEGY 5. PROVIDE COMPREHENSIVE HCV CARE AND TREATMENT
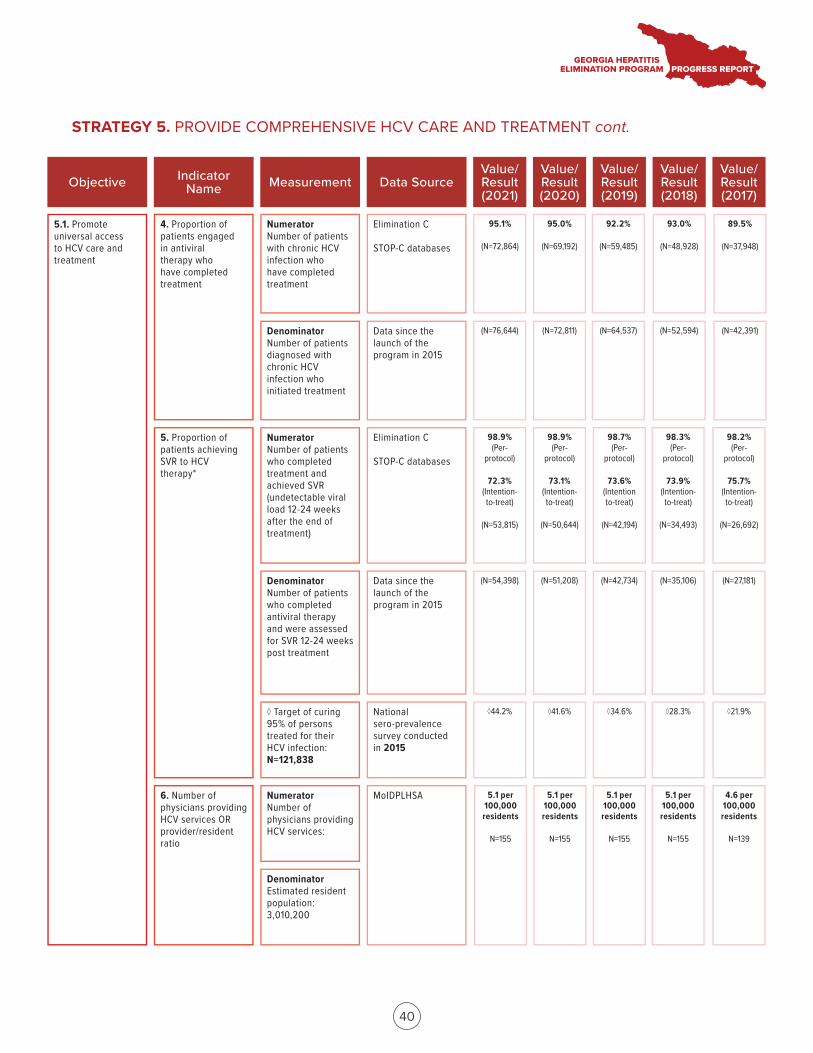
4. Proportion of patients engaged in antiviral therapy who have completed treatment
6. Number of physicians providing HCV services OR provider/resident ratio
Numerator Number of patients with chronic HCV infection who have completed treatment
Denominator Number of patients diagnosed with chronic HCV infection who initiated treatment
Numerator Number of physicians providing HCV services:
Denominator Estimated resident population: 3,010,200
Elimination C
STOP-C databases
MoIDPLHSA
95.1%
(N=72,864)
95.0%
(N=69,192)
92.2%
(N=59,485)
93.0%
(N=48,928)
(N=76,644) (N=72,811) (N=64,537) (N=52,594)
5.1 per 100,000 residents
N=155
5.1 per 100,000 residents
N=155
4.6 per 100,000 residents
N=139
Data since the launch of the program in 2015
89.5%
(N=37,948)
(N=42,391)
5. Proportion of patients achieving SVR to HCV therapy*
Numerator Number of patients who completed treatment and achieved SVR (undetectable viral load 12-24 weeks after the end of treatment)
Denominator Number of patients who completed antiviral therapy and were assessed for SVR 12-24 weeks post treatment
◊ Target of curing 95% of persons treated for their HCV infection: N=121,838
Elimination C
STOP-C databases
Data since the launch of the program in 2015
National sero-prevalence survey conducted in 2015
98.9% (Per-
protocol)
72.3% (Intention- to-treat)
(N=53,815)
98.9% (Per-
protocol)
73.1% (Intention- to-treat)
(N=50,644)
98.7% (Per-
protocol)
73.6% (Intention to-treat)
(N=42,194)
98.3% (Per-
protocol)
73.9% (Intention- to-treat)
(N=34,493)
98.2% (Per-
protocol)
75.7% (Intention- to-treat)
(N=26,692)
(N=54,398) (N=51,208) (N=42,734) (N=35,106) (N=27,181)
◊44.2% ◊41.6% ◊34.6% ◊28.3% ◊21.9%
5.1 per 100,000 residents
N=155
5.1 per 100,000 residents
N=155
Objective Indicator Name Measurement Data Source
Value/ Result (2021)
Value/ Result (2020)
Value/ Result (2019)
Value/ Result (2018)
Value/ Result (2017)
5.1. Promote universal access to HCV care and treatment
40
STRATEGY 5. PROVIDE COMPREHENSIVE HCV CARE AND TREATMENT cont.
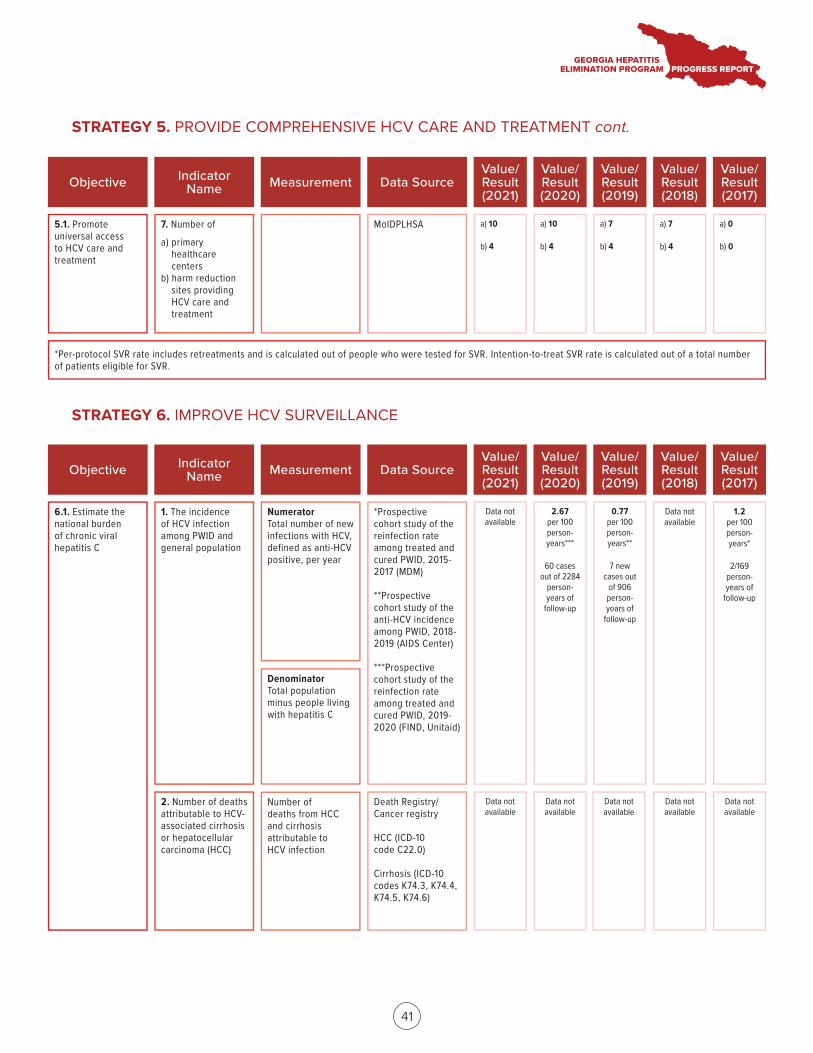
7. Number of
a) primaryhealthcare centers
b) harm reductionsites providing HCV care and treatment
MoIDPLHSA a) 10
b) 4
a) 10
b) 4
a) 7
b) 4
a) 7
b) 4
a) 0
b) 0
*Per-protocol SVR rate includes retreatments and is calculated out of people who were tested for SVR. Intention-to-treat SVR rate is calculated out of a total number of patients eligible for SVR.
Objective Indicator Name Measurement Data Source
Value/ Result (2021)
Value/ Result (2020)
Value/ Result (2019)
Value/ Result (2018)
Value/ Result (2017)
5.1. Promote universal access to HCV care and treatment
6.1. Estimate the national burden of chronic viral hepatitis C
Objective Indicator Name Measurement Data Source
Value/ Result (2021)
Value/ Result (2020)
Value/ Result (2019)
Value/ Result (2018)
Value/ Result (2017)
1. The incidence of HCV infection among PWID and general population
*Prospective cohort study of the reinfection rate among treated and cured PWID, 2015-2017 (MDM)
**Prospective cohort study of the anti-HCV incidence among PWID, 2018-2019 (AIDS Center)
***Prospective cohort study of the reinfection rate among treated and cured PWID, 2019-2020 (FIND, Unitaid)
Data not available
2. Number of deaths attributable to HCV-associated cirrhosis or hepatocellular carcinoma (HCC)
Death Registry/ Cancer registry
HCC (ICD-10 code C22.0)
Cirrhosis (ICD-10 codes K74.3, K74.4, K74.5, K74.6)
2.67 per 100 person- years***
60 cases out of 2284
person- years of
follow-up
0.77 per 100 person- years**
7 new cases out
of 906 person- years of
follow-up
Data not available
1.2 per 100 person- years*
2/169 person- years of
follow-up
Numerator Total number of new infections with HCV, defined as anti-HCV positive, per year
Denominator Total population minus people living with hepatitis C
Data not available
Data not available
Data not available
Data not available
Data not available
Number of deaths from HCC and cirrhosis attributable to HCV infection
41
STRATEGY 5. PROVIDE COMPREHENSIVE HCV CARE AND TREATMENT cont.
STRATEGY 6. IMPROVE HCV SURVEILLANCE
42
Established in August 2016, the Scientific Committee (SC) represents a diverse group of partners in the Georgia Hepatitis C Elimination Program, including policy makers, clinicians, and researchers. In 2020–2021, the SC continued program support by reviewing and approving research proposals focused on hepatitis C- and hepatitis B-related topics and supported researchers in securing funding, obtaining IRB approvals, study implementation, data analysis, and manuscript writing. The SC coordinated its activities with MoIDPLHSA, NCDC, the Program Clinical Committee, and international organizations to increase overall efficiency of the supported research programs. Additionally, the SC served as a platform for invited speakers to disseminate research findings.
Between August 2016 and December 31, 2021, the SC reviewed a total of 80 research proposals, of which 72 were approved. Of those, 12 were approved from January 2020 through December 2021. The results of the following research projects were published and/or presented during the time period covered by this Annual Report:
PREVENTION AND AWARENESS RAISING• Project title: Blood transfusion safety in Republic of Georgia: Leveraging blood centers to advance a national Hepatitis C intervention program
• Description: Data from the blood donor screening was analyzed from 2015 through 2017. The analysis demonstrated that prevalence of anti-HCV among blood donors declined from 2.3% in 2015 to 1.4% in 2017.
• Publication: Bloch EM, Kipiani E, Shadaker S, et al. Blood transfusion safety in the country of Georgia: collateral benefit from a national hepatitis C elimination program. Transfusion. 2020;60(6):1243-1252. doi:10.1111/trf.15815
• Abstract/poster: N/A
SCREENING AND LINKAGE TO CARE• Project title: HCV screening and linkage to care among inpatients in Georgia, 2016-2017
• Description: This analysis assessed the effectiveness of the first year of the screening program to identify HCV-infected persons and link them to care. Data from Georgia’s electronic Health Management Information System and ELIMINATION-C treatment database were analyzed for patients aged ≥18 years hospitalized from November 1, 2016 to October 31, 2017. Of 291,975 adult inpatients, 252,848 (86.6%) were screened. Of them, 4.9% tested anti-HCV+, and 19.8% of them were linked to care. This study demonstrated that hospital-based screening programs can identify large numbers of anti-HCV+ persons, but low linkage-to-care rates underscore the need for screening programs to be coupled with effective linkage strategies.
• Publication: Shadaker S, Nasrullah M, Gamkrelidze A, et al. Screening and linkage to care for hepatitis C among inpatients in Georgia’s national hospital screening program. Prev Med. 2020;138:106153. doi:10.1016/j.ypmed.2020.106153
• Abstract/poster: N/A
RESEARCH AND SCIENCE
43
• Project title: Integrating HCV screening and simplified treatment services in primary healthcare
• Description: To address the barriers in diagnosis and linkage to care, Georgia initiated service decentralization in 2018 by integrating hepatitis C virus (HCV) screening and treatment in primary healthcare centers (PHCs). This study reported a high rate of treatment initiation and cure rates in the primary healthcare setting and demonstrated the feasibility and effectiveness of integrating a simplified HCV diagnostic and treatment model in PHCs.
• Publication: N/A
• Abstract/poster:
1. Management of hepatitis C in primary healthcare in the country of Georgia at Digital International Liver Congress, August 2020
2. Management of hepatitis C in primary healthcare in the country of Georgia at Global Hepatitis Summit, June 2021
DIAGNOSTICS• Project title: Evaluation study of rapid diagnostic tests (RDTs) detecting antibodies against hepatitis C virus
• Description: This retrospective multi-country study assessed performance of rapid diagnostic tests (RDTs) for detection of HCV antibodies. In HIV negative samples (n = 384), the majority of RDTs had sensitivity ≥98% in 1 or both lots and most RDTs had specificity ≥99%. In HIV-positive samples (n = 264), specificity remained high, but sensitivity was markedly lower than in HIV-negative samples. The study also compared the performance of 2 RDTs on different samples and found that sensitivity was lower in whole blood versus plasma and serum for both RDTs. Sensitivity improved when considering only samples with detectable HCV viral load.
• Publication:
1. Vetter BN, Ongarello S, Tyshkovskiy A, et al. Sensitivity and specificity of rapid hepatitis C antibody assays in freshly collected whole blood, plasma and serum samples: A multicentre prospective study. PLoS One. 2020;15(12):e0243040. doi:10.1371/journal.pone.0243040
2. Vetter BN, Reipold EI, Ongarello S, et al. Sensitivity and specificity of rapid diagnostic tests for hepatitis C virus with or without HIV coinfection: a multicentre laboratory evaluation study [published online ahead of print, 2020 Jul 2]. J Infect Dis. 2020;jiaa389. doi:10.1093/infdis/jiaa389
• Abstract/poster: N/A
• Project title: Prospective evaluation of the Genedrive® HCV ID Kit in Georgia
• Description: This study evaluated the diagnostic accuracy of Genedrive HCV ID assay for the qualitative detection of HCV RNA in decentralized settings in Georgia and Cameroon using fresh plasma specimens from 426 participants. The Abbott RealTime HCV assay was used as the gold standard. Genedrive HCV ID assay was conducted by different users. Users also completed questionnaires to assess the usability of Genedrive. At different detection thresholds, Genedrive showed very high sensitivity (96%-100%) and specificity (99%-100%). All genotypes detected using the gold-standard assay were also detected with Genedrive. The study demonstrated that Genedrive is a simple and accurate test to confirm chronic HCV infection in decentralized, real-life, resource-limited settings.
44
• Publication: Lamoury FMJ, Njouom R, Amougou-Atsama M, et al. Diagnostic Performance and Usability of the Genedrive® HCV ID Kit in Two Decentralized Settings in Cameroon and Georgia. Diagnostics (Basel). 2021;11(5):746. doi:10.3390/diagnostics11050746
• Abstract/poster: N/A
CARE AND TREATMENT• Project title: Effectiveness of ledipasvir/sofosbuvir based regimens in patients with hepatitis C virus genotype 1, 2, 3 and 4 infection and factors associated with treatment outcomes within Georgian national hepatitis C elimination program
• Description: This study reported outcomes of Sofosbuvir (SOF)-based treatment regimens in patients with chronic HCV infection in Georgia. Of the 7,342 patients who initiated treatment with SOF-based regimens, 5,079 patients were tested for SVR. Total SVR rate was 82.1% in per-protocol analysis, which included only those with complete SVR data, and 74.5% in modified intention-to-treat analysis, which additionally included persons discontinuing treatment. The study provided clear evidence that SOF plus IFN and RBV for 12 weeks can be considered a treatment option for eligible patients with all three HCV genotypes.
• Publication: Tsertsvadze, T., Gamkrelidze, A., Nasrullah, M. et al. Treatment outcomes of patients with chronic hepatitis C receiving sofosbuvir-based combination therapy within national hepatitis C elimination program in the country of Georgia. BMC Infect Dis 20, 30 (2020). https://doi.org/10.1186/s12879-019-4741-5
• Abstract/poster: N/A
• Project title: High sustained viral response among HCV genotype 3 patients with advanced liver fibrosis: Real-world data of HCV elimination program in Georgia
• Description: This study assessed treatment outcome data from patients with HCV GEN3 and advanced liver fibrosis using sofosbuvir-based regimens. In total, 1,525 genotype 3 patients were eligible for analysis and all (100%) had advanced liver disease. Of those who received sofosbuvir/ribavirin (SOF/RBV) for 24 weeks, 79.3% achieved SVR, while 96.5% who received sofosbuvir/pegylated interferon/ribavirin (SOF/PEG/RBV) for 12 weeks achieved SVR (p < 0.01). Among patients with liver cirrhosis (defined as F4) overall cure rate was 85.7% as opposed to 96.4% for those with F3. While patients with HCV genotype 3 achieved a high level of overall cure rate with SOF/RBV, the inclusion of PEG led to a higher cure rate with a shorter duration of treatment.
• Publication: Butsashvili M, Gvinjilia L, Kamkamidze G, et al. High sustained viral response among HCV genotype 3 patients with advanced liver fibrosis: Real-world data of HCV elimination program in Georgia. BMC Res Notes. 2020;13(1):332. doi:10.1186/s13104-020-05173-4
• Abstract/poster: N/A
45
• Project title: Implementing HCV treatment in harm reduction centers in Georgia
• Description: As part of this study, 358 patients were surveyed; 48.6% received HCV treatment at specialized clinics and 51.4% at HR sites with integrated treatment. Similar proportions of surveyed patients at HR sites and clinics stated that they did not face any barriers to enrollment in the elimination program and were confident that confidentiality was completely protected during treatment. Time to treatment initiation differed significantly, with 42.9% of patients at integrated treatment sites vs 4.6% at specialized clinics receiving the first dose of medication within two weeks. The study findings suggest that integration of HCV treatment with HR services is feasible and shortens time to treatment initiation.
• Publication: Butsashvili M, Kamkamidze G, Kajaia M, et al. Integration of hepatitis C treatment at harm reduction centers in Georgia-Findings from a patient satisfaction survey. Int J Drug Policy. 2020;84:102893. doi:10.1016/j.drugpo.2020.102893
• Abstract/poster: N/A
• Project title: Retreatment for HCV: A retrospective analysis of pooled national program data across several countries
• Description: Recommended second-line treatment is limited for patients who fail initial hepatitis C virus (HCV) therapy in low- and middle-income countries. Alternative regimens and associated outcomes are not well understood. As part of this study, a pooled analysis of national program data in Egypt, Georgia, and Myanmar was conducted. The analysis observed SVR rates >90% for alternative retreatment regimens, typically based on sofosbuvir in combination with the NS5A inhibitors, such as ledipasvir.
• Publication: Boeke CE, Hiebert L, Waked I, et al. Retreatment of Chronic Hepatitis C Infection: Real-World Regimens and Outcomes from National Treatment Programs in Three Low- and Middle-Income Countries. Clin Infect Dis. 2021;ciab461. doi:10.1093/cid/ciab461
• Abstract/poster: Retreatment for HCV: Preliminary results from a Retrospective Analysis of Pooled National Program Data across Several Countries, presented at 2020 Annual Meeting of the American Association for the Study of Liver Diseases, November 13-16, 2020
• Project title: The Hepatitis C Elimination through Access to Diagnostics (HEAD-Start) project: Feasibility, acceptability, effectiveness, and cost-effectiveness of a decentralized and a centralized model of HCV viremia testing for confirmation and cure versus standard of care among harm reduction site attendees in Georgia
• Description: This cluster, non-randomized intervention study assessed two novel models of viremic testing in harm reduction settings. The proportion of participants who completed each step in the HCV care cascade were compared across the three arms: 1) viremia testing (GeneXpert) on-site; 2) blood draw on site, confirmatory testing (cAg) at a centralized laboratory; 3) standard of care - patients referred for testing at the treatment centre. Confirmatory testing or blood draw on-site at HRS showed improved retention of patients in the care cascade compared to a referral of patients for blood collection. Moreover, the turnaround time to diagnosis was shortest when confirmatory testing was performed on site. Time to treatment initiation did not differ substantially.
46
• Publication: N/A
• Abstract/poster: The head-start project Georgia: a three-armed, cluster, non-randomised trial of the effectiveness of two novel models of HCV confirmatory testing in harm reduction sites (HRS) in Georgia at the Digital International Liver Congress, August 2020
• Project title: Progress of the Georgia Hepatitis C Elimination Program
• Description: This project tracks the progress towards elimination targets and reports the hepatitis C care cascade results. Ongoing analyses repeatedly demonstrates that Georgia has made substantial progress towards eliminating hepatitis C. Very high cure rates have been achieved among those who received SVR testing. Challenges remain in identifying and especially linking to care persons living with HCV in Georgia.
• Publication: N/A
• Abstract/poster:
1. Progress towards achieving hepatitis C elimination in the country of Georgia, April 2015-October 2019 at the Digital International Liver Congress, August 2020 (oral presentation)
2. Progress towards achieving hepatitis C elimination in the country of Georgia, April 2015-December 2020 at the International Liver Congress, June 23-26, 2021
SURVEILLANCE• Project title: Evidence synthesis for real-time and retrospective evaluation of the HCV elimination program in Georgia
• Description: This study evaluated the cost-effectiveness of the screening and treatment undertaken in the HCV elimination program from 2015 to November 2017 compared to no treatment. Using the adapted HCV transmission and progression model calibrated to Georgian data, this study found that the first phase of the HCV elimination program was highly cost-effective in Georgia: 0.78 QALYs were gained per patient treated due to reduced disease progression, and the intervention prevented 2,673 HCV- related deaths and averted 16,225 new infections by 2030 compared to no treatment.
• Publication: N/A
• Abstract/poster: Economic evaluation of the hepatitis C virus screening and treatment program in Georgia at Digital International Liver Congress, August 2020
• Project title: Impact on mortality of hepatitis C virus (HCV) treatment with direct acting anti-viral (DAA) medications, Georgia, 2015-2018
• Description: This study linked data from hepatitis C screening registry, the national hepatitis C treatment database and national vital statistics using the 11-digit national personal identifier. The results demonstrated that persons with HCV infection who are cured with DAAs have an increased likelihood of survival, similar to persons never infected, compared to HCV-infected persons who did not receive treatment.
• Publication: N/A
• Abstract/poster: The impact on mortality of a national hepatitis C elimination program, Georgia, 2015-2019 at Digital International Liver Congress, August 2020
47
• Project title: Evaluation of alcohol use behavior among patients cured through HCV elimination program in Georgia
• Description: This study evaluated alcohol consumption behaviors among patients in the HCV program using an interviewer-administered questionnaire in three cities of Georgia. As of December 2020, 256 patients were enrolled in the study; the majority of them (93.7%) reported ever using alcohol in their lifetime, 10.3% considered themselves heavy drinkers, and 97.5% abstained from alcohol during treatment. In a bivariate analysis, patients who abstained from alcohol after achieving SVR were 4 times more likely to have improvement in liver fibrosis compared to those who resumed drinking. The findings present an opportunity to focus messaging and education for patients during DAA treatment to improve outcomes even after completion of treatment.
• Publication: N/A
• Abstract/poster: Evaluation of alcohol use behavior among patients cured in Georgia’s HCV elimination program (preliminary results) at Global Hepatitis Summit, June 2021
• Project title: Long-term health outcome among HCV patients with advanced liver fibrosis treated through HCV Elimination Program in Georgia
• Description: A total of 600 patients were included in this cohort study, which demonstrated that among patients with liver fibrosis, treatment with DAAs affords significant improvement in nearly all diagnostic markers and can lead to resolution of clinical symptoms of decompensated liver failure.
• Publication: N/A
• Abstract/poster: Improvement in liver fibrosis among patients with hepatitis C who achieved sustained virologic response after direct-acting antivirals treatment in Georgia (preliminary results) at the Global Hepatitis Summit, June 2021
• Project title: Epidemiology of tuberculosis and hepatitis C co-infection in the Country of Georgia
• Description: This study assessed the effects of HCV infection on the rate of active TB disease in a cohort of 1,778,382 adults. Active TB incidence was compared in three groups: 1) HCV antibody-negative (reference group), 2) completed HCV treatment (treated), 3) untreated HCV infection. TB was diagnosed in 2,923 (0.16%) participants. The TB incidence rate was more than 4 times higher among persons with untreated HCV infection, and 1.7 times higher among those with treated HCV compared to those without HCV infection, suggesting that integrating TB-related interventions in the hepatitis C program might be beneficial.
• Publication: N/A
• Abstract/poster: Association of treated and untreated chronic hepatitis C with the incidence of active tuberculosis: a population-based cohort study in the country of Georgia at the American Association for the Study of Liver Diseases, November 12-15, 2021
48
• Project title: Identification and characterization of HCV-attributable hepatocellular carcinoma among persons with hepatobiliary cancer diagnoses in Georgia: 2015-2019
• Description: Assessing the HCV-attributable burden of hepatocellular carcinoma (HCC) is needed to measure the impact of the elimination program and progress toward viral hepatitis elimination. This study linked the data from Georgian Cancer Registry to the Georgia Hepatitis C Elimination Program databases and found that approximately half of those with primary liver cancer (PLC) and screening data available had chronic HCV infection. This suggests that HCV contributes substantially to PLC burden in Georgia. Continuing to monitor these trends is critical to demonstrating progress towards elimination, and provides a global model for integrated surveillance of sequelae from viral hepatitis.
• Publication: N/A
• Abstract/poster: HCV-attributable liver cancer in the country of Georgia: Analysis of cases from the Georgian Cancer Registry 2015-2019 at the International Viral Hepatitis Elimination Meeting, December 2021
Other publications/abstracts/posters not related to the SC approved projects• Title: HCV care cascade of PWID enrolled in methadone substitution treatment program in Georgia
• Description: This study examined and identified factors that affect HCV treatment uptake among PWID who received methadone substitution therapy in Georgia. HCV care cascade analysis used data from the hepatitis C program treatment registry and the MST treatment database between January 1, 2015, and December 31, 2018. The study demonstrated high rates of HCV treatment uptake and cure among MST patients with HCV infection (75.8% and 96.1%, respectively), suggesting that the MST patients could be the first microelimination target population.
• Publication: Stvilia K, Vephkvadze N, Gamkrelidze A, et al. Hepatitis C treatment uptake among patients who have received methadone substitution treatment in the Republic of Georgia. Public Health. 2021;195:42-50. doi:10.1016/j.puhe.2021.03.017
• Abstract/Poster: HCV care cascade of PWID enrolled in methadone substitution treatment program in Georgia—Is this the first group of population in which hepatitis C will be eliminated in Georgia? at the Digital International Liver Congress, August 2020
• Title: Hepatitis C core antigen test as an alternative for diagnosing HCV infection: Mathematical model and cost-effectiveness analysis
• Description: This study investigated the cost effectiveness of testing strategies using antigen instead of PCR testing using a mathematical model. The results demonstrated that antigen testing, either following a positive antibody test or alone, performed almost as well as the current practice of HCV testing. The cost effectiveness of these strategies depends on the inclusion of treatment costs.
• Publication: Sadeghimehr M, Bertisch B, Negro F, et al. Hepatitis C core antigen test as an alternative for diagnosing HCV infection: Mathematical model and cost-effectiveness analysis. PeerJ. 2021;9:e11895. Published 2021 Sep 10. doi:10.7717/peerj.11895
• Abstract/poster: N/A
49
• Title: Innovative linkage model to re-engage lost-to-follow-up individuals in the national hepatitis C elimination program of Georgia
• Description: This pilot project promoted linkage to care for individuals who screened positive for HCV antibody (anti-HCV) but did not receive a viremia test. Anti-HCV-positive individuals lost to follow up residing in the 5 largest regions in Georgia were randomly selected and counselled via phone or home visit. A total of 3,859 individuals were reached, of which 77% presented for viremia testing. The project also demonstrated that individuals considered lost-to-follow-up can be re-engaged in HCV care.
• Publication: N/A
• Abstract/poster: Innovative linkage model to re-engage lost-to-follow-up individuals in the national hepatitis C elimination program of Georgia at the International Liver Congress, June 23-26, 2021
Other projects ongoing or with pending publication, abstract, or posterPREVENTION AND AWARENESS RAISING
• Title: Identifying risk factors of HCV transmission in Georgia – a case-control study
• Objective: 1) To evaluate risk factors of HCV transmission 2) to elaborate recommendations for HCV prevention based on study findings
• Description: The project will build on a recently completed project that interviewed 214 people who demonstrated seroconversion for HCV to assess risk factors for recent infection. The initial study provided descriptive data on risk factors. This study will include controls to allow for statistical comparison to best understand the risk of factors associated with recent infection.
• Title: Study of risk factors of HCV reinfection among PWID enrolled in HCV elimination program in Georgia
• Objective: To evaluate risk factors of HCV re-infection among PWID treated though HCV elimination program achieving SVR.
• Description: This study will enroll 60 PWID who were found to be reinfected with HCV as part of a previous study conducted by FIND. All 60 will be invited to be enrolled in the study as cases, and ratio of cases and controls will be 1:3, with an overall sample size of 240.
• Title: Evaluation of knowledge, attitudes, and practices for HBV infection among primary healthcare doctors
• Objective: Evaluate knowledge, attitudes, and practices about HBV infection among primary healthcare doctors (PHDs).
• Description: The study will survey 500 randomly selected PHDs on their knowledge, attitudes, and practices about HBV. The findings will inform training programs and expanded testing and treatment for HBV.
50
SCREENING AND LINKAGE TO CARE• Title: Late presentation for hepatitis C care in Georgia, 2016-2021
• Objective: To assess trends in late presentation for HCV care in Georgia during 2016-2021
• Description: This study will include all adults (age ≥18 years) enrolled in the elimination program during 2016-2021 in the analysis to quantify the proportion of late presenters with advanced liver disease and to identify factors associated with late presentation
• Title: Eliminating HCV infection in prison settings in Georgia
• Objectives: 1) To evaluate engagement in the HCV care continuum, identify gaps in HCV cascade/ service delivery and associated factors, 2) to evaluate linkage of released prisoners to HCV care providers, 3) to develop recommendations on achieving elimination of hepatitis C in prison settings
• Description: This analysis will include all adult (age ≥18 years) individuals known to be living with chronic HCV infection while incarcerated in prisons of Georgia. The analysis will quantify HCV care cascade among prisoners, assess factors associated with engagement in the continuum, and evaluate treatment outcomes.
• Title: Assessment of HCV screening and linkage to care modalities within the national Georgia Hepatitis C Elimination Program and designing the most optimal models for reaching the elimination targets
• Objectives: 1) To evaluate effectiveness of various modalities in terms of diagnostic yield and engagement in HCV care (including linkage to care and treatment initiation), 2) to define the most optimal screening and linkage modalities
• Description: This project will quantify screening and care cascade and conduct economic/value for money analysis for the following HCV screening models: 1) Hospital sector screening model (centralized model), 2) Hospital sector screening model (decentralized model), 3) Primary healthcare screening model, 4) HCV provider site screening model; 5) Other outpatient/outreach screening models.
• Title: Learning lessons from Georgia using economic modelling to determine optimum screening and linkage-to-treatment strategies for achieving high treatment coverage in Eastern Europe and Central Asia
• Objective: Use economic modelling to determine the most cost-effective strategies for improving screening and linkage to treatment for achieving HCV elimination in Georgia and elsewhere in Eastern Europe and Central Asia.
• Description: This study will estimate the cost, impact and cost-effectiveness (cost/QALY saved or DALY averted) of different interventions being used in Georgia to improve screening, confirmatory testing and treatment uptake. It will also model the impact and cost of different intervention combinations.
51
• Title: Assessing the inclusion and participation of collective center internally displaced persons (IDPs) in the State HCV Elimination Program
• Objectives: 1) Assessing the burden of disease for HIV, hepatitis B, and hepatitis C among internally displaced persons living in collective centers, 2) understanding the extent to which the elimination program and its subsequent interventions have penetrated into these communities and with what efficacy.
• Description: This study will generate information about the HIV and viral hepatitis-related health status of IDPs in collective centers. Nearly half of IDPs in Georgia reside in such centers or compact settlements where their quality of life and experience differs significantly from the general population and from IDPs who live in private accommodations. Therefore, it is important to carefully examine the health status of this population, especially in terms of infectious diseases such as HIV and viral hepatitis.
• Title: A controlled, observed trial of Hepatitis C self-testing in the hands of untrained users
• Objective: To document if a lay person, unassisted by a healthcare worker, is able to perform a Hepatitis C Virus (HCV) test on themselves using the HCV Self-Test
• Description: This multicountry controlled study (Georgia, South Africa, Spain) will evaluate the process and performance of 2 types of rapid hepatitis C self-tests (from fingerstick blood and from oral fluids) by untrained users. Self-test results will be confirmed by testing with the same test but performed by a professional user (healthcare worker). The level of agreement between the results of the investigated test obtained by a participant and those obtained by a healthcare worker will be calculated.
• Title: Enhanced linkage to care for patients lost to follow up in hepatitis C elimination program
• Objective: To link to care those individuals that have previously tested positive for HCV antibody but have not received viremia testing
• Description: This project aims to contact 20,000 anti-HCV positive persons lost to follow-up, conduct HCV viremia testing on at least 70% (14,000) of them, and enroll 50% of the HCV RNA positive persons in the treatment program.
• Title: Uptake of HCV self-testing (HCVST) among the general population in Georgia
• Objective: To evaluate uptake, linkage to care, and operational considerations of different HCVST delivery models among men aged 30-59 years in Tbilisi Georgia.
• Description: The study will examine two models of HCV self-test distribution: secondary distribution via female attendees at cancer screening centers in Tbilisi and pharmacy-based distribution of HCVST among male clients. It will also examine the linkage to care of persons who report positive tests using HCVST and evaluate costs associated with each HCVST model.
52
DIAGNOSTICS • Title: Advancing blood transfusion safety using molecular detection in the country of Georgia
• Objectives: To evaluate the feasibility and incremental benefit of implementing NAT testing in the country of Georgia by assessing yield in seronegative samples
• Description: Multiplex NAT screening for HIV, HCV, and hepatitis B virus (HBV) was launched in January 2020. An analysis was conducted of serological and NAT donor/donation screening data for the first year of screening (through December 2020), with a total of 54,116 donations representing 39,164 unique donors evaluated. This program-wide implementation of NAT in Georgia demonstrates the feasibility and clinical utility of employing NAT systematically across a nationwide blood program.
• Title: Implementing viral marker testing for blood products in Georgia
• Objective: The main aim of the study is to understand the deficiencies in the standard methods used in Georgian blood banks to test blood donation samples for HBV, HCV, HIV, and T. pallidum, and use the findings to inform public policy on the best testing algorithm and system-wide testing of blood donations to reduce TTIs in Georgia.
• Description: This study performs a comparative assessment of different assays, primarily between new ultrasensitive Abbott assays, and current assays being used by individual blood banks and through centralized NAT testing. Sample testing ran from March through June 2021. All samples received by all blood banks countrywide from March through June 2021 were included in the study and tested using the Abbott ultrasensitive assays. The samples included were all those positive for either serology or NAT and a randomly selected subset of negative samples. In total, 8,400 samples were analyzed.
• Title: Analysis of HCV RNA levels of viral rebound among patients who have completed treatment for HCV to inform the limit of detection necessary to confirm SVR
• Objectives: To analyze HCV RNA levels of viral rebound among patients who have completed treatment for HCV to inform the limit of detection necessary to confirm SVR
• Description: This study will test factors associated with an HCV RNA in the lowest 3%, calculate summary statistics for covariates of interest and test associations between these covariates and the odds of having HCV RNA < the 97% threshold value.
• Title: Strengthening HCV outbreak detection capacity within harm reduction settings in Georgia by utilizing GHOST technology
• Objectives: 1) To analyze and visualize transmission patterns of HCV infection among PWID who test positive for HCV at selected HR sites located in Tbilisi (n=1) and Zugdidi (n=1), 2) To use GHOST technology to identify PWID at highest risk of transmitting HCV (high-centrality nodes with multiple molecular connections or high intra-host HCV variability or HIV coinfected) within an injection drug use network.
• Description: This study uses GHOST technology to examine the HCV transmission pattern on 100 PWID who test positive on HCV viremia testing. PWID will be enrolled in the study sites in two cities assessing networks using GHOST technology.
53
CARE AND TREATMENT• Title: Prioritization of DAA treatment in HCV infected individuals across Europe – CARE Consortium EU project application under H2020
• Objective: To develop recommendations on how to rationally prioritize DAA therapy among people infected with HCV in settings with high case load and limited health budgets
• Description: This study is a part of CARE (Common Action against HIV, TB, and HCV across the Regions of Europe) consortium aiming to analyze and combat the HIV, TB, and HCV epidemics across Europe and Russia. The analysis will use the existing cohorts of co-infected patients from Georgia, Italy, Sweden and EuroSIDA.
• Title: Comparing engagement in HCV care and treatment outcomes between persons who are HIV negative and persons who are HIV positive within the national hepatitis C elimination program
• Objectives: 1) To evaluate engagement in HCV care continuum by HIV status within the Georgia Hepatitis C Elimination Program, 2) to compare SVR rates among HIV negative and HIV positive persons treated within the Georgia Hepatitis C Elimination Program
• Description: This analysis will include all adult (age ≥18 years) persons enrolled in the elimination program and will quantify and compare engagement in HCV care cascade within the Georgia Hepatitis C Elimination Program by HIV status.
SURVEILLANCE• Title: Establishing Georgian PWID cohort study to estimate incidence of HCV infection
• Objective: To obtain new knowledge about the epidemiology of HCV infection as well as HCV care and treatment among PWID and to move this knowledge into effective control measures towards achieving goals of the national hepatitis C elimination strategy
• Description: This study enrolled 1744 PWID to estimate the prevalence and incidence of HCV infection in this population. Of them, 563 were found to be anti-HCV positive. The remaining study participants were followed for a median of 11 months, and anti-HCV seroconversion was documented in 7 of them.
• Title: Surveillance and risk of transmission of HCV and HBV in renal dialysis, Georgia
• Objectives: 1) To describe the infection control practices in dialysis units in Georgia (in general and specific to hepatitis B and hepatitis C virus), 2) to determine the prevalence of HBV and HCV among those receiving dialysis, 3) to determine the seroconversion rate in dialysis units/clinics
• Description: This project collected information from dialysis clinics about type of services at the unit, number of patients served, availability of infection control service at the unit, HCV and HBV testing and laboratory methods, prevalence and seroconversion of HBV and HCV among dialysis patients, and treatment coverage of HBV and HCV patients. A total of 23 facilities throughout country participated.
54
• Title: Evaluation of HCV transmission through endoscopy procedures
• Objectives: 1) To evaluate the adherence to standard safety measures during diagnostic endoscopic procedures in Georgian hospitals and outpatient clinics, 2) to train staff serving at endoscopic units on safety precautions for the prevention of healthcare associated infections, 3) to estimate HCV incidence among patients undergoing gastroscopy, colonoscopy, and bronchoscopy.
• Description: As part of this study, IPC assessment questionnaires were administered to 4 endoscopic units (3 in Tbilisi and 1 in Kutaisi) to assess infection control practices in the facility. 500 patients were enrolled from each hospital for a total of 2,000 patients; all were screened for anti-HCV at time zero and will be followed-up at 6 months. Patient-level HCV risk-factors data will be collected using a standardized data collection instrument.
• Title: Rates and risk factors for HCV reinfection within the national hepatitis C elimination program: Implications for program success
• Objectives: 1) To determine rate of HCV reinfection among persons successfully treated within the Georgia Hepatitis C Elimination Program, 2) to identify risk factors associated with HCV reinfection
• Description: This analysis will be limited to persons who achieved SVR within the elimination program. The study team will conduct probability sampling stratified by geographic location and age group. Selected subjects will be enrolled to obtain plasma specimens and administer survey questionnaire. Among those positive for HCV RNA, the study will use HCV genotype data to determine whether this is reinfection or late relapse.
• Title: Epidemiology of HBV infection among HCV patients treated with DAAs
• Objective: To evaluate epidemiology of HBV infection among HCV infected patients treated within elimination program in Georgia
• Description: This study evaluates the rate of HCV/HBV co-infection (presence of HBsAg among patients with positive HCV RNA), the rate of HBV exposure among HCV-infected patients (presence of anti-HBc among patients with positive HCV RNA), and the HCV cure rate among HBV-infected patients. It also examines the role of HBV/HCV co-infection on liver fibrosis level and factors associated with HBsAg clearance among HCV-infected patients.
• Title: A population-based serosurvey of prevalence and risk factors for SARS-CoV-2, Hepatitis C and Hepatitis B virus infection in Georgia, 2021
• Objective: To estimate prevalence of serological evidence of past or present HCV and HBV infection and prevalence of chronic HCV and HBV infection among adults and children aged >5 years
• Description: This study provided updated prevalence estimates and risk factors for HCV and HBV infection in Georgia, geographic distribution, and other behavioral risk factors (e.g., alcohol consumption) associated with infection. It also characterized circulating genotypes of HCV and HBV in different population sub-groups and provided updated information on current knowledge and perceptions towards viral hepatitis. (full summary on page 7).
55
• Title: MTCT for children born to mothers with chronic HCV infection
• Objective: Develop and establish a sustainable surveillance system on children born to women with chronic HCV infection
• Description: This study aims to identify, follow-up, and link to HCV care all eligible (at or after 18 months of age) children born to women with chronic HCV infection, and to assess HCV burden and obstacles to linkage-to-care among the women of reproductive age. By linking the data from the Georgian birth registry and the HCV treatment registry, the study conducted 185 interviews among anti-HCV positive mothers.
• Title: Viral hepatitis B and C surveillance capacity building (study of HCV seroconversions; acute HCV and HBV sentinel surveillance project)
• Objective: To enhance viral hepatitis surveillance through policy development and surveillance capacity building in the country
• Description: This project involves utilizing existing HCV screening systems to 1) identify serconversions and conducting investigations, 2) establishing enhanced surveillance activities among young persons (<18 years old) who screen positive, 3) enhancing/expanding current sentinel surveillance pilot at infectious diseases hospitals by utilizing standard case detection and laboratory testing.
56
5TH HEPATITIS TECHNICAL ADVISORY GROUP (TAG) RECOMMENDATIONS FOR THE GEORGIA HEPATITIS C ELIMINATION PROGRAMOn November 19-20, 2019, the Georgian Ministry of Internally Displaced Persons from the Occupied Territories, Labour, Health and Social Affairs (MoIDPLHSA), together with experts from the U.S. Centers for Disease Control and Prevention’s (CDC) Division of Viral Hepatitis (DVH), the World Health Organization (WHO), and other international partners, convened Georgia’s fifth external Hepatitis C Technical Advisory Group (TAG) meeting. A total of twelve experts in the field of viral hepatitis prevention and control served as TAG members. The two-day meeting was opened with remarks from the First Deputy Minister of MoIDPLHSA, the US Embassy Charge d’Affaires, the Director of CDC’s DVH, a representative from Gilead Sciences, and the Head of the WHO Georgia office. The program began with introduction of the TAG members and review of last year’s recommendations followed by an overview of the progress of the HCV Elimination Program since its launch in April 2015, including the activities on decentralization and integration of HCV services in primary healthcare centers, hospitals and harm reduction settings in Georgia. The TAG then explored progress of the HCV elimination program on topics including: promote advocacy, awareness, education, and partnerships for HCV-associated resource mobilization; prevent HCV transmission: harm reduction, blood safety, and infection control; identify and link to care persons infected with HCV; improve HCV laboratory diagnostics; provide HCV care and treatment; and improve HCV surveillance. Sessions to explore these topics included presentations from Georgian public health officials and clinicians. For each session, two TAG members moderated, and specific discussants were invited on stage to lead the discussion and answer questions. On the final day, following a time for deliberation, the TAG presented draft recommendations for review and comment.
First and foremost, the TAG would like to congratulate Georgia on the remarkable progress in all aspects of the Hepatitis C Elimination Program since the last TAG meeting. The TAG appreciates the sustained commitment of the Georgian government to improve the Program, the commitment of Georgian staff and clinical partners working on the Program, and the efforts to implement or revise activities in response to the recommendations of the 2018 TAG. The TAG also appreciates the open and transparent presentation of data. The quality of evaluation data and the discussions of Program strengths and challenges facilitated the work of the TAG. Based on the presented information and discussions, the TAG developed the following recommendations to resolve key challenges for the Program and assist the country of Georgia in successful achievement of country goals for HCV elimination.
TECHNICAL ADVISORY GROUP RECOMMENDATIONS
57
THE TAG MEMBERS INCLUDED
OVERARCHING CONSIDERATIONS• Recommend developing an updated 2021–2025 National Strategic Plan for the Elimination of Hepatitis C Virus in Georgia
о Should be integrated into Georgia’s Universal Health Care response
о Consider including HBV
SECTION 1. PROMOTE ADVOCACY, AWARENESS, EDUCATION, AND PARTNERSHIPS FOR HCV-ASSOCIATED RESOURCE MOBILIZATION
• Prioritize increased engagement of HCV cured patients to assist with increasing broader community awareness about hepatitis C and hepatitis C cure:
о Create paid opportunities for individuals with lived hepatitis experience to participate in the elimination program (e.g. patient navigators, media campaigns)
• Involve peers in all aspects of HCV elimination, including those cured of HCV, key populations such as people who inject drugs (PWID), and from both liver patient associations and related associations, such as haemophilia
• Continue to explore ways to minimize the impact of the criminal justice system on harm reduction efforts:
о Modify laws regarding the carrying of injecting paraphernalia for drug users and syringe service providers, including safe disposal of syringes
• Continue dialogue with other stakeholders (Ministry of Justice, Police, Government) about the public health approaches in drug policies
• Initiate campaigns to reach marginalized populations, including ethnic minorities, immigrants, and internally displaced persons including the use of outreach workers/peers.
Dr. Carolyn Wester (co-chair)U.S. Centers for Disease Control and Prevention
Dr. Margaret Hellard (co-chair)Burnet Institute, Australia
Dr. Evan BlochThe Johns Hopkins University, USA
Dr. Carlos del RioEmory University, USA
Dr. Graham FosterQueen Marys, University of London, UK
Dr. Sharon HutchisonGlasgow Caledonian University, UK
Dr. Jeffrey LazarusBarcelona Institute for Global Health, Spain
Dr. Jorge MeraCherokee Nation Health Services, USA
Dr. Antons MozalevskisWorld Health Organization, Denmark
Dr. Priti PatelU.S. Centers for Disease Control and Prevention
Dr. Tatjana ReicEuropean Liver Patients Association, Belgium
Dr. Anders WidellLund University, Sweden
58
SECTION 2. PREVENT HCV TRANSMISSION: HARM REDUCTION • Ensure HCV testing, care, and treatment services are available at all harm reduction sites.
о Ensure that all necessary HCV diagnostics are accessible at all harm reduction sites.
о Eliminate delays in government approval for implementation of HCV services
о Allow opioid substitution treatment (OST) physicians and narcologists to provide HCV services
♦ Ensure adequate supervision, training, and support for OST physicians and harm reduction physicians providing HCV testing, care, and treatment services [e.g. utilizing the ECHO model (Extension of Community Healthcare Outcomes)]
о Improve synergies with harm reduction and existing HCV testing, diagnostics, and treatment services
• Ensure all harm reduction related mobile van services have the capacity to provide needle and syringe services, OST, and hepatitis C testing, diagnostics, and treatment for remote areas
• Eliminate regulatory barriers (e.g. cameras, on-site doctor, physical space requirements, safes) to facilitate rapid integration of HCV services into harm reduction
• Pilot integration of HCV services and primary healthcare services into harm reduction sites consistent with Universal Health Coverage
• Develop a strategy to ensure that harm reduction funding is maintained going forward
SECTION 3. PREVENT HCV TRANSMISSION: BLOOD SAFETY • Mandate participation of all blood collection sites in Georgia’s State Safe Blood Program
• Perform phased implementation of NAT testing with a view to testing of all donor specimens for the major transfusion transmitted viruses (i.e. HIV, HCV and HBV)
о Maintain a trial period with limited implementation (e.g. restrict to limited numbers of centers) to evaluate workflow; identify challenges, particularly with respect to turn around time, logistical considerations (e.g. transportation of samples) and the impact on regional blood supply (i.e. shortages in blood products); and evaluate the costs of implementation as well as measures to improve efficiency of testing (e.g. pooling)
• Implement standardization and quality assurance of serological testing and algorithms within Georgia State Program
• Assess feasibility of centralized testing for all blood screening
• Develop an accreditation framework:
о State Safe Blood Program evaluation of blood services to determine adherence to standard practice
• Develop a look-back system including sample archiving to identify recipients of blood products from positive donors and ensure positive donors are linked to care
• Continue efforts to increase proportion of voluntary blood donors
59
SECTION 4. PREVENT HCV TRANSMISSION: INFECTION CONTROL IN HEALTHCARE, NON-TRADITIONAL HEALTHCARE, AND COMMUNITY SETTINGS
• Utilize epidemiologic and molecular data on acute cases to determine contribution of healthcare to new HCV cases:
о Conduct a special study of cases without recognized risk factors to identify healthcare exposures and healthcare-related outbreaks
о Investigate clusters of healthcare transmission to identify risk factors and prevent additional cases
о Determine the relative contributions of different healthcare settings to new HCV infections, including nontraditional healthcare
• Complete the national infection prevention and control (IPC) guidance
о Develop a dissemination plan and implementation guidance with standard protocols
о Dedicate resources to support implementation of the national guidance
• Strengthen IPC training and engagement of clinical staff in healthcare settings; perform ongoing IPC quality assessments in healthcare settings with risk of bloodborne pathogen transmission
• Consider a pilot study to assess critical infection control practices (e.g. injection safety, instrument sterilization) in select healthcare setting considered high-risk (e.g. dental and endoscopy) to inform prevention needs
• Implement and assess routine monitoring for HCV in special populations (e.g. CDC recommends maintenance hemodialysis patients be screened upon outpatient dialysis initiation and every 6 months thereafter for susceptible patients)
SECTION 5. IDENTIFY AND LINK TO CARE PERSONS INFECTED WITH HCV • Integration of testing for HCV with:
о Primary care screening for non-communicable diseases (NCDs)
о HIV and TB
• Assess testing uptake and proportion positive
• Assess the role of migration and internally displaced populations contributing to the lost to follow-up tested HCV-positive (labor migrants to the European Union, Turkey, Russia, and other locations) and consider tailored campaigns (e.g. inform Georgian citizens leaving the country to work/returning from abroad about the HCV elimination program)
• Focus testing efforts towards high-yield populations using evidence-based approaches:
о Geographically (e.g. Tbilisi)
о High burden settings (e.g. emergency departments and correctional facilities)
о Men age 30 and above with special attention to war veterans
о Persons with a history of incarceration
о Limit pediatric HCV testing to exposed infants (eliminate routine testing for hospitalized children <12 years of age)
60
о Explore the feasibility of innovative strategies for testing:
♦ PWID (e.g. respondent-driven sampling, bring in a friend/family/household/ high-risk contact for screening)
♦ Expanding community-based testing among populations with limited access to healthcare services
♦ Targeted outreach efforts (e.g. lost to follow-up following positive anti-HCV screening)
• Improving linkage to care:
о Increase number of people tested and treated by community providers (harm reduction and primary health care) so that a substantial proportion of treatment is delivered where client is tested
о Eliminate barriers to care (e.g. cameras, taxation of commodities, regulations that prohibit specialized providers such as narcologists, dentists, pharmacists)
о Explore role of patient incentives for linkage
о Explore the role of provider incentives for linkage and treatment
о Implement peer navigator strategies where appropriate (e.g. high-volume screening locations)
о Additional strategies to be considered:
♦ Treatment services should be available where testing is conducted
♦ Provide training for primary care physician and harm reduction physicians in counseling patients with HCV to increase linkage to care
♦ Minimize turnaround time and notification to patients of viremia testing results
♦ Pilot innovative test and treat strategies (e.g. allow patients to change providers once treatment is initiated if necessary)
♦ Navigation of released prisoners from screening, viremia testing, treatment initiation, and treatment completion should be initiated
SECTION 6. IMPROVE HCV LABORATORY DIAGNOSTICS • Continue quality controls and proficiency monitoring and make these standard operating procedures
• Use the quality data generated on 13 rapid diagnostic tests at Lugar to select those with the highest sensitivity and specificity for procurement for the HCV elimination program
• Continue to study the utility of dried blood spot (DBS) for inclusion in the HCV elimination program
• Continue support for archiving of key blood samples for future use (outbreak investigations, DAA resistance appearance, and research)
• Explore cost-effective approaches for confirming core antigen negative results (e.g. pool testing)
• Develop and implement strategies for expanded and shared use of GeneXpert machines in the HCV elimination program
61
SECTION 7. PROVIDE HCV CARE AND TREATMENT • To facilitate access to treatment, remove unnecessary barriers preventing “one-window” testing and treatment, such as centralized approval process for treatment, and camera recording of patients taking the first dose of medication for each bottle dispensed
• Introduce pangenotypic DAA regimens as soon as feasible; this will eliminate the need for genotype testing, simplifying the workup and patient care pathway, and reducing costs
• Implement the use of both branded and licensed generic versions of medications for treatment of hepatitis C and hepatitis B in Georgia
• Minimize on-treatment monitoring utilizing best practices from WHO, EASL, and AASLD guidelines (see attached)
• Expand patient eligibility for treatment at primary healthcare centers, harm reduction sites and other non-specialist sites to include all HCV infected patients except when decompensated cirrhosis or other serious co-morbidities are present. Ensure expert consultation is available for all providers (e.g. via ECHO, phone hotline, academic detailing) providing care and treatment
о Patients with possible compensated cirrhosis (FIB-4 score > 3.25; platelets < 150,000 mm3; APRI >2.0; or fibroscan stiffness >12.5 kPa) following completion of treatment at primary healthcare sites, harm reduction sites, and other sites, should be referred to a specialist for post-treatment cirrhosis evaluation and care
• Following confirmation of viremia, treatment should be initiated immediately, prior to staging or other testing
• SOF/VEL should be used for end-stage renal disease HCV infected patients (FDA approved and AASLD recommended)
о Consider HCV micro-elimination within dialysis patient population
• Expand the list of providers, such as primary healthcare providers, narcologists, TB specialists, etc., that are eligible to treat HCV infected patients so that patients are treated where diagnosed
• Implement micro-elimination of HCV in the prison population:
о Eliminate barriers to treatment (e.g. minimum sentence requirement, care navigators)
• Engage key stakeholders (e.g. hospital administrators, mayors, prison wardens, nephrologists, hematologists, etc.) to implement targeted micro-elimination efforts
• Re-testing (including RNA testing for those previously treated) in high risk groups should be implemented on a regular basis and documented
• Re-testing and re-treatment for potential reinfection should be encouraged in key populations and made free of charge for all patients
• Consider incorporating comprehensive care and treatment of NCDs for HCV patients engaged in treatment
62
SECTION 8. IMPROVE HCV SURVEILLANCE • Develop, implement, and strengthen surveillance for acute/incident HCV infections:
о Include sentinel sites with high volume emergency departments; persons with suspected hepatitis should be tested for acute hepatitis A, B, and C
о Identify and investigate new HCV infections among repeat blood donors and blood donors who test antiHCV-/NAT positive
о Establish surveillance for acute infections and re-infections at select settings serving at-risk populations (e.g. persons who inject drugs (PWID), prisoners, dialysis patients, and persons who receive blood products)
♦ Perform screening with NAT in immunocompromised persons
• Utilize GHOST (Global Hepatitis Outbreak Surveillance Technology) program to detect and intervene on transmission networks
• Assess HCV cascade of care by region and key populations
• Establish hepatocellular carcinoma (HCC) surveillance among cirrhotic patients treated in the program:
о HCC treatment should be linked to the elimination program
о If resources are limited, consider identifying a high-risk cohort for prioritized screening
6TH HEPATITIS TECHNICAL ADVISORY GROUP (TAG) RECOMMENDATIONS FOR THE GEORGIA HEPATITIS C ELIMINATION PROGRAMOn March 15–16, 2021, the Georgian Ministry of Internally Displaced Persons from the Occupied Territories, Labour, Health and Social Affairs (MoIDPLHSA), together with experts from the U.S. Centers for Disease Control and Prevention’s (CDC) Division of Viral Hepatitis (DVH), the World Health Organization (WHO), and other international partners, convened Georgia’s sixth external Viral Hepatitis Technical Advisory Group (TAG) meeting virtually. The TAG consists of twelve international experts in viral hepatitis prevention and control, and is co-chaired by the Director of CDC’s DVH.
The two-day meeting opened with remarks from the First Deputy Minister of MoIDPLHSA, the US Embassy Charge d’Affaires, the Director of CDC’s DVH, a representative from Gilead Sciences, and the Head of the WHO Georgia office. The meeting began with introduction of the TAG members, then presented progress on the HCV Elimination Program since its launch in 2015. Attention was also paid to the development of the 2021–2025 National Strategic Plan on Viral Hepatitis Elimination, which will be finalized and published later this year.
Presentations highlighted the accomplishments of the HCV Elimination Program through January 2021, including: 2.2 million people screened, 140,216 anti-HCV positive individuals identified, 113,151 persons testing positive for HCV RNA or core antigen, and 73,045 initiating treatment with direct acting antivirals.
63
The TAG explored progress of the HCV elimination program by reviewing the 2019 TAG recommendations, accomplishments, and ongoing challenges for each strategy in the 2016–2020 strategic plan: 1) advocacy and education, 2) prevention of transmission (including harm reduction, blood safety, and infection control), 3) linkage to care, 4) laboratory diagnostics, 5) care and treatment, and 6) surveillance. Two TAG members moderated each session, and provided an overview of pre-recorded scientific presentations pertinent to the strategy. On the second day, the TAG presented draft recommendations for review and comment.
The TAG would like to congratulate Georgia on the remarkable progress toward hepatitis C elimination, especially in light of the COVID-19 pandemic and its impact on all aspects of care. The TAG appreciates the sustained commitment of the Georgian government, Georgian staff and clinical partners working on the Program, and the efforts to implement 2019 TAG recommendations, while simultaneously developing a strategic plan for the next 5 years of the program. In particular, the TAG would like to recognize the efforts to incorporate hepatitis B in the program and next strategic plan. The TAG also appreciates the collegial and open sharing of data, and the valuable discussion and expertise demonstrated by Georgian colleagues. Based on the presentations and discussion, the TAG developed the recommendations listed below to aide the program in achieving the goal of hepatitis elimination.
THE TAG MEMBERS INCLUDED
OVERARCHING CONSIDERATIONS• The COVID-19 Pandemic has created barriers and opportunities for the HCV Elimination Program
о Barriers: reduced in-person encounters resulted in decreased numbers tested and treated
о Opportunities: able to leverage COVID-19 serosurvey to obtain data on HCV and HBV; expanded diagnostic testing provides opportunities for novel models for both HBV vaccine delivery and HCV testing in hard-to-reach populations; and increased attention to infection prevention and control (IPC)
Dr. Carolyn Wester (co-chair)U.S. Centers for Disease Control and Prevention
Dr. Margaret Hellard (co-chair)Burnet Institute, Australia
Dr. Evan BlochThe Johns Hopkins University, USA
Dr. Carlos del RioEmory University, USA
Dr. Graham FosterQueen Mary University of London, UK
Dr. Sharon HutchinsonGlasgow Caledonian University, UK
Dr. Jeffrey LazarusBarcelona Institute for Global Health, Spain
Dr. Jorge MeraCherokee Nation Health Services, USA
Dr. Antons MozalevskisWorld Health Organization, Denmark
Dr. Priti PatelU.S. Centers for Disease Control and Prevention
Dr. Tatjana ReicCroatian Society for liver Disease “Hepatos”, Croatia
Dr. Anders WidellLund University, Sweden
64
STRATEGY 1. PROMOTE ADVOCACY, AWARENESS, EDUCATION, AND PARTNERSHIPS FOR HCV-ASSOCIATED RESOURCE MOBILIZATION
• Implement evidence-based education and communication campaigns to increase broader community awareness about hepatitis B and C and hepatitis C cure:
о Prioritize the inclusion of people with lived experience to assist with campaign messaging and to serve as peer navigators (including creation of paid opportunities)
о Build capacity for newly formed patients’ advocacy groups
о Ensure use of person-first language in communication and education materials
о Use information collected around knowledge, attitudes, and practices related to hepatitis from the upcoming 2021 hepatitis serosurvey questionnaire to inform HCV and HBV communication campaigns and materials
о Ensure that individuals with liver disease from chronic hepatitis B and C are prioritized for COVID-19 vaccination
• Continue advocacy for and improvement of policies to reduce barriers to access to care for viral hepatitis
о Continue efforts to support the legal environment and modification of laws related to the possession of drug injection paraphernalia
о Explore options for allowing Harm Reduction (HR) sites to be certified to provide hepatitis treatment
STRATEGY 2. PREVENT HCV TRANSMISSION: HARM REDUCTION • Expand HR services and network of care provided
о Maintain support of Harm Reduction Sites/Needle-syringe programs (HR/NSPs) as an integral component of national health service delivery, and continue to provide government funding for HR/NSPs
о Expand capacity at all HR/NSPs (including mobile sites) to provide HCV screening, viremia testing, and pursue certification to provide treatment
♦ Ensure that HCV and HBV testing is provided free of charge to all, including HR/NSPs beneficiaries
о Integrate HBV vaccination into HR/NSP service sites, and explore opportunities to include HBV testing and treatment in HR/NSP sites
о Expand the number of HR/NSP sites that provide integrated HCV treatment (currently 4 sites)
• Reduce loss to follow-up and improve linkage to care at HR sites
о Reduce time from receipt of positive HCV RNA/Core Ag result to treatment initiation to ≤ 2 weeks
о Expand qualitative analysis to identify barriers to seeking care, pursuing viremia testing, and completing treatment; implement targeted interventions to address identified barriers
65
• Ensure continuous monitoring of high-risk populations to enhance detection of HCV infection and re-infection
о Implement repeat HCV testing among PWID, including HCV RNA/Core Ag testing among persons who inject drugs (PWID) who continue to be at risk for infection after achieving SVR; utilize data from repeated HCV RNA/Core Ag testing to inform surveillance for re-infection
• Continue to support Opioid Substitution Therapy (OST) Programs through state-based funding as a recognized integral part of harm reduction
о Integrate OST into certain high-risk settings (e.g., prisons)
о Ensure that changes to OST program introduced during the COVID-19 pandemic (e.g., allowing for more “take-away” doses) are maintained
STRATEGY 2. PREVENT HCV TRANSMISSION: BLOOD SAFETY • Infectious risk specific
о Standardize testing approach, including serological markers
♦ Transition to automated testing
♦ Standardize testing algorithms across sites; incorporate repeat and confirmatory testing
♦ Assess mini-pool Nucleic Acid Testing (NAT)
о Complete re-assessment of all blood bank collection facilities
о Conduct surveillance for any donor who tests positive for HCV and HBV and follow to link-to-care
♦ Develop national database or tracking mechanism to prevent subsequent donation by those who test positive for a given marker
♦ Conduct look-back (e.g., with follow-up testing) of all individuals who were transfused with blood from a donor who subsequently tests positive; the look-back period should be defined to balance yield with logistical feasibility (e.g. 6-12 months beyond last negative donation)
♦ Consider following blood transfusion recipients prospectively to estimate seroconversion rates
о Refine donor selection with reduced proportion of remunerated and first-time blood donors
♦ Conduct an impact study ahead of transition to exclusive voluntary donors (VNRBDs)
♦ Conduct a qualitative assessment of motivators for and deterrents against donation
• General Blood Safety
о Align with European Union (EU) standards
о Conduct assessment of infrastructure (coordinate with blood bank assessments)
о Bolster immunohematology capabilities (collateral benefit to oncology services)
о Impose regulatory controls on procurement: restrict to tests that have been adequately validated (e.g. CE marked)
66
STRATEGY 2. PREVENT HCV TRANSMISSION: INFECTION CONTROL IN HEALTHCARE, NON-TRADITIONAL HEALTHCARE, AND COMMUNITY SETTINGS
• Infection Prevention and Control (IPC) Guidance and Implementation
о Ensure that IPC guidance is disseminated and implemented nationwide
♦ Leverage COVID-19 IPC trainings to improve provider knowledge and adherence to injection safety and other basic practices to prevent HCV and HBV transmission in the healthcare setting
♦ Preform IPC assessments in healthcare settings with risk of bloodborne pathogen transmission
♦ Develop standard protocols and other tools to support implementation of national guidance
• Collect Evidence to inform IPC Activities
о Utilize epidemiologic and molecular data on acute cases (e.g., from sentinel surveillance sites) to determine contribution of healthcare to new HCV and HBV cases:
♦ Conduct a special study of cases without recognized risk factors to identify healthcare exposures and healthcare-related outbreaks
♦ Investigate clusters in healthcare settings to identify risk factors and prevent additional cases
♦ Determine the relative contributions of different healthcare settings to new HCV infections, including non-traditional healthcare settings
о Conduct assessment of critical infection control practices (e.g., injection safety and instrument sterilization) in select healthcare settings considered high-risk (e.g., dental and endoscopy) to inform prevention needs
о Conduct a study to assess the general population’s knowledge and understanding of the risk of HCV and HBV from injection practices in healthcare and non-traditional settings; use findings to inform education and communication campaigns
о Implement and assess routine monitoring for HCV and HBV infection in maintenance hemodialysis patients
о Utilize ongoing IPC assessment and research results to improve setting-specific IPC recommendations to prevent HCV and HBV transmission
STRATEGY 3. IDENTIFY AND LINK TO CARE PERSONS WITH HCV • Evaluate Hepatitis C Elimination Program data to ensure understanding of demographic and geographic distribution of those screened and not linked to care
• Focus testing efforts and improve linkage to care in populations in most need of targeted outreach efforts, including:
о Geographic (e.g., Tbilisi)
о High-burden settings (e.g., emergency departments and correctional facilities)
о Men age 30 years and older with special attention to war veterans or persons with a history of incarceration
о PWID
67
• Expand community-based testing among populations with limited access to healthcare services (e.g., door-to-door program)
• Continue to expand the number and type of sites that integrate HCV testing
о Primary care clinics
о HIV clinics and TB clinics
о Diabetes clinics
о OST Clinics
о Mental Health services
о COVID-19 clinics or testing sites
• Decrease the rate of advanced stage diagnosis through focusing efforts on increased screening of individuals with diabetes, high BMI, alcohol use disorder, and incarceration
о Increase the HCV screening education of medical personnel who take care of these populations
• Expand reflex testing to improve the viremia confirmation gap
о Develop strategies for ensuring individuals screened for HCV antibodies in all sites where testing is performed are linked to viremia testing and care (not just referred), either through onsite viremia testing, screening/linkage project model, or for patients screened in door-to-door Rapid Diagnostic Tests (RDTs); consider obtaining Dried Blood Spots (DBS) as well to send to the Lugar Center
• Continue to evaluate the role of HCV self-testing with RDTs among different populations [e.g., PWID, men who have sex with men (MSM), and other groups]
• Expand peer navigator programs and strategies in high-volume screening locations and other areas as appropriate
• Expand the role of provider incentives for linkage and treatment
STRATEGY 4. IMPROVE HCV LABORATORY DIAGNOSTICS • Continue sending proficiency panels from the Lugar Center to labs and blood banks (3 times/year) to ensure quality control
о Provide guidelines on actions to be taken when panels/laboratories fail
• Continue decentralization of RNA testing to stand alone instruments (e.g., GeneXpert and Genedrive)
о Follow the rapid development of new, simple isothermal RNA detecting tests for inclusion in the program when available
• Rapid Diagnostic Tests (RDTs) for anti-HCV antibodies
о Explore use of oral swab based RDTs
68
о Recommend use of RDTs that have been validated for use in decentralized settings (e.g., HCV One Step Rapid test, Healgen anti-HCV) and define acceptance criteria for use of other state procured RDTs
о Explore implementation of HCV self-testing
• Dried blood spot (DBS) testing for RNA
о Introduce DBS (preferably from plasma or serum) in RDT positive patients for shipment to the Lugar Center for RNA testing
о Monitor turnaround time from RDT taken via DBS to patient contact with conclusive viremia result for treatment
• Explore use of Plasma Separation Cards (PSC), including molecular epidemiology, GHOST, outbreak analyses, and resistance mutations
• Consider pilot study in HR sites to test all anti-HCV positive and negative samples for HCV Core Ag to determine rate of window phase infections
• Explore strategies to conduct HDV testing at least once for every person with chronic HBV infection
STRATEGY 5. PROVIDE HCV CARE AND TREATMENT • Expand Primary Care sites and providers offering HCV screening, viremia testing, and treatment
о Expand scope of treatment in non-specialist sites to include treatment of patients with non-decompensated cirrhosis
• Pilot HCV test-and-treat strategies in range of settings including point of care RNA testing, pre-treatment evaluation, and DAAs on the shelf to reduce time from testing to treatment
о Develop timeline goals from testing to treatment (e.g. patients should start DAA no later than 2 weeks after RNA tests are resulted)
• Alter treatment protocols nationwide to ensure simplified, more accessible treatment, including:
о Eliminate routine on-treatment lab tests
о Give full course of medication on initiation
о Minimize on-treatment follow-up appointments in person; conduct via alternate mechanisms (e.g., telephone)
• Disseminate information on HCV and HBV screening recommendations, safety of treatment and medication in persons with renal insufficiency, and determine opportunities for dialysis clinicians to provide HCV treatment to patients
о Engage nephrologists and other kidney care providers to identify and treat HCV infection among dialysis patients
69
• Implement more comprehensive treatment programs in high-impact populations (e.g., dialysis and prison)
• Design innovative strategies to engage HCV RNA positive individuals in care with particular focus on those with lowest treatment initiation rates, including:
о Individual 70 years of age or older
о Individuals on hemodialysis
о Individuals with hemophilia
STRATEGY 6. IMPROVE HCV SURVEILLANCE Surveillance
• Continue to strengthen surveillance for acute/incident HCV and HBV infections, including through sentinel surveillance sites
• Establish surveillance for acute infections and re-infections at select settings serving at-risk populations (e.g., PWID, prisoners, hemodialysis patients, and persons who receive blood products)
о Adopt AASLD/EASL/WHO recommendations to test high-risk individuals (e.g., PWID and MSM), at least annually, including testing for viremia in those previously diagnosed and treated (and thus seropositive)
о Identify and investigate new HCV infections among repeat blood donors and blood donors who test anti-HCV-negative/NAT-positive to identify the risks for recent HCV infection
о Continue efforts to apply GHOST (Global Hepatitis Outbreak Surveillance Technology) to detect and intervene on transmission networks
• Assess existing surveillance capacity for hepatitis B and build upon existing HCV systems (e.g., screening registry, treatment registry) to include HBV
• Expand surveillance system to identify and track pregnant women with HCV infection and children born to mothers with HCV infection
Program Effectiveness• Develop stratified iterations of the national HCV treatment cascade, including stratifications by geography, patient characteristics, facility type, and other pertinent factors
• Establish hepatocellular carcinoma (HCC) surveillance among patients with cirrhosis, including after achieving the SVR, within HCV Elimination Program or national healthcare system
• Engage with WHO to pilot the WHO Guidance for Validation of Elimination of Viral Hepatitis
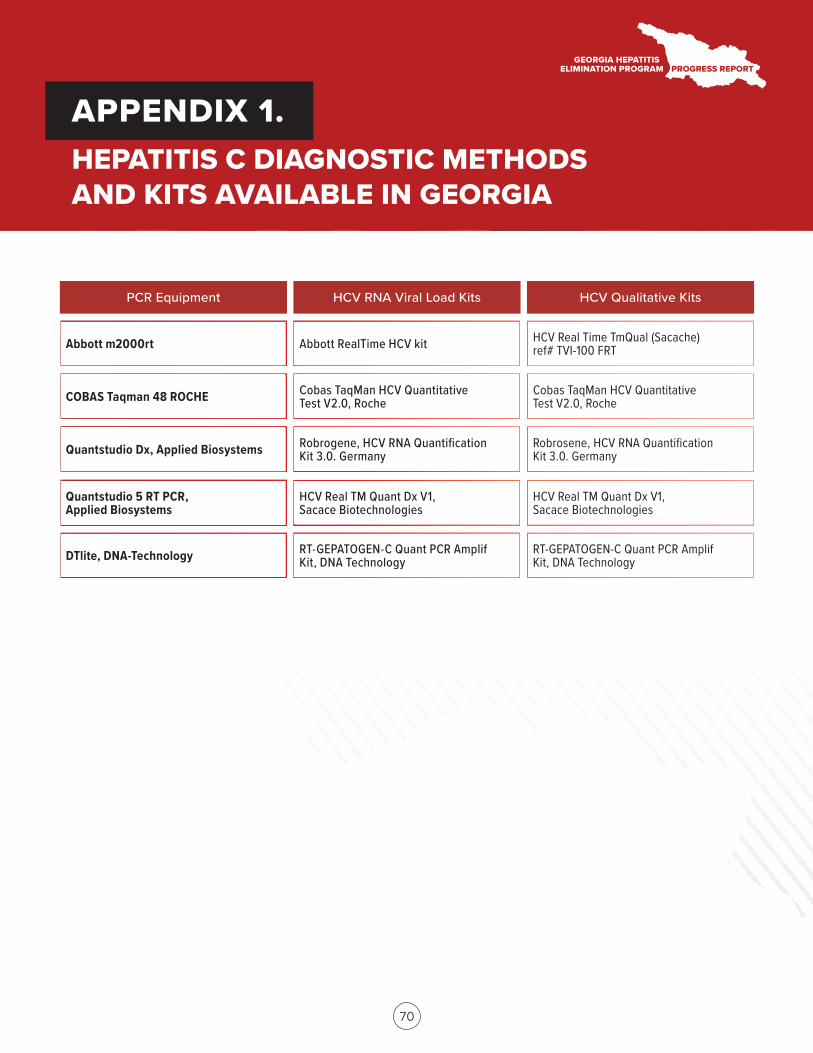
70
PCR Equipment HCV RNA Viral Load Kits HCV Qualitative Kits
APPENDIX 1. HEPATITIS C DIAGNOSTIC METHODS AND KITS AVAILABLE IN GEORGIA
Abbott m2000rt Abbott RealTime HCV kit HCV Real Time TmQual (Sacache) ref# TVI-100 FRT
COBAS Taqman 48 ROCHE Cobas TaqMan HCV Quantitative Test V2.0, Roche
Cobas TaqMan HCV Quantitative Test V2.0, Roche
Quantstudio Dx, Applied Biosystems Robrogene, HCV RNA Quantification Kit 3.0. Germany
Robrosene, HCV RNA Quantification Kit 3.0. Germany
Quantstudio 5 RT PCR, Applied Biosystems
HCV Real TM Quant Dx V1, Sacace Biotechnologies
HCV Real TM Quant Dx V1, Sacace Biotechnologies
DTlite, DNA-Technology RT-GEPATOGEN-C Quant PCR Amplif Kit, DNA Technology
RT-GEPATOGEN-C Quant PCR Amplif Kit, DNA Technology
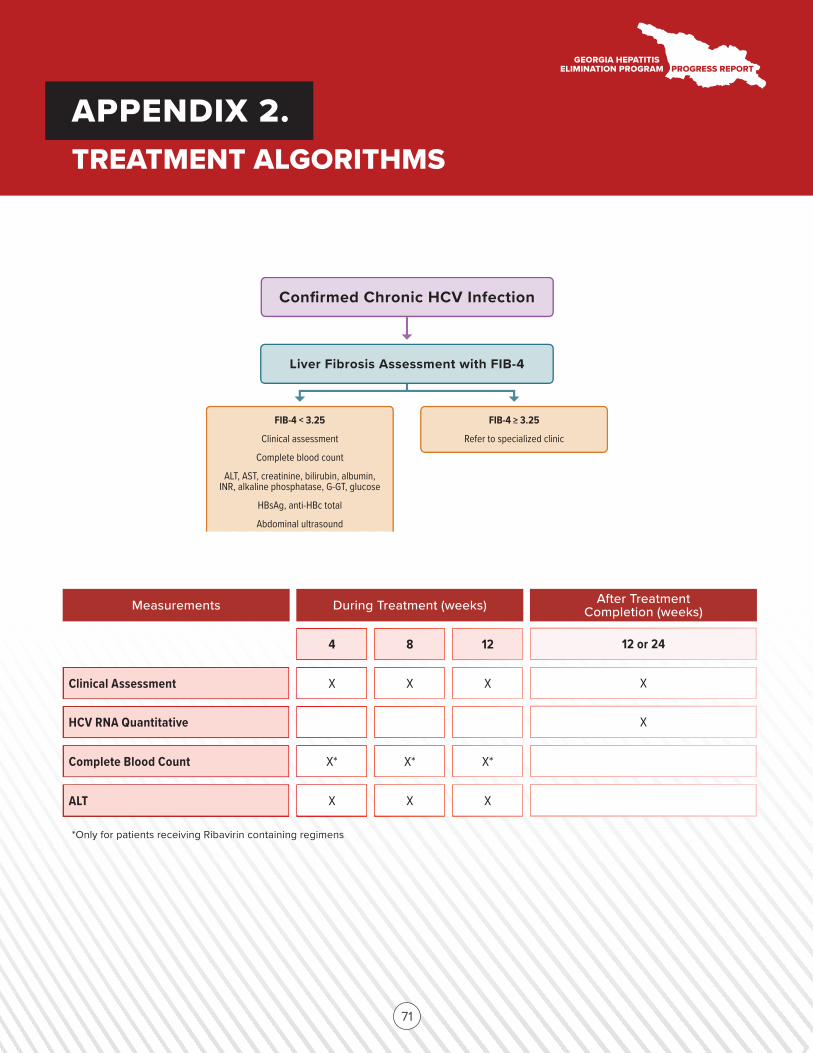
Confirmed Chronic HCV Infection
Liver Fibrosis Assessment with FIB-4
FIB-4 < 3.25
Clinical assessment
Complete blood count
ALT, AST, creatinine, bilirubin, albumin, INR, alkaline phosphatase, G-GT, glucose
HBsAg, anti-HBc total
Abdominal ultrasound
FIB-4 > 3.25
Refer to specialized clinic
71
Measurements During Treatment (weeks) After Treatment Completion (weeks)
APPENDIX 2.TREATMENT ALGORITHMS
*Only for patients receiving Ribavirin containing regimens
4 8 12 12 or 24
Clinical Assessment X X X X
HCV RNA Quantitative X
Complete Blood Count
ALT X X X
X* X* X*
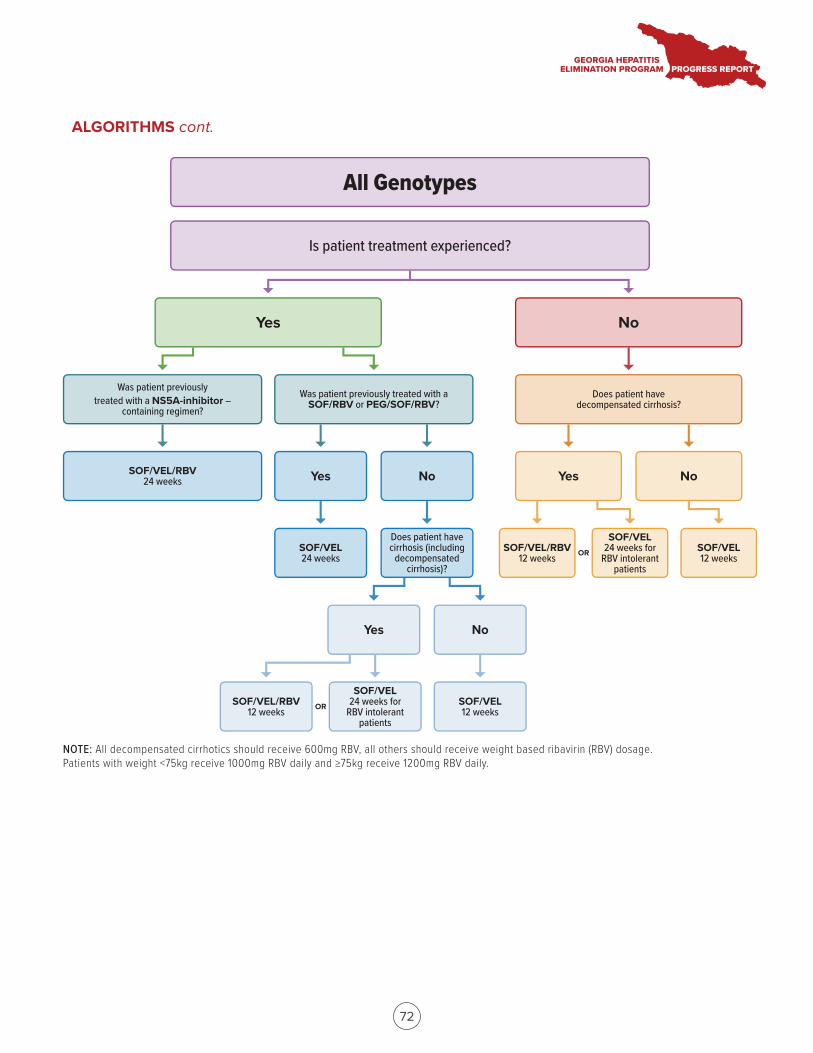
Yes No
Yes No Yes No
Is patient treatment experienced?
Was patient previously treated with a NS5A-inhibitor –
containing regimen?Was patient previously treated with a
SOF/RBV or PEG/SOF/RBV?Does patient have
decompensated cirrhosis?
SOF/VEL/RBV24 weeks
Does patient have cirrhosis (including
decompensated cirrhosis)?
SOF/VEL24 weeks for
RBV intolerant patients
SOF/VEL24 weeks
SOF/VEL/RBV12 weeks
Yes No
SOF/VEL12 weeks
SOF/VEL12 weeks
SOF/VEL24 weeks for
RBV intolerant patients
SOF/VEL/RBV12 weeks OR
OR
All Genotypes
NOTE: All decompensated cirrhotics should receive 600mg RBV, all others should receive weight based ribavirin (RBV) dosage. Patients with weight <75kg receive 1000mg RBV daily and >75kg receive 1200mg RBV daily.
72
ALGORITHMS cont.
73
i. ABSTRACTS1. The head-start project Georgia: a three-armed, cluster, nonrandomized trial of the effectiveness of two novel models of HCV confirmatory testing in harm reduction sites (HRS) in Georgia
Abstract Presented at EASL International Liver Congress, 2020; Virtual Event
Authors: Maia Japaridze1, Jessica Markby2, Irma Khonelidze3, Maia Butsashvili4, Maia Alkhazashvili3, Sonjelle Shilton2.
1Foundation for Innovative New Diagnostics, Georgia, 2Foundation for Innovative New Diagnostics, Geneva, Switzerland, 3Georgia National Centers for Disease Control, Georgia, 4Health Research Union, Georgia
Background and Aims: Georgia, a middle-income country with an estimated population of 3.7 million people, is among the world’s highest-burden countries, with an HCV prevalence of 6.7% in the general population and a higher burden of disease in high-risk populations especially PWID. In 2015, Georgia embarked on an elimination program, however, significant gaps remain in case finding and linkage to care. In particular, although screening programs have largely been decentralized for high-risk groups, viremic testing remains a bottleneck for PWID accessing care. Here we describe two novel models of viremic testing that aim to address these weaknesses in the care cascade.
Method: A cluster, non-randomized intervention study where HRS are assigned to one of three arms Arm1: 4 HRS, viremia testing (GeneXpert) on-site, Arm 2: 2 HRS, blood draw on site, confirmatory testing (cAg) at a centralized laboratory, Arm 3 2 HRS, standard of care patients referred for testing at the treatment center. Participants are eligible for the study if they tested anti-HCV positive on the same day and did not have prior confirmed diagnosis. The proportion of participants who completed each step in the HCV care cascade was compared across the three arms as well as the turn-around time of test results.
Results: Between May 2018 and November 2019, 1671 participants were enrolled (621 in Arm 1, 486 in Arm 2; 565 in Arm 3). Participants were predominantly male (95.4%), mean age was 44.0 (19–88) years and 79.1% were currently injecting drugs. 95% of participants reported having taken an HIV test and of these 14 (0.84%) self-reported being HIV-positive. To date, 1517 participants have had a confirmatory viremia test done: 621 (100%) in Arm 1, 483 (99.4%) in Arm 2; 438 (77.5%) in Arm 3. Of those confirmed positive, treatment was initiated for 450 (87.0%) in Arm 1, 273 (70.9%) in Arm 2 and 345 (98.0%) in Arm 3. On average participants received their results the same day (<3 hours) in Arm 1, 21.5 days in Arm 2 and 18.6 days in Arm 3 from the time they had blood drawn for testing.
Conclusion: Confirmatory testing or blood draw on-site at HRS showed improved retention of patients in the care cascade compared to the referral of patients for blood collection. Moreover, the turnaround time was shortest when confirmatory testing was performed on-site. These findings will facilitate the scale-up of decentralized HCV care for PWID in Georgia and globally
APPENDIX 3.SCIENTIFIC MEETING PRESENTATIONS OF THE GEORGIA HEPATITIS C ELIMINATION PROGRAM
74
2. Progress towards achieving hepatitis C elimination in the country of Georgia, April 2015–October 2019
Abstract Presented at EASL International Liver Congress, 2020; Virtual Event
Authors: Tengiz Tsertsvadze1,2, Amiran Gamkrelidze3, Nikoloz Chkhartishvili1, Akaki Abutidze1,2, Lali Sharvadze2,4, Vakhtang Kerashvili1, Maia Butsashvili5, David Metreveli6, Lia Gvinjilia7, Shaun Shadaker8, Muazzam Nasrullah8, Tamar Gabunia9, Ekaterine Adamia9, Stefan Zeuzem10, Nezam Afdhal11, Sanjeev Arora12, Karla Thornton12, Francisco Averhoff8
1Infectious Diseases, AIDS and Clinical Immunology Research Center, T’bilisi, Georgia, 2Ivane Javakhishvili Tbilisi State University (TSU) Faculty Of Medicine, T’bilisi, Georgia, 3National Center for Disease Control and Public Health, Tbilisi, Georgia, 4Hepatology Clinic HEPA, Tbilisi, Georgia, 5Clinic Neolab, Tbilisi, Georgia, 6Medical Center Mrcheveli, Tbilisi, Georgia, 7TEPHINET for Hepatitis C Elimination Program in Georgia, Tbilisi, Georgia, 8Centers for Disease Control and Prevention, Division of Viral Hepatitis National Center for HIV, Hepatitis, STD&TB Prevention, 9Ministry of IDPs from the Occupied Territories, Labour, Health, and Social Affairs of Georgia, Tbilisi, Georgia, Tbilisi, Georgia, 10Goethe University Frankfurt, Frankfurt, Germany, 11Beth Israel Deaconess Medical Center (BIDMC), Boston, United States, 12ECHO Institute University of New Mexico, Albuquerque, USA, Albuquerque
Background and Aims: In April 2015 with the technical assistance of U.S. CDC and commitment from Gilead Sciences to donate direct-acting antivirals (DAAs), Georgia launched the world’s first HCV elimination program. A key strategy of the program is nationwide HCV screening, active case finding, linkage to care, provision of treatment for all HCV-infected persons and effective prevention interventions. The elimination program aims at achieving 90–95–95 targets by 2020: a) diagnose 90% of HCV-infected persons, b) treat 95% of those diagnosed, and c) cure 95% of those treated. We report progress towards elimination targets 4 years into the elimination program.
Method: A hepatitis C care cascade was constructed using data from the national HCV treatment program (Figure). A national serosurvey in 2015 estimated that 150,000 over 18 years of age were infected with HCV in the country. The program collects data on all persons registered with the treatment program. Treatment was provided with Sofosbuvir, Ledipasvir/Sofosbuvir or Velpatasvir/Sofosbuvir-based regimens. Data on persons tested for chronic HCV infection through sustained virologic response (SVR) were extracted as of October 31, 2019.
Results: Overall 121,043 persons tested positive for HCV antibodies and of those 97,348 (80.4%) underwent HCV confirmatory testing. Chronic HCV infection was confirmed in 79,955 (82.1%) persons, representing 53.3% of the estimated 150,000 adults living with HCV. A total of 62,927 (78.7%) patients initiated treatment – 49.1% of the estimated target population to be treated (128,250). Of the 41,220 patients who were evaluated for SVR, 40,693 (98.7%) tested negative for HCV by PCR, representing 33.4% of the estimated target population to be cured (121,837). Very high cure rates were achieved for all HCV genotypes: 98.9% in genotype 1, 98.9% in genotype 2 and 98.3% in most challenging to treat genotype 3. Treatment effectiveness was comparable among persons with advanced fibrosis (F3 and F4) with 98.2% achieving SVR, and among patients with mild or no liver fibrosis (≤F2), SVR = 99.0%.
Conclusion: Georgia has made substantial progress towards eliminating hepatitis C, with more than half of persons with HCV infection identified and registered for treatment. Very high cure rates have been achieved among those who received SVR testing. Challenges remain in identifying and especially linking to care persons living with HCV in Georgia. A nationwide integrated, decentralized model of HCV treatment, which is already implemented, will be critical to improving linkage to care and close the gaps in the HCV cascade.
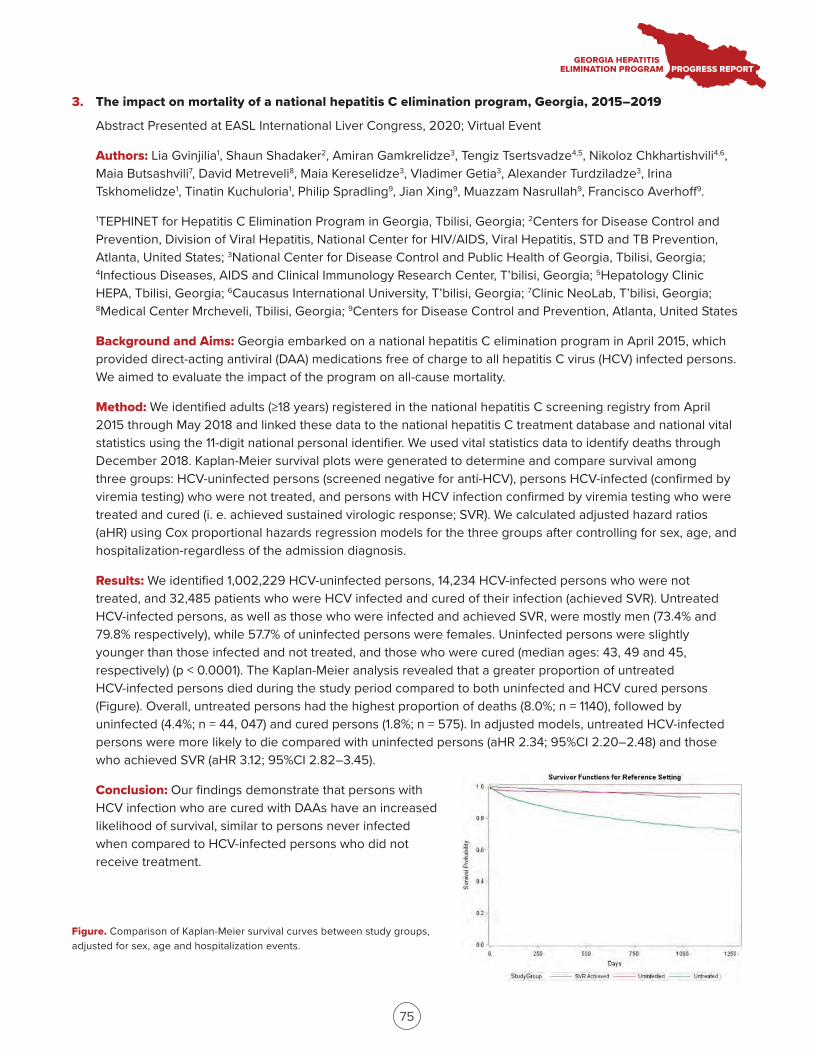
75
3. The impact on mortality of a national hepatitis C elimination program, Georgia, 2015–2019
Abstract Presented at EASL International Liver Congress, 2020; Virtual Event
Authors: Lia Gvinjilia1, Shaun Shadaker2, Amiran Gamkrelidze3, Tengiz Tsertsvadze4,5, Nikoloz Chkhartishvili4,6, Maia Butsashvili7, David Metreveli8, Maia Kereselidze3, Vladimer Getia3, Alexander Turdziladze3, Irina Tskhomelidze1, Tinatin Kuchuloria1, Philip Spradling9, Jian Xing9, Muazzam Nasrullah9, Francisco Averhoff9.
1TEPHINET for Hepatitis C Elimination Program in Georgia, Tbilisi, Georgia; 2Centers for Disease Control and Prevention, Division of Viral Hepatitis, National Center for HIV/AIDS, Viral Hepatitis, STD and TB Prevention, Atlanta, United States; 3National Center for Disease Control and Public Health of Georgia, Tbilisi, Georgia; 4Infectious Diseases, AIDS and Clinical Immunology Research Center, T’bilisi, Georgia; 5Hepatology Clinic HEPA, Tbilisi, Georgia; 6Caucasus International University, T’bilisi, Georgia; 7Clinic NeoLab, T’bilisi, Georgia; 8Medical Center Mrcheveli, Tbilisi, Georgia; 9Centers for Disease Control and Prevention, Atlanta, United States
Background and Aims: Georgia embarked on a national hepatitis C elimination program in April 2015, which provided direct-acting antiviral (DAA) medications free of charge to all hepatitis C virus (HCV) infected persons. We aimed to evaluate the impact of the program on all-cause mortality.
Method: We identified adults (≥18 years) registered in the national hepatitis C screening registry from April 2015 through May 2018 and linked these data to the national hepatitis C treatment database and national vital statistics using the 11-digit national personal identifier. We used vital statistics data to identify deaths through December 2018. Kaplan-Meier survival plots were generated to determine and compare survival among three groups: HCV-uninfected persons (screened negative for anti-HCV), persons HCV-infected (confirmed by viremia testing) who were not treated, and persons with HCV infection confirmed by viremia testing who were treated and cured (i. e. achieved sustained virologic response; SVR). We calculated adjusted hazard ratios (aHR) using Cox proportional hazards regression models for the three groups after controlling for sex, age, and hospitalization-regardless of the admission diagnosis.
Results: We identified 1,002,229 HCV-uninfected persons, 14,234 HCV-infected persons who were not treated, and 32,485 patients who were HCV infected and cured of their infection (achieved SVR). Untreated HCV-infected persons, as well as those who were infected and achieved SVR, were mostly men (73.4% and 79.8% respectively), while 57.7% of uninfected persons were females. Uninfected persons were slightly younger than those infected and not treated, and those who were cured (median ages: 43, 49 and 45, respectively) (p < 0.0001). The Kaplan-Meier analysis revealed that a greater proportion of untreated HCV-infected persons died during the study period compared to both uninfected and HCV cured persons (Figure). Overall, untreated persons had the highest proportion of deaths (8.0%; n = 1140), followed by uninfected (4.4%; n = 44, 047) and cured persons (1.8%; n = 575). In adjusted models, untreated HCV-infected persons were more likely to die compared with uninfected persons (aHR 2.34; 95%CI 2.20–2.48) and those who achieved SVR (aHR 3.12; 95%CI 2.82–3.45).
Conclusion: Our findings demonstrate that persons with HCV infection who are cured with DAAs have an increased likelihood of survival, similar to persons never infected when compared to HCV-infected persons who did not receive treatment.
Figure. Comparison of Kaplan-Meier survival curves between study groups, adjusted for sex, age and hospitalization events.
76
4. Progress in hepatitis C testing as a part of the hepatitis C elimination program in Georgia
Abstract Presented at EASL International Liver Congress, 2020; Virtual Event
Authors: Amiran Gamkrelidze1, Tamar Gabunia2, Alexander Turdziladze1, Irma Khonelidze1, Maia Tsereteli1, Vladimer Getia1, Ekaterine Adamia2, Tinatin Kuchuloria3, Irina Tskhomelidze3, Muazzam Nasrullah4, Shaun Shadaker4, Lia Gvinjilia3, Francisco Averhoff4.
1National Center for Disease Control and Public Health Georgia, Tbilisi, Georgia; 2Ministry of IDPs from the Occupied Territories, Labour, Health, and Social Affairs of Georgia, Tbilisi, Georgia; 3TEPHINET for Hepatitis C Elimination Program in Georgia, Tbilisi, Georgia; 4National Center for HIV/AIDS, Viral Hepatitis, STD and TB Prevention, CDC, Division of Viral Hepatitis, Atlanta, United States
Background and Aims: The country of Georgia, with a population of 3.7 million and an estimated 150,000 adults with chronic hepatitis C virus (HCV) infection, initiated the world’s first national hepatitis C elimination program in April 2015. Through the elimination program, screening for hepatitis C is available to all citizens free of charge. The aim of this analysis is to describe progress in hepatitis C testing as part of the hepatitis C elimination program.
Method: This analysis utilizes data from the national screening registry and treatment databases linked by national ID, and 2014 general population census. An information system was created to collect data from the elimination program utilizing the national ID to monitor and evaluate program performance and surveillance.
Results: As of November 10, 2019, 1,628,452 adults have been tested for hepatitis C (56.9% of the adult population), of whom 125,016 (7.7%) were anti-HCV positive. In 2015 the positivity rate averaged 27.0%, but has fallen to 4.4% in the first half of 2019. Overall, 98,134 individuals received viremia testing, of whom 80,074 (81.6%) were found to have chronic HCV. Screening rates are similar for men and women (55.9% vs. 57.9%, respectively). Among men screening rates are highest among those aged ≥60 (64.2%) and lowest among those aged 18–29 (51.7%). The overall positivity rate for adult males is 12.4%. The highest positivity rate is seen in men aged 30–59 (18.6%). Among women screening rates are highest among those (60.7%) aged 18–29 (60.7%) and lowest among those aged 30–59 (56.4%). The overall positivity rate for adult females is 3.7%. The highest positivity rate is seen in women aged ≥60 (5.3%).
Conclusion: The overall anti-HCV prevalence was higher in males and among those aged 30–59 years. The anti-HCV positivity rate has been declining since the launch of the HCV elimination program in April 2015. Although significant progress has been made, a substantial proportion of infected people need to be identified, confirmed, and linked to care.
5. Economic evaluation of the hepatitis C virus screening and treatment program in Georgia
Abstract Presented at EASL International Liver Congress, 2020; Virtual Event
Authors: Irina Tskhomelidze1, Shaun Shadaker2, Tinatin Kuchuloria1, Lia Gvinjilia1, Maia Butsashvili3, Muazzam Nasrullah2, Francisco Averhoff2, Peter Vickerman4, Josephine Walker4.
1TEPHINET, Georgia; 2Centers for Disease Control and Prevention, United States; 3Neolab, Georgia; 4University of Bristol, United Kingdom
77
Background and Aims: In spring 2015, the country of Georgia initiated an HCV elimination program with directly acting antivirals (DAA) donated by Gilead, alongside outstanding political commitment, and allocation of resources for a comprehensive program. We evaluated the cost-effectiveness of the screening and treatment undertaken in the HCV elimination program from 2015 to November 2017 compared to if no treatment had been done, from the perspective of the Ministry of Health (MoH) and patients.
Method: We adapted an HCV transmission and progression model calibrated to Georgian data on HCV prevalence and demographics of the general population and people who inject drugs (PWID) to project the impact of treatment of 41,483 patients during the study period. Quality adjusted life year (QALY) weights for liver disease stages including pre-cirrhosis, compensated and decompensated cirrhosis were estimated from EQ-5D-5L data collected from a subset of HCV-infected patients enrolled in the elimination program. Unit costs were gathered from the financial module of the MoH on reimbursement schemes for healthcare providers. Cost of screening tests, diagnostics and monitoring during treatment, and the annual cost of care for patients with advanced liver disease, were then calculated per patient treated. Indirect costs of public awareness campaigns, infrastructure investment, administrative costs, and logistics were included as fixed costs. Case-finding costs were estimated based on the cascade of care. Estimated economic costs of DAA drugs (sofosbuvir and sofosbuvir/ledipasvir) were included in sensitivity analysis. The incremental cost-effectiveness ratio (ICER) in terms of cost per QALY gained was calculated in 2015 US dollars accounting for all costs and outcomes from 2015–2030 with a discount rate of 3% for both costs and outcomes, and compared to a willingness-to-pay threshold of $3765 per QALY gained (1x GDP per capita in 2015).
Results: The total cost of screening and treatment per patient was $555. The average cost of liver disease care per patient was $416 with no treatment or $311 under the treatment scenario, with 0.78 QALYs gained per patient treated due to reduced disease progression. The intervention also prevented 2,673 HCV-related deaths and averted 16,225 new infections by 2030 compared to no treatment. The ICER of the intervention excluding DAA costs was $959/QALY, while including the cost of DAAs at a minimal generic cost of $143 per patient results in an ICER of $1,244.
Conclusion: The first phase of the HCV elimination program was highly cost-effective in Georgia. This provides valuable data on efficiency of national programs for scaling up HCV treatment for achieving HCV elimination.
6. HCV care cascade of PWID enrolled in methadone substitution treatment program in Georgia - is this the first group of population in which hepatitis C will be eliminated in Georgia?
Abstract Presented at EASL International Liver Congress, 2020; Virtual Event
Authors: Ketevan Stvilia1, Amiran Gamkrelidze1, Irma Khonelidze1, Vladimer Getia1, Lia Gvinjilia2, Tinatin Kuchuloria2, Maia Tsereteli3
1National Center for Disease Control and Public Health, Georgia, Global Fund Programs Implementation Unit, Tbilisi, Georgia; 2CDC office in Georgia, TEPHINET for Georgia Hepatitis C Elimination Program, Tbilisi, Georgia; 3National Center for Disease Control and Public Health, Georgia, HIV, Viral Hepatitis, TB and STI Unit, Tbilisi, Georgia
Background and Aims: Since April 2015 Georgia has started the hepatitis C elimination program with elimination goals by 2020. PWIDs enrolled in the Methadone Substation Treatment (MST) Program are also included in the large-scale screening program aimed to accelerate active HCV case detection. There are a total of 22 MST sites providing long-term substation treatment to PWIDs in Georgia. HCV antibody screening is provided to patients at enrollment in the MST program. The aim is to describe the HCV care cascade among MST program beneficiaries.
78
Method: HCV care cascade was generated for the period of January, 2018 through October, 2019. The data linkage between MST database and the national screening registry was done by matching the national personal ID number. Cascade of care was generated using the matched data.
Results: Overall 9,552 PWIDs registered in MST database by November 1, 2019. A total of 8,265 (87%) MST patients had HCV screening of whom 7,041 (85%) tested positive and 5,998 (85%) were tested for viremia with the positivity rate of 85% (n = 5073). A total of 4,237 (83%) initiated treatment. By the date of the analysis 3,956 (93%) have already completed treatment of whom 3,808 (97%) were eligible for SVR. The cure rate among SVR tested was 96% (2,531/ 2,622).
Conclusion: The analysis of the HCV care cascade for MST program beneficiaries shows high rates for screening and viremia testing uptake, treatment initiation, and SVR rates. Meeting HCV elimination goals by 2020 are feasible, however, requires more effort.
7. Management of hepatitis C in primary healthcare in the country of Georgia
Abstract Presented at EASL International Liver Congress, 2020; Virtual Event
Authors: Tengiz Tsertsvadze1,2, Akaki Abutidze1,2, Lali Sharvadze2,3, Nikoloz Chkhartishvili1, Amiran Gamkrelidze4, Lia Gvinjilia5, Maia Butsashvili6, David Metreveli7, Vakhtang Kerashvili1, Shaun Shadaker8, Muazzam Nasrullah8, Tamar Gabunia9, Ekaterine Adamia9, Stefan Zeuzem10, Nezam Afdhal11, Sanjeev Arora12, Karla Thornton12, Francisco Averhoff8.
1Infectious Diseases, AIDS and Clinical Immunology Research Center; 2Ivane Javakhishvili Tbilisi State University (TSU) Faculty Of Medicine; 3Hepatology Clinic HEPA; 4National Center for Disease Control and Public Health; 5TEPHINET; 6Clinic Neolab, Tbilisi, Georgia; 7Medical Center Mrcheveli, Tbilisi, Georgia; 8Centers for Disease Control and Prevention, Division of Viral Hepatitis National Center for HIV, Hepatitis, STD&TB Prevention; 9Ministry of IDPs from the Occupied Territories, Labour, Health, and Social Affairs of Georgia, Tbilisi, Georgia; 10Goethe University Hospital, Frankfurt, Germany; 11Beth Israel Deaconess Medical Center Liver Center, Boston, USA; 12ECHO Institute University of New Mexico, Albuquerque, USA
Background and Aims: In April 2015, with a partnership with Gilead Sciences and technical assistance from U.S. CDC, Georgia launched the world’s first hepatitis C elimination program. By August 30, 2019, more than 60 thousand persons initiated treatment, achieving >98% cure rates. Broad access to direct acting antivirals (DAAs) resulted in rapid increase in treatment uptake in 2016, which has since declined due to barriers in diagnosis and linkage to care. To address this issue Georgia initiated service decentralization in 2018 by integrating hepatitis C virus (HCV) screening and treatment in primary healthcare centers (PHCs). We report preliminary results of an integrated model of HCV care in PHCs from August 2018 through August 2019.
Method: By August 31 2019, a total of 10 PHCs provided HCV care services throughout the country. The integrated model was based on a “one-stop shop” approach, by which patients received all HCV screening, treatment and care services at the PHCs. PHCs provided care to HCV treatment-naïve patients with no or mild fibrosis (FIB-4 score<1.45) using simplified diagnostics and a treatment monitoring approach, while persons with advanced liver fibrosis/cirrhosis were referred to specialized clinics. Patients received Sofosbuvir/ Ledipasvir and/or Sofosbuvir/Velpatasvir for 12 weeks. Sustained virological response (SVR) was defined as undetectable HCV RNA 12– 24 weeks after the end of therapy. The Extension for Community Healthcare Outcomes (ECHO) telemedicine model was utilized to train and support primary healthcare providers. Regular teleECHO video conferencing was conducted to provide primary care providers with advice and clinical mentoring.
79
Results: Among persons diagnosed with active HCV infection, 639 were evaluated for FIB-4 score. Of these, 436 (68.2%) had FIB4 score<1.45; of them 355 (81.4%) initiated treatment. A total of 241 patients completed treatment. Of 146 patients within the 12–24 week window of SVR eligibility, 108 had been tested at the time of analysis, and 107 achieved SVR (99.1% cure rate).
Conclusion: Our study reported the feasibility and effectiveness of integrating a simplified HCV diagnostic and treatment model in PHCs. Countrywide expansion of this model is warranted to bridge the gaps in the HCV care continuum and ensure high rates of treatment uptake towards achieving elimination targets.
8. Novel approach to near POC testing for HCV RNA; integration of HCV RNA testing into existing near POC machines used in National TB program
Abstract Presented at the International Congress on Infectious Diseases, 2020; Kuala Lumpur, Malaysia
Authors: M. Japaridze1, J. Markby2, R. Ruiz2, I. Khonelidze3, M. Danelia4, I. Gabisonia3, E. Adamia5, S. Shilton2
1FIND, Tbilisi, Georgia; 2FIND, HCV, Geneva, Switzerland; 3NCDC/Global Fund, Global Fund, Tbilisi, Georgia; 4NCDC/Global Fund, TB, Tbilisi, Georgia; 5Ministry of Health, Georgia, State Programs, Tbilisi, Georgia
Background and Aims: Georgia embarked on a hepatitis C (HCV) elimination program in 2015, the program started in a centralized manner and is evolving to providing decentralized HCV care. To facilitate decentralization, the Foundation for Innovative New Diagnostics (FIND) in collaboration with the Georgian government, has introduced and implemented integration of HCV RNA testing on near point of care (POC) nucleic acid testing (NAT) machines currently used for tuberculosis (TB), under the Unitaid-funded, HEAD (Hepatitis Elimination through Access to Diagnostics) Start program.
Method: In order not to interrupt existing service delivery for TB, selection criteria for the integration sites were jointly decided by stakeholders from the Georgian MoH, NCDC, National TB program. Baseline data on TB testing prior to the intervention was collected and at project end the TB testing numbers during the project will be compared with the baseline to assess if the integration of HCV impacted the already established TB testing. Training on the use of the HCV assay was provided to 8 Georgian labs and the testing is monitored via on-line real-time database as well as site support visits.
Results: From March to October 2019 2293 HCV tests were run, of these 2116 tests resulted in a valid result and 177 tests resulted in no result/error/invalid. During the same time period 6, 630 TB tests were run that resulted in a valid result, and 163 TB test run resulted in no result/error/invalid.
Conclusion: Integration of HCV RNA testing using near POC testing in Georgia is feasible and does not appear to negatively impact already established TB testing using those same machines. Multisectoral stakeholder engagement is key to creating an enabling environment for the integration of multi-disease testing to take place. In the Georgian context, as the laboratory technicians were primarily used to conducting testing using the sample type of sputum, additional training for the laboratory technicians on how to correctly handle samples types such as plasma and whole blood is needed to ensure quality testing and low error rates. Integration of HCV testing onto existing machines for TB should be closely monitored in rollout to identify spot training and opportunities for quality improvement.

80
9. Progress towards achieving hepatitis C elimination in the country of Georgia, April 2015–June 2020
Abstract Presented at International Viral Hepatitis Elimination Meeting, 2020; Virtual Event
Authors: Tsertsvadze T1,2, Gamkrelidze A3, Chkhartishvili N1, Abutidze A1,2, Sharvadze L2,4, Kerashvili V1, Butsashvili M5, Metreveli D6, Gvinjilia L7, Shadaker S8, Nasrullah M8, Gabunia T9, Adamia E9, Zeuzem S10, Afdhal N11, Arora S12, Thornton K12, Averhoff F8
1Infectious Diseases, AIDS and Clinical Immunology Research Center, Tbilisi, Georgia, 2Ivane Javakhishvili Tbilisi State University, Tbilisi, Georgia, 3National Center for Disease Control and Public Health, Tbilisi, Georgia, 4Hepatology clinic HEPA, Tbilisi, Georgia, 5Health Research Union, Tbilisi, Georgia, 6Medical Center Mrcheveli, Tbilisi, Georgia, 7TEPHINET, Tbilisi, Georgia, 8Centers for Disease Control and Prevention, Division of Viral Hepatitis National Center for HIV, Hepatitis, STD&TB Prevention, Atlanta, USA, 9Ministry of IDPs from the Occupied Territories, Labour, Health, and Social Affairs of Georgia, Tbilisi, Georgia, 10Goethe University Hospital, Frankfurt, Germany, 11Beth Israel Deaconess Medical Center Liver Center, Boston, USA, 12ECHO Institute University of New Mexico, Albuquerque, USA
Background and Aims: In April 2015 with the technical assistance of U.S. CDC and commitment from Gilead Sciences to donate direct-acting antivirals (DAAs), Georgia launched the world’s first HCV elimination program. Key strategies include nationwide HCV screening, active case finding, linkage to care, decentralized care, provision of treatment for all HCV persons and effective prevention interventions. The elimination program aims at achieving 90-95-95 targets by 2020: a) diagnose 90% of HCV-infected persons, b) treat 95% of those diagnosed, and c) cure 95% of those treated. We report progress towards elimination targets 5 years into the elimination program.
Method: The estimated number of persons living with HCV infection was based on the 2015 population-based national seroprevalence survey, which showed that 5.4% of the adult general population has chronic HCV infection (approximately 150,000 persons). The program collects data on all persons registered with the treatment program. Treatment was provided with Sofosbuvir, Ledipasvir/Sofosbuvir or Velpatasvir/Sofosbuvir-based regimens. Data on persons tested for chronic HCV infection through sustained virologic response (SVR) were extracted as of June 2020. Advanced fibrosis was defined as F≥3 by METAVIR score based on elastography and/or FIB-4 score >3.25.
Results: As of June 30, 2020, a total of 87,626 persons were diagnosed with chronic active HCV infection, representing 58.4% of the estimated 150,000 adults living with HCV. A total of 70,032 (79, 9%) patients initiated treatment – 54.6% of the estimated target population to be treated (128,250). Of the 47,207 patients who were evaluated for SVR, 46,648 (98.8%) tested negative for HCV by PCR, representing 38.3% of the estimated target population to be cured (121,837). Very high cure rates were achieved for all HCV genotypes: 98.9% in genotype 1, 98.9% in genotype 2 and 98.3% in most challenging to treat genotype 3. Treatment effectiveness was comparable among persons with advanced fibrosis (F3 and F4) with 98.2% achieving SVR, and among patients with mild or no liver fibrosis (≤ F2), SVR= 99.1%.
Conclusions: Georgia has made substantial progress towards eliminating hepatitis C, with more than half of persons with HCV infection identified and registered for treatment. Very high cure rates have been achieved among those who received SVR testing. Challenges remain in identifying and especially linking to care persons living with HCV in Georgia. A nationwide integrated, decentralized model of HCV treatment, which is already implemented, will be critical to improving linkage to care and close the gaps in the HCV cascade.
81
10. Simplified HCV treatment model in primary healthcare in the country of Georgia
Abstract Presented at International Viral Hepatitis Elimination Meeting, 2020; Virtual Event
Authors: Dolmazashvili E1,4, Sharvadze L1,3, Abutidze A2,3, Chkhartishvili N2, Adamia E5, Shadaker S6, Nasrullah M6, Arora S7, Thornton K7, Averhoff F6, Tsertsvadze T1,2,3
1Hepatology Clinic HEPA, Tbilisi, Georgia, 2Infectious Diseases, AIDS & Clinical Immunology Research Center, Tbilisi, Georgia, 3Ivane Javakhishvili Tbilisi State University, Tbilisi, Georgia, 4European University, Tbilisi, Georgia, 5Ministry of Labour, Health and Social Affairs of Georgia, Tbilisi, Georgia, 6National Center for HIV, Hepatitis, STD, and TB Prevention; Division of Viral Hepatitis, Centers for Disease Control and Prevention, Atlanta, Georgia, USA, 7University of New Mexico, Albuquerque, New Mexico, USA
Background and Aims: In April 2015, Georgia in partnership with U.S CDC and Gilead Sciences launched the world’s first hepatitis C elimination program. By June 2020, more than 70 thousand persons initiated treatment, achieving >98% cure rates. Patient enrollment in HCV treatment sharply increased in 2016, but since it has been slowing down due to deficiencies in HCV testing and linkage to care. To overcome existing challenges Georgia initiated service decentralization in 2018 by integrating HCV screening and treatment in primary healthcare centers (PHCs).
Method: By June 30, 2020, a total of 11 PHCs provided HCV care services throughout the country. The integrated model was based on a “one-stop shop” approach, by which patients received all HCV screening and care services in selected PHCs. Treatment naïve patients with no or mild fibrosis (FIB-4 score < 1.45) received care at PHCs and underwent examinations as per simplified diagnostic and treatment monitoring algorithm, while persons with FIB-4 score > 1.45 were referred to specialized clinics. Patients received Sofosbuvir/Ledipasvir or Sofosbuvir/Velpatasvir for 12 weeks. Sustained virological response (SVR) was defined as undetectable HCV RNA 12-24 weeks after the end of therapy. The Extension for Community Healthcare Outcomes (ECHO) telemedicine model was utilized to train and support primary healthcare providers. Regular teleECHO videoconferencing was conducted to provide primary care providers with advice and clinical mentoring.
Results: Among persons diagnosed with active HCV infection, 1223 were evaluated for FIB-4 score. Of these, 819 (67%) had FIB-4 score < 1.45; of them 798 (97.4%) initiated treatment. A total of 674 patients completed treatment. Of 536 patients eligible for SVR testing, 438 had been tested at the time of analysis, and 430 achieved SVR (98.2% cure rate).
Conclusion: Our study reported that a simplified HCV diagnostic and treatment model in PHCs significantly enhanced diagnosis and linkage to care for treatment services without compromising the quality. Countrywide expansion of this model will further improve treatment uptake ensuring high cure rates within the national hepatitis C elimination program.
11. The Effect of COVID-19 on the Hepatitis C Screening in Georgia
Abstract Presented at International Viral Hepatitis Elimination Meeting, 2020; Virtual Event
Authors: Tsereteli M1, Turdziladze A1, Getia V1, Aslanikashvili A1, Surguladze S1, Adamia E2, Gamkrelidze A1
1National Center For Disease Control And Public Health Georgia, Tbilisi, Georgia; 2Ministry of Internally Displaced Persons from the Occupied Territories, Labour, Health and Social Affairs of Georgia, Tbilisi, Georgia
82
Background and Aims: Georgia, a country with a population of 3.7 million, has an estimated 150,000 adults living with chronic hepatitis C (HCV) infection. In April 2015, the country initiated the world’s first National Hepatitis C Elimination Program. Within the state elimination program, all HCV-related services, including screening, are covered by the Georgian government and are available to all citizens free of charge. To achieve the 2020 target of diagnosing 90% of HCV-infected persons, the government of Georgia has prioritized resources to increase uptake of screening and diagnosis. The first COVID-19 case was registered on the 26th of February 2020. A number of non-pharmaceutical interventions, including full lockdown throughout the country, were implemented through May 2020. The aim of this analysis is to describe the impact of COVID-19 on the uptake of HCV screening as part of the Georgian Hepatitis C Elimination Program.
Method: This descriptive analysis utilizes data from the national screening registry and treatment databases linked by a unique 11-digit national ID, and the 2020 general population census.
Results: As of July 31, 2020, 1,884,141 adults have been tested for hepatitis C (66.5% of the adult population), of whom 135,206 (7.2%) were anti-HCV positive. Overall, 108,813 individuals received viremia testing, of whom 88,475 (81.3%) were found to have chronic HCV. Screening rates are similar for men and women (65.1% vs. 67.6%, respectively) and are highest among those aged ≥60, 78.6% and 60.7% for men and women, accordingly. This may be explained with the high proportion of hospitalized patients, who are screened for hepatitis C on admission (29.1% of total screenings). Screening rates are lowest among those aged 18-29 (56.1% and 63.1% for men and women, respectively). The overall positivity rate for adult males is 11.5%. The highest positivity rate is seen in men aged 30-59 (16.9%). Among women, the overall positivity rate for adult females is 3.5%. The highest positivity rate is observed in women aged ≥60 (5.1%). In 2019, 38,030-64,613 (mean 49,219) newly screened individuals were registered per month. Monthly rates of newly screened individuals decreased to 12,304-34,647 (mean 26,606) in March – July 2020.
Conclusions: The overall anti-HCV prevalence was highest in males and among those aged 30-59 years. Monthly rates of HCV-screened individuals dropped significantly in 2020 compared to 2019. Observed COVID-19 related reduction in HCV screening uptake will delay progress towards delivery of the Georgian program elimination goals.
12. Self-testing for HCV: Multicountry evidence on usability and acceptability
Abstract Presented at Conference on Retroviruses and Opportunistic Infections, 2021; Virtual Event
Authors: Elena Ivanova Reipold1, Thi Thuy Van Nguyen2, Gamal Shiha3, Ketevan Stvilia4, Aliza MonroeWise5, Cheng Wang6, Muhammad Jamil7, Cheryl C. Johnson7, Philippa Easterbrook7
1Foundation for Innovative New Diagnostics, Geneva, Switzerland, 2World Health Organization, Vietnam Country Office, Hanoi, Viet Nam, 3Mansoura University, Mansoura, Egypt, 4National Center for Disease Control, Tbilisi, Georgia, 5University of Washington, Seattle, WA, USA, 6Guangxi Medical University, Nanning, China, 7World Health Organization, Geneva, Switzerland
Background and Aims: Globally, ≤ 20% of all persons with hepatitis C (HCV) infection have been tested and only one-quarter of diagnosed persons have been treated. Self-testing for HCV antibodies (HCVST) may be an additional strategy to expand access to HCV testing and support elimination efforts. We undertook studies to assess the usability and acceptability of HCVST in the general population as well as key populations: men who have sex with men (MSM) and people who inject drugs (PWID).
83
Method: Observational studies were conducted in five countries: Egypt (general population); China (MSM); Kenya (PWID); Vietnam and Georgia (PWID and MSM). Oral fluid OraQuick® HCV Rapid Antibody Test with Instructions for Use (IFU) adapted for ST was used as a prototype HCVST kit. Participants were provided written and pictorial IFU and then conducted ST in a private room with a trained observer. In Egypt, in addition to IFU, study personnel provided a one-to-one demonstration on how to use the test. Usability was evaluated through observer assessment of errors and difficulties during ST using a standardized checklist; and acceptability using a semistructured questionnaire. HCVST results were read and interpreted by participants and then re-read by the observer. All participants were re-tested with a professional use OraQuick® HCV Test performed by a trained provider.
Results: A total of 775 participants were enrolled across five studies. Participants completing all testing steps without any mistakes were greatest in Egypt and Georgia (>70%), and lowest in PWID from Kenya (30%) and Vietnam (46%). The most common error was incorrect sample collection. Inter-reader agreement ranged from 86% to 99%, and inter-operator agreement from 85% to 99%. The majority of PWID from Vietnam and Kenya required assistance in performing HCVST. The proportion of participants who found the kit very easy or easy to conduct ranged from 55% in Egypt and 66% in Kenya, to more than 80% in other countries. Acceptability was high with > 90% of participants in four countries willing to use HCVST again and who would recommend it to family and friends.
Conclusion: These are the first studies globally to demonstrate high usability and acceptability of HCVST in both general and key populations. While most users self-tested with ease, assisted self-testing models are needed for some populations such as PWID. HCVST is an important strategy for further consideration as it may be a promising tool for increasing coverage and achieving elimination goals.
13. Innovative linkage model to re-engage lost-to-follow-up individuals in The National Hepatitis C Elimination Program of Georgia
Abstract Presented at EASL International Liver Congress, 2021; Virtual Event
Authors: Amiran Gamkrelidze1, Alexander Turdziladze1, Maia Tsreteli1, Vladimer Getia1, Ana Aslanikashvili1, Lia Gvinjilia2, Tinatin Kuchuloria2, Irina Tskhomelidze2, Shaun Shadaker3, Paige A. Armstrong3, Maia Japaridze4, Sonjelle Shilton4
1National Center for Disease Control and Public Health Georgia, Tbilisi, Georgia; 2The Task Force for Global Health, Tbilisi, Georgia; 3National Center for HIV/AIDS, Viral Hepatitis, STD and TB Prevention, CDC, Division of Viral Hepatitis, Atlanta, United States; 4Foundation for Innovative New Diagnostics, Switzerland
Background and Aims: In 2015, Georgia launched a national hepatitis C virus (HCV) elimination program with the goal of reducing the country’s HCV prevalence by 90%. By implementing systematic screening, and expanding harm reduction services and diagnostic capacity, 72% of the adult population had been screened for HCV by the end of 2020. However, referral of anti-HCV positive individuals for viremia testing, and subsequent enrollment in the treatment program, remains a challenge. In 2019, the National Center for Disease Control and Public Health partnered with the Foundation for Innovative New Diagnostics (FIND) to pilot a project to promote linkage to care for individuals who screened positive for HCV antibody (anti-HCV) but did not receive a viremia test.
84
Method: Anti-HCV-positive individuals lost-to-follow-up residing in the 5 largest regions in Georgia were included in the pilot. Individuals with no documented viremia test results were randomly selected from the national database. Selected individuals were located and counseled via phone or home visit by trained epidemiologists and primary healthcare physicians and referred to an HCV care and treatment facility. If the first attempt was unsuccessful, one repeat attempt was made to contact the individual. Incentives were provided to the regional health personnel for each patient that was successfully linked to care, defined as anyone who presented for viremia testing.
Results: In December 2019, out of 7, 130 antibody-positive persons without viremia testing, a total of 5, 313 (75%) were followed-up, of which 3, 859 (73%) were reached. The remaining could not be reached, had moved, or emigrated. Of those contacted, 2, 972 (77%) presented for viremia testing, of whom 1, 685 (57%) were positive for HCV RNA or core antigen. Overall, 887 (53%) persons with chronic HCV infection were linked to care and enrolled in the HCV treatment program, which differed geographically; 46% of persons from urban areas were enrolled, compared to 57% of those in rural areas.
Conclusion: As Georgia nears elimination goals, ensuring all patients who screen positive for anti-HCV are linked to care is increasingly important. This pilot demonstrates the effectiveness of incentive-based active case follow-up. The project also demonstrates that individuals considered lost-to-follow-up can be re-engaged in HCV care. Lessons learned from this project are particularly relevant during the COVID-19 pandemic, when disruptions of care can compromise progress toward hepatitis elimination.
14. Progress towards achieving hepatitis C elimination in the country of Georgia, April 2015–December 2020
Abstract Presented at EASL International Liver Congress, 2021; Virtual Event
Authors: Tengiz Tsertsvadze1,2, Amiran Gamkrelidze3, Nikoloz Chkhartishvili1, Akaki Abutidze1,2, Lali Sharvadze2,4, Vakhtang Kerashvili1, Maia Butsashvili5, David Metreveli6, Lia Gvinjilia7, Shaun Shadaker8, Tamar Gabunia9, Ekaterine Adamia9, Stefan Zeuzem10, Nezam Afdhal11, Sanjeev Arora12, Karla Thornton12, Francisco Averhoff8, Paige A. Armstrong8
1Infectious Diseases, AIDS and Clinical Immunology Research Center, Tbilisi, Georgia; 2Ivane Javakhishvili Tbilisi State University, Tbilisi, Georgia; 3National Center for Disease Control and Public Health, Tbilisi, Georgia; 4Hepatology clinic HEPA, Tbilisi, Georgia; 5Health Research Union, Tbilisi, Georgia; 6Medical Center Mrcheveli, Tbilisi, Georgia; 7TEPHINET, Tbilisi, Georgia; 8Centers for Disease Control and Prevention, Division of Viral Hepatitis National Center for HIV, Hepatitis, STD&TB Prevention, Atlanta, USA; 9Ministry of Labour, Health and Social Affairs of Georgia, Tbilisi, Georgia; 10Goethe University Hospital, Frankfurt, Germany; 11Beth Israel Deaconess Medical Center Liver Center, Boston, USA; 12University of New Mexico, Albuquerque, USA
Background and Aims: In April 2015, with the technical assistance of the U.S. CDC and commitment from Gilead Sciences to donate direct-acting antivirals (DAAs), Georgia launched the world’s first HCV elimination program. Key strategies include nationwide HCV screening, active case finding, linkage to care, decentralized care, provision of treatment for all HCV persons, and effective prevention interventions. The initial goal of the program was to achieve the following targets by 2020: a) diagnose 90% of HCV-infected persons, b) treat 95% of those diagnosed, and c) cure 95% of those treated. We report progress towards elimination targets 5 years into the elimination program.
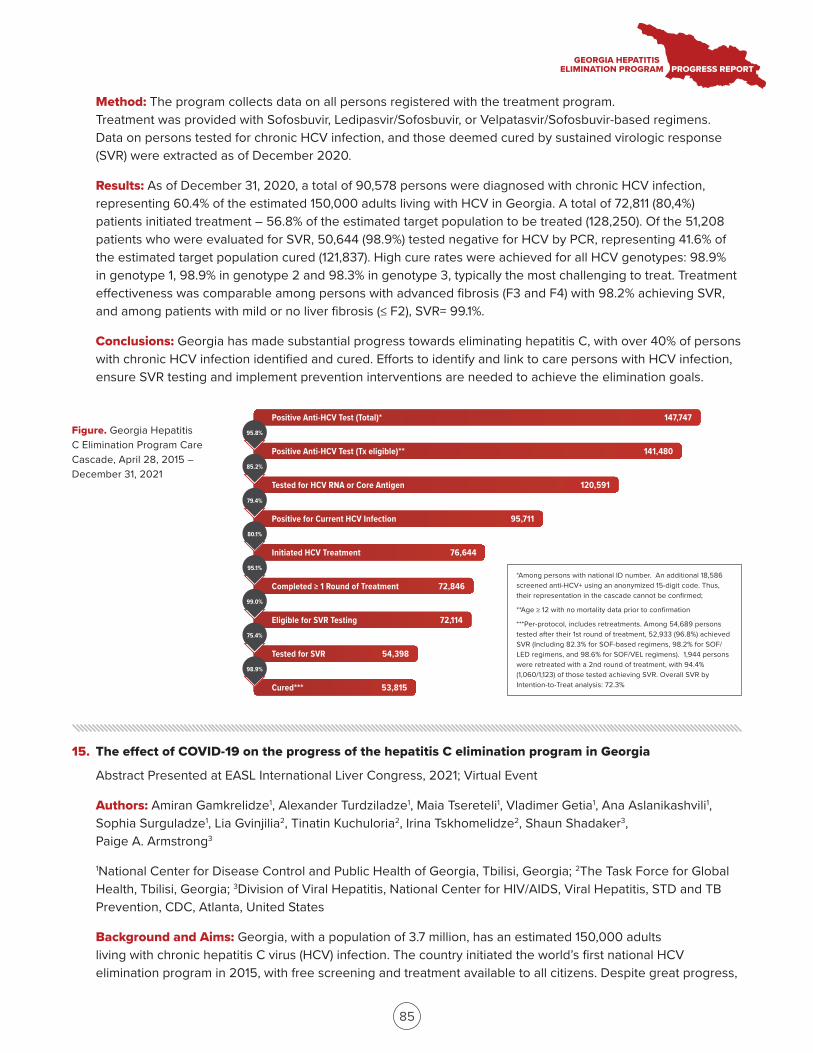
Positive Anti-HCV Test (Total)*
Positive Anti-HCV Test (Tx eligible)**
Tested for HCV RNA or Core Antigen
Positive for Current HCV Infection
Initiated HCV Treatment
Completed ≥ 1 Round of Treatment
Eligible for SVR Testing
Tested for SVR
Cured***
147,747
141,480
120,591
95,711
76,644
72,846
72,114
54,398
53,815
95.8%
85.2%
79.4%
80.1%
95.1%
99.0%
75.4%
98.9%
*Among persons with national ID number. An additional 18,586 screened anti-HCV+ using an anonymized 15-digit code. Thus, their representation in the cascade cannot be confirmed;
**Age ≥ 12 with no mortality data prior to confirmation
***Per-protocol, includes retreatments. Among 54,689 persons tested after their 1st round of treatment, 52,933 (96.8%) achieved SVR (Including 82.3% for SOF-based regimens, 98.2% for SOF/LED regimens, and 98.6% for SOF/VEL regimens). 1,944 persons were retreated with a 2nd round of treatment, with 94.4% (1,060/1,123) of those tested achieving SVR. Overall SVR by Intention-to-Treat analysis: 72.3%
85
Method: The program collects data on all persons registered with the treatment program. Treatment was provided with Sofosbuvir, Ledipasvir/Sofosbuvir, or Velpatasvir/Sofosbuvir-based regimens. Data on persons tested for chronic HCV infection, and those deemed cured by sustained virologic response (SVR) were extracted as of December 2020.
Results: As of December 31, 2020, a total of 90,578 persons were diagnosed with chronic HCV infection, representing 60.4% of the estimated 150,000 adults living with HCV in Georgia. A total of 72,811 (80,4%) patients initiated treatment – 56.8% of the estimated target population to be treated (128,250). Of the 51,208 patients who were evaluated for SVR, 50,644 (98.9%) tested negative for HCV by PCR, representing 41.6% of the estimated target population cured (121,837). High cure rates were achieved for all HCV genotypes: 98.9% in genotype 1, 98.9% in genotype 2 and 98.3% in genotype 3, typically the most challenging to treat. Treatment effectiveness was comparable among persons with advanced fibrosis (F3 and F4) with 98.2% achieving SVR, and among patients with mild or no liver fibrosis (≤ F2), SVR= 99.1%.
Conclusions: Georgia has made substantial progress towards eliminating hepatitis C, with over 40% of persons with chronic HCV infection identified and cured. Efforts to identify and link to care persons with HCV infection, ensure SVR testing and implement prevention interventions are needed to achieve the elimination goals.
Figure. Georgia Hepatitis C Elimination Program Care Cascade, April 28, 2015 – December 31, 2021
15. The effect of COVID-19 on the progress of the hepatitis C elimination program in Georgia
Abstract Presented at EASL International Liver Congress, 2021; Virtual Event
Authors: Amiran Gamkrelidze1, Alexander Turdziladze1, Maia Tsereteli1, Vladimer Getia1, Ana Aslanikashvili1, Sophia Surguladze1, Lia Gvinjilia2, Tinatin Kuchuloria2, Irina Tskhomelidze2, Shaun Shadaker3, Paige A. Armstrong3
1National Center for Disease Control and Public Health of Georgia, Tbilisi, Georgia; 2The Task Force for Global Health, Tbilisi, Georgia; 3Division of Viral Hepatitis, National Center for HIV/AIDS, Viral Hepatitis, STD and TB Prevention, CDC, Atlanta, United States
Background and Aims: Georgia, with a population of 3.7 million, has an estimated 150,000 adults living with chronic hepatitis C virus (HCV) infection. The country initiated the world’s first national HCV elimination program in 2015, with free screening and treatment available to all citizens. Despite great progress,
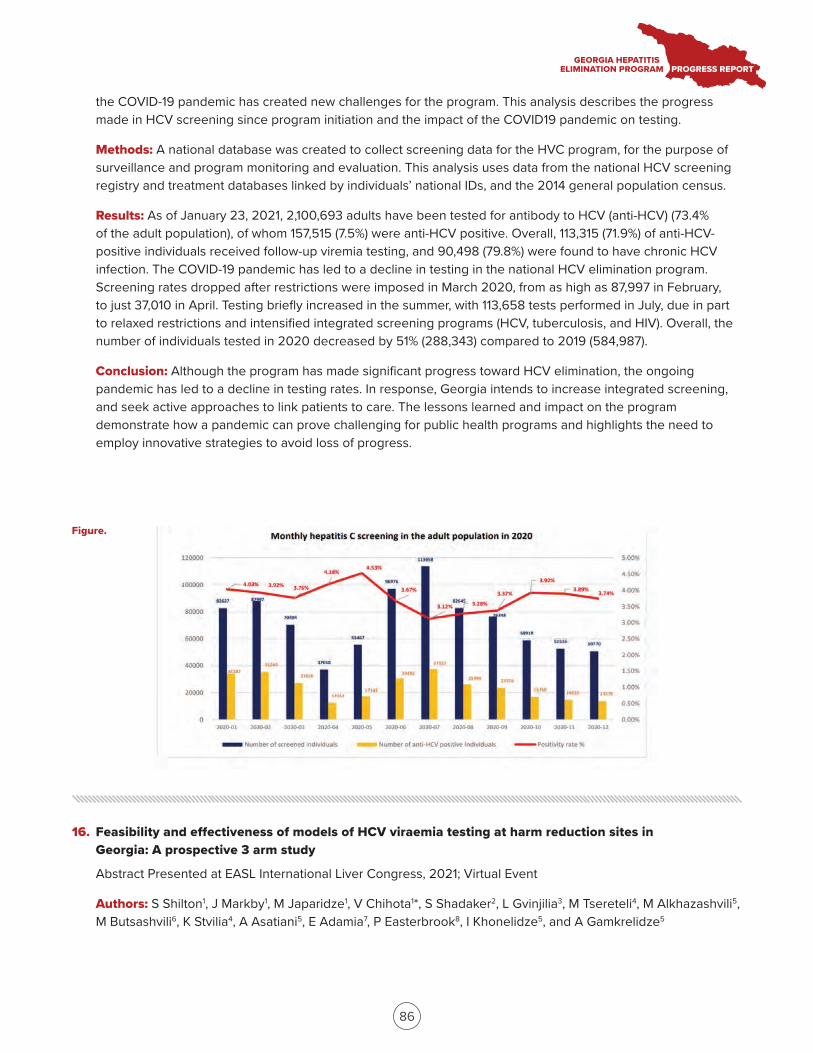
86
the COVID-19 pandemic has created new challenges for the program. This analysis describes the progress made in HCV screening since program initiation and the impact of the COVID19 pandemic on testing.
Methods: A national database was created to collect screening data for the HVC program, for the purpose of surveillance and program monitoring and evaluation. This analysis uses data from the national HCV screening registry and treatment databases linked by individuals’ national IDs, and the 2014 general population census.
Results: As of January 23, 2021, 2,100,693 adults have been tested for antibody to HCV (anti-HCV) (73.4% of the adult population), of whom 157,515 (7.5%) were anti-HCV positive. Overall, 113,315 (71.9%) of anti-HCV-positive individuals received follow-up viremia testing, and 90,498 (79.8%) were found to have chronic HCV infection. The COVID-19 pandemic has led to a decline in testing in the national HCV elimination program. Screening rates dropped after restrictions were imposed in March 2020, from as high as 87,997 in February, to just 37,010 in April. Testing briefly increased in the summer, with 113,658 tests performed in July, due in part to relaxed restrictions and intensified integrated screening programs (HCV, tuberculosis, and HIV). Overall, the number of individuals tested in 2020 decreased by 51% (288,343) compared to 2019 (584,987).
Conclusion: Although the program has made significant progress toward HCV elimination, the ongoing pandemic has led to a decline in testing rates. In response, Georgia intends to increase integrated screening, and seek active approaches to link patients to care. The lessons learned and impact on the program demonstrate how a pandemic can prove challenging for public health programs and highlights the need to employ innovative strategies to avoid loss of progress.
16. Feasibility and effectiveness of models of HCV viraemia testing at harm reduction sites in Georgia: A prospective 3 arm study
Abstract Presented at EASL International Liver Congress, 2021; Virtual Event
Authors: S Shilton1, J Markby1, M Japaridze1, V Chihota1*, S Shadaker2, L Gvinjilia3, M Tsereteli4, M Alkhazashvili5, M Butsashvili6, K Stvilia4, A Asatiani5, E Adamia7, P Easterbrook8, I Khonelidze5, and A Gamkrelidze5
Figure.
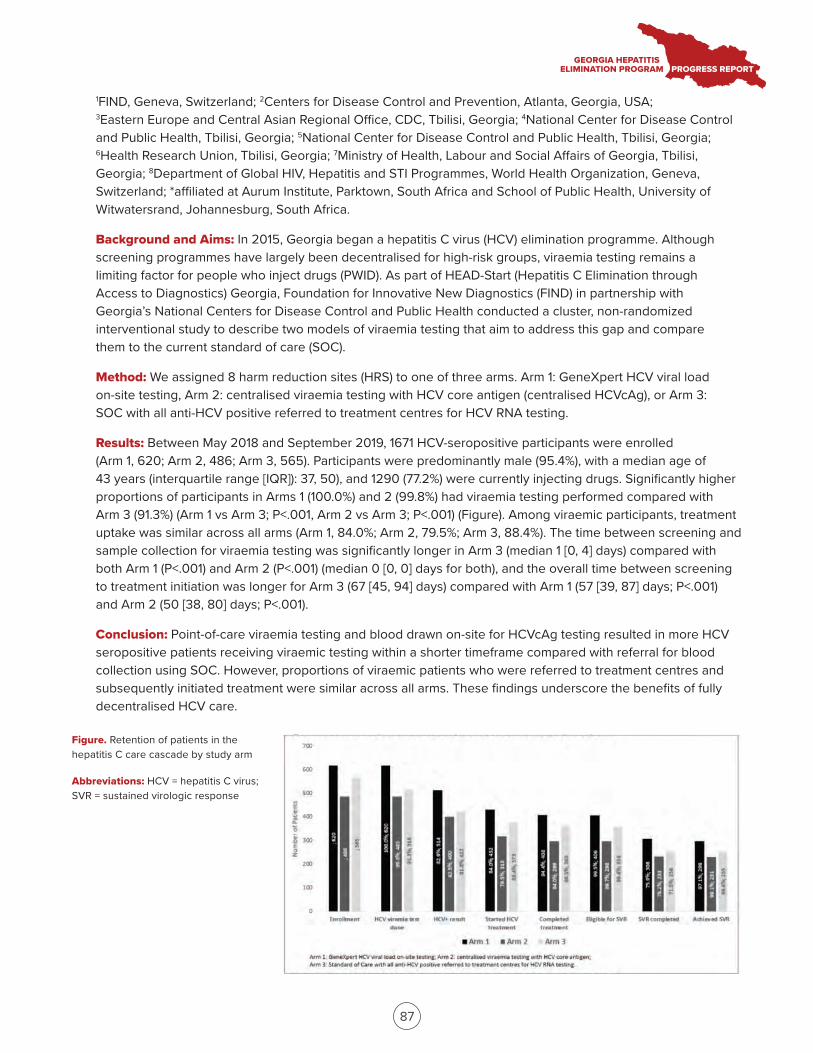
87
1FIND, Geneva, Switzerland; 2Centers for Disease Control and Prevention, Atlanta, Georgia, USA; 3Eastern Europe and Central Asian Regional Office, CDC, Tbilisi, Georgia; 4National Center for Disease Control and Public Health, Tbilisi, Georgia; 5National Center for Disease Control and Public Health, Tbilisi, Georgia; 6Health Research Union, Tbilisi, Georgia; 7Ministry of Health, Labour and Social Affairs of Georgia, Tbilisi, Georgia; 8Department of Global HIV, Hepatitis and STI Programmes, World Health Organization, Geneva, Switzerland; *affiliated at Aurum Institute, Parktown, South Africa and School of Public Health, University of Witwatersrand, Johannesburg, South Africa.
Background and Aims: In 2015, Georgia began a hepatitis C virus (HCV) elimination programme. Although screening programmes have largely been decentralised for high-risk groups, viraemia testing remains a limiting factor for people who inject drugs (PWID). As part of HEAD-Start (Hepatitis C Elimination through Access to Diagnostics) Georgia, Foundation for Innovative New Diagnostics (FIND) in partnership with Georgia’s National Centers for Disease Control and Public Health conducted a cluster, non-randomized interventional study to describe two models of viraemia testing that aim to address this gap and compare them to the current standard of care (SOC).
Method: We assigned 8 harm reduction sites (HRS) to one of three arms. Arm 1: GeneXpert HCV viral load on-site testing, Arm 2: centralised viraemia testing with HCV core antigen (centralised HCVcAg), or Arm 3: SOC with all anti-HCV positive referred to treatment centres for HCV RNA testing.
Results: Between May 2018 and September 2019, 1671 HCV-seropositive participants were enrolled (Arm 1, 620; Arm 2, 486; Arm 3, 565). Participants were predominantly male (95.4%), with a median age of 43 years (interquartile range [IQR]): 37, 50), and 1290 (77.2%) were currently injecting drugs. Significantly higher proportions of participants in Arms 1 (100.0%) and 2 (99.8%) had viraemia testing performed compared with Arm 3 (91.3%) (Arm 1 vs Arm 3; P<.001, Arm 2 vs Arm 3; P<.001) (Figure). Among viraemic participants, treatment uptake was similar across all arms (Arm 1, 84.0%; Arm 2, 79.5%; Arm 3, 88.4%). The time between screening and sample collection for viraemia testing was significantly longer in Arm 3 (median 1 [0, 4] days) compared with both Arm 1 (P<.001) and Arm 2 (P<.001) (median 0 [0, 0] days for both), and the overall time between screening to treatment initiation was longer for Arm 3 (67 [45, 94] days) compared with Arm 1 (57 [39, 87] days; P<.001) and Arm 2 (50 [38, 80] days; P<.001).
Conclusion: Point-of-care viraemia testing and blood drawn on-site for HCVcAg testing resulted in more HCV seropositive patients receiving viraemic testing within a shorter timeframe compared with referral for blood collection using SOC. However, proportions of viraemic patients who were referred to treatment centres and subsequently initiated treatment were similar across all arms. These findings underscore the benefits of fully decentralised HCV care.
Figure. Retention of patients in the hepatitis C care cascade by study arm
Abbreviations: HCV = hepatitis C virus; SVR = sustained virologic response
88
17. Evaluation of alcohol use behavior among patients cured in Georgia’s HCV elimination program (preliminary results)
Abstract Presented at Global Hepatitis Summit, 2021; Taipei, Taiwan
Authors: Maia Butsashvili1, George Kamkamidze1, Lasha Gulbiani1, Lia Gvinjilia2, Tinatin Kuchuloria2, Irina Tskhomelidze2, Shaun Shadaker3, Paige A. Armstrong3
1Health research union/Clinic Neolab, Tbilisi, Georgia; 2The Task Force for Global Health, Tbilisi, Georgia; 3Division of Viral Hepatitis, National Center for HIV/AIDS, Viral Hepatitis, STD and TB Prevention, CDC
Background and Aims: Georgia has one of the highest rates of wine consumption in the world. Combined with a high prevalence of chronic HCV infection, the synergistic effects can lead to worse liver-related outcomes. There is no data on the role of alcohol consumption on progression of liver disease among hepatitis C virus (HCV) patients in the country. This study evaluates alcohol consumption behaviors among patients in the HCV program.
Method: An interviewer-administered questionnaire was used to collect data on demographic, clinical, and drinking behavior. Patients were enrolled from three clinics, one in Tbilisi and two in other large cities in Georgia. Participants were then randomly selected from the list of patients treated with direct-acting antivirals (DAAs), and who subsequently achieved SVR. Data on baseline and post-treatment fibrosis levels (measured by FIB4 score or liver elastography) were abstracted to evaluate the association of alcohol use with liver fibrosis progression.
Results: As of December 2020, 256 patients were enrolled in the study. Of those, 11.1% were ≤35 years old, 81.7% were male, 98.4% were Georgian, 69.8% were married, 38.9% had a university degree, and 61.5% were employed. The majority of participants (93.7%) report ever using alcohol in their lifetime, and 10.3% consider themselves heavy drinkers. Nearly all (94.1%) people knew that heavy alcohol consumption can accelerate the development of liver fibrosis, and 97.5% abstained from alcohol during treatment. Among those, 75.7% resumed drinking after achieving SVR. More than half (52.1%) of the patients felt moderate alcohol intake is normal for those with low fibrosis scores. And only 12.8% of patients thought drinking is unacceptable among people with HCV infection. In a bivariate analysis, patients who abstained from alcohol after achieving SVR were 4 times more likely to have improvement in liver fibrosis compared to those who resumed drinking (29.5% vs 7.4%, respectively; p <0.02).
Conclusion: Drinking alcohol is common in Georgia, and a high proportion of people in the HCV treatment program consume alcohol. Abstaining from alcohol is advantageous to improvement in fibrosis, even after SVR has been achieved. However, a majority of patients with HCV infection do not drink alcohol during treatment, but resume drinking after achieving SVR. The findings present an opportunity to focus messaging and education for patients during DAA treatment to improve outcomes even after completion of treatment.
18. Improvement in liver fibrosis among patients with Hepatitis C who achieved sustained virologic response after direct acting antivirals treatment in Georgia (preliminary results)
Abstract Presented at Global Hepatitis Summit, 2021; Taipei, Taiwan
Authors: M.Kajaia1, M. Butsashvili1, G. Kamkamidze1, D. Metreveli3, L. Gvinjilia2, T. Kuchuloria2, A. Gamkrelidze6, M. Zakalashvili3, E. Dolmazashvili5, V. Kerashvili4, PA. Armstrong7
89
1Health Research Union/Clinic NEOLAB, 2CDC Foundation, 3Medical Center Mrcheveli, 4Infectious Diseases, AIDS and Clinical Immunology Research Center, 5Clinic HEPA, 6National Center for Disease Control and Public Health, Tbilisi, Georgia, 7Division of Viral Hepatitis, National Center for HIV/AIDS, Viral Hepatitis, STD and TB Prevention, CDC, Atlanta, United States, 8Global Disease Detection, Division of Global Health Protection, South Caucasus CDC Office, Tbilisi, Georgia
Background and Aim: In 2015, Georgia launched a national HCV elimination program. This study assesses changes in liver stiffness, biochemical, and clinical parameters in a cohort of HCV-infected patients with advanced liver fibrosis who were enrolled in the HCV elimination program and achieved SVR after treatment with DAAs.
Method: The study cohort included patients ≥18 years with advanced liver fibrosis level by elastography (≥F3) or FIB4 score >3.25, who were treated with DAAs and achieved SVR at 12–24 weeks post-treatment. A random sample was selected from clinics providing care and treatment to HCV patients. Baseline data (prior to initiating treatment) were abstracted from patients’ medical records. Follow-up laboratory and clinical measures were collected at 4 years posttreatment.
Results: A total of 600 patients were included in the study. At 4 years post-treatment, mean liver stiffness decreased from 23.7 kPa to 11.3 kPa (p< .0001). Mean difference in FIB-4 score was 1.6 (from 3.52 to 1.92) (p< .0001). Mean ALT level decreased from 111.9 to 28.2 (p< .0001) and mean AST level from 89.6 to 26.7 (p< .0001). Platelet count increased from 159,200 to 190,500/µL (p< .0001). Hemoglobin levels increased by a mean of 0.3 g/dL (p= .039), and spleen length and width decreased by mean of 4.3 mm (p= .004) and 3.1 mm (p< .0001), respectively. Among patients with ascites at baseline (n=17), 11 (64.7%) experienced resolution; for the majority (n=583) without ascites at baseline, 10 (1.7%) developed ascites during follow-up period. Four patients developed HCC between baseline and 4-year follow up visit.
Conclusion: Among patients with liver fibrosis, treatment with DAAs affords significant improvement in nearly all diagnostic markers, and can lead to resolution of clinical symptoms of decompensated liver failure.
19. Management of hepatitis C in primary healthcare in the country of Georgia
Abstract Presented at Global Hepatitis Summit, 2021; Taipei, Taiwan
Authors: Tengiz Tsertsvadze1,2, Amiran Gamkrelidze3, Nikoloz Chkhartishvili1, Akaki Abutidze1,2, Lali Sharvadze2,4, Vakhtang Kerashvili1, Maia Butsashvili5, David Metreveli6, Tinatin Kuchuloria7, Lia Gvinjilia7, Shaun Shadaker8, Tamar Gabunia9, Ekaterine Adamia9, Stefan Zeuzem10, Nezam Afdhal11, Sanjeev Arora12, Karla Thornton12, Francisco Averhoff8, Paige A. Armstrong8
1Infectious Diseases, AIDS and Clinical Immunology Research Center, Tbilisi, Georgia; 2Ivane Javakhishvili Tbilisi State University, Tbilisi, Georgia; 3National Center for Disease Control and Public Health, Tbilisi, Georgia; 4Hepatology clinic HEPA, Tbilisi, Georgia; 5Health Research Union, Tbilisi, Georgia; 6Medical Center Mrcheveli, Tbilisi, Georgia; 7The Task Force for Global Health, Tbilisi, Georgia; 8Centers for Disease Control and Prevention, Division of Viral Hepatitis National Center for HIV, Hepatitis, STD&TB Prevention, Atlanta, USA; 9Ministry of Labour, Health and Social Affairs of Georgia, Tbilisi, Georgia; 10Goethe University Hospital, Frankfurt, Germany; 11Beth Israel Deaconess Medical Center Liver Center, Boston, USA; 12University of New Mexico, Albuquerque, USA
90
Background and Aims: In April 2015, through a partnership with Gilead Sciences and technical assistance from U.S. CDC, Georgia launched the world’s first hepatitis C elimination program. By December 31, 2020, more than 72,000 persons initiated treatment with >98% reporting sustained virologic response (SVR) cure. Broad access to direct acting antivirals (DAAs) resulted in rapid increase in treatment uptake in 2016, which has since declined due to barriers in diagnosis and linkage to care. To address this issue Georgia initiated service decentralization in 2018 by integrating hepatitis C virus (HCV) screening and treatment in primary healthcare centers (PHCs). We report preliminary results of an integrated model of HCV care in PHCs from August 2018 through June 2020.
Method: By June 30 2020, a total of 10 PHCs provided HCV care services throughout the country. The integrated model was based on a single-location delivery model, by which patients received all HCV screening, treatment and care services at a PHC. PHCs provided care to HCV treatment-naïve patients with no or mild fibrosis (FIB-4 score<1.45) using simplified diagnostics and a treatment monitoring approach, while persons with advanced liver fibrosis/cirrhosis were referred to specialized clinics. Patients received Sofosbuvir/Ledipasvir and/or Sofosbuvir/Velpatasvir for 12 weeks. SVR was defined as undetectable HCV RNA 12-24 weeks after end of therapy. The Extension for Community Healthcare Outcomes (ECHO) telemedicine model was utilized to train and support primary healthcare providers. Regular teleECHO videoconferencing was conducted to provide primary care providers with advice and clinical mentoring.
Results: Among persons diagnosed with active HCV infection, 1,223 were evaluated for FIB-4 score. Of these, 819 (66.9%) had FIB4 score<1.45 and qualified for treatment at a PHC; of them 798 (97.4%) initiated treatment, and 674 (85%) of those who initiated treatment completed it. Of 536 patients within the 12-24 week window of SVR eligibility, 438 had been tested at the time of analysis, and 427 achieved SVR (97.5% cure rate).
Conclusion: Our study reported the feasibility and effectiveness of integrating a simplified HCV diagnostic and treatment model in PHCs. Countrywide expansion of this model is warranted to bridge the gaps in the HCV care continuum and ensure high rates of treatment uptake towards achieving elimination targets.
20. Association of treated and untreated chronic hepatitis C with the incidence of tuberculosis: A population-based cohort study in the country of Georgia
Abstract Presented at The Liver Meeting- American Association for the Study of Liver Diseases, 2021; Virtual Event
Authors: Davit Baliashvili1, Neel R. Gandhi1,2, David Benkeser3, Russell R. Kempker2, Shaun Shadaker4, Francisco Averhoff5, Lia Gvinjilia6, Natalia Adamashvili7, Giorgi Kamkamidze8, Mamuka Zakalashvili9, Tengiz Tsertsvadze10, Lali Sharvadze11, Mamuka Chincharauli12, Nestan Tukvadze12, Henry M. Blumberg1,2
1Department of Epidemiology, Emory University Rollins School of Public Health, Atlanta, GA, USA; 2Division of Infectious Diseases, Department of Medicine, Emory University School of Medicine, Atlanta, GA, USA; 3Department of Biostatistics and Bioinformatics, Emory University Rollins School of Public Health, Atlanta, GA, USA; 4Division of Viral Hepatitis, Centers for Disease Control and Prevention, Atlanta, GA, USA; 5Department of Family and Preventive Medicine, Emory University School of Medicine; 6Eastern Europe and Central Asia Regional Office, Centers for Disease Control and Prevention, Tbilisi, Georgia; 7National Center for Disease Control and Public Health, Tbilisi, Georgia; 8Health Research Union, Tbilisi, Georgia; 9Clinic “Mrcheveli”, Tbilisi, Georgia; 10Infectious Diseases, AIDS and Clinical Immunology Research Center, Tbilisi, Georgia; 11Clinic “Hepa”, Tbilisi, Georgia; 12National Center for Tuberculosis and Lung Diseases, Tbilisi, Georgia.
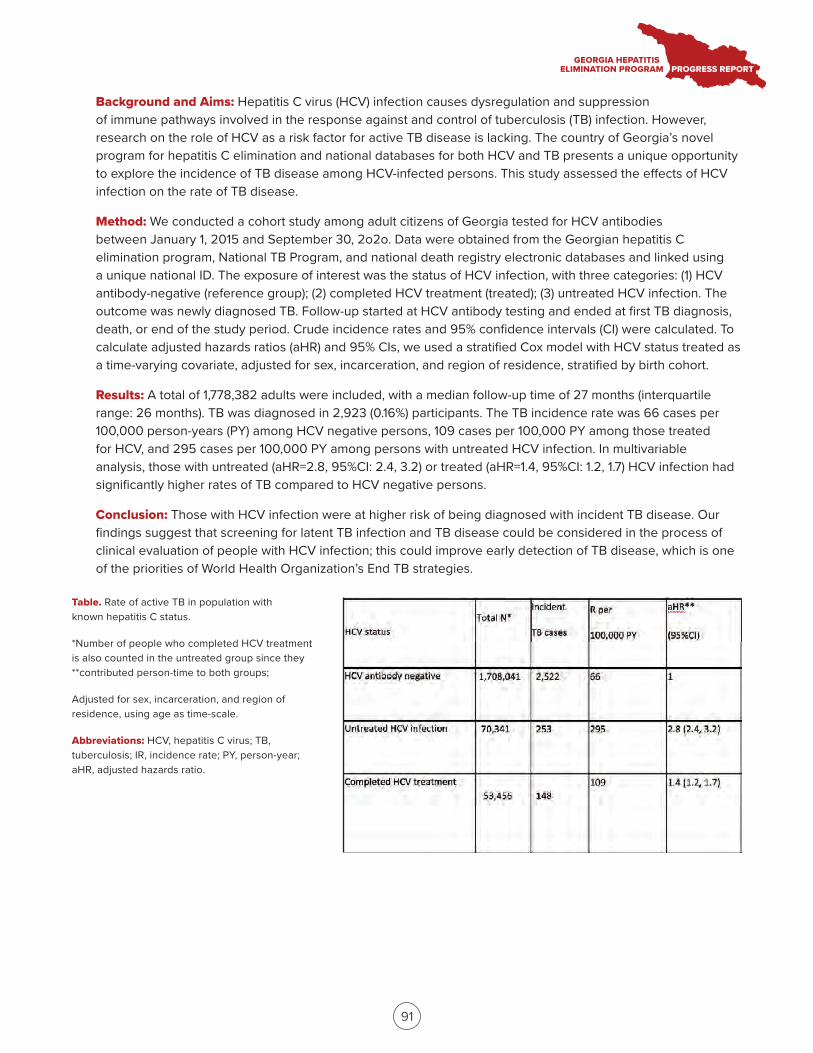
91
Background and Aims: Hepatitis C virus (HCV) infection causes dysregulation and suppression of immune pathways involved in the response against and control of tuberculosis (TB) infection. However, research on the role of HCV as a risk factor for active TB disease is lacking. The country of Georgia’s novel program for hepatitis C elimination and national databases for both HCV and TB presents a unique opportunity to explore the incidence of TB disease among HCV-infected persons. This study assessed the effects of HCV infection on the rate of TB disease.
Method: We conducted a cohort study among adult citizens of Georgia tested for HCV antibodies between January 1, 2015 and September 30, 2o2o. Data were obtained from the Georgian hepatitis C elimination program, National TB Program, and national death registry electronic databases and linked using a unique national ID. The exposure of interest was the status of HCV infection, with three categories: (1) HCV antibody-negative (reference group); (2) completed HCV treatment (treated); (3) untreated HCV infection. The outcome was newly diagnosed TB. Follow-up started at HCV antibody testing and ended at first TB diagnosis, death, or end of the study period. Crude incidence rates and 95% confidence intervals (CI) were calculated. To calculate adjusted hazards ratios (aHR) and 95% CIs, we used a stratified Cox model with HCV status treated as a time-varying covariate, adjusted for sex, incarceration, and region of residence, stratified by birth cohort.
Results: A total of 1,778,382 adults were included, with a median follow-up time of 27 months (interquartile range: 26 months). TB was diagnosed in 2,923 (0.16%) participants. The TB incidence rate was 66 cases per 100,000 person-years (PY) among HCV negative persons, 109 cases per 100,000 PY among those treated for HCV, and 295 cases per 100,000 PY among persons with untreated HCV infection. In multivariable analysis, those with untreated (aHR=2.8, 95%CI: 2.4, 3.2) or treated (aHR=1.4, 95%CI: 1.2, 1.7) HCV infection had significantly higher rates of TB compared to HCV negative persons.
Conclusion: Those with HCV infection were at higher risk of being diagnosed with incident TB disease. Our findings suggest that screening for latent TB infection and TB disease could be considered in the process of clinical evaluation of people with HCV infection; this could improve early detection of TB disease, which is one of the priorities of World Health Organization’s End TB strategies.
Table. Rate of active TB in population with known hepatitis C status.
*Number of people who completed HCV treatment is also counted in the untreated group since they **contributed person-time to both groups;
Adjusted for sex, incarceration, and region of residence, using age as time-scale.
Abbreviations: HCV, hepatitis C virus; TB, tuberculosis; IR, incidence rate; PY, person-year; aHR, adjusted hazards ratio.
HCV status Total N*
Incident
TB cases
R per
100,000 PY
aHR**
(95%CI)
HCV antibody negative 1,708,041 2,522 66 1
Untreated HCV infection 70,341 253 295 2.8 (2.4, 3.2)
Completed HCV treatment 53,456 148
109 1.4 (1.2, 1.7)
92
21. The effect of COVID-19 on the progress of the hepatitis C elimination program in Georgia
Abstract Presented at International Viral Hepatitis Elimination Meeting, 2021; Virtual Event
Authors: Amiran Gamkrelidze1, Alexander Turdziladze1, Maia Tsreteli1, Vladimer Getia1, Ana Aslanikashvili1, Sophia Surguladze1, Lia Gvinjilia2, Tinatin Kuchuloria2, Irina Tskhomelidze2, Shaun Shadaker3, Paige A Armstrong3
1National Center for Disease Control and Public Health Georgia, Tbilisi, Georgia; 2The Task Force for Global Health, Tbilisi, Georgia; 3National Center for HIV/AIDS, Viral Hepatitis, STD and TB Prevention, CDC, Division of Viral Hepatitis, Atlanta, United States
Background and Aims: Georgia, with a population of 3.7 million, has an estimated 150,000 adults living with chronic hepatitis C virus (HCV) infection. The country initiated the world’s first national HCV elimination program in 2015, with free screening and treatment available to all citizens. Despite great progress, the COVID-19 pandemic has created new challenges for the program. This analysis describes the progress made in HCV screening since program initiation and the impact of the COVID-19 pandemic on testing.
Method: A national database was created to collect screening data for the HCV program, for the purpose of surveillance and program monitoring and evaluation. This analysis uses data from the national HCV screening registry and treatment databases linked by individuals’ national IDs, and the 2014 general population census.
Results: As of August 30, 2021, 2,220,000 adults have been tested for antibody to HCV (anti-HCV) (77.6% of the adult population), of whom 162,657 (7.3%) were anti-HCV positive. Overall, 118,400 (72.8%) of anti-HCV-positive individuals received follow-up viremia testing, and 93,839 (79.3%) were found to have chronic HCV infection. The COVID-19 pandemic led to a decline in testing in the national HCV elimination program. Screening rates dropped after restrictions were imposed in March 2020, from as high as 87,997 in February, to just 37,010 in April. Testing briefly increased in the summer, with 113,658 tests performed in July, due in part to relaxed restrictions and intensified integrated screening programs (HCV, tuberculosis, and HIV). Overall, the number of individuals tested in 2020 decreased by 51% (288,343) compared to 2019 (584,987). During January−August 2021, total number of persons screened is lower than the same eight-month period in 2020 (433,907 versus 552,593).
Conclusion: Although the program has made significant progress toward HCV elimination, the ongoing pandemic has led to a decline in testing rates, with numbers continuing to decline in 2021. In response, Georgia intends to increase integrated screening, and seek active approaches to link patients to care. The lessons learned and impact on the program demonstrate how a pandemic can prove challenging for public health programs, and highlights the need to employ innovative strategies to avoid loss of progress.
22. HCV-Attributable liver cancer in the country of Georgia: Analysis of cases from the Georgian Cancer Registry, 2015-2019
Abstract Presented at International Viral Hepatitis Elimination Meeting, 2021; Virtual Event
Authors: Geoff A. Beckett1, Ana Aslanikashvili2, Sophia Surguladze2, Shaun Shadaker1, Lia Gvinjilia3, Paige A. Armstrong1, Amiran Gamkrelidze2
1Division of Viral Hepatitis, National Center for HIV/AIDS, Viral Hepatitis, STD and TB Prevention, CDC, Atlanta, United States; 2National Center for Disease Control and Public Health of Georgia, Tbilisi, Georgia; 3Eastern Europe and Central Asia Regional Office, CDC, Tbilisi, Georgia
93
Background and Aims: Georgia has a high national prevalence of hepatitis C virus (HCV) infection, with 5.4% of adults chronically infected based on a 2015 serosurvey. In response, a national Hepatitis C Elimination program was launched in 2015 to provide widespread testing and treatment with direct-acting antiviral agents (DAAs). By the end of 2020, 73% of the adult population had been screened for anti-HCV and >70,000 had been treated. Chronic HCV infection is a leading cause of hepatocellular carcinoma (HCC), which has a 5-year survival of 10-20%.
The Georgia Hepatitis C Elimination Program maintains high-quality registries, providing data for HCV screening, testing and treatment. These data can be linked to other health registries; analyses of case-level data from the HCV registries linked to the recently-inaugurated (2015) Georgian Cancer registry (GCR) may facilitate a better understanding of the HCV-attributable burden of HCC in Georgia . Assessing the attributable disease burden of chronic viral hepatitis (CVH) is needed to measure the impact of the program and progress toward viral hepatitis elimination.
Method: We extracted data for all cases in the GCR classified as C22 (Primary Liver Cancer [PCL]) using the International Classification of Diseases, Tenth Revision, Clinical Modification (ICD-10-CM) during 2015-2019. Data on demographics (date of birth, sex, residence), date of diagnosis, and death (if applicable), and clinical information were abstracted. Using Georgia’s unique National ID, cases were matched to the HCV Screening and HCV Treatment Registries (anti-HCV and RNA test results, fibrosis scores, genotype, HBsAg results, and data on treatment (initiation, completion, and cure).
Results: Among 869 case-patients, 72% were male and median age at diagnosis was 62 years (IQR 55-71); males were younger than females at diagnosis. Overall, 698 (84%) case-patients died as of April 2021, and 288 (33%) survived > 1 year from date of diagnosis.
One-third (275, 32%) of cases were classified as HCC (C22.0), 96 (11%) as intrahepatic cholangiocarcinoma (ICC, C22.1), and most cases (490, 56%) were not classified to a specific cancer subtype (NSCT, C22.7/C22.9). A minority of cases (253, 29%) were diagnosed histologically.
Most cases (588, 68%) were screened for anti-HCV, and the proportions screened increased from 27% in 2015 to 93% in 2019. Of these, 351 (60%) were anti-HCV positive, and 283 (80%) were confirmed to be viremic. Among viremic cases, 209 (74%) had fibrosis assessment, and 190 (91%) were classified as Metavir F3-F4. Chronic HCV infection was strongly associated with both younger age (p <.0001) and male sex (OR=3.6 [95% CI 2.4-5.5]).
Conclusion: Georgia has a comprehensive Hepatitis C Elimination program, with surveillance systems that can link testing, treatment, and cancer registry data. Still, only two-thirds of cases of PLC had data on HCV status; however, the proportion screened increased substantially during the study period. Approximately half of those with PLC and screening data available had chronic HCV infection, suggesting HCV contributes substantially to PLC burden in Georgia. Continuing to monitor these trends is critical to demonstrating progress towards elimination, and provides a model globally for integrated surveillance of sequelae from viral hepatitis.
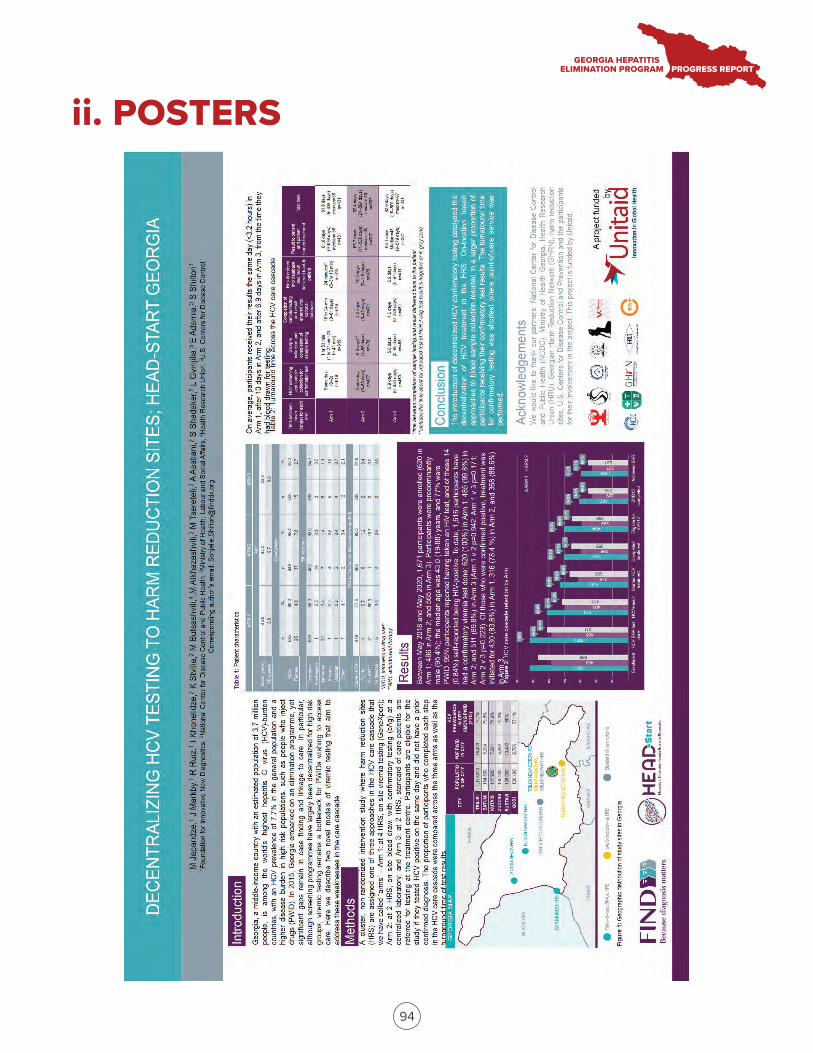
94
ii. POSTERS

ii. POSTERS cont.
95
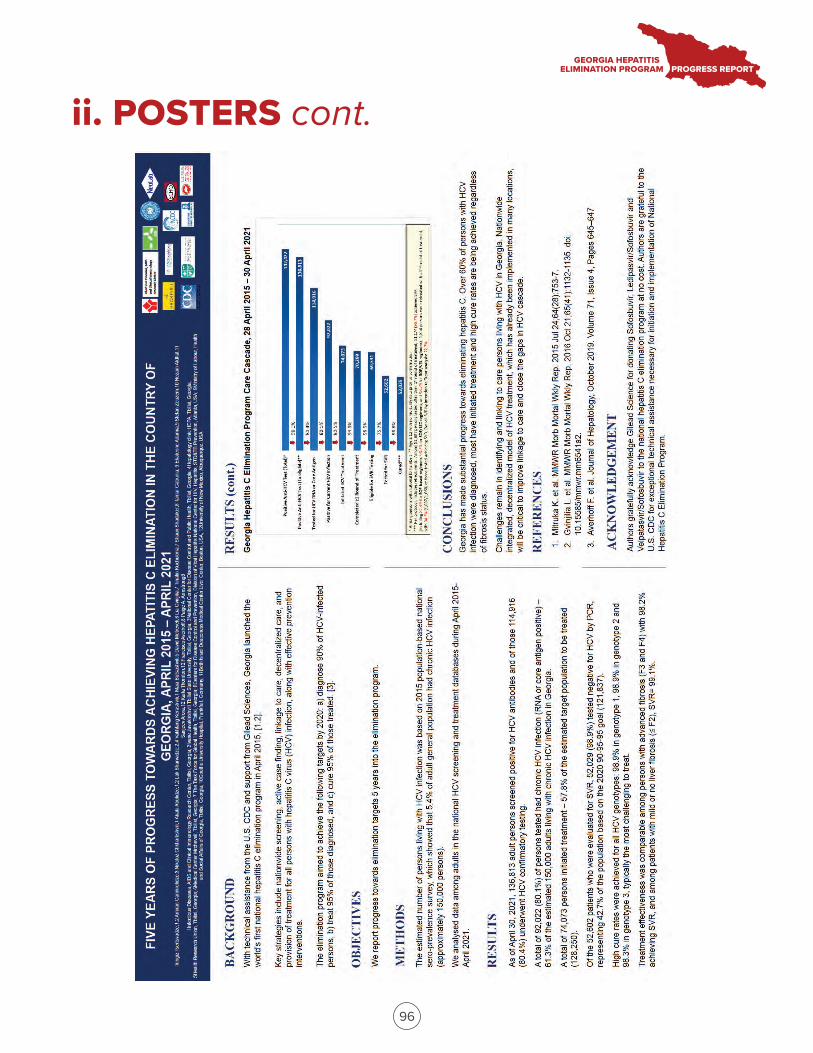
ii. POSTERS cont.
96
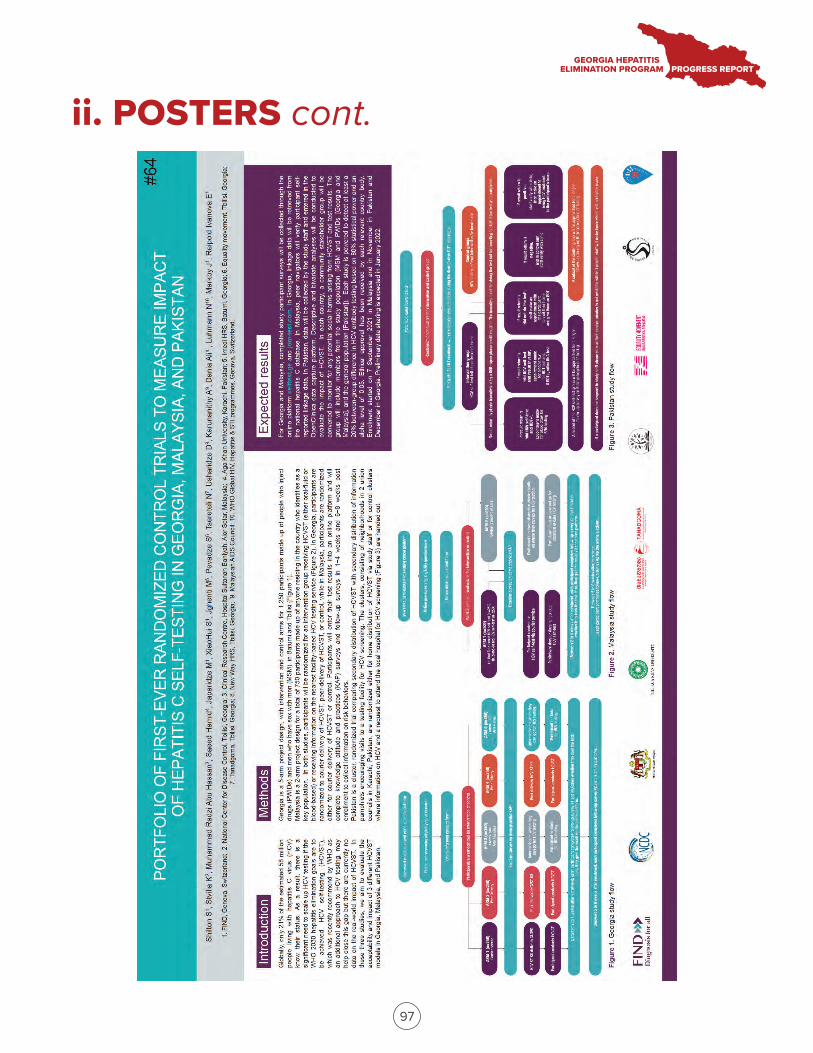
ii. POSTERS cont.
97
98
1. Georgia HCV Elimination Program: Successes and Challenges during COVID-19, Amiran Gamkrelidze
Presented at the Virtual International Liver Congress, 2021
2. The effect of COVID-19 on the progress of the hepatitis C elimination program in Georgia, Amiran Gamkrelidze
Presented at the Virtual International Liver Congress, 2021
3. The Georgian Model for Hepatitis C Elimination, Tengiz Tsertsvadze
Presented at the Virtual Central and Eastern European Meeting on Viral Hepatitis and HIV 2021
4. Three-armed, cluster intervention study of hepatitis C viremia testing for people who inject drugs in Georgia
Presented at the Virtual International Network on Hepatitis in Substance Users Conference, 2021
iii. ORAL PRESENTATIONS

99
APPENDIX 4.PUBLICATIONS OF THE GEORGIA HEPATITIS C ELIMINATION PROGRAM
RESEARCH ARTICLE Open Access
Treatment outcomes of patients withchronic hepatitis C receiving sofosbuvir-based combination therapy within nationalhepatitis C elimination program in thecountry of GeorgiaTengiz Tsertsvadze1,2*, Amiran Gamkrelidze3, Muazzam Nasrullah4, Lali Sharvadze1,2,5, Juliette Morgan4,Shaun Shadaker4, Lia Gvinjilia6, Maia Butsashvili7, David Metreveli8, Vakhtang Kerashvili1, Marina Ezugbaia1,Nikoloz Chkhartishvili1, Akaki Abutidze1, Valeri Kvaratskhelia9 and Francisco Averhoff4
Abstract
Background: Georgia has one of the highest HCV prevalence in the world and launched the world’s first nationalHCV elimination programs in 2015. Georgia set the ambitious target of diagnosing 90% of people living with HCV,treating 95% of those diagnosed and curing 95% of treated patients by 2020. We report outcomes of Sofosbuvir(SOF) based treatment regimens in patients with chronic HCV infection in Georgia.
Methods: Patients with cirrhosis, advanced liver fibrosis and severe extrahepatic manifestations were enrolled in thetreatment program. Initial treatment consisted of SOF plus ribavirin (RBV) with or without pegylated interferon (INF).Sustained virologic response (SVR) was defined as undetectable HCV RNA at least 12 weeks after the end oftreatment. SVR were calculated using both per-protocol and modified intent-to-treat (mITT) analysis. Results forpatients who completed treatment through 31 October 2018 were analyzed.
Results: Of the 7342 patients who initiated treatment with SOF-based regimens, 5079 patients were tested for SVR.Total SVR rate was 82.1% in per-protocol analysis and 74.5% in mITT analysis. The lowest response rate wasobserved among genotype 1 patients (69.5%), intermediate response rate was achieved in genotype 2 patients(81.4%), while the highest response rate was among genotype 3 patients (91.8%). Overall, SOF/RBV regimensachieved lower response rates than IFN/SOF/RBV regimen (72.1% vs 91.3%, P < 0.0001).In multivariate analysis being infected with HCV genotype 2 (RR =1.10, CI [1.05–1.15]) and genotype 3 (RR = 1.14, CI[1.11–1.18]) were associated with higher SVR. Patients with cirrhosis (RR = 0.95, CI [0.93–0.98]), receiving treatmentregimens of SOF/RBV 12 weeks, SOF/RBV 20weeks, SOF/RBV 24weeks and SOF/RBV 48 weeks (RR = 0.85, CI [0.81–0.91];RR = 0.86, CI [0.82–0.92]; RR = 0.88, CI [0.85–0.91] and RR = 0.92, CI [0.87–0.98], respectively) were less likely to achieve SVR.
Conclusions: Georgia’s real world experience resulted in high overall response rates given that most patients had severeliver damage. Our results provide clear evidence that SOF plus IFN and RBV for 12 weeks can be considered a treatmentoption for eligible patients with all three HCV genotypes. With introduction of next generation DAAs, significantlyimproved response rates are expected, paving the way for Georgia to achieve HCV elimination goals.
Keywords: HCV, Elimination, DAAs, SVR, Georgia
© The Author(s). 2020 Open Access This article is distributed under the terms of the Creative Commons Attribution 4.0International License (http://creativecommons.org/licenses/by/4.0/), which permits unrestricted use, distribution, andreproduction in any medium, provided you give appropriate credit to the original author(s) and the source, provide a link tothe Creative Commons license, and indicate if changes were made. The Creative Commons Public Domain Dedication waiver(http://creativecommons.org/publicdomain/zero/1.0/) applies to the data made available in this article, unless otherwise stated.
* Correspondence: [email protected] Diseases, AIDS and Clinical Immunology Research Center, Tbilisi,Georgia2Ivane Javakhishvili Tbilisi State University, Faculty of Medicine, Tbilisi, GeorgiaFull list of author information is available at the end of the article
Tsertsvadze et al. BMC Infectious Diseases (2020) 20:30 https://doi.org/10.1186/s12879-019-4741-5
BackgroundGlobally, an estimated 71 million people are chronic-ally infected with hepatitis C virus (HCV), and 400,000 die annually from hepatitis C-related liver dis-eases [1]. Management of HCV infection has beenrevolutionized after the availability of direct acting an-tivirals (DAAs), and Sofosbuvir (SOF) was the firstwidely introduced DAA [2, 3]. Clinical trials havedemonstrated high efficacy of SOF-based regimens inpatients infected with genotypes 1–6 [4–8].Georgia has one of the highest HCV prevalence
rates among general population in the world [9], andlaunched the world’s first national HCV eliminationprogram in 2015 [10]. The elimination program hasadopted a comprehensive strategy that addresses bothprevention and treatment of HCV infection. A keycomponent of the program is the provision of DAAsfree of charge to all Georgian citizens; this was madepossible through an agreement with Gilead Sciencesto donate DAAs. Georgia has set itself the ambitioustarget of diagnosing 90% (135,000 persons) of peopleliving with HCV, treating 95% (128,000 persons) ofthose diagnosed and curing 95% (121000) of treatedpatients by 2020 [9]. We report outcomes of SOF-based treatment regimens in patients with chronicHCV infection in the country of Georgia.
MethodsAll Georgians aged 18 years or older that are infectedwith HCV are eligible for the free of charge treatmentprogram. The hepatitis C elimination program waslaunched on 28 April 2015. All patients treated fromlaunch through 31 October 2018 are included in theanalysis. Treatment-naive and experienced patientswith cirrhosis (including decompensated cirrhosis),advanced liver fibrosis, severe extrahepatic manifesta-tions, HCV re-infection after liver transplantation andHIV-coinfection were prioritized for enrollment in thetreatment program. Initially, DAA treatment was ex-clusively SOF based and included ribavirin (RBV) withor without pegylated interferon, depending on theHCV genotype, per national guidelines. From February2016, more effective, interferon free DAA combination- sofosbuvir and ledipasvir (SOF/LDV) was intro-duced, and treatment regimens were revised. Begin-ning in June 2016, treatment criteria were relaxedallowing enrollment of all HCV infected persons re-gardless of level of liver fibrosis, to be treated. Treat-ment guidelines were established by a committeecomposed of treatment experts from Georgia in con-sultation with international experts. Based on eligibil-ity of interferon therapy all HCV genotype 1 and 3patients received SOF plus, Pegylated interferon (IFN)and RBV for 12 weeks or SOF plus RBV for 24 weeks.
HCV genotype 2 treatment naïve patients without cir-rhosis were treated with the 12-week combination ofSOF plus RBV, while cirrhotic patients and those withprior treatment failure received the 12-week regimenof SOF plus IFN and RBV or the 20-week regimen ofSOF plus RBV based on eligibility of interferon. Pa-tients with decompensated cirrhosis received SOF plusRBV for 48 weeks.Treatment was initially limited to four sites in
Tbilisi, and later expanded with sites from other cit-ies within Georgia; by October 2018, 31 sites wereproviding HCV treatment in the country. The HCVtreatment program providers also participated inProject ECHO (Extension for Community HealthcareOutcomes).A national HCV treatment database was established,
which collected standard data for each patient enrolledin treatment program. Each treatment site was respon-sible for data entry for each enrolled patient. Data werede-identified and sociodemographic, clinical and la-boratory data were extracted from national HCV treat-ment database. Characteristics measured included: age,gender, HCV RNA, FIB-4 test score, METAVIR score,HBsAg, treatment regimen, HCV genotype and citywhere treatment was provided. Sustained virologic re-sponse (SVR) was defined as undetectable HCV RNA atleast 12 weeks after the end of treatment. The presenceof cirrhosis was confirmed by vibration-controlled tran-sient elastography or acoustic radiation force impulseelastography (ARFI) compatible with stage F4 fibrosis(≥14.5 kpa)_by METAVIR. Decompensated cirrhosiswas defined as the presence of current or past ascites,hepatic encephalopathy and variceal haemorrhage etc.SVRs were calculated using both per-protocol andmodified intent-to-treat (mITT) analysis. Per-protocolapproach included only those with complete SVR data,while in mITT analysis persons discontinuing treat-ment were also included. Persons who died or had noSVR test > 24 weeks after completing treatment wereexcluded from analysis.
Statistical analysisAll analyses were performed with SAS version 9.3 soft-ware (SAS Institute, Inc., Cary, NC, USA). Variableswere categorized as follows: age category: 18–44, 45–60,and > 60; HCV RNA category: < 800,000 IU/mL vs. ≥800,000 IU/mL; FIB-4 test: <1.45, 1.45–3.25 and > 3.25;METAVIR score: <F4 and F4. We used the chi-squareor Fisher’s exact to compare differences in categoricalvariables with SVR. We performed a multivariatelogistic-regression analysis involving baseline demo-graphic, clinical and laboratory characteristics to iden-tify independent predictors of SVR. A p-value < 0.05was considered significant. The final model included
Tsertsvadze et al. BMC Infectious Diseases (2020) 20:30 Page 2 of 7
variables associated (p < 0.05) with SVR in the bivariateanalysis. The results are presented with a Risk ratio(RR) and 95% Confidence intervals (CIs). Results forpatients who completed treatment and tested for SVRthrough 31 October 2018 were analyzed. The study wasapproved by the Institutional review board of the Infec-tious Diseases, AIDS and Clinical Immunology Re-search Center, Tbilisi.
ResultsA total of 7342 patients with chronic HCV infection re-ceived SOF-based therapy from April 28, 2015 until Oc-tober 31, 2018 and 5079 had complete SVR data.The pretreatment demographics, clinical and labora-
tory characteristics of patients with complete SVR dataare described in Table 1. Most patients, 2838 (55.9%)were age 45–60 years, 4381 (86.3%) were males and 2783(57.9%) had stage F4 fibrosis (by METAVIR). Overall,1724 (33.9%) of the patients had HCV genotype 1,followed by HCV genotype 3, 2305 (45.4%) and HCVgenotype 2, 1047 (20.6%). Only 3 patients were infectedwith HCV genotype 4. Majority of patients were treatedwith IFN/SOF/RBV for 12 weeks (52.1%), followed bySOF/RBV for 24 weeks (27.9%), SOF/RBV for 20 weeks(7.8%), SOF/RBV for 12 weeks (7.2%), and SOF/RBV for48 weeks (5.0%).A total of 521 persons discontinued treatment, with the
most common causes for not completing treatment beingdeath (48.8%; n = 254), self-discontinuation (19.6%; n =102), and loss to follow up (15.9%; n = 83). Among thosewho died during treatment, the majority 299/521 (57.4%)had severe liver disease (METAVIR scores of F3 or F4).A total of 5079 persons with complete SVR data and
521 persons who discontinued treatment, were includedin treatment efficacy analysis (total 5600 persons). TotalSVR rate was 82.1% (4170/5079) in per-protocol analysisand 74.5% (4170/5600) in mITT analysis.Of those with an SVR12, the lowest response rate
was observed among genotype 1 patients (1198/1724;69.5%), intermediate response rate was achieved ingenotype 2 patients (852/1047; 81.4%), while the high-est response rate was among genotype 3 patients(2117/2305; 91.8%). There were only 3 patients withgenotype 4 and all were cured.Overall, SOF/RBV regimens achieved lower response
rates than IFN/SOF/RBV regimen (72.1% vs 91.3%, P <0.0001). This difference was seen in all genotypes (57.0%vs 80.8%, P < 0.0001 for genotype 1; 76.9% vs 96.3%, P <0.0001 for genotype 2 and 82.5% vs 96.9%, P < 0.0001 forgenotype 3 respectively) (Fig. 1).Multivariate analysis (Table 2) showed that when con-
trolling those factors which were significantly associatedwith SVR in bivariate analysis, being infected with HCVgenotype 2 (RR =1.10, CI [1.05–1.15], P = 0.001) and
genotype 3 (RR = 1.14, CI [1.11–1.18], P < 0.0001) wereassociated with higher SVR. Patients with cirrhosis (RR =0.95, CI [0.93–0.98], P < 0.0001), receiving treatmentregimens of SOF/RBV 12 weeks, SOF/RBV 20 weeks,SOF/RBV 24 weeks and SOF/RBV 48 weeks (RR = 0.85,CI [0.81–0.91], P < 0.0001; RR = 0.86, CI [0.82–0.92],P < 0.0001; RR = 0.88, CI [0.85–0.91], P < 0.0001 andRR = 0.92, CI [0.87–0.98], P = 0.005, respectively) wereless likely to achieve SVR.
DiscussionThis study from Georgia is one of the largest real-world cohorts examining outcomes of HCV treat-ment with SOF based regimens, among patients withsevere liver disease. We assessed real-world efficacyof SOF plus RBV with or without IFN in thesedifficult-to-treat patients with chronic hepatitis C.Our study demonstrated that SOF-based regimenscan result in high overall SVR rates, similar to SVRrates achieved in clinical trials [11, 12]. While newercombination DAAs are now available, SOF is nowone of the most readily available DAAs worldwide,at affordable prices in many low middle incomecountries, and as such, these findings have relevancetoday. In particular, the acceptable SOF plus RBVoutcomes among the most severely ill patients, re-gardless of genotype are highly relevant.In our study response rates among patients with
HCV genotype 2 were lower than reported in clinicaltrials and real-life studies which showed high efficacyof SOF plus RBV combination treatment among HCVgenotype 2 patients including those with cirrhosisand/or treatment experience [8, 12–15]. Lower effi-cacy of treatment in genotype 2 patients may havebeen associated with a reported high prevalence ofHCV recombinant form 2 k/1b among Georgian HCVgenotype 2 patients [16]; these patients do not re-spond well to standard treatment for genotype 2 andregimens used for genotype 1 seem to be more effect-ive [17]. Therefore there is a need for reassessingexisting modalities for the management of HCV geno-type 2 infection, especially in areas with high preva-lence of HCV recombinant form 2 k/1b [18].We observed high cure rates in HCV genotype 3
patients that are one of the most challenging subpop-ulations to treat [19]. IFN-based regimens were super-ior to SOF/RBV alone. The results of clinical trialsshowed that HCV genotype 3 patients achieved higherSVR12 rates with a 12 week SOF and RBV in combin-ation with IFN that patients who were treated withSOF and RBV alone [12].Our findings support use of a 12 week regimen of SOF
plus RBV in combination with IFN as a treatment optionfor eligible HCV genotype 3 patients in settings, where
Tsertsvadze et al. BMC Infectious Diseases (2020) 20:30 Page 3 of 7
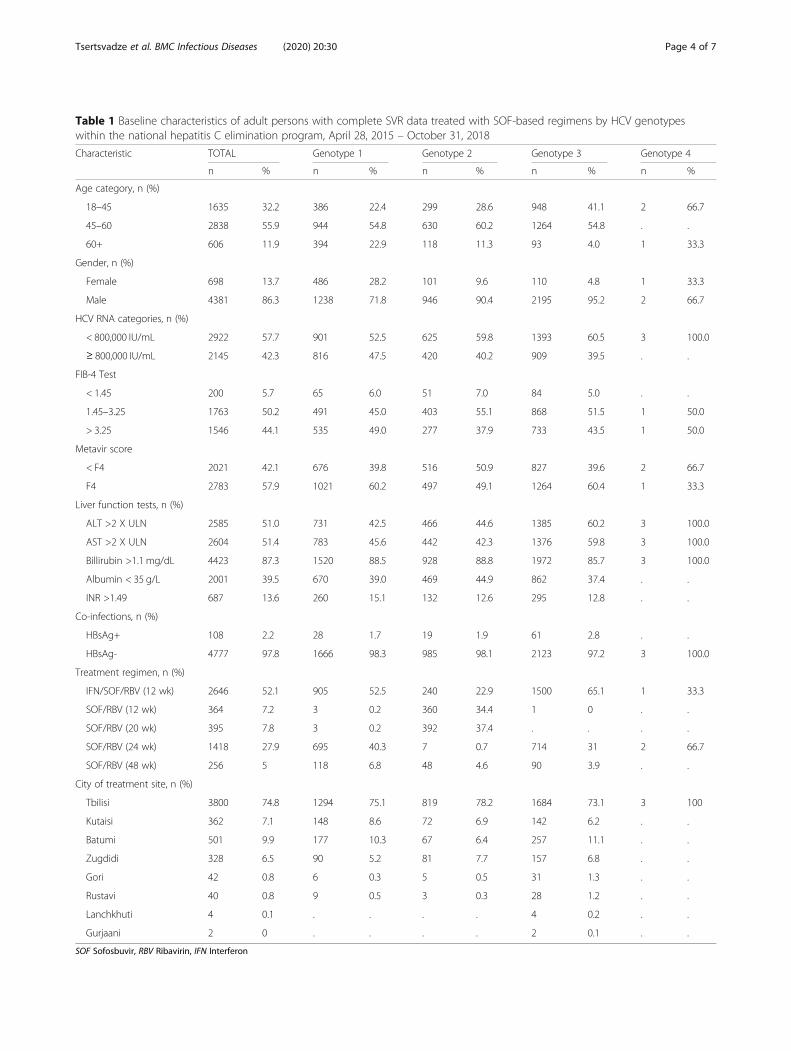
Table 1 Baseline characteristics of adult persons with complete SVR data treated with SOF-based regimens by HCV genotypeswithin the national hepatitis C elimination program, April 28, 2015 – October 31, 2018
Characteristic TOTAL Genotype 1 Genotype 2 Genotype 3 Genotype 4
n % n % n % n % n %
Age category, n (%)
18–45 1635 32.2 386 22.4 299 28.6 948 41.1 2 66.7
45–60 2838 55.9 944 54.8 630 60.2 1264 54.8 . .
60+ 606 11.9 394 22.9 118 11.3 93 4.0 1 33.3
Gender, n (%)
Female 698 13.7 486 28.2 101 9.6 110 4.8 1 33.3
Male 4381 86.3 1238 71.8 946 90.4 2195 95.2 2 66.7
HCV RNA categories, n (%)
< 800,000 IU/mL 2922 57.7 901 52.5 625 59.8 1393 60.5 3 100.0
≥ 800,000 IU/mL 2145 42.3 816 47.5 420 40.2 909 39.5 . .
FIB-4 Test
< 1.45 200 5.7 65 6.0 51 7.0 84 5.0 . .
1.45–3.25 1763 50.2 491 45.0 403 55.1 868 51.5 1 50.0
> 3.25 1546 44.1 535 49.0 277 37.9 733 43.5 1 50.0
Metavir score
< F4 2021 42.1 676 39.8 516 50.9 827 39.6 2 66.7
F4 2783 57.9 1021 60.2 497 49.1 1264 60.4 1 33.3
Liver function tests, n (%)
ALT >2 X ULN 2585 51.0 731 42.5 466 44.6 1385 60.2 3 100.0
AST >2 X ULN 2604 51.4 783 45.6 442 42.3 1376 59.8 3 100.0
Billirubin >1.1 mg/dL 4423 87.3 1520 88.5 928 88.8 1972 85.7 3 100.0
Albumin < 35 g/L 2001 39.5 670 39.0 469 44.9 862 37.4 . .
INR >1.49 687 13.6 260 15.1 132 12.6 295 12.8 . .
Co-infections, n (%)
HBsAg+ 108 2.2 28 1.7 19 1.9 61 2.8 . .
HBsAg- 4777 97.8 1666 98.3 985 98.1 2123 97.2 3 100.0
Treatment regimen, n (%)
IFN/SOF/RBV (12 wk) 2646 52.1 905 52.5 240 22.9 1500 65.1 1 33.3
SOF/RBV (12 wk) 364 7.2 3 0.2 360 34.4 1 0 . .
SOF/RBV (20 wk) 395 7.8 3 0.2 392 37.4 . . . .
SOF/RBV (24 wk) 1418 27.9 695 40.3 7 0.7 714 31 2 66.7
SOF/RBV (48 wk) 256 5 118 6.8 48 4.6 90 3.9 . .
City of treatment site, n (%)
Tbilisi 3800 74.8 1294 75.1 819 78.2 1684 73.1 3 100
Kutaisi 362 7.1 148 8.6 72 6.9 142 6.2 . .
Batumi 501 9.9 177 10.3 67 6.4 257 11.1 . .
Zugdidi 328 6.5 90 5.2 81 7.7 157 6.8 . .
Gori 42 0.8 6 0.3 5 0.5 31 1.3 . .
Rustavi 40 0.8 9 0.5 3 0.3 28 1.2 . .
Lanchkhuti 4 0.1 . . . . 4 0.2 . .
Gurjaani 2 0 . . . . 2 0.1 . .
SOF Sofosbuvir, RBV Ribavirin, IFN Interferon
Tsertsvadze et al. BMC Infectious Diseases (2020) 20:30 Page 4 of 7
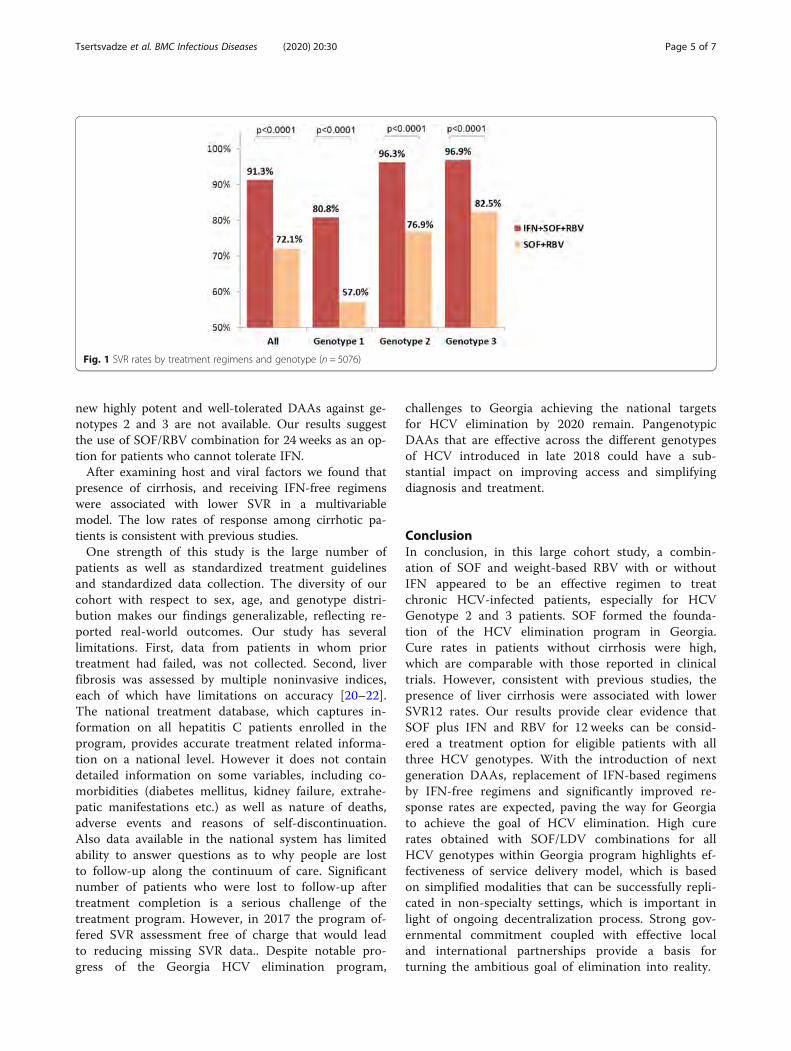
new highly potent and well-tolerated DAAs against ge-notypes 2 and 3 are not available. Our results suggestthe use of SOF/RBV combination for 24 weeks as an op-tion for patients who cannot tolerate IFN.After examining host and viral factors we found that
presence of cirrhosis, and receiving IFN-free regimenswere associated with lower SVR in a multivariablemodel. The low rates of response among cirrhotic pa-tients is consistent with previous studies.One strength of this study is the large number of
patients as well as standardized treatment guidelinesand standardized data collection. The diversity of ourcohort with respect to sex, age, and genotype distri-bution makes our findings generalizable, reflecting re-ported real-world outcomes. Our study has severallimitations. First, data from patients in whom priortreatment had failed, was not collected. Second, liverfibrosis was assessed by multiple noninvasive indices,each of which have limitations on accuracy [20–22].The national treatment database, which captures in-formation on all hepatitis C patients enrolled in theprogram, provides accurate treatment related informa-tion on a national level. However it does not containdetailed information on some variables, including co-morbidities (diabetes mellitus, kidney failure, extrahe-patic manifestations etc.) as well as nature of deaths,adverse events and reasons of self-discontinuation.Also data available in the national system has limitedability to answer questions as to why people are lostto follow-up along the continuum of care. Significantnumber of patients who were lost to follow-up aftertreatment completion is a serious challenge of thetreatment program. However, in 2017 the program of-fered SVR assessment free of charge that would leadto reducing missing SVR data.. Despite notable pro-gress of the Georgia HCV elimination program,
challenges to Georgia achieving the national targetsfor HCV elimination by 2020 remain. PangenotypicDAAs that are effective across the different genotypesof HCV introduced in late 2018 could have a sub-stantial impact on improving access and simplifyingdiagnosis and treatment.
ConclusionIn conclusion, in this large cohort study, a combin-ation of SOF and weight-based RBV with or withoutIFN appeared to be an effective regimen to treatchronic HCV-infected patients, especially for HCVGenotype 2 and 3 patients. SOF formed the founda-tion of the HCV elimination program in Georgia.Cure rates in patients without cirrhosis were high,which are comparable with those reported in clinicaltrials. However, consistent with previous studies, thepresence of liver cirrhosis were associated with lowerSVR12 rates. Our results provide clear evidence thatSOF plus IFN and RBV for 12 weeks can be consid-ered a treatment option for eligible patients with allthree HCV genotypes. With the introduction of nextgeneration DAAs, replacement of IFN-based regimensby IFN-free regimens and significantly improved re-sponse rates are expected, paving the way for Georgiato achieve the goal of HCV elimination. High curerates obtained with SOF/LDV combinations for allHCV genotypes within Georgia program highlights ef-fectiveness of service delivery model, which is basedon simplified modalities that can be successfully repli-cated in non-specialty settings, which is important inlight of ongoing decentralization process. Strong gov-ernmental commitment coupled with effective localand international partnerships provide a basis forturning the ambitious goal of elimination into reality.
Fig. 1 SVR rates by treatment regimens and genotype (n = 5076)
Tsertsvadze et al. BMC Infectious Diseases (2020) 20:30 Page 5 of 7
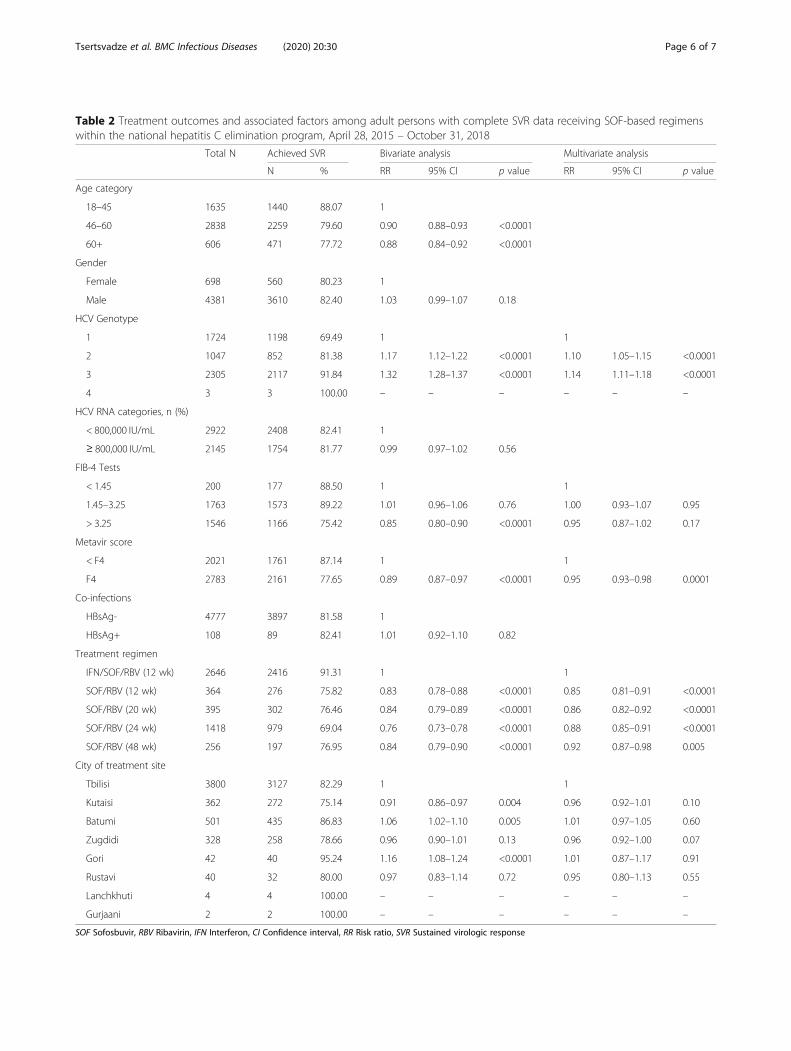
Table 2 Treatment outcomes and associated factors among adult persons with complete SVR data receiving SOF-based regimenswithin the national hepatitis C elimination program, April 28, 2015 – October 31, 2018
Total N Achieved SVR Bivariate analysis Multivariate analysis
N % RR 95% CI p value RR 95% CI p value
Age category
18–45 1635 1440 88.07 1
46–60 2838 2259 79.60 0.90 0.88–0.93 <0.0001
60+ 606 471 77.72 0.88 0.84–0.92 <0.0001
Gender
Female 698 560 80.23 1
Male 4381 3610 82.40 1.03 0.99–1.07 0.18
HCV Genotype
1 1724 1198 69.49 1 1
2 1047 852 81.38 1.17 1.12–1.22 <0.0001 1.10 1.05–1.15 <0.0001
3 2305 2117 91.84 1.32 1.28–1.37 <0.0001 1.14 1.11–1.18 <0.0001
4 3 3 100.00 – – – – – –
HCV RNA categories, n (%)
< 800,000 IU/mL 2922 2408 82.41 1
≥ 800,000 IU/mL 2145 1754 81.77 0.99 0.97–1.02 0.56
FIB-4 Tests
< 1.45 200 177 88.50 1 1
1.45–3.25 1763 1573 89.22 1.01 0.96–1.06 0.76 1.00 0.93–1.07 0.95
> 3.25 1546 1166 75.42 0.85 0.80–0.90 <0.0001 0.95 0.87–1.02 0.17
Metavir score
< F4 2021 1761 87.14 1 1
F4 2783 2161 77.65 0.89 0.87–0.97 <0.0001 0.95 0.93–0.98 0.0001
Co-infections
HBsAg- 4777 3897 81.58 1
HBsAg+ 108 89 82.41 1.01 0.92–1.10 0.82
Treatment regimen
IFN/SOF/RBV (12 wk) 2646 2416 91.31 1 1
SOF/RBV (12 wk) 364 276 75.82 0.83 0.78–0.88 <0.0001 0.85 0.81–0.91 <0.0001
SOF/RBV (20 wk) 395 302 76.46 0.84 0.79–0.89 <0.0001 0.86 0.82–0.92 <0.0001
SOF/RBV (24 wk) 1418 979 69.04 0.76 0.73–0.78 <0.0001 0.88 0.85–0.91 <0.0001
SOF/RBV (48 wk) 256 197 76.95 0.84 0.79–0.90 <0.0001 0.92 0.87–0.98 0.005
City of treatment site
Tbilisi 3800 3127 82.29 1 1
Kutaisi 362 272 75.14 0.91 0.86–0.97 0.004 0.96 0.92–1.01 0.10
Batumi 501 435 86.83 1.06 1.02–1.10 0.005 1.01 0.97–1.05 0.60
Zugdidi 328 258 78.66 0.96 0.90–1.01 0.13 0.96 0.92–1.00 0.07
Gori 42 40 95.24 1.16 1.08–1.24 <0.0001 1.01 0.87–1.17 0.91
Rustavi 40 32 80.00 0.97 0.83–1.14 0.72 0.95 0.80–1.13 0.55
Lanchkhuti 4 4 100.00 – – – – – –
Gurjaani 2 2 100.00 – – – – – –
SOF Sofosbuvir, RBV Ribavirin, IFN Interferon, CI Confidence interval, RR Risk ratio, SVR Sustained virologic response
Tsertsvadze et al. BMC Infectious Diseases (2020) 20:30 Page 6 of 7
AbbreviationsCI: Confidence intervals; DAAs: Direct acting antivirals; HCV: Hepatitis C virus;INF: Pegylated interferon; mITT: modified intent-to-treat; RBV: Ribavirin;RR: Risk ratio; SOF: Sofosbuvir; SVR: Sustained virologic response
AcknowledgementsAuthors gratefully acknowledge Gilead Science for donating Sofosbuvir andLedipasvir/Sofosbuvir to the national hepatitis C elimination program at no cost.
Authors’ contributionsConcept and design (TT, AG, FA, NC, AA), statistical analyses (SS, NC, AA),interpretation of the data (TT, AG, MN, LS, JM, SS, LG, MB, DM, VK, ME, NC,AA, VK, FA), drafting the manuscript (TT) and critical revision of themanuscript for intellectual content (TT, AG, MN, LS, JM, SS, LG, MB, DM, VK,ME, NC, AA, VK, FA). All authors read and approve the final manuscript.
FundingNo funding was obtained for this study.
Availability of data and materialsThe data that support the findings of this study are property of Georgia’sHCV elimination program. In case the data is requested, please contactscientific committee of Georgia’s HCV elimination program (Secretary Dr.Tinatin Kuchuloria, email: [email protected]).
Ethics approval and consent to participateThe study was approved by the Institutional review board of the InfectiousDiseases, AIDS and Clinical Immunology Research Center, Tbilisi.
Consent for publicationNot Applicable.
Competing interestsThe authors declare that they have no competing interests.
Author details1Infectious Diseases, AIDS and Clinical Immunology Research Center, Tbilisi,Georgia. 2Ivane Javakhishvili Tbilisi State University, Faculty of Medicine,Tbilisi, Georgia. 3National Center for Disease control and public health, 99,Kakheti highway, 0198 Tbilisi, Georgia. 4Emerging Infections Program, Centersfor Disease Control and Prevention (CDC), Division of Viral Hepatitis NationalCenter for HIV, Hepatitis, STD&TB Prevention, Atlanta, USA. 5Hepatology ClinicHEPA, Tbilisi, Georgia. 6CDC Foundation, Georgia Hepatitis C EliminationProgram, Tbilisi, Georgia. 7Clinic NeoLab, Tbilisi, Georgia. 8Medical CenterMrcheveli, Tbilisi, Georgia. 9Ministry of Labor, Health and Social Affairs ofGeorgia, Tbilisi, Georgia.
Received: 17 April 2019 Accepted: 27 December 2019
References1. WHO Hepatitis C fact sheet. Updated April 2017. http://www.who.int/
mediacentre/factsheets/fs164/en/. .2. Gane EJ, Stedman CA, Hyland RH, et al. Nucleotide polymerase
inhibitor sofosbuvir plus ribavirin for hepatitis C. N Engl J Med. 2013;368(1):34–44.
3. Gentile I, Maraolo AE, Buonomo AR, Zappulo E, Borgia G. The discovery ofsofosbuvir: a revolution for therapy of chronic hepatitis C. Expert Opin DrugDiscovery. 2015;10(12):1363–77.
4. Rodriguez-Torres M, Lawitz E, Kowdley KV, et al. Sofosbuvir (GS-7977) pluspeginterferon/ribavirin in treatment-naive patients with HCV genotype 1: arandomized, 28-day, dose-ranging trial. J Hepatol. 2013;58(4):663–8.
5. Kowdley KV, Lawitz E, Crespo I, et al. Sofosbuvir with pegylated interferonalfa-2a and ribavirin for treatment-naive patients with hepatitis C genotype-1 infection (ATOMIC): an open-label, randomised, multicentre phase 2 trial.Lancet. 2013;381(9883):2100–7.
6. Lawitz E, Lalezari JP, Hassanein T, et al. Sofosbuvir in combination withpeginterferon alfa-2a and ribavirin for non-cirrhotic, treatment-naivepatients with genotypes 1, 2, and 3 hepatitis C infection: a randomised,double-blind, phase 2 trial. Lancet Infect Dis. 2013;13(5):401–8.
7. Lawitz E, Poordad FF, Pang PS, et al. Sofosbuvir and ledipasvir fixed-dosecombination with and without ribavirin in treatment-naive and previouslytreated patients with genotype 1 hepatitis C virus infection (LONESTAR): anopen-label, randomised, phase 2 trial. Lancet. 2014;383(9916):515–23.
8. Zeuzem S, Dusheiko GM, Salupere R, et al. Sofosbuvir and ribavirin in HCVgenotypes 2 and 3. N Engl J Med. 2014;370(21):1993–2001.
9. Mitruka K, Tsertsvadze T, Butsashvili M, et al. Launch of a NationwideHepatitis C Elimination Program--Georgia, April 2015. MMWR Morb MortalWkly Rep. 2015;64(28):753–7.
10. Nasrullah M, Sergeenko D, Gvinjilia L, et al. The Role of Screening andTreatment in National Progress Toward Hepatitis C Elimination - Georgia,2015–2016. MMWR Morb Mortal Wkly Rep. 2017;66(29):773–6.
11. Stedman C. Sofosbuvir, a NS5B polymerase inhibitor in the treatment ofhepatitis C: a review of its clinical potential. Ther Adv Gastroenterol. 2014;7(3):131–40.
12. Foster GR, Pianko S, Brown A, et al. Efficacy of sofosbuvir plus ribavirin withor without peginterferon-alfa in patients with hepatitis C virus genotype 3infection and treatment-experienced patients with cirrhosis and hepatitis Cvirus genotype 2 infection. Gastroenterology. 2015;149(6):1462–70.
13. Lawitz E, Gane EJ. Sofosbuvir for previously untreated chronic hepatitis Cinfection. N Engl J Med. 2013;369(7):678–9.
14. Jacobson IM, Gordon SC, Kowdley KV, et al. Sofosbuvir for hepatitis Cgenotype 2 or 3 in patients without treatment options. N Engl J Med. 2013;368(20):1867–77.
15. Welzel TM, Nelson DR, Morelli G, et al. Effectiveness and safety of sofosbuvirplus ribavirin for the treatment of HCV genotype 2 infection: results of thereal-world, clinical practice HCV-TARGET study. Gut. 2016;66:1844.
16. Karchava M, Waldenstrom J, Parker M, et al. High incidence of the hepatitisC virus recombinant 2k/1b in Georgia: recommendations for testing andtreatment. Hepatol Res. 2015;45(13):1292–8.
17. Hedskog C, Doehle B, Chodavarapu K, et al. Characterization of hepatitis Cvirus intergenotypic recombinant strains and associated virological responseto sofosbuvir/ribavirin. Hepatology. 2015;61(2):471–80.
18. Karchava M, Chkhartishvili N, Sharvadze L, et al. Impact of hepatitis C virusrecombinant form RF1_2k/1b on treatment outcomes within the Georgiannational hepatitis C elimination program. Hepatol Res. 2017;48(1):36.
19. Tapper EB, Afdhal NH. Is 3 the new 1: perspectives on virology, naturalhistory and treatment for hepatitis C genotype 3. J Viral Hepat. 2013;20(10):669–77.
20. Lawitz E, Sulkowski MS, Ghalib R, et al. Simeprevir plus sofosbuvir, with orwithout ribavirin, to treat chronic infection with hepatitis C virus genotype1 in non-responders to pegylated interferon and ribavirin and treatment-naive patients: the COSMOS randomised study. Lancet. 2014;384(9956):1756–65.
21. Bonder A, Tapper EB, Afdhal NH. Contemporary assessment of hepaticfibrosis. Clin Liver Dis. 2015;19(1):123–34.
22. Tapper EB, Bacon BR, Curry MP, et al. Real-world effectiveness for 12 weeksof ledipasvir-sofosbuvir for genotype 1 hepatitis C: the trio health study. JViral Hepat. Jan 2017;24(1):22–7.
Publisher’s NoteSpringer Nature remains neutral with regard to jurisdictional claims inpublished maps and institutional affiliations.
Tsertsvadze et al. BMC Infectious Diseases (2020) 20:30 Page 7 of 7
See discussions, stats, and author profiles for this publication at: https://www.researchgate.net/publication/337302390
Tuberculosis, HIV, and viral hepatitis diagnostics in eastern Europe and
central Asia: high time for integrated and people-centred services
Article in The Lancet Infectious Diseases · November 2019
DOI: 10.1016/S1473-3099(19)30524-9
CITATIONS
11READS
162
17 authors, including:
Some of the authors of this publication are also working on these related projects:
Pilot Study to estimate the potential efficacy and safety of using Adjunctive Ibuprofen for the Treatment of XDR Tuberculosis (ClinicalTrials.gov Identifier NCT02781909)
View project
aDSM project View project
Masoud Dara
Otsuka Novel Products Group GmbH
118 PUBLICATIONS 3,102 CITATIONS
SEE PROFILE
Soudeh Ehsani
World Health Organization WHO
16 PUBLICATIONS 231 CITATIONS
SEE PROFILE
Elena Vovc
World Health Organization WHO
8 PUBLICATIONS 31 CITATIONS
SEE PROFILE
Daniel Simões
Coalition PLUS
38 PUBLICATIONS 74 CITATIONS
SEE PROFILE
All content following this page was uploaded by Irina Felker on 07 September 2020.
The user has requested enhancement of the downloaded file.
www.thelancet.com/infection Vol 20 February 2020 e47
Personal View
Tuberculosis, HIV, and viral hepatitis diagnostics in eastern Europe and central Asia: high time for integrated and people-centred servicesMasoud Dara*, Soudeh Ehsani, Antons Mozalevskis, Elena Vovc, Daniel Simões, Ana Avellon Calvo, Jordi Casabona i Barbarà, Otar Chokoshvili, Irina Felker, Sven Hoffner, Gulmira Kalmambetova, Ecatarina Noroc, Natalia Shubladze, Alena Skrahina, Rasim Tahirli, Tengiz Tsertsvadze, Francis Drobniewski*
Globally, high rates (and in the WHO European region an increasing prevalence) of co-infection with tuberculosis and HIV and HIV and hepatitis C virus exist. In eastern European and central Asian countries, the tuberculosis, HIV, and viral hepatitis programmes, including diagnostic services, are separate vertical structures. In this Personal View, we consider underlying reasons for the poor integration for these diseases, particularly in the WHO European region, and how to address this with an initial focus on diagnostic services. In part, this low integration has reflected different diagnostic development histories, global funding sources, and sample types used for diagnosis (eg, typically sputum for tuberculosis and blood for HIV and hepatitis C). Cooperation between services improved as patients with tuberculosis needed routine testing for HIV and vice versa, but financial, infection control, and logistical barriers remain. Multidisease diagnostic platforms exist, but to be used optimally, appropriate staff training and sensible understanding of different laboratory and infection control risks needs rapid implementation. Technically these ideas are all feasible. Poor coordination between these vertical systems remains unhelpful. There is a need to increase political and operational integration of diagnostic and treatment services and bring them closer to patients.
IntroductionIn the past 20 years rapid molecular tools have revolutionised the work of tuberculosis laboratories. Classic micro biologybased culture examinations of patient specimens and drugsusceptibility testing are increasingly replaced, at least in part, with rapid molecular tests, offering results in hours or days rather than weeks or months.1–4 Under standing of how specific mutations in the Mycobacterium tuberculosis genome are related to drug resistance is rapidly increasing, and molecular detection of such resistancepredicting mutations is often used to rapidly detect drugresistant tuberculosis5–11 and potentially could be used to initiate personalised treatment regimens.12 An additional added value of replacing conventional tuberculosis diagnostic methods, based on mycobacterial culture, to modern molecular assays, is that, although they still require training of laboratory staff, they permit tuberculosis diagnosis to take place in less specialised laboratories, closer to patients. A similar trend is seen in using PCR and sequencingbased technologies for detection of drugresistant HIV.13 Although a commercially available and automated diagnostic tool recommended by WHO, such as the GeneXpert system (Cepheid; Sunnyvale, CA, USA), has shown its applicability in a combined diagnostic landscape, the full role of sequencingbased technologies, increasingly used in characterisation of different infectious disease pathogens offers great opportunities in the near future. Nextgeneration sequencing (NGS), including both targeted sequencing and wholegenome sequencing (WGS), is becoming increasingly affordable and thus more widely used in, for example, the study of resistance mutations in viruses and bacteria such as M tuberculosis.11,14–16 At present, for tuberculosis, reliable NGS approaches are confined to grown cultures but
successful attempts have been made to do NGS on sputum specimens17–19 or by using a targeted gene approach.20
Great progress has been achieved in HIV diagnostics. Nowadays, wider use of rapid HIV tests and confirmation of positive results with additional rapid ELISA confirmatory testing21 is simpler, faster, and more accurate and costeffective than before. Use of modern fourthgeneration combined antigen and antibody tests can now increase the accuracy of HIV diagnosis and reduce the number of misdiagnosed patients within the socalled window period in HIV testing.21
With increasing access to effective treatment of hepatitis C globally, any simplification of diagnostic algorithms for the disease allows for more rapid implementation of national control programmes.22,23
Background and current situationGlobal and European policyThe commitments contained in the UN General Assembly political declarations on the fights against tuberculosis24 and HIV/AIDS,25 and the globally endorsed End TB strategy,26 the Global Health Sector Strategy on HIV, 2016–2021,27 and the Global Health Sector Strategy on Viral Hepatitis 2016–2021,28 collectively agreed on universal health coverage and collaboration between diverse stakeholders to achieve their objectives. The WHO European region has translated these goals into regional action plans for tuberculosis (for 2016–20),29 for HIV30 and for viral hepatitis,31 which were endorsed at the 65th32 and 66th33 sessions of the Regional Committee for Europe.
Integrating programmes benefits patients by maximising available infrastructure and resources (including staff) and minimising diagnostic and therapeutic delay
Lancet Infect Dis 202; 20: e47–53
Published Online November 15, 2019 https://doi.org/10.1016/ S1473-3099(19)30524-9
*Contributed equally
Communicable Diseases Department, Division of Health Emergencies and Communicable Diseases (M Dara MD), Joint Tuberculosis, HIV and Viral Hepatitis Programme (S Ehsani MD, A Mozalevskis MD, E Vovc MD), Regional Office for Europe, World Health Organization, Copenhagen, Denmark; EPI Unit, Institute of Public Health, University of Porto, Porto, Portugal (D Simões MPH); Hepatitis Unit, National Center of Microbiology, Carlos III Institute of Health, Majadahonda, Madrid, Spain (A Avellon Calvo PhD); Center for Epidemiological Studies on STI and AIDS in Catalonia and Research Network on Biomedical Research, Epidemiology and Public Health, Catalan Agency of Public Health, Badalona, Spain (J Casabona i Barbarà PhD); Infectious diseases and Clinical Immunology Research Center, Tbilisi, Georgia (O Chokoshvili MPH); Scientific department, Novosibirsk Tuberculosis Research Institute, Novosibirsk, Russia (I Felker PhD); Department of Public Health Sciences, Karolinska Institute, Stockholm, Sweden (S Hoffner PhD); National TB Reference Laboratory, Bishkek, Kyrgyzstan (G Kalmambetova PhD); National AIDS Programme, Dermatology and Communicable Diseases Hospital, Chisinau, Moldova (E Noroc MD); National Reference Laboratory, National Center for Tuberculosis and Lung Diseases, Tbilisi, Georgia (N Shubladze PhD); Clinical
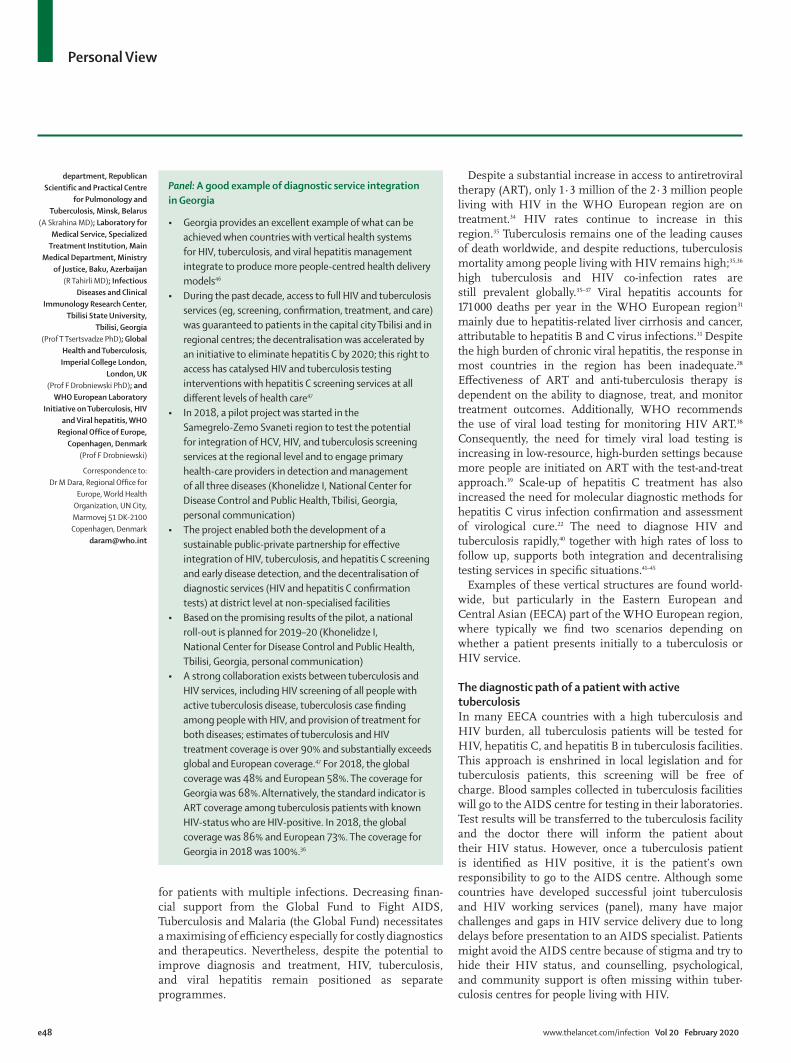
e48 www.thelancet.com/infection Vol 20 February 2020
Personal View
department, Republican Scientific and Practical Centre
for Pulmonology and Tuberculosis, Minsk, Belarus
(A Skrahina MD); Laboratory for Medical Service, Specialized
Treatment Institution, Main Medical Department, Ministry
of Justice, Baku, Azerbaijan (R Tahirli MD); Infectious
Diseases and Clinical Immunology Research Center,
Tbilisi State University, Tbilisi, Georgia
(Prof T Tsertsvadze PhD); Global Health and Tuberculosis, Imperial College London,
London, UK (Prof F Drobniewski PhD); and
WHO European Laboratory Initiative on Tuberculosis, HIV
and Viral hepatitis, WHO Regional Office of Europe,
Copenhagen, Denmark (Prof F Drobniewski)
Correspondence to: Dr M Dara, Regional Office for
Europe, World Health Organization, UN City, Marmovej 51 DK-2100 Copenhagen, Denmark
for patients with multiple infections. Decreasing financial support from the Global Fund to Fight AIDS, Tuberculosis and Malaria (the Global Fund) necessitates a maximising of efficiency especially for costly diagnostics and therapeutics. Nevertheless, despite the potential to improve diagnosis and treatment, HIV, tuberculosis, and viral hepatitis remain positioned as separate programmes.
Despite a substantial increase in access to antiretroviral therapy (ART), only 1·3 million of the 2·3 million people living with HIV in the WHO European region are on treatment.34 HIV rates continue to increase in this region.35 Tuberculosis remains one of the leading causes of death worldwide, and despite reductions, tuberculosis mortality among people living with HIV remains high;35,36 high tuberculosis and HIV coinfection rates are still prevalent globally.35–37 Viral hepatitis accounts for 171 000 deaths per year in the WHO European region31 mainly due to hepatitisrelated liver cirrhosis and cancer, attributable to hepatitis B and C virus infections.31 Despite the high burden of chronic viral hepatitis, the response in most countries in the region has been inadequate.28 Effectiveness of ART and antituberculosis therapy is dependent on the ability to diagnose, treat, and monitor treatment outcomes. Additionally, WHO recommends the use of viral load testing for monitoring HIV ART.38 Consequently, the need for timely viral load testing is increasing in lowresource, highburden settings because more people are initiated on ART with the testandtreat approach.39 Scaleup of hepatitis C treatment has also increased the need for molecular diagnostic methods for hepatitis C virus infection confirmation and assessment of virological cure.22 The need to diagnose HIV and tuberculosis rapidly,40 together with high rates of loss to follow up, supports both integration and decentralising testing services in specific situations.41–45
Examples of these vertical structures are found worldwide, but particularly in the Eastern European and Central Asian (EECA) part of the WHO European region, where typically we find two scenarios depending on whether a patient presents initially to a tuberculosis or HIV service.
The diagnostic path of a patient with active tuberculosisIn many EECA countries with a high tuberculosis and HIV burden, all tuberculosis patients will be tested for HIV, hepatitis C, and hepatitis B in tuberculosis facilities. This approach is enshrined in local legislation and for tuberculosis patients, this screening will be free of charge. Blood samples collected in tuberculosis facilities will go to the AIDS centre for testing in their laboratories. Test results will be transferred to the tuberculosis facility and the doctor there will inform the patient about their HIV status. However, once a tuberculosis patient is identified as HIV positive, it is the patient’s own responsibility to go to the AIDS centre. Although some countries have developed successful joint tuberculosis and HIV working services (panel), many have major challenges and gaps in HIV service delivery due to long delays before presentation to an AIDS specialist. Patients might avoid the AIDS centre because of stigma and try to hide their HIV status, and counselling, psychological, and community support is often missing within tuberculosis centres for people living with HIV.
Panel: A good example of diagnostic service integration in Georgia
• Georgia provides an excellent example of what can be achieved when countries with vertical health systems for HIV, tuberculosis, and viral hepatitis management integrate to produce more people-centred health delivery models46
• During the past decade, access to full HIV and tuberculosis services (eg, screening, confirmation, treatment, and care) was guaranteed to patients in the capital city Tbilisi and in regional centres; the decentralisation was accelerated by an initiative to eliminate hepatitis C by 2020; this right to access has catalysed HIV and tuberculosis testing interventions with hepatitis C screening services at all different levels of health care47
• In 2018, a pilot project was started in the Samegrelo-Zemo Svaneti region to test the potential for integration of HCV, HIV, and tuberculosis screening services at the regional level and to engage primary health-care providers in detection and management of all three diseases (Khonelidze I, National Center for Disease Control and Public Health, Tbilisi, Georgia, personal communication)
• The project enabled both the development of a sustainable public-private partnership for effective integration of HIV, tuberculosis, and hepatitis C screening and early disease detection, and the decentralisation of diagnostic services (HIV and hepatitis C confirmation tests) at district level at non-specialised facilities
• Based on the promising results of the pilot, a national roll-out is planned for 2019–20 (Khonelidze I, National Center for Disease Control and Public Health, Tbilisi, Georgia, personal communication)
• A strong collaboration exists between tuberculosis and HIV services, including HIV screening of all people with active tuberculosis disease, tuberculosis case finding among people with HIV, and provision of treatment for both diseases; estimates of tuberculosis and HIV treatment coverage is over 90% and substantially exceeds global and European coverage.47 For 2018, the global coverage was 48% and European 58%. The coverage for Georgia was 68%. Alternatively, the standard indicator is ART coverage among tuberculosis patients with known HIV-status who are HIV-positive. In 2018, the global coverage was 86% and European 73%. The coverage for Georgia in 2018 was 100%.36
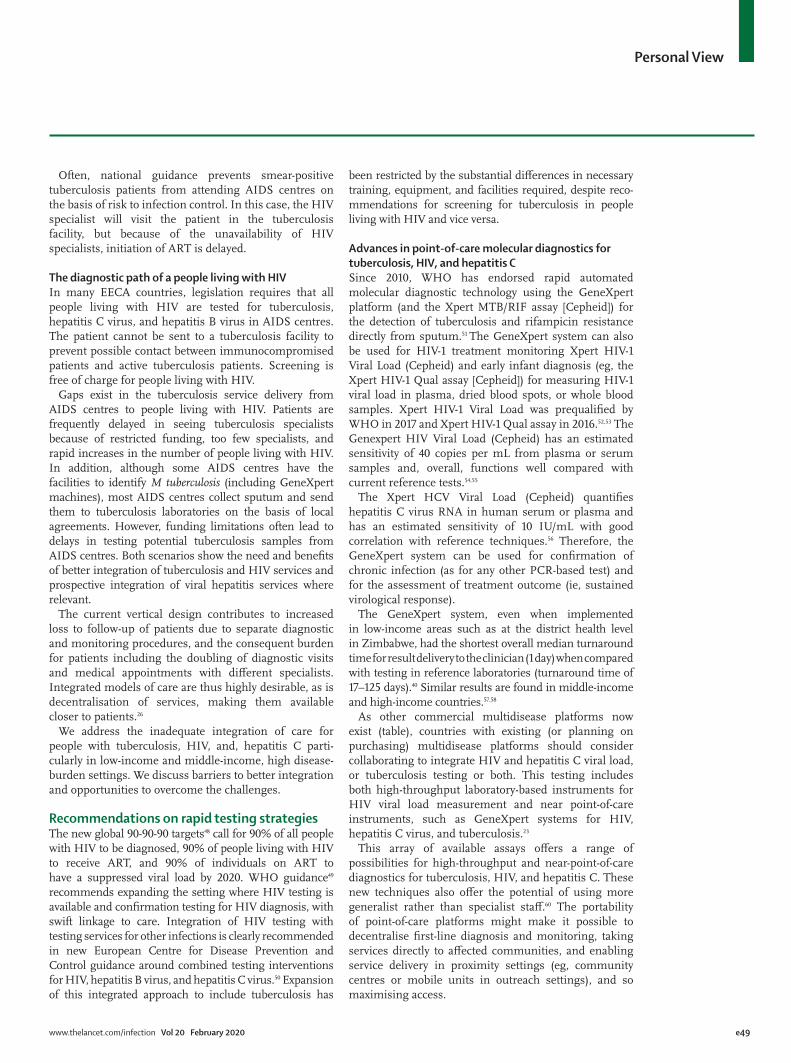
www.thelancet.com/infection Vol 20 February 2020 e49
Personal View
Often, national guidance prevents smearpositive tuberculosis patients from attending AIDS centres on the basis of risk to infection control. In this case, the HIV specialist will visit the patient in the tuberculosis facility, but because of the unavailability of HIV specialists, initiation of ART is delayed.
The diagnostic path of a people living with HIVIn many EECA countries, legislation requires that all people living with HIV are tested for tuberculosis, hepatitis C virus, and hepatitis B virus in AIDS centres. The patient cannot be sent to a tuberculosis facility to prevent possible contact between immunocompromised patients and active tuberculosis patients. Screening is free of charge for people living with HIV.
Gaps exist in the tuberculosis service delivery from AIDS centres to people living with HIV. Patients are frequently delayed in seeing tuberculosis specialists because of restricted funding, too few specialists, and rapid increases in the number of people living with HIV. In addition, although some AIDS centres have the facilities to identify M tuberculosis (including GeneXpert machines), most AIDS centres collect sputum and send them to tuberculosis laboratories on the basis of local agreements. However, funding limitations often lead to delays in testing potential tuberculosis samples from AIDS centres. Both scenarios show the need and benefits of better integration of tuberculosis and HIV services and pros pective integration of viral hepatitis services where relevant.
The current vertical design contributes to increased loss to followup of patients due to separate diagnostic and monitoring procedures, and the consequent burden for patients including the doubling of diagnostic visits and medical appointments with different specialists. Integrated models of care are thus highly desirable, as is decentralisation of services, making them available closer to patients.26
We address the inadequate integration of care for people with tuberculosis, HIV, and, hepatitis C particularly in lowincome and middleincome, high diseaseburden settings. We discuss barriers to better integration and opportunities to overcome the challenges.
Recommendations on rapid testing strategiesThe new global 909090 targets48 call for 90% of all people with HIV to be diagnosed, 90% of people living with HIV to receive ART, and 90% of individuals on ART to have a suppressed viral load by 2020. WHO guidance49
recommends expanding the setting where HIV testing is available and confirmation testing for HIV diagnosis, with swift linkage to care. Integration of HIV testing with testing services for other infections is clearly recommended in new European Centre for Disease Prevention and Control guidance around combined testing interventions for HIV, hepatitis B virus, and hepatitis C virus.50 Expansion of this integrated approach to include tuberculosis has
been restricted by the substantial differences in necessary training, equipment, and facilities required, despite recommendations for screening for tuberculosis in people living with HIV and vice versa.
Advances in point-of-care molecular diagnostics for tuberculosis, HIV, and hepatitis CSince 2010, WHO has endorsed rapid automated molecular diagnostic technology using the GeneXpert platform (and the Xpert MTB/RIF assay [Cepheid]) for the detection of tuberculosis and rifampicin resistance directly from sputum.51 The GeneXpert system can also be used for HIV1 treatment monitoring Xpert HIV1 Viral Load (Cepheid) and early infant diagnosis (eg, the Xpert HIV1 Qual assay [Cepheid]) for measuring HIV1 viral load in plasma, dried blood spots, or whole blood samples. Xpert HIV1 Viral Load was prequalified by WHO in 2017 and Xpert HIV1 Qual assay in 2016.52,53 The Genexpert HIV Viral Load (Cepheid) has an estimated sensitivity of 40 copies per mL from plasma or serum samples and, overall, functions well compared with current reference tests.54,55
The Xpert HCV Viral Load (Cepheid) quantifies hepatitis C virus RNA in human serum or plasma and has an estimated sensitivity of 10 IU/mL with good correlation with reference techniques.56 Therefore, the GeneXpert system can be used for confirmation of chronic infection (as for any other PCRbased test) and for the assessment of treatment outcome (ie, sustained virological response).
The GeneXpert system, even when implemented in lowincome areas such as at the district health level in Zimbabwe, had the shortest overall median turnaround time for result delivery to the clinician (1 day) when compared with testing in reference laboratories (turnaround time of 17–125 days).40 Similar results are found in middleincome and highincome countries.57,58
As other commercial multidisease platforms now exist (table), countries with existing (or planning on purchasing) multidisease platforms should consider collaborating to integrate HIV and hepatitis C viral load, or tuberculosis testing or both. This testing includes both highthroughput laboratorybased instruments for HIV viral load measurement and near pointofcare instruments, such as GeneXpert systems for HIV, hepatitis C virus, and tuberculosis.23
This array of available assays offers a range of possibilities for highthroughput and nearpointofcare diagnostics for tuberculosis, HIV, and hepatitis C. These new techniques also offer the potential of using more generalist rather than specialist staff.60 The portability of pointofcare platforms might make it possible to decentralise firstline diagnosis and monitoring, taking services directly to affected communities, and enabling service delivery in proximity settings (eg, community centres or mobile units in outreach settings), and so maximising access.
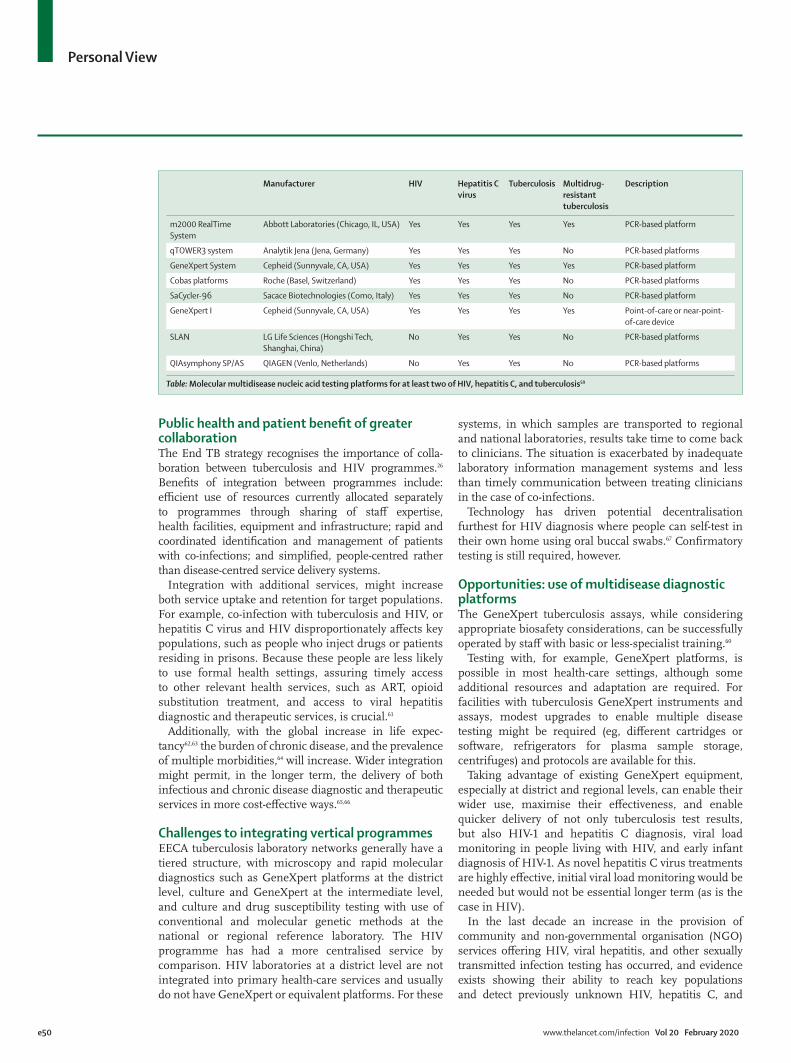
e50 www.thelancet.com/infection Vol 20 February 2020
Personal View
Public health and patient benefit of greater collaborationThe End TB strategy recognises the importance of collaboration between tuberculosis and HIV programmes.26 Benefits of integration between programmes include: efficient use of resources currently allocated separately to programmes through sharing of staff expertise, health facilities, equipment and infrastructure; rapid and coordinated identification and management of patients with coinfections; and simplified, peoplecentred rather than diseasecentred service delivery systems.
Integration with additional services, might increase both service uptake and retention for target populations. For example, coinfection with tuberculosis and HIV, or hepatitis C virus and HIV disproportionately affects key populations, such as people who inject drugs or patients residing in prisons. Because these people are less likely to use formal health settings, assuring timely access to other relevant health services, such as ART, opioid substitution treatment, and access to viral hepatitis diagnostic and therapeutic services, is crucial.61
Additionally, with the global increase in life expectancy62,63 the burden of chronic disease, and the prevalence of multiple morbidities,64 will increase. Wider integration might permit, in the longer term, the delivery of both infectious and chronic disease diagnostic and therapeutic services in more costeffective ways.65,66
Challenges to integrating vertical programmesEECA tuberculosis laboratory networks generally have a tiered structure, with microscopy and rapid molecular diagnostics such as GeneXpert platforms at the district level, culture and GeneXpert at the intermediate level, and culture and drug susceptibility testing with use of conventional and molecular genetic methods at the national or regional reference laboratory. The HIV programme has had a more centralised service by comparison. HIV laboratories at a district level are not integrated into primary healthcare services and usually do not have GeneXpert or equivalent platforms. For these
systems, in which samples are transported to regional and national laboratories, results take time to come back to clinicians. The situation is exacerbated by inadequate laboratory information management systems and less than timely communication between treating clinicians in the case of coinfections.
Technology has driven potential decentralisation furthest for HIV diagnosis where people can selftest in their own home using oral buccal swabs.67 Confirmatory testing is still required, however.
Opportunities: use of multidisease diagnostic platformsThe GeneXpert tuberculosis assays, while considering appropriate bio safety considerations, can be successfully operated by staff with basic or lessspecialist training.60
Testing with, for example, GeneXpert platforms, is possible in most healthcare settings, although some additional resources and adaptation are required. For facilities with tuberculosis GeneXpert instruments and assays, modest upgrades to enable multiple disease testing might be required (eg, different cartridges or software, refrigerators for plasma sample storage, centrifuges) and protocols are available for this.
Taking advantage of existing GeneXpert equipment, especially at district and regional levels, can enable their wider use, maximise their effectiveness, and enable quicker delivery of not only tuberculosis test results, but also HIV1 and hepatitis C diagnosis, viral load monitoring in people living with HIV, and early infant diagnosis of HIV1. As novel hepatitis C virus treatments are highly effective, initial viral load monitoring would be needed but would not be essential longer term (as is the case in HIV).
In the last decade an increase in the provision of community and nongovernmental organisation (NGO) services offering HIV, viral hepatitis, and other sexually transmitted infection testing has occurred, and evidence exists showing their ability to reach key populations and detect previously unknown HIV, hepatitis C, and
Manufacturer HIV Hepatitis C virus
Tuberculosis Multidrug-resistant tuberculosis
Description
m2000 RealTime System
Abbott Laboratories (Chicago, IL, USA) Yes Yes Yes Yes PCR-based platform
qTOWER3 system Analytik Jena (Jena, Germany) Yes Yes Yes No PCR-based platforms
GeneXpert System Cepheid (Sunnyvale, CA, USA) Yes Yes Yes Yes PCR-based platform
Cobas platforms Roche (Basel, Switzerland) Yes Yes Yes No PCR-based platforms
SaCycler-96 Sacace Biotechnologies (Como, Italy) Yes Yes Yes No PCR-based platform
GeneXpert I Cepheid (Sunnyvale, CA, USA) Yes Yes Yes Yes Point-of-care or near-point-of-care device
SLAN LG Life Sciences (Hongshi Tech, Shanghai, China)
No Yes Yes No PCR-based platforms
QIAsymphony SP/AS QIAGEN (Venlo, Netherlands) No Yes Yes No PCR-based platforms
Table: Molecular multidisease nucleic acid testing platforms for at least two of HIV, hepatitis C, and tuberculosis59
www.thelancet.com/infection Vol 20 February 2020 e51
Personal View
hepatitis B infections.49,50,68–70 Although most of these services use rapid serological tests and often do not have the equipment for more complex procedures, some have incorporated pointofcare platforms, which allow diagnosis of HIV and other infections.
The sharing of technological platforms will also facilitate implementation of modern diagnostic connectivity solutions leading to streamlining of record keeping of test results and better communication and followup.
Efficient use of restricted fundingThe balance between diseasespecific programmes and strategies, and the need for further integration and strengthening of health services, has received attention from the Global Fund not only at a strategic,71 but also at an implementation level.72
Currently the Global Fund, which supports diagnostic activities in many countries, has requested that ministries of health shift from donor budget funding to state budget funding covering at least 30% of all activities and ideally 100% of costs through domestic funds by the end of 2020.73 This change makes consideration of the value of integration of separate tuberculosis, HIV, and hepatitis C diagnostic services more crucial and multidisease diagnostic platforms make this possible.
Promoting change: the role of governments, donors, and international organisationsPolitical and donor support, and civil society advocacy for greater integration of diagnostic services for tubercu losis, HIV, and viral hepatitis are necessary. So far, contributions from governments, international NGOs, and publicprivate partnerships have improved access to the GeneXpert platforms following the WHO recommendation for their use in 2010, which led to a transformation of tuberculosis and rifampicinresistance testing globally.74
Ministries of health are key for moving forward the integration of these services. However, political willingness needs to be supported and complemented by streamlined communication with donors, and funding strategies of national and international agencies need to be in line with this goal. Stimulating the development of solid investment cases and fostering the involvement of ministries of finance in the planning and analysis of integrated service delivery models might help systematiclevel change because increasing effectiveness without increasing resource allocation is a rare opportunity.
Additionally, reduced requirement for external resources (by maximising the use of diagnostic equipment) within the national health systems will be an added benefit for countries and the people affected by these diseases.
Programme managers (and laboratory experts) have a key role in maximising patient outcomes and costeffectiveness by deciding on placement of multidisease diagnostic platforms and determining testing volumes, reliable sample and result transport systems, and human resource capacity. For example, because of their
experience of using GeneXpert platforms in tuberculosis services, HIV or hepatitis C viral load testing could be easily delegated to tuberculosis laboratory technicians with existing practical experience of Xpert MTB/RIF testing. This shared experience includes training on regular maintenance, troubleshooting, annual calibration, and replacement of modules.
Having a single, efficient sample transport system building on any existing well functioning incountry system would also be more beneficial than having completely parallel systems.
ConclusionEvidence supports the feasibility of integrated diagnostic testing using multidisease diagnostic platforms within district and subdistrict health facilities.40 Improved access to optimised laboratorybased testing services would be mutually beneficial for tuberculosis, HIV, and hepatitis C programmes.ContributorsThe initial draft was prepared by MD, SE, GK, DS, and FD. The revised version was produced by FD. MD, and FD contributed equally to the Personal View. All remaining authors contributed equally to rewriting and producing the final draft.
Declaration of interestsWe declare no competing interests.
AcknowledgmentsWe would like to acknowledge the careful input of Léa Clapier throughout the process, specifically for the table.
References
1 Lin SY, Desmond E. Molecular diagnosis of tuberculosis and drug resistance. Clin Lab Med 2014; 34: 297–314.
2 Vittor AY, Garland JM, Gilman RH. Molecular Diagnosis of TB in the HIV Positive Population. Ann Glob Health 2014; 80: 476–85.
3 Stevens WS, Scott L, Noble L, Gous N, Dheda K. Impact of the GeneXpert MTB/RIF technology on tuberculosis control. Microbiol Spect 2017; published online Feb 3. DOI:10.1128/microbiolspec.TBTB200402016.
4 Tagliani E, Cabibbe AM, Miotto P, et al. Diagnostic performance of the new version (v2.0) of GenoType MTBDRs/assay for detection of resistance to fluoroquinolones and secondline injectable drugs: a multicenter study. J Clin Microbiol 2015; 53: 2961–69
5 Zignol M, Dean AS, Alikhanova N, et al. Populationbased resistance of Mycobacterium tuberculosis isolates to pyrazinamide and fluoroquinolones: results from a multicountry surveillance project. Lancet Infect Dis 2016; 16: 1185–1192.
6 Miotto P, Tessema B, Tagliani E, et al. A standardised method for interpreting the association between mutations and phenotypic drug resistance in Mycobacterium tuberculosis. Eur Respir J 2017; 50: 1701354.
7 Cirillo DM, Miotto P, Tortoli E. Evolution of phenotypic and molecular drug susceptibility testing. Adv Exp Med Biol 2017; 1019: 221–46.
8 Miotto P, Cabibbe AM, Feuerriegel S, et al. Mycobacterium tuberculosis pyrazinamide resistance determinants: a multicenter study. MBio 2014; 5: e0181914.
9 Yadon AN, Maharaj K, Adamson JH, et al. A comprehensive characterization of PncA polymorphisms that confer resistance to pyrazinamide. Nat Commun 2017; 8: 588.
10 Casali N, Nikolayevskyy V, Yanina B, et al. Microevolution of extensively drugresistant tuberculosis in Russia. Genome Res 2012; 22: 735–45.
11 Walker T, AllixBeguec C, Arandjelovic I, et al. Prediction of susceptibility to firstline tuberculosis drugs by DNA sequencing. N Engl J Med 2018; 379: 1403–15.
e52 www.thelancet.com/infection Vol 20 February 2020
Personal View
12 Lange C, Alghamdi WA, AlShaer MH, et al. Perspectives for personalized therapy for patients with multidrugresistant tuberculosis. J Intern Med 2018; published online May 28. DOI:10.1111/joim.12780.
13 Yu X, Weber IT, Harrison RW. Identifying representative drug resistant mutants of HIV. BMC Bioinformatics 2015; 16 (suppl 17): S1.
14 Walker TM, Kohl TA, Omar SV, et al. Wholegenome sequencing for prediction of Mycobacterium tuberculosis drug susceptibility and resistance: a retrospective cohort study. Lancet Infect Dis 2015; 15: 1193–202.
15 Casali N, Nikolayevskyy V, Balabanova Y, et al. Evolution and transmission of drug resistant tuberculosis in a Russian population. Nature Genet 2014; 46: 279–86.
16 Papaventsis D, Casali N, Kontsevaya I, Drobniewski F, Cirillo DN, Nikolayevskyy V. Whole genome sequencing of Mycobacterium tuberculosis for detection of drug resistance: a systematic review. Clin Microbiol Infect 2017; 23: 61–68.
17 Brown AC, Bryant JM, EinerJensen K, et al. Rapid wholegenome sequencing of Mycobacterium tuberculosis isolates directly from clinical samples. J Clin Microbiol 2015; 53: 2230–37.
18 Doughty EL, Sergeant MJ, Adetifa I, Antonio M, Pallen MJ. Cultureindependent detection and characterisation of Mycobacterium tuberculosis and M africanum in sputum samples using shotgun metagenomics on a benchtop sequencer. Peer J 2014; 2: e585.
19 Votintseva AA, Bradley P, Pankhurst L, et al. Sameday diagnostic and surveillance data for tuberculosis via wholegenome sequencing of direct respiratory samples. J Clin Microbiol 2017; 55: 1285–98.
20 Makhado NA, Matabane E, Faccin M, et al. Outbreak of multidrugresistant tuberculosis in South Africa undetected by WHOendorsed commercial tests: an observational study. Lancet Infect Dis 2018; 18: 1350–59.
21 WHO. HIV assays: laboratory performance and other operational characteristics rapid diagnostic tests (combined detection of hiv1/2 antibodies and discriminatory detection of HIV1 and HIV2 antibodies. Geneva: World Health Organization, 2015.
22 WHO. Guidelines on hepatitis B and C testing. Geneva: World Health Organization, 2017.
23 WHO. Guidelines for the care and treatment of persons diagnosed with chronic hepatitis C virus infection. Geneva: World Health Organization, 2018.
24 UN. Political declaration of the UN General Assembly highlevel meeting on the fight against tuberculosis. Resolution A/RES/73/3. New York, NY: United Nations, 2018. https://www.who.int/tb/unhlmonTBDeclaration.pdf (accessed Aug 01, 2019).
25 UN. Political declaration on HIV and AIDS: on the fast track to accelerating the fight against HIV and to ending the AIDS epidemic by 2030. Resolution 70/266. New York, NY: United Nations, 2016.
26 WHO. Global strategy and targets for tuberculosis prevention, care and control after 2015. Geneva: World Health Organization, 2014.
27 WHO. Global health sector strategy on HIV, 2016–2021. Geneva: World Health Organization, 2016.
28 WHO. Global health sector strategy on viral hepatitis 2016–2021. Geneva: World Health Organization; 2016.
29 WHO. Roadmap to implement the tuberculosis action plan for the WHO European Region 2016–2020. Towards ending tuberculosis and multidrugresistant tuberculosis (2016). Copenhagen: World Health Organization, 2016.
30 WHO. Action plan for the health sector response to HIV in the WHO European Region. Copenhagen: World Health Organization, 2017.
31 WHO. Action plan for the health sector response to viral hepatitis in the WHO European region. Copenhagen: World Health Organization, 2017.
32 WHO. Report of the 65th session of the WHO Regional Committee for Europe. Vilnius: World Health Organization, 2015.
33 WHO. Report of the 66th session of the WHO Regional Committee for Europe. Copenhagen: World Health Organization, 2016.
34 WHO. Antiretroviral therapy coverage estimates by WHO region. World Health Organization. 2018. http://apps.who.int/gho/data/view.main.23300REGION?lang=en (accessed Dec 15, 2018).
35 European Centre for Disease Prevention and Control, WHO Regional Office for Europe. HIV/AIDS surveillance in Europe 2018–2017 data. Copenhagen: WHO Regional Office for Europe; 2018.
36 WHO. Global tuberculosis report 2018. Geneva: World Health Organization, 2018.
37 Gao J, Zheng P, Fu H. Prevalence of TB/HIV coinfection in countries except China: a systematic review and metaanalysis. PLoS One 2013; 8: e64915.
38 WHO. Consolidated guidelines on the use of antiretroviral drugs for treating and preventing HIV infection: recommendations for a public health approach, 2nd edn. Geneva: World Health Organization, 2016.
39 WHO. Progress report 2016. Prevent HIV, Test and Treat all. Geneva: World Health Organization, 2016.
40 Ndlovu Z, Fajardo E, Mbofana E, et al. Multidisease testing for HIV and TB using the GeneXpert platform: a feasibility study in rural Zimbabwe. PLoS One 2018; 13: e0193577.
41 UNAIDS. Get on the fasttrack. The life cycle approach to HIV. Finding solutions at every stage of life. Geneva: Joint United Nations Programme on HIV/AIDS, 2016.
42 Moore C. Pointofcare tests for infection control: should rapid testing be in the laboratory or at the front line? J Hosp Infect 2013; 85: 1–7.
43 Roberts T, Bygrave H, Fajardo E, Ford N. Challenges and opportunities for the implementation of virological testing in resourcelimited settings. J Int AIDS Soc 2012; 15: 17324.
44 MashambaThompson TP, Jama NA, Santorius B, Drain PK, Thompson RM. Implementation of pointofcare diagnostics in rural primary healthcare clinics in South Africa: perspectives of key stakeholders Diagnostics (Basel) 2017; 7: e3.
45 Stevens W, Gous N, Ford N, Scott LE. Feasibility of HIV pointofcare tests for resourcelimited settings: challenges and solutions. BMC Med 2014; 12: 173.
46 WHO. HIV/AIDS treatment and care in Georgia. Copenhagen: World Health Organization, 2014.
47 UNAIDS. Global AIDS monitoring 2018—indicators for monitoring the 2016 United Nations political declaration on ending AIDS. Geneva: Joint United Nations Programme on HIV/AIDS, 2017.
48 UNAIDS. Ending AIDS: progress towards the 909090 targets. Geneva: Joint United Nations Programme on HIV/AIDS, 2017.
49 WHO. Consolidated guidelines on HIV testing services. Geneva: World Health Organization, 2015.
50 ECDC. Public health guidance on HIV, hepatitis B and C testing in the EU/EEA. Stockholm: European Centre for Disease Prevention and Control, 2018.
51 WHO. WHO endorses new rapid tuberculosis test. Geneva: World Health Organization, 2010 https://www.who.int/mediacentre/news/releases/2010/tb_test_20101208/en/ (accessed Dec 17, 2018).
52 Cepheid. WHO prequalification of in vitro diagnostics public report product: Xpert HCV Viral Load with GeneXpert Dx, GeneXpert Infinity48s, and GeneXpert Infinity80. Solna: Cepheid, 2017.
53 Cepheid. WHO prequalification of in vitro diagnostics public report product: Xpert HIV1 qual assay. Solna: Cepheid, 2016.
54 Mor O, Gozlan Y, Wax M, et al. Evaluation of the RealTime HIV1, Xpert HIV1, and Aptima HIV1 Quant Dx assays in comparison to the NucliSens EasyQ HIV1 v2.0 assay for quantification of HIV1 viral load. J Clin Microbiol 2015; 53: 3458–65.
55 Nash M, Huddart S, Badar S, Baliga S, Saravu K, Pai M. Performance of the Xpert HIV1 viral load assay: a systematic review and metaanalysis. J Clin Microbiol 2018; 56: e0167317.
56 Gupta E, Agarwala P, Kumar G, Maiwall R, Sarin S. Pointofcare testing (POCT) in molecular diagnostics: performance evaluation of GeneXpert HCV RNA test in diagnosing and monitoring of HCV infection. J Clin Virol 2017; 88: 46–51.
57 Lisboa M, Fronteira I, Colove E, Nhamonga M, do Rosario O, Martins M. Time delay and associated mortality from negative smear to positive Xpert MTB/RIF test among TB/HIV patients: a retrospective study. BMC Infect Dis 2019; 19: 18.
58 Drobniewski F, Cooke M, Jordan J, et al. Systematic review, metaanalysis and economic modelling of molecular diagnostic tests for antibiotic resistance in tuberculosis. Health Technol Assess 2015; 19: 1–188.
www.thelancet.com/infection Vol 20 February 2020 e53
Personal View
59 Unitaid. Multidisease diagnostic landscape for integrated management of HIV, HCV, TB and other coinfections. January 2018. https://unitaid.org/assets/multidiseasediagnosticslandscapeforintegratedmanagementofHIVHCVTBandothercoinfectionsjanuary2018.pdf (accessed Aug 01, 2019).
60 Creswell J, Codlin AJ, Andre E, et al. Results from early programmatic implementation of Xpert MTB/RIF testing in nine countries. BMC Infect Dis 2014; 14: 2.
61 WHO. WHO policy on collaborative TB/HIV activities: guidelines for national programmes and other stakeholders. Geneva: World Health Organization, 2012.
62 WHO. Global Health Estimates. https://www.who.int/healthinfo/global_burden_disease/en/ (accessed Dec 17, 2018).
63 Bloom D, Chatterji S, Kowal P, et al. Macroeconomic implications of population ageing and selected policy responses. Lancet 2015; 385: 649–57.
64 Vos T, Barber RM, Bell B, et al. Global, regional, and national incidence, prevalence, and years lived with disability for 301 acute and chronic diseases and injuries in 188 countries, 1990–2013: a systematic analysis for the Global Burden of Disease Study 2013. Lancet 2015; 386: 743–800.
65 Ho J, Byrne AL, Linh NN, Jaramillo E, Fox GJ. Decentralized care for multidrugresistant tuberculosis: a systematic review and metaanalysis. Bull World Health Organ 2017; 95: 584–93.
66 Vojnov L, Markby J, Boeke C, Harris L, Ford N, Peter T. POC CD4 Testing improves linkage to HIV care and timeliness of ART initiation in a public health approach: a systematic review and metaanalysis. PLoS One 2016; 11: e0155256.
67 Figueroa C, Johnson C, Verster A, Baggaley R. Attitudes and acceptability on HIV selftesting among key populations: a literature review. AIDS Behav 2015; 19: 1949–65.
68 FernàndezLópez L, ReyesUrueña J, Agusti C, et al. The COBATEST network: monitoring and evaluation of HIV communitybased practices in Europe, 2014–2016. HIV Med 2018; 19 (suppl 1): 21–26.
69 Strömdahl S, Hickson F, Pharris A, Sabido M, Baral S, Thorson A. A systematic review of evidence to inform HIV prevention interventions among men who have sex with men in Europe. Euro Surveill 2015; 20: 21096.
70 Meulbroek M, Pujol F, Pérez F, et al. BCN Checkpoint: sameday confirmation of reactive HIV rapid test with point of care HIVRNA accelerates linkage to care and reduces anxiety. HIV Med 2018; 19 (suppl 1): 63–65.
71 The Global Fund to Fight AIDS, Tuberculosis and Malaria. The Global Fund Strategy 2017–2022. Geneva: The Global Fund to Fight AIDS, Tuberculosis and Malaria, 2017.
72 The Global Fund to Fight AIDS, Tuberculosis and Malaria. Building resilient and sustainable systems for health through global fund investments information. Geneva: The Global Fund to Fight AIDS, Tuberculosis and Malaria, 2017.
73 The Global Fund The Global Fund Strategy 20172022investing to end epidemics. 2017. https://www.theglobalfund.org/media/2531/core_globalfundstrategy20172022_strategy_en.pdf (accessed Dec 28, 2019).
74 Dolen V, Bahk K, Carroll K, Klugman K, Ledeboer N, Miller M. Changing diagnostic paradigms for microbiology: report on an American academy of microbiology colloquium held in Washington, DC, from 17 to 18 October 2016. Washington, DC: American Society for Microbiology, 2017.
© 2019. World Health Organization. Published by Elsevier Ltd/Inc/BV. All rights reserved.
View publication statsView publication stats
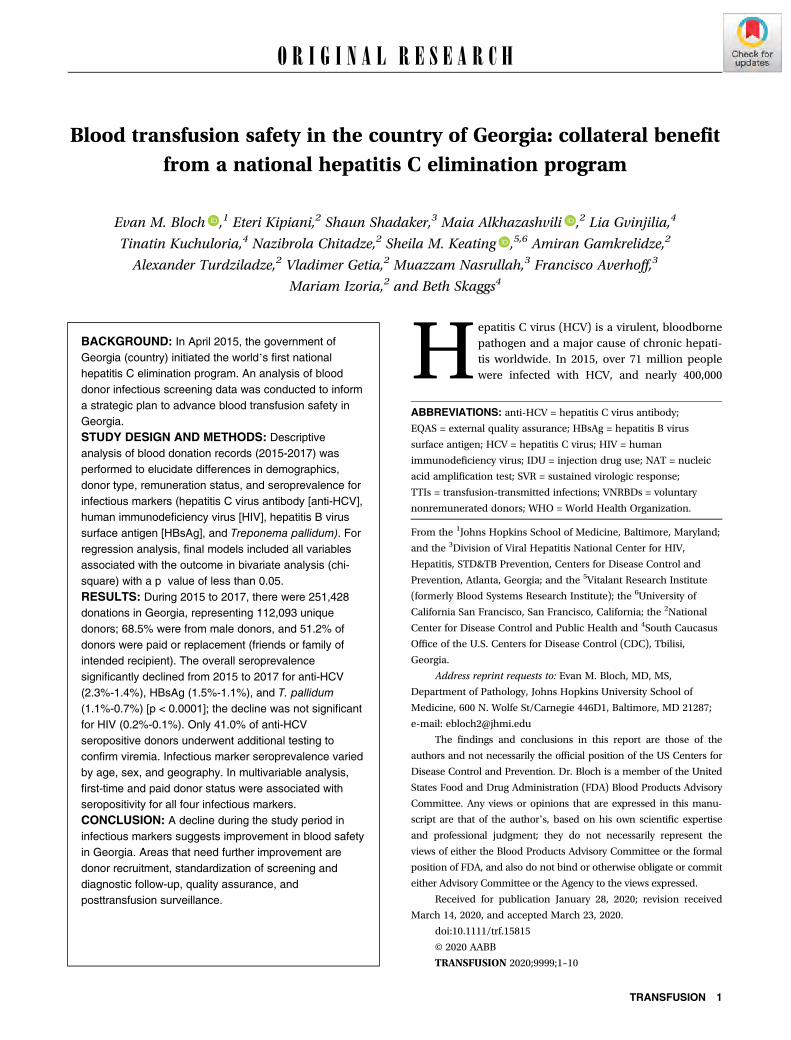
O R I G I N A L R E S E A R C H
Blood transfusion safety in the country of Georgia: collateral benefitfrom a national hepatitis C elimination program
Evan M. Bloch ,1 Eteri Kipiani,2 Shaun Shadaker,3 Maia Alkhazashvili ,2 Lia Gvinjilia,4
Tinatin Kuchuloria,4 Nazibrola Chitadze,2 Sheila M. Keating ,5,6 Amiran Gamkrelidze,2
Alexander Turdziladze,2 Vladimer Getia,2 Muazzam Nasrullah,3 Francisco Averhoff,3
Mariam Izoria,2 and Beth Skaggs4
BACKGROUND: In April 2015, the government ofGeorgia (country) initiated the worldʼs first nationalhepatitis C elimination program. An analysis of blooddonor infectious screening data was conducted to informa strategic plan to advance blood transfusion safety inGeorgia.STUDY DESIGN AND METHODS: Descriptiveanalysis of blood donation records (2015-2017) wasperformed to elucidate differences in demographics,donor type, remuneration status, and seroprevalence forinfectious markers (hepatitis C virus antibody [anti-HCV],human immunodeficiency virus [HIV], hepatitis B virussurface antigen [HBsAg], and Treponema pallidum). Forregression analysis, final models included all variablesassociated with the outcome in bivariate analysis (chi-square) with a p value of less than 0.05.RESULTS: During 2015 to 2017, there were 251,428donations in Georgia, representing 112,093 uniquedonors; 68.5% were from male donors, and 51.2% ofdonors were paid or replacement (friends or family ofintended recipient). The overall seroprevalencesignificantly declined from 2015 to 2017 for anti-HCV(2.3%-1.4%), HBsAg (1.5%-1.1%), and T. pallidum(1.1%-0.7%) [p < 0.0001]; the decline was not significantfor HIV (0.2%-0.1%). Only 41.0% of anti-HCVseropositive donors underwent additional testing toconfirm viremia. Infectious marker seroprevalence variedby age, sex, and geography. In multivariable analysis,first-time and paid donor status were associated withseropositivity for all four infectious markers.CONCLUSION: A decline during the study period ininfectious markers suggests improvement in blood safetyin Georgia. Areas that need further improvement aredonor recruitment, standardization of screening anddiagnostic follow-up, quality assurance, andposttransfusion surveillance.
Hepatitis C virus (HCV) is a virulent, bloodbornepathogen and a major cause of chronic hepati-tis worldwide. In 2015, over 71 million peoplewere infected with HCV, and nearly 400,000
ABBREVIATIONS: anti-HCV = hepatitis C virus antibody;
EQAS = external quality assurance; HBsAg = hepatitis B virus
surface antigen; HCV = hepatitis C virus; HIV = human
immunodeficiency virus; IDU = injection drug use; NAT = nucleic
acid amplification test; SVR = sustained virologic response;
TTIs = transfusion-transmitted infections; VNRBDs = voluntary
nonremunerated donors; WHO = World Health Organization.
From the 1Johns Hopkins School of Medicine, Baltimore, Maryland;
and the 3Division of Viral Hepatitis National Center for HIV,
Hepatitis, STD&TB Prevention, Centers for Disease Control and
Prevention, Atlanta, Georgia; and the 5Vitalant Research Institute
(formerly Blood Systems Research Institute); the 6University of
California San Francisco, San Francisco, California; the 2National
Center for Disease Control and Public Health and 4South Caucasus
Office of the U.S. Centers for Disease Control (CDC), Tbilisi,
Georgia.
Address reprint requests to: Evan M. Bloch, MD, MS,
Department of Pathology, Johns Hopkins University School of
Medicine, 600 N. Wolfe St/Carnegie 446D1, Baltimore, MD 21287;
e-mail: [email protected]
The findings and conclusions in this report are those of the
authors and not necessarily the official position of the US Centers for
Disease Control and Prevention. Dr. Bloch is a member of the United
States Food and Drug Administration (FDA) Blood Products Advisory
Committee. Any views or opinions that are expressed in this manu-
script are that of the authorʼs, based on his own scientific expertise
and professional judgment; they do not necessarily represent the
views of either the Blood Products Advisory Committee or the formal
position of FDA, and also do not bind or otherwise obligate or commit
either Advisory Committee or the Agency to the views expressed.
Received for publication January 28, 2020; revision received
March 14, 2020, and accepted March 23, 2020.
doi:10.1111/trf.15815
© 2020 AABB
TRANSFUSION 2020;9999;1–10
TRANSFUSION 1
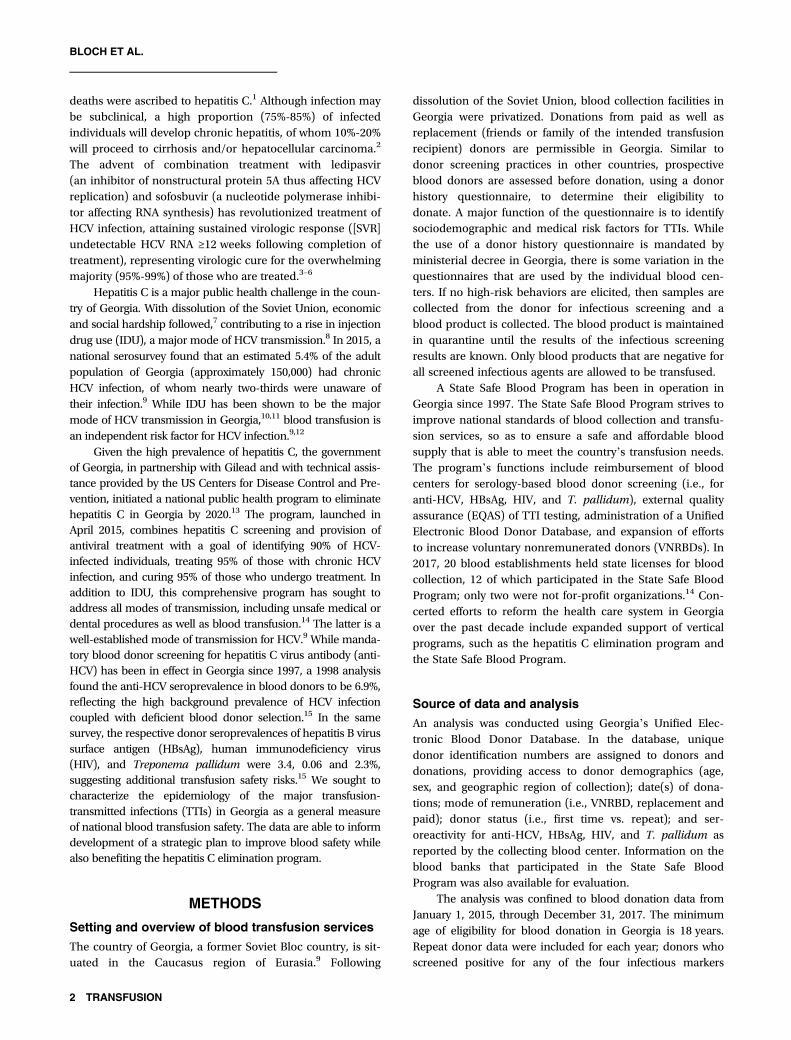
deaths were ascribed to hepatitis C.1 Although infection maybe subclinical, a high proportion (75%-85%) of infectedindividuals will develop chronic hepatitis, of whom 10%-20%will proceed to cirrhosis and/or hepatocellular carcinoma.2
The advent of combination treatment with ledipasvir(an inhibitor of nonstructural protein 5A thus affecting HCVreplication) and sofosbuvir (a nucleotide polymerase inhibi-tor affecting RNA synthesis) has revolutionized treatment ofHCV infection, attaining sustained virologic response ([SVR]undetectable HCV RNA ≥12 weeks following completion oftreatment), representing virologic cure for the overwhelmingmajority (95%-99%) of those who are treated.3–6
Hepatitis C is a major public health challenge in the coun-try of Georgia. With dissolution of the Soviet Union, economicand social hardship followed,7 contributing to a rise in injectiondrug use (IDU), a major mode of HCV transmission.8 In 2015, anational serosurvey found that an estimated 5.4% of the adultpopulation of Georgia (approximately 150,000) had chronicHCV infection, of whom nearly two-thirds were unaware oftheir infection.9 While IDU has been shown to be the majormode of HCV transmission in Georgia,10,11 blood transfusion isan independent risk factor for HCV infection.9,12
Given the high prevalence of hepatitis C, the governmentof Georgia, in partnership with Gilead and with technical assis-tance provided by the US Centers for Disease Control and Pre-vention, initiated a national public health program to eliminatehepatitis C in Georgia by 2020.13 The program, launched inApril 2015, combines hepatitis C screening and provision ofantiviral treatment with a goal of identifying 90% of HCV-infected individuals, treating 95% of those with chronic HCVinfection, and curing 95% of those who undergo treatment. Inaddition to IDU, this comprehensive program has sought toaddress all modes of transmission, including unsafe medical ordental procedures as well as blood transfusion.14 The latter is awell-established mode of transmission for HCV.9 While manda-tory blood donor screening for hepatitis C virus antibody (anti-HCV) has been in effect in Georgia since 1997, a 1998 analysisfound the anti-HCV seroprevalence in blood donors to be 6.9%,reflecting the high background prevalence of HCV infectioncoupled with deficient blood donor selection.15 In the samesurvey, the respective donor seroprevalences of hepatitis B virussurface antigen (HBsAg), human immunodeficiency virus(HIV), and Treponema pallidum were 3.4, 0.06 and 2.3%,suggesting additional transfusion safety risks.15 We sought tocharacterize the epidemiology of the major transfusion-transmitted infections (TTIs) in Georgia as a general measureof national blood transfusion safety. The data are able to informdevelopment of a strategic plan to improve blood safety whilealso benefiting the hepatitis C elimination program.
METHODS
Setting and overview of blood transfusion services
The country of Georgia, a former Soviet Bloc country, is sit-uated in the Caucasus region of Eurasia.9 Following
dissolution of the Soviet Union, blood collection facilities inGeorgia were privatized. Donations from paid as well asreplacement (friends or family of the intended transfusionrecipient) donors are permissible in Georgia. Similar todonor screening practices in other countries, prospectiveblood donors are assessed before donation, using a donorhistory questionnaire, to determine their eligibility todonate. A major function of the questionnaire is to identifysociodemographic and medical risk factors for TTIs. Whilethe use of a donor history questionnaire is mandated byministerial decree in Georgia, there is some variation in thequestionnaires that are used by the individual blood cen-ters. If no high-risk behaviors are elicited, then samples arecollected from the donor for infectious screening and ablood product is collected. The blood product is maintainedin quarantine until the results of the infectious screeningresults are known. Only blood products that are negative forall screened infectious agents are allowed to be transfused.
A State Safe Blood Program has been in operation inGeorgia since 1997. The State Safe Blood Program strives toimprove national standards of blood collection and transfu-sion services, so as to ensure a safe and affordable bloodsupply that is able to meet the countryʼs transfusion needs.The programʼs functions include reimbursement of bloodcenters for serology-based blood donor screening (i.e., foranti-HCV, HBsAg, HIV, and T. pallidum), external qualityassurance (EQAS) of TTI testing, administration of a UnifiedElectronic Blood Donor Database, and expansion of effortsto increase voluntary nonremunerated donors (VNRBDs). In2017, 20 blood establishments held state licenses for bloodcollection, 12 of which participated in the State Safe BloodProgram; only two were not for-profit organizations.14 Con-certed efforts to reform the health care system in Georgiaover the past decade include expanded support of verticalprograms, such as the hepatitis C elimination program andthe State Safe Blood Program.
Source of data and analysis
An analysis was conducted using Georgiaʼs Unified Elec-tronic Blood Donor Database. In the database, uniquedonor identification numbers are assigned to donors anddonations, providing access to donor demographics (age,sex, and geographic region of collection); date(s) of dona-tions; mode of remuneration (i.e., VNRBD, replacement andpaid); donor status (i.e., first time vs. repeat); and ser-oreactivity for anti-HCV, HBsAg, HIV, and T. pallidum asreported by the collecting blood center. Information on theblood banks that participated in the State Safe BloodProgram was also available for evaluation.
The analysis was confined to blood donation data fromJanuary 1, 2015, through December 31, 2017. The minimumage of eligibility for blood donation in Georgia is 18 years.Repeat donor data were included for each year; donors whoscreened positive for any of the four infectious markers
2 TRANSFUSION
BLOCH ET AL.

(i.e., HIV, HBsAg, anti-HCV, or T. pallidum) in any of theirdonations within the study period were reported as positivefor that marker. When we analyzed overall findings for thecombined 3 years, 2015 through 2017, repeat donor data werecounted once and seroreactive results for any donation wereprioritized for reporting. The overall 3-year (2015-2017) resultsthat are shown represent cumulative infection prevalencerates over the 3-year period. Thus, the “overall” data reportedare not a simple summation of the individual years. If donorshad multiple donations within the study period with differentlevels of remuneration, paid donor status was prioritized,followed by VNRBD and finally replacement. Final remunera-tion status was assigned accordingly. Individuals with morethan one blood donation were classified as repeat donors. Ageand region of donation were reported based on the donorʼsfirst/earliest donation in the study period.
For this analysis, paid donors refers to individuals whoreceived monetary compensation for their donation. Replace-ment donors comprised friends or family of the intendedtransfusion recipient; replacement donors were either rec-ruited to donate specifically for the index recipient or todonate with a view to restore the blood bank inventory fol-lowing the transfusion of the intended recipient. By contrast,VNRBDs have no direct knowledge of transfusion recipientsand receive no financial compensation for their donation.
Data management and statistical analysis
Descriptive analysis of donation records was performed toelucidate differences in demographics, donor type, remu-neration status, and infectious marker prevalence. Variableswith missing values for more than 10% of the sample areshown in the tables. Statistically significant associations inbivariate analysis were determined using chi-square testswith a significance level of p less than 0.05. For regressionanalysis, final models included all variables available forbivariate analysis (age, sex, region of donation, donor type,and remuneration status), which were tested for goodnessof fit and collinearity among predictors. For donors screen-ing positive for anti-HCV, analysis of their continuum ofcare, including treatment for hepatitis C, was obtained fromGeorgiaʼs national hepatitis C screening registry as well astreatment records from the countryʼs national hepatitis Celimination program, with results through December31, 2018. Computer software (SAS version 9.4, SAS Institute)was used for all statistical analyses.
RESULTS
A total of 252,019 donations were recorded during the studyperiod; 591 were excluded if the associated donorʼs age waseither missing or listed as less than 18 years. The final resultof 251,428 donations represents 112,093 unique adultdonors, corresponding to an average of 83,809 collectionsper year (Table 1). Of those donors, 68.5% were male
(n = 76,389), 44.7% (n = 50,098) were aged 18 to 29 years,and 51.2% were either paid (n = 30,806) or replacement(n = 26,570). Missing values were noted for sex (0.5%;n = 567) and remuneration (13.2%; n = 14,835). The major-ity were donated in Tbilisi (54.8%), followed by the regionsof Imereti (15.1%) and Kvemo Kartli (11.5%). The overalldonor prevalences for anti-HCV, HBsAg, HIV, andT. pallidum were 2.4, 1.7, 0.2 and 1.1%, respectively.
HCV
For anti-HCV, significant differences were seen by sex, age,and region in bivariate analysis (all p < 0.0001; Table 2). Thehighest rates were seen among male donors (2.8%), thoseaged 40 to 49 years (4.5%), and in the regions of Samegrelo(5.0%) and Shida Kartli (3.3%; Table 2). After adjusting forcovariates, first-time donors were more likely to be anti-HCV positive than repeat donors (odds ratio [OR], 7.95; 95%confidence interval [CI], 7.12-8.88), as were paid (OR, 3.59;95% CI, 3.21-4.02) and replacement donors (OR, 1.17; 95%CI, 1.02-1.34) as compared to VNRBDs (Table 3). Male(as compared to female) donors (OR, 2.37; 95% CI,2.15-2.61) and age groups 30 years or older (as compared tothose aged 18-29 years) were also more likely to be anti-HCV positive in the adjusted model. Anti-HCV positivityprevalence declined in donors from 2.3% in 2015 to 1.4% in2017, an overall decline of 39.9% (p < 0.0001; Table 1).
Overall, 2.4% (n = 2745) of adult donors tested anti-HCVpositive over the 3-year period. Of those, 41.0% (n = 1126)had an HCV nucleic acid amplification test (NAT) or HCVcore antigen test to determine viremia (Fig. 1). Of those whounderwent viremia testing, 78.6% (n = 885) had evidence ofactive infection, and 83.3% (n = 737) of those completed theadditional diagnostic workup and evaluation necessary forenrollment in the national hepatitis C elimination program.After enrollment, 98.1% (n = 723) initiated treatment and94.5% (n = 683) of those completed their treatment regimen.SVR, indicative of a cure, was ultimately achieved in 98.2% ofthose who were tested for SVR (n = 494/503).
HBV
In bivariate analysis, HBsAg positivity prevalence differedby sex, age, and region of donation (all p < 0.0001), andwas highest in males (2.0%), donors aged 30 to 39 (2.7%),and in the regions of Adjara (3.4%), Samegrelo (2.7%), andImereti (2.5%; Table 2). After adjusting for covariates, first-time donors (OR, 7.67; 95% CI, 6.66-8.84) were more likelyto be HBsAg positive as compared to repeat donors, aswere paid (OR, 2.00; 95% CI, 1.74-2.30) and replacement(OR, 1.25; 95% CI, 1.08-1.44) donors as compared to vol-unteers, males as compared to females (OR, 1.79; 95% CI,1.60-2.00) and age groups 30 years or older as comparedto those aged 18-29 years (Table 3). Donor hepatitis Bprevalence declined by 27.2% from 1.5% in 2015 to 1.1% in2017 (p < 0.0001; Table 1).
TRANSFUSION 3
HCV TRANSFUSION INITIATIVE GEORGIA
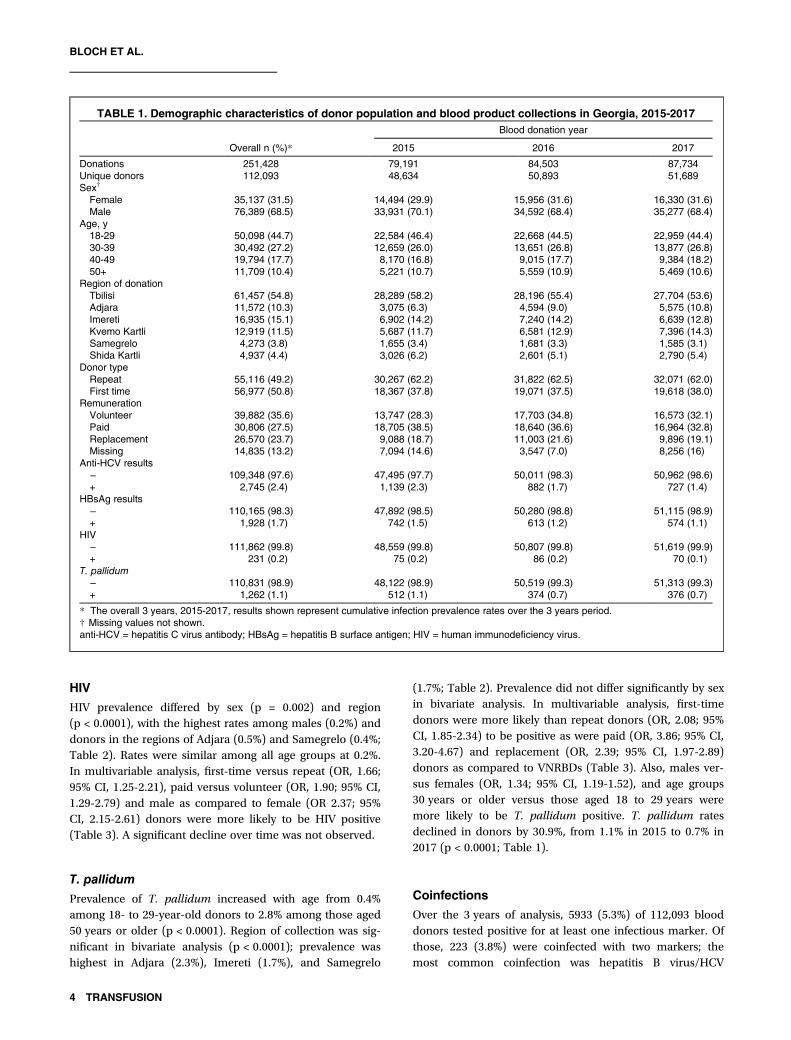
HIV
HIV prevalence differed by sex (p = 0.002) and region(p < 0.0001), with the highest rates among males (0.2%) anddonors in the regions of Adjara (0.5%) and Samegrelo (0.4%;Table 2). Rates were similar among all age groups at 0.2%.In multivariable analysis, first-time versus repeat (OR, 1.66;95% CI, 1.25-2.21), paid versus volunteer (OR, 1.90; 95% CI,1.29-2.79) and male as compared to female (OR 2.37; 95%CI, 2.15-2.61) donors were more likely to be HIV positive(Table 3). A significant decline over time was not observed.
T. pallidum
Prevalence of T. pallidum increased with age from 0.4%among 18- to 29-year-old donors to 2.8% among those aged50 years or older (p < 0.0001). Region of collection was sig-nificant in bivariate analysis (p < 0.0001); prevalence washighest in Adjara (2.3%), Imereti (1.7%), and Samegrelo
(1.7%; Table 2). Prevalence did not differ significantly by sexin bivariate analysis. In multivariable analysis, first-timedonors were more likely than repeat donors (OR, 2.08; 95%CI, 1.85-2.34) to be positive as were paid (OR, 3.86; 95% CI,3.20-4.67) and replacement (OR, 2.39; 95% CI, 1.97-2.89)donors as compared to VNRBDs (Table 3). Also, males ver-sus females (OR, 1.34; 95% CI, 1.19-1.52), and age groups30 years or older versus those aged 18 to 29 years weremore likely to be T. pallidum positive. T. pallidum ratesdeclined in donors by 30.9%, from 1.1% in 2015 to 0.7% in2017 (p < 0.0001; Table 1).
Coinfections
Over the 3 years of analysis, 5933 (5.3%) of 112,093 blooddonors tested positive for at least one infectious marker. Ofthose, 223 (3.8%) were coinfected with two markers; themost common coinfection was hepatitis B virus/HCV
TABLE 1. Demographic characteristics of donor population and blood product collections in Georgia, 2015-2017
Overall n (%)*
Blood donation year
2015 2016 2017
Donations 251,428 79,191 84,503 87,734Unique donors 112,093 48,634 50,893 51,689Sex†
Female 35,137 (31.5) 14,494 (29.9) 15,956 (31.6) 16,330 (31.6)Male 76,389 (68.5) 33,931 (70.1) 34,592 (68.4) 35,277 (68.4)
Age, y18-29 50,098 (44.7) 22,584 (46.4) 22,668 (44.5) 22,959 (44.4)30-39 30,492 (27.2) 12,659 (26.0) 13,651 (26.8) 13,877 (26.8)40-49 19,794 (17.7) 8,170 (16.8) 9,015 (17.7) 9,384 (18.2)50+ 11,709 (10.4) 5,221 (10.7) 5,559 (10.9) 5,469 (10.6)
Region of donationTbilisi 61,457 (54.8) 28,289 (58.2) 28,196 (55.4) 27,704 (53.6)Adjara 11,572 (10.3) 3,075 (6.3) 4,594 (9.0) 5,575 (10.8)Imereti 16,935 (15.1) 6,902 (14.2) 7,240 (14.2) 6,639 (12.8)Kvemo Kartli 12,919 (11.5) 5,687 (11.7) 6,581 (12.9) 7,396 (14.3)Samegrelo 4,273 (3.8) 1,655 (3.4) 1,681 (3.3) 1,585 (3.1)Shida Kartli 4,937 (4.4) 3,026 (6.2) 2,601 (5.1) 2,790 (5.4)
Donor typeRepeat 55,116 (49.2) 30,267 (62.2) 31,822 (62.5) 32,071 (62.0)First time 56,977 (50.8) 18,367 (37.8) 19,071 (37.5) 19,618 (38.0)
RemunerationVolunteer 39,882 (35.6) 13,747 (28.3) 17,703 (34.8) 16,573 (32.1)Paid 30,806 (27.5) 18,705 (38.5) 18,640 (36.6) 16,964 (32.8)Replacement 26,570 (23.7) 9,088 (18.7) 11,003 (21.6) 9,896 (19.1)Missing 14,835 (13.2) 7,094 (14.6) 3,547 (7.0) 8,256 (16)
Anti-HCV results− 109,348 (97.6) 47,495 (97.7) 50,011 (98.3) 50,962 (98.6)+ 2,745 (2.4) 1,139 (2.3) 882 (1.7) 727 (1.4)
HBsAg results− 110,165 (98.3) 47,892 (98.5) 50,280 (98.8) 51,115 (98.9)+ 1,928 (1.7) 742 (1.5) 613 (1.2) 574 (1.1)
HIV− 111,862 (99.8) 48,559 (99.8) 50,807 (99.8) 51,619 (99.9)+ 231 (0.2) 75 (0.2) 86 (0.2) 70 (0.1)
T. pallidum− 110,831 (98.9) 48,122 (98.9) 50,519 (99.3) 51,313 (99.3)+ 1,262 (1.1) 512 (1.1) 374 (0.7) 376 (0.7)
* The overall 3 years, 2015-2017, results shown represent cumulative infection prevalence rates over the 3 years period.† Missing values not shown.anti-HCV = hepatitis C virus antibody; HBsAg = hepatitis B surface antigen; HIV = human immunodeficiency virus.
4 TRANSFUSION
BLOCH ET AL.
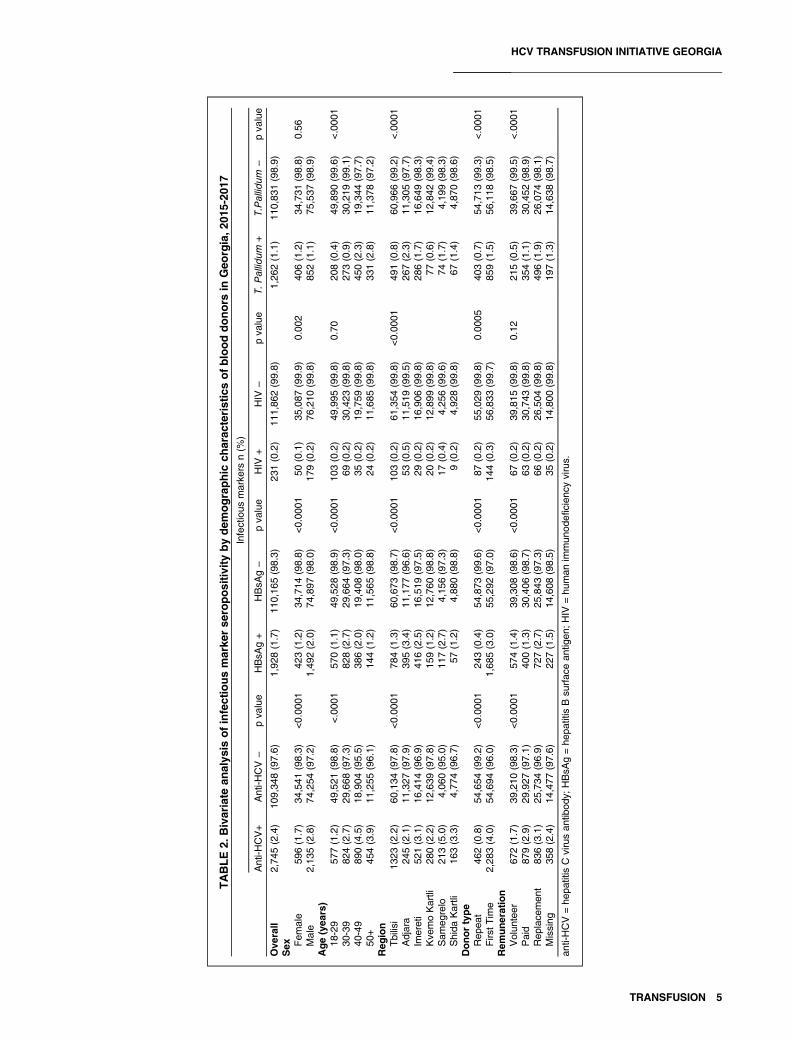
TABLE2.
Bivariate
analys
isofinfectiousmarke
rse
ropositivity
bydem
ographic
charac
teristicsofblooddonors
inGeo
rgia,2
015-20
17Infectious
marke
rsn(%
)
Anti-H
CV+
Anti-H
CV−
pva
lue
HBsA
g+
HBsA
g−
pva
lue
HIV
+HIV
−pva
lue
T.Pallid
um+
T.Pallid
um−
pva
lue
Ove
rall
2,74
5(2.4)
109,34
8(97.6)
1,92
8(1.7)
110,16
5(98.3)
231(0.2)
111,86
2(99.8)
1,26
2(1.1)
110,83
1(98.9)
Sex Fem
ale
596(1.7)
34,541
(98.3)
<0.00
0142
3(1.2)
34,714
(98.8)
<0.00
0150
(0.1)
35,087
(99.9)
0.00
240
6(1.2)
34,731
(98.8)
0.56
Male
2,13
5(2.8)
74,254
(97.2)
1,49
2(2.0)
74,897
(98.0)
179(0.2)
76,210
(99.8)
852(1.1)
75,537
(98.9)
Age(yea
rs)
18-29
577(1.2)
49,521
(98.8)
<.000
157
0(1.1)
49,528
(98.9)
<0.00
0110
3(0.2)
49,995
(99.8)
0.70
208(0.4)
49,890
(99.6)
<.000
130
-39
824(2.7)
29,668
(97.3)
828(2.7)
29,664
(97.3)
69(0.2)
30,423
(99.8)
273(0.9)
30,219
(99.1)
40-49
890(4.5)
18,904
(95.5)
386(2.0)
19,408
(98.0)
35(0.2)
19,759
(99.8)
450(2.3)
19,344
(97.7)
50+
454(3.9)
11,255
(96.1)
144(1.2)
11,565
(98.8)
24(0.2)
11,685
(99.8)
331(2.8)
11,378
(97.2)
Reg
ion
Tbilisi
1323
(2.2)
60,134
(97.8)
<0.00
0178
4(1.3)
60,673
(98.7)
<0.00
0110
3(0.2)
61,354
(99.8)
<0.00
0149
1(0.8)
60,966
(99.2)
<.000
1Adjara
245(2.1)
11,327
(97.9)
395(3.4)
11,177
(96.6)
53(0.5)
11,519
(99.5)
267(2.3)
11,305
(97.7)
Imereti
521(3.1)
16,414
(96.9)
416(2.5)
16,519
(97.5)
29(0.2)
16,906
(99.8)
286(1.7)
16,649
(98.3)
Kve
moKartli
280(2.2)
12,639
(97.8)
159(1.2)
12,760
(98.8)
20(0.2)
12,899
(99.8)
77(0.6)
12,842
(99.4)
Sam
egrelo
213(5.0)
4,06
0(95.0)
117(2.7)
4,15
6(97.3)
17(0.4)
4,25
6(99.6)
74(1.7)
4,19
9(98.3)
Shida
Kartli
163(3.3)
4,77
4(96.7)
57(1.2)
4,88
0(98.8)
9(0.2)
4,92
8(99.8)
67(1.4)
4,87
0(98.6)
Donortype
Rep
eat
462(0.8)
54,654
(99.2)
<0.00
0124
3(0.4)
54,873
(99.6)
<0.00
0187
(0.2)
55,029
(99.8)
0.00
0540
3(0.7)
54,713
(99.3)
<.000
1Firs
tTim
e2,28
3(4.0)
54,694
(96.0)
1,68
5(3.0)
55,292
(97.0)
144(0.3)
56,833
(99.7)
859(1.5)
56,118
(98.5)
Rem
uneration
Volun
teer
672(1.7)
39,210
(98.3)
<0.00
0157
4(1.4)
39,308
(98.6)
<0.00
0167
(0.2)
39,815
(99.8)
0.12
215(0.5)
39,667
(99.5)
<.000
1Paid
879(2.9)
29,927
(97.1)
400(1.3)
30,406
(98.7)
63(0.2)
30,743
(99.8)
354(1.1)
30,452
(98.9)
Rep
lace
men
t83
6(3.1)
25,734
(96.9)
727(2.7)
25,843
(97.3)
66(0.2)
26,504
(99.8)
496(1.9)
26,074
(98.1)
Missing
358(2.4)
14,477
(97.6)
227(1.5)
14,608
(98.5)
35(0.2)
14,800
(99.8)
197(1.3)
14,638
(98.7)
anti-HCV=he
patitis
Cvirusan
tibod
y;HBsA
g=he
patitis
Bsu
rfac
ean
tigen
;HIV
=hu
man
immun
odefi
cien
cyvirus.
TRANSFUSION 5
HCV TRANSFUSION INITIATIVE GEORGIA
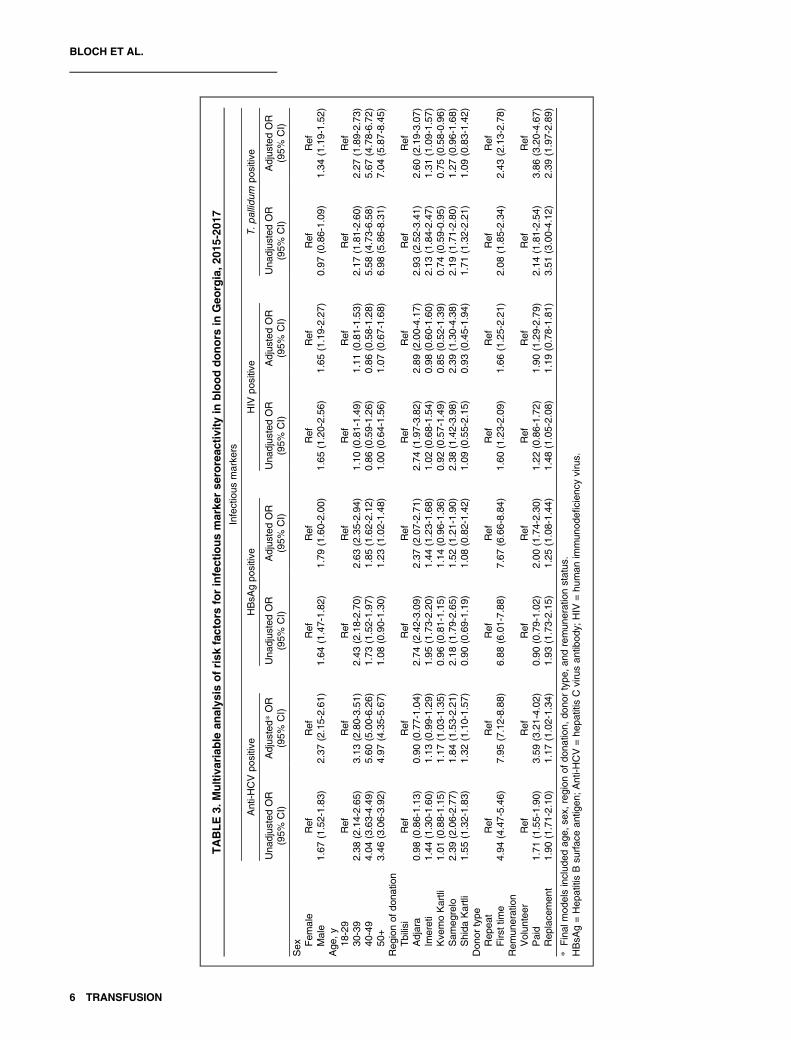
TABLE3.
Multivariable
analys
isofrisk
factors
forinfectiousmarke
rse
roreac
tivity
inblooddonors
inGeo
rgia,2
015-20
17Infectious
marke
rs
Anti-H
CVpo
sitive
HBsA
gpo
sitive
HIV
positive
T.pallid
umpo
sitive
Una
djus
tedOR
(95%
CI)
Adjus
ted*
OR
(95%
CI)
Una
djus
tedOR
(95%
CI)
Adjus
tedOR
(95%
CI)
Una
djus
tedOR
(95%
CI)
Adjus
tedOR
(95%
CI)
Una
djus
tedOR
(95%
CI)
Adjus
tedOR
(95%
CI)
Sex Fem
ale
Ref
Ref
Ref
Ref
Ref
Ref
Ref
Ref
Male
1.67
(1.52-1.83
)2.37
(2.15-2.61
)1.64
(1.47-1.82
)1.79
(1.60-2.00
)1.65
(1.20-2.56
)1.65
(1.19-2.27
)0.97
(0.86-1.09
)1.34
(1.19-1.52
)Age
,y18
-29
Ref
Ref
Ref
Ref
Ref
Ref
Ref
Ref
30-39
2.38
(2.14-2.65
)3.13
(2.80-3.51
)2.43
(2.18-2.70
)2.63
(2.35-2.94
)1.10
(0.81-1.49
)1.11
(0.81-1.53
)2.17
(1.81-2.60
)2.27
(1.89-2.73
)40
-49
4.04
(3.63-4.49
)5.60
(5.00-6.26
)1.73
(1.52-1.97
)1.85
(1.62-2.12
)0.86
(0.59-1.26
)0.86
(0.58-1.28
)5.58
(4.73-6.58
)5.67
(4.78-6.72
)50
+3.46
(3.06-3.92
)4.97
(4.35-5.67
)1.08
(0.90-1.30
)1.23
(1.02-1.48
)1.00
(0.64-1.56
)1.07
(0.67-1.68
)6.98
(5.86-8.31
)7.04
(5.87-8.45
)Reg
ionof
dona
tion
Tbilisi
Ref
Ref
Ref
Ref
Ref
Ref
Ref
Ref
Adjara
0.98
(0.86-1.13
)0.90
(0.77-1.04
)2.74
(2.42-3.09
)2.37
(2.07-2.71
)2.74
(1.97-3.82
)2.89
(2.00-4.17
)2.93
(2.52-3.41
)2.60
(2.19-3.07
)Im
ereti
1.44
(1.30-1.60
)1.13
(0.99-1.29
)1.95
(1.73-2.20
)1.44
(1.23-1.68
)1.02
(0.68-1.54
)0.98
(0.60-1.60
)2.13
(1.84-2.47
)1.31
(1.09-1.57
)Kve
moKartli
1.01
(0.88-1.15
)1.17
(1.03-1.35
)0.96
(0.81-1.15
)1.14
(0.96-1.36
)0.92
(0.57-1.49
)0.85
(0.52-1.39
)0.74
(0.59-0.95
)0.75
(0.58-0.96
)Sam
egrelo
2.39
(2.06-2.77
)1.84
(1.53-2.21
)2.18
(1.79-2.65
)1.52
(1.21-1.90
)2.38
(1.42-3.98
)2.39
(1.30-4.38
)2.19
(1.71-2.80
)1.27
(0.96-1.68
)Shida
Kartli
1.55
(1.32-1.83
)1.32
(1.10-1.57
)0.90
(0.69-1.19
)1.08
(0.82-1.42
)1.09
(0.55-2.15
)0.93
(0.45-1.94
)1.71
(1.32-2.21
)1.09
(0.83-1.42
)Don
ortype
Rep
eat
Ref
Ref
Ref
Ref
Ref
Ref
Ref
Ref
Firs
ttim
e4.94
(4.47-5.46
)7.95
(7.12-8.88
)6.88
(6.01-7.88
)7.67
(6.66-8.84
)1.60
(1.23-2.09
)1.66
(1.25-2.21
)2.08
(1.85-2.34
)2.43
(2.13-2.78
)Rem
uneration
Volun
teer
Ref
Ref
Ref
Ref
Ref
Ref
Ref
Ref
Paid
1.71
(1.55-1.90
)3.59
(3.21-4.02
)0.90
(0.79-1.02
)2.00
(1.74-2.30
)1.22
(0.86-1.72
)1.90
(1.29-2.79
)2.14
(1.81-2.54
)3.86
(3.20-4.67
)Rep
lace
men
t1.90
(1.71-2.10
)1.17
(1.02-1.34
)1.93
(1.73-2.15
)1.25
(1.08-1.44
)1.48
(1.05-2.08
)1.19
(0.78-1.81
)3.51
(3.00-4.12
)2.39
(1.97-2.89
)
*Final
mod
elsinclud
edag
e,se
x,region
ofdo
natio
n,do
nortype
,and
remun
erationstatus
.HBsA
g=Hep
atitisBsu
rfac
ean
tigen
;Anti-H
CV=he
patitis
Cvirusan
tibod
y;HIV
=hu
man
immun
odefi
cien
cyvirus.
6 TRANSFUSION
BLOCH ET AL.
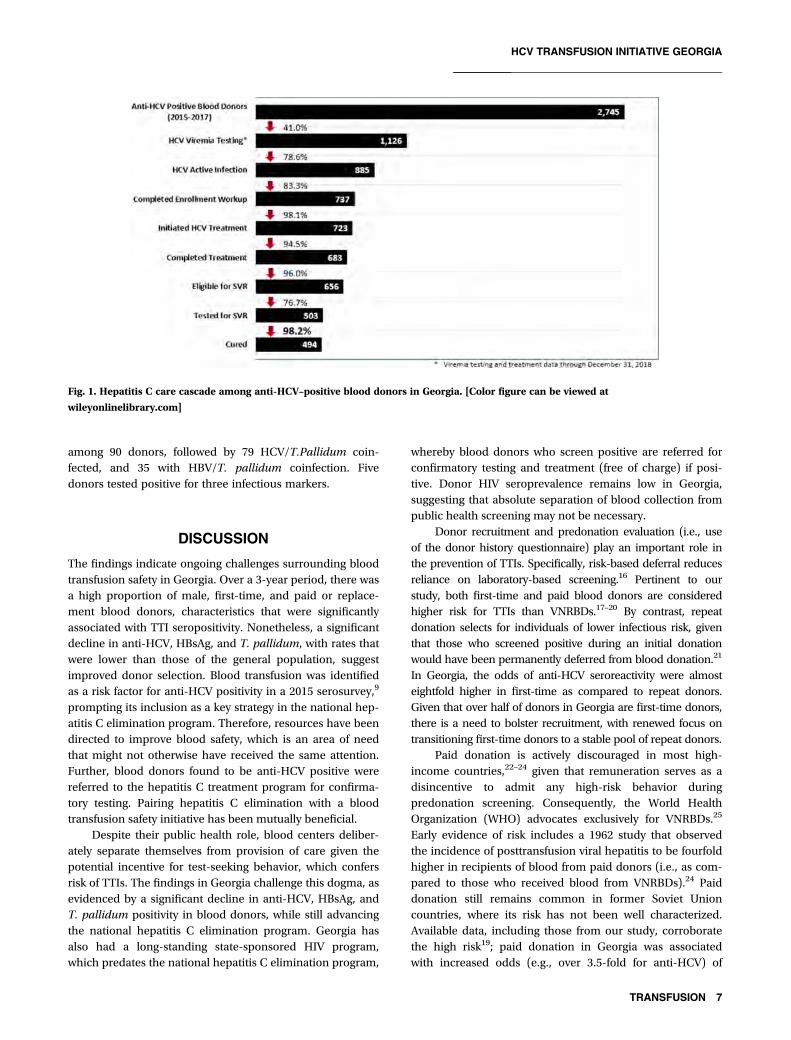
among 90 donors, followed by 79 HCV/T.Pallidum coin-fected, and 35 with HBV/T. pallidum coinfection. Fivedonors tested positive for three infectious markers.
DISCUSSION
The findings indicate ongoing challenges surrounding bloodtransfusion safety in Georgia. Over a 3-year period, there wasa high proportion of male, first-time, and paid or replace-ment blood donors, characteristics that were significantlyassociated with TTI seropositivity. Nonetheless, a significantdecline in anti-HCV, HBsAg, and T. pallidum, with rates thatwere lower than those of the general population, suggestimproved donor selection. Blood transfusion was identifiedas a risk factor for anti-HCV positivity in a 2015 serosurvey,9
prompting its inclusion as a key strategy in the national hep-atitis C elimination program. Therefore, resources have beendirected to improve blood safety, which is an area of needthat might not otherwise have received the same attention.Further, blood donors found to be anti-HCV positive werereferred to the hepatitis C treatment program for confirma-tory testing. Pairing hepatitis C elimination with a bloodtransfusion safety initiative has been mutually beneficial.
Despite their public health role, blood centers deliber-ately separate themselves from provision of care given thepotential incentive for test-seeking behavior, which confersrisk of TTIs. The findings in Georgia challenge this dogma, asevidenced by a significant decline in anti-HCV, HBsAg, andT. pallidum positivity in blood donors, while still advancingthe national hepatitis C elimination program. Georgia hasalso had a long-standing state-sponsored HIV program,which predates the national hepatitis C elimination program,
whereby blood donors who screen positive are referred forconfirmatory testing and treatment (free of charge) if posi-tive. Donor HIV seroprevalence remains low in Georgia,suggesting that absolute separation of blood collection frompublic health screening may not be necessary.
Donor recruitment and predonation evaluation (i.e., useof the donor history questionnaire) play an important role inthe prevention of TTIs. Specifically, risk-based deferral reducesreliance on laboratory-based screening.16 Pertinent to ourstudy, both first-time and paid blood donors are consideredhigher risk for TTIs than VNRBDs.17–20 By contrast, repeatdonation selects for individuals of lower infectious risk, giventhat those who screened positive during an initial donationwould have been permanently deferred from blood donation.21
In Georgia, the odds of anti-HCV seroreactivity were almosteightfold higher in first-time as compared to repeat donors.Given that over half of donors in Georgia are first-time donors,there is a need to bolster recruitment, with renewed focus ontransitioning first-time donors to a stable pool of repeat donors.
Paid donation is actively discouraged in most high-income countries,22–24 given that remuneration serves as adisincentive to admit any high-risk behavior duringpredonation screening. Consequently, the World HealthOrganization (WHO) advocates exclusively for VNRBDs.25
Early evidence of risk includes a 1962 study that observedthe incidence of posttransfusion viral hepatitis to be fourfoldhigher in recipients of blood from paid donors (i.e., as com-pared to those who received blood from VNRBDs).24 Paiddonation still remains common in former Soviet Unioncountries, where its risk has not been well characterized.Available data, including those from our study, corroboratethe high risk19; paid donation in Georgia was associatedwith increased odds (e.g., over 3.5-fold for anti-HCV) of
Fig. 1. Hepatitis C care cascade among anti-HCV–positive blood donors in Georgia. [Color figure can be viewed at
wileyonlinelibrary.com]
TRANSFUSION 7
HCV TRANSFUSION INITIATIVE GEORGIA
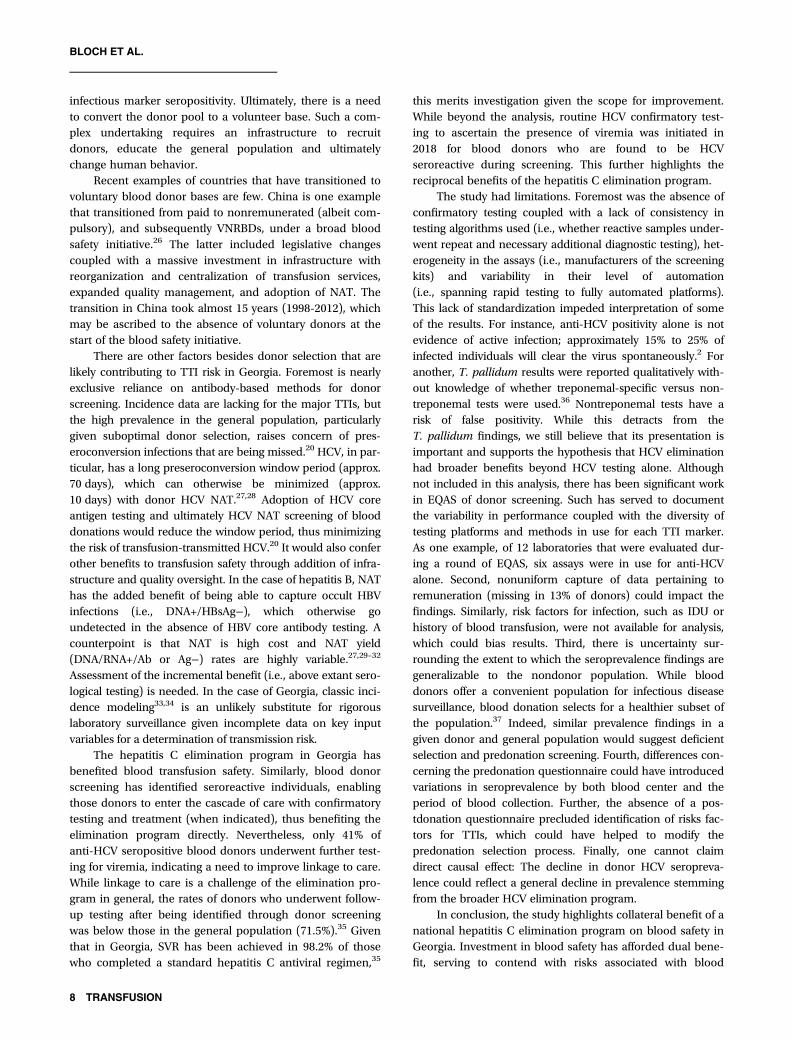
infectious marker seropositivity. Ultimately, there is a needto convert the donor pool to a volunteer base. Such a com-plex undertaking requires an infrastructure to recruitdonors, educate the general population and ultimatelychange human behavior.
Recent examples of countries that have transitioned tovoluntary blood donor bases are few. China is one examplethat transitioned from paid to nonremunerated (albeit com-pulsory), and subsequently VNRBDs, under a broad bloodsafety initiative.26 The latter included legislative changescoupled with a massive investment in infrastructure withreorganization and centralization of transfusion services,expanded quality management, and adoption of NAT. Thetransition in China took almost 15 years (1998-2012), whichmay be ascribed to the absence of voluntary donors at thestart of the blood safety initiative.
There are other factors besides donor selection that arelikely contributing to TTI risk in Georgia. Foremost is nearlyexclusive reliance on antibody-based methods for donorscreening. Incidence data are lacking for the major TTIs, butthe high prevalence in the general population, particularlygiven suboptimal donor selection, raises concern of pres-eroconversion infections that are being missed.20 HCV, in par-ticular, has a long preseroconversion window period (approx.70 days), which can otherwise be minimized (approx.10 days) with donor HCV NAT.27,28 Adoption of HCV coreantigen testing and ultimately HCV NAT screening of blooddonations would reduce the window period, thus minimizingthe risk of transfusion-transmitted HCV.20 It would also conferother benefits to transfusion safety through addition of infra-structure and quality oversight. In the case of hepatitis B, NAThas the added benefit of being able to capture occult HBVinfections (i.e., DNA+/HBsAg−), which otherwise goundetected in the absence of HBV core antibody testing. Acounterpoint is that NAT is high cost and NAT yield(DNA/RNA+/Ab or Ag−) rates are highly variable.27,29–32
Assessment of the incremental benefit (i.e., above extant sero-logical testing) is needed. In the case of Georgia, classic inci-dence modeling33,34 is an unlikely substitute for rigorouslaboratory surveillance given incomplete data on key inputvariables for a determination of transmission risk.
The hepatitis C elimination program in Georgia hasbenefited blood transfusion safety. Similarly, blood donorscreening has identified seroreactive individuals, enablingthose donors to enter the cascade of care with confirmatorytesting and treatment (when indicated), thus benefiting theelimination program directly. Nevertheless, only 41% ofanti-HCV seropositive blood donors underwent further test-ing for viremia, indicating a need to improve linkage to care.While linkage to care is a challenge of the elimination pro-gram in general, the rates of donors who underwent follow-up testing after being identified through donor screeningwas below those in the general population (71.5%).35 Giventhat in Georgia, SVR has been achieved in 98.2% of thosewho completed a standard hepatitis C antiviral regimen,35
this merits investigation given the scope for improvement.While beyond the analysis, routine HCV confirmatory test-ing to ascertain the presence of viremia was initiated in2018 for blood donors who are found to be HCVseroreactive during screening. This further highlights thereciprocal benefits of the hepatitis C elimination program.
The study had limitations. Foremost was the absence ofconfirmatory testing coupled with a lack of consistency intesting algorithms used (i.e., whether reactive samples under-went repeat and necessary additional diagnostic testing), het-erogeneity in the assays (i.e., manufacturers of the screeningkits) and variability in their level of automation(i.e., spanning rapid testing to fully automated platforms).This lack of standardization impeded interpretation of someof the results. For instance, anti-HCV positivity alone is notevidence of active infection; approximately 15% to 25% ofinfected individuals will clear the virus spontaneously.2 Foranother, T. pallidum results were reported qualitatively with-out knowledge of whether treponemal-specific versus non-treponemal tests were used.36 Nontreponemal tests have arisk of false positivity. While this detracts from theT. pallidum findings, we still believe that its presentation isimportant and supports the hypothesis that HCV eliminationhad broader benefits beyond HCV testing alone. Althoughnot included in this analysis, there has been significant workin EQAS of donor screening. Such has served to documentthe variability in performance coupled with the diversity oftesting platforms and methods in use for each TTI marker.As one example, of 12 laboratories that were evaluated dur-ing a round of EQAS, six assays were in use for anti-HCValone. Second, nonuniform capture of data pertaining toremuneration (missing in 13% of donors) could impact thefindings. Similarly, risk factors for infection, such as IDU orhistory of blood transfusion, were not available for analysis,which could bias results. Third, there is uncertainty sur-rounding the extent to which the seroprevalence findings aregeneralizable to the nondonor population. While blooddonors offer a convenient population for infectious diseasesurveillance, blood donation selects for a healthier subset ofthe population.37 Indeed, similar prevalence findings in agiven donor and general population would suggest deficientselection and predonation screening. Fourth, differences con-cerning the predonation questionnaire could have introducedvariations in seroprevalence by both blood center and theperiod of blood collection. Further, the absence of a pos-tdonation questionnaire precluded identification of risks fac-tors for TTIs, which could have helped to modify thepredonation selection process. Finally, one cannot claimdirect causal effect: The decline in donor HCV seropreva-lence could reflect a general decline in prevalence stemmingfrom the broader HCV elimination program.
In conclusion, the study highlights collateral benefit of anational hepatitis C elimination program on blood safety inGeorgia. Investment in blood safety has afforded dual bene-fit, serving to contend with risks associated with blood
8 TRANSFUSION
BLOCH ET AL.
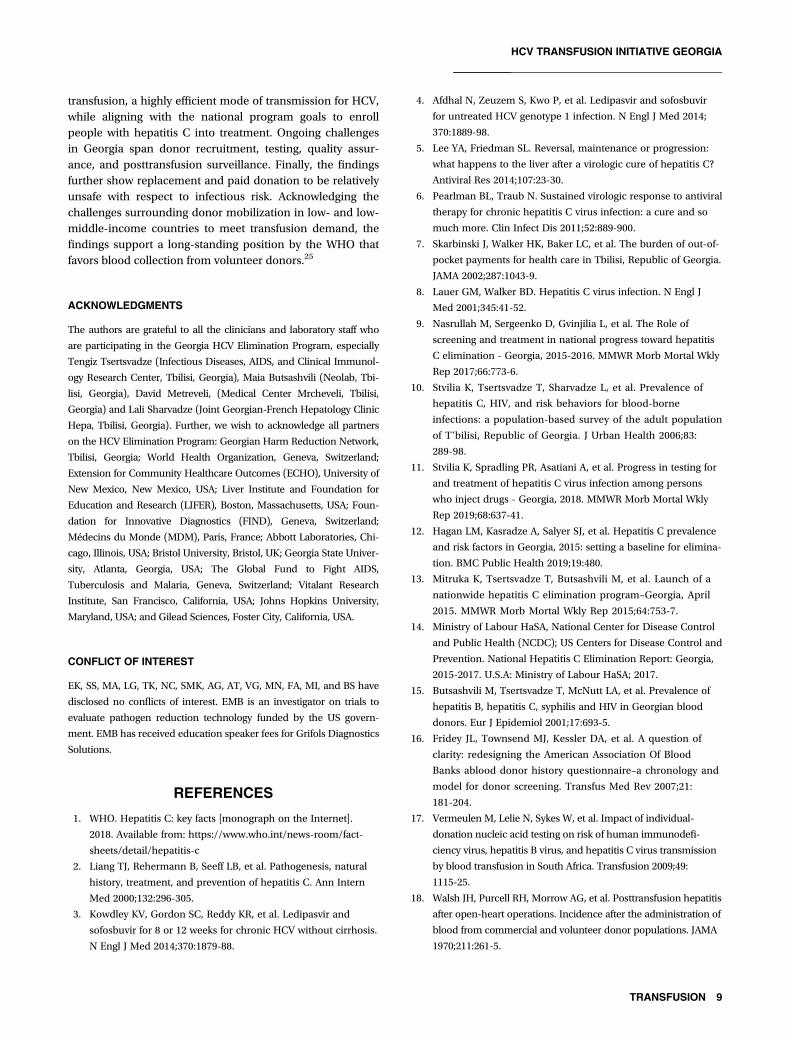
transfusion, a highly efficient mode of transmission for HCV,while aligning with the national program goals to enrollpeople with hepatitis C into treatment. Ongoing challengesin Georgia span donor recruitment, testing, quality assur-ance, and posttransfusion surveillance. Finally, the findingsfurther show replacement and paid donation to be relativelyunsafe with respect to infectious risk. Acknowledging thechallenges surrounding donor mobilization in low- and low-middle-income countries to meet transfusion demand, thefindings support a long-standing position by the WHO thatfavors blood collection from volunteer donors.25
ACKNOWLEDGMENTS
The authors are grateful to all the clinicians and laboratory staff who
are participating in the Georgia HCV Elimination Program, especially
Tengiz Tsertsvadze (Infectious Diseases, AIDS, and Clinical Immunol-
ogy Research Center, Tbilisi, Georgia), Maia Butsashvili (Neolab, Tbi-
lisi, Georgia), David Metreveli, (Medical Center Mrcheveli, Tbilisi,
Georgia) and Lali Sharvadze (Joint Georgian-French Hepatology Clinic
Hepa, Tbilisi, Georgia). Further, we wish to acknowledge all partners
on the HCV Elimination Program: Georgian Harm Reduction Network,
Tbilisi, Georgia; World Health Organization, Geneva, Switzerland;
Extension for Community Healthcare Outcomes (ECHO), University of
New Mexico, New Mexico, USA; Liver Institute and Foundation for
Education and Research (LIFER), Boston, Massachusetts, USA; Foun-
dation for Innovative Diagnostics (FIND), Geneva, Switzerland;
Médecins du Monde (MDM), Paris, France; Abbott Laboratories, Chi-
cago, Illinois, USA; Bristol University, Bristol, UK; Georgia State Univer-
sity, Atlanta, Georgia, USA; The Global Fund to Fight AIDS,
Tuberculosis and Malaria, Geneva, Switzerland; Vitalant Research
Institute, San Francisco, California, USA; Johns Hopkins University,
Maryland, USA; and Gilead Sciences, Foster City, California, USA.
CONFLICT OF INTEREST
EK, SS, MA, LG, TK, NC, SMK, AG, AT, VG, MN, FA, MI, and BS have
disclosed no conflicts of interest. EMB is an investigator on trials to
evaluate pathogen reduction technology funded by the US govern-
ment. EMB has received education speaker fees for Grifols Diagnostics
Solutions.
REFERENCES
1. WHO. Hepatitis C: key facts [monograph on the Internet].
2018. Available from: https://www.who.int/news-room/fact-
sheets/detail/hepatitis-c
2. Liang TJ, Rehermann B, Seeff LB, et al. Pathogenesis, natural
history, treatment, and prevention of hepatitis C. Ann Intern
Med 2000;132:296-305.
3. Kowdley KV, Gordon SC, Reddy KR, et al. Ledipasvir and
sofosbuvir for 8 or 12 weeks for chronic HCV without cirrhosis.
N Engl J Med 2014;370:1879-88.
4. Afdhal N, Zeuzem S, Kwo P, et al. Ledipasvir and sofosbuvir
for untreated HCV genotype 1 infection. N Engl J Med 2014;
370:1889-98.
5. Lee YA, Friedman SL. Reversal, maintenance or progression:
what happens to the liver after a virologic cure of hepatitis C?
Antiviral Res 2014;107:23-30.
6. Pearlman BL, Traub N. Sustained virologic response to antiviral
therapy for chronic hepatitis C virus infection: a cure and so
much more. Clin Infect Dis 2011;52:889-900.
7. Skarbinski J, Walker HK, Baker LC, et al. The burden of out-of-
pocket payments for health care in Tbilisi, Republic of Georgia.
JAMA 2002;287:1043-9.
8. Lauer GM, Walker BD. Hepatitis C virus infection. N Engl J
Med 2001;345:41-52.
9. Nasrullah M, Sergeenko D, Gvinjilia L, et al. The Role of
screening and treatment in national progress toward hepatitis
C elimination - Georgia, 2015-2016. MMWR Morb Mortal Wkly
Rep 2017;66:773-6.
10. Stvilia K, Tsertsvadze T, Sharvadze L, et al. Prevalence of
hepatitis C, HIV, and risk behaviors for blood-borne
infections: a population-based survey of the adult population
of Tʼbilisi, Republic of Georgia. J Urban Health 2006;83:
289-98.
11. Stvilia K, Spradling PR, Asatiani A, et al. Progress in testing for
and treatment of hepatitis C virus infection among persons
who inject drugs - Georgia, 2018. MMWR Morb Mortal Wkly
Rep 2019;68:637-41.
12. Hagan LM, Kasradze A, Salyer SJ, et al. Hepatitis C prevalence
and risk factors in Georgia, 2015: setting a baseline for elimina-
tion. BMC Public Health 2019;19:480.
13. Mitruka K, Tsertsvadze T, Butsashvili M, et al. Launch of a
nationwide hepatitis C elimination program–Georgia, April
2015. MMWR Morb Mortal Wkly Rep 2015;64:753-7.
14. Ministry of Labour HaSA, National Center for Disease Control
and Public Health (NCDC); US Centers for Disease Control and
Prevention. National Hepatitis C Elimination Report: Georgia,
2015-2017. U.S.A: Ministry of Labour HaSA; 2017.
15. Butsashvili M, Tsertsvadze T, McNutt LA, et al. Prevalence of
hepatitis B, hepatitis C, syphilis and HIV in Georgian blood
donors. Eur J Epidemiol 2001;17:693-5.
16. Fridey JL, Townsend MJ, Kessler DA, et al. A question of
clarity: redesigning the American Association Of Blood
Banks ablood donor history questionnaire–a chronology and
model for donor screening. Transfus Med Rev 2007;21:
181-204.
17. Vermeulen M, Lelie N, Sykes W, et al. Impact of individual-
donation nucleic acid testing on risk of human immunodefi-
ciency virus, hepatitis B virus, and hepatitis C virus transmission
by blood transfusion in South Africa. Transfusion 2009;49:
1115-25.
18. Walsh JH, Purcell RH, Morrow AG, et al. Posttransfusion hepatitis
after open-heart operations. Incidence after the administration of
blood from commercial and volunteer donor populations. JAMA
1970;211:261-5.
TRANSFUSION 9
HCV TRANSFUSION INITIATIVE GEORGIA
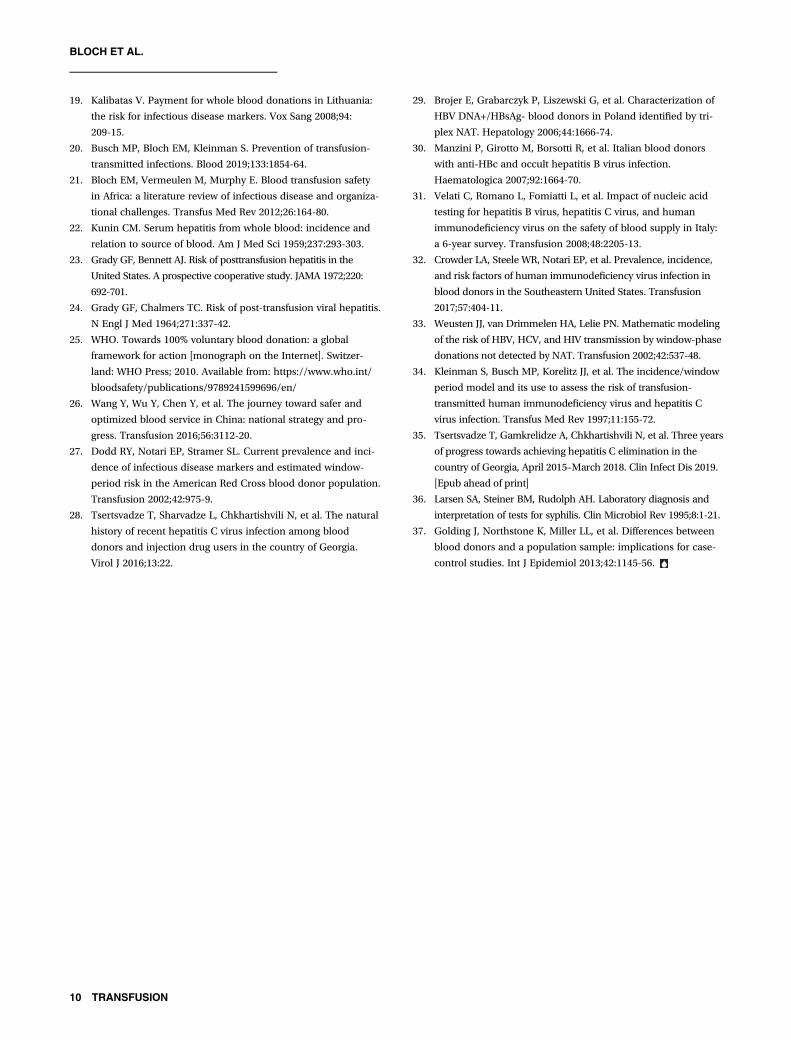
19. Kalibatas V. Payment for whole blood donations in Lithuania:
the risk for infectious disease markers. Vox Sang 2008;94:
209-15.
20. Busch MP, Bloch EM, Kleinman S. Prevention of transfusion-
transmitted infections. Blood 2019;133:1854-64.
21. Bloch EM, Vermeulen M, Murphy E. Blood transfusion safety
in Africa: a literature review of infectious disease and organiza-
tional challenges. Transfus Med Rev 2012;26:164-80.
22. Kunin CM. Serum hepatitis from whole blood: incidence and
relation to source of blood. Am J Med Sci 1959;237:293-303.
23. Grady GF, Bennett AJ. Risk of posttransfusion hepatitis in the
United States. A prospective cooperative study. JAMA 1972;220:
692-701.
24. Grady GF, Chalmers TC. Risk of post-transfusion viral hepatitis.
N Engl J Med 1964;271:337-42.
25. WHO. Towards 100% voluntary blood donation: a global
framework for action [monograph on the Internet]. Switzer-
land: WHO Press; 2010. Available from: https://www.who.int/
bloodsafety/publications/9789241599696/en/
26. Wang Y, Wu Y, Chen Y, et al. The journey toward safer and
optimized blood service in China: national strategy and pro-
gress. Transfusion 2016;56:3112-20.
27. Dodd RY, Notari EP, Stramer SL. Current prevalence and inci-
dence of infectious disease markers and estimated window-
period risk in the American Red Cross blood donor population.
Transfusion 2002;42:975-9.
28. Tsertsvadze T, Sharvadze L, Chkhartishvili N, et al. The natural
history of recent hepatitis C virus infection among blood
donors and injection drug users in the country of Georgia.
Virol J 2016;13:22.
29. Brojer E, Grabarczyk P, Liszewski G, et al. Characterization of
HBV DNA+/HBsAg- blood donors in Poland identified by tri-
plex NAT. Hepatology 2006;44:1666-74.
30. Manzini P, Girotto M, Borsotti R, et al. Italian blood donors
with anti-HBc and occult hepatitis B virus infection.
Haematologica 2007;92:1664-70.
31. Velati C, Romano L, Fomiatti L, et al. Impact of nucleic acid
testing for hepatitis B virus, hepatitis C virus, and human
immunodeficiency virus on the safety of blood supply in Italy:
a 6-year survey. Transfusion 2008;48:2205-13.
32. Crowder LA, Steele WR, Notari EP, et al. Prevalence, incidence,
and risk factors of human immunodeficiency virus infection in
blood donors in the Southeastern United States. Transfusion
2017;57:404-11.
33. Weusten JJ, van Drimmelen HA, Lelie PN. Mathematic modeling
of the risk of HBV, HCV, and HIV transmission by window-phase
donations not detected by NAT. Transfusion 2002;42:537-48.
34. Kleinman S, Busch MP, Korelitz JJ, et al. The incidence/window
period model and its use to assess the risk of transfusion-
transmitted human immunodeficiency virus and hepatitis C
virus infection. Transfus Med Rev 1997;11:155-72.
35. Tsertsvadze T, Gamkrelidze A, Chkhartishvili N, et al. Three years
of progress towards achieving hepatitis C elimination in the
country of Georgia, April 2015–March 2018. Clin Infect Dis 2019.
[Epub ahead of print]
36. Larsen SA, Steiner BM, Rudolph AH. Laboratory diagnosis and
interpretation of tests for syphilis. Clin Microbiol Rev 1995;8:1-21.
37. Golding J, Northstone K, Miller LL, et al. Differences between
blood donors and a population sample: implications for case-
control studies. Int J Epidemiol 2013;42:1145-56.
10 TRANSFUSION
BLOCH ET AL.
Progress and challenges of a pioneering hepatitis Celimination program in the country of Georgia
Graphical abstract
3,000
2,500
Pers
ons
per m
onth
0
Jan-1
5Mar-
15May
-15Ju
l-15
Sep-15
Nov-15
Jan-1
6Mar-
16May
-16Ju
l-16
Sep-16
Nov-16
Jan-1
7Mar-
17May
-17Ju
l-17
Sep-17
Nov-17
Jan-1
8Mar-
18May
-18Ju
l-18
Sep-18
Nov-18
Month of earliest positive diagnostic testHCV RNA positiveHCVcAg positive
HCV RNA positive persons initiating treatmentHCVcAg positive persons initiating treatment
2,000
1,500
500
1,000
Hepatitis C virus RNA (HCV RNA) or HCV core antigen (HCVcAg) diagnostic testing and initiation oftreatment by test method and month of diagnosisGeorgia hepatitis C elimination program, January 2015 – December 2018
The implementation of reflex viral diagnostictesting in March 2018 increased the rate of
identification of viremic individuals, but did notincrease the rate of infected persons
initiating treatment.
Highlights� One-third of HCV-infected individuals in Georgia have received treatment.
� Use of reflex HCV core antigen greatly increased the number of individualsdiagnosed with active infection
� Identification of HCV-infected individuals and treatment initiation con-tinue to be major challenges to HCV elimination in Georgia.
Authors
Francisco Averhoff,Shaun Shadaker,Amiran Gamkrelidze, .,Jaba Zarkua, Beth Skaggs,Muazzam Nasrullah
[email protected] (F. Averhoff).
Lay summaryThis report describes progressin Georgia's hepatitis C elimi-nationprogramandhighlightsefforts to promote hepatitis Cvirus screening and treatmentinitiation on a national scale.Georgia has made progresstowards eliminating hepatitisC, treating over 50,000 people,approximately one-third ofthe number infected, andachieving cure for 98.5% ofthose tested. However, identi-fying infected individuals andlinking them to care remainschallenging. Novel approachesto increase diagnostic testingcan have unintended con-sequences further down thecare cascade.
Research ArticleViral Hepatitis
https://doi.org/10.1016/j.jhep.2019.11.019Published by Elsevier B.V. on behalf of European Association for the Study of the Liver. J. Hepatol. 2020, 72, 680–687
Progress and challenges of a pioneering hepatitis C eliminationprogram in the country of Georgia
Francisco Averhoff1,*, Shaun Shadaker1, Amiran Gamkrelidze2, Tatia Kuchuloria3, Lia Gvinjilia3,Vladimer Getia2, David Sergeenko4, Maia Butsashvili5, Tengiz Tsertsvadze6, Lali Sharvadze7,
Jaba Zarkua8, Beth Skaggs9, Muazzam Nasrullah1
1Centers for Disease Control and Prevention, Division of Viral Hepatitis, National Center for HIV/AIDS, Viral Hepatitis, STD & TB Prevention,Atlanta, Georgia, USA; 2National Center for Disease Control and Public Health of Georgia, Tbilisi, Georgia; 3TEPHINET independent contractorfor Georgia Hepatitis C Elimination Program, Atlanta, Georgia, USA; 4Ministry of IDPs from the Occupied Territories, Labour, Health, and SocialAffairs of Georgia, Tbilisi, Georgia; 5Health Research Union, Tbilisi, Georgia; 6Infectious Diseases, AIDS and Clinical Immunology ResearchCenter, Tbilisi, Georgia; 7Hepatology clinic HEPA, Tbilisi, Georgia; 8Hepatology and Gastroenterology Department, Medical Center Mrcheveli,
Tbilisi, Georgia; 9Division of Global Health Protection, Center for Global Health, South Caucasus Regional Office, Tbilisi, Georgia
Background & Aims: Georgia, with a high prevalence of HCVinfection, launched the world's first national hepatitis C elimi-nation program in April 2015. A key strategy is the identification,treatment, and cure of the estimated 150,000 HCV-infectedpeople living in the country. We report on progress and keychallenges from Georgia's experience.Methods: We constructed a care cascade by analyzing linkeddata from the national hepatitis C screening registry and treat-ment databases during 2015–2018. We assessed the impact ofreflex hepatitis C core antigen (HCVcAg) testing on rates ofviremia testing and treatment initiation (i.e. linkage to care).Results: As of December 31, 2018, 1,101,530 adults (39.6% of theadult population) were screened for HCV antibody, of whom98,430 (8.9%) tested positive. Of the individuals who testedpositive, 78,484 (79.7%) received viremia testing, of whom66,916 (85.3%) tested positive for active HCV infection. A total of52,576 people with active HCV infection initiated treatment and48,879 completed their course of treatment. Of the 35,035 whowere tested for cure (i.e., sustained virologic response [SVR]),34,513 (98.5%) achieved SVR. Reflex HCVcAg testing, imple-mented in March 2018, increased rates of monthly viremiatesting by 97.5% among those who screened positive for anti-HCV, however, rates of treatment initiation decreased by 60.7%among diagnosed viremic patients.Conclusions: Over one-third of people living with HCV inGeorgia have been detected and linked to care and treatment,however, identification and linkage to care of the remaining in-dividuals with HCV infection is challenging. Novel interventions,such as reflex testing with HCVcAg, can improve rates of viremiatesting, but may result in unintended consequences, such asdecreased rates of treatment initiation. Linked data systems
allow for regular review of the care cascade, allowing for iden-tification of deficiencies and development of corrective actions.Lay summary: This report describes progress inGeorgia's hepatitisC elimination programand highlights efforts to promote hepatitis Cvirus screening and treatment initiation on a national scale. Georgiahas made progress towards eliminating hepatitis C, treating over50,000 people, approximately one-third of the number infected,and achieving cure for 98.5% of those tested. However, identifyinginfected individuals and linking them to care remains challenging.Novel approaches to increase diagnostic testing can have unin-tended consequences further down the care cascade.Published by Elsevier B.V. on behalf of European Association for theStudy of the Liver.
IntroductionGeorgia, a small middle-income country with a population of3.7million, located at the cross-roads of Europe andAsia, launchedthe world's first national hepatitis C elimination program in April2015, with the ambitious goal of a 90% reduction in hepatitis Cprevalence by 2020.1 At the time the programwas initiated, a na-tional seroprevalence survey was conducted that estimated150,000 Georgians (5.4% of the adult population) were living withHCV infection.2 To achieve the elimination goal, Georgia imple-mented several strategies, including the identification and treat-ment of all HCV-infected people in the country.3 The feasibility ofthis strategic goal was made possible by an April 2015 memoran-dumof understanding (MOU) between the government of Georgiaand Gilead Sciences, in which Gilead Sciences agreed to providedirect-acting antiviral (DAA) medications free-of-charge foreligible Georgians with HCV infection.3,4 The cost of DAAs in 2015was prohibitive; without the MOU with Gilead Sciences this pro-gram could not have transpired. A large number of Georgiansenrolled in the program during the first 3 years, and cure ratesexceeded 95% among those treated and tested for cure (i.e., sus-tained virologic response [SVR]).5 Yet, despite the availability oftreatment and high cure rates, important challenges remain. Wereport on progress, key challenges, and lessons learned fromGeorgia's experience in identifyingpersonswithHCV infectionandlinking them to hepatitis C care and treatment.
Keywords: Georgia; HCV; Hepatitis C diagnostic testing; Screening; Linkage to care;Reflex testing.Received 21 August 2019; received in revised form 28 October 2019; accepted 20November 2019; available online 4 December 2019
* Corresponding author. Address: Division of Viral Hepatitis, National Center for HIV/AIDS, Viral Hepatitis, STD, and TB Prevention, Centers for Disease Control andPrevention, 1600 Clifton Road, Mailstop US12-3, Atlanta, GA 30329. Tel.: 404-718-8501; fax: 404-718-8588.E-mail address: [email protected] (F. Averhoff).https://doi.org/10.1016/j.jhep.2019.11.019
Journal of Hepatology 2020 vol. 72 j 680–687
Research ArticleViral Hepatitis
Patients and methodsGeorgia's hepatitis C elimination programGeorgia's hepatitis C elimination program provides hepatitis Ctesting free-of-charge in a variety of settings (Table 1). Initialscreening is conducted using a rapid HCV antibody (anti-HCV)assay that tests for past or present HCV infection; people whoscreen positive on the antibody test are then referred to autho-rized treatment sites for diagnosis of active HCV infection bytesting for HCV RNA using PCR, before being notified of theirresults and enrolled for treatment if they test positive for HCVRNA. To increase access by identifying and linking HCV-infectedpersons to care, in December 2017, HCV core antigen (HCVcAg)testing was introduced in a limited number of settings, andexpanded in March 2018 when the program implemented reflexHCVcAg for all anti-HCV positive patients screened in hospitals,antenatal clinics, and blood banks. Each patient with a positiveanti-HCV test during their visit had a serum sample obtainedand shipped to the National Reference Laboratory (Lugar Cen-ter) in Tbilisi for centralized HCVcAg testing. HCVcAg hascomparable sensitivity and specificity to HCV RNA testing foridentifying active HCV infection.6 To minimize false-negativeresults, all specimens that tested negative or inconclusive byHCVcAg were subsequently tested for HCV RNA. NationalCenters for Disease Control and Public Health (NCDC) staffinformed patients by telephone of the results of the diagnostictesting (HCVcAg or HCV RNA) and referred those that testedpositive for treatment.
People confirmed to have active HCV infection by HCVcAgor HCV RNA testing are eligible to enroll in the treatmentprogram.3,7 During the enrollment process, patients undergoadditional diagnostic testing, including determination of HCVgenotype, assessment of degree of liver fibrosis, and screeningfor comorbidities and contraindications to treatment. Patientsfound eligible for treatment based on results of the initialworkup are prescribed a DAA treatment regimen according tonational treatment guidelines8 and are followed during thecourse of their treatment. Within 12–24 weeks of completingtreatment, patients are to return to the treatment site for HCVRNA testing to determine whether they had reached an SVR.Those with SVR are considered cured of their HCV infection.Initially, DAA treatment was exclusively sofosbuvir (SOF)-basedand included ribavirin with or without pegylated interferon,depending on the HCV genotype, per national guidelines.4
Beginning in February 2016, the DAA combination sofosbuvirand ledipasvir (SOF/LED) was introduced, and treatment regi-mens were revised.4 For the first year of the program, treatment
was limited to those with severe liver disease, defined as MET-AVIR score correlating to F3 or F4 (based on liver elastography),or FIB-4 score >3.25.1 In July 2016, the treatment program wasexpanded to include all people with HCV infection, regardless oflevel of liver fibrosis.
Although treatment is free for program enrollees, at the startof the program Georgians were required to pay for diagnostictesting, with prices determined by a sliding scale based on thepatients' ability to pay. Recognizing testing costs as a barrier tohepatitis C elimination, the government of Georgia reduced thenumber of tests required for each patient9 and beginning inMarch 2018, provided HCV RNA or HCVcAg testing free-of-chargeto all Georgians.
Data management and analysisEvery Georgian citizen is provided a unique national identifica-tion number for accessing healthcare services, including thoseoffered through the hepatitis C elimination program. Georgiadeveloped information systems to collect data from the hepatitisC screening registry, laboratories, and the hepatitis C treatmentprogram, all of which can be linked using each person's uniquenational identification number. Although this number must beprovided by all patients prior to enrolling in the treatment pro-gram, screening data from harm-reduction sites (including nee-dle and syringe programs and opioid substitution therapy sites)are collected and reported anonymously to protect the privacy ofclients. Beginning in 2017, harm-reduction sites began using thenational identification number for consenting beneficiaries aswell, allowing for analysis of data from these sites within thenational hepatitis C elimination program.10
We analyzed national screening registry data from January2015 through December 2018, as well as hepatitis C treatmentdata from April 2015 through December 2018, to assess theeffectiveness of screening, linkage to care and treatment services,as well as outcomes (i.e. the care cascade). We calculated thepercentage of people who screened positive for HCV antibody,and of those who were positive, we calculated the percentagewho received diagnostic testing to determine active, viremicinfection. Of those who tested positive for active HCV infection,the rates of treatment initiation, treatment completion, andtesting for and achieving virologic cure (SVR) were assessed.
In order to better understand the effectiveness of HCVcAgreflex testing as a diagnostic tool for ensuring treatment initia-tion, we constructed 2 care cascades among hospitalized pa-tients; one cascade included patients who screened positive forHCV antibody and were referred to a treatment center fordiagnosis of active HCV infection, while the other includedhospitalized patients who screened positive for HCV antibodyand received reflex HCVcAg testing for diagnosis of active HCVinfection, and if positive, were referred to a treatment center.To ensure comparability, we limited our care cascade analysisto 4 months following a positive HCV antibody test result andcalculated each strata of the cascade based on the percent fromthe previous strata. The first cascade covered a period of timeduring which antibody screening was offered to all hospitalizedpatients and those who screened positive were referred to atreatment center to receive diagnostic viremia testing (1September 2017 to 28 February 2018). The second cascadecovered the period of time when antibody screening was offeredto all hospitalized patients and those who screened positive hadreflex testing for HCVcAg (1 March 2018 to 31 December 2018),
Table 1. Number of adults aged >−18 years screened for anti-HCV antibodyand percentage testing positive, by group screened – Georgia, 2015-2018.
Group/locationof screening
No. adults (aged>−18) screened
% anti-HCVpositive
Blood donors 112,926 3.0%NCDC 131,479 33.4%Pregnant women/ANCs 108,776 0.6%Hospitalized patients 468,479 4.7%Harm-reduction beneficiaries 10,886 30.6%Outpatients 612,452 5.0%Prisoners 7,008 24.3%Military recruits 19,759 1.5%Persons living with HIV* 3,889 39.5%
ANC, antenatal clinic; NCDC, National Centers for Disease Control and Public Health.*Data through July 1, 2018.
Journal of Hepatology 2020 vol. 72 j 680–687 681
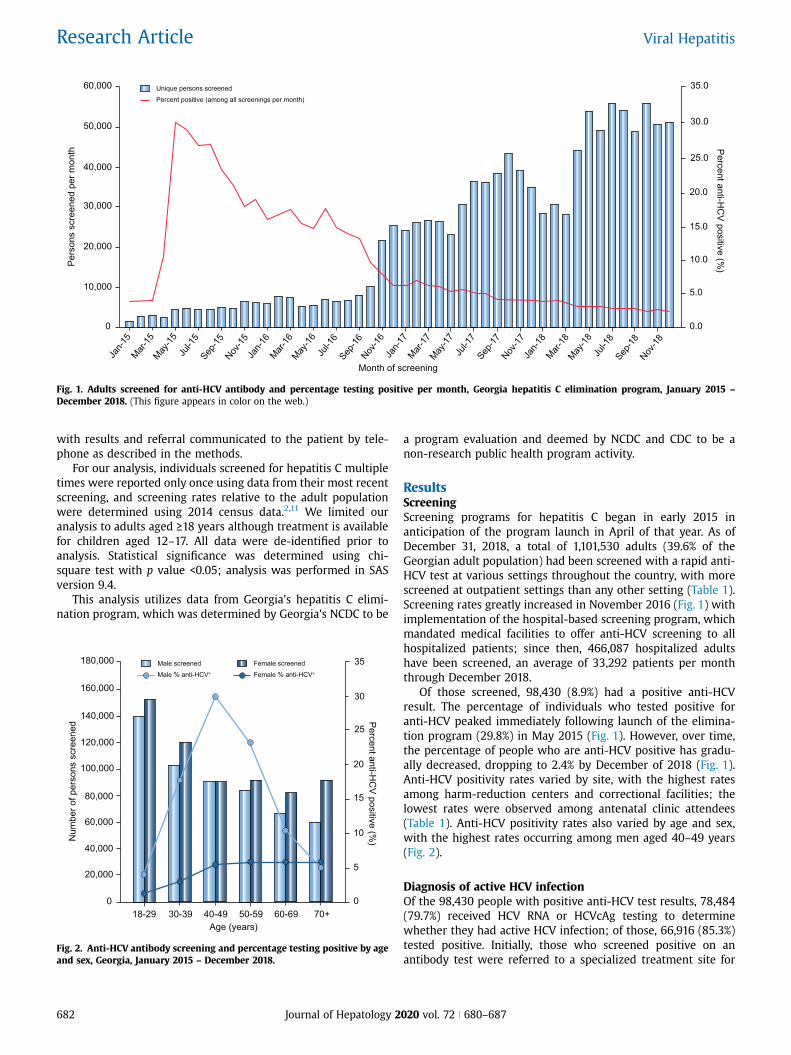
with results and referral communicated to the patient by tele-phone as described in the methods.
For our analysis, individuals screened for hepatitis C multipletimes were reported only once using data from their most recentscreening, and screening rates relative to the adult populationwere determined using 2014 census data.2,11 We limited ouranalysis to adults aged >−18 years although treatment is availablefor children aged 12–17. All data were de-identified prior toanalysis. Statistical significance was determined using chi-square test with p value <0.05; analysis was performed in SASversion 9.4.
This analysis utilizes data from Georgia's hepatitis C elimi-nation program, which was determined by Georgia's NCDC to be
a program evaluation and deemed by NCDC and CDC to be anon-research public health program activity.
ResultsScreeningScreening programs for hepatitis C began in early 2015 inanticipation of the program launch in April of that year. As ofDecember 31, 2018, a total of 1,101,530 adults (39.6% of theGeorgian adult population) had been screened with a rapid anti-HCV test at various settings throughout the country, with morescreened at outpatient settings than any other setting (Table 1).Screening rates greatly increased in November 2016 (Fig. 1) withimplementation of the hospital-based screening program, whichmandated medical facilities to offer anti-HCV screening to allhospitalized patients; since then, 466,087 hospitalized adultshave been screened, an average of 33,292 patients per monththrough December 2018.
Of those screened, 98,430 (8.9%) had a positive anti-HCVresult. The percentage of individuals who tested positive foranti-HCV peaked immediately following launch of the elimina-tion program (29.8%) in May 2015 (Fig. 1). However, over time,the percentage of people who are anti-HCV positive has gradu-ally decreased, dropping to 2.4% by December of 2018 (Fig. 1).Anti-HCV positivity rates varied by site, with the highest ratesamong harm-reduction centers and correctional facilities; thelowest rates were observed among antenatal clinic attendees(Table 1). Anti-HCV positivity rates also varied by age and sex,with the highest rates occurring among men aged 40–49 years(Fig. 2).
Diagnosis of active HCV infectionOf the 98,430 people with positive anti-HCV test results, 78,484(79.7%) received HCV RNA or HCVcAg testing to determinewhether they had active HCV infection; of those, 66,916 (85.3%)tested positive. Initially, those who screened positive on anantibody test were referred to a specialized treatment site for
60,000
50,000
Pers
ons
scre
ened
per
mon
th Percent anti-HC
V positive (%)
35.0
40,000
30,000
20,000
10,000
0
30.0
25.0
20.0
15.0
10.0
5.0
0.0
Jan-1
5Mar-
15May
-15Ju
l-15
Sep-15
Nov-15
Jan-1
6Mar-
16May
-16Ju
l-16
Sep-16
Nov-16
Jan-1
7Mar-
17May
-17Ju
l-17
Sep-17
Nov-17
Jan-1
8Mar-
18May
-18Ju
l-18
Sep-18
Nov-18
Month of screening
Unique persons screenedPercent positive (among all screenings per month)
Fig. 1. Adults screened for anti-HCV antibody and percentage testing positive per month, Georgia hepatitis C elimination program, January 2015 –
December 2018. (This figure appears in color on the web.)
60,000
140,000
Num
ber o
f per
sons
scr
eene
d Percent anti-HC
V positive (%)
35
40,000
100,000
20,000
80,000
0
30
25
20
15
10
5
0
Age (years)
Male screenedMale % anti-HCV+
18-29 30-39 40-49 50-59 60-69 70+
120,000
160,000
180,000 Female screenedFemale % anti-HCV+
Fig. 2. Anti-HCV antibody screening and percentage testing positive by ageand sex, Georgia, January 2015 – December 2018.
682 Journal of Hepatology 2020 vol. 72 j 680–687
Research Article Viral Hepatitis
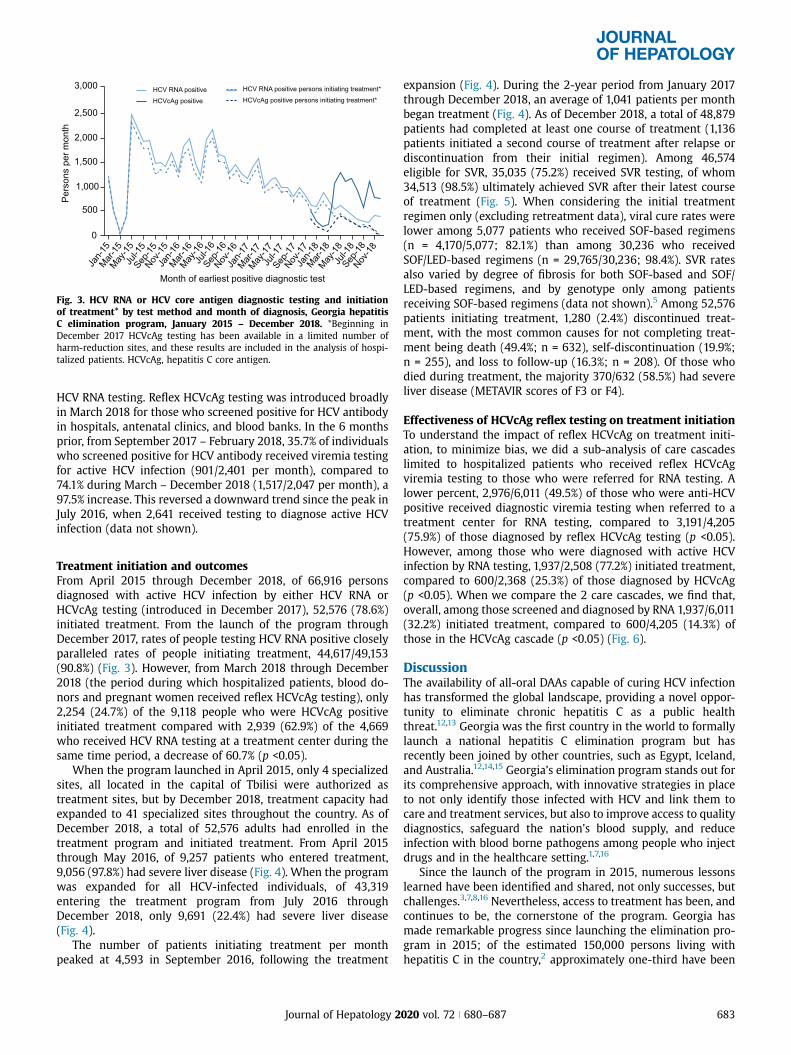
HCV RNA testing. Reflex HCVcAg testing was introduced broadlyin March 2018 for those who screened positive for HCV antibodyin hospitals, antenatal clinics, and blood banks. In the 6 monthsprior, from September 2017 – February 2018, 35.7% of individualswho screened positive for HCV antibody received viremia testingfor active HCV infection (901/2,401 per month), compared to74.1% during March – December 2018 (1,517/2,047 per month), a97.5% increase. This reversed a downward trend since the peak inJuly 2016, when 2,641 received testing to diagnose active HCVinfection (data not shown).
Treatment initiation and outcomesFrom April 2015 through December 2018, of 66,916 personsdiagnosed with active HCV infection by either HCV RNA orHCVcAg testing (introduced in December 2017), 52,576 (78.6%)initiated treatment. From the launch of the program throughDecember 2017, rates of people testing HCV RNA positive closelyparalleled rates of people initiating treatment, 44,617/49,153(90.8%) (Fig. 3). However, from March 2018 through December2018 (the period during which hospitalized patients, blood do-nors and pregnant women received reflex HCVcAg testing), only2,254 (24.7%) of the 9,118 people who were HCVcAg positiveinitiated treatment compared with 2,939 (62.9%) of the 4,669who received HCV RNA testing at a treatment center during thesame time period, a decrease of 60.7% (p <0.05).
When the program launched in April 2015, only 4 specializedsites, all located in the capital of Tbilisi were authorized astreatment sites, but by December 2018, treatment capacity hadexpanded to 41 specialized sites throughout the country. As ofDecember 2018, a total of 52,576 adults had enrolled in thetreatment program and initiated treatment. From April 2015through May 2016, of 9,257 patients who entered treatment,9,056 (97.8%) had severe liver disease (Fig. 4). When the programwas expanded for all HCV-infected individuals, of 43,319entering the treatment program from July 2016 throughDecember 2018, only 9,691 (22.4%) had severe liver disease(Fig. 4).
The number of patients initiating treatment per monthpeaked at 4,593 in September 2016, following the treatment
expansion (Fig. 4). During the 2-year period from January 2017through December 2018, an average of 1,041 patients per monthbegan treatment (Fig. 4). As of December 2018, a total of 48,879patients had completed at least one course of treatment (1,136patients initiated a second course of treatment after relapse ordiscontinuation from their initial regimen). Among 46,574eligible for SVR, 35,035 (75.2%) received SVR testing, of whom34,513 (98.5%) ultimately achieved SVR after their latest courseof treatment (Fig. 5). When considering the initial treatmentregimen only (excluding retreatment data), viral cure rates werelower among 5,077 patients who received SOF-based regimens(n = 4,170/5,077; 82.1%) than among 30,236 who receivedSOF/LED-based regimens (n = 29,765/30,236; 98.4%). SVR ratesalso varied by degree of fibrosis for both SOF-based and SOF/LED-based regimens, and by genotype only among patientsreceiving SOF-based regimens (data not shown).5 Among 52,576patients initiating treatment, 1,280 (2.4%) discontinued treat-ment, with the most common causes for not completing treat-ment being death (49.4%; n = 632), self-discontinuation (19.9%;n = 255), and loss to follow-up (16.3%; n = 208). Of those whodied during treatment, the majority 370/632 (58.5%) had severeliver disease (METAVIR scores of F3 or F4).
Effectiveness of HCVcAg reflex testing on treatment initiationTo understand the impact of reflex HCVcAg on treatment initi-ation, to minimize bias, we did a sub-analysis of care cascadeslimited to hospitalized patients who received reflex HCVcAgviremia testing to those who were referred for RNA testing. Alower percent, 2,976/6,011 (49.5%) of those who were anti-HCVpositive received diagnostic viremia testing when referred to atreatment center for RNA testing, compared to 3,191/4,205(75.9%) of those diagnosed by reflex HCVcAg testing (p <0.05).However, among those who were diagnosed with active HCVinfection by RNA testing, 1,937/2,508 (77.2%) initiated treatment,compared to 600/2,368 (25.3%) of those diagnosed by HCVcAg(p <0.05). When we compare the 2 care cascades, we find that,overall, among those screened and diagnosed by RNA 1,937/6,011(32.2%) initiated treatment, compared to 600/4,205 (14.3%) ofthose in the HCVcAg cascade (p <0.05) (Fig. 6).
DiscussionThe availability of all-oral DAAs capable of curing HCV infectionhas transformed the global landscape, providing a novel oppor-tunity to eliminate chronic hepatitis C as a public healththreat.12,13 Georgia was the first country in the world to formallylaunch a national hepatitis C elimination program but hasrecently been joined by other countries, such as Egypt, Iceland,and Australia.12,14,15 Georgia’s elimination program stands out forits comprehensive approach, with innovative strategies in placeto not only identify those infected with HCV and link them tocare and treatment services, but also to improve access to qualitydiagnostics, safeguard the nation's blood supply, and reduceinfection with blood borne pathogens among people who injectdrugs and in the healthcare setting.1,7,16
Since the launch of the program in 2015, numerous lessonslearned have been identified and shared, not only successes, butchallenges.3,7,8,16 Nevertheless, access to treatment has been, andcontinues to be, the cornerstone of the program. Georgia hasmade remarkable progress since launching the elimination pro-gram in 2015; of the estimated 150,000 persons living withhepatitis C in the country,2 approximately one-third have been
3,000
2,500
Pers
ons
per m
onth
0
Jan-1
5Mar-
15May
-15Ju
l-15
Sep-15
Nov-15
Jan-1
6Mar-
16May
-16Ju
l-16
Sep-16
Nov-16
Jan-1
7Mar-
17May
-17Ju
l-17
Sep-17
Nov-17
Jan-1
8Mar-
18May
-18Ju
l-18
Sep-18
Nov-18
Month of earliest positive diagnostic test
HCV RNA positiveHCVcAg positive
HCV RNA positive persons initiating treatment*HCVcAg positive persons initiating treatment*
2,000
1,500
500
1,000
Fig. 3. HCV RNA or HCV core antigen diagnostic testing and initiationof treatment* by test method and month of diagnosis, Georgia hepatitisC elimination program, January 2015 – December 2018. *Beginning inDecember 2017 HCVcAg testing has been available in a limited number ofharm-reduction sites, and these results are included in the analysis of hospi-talized patients. HCVcAg, hepatitis C core antigen.
Journal of Hepatology 2020 vol. 72 j 680–687 683
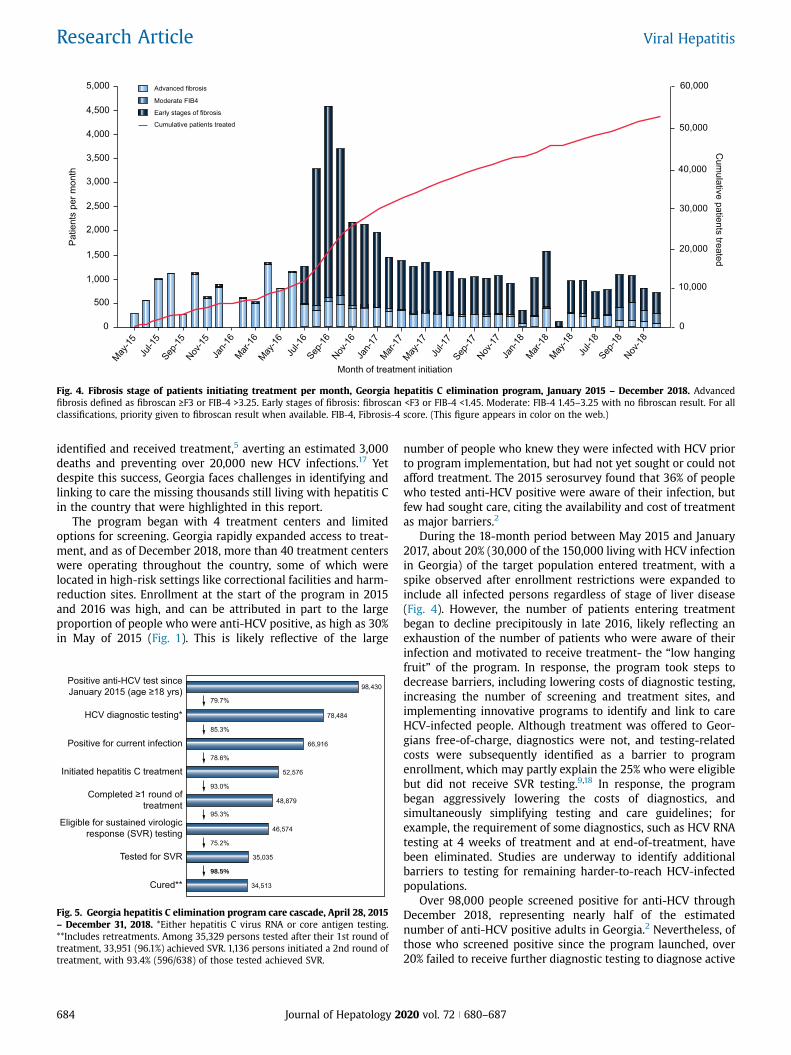
identified and received treatment,5 averting an estimated 3,000deaths and preventing over 20,000 new HCV infections.17 Yetdespite this success, Georgia faces challenges in identifying andlinking to care the missing thousands still living with hepatitis Cin the country that were highlighted in this report.
The program began with 4 treatment centers and limitedoptions for screening. Georgia rapidly expanded access to treat-ment, and as of December 2018, more than 40 treatment centerswere operating throughout the country, some of which werelocated in high-risk settings like correctional facilities and harm-reduction sites. Enrollment at the start of the program in 2015and 2016 was high, and can be attributed in part to the largeproportion of people who were anti-HCV positive, as high as 30%in May of 2015 (Fig. 1). This is likely reflective of the large
number of people who knew they were infected with HCV priorto program implementation, but had not yet sought or could notafford treatment. The 2015 serosurvey found that 36% of peoplewho tested anti-HCV positive were aware of their infection, butfew had sought care, citing the availability and cost of treatmentas major barriers.2
During the 18-month period between May 2015 and January2017, about 20% (30,000 of the 150,000 living with HCV infectionin Georgia) of the target population entered treatment, with aspike observed after enrollment restrictions were expanded toinclude all infected persons regardless of stage of liver disease(Fig. 4). However, the number of patients entering treatmentbegan to decline precipitously in late 2016, likely reflecting anexhaustion of the number of patients who were aware of theirinfection and motivated to receive treatment- the “low hangingfruit” of the program. In response, the program took steps todecrease barriers, including lowering costs of diagnostic testing,increasing the number of screening and treatment sites, andimplementing innovative programs to identify and link to careHCV-infected people. Although treatment was offered to Geor-gians free-of-charge, diagnostics were not, and testing-relatedcosts were subsequently identified as a barrier to programenrollment, which may partly explain the 25% who were eligiblebut did not receive SVR testing.9,18 In response, the programbegan aggressively lowering the costs of diagnostics, andsimultaneously simplifying testing and care guidelines; forexample, the requirement of some diagnostics, such as HCV RNAtesting at 4 weeks of treatment and at end-of-treatment, havebeen eliminated. Studies are underway to identify additionalbarriers to testing for remaining harder-to-reach HCV-infectedpopulations.
Over 98,000 people screened positive for anti-HCV throughDecember 2018, representing nearly half of the estimatednumber of anti-HCV positive adults in Georgia.2 Nevertheless, ofthose who screened positive since the program launched, over20% failed to receive further diagnostic testing to diagnose active
4,500
5,000Pa
tient
s pe
r mon
thC
umulative patients treated
60,000
4,000
3,000
2,000
1,000
0
50,000
40,000
30,000
20,000
10,000
0
May-15
Jul-1
5Sep
-15Nov
-15Ja
n-16
Mar-16
May-16
Jul-1
6Sep
-16Nov
-16Ja
n-17
Mar-17
May-17
Jul-1
7Sep
-17Nov
-17Ja
n-18
Mar-18
May-18
Jul-1
8Sep
-18Nov
-18
Month of treatment initiation
Advanced fibrosis
Moderate FIB4
500
1,500
2,500
3,500
Early stages of fibrosis
Cumulative patients treated
Fig. 4. Fibrosis stage of patients initiating treatment per month, Georgia hepatitis C elimination program, January 2015 – December 2018. Advancedfibrosis defined as fibroscan >−F3 or FIB-4 >3.25. Early stages of fibrosis: fibroscan <F3 or FIB-4 <1.45. Moderate: FIB-4 1.45–3.25 with no fibroscan result. For allclassifications, priority given to fibroscan result when available. FIB-4, Fibrosis-4 score. (This figure appears in color on the web.)
Positive anti-HCV test sinceJanuary 2015 (age ≥18 yrs)
HCV diagnostic testing*
Positive for current infection
Initiated hepatitis C treatment
Completed ≥1 round oftreatment
Eligible for sustained virologicresponse (SVR) testing
Tested for SVR
Cured**
98,430
78,484
66,916
52,576
48,879
46,574
35,035
34,513
79.7%
85.3%
78.6%
93.0%
95.3%
75.2%
98.5%
Fig. 5. Georgia hepatitis C elimination program care cascade, April 28, 2015– December 31, 2018. *Either hepatitis C virus RNA or core antigen testing.**Includes retreatments. Among 35,329 persons tested after their 1st round oftreatment, 33,951 (96.1%) achieved SVR. 1,136 persons initiated a 2nd round oftreatment, with 93.4% (596/638) of those tested achieved SVR.
684 Journal of Hepatology 2020 vol. 72 j 680–687
Research Article Viral Hepatitis
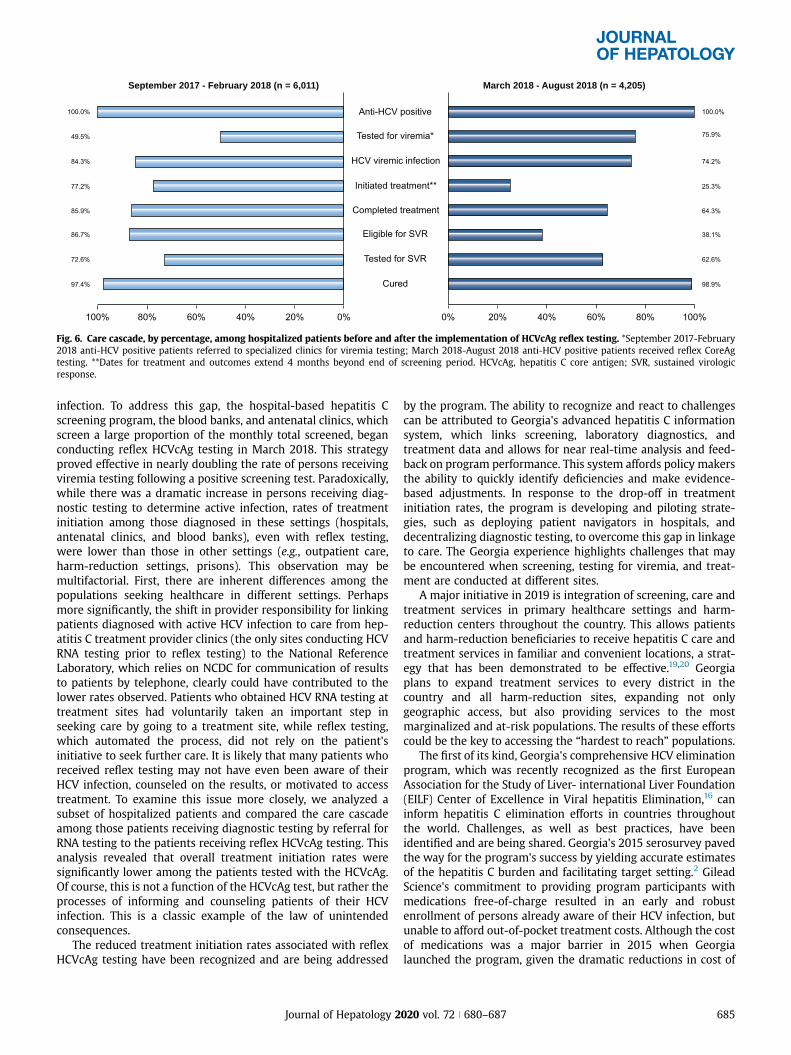
infection. To address this gap, the hospital-based hepatitis Cscreening program, the blood banks, and antenatal clinics, whichscreen a large proportion of the monthly total screened, beganconducting reflex HCVcAg testing in March 2018. This strategyproved effective in nearly doubling the rate of persons receivingviremia testing following a positive screening test. Paradoxically,while there was a dramatic increase in persons receiving diag-nostic testing to determine active infection, rates of treatmentinitiation among those diagnosed in these settings (hospitals,antenatal clinics, and blood banks), even with reflex testing,were lower than those in other settings (e.g., outpatient care,harm-reduction settings, prisons). This observation may bemultifactorial. First, there are inherent differences among thepopulations seeking healthcare in different settings. Perhapsmore significantly, the shift in provider responsibility for linkingpatients diagnosed with active HCV infection to care from hep-atitis C treatment provider clinics (the only sites conducting HCVRNA testing prior to reflex testing) to the National ReferenceLaboratory, which relies on NCDC for communication of resultsto patients by telephone, clearly could have contributed to thelower rates observed. Patients who obtained HCV RNA testing attreatment sites had voluntarily taken an important step inseeking care by going to a treatment site, while reflex testing,which automated the process, did not rely on the patient'sinitiative to seek further care. It is likely that many patients whoreceived reflex testing may not have even been aware of theirHCV infection, counseled on the results, or motivated to accesstreatment. To examine this issue more closely, we analyzed asubset of hospitalized patients and compared the care cascadeamong those patients receiving diagnostic testing by referral forRNA testing to the patients receiving reflex HCVcAg testing. Thisanalysis revealed that overall treatment initiation rates weresignificantly lower among the patients tested with the HCVcAg.Of course, this is not a function of the HCVcAg test, but rather theprocesses of informing and counseling patients of their HCVinfection. This is a classic example of the law of unintendedconsequences.
The reduced treatment initiation rates associated with reflexHCVcAg testing have been recognized and are being addressed
by the program. The ability to recognize and react to challengescan be attributed to Georgia's advanced hepatitis C informationsystem, which links screening, laboratory diagnostics, andtreatment data and allows for near real-time analysis and feed-back on program performance. This system affords policy makersthe ability to quickly identify deficiencies and make evidence-based adjustments. In response to the drop-off in treatmentinitiation rates, the program is developing and piloting strate-gies, such as deploying patient navigators in hospitals, anddecentralizing diagnostic testing, to overcome this gap in linkageto care. The Georgia experience highlights challenges that maybe encountered when screening, testing for viremia, and treat-ment are conducted at different sites.
A major initiative in 2019 is integration of screening, care andtreatment services in primary healthcare settings and harm-reduction centers throughout the country. This allows patientsand harm-reduction beneficiaries to receive hepatitis C care andtreatment services in familiar and convenient locations, a strat-egy that has been demonstrated to be effective.19,20 Georgiaplans to expand treatment services to every district in thecountry and all harm-reduction sites, expanding not onlygeographic access, but also providing services to the mostmarginalized and at-risk populations. The results of these effortscould be the key to accessing the “hardest to reach” populations.
The first of its kind, Georgia's comprehensive HCV eliminationprogram, which was recently recognized as the first EuropeanAssociation for the Study of Liver- international Liver Foundation(EILF) Center of Excellence in Viral hepatitis Elimination,16 caninform hepatitis C elimination efforts in countries throughoutthe world. Challenges, as well as best practices, have beenidentified and are being shared. Georgia's 2015 serosurvey pavedthe way for the program's success by yielding accurate estimatesof the hepatitis C burden and facilitating target setting.2 GileadScience's commitment to providing program participants withmedications free-of-charge resulted in an early and robustenrollment of persons already aware of their HCV infection, butunable to afford out-of-pocket treatment costs. Although the costof medications was a major barrier in 2015 when Georgialaunched the program, given the dramatic reductions in cost of
Anti-HCV positive
Tested for viremia*
HCV viremic infection
Initiated treatment**
Completed treatment
Eligible for SVR
Tested for SVR
Cured
100.0%
75.9%
74.2%
25.3%
64.3%
38.1%
62.6%
98.9%
100.0%
49.5%
84.3%
77.2%
85.9%
86.7%
72.6%
0% 20% 40% 60% 80% 100%
September 2017 - February 2018 (n = 6,011) March 2018 - August 2018 (n = 4,205)
0%20%40%60%80%100%
97.4%
Fig. 6. Care cascade, by percentage, among hospitalized patients before and after the implementation of HCVcAg reflex testing. *September 2017-February2018 anti-HCV positive patients referred to specialized clinics for viremia testing; March 2018-August 2018 anti-HCV positive patients received reflex CoreAgtesting. **Dates for treatment and outcomes extend 4 months beyond end of screening period. HCVcAg, hepatitis C core antigen; SVR, sustained virologicresponse.
Journal of Hepatology 2020 vol. 72 j 680–687 685
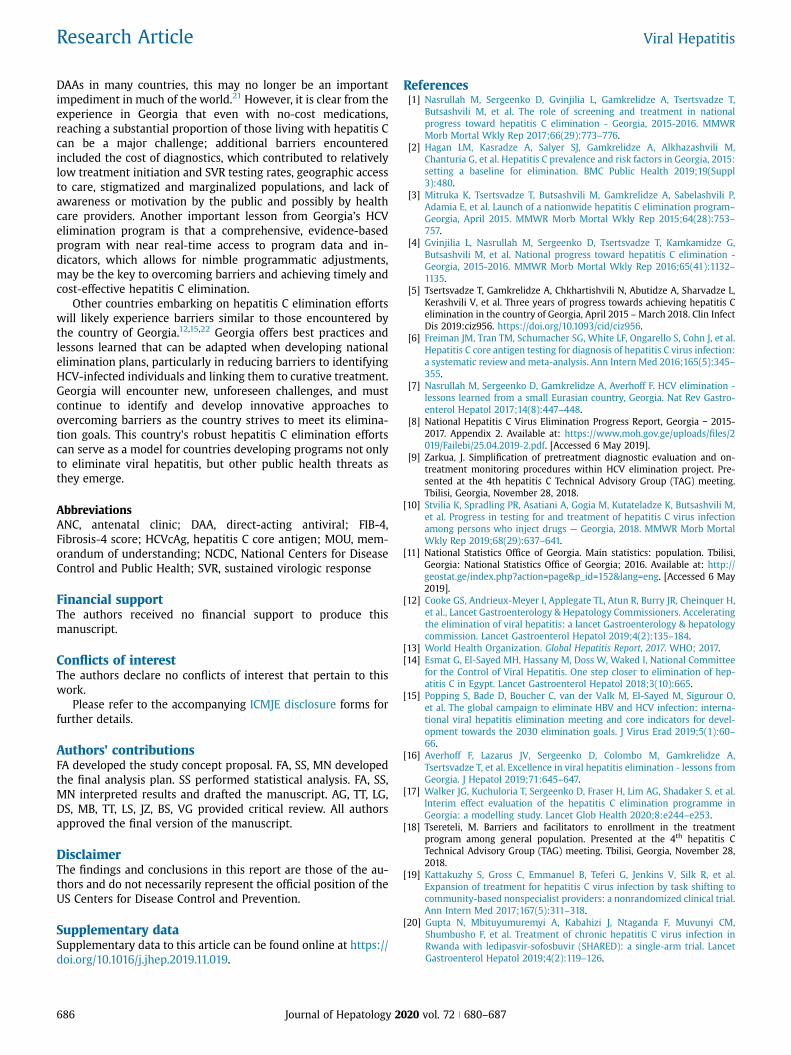
DAAs in many countries, this may no longer be an importantimpediment in much of the world.21 However, it is clear from theexperience in Georgia that even with no-cost medications,reaching a substantial proportion of those living with hepatitis Ccan be a major challenge; additional barriers encounteredincluded the cost of diagnostics, which contributed to relativelylow treatment initiation and SVR testing rates, geographic accessto care, stigmatized and marginalized populations, and lack ofawareness or motivation by the public and possibly by healthcare providers. Another important lesson from Georgia’s HCVelimination program is that a comprehensive, evidence-basedprogram with near real-time access to program data and in-dicators, which allows for nimble programmatic adjustments,may be the key to overcoming barriers and achieving timely andcost-effective hepatitis C elimination.
Other countries embarking on hepatitis C elimination effortswill likely experience barriers similar to those encountered bythe country of Georgia.12,15,22 Georgia offers best practices andlessons learned that can be adapted when developing nationalelimination plans, particularly in reducing barriers to identifyingHCV-infected individuals and linking them to curative treatment.Georgia will encounter new, unforeseen challenges, and mustcontinue to identify and develop innovative approaches toovercoming barriers as the country strives to meet its elimina-tion goals. This country's robust hepatitis C elimination effortscan serve as a model for countries developing programs not onlyto eliminate viral hepatitis, but other public health threats asthey emerge.
AbbreviationsANC, antenatal clinic; DAA, direct-acting antiviral; FIB-4,Fibrosis-4 score; HCVcAg, hepatitis C core antigen; MOU, mem-orandum of understanding; NCDC, National Centers for DiseaseControl and Public Health; SVR, sustained virologic response
Financial supportThe authors received no financial support to produce thismanuscript.
Conflicts of interestThe authors declare no conflicts of interest that pertain to thiswork.
Please refer to the accompanying ICMJE disclosure forms forfurther details.
Authors' contributionsFA developed the study concept proposal. FA, SS, MN developedthe final analysis plan. SS performed statistical analysis. FA, SS,MN interpreted results and drafted the manuscript. AG, TT, LG,DS, MB, TT, LS, JZ, BS, VG provided critical review. All authorsapproved the final version of the manuscript.
DisclaimerThe findings and conclusions in this report are those of the au-thors and do not necessarily represent the official position of theUS Centers for Disease Control and Prevention.
Supplementary dataSupplementary data to this article can be found online at https://doi.org/10.1016/j.jhep.2019.11.019.
References[1] Nasrullah M, Sergeenko D, Gvinjilia L, Gamkrelidze A, Tsertsvadze T,
Butsashvili M, et al. The role of screening and treatment in nationalprogress toward hepatitis C elimination - Georgia, 2015-2016. MMWRMorb Mortal Wkly Rep 2017;66(29):773–776.
[2] Hagan LM, Kasradze A, Salyer SJ, Gamkrelidze A, Alkhazashvili M,Chanturia G, et al. Hepatitis C prevalence and risk factors in Georgia, 2015:setting a baseline for elimination. BMC Public Health 2019;19(Suppl3):480.
[3] Mitruka K, Tsertsvadze T, Butsashvili M, Gamkrelidze A, Sabelashvili P,Adamia E, et al. Launch of a nationwide hepatitis C elimination program–
Georgia, April 2015. MMWR Morb Mortal Wkly Rep 2015;64(28):753–757.
[4] Gvinjilia L, Nasrullah M, Sergeenko D, Tsertsvadze T, Kamkamidze G,Butsashvili M, et al. National progress toward hepatitis C elimination -Georgia, 2015-2016. MMWR Morb Mortal Wkly Rep 2016;65(41):1132–1135.
[5] Tsertsvadze T, Gamkrelidze A, Chkhartishvili N, Abutidze A, Sharvadze L,Kerashvili V, et al. Three years of progress towards achieving hepatitis Celimination in the country of Georgia, April 2015 –March 2018. Clin InfectDis 2019:ciz956. https://doi.org/10.1093/cid/ciz956.
[6] Freiman JM, Tran TM, Schumacher SG, White LF, Ongarello S, Cohn J, et al.Hepatitis C core antigen testing for diagnosis of hepatitis C virus infection:a systematic review and meta-analysis. Ann Intern Med 2016;165(5):345–355.
[7] Nasrullah M, Sergeenko D, Gamkrelidze A, Averhoff F. HCV elimination -lessons learned from a small Eurasian country, Georgia. Nat Rev Gastro-enterol Hepatol 2017;14(8):447–448.
[8] National Hepatitis C Virus Elimination Progress Report, Georgia − 2015-2017. Appendix 2. Available at: https://www.moh.gov.ge/uploads/files/2019/Failebi/25.04.2019-2.pdf. [Accessed 6 May 2019].
[9] Zarkua, J. Simplification of pretreatment diagnostic evaluation and on-treatment monitoring procedures within HCV elimination project. Pre-sented at the 4th hepatitis C Technical Advisory Group (TAG) meeting.Tbilisi, Georgia, November 28, 2018.
[10] Stvilia K, Spradling PR, Asatiani A, Gogia M, Kutateladze K, Butsashvili M,et al. Progress in testing for and treatment of hepatitis C virus infectionamong persons who inject drugs — Georgia, 2018. MMWR Morb MortalWkly Rep 2019;68(29):637–641.
[11] National Statistics Office of Georgia. Main statistics: population. Tbilisi,Georgia: National Statistics Office of Georgia; 2016. Available at: http://geostat.ge/index.php?action=page&p_id=152&lang=eng. [Accessed 6 May2019].
[12] Cooke GS, Andrieux-Meyer I, Applegate TL, Atun R, Burry JR, Cheinquer H,et al., Lancet Gastroenterology & Hepatology Commissioners. Acceleratingthe elimination of viral hepatitis: a lancet Gastroenterology & hepatologycommission. Lancet Gastroenterol Hepatol 2019;4(2):135–184.
[13] World Health Organization. Global Hepatitis Report, 2017. WHO; 2017.[14] Esmat G, El-Sayed MH, Hassany M, Doss W, Waked I, National Committee
for the Control of Viral Hepatitis. One step closer to elimination of hep-atitis C in Egypt. Lancet Gastroenterol Hepatol 2018;3(10):665.
[15] Popping S, Bade D, Boucher C, van der Valk M, El-Sayed M, Sigurour O,et al. The global campaign to eliminate HBV and HCV infection: interna-tional viral hepatitis elimination meeting and core indicators for devel-opment towards the 2030 elimination goals. J Virus Erad 2019;5(1):60–66.
[16] Averhoff F, Lazarus JV, Sergeenko D, Colombo M, Gamkrelidze A,Tsertsvadze T, et al. Excellence in viral hepatitis elimination - lessons fromGeorgia. J Hepatol 2019;71:645–647.
[17] Walker JG, Kuchuloria T, Sergeenko D, Fraser H, Lim AG, Shadaker S, et al.Interim effect evaluation of the hepatitis C elimination programme inGeorgia: a modelling study. Lancet Glob Health 2020;8:e244–e253.
[18] Tsereteli, M. Barriers and facilitators to enrollment in the treatmentprogram among general population. Presented at the 4th hepatitis CTechnical Advisory Group (TAG) meeting. Tbilisi, Georgia, November 28,2018.
[19] Kattakuzhy S, Gross C, Emmanuel B, Teferi G, Jenkins V, Silk R, et al.Expansion of treatment for hepatitis C virus infection by task shifting tocommunity-based nonspecialist providers: a nonrandomized clinical trial.Ann Intern Med 2017;167(5):311–318.
[20] Gupta N, Mbituyumuremyi A, Kabahizi J, Ntaganda F, Muvunyi CM,Shumbusho F, et al. Treatment of chronic hepatitis C virus infection inRwanda with ledipasvir-sofosbuvir (SHARED): a single-arm trial. LancetGastroenterol Hepatol 2019;4(2):119–126.
686 Journal of Hepatology 2020 vol. 72 j 680–687
Research Article Viral Hepatitis

[21] World Health Organization. Progress Report on Access to Hepatitis CTreatment: Focus on Overcoming Barriers in Low and Middle IncomeCountries. Geneva, Switzerland: World Health Organization; 2018. http://apps.who.int/iris/bitstream/handle/10665/260445/WHO-CDS-HIV-18.4-eng.pdf;jsessionid=7090253C8CCE163E5B148508158B7536?sequence=1.[Accessed 2 May 2019].
[22] Doyle JS, Scott N, Sacks-Davis R, Pedrana AE, Thompson AJ, Hellard ME,et al., Eliminate Hepatitis C Partnership. Treatment access is only thefirst step to hepatitis C elimination: experience of universal anti-viraltreatment access in Australia. Aliment Pharmacol Ther2019;49(9):1223–1229.
Journal of Hepatology 2020 vol. 72 j 680–687 687
Contents lists available at ScienceDirect
Preventive Medicine
journal homepage: www.elsevier.com/locate/ypmed
Screening and linkage to care for hepatitis C among inpatients in Georgia'snational hospital screening program
Shaun Shadakera,⁎, Muazzam Nasrullaha, Amiran Gamkrelidzeb, Jessica Rayc, Lia Gvinjiliad,Tinatin Kuchuloriad, Maia Butsashvilie, Vladimer Getiab, David Metrevelif, Maia Tseretelib,Tengiz Tsertsvadzeg, Ruth Link-Gellesa, Alexander J. Millmana, Aleksandre Turdziladzeb,Francisco Averhoffa
a Centers for Disease Control and Prevention, Division of Viral Hepatitis, National Center for HIV, Hepatitis, STD&TB Prevention, Atlanta, USAbNational Center for Disease Control and Public Health, Tbilisi, Georgiac Seattle Children's Hospital, Seattle, Washington, USAd CDC Foundation, Tbilisi, Georgiae Clinic NeoLab, Tbilisi, GeorgiafMedical Center Mrcheveli, Tbilisi, Georgiag Infectious Diseases, AIDS and Clinical Immunology Research Center, Tbilisi, Georgia
A R T I C L E I N F O
Keywords:GeorgiaHepatitis CHospitalScreeningLinkage to care
A B S T R A C T
The country of Georgia initiated an ambitious national hepatitis C elimination program. To facilitate elimination,a national hospital hepatitis C screening program was launched in November 2016, offering all inpatientsscreening for HCV infection. This analysis assesses the effectiveness of the first year of the screening program toidentify HCV-infected persons and link them to care. Data from Georgia's electronic Health ManagementInformation System and ELIMINATION-C treatment database were analyzed for patients aged ≥18 years hos-pitalized from November 1, 2016 to October 31, 2017. We described patient characteristics and screening resultsand compared linked-to-care patients to those not linked to care, defined as having a test for viremia followingan HCV antibody (anti-HCV) positive hospital screening. Of 291,975 adult inpatients, 252,848 (86.6%) werescreened. Of them, 4.9% tested positive, with a high of 17.4% among males aged 40–49. Overall, 19.8% of anti-HCV+ patients were linked to care, which differed by sex (20.6% for males vs. 18.4% for females; p= .019), age(23.9% for age 50–59 years vs. 10.7% for age ≥ 70 years; p < .0001), and length of hospitalization (21.8%among patients hospitalized for 1 day vs. 16.1% for those hospitalized 11+ days; p = .023). Redundantscreening is a challenge; 15.6% of patients were screened multiple times and 27.6% of anti-HCV+ patients had aprior viremia test. This evaluation demonstrates that hospital-based screening programs can identify largenumbers of anti-HCV+ persons, supporting hepatitis C elimination. However, low linkage-to-care rates un-derscore the need for screening programs to be coupled with effective linkage strategies.
1. Introduction
Globally, in 2015 an estimated 71 million people were infected withhepatitis C virus (HCV), with approximately 400,000 HCV-attributabledeaths (World Health Organization, 2017). Georgia, a lower-middleincome Eurasian country with a population of 3.7 million people (TheWorld Bank, 2017) has a high prevalence of HCV infection. Resultsfrom a nationally representative seroprevalence survey among Geor-gian adults (≥18 years) in 2015 found an HCV antibody (anti-HCV)
prevalence of 7.7% (equating to approximately 215,000 persons) and achronic hepatitis C prevalence of 5.4% (HCV RNA positive by PCR)(approximately 150,000 persons) (Hagan et al., 2019).
On April 28, 2015, in collaboration with international partners in-cluding technical assistance from U.S. Centers for Disease Control andPrevention (CDC) and a commitment from Gilead Sciences to providedirect-acting antiviral hepatitis C medications (DAAs) free of charge forall persons living with HCV infection in the country, Georgia launchedan ambitious national hepatitis C elimination program (Gvinjilia et al.,
https://doi.org/10.1016/j.ypmed.2020.106153Received 2 December 2019; Received in revised form 4 March 2020; Accepted 22 May 2020
⁎ Corresponding author at: Division of Viral Hepatitis, National Center for HIV/AIDS, Viral Hepatitis, STD, and TB Prevention, Centers for Disease Control andPrevention, 1600 Clifton Road, MS US12-3, Atlanta, GA 30329, USA.
E-mail address: [email protected] (S. Shadaker).
Preventive Medicine 138 (2020) 106153
Available online 27 May 20200091-7435/ © 2020 Elsevier Inc. All rights reserved.
T
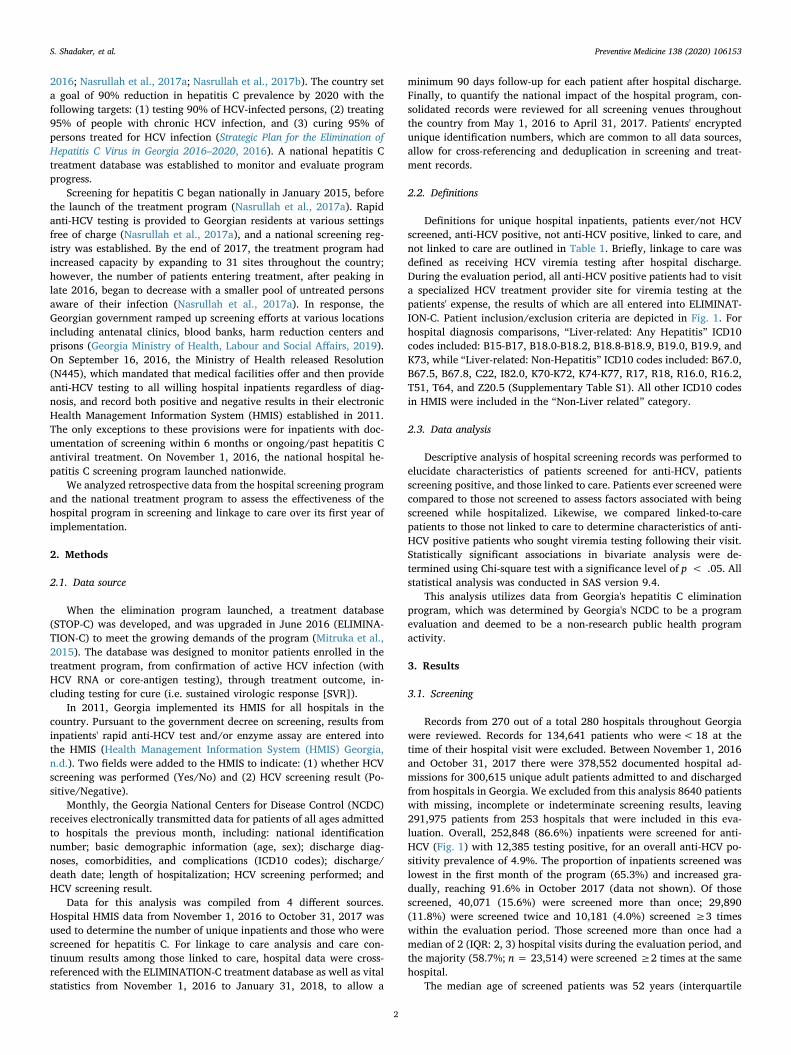
2016; Nasrullah et al., 2017a; Nasrullah et al., 2017b). The country seta goal of 90% reduction in hepatitis C prevalence by 2020 with thefollowing targets: (1) testing 90% of HCV-infected persons, (2) treating95% of people with chronic HCV infection, and (3) curing 95% ofpersons treated for HCV infection (Strategic Plan for the Elimination ofHepatitis C Virus in Georgia 2016–2020, 2016). A national hepatitis Ctreatment database was established to monitor and evaluate programprogress.
Screening for hepatitis C began nationally in January 2015, beforethe launch of the treatment program (Nasrullah et al., 2017a). Rapidanti-HCV testing is provided to Georgian residents at various settingsfree of charge (Nasrullah et al., 2017a), and a national screening reg-istry was established. By the end of 2017, the treatment program hadincreased capacity by expanding to 31 sites throughout the country;however, the number of patients entering treatment, after peaking inlate 2016, began to decrease with a smaller pool of untreated personsaware of their infection (Nasrullah et al., 2017a). In response, theGeorgian government ramped up screening efforts at various locationsincluding antenatal clinics, blood banks, harm reduction centers andprisons (Georgia Ministry of Health, Labour and Social Affairs, 2019).On September 16, 2016, the Ministry of Health released Resolution(N445), which mandated that medical facilities offer and then provideanti-HCV testing to all willing hospital inpatients regardless of diag-nosis, and record both positive and negative results in their electronicHealth Management Information System (HMIS) established in 2011.The only exceptions to these provisions were for inpatients with doc-umentation of screening within 6 months or ongoing/past hepatitis Cantiviral treatment. On November 1, 2016, the national hospital he-patitis C screening program launched nationwide.
We analyzed retrospective data from the hospital screening programand the national treatment program to assess the effectiveness of thehospital program in screening and linkage to care over its first year ofimplementation.
2. Methods
2.1. Data source
When the elimination program launched, a treatment database(STOP-C) was developed, and was upgraded in June 2016 (ELIMINA-TION-C) to meet the growing demands of the program (Mitruka et al.,2015). The database was designed to monitor patients enrolled in thetreatment program, from confirmation of active HCV infection (withHCV RNA or core-antigen testing), through treatment outcome, in-cluding testing for cure (i.e. sustained virologic response [SVR]).
In 2011, Georgia implemented its HMIS for all hospitals in thecountry. Pursuant to the government decree on screening, results frominpatients' rapid anti-HCV test and/or enzyme assay are entered intothe HMIS (Health Management Information System (HMIS) Georgia,n.d.). Two fields were added to the HMIS to indicate: (1) whether HCVscreening was performed (Yes/No) and (2) HCV screening result (Po-sitive/Negative).
Monthly, the Georgia National Centers for Disease Control (NCDC)receives electronically transmitted data for patients of all ages admittedto hospitals the previous month, including: national identificationnumber; basic demographic information (age, sex); discharge diag-noses, comorbidities, and complications (ICD10 codes); discharge/death date; length of hospitalization; HCV screening performed; andHCV screening result.
Data for this analysis was compiled from 4 different sources.Hospital HMIS data from November 1, 2016 to October 31, 2017 wasused to determine the number of unique inpatients and those who werescreened for hepatitis C. For linkage to care analysis and care con-tinuum results among those linked to care, hospital data were cross-referenced with the ELIMINATION-C treatment database as well as vitalstatistics from November 1, 2016 to January 31, 2018, to allow a
minimum 90 days follow-up for each patient after hospital discharge.Finally, to quantify the national impact of the hospital program, con-solidated records were reviewed for all screening venues throughoutthe country from May 1, 2016 to April 31, 2017. Patients' encryptedunique identification numbers, which are common to all data sources,allow for cross-referencing and deduplication in screening and treat-ment records.
2.2. Definitions
Definitions for unique hospital inpatients, patients ever/not HCVscreened, anti-HCV positive, not anti-HCV positive, linked to care, andnot linked to care are outlined in Table 1. Briefly, linkage to care wasdefined as receiving HCV viremia testing after hospital discharge.During the evaluation period, all anti-HCV positive patients had to visita specialized HCV treatment provider site for viremia testing at thepatients' expense, the results of which are all entered into ELIMINAT-ION-C. Patient inclusion/exclusion criteria are depicted in Fig. 1. Forhospital diagnosis comparisons, “Liver-related: Any Hepatitis” ICD10codes included: B15-B17, B18.0-B18.2, B18.8-B18.9, B19.0, B19.9, andK73, while “Liver-related: Non-Hepatitis” ICD10 codes included: B67.0,B67.5, B67.8, C22, I82.0, K70-K72, K74-K77, R17, R18, R16.0, R16.2,T51, T64, and Z20.5 (Supplementary Table S1). All other ICD10 codesin HMIS were included in the “Non-Liver related” category.
2.3. Data analysis
Descriptive analysis of hospital screening records was performed toelucidate characteristics of patients screened for anti-HCV, patientsscreening positive, and those linked to care. Patients ever screened werecompared to those not screened to assess factors associated with beingscreened while hospitalized. Likewise, we compared linked-to-carepatients to those not linked to care to determine characteristics of anti-HCV positive patients who sought viremia testing following their visit.Statistically significant associations in bivariate analysis were de-termined using Chi-square test with a significance level of p < .05. Allstatistical analysis was conducted in SAS version 9.4.
This analysis utilizes data from Georgia's hepatitis C eliminationprogram, which was determined by Georgia's NCDC to be a programevaluation and deemed to be a non-research public health programactivity.
3. Results
3.1. Screening
Records from 270 out of a total 280 hospitals throughout Georgiawere reviewed. Records for 134,641 patients who were<18 at thetime of their hospital visit were excluded. Between November 1, 2016and October 31, 2017 there were 378,552 documented hospital ad-missions for 300,615 unique adult patients admitted to and dischargedfrom hospitals in Georgia. We excluded from this analysis 8640 patientswith missing, incomplete or indeterminate screening results, leaving291,975 patients from 253 hospitals that were included in this eva-luation. Overall, 252,848 (86.6%) inpatients were screened for anti-HCV (Fig. 1) with 12,385 testing positive, for an overall anti-HCV po-sitivity prevalence of 4.9%. The proportion of inpatients screened waslowest in the first month of the program (65.3%) and increased gra-dually, reaching 91.6% in October 2017 (data not shown). Of thosescreened, 40,071 (15.6%) were screened more than once; 29,890(11.8%) were screened twice and 10,181 (4.0%) screened ≥3 timeswithin the evaluation period. Those screened more than once had amedian of 2 (IQR: 2, 3) hospital visits during the evaluation period, andthe majority (58.7%; n = 23,514) were screened ≥2 times at the samehospital.
The median age of screened patients was 52 years (interquartile
S. Shadaker, et al. Preventive Medicine 138 (2020) 106153
2
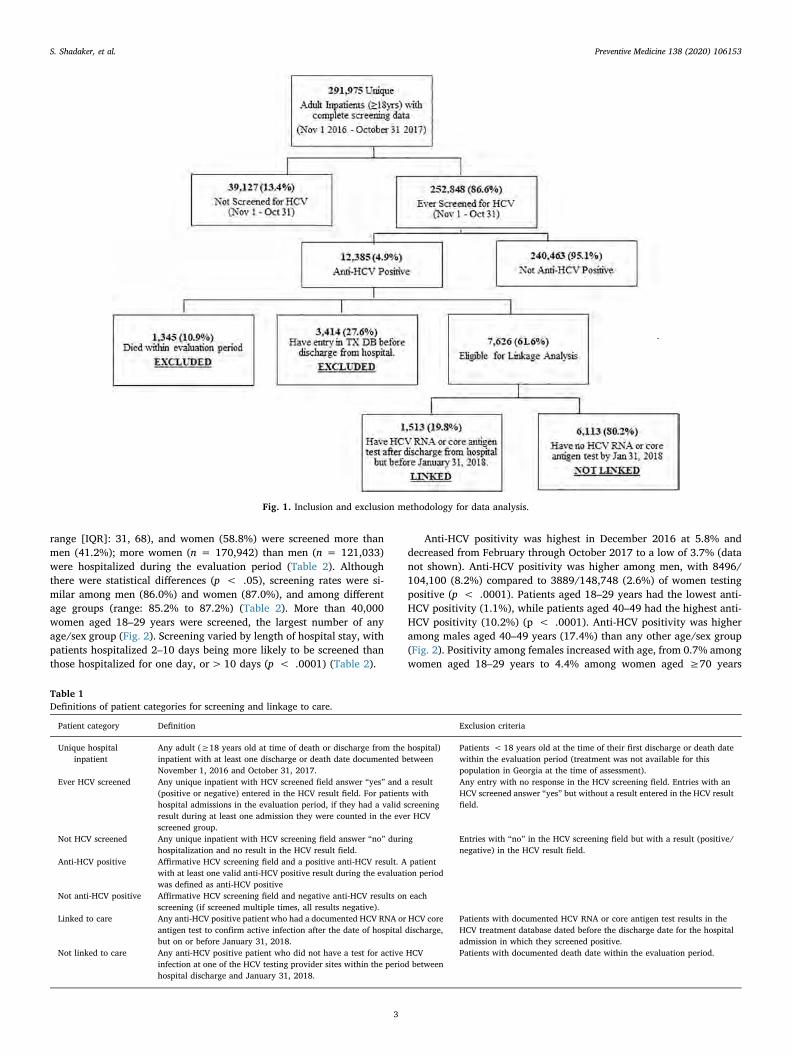
range [IQR]: 31, 68), and women (58.8%) were screened more thanmen (41.2%); more women (n = 170,942) than men (n = 121,033)were hospitalized during the evaluation period (Table 2). Althoughthere were statistical differences (p < .05), screening rates were si-milar among men (86.0%) and women (87.0%), and among differentage groups (range: 85.2% to 87.2%) (Table 2). More than 40,000women aged 18–29 years were screened, the largest number of anyage/sex group (Fig. 2). Screening varied by length of hospital stay, withpatients hospitalized 2–10 days being more likely to be screened thanthose hospitalized for one day, or> 10 days (p < .0001) (Table 2).
Anti-HCV positivity was highest in December 2016 at 5.8% anddecreased from February through October 2017 to a low of 3.7% (datanot shown). Anti-HCV positivity was higher among men, with 8496/104,100 (8.2%) compared to 3889/148,748 (2.6%) of women testingpositive (p < .0001). Patients aged 18–29 years had the lowest anti-HCV positivity (1.1%), while patients aged 40–49 had the highest anti-HCV positivity (10.2%) (p < .0001). Anti-HCV positivity was higheramong males aged 40–49 years (17.4%) than any other age/sex group(Fig. 2). Positivity among females increased with age, from 0.7% amongwomen aged 18–29 years to 4.4% among women aged ≥70 years
Fig. 1. Inclusion and exclusion methodology for data analysis.
Table 1Definitions of patient categories for screening and linkage to care.
Patient category Definition Exclusion criteria
Unique hospitalinpatient
Any adult (≥18 years old at time of death or discharge from the hospital)inpatient with at least one discharge or death date documented betweenNovember 1, 2016 and October 31, 2017.
Patients < 18 years old at the time of their first discharge or death datewithin the evaluation period (treatment was not available for thispopulation in Georgia at the time of assessment).
Ever HCV screened Any unique inpatient with HCV screened field answer “yes” and a result(positive or negative) entered in the HCV result field. For patients withhospital admissions in the evaluation period, if they had a valid screeningresult during at least one admission they were counted in the ever HCVscreened group.
Any entry with no response in the HCV screening field. Entries with anHCV screened answer “yes” but without a result entered in the HCV resultfield.
Not HCV screened Any unique inpatient with HCV screening field answer “no” duringhospitalization and no result in the HCV result field.
Entries with “no” in the HCV screening field but with a result (positive/negative) in the HCV result field.
Anti-HCV positive Affirmative HCV screening field and a positive anti-HCV result. A patientwith at least one valid anti-HCV positive result during the evaluation periodwas defined as anti-HCV positive
Not anti-HCV positive Affirmative HCV screening field and negative anti-HCV results on eachscreening (if screened multiple times, all results negative).
Linked to care Any anti-HCV positive patient who had a documented HCV RNA or HCV coreantigen test to confirm active infection after the date of hospital discharge,but on or before January 31, 2018.
Patients with documented HCV RNA or core antigen test results in theHCV treatment database dated before the discharge date for the hospitaladmission in which they screened positive.
Not linked to care Any anti-HCV positive patient who did not have a test for active HCVinfection at one of the HCV testing provider sites within the period betweenhospital discharge and January 31, 2018.
Patients with documented death date within the evaluation period.
S. Shadaker, et al. Preventive Medicine 138 (2020) 106153
3
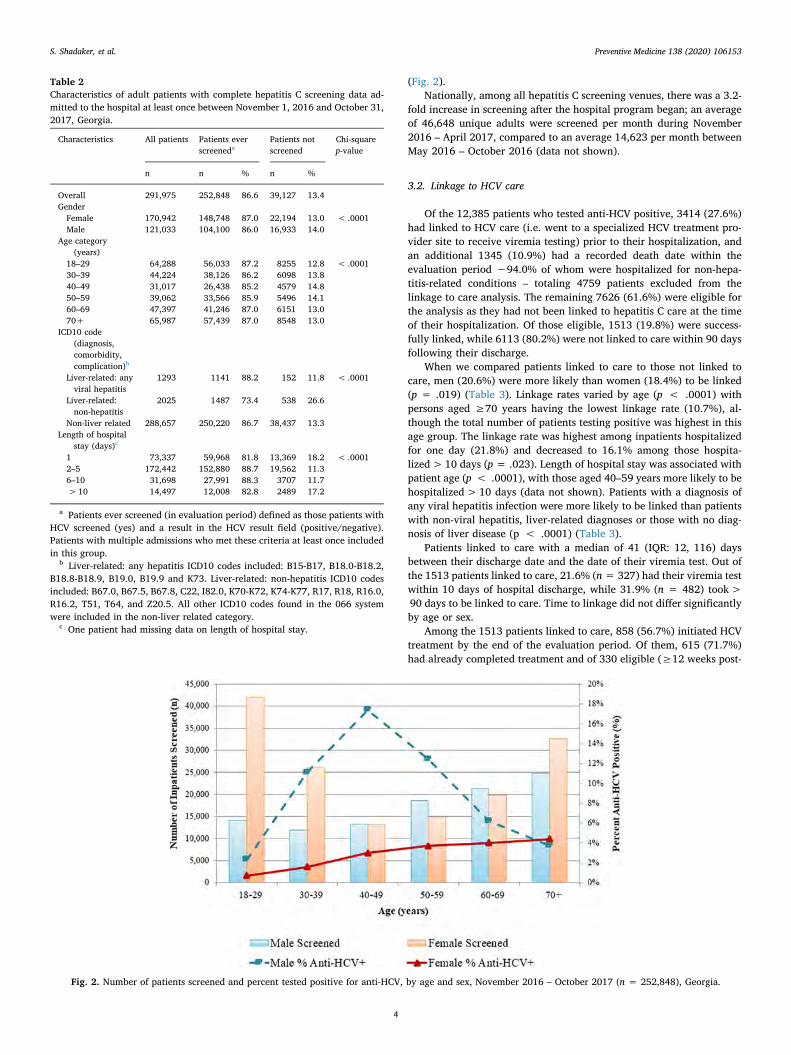
(Fig. 2).Nationally, among all hepatitis C screening venues, there was a 3.2-
fold increase in screening after the hospital program began; an averageof 46,648 unique adults were screened per month during November2016 – April 2017, compared to an average 14,623 per month betweenMay 2016 – October 2016 (data not shown).
3.2. Linkage to HCV care
Of the 12,385 patients who tested anti-HCV positive, 3414 (27.6%)had linked to HCV care (i.e. went to a specialized HCV treatment pro-vider site to receive viremia testing) prior to their hospitalization, andan additional 1345 (10.9%) had a recorded death date within theevaluation period −94.0% of whom were hospitalized for non-hepa-titis-related conditions – totaling 4759 patients excluded from thelinkage to care analysis. The remaining 7626 (61.6%) were eligible forthe analysis as they had not been linked to hepatitis C care at the timeof their hospitalization. Of those eligible, 1513 (19.8%) were success-fully linked, while 6113 (80.2%) were not linked to care within 90 daysfollowing their discharge.
When we compared patients linked to care to those not linked tocare, men (20.6%) were more likely than women (18.4%) to be linked(p = .019) (Table 3). Linkage rates varied by age (p < .0001) withpersons aged ≥70 years having the lowest linkage rate (10.7%), al-though the total number of patients testing positive was highest in thisage group. The linkage rate was highest among inpatients hospitalizedfor one day (21.8%) and decreased to 16.1% among those hospita-lized> 10 days (p = .023). Length of hospital stay was associated withpatient age (p < .0001), with those aged 40–59 years more likely to behospitalized> 10 days (data not shown). Patients with a diagnosis ofany viral hepatitis infection were more likely to be linked than patientswith non-viral hepatitis, liver-related diagnoses or those with no diag-nosis of liver disease (p < .0001) (Table 3).
Patients linked to care with a median of 41 (IQR: 12, 116) daysbetween their discharge date and the date of their viremia test. Out ofthe 1513 patients linked to care, 21.6% (n= 327) had their viremia testwithin 10 days of hospital discharge, while 31.9% (n = 482) took>90 days to be linked to care. Time to linkage did not differ significantlyby age or sex.
Among the 1513 patients linked to care, 858 (56.7%) initiated HCVtreatment by the end of the evaluation period. Of them, 615 (71.7%)had already completed treatment and of 330 eligible (≥12 weeks post-
Table 2Characteristics of adult patients with complete hepatitis C screening data ad-mitted to the hospital at least once between November 1, 2016 and October 31,2017, Georgia.
Characteristics All patients Patients everscreeneda
Patients notscreened
Chi-squarep-value
n n % n %
Overall 291,975 252,848 86.6 39,127 13.4GenderFemale 170,942 148,748 87.0 22,194 13.0 < .0001Male 121,033 104,100 86.0 16,933 14.0
Age category(years)
18–29 64,288 56,033 87.2 8255 12.8 < .000130–39 44,224 38,126 86.2 6098 13.840–49 31,017 26,438 85.2 4579 14.850–59 39,062 33,566 85.9 5496 14.160–69 47,397 41,246 87.0 6151 13.070+ 65,987 57,439 87.0 8548 13.0
ICD10 code(diagnosis,comorbidity,complication)b
Liver-related: anyviral hepatitis
1293 1141 88.2 152 11.8 < .0001
Liver-related:non-hepatitis
2025 1487 73.4 538 26.6
Non-liver related 288,657 250,220 86.7 38,437 13.3Length of hospital
stay (days)c
1 73,337 59,968 81.8 13,369 18.2 < .00012–5 172,442 152,880 88.7 19,562 11.36–10 31,698 27,991 88.3 3707 11.7>10 14,497 12,008 82.8 2489 17.2
a Patients ever screened (in evaluation period) defined as those patients withHCV screened (yes) and a result in the HCV result field (positive/negative).Patients with multiple admissions who met these criteria at least once includedin this group.
b Liver-related: any hepatitis ICD10 codes included: B15-B17, B18.0-B18.2,B18.8-B18.9, B19.0, B19.9 and K73. Liver-related: non-hepatitis ICD10 codesincluded: B67.0, B67.5, B67.8, C22, I82.0, K70-K72, K74-K77, R17, R18, R16.0,R16.2, T51, T64, and Z20.5. All other ICD10 codes found in the 066 systemwere included in the non-liver related category.
c One patient had missing data on length of hospital stay.
Fig. 2. Number of patients screened and percent tested positive for anti-HCV, by age and sex, November 2016 – October 2017 (n = 252,848), Georgia.
S. Shadaker, et al. Preventive Medicine 138 (2020) 106153
4
treatment completion) and tested for SVR, 326 (98.8%) achieved cure.
4. Discussion
To accelerate identification of HCV infected persons in the country,on November 1, 2016, Georgia launched a program to screen for he-patitis C every patient admitted to any hospital in the country. Byanalyzing records of nearly 300,000 inpatients, our evaluation reflectsgreat progress made over the first year of the program, and highlightsareas in need of improvement. Over a quarter million adult patientswere screened for hepatitis C throughout the year, representing nearly90% of adult inpatients, and monthly national screening rates tripled inthe first 6 months of the hospital screening program. Overall, 4.9% ofpatients screened positive, and 19.8% of eligible anti-HCV positivepatients were linked to care. We identified factors associated withlinkage to care, which could guide efforts to improve this objective andhelp Georgia reach its hepatitis C elimination goals.
The proportion of inpatients screened increased as the programprogressed, which could be explained by increased access to necessarytesting materials at hospitals, and/or increased awareness of the gov-ernmental mandate among hospital personnel over time – hospitalscould be fined for non-compliance, and automated reminders were builtinto HMIS to remind personnel to screen patients and document results.Previous studies have identified management guidelines and financialresources (Estevez et al., 2016) as well as physician noncompliance anddata errors (Patil et al., 2016) to be barriers to hepatitis C screeningamong healthcare professionals. Therefore, training and acclimation tonew procedures among hospital personnel may have increased over thefirst year of the screening initiative. We found significant differences inscreening rates by age and sex; males were less likely to have beenscreened than females, and the age group least likely to be screened waspatients aged 40–49. This is counterproductive to elimination goals, asthese two groups had the highest prevalence of anti-HCV positivity
among those screened. Targeted screening could be considered to en-sure those most at risk of hepatitis C are screened routinely. Screeningmen aged 30–59 instead of general screening may increase efficiency,as 13.6% of men aged 30–59 were anti-HCV positive, compared to only2.5% of females in the same age group.
The proportion of patients screening anti-HCV positive decreasedover time. The cause of this is unknown but could be a reflection of thesuccesses of the national HCV treatment program (Gvinjilia et al., 2016;Nasrullah et al., 2017a), which had identified>45,000 andtreated> 40,000 chronically infected Georgians by the end of ourevaluation period (Georgia Ministry of Health, Labour and SocialAffairs, 2019). Those aware of their status, if hospitalized, may havedeclined re-testing thereby reducing anti-HCV positivity among thosescreened. It's also possible that some providers were still practicingmore thorough screening among high-risk patients early in the pro-gram, despite the mandate to offer screening to all. Of those whoscreened positive, 27.6% had received a viremia test prior to theirhospital visit, indicating that added scrutiny to prevent redundantscreenings could save valuable resources. Many states in the UnitedStates require all hospitalized baby boomers (born between 1945 and1965) to be screened for hepatitis C, and one study in New York statefound 63.7% of detected anti-HCV patients had already been diagnosedor treated prior to their admission, more than double our findings(Hung et al., 2016). Furthermore,> 23,000 inpatients were screenedmultiple times within the same hospital during our evaluation period,indicating that mandatory screening could lead to over-testing. Linkageof the HMIS to the national screening registry and ELIMINATION-Ctreatment database would allow for real-time determination of a pa-tient's screening and hepatitis C treatment history. This could facilitatea “flagging” system to help eliminate unnecessary screening of patientsalready aware of their status.
While identification of anti-HCV positive patients is essential for thesuccess of the hepatitis C elimination program, referral of anti-HCV
Table 3Characteristics of adult patients who screened anti-HCV positive while admitted to the hospital between November 1, 2016 and October 31, 2017 and linked to care,Georgia.
Characteristic Anti-HCV positivea Linked to careb Not linked to care Chi-squarep-value
n n % n %
Overall 7626 1513 19.8 6113 80.2GenderFemale 2754 507 18.4 2247 81.6 .019Male 4872 1006 20.6 3866 79.4
Age category (years)18–29 495 80 16.2 415 83.8 < .000130–39 1134 237 20.9 897 79.140–49 1526 354 23.2 1172 76.850–59 1605 383 23.9 1222 76.160–69 1327 295 22.2 1032 77.870+ 1539 164 10.7 1375 89.3
Length of hospital stay (days)1 1369 298 21.8 1071 78.2 .0232–5 4316 859 19.9 3457 80.16–10 1215 239 19.7 976 80.3>10 726 117 16.1 609 83.9
ICD 10 code (diagnosis, comorbidity, complication)c
Liver-related: any viral hepatitis 343 123 35.9 220 64.1 < .0001Liver-related: non-hepatitis 146 41 28.1 105 71.9Non-liver related 7137 1349 18.9 5788 81.1
a Anti-HCV positive patients defined as a patient with screening field “yes” and HCV result field “positive.” Patients with multiple admissions who met thesecriteria are included in this group. Here n = 8971, which is the sum of patients linked to care and not linked to care. From the original 12,385 anti-HCV positivepatients, 3412 were excluded from the linkage to care data/analysis due to entry in ELIM-C treatment database prior to hospitalization and screening date and anadditional 1345 were excluded for having died in the analysis period (see inclusion/exclusion flow diagram).
b Linked to care patients defined as any anti-HCV positive patient (previously defined) who subsequently received documented HCV RNA or core-antigen testing atone of the diagnostic testing provider sites after date of hospital discharge but before January 31, 2018.
c Liver-related: any viral hepatitis ICD10 codes included: B15-B17, B18.0-B18.2, B18.8-B18.9, B19.0, B19.9, and K73. Liver-related: non-hepatitis ICD10 codesincluded: B67.0, B67.5, B67.8, C22, I82.0, K70-K72, K74-K77, R17, R18, R16.0, R16.2, T51, T64, and Z20.5. All other ICD10 codes in the 066 system were includedin the non-liver related category.
S. Shadaker, et al. Preventive Medicine 138 (2020) 106153
5
positive patients for further evaluation and provision of comprehensivetreatment services is equally important. At the time of this evaluation,after a patient screened anti-HCV positive, he/she needed to in-dependently seek HCV viremia testing, and subsequent evaluation andtreatment at a specialized hepatitis C treatment site. Whereas screeningis conducted at a wide range of facilities throughout Georgia, access tohepatitis C evaluation services and treatment was more limited. As ofOctober 2017, treatment was provided at 31 health facilitiesthroughout the country by 139 physician providers (Mitruka et al.,2015). Since the elimination program's inception in 2015, a substantialproportion of anti-HCV positive patients have failed to seek viremiatesting or further evaluation/treatment (Mitruka et al., 2015). Evalua-tion of the hospital screening program suggests a similar challenge: only19.8% of patients eligible for linkage to care analysis sought follow-uptesting after their hospital discharge. Thus, over four-fifths of the anti-HCV positive patients identified by the hospital program were notlinked to care. At the time of this evaluation, there was no systematicmethod for counseling patients or informing them where to go forfurther care, but was instead at the hospitals' discretion, and based ontheir varying resources and capabilities. Standardized methods forscreening and linking patients to care could be considered. Interven-tions in which hospital personnel assist in coordinating HCV-infectedpatients' next steps can significantly improve linkage to care (Deminget al., 2018). Another potential barrier is financial; although screeningand treatment are free of charge, the cost of diagnostics, includingviremia testing, determination of genotype and degree of liver fibrosis,as well as other testing during treatment, were the responsibility of thepatient (Gvinjilia et al., 2016; Nasrullah et al., 2017a). These costscould be significant for persons of low income. In 2017, Georgians'average monthly nominal earnings were 999 Georgian lari (GEL)(National Statistics Office of Georgia (GEOSTAT), n.d.), and the cost ofpre-treatment diagnostic testing ranged from 279 to 335 GEL (Adamia,2018), or 28–34% of their monthly income. We were unable to assessfinancial barriers, though other studies in Georgia have shown costs tobe a barrier (Averhoff et al., 2019). At the time of this analysis only57% of linked-to-care patients had initiated treatment, far lower thanthe 92% reported nationally (Nasrullah et al., 2017a). This proportionis likely to increase as patients have more time to enroll in the program,but could also reflect challenges among persons with possible comorbidconditions that required their hospitalization, in addition to financialbarriers.
Linkage-to-care varied by age, with patients aged ≥70 years ob-taining viremia testing at substantially lower rates than other agegroups. Although our analysis could not assess the reasons for this, itcould be related to costs, mobility and access to treatment sites, co-morbid conditions, or other social and behavioral factors. A study ofinpatient screening among baby boomers at a medical center in theUnited States (Mehta et al., 2017), in which linkage to care was definedas scheduling a follow-up appointment after RNA confirmation, foundlinkage rates for that age group slightly less than our analysis (18% forbaby boomers vs. 22.2% in our 60–69 year age group). Length ofhospital admission also influenced linkage to care and screening; pa-tients with longer hospital stays sought HCV viremia testing and werescreened at lower rates. This could suggest that more critical conditionsrequiring longer hospital admissions may have taken priority over di-agnosing past or current HCV infection (Junius-Walker et al., 2010).This finding appears independent of age; the age group least likely to belinked to care (≥70) were less likely than those aged 40–59 year tohave an extended hospital stay.
Providing increased access to diagnostic testing and treatment is apriority in the elimination program, and a rollout of decentralization ofcare began in 2018, whereby HCV-infected individuals can seek treat-ment at selected primary care and harm reduction sites (Adamia, 2018).Several other interventions, such as lowering costs of diagnostics arebeing implemented (Adamia, 2018). This hospital screening programwas expanded by a follow-up governmental decree in May of 2018 to
ensure all emergency room patients are offered HCV screening in ad-dition to inpatients. Additionally, in March 2018, Georgia instituted apolicy in which hospitals are mandated to obtain and send serum spe-cimen of all patients who screen anti-HCV positive to the national re-ference laboratory for reflex HCV core antigen testing, free of charge topatients (Averhoff et al., 2019). This change in policy resulted in in-creased viremia testing, though rates of subsequent hepatitis C treat-ment initiation decreased among patients diagnosed viremic - the nextstep in the care continuum that the elimination program must seek tofacilitate (Averhoff et al., 2019).
Interventions to improve screening and linkage to care should de-crease barriers to the program. However, it is essential to continuallymonitor and evaluate the care continuum to identify deficiencies andbolster screening and treatment rates. Since the time of this evaluation,hospital screening data was incorporated into a national screeningregistry, creating a unified database that allows monitoring of the he-patitis C continuum of care at the individual-patient level (GeorgiaMinistry of Health, Labour and Social Affairs, 2019). This more efficientinformation system can help prevent unnecessary and repeat screen-ings, thereby reducing costs.
4.1. Study limitations
There were several limitations to this evaluation. First, erroneousdata entries and entries with missing HCV fields (2.9% of patients) inthe HMIS could have affected our findings. Second, the HMIS did notcollect information to assess reasons for the screening and linkage-to-care rates observed. The database did not report eligibility criteria (e.g.previous screening results, prior initiation of hepatitis C treatment,patient refusal), nor demographic information such as income or edu-cation level; thus, it was impossible to determine reasons for variationsin screening rates across different populations. Also, no data wasavailable regarding post-screening counseling to confirm when, how, orif the patient was informed of his/her results, if the patient was coun-seled about how to seek follow-up diagnostic testing, the importancethereof, or if any potential barriers to linkage were identified. Third,some patients may have had contraindications to hepatitis C treatment,or terminal diseases that would hinder follow-up diagnostics, leading tounderestimation of linkage-to-care rates. Finally, anti-HCV positivepatients discharged at the end of the evaluation period had only 90 daysto seek diagnostic testing, though our analysis found that nearly a thirdof patients linked to care took>90 days to do so.
5. Conclusion
Identification of HCV-infected persons, and subsequent care andtreatment is essential for the success of Georgia's hepatitis C eliminationprogram. Our evaluation reports on the first year of the country's in-itiative to screen all hospital inpatients for hepatitis C. We highlightedgreat progress that was made to identify anti-HCV positive patients, aswell as some shortfalls that can be addressed to promote screening andlinkage to care in the country and can help meet their hepatitis Celimination targets.
Supplementary data to this article can be found online at https://doi.org/10.1016/j.ypmed.2020.106153.
Funding
N/A.
Disclaimer
The findings and conclusions in this report are those of the authorsand do not necessarily represent the official position of the US Centersfor Disease Control and Prevention.
S. Shadaker, et al. Preventive Medicine 138 (2020) 106153
6
CRediT authorship contribution statement
Shaun Shadaker:Methodology, Formal analysis, Data curation,Writing - original draft, Writing - review & editing,Visualization.Muazzam Nasrullah:Methodology, Writing - originaldraft, Writing - review & editing, Visualization.Amiran
Gamkrelidze:Conceptualization, Writing - review & editing.JessicaRay:Methodology, Writing - original draft.LiaGvinjilia:Methodology, Writing - original draft, Writing - review &editing.Tinatin Kuchuloria:Methodology, Writing - original draft,Writing - review & editing.Maia Butsashvili:Writing - review &editing.Vladimer Getia:Writing - review & editing.DavidMetreveli:Writing - review & editing.Maia Tsereteli:Writing - review& editing.Tengiz Tsertsvadze:Writing - review & editing.Ruth Link-
Gelles:Conceptualization, Writing - review & editing.Alexander J.
Millman:Conceptualization, Writing - review & editing.AleksandreTurdziladze:Writing - review & editing.FranciscoAverhoff:Methodology, Writing - original draft, Writing - review &editing, Visualization.
Declaration of competing interest
The authors declare that there are no conflicts of interest.
References
Adamia, E., 2018. Decentralization and Integration of HCV Services in Primary Care,Hospitals and Harm Reduction Settings in Georgia, Presented at Decentralization ofHCV Diagnostic, Care and Treatment Services Within Georgian National Hepatitis CElimination Program Workshop, Tbilisi, Georgia, December 5.
Averhoff F, Shadaker S, Gamkrelidze A, Kuchuloria T, Gvinjilia L, Getia V, Sergeenko D,Butsashvili M, Tsertsvadze T, Sharvadze L, Zarkua J, Skaggs B, Nasrullah M. Progressand challenges in a pioneering hepatitis C elimination program in the country ofGeorgia, 2015–2018. J Hepatol. 2019; pii: S0168-8278(19)30710-X.
Deming, R., Ford, M.M., Moore, M.S., Lim, S., Perumalswami, P., Weiss, J., et al., 2018.Evaluation of a hepatitis C clinical care coordination programme’s effect on treatmentinitiation and cure: a surveillance-based propensity score matching approach. J. ViralHepat. 25, 1236–1243.
Estevez J, Kim YA, Le A, Israelski D, Baatarkhuu O, Sarantuya T, et al. Low rates ofscreening and treatment of chronic hepatitis B, C, D (HBV, HCV, HDV), and hepa-tocellular carcinoma (HCC), associated barriers, and proposed solutions: results of a
survey of physicians from all major provinces of Mongolia. Annals of Global Health.2016; 82(3): 416. DOI: https://doi.org/10.1016/j.aogh.2016.04.159.
Georgia Ministry of Health, Labour and Social Affairs, 2019. National hepatitis C viruselimination progress report Georgia, 2015–2017. Georgia Ministry of Health, Labourand Social Affairs, Tbilisi, Georgia. https://www.moh.gov.ge/uploads/files/2019/Failebi/25.04.2019-1.pdf, Accessed date: 3 March 2020.
Gvinjilia, L., Nasrullah, M., Sergeenko, D., Tsertsvadze, T., Kamkamidze, G., Butsashvili,M., et al., 2016. National progress toward hepatitis C elimination — Georgia,2015–2016. MMWR Morb. Mortal. Wkly Rep. 65 (41), 1132–1135.
Hagan, L.M., Kasradze, A., Salyer, S.J., Gamkrelidze, A., Alkhazashvili, M., Chanturia, G.,et al., 2019. Hepatitis C prevalence and risk factors in Georgia, 2015: setting abaseline for elimination. BMC Public Health 19 (Suppl. 3), 480.
Health Management Information System (HMIS) Georgia. Available at: http://www.georgia-ccm.ge/wp-content/uploads/HMIS_Module_Descriptions_ENG.pdf. Accessedon February 20, 2019.
Hung, C.K., Demabildo, M., Bernstein, D., Lee, T.P., 2016. Inpatient hepatitis C screeningat teaching medical centers: an opportunity for improvement. Gastroenterology 150,S1062.
Junius-Walker, U., Voigt, I., Wrede, J., Hummers-Pradier, E., Lazic, D., Dierks, M.L.,2010. Health and treatment priorities in patients with multimorbidity: report on aworkshop from the European General Practice Network meeting ‘Research on mul-timorbidity in general practice’. Eur. J. Gen. Pract. 16, 51–54. https://doi.org/10.3109/13814780903580307.
Mehta, A., Down, C., Shen, N.T., Kumar, S., 2017. Inpatient hepatitis C screening, healthdisparities, and inadequate linkage to outpatient care at a large academic medicalcenter. Gastroenterology 152 (5), S1190.
Mitruka, K., Tsertsvadze, T., Butsashvili, M., Gamkrelidze, G.A., Sabelashvili, P., Adamia,E., et al., 2015. Launch of a nationwide hepatitis C elimination program – Georgia,April 2015. MMWR Morb. Mortal. Wkly Rep. 64 (28), 753–757.
Nasrullah, M., Sergeenko, D., Gvinjilia, L., Gamkrelidze, A., Tsertsvadze, T., Butsashvili,M., et al., 2017a. The role of screening and treatment in national progress towardhepatitis C elimination in Georgia, 2015-2016. MMWR Morb. Mortal. Wkly Rep. 66,773–776.
Nasrullah, M., Sergeenko, D., Gamkrelidze, A., Averhoff, F., 2017b. HCV elimination –lessons learned from a small Eurasian country, Georgia. Nat Rev GastroenterolHepatol. 14 (8), 447–448.
National Statistics Office of Georgia (GEOSTAT). Retrieved from: http://www.geostat.ge/index.php?action=page&p_id=149&lang=eng. Accessed on April 19, 2019.
Patil, R., Ona, M.A., Saikali, P., Papafragkakis, C., Anand, S., 2016. 744a hepatitis Cscreening barriers in 2016: unusual suspects. Gastroenterology 150 (4), S152.
Strategic Plan for the Elimination of Hepatitis C Virus in Georgia, 2016–2020. Georgia'sMinistry of Labour, Health, and Social Affairs (MoLHSA), Tbilisi Available at:https://www.moh.gov.ge/uploads/files/2017/akordeoni/failebi/Georgia_HCV_Elimination_Strategy_2016-2020.pdf, Accessed date: 20 February 2019.
The World Bank. The World Bank in Georgia. 2017. Retrieved from: https://www.worldbank.org/en/country/georgia. Accessed on February 19, 2019.
World Health Organization, 2017. Global Hepatitis Report 2017. Retrieved from: https://www.who.int/hepatitis/publications/global-hepatitis-report2017/en/, Accesseddate: 19 February 2019.
S. Shadaker, et al. Preventive Medicine 138 (2020) 106153
7
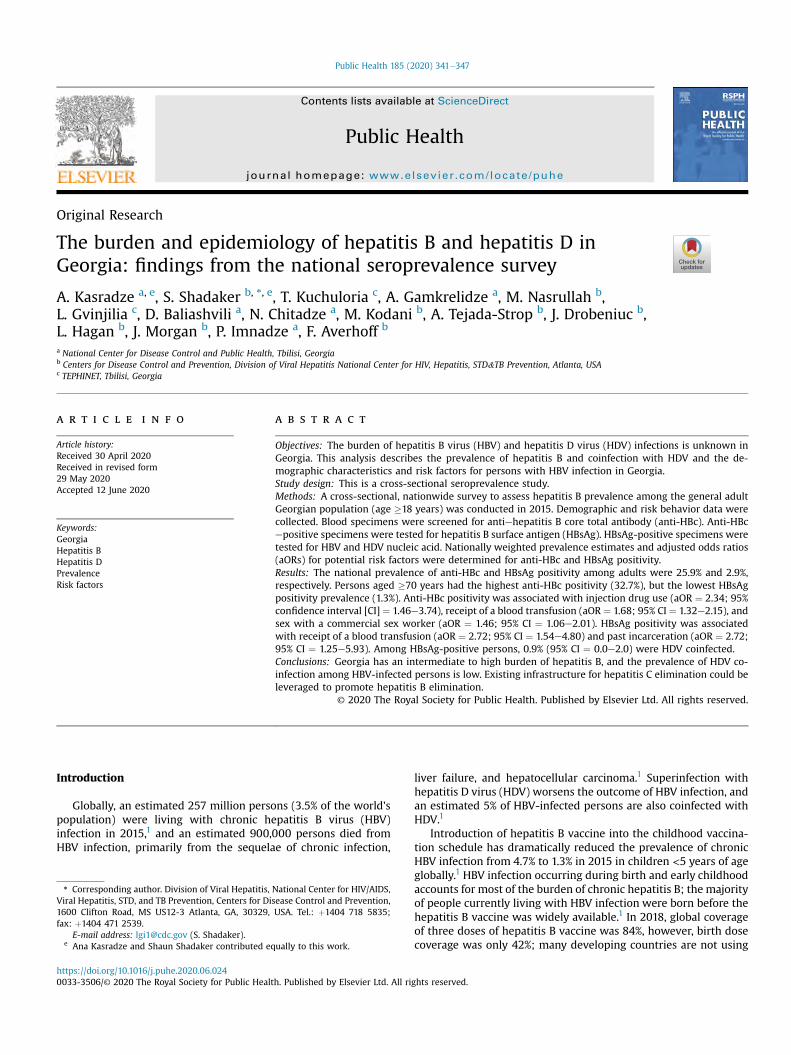
Original Research
The burden and epidemiology of hepatitis B and hepatitis D inGeorgia: findings from the national seroprevalence survey
A. Kasradze a, e, S. Shadaker b, *, e, T. Kuchuloria c, A. Gamkrelidze a, M. Nasrullah b,L. Gvinjilia c, D. Baliashvili a, N. Chitadze a, M. Kodani b, A. Tejada-Strop b, J. Drobeniuc b,L. Hagan b, J. Morgan b, P. Imnadze a, F. Averhoff b
a National Center for Disease Control and Public Health, Tbilisi, Georgiab Centers for Disease Control and Prevention, Division of Viral Hepatitis National Center for HIV, Hepatitis, STD&TB Prevention, Atlanta, USAc TEPHINET, Tbilisi, Georgia
a r t i c l e i n f o
Article history:Received 30 April 2020Received in revised form29 May 2020Accepted 12 June 2020
Keywords:GeorgiaHepatitis BHepatitis DPrevalenceRisk factors
a b s t r a c t
Objectives: The burden of hepatitis B virus (HBV) and hepatitis D virus (HDV) infections is unknown inGeorgia. This analysis describes the prevalence of hepatitis B and coinfection with HDV and the de-mographic characteristics and risk factors for persons with HBV infection in Georgia.Study design: This is a cross-sectional seroprevalence study.Methods: A cross-sectional, nationwide survey to assess hepatitis B prevalence among the general adultGeorgian population (age �18 years) was conducted in 2015. Demographic and risk behavior data werecollected. Blood specimens were screened for antiehepatitis B core total antibody (anti-HBc). Anti-HBcepositive specimens were tested for hepatitis B surface antigen (HBsAg). HBsAg-positive specimens weretested for HBV and HDV nucleic acid. Nationally weighted prevalence estimates and adjusted odds ratios(aORs) for potential risk factors were determined for anti-HBc and HBsAg positivity.Results: The national prevalence of anti-HBc and HBsAg positivity among adults were 25.9% and 2.9%,respectively. Persons aged �70 years had the highest anti-HBc positivity (32.7%), but the lowest HBsAgpositivity prevalence (1.3%). Anti-HBc positivity was associated with injection drug use (aOR ¼ 2.34; 95%confidence interval [CI] ¼ 1.46e3.74), receipt of a blood transfusion (aOR ¼ 1.68; 95% CI ¼ 1.32e2.15), andsex with a commercial sex worker (aOR ¼ 1.46; 95% CI ¼ 1.06e2.01). HBsAg positivity was associatedwith receipt of a blood transfusion (aOR ¼ 2.72; 95% CI ¼ 1.54e4.80) and past incarceration (aOR ¼ 2.72;95% CI ¼ 1.25e5.93). Among HBsAg-positive persons, 0.9% (95% CI ¼ 0.0e2.0) were HDV coinfected.Conclusions: Georgia has an intermediate to high burden of hepatitis B, and the prevalence of HDV co-infection among HBV-infected persons is low. Existing infrastructure for hepatitis C elimination could beleveraged to promote hepatitis B elimination.
© 2020 The Royal Society for Public Health. Published by Elsevier Ltd. All rights reserved.
Introduction
Globally, an estimated 257 million persons (3.5% of the world'spopulation) were living with chronic hepatitis B virus (HBV)infection in 2015,1 and an estimated 900,000 persons died fromHBV infection, primarily from the sequelae of chronic infection,
liver failure, and hepatocellular carcinoma.1 Superinfection withhepatitis D virus (HDV) worsens the outcome of HBV infection, andan estimated 5% of HBV-infected persons are also coinfected withHDV.1
Introduction of hepatitis B vaccine into the childhood vaccina-tion schedule has dramatically reduced the prevalence of chronicHBV infection from 4.7% to 1.3% in 2015 in children <5 years of ageglobally.1 HBV infection occurring during birth and early childhoodaccounts for most of the burden of chronic hepatitis B; the majorityof people currently living with HBV infection were born before thehepatitis B vaccine was widely available.1 In 2018, global coverageof three doses of hepatitis B vaccine was 84%, however, birth dosecoverage was only 42%; many developing countries are not using
* Corresponding author. Division of Viral Hepatitis, National Center for HIV/AIDS,Viral Hepatitis, STD, and TB Prevention, Centers for Disease Control and Prevention,1600 Clifton Road, MS US12-3 Atlanta, GA, 30329, USA. Tel.: þ1404 718 5835;fax: þ1404 471 2539.
E-mail address: [email protected] (S. Shadaker).e Ana Kasradze and Shaun Shadaker contributed equally to this work.
Contents lists available at ScienceDirect
Public Health
journal homepage: www.elsevier .com/locate/puhe
https://doi.org/10.1016/j.puhe.2020.06.0240033-3506/© 2020 The Royal Society for Public Health. Published by Elsevier Ltd. All rights reserved.
Public Health 185 (2020) 341e347
the birth dose of hepatitis B vaccine as part of their nationalstrategy.2 In 2016, the World Health Assembly endorsed viralhepatitis elimination goals, defined as a reduction of 90% in inci-dence and 65% in mortality worldwide of both hepatitis B andhepatitis C by 2030.1,3
Georgia, a lower-middle-income country with a population of3.7 million situated at the crossroads of Europe and Asia, imple-mented a national program in 2015 to eliminate hepatitis C by2020.4e6 To inform this effort, the country conducted a nationalseroprevalence survey in 2015 to estimate the burden of hepatitis Cvirus (HCV) infection, but also included testing for HBVinfection.7e9 The hepatitis B vaccine has been included in Georgia'snational immunization schedule since 2002, and the birth dose hasbeen included since 2003. Coverage for routine vaccination hasbeen >90% for most years during 2005e2018.10 This article de-scribes the national prevalence of HBV infection and associated riskfactors, as well as coinfection with HDV, in Georgia's adult popu-lation born before 1998.
Methods
Study population
A cross-sectional, nationwide survey for hepatitis B and hepa-titis C prevalence among the general population aged �18 yearswas conducted in Georgia in 2015 using a stratified, multistagecluster design with random sampling.9 A sample size of 7000 wasbased on an estimated hepatitis C prevalence of 6.7%, a design effectof 2, and a 70% anticipated response rate.9 After obtaining informedconsent from the study participants, interviewers collected de-mographic information, medical and behavioral history, informa-tion about potential risk factors and exposures, knowledge aboutHBV infection, and vaccination information. A blood sample wascollected from the study participants. Trained interviewers verballyadministered the survey in the language of the participant (eitherGeorgian, Armenian, Russian, or Azerbaijani). Data were enteredinto handheld electronic devices in real time and uploaded to asecure database. The details of sampling methods, specimen anddata collection details, and hepatitis C testing and statisticalmethods are described in the study by Hagan et al.9
Laboratory methods
Blood specimens were centrifuged, and serum was separated,aliquoted, and stored at �20 �C. Weekly, the specimens wereshipped on dry ice to the Lugar Center, Georgia's national referencelaboratory, where they were stored at �70 �C until tested. Thespecimens were screened for antiehepatitis B core total antibody(anti-HBc) by enzyme immunoassay (anti-HBc Ab, EIA IVD; Dia.Pro.Diagnostic Bioprobes Srl., Italy).11 Anti-HBcepositive specimenswere tested for hepatitis B surface antigen (HBsAg) (EIA IVD; Dia.-Pro. Diagnostic Bioprobes Srl., Italy).12 To confirm the presence ofHBsAg, all HBsAg-positive samples were tested with the HBsAgconfirmation neutralization assay (EIA IVD; Dia.Pro. DiagnosticBioprobes Srl., Italy).13 The Diagnostic Reference Team of the Divi-sion of Viral Hepatitis Laboratory Branch at the US Centers forDisease Control and Prevention (CDC) retested all anti-HBcepos-itive specimens and a comparable-size subset of negative speci-mens using the highly sensitive, Food and DrugAdministrationelicensed VITROS Immunodiagnostic System(aHBc and HBsAg, IVD; Ortho Clinical Diagnostics, Raritan, NJ,USA).14,15 Specimens that tested positive for HBsAg were tested atthe CDC using nucleic acid tests (NATs) for HBV DNA and for HDVRNA. NAT-positive samples were sequenced and genotyped usingpreviously established procedures.16 HBsAg-positive samples with
undetectable HBV DNA using a laboratory developed test (LDT)with a lower limit of detection (LOD) of 500 IU/mL were furthertested by ion vapor deposition (IVD) assay with a LOD <20 IU/mL.
Definitions
Persons testing negative for anti-HBc were classified as ‘neverinfected with HBV,’ those testing positive for anti-HBc wereconsidered ‘ever infected with HBV.’ Persons positive for both anti-HBc and HBsAg were classified as ‘currently infected.’ Patients withincomplete or missing anti-HBc results were excluded from theanalysis.
Statistical analyses
All data were weighted at cluster, household, and individuallevels using 2014 Georgia census data to account for selectionprobability, non-response, and sampling differences between re-gions to produce nationally representative estimates. We estimatedthe national prevalence of anti-HBc and HBsAg positivity as well ascoinfections with HCV (both antibody to HCV [anti-HCV] and HCVRNA) and HDV. The results are presented as weighted percentageswith 95% confidence intervals (CIs). Statistically significant bivar-iate associations between anti-HBc/HBsAg positivity and de-mographic and other risk factors were determined using chi-squared tests. All factors found to be statistically significant(P < 0.05) were included in a multivariable logistic regressionmodel. Statistical analysis was conducted using SAS version 9.4(Cary, North Carolina, USA).
Results
Of the 7000 persons selected to participate in the study, 6296(89.9%) gave consent and completed the questionnaire, and 6014(85.9%) completed both the questionnaire and provided a bloodspecimen. Seven of these respondents were excluded for havingmissing or inconclusive hepatitis B test results; the final samplecomprised valid anti-HBc and HBsAg results from 6007 adults.Demographic and exposure history for the overall sample of studyparticipants is described in the study by Hagan et al.9 In the sample,total anti-HBc positivity was detected in 1634 specimens, of which188 tested positive for HBsAg. Overall, the weighted prevalence ofanti-HBc positivity among adults was 25.9% (95% CI ¼ 24.2e27.6),and the prevalence of HBsAg positivity was 2.9% (95% CI¼ 2.4e3.5),corresponding to an estimated 80,000 adults living with chronicHBV infection in Georgia. Of 174 HBsAg-positive specimens testedfor HBV DNA using the LDT, 97 (55.7%) were positive and 77 hadundetectable HBV DNA levels. Of those 77 samples, 40 samples hadsufficient volume for an IVD assay test, with 28 (70.0%) testingpositive. Thus, of 137 HBsAg-positive specimens that were tested byboth HBV DNA assays, 125 (91.2%) tested positive for HBV DNA. Ofthose, 77 were successfully genotyped; HBV genotype A wasidentified in 28 (36.4%) specimens, and genotype D was identifiedin 49 (63.6%) specimens.
Anti-HBc positivity prevalence and risk factors
Anti-HBc positivity prevalence differed significantly by age, withthe lowest prevalence among persons aged 18e29 years (11.9%; 95%CI ¼ 9.2e14.5) and highest among those aged �70 years (32.7%;95% CI¼ 28.4e36.9) (P < 0.0001), but did not differ by sex (Table 1).Anti-HBc positivity prevalence differed by geographic region,ranging from a low of 18.8% (95% CI ¼ 12.4e25.2) to a high of 33.0%(95% CI ¼ 29.2e36.9; P < 0.001) (Fig. 1).
A. Kasradze et al. / Public Health 185 (2020) 341e347342
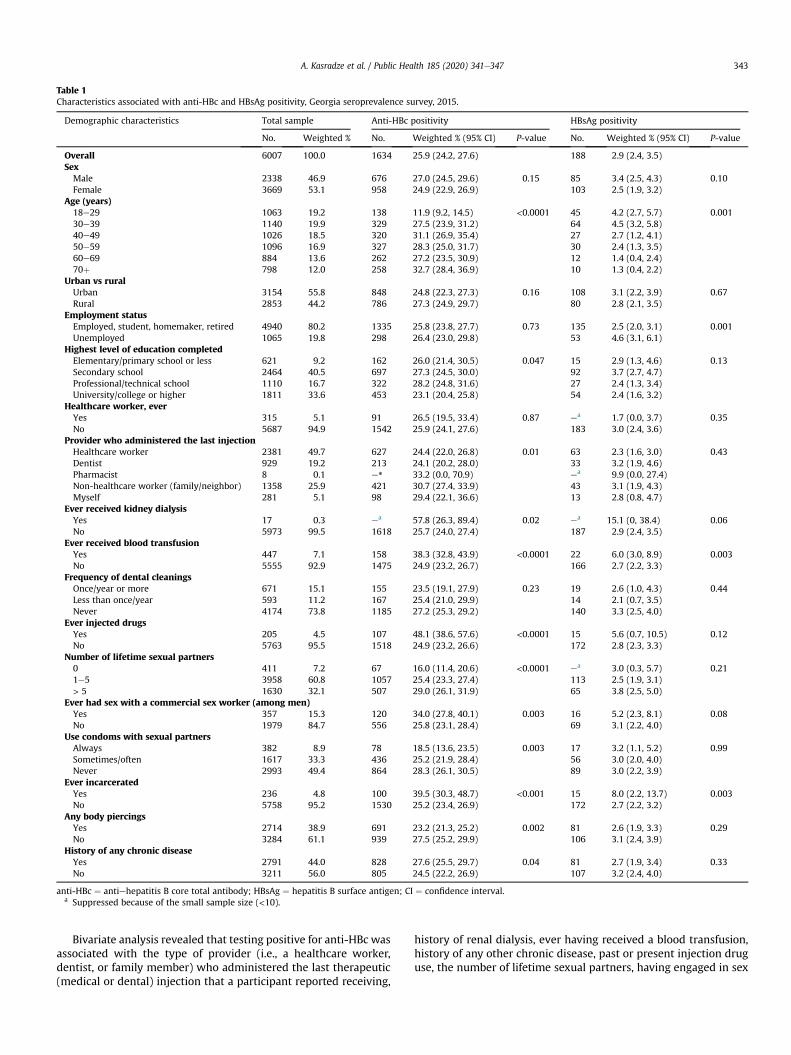
Bivariate analysis revealed that testing positive for anti-HBc wasassociated with the type of provider (i.e., a healthcare worker,dentist, or family member) who administered the last therapeutic(medical or dental) injection that a participant reported receiving,
history of renal dialysis, ever having received a blood transfusion,history of any other chronic disease, past or present injection druguse, the number of lifetime sexual partners, having engaged in sex
Table 1Characteristics associated with anti-HBc and HBsAg positivity, Georgia seroprevalence survey, 2015.
Demographic characteristics Total sample Anti-HBc positivity HBsAg positivity
No. Weighted % No. Weighted % (95% CI) P-value No. Weighted % (95% CI) P-value
Overall 6007 100.0 1634 25.9 (24.2, 27.6) 188 2.9 (2.4, 3.5)SexMale 2338 46.9 676 27.0 (24.5, 29.6) 0.15 85 3.4 (2.5, 4.3) 0.10Female 3669 53.1 958 24.9 (22.9, 26.9) 103 2.5 (1.9, 3.2)
Age (years)18e29 1063 19.2 138 11.9 (9.2, 14.5) <0.0001 45 4.2 (2.7, 5.7) 0.00130e39 1140 19.9 329 27.5 (23.9, 31.2) 64 4.5 (3.2, 5.8)40e49 1026 18.5 320 31.1 (26.9, 35.4) 27 2.7 (1.2, 4.1)50e59 1096 16.9 327 28.3 (25.0, 31.7) 30 2.4 (1.3, 3.5)60e69 884 13.6 262 27.2 (23.5, 30.9) 12 1.4 (0.4, 2.4)70þ 798 12.0 258 32.7 (28.4, 36.9) 10 1.3 (0.4, 2.2)
Urban vs ruralUrban 3154 55.8 848 24.8 (22.3, 27.3) 0.16 108 3.1 (2.2, 3.9) 0.67Rural 2853 44.2 786 27.3 (24.9, 29.7) 80 2.8 (2.1, 3.5)
Employment statusEmployed, student, homemaker, retired 4940 80.2 1335 25.8 (23.8, 27.7) 0.73 135 2.5 (2.0, 3.1) 0.001Unemployed 1065 19.8 298 26.4 (23.0, 29.8) 53 4.6 (3.1, 6.1)
Highest level of education completedElementary/primary school or less 621 9.2 162 26.0 (21.4, 30.5) 0.047 15 2.9 (1.3, 4.6) 0.13Secondary school 2464 40.5 697 27.3 (24.5, 30.0) 92 3.7 (2.7, 4.7)Professional/technical school 1110 16.7 322 28.2 (24.8, 31.6) 27 2.4 (1.3, 3.4)University/college or higher 1811 33.6 453 23.1 (20.4, 25.8) 54 2.4 (1.6, 3.2)
Healthcare worker, everYes 315 5.1 91 26.5 (19.5, 33.4) 0.87 ea 1.7 (0.0, 3.7) 0.35No 5687 94.9 1542 25.9 (24.1, 27.6) 183 3.0 (2.4, 3.6)
Provider who administered the last injectionHealthcare worker 2381 49.7 627 24.4 (22.0, 26.8) 0.01 63 2.3 (1.6, 3.0) 0.43Dentist 929 19.2 213 24.1 (20.2, 28.0) 33 3.2 (1.9, 4.6)Pharmacist 8 0.1 e* 33.2 (0.0, 70.9) ea 9.9 (0.0, 27.4)Non-healthcare worker (family/neighbor) 1358 25.9 421 30.7 (27.4, 33.9) 43 3.1 (1.9, 4.3)Myself 281 5.1 98 29.4 (22.1, 36.6) 13 2.8 (0.8, 4.7)
Ever received kidney dialysisYes 17 0.3 ea 57.8 (26.3, 89.4) 0.02 ea 15.1 (0, 38.4) 0.06No 5973 99.5 1618 25.7 (24.0, 27.4) 187 2.9 (2.4, 3.5)
Ever received blood transfusionYes 447 7.1 158 38.3 (32.8, 43.9) <0.0001 22 6.0 (3.0, 8.9) 0.003No 5555 92.9 1475 24.9 (23.2, 26.7) 166 2.7 (2.2, 3.3)
Frequency of dental cleaningsOnce/year or more 671 15.1 155 23.5 (19.1, 27.9) 0.23 19 2.6 (1.0, 4.3) 0.44Less than once/year 593 11.2 167 25.4 (21.0, 29.9) 14 2.1 (0.7, 3.5)Never 4174 73.8 1185 27.2 (25.3, 29.2) 140 3.3 (2.5, 4.0)
Ever injected drugsYes 205 4.5 107 48.1 (38.6, 57.6) <0.0001 15 5.6 (0.7, 10.5) 0.12No 5763 95.5 1518 24.9 (23.2, 26.6) 172 2.8 (2.3, 3.3)
Number of lifetime sexual partners0 411 7.2 67 16.0 (11.4, 20.6) <0.0001 ea 3.0 (0.3, 5.7) 0.211e5 3958 60.8 1057 25.4 (23.3, 27.4) 113 2.5 (1.9, 3.1)> 5 1630 32.1 507 29.0 (26.1, 31.9) 65 3.8 (2.5, 5.0)
Ever had sex with a commercial sex worker (among men)Yes 357 15.3 120 34.0 (27.8, 40.1) 0.003 16 5.2 (2.3, 8.1) 0.08No 1979 84.7 556 25.8 (23.1, 28.4) 69 3.1 (2.2, 4.0)
Use condoms with sexual partnersAlways 382 8.9 78 18.5 (13.6, 23.5) 0.003 17 3.2 (1.1, 5.2) 0.99Sometimes/often 1617 33.3 436 25.2 (21.9, 28.4) 56 3.0 (2.0, 4.0)Never 2993 49.4 864 28.3 (26.1, 30.5) 89 3.0 (2.2, 3.9)
Ever incarceratedYes 236 4.8 100 39.5 (30.3, 48.7) <0.001 15 8.0 (2.2, 13.7) 0.003No 5758 95.2 1530 25.2 (23.4, 26.9) 172 2.7 (2.2, 3.2)
Any body piercingsYes 2714 38.9 691 23.2 (21.3, 25.2) 0.002 81 2.6 (1.9, 3.3) 0.29No 3284 61.1 939 27.5 (25.2, 29.9) 106 3.1 (2.4, 3.9)
History of any chronic diseaseYes 2791 44.0 828 27.6 (25.5, 29.7) 0.04 81 2.7 (1.9, 3.4) 0.33No 3211 56.0 805 24.5 (22.2, 26.9) 107 3.2 (2.4, 4.0)
anti-HBc ¼ antiehepatitis B core total antibody; HBsAg ¼ hepatitis B surface antigen; CI ¼ confidence interval.a Suppressed because of the small sample size (<10).
A. Kasradze et al. / Public Health 185 (2020) 341e347 343
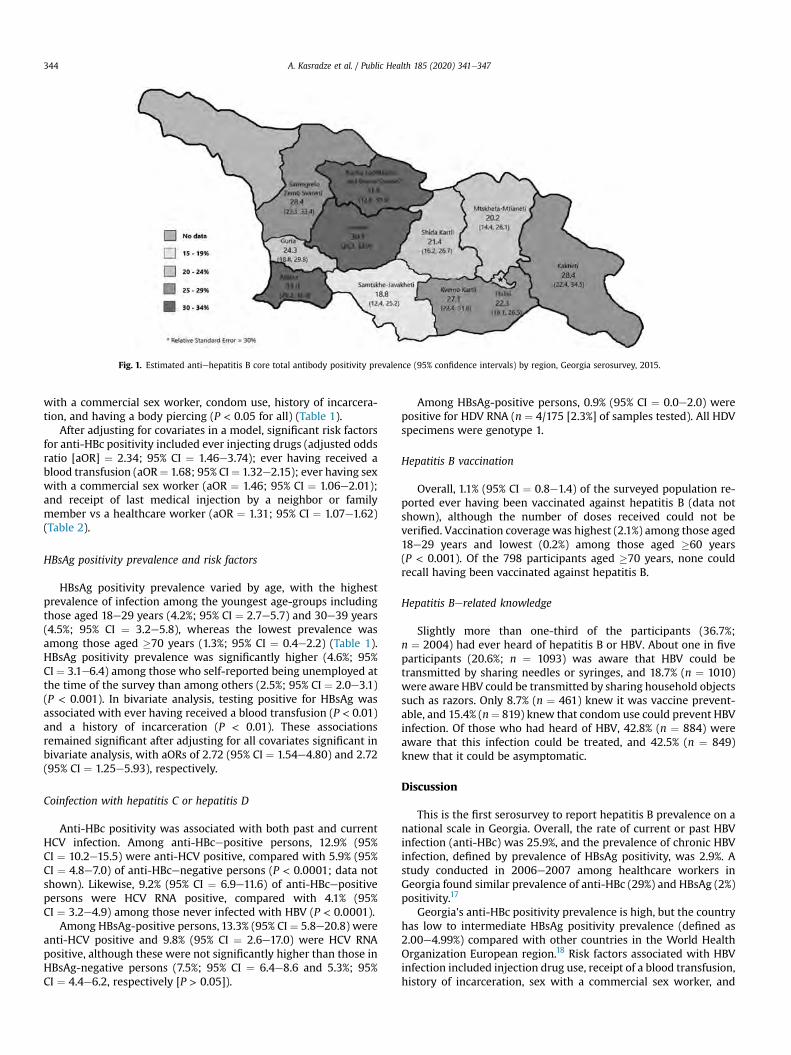
with a commercial sex worker, condom use, history of incarcera-tion, and having a body piercing (P < 0.05 for all) (Table 1).
After adjusting for covariates in a model, significant risk factorsfor anti-HBc positivity included ever injecting drugs (adjusted oddsratio [aOR] ¼ 2.34; 95% CI ¼ 1.46e3.74); ever having received ablood transfusion (aOR¼ 1.68; 95% CI¼ 1.32e2.15); ever having sexwith a commercial sex worker (aOR ¼ 1.46; 95% CI ¼ 1.06e2.01);and receipt of last medical injection by a neighbor or familymember vs a healthcare worker (aOR ¼ 1.31; 95% CI ¼ 1.07e1.62)(Table 2).
HBsAg positivity prevalence and risk factors
HBsAg positivity prevalence varied by age, with the highestprevalence of infection among the youngest age-groups includingthose aged 18e29 years (4.2%; 95% CI ¼ 2.7e5.7) and 30e39 years(4.5%; 95% CI ¼ 3.2e5.8), whereas the lowest prevalence wasamong those aged �70 years (1.3%; 95% CI ¼ 0.4e2.2) (Table 1).HBsAg positivity prevalence was significantly higher (4.6%; 95%CI ¼ 3.1e6.4) among those who self-reported being unemployed atthe time of the survey than among others (2.5%; 95% CI ¼ 2.0e3.1)(P < 0.001). In bivariate analysis, testing positive for HBsAg wasassociated with ever having received a blood transfusion (P < 0.01)and a history of incarceration (P < 0.01). These associationsremained significant after adjusting for all covariates significant inbivariate analysis, with aORs of 2.72 (95% CI ¼ 1.54e4.80) and 2.72(95% CI ¼ 1.25e5.93), respectively.
Coinfection with hepatitis C or hepatitis D
Anti-HBc positivity was associated with both past and currentHCV infection. Among anti-HBcepositive persons, 12.9% (95%CI ¼ 10.2e15.5) were anti-HCV positive, compared with 5.9% (95%CI ¼ 4.8e7.0) of anti-HBcenegative persons (P < 0.0001; data notshown). Likewise, 9.2% (95% CI ¼ 6.9e11.6) of anti-HBcepositivepersons were HCV RNA positive, compared with 4.1% (95%CI ¼ 3.2e4.9) among those never infected with HBV (P < 0.0001).
Among HBsAg-positive persons, 13.3% (95% CI ¼ 5.8e20.8) wereanti-HCV positive and 9.8% (95% CI ¼ 2.6e17.0) were HCV RNApositive, although these were not significantly higher than those inHBsAg-negative persons (7.5%; 95% CI ¼ 6.4e8.6 and 5.3%; 95%CI ¼ 4.4e6.2, respectively [P > 0.05]).
Among HBsAg-positive persons, 0.9% (95% CI ¼ 0.0e2.0) werepositive for HDV RNA (n ¼ 4/175 [2.3%] of samples tested). All HDVspecimens were genotype 1.
Hepatitis B vaccination
Overall, 1.1% (95% CI ¼ 0.8e1.4) of the surveyed population re-ported ever having been vaccinated against hepatitis B (data notshown), although the number of doses received could not beverified. Vaccination coveragewas highest (2.1%) among those aged18e29 years and lowest (0.2%) among those aged �60 years(P < 0.001). Of the 798 participants aged �70 years, none couldrecall having been vaccinated against hepatitis B.
Hepatitis Berelated knowledge
Slightly more than one-third of the participants (36.7%;n ¼ 2004) had ever heard of hepatitis B or HBV. About one in fiveparticipants (20.6%; n ¼ 1093) was aware that HBV could betransmitted by sharing needles or syringes, and 18.7% (n ¼ 1010)were aware HBV could be transmitted by sharing household objectssuch as razors. Only 8.7% (n ¼ 461) knew it was vaccine prevent-able, and 15.4% (n¼ 819) knew that condom use could prevent HBVinfection. Of those who had heard of HBV, 42.8% (n ¼ 884) wereaware that this infection could be treated, and 42.5% (n ¼ 849)knew that it could be asymptomatic.
Discussion
This is the first serosurvey to report hepatitis B prevalence on anational scale in Georgia. Overall, the rate of current or past HBVinfection (anti-HBc) was 25.9%, and the prevalence of chronic HBVinfection, defined by prevalence of HBsAg positivity, was 2.9%. Astudy conducted in 2006e2007 among healthcare workers inGeorgia found similar prevalence of anti-HBc (29%) and HBsAg (2%)positivity.17
Georgia's anti-HBc positivity prevalence is high, but the countryhas low to intermediate HBsAg positivity prevalence (defined as2.00e4.99%) compared with other countries in the World HealthOrganization European region.18 Risk factors associated with HBVinfection included injection drug use, receipt of a blood transfusion,history of incarceration, sex with a commercial sex worker, and
Fig. 1. Estimated antiehepatitis B core total antibody positivity prevalence (95% confidence intervals) by region, Georgia serosurvey, 2015.
A. Kasradze et al. / Public Health 185 (2020) 341e347344
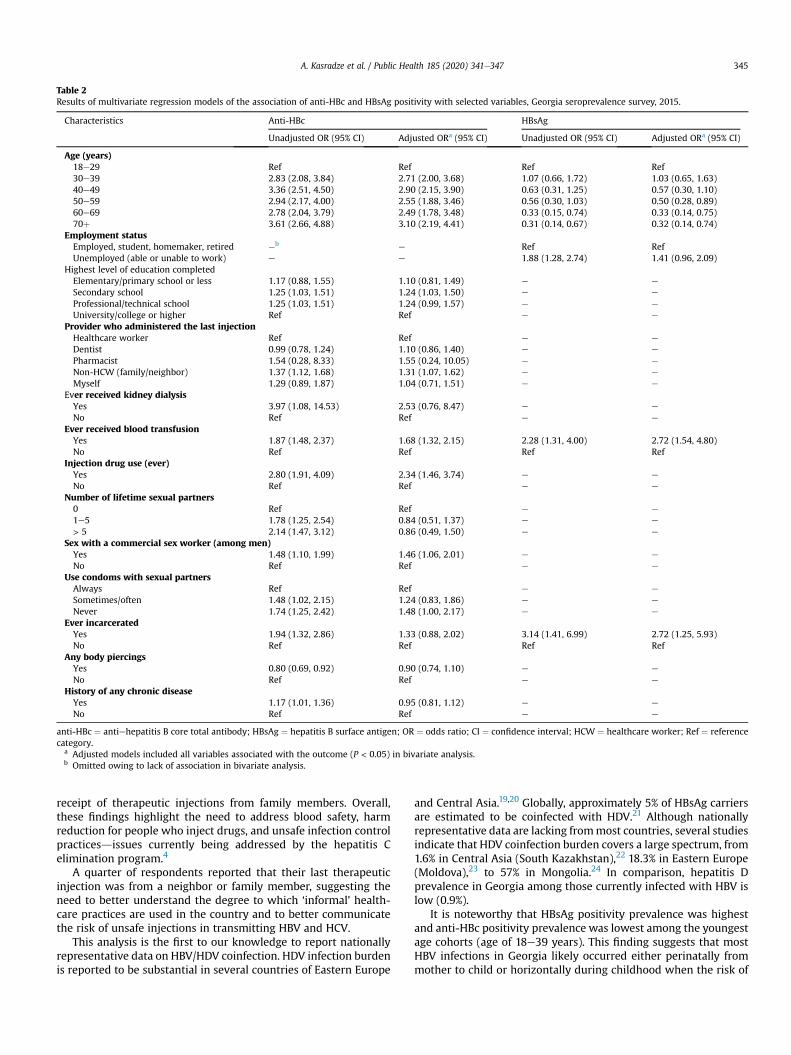
receipt of therapeutic injections from family members. Overall,these findings highlight the need to address blood safety, harmreduction for people who inject drugs, and unsafe infection controlpracticesdissues currently being addressed by the hepatitis Celimination program.4
A quarter of respondents reported that their last therapeuticinjection was from a neighbor or family member, suggesting theneed to better understand the degree to which ‘informal’ health-care practices are used in the country and to better communicatethe risk of unsafe injections in transmitting HBV and HCV.
This analysis is the first to our knowledge to report nationallyrepresentative data on HBV/HDV coinfection. HDV infection burdenis reported to be substantial in several countries of Eastern Europe
and Central Asia.19,20 Globally, approximately 5% of HBsAg carriersare estimated to be coinfected with HDV.21 Although nationallyrepresentative data are lacking frommost countries, several studiesindicate that HDV coinfection burden covers a large spectrum, from1.6% in Central Asia (South Kazakhstan),22 18.3% in Eastern Europe(Moldova),23 to 57% in Mongolia.24 In comparison, hepatitis Dprevalence in Georgia among those currently infected with HBV islow (0.9%).
It is noteworthy that HBsAg positivity prevalence was highestand anti-HBc positivity prevalence was lowest among the youngestage cohorts (age of 18e39 years). This finding suggests that mostHBV infections in Georgia likely occurred either perinatally frommother to child or horizontally during childhood when the risk of
Table 2Results of multivariate regression models of the association of anti-HBc and HBsAg positivity with selected variables, Georgia seroprevalence survey, 2015.
Characteristics Anti-HBc HBsAg
Unadjusted OR (95% CI) Adjusted ORa (95% CI) Unadjusted OR (95% CI) Adjusted ORa (95% CI)
Age (years)18e29 Ref Ref Ref Ref30e39 2.83 (2.08, 3.84) 2.71 (2.00, 3.68) 1.07 (0.66, 1.72) 1.03 (0.65, 1.63)40e49 3.36 (2.51, 4.50) 2.90 (2.15, 3.90) 0.63 (0.31, 1.25) 0.57 (0.30, 1.10)50e59 2.94 (2.17, 4.00) 2.55 (1.88, 3.46) 0.56 (0.30, 1.03) 0.50 (0.28, 0.89)60e69 2.78 (2.04, 3.79) 2.49 (1.78, 3.48) 0.33 (0.15, 0.74) 0.33 (0.14, 0.75)70þ 3.61 (2.66, 4.88) 3.10 (2.19, 4.41) 0.31 (0.14, 0.67) 0.32 (0.14, 0.74)
Employment statusEmployed, student, homemaker, retired eb e Ref RefUnemployed (able or unable to work) e e 1.88 (1.28, 2.74) 1.41 (0.96, 2.09)
Highest level of education completedElementary/primary school or less 1.17 (0.88, 1.55) 1.10 (0.81, 1.49) e e
Secondary school 1.25 (1.03, 1.51) 1.24 (1.03, 1.50) e e
Professional/technical school 1.25 (1.03, 1.51) 1.24 (0.99, 1.57) e e
University/college or higher Ref Ref e e
Provider who administered the last injectionHealthcare worker Ref Ref e e
Dentist 0.99 (0.78, 1.24) 1.10 (0.86, 1.40) e e
Pharmacist 1.54 (0.28, 8.33) 1.55 (0.24, 10.05) e e
Non-HCW (family/neighbor) 1.37 (1.12, 1.68) 1.31 (1.07, 1.62) e e
Myself 1.29 (0.89, 1.87) 1.04 (0.71, 1.51) e e
Ever received kidney dialysisYes 3.97 (1.08, 14.53) 2.53 (0.76, 8.47) e e
No Ref Ref e e
Ever received blood transfusionYes 1.87 (1.48, 2.37) 1.68 (1.32, 2.15) 2.28 (1.31, 4.00) 2.72 (1.54, 4.80)No Ref Ref Ref Ref
Injection drug use (ever)Yes 2.80 (1.91, 4.09) 2.34 (1.46, 3.74) e e
No Ref Ref e e
Number of lifetime sexual partners0 Ref Ref e e
1e5 1.78 (1.25, 2.54) 0.84 (0.51, 1.37) e e
> 5 2.14 (1.47, 3.12) 0.86 (0.49, 1.50) e e
Sex with a commercial sex worker (among men)Yes 1.48 (1.10, 1.99) 1.46 (1.06, 2.01) e e
No Ref Ref e e
Use condoms with sexual partnersAlways Ref Ref e e
Sometimes/often 1.48 (1.02, 2.15) 1.24 (0.83, 1.86) e e
Never 1.74 (1.25, 2.42) 1.48 (1.00, 2.17) e e
Ever incarceratedYes 1.94 (1.32, 2.86) 1.33 (0.88, 2.02) 3.14 (1.41, 6.99) 2.72 (1.25, 5.93)No Ref Ref Ref Ref
Any body piercingsYes 0.80 (0.69, 0.92) 0.90 (0.74, 1.10) e e
No Ref Ref e e
History of any chronic diseaseYes 1.17 (1.01, 1.36) 0.95 (0.81, 1.12) e e
No Ref Ref e e
anti-HBc ¼ antiehepatitis B core total antibody; HBsAg ¼ hepatitis B surface antigen; OR ¼ odds ratio; CI ¼ confidence interval; HCW ¼ healthcare worker; Ref ¼ referencecategory.
a Adjusted models included all variables associated with the outcome (P < 0.05) in bivariate analysis.b Omitted owing to lack of association in bivariate analysis.
A. Kasradze et al. / Public Health 185 (2020) 341e347 345
chronic infection is highest.2 Routine hepatitis B vaccination wasincluded in the national immunization schedule in 2002, and thehepatitis B birth dose was introduced in 2003, so persons in thissurvey would not have benefitted from childhood and birth dosevaccination programs. Cohorts of Georgian children born after 2002and 2003 will benefit from the protection of hepatitis B vaccina-tion.25 In addition, a dose of hepatitis B immunoglobulin (HBIG) isadministered to infants born to pregnant women who have beenscreened and tested positive for HBsAg since August 2006.26 In2017e2018, of 103,828 registered live births, HBIG was adminis-tered to 1532 (1.5%) newborns.25 Given these development, Georgiacould consider implementation of a hepatitis B serosurvey amongcohorts born after vaccine introduction to assess the impact ofvaccination on disease burden and report on progress toward theachievement of the European region hepatitis B control goal ofHBsAg <0.5% among vaccinated cohorts by 202027 and global goalof elimination which is defined as HBsAg<0.1% among childrenaged 5 years by 2030.1 In addition, in 2019, the government ofGeorgia approved a decree mandating hepatitis B vaccination bemade available to all healthcare workers.28 Fewer than 9% of per-sons were aware that hepatitis B can be prevented with a vaccine,suggesting public awareness campaigns could boost vaccinationuptake among older populations.
Several key risk factors for HBV infection identified in thisanalysis were also found to be associated with HCV infection inGeorgia, including history of incarceration (in bivariate analyses),receipt of a blood transfusion, and past or current injection druguse.9 HBV and HCV, both blood-borne pathogens, are known tohave similar modes of transmission,29 and nearly 10% of HBsAg-positive persons in this analysis were coinfected with HCV. Coin-fection can increase the likelihood of developing cirrhosis,decompensated liver disease, and hepatocellular carcinoma.30
Georgia's hepatitis C elimination program was launched in 2015and offers hepatitis C treatment free of charge; however, there iscurrently no such program for hepatitis B treatment. Nonetheless,the public health infrastructure established for hepatitis Cscreening and treatment as part of the hepatitis C eliminationprogram could be leveraged to support hepatitis B elimination aswell.4e6 Furthermore, Georgia can take advantage of reductions inthe price of hepatitis B antivirals observed globally to improvetreatment access.31 Cost-effectiveness studies and modeling forhepatitis B elimination are needed to further inform the Georgiangovernment's consideration of undertaking hepatitis B elimination.
This analysis was subject to several limitations. Owing to itscross-sectional design, causal associations are difficult to be made;hepatitis B could have been acquired at any time and in any settingbefore survey participation. Risk factor data were self-reported andcould not be independently verified and could be subject to recalland social desirability bias. Our survey only included persons �18years of age who were not eligible for hepatitis B vaccination at thetime of birth, so hepatitis B prevalence could not be estimated forpersons in younger age-groups and children who were born aftervaccine introduction. However, lower HBV infection rates areanticipated among children born after hepatitis B vaccine intro-duction. In addition, currently incarcerated persons were not sur-veyed in this analysis, which could lead to underestimation ofnational prevalence of hepatitis B. Demographic and behavioraldifferences between survey participants who did or did not providea blood specimen could have skewed results. The relatively lownumber of HBsAg-positive persons sampled prevented reliableanalysis of regional HBsAg prevalence and likely affected risk factoranalysis, which could explain differences observed between anti-HBc and HBsAg positivity, especially with respect to injectiondrug use (IDU) and sexwith a commercial sexworker. The samplingmethod of this study was not designed to produce precise
prevalence estimates for HDV infection; owing to low prevalenceamong the sampled population, national estimates should beinterpreted with caution.
To conclude, the overall rate of exposure to HBV in Georgia ishigh, suggesting significant transmission, although the prevalenceof chronic HBV infection is low to intermediate. Considering theoverlap in the population and risk factors for HCV and HBV infec-tion, existing programs and efforts within the ongoing nationalhepatitis C elimination program may be mitigating the risk ofcontinued HBV transmission in the country; preventive measuresaimed at reducing the risk of HCV transmission will also reduce therisk of HBV infection. The future burden of hepatitis B in Georgiawill also decrease as a result of childhood vaccinations begun in theearly 2000s. Nevertheless, more than 80,000 adults are estimatedto be living with chronic HBV infection and are at risk of sequelaeincluding cirrhosis and hepatocellular carcinoma, as well ascontinued transmission to additional susceptible individuals.Incorporating hepatitis B into Georgia's successful ongoing hepa-titis C elimination efforts offers an opportunity for Georgia to beamong the first countries in the region to undertake hepatitis Belimination. Studies to assess the feasibility and cost-effectivenessof undertaking hepatitis B elimination in Georgia could helpinform policy decisions.
Author statements
Ethical approval
Ethical approval was not required. This survey was deemed bythe Centers for Disease Control and Prevention to be a routinepublic health activity for public health surveillance and thereforejudged to not involve human subject research.
Funding
All funding for this study came from the US Centers for DiseaseControl and Prevention and the Georgia National Center for DiseaseControl.
Competing interests
None declared.
Disclaimer
The findings and conclusions in this report are those of theauthors and do not necessarily represent the official position of theUS Centers for Disease Control and Prevention.
References
1. Global hepatitis report. 2017. Available at: http://www.who.int/hepatitis/publications/global-hepatitis-report2017/en/. [Accessed 18 June 2018].
2. World Health Organization. WHO vaccine-preventable diseases: monitoringsystem. 2019 Global summary. Available at: https://www.who.int/immunization/monitoring_surveillance/data/gs_gloprofile.pdf?ua¼1.(Accessed 10 March 2020).
3. Cooke GS, Andrieux-Meyer I, Applegate TL, et al. Accelerating the elimination ofviral hepatitis: a lancet gastroenterology & hepatology commission. LancetGastroenterol Hepatol 2019;4(2):135e84. https://doi.org/10.1016/S2468-1253(18)30270-X.
4. Gvinjilia L, Nasrullah M, Sergeenko D, et al. National progress toward hepatitisC eliminationdGeorgia 2015e2016. MMWR 2016;65(41):1132e5. https://doi.org/10.15585/mmwr.mm6541a2.
5. Mitruka K, Tsertsvadze T, Butsashvili M, et al. Launch of a nationwide hepatitisC elimination programdGeorgia, April 2015. MMWR 2015;64(28):753e7.https://doi.org/10.15585/mmwr. mm6428a2.
A. Kasradze et al. / Public Health 185 (2020) 341e347346
6. Nasrullah M, Sergeenko D, Gvinjilia L, et al. The role of screening and treatmentin national progress toward hepatitis C elimination d Georgia, 2015e2016.MMWR 2017;66(29):773e6. https://doi.org/10.15585/mmwr.mm6629a2.
7. World bank country and lending groups. 2018. Available at: https://datahelpdesk.worldbank.org/knowledgebase/articles/906519-world-bank-country-and-lending-groups. [Accessed 1 May 2018].
8. General Population Census.Main Results. General Information. 2014. Available at:http://census.ge/files/results/Census_release_ENG.pdf. [Accessed 1 May 2018].
9. Hagan LM, Kasradze A, Salyer SJ, et al. Hepatitis C prevalence and risk factors inGeorgia, 2015: setting a baseline for elimination. BMC Publ Health 2019;19(S3):1e12. https://doi.org/10.1186/s12889-019-6784-3.
10. World Health Organization. WHO vaccine-preventable diseases: monitoringsystem. 2019 Global summary. Country data: Georgia Available at: http://apps.who.int/immunization_monitoring/globalsummary/countries?countrycriteria%5Bcountry%5D%5B%5D¼GEO. (Accessed 10 March 2020).
11. Anti-HBc Ab, EIA IVD, Dia.Pro. Diagnostic Bioprobes Srl., Italy. Dia.Pro. Diag-nostic Bioprobes Srl., Italy. https://www.diapro.it/index.php/products/elisa/hepatitis/hepatitis-b/hbc-ab-detail. (Accessed 13 May 2019).
12. HBsAg EIA IVD, Dia.Pro. Diagnostic Bioprobes Srl., Italy. https://www.diapro.it/index.php/products/elisa/hepatitis/hepatitis-b/hbs-ag-detail. (Accessed 13 May2019).
13. HBs Ag Conf, Dia.Pro. Diagnostic Bioprobes Srl., Italy. https://www.diapro.it/index.php/products/elisa/hepatitis/hepatitis-b/hbs-ag-conf-detail. (Accessed20 September 2019).
14. VITROS immunodiagnostic products, anti-HBc reagent pack and calibrator,United States. javascript:f_openPopup('aHBc_GEM1211_US_EN_I_13_1.pdf','http://techdocs.orthoclinicaldiagnostics.com','/IFU/ContentPages/dis-playDoc.aspx'). (Accessed 4 December 2019).
15. VITROS Immunodiagnostic Products, HBsAg Reagent Pack and Calibrator,United States. javascript:f_openPopup('HBsAg_GEM1201_US_EN_I_13_1.pdf','http://techdocs.orthoclinicaldiagnostics.com','/IFU/ContentPages/dis-playDoc.aspx'). (Accessed 4 December 2019).
16. Kodani M, Martin A, Mixson-Hayden T, et al. One-step real-time PCR assay fordetection and quantitation of hepatitis D virus RNA. J Virol Methods2013;193(2):531e5.
17. Butsashvili M, Kamkamidze G, Kajaia M, et al. Occupational exposure to bodyfluids among health care workers in Georgia. Occup Med (Oxford, England)2012;62(8):620e6. https://doi.org/10.1093/occmed/kqs121.
18. Schweitzer A, Horn J, Mikolajczyk R, Krause G, Ott JJ. Estimations of worldwideprevalence of chronic hepatitis B virus infection: a systematic review of data
published between 1965 and 2013. Lancet 2015;386(10003):1546e55. https://doi.org/10.1016/S0140-6736(15)61412-X.
19. Rizzetto M. Hepatitis D virus: introduction and epidemiology. Cold Spring HarbPerspect Med 2015;5(7):a021576. https://doi.org/10.1101/cshper-spect.a021576. Published 2015 Jul 1.
20. Mentha N, Cl�ement S, Negro F, Alfaiate D. A review on hepatitis D: fromvirology to new therapies. J Adv Res 2019;17:3e15. https://doi.org/10.1016/j.jare.2019.03.009. Published 2019 Mar 29.
21. Farzi P. Delta hepatitis: an update. J Hepatol 2003;39:S212e9.22. Nersesov AV, Berkinbayev SF, Junusbekova GA, Jumabayeva AE, Novitskaya MS,
Kyanysh N. Prevalence of viral hepatitis among residents of South Kazakhstanregion. Gepatologia 2016;171:30e2.
23. Drobeniuc J, Hutin YJF, Harpaz R, et al. Prevalence of hepatitis B, D and C virusinfections among children and pregnant women in Moldova: additional evi-dence supporting the need for routine hepatitis B vaccination of infants. Epi-demiol Infect 1999;123:463e7.
24. Chen X, Oidovsambuu O, Liu P, et al. A novel quantitative microarray antibodycapture assay identifies an extremely high hepatitis delta virus prevalenceamong hepatitis B viruseinfected Mongolians. Hepatology 2017;66(6):1739e49.
25. Jabidze L. Vaccination against hepatitis B in Georgia. In: Presented at the 6th
national hepatitis C elimination workshop, Tbilisi, Georgia, March 7; 2019.26. Hepatitis B catch-up vaccination program in Georgia. 2012. Available at: https://
partnerships.usaid.gov/partnership/hepatitis-b-catch-vaccination-program-georgia. [Accessed 18 June 2019].
27. World Health Organization Regional Office for Europe. Action plan for thehealth sector response to viral hepatitis in the WHO European Region. Avail-able at: http://www.euro.who.int/__data/assets/pdf_file/0008/357236/Hepatitis-9789289052870-eng.pdf?ua¼1. (Accessed 10 March 2020).
28. Legislative herald of Georgia. Available at: https://matsne.gov.ge/ka/document/view/4454340?publication¼0. (Accessed 29 May 2019).
29. Tyson GL, Kramer JR, Duan Z, Davila JA, Richardson PA, El-Serag HB. Prevalenceand predictors of hepatitis B virus coinfection in a United States cohort ofhepatitis C virus-infected patients. Hepatology 2013;58(2):538e45.
30. Chu CJ, Lee SD. Hepatitis B virus/hepatitis C virus coinfection: epidemiology,clinical features, viral interactions and treatment. J Gastroenterol Hepatol2008;23(4):512e20.
31. Hutin Y, Nasrullah M, Easterbrook P, et al. Access to treatment for hepatitis Bvirus infection - worldwide, 2016. MMWR Morb Mortal Wkly Rep 2018;67(28):773e7. https://doi.org/10.15585/mmwr.mm6728a2. Published 2018 Jul 20.
A. Kasradze et al. / Public Health 185 (2020) 341e347 347
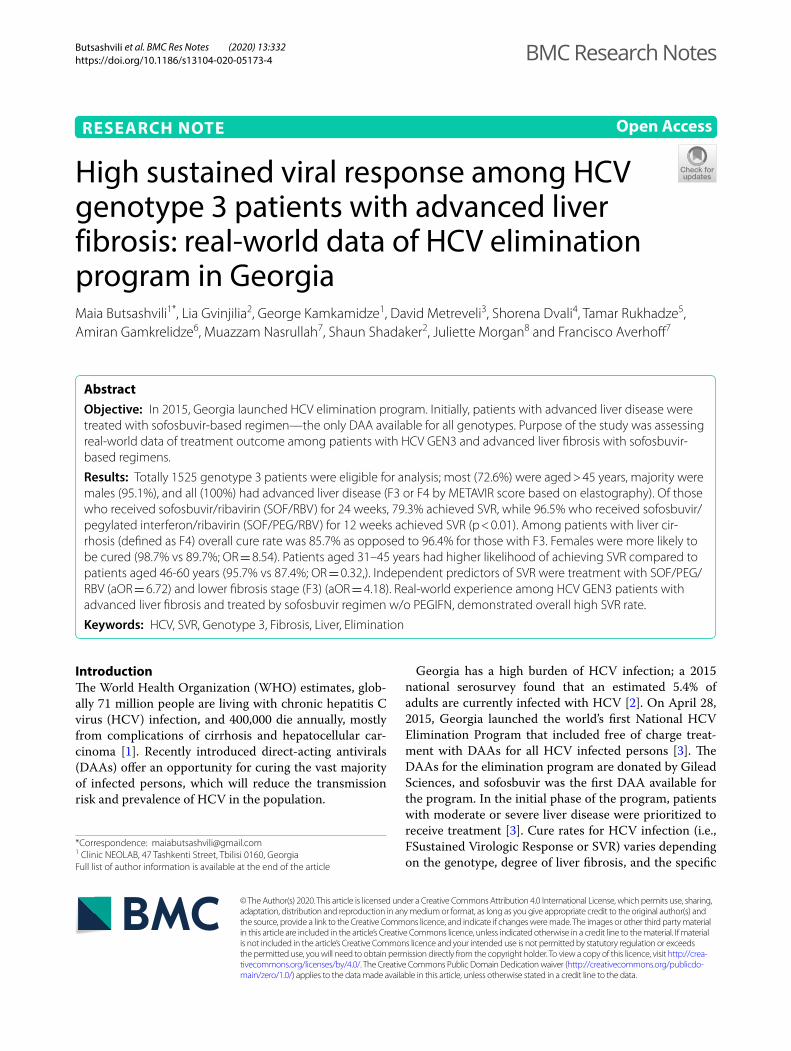
Butsashvili et al. BMC Res Notes (2020) 13:332 https://doi.org/10.1186/s13104-020-05173-4
RESEARCH NOTE
High sustained viral response among HCV genotype 3 patients with advanced liver fibrosis: real-world data of HCV elimination program in GeorgiaMaia Butsashvili1*, Lia Gvinjilia2, George Kamkamidze1, David Metreveli3, Shorena Dvali4, Tamar Rukhadze5, Amiran Gamkrelidze6, Muazzam Nasrullah7, Shaun Shadaker2, Juliette Morgan8 and Francisco Averhoff7
Abstract
Objective: In 2015, Georgia launched HCV elimination program. Initially, patients with advanced liver disease were treated with sofosbuvir-based regimen—the only DAA available for all genotypes. Purpose of the study was assessing real-world data of treatment outcome among patients with HCV GEN3 and advanced liver fibrosis with sofosbuvir-based regimens.
Results: Totally 1525 genotype 3 patients were eligible for analysis; most (72.6%) were aged > 45 years, majority were males (95.1%), and all (100%) had advanced liver disease (F3 or F4 by METAVIR score based on elastography). Of those who received sofosbuvir/ribavirin (SOF/RBV) for 24 weeks, 79.3% achieved SVR, while 96.5% who received sofosbuvir/pegylated interferon/ribavirin (SOF/PEG/RBV) for 12 weeks achieved SVR (p < 0.01). Among patients with liver cir-rhosis (defined as F4) overall cure rate was 85.7% as opposed to 96.4% for those with F3. Females were more likely to be cured (98.7% vs 89.7%; OR = 8.54). Patients aged 31–45 years had higher likelihood of achieving SVR compared to patients aged 46-60 years (95.7% vs 87.4%; OR = 0.32,). Independent predictors of SVR were treatment with SOF/PEG/RBV (aOR = 6.72) and lower fibrosis stage (F3) (aOR = 4.18). Real-world experience among HCV GEN3 patients with advanced liver fibrosis and treated by sofosbuvir regimen w/o PEGIFN, demonstrated overall high SVR rate.
Keywords: HCV, SVR, Genotype 3, Fibrosis, Liver, Elimination
© The Author(s) 2020. This article is licensed under a Creative Commons Attribution 4.0 International License, which permits use, sharing, adaptation, distribution and reproduction in any medium or format, as long as you give appropriate credit to the original author(s) and the source, provide a link to the Creative Commons licence, and indicate if changes were made. The images or other third party material in this article are included in the article’s Creative Commons licence, unless indicated otherwise in a credit line to the material. If material is not included in the article’s Creative Commons licence and your intended use is not permitted by statutory regulation or exceeds the permitted use, you will need to obtain permission directly from the copyright holder. To view a copy of this licence, visit http://crea-tivecommons.org/licenses/by/4.0/. The Creative Commons Public Domain Dedication waiver (http://creativecommons.org/publicdo-main/zero/1.0/) applies to the data made available in this article, unless otherwise stated in a credit line to the data.
IntroductionThe World Health Organization (WHO) estimates, glob-ally 71 million people are living with chronic hepatitis C virus (HCV) infection, and 400,000 die annually, mostly from complications of cirrhosis and hepatocellular car-cinoma [1]. Recently introduced direct-acting antivirals (DAAs) offer an opportunity for curing the vast majority of infected persons, which will reduce the transmission risk and prevalence of HCV in the population.
Georgia has a high burden of HCV infection; a 2015 national serosurvey found that an estimated 5.4% of adults are currently infected with HCV [2]. On April 28, 2015, Georgia launched the world’s first National HCV Elimination Program that included free of charge treat-ment with DAAs for all HCV infected persons [3]. The DAAs for the elimination program are donated by Gilead Sciences, and sofosbuvir was the first DAA available for the program. In the initial phase of the program, patients with moderate or severe liver disease were prioritized to receive treatment [3]. Cure rates for HCV infection (i.e., FSustained Virologic Response or SVR) varies depending on the genotype, degree of liver fibrosis, and the specific
Open Access
BMC Research Notes
*Correspondence: [email protected] Clinic NEOLAB, 47 Tashkenti Street, Tbilisi 0160, GeorgiaFull list of author information is available at the end of the article
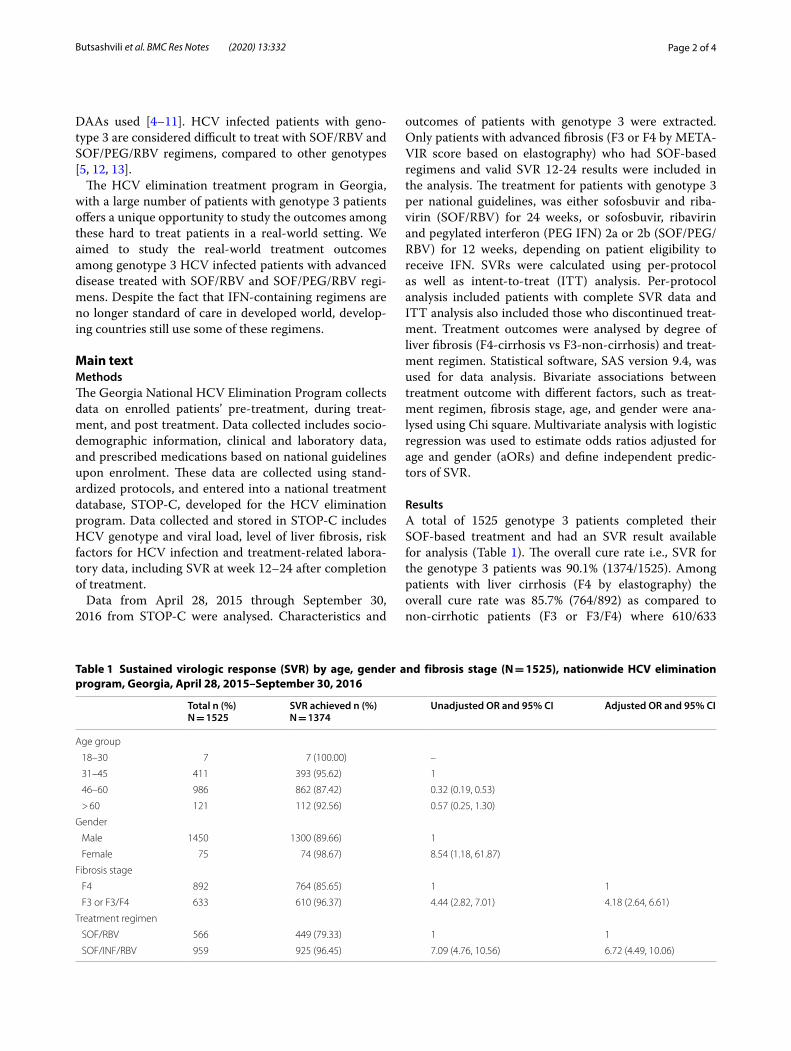
Page 2 of 4Butsashvili et al. BMC Res Notes (2020) 13:332
DAAs used [4–11]. HCV infected patients with geno-type 3 are considered difficult to treat with SOF/RBV and SOF/PEG/RBV regimens, compared to other genotypes [5, 12, 13].
The HCV elimination treatment program in Georgia, with a large number of patients with genotype 3 patients offers a unique opportunity to study the outcomes among these hard to treat patients in a real-world setting. We aimed to study the real-world treatment outcomes among genotype 3 HCV infected patients with advanced disease treated with SOF/RBV and SOF/PEG/RBV regi-mens. Despite the fact that IFN-containing regimens are no longer standard of care in developed world, develop-ing countries still use some of these regimens.
Main textMethodsThe Georgia National HCV Elimination Program collects data on enrolled patients’ pre-treatment, during treat-ment, and post treatment. Data collected includes socio-demographic information, clinical and laboratory data, and prescribed medications based on national guidelines upon enrolment. These data are collected using stand-ardized protocols, and entered into a national treatment database, STOP-C, developed for the HCV elimination program. Data collected and stored in STOP-C includes HCV genotype and viral load, level of liver fibrosis, risk factors for HCV infection and treatment-related labora-tory data, including SVR at week 12–24 after completion of treatment.
Data from April 28, 2015 through September 30, 2016 from STOP-C were analysed. Characteristics and
outcomes of patients with genotype 3 were extracted. Only patients with advanced fibrosis (F3 or F4 by META-VIR score based on elastography) who had SOF-based regimens and valid SVR 12-24 results were included in the analysis. The treatment for patients with genotype 3 per national guidelines, was either sofosbuvir and riba-virin (SOF/RBV) for 24 weeks, or sofosbuvir, ribavirin and pegylated interferon (PEG IFN) 2a or 2b (SOF/PEG/RBV) for 12 weeks, depending on patient eligibility to receive IFN. SVRs were calculated using per-protocol as well as intent-to-treat (ITT) analysis. Per-protocol analysis included patients with complete SVR data and ITT analysis also included those who discontinued treat-ment. Treatment outcomes were analysed by degree of liver fibrosis (F4-cirrhosis vs F3-non-cirrhosis) and treat-ment regimen. Statistical software, SAS version 9.4, was used for data analysis. Bivariate associations between treatment outcome with different factors, such as treat-ment regimen, fibrosis stage, age, and gender were ana-lysed using Chi square. Multivariate analysis with logistic regression was used to estimate odds ratios adjusted for age and gender (aORs) and define independent predic-tors of SVR.
ResultsA total of 1525 genotype 3 patients completed their SOF-based treatment and had an SVR result available for analysis (Table 1). The overall cure rate i.e., SVR for the genotype 3 patients was 90.1% (1374/1525). Among patients with liver cirrhosis (F4 by elastography) the overall cure rate was 85.7% (764/892) as compared to non-cirrhotic patients (F3 or F3/F4) where 610/633
Table 1 Sustained virologic response (SVR) by age, gender and fibrosis stage (N = 1525), nationwide HCV elimination program, Georgia, April 28, 2015–September 30, 2016
Total n (%)N = 1525
SVR achieved n (%)N = 1374
Unadjusted OR and 95% CI Adjusted OR and 95% CI
Age group
18–30 7 7 (100.00) –
31–45 411 393 (95.62) 1
46–60 986 862 (87.42) 0.32 (0.19, 0.53)
> 60 121 112 (92.56) 0.57 (0.25, 1.30)
Gender
Male 1450 1300 (89.66) 1
Female 75 74 (98.67) 8.54 (1.18, 61.87)
Fibrosis stage
F4 892 764 (85.65) 1 1
F3 or F3/F4 633 610 (96.37) 4.44 (2.82, 7.01) 4.18 (2.64, 6.61)
Treatment regimen
SOF/RBV 566 449 (79.33) 1 1
SOF/INF/RBV 959 925 (96.45) 7.09 (4.76, 10.56) 6.72 (4.49, 10.06)
Page 3 of 4Butsashvili et al. BMC Res Notes (2020) 13:332
(96.4%) achieved SVR. The SVR rate was significantly higher among those treated with SOF/INF/RBV contain-ing regimen compared to those ineligibles for prescribing interferon-based treatment. Out of 959 patients receiv-ing PEG IFN 2a or 2b with SOF and RBV for 12 weeks, 925 (96.5%) achieved SVR compared to 79.3% cure rate among those treated with SOF and RBV for 24 weeks (449 out of 566). The SVR rate in intent-to-treat analysis for IFN/SOF/RBV regimens was 76.9% and for SOF/RBV regimen—61.2%.
By bivariate analysis, gender was significantly associ-ated with SVR rate. Females (74/75 [98.7%] were more likely to be cured compared to males 1300/1450 [89.7%]; OR = 8.54, 95% CI 1.18–61.87). Patients aged 31–45 years had higher chance of achieving SVR (95.7% vs 87.4%) compared to patients aged 46–60 years (OR = 0.32, 95% CI 0.19–0.53).
Multivariate analysis showed that the independent predictors of achieving SVR were treatment regimen (patients treated with SOF/IFN/RBV combination were more likely to be cured–aOR = 6.72, 95% CI 4.49–10.06) and fibrosis stage (non-cirrhotic patients having higher chance of SVR–aOR = 4.18, 95% CI 2.64–6.61) (Table 1).
DiscussionIn this analysis of the real-world experience among HCV genotype 3 infected patients with advanced liver fibrosis treated with SOF containing regimen with or without pegylated interferon, we found patients achieved overall high SVR rates of > 90%. Higher SVR rate was observed among women. This finding is comparable to other stud-ies [6, 14, 15] where SVR rate varied by gender with males having lower HCV cure rate. The factors account for this difference are not well understood. Patients with liver cirrhosis in our cohort achieved higher SVR rates with this “first generation” DAA compared to previous published reports that enrolled cirrhotic patients with HCV genotype 3 [13, 16]. Several studies demonstrated SVR rates of 60% to 70% among those receiving the SOF and RBV 24-week regimen [6, 16–19]. The VALENCE trial reported an overall SVR rate of 85% among genotype 3 infected patients receiving the 24-week SOF/RBV regi-men [6]. In the VALENCE trial, SVR rates at 12-weeks post-treatment (SVR 12) were 91% for the non-cirrhotic group and 68% for the group of study participants with liver cirrhosis, and multivariate analysis identified the presence of liver cirrhosis as a predictor of non-response to treatment [6]. Our cohort, which included only those with advanced liver disease, had a similar overall SVR rate as the one reported among patients without cirrhosis in the VALENCE study (90.12% vs 91% SVR rate).
In June of 2016, sofosbuvir/ledipasvir (SOF/LED) was introduced in Georgia [2] and the treatment guidelines
were modified to include this combination DAA, resulting in little to no PEG IFN use for treatment. The Georgia treatment guidelines differ from those of the American Association for the Study of Liver Diseases (AASLD) or The European Association for the Study of the Liver (EASL), providing a unique opportunity to observe population-based outcomes with alterna-tive HCV treatment regimens. These results can inform clinicians and policy makers in countries with a large proportion or burden of HCV genotype 3 infection that may not have access to DAAs or combinations of DAAs that are available in high-income countries of North America and Western Europe.
LimitationsThis is a short report of a study limited to HCV infected genotype 3 patients with advanced liver disease treated during the first year of National HCV Elimination Pro-gram which was launched in 2015. Until 2016 HCV infected individuals with low fibrosis level were not eligible to be enrolled. The treatment outcomes were limited to two antiviral regimens: SOF/PEG/RBV and SOF/RBV. Interferon-free regimen (SOF/RIBA for 24 weeks) was used for patients with contraindication of IFN therapy, including mental illness. National HCV elimination program was not collecting data about IFN ineligibility; accordingly, we couldn’t analyze impact of comorbidities on treatment outcome. Another limita-tion is that we have not adjusted for the previous treat-ment history because at the beginning of the program this information was not entered into the elimination program database. This information is available for the patients enrolled after 2016, when program database was updated and several variables added.
It is hoped that pan-genotypic regimens will soon be introduced in Georgia, presenting the opportunity to greatly simplify testing and treatment regimens, sup-porting the realization of HCV Elimination in Georgia by 2020 [20].
In conclusion, high SVR rates can be achieved among patients with HCV genotype 3 and advanced liver fibro-sis, particularly among those treated with a 12-week SOF/PEG/RBV regimen. This may inform treatment for HCV infected patients in countries with limited access to newer DAAs.
AbbreviationsHCV: Hepatitis C virus; WHO: World Health Organization; DAAs: Directly acting antivirals; SVR: Sustained viral response; SOF: Sofosbuvir; RBV: Ribavirin; PEG: Pegylated; INF: Interferon; aOR: Adjusted odds ratio; LED: Ledipasvir; AASLD: American Association for the Study of Liver Diseases; EASL: European Associa-tion for the Study of the Liver.
Page 4 of 4Butsashvili et al. BMC Res Notes (2020) 13:332
AcknowledgementsGeorgia HCV elimination program is conducted under the leadership from the Georgia Ministry of Labor, Health, and Social Affairs [MoLHSA] with strong stakeholder support, including partnership and technical assistance from CDC, and commitment from Gilead Sciences to donate direct-acting antiviral HCV medications (DAAs). The study was also supported by the Shota Rustaveli National Science Foundation of Georgia (SRNSF) project # 217998.
DisclaimerThe findings and conclusions in this report are those of the authors and do not necessarily represent the views of the Centers for Disease Control and Pre-vention. The use of trade names is for identification only and does not imply endorsement by the Centres for Disease Control and Prevention.
Authors’ contributionsMB was a major contributor in conception, design and writing of the manu-script. LG participated in interpretation of data and revision of the manuscript. GK contributed in analysis and interpretation of data. DM participated in data collection and revision of the manuscript. SD participated in data collection. TR participated in data collection. AG contributed in revision of the manu-script. MN contributed in conception, design and revision of the manuscript. SS participated in analysis and interpretation of data. JM contributed in revi-sion of the manuscript. FA contributed in conception, design and revision of the manuscript. All authors read and approved the final manuscript.
FundingNot applicable
Availability of data and materialsThe datasets used and/or analysed during the current study are available from the corresponding author on reasonable request.
Ethics approval and consent to participateThe study was approved by the Institutional Review Board of Health Research Union (IRB00009520; IORG005619). Study participants were enrolled in the study after signing informed consent form specially developed for this study.
Consent for publicationNot applicable.
Competing interestsThe authors declare that they have no competing interests.
Author details1 Clinic NEOLAB, 47 Tashkenti Street, Tbilisi 0160, Georgia. 2 CDC Foundation, 9 Asatiani Street, Tbilisi 0177, Georgia. 3 Medical Center Mrcheveli, 9 Al. Kazbegi Ave, 0160 Tbilisi, Georgia. 4 Infectious Diseases, AIDS and Clinical Immunology Research Center, 16 Al. Kazbegi Ave, 0160 Tbilisi, Georgia. 5 Clinic HEPA, 18/20 Ljubljana Street, Tbilisi 0159, Georgia. 6 National Center for Disease Control and Public Health, 9 Asatiani Street, Tbilisi 0177, Georgia. 7 Division of Viral Hepatitis, National Center for HIV/AIDS, Viral Hepatitis, STD and TB Prevention, CDC, 1600 Clifton Road, Atlanta, GA 30329-4027, USA. 8 Epidemiology, Infor-matics, Surveillance and Laboratory Branch (EISLB), Division of Global Health Protection (DGHP), Center for Global Health (CGH), CDC, 1600 Clifton Road, Atlanta, GA 30329-4027, USA.
Received: 2 April 2020 Accepted: 3 July 2020
References 1. World Health Organization. Hepatitis C factsheet. No 164. Updated April,
2017. 2. Gvinjilia L, Nasrullah M, Sergeenko D, Tsertsvadze T, Kamkamidze G, But-
sashvili M, et al. National Progress Toward Hepatitis C Elimination—Georgia, 2015–2016. MMWR Morb Mortal Wkly Rep. 2016;65(41):1132–5.
3. Mitruka K, Tsertsvadze T, Butsashvili M, Gamkrelidze A, Sabelashvili P, Adamia E, et al. Launch of a nationwide hepatitis c elimination program-Georgia, April 2015. MMWR Morb Mortal Wkly Rep. 2015; 64(28):753–7. Erratum in: MMWR Morb Mortal Wkly Rep. 2015; 64(29):806.
4. Ampuero J, Reddy KR, Romero-Gomez M. Hepatitis C virus genotype 3: meta-analysis on sustained virologic response rates with currently available treatment options. World J Gastroenterol. 2016;22(22):5285–92.
5. Zoulim F, Liang TJ, Gerbes AL, Aghemo A, Deuffic-Burban S, Dusheiko G, et al. Hepatitis C virus treatment in the real world: optimising treatment and access to therapies. Gut. 2015;64(11):1824–33.
6. Zeuzem S, Dusheiko GM, Salupere R, Mangia A, Flisiak R, Hyland RH, Illeperuma A, Svarovskaia E, Brainard DM, Symonds WT, Subramanian GM, McHutchison JG, Weiland O, Reesink HW, Ferenci P, Hézode C, Esteban R, VALENCE Investigators. Sofosbuvir and ribavirin in HCV genotypes 2 and 3. N Engl J Med. 2014;370(21):1993–2001.
7. Ramos H, Linares P, Badia E, Martín I, Gómez J, Almohalla C, et al. Interferon-free treatments in patients with hepatitis C genotype 1-4 infections in a real-world setting. World J Gastrointest Pharmacol Ther. 2017;8(2):137–46.
8. Lawitz E, Mangia A, Wyles D, Rodriguez-Torres M, Hassanein T, Gordon SC, et al. Sofosbuvir for previously untreated chronic hepatitis C infection. N Engl J Med. 2013;368(20):1878–87.
9. Galán RJ, Cidoncha EC, Martin MF, Rodriguez CC, Almeida CV, Verdugo RM. Antiviral regimen complexity index as an independent predictor of sustained virologic response in patients with chronic hepatitis C. J Manag Care Pharm. 2013;19(6):448–53.
10. Parise ER, de Oliveira AC, Conceição RD, Amaral AC, Leite K. Response to treatment with interferon-alpha and ribavirin in patients with chronic Hepa-titis C virus genotypes 2 and 3 depends on the degree of hepatic fibrosis. Braz J Infect Dis. 2006;10(2):78–81.
11. Im GY, Dieterich DT. Direct-acting antiviral agents in patients with hepatitis C cirrhosis. Gastroenterol Hepatol (N Y). 2012;8(11):727–65.
12. Pawlotsky JM. New hepatitis C therapies: the toolbox, strategies, and chal-lenges. Gastroenterology. 2014;146(5):1176–92.
13. Gondeau C, Pageaux GP, Larrey D. Hepatitis C virus infection: are there still specific problems with genotype 3? World J Gastroenterol. 2015;21(42):12101–13.
14. Holzmann I, Tovo CV, Minmé R, Leal MP, Kliemann MP, Ubirajara C, Aquino AA, Araujo B, Almeida PRL. Effectiveness of chronic hepatitis C treatment with direct-acting antivirals in the Public Health System in Brazil. Braz J Infect Dis. 2018;22(4):317–22. https ://doi.org/10.1016/j.bjid.2018.06.004 Epub 2018 Jul 21.
15. Lobato CMO, Codes L, Silva GF, Souza AFM, Coelho HSM, Pedroso MLA, Parise ER, Lima LMSTB, Borba LA, Evangelista AS, Rezende REF, Cheinquer H, Kuniyoshi ASO, Aires RS, Quintela EHD, Mendes LSC, Nascimento FCV, MedeirosFilho JEM, Ferraz MLCG, Abdala E, Bittencourt PL, Members of the Brazilian Real-Life Study about HCV treatment; Members of the Brazilian Real-Life Study about HCV treatment. Direct antiviral therapy for treatment of hepatitis C: a real-world study from Brazil. Ann Hepatol. 2019;18(6):849–54. https ://doi.org/10.1016/j.aohep .2019.08.001.
16. Yang YM, Choi EJ. Efficacy and safety outcomes of sofosbuvir-based treatment regimens for hepatitis C virus-infected patients with or without cirrhosis from phase III clinical trials. Ther Clin Risk Manag. 2017;13:477–97.
17. Isakov V, Zhdanov K, Kersey K, Svarovskaia E, Massetto B, Zhu Y, et al. Efficacy of sofosbuvir plus ribavirin in treatment-naive patients with genotype-1 and -3 HCV infection: results from a Russian Phase IIIb study. Antivir Ther. 2016;21(8):671–8.
18. Foster GR, Pianko S, Brown A, Forton D, Nahass RG, George J, BOSON Study Group, et al. Efficacy of sofosbuvir plus ribavirin with or without peginterferon-alfa in patients with hepatitis C virus genotype 3 infection and treatment-experienced patients with cirrhosis and hepatitis C virus genotype 2 infection. Gastroenterology. 2015;149(6):1462–70.
19. Jacobson IM, Gordon SC, Kowdley KV, Yoshida EM, Rodriguez-Torres M, Sulkowski MS, POSITRON Study; FUSION Study, et al. Sofosbuvir for hepatitis C genotype 2 or 3 in patients without treatment options. N Engl J Med. 2013;368(20):1867–77.
20. Nasrullah M, Sergeenko D, Gvinjilia L, Gamkrelidze A, Tsertsvadze T, Butsash-vili M, et al. The role of screening and treatment in national progress toward hepatitis C elimination—Georgia, 2015–2016. MMWR Morb Mortal Wkly Rep. 2017;66(29):773–6.
Publisher’s NoteSpringer Nature remains neutral with regard to jurisdictional claims in pub-lished maps and institutional affiliations.
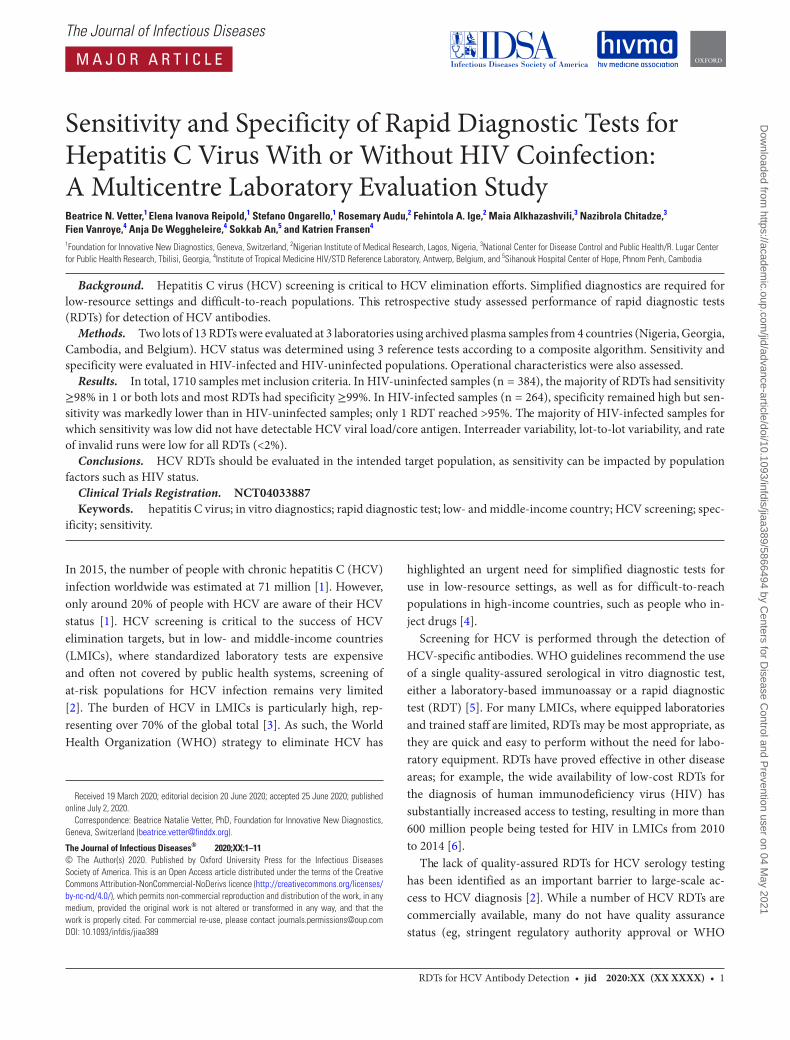
M A J O R A R T I C L E
RDTs for HCV Antibody Detection • jid 2020:XX (XX XXXX) • 1
The Journal of Infectious Diseases
Received 19 March 2020; editorial decision 20 June 2020; accepted 25 June 2020; published online July 2, 2020.
Correspondence: Beatrice Natalie Vetter, PhD, Foundation for Innovative New Diagnostics, Geneva, Switzerland ([email protected]).
The Journal of Infectious Diseases® 2020;XX:1–11© The Author(s) 2020. Published by Oxford University Press for the Infectious Diseases Society of America. This is an Open Access article distributed under the terms of the Creative Commons Attribution-NonCommercial-NoDerivs licence (http://creativecommons.org/licenses/by-nc-nd/4.0/), which permits non-commercial reproduction and distribution of the work, in any medium, provided the original work is not altered or transformed in any way, and that the work is properly cited. For commercial re-use, please contact [email protected]: 10.1093/infdis/jiaa389
Sensitivity and Specificity of Rapid Diagnostic Tests for Hepatitis C Virus With or Without HIV Coinfection: A Multicentre Laboratory Evaluation StudyBeatrice N. Vetter,1 Elena Ivanova Reipold,1 Stefano Ongarello,1 Rosemary Audu,2 Fehintola A. Ige,2 Maia Alkhazashvili,3 Nazibrola Chitadze,3 Fien Vanroye,4 Anja De Weggheleire,4 Sokkab An,5 and Katrien Fransen4
1Foundation for Innovative New Diagnostics, Geneva, Switzerland, 2Nigerian Institute of Medical Research, Lagos, Nigeria, 3National Center for Disease Control and Public Health/R. Lugar Center for Public Health Research, Tbilisi, Georgia, 4Institute of Tropical Medicine HIV/STD Reference Laboratory, Antwerp, Belgium, and 5Sihanouk Hospital Center of Hope, Phnom Penh, Cambodia
Background. Hepatitis C virus (HCV) screening is critical to HCV elimination efforts. Simplified diagnostics are required for low-resource settings and difficult-to-reach populations. This retrospective study assessed performance of rapid diagnostic tests (RDTs) for detection of HCV antibodies.
Methods. Two lots of 13 RDTs were evaluated at 3 laboratories using archived plasma samples from 4 countries (Nigeria, Georgia, Cambodia, and Belgium). HCV status was determined using 3 reference tests according to a composite algorithm. Sensitivity and specificity were evaluated in HIV-infected and HIV-uninfected populations. Operational characteristics were also assessed.
Results. In total, 1710 samples met inclusion criteria. In HIV-uninfected samples (n = 384), the majority of RDTs had sensitivity ≥98% in 1 or both lots and most RDTs had specificity ≥99%. In HIV-infected samples (n = 264), specificity remained high but sen-sitivity was markedly lower than in HIV-uninfected samples; only 1 RDT reached >95%. The majority of HIV-infected samples for which sensitivity was low did not have detectable HCV viral load/core antigen. Interreader variability, lot-to-lot variability, and rate of invalid runs were low for all RDTs (<2%).
Conclusions. HCV RDTs should be evaluated in the intended target population, as sensitivity can be impacted by population factors such as HIV status.
Clinical Trials Registration. NCT04033887Keywords. hepatitis C virus; in vitro diagnostics; rapid diagnostic test; low- and middle-income country; HCV screening; spec-
ificity; sensitivity.
In 2015, the number of people with chronic hepatitis C (HCV) infection worldwide was estimated at 71 million [1]. However, only around 20% of people with HCV are aware of their HCV status [1]. HCV screening is critical to the success of HCV elimination targets, but in low- and middle-income countries (LMICs), where standardized laboratory tests are expensive and often not covered by public health systems, screening of at-risk populations for HCV infection remains very limited [2]. The burden of HCV in LMICs is particularly high, rep-resenting over 70% of the global total [3]. As such, the World Health Organization (WHO) strategy to eliminate HCV has
highlighted an urgent need for simplified diagnostic tests for use in low-resource settings, as well as for difficult-to-reach populations in high-income countries, such as people who in-ject drugs [4].
Screening for HCV is performed through the detection of HCV-specific antibodies. WHO guidelines recommend the use of a single quality-assured serological in vitro diagnostic test, either a laboratory-based immunoassay or a rapid diagnostic test (RDT) [5]. For many LMICs, where equipped laboratories and trained staff are limited, RDTs may be most appropriate, as they are quick and easy to perform without the need for labo-ratory equipment. RDTs have proved effective in other disease areas; for example, the wide availability of low-cost RDTs for the diagnosis of human immunodeficiency virus (HIV) has substantially increased access to testing, resulting in more than 600 million people being tested for HIV in LMICs from 2010 to 2014 [6].
The lack of quality-assured RDTs for HCV serology testing has been identified as an important barrier to large-scale ac-cess to HCV diagnosis [2]. While a number of HCV RDTs are commercially available, many do not have quality assurance status (eg, stringent regulatory authority approval or WHO
applyparastyle “fig//caption/p[1]” parastyle “FigCapt”
Dow
nloaded from https://academ
ic.oup.com/jid/advance-article/doi/10.1093/infdis/jiaa389/5866494 by C
enters for Disease C
ontrol and Prevention user on 04 May 2021
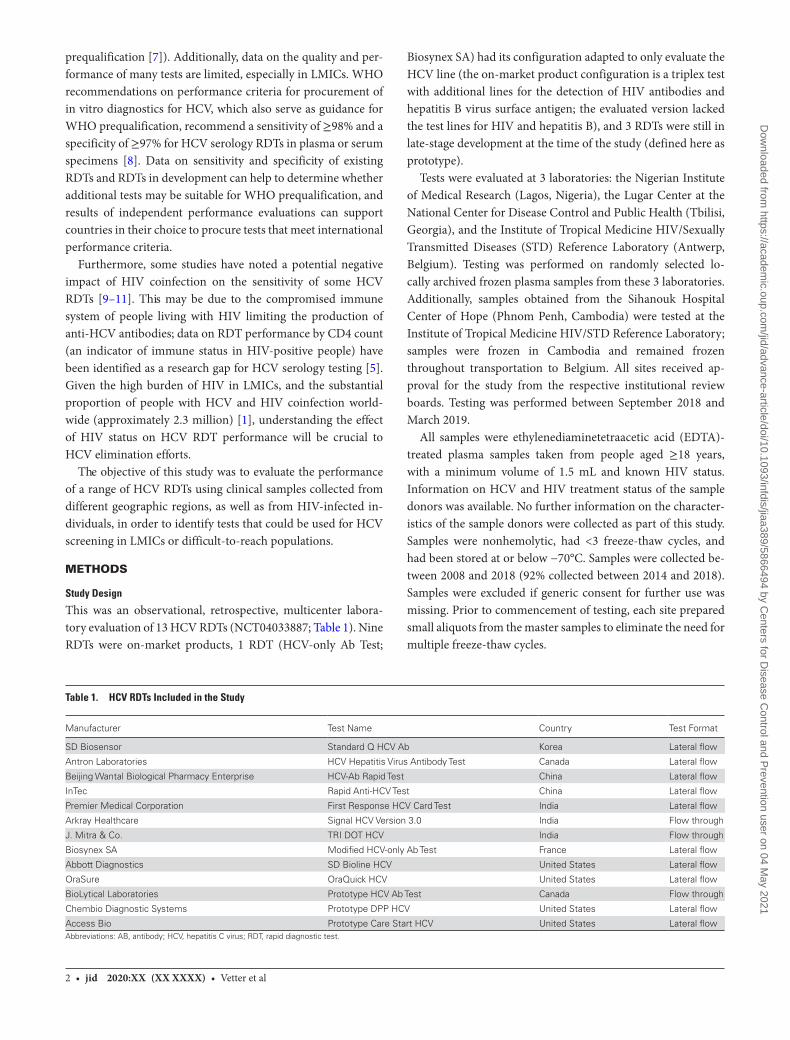
2 • jid 2020:XX (XX XXXX) • Vetter et al
prequalification [7]). Additionally, data on the quality and per-formance of many tests are limited, especially in LMICs. WHO recommendations on performance criteria for procurement of in vitro diagnostics for HCV, which also serve as guidance for WHO prequalification, recommend a sensitivity of ≥98% and a specificity of ≥97% for HCV serology RDTs in plasma or serum specimens [8]. Data on sensitivity and specificity of existing RDTs and RDTs in development can help to determine whether additional tests may be suitable for WHO prequalification, and results of independent performance evaluations can support countries in their choice to procure tests that meet international performance criteria.
Furthermore, some studies have noted a potential negative impact of HIV coinfection on the sensitivity of some HCV RDTs [9–11]. This may be due to the compromised immune system of people living with HIV limiting the production of anti-HCV antibodies; data on RDT performance by CD4 count (an indicator of immune status in HIV-positive people) have been identified as a research gap for HCV serology testing [5]. Given the high burden of HIV in LMICs, and the substantial proportion of people with HCV and HIV coinfection world-wide (approximately 2.3 million) [1], understanding the effect of HIV status on HCV RDT performance will be crucial to HCV elimination efforts.
The objective of this study was to evaluate the performance of a range of HCV RDTs using clinical samples collected from different geographic regions, as well as from HIV-infected in-dividuals, in order to identify tests that could be used for HCV screening in LMICs or difficult-to-reach populations.
METHODS
Study Design
This was an observational, retrospective, multicenter labora-tory evaluation of 13 HCV RDTs (NCT04033887; Table 1). Nine RDTs were on-market products, 1 RDT (HCV-only Ab Test;
Biosynex SA) had its configuration adapted to only evaluate the HCV line (the on-market product configuration is a triplex test with additional lines for the detection of HIV antibodies and hepatitis B virus surface antigen; the evaluated version lacked the test lines for HIV and hepatitis B), and 3 RDTs were still in late-stage development at the time of the study (defined here as prototype).
Tests were evaluated at 3 laboratories: the Nigerian Institute of Medical Research (Lagos, Nigeria), the Lugar Center at the National Center for Disease Control and Public Health (Tbilisi, Georgia), and the Institute of Tropical Medicine HIV/Sexually Transmitted Diseases (STD) Reference Laboratory (Antwerp, Belgium). Testing was performed on randomly selected lo-cally archived frozen plasma samples from these 3 laboratories. Additionally, samples obtained from the Sihanouk Hospital Center of Hope (Phnom Penh, Cambodia) were tested at the Institute of Tropical Medicine HIV/STD Reference Laboratory; samples were frozen in Cambodia and remained frozen throughout transportation to Belgium. All sites received ap-proval for the study from the respective institutional review boards. Testing was performed between September 2018 and March 2019.
All samples were ethylenediaminetetraacetic acid (EDTA)-treated plasma samples taken from people aged ≥18 years, with a minimum volume of 1.5 mL and known HIV status. Information on HCV and HIV treatment status of the sample donors was available. No further information on the character-istics of the sample donors were collected as part of this study. Samples were nonhemolytic, had <3 freeze-thaw cycles, and had been stored at or below −70°C. Samples were collected be-tween 2008 and 2018 (92% collected between 2014 and 2018). Samples were excluded if generic consent for further use was missing. Prior to commencement of testing, each site prepared small aliquots from the master samples to eliminate the need for multiple freeze-thaw cycles.
Table 1. HCV RDTs Included in the Study
Manufacturer Test Name Country Test Format
SD Biosensor Standard Q HCV Ab Korea Lateral flow
Antron Laboratories HCV Hepatitis Virus Antibody Test Canada Lateral flow
Beijing Wantal Biological Pharmacy Enterprise HCV-Ab Rapid Test China Lateral flow
InTec Rapid Anti-HCV Test China Lateral flow
Premier Medical Corporation First Response HCV Card Test India Lateral flow
Arkray Healthcare Signal HCV Version 3.0 India Flow through
J. Mitra & Co. TRI DOT HCV India Flow through
Biosynex SA Modified HCV-only Ab Test France Lateral flow
Abbott Diagnostics SD Bioline HCV United States Lateral flow
OraSure OraQuick HCV United States Lateral flow
BioLytical Laboratories Prototype HCV Ab Test Canada Flow through
Chembio Diagnostic Systems Prototype DPP HCV United States Lateral flow
Access Bio Prototype Care Start HCV United States Lateral flowAbbreviations: AB, antibody; HCV, hepatitis C virus; RDT, rapid diagnostic test.
Dow
nloaded from https://academ
ic.oup.com/jid/advance-article/doi/10.1093/infdis/jiaa389/5866494 by C
enters for Disease C
ontrol and Prevention user on 04 May 2021
RDTs for HCV Antibody Detection • jid 2020:XX (XX XXXX) • 3
HCV antibody status was determined using 3 reference tests, of which 2 were WHO prequalification approved en-zyme immunoassays (EIA; Murex Anti-HCV version 4.0, DiaSorin S.A., and INNOTEST HCV Ab IV, Fujirebio Europe) and 1 was a line immunoassay (LIA; MP Diagnostics HCV blot 3.0, MP Biomedicals). A signal to cutoff ratio of ≥1 (based on the measured optical density) was used for the EIAs; interpretation of LIA results was performed ac-cording to manufacturer instructions. HCV antibody status of each sample was determined according to a composite algorithm incorporating the results of all 3 reference tests (Supplementary Table 1). A similar algorithm has previously been used in WHO prequalification evaluation protocols, al-though the WHO algorithm does not require LIA confirma-tion for samples testing negative on both EIAs [12].
Outcomes
The primary outcomes were point estimates of sensitivity and specificity with 95% confidence intervals of the 13 HCV RDTs in HIV-infected and -uninfected samples. Secondary outcomes included sensitivity and specificity of the 13 RDTs in the overall population (regardless of HIV status), interreader variability, lot-to-lot variability, and the rate of invalid runs. Exploratory outcomes included point estimates of sensitivity and specificity with 95% confidence intervals of the 13 RDTs in HIV-infected and -uninfected samples with active HCV infection measured by the presence of detectable HCV viral load (VL) or core an-tigen (cAg) in the sample. Analysis of test performance by CD4 count range (<200 cells/mm3 [severely immunocompromised], 200–500 cells/mm3 [immunocompromised], or >500 cells/mm3 [not immunocompromised]) in HIV-infected samples and by HCV genotype in HIV-uninfected and -infected samples was also performed.
RDT Performance Assessments
Each sample was tested on 2 independently produced lots of each RDT and each result was read and recorded by 3 inde-pendent readers. RDT results were interpreted according to the manufacturer’s instructions. Samples were scored as either pos-itive (reactive), negative (nonreactive), or invalid on each RDT based on the concordance of at least 2 out of 3 reader results. For all samples that were scored invalid, a repeat test was per-formed once on the same lot.
Operators/readers of the RDTs were blinded to the results of the reference standard tests. The sequence in which samples were tested was varied for each RDT to avoid bias related to recognition patterns. Operators and reader sequences were also varied.
Statistical Analyses
For an average sensitivity of 85% and specificity of 80%, a min-imum sample size of 400 for sensitivity analyses and 502 for specificity analyses was required to obtain point estimates with
a precision of ± 5% and power of 80% to obtain a confidence interval with total width of 10% or less [13].
Point estimates were obtained, with 95% confidence intervals based on Wilson score method, for sensitivity and specificity. Interreader variability was assessed by Fleiss kappa coefficient (κ) (agreement was defined as concordance between 2/3 or 3/3 results for each RDT). Lot-to-lot variability was evaluated by as-sessing performance in each lot using final valid RDT outcomes (excluding repeatedly invalid results), and the rate of invalid runs was calculated as the ratio between runs marked as invalid and the total number.
RESULTS
Sample Characteristics
Of 1864 samples selected, 1710 met inclusion criteria. In total, 648 samples were HCV antibody positive, of which 264 were also HIV positive. Of the 852 HCV antibody-negative sam-ples, 626 were HIV positive and 226 were HIV negative. Two hundred and ten samples had indeterminate HCV status due to discrepancies between EIA and LIA results or indeterminate LIA results and were excluded from further analyses as per the composite reference standard algorithm (Figure 1). Although the sample size was not as large as was estimated to be required based on the previously stated test performance assumptions, based on the average test performance observed in this study, the sample size allowed for ≥ 80% power with a precision of ± 5 in all subgroups (Supplementary Table 2).
The numbers of samples with genotype, CD4, count and HCV VL/cAg availability, and the country of sample origin for each sample type, are shown in Table 2. The majority of geno-typed samples were of HCV genotype 1, 1a, or 1b (63.2% of HIV-uninfected and 54.2% of HIV-infected samples), followed by genotype 3 in HIV-uninfected samples (31.6%) and geno-type 6 in HIV-infected samples (22.9%). The majority of HIV-positive samples had CD4 counts greater than 200 cells/mm3 (>93%). The majority (89%) of HCV-infected and HIV-infected samples were from patients receiving treatment for HIV at the time of sample collection (HIV treatment status was known for 256 of 264 HCV-positive and HIV-positive samples). None of the samples from Nigeria, Cambodia, or Georgia were from people receiving treatment for HCV; of the Belgian samples, 107 were from people who had never received treatment for HCV, 10 were from people who were on active interferon treat-ment, 7 were from people who had previously received inter-feron treatment, and 2 had no treatment information available.
Sensitivity and Specificity
In the samples from HIV-uninfected patients, most RDTs showed high sensitivity, with the majority reaching ≥98% in 1 or both lots (Figure 2A and Table 3). The large majority of tests showed a specificity of ≥99% and several reached 100% (Figure 2B and Table 3). In HIV-infected samples, sensitivity
Dow
nloaded from https://academ
ic.oup.com/jid/advance-article/doi/10.1093/infdis/jiaa389/5866494 by C
enters for Disease C
ontrol and Prevention user on 04 May 2021
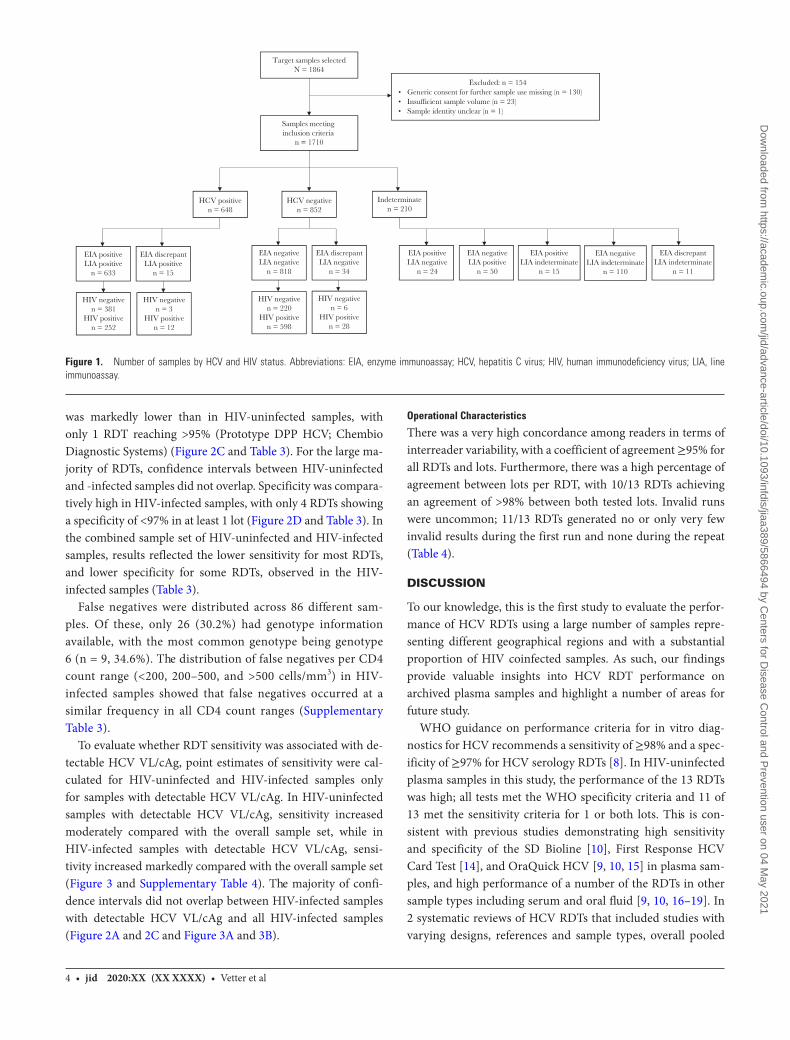
4 • jid 2020:XX (XX XXXX) • Vetter et al
was markedly lower than in HIV-uninfected samples, with only 1 RDT reaching >95% (Prototype DPP HCV; Chembio Diagnostic Systems) (Figure 2C and Table 3). For the large ma-jority of RDTs, confidence intervals between HIV-uninfected and -infected samples did not overlap. Specificity was compara-tively high in HIV-infected samples, with only 4 RDTs showing a specificity of <97% in at least 1 lot (Figure 2D and Table 3). In the combined sample set of HIV-uninfected and HIV-infected samples, results reflected the lower sensitivity for most RDTs, and lower specificity for some RDTs, observed in the HIV-infected samples (Table 3).
False negatives were distributed across 86 different sam-ples. Of these, only 26 (30.2%) had genotype information available, with the most common genotype being genotype 6 (n = 9, 34.6%). The distribution of false negatives per CD4 count range (<200, 200–500, and >500 cells/mm3) in HIV-infected samples showed that false negatives occurred at a similar frequency in all CD4 count ranges (Supplementary Table 3).
To evaluate whether RDT sensitivity was associated with de-tectable HCV VL/cAg, point estimates of sensitivity were cal-culated for HIV-uninfected and HIV-infected samples only for samples with detectable HCV VL/cAg. In HIV-uninfected samples with detectable HCV VL/cAg, sensitivity increased moderately compared with the overall sample set, while in HIV-infected samples with detectable HCV VL/cAg, sensi-tivity increased markedly compared with the overall sample set (Figure 3 and Supplementary Table 4). The majority of confi-dence intervals did not overlap between HIV-infected samples with detectable HCV VL/cAg and all HIV-infected samples (Figure 2A and 2C and Figure 3A and 3B).
Operational Characteristics
There was a very high concordance among readers in terms of interreader variability, with a coefficient of agreement ≥95% for all RDTs and lots. Furthermore, there was a high percentage of agreement between lots per RDT, with 10/13 RDTs achieving an agreement of >98% between both tested lots. Invalid runs were uncommon; 11/13 RDTs generated no or only very few invalid results during the first run and none during the repeat (Table 4).
DISCUSSION
To our knowledge, this is the first study to evaluate the perfor-mance of HCV RDTs using a large number of samples repre-senting different geographical regions and with a substantial proportion of HIV coinfected samples. As such, our findings provide valuable insights into HCV RDT performance on archived plasma samples and highlight a number of areas for future study.
WHO guidance on performance criteria for in vitro diag-nostics for HCV recommends a sensitivity of ≥98% and a spec-ificity of ≥97% for HCV serology RDTs [8]. In HIV-uninfected plasma samples in this study, the performance of the 13 RDTs was high; all tests met the WHO specificity criteria and 11 of 13 met the sensitivity criteria for 1 or both lots. This is con-sistent with previous studies demonstrating high sensitivity and specificity of the SD Bioline [10], First Response HCV Card Test [14], and OraQuick HCV [9, 10, 15] in plasma sam-ples, and high performance of a number of the RDTs in other sample types including serum and oral fluid [9, 10, 16–19]. In 2 systematic reviews of HCV RDTs that included studies with varying designs, references and sample types, overall pooled
EIA discrepantLIA indeterminate
n = 11
EIA negativeLIA indeterminate
n = 110
EIA positiveLIA indeterminate
n = 15
Target samples selectedN = 1864
Samples meeting inclusion criteria
n = 1710
HCV positiven = 648
Indeterminaten = 210
HCV negativen = 852
Excluded: n = 154• Generic consent for further sample use missing (n = 130)• Insu�cient sample volume (n = 23)• Sample identity unclear (n = 1)
EIA positiveLIA positive
n = 633
EIA discrepantLIA positive
n = 15
EIA negativeLIA negative
n = 818
EIA discrepantLIA negative
n = 34
EIA positiveLIA negative
n = 24
EIA negativeLIA positive
n = 50
HIV negativen = 381
HIV positiven = 252
HIV negativen = 3
HIV positiven = 12
HIV negativen = 220
HIV positiven = 598
HIV negativen = 6
HIV positiven = 28
Figure 1. Number of samples by HCV and HIV status. Abbreviations: EIA, enzyme immunoassay; HCV, hepatitis C virus; HIV, human immunodeficiency virus; LIA, line immunoassay.
Dow
nloaded from https://academ
ic.oup.com/jid/advance-article/doi/10.1093/infdis/jiaa389/5866494 by C
enters for Disease C
ontrol and Prevention user on 04 May 2021
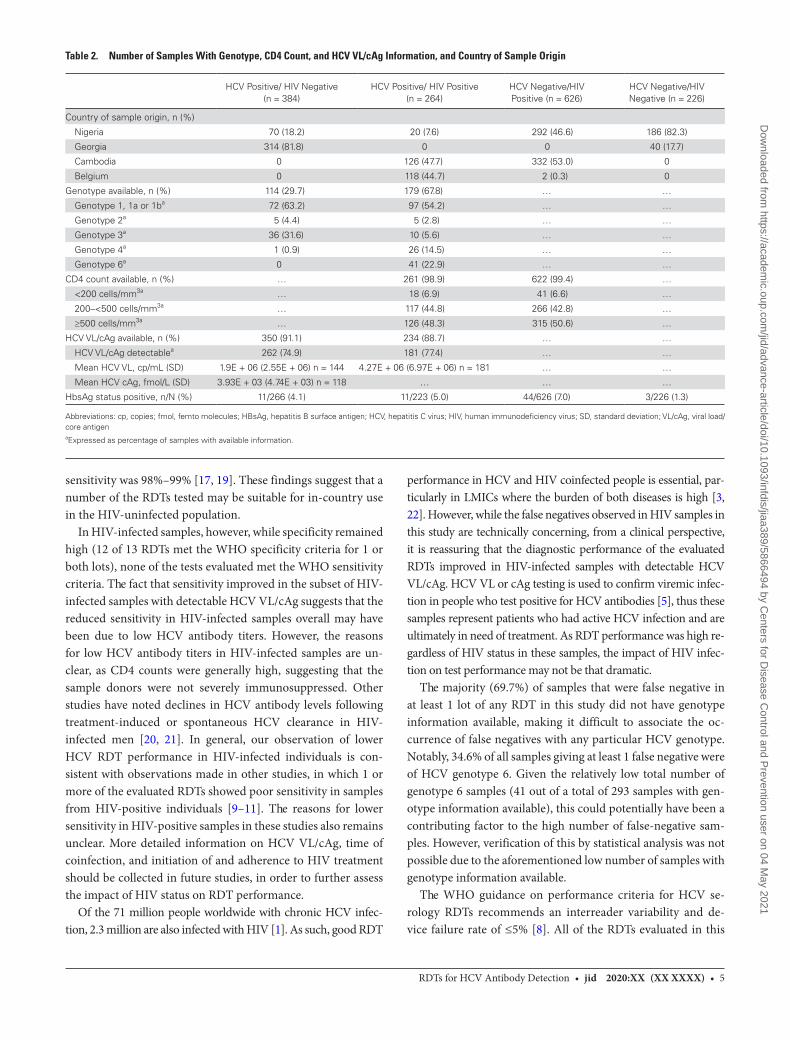
RDTs for HCV Antibody Detection • jid 2020:XX (XX XXXX) • 5
sensitivity was 98%–99% [17, 19]. These findings suggest that a number of the RDTs tested may be suitable for in-country use in the HIV-uninfected population.
In HIV-infected samples, however, while specificity remained high (12 of 13 RDTs met the WHO specificity criteria for 1 or both lots), none of the tests evaluated met the WHO sensitivity criteria. The fact that sensitivity improved in the subset of HIV-infected samples with detectable HCV VL/cAg suggests that the reduced sensitivity in HIV-infected samples overall may have been due to low HCV antibody titers. However, the reasons for low HCV antibody titers in HIV-infected samples are un-clear, as CD4 counts were generally high, suggesting that the sample donors were not severely immunosuppressed. Other studies have noted declines in HCV antibody levels following treatment-induced or spontaneous HCV clearance in HIV-infected men [20, 21]. In general, our observation of lower HCV RDT performance in HIV-infected individuals is con-sistent with observations made in other studies, in which 1 or more of the evaluated RDTs showed poor sensitivity in samples from HIV-positive individuals [9–11]. The reasons for lower sensitivity in HIV-positive samples in these studies also remains unclear. More detailed information on HCV VL/cAg, time of coinfection, and initiation of and adherence to HIV treatment should be collected in future studies, in order to further assess the impact of HIV status on RDT performance.
Of the 71 million people worldwide with chronic HCV infec-tion, 2.3 million are also infected with HIV [1]. As such, good RDT
performance in HCV and HIV coinfected people is essential, par-ticularly in LMICs where the burden of both diseases is high [3, 22]. However, while the false negatives observed in HIV samples in this study are technically concerning, from a clinical perspective, it is reassuring that the diagnostic performance of the evaluated RDTs improved in HIV-infected samples with detectable HCV VL/cAg. HCV VL or cAg testing is used to confirm viremic infec-tion in people who test positive for HCV antibodies [5], thus these samples represent patients who had active HCV infection and are ultimately in need of treatment. As RDT performance was high re-gardless of HIV status in these samples, the impact of HIV infec-tion on test performance may not be that dramatic.
The majority (69.7%) of samples that were false negative in at least 1 lot of any RDT in this study did not have genotype information available, making it difficult to associate the oc-currence of false negatives with any particular HCV genotype. Notably, 34.6% of all samples giving at least 1 false negative were of HCV genotype 6. Given the relatively low total number of genotype 6 samples (41 out of a total of 293 samples with gen-otype information available), this could potentially have been a contributing factor to the high number of false-negative sam-ples. However, verification of this by statistical analysis was not possible due to the aforementioned low number of samples with genotype information available.
The WHO guidance on performance criteria for HCV se-rology RDTs recommends an interreader variability and de-vice failure rate of ≤5% [8]. All of the RDTs evaluated in this
Table 2. Number of Samples With Genotype, CD4 Count, and HCV VL/cAg Information, and Country of Sample Origin
HCV Positive/ HIV Negative (n = 384)
HCV Positive/ HIV Positive (n = 264)
HCV Negative/HIV Positive (n = 626)
HCV Negative/HIV Negative (n = 226)
Country of sample origin, n (%)
Nigeria 70 (18.2) 20 (7.6) 292 (46.6) 186 (82.3)
Georgia 314 (81.8) 0 0 40 (17.7)
Cambodia 0 126 (47.7) 332 (53.0) 0
Belgium 0 118 (44.7) 2 (0.3) 0
Genotype available, n (%) 114 (29.7) 179 (67.8) … …
Genotype 1, 1a or 1ba 72 (63.2) 97 (54.2) … …
Genotype 2a 5 (4.4) 5 (2.8) … …
Genotype 3a 36 (31.6) 10 (5.6) … …
Genotype 4a 1 (0.9) 26 (14.5) … …
Genotype 6a 0 41 (22.9) … …
CD4 count available, n (%) … 261 (98.9) 622 (99.4) …
<200 cells/mm3a … 18 (6.9) 41 (6.6) …
200–<500 cells/mm3a … 117 (44.8) 266 (42.8) …
≥500 cells/mm3a … 126 (48.3) 315 (50.6) …
HCV VL/cAg available, n (%) 350 (91.1) 234 (88.7) … …
HCV VL/cAg detectablea 262 (74.9) 181 (77.4) … …
Mean HCV VL, cp/mL (SD) 1.9E + 06 (2.55E + 06) n = 144 4.27E + 06 (6.97E + 06) n = 181 … …
Mean HCV cAg, fmol/L (SD) 3.93E + 03 (4.74E + 03) n = 118 … … …
HbsAg status positive, n/N (%) 11/266 (4.1) 11/223 (5.0) 44/626 (7.0) 3/226 (1.3)
Abbreviations: cp, copies; fmol, femto molecules; HBsAg, hepatitis B surface antigen; HCV, hepatitis C virus; HIV, human immunodeficiency virus; SD, standard deviation; VL/cAg, viral load/core antigenaExpressed as percentage of samples with available information.
Dow
nloaded from https://academ
ic.oup.com/jid/advance-article/doi/10.1093/infdis/jiaa389/5866494 by C
enters for Disease C
ontrol and Prevention user on 04 May 2021
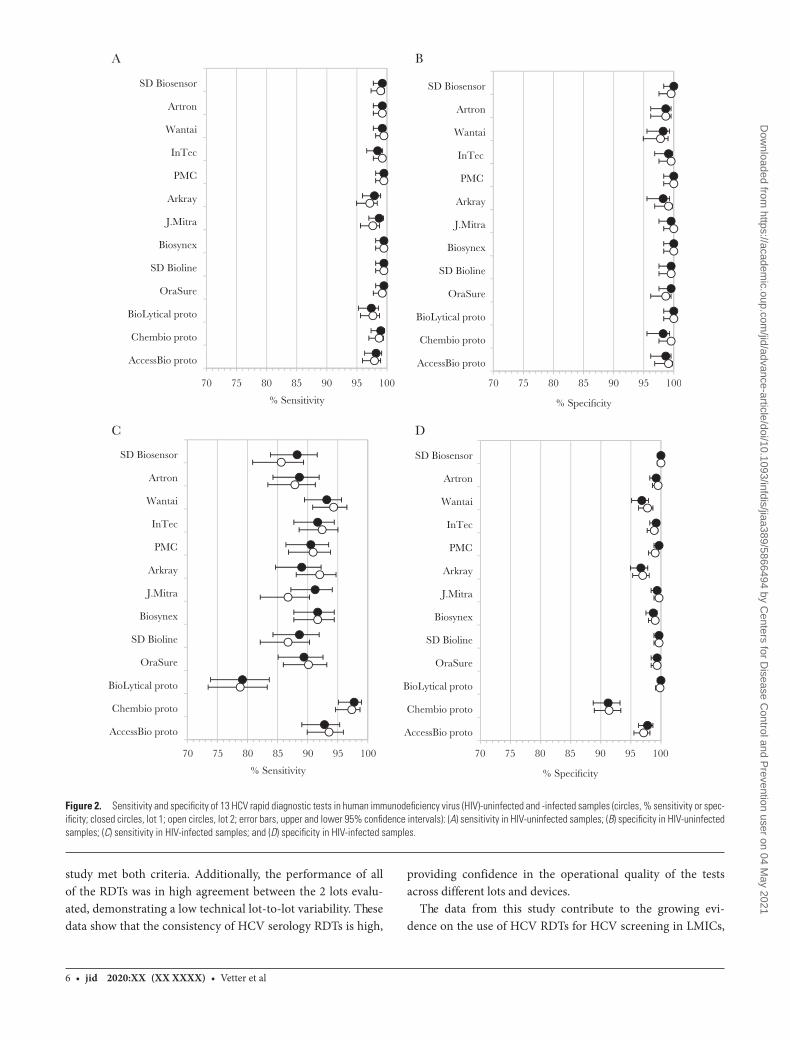
6 • jid 2020:XX (XX XXXX) • Vetter et al
study met both criteria. Additionally, the performance of all of the RDTs was in high agreement between the 2 lots evalu-ated, demonstrating a low technical lot-to-lot variability. These data show that the consistency of HCV serology RDTs is high,
providing confidence in the operational quality of the tests across different lots and devices.
The data from this study contribute to the growing evi-dence on the use of HCV RDTs for HCV screening in LMICs,
A
70 75 80 85 90 95 100 70 75 80 85 90 95 100
SD Biosensor
Artron
Wantai
InTec
PMC
Arkray
J.Mitra
Biosynex
SD Bioline
OraSure
BioLytical proto
Chembio proto
AccessBio proto
% Sensitivity
SD Biosensor
Artron
Wantai
InTec
PMC
Arkray
J.Mitra
Biosynex
SD Bioline
OraSure
BioLytical proto
Chembio proto
AccessBio proto
% Specificity
70 75 80 85 90 95 100 70 75 80 85 90 95 100
% Sensitivity % Specificity
B
SD Biosensor
Artron
Wantai
InTec
PMC
Arkray
J.Mitra
Biosynex
SD Bioline
OraSure
BioLytical proto
Chembio proto
AccessBio proto
C
SD Biosensor
Artron
Wantai
InTec
PMC
Arkray
J.Mitra
Biosynex
SD Bioline
OraSure
BioLytical proto
Chembio proto
AccessBio proto
D
Figure 2. Sensitivity and specificity of 13 HCV rapid diagnostic tests in human immunodeficiency virus (HIV)-uninfected and -infected samples (circles, % sensitivity or spec-ificity; closed circles, lot 1; open circles, lot 2; error bars, upper and lower 95% confidence intervals): (A) sensitivity in HIV-uninfected samples; (B) specificity in HIV-uninfected samples; (C) sensitivity in HIV-infected samples; and (D) specificity in HIV-infected samples.
Dow
nloaded from https://academ
ic.oup.com/jid/advance-article/doi/10.1093/infdis/jiaa389/5866494 by C
enters for Disease C
ontrol and Prevention user on 04 May 2021
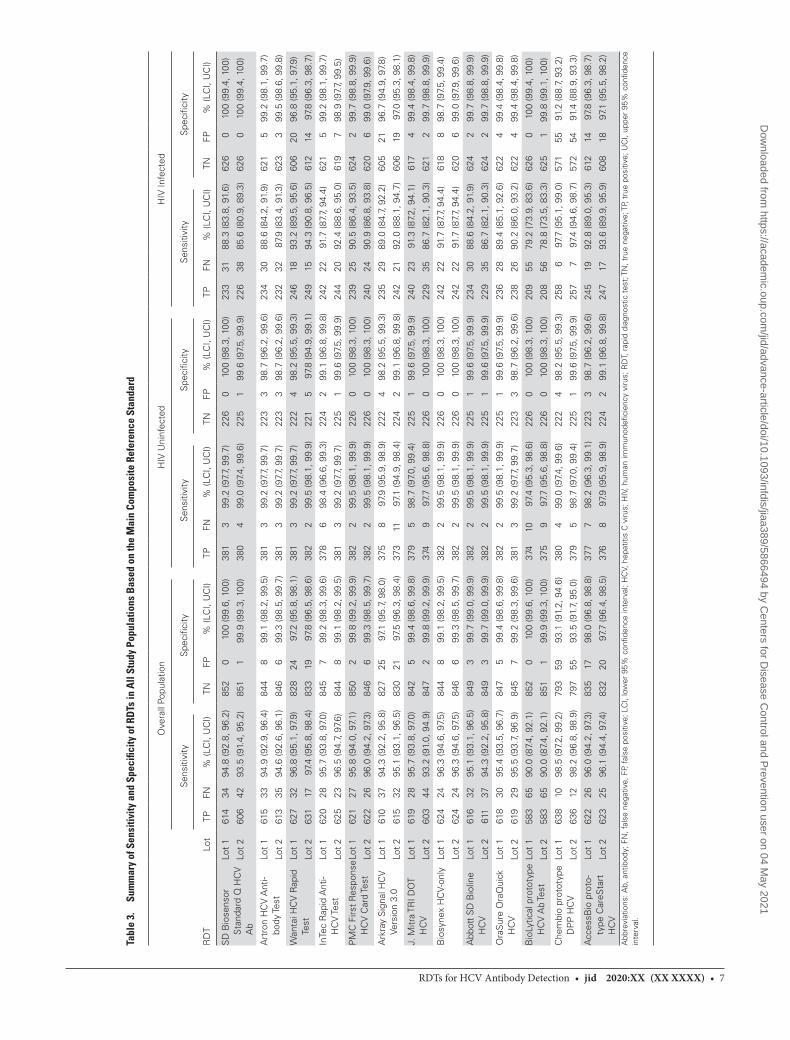
RDTs for HCV Antibody Detection • jid 2020:XX (XX XXXX) • 7
Tabl
e 3.
Su
mm
ary
of S
ensi
tivity
and
Spe
cific
ity o
f RD
Ts in
All
Stud
y Po
pula
tions
Bas
ed o
n th
e M
ain
Com
posi
te R
efer
ence
Sta
ndar
d
Ove
rall
Popu
latio
nH
IV U
ninf
ecte
dH
IV In
fect
ed
Sen
sitiv
ityS
peci
ficity
Sen
sitiv
ityS
peci
ficity
Sen
sitiv
ityS
peci
ficity
RD
TLo
tTP
FN%
(LC
I, U
CI)
TNFP
% (L
CI,
UC
I)TP
FN%
(LC
I, U
CI)
TNFP
% (L
CI,
UC
I)TP
FN%
(LC
I, U
CI)
TNFP
% (L
CI,
UC
I)
SD
Bio
sens
or
Sta
ndar
d Q
HC
V
Ab
Lot
161
434
94.8
(92.
8, 9
6.2)
852
010
0 (9
9.6,
100
)38
13
99.2
(97.
7, 9
9.7)
226
010
0 (9
8.3,
100
)23
331
88.3
(83.
8, 9
1.6)
626
010
0 (9
9.4,
100
)
Lot
260
642
93.5
(91.
4, 9
5.2)
851
199
.9 (9
9.3,
100
)38
04
99.0
(97.
4, 9
9.6)
225
199
.6 (9
7.5,
99.
9)22
638
85.6
(80.
9, 8
9.3)
626
010
0 (9
9.4,
100
)
Art
ron
HC
V A
nti-
body
Test
Lot
161
533
94.9
(92.
9, 9
6.4)
844
899
.1 (9
8.2,
99.
5)38
13
99.2
(97.
7, 9
9.7)
223
398
.7 (9
6.2,
99.
6)23
430
88.6
(84.
2, 9
1.9)
621
599
.2 (9
8.1,
99.
7)
Lot
261
335
94.6
(92.
6, 9
6.1)
846
699
.3 (9
8.5,
99.
7)38
13
99.2
(97.
7, 9
9.7)
223
398
.7 (9
6.2,
99.
6)23
232
87.9
(83.
4, 9
1.3)
623
399
.5 (9
8.6,
99.
8)
Wan
tai H
CV
Rap
id
Test
Lot
162
732
96.8
(95.
1, 9
7.9)
828
2497
.2 (9
5.8,
98.
1)38
13
99.2
(97.
7, 9
9.7)
222
498
.2 (9
5.5,
99.
3)24
618
93.2
(89.
5, 9
5.6)
606
2096
.8 (9
5.1,
97.
9)
Lot
263
117
97.4
(95.
8, 9
8.4)
833
1997
.8 (9
6.5,
98.
6)38
22
99.5
(98.
1, 9
9.9)
221
597
.8 (9
4.9,
99.
1)24
915
94.3
(90.
8, 9
6.5)
612
1497
.8 (9
6.3,
98.
7)
InTe
c R
apid
Ant
i- H
CV
Test
Lot
162
028
95.7
(93.
8, 9
7.0)
845
799
.2 (9
8.3,
99.
6)37
86
98.4
(96.
6, 9
9.3)
224
299
.1 (9
6.8,
99.
8)24
222
91.7
(87.
7, 9
4.4)
621
599
.2 (9
8.1,
99.
7)
Lot
262
523
96.5
(94.
7, 9
7.6)
844
899
.1 (9
8.2,
99.
5)38
13
99.2
(97.
7, 9
9.7)
225
199
.6 (9
7.5,
99.
9)24
420
92.4
(88.
6, 9
5.0)
619
798
.9 (9
7.7,
99.
5)
PM
C F
irst
Res
pons
e H
CV
Car
d Te
stLo
t 1
621
2795
.8 (9
4.0,
97.
1)85
02
99.8
(99.
2, 9
9.9)
382
299
.5 (9
8.1,
99.
9)22
60
100
(98.
3, 1
00)
239
2590
.5 (8
6.4,
93.
5)62
42
99.7
(98.
8, 9
9.9)
Lot
262
226
96.0
(94.
2, 9
7.3)
846
699
.3 (9
8.5,
99.
7)38
22
99.5
(98.
1, 9
9.9)
226
010
0 (9
8.3,
100
)24
024
90.9
(86.
8, 9
3.8)
620
699
.0 (9
7.9,
99.
6)
Ark
ray
Sig
nal H
CV
Ve
rsio
n 3.
0Lo
t 1
610
3794
.3 (9
2.2,
95.
8)82
725
97.1
(95.
7, 9
8.0)
375
897
.9 (9
5.9,
98.
9)22
24
98.2
(95.
5, 9
9.3)
235
2989
.0 (8
4.7,
92.
2)60
521
96.7
(94.
9, 9
7.8)
Lot
261
532
95.1
(93.
1, 9
6.5)
830
2197
.5 (9
6.3,
98.
4)37
311
97.1
(94.
9, 9
8.4)
224
299
.1 (9
6.8,
99.
8)24
221
92.0
(88.
1, 9
4.7)
606
1997
.0 (9
5.3,
98.
1)
J. M
itra
TRI D
OT
HC
VLo
t 1
619
2895
.7 (9
3.8,
97.
0)84
25
99.4
(98.
6, 9
9.8)
379
598
.7 (9
7.0,
99.
4)22
51
99.6
(97.
5, 9
9.9)
240
2391
.3 (8
7.2,
94.
1)61
74
99.4
(98.
4, 9
9.8)
Lot
260
344
93.2
(91.
0, 9
4.9)
847
299
.8 (9
9.2,
99.
9)37
49
97.7
(95.
6, 9
8.8)
226
010
0 (9
8.3,
100
)22
935
86.7
(82.
1, 9
0.3)
621
299
.7 (9
8.8,
99.
9)
Bio
syne
x H
CV-
only
Lot
162
424
96.3
(94.
6, 9
7.5)
844
899
.1 (9
8.2,
99.
5)38
22
99.5
(98.
1, 9
9.9)
226
010
0 (9
8.3,
100
)24
222
91.7
(87.
7, 9
4.4)
618
898
.7 (9
7.5,
99.
4)
Lot
262
424
96.3
(94.
6, 9
7.5)
846
699
.3 (9
8.5,
99.
7)38
22
99.5
(98.
1, 9
9.9)
226
010
0 (9
8.3,
100
)24
222
91.7
(87.
7, 9
4.4)
620
699
.0 (9
7.9,
99.
6)
Abb
ott
SD
Bio
line
HC
VLo
t 1
616
3295
.1 (9
3.1,
96.
5)84
93
99.7
(99.
0, 9
9.9)
382
299
.5 (9
8.1,
99.
9)22
51
99.6
(97.
5, 9
9.9)
234
3088
.6 (8
4.2,
91.
9)62
42
99.7
(98.
8, 9
9.9)
Lot
261
137
94.3
(92.
2, 9
5.8)
849
399
.7 (9
9.0,
99.
9)38
22
99.5
(98.
1, 9
9.9)
225
199
.6 (9
7.5,
99.
9)22
935
86.7
(82.
1, 9
0.3)
624
299
.7 (9
8.8,
99.
9)
Ora
Sur
e O
raQ
uick
H
CV
Lot
161
830
95.4
(93.
5, 9
6.7)
847
599
.4 (9
8.6,
99.
8)38
22
99.5
(98.
1, 9
9.9)
225
199
.6 (9
7.5,
99.
9)23
628
89.4
(85.
1, 9
2.6)
622
499
.4 (9
8.4,
99.
8)
Lot
261
929
95.5
(93.
7, 9
6.9)
845
799
.2 (9
8.3,
99.
6)38
13
99.2
(97.
7, 9
9.7)
223
398
.7 (9
6.2,
99.
6)23
826
90.2
(86.
0, 9
3.2)
622
499
.4 (9
8.4,
99.
8)
Bio
Lytic
al p
roto
type
H
CV
Ab
Test
Lot
158
365
90.0
(87.
4, 9
2.1)
852
010
0 (9
9.6,
100
)37
410
97.4
(95.
3, 9
8.6)
226
010
0 (9
8.3,
100
)20
955
79.2
(73.
9, 8
3.6)
626
010
0 (9
9.4,
100
)
Lot
258
365
90.0
(87.
4, 9
2.1)
851
199
.9 (9
9.3,
100
)37
59
97.7
(95.
6, 9
8.8)
226
010
0 (9
8.3,
100
)20
856
78.8
(73.
5, 8
3.3)
625
199
.8 (9
9.1,
100
)
Che
mbi
o pr
otot
ype
DP
P H
CV
Lot
163
810
98.5
(97.
2, 9
9.2)
793
5993
.1 (9
1.2,
94.
6)38
04
99.0
(97.
4, 9
9.6)
222
498
.2 (9
5.5,
99.
3)25
86
97.7
(95.
1, 9
9.0)
571
5591
.2 (8
8.7,
93.
2)
Lot
263
612
98.2
(96.
8, 9
8.9)
797
5593
.5 (9
1.7,
95.
0)37
95
98.7
(97.
0, 9
9.4)
225
199
.6 (9
7.5,
99.
9)25
77
97.4
(94.
6, 9
8.7)
572
5491
.4 (8
8.9,
93.
3)
Acc
essB
io p
roto
-ty
pe C
areS
tart
H
CV
Lot
162
226
96.0
(94.
2, 9
7.3)
835
1798
.0 (9
6.8,
98.
8)37
77
98.2
(96.
3, 9
9.1)
223
398
.7 (9
6.2,
99.
6)24
519
92.8
(89.
0, 9
5.3)
612
1497
.8 (9
6.3,
98.
7)
Lot
262
325
96.1
(94.
4, 9
7.4)
832
2097
.7 (9
6.4,
98.
5)37
68
97.9
(95.
9, 9
8.9)
224
299
.1 (9
6.8,
99.
8)24
717
93.6
(89.
9, 9
5.9)
608
1897
.1 (9
5.5,
98.
2)
Abb
revi
atio
ns: A
b, a
ntib
ody;
FN
, fal
se n
egat
ive,
FP,
fal
se p
ositi
ve; L
CI,
low
er 9
5% c
onfid
ence
inte
rval
; HC
V, h
epat
itis
C v
irus;
HIV
, hum
an im
mun
odefi
cien
cy v
irus;
RD
T, r
apid
dia
gnos
tic t
est;
TN
, tru
e ne
gativ
e; T
P, t
rue
posi
tive;
UC
I, up
per
95%
con
fiden
ce
inte
rval
.
Dow
nloaded from https://academ
ic.oup.com/jid/advance-article/doi/10.1093/infdis/jiaa389/5866494 by C
enters for Disease C
ontrol and Prevention user on 04 May 2021
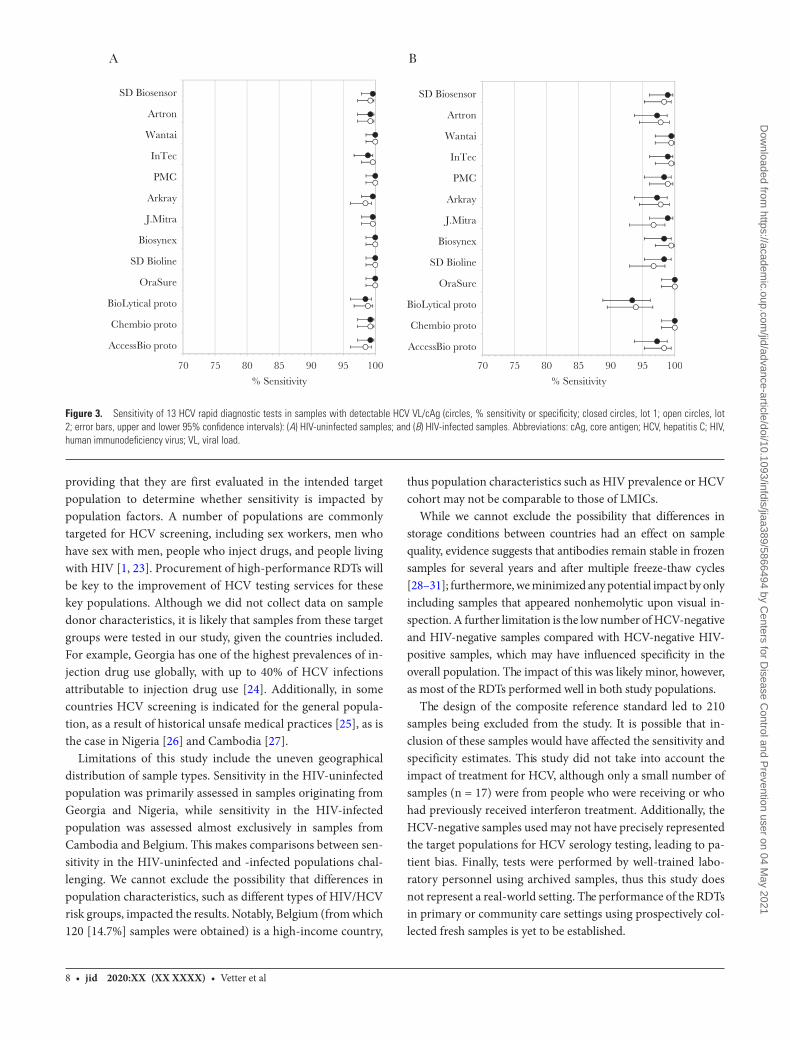
8 • jid 2020:XX (XX XXXX) • Vetter et al
providing that they are first evaluated in the intended target population to determine whether sensitivity is impacted by population factors. A number of populations are commonly targeted for HCV screening, including sex workers, men who have sex with men, people who inject drugs, and people living with HIV [1, 23]. Procurement of high-performance RDTs will be key to the improvement of HCV testing services for these key populations. Although we did not collect data on sample donor characteristics, it is likely that samples from these target groups were tested in our study, given the countries included. For example, Georgia has one of the highest prevalences of in-jection drug use globally, with up to 40% of HCV infections attributable to injection drug use [24]. Additionally, in some countries HCV screening is indicated for the general popula-tion, as a result of historical unsafe medical practices [25], as is the case in Nigeria [26] and Cambodia [27].
Limitations of this study include the uneven geographical distribution of sample types. Sensitivity in the HIV-uninfected population was primarily assessed in samples originating from Georgia and Nigeria, while sensitivity in the HIV-infected population was assessed almost exclusively in samples from Cambodia and Belgium. This makes comparisons between sen-sitivity in the HIV-uninfected and -infected populations chal-lenging. We cannot exclude the possibility that differences in population characteristics, such as different types of HIV/HCV risk groups, impacted the results. Notably, Belgium (from which 120 [14.7%] samples were obtained) is a high-income country,
thus population characteristics such as HIV prevalence or HCV cohort may not be comparable to those of LMICs.
While we cannot exclude the possibility that differences in storage conditions between countries had an effect on sample quality, evidence suggests that antibodies remain stable in frozen samples for several years and after multiple freeze-thaw cycles [28–31]; furthermore, we minimized any potential impact by only including samples that appeared nonhemolytic upon visual in-spection. A further limitation is the low number of HCV-negative and HIV-negative samples compared with HCV-negative HIV-positive samples, which may have influenced specificity in the overall population. The impact of this was likely minor, however, as most of the RDTs performed well in both study populations.
The design of the composite reference standard led to 210 samples being excluded from the study. It is possible that in-clusion of these samples would have affected the sensitivity and specificity estimates. This study did not take into account the impact of treatment for HCV, although only a small number of samples (n = 17) were from people who were receiving or who had previously received interferon treatment. Additionally, the HCV-negative samples used may not have precisely represented the target populations for HCV serology testing, leading to pa-tient bias. Finally, tests were performed by well-trained labo-ratory personnel using archived samples, thus this study does not represent a real-world setting. The performance of the RDTs in primary or community care settings using prospectively col-lected fresh samples is yet to be established.
A B
SD Biosensor
Artron
Wantai
InTec
PMC
Arkray
J.Mitra
Biosynex
SD Bioline
OraSure
BioLytical proto
Chembio proto
AccessBio proto
SD Biosensor
Artron
Wantai
InTec
PMC
Arkray
J.Mitra
Biosynex
SD Bioline
OraSure
BioLytical proto
Chembio proto
AccessBio proto
70 75 80 85 90 95 100
% Sensitivity
70 75 80 85 90 95 100
% Sensitivity
Figure 3. Sensitivity of 13 HCV rapid diagnostic tests in samples with detectable HCV VL/cAg (circles, % sensitivity or specificity; closed circles, lot 1; open circles, lot 2; error bars, upper and lower 95% confidence intervals): (A) HIV-uninfected samples; and (B) HIV-infected samples. Abbreviations: cAg, core antigen; HCV, hepatitis C; HIV, human immunodeficiency virus; VL, viral load.
Dow
nloaded from https://academ
ic.oup.com/jid/advance-article/doi/10.1093/infdis/jiaa389/5866494 by C
enters for Disease C
ontrol and Prevention user on 04 May 2021
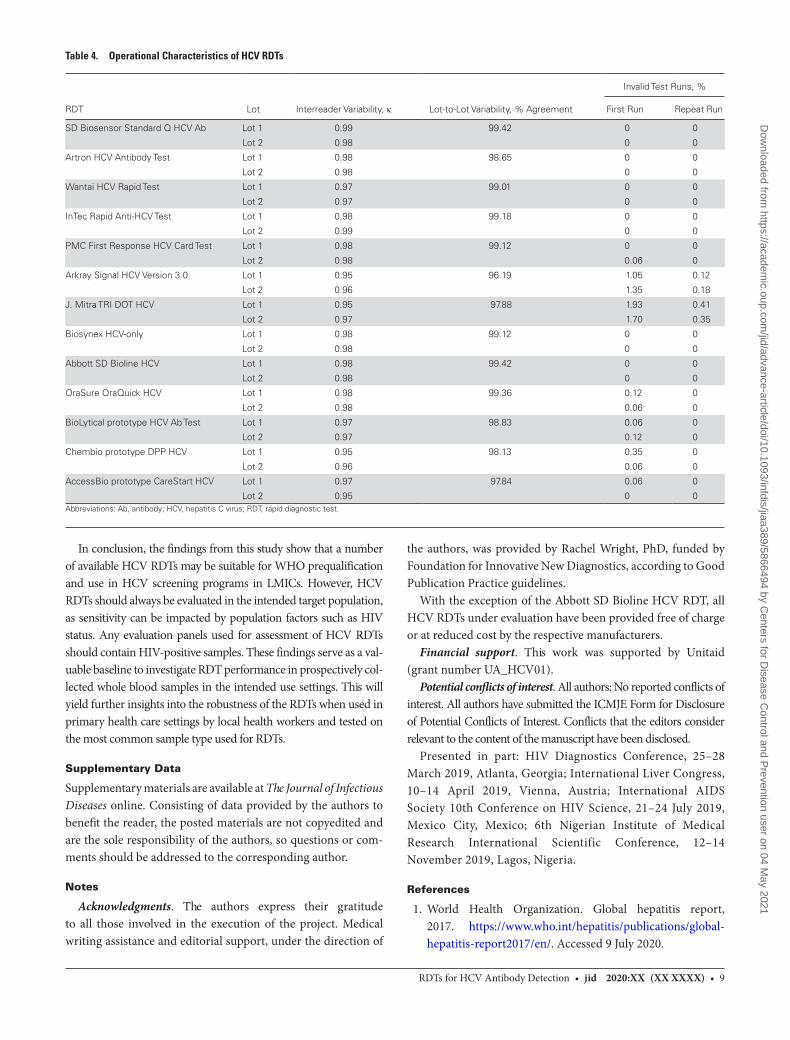
RDTs for HCV Antibody Detection • jid 2020:XX (XX XXXX) • 9
In conclusion, the findings from this study show that a number of available HCV RDTs may be suitable for WHO prequalification and use in HCV screening programs in LMICs. However, HCV RDTs should always be evaluated in the intended target population, as sensitivity can be impacted by population factors such as HIV status. Any evaluation panels used for assessment of HCV RDTs should contain HIV-positive samples. These findings serve as a val-uable baseline to investigate RDT performance in prospectively col-lected whole blood samples in the intended use settings. This will yield further insights into the robustness of the RDTs when used in primary health care settings by local health workers and tested on the most common sample type used for RDTs.
Supplementary Data
Supplementary materials are available at The Journal of Infectious Diseases online. Consisting of data provided by the authors to benefit the reader, the posted materials are not copyedited and are the sole responsibility of the authors, so questions or com-ments should be addressed to the corresponding author.
Notes
Acknowledgments. The authors express their gratitude to all those involved in the execution of the project. Medical writing assistance and editorial support, under the direction of
the authors, was provided by Rachel Wright, PhD, funded by Foundation for Innovative New Diagnostics, according to Good Publication Practice guidelines.
With the exception of the Abbott SD Bioline HCV RDT, all HCV RDTs under evaluation have been provided free of charge or at reduced cost by the respective manufacturers.
Financial support. This work was supported by Unitaid (grant number UA_HCV01).
Potential conflicts of interest. All authors: No reported conflicts of interest. All authors have submitted the ICMJE Form for Disclosure of Potential Conflicts of Interest. Conflicts that the editors consider relevant to the content of the manuscript have been disclosed.
Presented in part: HIV Diagnostics Conference, 25–28 March 2019, Atlanta, Georgia; International Liver Congress, 10–14 April 2019, Vienna, Austria; International AIDS Society 10th Conference on HIV Science, 21–24 July 2019, Mexico City, Mexico; 6th Nigerian Institute of Medical Research International Scientific Conference, 12–14 November 2019, Lagos, Nigeria.
References
1. World Health Organization. Global hepatitis report, 2017. https://www.who.int/hepatitis/publications/global-hepatitis-report2017/en/. Accessed 9 July 2020.
Table 4. Operational Characteristics of HCV RDTs
RDT Lot Interreader Variability, κ Lot-to-Lot Variability, % Agreement
Invalid Test Runs, %
First Run Repeat Run
SD Biosensor Standard Q HCV Ab Lot 1 0.99 99.42 0 0
Lot 2 0.98 0 0
Artron HCV Antibody Test Lot 1 0.98 98.65 0 0
Lot 2 0.98 0 0
Wantai HCV Rapid Test Lot 1 0.97 99.01 0 0
Lot 2 0.97 0 0
InTec Rapid Anti-HCV Test Lot 1 0.98 99.18 0 0
Lot 2 0.99 0 0
PMC First Response HCV Card Test Lot 1 0.98 99.12 0 0
Lot 2 0.98 0.06 0
Arkray Signal HCV Version 3.0 Lot 1 0.95 96.19 1.05 0.12
Lot 2 0.96 1.35 0.18
J. Mitra TRI DOT HCV Lot 1 0.95 97.88 1.93 0.41
Lot 2 0.97 1.70 0.35
Biosynex HCV-only Lot 1 0.98 99.12 0 0
Lot 2 0.98 0 0
Abbott SD Bioline HCV Lot 1 0.98 99.42 0 0
Lot 2 0.98 0 0
OraSure OraQuick HCV Lot 1 0.98 99.36 0.12 0
Lot 2 0.98 0.06 0
BioLytical prototype HCV Ab Test Lot 1 0.97 98.83 0.06 0
Lot 2 0.97 0.12 0
Chembio prototype DPP HCV Lot 1 0.95 98.13 0.35 0
Lot 2 0.96 0.06 0
AccessBio prototype CareStart HCV Lot 1 0.97 97.84 0.06 0
Lot 2 0.95 0 0Abbreviations: Ab, antibody; HCV, hepatitis C virus; RDT, rapid diagnostic test.
Dow
nloaded from https://academ
ic.oup.com/jid/advance-article/doi/10.1093/infdis/jiaa389/5866494 by C
enters for Disease C
ontrol and Prevention user on 04 May 2021
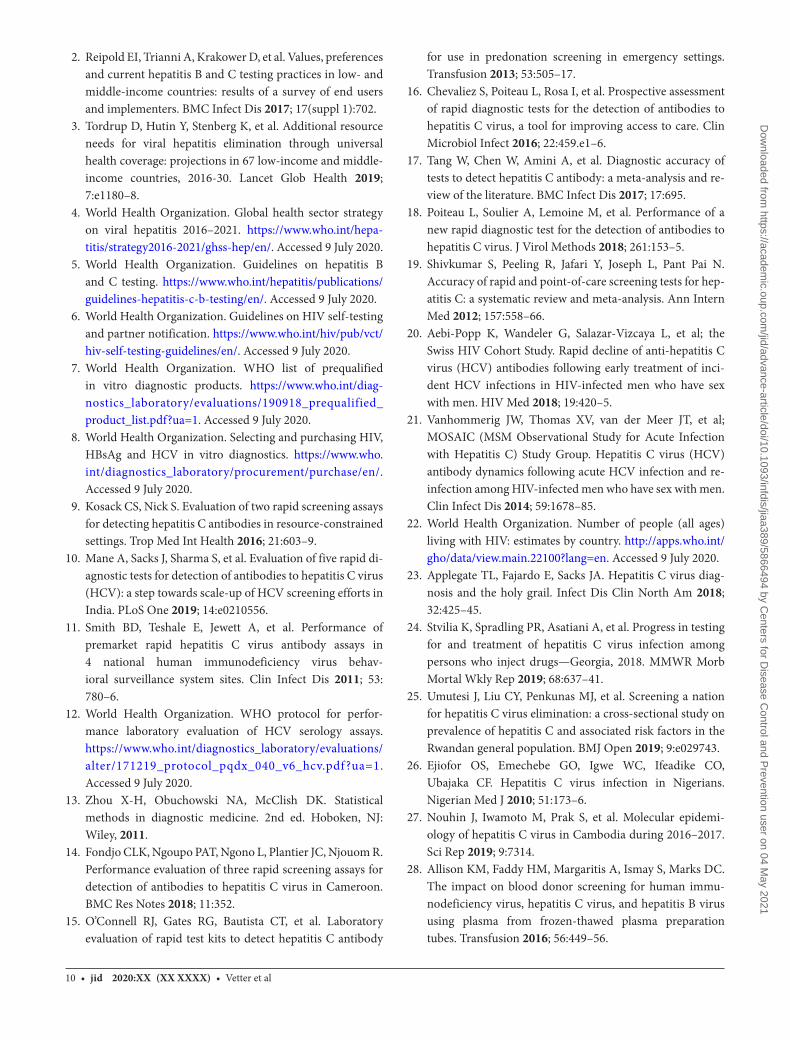
10 • jid 2020:XX (XX XXXX) • Vetter et al
2. Reipold EI, Trianni A, Krakower D, et al. Values, preferences and current hepatitis B and C testing practices in low- and middle-income countries: results of a survey of end users and implementers. BMC Infect Dis 2017; 17(suppl 1):702.
3. Tordrup D, Hutin Y, Stenberg K, et al. Additional resource needs for viral hepatitis elimination through universal health coverage: projections in 67 low-income and middle-income countries, 2016-30. Lancet Glob Health 2019; 7:e1180–8.
4. World Health Organization. Global health sector strategy on viral hepatitis 2016–2021. https://www.who.int/hepa-titis/strategy2016-2021/ghss-hep/en/. Accessed 9 July 2020.
5. World Health Organization. Guidelines on hepatitis B and C testing. https://www.who.int/hepatitis/publications/guidelines-hepatitis-c-b-testing/en/. Accessed 9 July 2020.
6. World Health Organization. Guidelines on HIV self-testing and partner notification. https://www.who.int/hiv/pub/vct/hiv-self-testing-guidelines/en/. Accessed 9 July 2020.
7. World Health Organization. WHO list of prequalified in vitro diagnostic products. https://www.who.int/diag-nostics_laboratory/evaluations/190918_prequalified_product_list.pdf?ua=1. Accessed 9 July 2020.
8. World Health Organization. Selecting and purchasing HIV, HBsAg and HCV in vitro diagnostics. https://www.who.int/diagnostics_laboratory/procurement/purchase/en/. Accessed 9 July 2020.
9. Kosack CS, Nick S. Evaluation of two rapid screening assays for detecting hepatitis C antibodies in resource-constrained settings. Trop Med Int Health 2016; 21:603–9.
10. Mane A, Sacks J, Sharma S, et al. Evaluation of five rapid di-agnostic tests for detection of antibodies to hepatitis C virus (HCV): a step towards scale-up of HCV screening efforts in India. PLoS One 2019; 14:e0210556.
11. Smith BD, Teshale E, Jewett A, et al. Performance of premarket rapid hepatitis C virus antibody assays in 4 national human immunodeficiency virus behav-ioral surveillance system sites. Clin Infect Dis 2011; 53: 780–6.
12. World Health Organization. WHO protocol for perfor-mance laboratory evaluation of HCV serology assays. https://www.who.int/diagnostics_laboratory/evaluations/alter/171219_protocol_pqdx_040_v6_hcv.pdf ?ua=1. Accessed 9 July 2020.
13. Zhou X-H, Obuchowski NA, McClish DK. Statistical methods in diagnostic medicine. 2nd ed. Hoboken, NJ: Wiley, 2011.
14. Fondjo CLK, Ngoupo PAT, Ngono L, Plantier JC, Njouom R. Performance evaluation of three rapid screening assays for detection of antibodies to hepatitis C virus in Cameroon. BMC Res Notes 2018; 11:352.
15. O’Connell RJ, Gates RG, Bautista CT, et al. Laboratory evaluation of rapid test kits to detect hepatitis C antibody
for use in predonation screening in emergency settings. Transfusion 2013; 53:505–17.
16. Chevaliez S, Poiteau L, Rosa I, et al. Prospective assessment of rapid diagnostic tests for the detection of antibodies to hepatitis C virus, a tool for improving access to care. Clin Microbiol Infect 2016; 22:459.e1–6.
17. Tang W, Chen W, Amini A, et al. Diagnostic accuracy of tests to detect hepatitis C antibody: a meta-analysis and re-view of the literature. BMC Infect Dis 2017; 17:695.
18. Poiteau L, Soulier A, Lemoine M, et al. Performance of a new rapid diagnostic test for the detection of antibodies to hepatitis C virus. J Virol Methods 2018; 261:153–5.
19. Shivkumar S, Peeling R, Jafari Y, Joseph L, Pant Pai N. Accuracy of rapid and point-of-care screening tests for hep-atitis C: a systematic review and meta-analysis. Ann Intern Med 2012; 157:558–66.
20. Aebi-Popp K, Wandeler G, Salazar-Vizcaya L, et al; the Swiss HIV Cohort Study. Rapid decline of anti-hepatitis C virus (HCV) antibodies following early treatment of inci-dent HCV infections in HIV-infected men who have sex with men. HIV Med 2018; 19:420–5.
21. Vanhommerig JW, Thomas XV, van der Meer JT, et al; MOSAIC (MSM Observational Study for Acute Infection with Hepatitis C) Study Group. Hepatitis C virus (HCV) antibody dynamics following acute HCV infection and re-infection among HIV-infected men who have sex with men. Clin Infect Dis 2014; 59:1678–85.
22. World Health Organization. Number of people (all ages) living with HIV: estimates by country. http://apps.who.int/gho/data/view.main.22100?lang=en. Accessed 9 July 2020.
23. Applegate TL, Fajardo E, Sacks JA. Hepatitis C virus diag-nosis and the holy grail. Infect Dis Clin North Am 2018; 32:425–45.
24. Stvilia K, Spradling PR, Asatiani A, et al. Progress in testing for and treatment of hepatitis C virus infection among persons who inject drugs—Georgia, 2018. MMWR Morb Mortal Wkly Rep 2019; 68:637–41.
25. Umutesi J, Liu CY, Penkunas MJ, et al. Screening a nation for hepatitis C virus elimination: a cross-sectional study on prevalence of hepatitis C and associated risk factors in the Rwandan general population. BMJ Open 2019; 9:e029743.
26. Ejiofor OS, Emechebe GO, Igwe WC, Ifeadike CO, Ubajaka CF. Hepatitis C virus infection in Nigerians. Nigerian Med J 2010; 51:173–6.
27. Nouhin J, Iwamoto M, Prak S, et al. Molecular epidemi-ology of hepatitis C virus in Cambodia during 2016–2017. Sci Rep 2019; 9:7314.
28. Allison KM, Faddy HM, Margaritis A, Ismay S, Marks DC. The impact on blood donor screening for human immu-nodeficiency virus, hepatitis C virus, and hepatitis B virus using plasma from frozen-thawed plasma preparation tubes. Transfusion 2016; 56:449–56.
Dow
nloaded from https://academ
ic.oup.com/jid/advance-article/doi/10.1093/infdis/jiaa389/5866494 by C
enters for Disease C
ontrol and Prevention user on 04 May 2021
RDTs for HCV Antibody Detection • jid 2020:XX (XX XXXX) • 11
29. Rastawicki W, Smietańska K, Rokosz N, Jagielski M. Effect of multiple freeze-thaw cycles on detection of IgA, IgG and IgM antibodies to selected bacterial antigens [in Polish]. Med Dosw Mikrobiol 2012; 64:79–85.
30. Pinsky NA, Huddleston JM, Jacobson RM, Wollan PC, Poland GA. Effect of multiple freeze-thaw cycles on
detection of measles, mumps, and rubella virus antibodies. Clin Diagn Lab Immunol 2003; 10:19–21.
31. Castejon MJ, Yamashiro R, Cardosa de Oliveira C, Aparecida de Freitas Oliveira C, Ueda M. Stability of anti-HIV anti-bodies in serum samples stored for two to eighteen years periods. J Bras Patol Med Lab 2014; 50:272–7.
Dow
nloaded from https://academ
ic.oup.com/jid/advance-article/doi/10.1093/infdis/jiaa389/5866494 by C
enters for Disease C
ontrol and Prevention user on 04 May 2021
Original Article
Assessment of treatment options for patients with hepatitis Cvirus recombinant form 2k/1b
Mamuka Zakalashvili,1 Jaba Zarkua,1 Robert G. Gish,2 Maia Zhamutashvili,1
Vakhtang Sartania,1 Michael Weizenegger,3 Jan Bartel,3 Monika Raabe,3 Lia Gvinjilia,4
Sophia Metreveli,1 Maka Barnova,1 Nikoloz Abramishvili,1 Irakli Rtskhiladze1 andDavid Metreveli1
1Hepatology and Gastroenterology Department, Medical Center Mrcheveli, Tbilisi, Georgia and 2Hepatitis BFoundation, Doylestown, Pennsylvania and 4TEPHINET independent contractor for Georgia Hepatitis C EliminationProgram, Atlanta, Georgia, USA and 3Medical Service Center Dr. Limbach & colleagues, Heidelberg, Germany
Aim: Hepatitis C virus (HCV) intergenotype recombinant form(RF) 2k/1b has been actively circulating in HCV‐infected patients,and the prevalence of this RF virus in the Republic of Georgia isone of the highest reported worldwide. The aim of this studywas to define the optimal treatment regimen for patients withRF_2k/1b.
Methods: We analyzed the data of 2735 patients who startedtreatment at the Medical Center Mrcheveli within Georgia’s hep-atitis C elimination program from May 2015 through December2019. The patients were treated with sofosbuvir (SOF)‐basedregimens. For identification of RF_2k/1b variants, refinement ofstandard (INNO‐LiPA) genotyping results for all patient samplesassigned the unspecific HCV genotypes (GT) 2a/2c was carriedout by sequencing of core and non‐structural protein 5B genes.
Results: Overall, 444 patients, representing 66% of GT2 and 16%of the total samples, were RF_2k/1b. Treatment of patients with
RF_2k/1b with SOF/ledipasvir and SOF/velpatasvir was highly ef-fective and viral cure rates did not differ among genotypestreated with the same regimen: RF_2k/1b, 99% (343/346); GT1,99% (876/885); GT2, 96% (156/162); and GT3, 99% (545/552). Aseparate comparison analysis of sustained virologic responserate, treated with SOF plus ribavirin, showed significantly highersustained virologic response (96%) in patients with confirmedGT2 (by sequencing) compared to unspecified GT2 (by INNO‐LiPA) (79%) (P< 0.05).
Conclusion: Sofosbuvir‐based regimens are highly effectivefor treatment of RF 2k/1b patients, and with availability of newpan‐genotypic direct‐acting antivirals, genotyping to identify RF2k/1b patients might not be necessary.
Key words: genotype, HCV, RF_2k/1b, sofosbuvir, sustainedvirologic response
INTRODUCTION
HEPATITIS C VIRUS (HCV) infection is a one ofthe major causes of liver‐related morbidity and
mortality,1 with an estimated 71 million persons withchronic HCV infection worldwide who are at risk of devel-oping cirrhosis and hepatocellular carcinoma.2 Treatmentfor patients with chronic HCV‐related liver disease hasevolved during the last two decades due to improved
understanding of the disease pathophysiology, develop-ments in diagnostic procedures, and improvements intherapy and prevention. The development of direct‐actingantivirals (DAAs) has revolutionized the treatment ofHCV infection andhas a potential for disease elimination.3
The estimated prevalence of HCV infection in theRepublic of Georgia is one of the highest in the world.4 Be-fore 2015, patients with chronic HCV infection were oftentreated with pegylated interferon (PegIFN) and ribavirin
Correspondence: Dr Mamuka Zakalashvili, Hepatology and Gastroenterology Department, Medical Center Mrcheveli, 9 Al. Kazbegi Ave, 0160 Tbilisi,Georgia. Email: [email protected] of interest: The authors have no conflict of interest.Financial support: This studywas funded in part byMedizinisches Versorgungszentrum,Dr. Limbach&Kollegen,Heidelberg, Germany, and in partby Medical Center Mrcheveli, Tbilisi, Georgia.Received 29 July 2020; revision 21 October 2020; accepted 24 October 2020.
Hepatology Research doi: 10.1111/hepr.13587
1© 2020 The Japan Society of Hepatology
bs_bs_banner
(RBV), and new‐generation DAAs were not affordable formost patients. In April 2015, Georgia launched theNational Hepatitis C Elimination Program in partnershipwith the US Centers for Disease Control and Preventionand Gilead Sciences. The goal of the program is 90%reduction in hepatitis C prevalence by 2020.5 Georgiahas achieved substantial treatment scale‐up with theimplementation of the hepatitis C elimination program,which has reduced the prevalence of chronic hepatitis Cinfection among adults by 37%, the incidence by 37%,and mortality by 14%.6
Since 2015, different sofosbuvir (SOF)‐based regimenshave been used for patients within the National HepatitisC Elimination Program. The SOF‐based regimens weredependent on HCV genotype (GT), presence of livercirrhosis, drug eligibility, and previous treatment history.7
In addition, specific HCV management guidelines havebeen created and further updated for treatment of patientswithin the program.The available data show that unique HCV chimeras,
otherwise known as HCV intergenotype recombinantform (RF) _2k/1b, have been actively circulating inHCV‐infected patients. Earlier data suggested that RF_2k/1b prevalence was extremely low and played a minor rolein HCV evolution, but it might have been underestimated.Our previous data confirmed that up to 20% of all HCVgenotypes are HCV RF_2k/1b. The RF_2k/1b genotypewas identified in only GT2 samples and comprised 72%of samples. Full genome sequencing confirmed the results.The phylogenetic analysis showed that the RF_2k/1bviruses from Georgia formed a monophyletic cluster withthe previously described RF1_2k/1b sequences.8,9
In the current era of more effective pan‐genotypic DAAmedication, differentiating patients with RF_2k/1b fromthose with GT2 might not be prudent. However, in areaswhere availability of pan‐genotypic DAAs is limited, iden-tification of recombinants could be important for makingthe most cost‐effective treatment choices for low‐incomecountries.There are case reports that detail the cure rate of patients
with RF_2k/1b and their treatment with the limitedspectrum of DAAs. According to the available data ofsustained virologic response (SVR) rates, patients withRF_2k/1b could bemore similar to patients with GT1 thanto patients with GT2.10,11
The aim of this study was to define the optimalSOF‐based treatment regimens for patients with RF_2k/1b, estimating SVR rates, and comparing these data tothe results of other HCV genotypes treated with the sameregimen within the National Hepatitis C EliminationProgram in the country of Georgia.
METHODS
Study design and population
WE EVALUATED HCV genotype distribution among2735 patients who initiated treatment within the
National Hepatitis C Elimination Program in the MedicalCenter Mrcheveli (Tbilisi, Georgia) from May 2015 toDecember 2019. A sample of 2280 patients were includedin the intention‐to‐treat analysis. Seventeen percent ofpatients (n = 455) were excluded for the following reasons:unable to undertake HCV genotyping, lost to follow‐up,treatment discontinuation, changes in treatment regimenor treatment provider, and ongoing treatment (Fig. 1).We evaluated post‐treatment 12‐week SVR rates in
patients with RF_2k/1b and compared them to patientswith GT2, GT1, and GT3. For the generalizability of ourresults, we undertook regenotyping and sequencing inrandomly selected samples from patients with unspecifiedGT2a/2c who failed to achieve SVR at other HCV elimina-tion program provider centers.
Parameters assessedDemographic and epidemiological characteristics werecollected from patients’ medical records and the NationalHepatitis C Elimination Program online database. Thedegree of liver damage was assessed by non‐invasivemethods such as liver stiffnessmeasurement with transientelastography (FibroScan; Echosens, Paris, France) andFibrosis‐4 (FIB‐4) score. Only patients with FIB‐4 scorefrom 1.45 to 3.25 were eligible for FibroScan. We stratifiedpatients into the following groups: patients withoutadvanced chronic liver disease (ACLD) (FIB‐4< 1.45;FibroScan <10 kPa), and patients with ACLD (FIB‐4>3.25; FibroScan >10 kPa), which includes patients withadvance fibrosis and compensated or decompensatedcirrhosis. Additional parameters for calculation ofChild–Pugh score were collected from patients’ medicalrecords. Hepatitis C virus RNA was assessed using areal‐time polymerase chain reaction (PCR) HCV assay(Cobas 6800; Roche Diagnostics, Mannheim, Germany)with a lower limit of quantification and detection of10 IU/mL. Hepatitis C virus genotype was determinedusing the VERSANT HCV Genotype 2.0 (VERSANT LiPA;Healthcare SIEMENS, Munich, Germany). For identifica-tion of RF_2k/1b samples, refinement of INNO‐LiPAgenotyping results for all patient samples assigned theunspecific HCV genotypes 2a/2c was carried out by partialsequencing of core and non‐structural protein 5B (NS5B)genes.9 Labor Limbach (Heidelberg, Germany) carriedout PCR, standard genotyping, and sequencing. Sustained
2 M. Zakalashvili et al. Hepatology Research
© 2020 The Japan Society of Hepatology
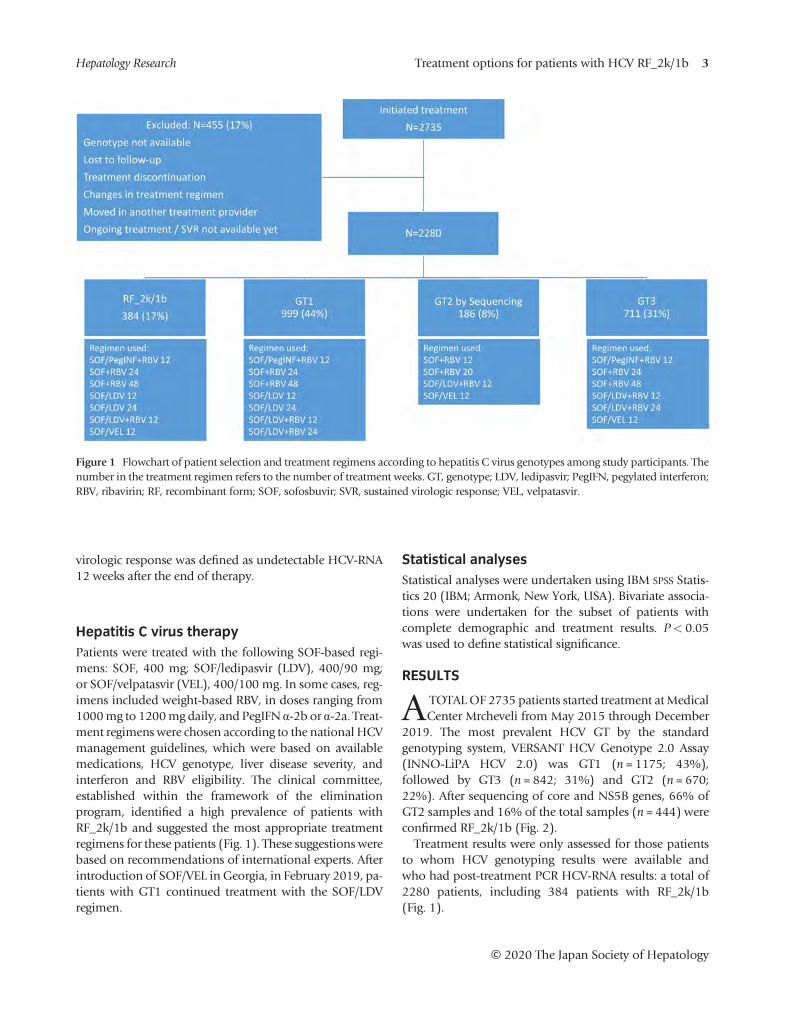
virologic response was defined as undetectable HCV‐RNA12 weeks after the end of therapy.
Hepatitis C virus therapyPatients were treated with the following SOF‐based regi-mens: SOF, 400 mg; SOF/ledipasvir (LDV), 400/90 mg;or SOF/velpatasvir (VEL), 400/100 mg. In some cases, reg-imens included weight‐based RBV, in doses ranging from1000mg to 1200mg daily, and PegIFN α‐2b or α‐2a. Treat-ment regimenswere chosen according to the national HCVmanagement guidelines, which were based on availablemedications, HCV genotype, liver disease severity, andinterferon and RBV eligibility. The clinical committee,established within the framework of the eliminationprogram, identified a high prevalence of patients withRF_2k/1b and suggested the most appropriate treatmentregimens for these patients (Fig. 1). These suggestions werebased on recommendations of international experts. Afterintroduction of SOF/VEL in Georgia, in February 2019, pa-tients with GT1 continued treatment with the SOF/LDVregimen.
Statistical analysesStatistical analyses were undertaken using IBM SPSS Statis-tics 20 (IBM; Armonk, New York, USA). Bivariate associa-tions were undertaken for the subset of patients withcomplete demographic and treatment results. P< 0.05was used to define statistical significance.
RESULTS
ATOTALOF 2735 patients started treatment atMedicalCenter Mrcheveli from May 2015 through December
2019. The most prevalent HCV GT by the standardgenotyping system, VERSANT HCV Genotype 2.0 Assay(INNO‐LiPA HCV 2.0) was GT1 (n = 1175; 43%),followed by GT3 (n = 842; 31%) and GT2 (n = 670;22%). After sequencing of core and NS5B genes, 66% ofGT2 samples and 16% of the total samples (n = 444) wereconfirmed RF_2k/1b (Fig. 2).Treatment results were only assessed for those patients
to whom HCV genotyping results were available andwho had post‐treatment PCR HCV‐RNA results: a total of2280 patients, including 384 patients with RF_2k/1b(Fig. 1).
Figure 1 Flowchart of patient selection and treatment regimens according to hepatitis C virus genotypes among study participants. Thenumber in the treatment regimen refers to the number of treatment weeks. GT, genotype; LDV, ledipasvir; PegIFN, pegylated interferon;RBV, ribavirin; RF, recombinant form; SOF, sofosbuvir; SVR, sustained virologic response; VEL, velpatasvir.
Treatment options for patients with HCV RF_2k/1b 3Hepatology Research
© 2020 The Japan Society of Hepatology
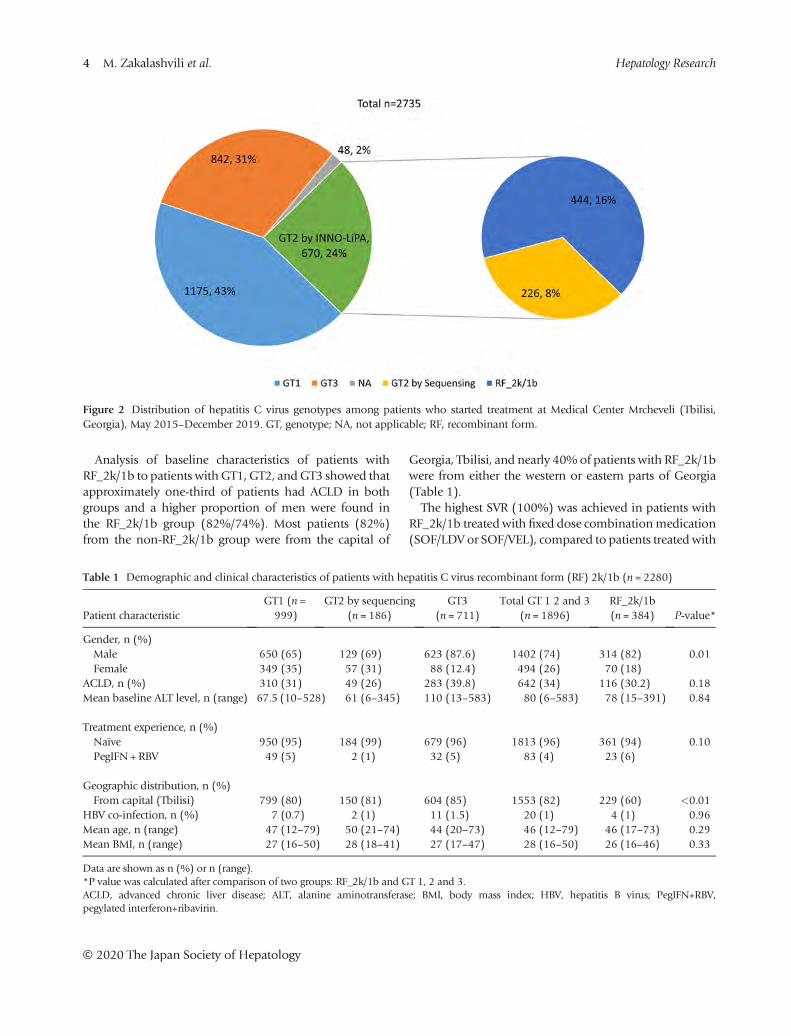
Analysis of baseline characteristics of patients withRF_2k/1b to patients withGT1, GT2, andGT3 showed thatapproximately one‐third of patients had ACLD in bothgroups and a higher proportion of men were found inthe RF_2k/1b group (82%/74%). Most patients (82%)from the non‐RF_2k/1b group were from the capital of
Georgia, Tbilisi, and nearly 40% of patients with RF_2k/1bwere from either the western or eastern parts of Georgia(Table 1).The highest SVR (100%) was achieved in patients with
RF_2k/1b treated with fixed dose combinationmedication(SOF/LDV or SOF/VEL), compared to patients treated with
Figure 2 Distribution of hepatitis C virus genotypes among patients who started treatment at Medical Center Mrcheveli (Tbilisi,Georgia), May 2015–December 2019. GT, genotype; NA, not applicable; RF, recombinant form.
Table 1 Demographic and clinical characteristics of patients with hepatitis C virus recombinant form (RF) 2k/1b (n = 2280)
Patient characteristicGT1 (n =999)
GT2 by sequencing(n = 186)
GT3(n = 711)
Total GT 1 2 and 3(n = 1896)
RF_2k/1b(n = 384) P‐value*
Gender, n (%)Male 650 (65) 129 (69) 623 (87.6) 1402 (74) 314 (82) 0.01Female 349 (35) 57 (31) 88 (12.4) 494 (26) 70 (18)
ACLD, n (%) 310 (31) 49 (26) 283 (39.8) 642 (34) 116 (30.2) 0.18Mean baseline ALT level, n (range) 67.5 (10–528) 61 (6–345) 110 (13–583) 80 (6–583) 78 (15–391) 0.84
Treatment experience, n (%)Naïve 950 (95) 184 (99) 679 (96) 1813 (96) 361 (94) 0.10PegIFN + RBV 49 (5) 2 (1) 32 (5) 83 (4) 23 (6)
Geographic distribution, n (%)From capital (Tbilisi) 799 (80) 150 (81) 604 (85) 1553 (82) 229 (60) <0.01
HBV co‐infection, n (%) 7 (0.7) 2 (1) 11 (1.5) 20 (1) 4 (1) 0.96Mean age, n (range) 47 (12–79) 50 (21–74) 44 (20–73) 46 (12–79) 46 (17–73) 0.29Mean BMI, n (range) 27 (16–50) 28 (18–41) 27 (17–47) 28 (16–50) 26 (16–46) 0.33
Data are shown as n (%) or n (range).*P value was calculated after comparison of two groups: RF_2k/1b and GT 1, 2 and 3.ACLD, advanced chronic liver disease; ALT, alanine aminotransferase; BMI, body mass index; HBV, hepatitis B virus; PegIFN+RBV,pegylated interferon+ribavirin.
4 M. Zakalashvili et al. Hepatology Research
© 2020 The Japan Society of Hepatology
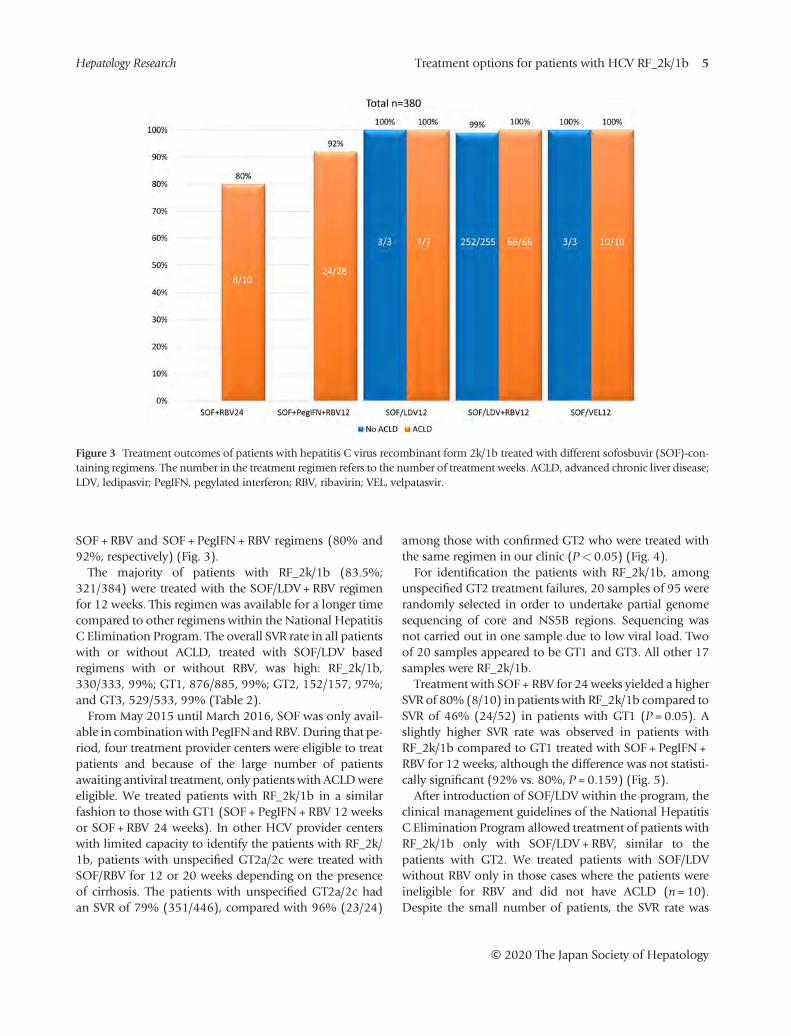
SOF + RBV and SOF + PegIFN + RBV regimens (80% and92%, respectively) (Fig. 3).The majority of patients with RF_2k/1b (83.5%;
321/384) were treated with the SOF/LDV + RBV regimenfor 12 weeks. This regimen was available for a longer timecompared to other regimens within the National HepatitisC Elimination Program. The overall SVR rate in all patientswith or without ACLD, treated with SOF/LDV basedregimens with or without RBV, was high: RF_2k/1b,330/333, 99%; GT1, 876/885, 99%; GT2, 152/157, 97%;and GT3, 529/533, 99% (Table 2).From May 2015 until March 2016, SOF was only avail-
able in combinationwith PegIFN and RBV. During that pe-riod, four treatment provider centers were eligible to treatpatients and because of the large number of patientsawaiting antiviral treatment, only patients with ACLDwereeligible. We treated patients with RF_2k/1b in a similarfashion to those with GT1 (SOF + PegIFN + RBV 12 weeksor SOF + RBV 24 weeks). In other HCV provider centerswith limited capacity to identify the patients with RF_2k/1b, patients with unspecified GT2a/2c were treated withSOF/RBV for 12 or 20 weeks depending on the presenceof cirrhosis. The patients with unspecified GT2a/2c hadan SVR of 79% (351/446), compared with 96% (23/24)
among those with confirmed GT2 who were treated withthe same regimen in our clinic (P< 0.05) (Fig. 4).For identification the patients with RF_2k/1b, among
unspecified GT2 treatment failures, 20 samples of 95 wererandomly selected in order to undertake partial genomesequencing of core and NS5B regions. Sequencing wasnot carried out in one sample due to low viral load. Twoof 20 samples appeared to be GT1 and GT3. All other 17samples were RF_2k/1b.Treatment with SOF + RBV for 24 weeks yielded a higher
SVR of 80% (8/10) in patients with RF_2k/1b compared toSVR of 46% (24/52) in patients with GT1 (P = 0.05). Aslightly higher SVR rate was observed in patients withRF_2k/1b compared to GT1 treated with SOF + PegIFN +RBV for 12 weeks, although the difference was not statisti-cally significant (92% vs. 80%, P = 0.159) (Fig. 5).After introduction of SOF/LDV within the program, the
clinical management guidelines of the National HepatitisC Elimination Program allowed treatment of patients withRF_2k/1b only with SOF/LDV + RBV, similar to thepatients with GT2. We treated patients with SOF/LDVwithout RBV only in those cases where the patients wereineligible for RBV and did not have ACLD (n = 10).Despite the small number of patients, the SVR rate was
Figure 3 Treatment outcomes of patients with hepatitis C virus recombinant form 2k/1b treated with different sofosbuvir (SOF)‐con-taining regimens. The number in the treatment regimen refers to the number of treatment weeks. ACLD, advanced chronic liver disease;LDV, ledipasvir; PegIFN, pegylated interferon; RBV, ribavirin; VEL, velpatasvir.
Treatment options for patients with HCV RF_2k/1b 5Hepatology Research
© 2020 The Japan Society of Hepatology
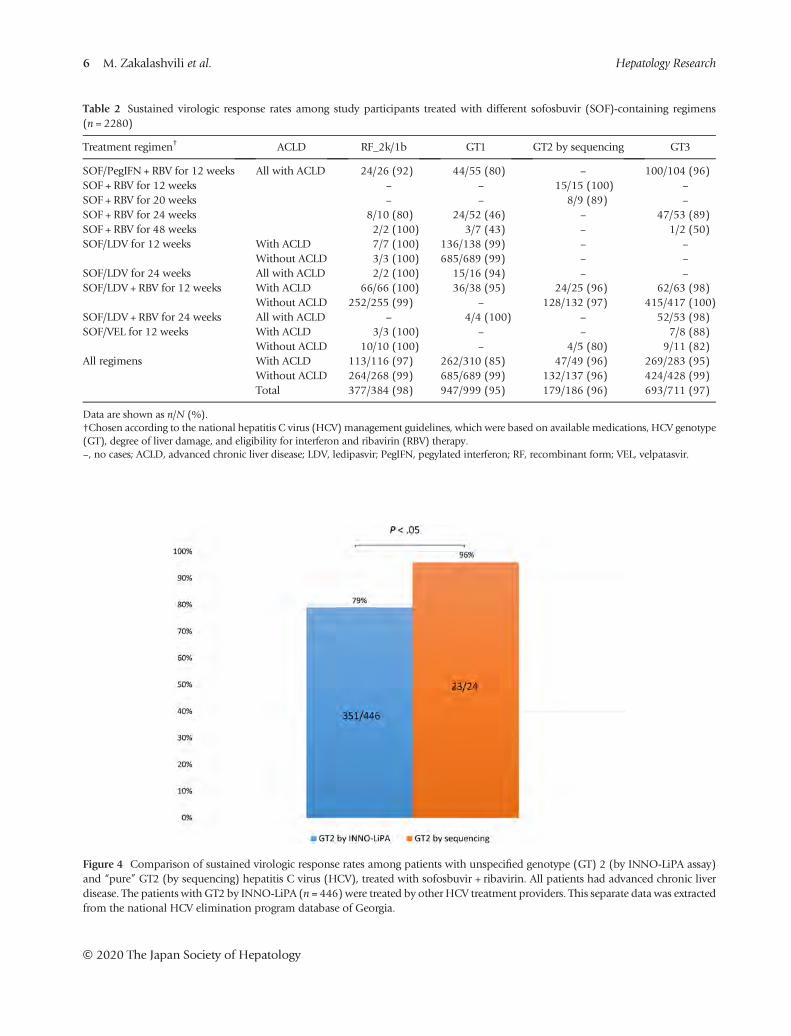
Table 2 Sustained virologic response rates among study participants treated with different sofosbuvir (SOF)‐containing regimens(n = 2280)
Treatment regimen† ACLD RF_2k/1b GT1 GT2 by sequencing GT3
SOF/PegIFN + RBV for 12 weeks All with ACLD 24/26 (92) 44/55 (80) – 100/104 (96)SOF + RBV for 12 weeks – – 15/15 (100) –
SOF + RBV for 20 weeks – – 8/9 (89) –
SOF + RBV for 24 weeks 8/10 (80) 24/52 (46) – 47/53 (89)SOF + RBV for 48 weeks 2/2 (100) 3/7 (43) – 1/2 (50)SOF/LDV for 12 weeks With ACLD 7/7 (100) 136/138 (99) – –
Without ACLD 3/3 (100) 685/689 (99) – –
SOF/LDV for 24 weeks All with ACLD 2/2 (100) 15/16 (94) – –
SOF/LDV + RBV for 12 weeks With ACLD 66/66 (100) 36/38 (95) 24/25 (96) 62/63 (98)Without ACLD 252/255 (99) – 128/132 (97) 415/417 (100)
SOF/LDV + RBV for 24 weeks All with ACLD – 4/4 (100) – 52/53 (98)SOF/VEL for 12 weeks With ACLD 3/3 (100) – – 7/8 (88)
Without ACLD 10/10 (100) – 4/5 (80) 9/11 (82)All regimens With ACLD 113/116 (97) 262/310 (85) 47/49 (96) 269/283 (95)
Without ACLD 264/268 (99) 685/689 (99) 132/137 (96) 424/428 (99)Total 377/384 (98) 947/999 (95) 179/186 (96) 693/711 (97)
Data are shown as n/N (%).†Chosen according to the national hepatitis C virus (HCV) management guidelines, which were based on available medications, HCV genotype(GT), degree of liver damage, and eligibility for interferon and ribavirin (RBV) therapy.–, no cases; ACLD, advanced chronic liver disease; LDV, ledipasvir; PegIFN, pegylated interferon; RF, recombinant form; VEL, velpatasvir.
Figure 4 Comparison of sustained virologic response rates among patients with unspecified genotype (GT) 2 (by INNO‐LiPA assay)and “pure” GT2 (by sequencing) hepatitis C virus (HCV), treated with sofosbuvir + ribavirin. All patients had advanced chronic liverdisease. The patients with GT2 by INNO‐LiPA (n = 446) were treated by other HCV treatment providers. This separate data was extractedfrom the national HCV elimination program database of Georgia.
6 M. Zakalashvili et al. Hepatology Research
© 2020 The Japan Society of Hepatology
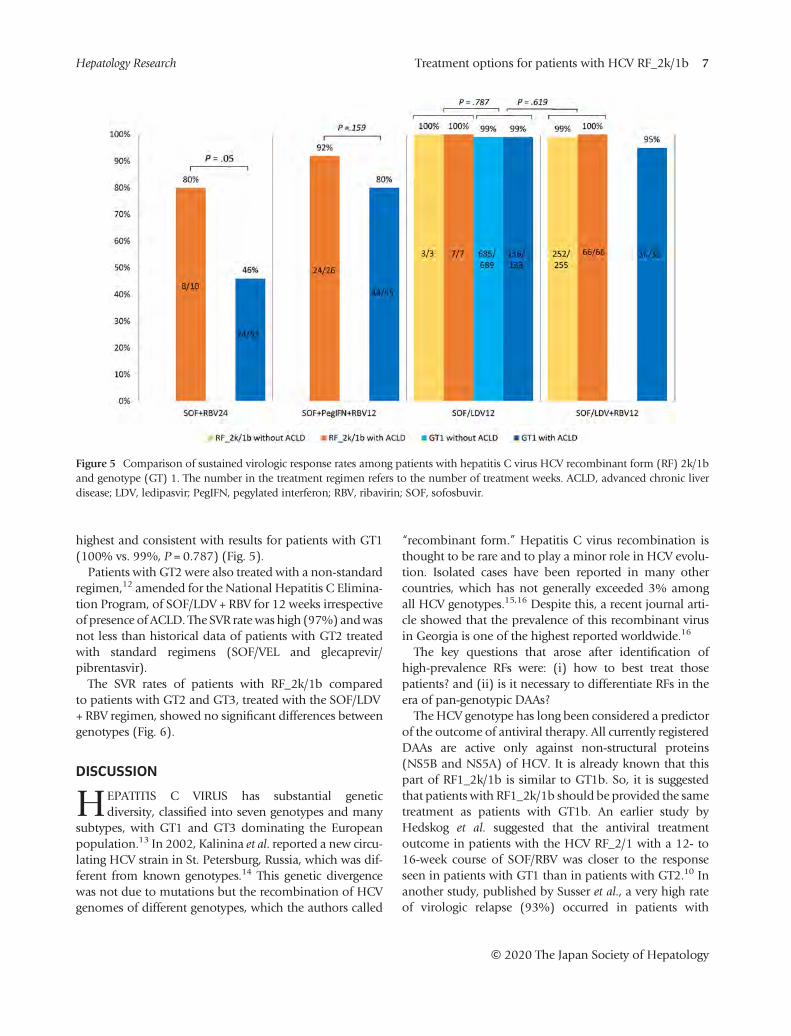
highest and consistent with results for patients with GT1(100% vs. 99%, P = 0.787) (Fig. 5).Patients with GT2 were also treated with a non‐standard
regimen,12 amended for the National Hepatitis C Elimina-tion Program, of SOF/LDV + RBV for 12 weeks irrespectiveof presence of ACLD. The SVR rate was high (97%) andwasnot less than historical data of patients with GT2 treatedwith standard regimens (SOF/VEL and glecaprevir/pibrentasvir).The SVR rates of patients with RF_2k/1b compared
to patients with GT2 and GT3, treated with the SOF/LDV+ RBV regimen, showed no significant differences betweengenotypes (Fig. 6).
DISCUSSION
HEPATITIS C VIRUS has substantial geneticdiversity, classified into seven genotypes and many
subtypes, with GT1 and GT3 dominating the Europeanpopulation.13 In 2002, Kalinina et al. reported a new circu-lating HCV strain in St. Petersburg, Russia, which was dif-ferent from known genotypes.14 This genetic divergencewas not due to mutations but the recombination of HCVgenomes of different genotypes, which the authors called
“recombinant form.” Hepatitis C virus recombination isthought to be rare and to play a minor role in HCV evolu-tion. Isolated cases have been reported in many othercountries, which has not generally exceeded 3% amongall HCV genotypes.15,16 Despite this, a recent journal arti-cle showed that the prevalence of this recombinant virusin Georgia is one of the highest reported worldwide.16
The key questions that arose after identification ofhigh‐prevalence RFs were: (i) how to best treat thosepatients? and (ii) is it necessary to differentiate RFs in theera of pan‐genotypic DAAs?The HCV genotype has long been considered a predictor
of the outcome of antiviral therapy. All currently registeredDAAs are active only against non‐structural proteins(NS5B and NS5A) of HCV. It is already known that thispart of RF1_2k/1b is similar to GT1b. So, it is suggestedthat patients with RF1_2k/1b should be provided the sametreatment as patients with GT1b. An earlier study byHedskog et al. suggested that the antiviral treatmentoutcome in patients with the HCV RF_2/1 with a 12‐ to16‐week course of SOF/RBV was closer to the responseseen in patients with GT1 than in patients with GT2.10 Inanother study, published by Susser et al., a very high rateof virologic relapse (93%) occurred in patients with
Figure 5 Comparison of sustained virologic response rates among patients with hepatitis C virus HCV recombinant form (RF) 2k/1band genotype (GT) 1. The number in the treatment regimen refers to the number of treatment weeks. ACLD, advanced chronic liverdisease; LDV, ledipasvir; PegIFN, pegylated interferon; RBV, ribavirin; SOF, sofosbuvir.
Treatment options for patients with HCV RF_2k/1b 7Hepatology Research
© 2020 The Japan Society of Hepatology
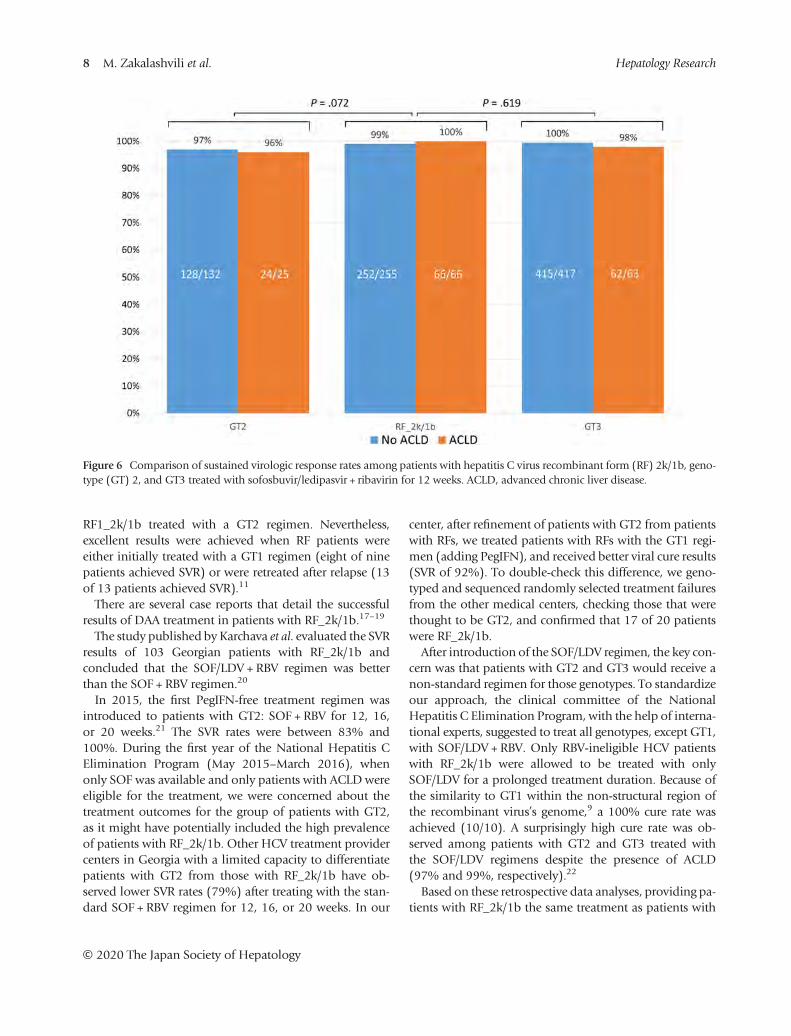
RF1_2k/1b treated with a GT2 regimen. Nevertheless,excellent results were achieved when RF patients wereeither initially treated with a GT1 regimen (eight of ninepatients achieved SVR) or were retreated after relapse (13of 13 patients achieved SVR).11
There are several case reports that detail the successfulresults of DAA treatment in patients with RF_2k/1b.17–19
The study published by Karchava et al. evaluated the SVRresults of 103 Georgian patients with RF_2k/1b andconcluded that the SOF/LDV + RBV regimen was betterthan the SOF + RBV regimen.20
In 2015, the first PegIFN‐free treatment regimen wasintroduced to patients with GT2: SOF + RBV for 12, 16,or 20 weeks.21 The SVR rates were between 83% and100%. During the first year of the National Hepatitis CElimination Program (May 2015–March 2016), whenonly SOF was available and only patients with ACLD wereeligible for the treatment, we were concerned about thetreatment outcomes for the group of patients with GT2,as it might have potentially included the high prevalenceof patients with RF_2k/1b. Other HCV treatment providercenters in Georgia with a limited capacity to differentiatepatients with GT2 from those with RF_2k/1b have ob-served lower SVR rates (79%) after treating with the stan-dard SOF + RBV regimen for 12, 16, or 20 weeks. In our
center, after refinement of patients with GT2 from patientswith RFs, we treated patients with RFs with the GT1 regi-men (adding PegIFN), and received better viral cure results(SVR of 92%). To double‐check this difference, we geno-typed and sequenced randomly selected treatment failuresfrom the other medical centers, checking those that werethought to be GT2, and confirmed that 17 of 20 patientswere RF_2k/1b.After introduction of the SOF/LDV regimen, the key con-
cern was that patients with GT2 and GT3 would receive anon‐standard regimen for those genotypes. To standardizeour approach, the clinical committee of the NationalHepatitis C Elimination Program, with the help of interna-tional experts, suggested to treat all genotypes, except GT1,with SOF/LDV + RBV. Only RBV‐ineligible HCV patientswith RF_2k/1b were allowed to be treated with onlySOF/LDV for a prolonged treatment duration. Because ofthe similarity to GT1 within the non‐structural region ofthe recombinant virus’s genome,9 a 100% cure rate wasachieved (10/10). A surprisingly high cure rate was ob-served among patients with GT2 and GT3 treated withthe SOF/LDV regimens despite the presence of ACLD(97% and 99%, respectively).22
Based on these retrospective data analyses, providing pa-tients with RF_2k/1b the same treatment as patients with
Figure 6 Comparison of sustained virologic response rates among patients with hepatitis C virus recombinant form (RF) 2k/1b, geno-type (GT) 2, and GT3 treated with sofosbuvir/ledipasvir + ribavirin for 12 weeks. ACLD, advanced chronic liver disease.
8 M. Zakalashvili et al. Hepatology Research
© 2020 The Japan Society of Hepatology
GT1 was the appropriate treatment decision. We can alsoassume that when GT2 was considered the best genotypefor a cure, the majority of treatment failures could havebeen patients with RF_2k/1b, at least in the country ofGeorgia.The data showed that treatment of patients with
RF_2k/1b with SOF/LDV or one of the pan‐genotypicdrugs (SOF/VEL) is extremely effective. We can alsoassume that other DAAs that are used for patients withGT1 and/or pan‐genotypic drugs might be as effective.Although the recent pan‐genotypic DAAs are ultimately
eliminating any concern related to the effect of genotypeon treatment response, the availability of these expensivedrugs is still currently limited. It is worth mentioning thatsix developing nations (China, Pakistan, Nigeria, Egypt,India, and Russia) account for more than half of HCVinfections worldwide.23
Continuous identification of recombinants could behelpful for making treatment choices until pan‐genotypicmedications become widely available and affordable.Identification of recombinants in high‐prevalence areasmight be reasonable for improving antiviral responserates, particularly in the context of HCV eliminationworldwide.16,24
In conclusion, identification of RF_2k/1b in treatment‐naïve or PegIFN/RBV treatment‐experienced patients,with or without liver cirrhosis, in countries wherepan‐genotypic drugs are available, is not necessary. How-ever, in areas where pan‐genotypic DAAs are not availableor affordable, especially in low‐income countries with ahigh prevalence of HCV infection, differentiating patientswith GT2 from those with RF_2k/1b might be reasonablefor choosing the most cost‐effective treatment regimens.
ACKNOWLEDGMENTS
WE THANK KELLY Schrank, MA, ELS, of BookwormEditing Services LLC for her editorial services in
preparing the manuscript for publication. This study wasfunded in part by Medical Service Center Dr. Limbach &colleagues, Heidelberg, Germany, and in part by MedicalCenter Mrcheveli, Tbilisi, Georgia.
REFERENCES
1 Lavanchy D. Evolving epidemiology of hepatitis C virus. ClinMicrobiol Infect 2011; 17: 107–15.
2 World Health Organization. Global hepatitis report, 2017.Available at: https://www.who.int/hepatitis/publications/global‐hepatitis‐report2017/en/ Accessed March 18, 2020.
3 Nasrullah M, Sergeenko D, Gamkrelidze A, Averhoff F. HCVelimination – lessons learned from a small Eurasian country,Georgia. Nat Rev Gastroenterol Hepatol 2017; 14: 447–8.
4 Gvinjilia L, Nasrullah M, Sergeenko D et al. National progresstoward hepatitis C elimination – Georgia, 2015–2016.MMWRMorb Mortal Wkly Rep 2016; 65: 1132–5.
5 Mitruka K, Tsertsvadze T, Butsashvili M et al. Launch of anationwide hepatitis C elimination program – Georgia, April2015. MMWR Morb Mortal Wkly Rep 2015; 65: 753–7.
6 Walker JG, Kuchuloria T, SergeenkoD et al. Interim effect eval-uation of the hepatitis C elimination programme in Georgia:a modelling study. Lancet Glob Health 2020; 8: e244–e253.
7 Tsertsvadze T, Gamkrelidze A, Chkhartishvili N et al. Threeyears of progress toward achieving hepatitis C elimination inthe country of Georgia, April 2015–March 2018. Clin InfectDis 2020; 71: 1263–8.
8 Zakalashvili M, Weizenegger M, Bartel J et al. Emergence ofhepatitis C virus genotype recombinant forms 2k/1b inGeorgia. Clin Lab 2016; 62: 1347–51.
9 ZakalashviliM, Zarkua J,WeizeneggerM et al. Identification ofhepatitis C virus 2k/1b intergenotypic recombinants inGeorgia. Liver Int 2018; 38: 451–7.
10 Hedskog C, Doehle B, Chodavarapu K et al. Characterizationof hepatitis C virus intergenotypic recombinant strains andassociated virological response to sofosbuvir/ribavirin.Hepatology 2015; 61: 471–80.
11 Susser S, Dietz J, Schlevogt B et al. Origin, prevalence andresponse to therapy of hepatitis C virus genotype 2k/1bchimeras. J Hepatol 2017; 76: 680–6.
12 European Association for the Study of the Liver. EASL recom-mendations on treatment of hepatitis C 2018. J Hepatol 2018;69: 461–511.
13 Smith DB, Bukh J, Kuiken C et al. Expanded classification ofhepatitis C virus into 7 genotypes and 67 subtypes: updatedcriteria and genotype assignment web resource. Hepatology2014; 59: 318–27.
14 Kalinina O, Norder H, Mukomolov S, Magnius LO. A naturalintergenotypic recombinant of hepatitis C virus identified inSt. Petersburg. J Virol 2002; 76: 4034–43.
15 Morel V, Fournier C, Francois C et al. Genetic recombinationof the hepatitis C virus: clinical implications. J Viral Hepat2011; 18: 77–83.
16 Raghwani J, Thomas XV, Koekkoek SM et al. Origin and evolu-tion of the unique hepatitis C virus circulating recombinantform 2k/1b. J Virol 2012; 86: 2212–20.
17 Paolucci S, Premoli M, Ludovisi S, Mondelli MU, Baldanti F.HCV intergenotype 2k/1b recombinant detected in a DAA‐treated patient in Italy. Antivir Ther 2017; 22: 365–8.
18 Kassela K, Karakasiliotis I, Kokkiou E et al. Intergenotypic2k/1b hepatitis C virus recombinants in the EastMacedonia and Thrace region of Greece. Ann Gastroenterol2019; 32: 88–92.
19 Hazzan R, Reish I, Barak M, Daniel R, Strauss M, ZuckermanE. Twelve weeks treatment with ombitasvir/paritaprevir/ritonavir and dasabuvir in chronic hepatitis C genotype 2k/
Treatment options for patients with HCV RF_2k/1b 9Hepatology Research
© 2020 The Japan Society of Hepatology

1b patients is highly efficient and safe. Ann Clin Hepatol 2019;3: 1010.
20 Karchava M, Chkhartishvili N, Sharvadze L et al. Impact ofhepatitis C virus recombinant form RF1_2k/1b on treatmentoutcomes within the Georgian national hepatitis C elimina-tion program. Hepatol Res 2018; 48: 36–44.
21 European Association for the Study of the Liver. EASL recom-mendations on treatment of hepatitis C 2015. J Hepatol 2015;63: 199–236.
22 Tsertsvadze T, Gamkrelidze A, Nasrullah M et al. Treatmentoutcomes of patients with chronic hepatitis C receiving
sofosbuvir‐based combination therapy within nationalhepatitis C elimination program in the country of Georgia.BMC Infect Dis 2020; 20: 30.
23 Hézode C. Pan‐genotypic treatment regimens for hepatitis Cvirus: advantages and disadvantages in high‐ and low‐incomeregions. J Viral Hepat 2017; 24: 92–101.
24 Pawlotsky JM. DAA failures in African patients with “unusual”HCV subtypes: Hey! Didn’t you know there was anotherworld? J Hepatol 2019; 71: 1070–2.
10 M. Zakalashvili et al. Hepatology Research
© 2020 The Japan Society of Hepatology
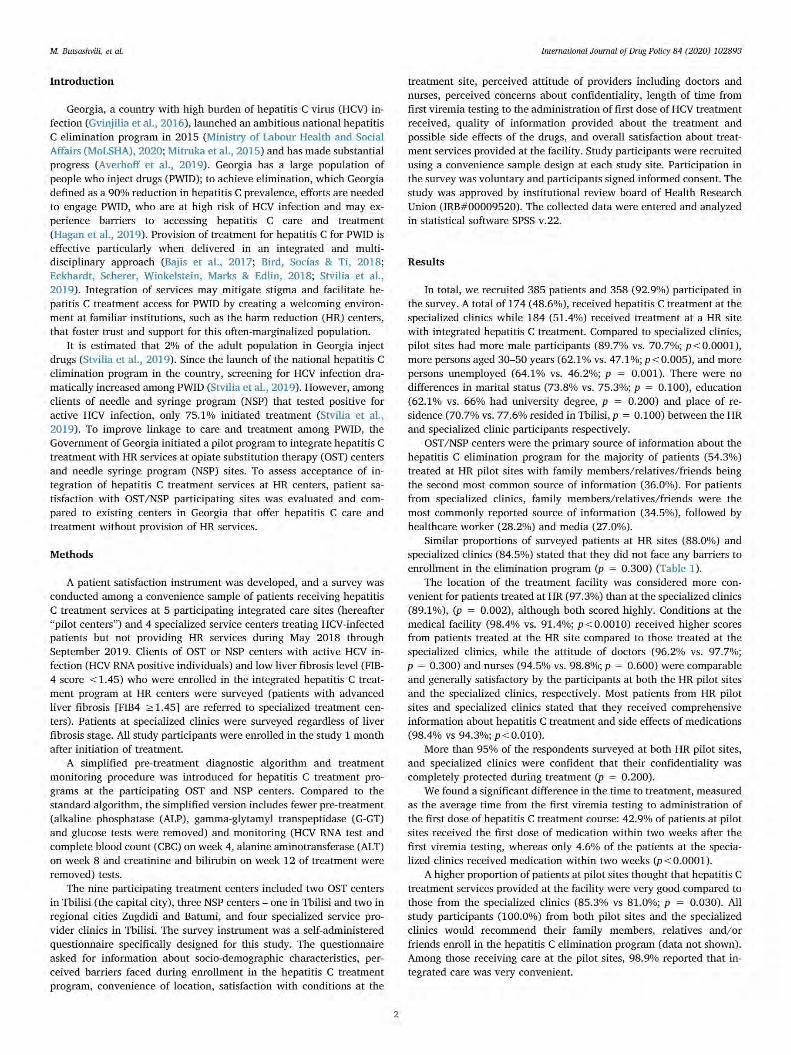
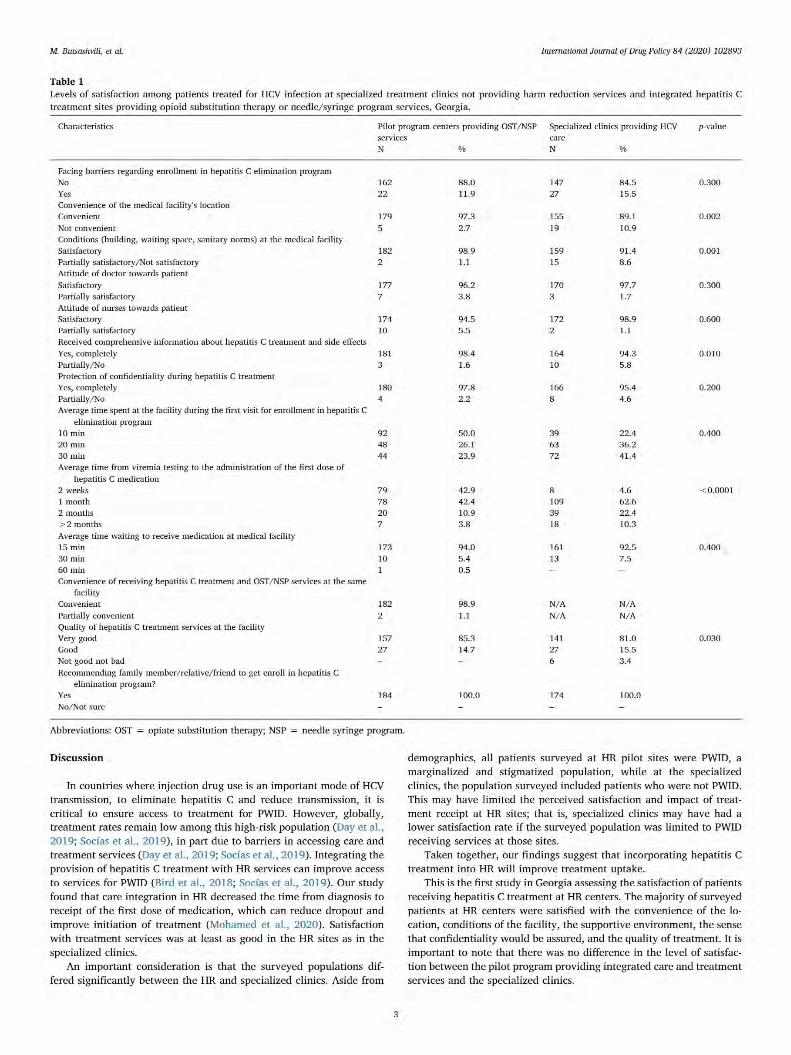
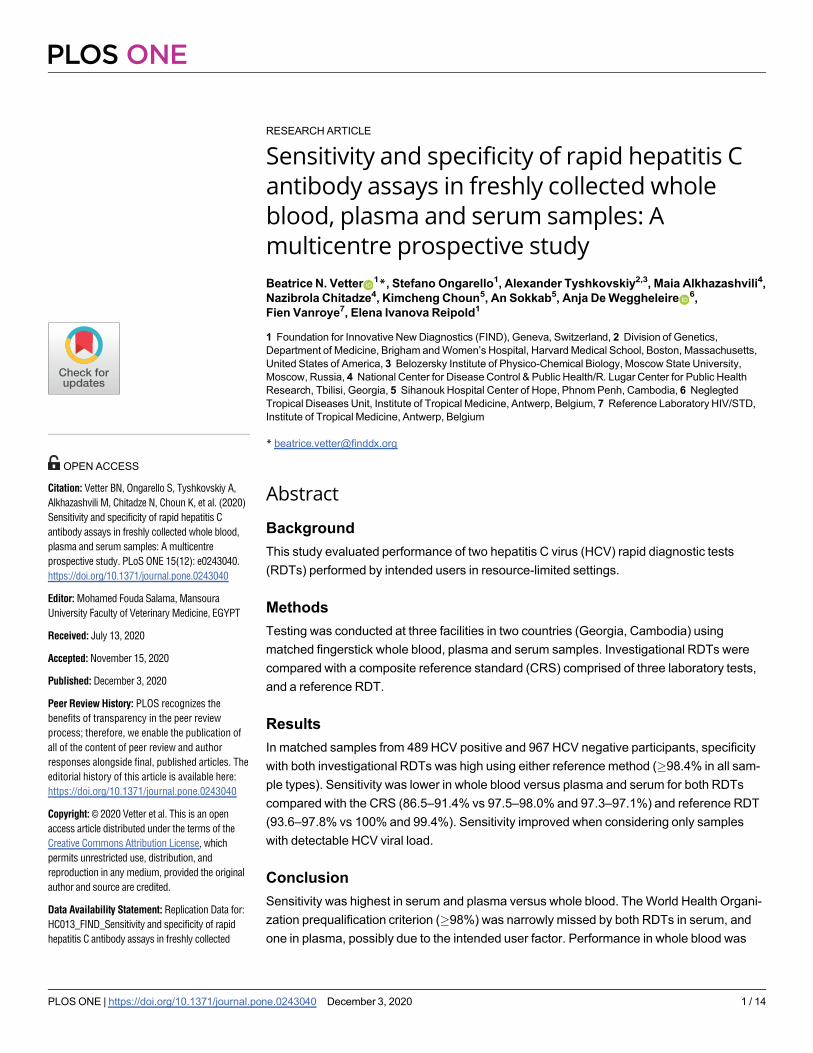
RESEARCH ARTICLE
Sensitivity and specificity of rapid hepatitis C
antibody assays in freshly collected whole
blood, plasma and serum samples: A
multicentre prospective study
Beatrice N. VetterID1*, Stefano Ongarello1, Alexander Tyshkovskiy2,3, Maia Alkhazashvili4,Nazibrola Chitadze4, Kimcheng Choun5, An Sokkab5, Anja DeWeggheleireID6,Fien Vanroye7, Elena Ivanova Reipold1
1 Foundation for Innovative New Diagnostics (FIND), Geneva, Switzerland, 2 Division of Genetics,Department of Medicine, Brigham and Women’s Hospital, Harvard Medical School, Boston, Massachusetts,United States of America, 3 Belozersky Institute of Physico-Chemical Biology, Moscow State University,Moscow, Russia, 4 National Center for Disease Control & Public Health/R. Lugar Center for Public HealthResearch, Tbilisi, Georgia, 5 Sihanouk Hospital Center of Hope, Phnom Penh, Cambodia, 6 NeglegtedTropical Diseases Unit, Institute of Tropical Medicine, Antwerp, Belgium, 7 Reference Laboratory HIV/STD,Institute of Tropical Medicine, Antwerp, Belgium
Abstract
BackgroundThis study evaluated performance of two hepatitis C virus (HCV) rapid diagnostic tests(RDTs) performed by intended users in resource-limited settings.
MethodsTesting was conducted at three facilities in two countries (Georgia, Cambodia) usingmatched fingerstick whole blood, plasma and serum samples. Investigational RDTs werecompared with a composite reference standard (CRS) comprised of three laboratory tests,and a reference RDT.
ResultsIn matched samples from 489 HCV positive and 967 HCV negative participants, specificitywith both investigational RDTs was high using either reference method (�98.4% in all sam-ple types). Sensitivity was lower in whole blood versus plasma and serum for both RDTscompared with the CRS (86.5–91.4% vs 97.5–98.0% and 97.3–97.1%) and reference RDT(93.6–97.8% vs 100% and 99.4%). Sensitivity improved when considering only sampleswith detectable HCV viral load.
ConclusionSensitivity was highest in serum and plasma versus whole blood. The World Health Organi-zation prequalification criterion (�98%) was narrowly missed by both RDTs in serum, andone in plasma, possibly due to the intended user factor. Performance in whole blood was
PLOS ONE
PLOS ONE | https://doi.org/10.1371/journal.pone.0243040 December 3, 2020 1 / 14
a1111111111a1111111111a1111111111a1111111111a1111111111
OPEN ACCESS
Citation: Vetter BN, Ongarello S, Tyshkovskiy A,
Alkhazashvili M, Chitadze N, Choun K, et al. (2020)
Sensitivity and specificity of rapid hepatitis C
antibody assays in freshly collected whole blood,
plasma and serum samples: A multicentre
prospective study. PLoS ONE 15(12): e0243040.
https://doi.org/10.1371/journal.pone.0243040
Editor: Mohamed Fouda Salama, Mansoura
University Faculty of Veterinary Medicine, EGYPT
Received: July 13, 2020
Accepted: November 15, 2020
Published: December 3, 2020
Peer Review History: PLOS recognizes the
benefits of transparency in the peer review
process; therefore, we enable the publication of
all of the content of peer review and author
responses alongside final, published articles. The
editorial history of this article is available here:
https://doi.org/10.1371/journal.pone.0243040
Copyright:© 2020 Vetter et al. This is an open
access article distributed under the terms of the
Creative Commons Attribution License, which
permits unrestricted use, distribution, and
reproduction in any medium, provided the original
author and source are credited.
Data Availability Statement: Replication Data for:
HC013_FIND_Sensitivity and specificity of rapid
hepatitis C antibody assays in freshly collected
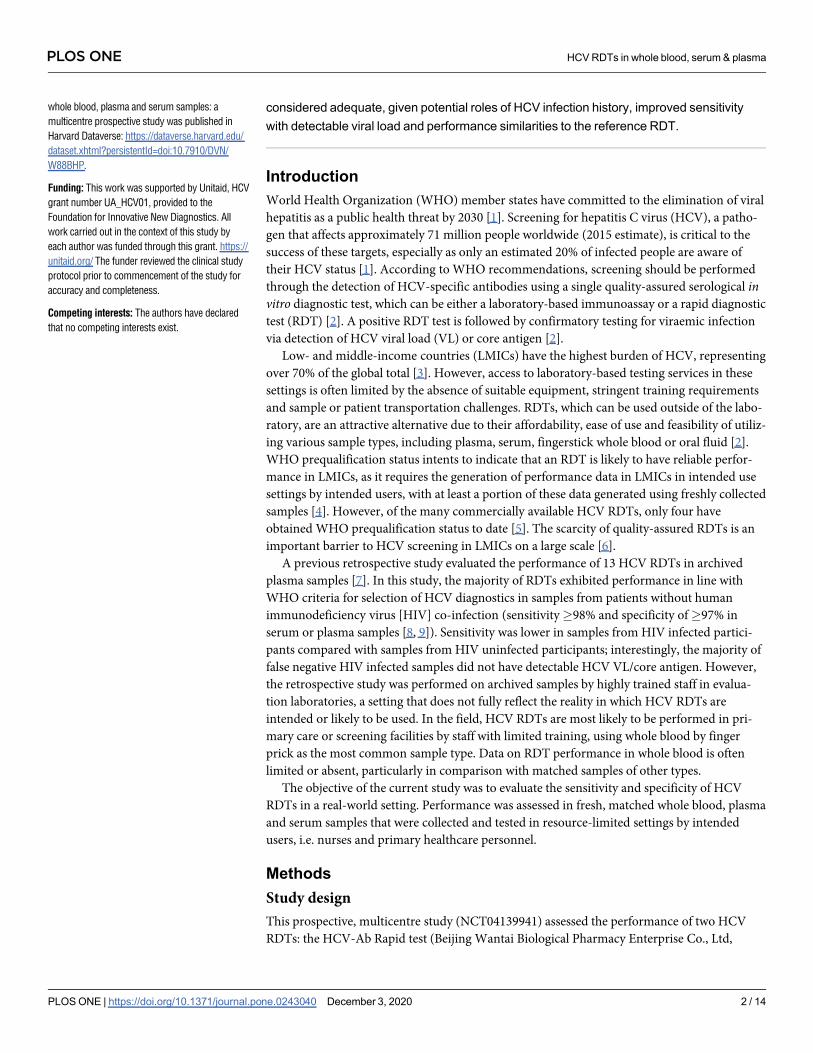
considered adequate, given potential roles of HCV infection history, improved sensitivitywith detectable viral load and performance similarities to the reference RDT.
IntroductionWorld Health Organization (WHO) member states have committed to the elimination of viralhepatitis as a public health threat by 2030 [1]. Screening for hepatitis C virus (HCV), a patho-gen that affects approximately 71 million people worldwide (2015 estimate), is critical to thesuccess of these targets, especially as only an estimated 20% of infected people are aware oftheir HCV status [1]. According to WHO recommendations, screening should be performedthrough the detection of HCV-specific antibodies using a single quality-assured serological invitro diagnostic test, which can be either a laboratory-based immunoassay or a rapid diagnostictest (RDT) [2]. A positive RDT test is followed by confirmatory testing for viraemic infectionvia detection of HCV viral load (VL) or core antigen [2].
Low- and middle-income countries (LMICs) have the highest burden of HCV, representingover 70% of the global total [3]. However, access to laboratory-based testing services in thesesettings is often limited by the absence of suitable equipment, stringent training requirementsand sample or patient transportation challenges. RDTs, which can be used outside of the labo-ratory, are an attractive alternative due to their affordability, ease of use and feasibility of utiliz-ing various sample types, including plasma, serum, fingerstick whole blood or oral fluid [2].WHO prequalification status intents to indicate that an RDT is likely to have reliable perfor-mance in LMICs, as it requires the generation of performance data in LMICs in intended usesettings by intended users, with at least a portion of these data generated using freshly collectedsamples [4]. However, of the many commercially available HCV RDTs, only four haveobtained WHO prequalification status to date [5]. The scarcity of quality-assured RDTs is animportant barrier to HCV screening in LMICs on a large scale [6].
A previous retrospective study evaluated the performance of 13 HCV RDTs in archivedplasma samples [7]. In this study, the majority of RDTs exhibited performance in line withWHO criteria for selection of HCV diagnostics in samples from patients without humanimmunodeficiency virus [HIV] co-infection (sensitivity�98% and specificity of�97% inserum or plasma samples [8, 9]). Sensitivity was lower in samples from HIV infected partici-pants compared with samples from HIV uninfected participants; interestingly, the majority offalse negative HIV infected samples did not have detectable HCV VL/core antigen. However,the retrospective study was performed on archived samples by highly trained staff in evalua-tion laboratories, a setting that does not fully reflect the reality in which HCV RDTs areintended or likely to be used. In the field, HCV RDTs are most likely to be performed in pri-mary care or screening facilities by staff with limited training, using whole blood by fingerprick as the most common sample type. Data on RDT performance in whole blood is oftenlimited or absent, particularly in comparison with matched samples of other types.
The objective of the current study was to evaluate the sensitivity and specificity of HCVRDTs in a real-world setting. Performance was assessed in fresh, matched whole blood, plasmaand serum samples that were collected and tested in resource-limited settings by intendedusers, i.e. nurses and primary healthcare personnel.
MethodsStudy designThis prospective, multicentre study (NCT04139941) assessed the performance of two HCVRDTs: the HCV-Ab Rapid test (Beijing Wantai Biological Pharmacy Enterprise Co., Ltd,
PLOS ONE HCV RDTs in whole blood, serum & plasma
PLOS ONE | https://doi.org/10.1371/journal.pone.0243040 December 3, 2020 2 / 14
whole blood, plasma and serum samples: a
multicentre prospective study was published in
Harvard Dataverse: https://dataverse.harvard.edu/
dataset.xhtml?persistentId=doi:10.7910/DVN/
W88BHP.
Funding: This work was supported by Unitaid, HCV
grant number UA_HCV01, provided to the
Foundation for Innovative New Diagnostics. All
work carried out in the context of this study by
each author was funded through this grant. https://
unitaid.org/ The funder reviewed the clinical study
protocol prior to commencement of the study for
accuracy and completeness.
Competing interests: The authors have declared
that no competing interests exist.
Beijing, China) and the First Response HCV card test (Premier Medical Corporation Ltd.,Mumbai, India). Operational characteristics of these tests are shown in S1 Table. These RDTswere selected as they met WHO prequalification criteria in archived plasma samples in theprevious study [7], and the manufacturers had demonstrated a commitment to seeking WHOprequalification status.
Testing was conducted at three primary healthcare facilities in two countries. These were: ageneral outpatient clinic at the Sihanouk Hospital Center of Hope (SHCH), a non-governmen-tal hospital providing low-cost medical care in Phnom Penh, Cambodia; an HCV screeningfacility at the National Center for Disease Control and Public Health (NCDC) in Tbilisi, Geor-gia; and an opioid substitution treatment facility at the Centre for Mental Health and Preven-tion of Addiction (CMHPA), also in Tbilisi, Georgia.
RDTs were tested on three sample types: fingerstick whole blood, ethylenediaminetetraace-tic acid (EDTA) plasma, and serum (matched samples), all collected and tested on the sameday. Performance was compared with three WHO prequalified laboratory reference tests, ofwhich two were enzyme immunoassays (EIAs; Murex Anti-HCV version 4.0, FujirebioINNOTEST HCV Ab IV) and one was a line immunoassay (LIA; Fujirebio INNO-LIA HCVScore), using a previously described composite reference standard (CRS) that incorporated theresults of all three reference tests [7]. The algorithm was based on WHO prequalification eval-uation protocols, with the final decision being based on the LIA test result. A signal-to-cut-offratio of�1 (based on the measured optical density) was used for the EIAs; interpretation ofLIA results was performed according to manufacturer instructions. Performance of the twoinvestigational RDTs was also compared with a reference RDT, the WHO prequalified SD Bio-line HCV test (Abbott Laboratories, Lake Bluff, USA; operational characteristics shown in S1Table).
Reference testing was conducted at diagnostic reference laboratories (R. Lugar Center forPublic Health Research, Tbilisi, Georgia and Biobykhin Medical Analysis Laboratory, PhnomPenh, Cambodia) using plasma samples, collected and tested on fresh or non-frozen samples(stored at 4˚C) within seven days of sample collection, in accordance with manufacturerinstructions for use. Confirmatory testing to obtain HCV VL and genotyping information wasperformed on fresh plasma samples. Tests used for determination of HCV VL were the Real-Time HCV viral load assay (Abbott Laboratories, Lake Bluff, USA; limit of detection [LOD] 12IU/mL) in Georgia and the AccuPid HCV Real-time PCR Quantification Kit (Khoa ThuongBiotechnology, Ho Chi Minh City, Vietnam; LOD 21 IU/mL) in Cambodia. Testing was per-formed between July 2019 and December 2019. Ethics approval for this study was obtainedfrom the Cambodian National Ethics Committee for Health Research and the GeorgianNational Center for Disease Control and Public Health Institutional Review Board. Writteninformed consent was obtained from all study participants.
Participant recruitmentParticipants providing samples were required to be aged�18 years, have no history of HCVtreatment (past or present), and be willing to perform an HIV test. At SHCH in Cambodia, allindividuals visiting the facility as outpatients were invited to participate in the study until thedaily recruitment target (~10 participants/day) was met. At CMHPA and NCDC in Georgia,all individuals visiting the facility were invited to participate. Additionally, known HCV posi-tive individuals from the site databases were contacted and invited to participate. Participantdemographic and medical history information was collected, including age, HIV status, othermedications and infections, and recent vaccinations. Counselling related to HCV test resultswas offered, and all participants received HCV confirmatory testing. Participants were
PLOS ONE HCV RDTs in whole blood, serum & plasma
PLOS ONE | https://doi.org/10.1371/journal.pone.0243040 December 3, 2020 3 / 14
assigned to the HCV positive and HCV negative group based on the result of the compositereference standard. If positive, Cambodian participants were given free treatment; Georgianparticipants received treatment via the national HCV treatment programme. The HCV statusof participants was not known to RDT testers.
RDT performance assessmentsEvery sample type was tested and interpreted once per RDT. Invalid results were repeated once,and plasma and serum samples were repeated in duplicate if the initial result was different tothe reference RDT SD Bioline. Two lots of each RDT were used; the complete sample popula-tion was tested to approximately 50% with lot 1 and 50% with lot 2. Testers were nurses and pri-mary healthcare personnel who are intended to perform RDT screening as per each countries’healthcare system. A number of different testers performed the tests at each site. The number ofdifferent testers for whole blood samples was 6, 2 and 4 at SHCH, CMHPA and NCDC, respec-tively. The corresponding numbers of testers for plasma and serum were 3, 2 and 3.
Data captureParticipant demographic, medical history, RDT and LIA results were initially captured onpaper case report forms. Viral load and genotype results, as well as EIA results were capturedin electronic format on the respective analyses platforms. All data were subsequently enteredinto the electronic databased Open Clinica v4.0.
Outcome measuresThe primary outcome was the estimates of sensitivity and specificity of the two RDTs in eachof the three sample types, compared with the CRS. Sensitivity and specificity compared withthe reference RDT SD Bioline was a secondary outcome. For both outcomes, sensitivity andspecificity were calculated for the overall sample set, by country and in the subset of sampleswith detectable HCV VL. Furthermore, statistical difference in performance between the sam-ple types was assessed for both outcomes. Additionally, a multivariate analysis was performedto evaluate the impact of different demographic factors on RDT sensitivity in whole blood.
Statistical analysesFor sample size calculations, sensitivity and specificity was assumed to be 90% for whole bloodand 95% for plasma and serum samples. However, using these assumptions, the minimumsample sizes to achieve 80% power with a 95% CI of ±5% were lower than WHO TechnicalSpecification Series-7 (TSS-7) requirements of 400 HCV positive and 1000 HCV antibody andRNA negative samples for diagnostic assessments of HCV RDTs [4]. Therefore, the TSS-7 val-ues were used, with a 10% increase to account for sample exclusion due to indeterminate HCVstatus with the CRS (based on experience from the previous study [7]). Final sample size tar-gets were 440 HCV antibody positive (HCV positive) and 1,100 HCV antibody negative (HCVnegative) samples.
Point estimates with 95% confidence intervals based on Wilson’s score method, were calcu-lated for sensitivity and specificity. A performance comparison was performed using Pearson’schi-square test with Bonferroni adjustment to estimate statistical differences in RDT perfor-mance between sample types and by sample type between the two countries. Statistical analysiswas performed using R (version 3.6).
Covariates included in the multivariate logistic regression were age, gender, presence ofdetectable viral load, HCV genotype and country. The model was applied separately for each
PLOS ONE HCV RDTs in whole blood, serum & plasma
PLOS ONE | https://doi.org/10.1371/journal.pone.0243040 December 3, 2020 4 / 14
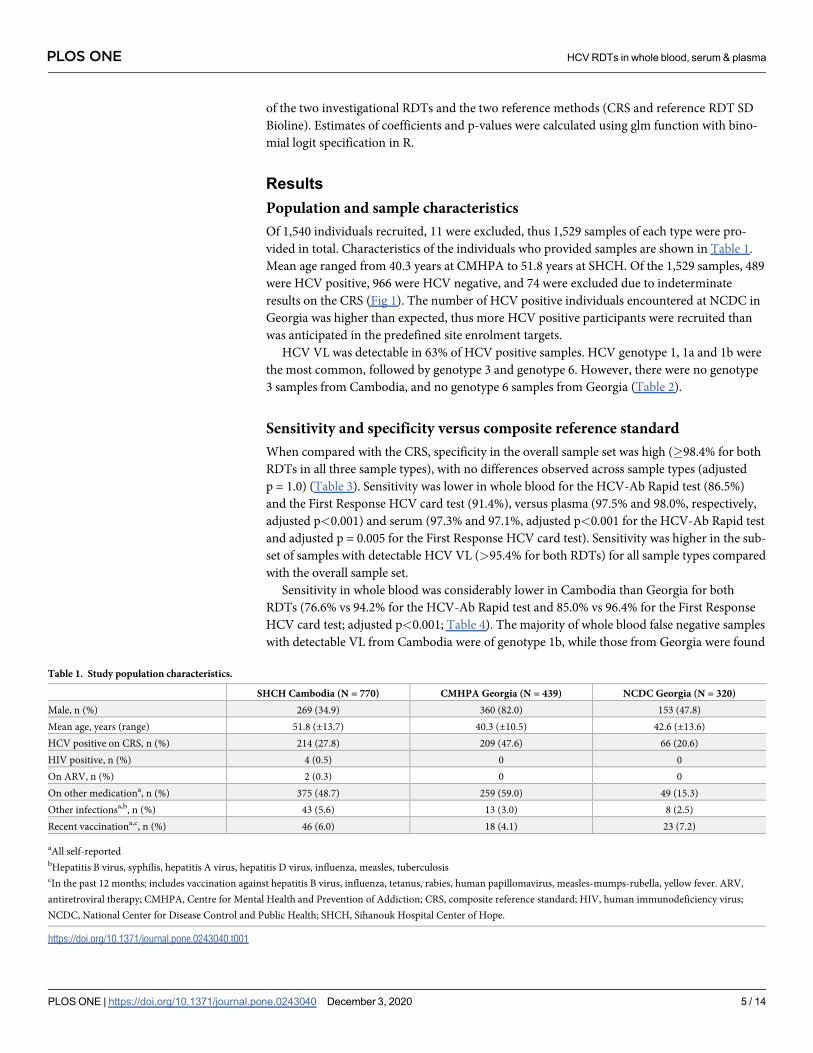
of the two investigational RDTs and the two reference methods (CRS and reference RDT SDBioline). Estimates of coefficients and p-values were calculated using glm function with bino-mial logit specification in R.
ResultsPopulation and sample characteristicsOf 1,540 individuals recruited, 11 were excluded, thus 1,529 samples of each type were pro-vided in total. Characteristics of the individuals who provided samples are shown in Table 1.Mean age ranged from 40.3 years at CMHPA to 51.8 years at SHCH. Of the 1,529 samples, 489were HCV positive, 966 were HCV negative, and 74 were excluded due to indeterminateresults on the CRS (Fig 1). The number of HCV positive individuals encountered at NCDC inGeorgia was higher than expected, thus more HCV positive participants were recruited thanwas anticipated in the predefined site enrolment targets.
HCV VL was detectable in 63% of HCV positive samples. HCV genotype 1, 1a and 1b werethe most common, followed by genotype 3 and genotype 6. However, there were no genotype3 samples from Cambodia, and no genotype 6 samples from Georgia (Table 2).
Sensitivity and specificity versus composite reference standardWhen compared with the CRS, specificity in the overall sample set was high (�98.4% for bothRDTs in all three sample types), with no differences observed across sample types (adjustedp = 1.0) (Table 3). Sensitivity was lower in whole blood for the HCV-Ab Rapid test (86.5%)and the First Response HCV card test (91.4%), versus plasma (97.5% and 98.0%, respectively,adjusted p<0.001) and serum (97.3% and 97.1%, adjusted p<0.001 for the HCV-Ab Rapid testand adjusted p = 0.005 for the First Response HCV card test). Sensitivity was higher in the sub-set of samples with detectable HCV VL (>95.4% for both RDTs) for all sample types comparedwith the overall sample set.
Sensitivity in whole blood was considerably lower in Cambodia than Georgia for bothRDTs (76.6% vs 94.2% for the HCV-Ab Rapid test and 85.0% vs 96.4% for the First ResponseHCV card test; adjusted p<0.001; Table 4). The majority of whole blood false negative sampleswith detectable VL from Cambodia were of genotype 1b, while those from Georgia were found
Table 1. Study population characteristics.
SHCH Cambodia (N = 770) CMHPA Georgia (N = 439) NCDC Georgia (N = 320)Male, n (%) 269 (34.9) 360 (82.0) 153 (47.8)Mean age, years (range) 51.8 (±13.7) 40.3 (±10.5) 42.6 (±13.6)HCV positive on CRS, n (%) 214 (27.8) 209 (47.6) 66 (20.6)HIV positive, n (%) 4 (0.5) 0 0On ARV, n (%) 2 (0.3) 0 0On other medicationa, n (%) 375 (48.7) 259 (59.0) 49 (15.3)Other infectionsa,b, n (%) 43 (5.6) 13 (3.0) 8 (2.5)Recent vaccinationa,c, n (%) 46 (6.0) 18 (4.1) 23 (7.2)
aAll self-reportedbHepatitis B virus, syphilis, hepatitis A virus, hepatitis D virus, influenza, measles, tuberculosiscIn the past 12 months; includes vaccination against hepatitis B virus, influenza, tetanus, rabies, human papillomavirus, measles-mumps-rubella, yellow fever. ARV,antiretroviral therapy; CMHPA, Centre for Mental Health and Prevention of Addiction; CRS, composite reference standard; HIV, human immunodeficiency virus;NCDC, National Center for Disease Control and Public Health; SHCH, Sihanouk Hospital Center of Hope.
https://doi.org/10.1371/journal.pone.0243040.t001
PLOS ONE HCV RDTs in whole blood, serum & plasma
PLOS ONE | https://doi.org/10.1371/journal.pone.0243040 December 3, 2020 5 / 14
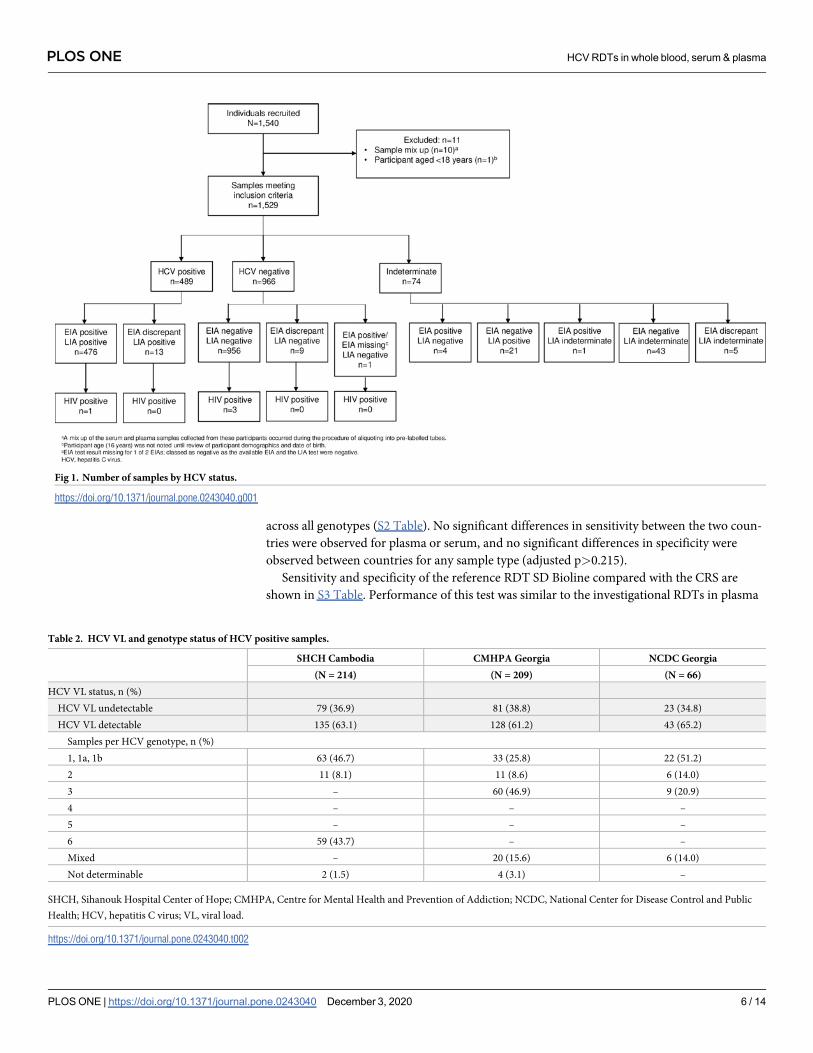
across all genotypes (S2 Table). No significant differences in sensitivity between the two coun-tries were observed for plasma or serum, and no significant differences in specificity wereobserved between countries for any sample type (adjusted p>0.215).
Sensitivity and specificity of the reference RDT SD Bioline compared with the CRS areshown in S3 Table. Performance of this test was similar to the investigational RDTs in plasma
Fig 1. Number of samples by HCV status.
https://doi.org/10.1371/journal.pone.0243040.g001
Table 2. HCV VL and genotype status of HCV positive samples.
SHCH Cambodia CMHPA Georgia NCDC Georgia(N = 214) (N = 209) (N = 66)
HCV VL status, n (%)HCV VL undetectable 79 (36.9) 81 (38.8) 23 (34.8)HCV VL detectable 135 (63.1) 128 (61.2) 43 (65.2)
Samples per HCV genotype, n (%)1, 1a, 1b 63 (46.7) 33 (25.8) 22 (51.2)2 11 (8.1) 11 (8.6) 6 (14.0)3 – 60 (46.9) 9 (20.9)4 – – –5 – – –6 59 (43.7) – –Mixed – 20 (15.6) 6 (14.0)Not determinable 2 (1.5) 4 (3.1) –
SHCH, Sihanouk Hospital Center of Hope; CMHPA, Centre for Mental Health and Prevention of Addiction; NCDC, National Center for Disease Control and PublicHealth; HCV, hepatitis C virus; VL, viral load.
https://doi.org/10.1371/journal.pone.0243040.t002
PLOS ONE HCV RDTs in whole blood, serum & plasma
PLOS ONE | https://doi.org/10.1371/journal.pone.0243040 December 3, 2020 6 / 14
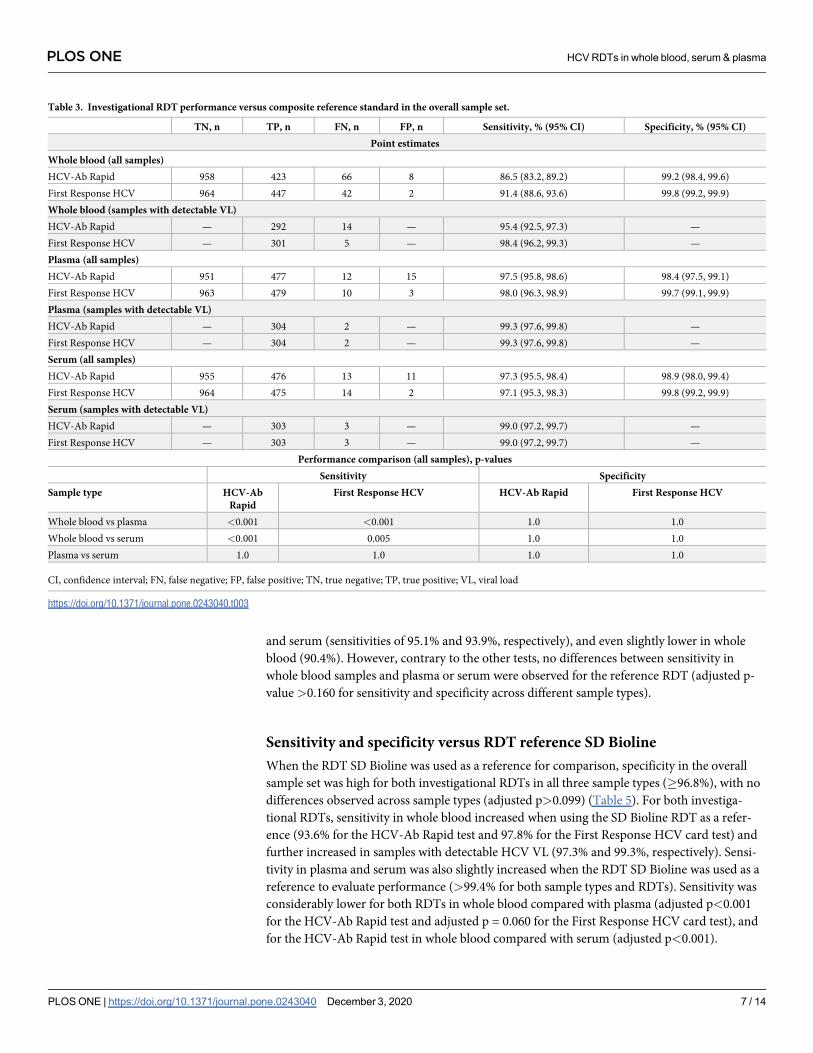
and serum (sensitivities of 95.1% and 93.9%, respectively), and even slightly lower in wholeblood (90.4%). However, contrary to the other tests, no differences between sensitivity inwhole blood samples and plasma or serum were observed for the reference RDT (adjusted p-value>0.160 for sensitivity and specificity across different sample types).
Sensitivity and specificity versus RDT reference SD BiolineWhen the RDT SD Bioline was used as a reference for comparison, specificity in the overallsample set was high for both investigational RDTs in all three sample types (�96.8%), with nodifferences observed across sample types (adjusted p>0.099) (Table 5). For both investiga-tional RDTs, sensitivity in whole blood increased when using the SD Bioline RDT as a refer-ence (93.6% for the HCV-Ab Rapid test and 97.8% for the First Response HCV card test) andfurther increased in samples with detectable HCV VL (97.3% and 99.3%, respectively). Sensi-tivity in plasma and serum was also slightly increased when the RDT SD Bioline was used as areference to evaluate performance (>99.4% for both sample types and RDTs). Sensitivity wasconsiderably lower for both RDTs in whole blood compared with plasma (adjusted p<0.001for the HCV-Ab Rapid test and adjusted p = 0.060 for the First Response HCV card test), andfor the HCV-Ab Rapid test in whole blood compared with serum (adjusted p<0.001).
Table 3. Investigational RDT performance versus composite reference standard in the overall sample set.
TN, n TP, n FN, n FP, n Sensitivity, % (95% CI) Specificity, % (95% CI)Point estimates
Whole blood (all samples)HCV-Ab Rapid 958 423 66 8 86.5 (83.2, 89.2) 99.2 (98.4, 99.6)First Response HCV 964 447 42 2 91.4 (88.6, 93.6) 99.8 (99.2, 99.9)Whole blood (samples with detectable VL)HCV-Ab Rapid — 292 14 — 95.4 (92.5, 97.3) —First Response HCV — 301 5 — 98.4 (96.2, 99.3) —Plasma (all samples)HCV-Ab Rapid 951 477 12 15 97.5 (95.8, 98.6) 98.4 (97.5, 99.1)First Response HCV 963 479 10 3 98.0 (96.3, 98.9) 99.7 (99.1, 99.9)Plasma (samples with detectable VL)HCV-Ab Rapid — 304 2 — 99.3 (97.6, 99.8) —First Response HCV — 304 2 — 99.3 (97.6, 99.8) —Serum (all samples)HCV-Ab Rapid 955 476 13 11 97.3 (95.5, 98.4) 98.9 (98.0, 99.4)First Response HCV 964 475 14 2 97.1 (95.3, 98.3) 99.8 (99.2, 99.9)Serum (samples with detectable VL)HCV-Ab Rapid — 303 3 — 99.0 (97.2, 99.7) —First Response HCV — 303 3 — 99.0 (97.2, 99.7) —
Performance comparison (all samples), p-valuesSensitivity Specificity
Sample type HCV-AbRapid
First Response HCV HCV-Ab Rapid First Response HCV
Whole blood vs plasma <0.001 <0.001 1.0 1.0Whole blood vs serum <0.001 0.005 1.0 1.0Plasma vs serum 1.0 1.0 1.0 1.0
CI, confidence interval; FN, false negative; FP, false positive; TN, true negative; TP, true positive; VL, viral load
https://doi.org/10.1371/journal.pone.0243040.t003
PLOS ONE HCV RDTs in whole blood, serum & plasma
PLOS ONE | https://doi.org/10.1371/journal.pone.0243040 December 3, 2020 7 / 14
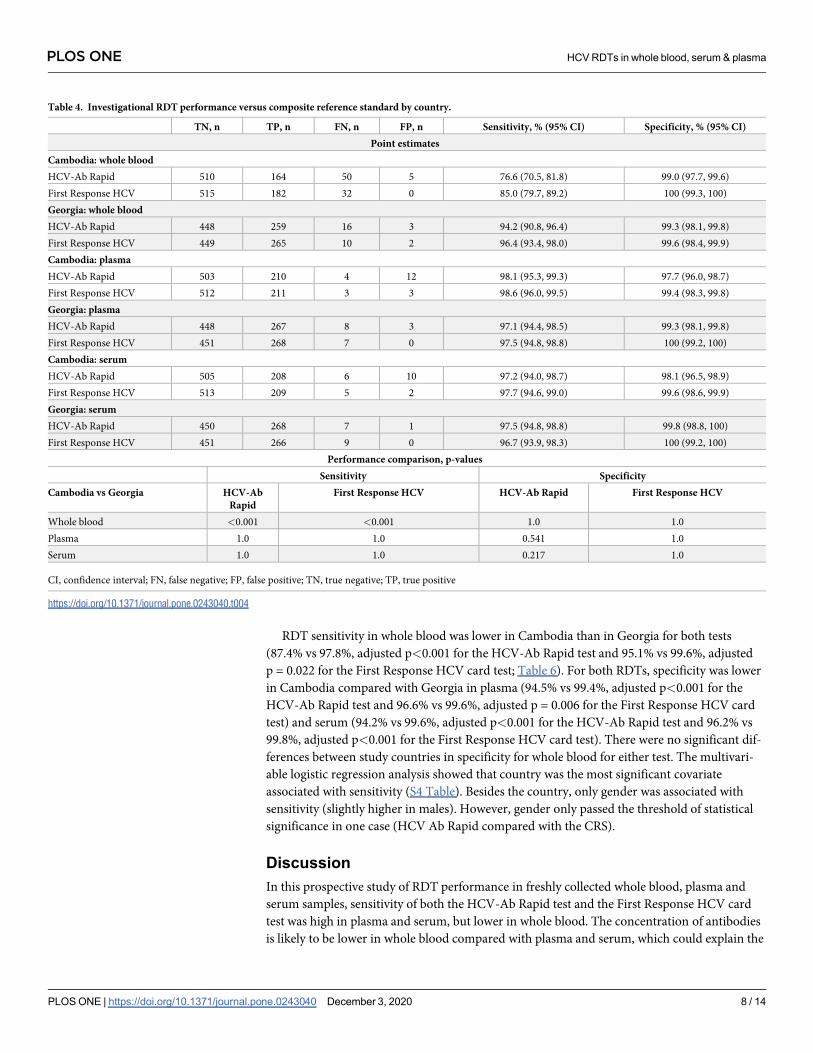
RDT sensitivity in whole blood was lower in Cambodia than in Georgia for both tests(87.4% vs 97.8%, adjusted p<0.001 for the HCV-Ab Rapid test and 95.1% vs 99.6%, adjustedp = 0.022 for the First Response HCV card test; Table 6). For both RDTs, specificity was lowerin Cambodia compared with Georgia in plasma (94.5% vs 99.4%, adjusted p<0.001 for theHCV-Ab Rapid test and 96.6% vs 99.6%, adjusted p = 0.006 for the First Response HCV cardtest) and serum (94.2% vs 99.6%, adjusted p<0.001 for the HCV-Ab Rapid test and 96.2% vs99.8%, adjusted p<0.001 for the First Response HCV card test). There were no significant dif-ferences between study countries in specificity for whole blood for either test. The multivari-able logistic regression analysis showed that country was the most significant covariateassociated with sensitivity (S4 Table). Besides the country, only gender was associated withsensitivity (slightly higher in males). However, gender only passed the threshold of statisticalsignificance in one case (HCV Ab Rapid compared with the CRS).
DiscussionIn this prospective study of RDT performance in freshly collected whole blood, plasma andserum samples, sensitivity of both the HCV-Ab Rapid test and the First Response HCV cardtest was high in plasma and serum, but lower in whole blood. The concentration of antibodiesis likely to be lower in whole blood compared with plasma and serum, which could explain the
Table 4. Investigational RDT performance versus composite reference standard by country.
TN, n TP, n FN, n FP, n Sensitivity, % (95% CI) Specificity, % (95% CI)Point estimates
Cambodia: whole bloodHCV-Ab Rapid 510 164 50 5 76.6 (70.5, 81.8) 99.0 (97.7, 99.6)First Response HCV 515 182 32 0 85.0 (79.7, 89.2) 100 (99.3, 100)Georgia: whole bloodHCV-Ab Rapid 448 259 16 3 94.2 (90.8, 96.4) 99.3 (98.1, 99.8)First Response HCV 449 265 10 2 96.4 (93.4, 98.0) 99.6 (98.4, 99.9)Cambodia: plasmaHCV-Ab Rapid 503 210 4 12 98.1 (95.3, 99.3) 97.7 (96.0, 98.7)First Response HCV 512 211 3 3 98.6 (96.0, 99.5) 99.4 (98.3, 99.8)Georgia: plasmaHCV-Ab Rapid 448 267 8 3 97.1 (94.4, 98.5) 99.3 (98.1, 99.8)First Response HCV 451 268 7 0 97.5 (94.8, 98.8) 100 (99.2, 100)Cambodia: serumHCV-Ab Rapid 505 208 6 10 97.2 (94.0, 98.7) 98.1 (96.5, 98.9)First Response HCV 513 209 5 2 97.7 (94.6, 99.0) 99.6 (98.6, 99.9)Georgia: serumHCV-Ab Rapid 450 268 7 1 97.5 (94.8, 98.8) 99.8 (98.8, 100)First Response HCV 451 266 9 0 96.7 (93.9, 98.3) 100 (99.2, 100)
Performance comparison, p-valuesSensitivity Specificity
Cambodia vs Georgia HCV-AbRapid
First Response HCV HCV-Ab Rapid First Response HCV
Whole blood <0.001 <0.001 1.0 1.0Plasma 1.0 1.0 0.541 1.0Serum 1.0 1.0 0.217 1.0
CI, confidence interval; FN, false negative; FP, false positive; TN, true negative; TP, true positive
https://doi.org/10.1371/journal.pone.0243040.t004
PLOS ONE HCV RDTs in whole blood, serum & plasma
PLOS ONE | https://doi.org/10.1371/journal.pone.0243040 December 3, 2020 8 / 14
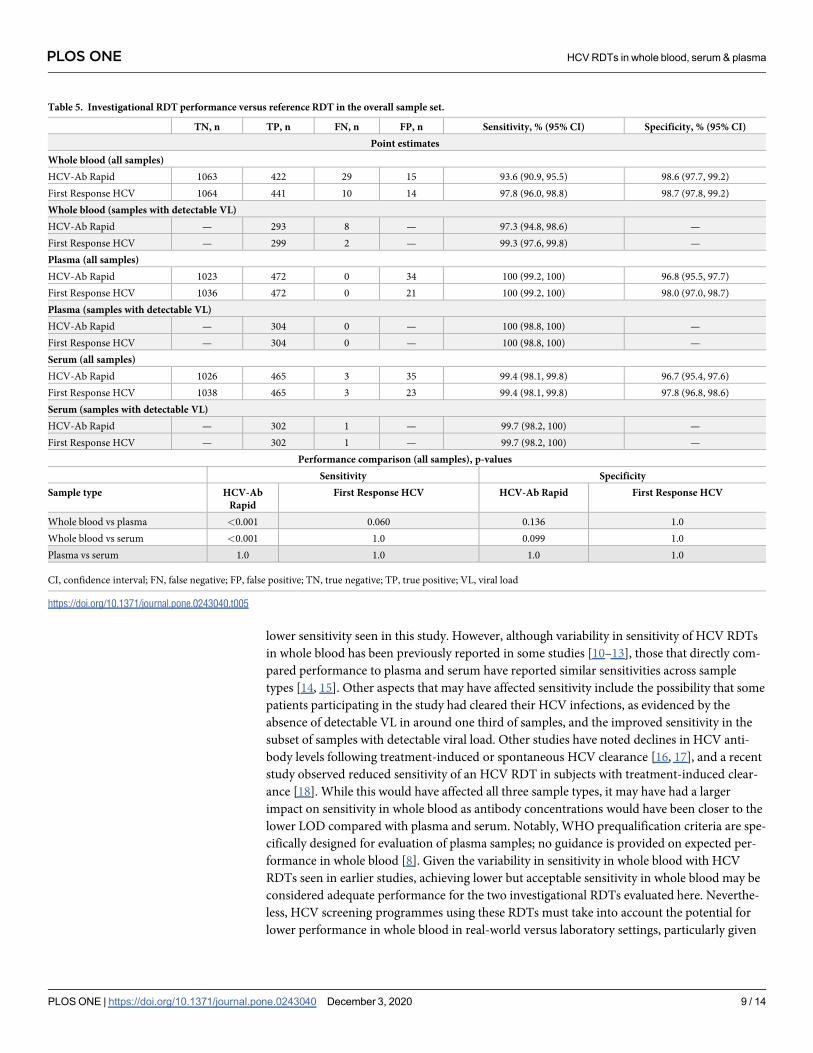
lower sensitivity seen in this study. However, although variability in sensitivity of HCV RDTsin whole blood has been previously reported in some studies [10–13], those that directly com-pared performance to plasma and serum have reported similar sensitivities across sampletypes [14, 15]. Other aspects that may have affected sensitivity include the possibility that somepatients participating in the study had cleared their HCV infections, as evidenced by theabsence of detectable VL in around one third of samples, and the improved sensitivity in thesubset of samples with detectable viral load. Other studies have noted declines in HCV anti-body levels following treatment-induced or spontaneous HCV clearance [16, 17], and a recentstudy observed reduced sensitivity of an HCV RDT in subjects with treatment-induced clear-ance [18]. While this would have affected all three sample types, it may have had a largerimpact on sensitivity in whole blood as antibody concentrations would have been closer to thelower LOD compared with plasma and serum. Notably, WHO prequalification criteria are spe-cifically designed for evaluation of plasma samples; no guidance is provided on expected per-formance in whole blood [8]. Given the variability in sensitivity in whole blood with HCVRDTs seen in earlier studies, achieving lower but acceptable sensitivity in whole blood may beconsidered adequate performance for the two investigational RDTs evaluated here. Neverthe-less, HCV screening programmes using these RDTs must take into account the potential forlower performance in whole blood in real-world versus laboratory settings, particularly given
Table 5. Investigational RDT performance versus reference RDT in the overall sample set.
TN, n TP, n FN, n FP, n Sensitivity, % (95% CI) Specificity, % (95% CI)Point estimates
Whole blood (all samples)HCV-Ab Rapid 1063 422 29 15 93.6 (90.9, 95.5) 98.6 (97.7, 99.2)First Response HCV 1064 441 10 14 97.8 (96.0, 98.8) 98.7 (97.8, 99.2)Whole blood (samples with detectable VL)HCV-Ab Rapid — 293 8 — 97.3 (94.8, 98.6) —First Response HCV — 299 2 — 99.3 (97.6, 99.8) —Plasma (all samples)HCV-Ab Rapid 1023 472 0 34 100 (99.2, 100) 96.8 (95.5, 97.7)First Response HCV 1036 472 0 21 100 (99.2, 100) 98.0 (97.0, 98.7)Plasma (samples with detectable VL)HCV-Ab Rapid — 304 0 — 100 (98.8, 100) —First Response HCV — 304 0 — 100 (98.8, 100) —Serum (all samples)HCV-Ab Rapid 1026 465 3 35 99.4 (98.1, 99.8) 96.7 (95.4, 97.6)First Response HCV 1038 465 3 23 99.4 (98.1, 99.8) 97.8 (96.8, 98.6)Serum (samples with detectable VL)HCV-Ab Rapid — 302 1 — 99.7 (98.2, 100) —First Response HCV — 302 1 — 99.7 (98.2, 100) —
Performance comparison (all samples), p-valuesSensitivity Specificity
Sample type HCV-AbRapid
First Response HCV HCV-Ab Rapid First Response HCV
Whole blood vs plasma <0.001 0.060 0.136 1.0Whole blood vs serum <0.001 1.0 0.099 1.0Plasma vs serum 1.0 1.0 1.0 1.0
CI, confidence interval; FN, false negative; FP, false positive; TN, true negative; TP, true positive; VL, viral load
https://doi.org/10.1371/journal.pone.0243040.t005
PLOS ONE HCV RDTs in whole blood, serum & plasma
PLOS ONE | https://doi.org/10.1371/journal.pone.0243040 December 3, 2020 9 / 14
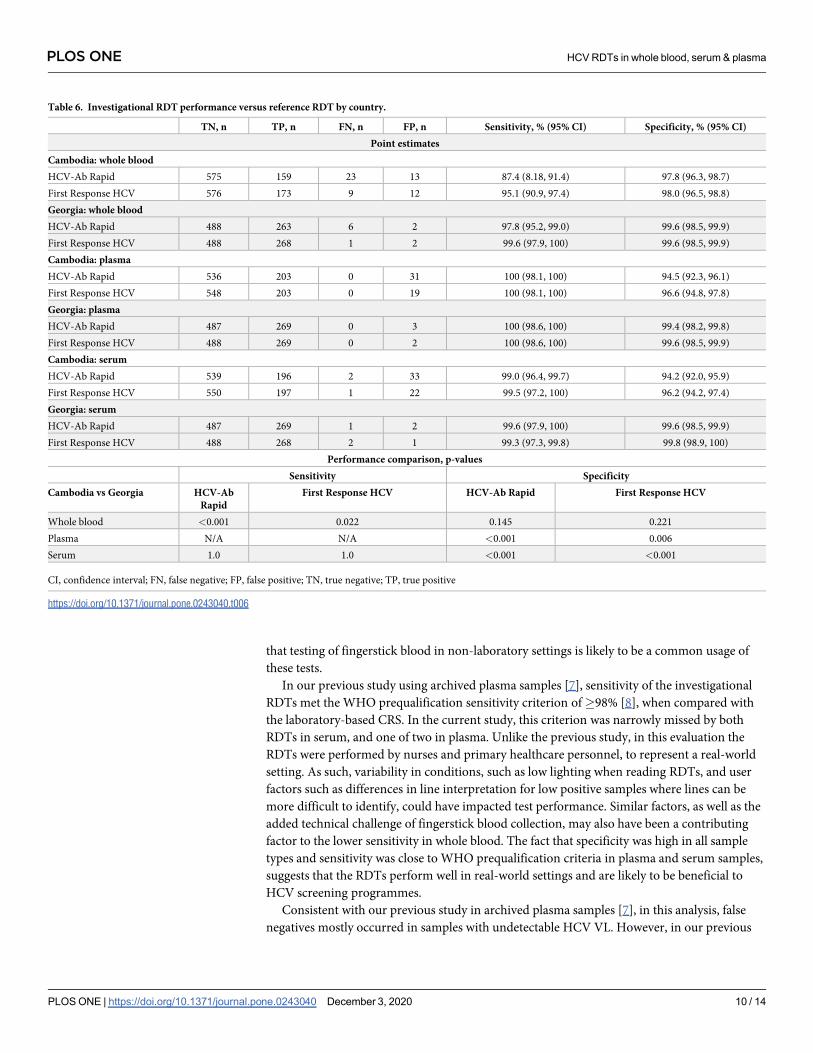
that testing of fingerstick blood in non-laboratory settings is likely to be a common usage ofthese tests.
In our previous study using archived plasma samples [7], sensitivity of the investigationalRDTs met the WHO prequalification sensitivity criterion of�98% [8], when compared withthe laboratory-based CRS. In the current study, this criterion was narrowly missed by bothRDTs in serum, and one of two in plasma. Unlike the previous study, in this evaluation theRDTs were performed by nurses and primary healthcare personnel, to represent a real-worldsetting. As such, variability in conditions, such as low lighting when reading RDTs, and userfactors such as differences in line interpretation for low positive samples where lines can bemore difficult to identify, could have impacted test performance. Similar factors, as well as theadded technical challenge of fingerstick blood collection, may also have been a contributingfactor to the lower sensitivity in whole blood. The fact that specificity was high in all sampletypes and sensitivity was close to WHO prequalification criteria in plasma and serum samples,suggests that the RDTs perform well in real-world settings and are likely to be beneficial toHCV screening programmes.
Consistent with our previous study in archived plasma samples [7], in this analysis, falsenegatives mostly occurred in samples with undetectable HCV VL. However, in our previous
Table 6. Investigational RDT performance versus reference RDT by country.
TN, n TP, n FN, n FP, n Sensitivity, % (95% CI) Specificity, % (95% CI)Point estimates
Cambodia: whole bloodHCV-Ab Rapid 575 159 23 13 87.4 (8.18, 91.4) 97.8 (96.3, 98.7)First Response HCV 576 173 9 12 95.1 (90.9, 97.4) 98.0 (96.5, 98.8)Georgia: whole bloodHCV-Ab Rapid 488 263 6 2 97.8 (95.2, 99.0) 99.6 (98.5, 99.9)First Response HCV 488 268 1 2 99.6 (97.9, 100) 99.6 (98.5, 99.9)Cambodia: plasmaHCV-Ab Rapid 536 203 0 31 100 (98.1, 100) 94.5 (92.3, 96.1)First Response HCV 548 203 0 19 100 (98.1, 100) 96.6 (94.8, 97.8)Georgia: plasmaHCV-Ab Rapid 487 269 0 3 100 (98.6, 100) 99.4 (98.2, 99.8)First Response HCV 488 269 0 2 100 (98.6, 100) 99.6 (98.5, 99.9)Cambodia: serumHCV-Ab Rapid 539 196 2 33 99.0 (96.4, 99.7) 94.2 (92.0, 95.9)First Response HCV 550 197 1 22 99.5 (97.2, 100) 96.2 (94.2, 97.4)Georgia: serumHCV-Ab Rapid 487 269 1 2 99.6 (97.9, 100) 99.6 (98.5, 99.9)First Response HCV 488 268 2 1 99.3 (97.3, 99.8) 99.8 (98.9, 100)
Performance comparison, p-valuesSensitivity Specificity
Cambodia vs Georgia HCV-AbRapid
First Response HCV HCV-Ab Rapid First Response HCV
Whole blood <0.001 0.022 0.145 0.221Plasma N/A N/A <0.001 0.006Serum 1.0 1.0 <0.001 <0.001
CI, confidence interval; FN, false negative; FP, false positive; TN, true negative; TP, true positive
https://doi.org/10.1371/journal.pone.0243040.t006
PLOS ONE HCV RDTs in whole blood, serum & plasma
PLOS ONE | https://doi.org/10.1371/journal.pone.0243040 December 3, 2020 10 / 14
study this effect was more apparent in HCV and HIV coinfected samples [7]. As only four par-ticipants in the current study were HIV positive, the effect of HCV VL on test performance inthis study was not linked to HIV. Other studies have reported similar observations ofimproved HCV RDT performance in samples with detectable VL [19]. HCV VL testing is usedto confirm viraemic infection in people who test positive for HCV antibodies [2], thus thesesamples represent participants who had active HCV infections. Because the sensitivity of theinvestigational RDTs was higher in samples with detectable VL compared with the overallsample set for all sample types, this provides some reassurance in the feasibility of using theseRDTs to detect HCV in the people in need of treatment.
RDT test performance in Cambodia was considerably lower than in Georgia, in terms ofsensitivity in whole blood compared with either reference test (CRS or reference RDT) and interms of specificity in serum and plasma compared with the RDT reference. Differences inspecificity when compared to the RDT reference might be explained by the lower sensitivity ofthe SD Bioline RDT in serum and plasma samples from Cambodia, resulting in a higher num-ber of apparent false positives for the investigational RDTs.
The reason for the lower sensitivity of the investigational RDTs in Cambodia is not clear.Although the majority of false negative samples with detectable VL from Cambodia were of
genotype 1b, while those from Georgia were found across all genotypes, different methodolo-gies were used at the different sites to determine HCV genotype, so it is difficult to determinewhether this represents a meaningful difference. A prozone effect, whereby the ability of anti-bodies to form immune complexes is impaired at high concentrations, may also have resultedin false negatives, as has been shown with other RDTs [20]. Alternatively, it is possible thatHCV positive participants from Cambodia with undetectable HCV VL had lower antibodytitres, as suggested by the fact that proportionally, there were more true positives in sampleswith undetectable VL from Georgia compared with Cambodia (87.5% versus 50.6% for theHCV-Ab Rapid test and 92.3% vs 63.3% for the First Response HCV card test). Historically,the HCV epidemic in Cambodia has been largely driven through past unsafe medical practices[21, 22], whereas Georgia has an ongoing HCV epidemic in injection drug users [23]. Addi-tionally, one of the two centres in Georgia was an opioid substitution treatment facility, thus ahigh proportion of Georgian participants would have been injection drug users. This suggestsa possibility that the between-country differences in sensitivity may be due to Cambodian par-ticipants having generally cleared infections longer ago, while more Georgian participants hadongoing infections. Previous studies have shown that HCV screening tests can provide dis-crepant results in people with waning antibodies [24]. However, it was not possible to test thishypothesis in this study, as it was not designed to recruit participants to represent the propor-tionate occurrence of ongoing and past infections. Further research is needed to better under-stand sensitivity differences across different population groups or HCV endemic areas.
It is interesting to note that the WHO prequalified RDT SD Bioline, used as a referenceRDT in this study, also had lower than expected sensitivity in whole blood in the overall sam-ple set (including samples with and without detectable VL) when compared with the labora-tory-based CRS. The quality of SD Bioline is well established [25, 26], thus this furtherhighlights how regional and demographic differences in population can impact on RDT per-formance, even with established RDTs, and demonstrates the generally lower sensitivity ofRDTs compared with laboratory-based immunoassays as antibody screening tests.
Specificity was high in all sample types for both investigational RDTs when compared withthe CRS, meeting the WHO prequalification specificity criterion of�97% for HCV serologyRDTs in plasma or serum specimens [8]. Specificity also met this criterion when comparedwith a WHO prequalified reference RDT test, except for one of two tests in plasma and serumsamples, for which specificity dropped just below the threshold.
PLOS ONE HCV RDTs in whole blood, serum & plasma
PLOS ONE | https://doi.org/10.1371/journal.pone.0243040 December 3, 2020 11 / 14
A limitation of this study is the stringent CRS used, which led to 73 samples being excludedfrom the study. While this provides confidence in the accuracy of the characterisation of thesamples used in the study, it is possible that inclusion of the excluded samples would haveaffected sensitivity and specificity estimates. Additionally, the number of testers was higher forwhole blood than for plasma and serum at two out of the three study sites, which may havecontributed to differences in performance across sample types. However, previous studieshave suggested that provision of training substantially reduces user errors with RDTs [27].Training was provided to all testers involved in this study, thus the impact of user variability islikely to have been minimal.
In summary, both investigational RDTs performed well in fresh plasma and serum samples.Although sensitivity in whole blood performance was lower, particularly in Cambodia, giventhe potential impact of variability in HCV infection history, population drivers, conditionsand user factors, data from other studies evidencing variable performance in whole blood withquality assured tests, and the fact that performance was similar to that of the reference RDT,test performance can be considered adequate. Additionally, overall performance in wholeblood for samples with detectable VL was high. Comparative studies in different sample typesshould be taken into consideration when selecting HCV RDTs for screening programmes,bearing in mind that whole blood performance in real-world settings may be different fromexpectations based on data generated in laboratory evaluations.
Supporting informationS1 Checklist. TREND statement checklist.(PDF)
S1 Table. Investigational and reference RDT operational characteristics.(DOCX)
S2 Table. HCV genotype of false negative whole blood samples by country.(DOCX)
S3 Table. Performance of the reference RDT test SD Bioline compared with the compositereference standard.(DOCX)
S4 Table. Multivariable logistic regression analysis for RDT performance in whole blood(p-values).(DOCX)
S5 Table. Protocol deviations.(DOCX)
S1 File. Clinical study protocol.(PDF)
AcknowledgmentsThe authors express their gratitude to all those involved in the execution of the project. Medi-cal writing assistance and editorial support, under the direction of the authors, was providedby Rachel Wright, PhD, funded by Foundation for Innovative New Diagnostics (FIND),according to Good Publication Practice guidelines.
Both investigational HCV RDTs under evaluation were provided free of charge by therespective manufacturers.
PLOS ONE HCV RDTs in whole blood, serum & plasma
PLOS ONE | https://doi.org/10.1371/journal.pone.0243040 December 3, 2020 12 / 14
Author ContributionsConceptualization: Beatrice N. Vetter, Stefano Ongarello, Elena Ivanova Reipold.
Data curation: Beatrice N. Vetter, Stefano Ongarello, Nazibrola Chitadze.
Formal analysis: Stefano Ongarello, Alexander Tyshkovskiy.
Investigation: Maia Alkhazashvili, Nazibrola Chitadze, Kimcheng Choun, An Sokkab.
Methodology: Beatrice N. Vetter, Stefano Ongarello, Elena Ivanova Reipold.
Project administration: Beatrice N. Vetter, Fien Vanroye.
Supervision: Maia Alkhazashvili, Nazibrola Chitadze, Kimcheng Choun, An Sokkab, Anja DeWeggheleire, Fien Vanroye.
Validation: Beatrice N. Vetter, Stefano Ongarello.
Writing – original draft: Beatrice N. Vetter.
Writing – review & editing: Beatrice N. Vetter, Stefano Ongarello, Alexander Tyshkovskiy,Maia Alkhazashvili, Nazibrola Chitadze, Kimcheng Choun, An Sokkab, Anja De Wegghe-leire, Fien Vanroye, Elena Ivanova Reipold.
References1. World Health Organization (WHO). Global hepatitis report 2017 [updated 24 October 2019. Available
from: https://www.who.int/hepatitis/publications/global-hepatitis-report2017/en/.2. World Health Organization (WHO). Guidelines on hepatitis B and C testing 2017 [updated 25 October
2019. Available from: https://www.who.int/hepatitis/publications/guidelines-hepatitis-c-b-testing/en/.3. Tordrup D, Hutin Y, Stenberg K, Lauer JA, Hutton DW, Toy M, et al. Additional resource needs for viral
hepatitis elimination through universal health coverage: projections in 67 low-income and middle-income countries, 2016–30. Lancet Glob Health. 2019; 7(9):e1180–e8. https://doi.org/10.1016/S2214-109X(19)30272-4 PMID: 31353061
4. World Health Organization (WHO). Technical Specifications Series for submission to WHO Prequalifi-cation–Diagnostic Assessment: Rapid diagnostic tests to detect hepatitis C antibody or antigen.2019 22May 2020. Available from: https://apps.who.int/iris/bitstream/handle/10665/327935/9789241516501-eng.pdf?ua=1.
5. World Health Organization (WHO). WHO list of prequalified in vitro diagnostic products 2019 [updated24 October 2019. Available from: https://www.who.int/diagnostics_laboratory/evaluations/190918_prequalified_product_list.pdf?ua=1.
6. Reipold EI, Trianni A, Krakower D, Ongarello S, Roberts T, Easterbrook P, et al. Values, preferencesand current hepatitis B and C testing practices in low- and middle-income countries: results of a surveyof end users and implementers. BMC Infect Dis. 2017; 17(Suppl 1):702. https://doi.org/10.1186/s12879-017-2769-y PMID: 29143612
7. Vetter BN, Ivanova Reipold E, Ongarello S, Audu R, Ige FA, Alkhazashvili M, et al. Sensitivity and speci-ficity of rapid diagnostic tests for hepatitis C virus with or without HIV coinfection: a multicentre labora-tory evaluation study. J Infect Dis. 2020; https://doi.org/10.1093/infdis/jiaa389 PMID: 32614451
8. World Health Organization (WHO). Selecting and purchasing HIV, HBsAg and HCV in vitro diagnostics[updated 24 October 2019. Available from: https://www.who.int/diagnostics_laboratory/procurement/purchase/en/.
9. World Health Organization (WHO). WHO protocol for performance laboratory evaluation of HCV serol-ogy assays 2017 [updated 24 October 2019. Available from: https://www.who.int/diagnostics_laboratory/evaluations/alter/171219_protocol_pqdx_040_v6_hcv.pdf?ua=1.
10. O’Connell RJ, Gates RG, Bautista CT, Imbach M, Eggleston JC, Beardsley SG, et al. Laboratory evalu-ation of rapid test kits to detect hepatitis C antibody for use in predonation screening in emergency set-tings. Transfusion. 2013; 53(3):505–17. https://doi.org/10.1111/j.1537-2995.2012.03770.x PMID:22823283
11. Smith BD, Teshale E, Jewett A, Weinbaum CM, Neaigus A, Hagan H, et al. Performance of premarketrapid hepatitis C virus antibody assays in 4 national human immunodeficiency virus behavioral
PLOS ONE HCV RDTs in whole blood, serum & plasma
PLOS ONE | https://doi.org/10.1371/journal.pone.0243040 December 3, 2020 13 / 14
surveillance system sites. Clin Infect Dis. 2011; 53(8):780–6. https://doi.org/10.1093/cid/cir499 PMID:21921221
12. Chevaliez S, Poiteau L, Rosa I, Soulier A, Roudot-Thoraval F, Laperche S, et al. Prospective assess-ment of rapid diagnostic tests for the detection of antibodies to hepatitis C virus, a tool for improvingaccess to care. Clin Microbiol Infect. 2016; 22(5):459 e1–6. https://doi.org/10.1016/j.cmi.2016.01.009PMID: 26806260
13. Fisher DG, Hess KL, Erlyana E, Reynolds GL, Cummins CA, Alonzo TA. Comparison of Rapid Point-of-Care Tests for Detection of Antibodies to Hepatitis C Virus. Open Forum Infect Dis. 2015; 2(3):ofv101.https://doi.org/10.1093/ofid/ofv101 PMID: 26269795
14. Lee SR, Kardos KW, Schiff E, Berne CA, Mounzer K, Banks AT, et al. Evaluation of a new, rapid test fordetecting HCV infection, suitable for use with blood or oral fluid. J Virol Methods. 2011; 172(1–2):27–31.https://doi.org/10.1016/j.jviromet.2010.12.009 PMID: 21182871
15. Kant J, Moller B, Heyne R, Herber A, Bohm S, Maier M, et al. Evaluation of a rapid on-site anti-HCV testas a screening tool for hepatitis C virus infection. Eur J Gastroenterol Hepatol. 2013; 25(4):416–20.https://doi.org/10.1097/MEG.0b013e32835c502d PMID: 23211286
16. Aebi-Popp K, Wandeler G, Salazar-Vizcaya L, Metzner K, Stockle M, Cavassini M, et al. Rapid declineof anti-hepatitis C virus (HCV) antibodies following early treatment of incident HCV infections in HIV-infected men who have sex with men. HIV Med. 2018; 19(6):420–5. https://doi.org/10.1111/hiv.12602PMID: 29573533
17. Vanhommerig JW, Thomas XV, van der Meer JT, Geskus RB, Bruisten SM, Molenkamp R, et al. Hepa-titis C virus (HCV) antibody dynamics following acute HCV infection and reinfection among HIV-infectedmen who have sex with men. Clin Infect Dis. 2014; 59(12):1678–85. https://doi.org/10.1093/cid/ciu695PMID: 25186590
18. Carvalho-Gomes A, Cubells A, Pallares C, Hontangas V, Conde I, Di Maira T, et al. A population-basedscreening for hepatitis C antibodies and active infection using a point-of-care test in a low prevalencearea. PLoS One. 2020; 15(2):e0228351. https://doi.org/10.1371/journal.pone.0228351 PMID:32045417
19. Scalioni Lde P, Cruz HM, de Paula VS, Miguel JC, Marques VA, Villela-Nogueira CA, et al. Performanceof rapid hepatitis C virus antibody assays among high- and low-risk populations. J Clin Virol. 2014; 60(3):200–5. https://doi.org/10.1016/j.jcv.2014.04.001 PMID: 24794796
20. Gillet P, Scheirlinck A, Stokx J, De Weggheleire A, Chauque HS, Canhanga OD, et al. Prozone inmalaria rapid diagnostics tests: how many cases are missed? Malar J. 2011; 10:166. https://doi.org/10.1186/1475-2875-10-166 PMID: 21676264
21. De Weggheleire A, An S, De Baetselier I, Soeung P, Keath H, So V, et al. A cross-sectional study ofhepatitis C among people living with HIV in Cambodia: Prevalence, risk factors, and potential for tar-geted screening. PLoS One. 2017; 12(8):e0183530. https://doi.org/10.1371/journal.pone.0183530PMID: 28832660
22. Nouhin J, Iwamoto M, Prak S, Dousset JP, Phon K, Heng S, et al. Molecular epidemiology of hepatitis Cvirus in Cambodia during 2016–2017. Sci Rep. 2019; 9(1):7314. https://doi.org/10.1038/s41598-019-43785-4 PMID: 31086236
23. Stvilia K, Spradling PR, Asatiani A, Gogia M, Kutateladze K, Butsashvili M, et al. Progress in Testing forand Treatment of Hepatitis C Virus Infection Among Persons Who Inject Drugs—Georgia, 2018.MMWR Morb Mortal Wkly Rep. 2019; 68(29):637–41. https://doi.org/10.15585/mmwr.mm6829a2PMID: 31344021
24. Mazzarella C, Rocco C, Vallefuoco L, Sorrentino R, Braschi U, Lauritano G, et al. Differential reactivityof anti-hepatitis C virus screening assays in patients with waning antibodies. Future Virology. 2019; 14(5):303–9.
25. Mane A, Sacks J, Sharma S, Singh H, Tejada-Strop A, Kamili S, et al. Evaluation of five rapid diagnostictests for detection of antibodies to hepatitis C virus (HCV): A step towards scale-up of HCV screeningefforts in India. PLoS One. 2019; 14(1):e0210556. https://doi.org/10.1371/journal.pone.0210556 PMID:30653562
26. World Health Organization (WHO). WHO Prequalification of In Vitro Diagnostics: PUBLIC REPORT.Product: SD BIOLINE HCV. WHO reference number: PQDx 0257-012-002016 19 May 2020. Availablefrom: https://www.who.int/diagnostics_laboratory/evaluations/pq-list/hcv/161216_final_amended_report_0257_012_00.pdf.
27. Rennie W, Phetsouvanh R, Lupisan S, Vanisaveth V, Hongvanthong B, Phompida S, et al. Minimisinghuman error in malaria rapid diagnosis: clarity of written instructions and health worker performance.Trans R Soc Trop Med Hyg. 2007; 101(1):9–18. https://doi.org/10.1016/j.trstmh.2006.03.011 PMID:17049572
PLOS ONE HCV RDTs in whole blood, serum & plasma
PLOS ONE | https://doi.org/10.1371/journal.pone.0243040 December 3, 2020 14 / 14
Original Research
Hepatitis C treatment uptake among patients who have receivedmethadone substitution treatment in the Republic of Georgia
Ketevan Stvilia a, *, Nino Vephkvadze b, Amiran Gamkrelidze a, Irma Khonelidze a,Vladimer Getia a, Maia Tsereteli a, Lia Gvinjilia c, Tainatin Kuchuloria c
a National Center for Disease Control and Public Health, Georgiab Tbilisi State Medical University, Georgiac The Task Force for Global Health, Georgia
a r t i c l e i n f o
Article history:Received 2 December 2020Received in revised form16 March 2021Accepted 21 March 2021
Keywords:Hepatitis COpioid substitution treatmentPeople who inject drugsHCV screeningHarm reduction
a b s t r a c t
Objectives: There is a dearth of research on hepatitis C virus (HCV) treatment uptake among people whoinject drugs (PWIDs) and receive methadone substitution treatment (MST) in Eastern Europe and CentralAsia countries. This study contributed to addressing that gap. We examined and identified factors thatmay affect HCV treatment uptake among PWID who received MST in the Republic of Georgia.Study design: The design of the study is retrospective cohort study.Methods: We conducted HCV care cascade analysis by matching the data from the web-based nationalhepatitis C program registry (ELIM C) and the MST treatment database between January 1, 2015, andDecember 31, 2018. Using the World Health Organization's (WHO) Consensus HCV cascade of care (CoC)global instrument, we assessed the progress made toward the country's 2020 and WHO's 2030 hepatitisC elimination targets for the subpopulation of MST patients.Results: Overall, 10,498 individuals have been dispensed methadone during the study period. A total of6828 MST beneficiaries had HCV screening, of whom 5843 (85.6%) tested positive; 5476 (93.7%) weretested for HCV viremia, and 5275 (96.3%) were confirmed with chronic HCV infection. More than 75%(n ¼ 4000) of HCV-infected MST patients initiated HCV treatment, and 3772 (94.3%) completed thetreatment. Of those eligible for sustained virologic response assessment, 71.0% (2641/3715) were eval-uated, and the reported cure rate was 96.1% (2537). The study found the odds of patients starting HCVtreatment differed by the type of facility they were screened at and whether they were registered asPWID at the screening sites. The patients screened at centers with integrated HCV treatment services hadhigher treatment uptake rates than those screened at other centers.Conclusions: As the cumulative HCV treatment uptake and cure rates among MST patients with HCVinfection are high (75.8% and 96.1%, respectively), the MST patients might become the first micro-elimination target population in which hepatitis C elimination will be achieved in Georgia. The studyfound the type of screening facility and whether MST patients registered themselves as PWID or not hadsignificant effects on MST patients starting HCV treatment. At the same time, the study did not findgender and age to be significant predictors of MST patients starting HCV treatment. MST patients useddifferent types of health facilities to get screened for HIV. Many of them did not register themselves asPWID when screened for HIV. The existence of only a few harm reduction sites with integrated HCVtreatment services, a high level of stigma, and the criminalization of drug use might have incentivizedMST patients to self-navigate across the HCV care continuum with the rest of the population. Theimplementation of focused, harm reduction, integrated HCV treatment with good peer and professionaladherence support at treatment sites could help reach the hepatitis C elimination goals among MSTpatients.
© 2021 The Royal Society for Public Health. Published by Elsevier Ltd. All rights reserved.
* Corresponding author.E-mail address: [email protected] (K. Stvilia).
Contents lists available at ScienceDirect
Public Health
journal homepage: www.elsevier .com/locate/puhe
https://doi.org/10.1016/j.puhe.2021.03.0170033-3506/© 2021 The Royal Society for Public Health. Published by Elsevier Ltd. All rights reserved.
Public Health 195 (2021) 42e50
Introduction
Approximately 269 million people worldwide (nearly 5.4% ofthe global population), aged 15e64 years, used drugs at least oncein 2018. Of them, approximately 53 million people used mostlyopioids and 29 million used mostly opiates or amphetamines andprescription stimulants.1 In 2018, an estimated 35.6 million peoplesuffered from drug use disorders.2 The situation is particularlyalarming in Eastern and Southeastern Europe, Central Asia, andSouth Caucasus, where the proportions of the populations aged15e64 years who inject drugs are almost four times higher than theglobal average.3
Pharmacological maintenance therapy, which uses drugs suchas methadone and buprenorphine to reduce the craving for and useof opioids, is recommended by the World Health Organization(WHO) and has become the mainstream treatment for opioiddependence in many countries.4,5
The number of PWID is increasing in Georgia. According to in-tegrated behavior and biomarker surveillance surveys (IBBSS) of2015 and 2017, the estimated number of PWID has increased from49,200 to 52,500. The opioid dependence last was measured usinga brief 8-item measure, the Rapid Opioid Dependence Screen(RODS), within the IBBSS conducted in 2017. The RODS calculationrevealed that 31.4% of those who used illicit opioid drugs (93% ofthe whole sample) experienced an active phase of opioid depen-dence. This amounts to about 16,000 opioid-dependent PWIDliving in Georgia.6
More than 70 million people lived with the hepatitis C virus(HCV) infection, and only approximately 19% (13.1 million) of themknew their diagnosis in 2017.7 The prevalence of bloodborne in-fections, including HCV infection, remains high among the globaldrug user population. More than half of them live with hepatitis C,and approximately one in every eight people live with HIV.1,2 In2017, the HIV prevalence among PWID was 2.3% (95% confidenceinterval [CI] 1.63e3.12) in Georgia, with no change since 2015 whenHIV prevalence was 2.2% (95% CI 1.53e2.99).6 In 2015, hepatitis Cprevalence in Georgia was considerably higher than the Europeanaverage. An estimated 150,000 persons (5.4% of the adult popula-tion) lived with chronic HCV infection in the country at the time.8 Itexceeded the estimated HCV prevalence of other countries of theEastern Europe and Central Asia region except Uzbekistan andUkraine (6.5% and 8% accordingly).9
In April 2015, with the support of the U.S. Centers for DiseaseControl and Prevention, Gilead Sciences, the WHO, and otherpartners, the Government of Georgia initiated one of the world'sfirst Hepatitis C Elimination Programs with the ambitious goal of90% reduction in chronic HCV prevalence by 2020.10 As ofDecember 31, 2019, more than 1.9 million adults (67% of the adultpopulation) have been screened with anti-HCV rapid diagnostictests at over 1200 facilities countrywide, with an overall 6.7% anti-HCV antibody positivity rate in Georgia,11 which fully correspondedto the national estimate for anti-HCV antibody prevalence based onthe national seroprevalence study of 2015.8 The screening facilitieslist included 14 drop-in centers and eight mobile ambulatories ofthe Needle and Syringe Program (NSP).12,13
An important direction of the National Hepatitis C EliminationStrategy is the identification of persons with chronic HCV amongthe general population, especially among high-risk groups such asPWID, who were reached through the NSP or enrolled in opioidsubstitution treatment (OST) Program (methadone and buprenor-phine substitution programs).10
Studies report a positive impact of retention in OST on HCVtreatment outcomes. The longer retention in OST translates in thehigher probability of achieving an HCV cure.14e21 Methadone sub-stitution treatment (MST) was first introduced in Georgia in 2005
through the support of the Global Fund (GFATM) and is available intwo different forms: (1) methadone maintenance program and (2)the program using combined preparation with buprenorphine andnaloxone.22 In 2018, the number of MST patients reached 10,498,which corresponds to 19.9% of the estimated 52,500 PWID living inGeorgia.6,23 Fig. 1 represents the overall MST capacity distributionin the country for the same period. More than two-third of MSTpatients (6265) were receiving treatment in Tbilisi, the capital city.
While HCV infection is a major public health problem world-wide, currently, only a small portion of infected persons have beentested and know their diagnosis. Furthermore, there is uncertaintyin many countries, including Georgia, regarding optimal testingapproaches and whom to prioritize for testing.24
During the last decade, the uptake of HCV treatment and relatedbarriers have been explored within the different studies conductedamong PWID worldwide. Many of these studies have contradictedprevious concerns over poor treatment adherence and higher ratesof re-infection among PWID, and therefore WHO has recom-mended HCV treatment within this population.25e32 Modelingstudies have shown that scaling up HCV treatment, in combinationwith improved OST coverage and NSPs, could lead to substantialreductions in disease incidence and prevalence.33e35
A study conducted during 2016e2017 among the people whoinject drugs (PWIDs) confirmed the high burden (between 48.8%and 63.2% of different geographic locations) of chronic hepatitis Cinfection in Georgia.6 The present study was conducted to analyzethe cumulative HCV treatment uptake, estimation of annual treat-ment, and cure rates, as well as the identification of factors asso-ciated with HCV treatment uptake among individuals whocontinued using MST treatment or were newly enrolled in the stateMST programs during 2018 in Georgia.
Methods
The MST program uses an electronic web-based real-time datacollection tool. The clients' information that is regularly collected,among other variables, includes the client's (1) 11-digit personalidentification number, (2) residency address, (3) date of birth, (4)gender, (5) date of program entry, and (6) hepatitis C status.Georgia's hepatitis C elimination program data, on the other hand,is managed by the hepatitis C information system (ELIMC) thatrecords screening, laboratory diagnostics, and treatment data andenables monitoring of the HCV care cascade for all populationgroups based on personal ID.36
To generate the data set used by this study, first, the MST pro-gram's database was searched for patients undergoing methadonesubstitution therapy and getting at least one dose of medicineduring 2018. Next, the MST patients' data were cross-matched withELIMC by personal ID to identify the number of MST patientsscreened on HCV infection, confirmed to have active HCV infection,and the number of patients who were enrolled and completed thetreatment.
As the study dealt with sensitive information, the matched datawere provided to the researchers with all personal identifiers ofpatients removed. The study was approved by the National Centerfor Disease Control and Public Health, Georgia Institutional ReviewBoard on July 30, 2020, approval number N2020-049.
Both databases had built-in data quality checks. Also, MST andHCV screening services were reimbursed based on the databases’records and were subject to regular monitoring for completenessand accuracy. We excluded all duplicates, as well as all observationsfor which the program entry datewas missing, in total, 261 records.For anti-HCV screening, we used the facility name for the mostrecent HCV antibody test.
K. Stvilia, N. Vephkvadze, A. Gamkrelidze et al. Public Health 195 (2021) 42e50
43
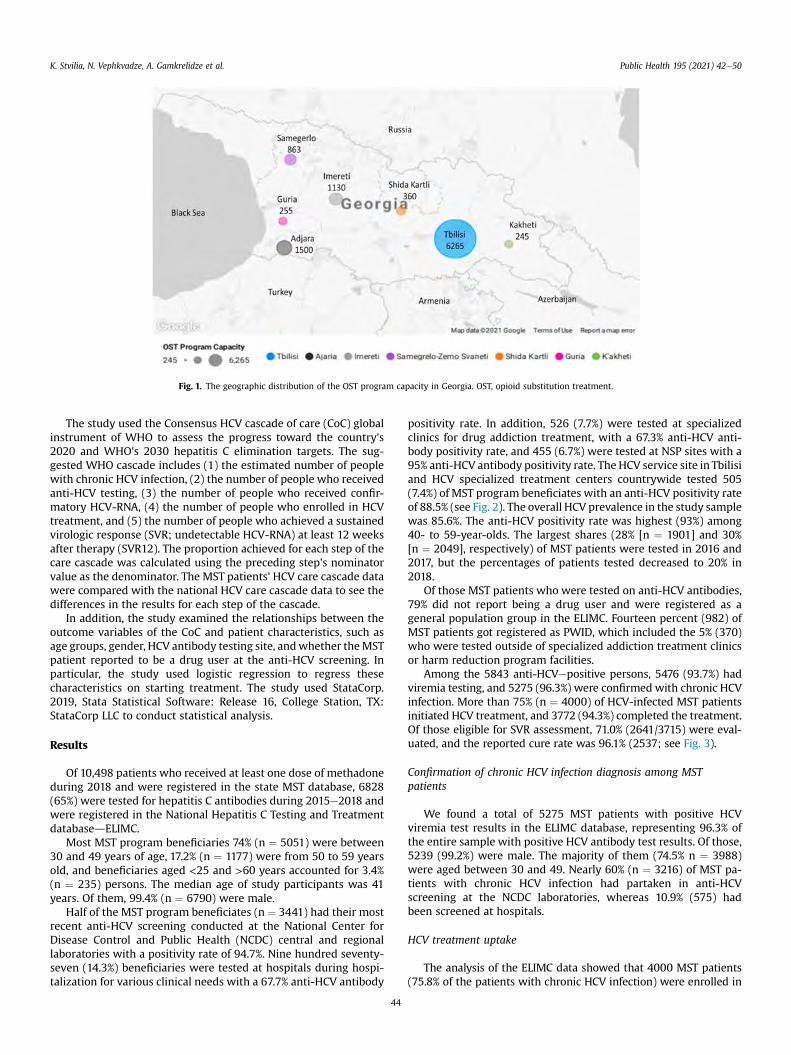
The study used the Consensus HCV cascade of care (CoC) globalinstrument of WHO to assess the progress toward the country's2020 and WHO's 2030 hepatitis C elimination targets. The sug-gested WHO cascade includes (1) the estimated number of peoplewith chronic HCV infection, (2) the number of people who receivedanti-HCV testing, (3) the number of people who received confir-matory HCV-RNA, (4) the number of people who enrolled in HCVtreatment, and (5) the number of people who achieved a sustainedvirologic response (SVR; undetectable HCV-RNA) at least 12 weeksafter therapy (SVR12). The proportion achieved for each step of thecare cascade was calculated using the preceding step's nominatorvalue as the denominator. The MST patients' HCV care cascade datawere compared with the national HCV care cascade data to see thedifferences in the results for each step of the cascade.
In addition, the study examined the relationships between theoutcome variables of the CoC and patient characteristics, such asage groups, gender, HCV antibody testing site, andwhether theMSTpatient reported to be a drug user at the anti-HCV screening. Inparticular, the study used logistic regression to regress thesecharacteristics on starting treatment. The study used StataCorp.2019, Stata Statistical Software: Release 16, College Station, TX:StataCorp LLC to conduct statistical analysis.
Results
Of 10,498 patients who received at least one dose of methadoneduring 2018 and were registered in the state MST database, 6828(65%) were tested for hepatitis C antibodies during 2015e2018 andwere registered in the National Hepatitis C Testing and TreatmentdatabasedELIMC.
Most MST program beneficiaries 74% (n ¼ 5051) were between30 and 49 years of age, 17.2% (n ¼ 1177) were from 50 to 59 yearsold, and beneficiaries aged <25 and >60 years accounted for 3.4%(n ¼ 235) persons. The median age of study participants was 41years. Of them, 99.4% (n ¼ 6790) were male.
Half of the MST program beneficiates (n ¼ 3441) had their mostrecent anti-HCV screening conducted at the National Center forDisease Control and Public Health (NCDC) central and regionallaboratories with a positivity rate of 94.7%. Nine hundred seventy-seven (14.3%) beneficiaries were tested at hospitals during hospi-talization for various clinical needs with a 67.7% anti-HCV antibody
positivity rate. In addition, 526 (7.7%) were tested at specializedclinics for drug addiction treatment, with a 67.3% anti-HCV anti-body positivity rate, and 455 (6.7%) were tested at NSP sites with a95% anti-HCV antibody positivity rate. The HCV service site in Tbilisiand HCV specialized treatment centers countrywide tested 505(7.4%) of MST program beneficiates with an anti-HCV positivity rateof 88.5% (see Fig. 2). The overall HCV prevalence in the study samplewas 85.6%. The anti-HCV positivity rate was highest (93%) among40- to 59-year-olds. The largest shares (28% [n ¼ 1901] and 30%[n ¼ 2049], respectively) of MST patients were tested in 2016 and2017, but the percentages of patients tested decreased to 20% in2018.
Of those MST patients who were tested on anti-HCV antibodies,79% did not report being a drug user and were registered as ageneral population group in the ELIMC. Fourteen percent (982) ofMST patients got registered as PWID, which included the 5% (370)who were tested outside of specialized addiction treatment clinicsor harm reduction program facilities.
Among the 5843 anti-HCVepositive persons, 5476 (93.7%) hadviremia testing, and 5275 (96.3%) were confirmed with chronic HCVinfection. More than 75% (n ¼ 4000) of HCV-infected MST patientsinitiated HCV treatment, and 3772 (94.3%) completed the treatment.Of those eligible for SVR assessment, 71.0% (2641/3715) were eval-uated, and the reported cure rate was 96.1% (2537; see Fig. 3).
Confirmation of chronic HCV infection diagnosis among MSTpatients
We found a total of 5275 MST patients with positive HCVviremia test results in the ELIMC database, representing 96.3% ofthe entire sample with positive HCV antibody test results. Of those,5239 (99.2%) were male. The majority of them (74.5% n ¼ 3988)were aged between 30 and 49. Nearly 60% (n ¼ 3216) of MST pa-tients with chronic HCV infection had partaken in anti-HCVscreening at the NCDC laboratories, whereas 10.9% (575) hadbeen screened at hospitals.
HCV treatment uptake
The analysis of the ELIMC data showed that 4000 MST patients(75.8% of the patients with chronic HCV infection) were enrolled in
Fig. 1. The geographic distribution of the OST program capacity in Georgia. OST, opioid substitution treatment.
K. Stvilia, N. Vephkvadze, A. Gamkrelidze et al. Public Health 195 (2021) 42e50
44
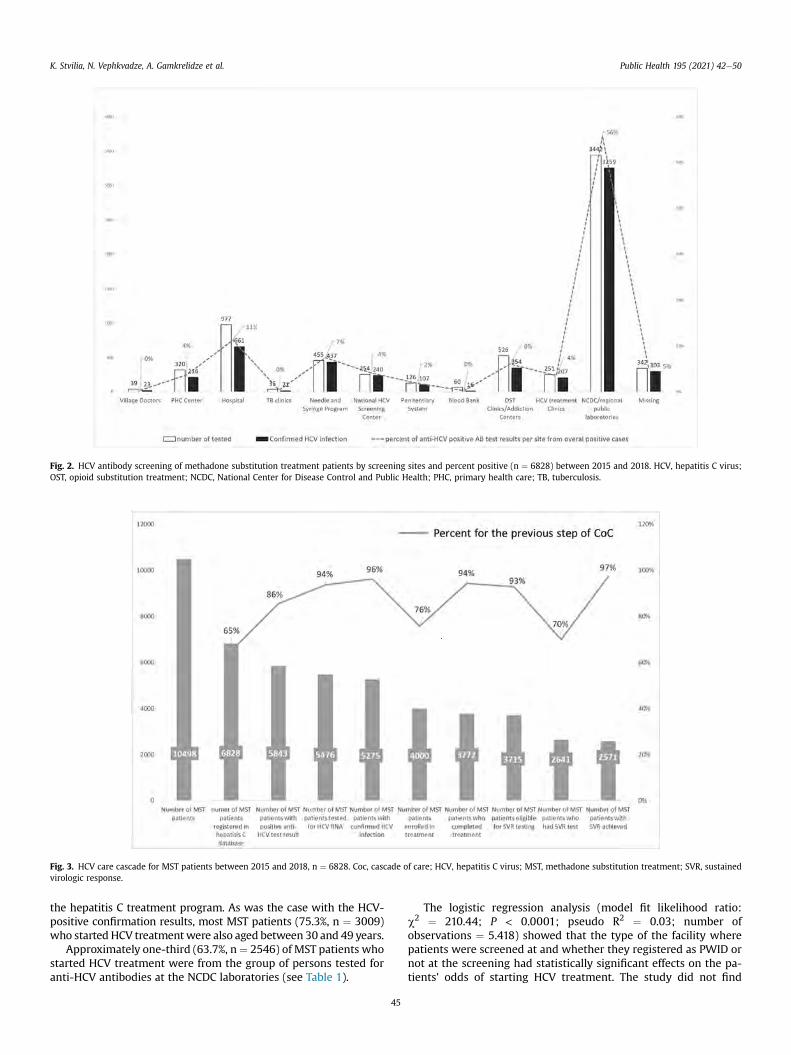
the hepatitis C treatment program. As was the case with the HCV-positive confirmation results, most MST patients (75.3%, n ¼ 3009)who started HCV treatmentwere also aged between 30 and 49 years.
Approximately one-third (63.7%, n¼ 2546) of MST patients whostarted HCV treatment were from the group of persons tested foranti-HCV antibodies at the NCDC laboratories (see Table 1).
The logistic regression analysis (model fit likelihood ratio:c2 ¼ 210.44; P < 0.0001; pseudo R2 ¼ 0.03; number ofobservations ¼ 5.418) showed that the type of the facility wherepatients were screened at and whether they registered as PWID ornot at the screening had statistically significant effects on the pa-tients' odds of starting HCV treatment. The study did not find
Fig. 2. HCV antibody screening of methadone substitution treatment patients by screening sites and percent positive (n ¼ 6828) between 2015 and 2018. HCV, hepatitis C virus;OST, opioid substitution treatment; NCDC, National Center for Disease Control and Public Health; PHC, primary health care; TB, tuberculosis.
Fig. 3. HCV care cascade for MST patients between 2015 and 2018, n ¼ 6828. Coc, cascade of care; HCV, hepatitis C virus; MST, methadone substitution treatment; SVR, sustainedvirologic response.
K. Stvilia, N. Vephkvadze, A. Gamkrelidze et al. Public Health 195 (2021) 42e50
45
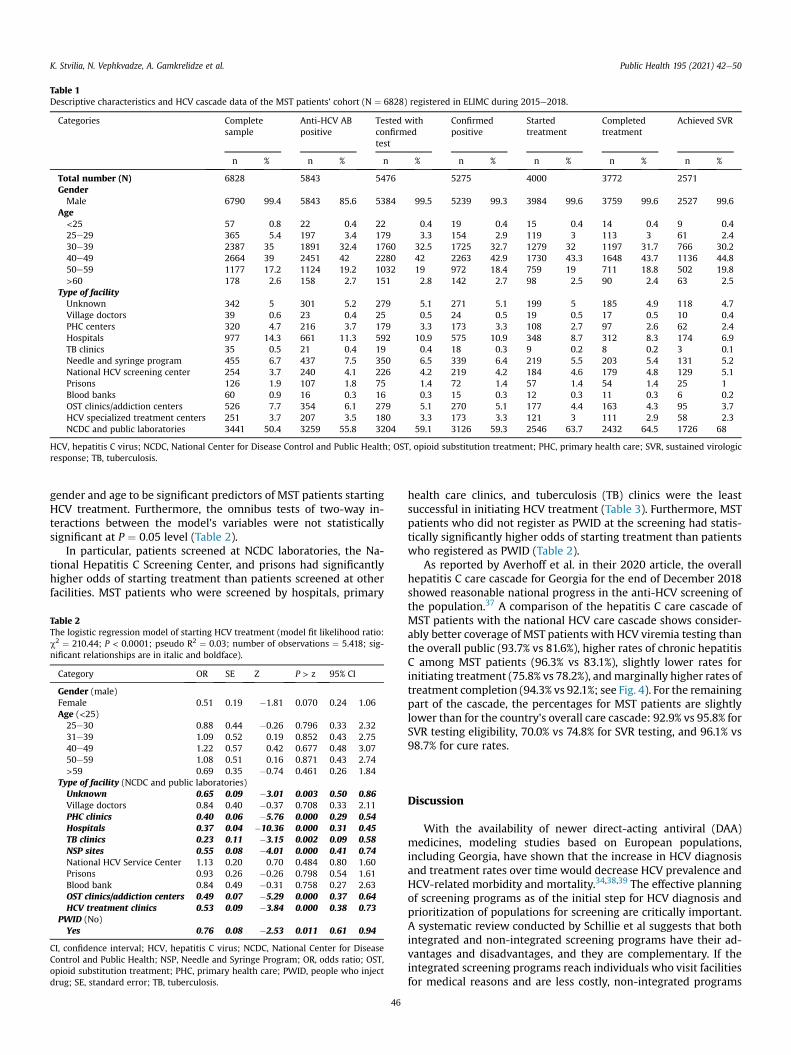
gender and age to be significant predictors of MST patients startingHCV treatment. Furthermore, the omnibus tests of two-way in-teractions between the model's variables were not statisticallysignificant at P ¼ 0.05 level (Table 2).
In particular, patients screened at NCDC laboratories, the Na-tional Hepatitis C Screening Center, and prisons had significantlyhigher odds of starting treatment than patients screened at otherfacilities. MST patients who were screened by hospitals, primary
health care clinics, and tuberculosis (TB) clinics were the leastsuccessful in initiating HCV treatment (Table 3). Furthermore, MSTpatients who did not register as PWID at the screening had statis-tically significantly higher odds of starting treatment than patientswho registered as PWID (Table 2).
As reported by Averhoff et al. in their 2020 article, the overallhepatitis C care cascade for Georgia for the end of December 2018showed reasonable national progress in the anti-HCV screening ofthe population.37 A comparison of the hepatitis C care cascade ofMST patients with the national HCV care cascade shows consider-ably better coverage of MST patients with HCV viremia testing thanthe overall public (93.7% vs 81.6%), higher rates of chronic hepatitisC among MST patients (96.3% vs 83.1%), slightly lower rates forinitiating treatment (75.8% vs 78.2%), andmarginally higher rates oftreatment completion (94.3% vs 92.1%; see Fig. 4). For the remainingpart of the cascade, the percentages for MST patients are slightlylower than for the country's overall care cascade: 92.9% vs 95.8% forSVR testing eligibility, 70.0% vs 74.8% for SVR testing, and 96.1% vs98.7% for cure rates.
Discussion
With the availability of newer direct-acting antiviral (DAA)medicines, modeling studies based on European populations,including Georgia, have shown that the increase in HCV diagnosisand treatment rates over time would decrease HCV prevalence andHCV-related morbidity and mortality.34,38,39 The effective planningof screening programs as of the initial step for HCV diagnosis andprioritization of populations for screening are critically important.A systematic review conducted by Schillie et al suggests that bothintegrated and non-integrated screening programs have their ad-vantages and disadvantages, and they are complementary. If theintegrated screening programs reach individuals who visit facilitiesfor medical reasons and are less costly, non-integrated programs
Table 1Descriptive characteristics and HCV cascade data of the MST patients’ cohort (N ¼ 6828) registered in ELIMC during 2015e2018.
Categories Completesample
Anti-HCV ABpositive
Tested withconfirmedtest
Confirmedpositive
Startedtreatment
Completedtreatment
Achieved SVR
n % n % n % n % n % n % n %
Total number (N) 6828 5843 5476 5275 4000 3772 2571GenderMale 6790 99.4 5843 85.6 5384 99.5 5239 99.3 3984 99.6 3759 99.6 2527 99.6
Age<25 57 0.8 22 0.4 22 0.4 19 0.4 15 0.4 14 0.4 9 0.425e29 365 5.4 197 3.4 179 3.3 154 2.9 119 3 113 3 61 2.430e39 2387 35 1891 32.4 1760 32.5 1725 32.7 1279 32 1197 31.7 766 30.240e49 2664 39 2451 42 2280 42 2263 42.9 1730 43.3 1648 43.7 1136 44.850e59 1177 17.2 1124 19.2 1032 19 972 18.4 759 19 711 18.8 502 19.8>60 178 2.6 158 2.7 151 2.8 142 2.7 98 2.5 90 2.4 63 2.5
Type of facilityUnknown 342 5 301 5.2 279 5.1 271 5.1 199 5 185 4.9 118 4.7Village doctors 39 0.6 23 0.4 25 0.5 24 0.5 19 0.5 17 0.5 10 0.4PHC centers 320 4.7 216 3.7 179 3.3 173 3.3 108 2.7 97 2.6 62 2.4Hospitals 977 14.3 661 11.3 592 10.9 575 10.9 348 8.7 312 8.3 174 6.9TB clinics 35 0.5 21 0.4 19 0.4 18 0.3 9 0.2 8 0.2 3 0.1Needle and syringe program 455 6.7 437 7.5 350 6.5 339 6.4 219 5.5 203 5.4 131 5.2National HCV screening center 254 3.7 240 4.1 226 4.2 219 4.2 184 4.6 179 4.8 129 5.1Prisons 126 1.9 107 1.8 75 1.4 72 1.4 57 1.4 54 1.4 25 1Blood banks 60 0.9 16 0.3 16 0.3 15 0.3 12 0.3 11 0.3 6 0.2OST clinics/addiction centers 526 7.7 354 6.1 279 5.1 270 5.1 177 4.4 163 4.3 95 3.7HCV specialized treatment centers 251 3.7 207 3.5 180 3.3 173 3.3 121 3 111 2.9 58 2.3NCDC and public laboratories 3441 50.4 3259 55.8 3204 59.1 3126 59.3 2546 63.7 2432 64.5 1726 68
HCV, hepatitis C virus; NCDC, National Center for Disease Control and Public Health; OST, opioid substitution treatment; PHC, primary health care; SVR, sustained virologicresponse; TB, tuberculosis.
Table 2The logistic regression model of starting HCV treatment (model fit likelihood ratio:c2 ¼ 210.44; P < 0.0001; pseudo R2 ¼ 0.03; number of observations ¼ 5.418; sig-nificant relationships are in italic and boldface).
Category OR SE Z P > z 95% CI
Gender (male)Female 0.51 0.19 �1.81 0.070 0.24 1.06Age (<25)25e30 0.88 0.44 �0.26 0.796 0.33 2.3231e39 1.09 0.52 0.19 0.852 0.43 2.7540e49 1.22 0.57 0.42 0.677 0.48 3.0750e59 1.08 0.51 0.16 0.871 0.43 2.74>59 0.69 0.35 �0.74 0.461 0.26 1.84
Type of facility (NCDC and public laboratories)Unknown 0.65 0.09 �3.01 0.003 0.50 0.86Village doctors 0.84 0.40 �0.37 0.708 0.33 2.11PHC clinics 0.40 0.06 �5.76 0.000 0.29 0.54Hospitals 0.37 0.04 �10.36 0.000 0.31 0.45TB clinics 0.23 0.11 �3.15 0.002 0.09 0.58NSP sites 0.55 0.08 �4.01 0.000 0.41 0.74National HCV Service Center 1.13 0.20 0.70 0.484 0.80 1.60Prisons 0.93 0.26 �0.26 0.798 0.54 1.61Blood bank 0.84 0.49 �0.31 0.758 0.27 2.63OST clinics/addiction centers 0.49 0.07 �5.29 0.000 0.37 0.64HCV treatment clinics 0.53 0.09 �3.84 0.000 0.38 0.73
PWID (No)Yes 0.76 0.08 �2.53 0.011 0.61 0.94
CI, confidence interval; HCV, hepatitis C virus; NCDC, National Center for DiseaseControl and Public Health; NSP, Needle and Syringe Program; OR, odds ratio; OST,opioid substitution treatment; PHC, primary health care; PWID, people who injectdrug; SE, standard error; TB, tuberculosis.
K. Stvilia, N. Vephkvadze, A. Gamkrelidze et al. Public Health 195 (2021) 42e50
46
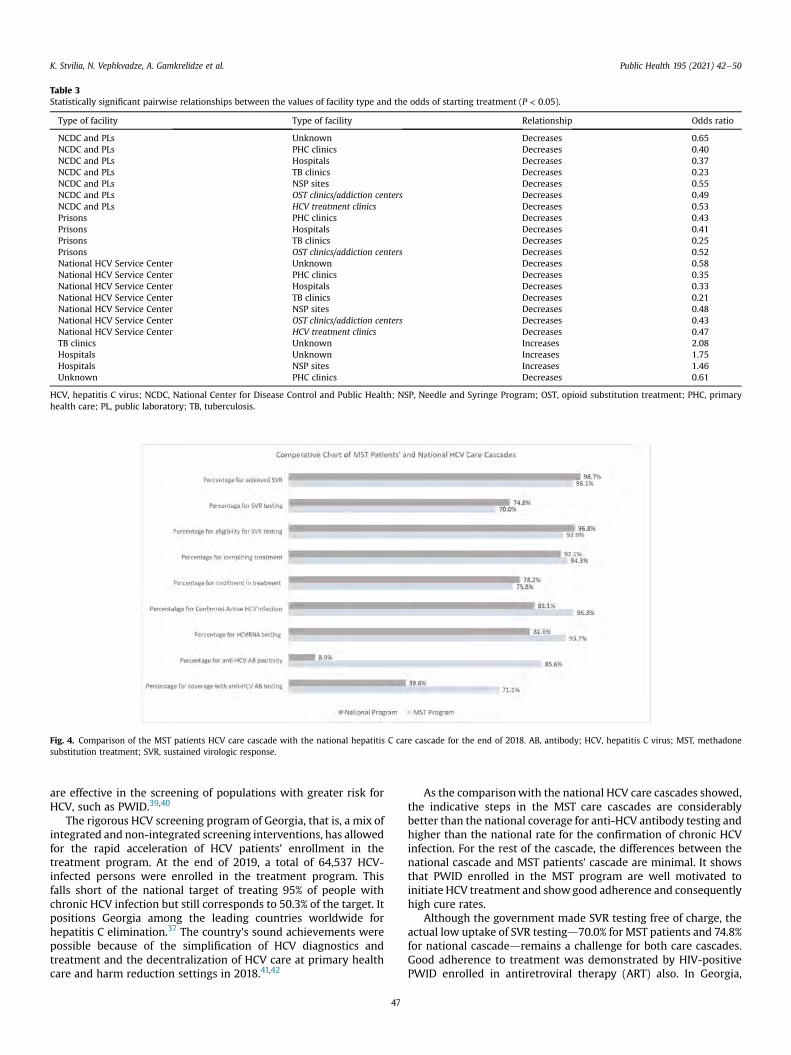
are effective in the screening of populations with greater risk forHCV, such as PWID.39,40
The rigorous HCV screening program of Georgia, that is, a mix ofintegrated and non-integrated screening interventions, has allowedfor the rapid acceleration of HCV patients' enrollment in thetreatment program. At the end of 2019, a total of 64,537 HCV-infected persons were enrolled in the treatment program. Thisfalls short of the national target of treating 95% of people withchronic HCV infection but still corresponds to 50.3% of the target. Itpositions Georgia among the leading countries worldwide forhepatitis C elimination.37 The country's sound achievements werepossible because of the simplification of HCV diagnostics andtreatment and the decentralization of HCV care at primary healthcare and harm reduction settings in 2018.41,42
As the comparisonwith the national HCV care cascades showed,the indicative steps in the MST care cascades are considerablybetter than the national coverage for anti-HCV antibody testing andhigher than the national rate for the confirmation of chronic HCVinfection. For the rest of the cascade, the differences between thenational cascade and MST patients' cascade are minimal. It showsthat PWID enrolled in the MST program are well motivated toinitiate HCV treatment and showgood adherence and consequentlyhigh cure rates.
Although the government made SVR testing free of charge, theactual low uptake of SVR testingd70.0% for MST patients and 74.8%for national cascadedremains a challenge for both care cascades.Good adherence to treatment was demonstrated by HIV-positivePWID enrolled in antiretroviral therapy (ART) also. In Georgia,
Table 3Statistically significant pairwise relationships between the values of facility type and the odds of starting treatment (P < 0.05).
Type of facility Type of facility Relationship Odds ratio
NCDC and PLs Unknown Decreases 0.65NCDC and PLs PHC clinics Decreases 0.40NCDC and PLs Hospitals Decreases 0.37NCDC and PLs TB clinics Decreases 0.23NCDC and PLs NSP sites Decreases 0.55NCDC and PLs OST clinics/addiction centers Decreases 0.49NCDC and PLs HCV treatment clinics Decreases 0.53Prisons PHC clinics Decreases 0.43Prisons Hospitals Decreases 0.41Prisons TB clinics Decreases 0.25Prisons OST clinics/addiction centers Decreases 0.52National HCV Service Center Unknown Decreases 0.58National HCV Service Center PHC clinics Decreases 0.35National HCV Service Center Hospitals Decreases 0.33National HCV Service Center TB clinics Decreases 0.21National HCV Service Center NSP sites Decreases 0.48National HCV Service Center OST clinics/addiction centers Decreases 0.43National HCV Service Center HCV treatment clinics Decreases 0.47TB clinics Unknown Increases 2.08Hospitals Unknown Increases 1.75Hospitals NSP sites Increases 1.46Unknown PHC clinics Decreases 0.61
HCV, hepatitis C virus; NCDC, National Center for Disease Control and Public Health; NSP, Needle and Syringe Program; OST, opioid substitution treatment; PHC, primaryhealth care; PL, public laboratory; TB, tuberculosis.
Fig. 4. Comparison of the MST patients HCV care cascade with the national hepatitis C care cascade for the end of 2018. AB, antibody; HCV, hepatitis C virus; MST, methadonesubstitution treatment; SVR, sustained virologic response.
K. Stvilia, N. Vephkvadze, A. Gamkrelidze et al. Public Health 195 (2021) 42e50
47
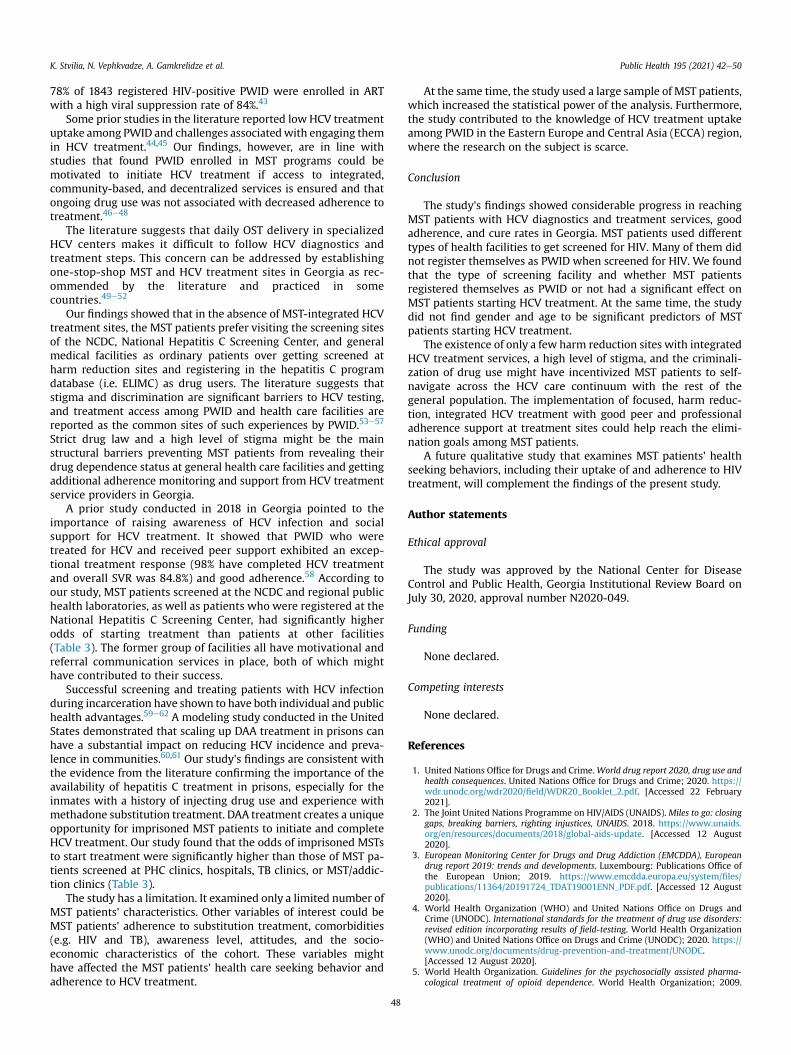
78% of 1843 registered HIV-positive PWID were enrolled in ARTwith a high viral suppression rate of 84%.43
Some prior studies in the literature reported low HCV treatmentuptake among PWID and challenges associatedwith engaging themin HCV treatment.44,45 Our findings, however, are in line withstudies that found PWID enrolled in MST programs could bemotivated to initiate HCV treatment if access to integrated,community-based, and decentralized services is ensured and thatongoing drug use was not associated with decreased adherence totreatment.46e48
The literature suggests that daily OST delivery in specializedHCV centers makes it difficult to follow HCV diagnostics andtreatment steps. This concern can be addressed by establishingone-stop-shop MST and HCV treatment sites in Georgia as rec-ommended by the literature and practiced in somecountries.49e52
Our findings showed that in the absence of MST-integrated HCVtreatment sites, the MST patients prefer visiting the screening sitesof the NCDC, National Hepatitis C Screening Center, and generalmedical facilities as ordinary patients over getting screened atharm reduction sites and registering in the hepatitis C programdatabase (i.e. ELIMC) as drug users. The literature suggests thatstigma and discrimination are significant barriers to HCV testing,and treatment access among PWID and health care facilities arereported as the common sites of such experiences by PWID.53e57
Strict drug law and a high level of stigma might be the mainstructural barriers preventing MST patients from revealing theirdrug dependence status at general health care facilities and gettingadditional adherence monitoring and support from HCV treatmentservice providers in Georgia.
A prior study conducted in 2018 in Georgia pointed to theimportance of raising awareness of HCV infection and socialsupport for HCV treatment. It showed that PWID who weretreated for HCV and received peer support exhibited an excep-tional treatment response (98% have completed HCV treatmentand overall SVR was 84.8%) and good adherence.58 According toour study, MST patients screened at the NCDC and regional publichealth laboratories, as well as patients who were registered at theNational Hepatitis C Screening Center, had significantly higherodds of starting treatment than patients at other facilities(Table 3). The former group of facilities all have motivational andreferral communication services in place, both of which mighthave contributed to their success.
Successful screening and treating patients with HCV infectionduring incarceration have shown to have both individual and publichealth advantages.59e62 A modeling study conducted in the UnitedStates demonstrated that scaling up DAA treatment in prisons canhave a substantial impact on reducing HCV incidence and preva-lence in communities.60,61 Our study's findings are consistent withthe evidence from the literature confirming the importance of theavailability of hepatitis C treatment in prisons, especially for theinmates with a history of injecting drug use and experience withmethadone substitution treatment. DAA treatment creates a uniqueopportunity for imprisoned MST patients to initiate and completeHCV treatment. Our study found that the odds of imprisoned MSTsto start treatment were significantly higher than those of MST pa-tients screened at PHC clinics, hospitals, TB clinics, or MST/addic-tion clinics (Table 3).
The study has a limitation. It examined only a limited number ofMST patients' characteristics. Other variables of interest could beMST patients' adherence to substitution treatment, comorbidities(e.g. HIV and TB), awareness level, attitudes, and the socio-economic characteristics of the cohort. These variables mighthave affected the MST patients' health care seeking behavior andadherence to HCV treatment.
At the same time, the study used a large sample of MST patients,which increased the statistical power of the analysis. Furthermore,the study contributed to the knowledge of HCV treatment uptakeamong PWID in the Eastern Europe and Central Asia (ECCA) region,where the research on the subject is scarce.
Conclusion
The study's findings showed considerable progress in reachingMST patients with HCV diagnostics and treatment services, goodadherence, and cure rates in Georgia. MST patients used differenttypes of health facilities to get screened for HIV. Many of them didnot register themselves as PWID when screened for HIV. We foundthat the type of screening facility and whether MST patientsregistered themselves as PWID or not had a significant effect onMST patients starting HCV treatment. At the same time, the studydid not find gender and age to be significant predictors of MSTpatients starting HCV treatment.
The existence of only a few harm reduction sites with integratedHCV treatment services, a high level of stigma, and the criminali-zation of drug use might have incentivized MST patients to self-navigate across the HCV care continuum with the rest of thegeneral population. The implementation of focused, harm reduc-tion, integrated HCV treatment with good peer and professionaladherence support at treatment sites could help reach the elimi-nation goals among MST patients.
A future qualitative study that examines MST patients' healthseeking behaviors, including their uptake of and adherence to HIVtreatment, will complement the findings of the present study.
Author statements
Ethical approval
The study was approved by the National Center for DiseaseControl and Public Health, Georgia Institutional Review Board onJuly 30, 2020, approval number N2020-049.
Funding
None declared.
Competing interests
None declared.
References
1. United Nations Office for Drugs and Crime.World drug report 2020, drug use andhealth consequences. United Nations Office for Drugs and Crime; 2020. https://wdr.unodc.org/wdr2020/field/WDR20_Booklet_2.pdf. [Accessed 22 February2021].
2. The Joint United Nations Programme on HIV/AIDS (UNAIDS). Miles to go: closinggaps, breaking barriers, righting injustices, UNAIDS. 2018. https://www.unaids.org/en/resources/documents/2018/global-aids-update. [Accessed 12 August2020].
3. European Monitoring Center for Drugs and Drug Addiction (EMCDDA), Europeandrug report 2019: trends and developments. Luxembourg: Publications Office ofthe European Union; 2019. https://www.emcdda.europa.eu/system/files/publications/11364/20191724_TDAT19001ENN_PDF.pdf. [Accessed 12 August2020].
4. World Health Organization (WHO) and United Nations Office on Drugs andCrime (UNODC). International standards for the treatment of drug use disorders:revised edition incorporating results of field-testing. World Health Organization(WHO) and United Nations Office on Drugs and Crime (UNODC); 2020. https://www.unodc.org/documents/drug-prevention-and-treatment/UNODC.[Accessed 12 August 2020].
5. World Health Organization. Guidelines for the psychosocially assisted pharma-cological treatment of opioid dependence. World Health Organization; 2009.
K. Stvilia, N. Vephkvadze, A. Gamkrelidze et al. Public Health 195 (2021) 42e50
48
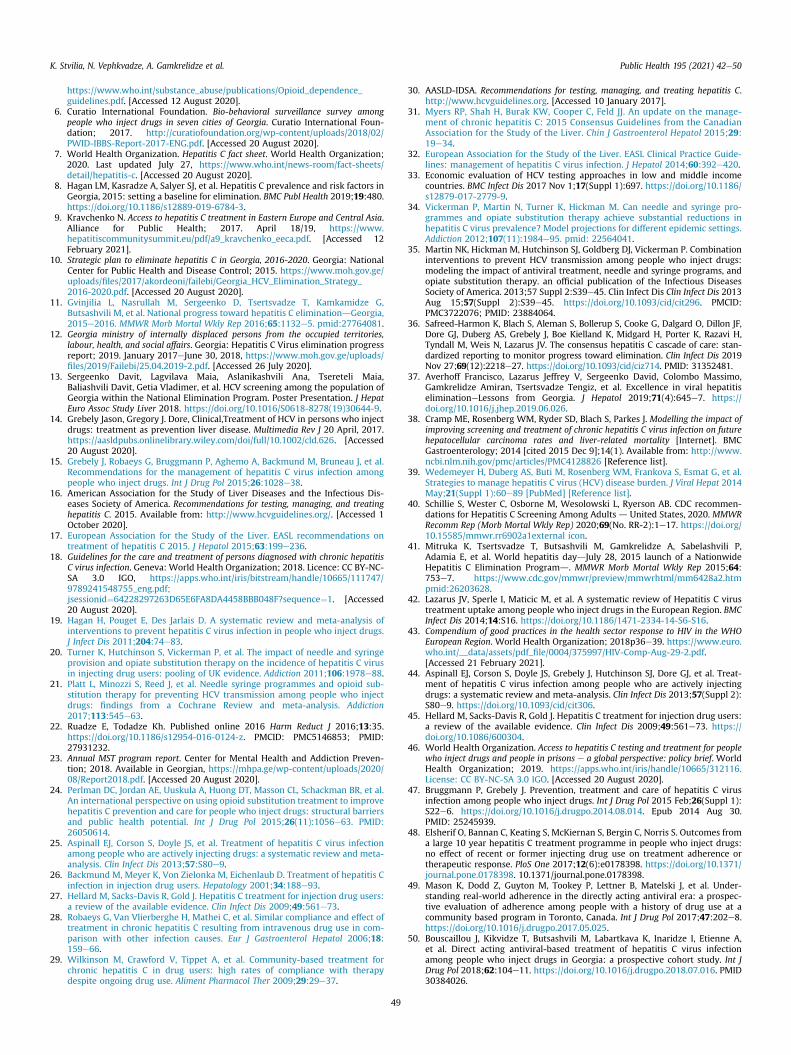
https://www.who.int/substance_abuse/publications/Opioid_dependence_guidelines.pdf. [Accessed 12 August 2020].
6. Curatio International Foundation. Bio-behavioral surveillance survey amongpeople who inject drugs in seven cities of Georgia. Curatio International Foun-dation; 2017. http://curatiofoundation.org/wp-content/uploads/2018/02/PWID-IBBS-Report-2017-ENG.pdf. [Accessed 20 August 2020].
7. World Health Organization. Hepatitis C fact sheet. World Health Organization;2020. Last updated July 27, https://www.who.int/news-room/fact-sheets/detail/hepatitis-c. [Accessed 20 August 2020].
8. Hagan LM, Kasradze A, Salyer SJ, et al. Hepatitis C prevalence and risk factors inGeorgia, 2015: setting a baseline for elimination. BMC Publ Health 2019;19:480.https://doi.org/10.1186/s12889-019-6784-3.
9. Kravchenko N. Access to hepatitis C treatment in Eastern Europe and Central Asia.Alliance for Public Health; 2017. April 18/19, https://www.hepatitiscommunitysummit.eu/pdf/a9_kravchenko_eeca.pdf. [Accessed 12February 2021].
10. Strategic plan to eliminate hepatitis C in Georgia, 2016-2020. Georgia: NationalCenter for Public Health and Disease Control; 2015. https://www.moh.gov.ge/uploads/files/2017/akordeoni/failebi/Georgia_HCV_Elimination_Strategy_2016-2020.pdf. [Accessed 20 August 2020].
11. Gvinjilia L, Nasrullah M, Sergeenko D, Tsertsvadze T, Kamkamidze G,Butsashvili M, et al. National progress toward hepatitis C eliminationdGeorgia,2015e2016. MMWR Morb Mortal Wkly Rep 2016;65:1132e5. pmid:27764081.
12. Georgia ministry of internally displaced persons from the occupied territories,labour, health, and social affairs. Georgia: Hepatitis C Virus elimination progressreport; 2019. January 2017eJune 30, 2018, https://www.moh.gov.ge/uploads/files/2019/Failebi/25.04.2019-2.pdf. [Accessed 26 July 2020].
13. Sergeenko Davit, Lagvilava Maia, Aslanikashvili Ana, Tsereteli Maia,Baliashvili Davit, Getia Vladimer, et al. HCV screening among the population ofGeorgia within the National Elimination Program. Poster Presentation. J HepatEuro Assoc Study Liver 2018. https://doi.org/10.1016/S0618-8278(19)30644-9.
14. Grebely Jason, Gregory J. Dore, Clinical,Treatment of HCV in persons who injectdrugs: treatment as prevention liver disease. Multimedia Rev J 20 April, 2017.https://aasldpubs.onlinelibrary.wiley.com/doi/full/10.1002/cld.626. [Accessed20 August 2020].
15. Grebely J, Robaeys G, Bruggmann P, Aghemo A, Backmund M, Bruneau J, et al.Recommendations for the management of hepatitis C virus infection amongpeople who inject drugs. Int J Drug Pol 2015;26:1028e38.
16. American Association for the Study of Liver Diseases and the Infectious Dis-eases Society of America. Recommendations for testing, managing, and treatinghepatitis C. 2015. Available from: http://www.hcvguidelines.org/. [Accessed 1October 2020].
17. European Association for the Study of the Liver. EASL recommendations ontreatment of hepatitis C 2015. J Hepatol 2015;63:199e236.
18. Guidelines for the care and treatment of persons diagnosed with chronic hepatitisC virus infection. Geneva: World Health Organization; 2018. Licence: CC BY-NC-SA 3.0 IGO, https://apps.who.int/iris/bitstream/handle/10665/111747/9789241548755_eng.pdf;jsessionid¼64228297263D65E6FA8DA4458BBB048F?sequence¼1. [Accessed20 August 2020].
19. Hagan H, Pouget E, Des Jarlais D. A systematic review and meta-analysis ofinterventions to prevent hepatitis C virus infection in people who inject drugs.J Infect Dis 2011;204:74e83.
20. Turner K, Hutchinson S, Vickerman P, et al. The impact of needle and syringeprovision and opiate substitution therapy on the incidence of hepatitis C virusin injecting drug users: pooling of UK evidence. Addiction 2011;106:1978e88.
21. Platt L, Minozzi S, Reed J, et al. Needle syringe programmes and opioid sub-stitution therapy for preventing HCV transmission among people who injectdrugs: findings from a Cochrane Review and meta-analysis. Addiction2017;113:545e63.
22. Ruadze E, Todadze Kh. Published online 2016 Harm Reduct J 2016;13:35.https://doi.org/10.1186/s12954-016-0124-z. PMCID: PMC5146853; PMID:27931232.
23. Annual MST program report. Center for Mental Health and Addiction Preven-tion; 2018. Available in Georgian, https://mhpa.ge/wp-content/uploads/2020/08/Report2018.pdf. [Accessed 20 August 2020].
24. Perlman DC, Jordan AE, Uuskula A, Huong DT, Masson CL, Schackman BR, et al.An international perspective on using opioid substitution treatment to improvehepatitis C prevention and care for people who inject drugs: structural barriersand public health potential. Int J Drug Pol 2015;26(11):1056e63. PMID:26050614.
25. Aspinall EJ, Corson S, Doyle JS, et al. Treatment of hepatitis C virus infectionamong people who are actively injecting drugs: a systematic review and meta-analysis. Clin Infect Dis 2013;57:S80e9.
26. Backmund M, Meyer K, Von Zielonka M, Eichenlaub D. Treatment of hepatitis Cinfection in injection drug users. Hepatology 2001;34:188e93.
27. Hellard M, Sacks-Davis R, Gold J. Hepatitis C treatment for injection drug users:a review of the available evidence. Clin Infect Dis 2009;49:561e73.
28. Robaeys G, Van Vlierberghe H, Mathei C, et al. Similar compliance and effect oftreatment in chronic hepatitis C resulting from intravenous drug use in com-parison with other infection causes. Eur J Gastroenterol Hepatol 2006;18:159e66.
29. Wilkinson M, Crawford V, Tippet A, et al. Community-based treatment forchronic hepatitis C in drug users: high rates of compliance with therapydespite ongoing drug use. Aliment Pharmacol Ther 2009;29:29e37.
30. AASLD-IDSA. Recommendations for testing, managing, and treating hepatitis C.http://www.hcvguidelines.org. [Accessed 10 January 2017].
31. Myers RP, Shah H, Burak KW, Cooper C, Feld JJ. An update on the manage-ment of chronic hepatitis C: 2015 Consensus Guidelines from the CanadianAssociation for the Study of the Liver. Chin J Gastroenterol Hepatol 2015;29:19e34.
32. European Association for the Study of the Liver. EASL Clinical Practice Guide-lines: management of hepatitis C virus infection. J Hepatol 2014;60:392e420.
33. Economic evaluation of HCV testing approaches in low and middle incomecountries. BMC Infect Dis 2017 Nov 1;17(Suppl 1):697. https://doi.org/10.1186/s12879-017-2779-9.
34. Vickerman P, Martin N, Turner K, Hickman M. Can needle and syringe pro-grammes and opiate substitution therapy achieve substantial reductions inhepatitis C virus prevalence? Model projections for different epidemic settings.Addiction 2012;107(11):1984e95. pmid: 22564041.
35. Martin NK, Hickman M, Hutchinson SJ, Goldberg DJ, Vickerman P. Combinationinterventions to prevent HCV transmission among people who inject drugs:modeling the impact of antiviral treatment, needle and syringe programs, andopiate substitution therapy. an official publication of the Infectious DiseasesSociety of America. 2013;57 Suppl 2:S39e45. Clin Infect Dis Clin Infect Dis 2013Aug 15;57(Suppl 2):S39e45. https://doi.org/10.1093/cid/cit296. PMCID:PMC3722076; PMID: 23884064.
36. Safreed-Harmon K, Blach S, Aleman S, Bollerup S, Cooke G, Dalgard O, Dillon JF,Dore GJ, Duberg AS, Grebely J, Boe Kielland K, Midgard H, Porter K, Razavi H,Tyndall M, Weis N, Lazarus JV. The consensus hepatitis C cascade of care: stan-dardized reporting to monitor progress toward elimination. Clin Infect Dis 2019Nov 27;69(12):2218e27. https://doi.org/10.1093/cid/ciz714. PMID: 31352481.
37. Averhoff Francisco, Lazarus Jeffrey V, Sergeenko David, Colombo Massimo,Gamkrelidze Amiran, Tsertsvadze Tengiz, et al. Excellence in viral hepatitiseliminationeLessons from Georgia. J Hepatol 2019;71(4):645e7. https://doi.org/10.1016/j.jhep.2019.06.026.
38. Cramp ME, Rosenberg WM, Ryder SD, Blach S, Parkes J. Modelling the impact ofimproving screening and treatment of chronic hepatitis C virus infection on futurehepatocellular carcinoma rates and liver-related mortality [Internet]. BMCGastroenterology; 2014 [cited 2015 Dec 9];14(1). Available from: http://www.ncbi.nlm.nih.gov/pmc/articles/PMC4128826 [Reference list].
39. Wedemeyer H, Duberg AS, Buti M, Rosenberg WM, Frankova S, Esmat G, et al.Strategies to manage hepatitis C virus (HCV) disease burden. J Viral Hepat 2014May;21(Suppl 1):60e89 [PubMed] [Reference list].
40. Schillie S, Wester C, Osborne M, Wesolowski L, Ryerson AB. CDC recommen-dations for Hepatitis C Screening Among Adults d United States, 2020. MMWRRecomm Rep (Morb Mortal Wkly Rep) 2020;69(No. RR-2):1e17. https://doi.org/10.15585/mmwr.rr6902a1external icon.
41. Mitruka K, Tsertsvadze T, Butsashvili M, Gamkrelidze A, Sabelashvili P,Adamia E, et al. World hepatitis daydJuly 28, 2015 launch of a NationwideHepatitis C Elimination Programd. MMWR Morb Mortal Wkly Rep 2015;64:753e7. https://www.cdc.gov/mmwr/preview/mmwrhtml/mm6428a2.htmpmid:26203628.
42. Lazarus JV, Sperle I, Maticic M, et al. A systematic review of Hepatitis C virustreatment uptake among people who inject drugs in the European Region. BMCInfect Dis 2014;14:S16. https://doi.org/10.1186/1471-2334-14-S6-S16.
43. Compendium of good practices in the health sector response to HIV in the WHOEuropean Region. World Health Organization; 2018p36e39. https://www.euro.who.int/__data/assets/pdf_file/0004/375997/HIV-Comp-Aug-29-2.pdf.[Accessed 21 February 2021].
44. Aspinall EJ, Corson S, Doyle JS, Grebely J, Hutchinson SJ, Dore GJ, et al. Treat-ment of hepatitis C virus infection among people who are actively injectingdrugs: a systematic review and meta-analysis. Clin Infect Dis 2013;57(Suppl 2):S80e9. https://doi.org/10.1093/cid/cit306.
45. Hellard M, Sacks-Davis R, Gold J. Hepatitis C treatment for injection drug users:a review of the available evidence. Clin Infect Dis 2009;49:561e73. https://doi.org/10.1086/600304.
46. World Health Organization. Access to hepatitis C testing and treatment for peoplewho inject drugs and people in prisons e a global perspective: policy brief. WorldHealth Organization; 2019. https://apps.who.int/iris/handle/10665/312116.License: CC BY-NC-SA 3.0 IGO. [Accessed 20 August 2020].
47. Bruggmann P, Grebely J. Prevention, treatment and care of hepatitis C virusinfection among people who inject drugs. Int J Drug Pol 2015 Feb;26(Suppl 1):S22e6. https://doi.org/10.1016/j.drugpo.2014.08.014. Epub 2014 Aug 30.PMID: 25245939.
48. Elsherif O, Bannan C, Keating S, McKiernan S, Bergin C, Norris S. Outcomes froma large 10 year hepatitis C treatment programme in people who inject drugs:no effect of recent or former injecting drug use on treatment adherence ortherapeutic response. PloS One 2017;12(6):e0178398. https://doi.org/10.1371/journal.pone.0178398. 10.1371/journal.pone.0178398.
49. Mason K, Dodd Z, Guyton M, Tookey P, Lettner B, Matelski J, et al. Under-standing real-world adherence in the directly acting antiviral era: a prospec-tive evaluation of adherence among people with a history of drug use at acommunity based program in Toronto, Canada. Int J Drug Pol 2017;47:202e8.https://doi.org/10.1016/j.drugpo.2017.05.025.
50. Bouscaillou J, Kikvidze T, Butsashvili M, Labartkava K, Inaridze I, Etienne A,et al. Direct acting antiviral-based treatment of hepatitis C virus infectionamong people who inject drugs in Georgia: a prospective cohort study. Int JDrug Pol 2018;62:104e11. https://doi.org/10.1016/j.drugpo.2018.07.016. PMID30384026.
K. Stvilia, N. Vephkvadze, A. Gamkrelidze et al. Public Health 195 (2021) 42e50
49
51. Bruggmann P, Grebely J. Prevention, treatment and care of hepatitis C virusinfection among people who inject drugs. Int J Drug Pol 2015;26(Suppl 1):S22e6. https://doi.org/10.1016/j.drugpo.2014.08.014.
52. Grebely J, Robaeys G, Bruggmann P, Aghemo A, Backmund M, Bruneau J, et al.Recommendations for the management of hepatitis C virus infection amongpeople who inject drugs. Int J Drug Pol 2015;26(10):1028e38. https://doi.org/10.1016/j.drugpo.2015.07.005.
53. Lally MA, Montstream-Quas SA, Tanaka S, Tedeschi SK, Morrow KM. A qualitativestudy among injection drug using women in Rhode Island: attitudes towardtesting, treatment, and vaccination for hepatitis and HIV. AIDS Patient Care STDS2008;22:53e64. https://doi.org/10.1089/apc.2006.0206.
54. Swan D, et al. Barriers to and facilitators of hepatitis C testing, management,and treatment among current and former injecting drug users: a qualitativeexploration. AIDS Patient Care STDS 2010;24:753e62. https://doi.org/10.1089/apc.2010.0142.
55. Strauss S, et al. Barriers and facilitators to undergoing hepatitis C virus (HCV)testing through drug treatment programs. J Drug Issues 2008;38:1161. https://doi.org/10.1177/002204260803800411.
56. Harris M, Rhodes T, Martin A. Taming systems to create enabling environmentsfor HCV treatment: negotiating trust in the drug and alcohol setting. Soc SciMed 2013;83:19e26.
57. Hopwood M, Treloar C, Bryant J. HCV and injecting-related discrimination inNew South Wales, Australia. Drugs Educ Prev Pol 2006;13:61e75. https://doi.org/10.1080/09687630500481150.
58. Chikovani I, Ompad DC, Uchaneishvili M, et al. On the way to hepatitis Celimination in the Republic of Georgiadbarriers and facilitators for people whoinject drugs for engaging in the treatment program: a formative qualitativestudy. PloS One 2019;14(4):e0216123. https://doi.org/10.1371/journal.-pone.0216123. Published online 2019 Apr 29.
59. He T, Li K, Roberts MS, et al. Prevention of hepatitis C by screening andtreatment in U.S. Prisons. Ann Intern Med 2016;164:84e92.
60. Stone J, Martin NK, Hickman M, et al. Modelling the impact of incarceration andprison-based hepatitis C virus (HCV) treatment on HCV transmission amongpeople who inject drugs in Scotland. Addiction 2017;112:1302e14.
61. Martin NK, Vickerman P, Dore GJ, Hickman M. The hepatitis C virus epidemicsin key populations (including people who inject drugs, prisoners and MSM):the use of direct-acting antivirals as treatment for prevention. Curr Opin HIVAIDS 2015;10:374e80.
62. Rich JD, Allen SA, Williams BA. Responding to hepatitis C through the criminaljustice system. N Engl J Med 2014;370:1871e4.
K. Stvilia, N. Vephkvadze, A. Gamkrelidze et al. Public Health 195 (2021) 42e50
50
diagnostics
Article
Diagnostic Performance and Usability of the Genedrive® HCVID Kit in Two Decentralized Settings in Cameroon and Georgia
Francois M. J. Lamoury 1, Richard Njouom 2, Marie Amougou-Atsama 2, Euloge Yiagnigni Mfopou 3,Nino Berishvili 4, Manana Sologashvili 5, Emmanuel Fajardo 1 , Agnes Malobela 1, Aurélien Macé 1 ,Maxwell Chirehwa 6, Maia Alkhazashvili 4 and Elena Ivanova Reipold 1,*
�����������������
Citation: Lamoury, F.M.J.; Njouom,
R.; Amougou-Atsama, M.; Yiagnigni
Mfopou, E.; Berishvili, N.;
Sologashvili, M.; Fajardo, E.;
Malobela, A.; Macé, A.; Chirehwa, M.;
et al. Diagnostic Performance and
Usability of the Genedrive® HCV ID
Kit in Two Decentralized Settings in
Cameroon and Georgia. Diagnostics
2021, 11, 746. https://doi.org/
10.3390/diagnostics11050746
Academic Editor: Carmen de
Mendoza
Received: 12 March 2021
Accepted: 9 April 2021
Published: 22 April 2021
Publisher’s Note: MDPI stays neutral
with regard to jurisdictional claims in
published maps and institutional affil-
iations.
Copyright: © 2021 by the authors.
Licensee MDPI, Basel, Switzerland.
This article is an open access article
distributed under the terms and
conditions of the Creative Commons
Attribution (CC BY) license (https://
creativecommons.org/licenses/by/
4.0/).
1 Foundation for Innovative New Diagnostics, 1202 Geneva, Switzerland; [email protected] (F.M.J.L.);[email protected] (E.F.); [email protected] (A.M.); [email protected] (A.M.)
2 Centre Pasteur du Cameroun, Yaoundé 1274, Cameroon; [email protected] (R.N.);[email protected] (M.A.-A.)
3 Polyclinique Les Promoteurs de la Bonne Santé, Yaoundé 8463, Cameroon; [email protected] Lugar Center for Public Health Research, National Center for Disease Control and Public Health,
0198 Tbilisi, Georgia; [email protected] (N.B.); [email protected] (M.A.)5 Hepa Plus, 0190 Tbilisi, Georgia; [email protected] Division of Clinical Pharmacology, University of Cape Town, Cape Town 7700, South Africa;
[email protected]* Correspondence: [email protected]
Abstract: Point-of-care diagnostics have the potential to increase diagnosis and linkage to care andhelp reach the WHO targets to eliminate hepatitis C virus (HCV) by 2030. Here, we evaluatedthe diagnostic accuracy of Genedrive HCV ID assay for the qualitative detection of HCV RNA indecentralized settings in two low- and middle-income countries using fresh plasma specimens from426 participants. The Abbott RealTime HCV assay was used as the gold standard. Genedrive HCV IDassay was conducted by different users. Users also completed questionnaires to assess the usabilityof Genedrive. At detection thresholds of 12 IU/mL or 30 IU/mL, 1000 IU/mL, and 2362 IU/mL, thesensitivity was 96.2% (95% CI: 92.7–98.4), 100% (98.2–100), and 100% (98.2–100), respectively; thespecificity was 99.5% (95% CI: 97.4–100), 99.5% (97.5–100), and 98.7% (96.1–100), respectively. Allgenotypes detected using the gold-standard assay were also detected with Genedrive. Users foundGenedrive easy to use. Genedrive is a simple and accurate test to confirm chronic HCV infectionin decentralized, real-life, resource-limited settings. This novel diagnostic tool could contribute toclosing the current gap in HCV diagnosis.
Keywords: Hepatitis C; HCV RNA; diagnostics; point-of-care; Genedrive
1. Background
Hepatitis C virus (HCV) infection can lead to chronic disease that may progressfor decades without being noticed until symptoms of advanced liver disease appear [1].Approximately 71 million people worldwide are living with chronic HCV infection, andmore than 80% of them are living in low- and middle-income countries (LMICs) [2]. TheWorld Health Organization (WHO) has called for the elimination of HCV by 2030 [3].Treatment for HCV is becoming more widely available worldwide, with the developmentof short-course oral direct-acting antiviral (DAA) regimens with higher tolerability andcure rates and the introduction of generic formulations [4–6]. However, access to treatmentremains limited due to insufficient diagnostic services and poor linkage to care.
Nucleic acid testing for quantitative HCV RNA determination is mainly performedusing high-throughput platforms in specialized laboratories. The cost of these assays isgenerally high, and turnaround times for results to reach patients can be several weeks induration. More portable, affordable, and easy-to-use platforms that can be used in districthospitals or clinics may help decentralize and increase access to HCV testing in LMICs [7].
Diagnostics 2021, 11, 746. https://doi.org/10.3390/diagnostics11050746 https://www.mdpi.com/journal/diagnostics
Diagnostics 2021, 11, 746 2 of 10
One HCV RNA assay that requires fewer technical skills to operate is the Genedrive®
HCV ID Kit (Genedrive Diagnostics Ltd, Manchester, UK), henceforth referred to asGenedrive. This test meets most of the technical requirements for a virological test, asdefined in the target product profile developed by FIND (Foundation for Innovative NewDiagnostics) and WHO [8]. Genedrive detects HCV RNA in a small volume of plasma(30 µL) using reverse transcription polymerase chain reaction (RT-PCR). The system pro-vides a simple, qualitative result without the need for specialist knowledge or data inter-pretation [9]. The Genedrive instrument is small and can be easily operated in a range ofdecentralized laboratory settings with limited requirements for ancillary equipment or testmaterials. The Genedrive HCV ID Kit comprises lyophilized PCR reagents packaged into asingle-use, disposable cartridge, and the testing procedure consists of 12 manual steps [10].The test turnaround time is about 90 min. It is intended to be a confirmatory test of currentHCV infection following a positive HCV antibody test. The test is CE-marked [11] andWHO prequalified [12]. One study found Genedrive to have an analytical sensitivity of2362 IU/mL, with 98.6% sensitivity and 100% specificity [13]. However, the performancewas evaluated on leftover frozen plasma samples obtained from a research laboratory inEurope. The performance of Genedrive with freshly collected samples in real-world LMICsettings, operated by intended users, has not yet been assessed.
Genedrive has the potential to simplify testing requirements and decentralize HCVRNA testing for the confirmation of HCV viremia. The aim of this study was to evaluatethe diagnostic performance and usability of Genedrive in laboratory-based real-life settingsin Cameroon and Georgia.
2. Methods2.1. Study Design
This cross-sectional study was performed and reported in accordance with the Stan-dards for Reporting of Diagnostic Accuracy Studies (STARD) guidelines [14]. The studywas conducted in small laboratories in primary healthcare settings where, typically, HCVRNA testing is not available. Informed consent was obtained from participants in Georgiaand Cameroon, who were then prospectively enrolled in the study. The study protocol wasapproved by the respective local ethics committees in Cameroon (N◦2019/06/1166/CE/CNERSH/SP, 14 June 2019) and Georgia (N◦8160-2/1, 1 December 2018). The diagnosticperformance of Genedrive (index test) was evaluated against a gold standard (referencetest), the Abbott RealTime HCV viral load assay (Abbott Molecular Inc., Des Plaines, IL, USA),henceforth referred to as Abbott HCV.
2.2. Study Population and Study Settings
Individuals who fulfilled the eligibility criteria were invited to participate in the studyuntil the desired sample size was reached. Recruitment took place between June andOctober 2019. Three population groups were considered: “HCV risk,” “HCV seropositive,”and “HCV treatment.” The “HCV risk” group included individuals at risk of havingHCV infection based on past and/or current exposure to risk factors, as defined in theWHO [15] and Centers for Disease Control and Prevention (CDC) guidelines [16]. The“HCV seropositive” group included individuals with a documented positive HCV serologyresult. Finally, the “HCV treatment” group included individuals diagnosed with chronicHCV infection who initiated or completed a course of DAA therapy and who presented atthe clinical site for treatment monitoring or test of cure (i.e., sustained virological response).
Two sites per country were used for testing, one site for the index test and another forthe reference test. In Georgia, recruitment and index testing was done at a Hepa Plus harmreduction site in Tbilisi, and reference testing was done at the National Center for DiseaseControl (NCDC). In Cameroon, recruitment and reference testing was conducted at theCentre Pasteur of Cameroon (CPC) in Yaoundé, and index testing was performed at theclinic “les Promoteurs de la Bonne Santé (PBS),” also in Yaoundé. Neither of the countryindex testing facilities had any prior experience in PCR-based assays and were blind to the
Diagnostics 2021, 11, 746 3 of 10
results of reference testing. At both sites, reference and index testing were carried out bydifferent users, and no data were shared.
2.3. Testing Methods
Participants were asked to provide 8 mL of venous blood, collected in standard K2EDTA tubes. Plasma was aliquoted within 6 h of blood collection, and Genedrive testingcarried out within 24 h, using 30 µL of plasma. The Genedrive testing procedure consistedof 12 steps, from sample input to result reporting. One plasma aliquot was used for testingwith the Abbott HCV within 4 weeks of blood collection, using the m2000sp/m2000rtplatform. Another aliquot of plasma was used for HCV genotype analysis, performed usingSanger sequencing in Cameroon and the Abbott RealTime HCV Genotype II Assay [17] inGeorgia. The remaining aliquots were stored at −80 ◦C and used for repeat testing andresolution of discrepant results. All testing procedures were performed in accordance withthe manufacturers’ instructions.
2.4. Usability of Genedrive
All users received training on Genedrive from the manufacturer prior to the start ofthe studies. Two structured questionnaires, capturing ease-of-use, level of training received,problems encountered, and overall opinion of the technology were completed by each userbased on their experience of the test system. Answers were rated using a 5-point Likertscale, from strongly agree to strongly disagree (Supplementary Material Table S1).
2.5. Statistical Analysis
Assuming a sensitivity and specificity of 95% and 97.5%, respectively, a power of80%, and a significance level of 5%, it was calculated that a minimum sample size of200 participants with detectable HCV RNA and 200 participants with no detectable HCVRNA was required.
The results of Genedrive were compared with those of the Abbott HCV to calcu-late sensitivity and specificity, along with 95% confidence intervals (CI). Sensitivity andspecificity were calculated using different detection thresholds with the reference assay,namely: 30 IU/mL in Georgia [18] and 12 IU/mL in Cameroon; 1000 IU/mL based onrecommendations from the European Association for the Study of the Liver (EASL) [19]and 2362 IU/mL based on Genedrive’s lower limit of detection.
The rate of invalid results was estimated by calculating the total number of testswithout a positive or negative result given by the Genedrive instrument, either because ofan indeterminate result or a failed control. Invalid results were excluded from the diagnosticaccuracy analyses. Descriptive statistics were used to describe the study population. Allanalyses were performed using the statistical software R (R Foundation for StatisticalComputing, version 3.6).
3. Results3.1. Characteristics of the Study Population
Among the 434 participants who met the inclusion criteria, 8 participants were ex-cluded due to lack of consent, resulting in a total of 426 enrolled participants. The totalnumber of participants classified according to HCV antibody status and HCV RNA isshown in Figure 1. The demographic characteristics of the participants are displayed inTable 1. Among all enrolled participants, the median age was 47 years, and 73.9% weremale. In Georgia, 99.6% of participants had a history of injecting non-prescription drugscompared to none in Cameroon. Overall, 1.3% of participants in Cameroon were HIV-positive versus 1.1% in Georgia. Only 11.0% of participants had received HCV treatment,all from Georgia. Overall, 50.0% of participants had detectable HCV RNA levels. Of thesamples with detectable HCV RNA, 93% had genotype data available, with genotype 1being the most common (52.7%).
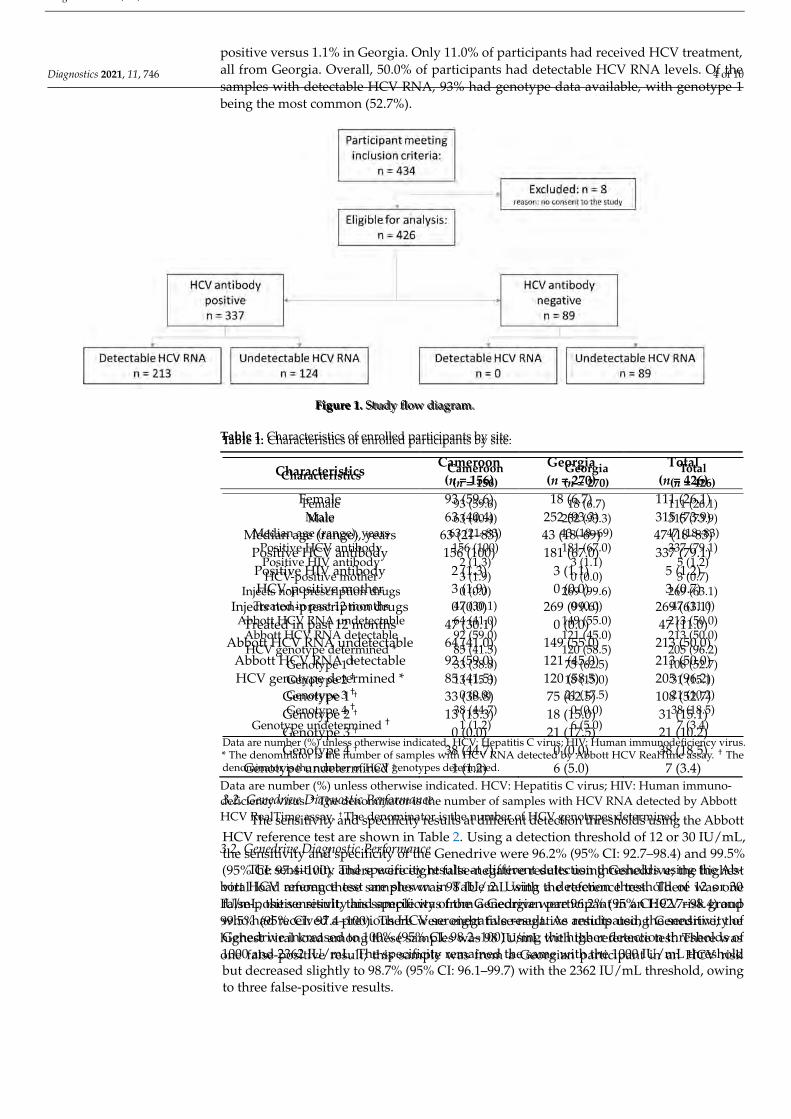
Diagnostics 2021, 11, 746 4 of 10
Diagnostics 2021, 11, x FOR PEER REVIEW 4 of 10
positive versus 1.1% in Georgia. Only 11.0% of participants had received HCV treatment, all from Georgia. Overall, 50.0% of participants had detectable HCV RNA levels. Of the samples with detectable HCV RNA, 93% had genotype data available, with genotype 1 being the most common (52.7%).
Figure 1. Study flow diagram.
Table 1. Characteristics of enrolled participants by site.
Characteristics Cameroon
(n = 156) Georgia (n = 270)
Total (n = 426)
Female 93 (59.6) 18 (6.7) 111 (26.1) Male 63 (40.4) 252 (93.3) 315 (73.9)
Median age (range), years 63 (21–83) 43 (18–69) 47 (18–83) Positive HCV antibody 156 (100) 181 (67.0) 337 (79.1) Positive HIV antibody 2 (1.3) 3 (1.1) 5 (1.2) HCV-positive mother 3 (1.9) 0 (0.0) 3 (0.7)
Injects non-prescription drugs 0 (0.0) 269 (99.6) 269 (63.1) Treated in past 12 months 47 (30.1) 0 (0.0) 47 (11.0)
Abbott HCV RNA undetectable 64 (41.0) 149 (55.0) 213 (50.0) Abbott HCV RNA detectable 92 (59.0) 121 (45.0) 213 (50.0) HCV genotype determined * 85 (41.5) 120 (58.5) 205 (96.2)
Genotype 1 † 33 (38.8) 75 (62.5) 108 (52.7) Genotype 2 † 13 (15.3) 18 (15.0) 31 (15.1) Genotype 3 † 0 (0.0) 21 (17.5) 21 (10.2) Genotype 4 † 38 (44.7) 0 (0.0) 38 (18.5)
Genotype undetermined † 1 (1.2) 6 (5.0) 7 (3.4) Data are number (%) unless otherwise indicated. HCV: Hepatitis C virus; HIV: Human immuno-deficiency virus. * The denominator is the number of samples with HCV RNA detected by Abbott HCV RealTime assay. † The denominator is the number of HCV genotypes determined.
3.2. Genedrive Diagnostic Performance The sensitivity and specificity results at different detection thresholds using the Ab-
bott HCV reference test are shown in Table 2. Using a detection threshold of 12 or 30 IU/mL, the sensitivity and specificity of the Genedrive were 96.2% (95% CI: 92.7–98.4) and 99.5% (95% CI: 97.4–100). There were eight false-negative results using Genedrive; the highest viral load among these samples was 98 IU/mL with the reference test. There was one false-positive result; this sample was from a Georgian participant in an HCV risk
Figure 1. Study flow diagram.
Table 1. Characteristics of enrolled participants by site.
Characteristics Cameroon(n = 156)
Georgia(n = 270)
Total(n = 426)
Female 93 (59.6) 18 (6.7) 111 (26.1)Male 63 (40.4) 252 (93.3) 315 (73.9)
Median age (range), years 63 (21–83) 43 (18–69) 47 (18–83)Positive HCV antibody 156 (100) 181 (67.0) 337 (79.1)Positive HIV antibody 2 (1.3) 3 (1.1) 5 (1.2)HCV-positive mother 3 (1.9) 0 (0.0) 3 (0.7)
Injects non-prescription drugs 0 (0.0) 269 (99.6) 269 (63.1)Treated in past 12 months 47 (30.1) 0 (0.0) 47 (11.0)
Abbott HCV RNA undetectable 64 (41.0) 149 (55.0) 213 (50.0)Abbott HCV RNA detectable 92 (59.0) 121 (45.0) 213 (50.0)HCV genotype determined * 85 (41.5) 120 (58.5) 205 (96.2)
Genotype 1 † 33 (38.8) 75 (62.5) 108 (52.7)Genotype 2 † 13 (15.3) 18 (15.0) 31 (15.1)Genotype 3 † 0 (0.0) 21 (17.5) 21 (10.2)Genotype 4 † 38 (44.7) 0 (0.0) 38 (18.5)
Genotype undetermined † 1 (1.2) 6 (5.0) 7 (3.4)Data are number (%) unless otherwise indicated. HCV: Hepatitis C virus; HIV: Human immunodeficiency virus.* The denominator is the number of samples with HCV RNA detected by Abbott HCV RealTime assay. † Thedenominator is the number of HCV genotypes determined.
3.2. Genedrive Diagnostic Performance
The sensitivity and specificity results at different detection thresholds using the AbbottHCV reference test are shown in Table 2. Using a detection threshold of 12 or 30 IU/mL,the sensitivity and specificity of the Genedrive were 96.2% (95% CI: 92.7–98.4) and 99.5%(95% CI: 97.4–100). There were eight false-negative results using Genedrive; the highestviral load among these samples was 98 IU/mL with the reference test. There was onefalse-positive result; this sample was from a Georgian participant in an HCV risk groupwho had received a previous HCV seronegative result. As anticipated, the sensitivity ofGenedrive increased to 100% (95% CI: 98.2–100) using the higher detection thresholds of1000 and 2362 IU/mL. The specificity remained the same with the 1000 IU/mL thresholdbut decreased slightly to 98.7% (95% CI: 96.1–99.7) with the 2362 IU/mL threshold, owingto three false-positive results.
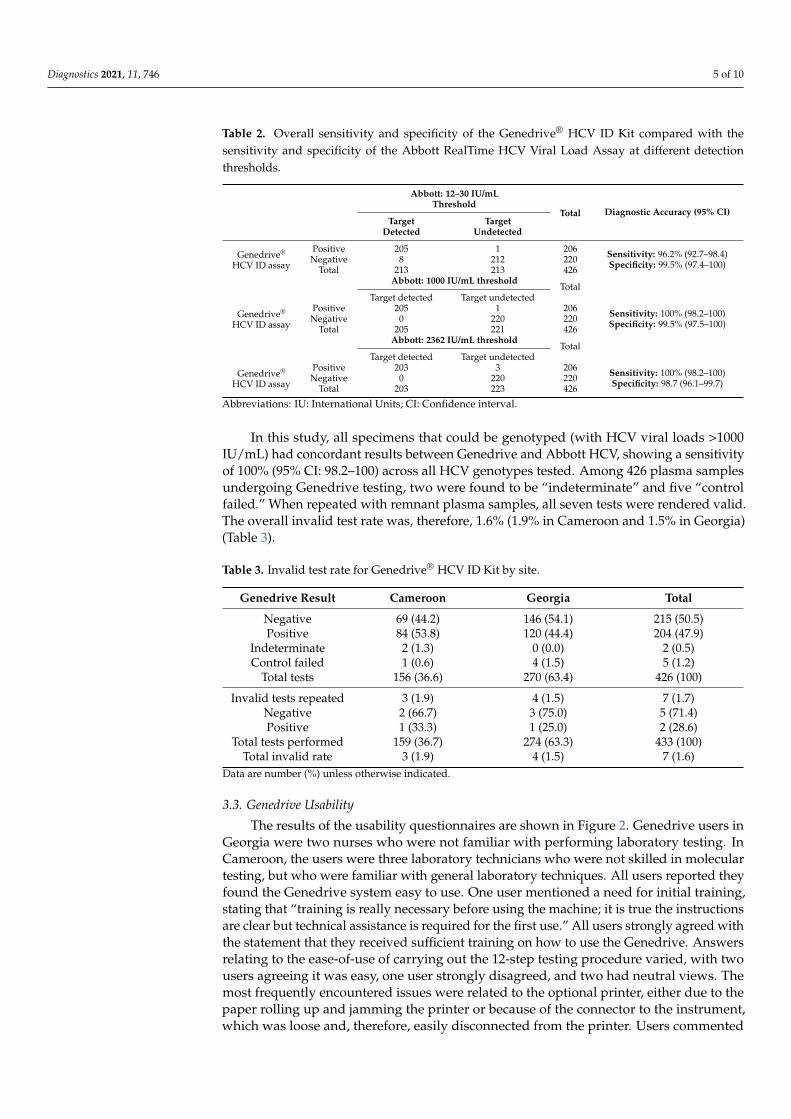
Diagnostics 2021, 11, 746 5 of 10
Table 2. Overall sensitivity and specificity of the Genedrive® HCV ID Kit compared with thesensitivity and specificity of the Abbott RealTime HCV Viral Load Assay at different detectionthresholds.
Abbott: 12–30 IU/mLThreshold
Total Diagnostic Accuracy (95% CI)Target
DetectedTarget
Undetected
Genedrive®
HCV ID assay
Positive 205 1 206 Sensitivity: 96.2% (92.7–98.4)Specificity: 99.5% (97.4–100)Negative 8 212 220
Total 213 213 426Abbott: 1000 IU/mL threshold
TotalTarget detected Target undetected
Genedrive®
HCV ID assay
Positive 205 1 206 Sensitivity: 100% (98.2–100)Specificity: 99.5% (97.5–100)Negative 0 220 220
Total 205 221 426Abbott: 2362 IU/mL threshold
TotalTarget detected Target undetected
Genedrive®
HCV ID assay
Positive 203 3 206 Sensitivity: 100% (98.2–100)Specificity: 98.7 (96.1–99.7)Negative 0 220 220
Total 203 223 426
Abbreviations: IU: International Units; CI: Confidence interval.
In this study, all specimens that could be genotyped (with HCV viral loads >1000IU/mL) had concordant results between Genedrive and Abbott HCV, showing a sensitivityof 100% (95% CI: 98.2–100) across all HCV genotypes tested. Among 426 plasma samplesundergoing Genedrive testing, two were found to be “indeterminate” and five “controlfailed.” When repeated with remnant plasma samples, all seven tests were rendered valid.The overall invalid test rate was, therefore, 1.6% (1.9% in Cameroon and 1.5% in Georgia)(Table 3).
Table 3. Invalid test rate for Genedrive® HCV ID Kit by site.
Genedrive Result Cameroon Georgia Total
Negative 69 (44.2) 146 (54.1) 215 (50.5)Positive 84 (53.8) 120 (44.4) 204 (47.9)
Indeterminate 2 (1.3) 0 (0.0) 2 (0.5)Control failed 1 (0.6) 4 (1.5) 5 (1.2)
Total tests 156 (36.6) 270 (63.4) 426 (100)
Invalid tests repeated 3 (1.9) 4 (1.5) 7 (1.7)Negative 2 (66.7) 3 (75.0) 5 (71.4)Positive 1 (33.3) 1 (25.0) 2 (28.6)
Total tests performed 159 (36.7) 274 (63.3) 433 (100)Total invalid rate 3 (1.9) 4 (1.5) 7 (1.6)
Data are number (%) unless otherwise indicated.
3.3. Genedrive Usability
The results of the usability questionnaires are shown in Figure 2. Genedrive users inGeorgia were two nurses who were not familiar with performing laboratory testing. InCameroon, the users were three laboratory technicians who were not skilled in moleculartesting, but who were familiar with general laboratory techniques. All users reported theyfound the Genedrive system easy to use. One user mentioned a need for initial training,stating that “training is really necessary before using the machine; it is true the instructionsare clear but technical assistance is required for the first use.” All users strongly agreed withthe statement that they received sufficient training on how to use the Genedrive. Answersrelating to the ease-of-use of carrying out the 12-step testing procedure varied, with twousers agreeing it was easy, one user strongly disagreed, and two had neutral views. Themost frequently encountered issues were related to the optional printer, either due to thepaper rolling up and jamming the printer or because of the connector to the instrument,which was loose and, therefore, easily disconnected from the printer. Users commented
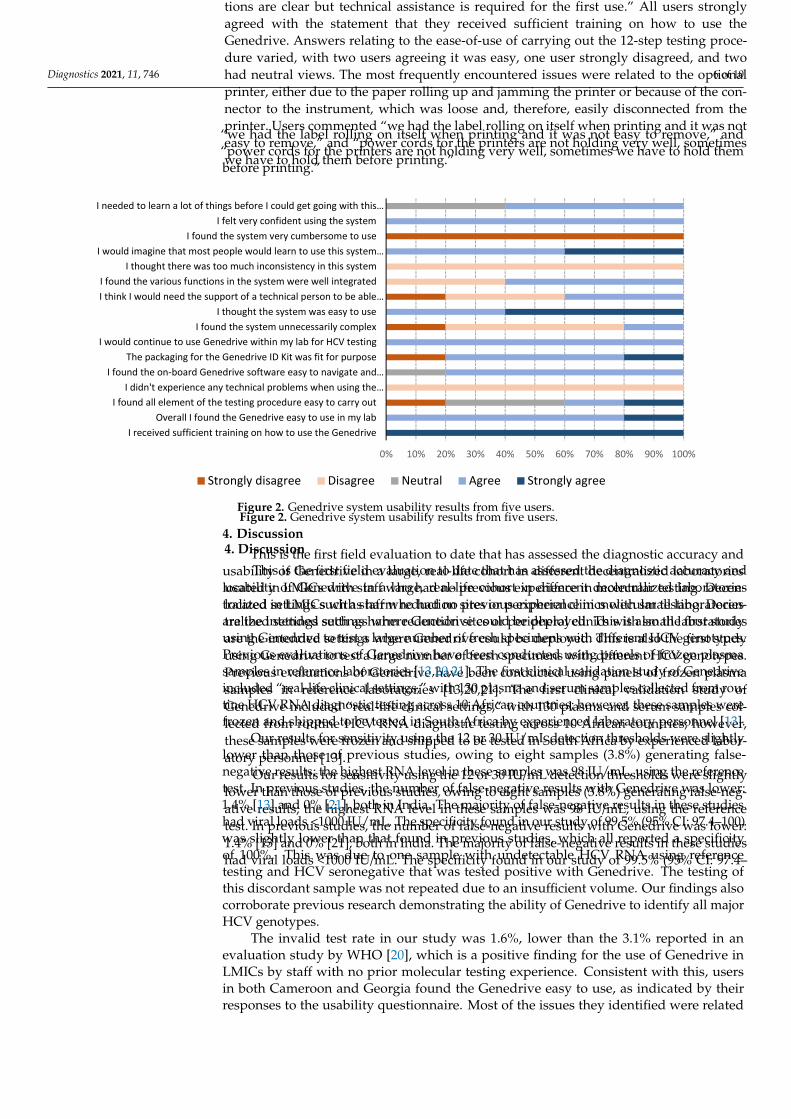
Diagnostics 2021, 11, 746 6 of 10
“we had the label rolling on itself when printing and it was not easy to remove,” and“power cords for the printers are not holding very well, sometimes we have to hold thembefore printing.”
Diagnostics 2021, 11, x FOR PEER REVIEW 6 of 10
found the Genedrive system easy to use. One user mentioned a need for initial training, stating that “training is really necessary before using the machine; it is true the instruc-tions are clear but technical assistance is required for the first use.” All users strongly agreed with the statement that they received sufficient training on how to use the Genedrive. Answers relating to the ease-of-use of carrying out the 12-step testing proce-dure varied, with two users agreeing it was easy, one user strongly disagreed, and two had neutral views. The most frequently encountered issues were related to the optional printer, either due to the paper rolling up and jamming the printer or because of the con-nector to the instrument, which was loose and, therefore, easily disconnected from the printer. Users commented “we had the label rolling on itself when printing and it was not easy to remove,” and “power cords for the printers are not holding very well, sometimes we have to hold them before printing.”
Figure 2. Genedrive system usability results from five users.
4. Discussion This is the first field evaluation to date that has assessed the diagnostic accuracy and
usability of Genedrive in a large, real-life cohort in different decentralized laboratories located in LMICs with staff who had no previous experience in molecular testing. Decen-tralized settings such as harm reduction sites or peripheral clinics with small laboratories are the intended settings where Genedrive could be deployed. This is also the first study using Genedrive to test a large number of fresh specimens with different HCV genotypes. Previous evaluations of Genedrive have been conducted using panels of frozen plasma samples in reference laboratories [13,20,21]. The first clinical validation study of Genedrive included “real-life clinical settings,” with 130 plasma and serum samples col-lected from routine HCV RNA diagnostic testing across 10 African countries; however, these samples were frozen and shipped to be tested in South Africa by experienced labor-atory personnel [13].
Our results for sensitivity using the 12 or 30 IU/mL detection thresholds were slightly lower than those of previous studies, owing to eight samples (3.8%) generating false-neg-ative results; the highest RNA level in these samples was 98 IU/mL, using the reference test. In previous studies, the number of false-negative results with Genedrive was lower: 1.4% [13] and 0% [21], both in India. The majority of false-negative results in these studies had viral loads <1000 IU/mL. The specificity found in our study of 99.5% (95% CI: 97.4–
0% 10% 20% 30% 40% 50% 60% 70% 80% 90% 100%
I received sufficient training on how to use the GenedriveOverall I found the Genedrive easy to use in my lab
I found all element of the testing procedure easy to carry outI didn't experience any technical problems when using the…
I found the on-board Genedrive software easy to navigate and…The packaging for the Genedrive ID Kit was fit for purpose
I would continue to use Genedrive within my lab for HCV testingI found the system unnecessarily complex
I thought the system was easy to useI think I would need the support of a technical person to be able…I found the various functions in the system were well integrated
I thought there was too much inconsistency in this systemI would imagine that most people would learn to use this system…
I found the system very cumbersome to useI felt very confident using the system
I needed to learn a lot of things before I could get going with this…
Strongly disagree Disagree Neutral Agree Strongly agree
Figure 2. Genedrive system usability results from five users.
4. Discussion
This is the first field evaluation to date that has assessed the diagnostic accuracy andusability of Genedrive in a large, real-life cohort in different decentralized laboratorieslocated in LMICs with staff who had no previous experience in molecular testing. Decen-tralized settings such as harm reduction sites or peripheral clinics with small laboratoriesare the intended settings where Genedrive could be deployed. This is also the first studyusing Genedrive to test a large number of fresh specimens with different HCV genotypes.Previous evaluations of Genedrive have been conducted using panels of frozen plasmasamples in reference laboratories [13,20,21]. The first clinical validation study of Genedriveincluded “real-life clinical settings,” with 130 plasma and serum samples collected from rou-tine HCV RNA diagnostic testing across 10 African countries; however, these samples werefrozen and shipped to be tested in South Africa by experienced laboratory personnel [13].
Our results for sensitivity using the 12 or 30 IU/mL detection thresholds were slightlylower than those of previous studies, owing to eight samples (3.8%) generating false-negative results; the highest RNA level in these samples was 98 IU/mL, using the referencetest. In previous studies, the number of false-negative results with Genedrive was lower:1.4% [13] and 0% [21], both in India. The majority of false-negative results in these studieshad viral loads <1000 IU/mL. The specificity found in our study of 99.5% (95% CI: 97.4–100)was slightly lower than that found in previous studies, which all reported a specificityof 100%. This was due to one sample with undetectable HCV RNA using referencetesting and HCV seronegative that was tested positive with Genedrive. The testing ofthis discordant sample was not repeated due to an insufficient volume. Our findings alsocorroborate previous research demonstrating the ability of Genedrive to identify all majorHCV genotypes.
The invalid test rate in our study was 1.6%, lower than the 3.1% reported in anevaluation study by WHO [20], which is a positive finding for the use of Genedrive inLMICs by staff with no prior molecular testing experience. Consistent with this, usersin both Cameroon and Georgia found the Genedrive easy to use, as indicated by theirresponses to the usability questionnaire. Most of the issues they identified were related
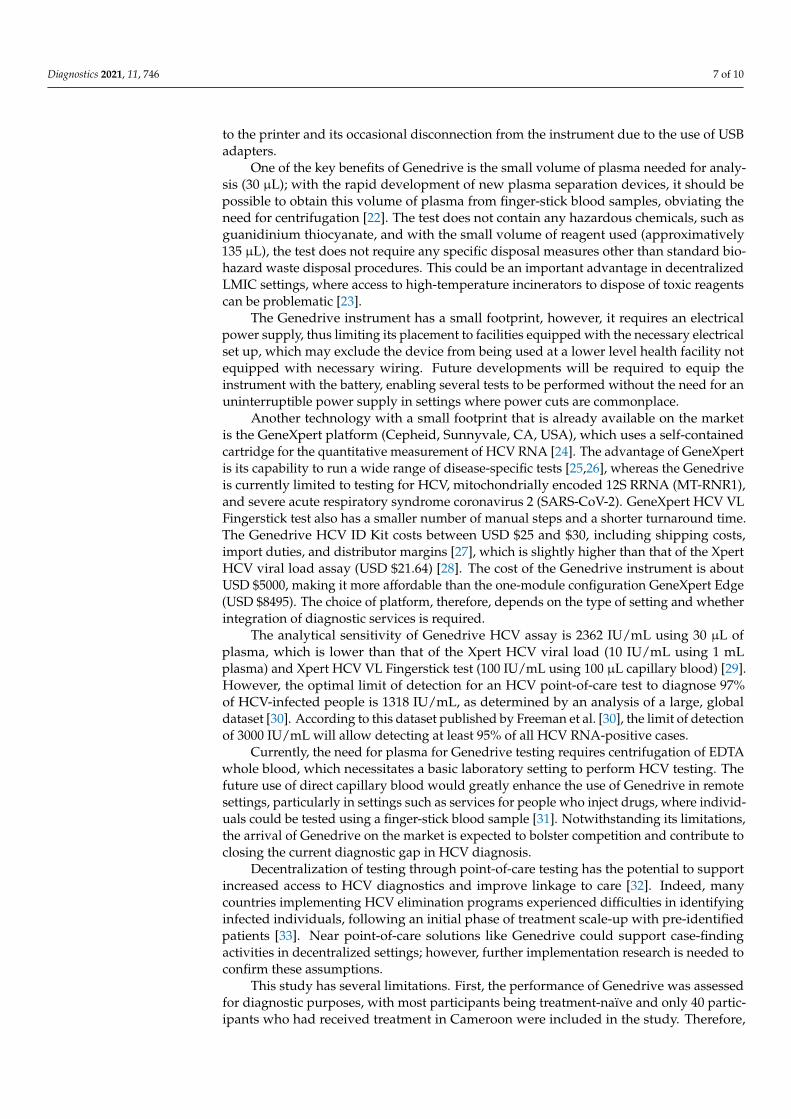
Diagnostics 2021, 11, 746 7 of 10
to the printer and its occasional disconnection from the instrument due to the use of USBadapters.
One of the key benefits of Genedrive is the small volume of plasma needed for analy-sis (30 µL); with the rapid development of new plasma separation devices, it should bepossible to obtain this volume of plasma from finger-stick blood samples, obviating theneed for centrifugation [22]. The test does not contain any hazardous chemicals, such asguanidinium thiocyanate, and with the small volume of reagent used (approximatively135 µL), the test does not require any specific disposal measures other than standard bio-hazard waste disposal procedures. This could be an important advantage in decentralizedLMIC settings, where access to high-temperature incinerators to dispose of toxic reagentscan be problematic [23].
The Genedrive instrument has a small footprint, however, it requires an electricalpower supply, thus limiting its placement to facilities equipped with the necessary electricalset up, which may exclude the device from being used at a lower level health facility notequipped with necessary wiring. Future developments will be required to equip theinstrument with the battery, enabling several tests to be performed without the need for anuninterruptible power supply in settings where power cuts are commonplace.
Another technology with a small footprint that is already available on the marketis the GeneXpert platform (Cepheid, Sunnyvale, CA, USA), which uses a self-containedcartridge for the quantitative measurement of HCV RNA [24]. The advantage of GeneXpertis its capability to run a wide range of disease-specific tests [25,26], whereas the Genedriveis currently limited to testing for HCV, mitochondrially encoded 12S RRNA (MT-RNR1),and severe acute respiratory syndrome coronavirus 2 (SARS-CoV-2). GeneXpert HCV VLFingerstick test also has a smaller number of manual steps and a shorter turnaround time.The Genedrive HCV ID Kit costs between USD $25 and $30, including shipping costs,import duties, and distributor margins [27], which is slightly higher than that of the XpertHCV viral load assay (USD $21.64) [28]. The cost of the Genedrive instrument is aboutUSD $5000, making it more affordable than the one-module configuration GeneXpert Edge(USD $8495). The choice of platform, therefore, depends on the type of setting and whetherintegration of diagnostic services is required.
The analytical sensitivity of Genedrive HCV assay is 2362 IU/mL using 30 µL ofplasma, which is lower than that of the Xpert HCV viral load (10 IU/mL using 1 mLplasma) and Xpert HCV VL Fingerstick test (100 IU/mL using 100 µL capillary blood) [29].However, the optimal limit of detection for an HCV point-of-care test to diagnose 97%of HCV-infected people is 1318 IU/mL, as determined by an analysis of a large, globaldataset [30]. According to this dataset published by Freeman et al. [30], the limit of detectionof 3000 IU/mL will allow detecting at least 95% of all HCV RNA-positive cases.
Currently, the need for plasma for Genedrive testing requires centrifugation of EDTAwhole blood, which necessitates a basic laboratory setting to perform HCV testing. Thefuture use of direct capillary blood would greatly enhance the use of Genedrive in remotesettings, particularly in settings such as services for people who inject drugs, where individ-uals could be tested using a finger-stick blood sample [31]. Notwithstanding its limitations,the arrival of Genedrive on the market is expected to bolster competition and contribute toclosing the current diagnostic gap in HCV diagnosis.
Decentralization of testing through point-of-care testing has the potential to supportincreased access to HCV diagnostics and improve linkage to care [32]. Indeed, manycountries implementing HCV elimination programs experienced difficulties in identifyinginfected individuals, following an initial phase of treatment scale-up with pre-identifiedpatients [33]. Near point-of-care solutions like Genedrive could support case-findingactivities in decentralized settings; however, further implementation research is needed toconfirm these assumptions.
This study has several limitations. First, the performance of Genedrive was assessedfor diagnostic purposes, with most participants being treatment-naïve and only 40 partic-ipants who had received treatment in Cameroon were included in the study. Therefore,
Diagnostics 2021, 11, 746 8 of 10
the performance of Genedrive to assess sustained virological response (SVR) could notbe determined because most participants had undetectable viral loads. It is importantto note that the GeneDrive HCV ID assay is not intended to be used as a test of cure.A second limitation of the study is the difference in recruitment and Genedrive testingbetween the sites. In Georgia, the recruitment and Genedrive testing were performed at aharm reduction site, and the plasma aliquots were then sent to a reference laboratory. InCameroon, the recruitment and reference testing were both carried out at a reference center,and then the plasma samples were sent to a private clinic for Genedrive testing. Althoughthe transport of plasma samples to the Genedrive testing site in Cameroon took place undercold-chain conditions, we cannot exclude the possibility that this transportation may haveimpacted the accuracy of the test, as the sensitivity was slightly lower in Cameroon than inGeorgia: 92.4% (95% CI: 84.9–96.8) versus 99.2% (95% CI: 95.5–99.9). Finally, the usabilityof Genedrive was only assessed among a small number of users. Although most answerswere consistent across users, answers to the questions relating to the testing procedurevaried. Therefore, future studies involving a larger number of users will be necessary tovalidate our findings.
5. Conclusions
In conclusion, this study contributes additional evidence of the potential of Genedrive.It can be used as a test for the confirmation of HCV viremia following a positive antibodytest in decentralized settings in LMICs. Furthermore, Genedrive can be successfully usedby staff with no previous experience in molecular testing.
Supplementary Materials: The following are available online at https://www.mdpi.com/article/10.3390/diagnostics11050746/s1, Table S1: Detailed Genedrive System Usability Scale Questionnaire.
Author Contributions: E.I.R. and F.M.J.L. conceptualized the study and developed the study protocol.F.M.J.L. wrote first draft of the manuscript. E.I.R. and A.M (Aurélien Mace). designed the datacollection forms. F.M.J.L. and A.M. (Agnes Malobela) conducted site assessments and monitored thestudy. M.A., R.N., E.Y.M., N.B., M.A.-A., M.S. supervised local study procedures. M.C. conductedthe statistical analysis. F.M.J.L. and E.F. drafted the manuscript; E.I.R., A.M. (Aurélien Macé), M.A.,R.N. critically reviewed the manuscript. All authors have read and agreed to the published versionof the manuscript.
Funding: This work was supported by Unitaid grant to Foundation for Innovative new Diagnostics[HEAD-Start].
Institutional Review Board Statement: The study was conducted according to the guidelines of theDeclaration of Helsinki, and approved by Comité National d’Etique De La Recherche Pour La SantéHumaine in Cameroon (N◦2019/06/1166/CE/CNERSH/SP, 14 June 2019) and Institutional ReviewBoard of Georgian National Center For Disease Control and Public Health (N◦8160-2/1, 1 December2018).
Informed Consent Statement: The study was conducted according to the guidelines of the Declara-tion of Helsinki. Informed consent was obtained from all subjects involved in the study.
Data Availability Statement: The data presented in this study are available on request from thecorresponding author. Some human data are not publicly available due to data protection reasons.
Acknowledgments: We thank all participants in Cameroon and Georgia for their time and willing-ness to take part in this study. We thank the following staff for conducting recruitment and testingin Cameroon: Yannick Linjouom, Georgette Nzaneliagnigni, and Micheline Mimche. The authorsalso thank staff from Genedrive plc for conducting local training at the study sites, and Laura Kempand Scott Markland for useful comments on the final report of the study. We thank Genedrive plcfor donating the test kits and reagents and lending the Genedrive instruments used in this study.In addition, we express our gratitude to Rachel Wright and Adam Bodley for editorial assistance.Editorial support was funded by the Foundation for Innovative New Diagnostics, according to GoodPublication Practice guidelines.
Conflicts of Interest: The authors declare that they have no conflict of interest.
Diagnostics 2021, 11, 746 9 of 10
References1. Gower, E.; Estes, C.; Blach, S.; Razavi-Shearer, K.; Razavi, H. Global epidemiology and genotype distribution of the hepatitis C
virus infection. J. Hepatol. 2014, 61, S45–S57. [CrossRef]2. World Health Organization. Global Hepatitis Report 2017; World Health Organization: Geneva, Switzerland, 2017. Available online:
https://www.who.int/hepatitis/publications/global-hepatitis-report2017/en/ (accessed on 14 August 2020).3. World Health Organization. Global Health Sector Strategy on Viral Hepatitis, 2016–2021; World Health Organization: Geneva,
Switzerland, 2016. Available online: https://www.who.int/hepatitis/strategy2016-2021/ghss-hep/en/ (accessed on 14 August2020).
4. Feld, J.J. Direct-Acting Antivirals for Hepatitis C Virus (HCV): The Progress Continues. Curr. Drug Targets 2017, 18, 851–862.[CrossRef]
5. Hill, A.; Khoo, S.; Fortunak, J.; Simmons, B.; Ford, N. Minimum Costs for Producing Hepatitis C Direct-Acting Antivirals for Usein Large-Scale Treatment Access Programs in Developing Countries. Clin. Infect. Dis. 2014, 58, 928–936. [CrossRef] [PubMed]
6. Hill, A.; Simmons, B.; Gotham, D.; Fortunak, J. Rapid reductions in prices for generic sofosbuvir and daclatasvir to treat hepatitisC. J. Virus Erad. 2016, 2, 28–31. [CrossRef]
7. Reipold, E.I.; Trianni, A.; Krakower, D.; Ongarello, S.; Roberts, T.; Easterbrook, P.; Denkinger, C. Values, preferences and currenthepatitis B and C testing practices in low- and middle-income countries: Results of a survey of end users and implementers.BMC Infect. Dis. 2017, 17 (Suppl. S1), 702. [CrossRef]
8. Ivanova Reipold, E.; Easterbrook, P.; Trianni, A.; Panneer, N.; Krakower, D.; Ongarello, S.; Roberts, T.; Miller, V.; Denkinger, C.Optimising diagnosis of viraemic hepatitis C infection: The development of a target product profile. BMC Infect. Dis. 2017, 17(Suppl. S1), 707. [CrossRef]
9. Lemoine, M.; Tillmann, H.L. What is required from HCV point-of-care tests to reduce the burden of hepatitis C infection?’De-velopment and clinical validation of the genedrive point-of-care test for qualitative detection of hepatitis C virus’. Gut 2018,67, 1916–1917. [CrossRef]
10. Genedrive plc. Hepatitis C Point-of-Care Diagnostic Launched. 2018. Available online: http://www.genedriveplc.com/company-reports/Hardman.pdf (accessed on 20 September 2020).
11. Genedrive plc. Press Release 11 September 2017. Genedrive HCV ID Kit Received CE-IVD Certification. Available online: http://www.genedriveplc.com/press-releases/genedrive_hcv_id_test_received_ce_certification_final.pdf (accessed on 20 September2020).
12. Genedrive plc. Press Release 4 May 2020. Genedrive HCV-ID Test Receives WHO Prequalification. Available online: http://www.genedriveplc.com/press-releases/gdr_who_pq.pdf (accessed on 20 September 2020).
13. Llibre, A.; Shimakawa, Y.; Mottez, E.; Ainsworth, S.; Buivan, T.-P.; Firth, R.; Harrison, E.; Rosenberg, A.R.; Meritet, J.-F.; Fontanet,A.; et al. Development and clinical validation of the Genedrive point-of-care test for qualitative detection of hepatitis C virus. Gut2018, 67, 2017–2024. [CrossRef] [PubMed]
14. Cohen, J.F.; Korevaar, D.A.; Altman, D.G.; Bruns, D.E.; Gatsonis, C.A.; Hooft, L.; Irwig, L.; Levine, D.; Reitsma, J.B.; De Vet,H.C.W.; et al. STARD 2015 guidelines for reporting diagnostic accuracy studies: Explanation and elaboration. BMJ Open 2016, 6,e012799. [CrossRef]
15. World Health Organization. Guidelines for the Screening Care and Treatment of Persons with Chronic Hepatitis C Infection: UpdatedVersion; World Health Organization: Geneva, Switzerland, 2016. Available online: https://www.who.int/hiv/pub/hepatitis/hepatitis-c-guidelines/en/ (accessed on 20 September 2020).
16. Campos-Outcalt, D. Hepatitis C: New CDC screening recommendations. J. Fam. Pract. 2012, 61, 744–746. [PubMed]17. Mokhtari, C.; Ebel, A.; Reinhardt, B.; Merlin, S.; Proust, S.; Roque-Afonso, A.-M. Characterization of Samples Identified as
Hepatitis C Virus Genotype 1 without Subtype by Abbott RealTime HCV Genotype II Assay Using the New Abbott HCVGenotypePlusRUO Test. J. Clin. Microbiol. 2015, 54, 296–299. [CrossRef]
18. Wiesmann, F.; Naeth, G.; Sarrazin, C.; Berger, A.; Kaiser, R.; Ehret, R.; Knechten, H.; Braun, P. Variation analysis of six HCVviral load assays using low viremic HCV samples in the range of the clinical decision points for HCV protease inhibitors. Med.Microbiol. Immunol. 2014, 204, 515–525. [CrossRef]
19. European Association for the Study of the Liver. EASL Recommendations on Treatment of Hepatitis C 2018. J. Hepatol. 2018, 69,461–511. [CrossRef] [PubMed]
20. World Health Organization. WHO Prequalification of In Vitro Diagnostics. Public Report May 2020. Product: Genedrive HCVID Kit. WHO Reference Number: PQDx 0380-133-00; World Health Organization: Geneva, Switzerland, 2020. Available on-line: https://www.who.int/diagnostics_laboratory/evaluations/pq-list/hcv/200501_final_pqpr_pqdx_0380_133_00_genedrive_hcv_id_v1.pdf?ua=1 (accessed on 20 September 2020).
21. Padhi, A.; Gupta, E.; Singh, G.; Agarwal, R.; Sharma, M.K.; Sarin, S.K. Evaluation of the Point of Care Molecular DiagnosticGenedrive HCV ID Kit for the detection of HCV RNA in clinical samples. Epidemiol. Infect. 2020, 2020, 1–23. [CrossRef] [PubMed]
22. Mielczarek, W.S.; Obaje, E.A.; Bachmann, T.T.; Kersaudy-Kerhoas, M. Microfluidic blood plasma separation for medical diagnos-tics: Is it worth it? Lab Chip 2016, 16, 3441–3448. [CrossRef]
23. Llibre, A.; Shimakawa, Y.; Duffy, D. Potential utility of the Genedrive point-of-care test for HCV RNA detection. Gut 2019, 68,1903–1904. [CrossRef]
Diagnostics 2021, 11, 746 10 of 10
24. McHugh, M.P.; Wu, A.H.B.; Chevaliez, S.; Pawlotsky, J.M.; Hallin, M.; Templeton, K.E. Multicenter Evaluation of the CepheidXpert Hepatitis C Virus Viral Load Assay. J. Clin. Microbiol. 2017, 55, 1550–1556. [CrossRef]
25. Ndlovu, Z.; Fajardo, E.; Mbofana, E.; Maparo, T.; Garone, D.; Metcalf, C.; Bygrave, H.; Kao, K.; Zinyowera, S. Multidisease testingfor HIV and TB using the GeneXpert platform: A feasibility study in rural Zimbabwe. PLoS ONE 2018, 13, e0193577. [CrossRef]
26. Cazabon., D.; Pande, T.; Kik, S.; Van Gemert, W.; Sohn, H.; Denkinger, C.; Qin, Z.Z.; Waning, B.; Pai, M. Market penetration ofXpert MTB/RIF in high tuberculosis burden countries: A trend analysis from 2014–2016. Gates Open Res. 2018, 2, 35. [CrossRef]
27. Médecins Sans Frontières. MSF Access Campaign. Putting HIV and HCV to the Test: A Product Guide for Point-of-Care CD4 andLaboratory-Based and Point-of-Care Virological HIV and HCV Tests. 2017. Available online: https://msfaccess.org/putting-hiv-and-hcv-test-3rd-ed-2017 (accessed on 20 September 2020).
28. Clinton Health Access Initiative (CHAI). Hepatitis C Market Report. Issue 1 May 2020. Available online: https://3cdmh310dov3470e6x160esb-wpengine.netdna-ssl.com/wp-content/uploads/2020/05/Hepatitis-C-Market-Report_Issue-1_Web.pdf (accessedon 20 September 2020).
29. Lamoury, F.M.J.; Bajis, S.; Hajarizadeh, B.; Marshall, A.D.; Martinello, M.; Ivanova, E.; Catlett, B.; Mowat, Y.; Marks, P.; Amin, J.;et al. Evaluation of the Xpert HCV Viral Load Finger-Stick Point-of-Care Assay. J. Infect. Dis. 2018, 217, 1889–1896. [CrossRef][PubMed]
30. Freiman, J.M.; Wang, J.; Easterbrook, P.J.; Horsburgh, C.R.; Marinucci, F.; White, L.F.; Kamkamidze, G.; Krajden, M.; Loarec, A.;Njouom, R.; et al. Deriving the optimal limit of detection for an HCV point-of-care test for viraemic infection: Analysis of a globaldataset. J. Hepatol. 2019, 71, 62–70. [CrossRef]
31. Bajis, S.; Maher, L.; Treloar, C.; Hajarizadeh, B.; Lamoury, F.M.; Mowat, Y.; Schulz, M.; Marshall, A.D.; Cunningham, E.B.; Cock, V.;et al. Acceptability and preferences of point-of-care finger-stick whole-blood and venepuncture hepatitis C virus testing amongpeople who inject drugs in Australia. Int. J. Drug Policy 2018, 61, 23–30. [CrossRef] [PubMed]
32. Mohamed, Z.; Al-Kurdi, D.; Nelson, M.; Shimakawa, Y.; Selvapatt, N.; Lacey, J.; Thursz, M.R.; Lemoine, M.; Brown, A.S. Timematters: Point of care screening and streamlined linkage to care dramatically improves hepatitis C treatment uptake in prisonersin England. Int. J. Drug Policy 2020, 75, 102608. [CrossRef] [PubMed]
33. Hutin, Y.; Luhmann, N.; Easterbrook, P. Evaluating the impact of Georgia’s hepatitis C elimination plan: Lessons learned for theglobal initiative. Lancet Glob. Health 2020, 8, e163–e164. [CrossRef]
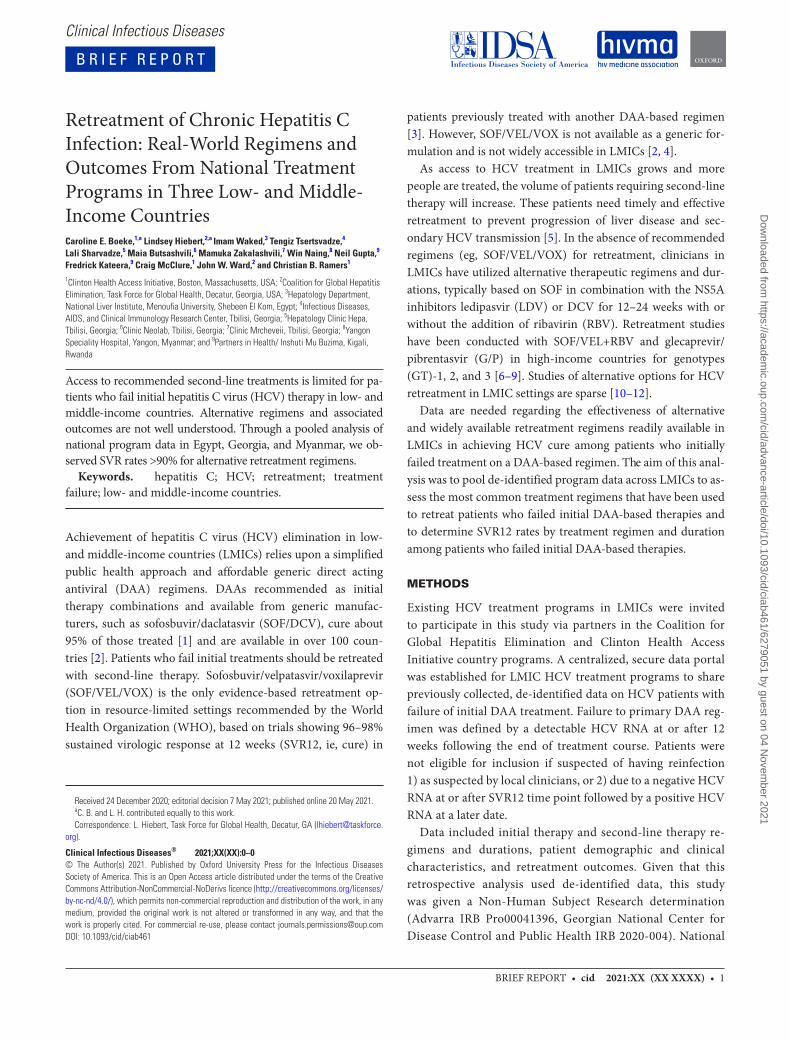
B r i e f r e p o r t
Clinical Infectious Diseases
BRIEF REPORT • cid 2021:XX (XX XXXX) • 1
Received 24 December 2020; editorial decision 7 May 2021; published online 20 May 2021.aC. B. and L. H. contributed equally to this work.Correspondence: L. Hiebert, Task Force for Global Health, Decatur, GA (lhiebert@taskforce.
org).
Clinical Infectious Diseases® 2021;XX(XX):0–0© The Author(s) 2021. Published by Oxford University Press for the Infectious Diseases Society of America. This is an Open Access article distributed under the terms of the Creative Commons Attribution-NonCommercial-NoDerivs licence (http://creativecommons.org/licenses/by-nc-nd/4.0/), which permits non-commercial reproduction and distribution of the work, in any medium, provided the original work is not altered or transformed in any way, and that the work is properly cited. For commercial re-use, please contact [email protected]: 10.1093/cid/ciab461
Retreatment of Chronic Hepatitis C Infection: Real-World Regimens and Outcomes From National Treatment Programs in Three Low- and Middle-Income CountriesCaroline E. Boeke,1,a Lindsey Hiebert,2,a Imam Waked,3 Tengiz Tsertsvadze,4 Lali Sharvadze,5 Maia Butsashvili,6 Mamuka Zakalashvili,7 Win Naing,8 Neil Gupta,9 Fredrick Kateera,9 Craig McClure,1 John W. Ward,2 and Christian B. Ramers1
1Clinton Health Access Initiative, Boston, Massachusetts, USA; 2Coalition for Global Hepatitis Elimination, Task Force for Global Health, Decatur, Georgia, USA; 3Hepatology Department, National Liver Institute, Menoufia University, Shebeen El Kom, Egypt; 4Infectious Diseases, AIDS, and Clinical Immunology Research Center, Tbilisi, Georgia; 5Hepatology Clinic Hepa, Tbilisi, Georgia; 6Clinic Neolab, Tbilisi, Georgia; 7Clinic Mrcheveii, Tbilisi, Georgia; 8Yangon Speciality Hospital, Yangon, Myanmar; and 9Partners in Health/ Inshuti Mu Buzima, Kigali, Rwanda
Access to recommended second-line treatments is limited for pa-tients who fail initial hepatitis C virus (HCV) therapy in low- and middle-income countries. Alternative regimens and associated outcomes are not well understood. Through a pooled analysis of national program data in Egypt, Georgia, and Myanmar, we ob-served SVR rates >90% for alternative retreatment regimens.
Keywords. hepatitis C; HCV; retreatment; treatment failure; low- and middle-income countries.
Achievement of hepatitis C virus (HCV) elimination in low- and middle-income countries (LMICs) relies upon a simplified public health approach and affordable generic direct acting antiviral (DAA) regimens. DAAs recommended as initial therapy combinations and available from generic manufac-turers, such as sofosbuvir/daclatasvir (SOF/DCV), cure about 95% of those treated [1] and are available in over 100 coun-tries [2]. Patients who fail initial treatments should be retreated with second-line therapy. Sofosbuvir/velpatasvir/voxilaprevir (SOF/VEL/VOX) is the only evidence-based retreatment op-tion in resource-limited settings recommended by the World Health Organization (WHO), based on trials showing 96–98% sustained virologic response at 12 weeks (SVR12, ie, cure) in
patients previously treated with another DAA-based regimen [3]. However, SOF/VEL/VOX is not available as a generic for-mulation and is not widely accessible in LMICs [2, 4].
As access to HCV treatment in LMICs grows and more people are treated, the volume of patients requiring second-line therapy will increase. These patients need timely and effective retreatment to prevent progression of liver disease and sec-ondary HCV transmission [5]. In the absence of recommended regimens (eg, SOF/VEL/VOX) for retreatment, clinicians in LMICs have utilized alternative therapeutic regimens and dur-ations, typically based on SOF in combination with the NS5A inhibitors ledipasvir (LDV) or DCV for 12–24 weeks with or without the addition of ribavirin (RBV). Retreatment studies have been conducted with SOF/VEL+RBV and glecaprevir/pibrentasvir (G/P) in high-income countries for genotypes (GT)-1, 2, and 3 [6–9]. Studies of alternative options for HCV retreatment in LMIC settings are sparse [10–12].
Data are needed regarding the effectiveness of alternative and widely available retreatment regimens readily available in LMICs in achieving HCV cure among patients who initially failed treatment on a DAA-based regimen. The aim of this anal-ysis was to pool de-identified program data across LMICs to as-sess the most common treatment regimens that have been used to retreat patients who failed initial DAA-based therapies and to determine SVR12 rates by treatment regimen and duration among patients who failed initial DAA-based therapies.
METHODS
Existing HCV treatment programs in LMICs were invited to participate in this study via partners in the Coalition for Global Hepatitis Elimination and Clinton Health Access Initiative country programs. A centralized, secure data portal was established for LMIC HCV treatment programs to share previously collected, de-identified data on HCV patients with failure of initial DAA treatment. Failure to primary DAA reg-imen was defined by a detectable HCV RNA at or after 12 weeks following the end of treatment course. Patients were not eligible for inclusion if suspected of having reinfection 1) as suspected by local clinicians, or 2) due to a negative HCV RNA at or after SVR12 time point followed by a positive HCV RNA at a later date.
Data included initial therapy and second-line therapy re-gimens and durations, patient demographic and clinical characteristics, and retreatment outcomes. Given that this retrospective analysis used de-identified data, this study was given a Non-Human Subject Research determination (Advarra IRB Pro00041396, Georgian National Center for Disease Control and Public Health IRB 2020-004). National
Dow
nloaded from https://academ
ic.oup.com/cid/advance-article/doi/10.1093/cid/ciab461/6279051 by guest on 04 N
ovember 2021
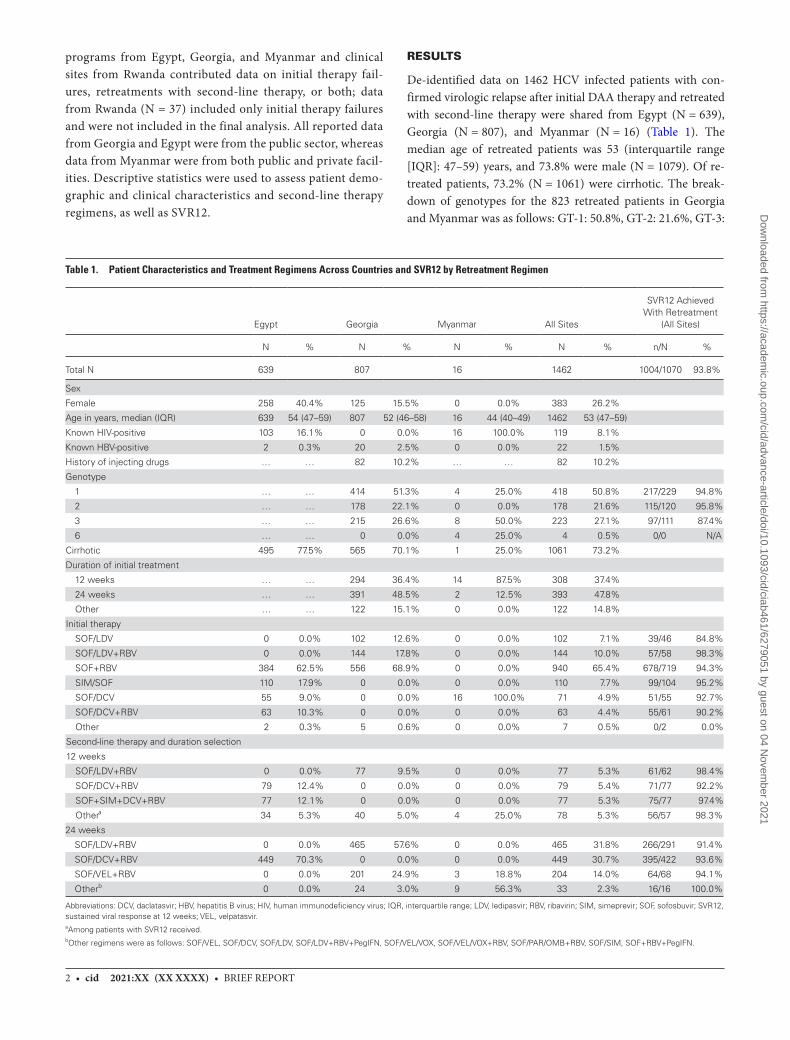
2 • cid 2021:XX (XX XXXX) • BRIEF REPORT
programs from Egypt, Georgia, and Myanmar and clinical sites from Rwanda contributed data on initial therapy fail-ures, retreatments with second-line therapy, or both; data from Rwanda (N = 37) included only initial therapy failures and were not included in the final analysis. All reported data from Georgia and Egypt were from the public sector, whereas data from Myanmar were from both public and private facil-ities. Descriptive statistics were used to assess patient demo-graphic and clinical characteristics and second-line therapy regimens, as well as SVR12.
RESULTS
De-identified data on 1462 HCV infected patients with con-firmed virologic relapse after initial DAA therapy and retreated with second-line therapy were shared from Egypt (N = 639), Georgia (N = 807), and Myanmar (N = 16) (Table 1). The median age of retreated patients was 53 (interquartile range [IQR]: 47–59) years, and 73.8% were male (N = 1079). Of re-treated patients, 73.2% (N = 1061) were cirrhotic. The break-down of genotypes for the 823 retreated patients in Georgia and Myanmar was as follows: GT-1: 50.8%, GT-2: 21.6%, GT-3:
Table 1. Patient Characteristics and Treatment Regimens Across Countries and SVR12 by Retreatment Regimen
Egypt Georgia Myanmar All Sites
SVR12 Achieved With Retreatment
(All Sites)
N % N % N % N % n/N %
Total N 639 807 16 1462 1004/1070 93.8%
Sex
Female 258 40.4% 125 15.5% 0 0.0% 383 26.2%
Age in years, median (IQR) 639 54 (47–59) 807 52 (46–58) 16 44 (40–49) 1462 53 (47–59)
Known HIV-positive 103 16.1% 0 0.0% 16 100.0% 119 8.1%
Known HBV-positive 2 0.3% 20 2.5% 0 0.0% 22 1.5%
History of injecting drugs … … 82 10.2% … … 82 10.2%
Genotype
1 … … 414 51.3% 4 25.0% 418 50.8% 217/229 94.8%
2 … … 178 22.1% 0 0.0% 178 21.6% 115/120 95.8%
3 … … 215 26.6% 8 50.0% 223 27.1% 97/111 87.4%
6 … … 0 0.0% 4 25.0% 4 0.5% 0/0 N/A
Cirrhotic 495 77.5% 565 70.1% 1 25.0% 1061 73.2%
Duration of initial treatment
12 weeks … … 294 36.4% 14 87.5% 308 37.4%
24 weeks … … 391 48.5% 2 12.5% 393 47.8%
Other … … 122 15.1% 0 0.0% 122 14.8%
Initial therapy
SOF/LDV 0 0.0% 102 12.6% 0 0.0% 102 7.1% 39/46 84.8%
SOF/LDV+RBV 0 0.0% 144 17.8% 0 0.0% 144 10.0% 57/58 98.3%
SOF+RBV 384 62.5% 556 68.9% 0 0.0% 940 65.4% 678/719 94.3%
SIM/SOF 110 17.9% 0 0.0% 0 0.0% 110 7.7% 99/104 95.2%
SOF/DCV 55 9.0% 0 0.0% 16 100.0% 71 4.9% 51/55 92.7%
SOF/DCV+RBV 63 10.3% 0 0.0% 0 0.0% 63 4.4% 55/61 90.2%
Other 2 0.3% 5 0.6% 0 0.0% 7 0.5% 0/2 0.0%
Second-line therapy and duration selection
12 weeks
SOF/LDV+RBV 0 0.0% 77 9.5% 0 0.0% 77 5.3% 61/62 98.4%
SOF/DCV+RBV 79 12.4% 0 0.0% 0 0.0% 79 5.4% 71/77 92.2%
SOF+SIM+DCV+RBV 77 12.1% 0 0.0% 0 0.0% 77 5.3% 75/77 97.4%
Othera 34 5.3% 40 5.0% 4 25.0% 78 5.3% 56/57 98.3%
24 weeks
SOF/LDV+RBV 0 0.0% 465 57.6% 0 0.0% 465 31.8% 266/291 91.4%
SOF/DCV+RBV 449 70.3% 0 0.0% 0 0.0% 449 30.7% 395/422 93.6%
SOF/VEL+RBV 0 0.0% 201 24.9% 3 18.8% 204 14.0% 64/68 94.1%
Otherb 0 0.0% 24 3.0% 9 56.3% 33 2.3% 16/16 100.0%
Abbreviations: DCV, daclatasvir; HBV, hepatitis B virus; HIV, human immunodeficiency virus; IQR, interquartile range; LDV, ledipasvir; RBV, ribavirin; SIM, simeprevir; SOF, sofosbuvir; SVR12, sustained viral response at 12 weeks; VEL, velpatasvir.aAmong patients with SVR12 received.bOther regimens were as follows: SOF/VEL, SOF/DCV, SOF/LDV, SOF/LDV+RBV+PegIFN, SOF/VEL/VOX, SOF/VEL/VOX+RBV, SOF/PAR/OMB+RBV, SOF/SIM, SOF+RBV+PegIFN.
Dow
nloaded from https://academ
ic.oup.com/cid/advance-article/doi/10.1093/cid/ciab461/6279051 by guest on 04 N
ovember 2021
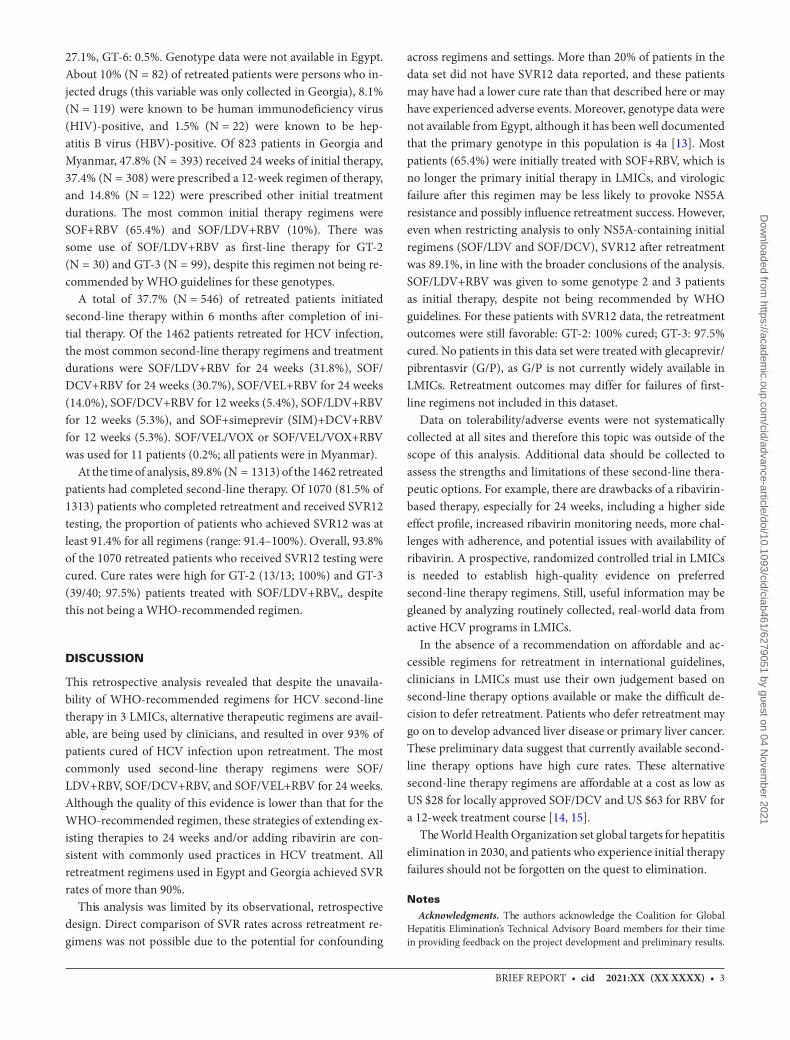
BRIEF REPORT • cid 2021:XX (XX XXXX) • 3
27.1%, GT-6: 0.5%. Genotype data were not available in Egypt. About 10% (N = 82) of retreated patients were persons who in-jected drugs (this variable was only collected in Georgia), 8.1% (N = 119) were known to be human immunodeficiency virus (HIV)-positive, and 1.5% (N = 22) were known to be hep-atitis B virus (HBV)-positive. Of 823 patients in Georgia and Myanmar, 47.8% (N = 393) received 24 weeks of initial therapy, 37.4% (N = 308) were prescribed a 12-week regimen of therapy, and 14.8% (N = 122) were prescribed other initial treatment durations. The most common initial therapy regimens were SOF+RBV (65.4%) and SOF/LDV+RBV (10%). There was some use of SOF/LDV+RBV as first-line therapy for GT-2 (N = 30) and GT-3 (N = 99), despite this regimen not being re-commended by WHO guidelines for these genotypes.
A total of 37.7% (N = 546) of retreated patients initiated second-line therapy within 6 months after completion of ini-tial therapy. Of the 1462 patients retreated for HCV infection, the most common second-line therapy regimens and treatment durations were SOF/LDV+RBV for 24 weeks (31.8%), SOF/DCV+RBV for 24 weeks (30.7%), SOF/VEL+RBV for 24 weeks (14.0%), SOF/DCV+RBV for 12 weeks (5.4%), SOF/LDV+RBV for 12 weeks (5.3%), and SOF+simeprevir (SIM)+DCV+RBV for 12 weeks (5.3%). SOF/VEL/VOX or SOF/VEL/VOX+RBV was used for 11 patients (0.2%; all patients were in Myanmar).
At the time of analysis, 89.8% (N = 1313) of the 1462 retreated patients had completed second-line therapy. Of 1070 (81.5% of 1313) patients who completed retreatment and received SVR12 testing, the proportion of patients who achieved SVR12 was at least 91.4% for all regimens (range: 91.4–100%). Overall, 93.8% of the 1070 retreated patients who received SVR12 testing were cured. Cure rates were high for GT-2 (13/13; 100%) and GT-3 (39/40; 97.5%) patients treated with SOF/LDV+RBV,, despite this not being a WHO-recommended regimen.
DISCUSSION
This retrospective analysis revealed that despite the unavaila-bility of WHO-recommended regimens for HCV second-line therapy in 3 LMICs, alternative therapeutic regimens are avail-able, are being used by clinicians, and resulted in over 93% of patients cured of HCV infection upon retreatment. The most commonly used second-line therapy regimens were SOF/LDV+RBV, SOF/DCV+RBV, and SOF/VEL+RBV for 24 weeks. Although the quality of this evidence is lower than that for the WHO-recommended regimen, these strategies of extending ex-isting therapies to 24 weeks and/or adding ribavirin are con-sistent with commonly used practices in HCV treatment. All retreatment regimens used in Egypt and Georgia achieved SVR rates of more than 90%.
This analysis was limited by its observational, retrospective design. Direct comparison of SVR rates across retreatment re-gimens was not possible due to the potential for confounding
across regimens and settings. More than 20% of patients in the data set did not have SVR12 data reported, and these patients may have had a lower cure rate than that described here or may have experienced adverse events. Moreover, genotype data were not available from Egypt, although it has been well documented that the primary genotype in this population is 4a [13]. Most patients (65.4%) were initially treated with SOF+RBV, which is no longer the primary initial therapy in LMICs, and virologic failure after this regimen may be less likely to provoke NS5A resistance and possibly influence retreatment success. However, even when restricting analysis to only NS5A-containing initial regimens (SOF/LDV and SOF/DCV), SVR12 after retreatment was 89.1%, in line with the broader conclusions of the analysis. SOF/LDV+RBV was given to some genotype 2 and 3 patients as initial therapy, despite not being recommended by WHO guidelines. For these patients with SVR12 data, the retreatment outcomes were still favorable: GT-2: 100% cured; GT-3: 97.5% cured. No patients in this data set were treated with glecaprevir/pibrentasvir (G/P), as G/P is not currently widely available in LMICs. Retreatment outcomes may differ for failures of first-line regimens not included in this dataset.
Data on tolerability/adverse events were not systematically collected at all sites and therefore this topic was outside of the scope of this analysis. Additional data should be collected to assess the strengths and limitations of these second-line thera-peutic options. For example, there are drawbacks of a ribavirin-based therapy, especially for 24 weeks, including a higher side effect profile, increased ribavirin monitoring needs, more chal-lenges with adherence, and potential issues with availability of ribavirin. A prospective, randomized controlled trial in LMICs is needed to establish high-quality evidence on preferred second-line therapy regimens. Still, useful information may be gleaned by analyzing routinely collected, real-world data from active HCV programs in LMICs.
In the absence of a recommendation on affordable and ac-cessible regimens for retreatment in international guidelines, clinicians in LMICs must use their own judgement based on second-line therapy options available or make the difficult de-cision to defer retreatment. Patients who defer retreatment may go on to develop advanced liver disease or primary liver cancer. These preliminary data suggest that currently available second-line therapy options have high cure rates. These alternative second-line therapy regimens are affordable at a cost as low as US $28 for locally approved SOF/DCV and US $63 for RBV for a 12-week treatment course [14, 15].
The World Health Organization set global targets for hepatitis elimination in 2030, and patients who experience initial therapy failures should not be forgotten on the quest to elimination.
NotesAcknowledgments. The authors acknowledge the Coalition for Global
Hepatitis Elimination’s Technical Advisory Board members for their time in providing feedback on the project development and preliminary results.
Dow
nloaded from https://academ
ic.oup.com/cid/advance-article/doi/10.1093/cid/ciab461/6279051 by guest on 04 N
ovember 2021
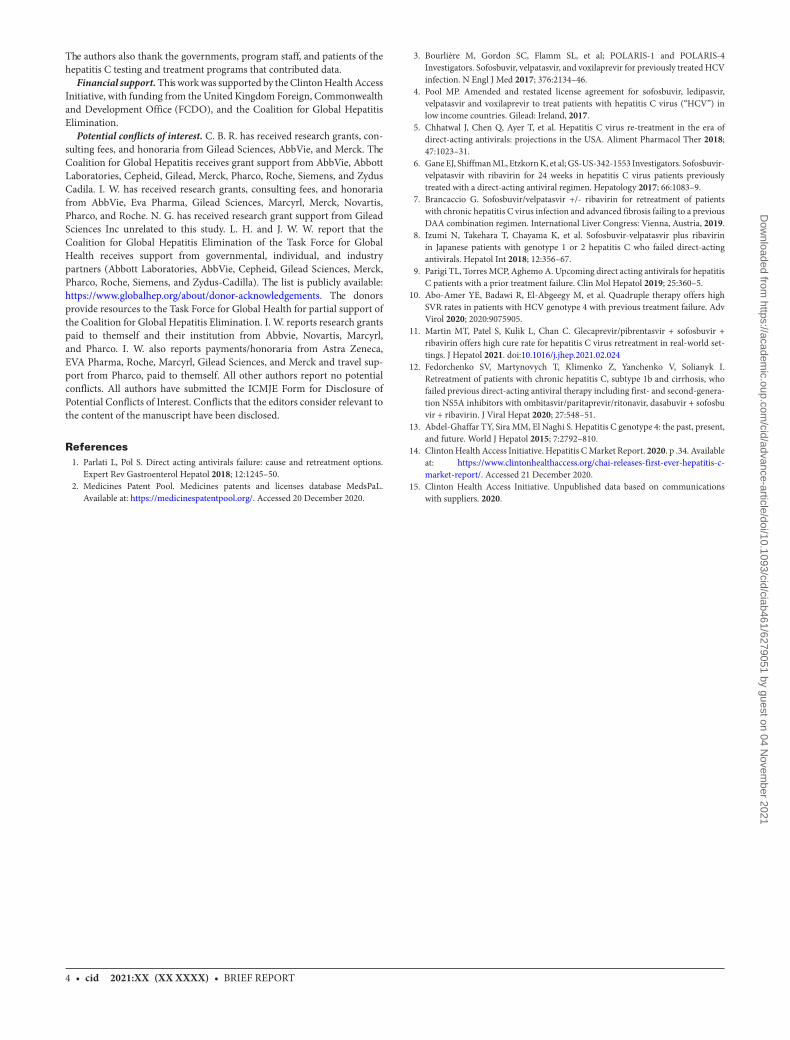
4 • cid 2021:XX (XX XXXX) • BRIEF REPORT
The authors also thank the governments, program staff, and patients of the hepatitis C testing and treatment programs that contributed data.
Financial support. This work was supported by the Clinton Health Access Initiative, with funding from the United Kingdom Foreign, Commonwealth and Development Office (FCDO), and the Coalition for Global Hepatitis Elimination.
Potential conflicts of interest. C. B. R. has received research grants, con-sulting fees, and honoraria from Gilead Sciences, AbbVie, and Merck. The Coalition for Global Hepatitis receives grant support from AbbVie, Abbott Laboratories, Cepheid, Gilead, Merck, Pharco, Roche, Siemens, and Zydus Cadila. I. W. has received research grants, consulting fees, and honoraria from AbbVie, Eva Pharma, Gilead Sciences, Marcyrl, Merck, Novartis, Pharco, and Roche. N. G. has received research grant support from Gilead Sciences Inc unrelated to this study. L. H. and J. W. W. report that the Coalition for Global Hepatitis Elimination of the Task Force for Global Health receives support from governmental, individual, and industry partners (Abbott Laboratories, AbbVie, Cepheid, Gilead Sciences, Merck, Pharco, Roche, Siemens, and Zydus-Cadilla). The list is publicly available: https://www.globalhep.org/about/donor-acknowledgements. The donors provide resources to the Task Force for Global Health for partial support of the Coalition for Global Hepatitis Elimination. I. W. reports research grants paid to themself and their institution from Abbvie, Novartis, Marcyrl, and Pharco. I. W. also reports payments/honoraria from Astra Zeneca, EVA Pharma, Roche, Marcyrl, Gilead Sciences, and Merck and travel sup-port from Pharco, paid to themself. All other authors report no potential conflicts. All authors have submitted the ICMJE Form for Disclosure of Potential Conflicts of Interest. Conflicts that the editors consider relevant to the content of the manuscript have been disclosed.
References1. Parlati L, Pol S. Direct acting antivirals failure: cause and retreatment options.
Expert Rev Gastroenterol Hepatol 2018; 12:1245–50.2. Medicines Patent Pool. Medicines patents and licenses database MedsPaL.
Available at: https://medicinespatentpool.org/. Accessed 20 December 2020.
3. Bourlière M, Gordon SC, Flamm SL, et al; POLARIS-1 and POLARIS-4 Investigators. Sofosbuvir, velpatasvir, and voxilaprevir for previously treated HCV infection. N Engl J Med 2017; 376:2134–46.
4. Pool MP. Amended and restated license agreement for sofosbuvir, ledipasvir, velpatasvir and voxilaprevir to treat patients with hepatitis C virus (“HCV”) in low income countries. Gilead: Ireland, 2017.
5. Chhatwal J, Chen Q, Ayer T, et al. Hepatitis C virus re-treatment in the era of direct-acting antivirals: projections in the USA. Aliment Pharmacol Ther 2018; 47:1023–31.
6. Gane EJ, Shiffman ML, Etzkorn K, et al; GS-US-342-1553 Investigators. Sofosbuvir-velpatasvir with ribavirin for 24 weeks in hepatitis C virus patients previously treated with a direct-acting antiviral regimen. Hepatology 2017; 66:1083–9.
7. Brancaccio G. Sofosbuvir/velpatasvir +/- ribavirin for retreatment of patients with chronic hepatitis C virus infection and advanced fibrosis failing to a previous DAA combination regimen. International Liver Congress: Vienna, Austria, 2019.
8. Izumi N, Takehara T, Chayama K, et al. Sofosbuvir-velpatasvir plus ribavirin in Japanese patients with genotype 1 or 2 hepatitis C who failed direct-acting antivirals. Hepatol Int 2018; 12:356–67.
9. Parigi TL, Torres MCP, Aghemo A. Upcoming direct acting antivirals for hepatitis C patients with a prior treatment failure. Clin Mol Hepatol 2019; 25:360–5.
10. Abo-Amer YE, Badawi R, El-Abgeegy M, et al. Quadruple therapy offers high SVR rates in patients with HCV genotype 4 with previous treatment failure. Adv Virol 2020; 2020:9075905.
11. Martin MT, Patel S, Kulik L, Chan C. Glecaprevir/pibrentasvir + sofosbuvir + ribavirin offers high cure rate for hepatitis C virus retreatment in real-world set-tings. J Hepatol 2021. doi:10.1016/j.jhep.2021.02.024
12. Fedorchenko SV, Martynovych T, Klimenko Z, Yanchenko V, Solianyk I. Retreatment of patients with chronic hepatitis C, subtype 1b and cirrhosis, who failed previous direct-acting antiviral therapy including first- and second-genera-tion NS5A inhibitors with ombitasvir/paritaprevir/ritonavir, dasabuvir + sofosbuvir + ribavirin. J Viral Hepat 2020; 27:548–51.
13. Abdel-Ghaffar TY, Sira MM, El Naghi S. Hepatitis C genotype 4: the past, present, and future. World J Hepatol 2015; 7:2792–810.
14. Clinton Health Access Initiative. Hepatitis C Market Report. 2020. p .34. Available at: https://www.clintonhealthaccess.org/chai-releases-first-ever-hepatitis-c-market-report/. Accessed 21 December 2020.
15. Clinton Health Access Initiative. Unpublished data based on communications with suppliers. 2020.
Dow
nloaded from https://academ
ic.oup.com/cid/advance-article/doi/10.1093/cid/ciab461/6279051 by guest on 04 N
ovember 2021
National Hepatitis C Elimination Programof Georgia 13Tengiz Tsertsvadze, David Sergeenko, Amiran Gamkrelidze,Nikoloz Chkhartishvili, Maia Butsashvili, David Metreveli,Akaki Abutidze, Lia Gvinjilia, Muazzam Nasrullah, andFrancisco Averhoff
13.1 HCV Epidemiology in Georgia
Georgia is a small Eastern European country (population: 3.7 million people)situated in the Caucasus between Russia and Turkey. The country has the fifthhighest prevalence of hepatitis C in the world with an estimated 5.4% of adultpopulation (150,000 persons) living with chronic HCV infection [1, 2]. Studies invarious populations show that people who inject drugs have highest anti-HCV
T. Tsertsvadze (*)Infectious Diseases, AIDS and Clinical Immunology Research Center, Tbilisi, Georgia
Ivane Javakhishvili Tbilisi State University, Tbilisi, Georgiae-mail: [email protected]
D. SergeenkoMinistry of Labour, Health and Social Affairs of Georgia, Tbilisi, Georgia
A. GamkrelidzeNational Center for Disease Control and Public Health, Tbilisi, Georgiae-mail: [email protected]
N. Chkhartishvili · A. AbutidzeInfectious Diseases, AIDS and Clinical Immunology Research Center, Tbilisi, Georgiae-mail: [email protected]
M. ButsashviliClinic Neolab, Tbilisi, Georgia
D. MetreveliMrcheveli Medical Center, Tbilisi, Georgia
L. GvinjiliaCDC Foundation, Tbilisi, Georgia
M. Nasrullah · F. AverhoffCenters for Diseases Control and Prevention, Atlanta, USAe-mail: [email protected]; [email protected]
# Springer Nature Switzerland AG 2021A. Hatzakis (ed.), Hepatitis C: Epidemiology, Prevention and Elimination,https://doi.org/10.1007/978-3-030-64649-3_13
237
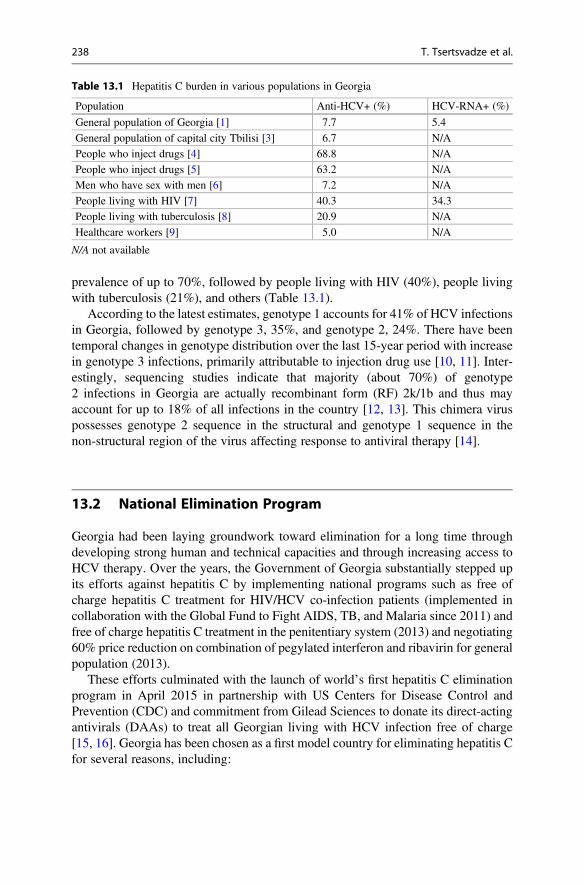
prevalence of up to 70%, followed by people living with HIV (40%), people livingwith tuberculosis (21%), and others (Table 13.1).
According to the latest estimates, genotype 1 accounts for 41% of HCV infectionsin Georgia, followed by genotype 3, 35%, and genotype 2, 24%. There have beentemporal changes in genotype distribution over the last 15-year period with increasein genotype 3 infections, primarily attributable to injection drug use [10, 11]. Inter-estingly, sequencing studies indicate that majority (about 70%) of genotype2 infections in Georgia are actually recombinant form (RF) 2k/1b and thus mayaccount for up to 18% of all infections in the country [12, 13]. This chimera viruspossesses genotype 2 sequence in the structural and genotype 1 sequence in thenon-structural region of the virus affecting response to antiviral therapy [14].
13.2 National Elimination Program
Georgia had been laying groundwork toward elimination for a long time throughdeveloping strong human and technical capacities and through increasing access toHCV therapy. Over the years, the Government of Georgia substantially stepped upits efforts against hepatitis C by implementing national programs such as free ofcharge hepatitis C treatment for HIV/HCV co-infection patients (implemented incollaboration with the Global Fund to Fight AIDS, TB, and Malaria since 2011) andfree of charge hepatitis C treatment in the penitentiary system (2013) and negotiating60% price reduction on combination of pegylated interferon and ribavirin for generalpopulation (2013).
These efforts culminated with the launch of world’s first hepatitis C eliminationprogram in April 2015 in partnership with US Centers for Disease Control andPrevention (CDC) and commitment from Gilead Sciences to donate its direct-actingantivirals (DAAs) to treat all Georgian living with HCV infection free of charge[15, 16]. Georgia has been chosen as a first model country for eliminating hepatitis Cfor several reasons, including:
Table 13.1 Hepatitis C burden in various populations in Georgia
Population Anti-HCV+ (%) HCV-RNA+ (%)
General population of Georgia [1] 7.7 5.4
General population of capital city Tbilisi [3] 6.7 N/A
People who inject drugs [4] 68.8 N/A
People who inject drugs [5] 63.2 N/A
Men who have sex with men [6] 7.2 N/A
People living with HIV [7] 40.3 34.3
People living with tuberculosis [8] 20.9 N/A
Healthcare workers [9] 5.0 N/A
N/A not available
238 T. Tsertsvadze et al.
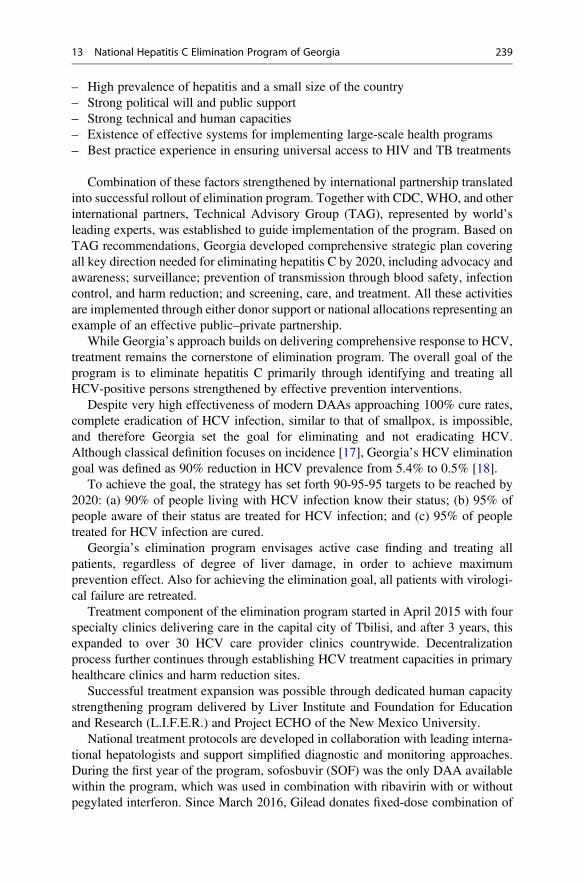
– High prevalence of hepatitis and a small size of the country– Strong political will and public support– Strong technical and human capacities– Existence of effective systems for implementing large-scale health programs– Best practice experience in ensuring universal access to HIV and TB treatments
Combination of these factors strengthened by international partnership translatedinto successful rollout of elimination program. Together with CDC, WHO, and otherinternational partners, Technical Advisory Group (TAG), represented by world’sleading experts, was established to guide implementation of the program. Based onTAG recommendations, Georgia developed comprehensive strategic plan coveringall key direction needed for eliminating hepatitis C by 2020, including advocacy andawareness; surveillance; prevention of transmission through blood safety, infectioncontrol, and harm reduction; and screening, care, and treatment. All these activitiesare implemented through either donor support or national allocations representing anexample of an effective public–private partnership.
While Georgia’s approach builds on delivering comprehensive response to HCV,treatment remains the cornerstone of elimination program. The overall goal of theprogram is to eliminate hepatitis C primarily through identifying and treating allHCV-positive persons strengthened by effective prevention interventions.
Despite very high effectiveness of modern DAAs approaching 100% cure rates,complete eradication of HCV infection, similar to that of smallpox, is impossible,and therefore Georgia set the goal for eliminating and not eradicating HCV.Although classical definition focuses on incidence [17], Georgia’s HCV eliminationgoal was defined as 90% reduction in HCV prevalence from 5.4% to 0.5% [18].
To achieve the goal, the strategy has set forth 90-95-95 targets to be reached by2020: (a) 90% of people living with HCV infection know their status; (b) 95% ofpeople aware of their status are treated for HCV infection; and (c) 95% of peopletreated for HCV infection are cured.
Georgia’s elimination program envisages active case finding and treating allpatients, regardless of degree of liver damage, in order to achieve maximumprevention effect. Also for achieving the elimination goal, all patients with virologi-cal failure are retreated.
Treatment component of the elimination program started in April 2015 with fourspecialty clinics delivering care in the capital city of Tbilisi, and after 3 years, thisexpanded to over 30 HCV care provider clinics countrywide. Decentralizationprocess further continues through establishing HCV treatment capacities in primaryhealthcare clinics and harm reduction sites.
Successful treatment expansion was possible through dedicated human capacitystrengthening program delivered by Liver Institute and Foundation for Educationand Research (L.I.F.E.R.) and Project ECHO of the New Mexico University.
National treatment protocols are developed in collaboration with leading interna-tional hepatologists and support simplified diagnostic and monitoring approaches.During the first year of the program, sofosbuvir (SOF) was the only DAA availablewithin the program, which was used in combination with ribavirin with or withoutpegylated interferon. Since March 2016, Gilead donates fixed-dose combination of
13 National Hepatitis C Elimination Program of Georgia 239
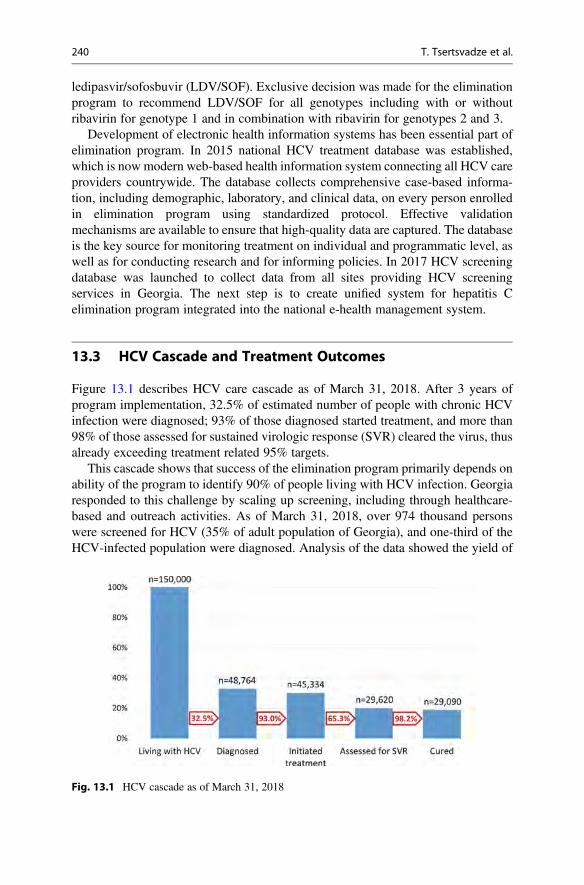
ledipasvir/sofosbuvir (LDV/SOF). Exclusive decision was made for the eliminationprogram to recommend LDV/SOF for all genotypes including with or withoutribavirin for genotype 1 and in combination with ribavirin for genotypes 2 and 3.
Development of electronic health information systems has been essential part ofelimination program. In 2015 national HCV treatment database was established,which is now modern web-based health information system connecting all HCV careproviders countrywide. The database collects comprehensive case-based informa-tion, including demographic, laboratory, and clinical data, on every person enrolledin elimination program using standardized protocol. Effective validationmechanisms are available to ensure that high-quality data are captured. The databaseis the key source for monitoring treatment on individual and programmatic level, aswell as for conducting research and for informing policies. In 2017 HCV screeningdatabase was launched to collect data from all sites providing HCV screeningservices in Georgia. The next step is to create unified system for hepatitis Celimination program integrated into the national e-health management system.
13.3 HCV Cascade and Treatment Outcomes
Figure 13.1 describes HCV care cascade as of March 31, 2018. After 3 years ofprogram implementation, 32.5% of estimated number of people with chronic HCVinfection were diagnosed; 93% of those diagnosed started treatment, and more than98% of those assessed for sustained virologic response (SVR) cleared the virus, thusalready exceeding treatment related 95% targets.
This cascade shows that success of the elimination program primarily depends onability of the program to identify 90% of people living with HCV infection. Georgiaresponded to this challenge by scaling up screening, including through healthcare-based and outreach activities. As of March 31, 2018, over 974 thousand personswere screened for HCV (35% of adult population of Georgia), and one-third of theHCV-infected population were diagnosed. Analysis of the data showed the yield of
Fig. 13.1 HCV cascade as of March 31, 2018
240 T. Tsertsvadze et al.
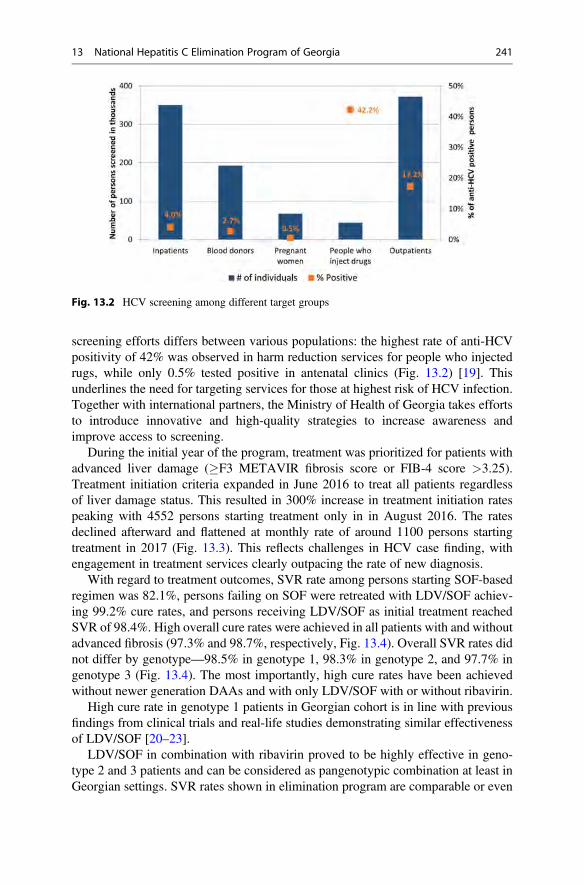
screening efforts differs between various populations: the highest rate of anti-HCVpositivity of 42% was observed in harm reduction services for people who injectedrugs, while only 0.5% tested positive in antenatal clinics (Fig. 13.2) [19]. Thisunderlines the need for targeting services for those at highest risk of HCV infection.Together with international partners, the Ministry of Health of Georgia takes effortsto introduce innovative and high-quality strategies to increase awareness andimprove access to screening.
During the initial year of the program, treatment was prioritized for patients withadvanced liver damage (�F3 METAVIR fibrosis score or FIB-4 score >3.25).Treatment initiation criteria expanded in June 2016 to treat all patients regardlessof liver damage status. This resulted in 300% increase in treatment initiation ratespeaking with 4552 persons starting treatment only in in August 2016. The ratesdeclined afterward and flattened at monthly rate of around 1100 persons startingtreatment in 2017 (Fig. 13.3). This reflects challenges in HCV case finding, withengagement in treatment services clearly outpacing the rate of new diagnosis.
With regard to treatment outcomes, SVR rate among persons starting SOF-basedregimen was 82.1%, persons failing on SOF were retreated with LDV/SOF achiev-ing 99.2% cure rates, and persons receiving LDV/SOF as initial treatment reachedSVR of 98.4%. High overall cure rates were achieved in all patients with and withoutadvanced fibrosis (97.3% and 98.7%, respectively, Fig. 13.4). Overall SVR rates didnot differ by genotype—98.5% in genotype 1, 98.3% in genotype 2, and 97.7% ingenotype 3 (Fig. 13.4). The most importantly, high cure rates have been achievedwithout newer generation DAAs and with only LDV/SOF with or without ribavirin.
High cure rate in genotype 1 patients in Georgian cohort is in line with previousfindings from clinical trials and real-life studies demonstrating similar effectivenessof LDV/SOF [20–23].
LDV/SOF in combination with ribavirin proved to be highly effective in geno-type 2 and 3 patients and can be considered as pangenotypic combination at least inGeorgian settings. SVR rates shown in elimination program are comparable or even
Fig. 13.2 HCV screening among different target groups
13 National Hepatitis C Elimination Program of Georgia 241
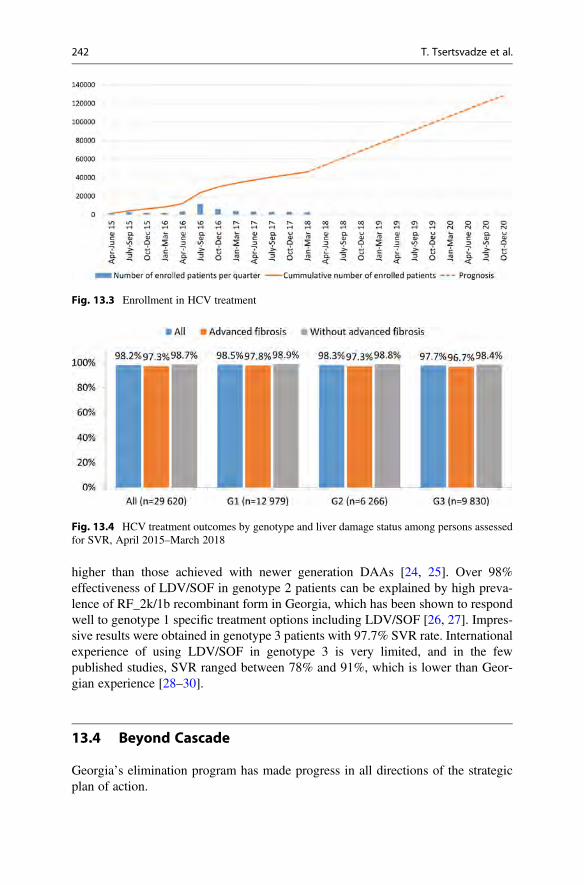
higher than those achieved with newer generation DAAs [24, 25]. Over 98%effectiveness of LDV/SOF in genotype 2 patients can be explained by high preva-lence of RF_2k/1b recombinant form in Georgia, which has been shown to respondwell to genotype 1 specific treatment options including LDV/SOF [26, 27]. Impres-sive results were obtained in genotype 3 patients with 97.7% SVR rate. Internationalexperience of using LDV/SOF in genotype 3 is very limited, and in the fewpublished studies, SVR ranged between 78% and 91%, which is lower than Geor-gian experience [28–30].
13.4 Beyond Cascade
Georgia’s elimination program has made progress in all directions of the strategicplan of action.
Fig. 13.3 Enrollment in HCV treatment
Fig. 13.4 HCV treatment outcomes by genotype and liver damage status among persons assessedfor SVR, April 2015–March 2018
242 T. Tsertsvadze et al.
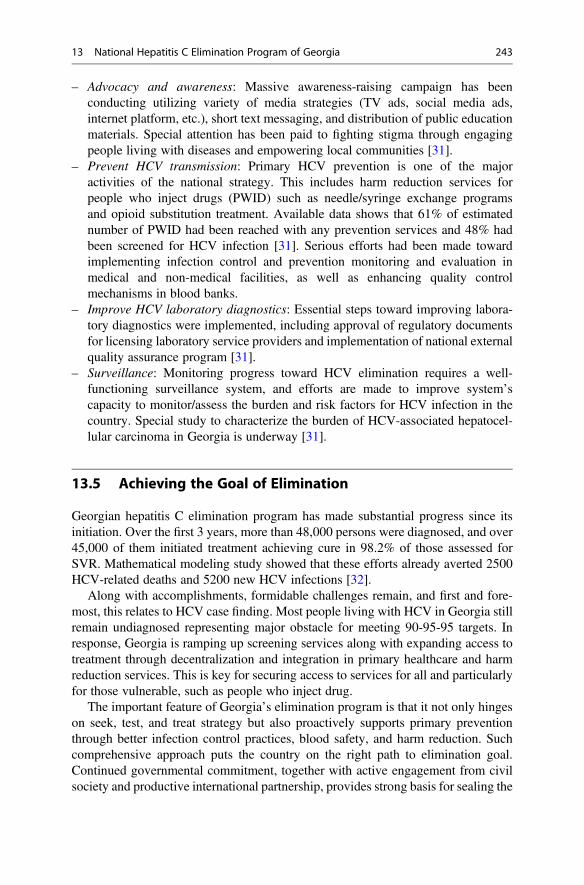
– Advocacy and awareness: Massive awareness-raising campaign has beenconducting utilizing variety of media strategies (TV ads, social media ads,internet platform, etc.), short text messaging, and distribution of public educationmaterials. Special attention has been paid to fighting stigma through engagingpeople living with diseases and empowering local communities [31].
– Prevent HCV transmission: Primary HCV prevention is one of the majoractivities of the national strategy. This includes harm reduction services forpeople who inject drugs (PWID) such as needle/syringe exchange programsand opioid substitution treatment. Available data shows that 61% of estimatednumber of PWID had been reached with any prevention services and 48% hadbeen screened for HCV infection [31]. Serious efforts had been made towardimplementing infection control and prevention monitoring and evaluation inmedical and non-medical facilities, as well as enhancing quality controlmechanisms in blood banks.
– Improve HCV laboratory diagnostics: Essential steps toward improving labora-tory diagnostics were implemented, including approval of regulatory documentsfor licensing laboratory service providers and implementation of national externalquality assurance program [31].
– Surveillance: Monitoring progress toward HCV elimination requires a well-functioning surveillance system, and efforts are made to improve system’scapacity to monitor/assess the burden and risk factors for HCV infection in thecountry. Special study to characterize the burden of HCV-associated hepatocel-lular carcinoma in Georgia is underway [31].
13.5 Achieving the Goal of Elimination
Georgian hepatitis C elimination program has made substantial progress since itsinitiation. Over the first 3 years, more than 48,000 persons were diagnosed, and over45,000 of them initiated treatment achieving cure in 98.2% of those assessed forSVR. Mathematical modeling study showed that these efforts already averted 2500HCV-related deaths and 5200 new HCV infections [32].
Along with accomplishments, formidable challenges remain, and first and fore-most, this relates to HCV case finding. Most people living with HCV in Georgia stillremain undiagnosed representing major obstacle for meeting 90-95-95 targets. Inresponse, Georgia is ramping up screening services along with expanding access totreatment through decentralization and integration in primary healthcare and harmreduction services. This is key for securing access to services for all and particularlyfor those vulnerable, such as people who inject drug.
The important feature of Georgia’s elimination program is that it not only hingeson seek, test, and treat strategy but also proactively supports primary preventionthrough better infection control practices, blood safety, and harm reduction. Suchcomprehensive approach puts the country on the right path to elimination goal.Continued governmental commitment, together with active engagement from civilsociety and productive international partnership, provides strong basis for sealing the
13 National Hepatitis C Elimination Program of Georgia 243
success. Georgia’s hepatitis C elimination program will further evolve as innovativescreening strategies, diagnostics, and prevention and treatment options areimplemented, providing valuable lessons for the world [33].
References
1. Baliashvili D, et al. Prevalence and genotype distribution of heaptitis C virus in Georgia: a 2015nationawide population-based survey. J Hepatol. 2017;66:S277. https://doi.org/10.1016/S0168-8278(17)30870-X.
2. Gower E, Estes C, Blach S, Razavi-Shearer K, Razavi H. Global epidemiology and genotypedistribution of the hepatitis C virus infection. J Hepatol. 2014;61:S45–57. https://doi.org/10.1016/j.jhep.2014.07.027.
3. Stvilia K, Tsertsvadze T, Sharvadze L, Aladashvili M, Rio C, Kuniholm MH, NelsonKE. Prevalence of hepatitis C, HIV, and risk behaviors for blood-borne infections: apopulation-based survey of the adult population of T’bilisi, Republic of Georgia. J UrbanHealth. 2006;83:289–98. https://doi.org/10.1007/s11524-006-9032-y.
4. Shapatava E, Nelson KE, Tsertsvadze T, del Rio C. Risk behaviors and HIV, hepatitis B, andhepatitis C seroprevalence among injection drug users in Georgia. Drug Alcohol Depend.2006;82(Suppl 1):S35–8.
5. Chikovani I, Shengelia N, Sulaberidze L, Sirbiladze T, Tavzarashvili L. HIV risk and preven-tion behaviors among People Who Inject Drugs in seven cities of Georgia. Tbilisi: CuratioInternational Foundation, Bemoni Public Union; 2017.
6. Tsereteli N, Chikovani I, Shengelia N, Sulaberidze L. HIV risk and prevention behavior amongMen who have Sex with Men in Tbilisi and Batumi, Georgia. Tbilisi: Curatio InternationalFoundation, Center for Information and Counselling on Reproductive Health–Tanadgoma;2015.
7. Chkhartishvili N, Abutidze A, Bolokadze N, Chokoshvili O, Dvali N, Sharvadze L, TsertsvadzeT. Hepatitis C care cascade for people living with HIV in the country of Georgia. J Int AIDSSoc. 2017;20:11–2.
8. Lomtadze N, et al. Hepatitis C virus co-infection increases the risk of anti-tuberculosis drug-induced hepatotoxicity among patients with pulmonary tuberculosis. PLoS One. 2013;8:e83892. https://doi.org/10.1371/journal.pone.0083892.
9. Butsashvili M, Kamkamidze G, Kajaia M, Morse DL, Triner W, DeHovitz J, McNuttLA. Occupational exposure to body fluids among health care workers in Georgia. OccupMed. 2012;62:620–6. https://doi.org/10.1093/occmed/kqs121.
10. Karchava M, Sharvadze L, Gatserelia L, Badridze N, Tsertsvadze T. Prevailing HCV genotypesand subtypes among hiv infected patients in Georgia. Georgian Med News. 2009;177:51–5.
11. Sharvadze L, Nelson KE, Imnadze P, Karchava M, Tsertsvadze T. Prevalence of HCV andgenotypes distribution in general population of Georgia. Georgian Med News. 2008;165:71–7.
12. Karchava M, et al. High incidence of the hepatitis C virus recombinant 2k/1b in Georgia:recommendations for testing and treatment. Hepatol Res. 2015;45:1292–8. https://doi.org/10.1111/hepr.12505.
13. Zakalashvili M, et al. Identification of hepatitis C virus 2k/1b intergenotypic recombinants inGeorgia. Liver Int. 2018;38:451–7. https://doi.org/10.1111/liv.13540.
14. Kalinina O, Norder H, Mukomolov S, Magnius LO. A natural intergenotypic recombinant ofhepatitis C virus identified in St. Petersburg. J Virol. 2002;76:4034–43.
15. Gvinjilia L, et al. National progress toward hepatitis C elimination—Georgia, 2015–2016.MMWR Morb Mortal Wkly Rep. 2016;65:1132–5. https://doi.org/10.15585/mmwr.mm6541a2.
16. Mitruka K, et al. Launch of a Nationwide Hepatitis C elimination program—Georgia, April2015. MMWR Morb Mortal Wkly Rep. 2015;64:753–7.
244 T. Tsertsvadze et al.
17. Dowdle WR. The principles of disease elimination and eradication. Bull World Health Organ.1998;76(Suppl 2):22–5.
18. Ministry of Labour Health and Social Affairs of Georgia. Strategic plan for the elimination ofhepatitis C Virus in Georgia, 2016–2020. Tbilisi: Ministry of Labour, Health and Social Affairsof Georgia; 2016. http://www.moh.gov.ge/uploads/files/2017/akordeoni/failebi/Georgia_HCV_Elimination_Strategy_2016-2020.pdf.
19. Nasrullah M, et al. The role of screening and treatment in national progress toward hepatitis Celimination—Georgia, 2015–2016. MMWR Morb Mortal Wkly Rep. 2017;66:773–6. https://doi.org/10.15585/mmwr.mm6629a2.
20. Afdhal N, et al. Ledipasvir and sofosbuvir for previously treated HCV genotype 1 infection. NEngl J Med. 2014;370:1483–93. https://doi.org/10.1056/NEJMoa1316366.
21. Afdhal N, et al. Ledipasvir and sofosbuvir for untreated HCV genotype 1 infection. N Engl JMed. 2014;370:1889–98. https://doi.org/10.1056/NEJMoa1402454.
22. Lim JK, et al. Safety and effectiveness of ledipasvir and sofosbuvir, with or without ribavirin, intreatment-experienced patients with genotype 1 hepatitis C virus infection and cirrhosis. ClinGastroenterol Hepatol. 2018;16:1811-1819.e4. https://doi.org/10.1016/j.cgh.2017.12.037.
23. Tapper EB, et al. Real-world effectiveness for 12 weeks of ledipasvir-sofosbuvir for genotype1 hepatitis C: the Trio Health study. J Viral Hepat. 2017;24:22–7. https://doi.org/10.1111/jvh.12611.
24. Foster GR, et al. Sofosbuvir and velpatasvir for HCV genotype 2 and 3 infection. N Engl J Med.2015;373:2608–17. https://doi.org/10.1056/NEJMoa1512612.
25. Zeuzem S, et al. Glecaprevir-pibrentasvir for 8 or 12 weeks in HCV genotype 1 or 3 infection. NEngl J Med. 2018;378:354–69. https://doi.org/10.1056/NEJMoa1702417.
26. Hedskog C, et al. Characterization of hepatitis C virus intergenotypic recombinant strains andassociated virological response to sofosbuvir/ribavirin. Hepatology. 2015;61:471–80. https://doi.org/10.1002/hep.27361.
27. Karchava M, et al. Impact of hepatitis C virus recombinant form RF1_2k/1b on treatmentoutcomes within the Georgian national hepatitis C elimination program. Hepatol Res.2018;48:36–44. https://doi.org/10.1111/hepr.12890.
28. Dalgard O, et al. Sofosbuvir based treatment of chronic hepatitis C genotype 3 infections-AScandinavian real-life study. PLoS One. 2017;12:e0179764. https://doi.org/10.1371/journal.pone.0179764PONE-D-17-10021.
29. Gane EJ, Hyland RH, An D, Svarovskaia E, Pang PS, Brainard D, Stedman CA. Efficacy ofledipasvir and sofosbuvir, with or without ribavirin, for 12 weeks in patients with HCVgenotype 3 or 6 infection. Gastroenterology. 2015;149:1454–1461 e1451. https://doi.org/10.1053/j.gastro.2015.07.063S0016-5085(15)01096-3.
30. Ioannou GN, et al. Effectiveness of sofosbuvir, ledipasvir/sofosbuvir, or paritaprevir/ritonavir/ombitasvir and dasabuvir regimens for treatment of patients with hepatitis C in the veteransaffairs National Health Care System. Gastroenterology. 2016;151:457–471 e455. https://doi.org/10.1053/j.gastro.2016.05.049S0016-5085(16)34575-9.
31. Ministry of Labour Health and Social Affairs of Georgia, National Center for Disease Controland Public Health, U.S. Centers for Disease Control and Prevention. 2017. National Hepatitis CVirus Elimination Progress Report, Georgia: 2015–2017. Tbilisi.
32. Walker J, et al. Projected impact and pathways to success of the hepatitis C elimination programin Georgia, 2015–2020. J Hepatol. 2017;66:S70.
33. Nasrullah M, Sergeenko D, Gamkrelidze A, Averhoff F. HCV elimination—lessons learnedfrom a small Eurasian country. Georgia Nat Rev Gastroenterol Hepatol. 2017;14:447–8. https://doi.org/10.1038/nrgastro.2017.100nrgastro.2017.100.
13 National Hepatitis C Elimination Program of Georgia 245
Submitted 23 December 2020Accepted 12 July 2021Published 10 September 2021
Corresponding authorsMaryam Sadeghimehr,[email protected] Bertisch, [email protected]
Academic editorGunjan Arora
Additional Information andDeclarations can be found onpage 11
DOI 10.7717/peerj.11895
Copyright2021 Sadeghimehr et al.
Distributed underCreative Commons CC-BY 4.0
OPEN ACCESS
Hepatitis C core antigen test as analternative for diagnosing HCV infection:mathematical model and cost-effectivenessanalysisMaryam Sadeghimehr1, Barbara Bertisch1,2, Francesco Negro3, Maia Butsashvili4,Sonjelle Shilton5, Irina Tskhomelidze6, Maia Tsereteli7, Olivia Keiser1 andJanne Estill1,8
1 Institute of Global Health, University of Geneva, Geneva, Switzerland2Checkin Helvetiaplatz, Zürich, Switzerland3Divisions of Gastroenterology and Hepatology and of Clinical Pathology, Geneva University Hospitals,Geneva, Switzerland
4Clinic Neolab, Tbilisi, Georgia5 FIND, Geneva, Switzerland6TEPHINET for Georgia Hepatitis C Elimination Program, I. Javakhishvili Tbilisi State University,Tbilisi, Georgia
7Department of HIV/AIDS, Hepatitis, STI and TB, National Center for Disease Control and Public Health,Tbilisi, Georgia
8 Institute of Mathematical Statistics and Actuarial Science, University of Bern, Bern, Switzerland
ABSTRACTBackground. The cost and complexity of the polymerase chain reaction (PCR) testare barriers to diagnosis and treatment of hepatitis C virus (HCV) infection. Weinvestigated the cost-effectiveness of testing strategies using antigen instead of PCRtesting.Methods. We developed a mathematical model for HCV to estimate the number ofdiagnoses and cases of liver disease. We compared the following testing strategies:antibody test followed by PCR in case of positive antibody (baseline strategy); antibodytest followed by HCV-antigen test (antibody-antigen); antigen test alone; PCR testalone. We conducted cost-effectiveness analyses considering either the costs of HCVtesting of infected and uninfected individuals alone (A1), HCV testing and liver-related complications (A2), or all costs including HCV treatment (A3). The model wasparameterized for the country of Georgia. We conducted several sensitivity analyses.Results. The baseline scenario could detect 89% of infected individuals. Antibody-antigen detected 86% and antigen alone 88% of infected individuals. PCR testing alonedetected 91%of the infected individuals: the remaining 9% either died or spontaneouslyrecovered before testing. In analysis A1, the baseline strategy was not essentially moreexpensive than antibody-antigen. In analysis A2, strategies using PCR became cheaperthan antigen-based strategies. In analysis A3, antibody-antigen was again the cheapeststrategy, followed by the baseline strategy, and PCR testing alone.Conclusions. Antigen testing, either following a positive antibody test or alone,performed almost as well as the current practice of HCV testing. The cost-effectivenessof these strategies depends on the inclusion of treatment costs.
Subjects Epidemiology, Global Health, Health Policy, Infectious Diseases, Public Health
How to cite this article Sadeghimehr M, Bertisch B, Negro F, Butsashvili M, Shilton S, Tskhomelidze I, Tsereteli M, Keiser O, Estill J.2021. Hepatitis C core antigen test as an alternative for diagnosing HCV infection: mathematical model and cost-effectiveness analysis. PeerJ9:e11895 http://doi.org/10.7717/peerj.11895
Keywords HCV, Hepatitis C, PCR, Polymerase chain reaction, Antigen, Diagnostic test,Mathematical modeling, Progression model, Screening strategies, Country of Georgia
INTRODUCTIONHepatitis C virus (HCV) is amajor cause of liver disease and liver-relatedmortality (Pawlot-sky et al., 2018). The World Health Organization (WHO) estimates that 71 million peopleworldwide are chronically infected with hepatitis C, and 400,000 people die from HCVevery year, mostly due to cirrhosis and hepatocellular carcinoma. However, the majorityof the HCV infected individuals are not aware of their infection (WHO, 2021). Effectivehepatitis testing strategies and tools are needed to achieve the WHO target of eliminatingHCV as a major public health threat by 2030 (World Health Organization, 2016).
Since 2014, Direct Acting Antivirals (DAA) form the standard HCV treatment. Forsuccessful DAA treatments, tests are needed to diagnose the infection and confirm theclearance of viral replication (Pawlotsky et al., 2018; Tillmann, 2014). Two types of tests areusually applied: serological assays that detect antibodies to HCV, and nucleic acid tests thatdetect HCV RNA genomes to confirm active infection (Tillmann, 2014; Gretch, 2000). Themost commonly used testing protocol is to first use an antibody test, and if the result ispositive, check the presence of the virus with a nucleic acid test (usually a polymerase chainreaction test, PCR) (Tillmann, 2014; Gretch, 2000). The sensitivity and specificity of PCRtests are high (Gretch, 2000). PCR testing requires time and trained laboratory personnel,which increases the costs. The cost of PCR is an important barrier for comprehensivetesting, especially in low- and middle-income countries.
HCV-antigen test is a serological assay that directly detects a viral protein, giving apositive result as soon as the virus component is present. The test can be done on thesame platform as the antibody test (Tillmann, 2014), is cheaper (Cresswell et al., 2015) andrequires less special training than PCR testing. While antigen tests have a specificity of upto 100%, viral loads below 3,000 IU/ml may not be detected (Tillmann, 2014; Bertisch etal., 2020).
With a limited budget, replacing PCR by antigen testing could increase testing coverage,but people with very low viral loads may be missed. Using the country of Georgia as anexample, we aimed to study the cost-effectiveness of different testing strategies using amathematical model.
MATERIALS AND METHODSModel structure and inputsWe developed a mathematical model for HCV disease progression, similar to a previouslypublished model (Sadeghimehr et al., 2019). We simulated cohorts of patients frominfection until death. The progression of HCV is represented by a directed acyclic graphof health states. In each state, the model samples when and to which state the patient willmove next. The process is repeated until the patient reaches a terminal state (death). Thepatients progress along the stages of liver disease, course of HCV infection and cascadeof care (Fig. 1). The liver disease stages are represented by the METAVIR scoring system
Sadeghimehr et al. (2021), PeerJ, DOI 10.7717/peerj.11895 2/15
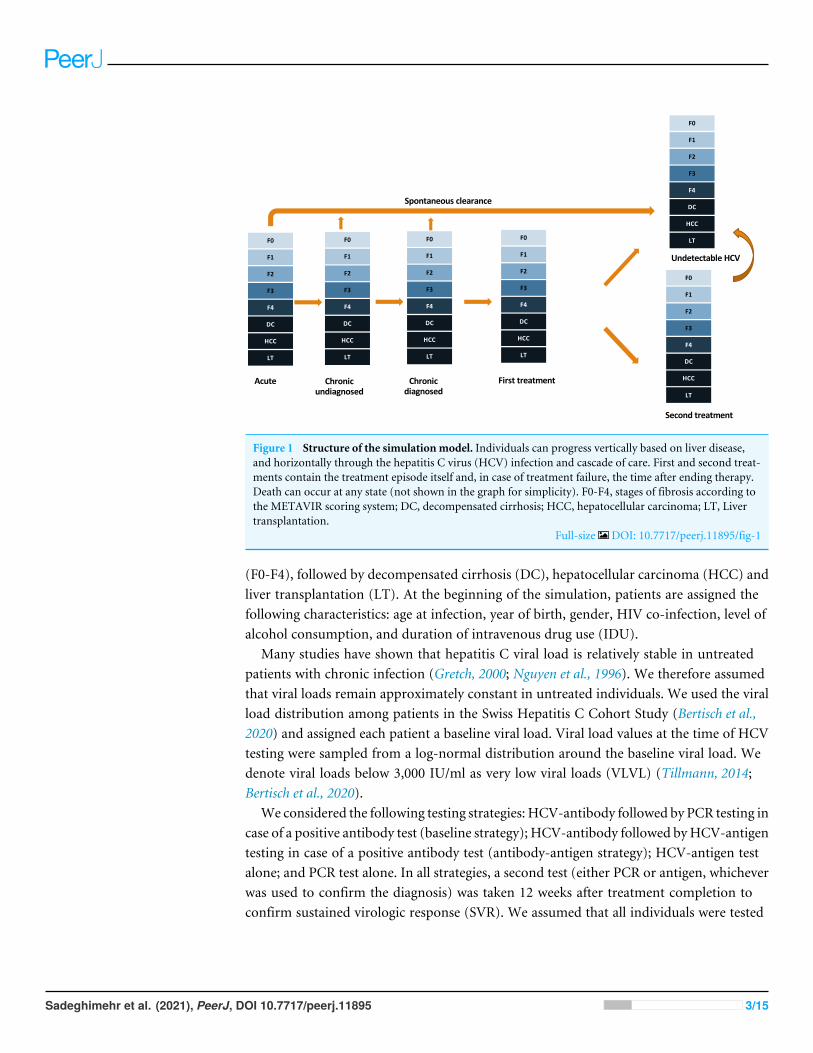
F0
F1
F2
F3
F4
DC
HCC
LT
Acute Chronic undiagnosed
Chronic diagnosed
First treatment
Undetectable HCV
Second treatment
Spontaneous clearance
F0
F1
F2
F3
F4
DC
HCC
LT
F0
F1
F2
F3
F4
DC
HCC
LT
F0
F1
F2
F3
F4
DC
HCC
LT
F0
F1
F2
F3
F4
DC
HCC
LT
F0
F1
F2
F3
F4
DC
HCC
LT
Figure 1 Structure of the simulationmodel. Individuals can progress vertically based on liver disease,and horizontally through the hepatitis C virus (HCV) infection and cascade of care. First and second treat-ments contain the treatment episode itself and, in case of treatment failure, the time after ending therapy.Death can occur at any state (not shown in the graph for simplicity). F0-F4, stages of fibrosis according tothe METAVIR scoring system; DC, decompensated cirrhosis; HCC, hepatocellular carcinoma; LT, Livertransplantation.
Full-size DOI: 10.7717/peerj.11895/fig-1
(F0-F4), followed by decompensated cirrhosis (DC), hepatocellular carcinoma (HCC) andliver transplantation (LT). At the beginning of the simulation, patients are assigned thefollowing characteristics: age at infection, year of birth, gender, HIV co-infection, level ofalcohol consumption, and duration of intravenous drug use (IDU).
Many studies have shown that hepatitis C viral load is relatively stable in untreatedpatients with chronic infection (Gretch, 2000; Nguyen et al., 1996). We therefore assumedthat viral loads remain approximately constant in untreated individuals. We used the viralload distribution among patients in the Swiss Hepatitis C Cohort Study (Bertisch et al.,2020) and assigned each patient a baseline viral load. Viral load values at the time of HCVtesting were sampled from a log-normal distribution around the baseline viral load. Wedenote viral loads below 3,000 IU/ml as very low viral loads (VLVL) (Tillmann, 2014;Bertisch et al., 2020).
We considered the following testing strategies: HCV-antibody followed by PCR testing incase of a positive antibody test (baseline strategy); HCV-antibody followed byHCV-antigentesting in case of a positive antibody test (antibody-antigen strategy); HCV-antigen testalone; and PCR test alone. In all strategies, a second test (either PCR or antigen, whicheverwas used to confirm the diagnosis) was taken 12 weeks after treatment completion toconfirm sustained virologic response (SVR). We assumed that all individuals were tested
Sadeghimehr et al. (2021), PeerJ, DOI 10.7717/peerj.11895 3/15
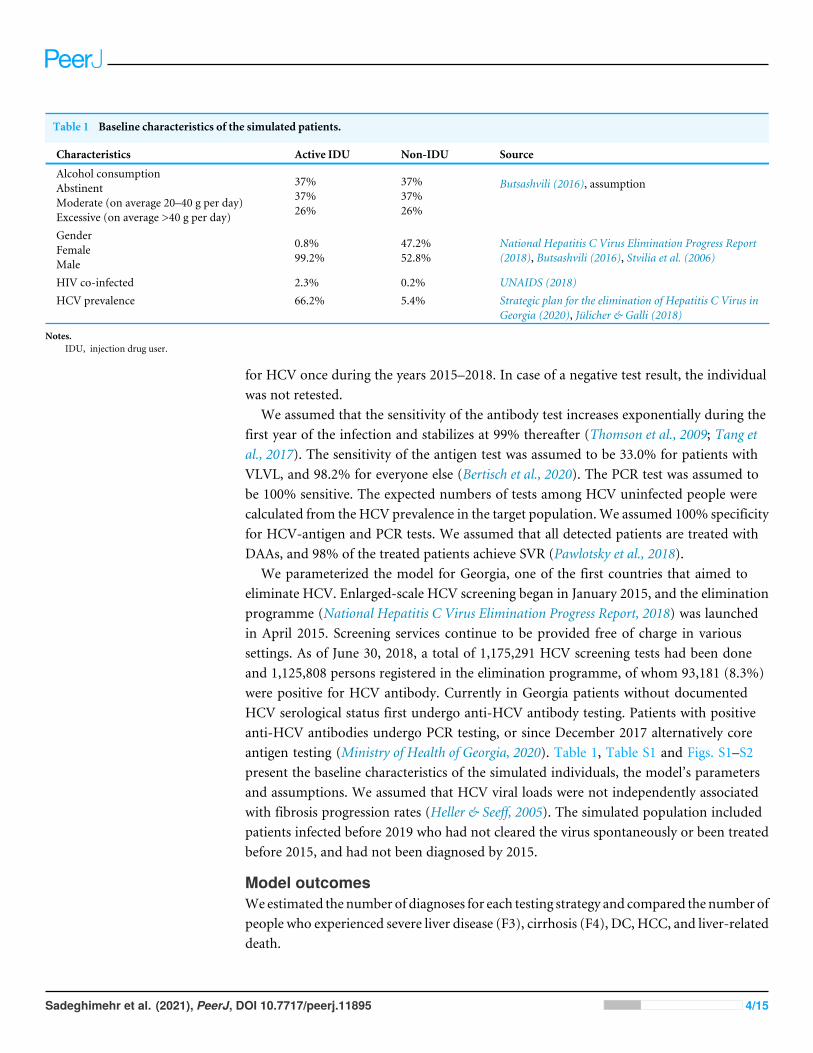
Table 1 Baseline characteristics of the simulated patients.
Characteristics Active IDU Non-IDU Source
Alcohol consumptionAbstinentModerate (on average 20–40 g per day)Excessive (on average >40 g per day)
37%37%26%
37%37%26%
Butsashvili (2016), assumption
GenderFemaleMale
0.8%99.2%
47.2%52.8%
National Hepatitis C Virus Elimination Progress Report(2018), Butsashvili (2016), Stvilia et al. (2006)
HIV co-infected 2.3% 0.2% UNAIDS (2018)HCV prevalence 66.2% 5.4% Strategic plan for the elimination of Hepatitis C Virus in
Georgia (2020), Jülicher & Galli (2018)
Notes.IDU, injection drug user.
for HCV once during the years 2015–2018. In case of a negative test result, the individualwas not retested.
We assumed that the sensitivity of the antibody test increases exponentially during thefirst year of the infection and stabilizes at 99% thereafter (Thomson et al., 2009; Tang etal., 2017). The sensitivity of the antigen test was assumed to be 33.0% for patients withVLVL, and 98.2% for everyone else (Bertisch et al., 2020). The PCR test was assumed tobe 100% sensitive. The expected numbers of tests among HCV uninfected people werecalculated from the HCV prevalence in the target population.We assumed 100% specificityfor HCV-antigen and PCR tests. We assumed that all detected patients are treated withDAAs, and 98% of the treated patients achieve SVR (Pawlotsky et al., 2018).
We parameterized the model for Georgia, one of the first countries that aimed toeliminate HCV. Enlarged-scale HCV screening began in January 2015, and the eliminationprogramme (National Hepatitis C Virus Elimination Progress Report, 2018) was launchedin April 2015. Screening services continue to be provided free of charge in varioussettings. As of June 30, 2018, a total of 1,175,291 HCV screening tests had been doneand 1,125,808 persons registered in the elimination programme, of whom 93,181 (8.3%)were positive for HCV antibody. Currently in Georgia patients without documentedHCV serological status first undergo anti-HCV antibody testing. Patients with positiveanti-HCV antibodies undergo PCR testing, or since December 2017 alternatively coreantigen testing (Ministry of Health of Georgia, 2020). Table 1, Table S1 and Figs. S1–S2present the baseline characteristics of the simulated individuals, the model’s parametersand assumptions. We assumed that HCV viral loads were not independently associatedwith fibrosis progression rates (Heller & Seeff, 2005). The simulated population includedpatients infected before 2019 who had not cleared the virus spontaneously or been treatedbefore 2015, and had not been diagnosed by 2015.
Model outcomesWeestimated the number of diagnoses for each testing strategy and compared the number ofpeople who experienced severe liver disease (F3), cirrhosis (F4), DC, HCC, and liver-relateddeath.
Sadeghimehr et al. (2021), PeerJ, DOI 10.7717/peerj.11895 4/15
We also compared the cost-effectiveness of the testing alternatives, conducting threeanalyses with different assumptions regarding costs. In analysis A1, we only considered thedirect costs of the HCV tests, including also testing the HCV uninfected individuals notexplicitly simulated. In analysis A2, we added the costs of HCV-associated consultationswith clinical assessment, complete blood count and alanine aminotransferase test (Ministryof Health of Georgia, 2020) and the lifetime costs associated with liver disease. This analysistakes the perspective of the health care payer in situations like in the country of Georgiawhere treatment costs are covered by external donors. In analysis A3, we included allcosts of HCV testing, liver disease and HCV treatment. We reviewed the literature,and contacted persons involved in the elimination project in the country of Georgia tointerpret published data to obtain costs of HCV testing, DAA treatment and liver disease,and HCV- and liver-related utilities (Table 2) (Jülicher & Galli, 2018; Ormeci et al., 2014;Cloherty et al., 2016). We adopted life-time liver disease costs from Turkey for viremicindividuals (Ormeci et al., 2014). We assumed that the costs of liver disease in stages F0-F3decreased by 50% after achieving SVR. The quality of life of patients has been shown toimprove substantially after SVR (Dusheiko, 2017). Moreover, the model does not allowliver disease regression, so patients modelled to be in an advanced stage of the liver diseasewith SVR may in reality have returned to a less severe stage (Knop et al., 2016). It shouldtherefore be safe to assume that the costs of treating liver disease decrease substantiallyafter achieving SVR. In all analyses, we calculated the incremental cost-effectiveness ratios(ICERs) between the strategies, comparing incremental costs with incremental gain inquality-adjusted life expectancy at time of infection. The results are presented per infectedindividual. We discounted all future costs and quality-adjusted life years (QALYs) at 3%per year.
Sensitivity analysesWe conducted sensitivity analyses to address the uncertainty around key parameters andgeneralize our findings to other settings (Table S2 ). First, we reduced the unit cost of eitherthe PCR test (sensitivity analysis S1) or antigen test (sensitivity analysis S2). Second, wereduced the liver-related costs after SVR to zero for liver stages F0-F2 (sensitivity analysisS3). Third, we used an alternative estimate of liver disease costs from France (sensitivityanalysis S4). Fourth, we calculated the results for a population consisting completely ofnon-IDUs with decreased HCV prevalence (sensitivity analysis S5), or an IDU populationwith increased HCV prevalence (sensitivity analysis S6). Finally, we decreased the cost ofHCV treatment to generalize the results for settings that have access to treatment withsubstantially reduced prices (sensitivity analysis S7).
RESULTSIn the baseline scenario, 89,400 of 100,000 infected individuals were diagnosed during thefour-year screening period. In the antibody-antigen strategy, fewer infected individualswere detected (86,100 per 100,000 infected individuals). For antigen test alone the numberof diagnoses was 87,500 per 100,000 infected individuals. PCR test alone could detect
Sadeghimehr et al. (2021), PeerJ, DOI 10.7717/peerj.11895 5/15
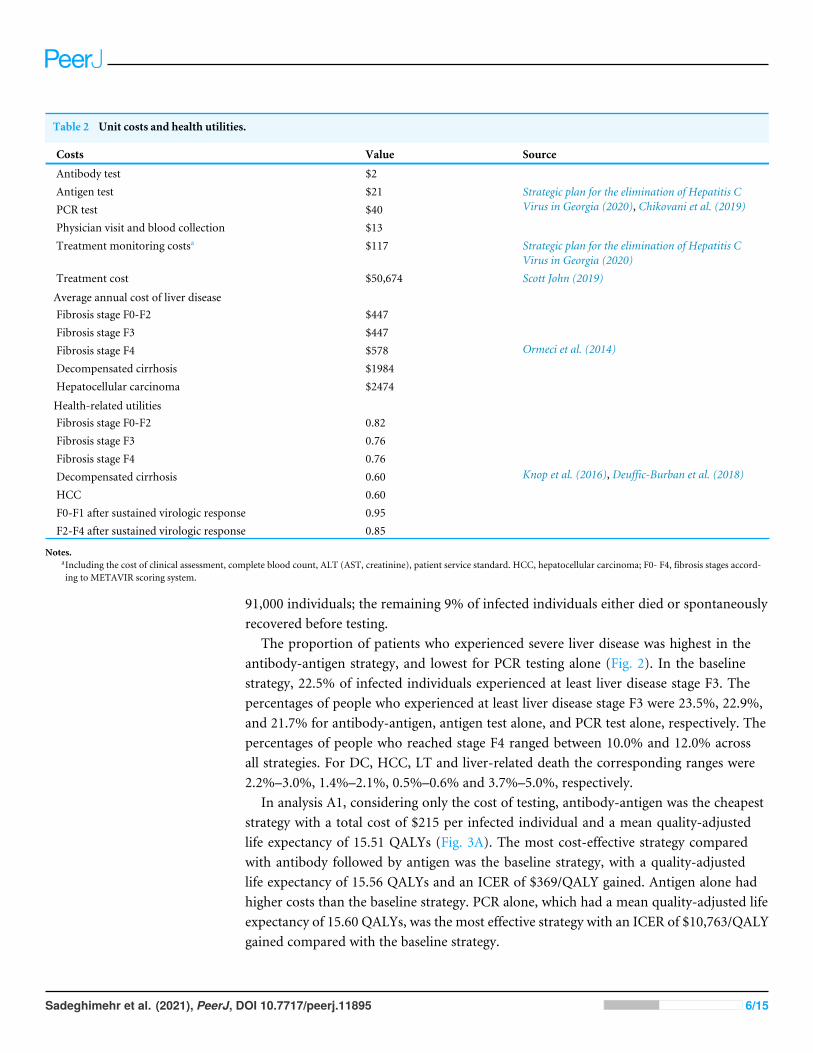
Table 2 Unit costs and health utilities.
Costs Value Source
Antibody test $2Antigen test $21PCR test $40Physician visit and blood collection $13
Strategic plan for the elimination of Hepatitis CVirus in Georgia (2020), Chikovani et al. (2019)
Treatment monitoring costsa $117 Strategic plan for the elimination of Hepatitis CVirus in Georgia (2020)
Treatment cost $50,674 Scott John (2019)
Average annual cost of liver diseaseFibrosis stage F0-F2 $447Fibrosis stage F3 $447Fibrosis stage F4 $578Decompensated cirrhosis $1984Hepatocellular carcinoma $2474
Ormeci et al. (2014)
Health-related utilitiesFibrosis stage F0-F2 0.82Fibrosis stage F3 0.76Fibrosis stage F4 0.76Decompensated cirrhosis 0.60HCC 0.60F0-F1 after sustained virologic response 0.95F2-F4 after sustained virologic response 0.85
Knop et al. (2016), Deuffic-Burban et al. (2018)
Notes.aIncluding the cost of clinical assessment, complete blood count, ALT (AST, creatinine), patient service standard. HCC, hepatocellular carcinoma; F0- F4, fibrosis stages accord-ing to METAVIR scoring system.
91,000 individuals; the remaining 9% of infected individuals either died or spontaneouslyrecovered before testing.
The proportion of patients who experienced severe liver disease was highest in theantibody-antigen strategy, and lowest for PCR testing alone (Fig. 2). In the baselinestrategy, 22.5% of infected individuals experienced at least liver disease stage F3. Thepercentages of people who experienced at least liver disease stage F3 were 23.5%, 22.9%,and 21.7% for antibody-antigen, antigen test alone, and PCR test alone, respectively. Thepercentages of people who reached stage F4 ranged between 10.0% and 12.0% acrossall strategies. For DC, HCC, LT and liver-related death the corresponding ranges were2.2%–3.0%, 1.4%–2.1%, 0.5%–0.6% and 3.7%–5.0%, respectively.
In analysis A1, considering only the cost of testing, antibody-antigen was the cheapeststrategy with a total cost of $215 per infected individual and a mean quality-adjustedlife expectancy of 15.51 QALYs (Fig. 3A). The most cost-effective strategy comparedwith antibody followed by antigen was the baseline strategy, with a quality-adjustedlife expectancy of 15.56 QALYs and an ICER of $369/QALY gained. Antigen alone hadhigher costs than the baseline strategy. PCR alone, which had a mean quality-adjusted lifeexpectancy of 15.60 QALYs, was the most effective strategy with an ICER of $10,763/QALYgained compared with the baseline strategy.
Sadeghimehr et al. (2021), PeerJ, DOI 10.7717/peerj.11895 6/15
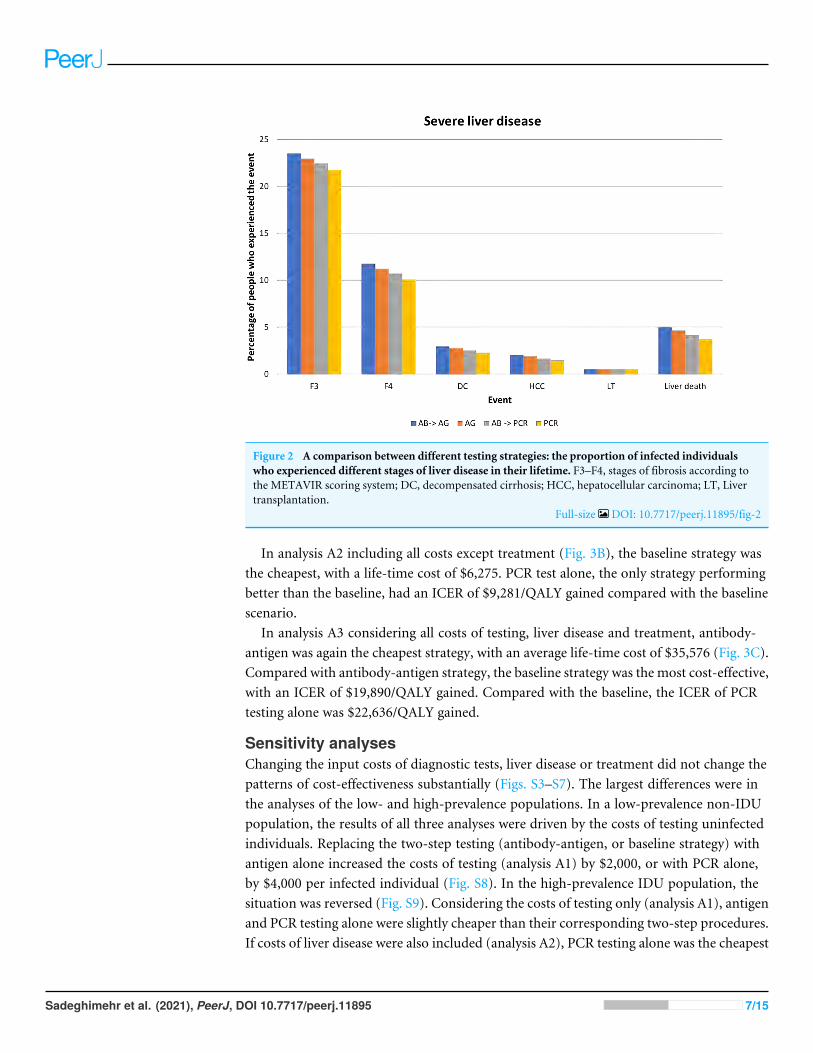
Figure 2 A comparison between different testing strategies: the proportion of infected individualswho experienced different stages of liver disease in their lifetime. F3–F4, stages of fibrosis according tothe METAVIR scoring system; DC, decompensated cirrhosis; HCC, hepatocellular carcinoma; LT, Livertransplantation.
Full-size DOI: 10.7717/peerj.11895/fig-2
In analysis A2 including all costs except treatment (Fig. 3B), the baseline strategy wasthe cheapest, with a life-time cost of $6,275. PCR test alone, the only strategy performingbetter than the baseline, had an ICER of $9,281/QALY gained compared with the baselinescenario.
In analysis A3 considering all costs of testing, liver disease and treatment, antibody-antigen was again the cheapest strategy, with an average life-time cost of $35,576 (Fig. 3C).Compared with antibody-antigen strategy, the baseline strategy was the most cost-effective,with an ICER of $19,890/QALY gained. Compared with the baseline, the ICER of PCRtesting alone was $22,636/QALY gained.
Sensitivity analysesChanging the input costs of diagnostic tests, liver disease or treatment did not change thepatterns of cost-effectiveness substantially (Figs. S3–S7). The largest differences were inthe analyses of the low- and high-prevalence populations. In a low-prevalence non-IDUpopulation, the results of all three analyses were driven by the costs of testing uninfectedindividuals. Replacing the two-step testing (antibody-antigen, or baseline strategy) withantigen alone increased the costs of testing (analysis A1) by $2,000, or with PCR alone,by $4,000 per infected individual (Fig. S8). In the high-prevalence IDU population, thesituation was reversed (Fig. S9). Considering the costs of testing only (analysis A1), antigenand PCR testing alone were slightly cheaper than their corresponding two-step procedures.If costs of liver disease were also included (analysis A2), PCR testing alone was the cheapest
Sadeghimehr et al. (2021), PeerJ, DOI 10.7717/peerj.11895 7/15
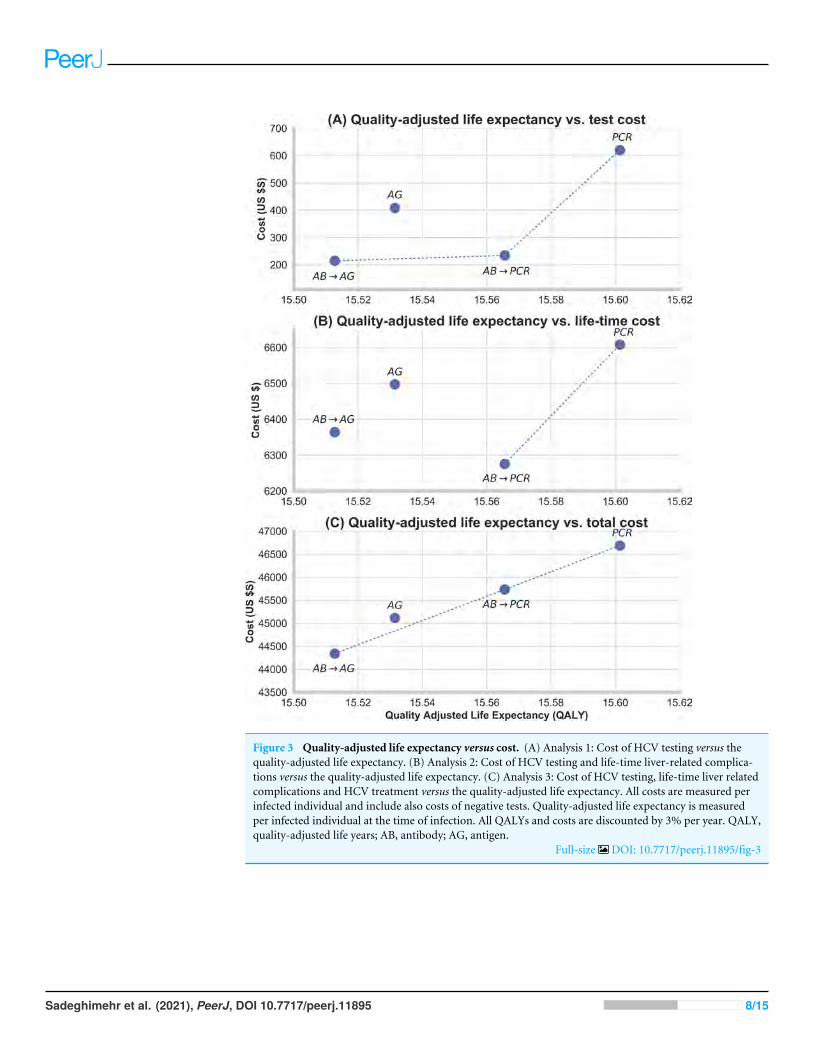
Figure 3 Quality-adjusted life expectancy versus cost. (A) Analysis 1: Cost of HCV testing versus thequality-adjusted life expectancy. (B) Analysis 2: Cost of HCV testing and life-time liver-related complica-tions versus the quality-adjusted life expectancy. (C) Analysis 3: Cost of HCV testing, life-time liver relatedcomplications and HCV treatment versus the quality-adjusted life expectancy. All costs are measured perinfected individual and include also costs of negative tests. Quality-adjusted life expectancy is measuredper infected individual at the time of infection. All QALYs and costs are discounted by 3% per year. QALY,quality-adjusted life years; AB, antibody; AG, antigen.
Full-size DOI: 10.7717/peerj.11895/fig-3
Sadeghimehr et al. (2021), PeerJ, DOI 10.7717/peerj.11895 8/15
strategy. Considering all costs (analysis A3), antibody-antigen was again the cheapestscenario. Of the remaining strategies, antigen testing alone was most cost-effective with anICER of $12,265/QALY gained compared to the cheapest strategy.
DISCUSSIONPrincipal findingsStrategies using an antigen test to diagnose HCV infection performed reasonably wellcompared with the traditional PCR-based approach, but the cost-effectiveness of thesestrategies depends on the perspective taken. In situations like in the country of Georgia,where treatment is provided from external sources (Ministry of Health of Georgia, 2020),the current two-step testing procedure using antibody and PCR tests has the lowest costsfrom the healthcare system’s point of view. Adding HCV treatment costs to our analysismade the two-step procedure with confirmation by antigen instead of PCR the cheapest, butalso the least effective, strategy. However, the maximum difference in quality-adjusted lifeexpectancy across all strategies was only onemonth. Antigen testing alone performed betterthan antibody followed by antigen, but not as well as the baseline strategy. PCR testingalone was clearly the most effective but also most expensive strategy. These additional costscould however be compensated by cost savings related to liver disease, if treatment costswere not considered.
Antigen testing alone is a potential alternative for the current two-step testing procedure.Both strategies miss some HCV infected individuals. In our study, antigen alone missedabout 3% and the baseline strategy 2% of those infected. But the characteristics of themissed patients differ. The HCV antibody test can detect an infection only after about35 days (Ottiger, Gygli & Huber, 2013). Strategies using antibody tests may lead to under-diagnosis in populations with ongoing transmission. In the Georgian HCV epidemic,where most infections were acquired during the first years after the collapse of the SovietUnion (Walker et al., 2018), this may be of limited relevance except for special groups suchas IDU. Also, the antibody test may remain negative in immunosuppressed patients (Mediciet al., 2011). The antigen test in turn misses around two thirds of individuals withVLVL (Bertisch et al., 2020). Antigen testing was less beneficial than the baseline strategy fortwo reasons: the number of VLVL patients was higher than the number of recently infectedpatients; and recently infected patients reach end stage liver disease later than VLVL patienton average. Antigen testing saved costs mainly by missing the individuals with VLVL andtherefore reducing the number of treated patients. However, spontaneous cure is morefrequent among VLVL individuals than other chronically infected patients (Bertisch et al.,2020), and the probability of onward HCV transmission may also be lower in persons withVLVL (Bouvet, 2005). A one-step simple test could also reduce the risk of loss to follow-up(LTFU). This may be highly relevant for a country like Georgia where, in 2015, more than25% of anti-HCV positive individuals had no confirmatory testing and were consideredLTFU (National Hepatitis C Virus Elimination Progress Report, 2018). A one-step simpletest would also reduce the unnecessary anxiety among individuals with a false positiveresult or spontaneous cure.
Sadeghimehr et al. (2021), PeerJ, DOI 10.7717/peerj.11895 9/15
Although PCR testing is more expensive than antigen testing, our analysis revealedsome situations where the total costs may be lower with PCR based strategies. If treatmentcosts are not considered, the costs saved by preventing liver disease progression in a fewpatients could outweigh the additional costs needed for PCR testing. In addition to settingswhere treatment is covered by external sources, this may also be relevant for countries thathave negotiated special agreements with treatment manufacturers. In the ‘‘subscriptionmodel’’ (Trusheim, Cassidy & Bach, 2018; Moon & Erickson, 2019), where the governmentpays a flat fee for treating all infected residents within a given time period, treatmentcosts do not depend on the number of treated patients and cost-effectiveness evaluationsshould focus on the costs of liver disease and diagnostics. PCR testing alone was used inour analysis as a theoretical best-case comparator: testing the population with this testcosting more than $40 is unlikely. However, in a setting with extremely high prevalenceand ongoing transmission, such as active IDU, PCR testing alone could be cost-saving.
When comparing the current practice to the less expensive strategy using antibodyfollowed by antigen testing, the ICER was $19,600 per QALY for all costs includingtreatment, and the high costs were mainly caused by the increased need of treatment. Thisshows that in higher-income countries, the use of PCR as the confirmatory test can bejustified from the financial point of view. However, in low-income settings, it may not beefficient to invest in PCR tests, in particular if individuals with low viral loads have a lowerrate of HCV transmission and higher probability of spontaneous cure. It is notable that inlow-income settings, government negotiations and other efforts towards HCV eliminationmay lead to lower price of DAA treatment and HCV RNA testing, but possibly also antigentesting. The formal cost-effectiveness analysis also does not consider factors such as budgetrestrictions. With a limited budget, less expensive tests allow to test more individuals,leading to more diagnoses and better clinical outcomes. Under some conditions, the useof antigen as a confirmatory test may thus be beneficial.
Strengths and limitationsSeveral studies have compared antigen and PCR testing and proposed the use of antigentesting (Cloherty et al., 2016; Wang, Lv & Zhang, 2017; Alonso et al., 2016). They werehowever limited to the costs of the diagnosis, or other short-term costs. Our study comparesdifferent HCV testing strategies on the life-time burden of HCV infection in a nationwidesetting. Our study included the progression of both liver disease and HCV infection. Weused different cost perspectives which makes the results of our study applicable for settingswith differing financing systems and conditions. We used local programmatic data fromGeorgia and literature data to parameterize our model.
Our study is subject to limitations. First, HCV transmission was not included; thus,we ignored the additional disease burden and costs that each missed case might cause byonward transmission. Second, we did not consider HCV reinfection after SVR: we assumedthat achieving SVR once will lead to a lifetime mitigation of liver related QALY loss andcost. Reinfection will reduce this benefit among people who are correctly tested positive andachieve SVR, which in turn will reduce the overall differences in QALYs and costs betweenthe strategies. Third, we did not model any extrahepatic manifestations (EHM). EHM
Sadeghimehr et al. (2021), PeerJ, DOI 10.7717/peerj.11895 10/15
could increase the overall life-time costs associated with HCV (Younossi et al., 2016), whichcould further favour more effective testing. Fourth, we did not allow for HCV re-testing.Individuals at high risk of infection, such as active IDUs, are recommended to get retestedat least once a year (Gretch, 2000). This is also the population with most acute infections.As antibody testing misses those recently infected, our model may overestimate the benefitof antibody testing for populations with many acute infections. Including re-testing couldtherefore favour the two-step testing procedures, as the patients who were tested negativeduring the acute phase of disease using an antibody test could be detected at the next testinground. Fifth, we did not consider some factors favouring the use of antigen testing, suchas lower transmission risk and more spontaneous cure among patients with VLVL, andthe potentially better retention of one-step testing strategies. Sixth, our analyses took theperspective of a health care payer. In the Georgian elimination program, the care is nowfree of charge for the patients. In settings where a considerable part of the costs is coveredwith out-of-pocket payments, the search for the most cost-effective strategy becomes morecomplicated.
CONCLUSIONSA single antigen test can be a reliable and practical alternative for the current two-stepprocedure to diagnose HCV infection, but the cost-effectiveness of this strategy dependson various factors. In settings where the costs of treatment do not directly depend onthe number of treated patients, the higher costs of PCR testing are likely compensated bysavings in liver disease-related costs. However, a full consideration of treatment-relatedcosts may favour simpler and easier tests such as antigen alone, or antigen after antibodytesting. The change to a simple one-time test could offer advantages. In addition, the vastmajority of individuals chronically infected with HCV have viral loads above 3,000 IU/ml,a level at which the diagnostic capacity of antigen tests does not differ from PCR. ReplacingPCR test by antigen test to diagnose HCV can be considered as a safe option for settingswith limited resources, although the associated cost savings may be limited.
ACKNOWLEDGEMENTSWe would like to thank all the collaborators and study nurses of the Swiss HepatitisC Cohort Study; and our colleague Matteo Brezzi, who passed away unexpectedly, forassisting with data collection and management.
ADDITIONAL INFORMATION AND DECLARATIONS
FundingThis study was funded by an unrestricted grant by Gilead Switzerland Sarl. Olivia Keiserwas funded by a professorship grant from the Swiss National Science Foundation (no163878). Barbara Bertisch was funded by the Swiss National Science Foundation via theSwiss Hepatitis C Cohort Study (grant no 177521). The funders had no role in study design,data collection and analysis, decision to publish, or preparation of the manuscript.
Sadeghimehr et al. (2021), PeerJ, DOI 10.7717/peerj.11895 11/15
Grant DisclosuresThe following grant information was disclosed by the authors:The Swiss National Science Foundation: 163878.The Swiss National Science Foundation via the Swiss Hepatitis C Cohort Study: 177521.
Competing InterestsThe authors declare there are no competing interests. Sonjelle Shilton is employed byFIND, Geneva, Switzerland, Barbara Bertisch is employed by Checkin Helvetiaplatz andMaia Butsashvili is employed by Clinic Neolab.
Author Contributions• Maryam Sadeghimehr and Janne Estill conceived and designed the experiments,performed the experiments, analyzed the data, prepared figures and/or tables, authoredor reviewed drafts of the paper, and approved the final draft.
• Barbara Bertisch and Olivia Keiser conceived and designed the experiments, analyzedthe data, prepared figures and/or tables, authored or reviewed drafts of the paper, andapproved the final draft.
• Francesco Negro, Maia Butsashvili, Sonjelle Shilton, Irina Tskhomelidze and MaiaTsereteli analyzed the data, prepared figures and/or tables, authored or reviewed draftsof the paper, and approved the final draft.
Data AvailabilityThe following information was supplied regarding data availability:
The code is available at GitHub: https://github.com/maryamsadeghimehr/HCV_Antigen.
Supplemental InformationSupplemental information for this article can be found online at http://dx.doi.org/10.7717/peerj.11895#supplemental-information.
REFERENCESAlonso R, Pérez-García F, López-Roa P, Alcalá L, Rodeño P, Bouza E. 2016. HCV core-
antigen assay as an alternative to HCV RNA quantification: a correlation study forthe assessment of HCV viremia. Enfermedades Infecciosas Y Microbiologia Clinica36(3):175–178 DOI 10.1016/j.eimc.2016.11.013.
Bertisch B, Brezzi M, Negro F, Müllhaupt B, Ottiger C, Künzler-Heule P, Schmid P,Giudici F, Clerc O, Moriggia A, Marinucci F, Moradpour D, Keiser O. 2020. Verylow hepatitis C viral loads in treatment-naïve persons: do they compromise hepatitisC virus antigen testing? Clinical Infectious Diseases 70(4):653–659.
Bouvet E. 2005. Risk factors for Hepatitis C Virus transmission to health care workersafter occupational exposure: a european case-control study. Clinical InfectiousDiseases 2005:1423–1430.
Butsashvili M. 2016.Hepatitis C elimination program high prevalence of HCV inGeorgia. In: Paris hepatitis conference.
Sadeghimehr et al. (2021), PeerJ, DOI 10.7717/peerj.11895 12/15
Chikovani I, Ompad DC, Uchaneishvili M, Sulaberidze L, Sikharulidze K, Hagan H,Van Devanter NL. 2019. On the way to Hepatitis C elimination in the Republicof Georgia-Barriers and facilitators for people who inject drugs for engaging inthe treatment program: a formative qualitative study. PLOS ONE 14(4):1–19DOI 10.1371/journal.pone.0216123.
Cloherty G, Talal A, Coller K, Steinhart C, Hackett Jr J, Dawson G, Rockstroh J,Feld J. 2016. Role of serologic and molecular diagnostic assays in identificationand management of hepatitis c virus infection. Journal of Clinical Microbiology54(2):265–273 DOI 10.1128/JCM.02407.
Cresswell FV, Fisher M, Hughes DJ, Shaw SG, Homer G, Hassan-IbrahimMO. 2015.Hepatitis C core antigen testing: a reliable, quick, and potentially cost-effectivealternative to hepatitis C polymerase chain reaction in diagnosing acute hepatitis Cvirus infection. Clinical Infectious Diseases 60(2):263–266 DOI 10.1093/cid/ciu782.
Deuffic-Burban S, Huneau A, Verleene A, Brouard C, Pillonel J, Le Strat Y, Cossais S,Roudot-Thoraval F, Canva V, Mathurin P, Dhumeaux D, Yazdanpanah Y. 2018.Assessing the cost-effectiveness of hepatitis C screening strategies in France. Journalof Hepatology 69(4):785–792 DOI 10.1016/j.jhep.2018.05.027.
Dusheiko G. 2017. The impact of antiviral therapy for hepatitis C on the quality of life: aperspective. Liver International 37:7–12.
Gretch DR. 2000. Diagnostic tests for hepatitis C virus. Clinical Microbiology Newsletter22(19):145–149 DOI 10.1016/S0196-4399(00)80011-2.
Heller T, Seeff LB. 2005. Viral load as a predictor of progression of chronic hepatitis C?Hepatology 42(6):1261–1263 DOI 10.1002/hep.20982.
Jülicher P, Galli C. 2018. Identifying cost-effective screening algorithms for activehepatitis C virus infections in a high prevalence setting. Journal of Medical Economics21(1):1–10 DOI 10.1080/13696998.2017.136998316.
Knop V, Hoppe D,Welzel T, Vermehren J, Herrmann E, Vermehren A, Friedrich-Rust M, Sarrazin C, Zeuzem S,Welker MW. 2016. Regression of fibrosis and portalhypertension in HCV-associated cirrhosis and sustained virologic response afterinterferon-free antiviral therapy. Journal of Viral Hepatitis 23(12):994–1002.
Medici MC, Furlini G, Rodella A, Fuertes A, Monachetti A, Calderaro A, Galli S,Terlenghi L, Olivares M, Bagnarelli P, Costantini A, De Conto F, Sainz M, GalliC, Mancaca N, Paola Landini M, Dettori G, Chezzi C. 2011. Hepatitis C viruscore antigen: analytical performances, correlation with viremia and potentialapplications of a quantitative, automated immunoassay. Journal of Clinical Virology51(4):264–269 DOI 10.1016/j.jcv.2011.05.003.
Moon S, Erickson E. 2019. Brazil’s fight against hepatitis C - Universalism, localproduction, and patents. New England Journal of Medicine 380(7):605–607DOI 10.1056/NEJMp1812959.
Ministry of Health of Georgia. 2018. National Hepatitis C Virus Elimination ProgressReport. Available at https://www.moh.gov.ge/uploads/ files/ 2019/Failebi/ 25.04.2019-2.pdf (accessed on 26 June 2021).
Sadeghimehr et al. (2021), PeerJ, DOI 10.7717/peerj.11895 13/15
Ministry of Health of Georgia. 2020. Strategic plan for the elimination of HepatitisC Virus in Georgia, 2016–2020. Available at https://www.moh.gov.ge/uploads/files/ 2017/akordeoni/ failebi/Georgia_HCV_Elimination_Strategy_2016-2020.pdf(accessed on 26 June 2021).
Nguyen TT, Sedghi-Vaziri A, Wilkes LB, Mondala T, Pockros PJ, Lindsay KL,McHutchison JG. 1996. Fluctations in viral load (HCV RNA) are relatively insignif-icant in untreated patients with chronic HCV infection. Journal of Viral Hepatitis3(2):75–78 DOI 10.1111/j.1365-2893.1996.tb00084.x.
Ormeci N, Akarca U, AladagM, Balik I, Kadayifci A, Kalayci C, Kaymakoglu S, KoksalI, Ozkan H, Tabak F, Saka G. 2014. Estimation of hepatitis C costs in Turkey VIAexpert opinion: delphi panel. Value Heal 17(3):A36–A37DOI 10.1016/j.jval.2014.03.222.
Ottiger C, Gygli N, Huber AR. 2013. Detection limit of architect hepatitis C coreantigen assay in correlation with HCV RNA, and renewed confirmation algo-rithm for reactive anti-HCV samples. Journal of Clinical Virology 58(3):535–540DOI 10.1016/j.jcv.2013.08.028.
Pawlotsky JM, Negro F, Aghemo A, Berenguer M, Dalgard O, Dusheiko G, Marra F,Puoti M,Wedemeyer H. 2018. EASL recommendations on treatment of Hepatitis C2018. Journal of Hepatology 69(2):461–511 DOI 10.1016/j.jhep.2018.03.026.
SadeghimehrM, Bertisch B, Schaetti C, Wandeler G, Richard JL, Scheidegger C,Keiser O, Estill J. 2019.Modeling the impact of different testing strategies for HCVinfection in Switzerland. Journal of Virus Eradication 5(4):191.
Scott John DSDH. 2019. Cost and access to direct-acting antiviral agents price ofdirect-acting antiviral agents. 1–22. Available at https://www.hepatitisc.uw.edu/pdf/evaluation-treatment/ cost-access-medications/ core-concept/all (accessed on 4 March2020).
Stvilia K, Tsertsvadze T, Sharvadze L, Aladashvili M, Del Rio C, KuniholmMH, NelsonKE. 2006. Prevalence of Hepatitis C, HIV, and risk behaviors for blood-borneinfections: a population-based survey of the adult population of T’ Bilisi, Republicof Georgia. Journal of Urban Health 83(2):289–298 DOI 10.1007/s11524-006-9032-y.
TangW, ChenW, Amini A, Boeras D, Falconer J, Kelly H, Peeling R, Varsaneux O,Tucker JD, Easterbrook P. 2017. Diagnostic accuracy of tests to detect HepatitisC antibody: a meta-analysis and review of the literature. BMC Infectious Diseases17(1):39–57.
Thomson EC, Nastouli E, Main J, Karayiannis P, Eliahoo J, Muir D, McClure MO.2009. Delayed anti-HCV antibody response in HIV-positive men acutely infectedwith HCV. Aids 23:89–93.
Tillmann HL. 2014.Hepatitis C virus core antigen testing: role in diagnosis, diseasemonitoring and treatment.World Journal of Gastroenterology 20(22):6701–6706DOI 10.3748/wjg.v20.i22.6701.
TrusheimMR, CassidyWM, Bach PB. 2018. Alternative state-level financing forHepatitis C treatment—the netflix model. JAMA - The Journal of the AmericanMedical Association 319(10):1024–1039 DOI 10.1001/jama.2018.1150.
Sadeghimehr et al. (2021), PeerJ, DOI 10.7717/peerj.11895 14/15
UNAIDS. 2018. Country progress report - Georgia. Available at https://www.unaids.org/sites/default/ files/ country/documents/GEO_2018_countryreport.pdf (accessed on 4March 2020).
Walker J, Lim A, Fraser H, Gvinjilia L, Hagan L, Kuchuloria T, Martin NK, NasrullahM, Shadaker S, Aladashvili M, Asatiani A. 2018. Interim impact evaluation of thehepatitis C virus elimination program in Georgia. Lancet Global Health 8:E244–E253DOI 10.1016/S2214-109X(19)30483-8.
Wang L, Lv H, Zhang G. 2017.Hepatitis C virus core antigen assay: an alternativemethod for hepatitis C diagnosis. Annals of Clinical Biochemistry 54(6):279–285DOI 10.1177/0004563216661218.
World Health Organization. 2016. Combating hepatitis b and c to reach elimination by2030. Available at http:// apps.who.int/ iris/ bitstream/handle/10665/206453/WHO_HIV_2016.04_eng.pdf?sequence=1 (accessed on 26 June 2021).
World Health Organization. 2021.Hepatitis C-Key facts. Available at https://www.who.int/news-room/ fact-sheets/detail/hepatitis-c (accessed on 26 June 2021).
Younossi Z, Park H, Henry L, Adeyemi A, StepanovaM. 2016. Extrahepatic manifes-tations of Hepatitis C: a meta-analysis of prevalence, quality of life, and economicburden. Gastroenterology 150(7):1599–1608 DOI 10.1053/j.gastro.2016.02.039.
Sadeghimehr et al. (2021), PeerJ, DOI 10.7717/peerj.11895 15/15
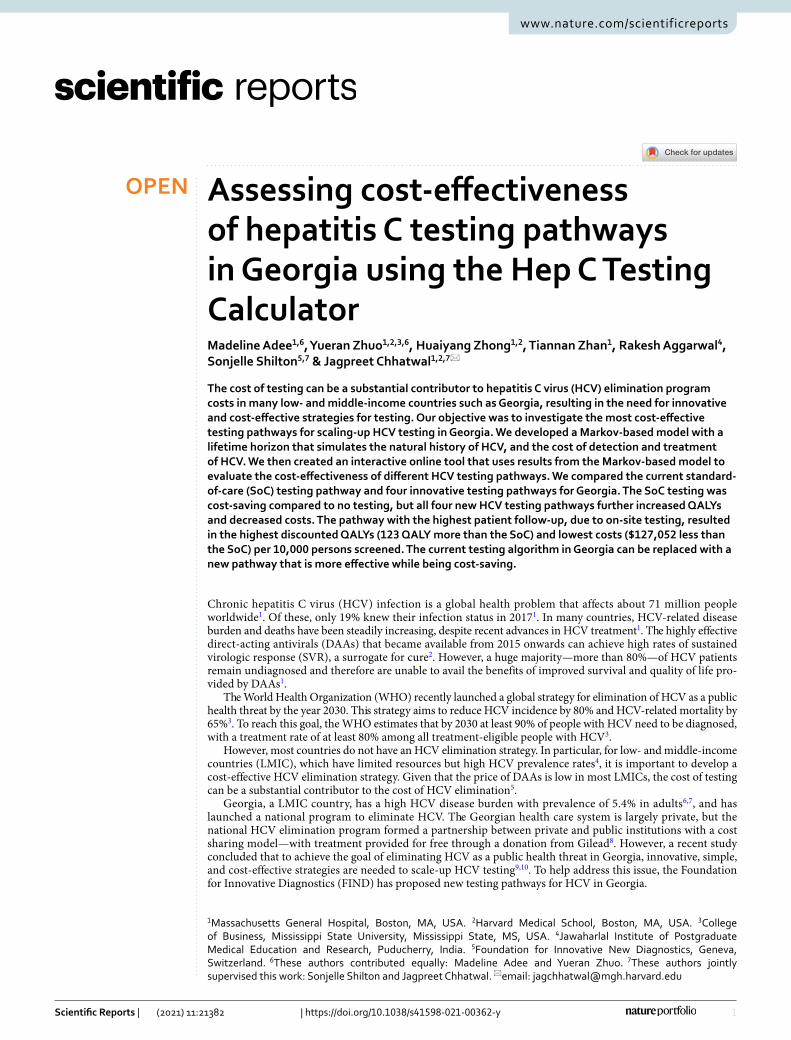
1
Vol.:(0123456789)
Scientific Reports | (2021) 11:21382 | https://doi.org/10.1038/s41598-021-00362-y
www.nature.com/scientificreports
Assessing cost‑effectiveness of hepatitis C testing pathways in Georgia using the Hep C Testing CalculatorMadeline Adee1,6, Yueran Zhuo1,2,3,6, Huaiyang Zhong1,2, Tiannan Zhan1, Rakesh Aggarwal4, Sonjelle Shilton5,7 & Jagpreet Chhatwal1,2,7*
The cost of testing can be a substantial contributor to hepatitis C virus (HCV) elimination program costs in many low‑ and middle‑income countries such as Georgia, resulting in the need for innovative and cost‑effective strategies for testing. Our objective was to investigate the most cost‑effective testing pathways for scaling‑up HCV testing in Georgia. We developed a Markov‑based model with a lifetime horizon that simulates the natural history of HCV, and the cost of detection and treatment of HCV. We then created an interactive online tool that uses results from the Markov‑based model to evaluate the cost‑effectiveness of different HCV testing pathways. We compared the current standard‑of‑care (SoC) testing pathway and four innovative testing pathways for Georgia. The SoC testing was cost‑saving compared to no testing, but all four new HCV testing pathways further increased QALYs and decreased costs. The pathway with the highest patient follow‑up, due to on‑site testing, resulted in the highest discounted QALYs (123 QALY more than the SoC) and lowest costs ($127,052 less than the SoC) per 10,000 persons screened. The current testing algorithm in Georgia can be replaced with a new pathway that is more effective while being cost‑saving.
Chronic hepatitis C virus (HCV) infection is a global health problem that affects about 71 million people worldwide1. Of these, only 19% knew their infection status in 20171. In many countries, HCV-related disease burden and deaths have been steadily increasing, despite recent advances in HCV treatment1. The highly effective direct-acting antivirals (DAAs) that became available from 2015 onwards can achieve high rates of sustained virologic response (SVR), a surrogate for cure2. However, a huge majority—more than 80%—of HCV patients remain undiagnosed and therefore are unable to avail the benefits of improved survival and quality of life pro-vided by DAAs1.
The World Health Organization (WHO) recently launched a global strategy for elimination of HCV as a public health threat by the year 2030. This strategy aims to reduce HCV incidence by 80% and HCV-related mortality by 65%3. To reach this goal, the WHO estimates that by 2030 at least 90% of people with HCV need to be diagnosed, with a treatment rate of at least 80% among all treatment-eligible people with HCV3.
However, most countries do not have an HCV elimination strategy. In particular, for low- and middle-income countries (LMIC), which have limited resources but high HCV prevalence rates4, it is important to develop a cost-effective HCV elimination strategy. Given that the price of DAAs is low in most LMICs, the cost of testing can be a substantial contributor to the cost of HCV elimination5.
Georgia, a LMIC country, has a high HCV disease burden with prevalence of 5.4% in adults6,7, and has launched a national program to eliminate HCV. The Georgian health care system is largely private, but the national HCV elimination program formed a partnership between private and public institutions with a cost sharing model—with treatment provided for free through a donation from Gilead8. However, a recent study concluded that to achieve the goal of eliminating HCV as a public health threat in Georgia, innovative, simple, and cost-effective strategies are needed to scale-up HCV testing9,10. To help address this issue, the Foundation for Innovative Diagnostics (FIND) has proposed new testing pathways for HCV in Georgia.
OPEN
1Massachusetts General Hospital, Boston, MA, USA. 2Harvard Medical School, Boston, MA, USA. 3College of Business, Mississippi State University, Mississippi State, MS, USA. 4Jawaharlal Institute of Postgraduate Medical Education and Research, Puducherry, India. 5Foundation for Innovative New Diagnostics, Geneva, Switzerland. 6These authors contributed equally: Madeline Adee and Yueran Zhuo. 7These authors jointly supervised this work: Sonjelle Shilton and Jagpreet Chhatwal. *email: [email protected]
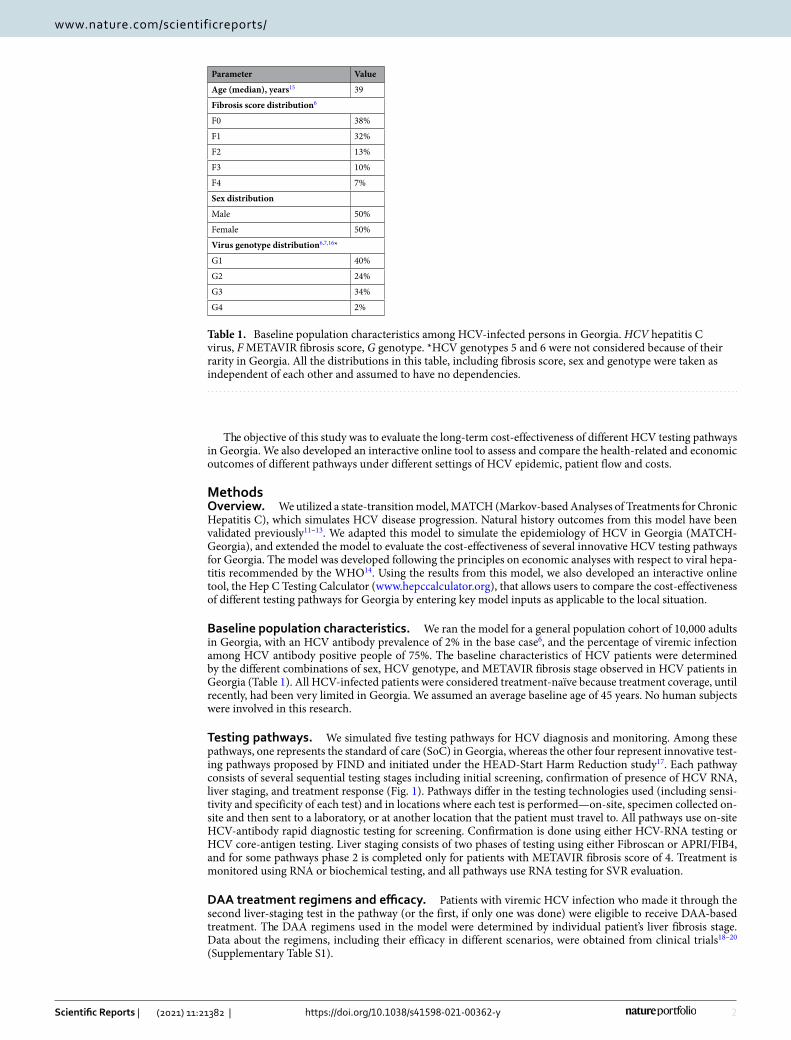
2
Vol:.(1234567890)
Scientific Reports | (2021) 11:21382 | https://doi.org/10.1038/s41598-021-00362-y
www.nature.com/scientificreports/
The objective of this study was to evaluate the long-term cost-effectiveness of different HCV testing pathways in Georgia. We also developed an interactive online tool to assess and compare the health-related and economic outcomes of different pathways under different settings of HCV epidemic, patient flow and costs.
MethodsOverview. We utilized a state-transition model, MATCH (Markov-based Analyses of Treatments for Chronic Hepatitis C), which simulates HCV disease progression. Natural history outcomes from this model have been validated previously11–13. We adapted this model to simulate the epidemiology of HCV in Georgia (MATCH-Georgia), and extended the model to evaluate the cost-effectiveness of several innovative HCV testing pathways for Georgia. The model was developed following the principles on economic analyses with respect to viral hepa-titis recommended by the WHO14. Using the results from this model, we also developed an interactive online tool, the Hep C Testing Calculator (www. hepcc alcul ator. org), that allows users to compare the cost-effectiveness of different testing pathways for Georgia by entering key model inputs as applicable to the local situation.
Baseline population characteristics. We ran the model for a general population cohort of 10,000 adults in Georgia, with an HCV antibody prevalence of 2% in the base case6, and the percentage of viremic infection among HCV antibody positive people of 75%. The baseline characteristics of HCV patients were determined by the different combinations of sex, HCV genotype, and METAVIR fibrosis stage observed in HCV patients in Georgia (Table 1). All HCV-infected patients were considered treatment-naïve because treatment coverage, until recently, had been very limited in Georgia. We assumed an average baseline age of 45 years. No human subjects were involved in this research.
Testing pathways. We simulated five testing pathways for HCV diagnosis and monitoring. Among these pathways, one represents the standard of care (SoC) in Georgia, whereas the other four represent innovative test-ing pathways proposed by FIND and initiated under the HEAD-Start Harm Reduction study17. Each pathway consists of several sequential testing stages including initial screening, confirmation of presence of HCV RNA, liver staging, and treatment response (Fig. 1). Pathways differ in the testing technologies used (including sensi-tivity and specificity of each test) and in locations where each test is performed—on-site, specimen collected on-site and then sent to a laboratory, or at another location that the patient must travel to. All pathways use on-site HCV-antibody rapid diagnostic testing for screening. Confirmation is done using either HCV-RNA testing or HCV core-antigen testing. Liver staging consists of two phases of testing using either Fibroscan or APRI/FIB4, and for some pathways phase 2 is completed only for patients with METAVIR fibrosis score of 4. Treatment is monitored using RNA or biochemical testing, and all pathways use RNA testing for SVR evaluation.
DAA treatment regimens and efficacy. Patients with viremic HCV infection who made it through the second liver-staging test in the pathway (or the first, if only one was done) were eligible to receive DAA-based treatment. The DAA regimens used in the model were determined by individual patient’s liver fibrosis stage. Data about the regimens, including their efficacy in different scenarios, were obtained from clinical trials18–20 (Supplementary Table S1).
Table 1. Baseline population characteristics among HCV-infected persons in Georgia. HCV hepatitis C virus, F METAVIR fibrosis score, G genotype. *HCV genotypes 5 and 6 were not considered because of their rarity in Georgia. All the distributions in this table, including fibrosis score, sex and genotype were taken as independent of each other and assumed to have no dependencies.
Parameter Value
Age (median), years15 39
Fibrosis score distribution6
F0 38%
F1 32%
F2 13%
F3 10%
F4 7%
Sex distribution
Male 50%
Female 50%
Virus genotype distribution6,7,16*
G1 40%
G2 24%
G3 34%
G4 2%
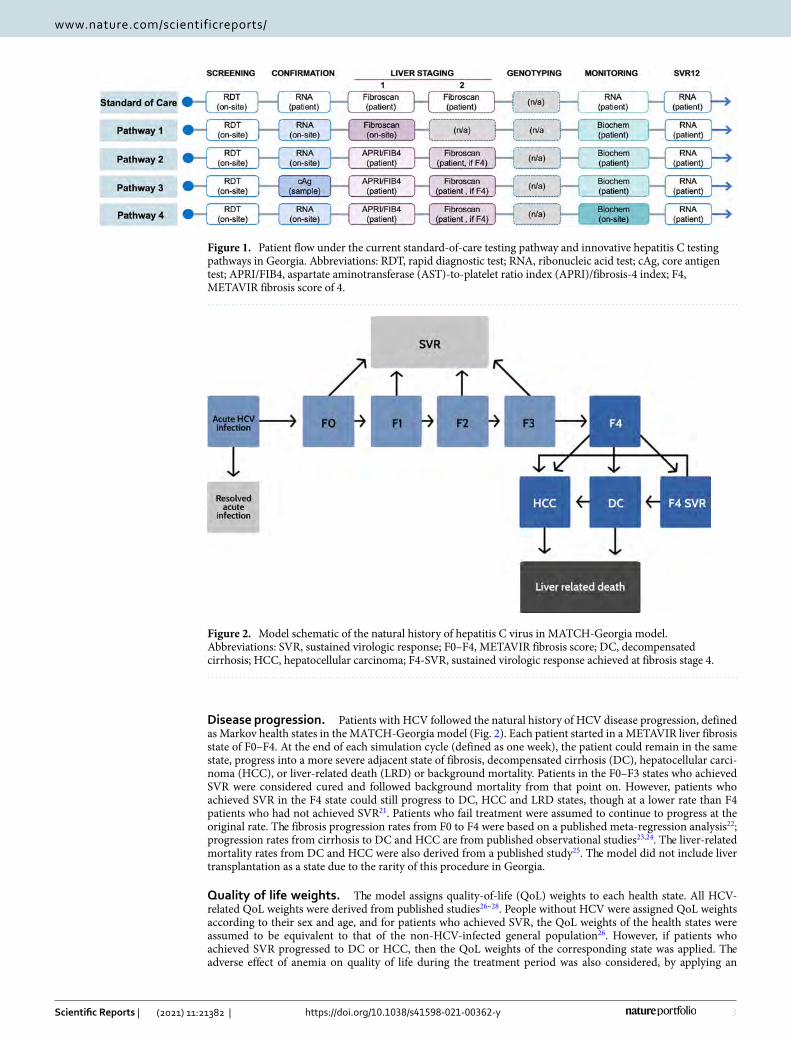
3
Vol.:(0123456789)
Scientific Reports | (2021) 11:21382 | https://doi.org/10.1038/s41598-021-00362-y
www.nature.com/scientificreports/
Disease progression. Patients with HCV followed the natural history of HCV disease progression, defined as Markov health states in the MATCH-Georgia model (Fig. 2). Each patient started in a METAVIR liver fibrosis state of F0–F4. At the end of each simulation cycle (defined as one week), the patient could remain in the same state, progress into a more severe adjacent state of fibrosis, decompensated cirrhosis (DC), hepatocellular carci-noma (HCC), or liver-related death (LRD) or background mortality. Patients in the F0–F3 states who achieved SVR were considered cured and followed background mortality from that point on. However, patients who achieved SVR in the F4 state could still progress to DC, HCC and LRD states, though at a lower rate than F4 patients who had not achieved SVR21. Patients who fail treatment were assumed to continue to progress at the original rate. The fibrosis progression rates from F0 to F4 were based on a published meta-regression analysis22; progression rates from cirrhosis to DC and HCC are from published observational studies23,24. The liver-related mortality rates from DC and HCC were also derived from a published study25. The model did not include liver transplantation as a state due to the rarity of this procedure in Georgia.
Quality of life weights. The model assigns quality-of-life (QoL) weights to each health state. All HCV-related QoL weights were derived from published studies26–28. People without HCV were assigned QoL weights according to their sex and age, and for patients who achieved SVR, the QoL weights of the health states were assumed to be equivalent to that of the non-HCV-infected general population26. However, if patients who achieved SVR progressed to DC or HCC, then the QoL weights of the corresponding state was applied. The adverse effect of anemia on quality of life during the treatment period was also considered, by applying an
Figure 1. Patient flow under the current standard-of-care testing pathway and innovative hepatitis C testing pathways in Georgia. Abbreviations: RDT, rapid diagnostic test; RNA, ribonucleic acid test; cAg, core antigen test; APRI/FIB4, aspartate aminotransferase (AST)-to-platelet ratio index (APRI)/fibrosis-4 index; F4, METAVIR fibrosis score of 4.
Figure 2. Model schematic of the natural history of hepatitis C virus in MATCH-Georgia model. Abbreviations: SVR, sustained virologic response; F0–F4, METAVIR fibrosis score; DC, decompensated cirrhosis; HCC, hepatocellular carcinoma; F4-SVR, sustained virologic response achieved at fibrosis stage 4.
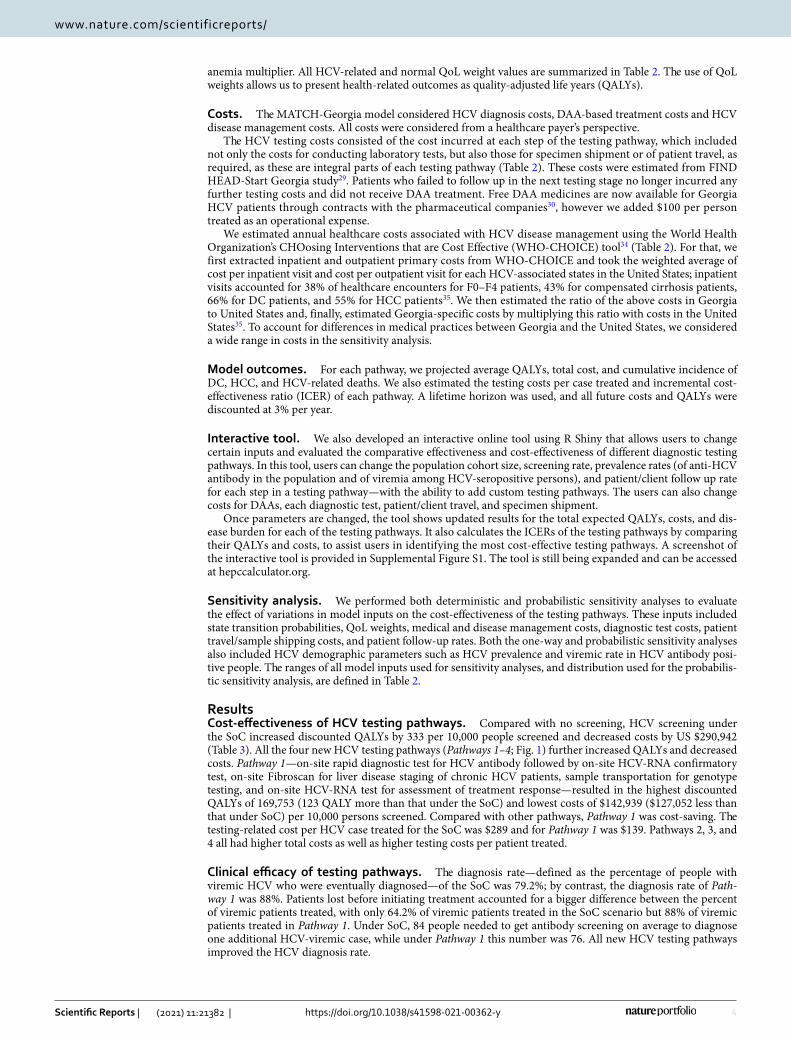
4
Vol:.(1234567890)
Scientific Reports | (2021) 11:21382 | https://doi.org/10.1038/s41598-021-00362-y
www.nature.com/scientificreports/
anemia multiplier. All HCV-related and normal QoL weight values are summarized in Table 2. The use of QoL weights allows us to present health-related outcomes as quality-adjusted life years (QALYs).
Costs. The MATCH-Georgia model considered HCV diagnosis costs, DAA-based treatment costs and HCV disease management costs. All costs were considered from a healthcare payer’s perspective.
The HCV testing costs consisted of the cost incurred at each step of the testing pathway, which included not only the costs for conducting laboratory tests, but also those for specimen shipment or of patient travel, as required, as these are integral parts of each testing pathway (Table 2). These costs were estimated from FIND HEAD-Start Georgia study29. Patients who failed to follow up in the next testing stage no longer incurred any further testing costs and did not receive DAA treatment. Free DAA medicines are now available for Georgia HCV patients through contracts with the pharmaceutical companies30, however we added $100 per person treated as an operational expense.
We estimated annual healthcare costs associated with HCV disease management using the World Health Organization’s CHOosing Interventions that are Cost Effective (WHO-CHOICE) tool34 (Table 2). For that, we first extracted inpatient and outpatient primary costs from WHO-CHOICE and took the weighted average of cost per inpatient visit and cost per outpatient visit for each HCV-associated states in the United States; inpatient visits accounted for 38% of healthcare encounters for F0–F4 patients, 43% for compensated cirrhosis patients, 66% for DC patients, and 55% for HCC patients35. We then estimated the ratio of the above costs in Georgia to United States and, finally, estimated Georgia-specific costs by multiplying this ratio with costs in the United States35. To account for differences in medical practices between Georgia and the United States, we considered a wide range in costs in the sensitivity analysis.
Model outcomes. For each pathway, we projected average QALYs, total cost, and cumulative incidence of DC, HCC, and HCV-related deaths. We also estimated the testing costs per case treated and incremental cost-effectiveness ratio (ICER) of each pathway. A lifetime horizon was used, and all future costs and QALYs were discounted at 3% per year.
Interactive tool. We also developed an interactive online tool using R Shiny that allows users to change certain inputs and evaluated the comparative effectiveness and cost-effectiveness of different diagnostic testing pathways. In this tool, users can change the population cohort size, screening rate, prevalence rates (of anti-HCV antibody in the population and of viremia among HCV-seropositive persons), and patient/client follow up rate for each step in a testing pathway—with the ability to add custom testing pathways. The users can also change costs for DAAs, each diagnostic test, patient/client travel, and specimen shipment.
Once parameters are changed, the tool shows updated results for the total expected QALYs, costs, and dis-ease burden for each of the testing pathways. It also calculates the ICERs of the testing pathways by comparing their QALYs and costs, to assist users in identifying the most cost-effective testing pathways. A screenshot of the interactive tool is provided in Supplemental Figure S1. The tool is still being expanded and can be accessed at hepccalculator.org.
Sensitivity analysis. We performed both deterministic and probabilistic sensitivity analyses to evaluate the effect of variations in model inputs on the cost-effectiveness of the testing pathways. These inputs included state transition probabilities, QoL weights, medical and disease management costs, diagnostic test costs, patient travel/sample shipping costs, and patient follow-up rates. Both the one-way and probabilistic sensitivity analyses also included HCV demographic parameters such as HCV prevalence and viremic rate in HCV antibody posi-tive people. The ranges of all model inputs used for sensitivity analyses, and distribution used for the probabilis-tic sensitivity analysis, are defined in Table 2.
ResultsCost‑effectiveness of HCV testing pathways. Compared with no screening, HCV screening under the SoC increased discounted QALYs by 333 per 10,000 people screened and decreased costs by US $290,942 (Table 3). All the four new HCV testing pathways (Pathways 1–4; Fig. 1) further increased QALYs and decreased costs. Pathway 1—on-site rapid diagnostic test for HCV antibody followed by on-site HCV-RNA confirmatory test, on-site Fibroscan for liver disease staging of chronic HCV patients, sample transportation for genotype testing, and on-site HCV-RNA test for assessment of treatment response—resulted in the highest discounted QALYs of 169,753 (123 QALY more than that under the SoC) and lowest costs of $142,939 ($127,052 less than that under SoC) per 10,000 persons screened. Compared with other pathways, Pathway 1 was cost-saving. The testing-related cost per HCV case treated for the SoC was $289 and for Pathway 1 was $139. Pathways 2, 3, and 4 all had higher total costs as well as higher testing costs per patient treated.
Clinical efficacy of testing pathways. The diagnosis rate—defined as the percentage of people with viremic HCV who were eventually diagnosed—of the SoC was 79.2%; by contrast, the diagnosis rate of Path-way 1 was 88%. Patients lost before initiating treatment accounted for a bigger difference between the percent of viremic patients treated, with only 64.2% of viremic patients treated in the SoC scenario but 88% of viremic patients treated in Pathway 1. Under SoC, 84 people needed to get antibody screening on average to diagnose one additional HCV-viremic case, while under Pathway 1 this number was 76. All new HCV testing pathways improved the HCV diagnosis rate.
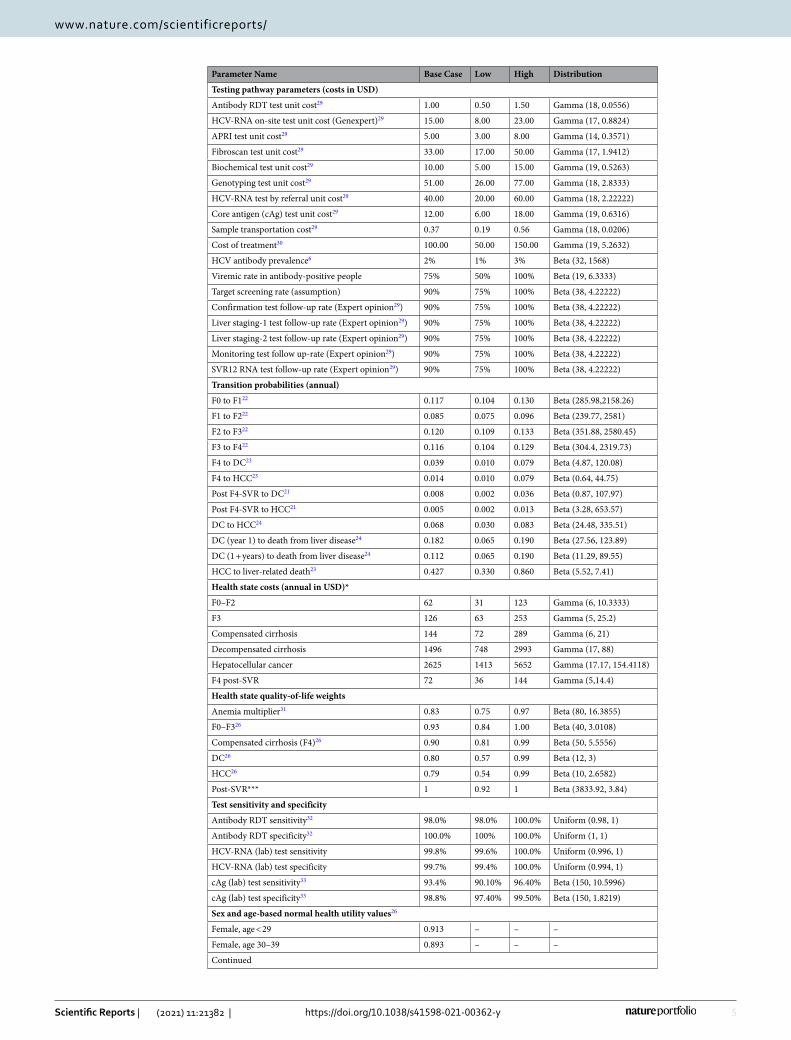
5
Vol.:(0123456789)
Scientific Reports | (2021) 11:21382 | https://doi.org/10.1038/s41598-021-00362-y
www.nature.com/scientificreports/
Parameter Name Base Case Low High Distribution
Testing pathway parameters (costs in USD)
Antibody RDT test unit cost29 1.00 0.50 1.50 Gamma (18, 0.0556)
HCV-RNA on-site test unit cost (Genexpert)29 15.00 8.00 23.00 Gamma (17, 0.8824)
APRI test unit cost29 5.00 3.00 8.00 Gamma (14, 0.3571)
Fibroscan test unit cost29 33.00 17.00 50.00 Gamma (17, 1.9412)
Biochemical test unit cost29 10.00 5.00 15.00 Gamma (19, 0.5263)
Genotyping test unit cost29 51.00 26.00 77.00 Gamma (18, 2.8333)
HCV-RNA test by referral unit cost29 40.00 20.00 60.00 Gamma (18, 2.22222)
Core antigen (cAg) test unit cost29 12.00 6.00 18.00 Gamma (19, 0.6316)
Sample transportation cost29 0.37 0.19 0.56 Gamma (18, 0.0206)
Cost of treatment30 100.00 50.00 150.00 Gamma (19, 5.2632)
HCV antibody prevalence6 2% 1% 3% Beta (32, 1568)
Viremic rate in antibody-positive people 75% 50% 100% Beta (19, 6.3333)
Target screening rate (assumption) 90% 75% 100% Beta (38, 4.22222)
Confirmation test follow-up rate (Expert opinion29) 90% 75% 100% Beta (38, 4.22222)
Liver staging-1 test follow-up rate (Expert opinion29) 90% 75% 100% Beta (38, 4.22222)
Liver staging-2 test follow-up rate (Expert opinion29) 90% 75% 100% Beta (38, 4.22222)
Monitoring test follow up-rate (Expert opinion29) 90% 75% 100% Beta (38, 4.22222)
SVR12 RNA test follow-up rate (Expert opinion29) 90% 75% 100% Beta (38, 4.22222)
Transition probabilities (annual)
F0 to F122 0.117 0.104 0.130 Beta (285.98,2158.26)
F1 to F222 0.085 0.075 0.096 Beta (239.77, 2581)
F2 to F322 0.120 0.109 0.133 Beta (351.88, 2580.45)
F3 to F422 0.116 0.104 0.129 Beta (304.4, 2319.73)
F4 to DC23 0.039 0.010 0.079 Beta (4.87, 120.08)
F4 to HCC23 0.014 0.010 0.079 Beta (0.64, 44.75)
Post F4-SVR to DC21 0.008 0.002 0.036 Beta (0.87, 107.97)
Post F4-SVR to HCC21 0.005 0.002 0.013 Beta (3.28, 653.57)
DC to HCC24 0.068 0.030 0.083 Beta (24.48, 335.51)
DC (year 1) to death from liver disease24 0.182 0.065 0.190 Beta (27.56, 123.89)
DC (1 + years) to death from liver disease24 0.112 0.065 0.190 Beta (11.29, 89.55)
HCC to liver-related death23 0.427 0.330 0.860 Beta (5.52, 7.41)
Health state costs (annual in USD)*
F0–F2 62 31 123 Gamma (6, 10.3333)
F3 126 63 253 Gamma (5, 25.2)
Compensated cirrhosis 144 72 289 Gamma (6, 21)
Decompensated cirrhosis 1496 748 2993 Gamma (17, 88)
Hepatocellular cancer 2625 1413 5652 Gamma (17.17, 154.4118)
F4 post-SVR 72 36 144 Gamma (5,14.4)
Health state quality-of-life weights
Anemia multiplier31 0.83 0.75 0.97 Beta (80, 16.3855)
F0–F326 0.93 0.84 1.00 Beta (40, 3.0108)
Compensated cirrhosis (F4)26 0.90 0.81 0.99 Beta (50, 5.5556)
DC26 0.80 0.57 0.99 Beta (12, 3)
HCC26 0.79 0.54 0.99 Beta (10, 2.6582)
Post-SVR*** 1 0.92 1 Beta (3833.92, 3.84)
Test sensitivity and specificity
Antibody RDT sensitivity32 98.0% 98.0% 100.0% Uniform (0.98, 1)
Antibody RDT specificity32 100.0% 100% 100.0% Uniform (1, 1)
HCV-RNA (lab) test sensitivity 99.8% 99.6% 100.0% Uniform (0.996, 1)
HCV-RNA (lab) test specificity 99.7% 99.4% 100.0% Uniform (0.994, 1)
cAg (lab) test sensitivity33 93.4% 90.10% 96.40% Beta (150, 10.5996)
cAg (lab) test specificity33 98.8% 97.40% 99.50% Beta (150, 1.8219)
Sex and age-based normal health utility values26
Female, age < 29 0.913 – – –
Female, age 30–39 0.893 – – –
Continued
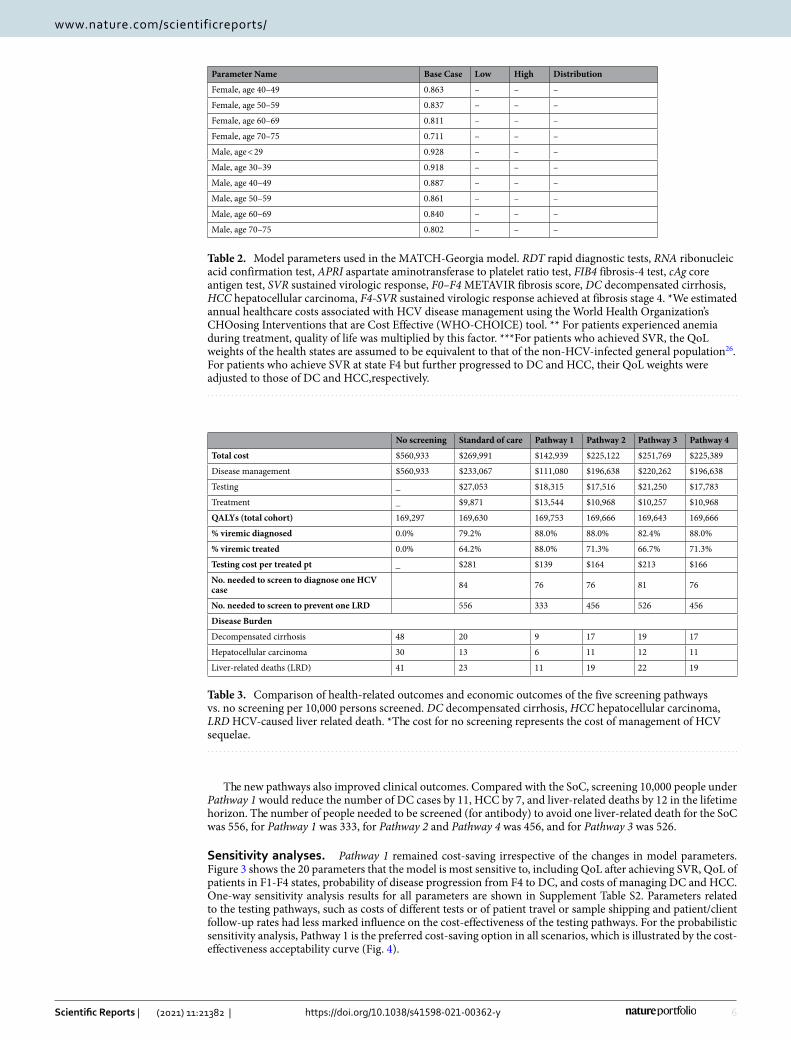
6
Vol:.(1234567890)
Scientific Reports | (2021) 11:21382 | https://doi.org/10.1038/s41598-021-00362-y
www.nature.com/scientificreports/
The new pathways also improved clinical outcomes. Compared with the SoC, screening 10,000 people under Pathway 1 would reduce the number of DC cases by 11, HCC by 7, and liver-related deaths by 12 in the lifetime horizon. The number of people needed to be screened (for antibody) to avoid one liver-related death for the SoC was 556, for Pathway 1 was 333, for Pathway 2 and Pathway 4 was 456, and for Pathway 3 was 526.
Sensitivity analyses. Pathway 1 remained cost-saving irrespective of the changes in model parameters. Figure 3 shows the 20 parameters that the model is most sensitive to, including QoL after achieving SVR, QoL of patients in F1-F4 states, probability of disease progression from F4 to DC, and costs of managing DC and HCC. One-way sensitivity analysis results for all parameters are shown in Supplement Table S2. Parameters related to the testing pathways, such as costs of different tests or of patient travel or sample shipping and patient/client follow-up rates had less marked influence on the cost-effectiveness of the testing pathways. For the probabilistic sensitivity analysis, Pathway 1 is the preferred cost-saving option in all scenarios, which is illustrated by the cost-effectiveness acceptability curve (Fig. 4).
Table 2. Model parameters used in the MATCH-Georgia model. RDT rapid diagnostic tests, RNA ribonucleic acid confirmation test, APRI aspartate aminotransferase to platelet ratio test, FIB4 fibrosis-4 test, cAg core antigen test, SVR sustained virologic response, F0–F4 METAVIR fibrosis score, DC decompensated cirrhosis, HCC hepatocellular carcinoma, F4-SVR sustained virologic response achieved at fibrosis stage 4. *We estimated annual healthcare costs associated with HCV disease management using the World Health Organization’s CHOosing Interventions that are Cost Effective (WHO-CHOICE) tool. ** For patients experienced anemia during treatment, quality of life was multiplied by this factor. ***For patients who achieved SVR, the QoL weights of the health states are assumed to be equivalent to that of the non-HCV-infected general population26. For patients who achieve SVR at state F4 but further progressed to DC and HCC, their QoL weights were adjusted to those of DC and HCC,respectively.
Parameter Name Base Case Low High Distribution
Female, age 40–49 0.863 – – –
Female, age 50–59 0.837 – – –
Female, age 60–69 0.811 – – –
Female, age 70–75 0.711 – – –
Male, age < 29 0.928 – – –
Male, age 30–39 0.918 – – –
Male, age 40–49 0.887 – – –
Male, age 50–59 0.861 – – –
Male, age 60–69 0.840 – – –
Male, age 70–75 0.802 – – –
Table 3. Comparison of health-related outcomes and economic outcomes of the five screening pathways vs. no screening per 10,000 persons screened. DC decompensated cirrhosis, HCC hepatocellular carcinoma, LRD HCV-caused liver related death. *The cost for no screening represents the cost of management of HCV sequelae.
No screening Standard of care Pathway 1 Pathway 2 Pathway 3 Pathway 4
Total cost $560,933 $269,991 $142,939 $225,122 $251,769 $225,389
Disease management $560,933 $233,067 $111,080 $196,638 $220,262 $196,638
Testing _ $27,053 $18,315 $17,516 $21,250 $17,783
Treatment _ $9,871 $13,544 $10,968 $10,257 $10,968
QALYs (total cohort) 169,297 169,630 169,753 169,666 169,643 169,666
% viremic diagnosed 0.0% 79.2% 88.0% 88.0% 82.4% 88.0%
% viremic treated 0.0% 64.2% 88.0% 71.3% 66.7% 71.3%
Testing cost per treated pt _ $281 $139 $164 $213 $166
No. needed to screen to diagnose one HCV case 84 76 76 81 76
No. needed to screen to prevent one LRD 556 333 456 526 456
Disease Burden
Decompensated cirrhosis 48 20 9 17 19 17
Hepatocellular carcinoma 30 13 6 11 12 11
Liver-related deaths (LRD) 41 23 11 19 22 19
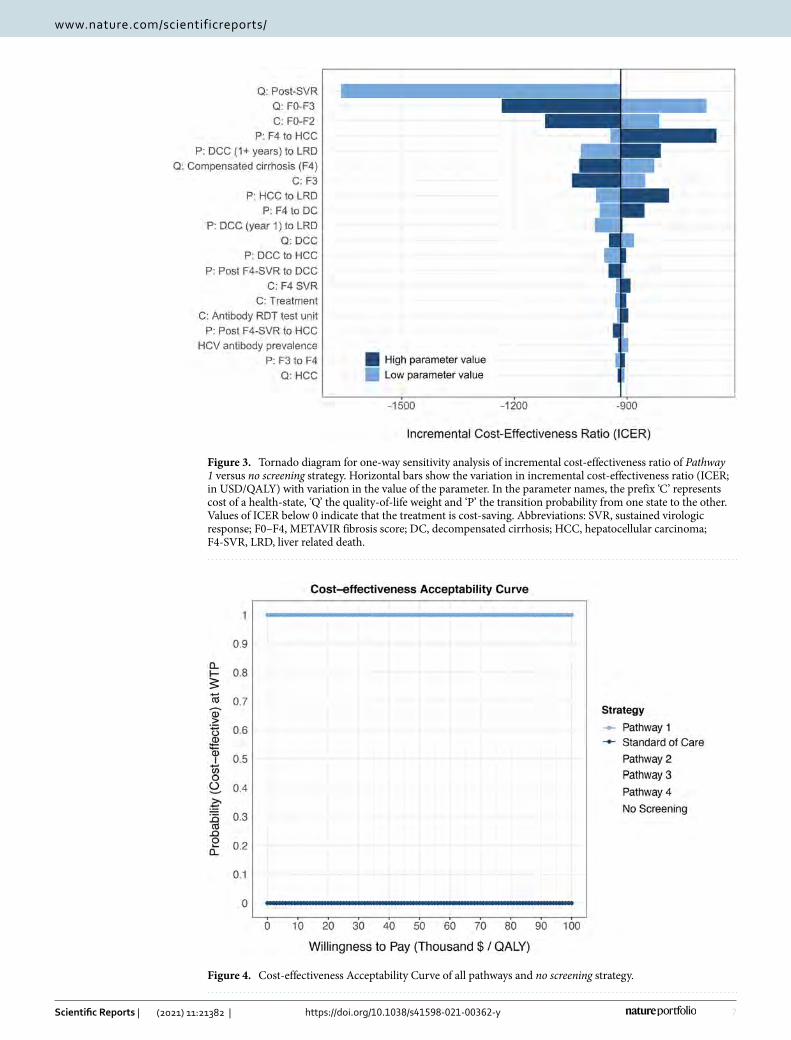
7
Vol.:(0123456789)
Scientific Reports | (2021) 11:21382 | https://doi.org/10.1038/s41598-021-00362-y
www.nature.com/scientificreports/
Figure 3. Tornado diagram for one-way sensitivity analysis of incremental cost-effectiveness ratio of Pathway 1 versus no screening strategy. Horizontal bars show the variation in incremental cost-effectiveness ratio (ICER; in USD/QALY) with variation in the value of the parameter. In the parameter names, the prefix ‘C’ represents cost of a health-state, ‘Q’ the quality-of-life weight and ‘P’ the transition probability from one state to the other. Values of ICER below 0 indicate that the treatment is cost-saving. Abbreviations: SVR, sustained virologic response; F0–F4, METAVIR fibrosis score; DC, decompensated cirrhosis; HCC, hepatocellular carcinoma; F4-SVR, LRD, liver related death.
Figure 4. Cost-effectiveness Acceptability Curve of all pathways and no screening strategy.
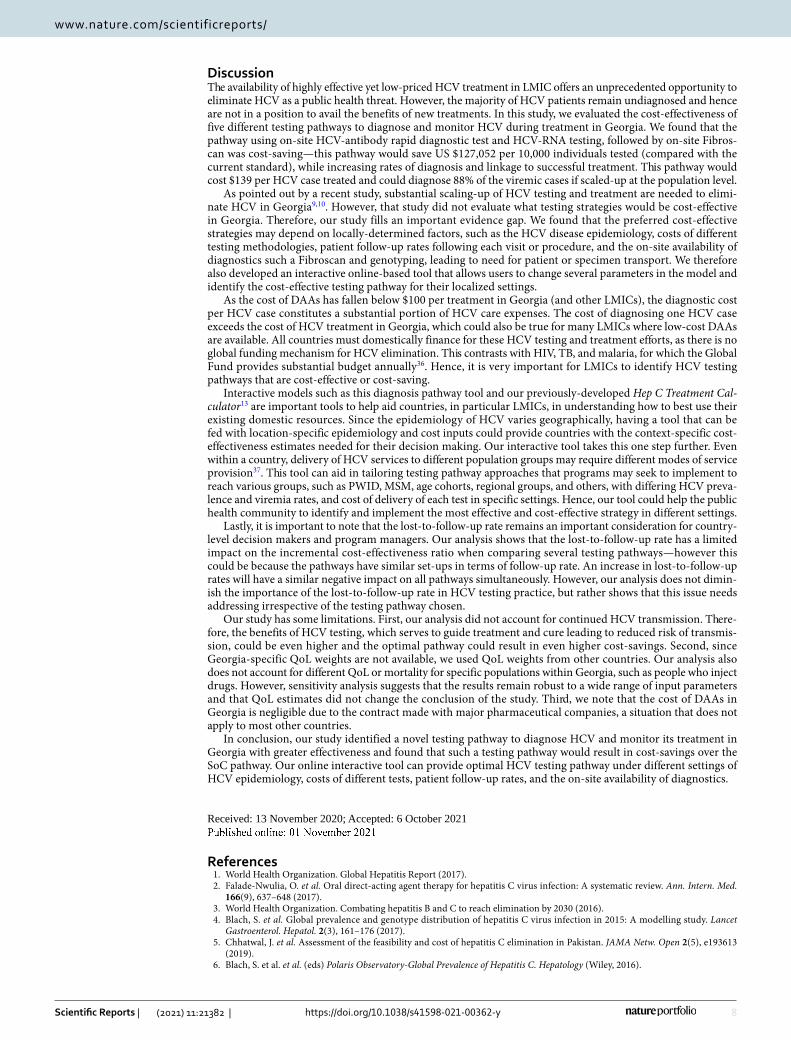
8
Vol:.(1234567890)
Scientific Reports | (2021) 11:21382 | https://doi.org/10.1038/s41598-021-00362-y
www.nature.com/scientificreports/
DiscussionThe availability of highly effective yet low-priced HCV treatment in LMIC offers an unprecedented opportunity to eliminate HCV as a public health threat. However, the majority of HCV patients remain undiagnosed and hence are not in a position to avail the benefits of new treatments. In this study, we evaluated the cost-effectiveness of five different testing pathways to diagnose and monitor HCV during treatment in Georgia. We found that the pathway using on-site HCV-antibody rapid diagnostic test and HCV-RNA testing, followed by on-site Fibros-can was cost-saving—this pathway would save US $127,052 per 10,000 individuals tested (compared with the current standard), while increasing rates of diagnosis and linkage to successful treatment. This pathway would cost $139 per HCV case treated and could diagnose 88% of the viremic cases if scaled-up at the population level.
As pointed out by a recent study, substantial scaling-up of HCV testing and treatment are needed to elimi-nate HCV in Georgia9,10. However, that study did not evaluate what testing strategies would be cost-effective in Georgia. Therefore, our study fills an important evidence gap. We found that the preferred cost-effective strategies may depend on locally-determined factors, such as the HCV disease epidemiology, costs of different testing methodologies, patient follow-up rates following each visit or procedure, and the on-site availability of diagnostics such a Fibroscan and genotyping, leading to need for patient or specimen transport. We therefore also developed an interactive online-based tool that allows users to change several parameters in the model and identify the cost-effective testing pathway for their localized settings.
As the cost of DAAs has fallen below $100 per treatment in Georgia (and other LMICs), the diagnostic cost per HCV case constitutes a substantial portion of HCV care expenses. The cost of diagnosing one HCV case exceeds the cost of HCV treatment in Georgia, which could also be true for many LMICs where low-cost DAAs are available. All countries must domestically finance for these HCV testing and treatment efforts, as there is no global funding mechanism for HCV elimination. This contrasts with HIV, TB, and malaria, for which the Global Fund provides substantial budget annually36. Hence, it is very important for LMICs to identify HCV testing pathways that are cost-effective or cost-saving.
Interactive models such as this diagnosis pathway tool and our previously-developed Hep C Treatment Cal-culator13 are important tools to help aid countries, in particular LMICs, in understanding how to best use their existing domestic resources. Since the epidemiology of HCV varies geographically, having a tool that can be fed with location-specific epidemiology and cost inputs could provide countries with the context-specific cost-effectiveness estimates needed for their decision making. Our interactive tool takes this one step further. Even within a country, delivery of HCV services to different population groups may require different modes of service provision37. This tool can aid in tailoring testing pathway approaches that programs may seek to implement to reach various groups, such as PWID, MSM, age cohorts, regional groups, and others, with differing HCV preva-lence and viremia rates, and cost of delivery of each test in specific settings. Hence, our tool could help the public health community to identify and implement the most effective and cost-effective strategy in different settings.
Lastly, it is important to note that the lost-to-follow-up rate remains an important consideration for country-level decision makers and program managers. Our analysis shows that the lost-to-follow-up rate has a limited impact on the incremental cost-effectiveness ratio when comparing several testing pathways—however this could be because the pathways have similar set-ups in terms of follow-up rate. An increase in lost-to-follow-up rates will have a similar negative impact on all pathways simultaneously. However, our analysis does not dimin-ish the importance of the lost-to-follow-up rate in HCV testing practice, but rather shows that this issue needs addressing irrespective of the testing pathway chosen.
Our study has some limitations. First, our analysis did not account for continued HCV transmission. There-fore, the benefits of HCV testing, which serves to guide treatment and cure leading to reduced risk of transmis-sion, could be even higher and the optimal pathway could result in even higher cost-savings. Second, since Georgia-specific QoL weights are not available, we used QoL weights from other countries. Our analysis also does not account for different QoL or mortality for specific populations within Georgia, such as people who inject drugs. However, sensitivity analysis suggests that the results remain robust to a wide range of input parameters and that QoL estimates did not change the conclusion of the study. Third, we note that the cost of DAAs in Georgia is negligible due to the contract made with major pharmaceutical companies, a situation that does not apply to most other countries.
In conclusion, our study identified a novel testing pathway to diagnose HCV and monitor its treatment in Georgia with greater effectiveness and found that such a testing pathway would result in cost-savings over the SoC pathway. Our online interactive tool can provide optimal HCV testing pathway under different settings of HCV epidemiology, costs of different tests, patient follow-up rates, and the on-site availability of diagnostics.
Received: 13 November 2020; Accepted: 6 October 2021
References 1. World Health Organization. Global Hepatitis Report (2017). 2. Falade-Nwulia, O. et al. Oral direct-acting agent therapy for hepatitis C virus infection: A systematic review. Ann. Intern. Med.
166(9), 637–648 (2017). 3. World Health Organization. Combating hepatitis B and C to reach elimination by 2030 (2016). 4. Blach, S. et al. Global prevalence and genotype distribution of hepatitis C virus infection in 2015: A modelling study. Lancet
Gastroenterol. Hepatol. 2(3), 161–176 (2017). 5. Chhatwal, J. et al. Assessment of the feasibility and cost of hepatitis C elimination in Pakistan. JAMA Netw. Open 2(5), e193613
(2019). 6. Blach, S. et al. et al. (eds) Polaris Observatory-Global Prevalence of Hepatitis C. Hepatology (Wiley, 2016).
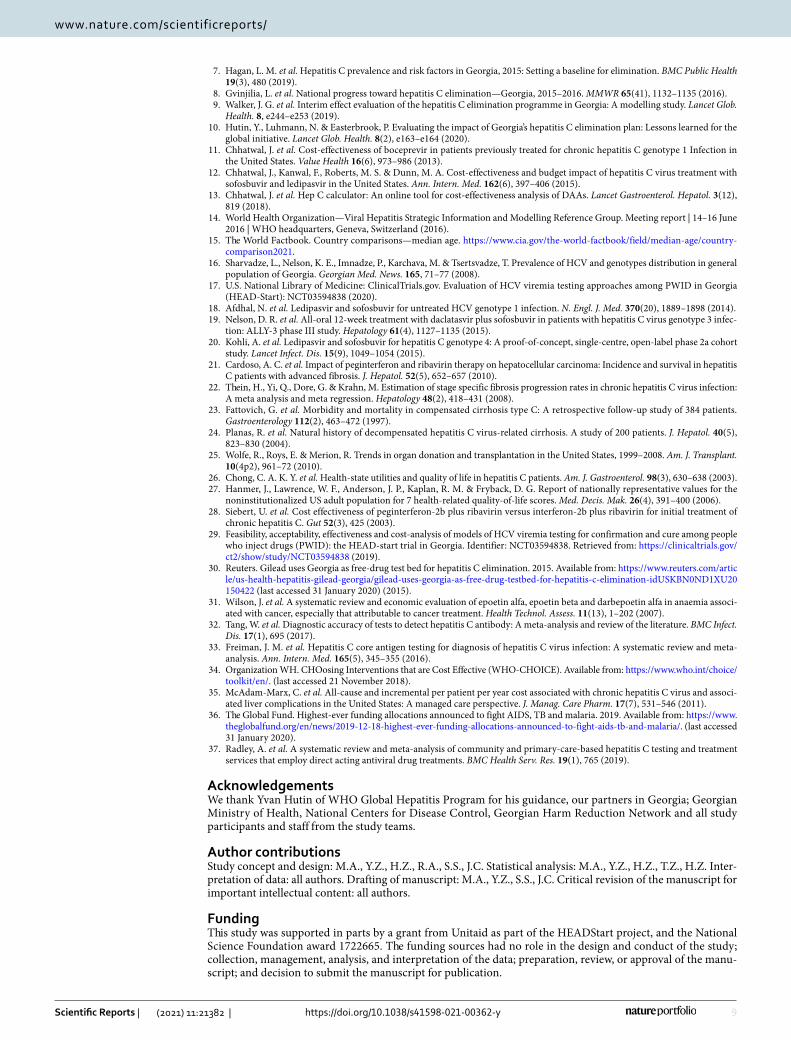
9
Vol.:(0123456789)
Scientific Reports | (2021) 11:21382 | https://doi.org/10.1038/s41598-021-00362-y
www.nature.com/scientificreports/
7. Hagan, L. M. et al. Hepatitis C prevalence and risk factors in Georgia, 2015: Setting a baseline for elimination. BMC Public Health 19(3), 480 (2019).
8. Gvinjilia, L. et al. National progress toward hepatitis C elimination—Georgia, 2015–2016. MMWR 65(41), 1132–1135 (2016). 9. Walker, J. G. et al. Interim effect evaluation of the hepatitis C elimination programme in Georgia: A modelling study. Lancet Glob.
Health. 8, e244–e253 (2019). 10. Hutin, Y., Luhmann, N. & Easterbrook, P. Evaluating the impact of Georgia’s hepatitis C elimination plan: Lessons learned for the
global initiative. Lancet Glob. Health. 8(2), e163–e164 (2020). 11. Chhatwal, J. et al. Cost-effectiveness of boceprevir in patients previously treated for chronic hepatitis C genotype 1 Infection in
the United States. Value Health 16(6), 973–986 (2013). 12. Chhatwal, J., Kanwal, F., Roberts, M. S. & Dunn, M. A. Cost-effectiveness and budget impact of hepatitis C virus treatment with
sofosbuvir and ledipasvir in the United States. Ann. Intern. Med. 162(6), 397–406 (2015). 13. Chhatwal, J. et al. Hep C calculator: An online tool for cost-effectiveness analysis of DAAs. Lancet Gastroenterol. Hepatol. 3(12),
819 (2018). 14. World Health Organization—Viral Hepatitis Strategic Information and Modelling Reference Group. Meeting report | 14–16 June
2016 | WHO headquarters, Geneva, Switzerland (2016). 15. The World Factbook. Country comparisons—median age. https:// www. cia. gov/ the- world- factb ook/ field/ median- age/ count ry-
compa rison 2021. 16. Sharvadze, L., Nelson, K. E., Imnadze, P., Karchava, M. & Tsertsvadze, T. Prevalence of HCV and genotypes distribution in general
population of Georgia. Georgian Med. News. 165, 71–77 (2008). 17. U.S. National Library of Medicine: ClinicalTrials.gov. Evaluation of HCV viremia testing approaches among PWID in Georgia
(HEAD-Start): NCT03594838 (2020). 18. Afdhal, N. et al. Ledipasvir and sofosbuvir for untreated HCV genotype 1 infection. N. Engl. J. Med. 370(20), 1889–1898 (2014). 19. Nelson, D. R. et al. All-oral 12-week treatment with daclatasvir plus sofosbuvir in patients with hepatitis C virus genotype 3 infec-
tion: ALLY-3 phase III study. Hepatology 61(4), 1127–1135 (2015). 20. Kohli, A. et al. Ledipasvir and sofosbuvir for hepatitis C genotype 4: A proof-of-concept, single-centre, open-label phase 2a cohort
study. Lancet Infect. Dis. 15(9), 1049–1054 (2015). 21. Cardoso, A. C. et al. Impact of peginterferon and ribavirin therapy on hepatocellular carcinoma: Incidence and survival in hepatitis
C patients with advanced fibrosis. J. Hepatol. 52(5), 652–657 (2010). 22. Thein, H., Yi, Q., Dore, G. & Krahn, M. Estimation of stage specific fibrosis progression rates in chronic hepatitis C virus infection:
A meta analysis and meta regression. Hepatology 48(2), 418–431 (2008). 23. Fattovich, G. et al. Morbidity and mortality in compensated cirrhosis type C: A retrospective follow-up study of 384 patients.
Gastroenterology 112(2), 463–472 (1997). 24. Planas, R. et al. Natural history of decompensated hepatitis C virus-related cirrhosis. A study of 200 patients. J. Hepatol. 40(5),
823–830 (2004). 25. Wolfe, R., Roys, E. & Merion, R. Trends in organ donation and transplantation in the United States, 1999–2008. Am. J. Transplant.
10(4p2), 961–72 (2010). 26. Chong, C. A. K. Y. et al. Health-state utilities and quality of life in hepatitis C patients. Am. J. Gastroenterol. 98(3), 630–638 (2003). 27. Hanmer, J., Lawrence, W. F., Anderson, J. P., Kaplan, R. M. & Fryback, D. G. Report of nationally representative values for the
noninstitutionalized US adult population for 7 health-related quality-of-life scores. Med. Decis. Mak. 26(4), 391–400 (2006). 28. Siebert, U. et al. Cost effectiveness of peginterferon-2b plus ribavirin versus interferon-2b plus ribavirin for initial treatment of
chronic hepatitis C. Gut 52(3), 425 (2003). 29. Feasibility, acceptability, effectiveness and cost-analysis of models of HCV viremia testing for confirmation and cure among people
who inject drugs (PWID): the HEAD-start trial in Georgia. Identifier: NCT03594838. Retrieved from: https:// clini caltr ials. gov/ ct2/ show/ study/ NCT03 594838 (2019).
30. Reuters. Gilead uses Georgia as free-drug test bed for hepatitis C elimination. 2015. Available from: https:// www. reute rs. com/ artic le/ us- health- hepat itis- gilead- georg ia/ gilead- uses- georg ia- as- free- drug- testb ed- for- hepat itis-c- elimi nation- idUSK BN0ND 1XU20 150422 (last accessed 31 January 2020) (2015).
31. Wilson, J. et al. A systematic review and economic evaluation of epoetin alfa, epoetin beta and darbepoetin alfa in anaemia associ-ated with cancer, especially that attributable to cancer treatment. Health Technol. Assess. 11(13), 1–202 (2007).
32. Tang, W. et al. Diagnostic accuracy of tests to detect hepatitis C antibody: A meta-analysis and review of the literature. BMC Infect. Dis. 17(1), 695 (2017).
33. Freiman, J. M. et al. Hepatitis C core antigen testing for diagnosis of hepatitis C virus infection: A systematic review and meta-analysis. Ann. Intern. Med. 165(5), 345–355 (2016).
34. Organization WH. CHOosing Interventions that are Cost Effective (WHO-CHOICE). Available from: https:// www. who. int/ choice/ toolk it/ en/. (last accessed 21 November 2018).
35. McAdam-Marx, C. et al. All-cause and incremental per patient per year cost associated with chronic hepatitis C virus and associ-ated liver complications in the United States: A managed care perspective. J. Manag. Care Pharm. 17(7), 531–546 (2011).
36. The Global Fund. Highest-ever funding allocations announced to fight AIDS, TB and malaria. 2019. Available from: https:// www. thegl obalf und. org/ en/ news/ 2019- 12- 18- highe st- ever- fundi ng- alloc ations- annou nced- to- fight- aids- tb- and- malar ia/. (last accessed 31 January 2020).
37. Radley, A. et al. A systematic review and meta-analysis of community and primary-care-based hepatitis C testing and treatment services that employ direct acting antiviral drug treatments. BMC Health Serv. Res. 19(1), 765 (2019).
AcknowledgementsWe thank Yvan Hutin of WHO Global Hepatitis Program for his guidance, our partners in Georgia; Georgian Ministry of Health, National Centers for Disease Control, Georgian Harm Reduction Network and all study participants and staff from the study teams.
Author contributionsStudy concept and design: M.A., Y.Z., H.Z., R.A., S.S., J.C. Statistical analysis: M.A., Y.Z., H.Z., T.Z., H.Z. Inter-pretation of data: all authors. Drafting of manuscript: M.A., Y.Z., S.S., J.C. Critical revision of the manuscript for important intellectual content: all authors.
FundingThis study was supported in parts by a grant from Unitaid as part of the HEADStart project, and the National Science Foundation award 1722665. The funding sources had no role in the design and conduct of the study; collection, management, analysis, and interpretation of the data; preparation, review, or approval of the manu-script; and decision to submit the manuscript for publication.
10
Vol:.(1234567890)
Scientific Reports | (2021) 11:21382 | https://doi.org/10.1038/s41598-021-00362-y
www.nature.com/scientificreports/
Competing interests S. Shilton is an employee of The Foundation for Innovative New Diagnostics. Dr. Chhatwal reported receiving grants from the National Science Foundation and Unitaid during the conduct of the study, grants and personal fees from Gilead and Merck & Co outside the submitted work, and served as a partner with Value Analytics Labs outside the submitted work. All other authors have no competing/conflict of interest.
Additional informationSupplementary Information The online version contains supplementary material available at https:// doi. org/ 10. 1038/ s41598- 021- 00362-y.
Correspondence and requests for materials should be addressed to J.C.
Reprints and permissions information is available at www.nature.com/reprints.
Publisher’s note Springer Nature remains neutral with regard to jurisdictional claims in published maps and institutional affiliations.
Open Access This article is licensed under a Creative Commons Attribution 4.0 International License, which permits use, sharing, adaptation, distribution and reproduction in any medium or
format, as long as you give appropriate credit to the original author(s) and the source, provide a link to the Creative Commons licence, and indicate if changes were made. The images or other third party material in this article are included in the article’s Creative Commons licence, unless indicated otherwise in a credit line to the material. If material is not included in the article’s Creative Commons licence and your intended use is not permitted by statutory regulation or exceeds the permitted use, you will need to obtain permission directly from the copyright holder. To view a copy of this licence, visit http:// creat iveco mmons. org/ licen ses/ by/4. 0/.
© The Author(s) 2021