Embed Size (px)
Citation preview
Corresponding author: Juliet Ijeoma Ewurum Department of Surveying & Geoinformatics, Nnamdi Azikiwe University, Awka, Nigeria.
Copyright © 2022 Author(s) retain the copyright of this article. This article is published under the terms of the Creative Commons Attribution Liscense 4.0.
Geospatial mapping of public electricity distribution network systems in Owerri Municipal Local Government Area, Imo State Nigeria
Juliet Ijeoma Ewurum * and Johnbosco Chibueze Ojiako
Department of Surveying & Geoinformatics, Nnamdi Azikiwe University, Awka, Nigeria.
World Journal of Advanced Research and Reviews, 2022, 13(02), 201–209
Publication history: Received on 05 January 2022; revised on 07 February 2022; accepted on 09 February 2022
Article DOI: https://doi.org/10.30574/wjarr.2022.13.2.0132
Abstract
The Owerri Municipal Local Government Area is plagued by problems such as inability to meet the target set for power generation, insufficient equipment, substandard methods of transmission, poor zoning of distribution, low voltage supply, unauthorized connection and disconnection, corruption in its management, equipment vandalization and inefficient distribution. This study is therefore aimed at Geospatial mapping of public electricity distribution network systems in this Local Government Area. The methodology employed in this research started from the planning, primary data acquisition from the field using handheld GPS and questionnaire, secondary data acquisition from Enugu Electricity Distribution Company (EEDC), Enugu and Imo State, database design and creation, query and analysis, visualization and presentation of result using ArcGIS 10.5. From the result of the spatial analyses carried out, the study area has 26,350 public electricity distribution network systems. These public electricity distribution network systems comprise of 2507 High Tension lines, 8536 Low Tension lines, 11502 Low Tension poles, 3238 High Tension poles, 505 Transformers (DSS), 59 Solar Energy systems and 3 distribution feeders as at the period of study. The spatial search carried out showed that Umueche community has the highest number of occupants and also the highest number of transformers spread across. The spatial distribution result showed that Arugo layout and Onitsha Road layout are where industrial activities are concentrated and they have a total number of 20 and 21 transformers spread across each area respectively. Ikenegbu layout was revealed to have 25 transformers (DSS) spread across it. It is recommended that this study should serve as a decision support system for siting of power generation facilities within the study area.
Keywords: Database; Electricity Distribution; Geospatial Modeling; GIS
1. Introduction
Electricity is a vital aspect of the utility sector that is very necessary to the smooth and meaningful development of any city. It has brought many things that definitely have made many marvels and life would seem so hard without it [1]. The prime purpose of an electricity distribution system is to meet the customer’s demand for energy after receiving the bulk electrical energy from transmission or sub-transmission substation [2].
Electricity supply in Nigeria dates back to 1886 when two small generating sets were installed to serve the then Colony of Lagos. By an Act of Parliament in 1951, the Electricity Corporation of Nigeria (ECN) was established, and in 1962, the Niger Dams Authority (NDA) was also established for the development of Hydro Electric Power. However, a merger of the two was made in 1972 to form the National Electric Power Authority (NEPA), which was renamed Power Holding Company of Nigeria (PHCN) in 2005. In March 2005, President Olusegun Obasanjo signed the Power Sector Reform Bill into law, enabling private companies to participate in electricity generation, transmission, and distribution.
World Journal of Advanced Research and Reviews, 2022, 13(02), 201–209
202
Nigeria has been experiencing challenges in the distribution of power to the whole country in the past decades. Efficient functioning of the generated power cannot be achieved without proper record keeping and monitoring of the transmission and distribution network system. With the aid of GIS, variety of information can be better organized on a computer system linking the database to an output map. This information helps in spatial decision making, makes the information easily updateable and can cater for the needs of maintaining large power infrastructure. This study is therefore based on carrying out geospatial mapping of Electricity Distribution Network Systems in Owerri Municipal Local Government Area, Imo State, Nigeria.
2. Study Area
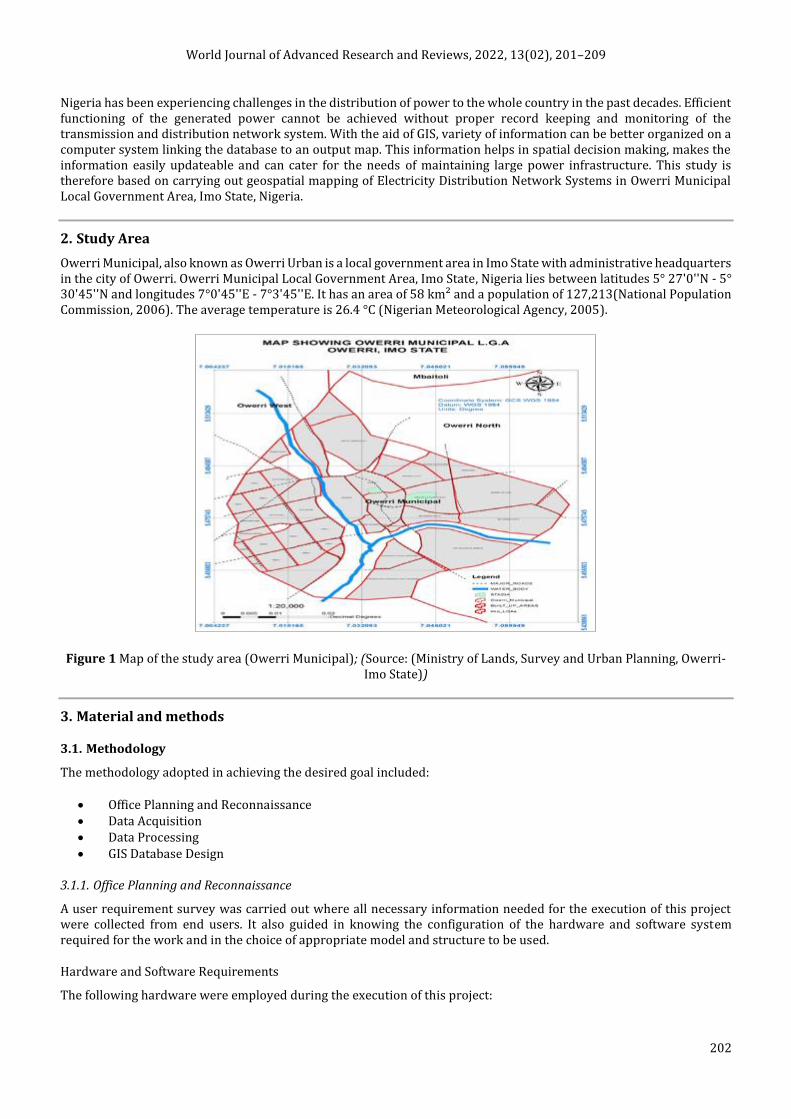
Owerri Municipal, also known as Owerri Urban is a local government area in Imo State with administrative headquarters in the city of Owerri. Owerri Municipal Local Government Area, Imo State, Nigeria lies between latitudes 5° 27'0''N - 5° 30'45''N and longitudes 7°0'45''E - 7°3'45''E. It has an area of 58 km² and a population of 127,213(National Population Commission, 2006). The average temperature is 26.4 °C (Nigerian Meteorological Agency, 2005).
Figure 1 Map of the study area (Owerri Municipal); (Source: (Ministry of Lands, Survey and Urban Planning, Owerri- Imo State))
3. Material and methods
3.1. Methodology
The methodology adopted in achieving the desired goal included:
Office Planning and Reconnaissance Data Acquisition Data Processing GIS Database Design
3.1.1. Office Planning and Reconnaissance
A user requirement survey was carried out where all necessary information needed for the execution of this project were collected from end users. It also guided in knowing the configuration of the hardware and software system required for the work and in the choice of appropriate model and structure to be used.
Hardware and Software Requirements
The following hardware were employed during the execution of this project:
World Journal of Advanced Research and Reviews, 2022, 13(02), 201–209
203
Garmin 76 handheld GPS. A computer (Laptop) system with the following configuration- Acer Aspire E1-571, Processor - Intel(R) Core
(TM) i3-2370M CPU @ 2.40GHz 2.40 GHz, Memory (RAM) - 6.00 GB, 64- bit Operating System. HP DeskJet 1515 printer. HP A0 scanner.
The following software were used during the execution of this project:
ArcGIS 10.5: This software handled multiple tables and related them to each other with ease, it also allowed manipulation and query using appropriate commands.
Microsoft office suit: This includes Word, Excel, and Power Point- Microsoft Word was used for preparing reports, Microsoft Excel for preparing coordinate tables before plotting in ArcGIS environment and Microsoft Power Point was used for report presentation.
Gecocal Software for coordinates transformation
3.1.2. Data Acquisition
Existing spatial data, non-spatial data, and maps both in digital and hardcopy formats were acquired. Spatial data acquired included the satellite imagery (Google Earth), GPS collected location data of features such as poles, transformers, power lines, etc. and digitized base map of the study area. The non-spatial data included oral interviews and questionnaires as well as consumer details and transformer details acquired from the EEDC and Owerri District Office.
3.1.3. Data Processing
This stage involved GPS data processing, digitizing of map, database creation which will facilitate ease of data exchange and analysis and database management system, this will facilitate organization, storage, manipulation, retrieval and integration of data in the database.
3.1.4. GIS Database Design
The methodology that was employed in this study involves conversion of analogue map into digital map, plotting of GPS coordinate points on the EEDC (Enugu Electricity Distribution Company) network systems (poles, transformers, power lines, solar energy systems, etc.) and other features of interest. Geo-database creation using data collected during field visits and queries generation.
4. Results and discussion
Results of database queries were presented in form of digital maps.
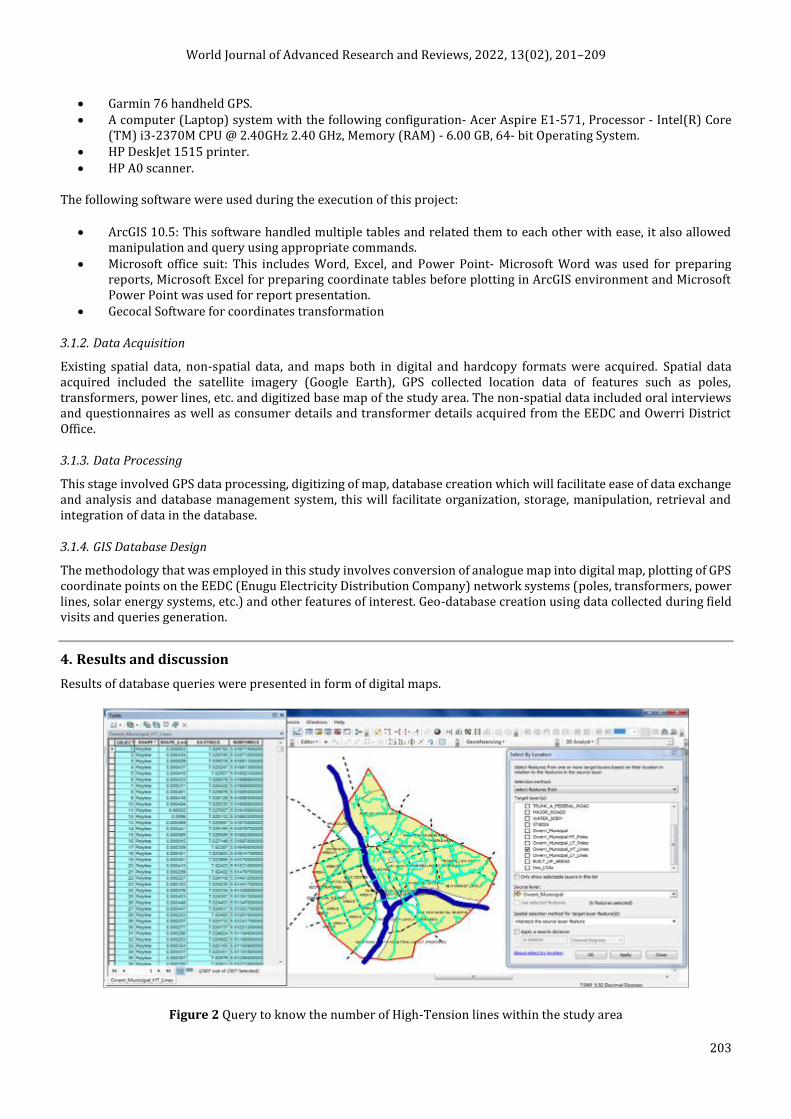
Figure 2 Query to know the number of High-Tension lines within the study area
World Journal of Advanced Research and Reviews, 2022, 13(02), 201–209
204
From figure 2, the query showed that Owerri Municipal L.G.A has 2507 high tension lines. The high-tension lines are highlighted in light vert colour, with the coordinates shown on the attribute table.
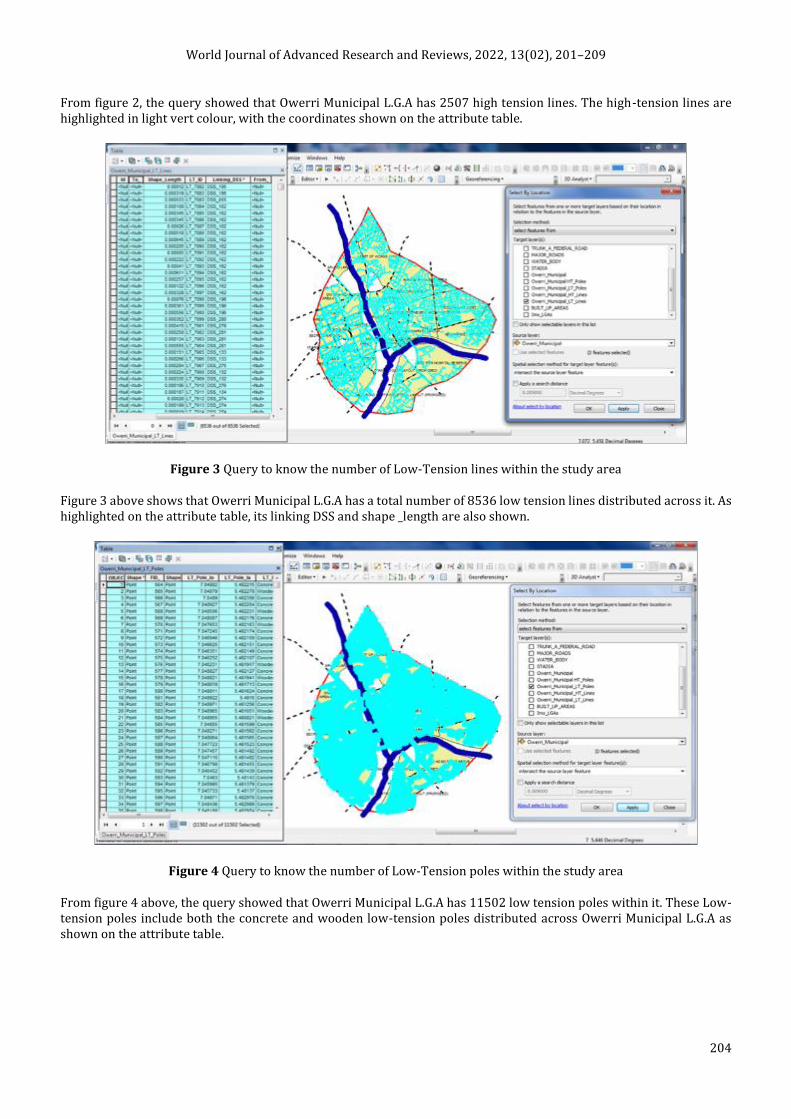
Figure 3 Query to know the number of Low-Tension lines within the study area
Figure 3 above shows that Owerri Municipal L.G.A has a total number of 8536 low tension lines distributed across it. As highlighted on the attribute table, its linking DSS and shape _length are also shown.
Figure 4 Query to know the number of Low-Tension poles within the study area
From figure 4 above, the query showed that Owerri Municipal L.G.A has 11502 low tension poles within it. These Low-tension poles include both the concrete and wooden low-tension poles distributed across Owerri Municipal L.G.A as shown on the attribute table.
World Journal of Advanced Research and Reviews, 2022, 13(02), 201–209
205
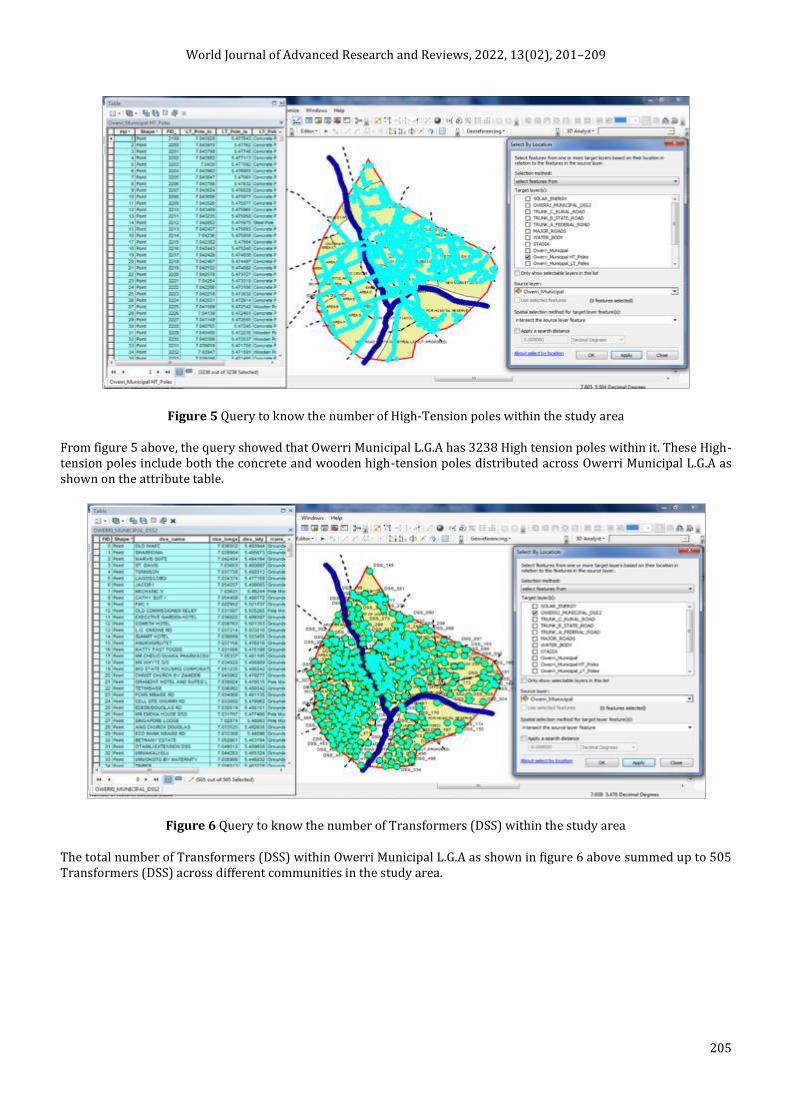
Figure 5 Query to know the number of High-Tension poles within the study area
From figure 5 above, the query showed that Owerri Municipal L.G.A has 3238 High tension poles within it. These High-tension poles include both the concrete and wooden high-tension poles distributed across Owerri Municipal L.G.A as shown on the attribute table.
Figure 6 Query to know the number of Transformers (DSS) within the study area
The total number of Transformers (DSS) within Owerri Municipal L.G.A as shown in figure 6 above summed up to 505 Transformers (DSS) across different communities in the study area.
World Journal of Advanced Research and Reviews, 2022, 13(02), 201–209
206
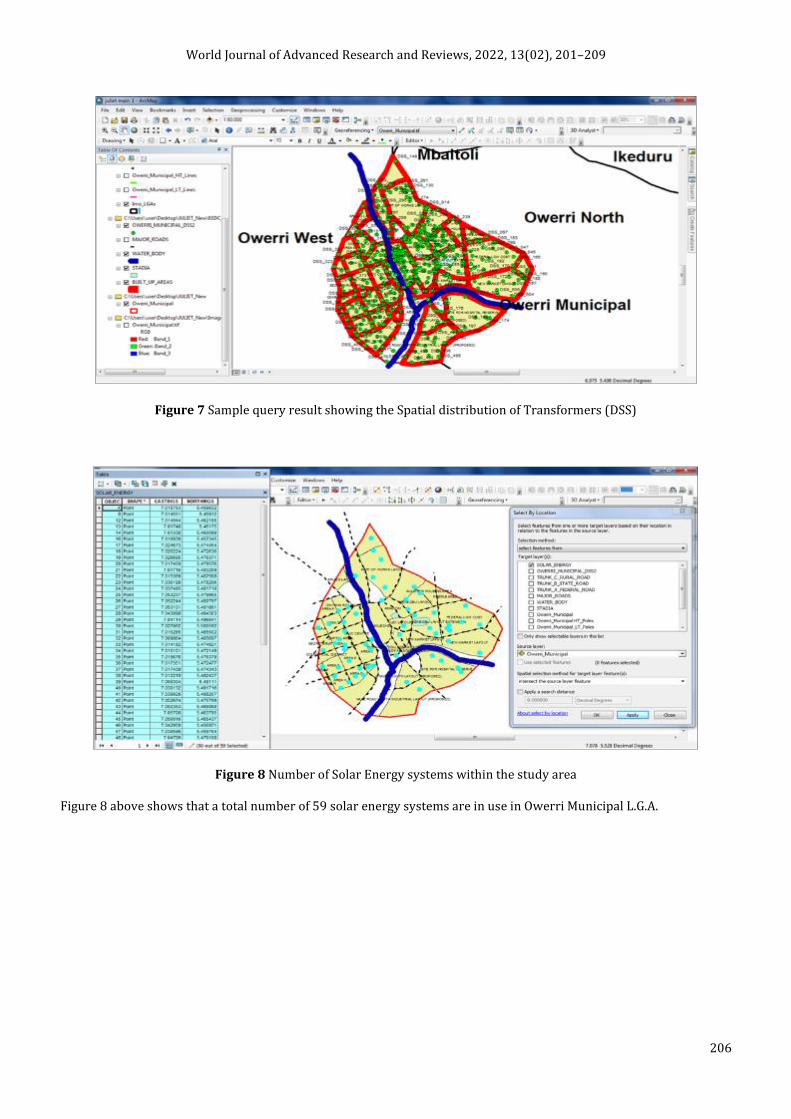
Figure 7 Sample query result showing the Spatial distribution of Transformers (DSS)
Figure 8 Number of Solar Energy systems within the study area
Figure 8 above shows that a total number of 59 solar energy systems are in use in Owerri Municipal L.G.A.
World Journal of Advanced Research and Reviews, 2022, 13(02), 201–209
207
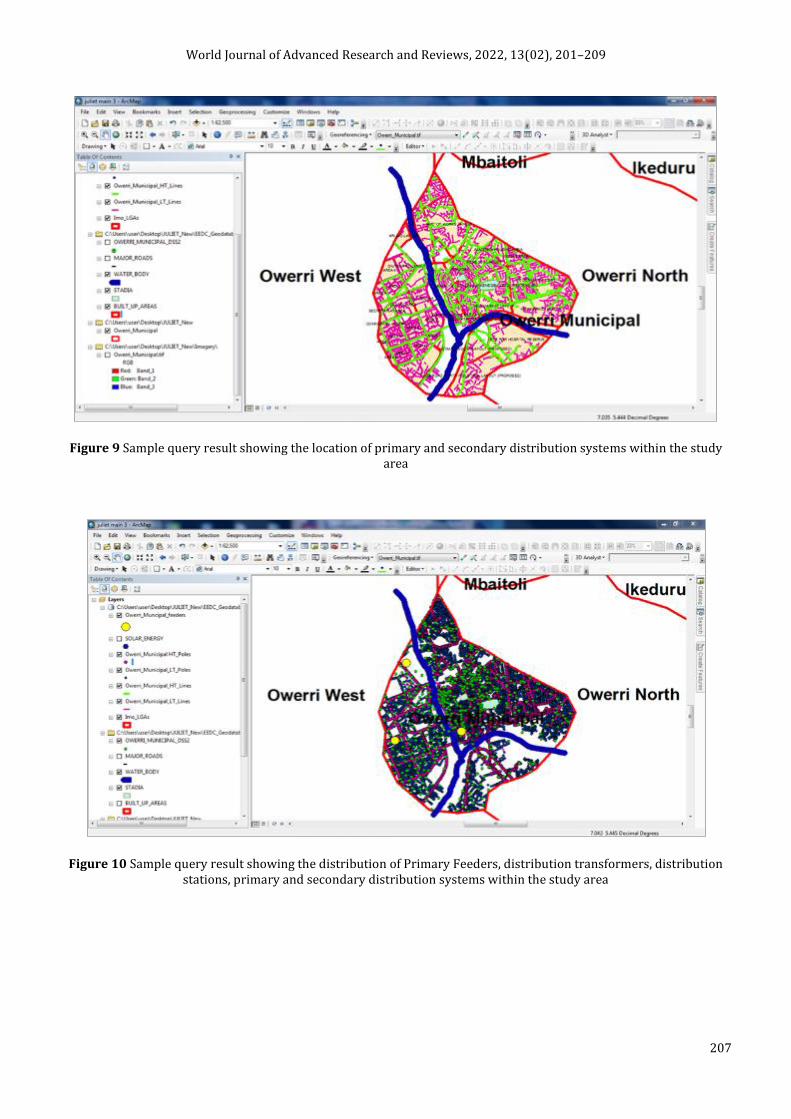
Figure 9 Sample query result showing the location of primary and secondary distribution systems within the study area
Figure 10 Sample query result showing the distribution of Primary Feeders, distribution transformers, distribution stations, primary and secondary distribution systems within the study area
World Journal of Advanced Research and Reviews, 2022, 13(02), 201–209
208
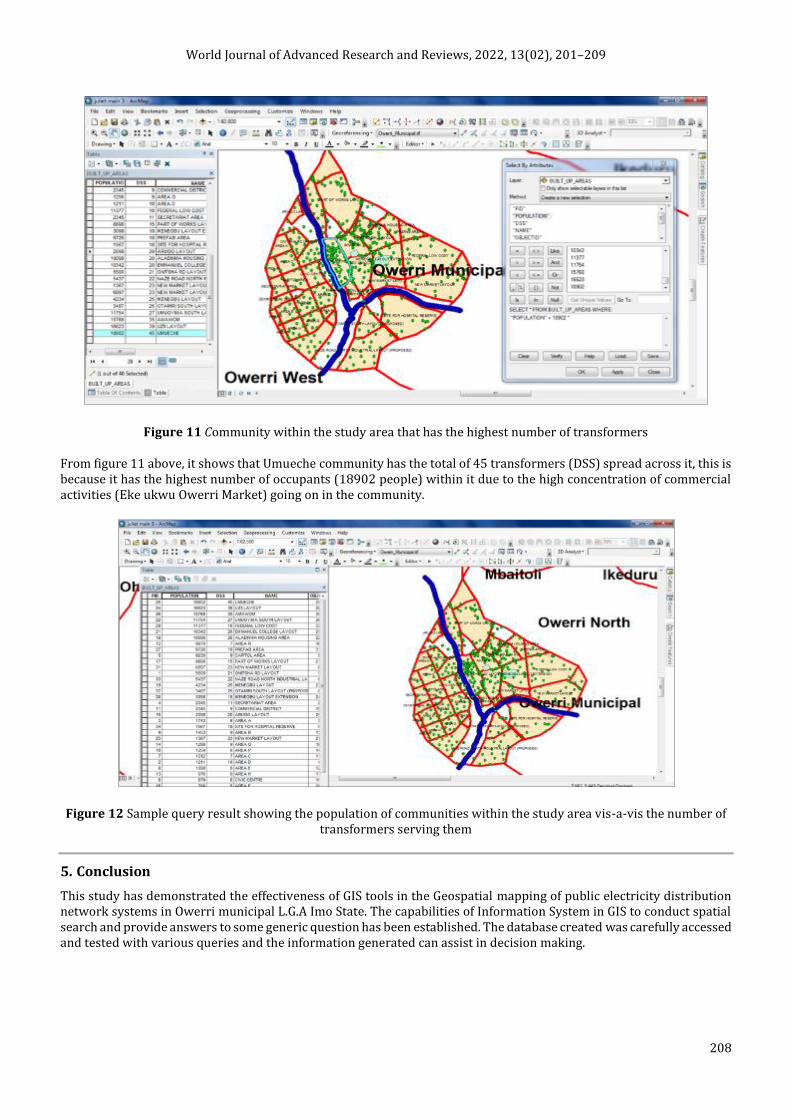
Figure 11 Community within the study area that has the highest number of transformers
From figure 11 above, it shows that Umueche community has the total of 45 transformers (DSS) spread across it, this is because it has the highest number of occupants (18902 people) within it due to the high concentration of commercial activities (Eke ukwu Owerri Market) going on in the community.
Figure 12 Sample query result showing the population of communities within the study area vis-a-vis the number of transformers serving them
5. Conclusion
This study has demonstrated the effectiveness of GIS tools in the Geospatial mapping of public electricity distribution network systems in Owerri municipal L.G.A Imo State. The capabilities of Information System in GIS to conduct spatial search and provide answers to some generic question has been established. The database created was carefully accessed and tested with various queries and the information generated can assist in decision making.

World Journal of Advanced Research and Reviews, 2022, 13(02), 201–209
209
Compliance with ethical standards
Acknowledgments
Thanks to Prof. J. C. Ojiako for his support, guidance and input into this paper. All authors read and approved this paper.
Disclosure of conflict of interest
There is no conflict of interest regarding the research, authorship and publication of this paper.
References
[1] Govindaraj R, Nailwal N. Electrical Distribution System Using Geospatial Technology, International Journal of Environment, Ecology, Family and Urban Studies (IJEEFUS). 2013; 1: 71-78.
[2] Kanmani B, Suresh Babu S. Electricity Distribution System using Geospatial Technology – A Case Study for Hosur Town, Krishnagiri District, International Journal of Computer Science and Information Technologies. 2014; 1296-1300.


