Embed Size (px)
Citation preview

Global free oscillations of the atmosphere and secondary
planetary waves in the mesosphere and lower thermosphere
region during August/September time conditions
A. I. Pogoreltsev,1 I. N. Fedulina,2 N. J. Mitchell3
Department of Physics, University of Wales, Aberystwyth, Ceredigion, UK
H. G. MullerUniversity of Cranfield, Royal Military College of Science, Shrivenham, Swindon, UK
Y. Luo,4 C. E. Meek, and A. H. MansonInstitute of Space and Atmospheric Studies, University of Saskatchewan, Saskatoon, Canada
Received 23 November 2001; revised 12 June 2002; accepted 13 June 2002; published 28 December 2002.
[1] Wind measurements made using ground-based mesosphere and lower thermosphereradar systems at Sheffield, UK (2�W, 53�N) and Saskatoon, Canada (107�W, 52�N) showan increase in long-period planetary wave (PW) activity at the end of August until themiddle of September 1993. Some of these waves can be identified with the well-knownnormal atmospheric modes; however, the westward propagating wave with zonal wavenumber one (m = 1) and a period of about 6.5 days observed during this time intervalcannot be explained using the classical theory of free atmospheric oscillations. Analysis ofthe UKMO assimilated fields shows that in the stratosphere the 7-day wave with m = 2increases in amplitude during the time interval considered, and there exists a strongstationary planetary wave (SPW) with m = 1. A steady state two-dimensional numericalmodel of planetary waves has been used to simulate the free atmospheric oscillationsand secondary planetary wave, which arises from a nonlinear interaction between thesecond asymmetric normal mode with m = 2 (the 7-day wave) and SPW with m = 1. Theresults of simulation show that an increase in long-period PW activity during August/September can be explained by seasonal changes of the zonal mean flow, which influencethe wave propagation conditions, and that one of the possible sources for the 6.5-daywave is a nonlinear interaction between the 7-day wave and SPW with m = 1. It issuggested that the 6.5-day wave with m = 1 be referred to as a ‘‘secondary normal mode,’’which has been generated by random meteorological motions in the lower atmosphere andinvolving interaction with a SPW of wave number 1. INDEX TERMS: 0342 Atmospheric
Composition and Structure: Middle atmosphere—energy deposition; 1620 Global Change: Climate dynamics
(3309); 3334 Meteorology and Atmospheric Dynamics: Middle atmosphere dynamics (0341, 0342); 3384
Meteorology and Atmospheric Dynamics: Waves and tides; KEYWORDS: planetary waves, atmospheric modes,
nonlinear interaction
Citation: Pogoreltsev, A. I., I. N. Fedulina, N. J. Mitchell, H. G. Muller, Y. Luo, C. E. Meek, and A. H. Manson, Global free
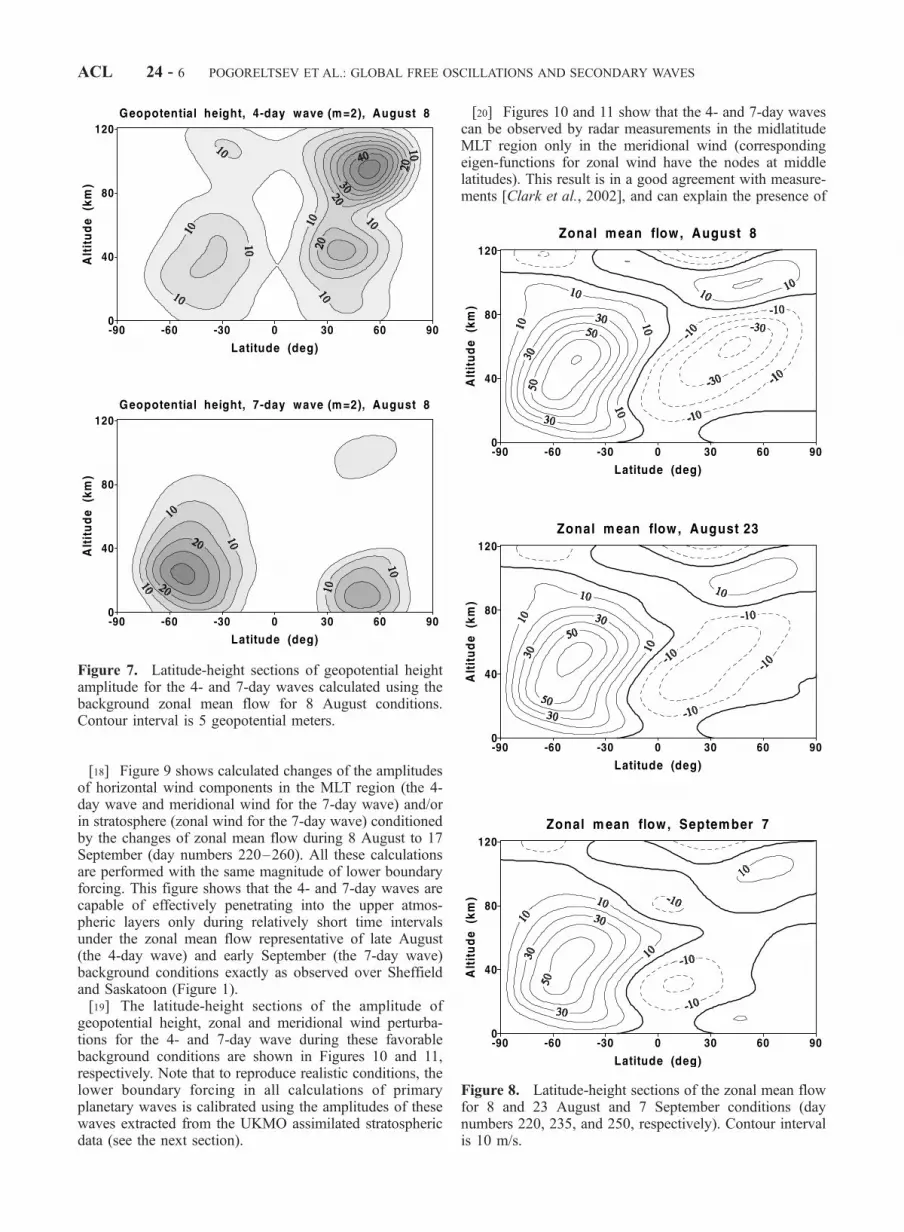
oscillations of the atmosphere and secondary planetary waves in the mesosphere and lower thermosphere region during August/
September time conditions, J. Geophys. Res., 107(D24), 4799, doi:10.1029/2001JD001535, 2002.
1. Introduction
[2] Recent wind measurements made using the meteorwind (MW) and medium-frequency (MF) radar systems andobservations with instruments on the UARS satellite show asubstantial increase in long-period planetary-wave activityin the mesosphere and lower thermosphere (MLT) duringseasonal transition periods [Wu et al., 1994; Clark et al.,2002; Talaat et al., 2001]. Usually, traveling planetarywaves (PWs) observed in the middle atmosphere can beidentified with free atmospheric oscillations, the so-callednormal atmospheric modes [Longuet-Higgins, 1968; Mad-
JOURNAL OF GEOPHYSICAL RESEARCH, VOL. 107, NO. D24, 4799, doi:10.1029/2001JD001535, 2002
1Now at Institute for Meteorology, Leipzig University, Leipzig,Germany.
2Now at Institute of Ionosphere, Ministry of Education and Science,Almaty, Kazakhstan.
3Now at Department of Electronic and Electrical Engineering,University of Bath, Bath, UK.
4Now at Canada Centre for Remote Sensing, Natural ResourcesCanada, Ottawa, Ontario, Canada.
Copyright 2002 by the American Geophysical Union.0148-0227/02/2001JD001535
ACL 24 - 1

den, 1979; Salby, 1984]. Nevertheless, sometimes a strongPW activity with periods different from those of the normalatmospheric modes has been observed. For instance, duringlate August and early September 1993 a large westwardpropagating wave with zonal wave number m = 1 andperiod of about 6–7 days was measured in the MLT regionby both ground- and satellite-based instruments [Clark etal., 2002].[3] Meyer and Forbes [1997] investigated different pos-
sible explanations for the appearance of this wave andsuggested that the most likely mechanism is a developmentof atmospheric instability in the mesosphere of the NorthernHemisphere. However, analysis of United Kingdom Mete-orological Office (UKMO) assimilated fields shows a sub-stantial PW activity with m = 1 and period of about 6–7days in the stratosphere. Here we propose an alternativeexplanation for this wave, involving nonlinear interactionbetween the stationary planetary wave (SPW) with m = 1and second asymmetric normal atmospheric mode withm = 2, the so-called 7-day wave.[4] A detail analysis of wind data recorded by MW radar
at Sheffield (2�W, 53�N) and MF radar at Saskatoon(107�W, 52�N) in August/September 1993 and UKMOassimilated geopotential height and zonal wind fields atthe 1 hPa pressure level [Swinbank and O’Neill, 1994] isperformed to estimate the periods, amplitudes, phases, andzonal wave numbers of PWs in the middle atmosphere andinvestigate the changes of wave activity during the autumn-time transition period. Results of simulations obtained witha steady state two-dimensional (2-D) linearized numericalmodel are used to interpret the observations.[5] Observational studies of tides and PWs have shown
the presence of various secondary waves in the MLT regiongenerated as a product of interaction between PW and tidalprimary waves and suggested that nonlinear interaction canplay an important role in middle atmospheric dynamics[Cevolani and Kingsley, 1992; Mitchell et al., 1996; Kama-labadi et al., 1997; Jacobi et al., 1998; Beard et al., 1999;Pancheva et al., 2000; Pogoreltsev et al., 2002]. A possiblenonlinear interaction between primary planetary waves thatresults in the generation of the 6.5-day secondary wave isdiscussed.
2. Analysis of MLT Radar Data
[6] All MLT wind analyses in this paper are based on 12-hourly data. The 24-hour means were calculated fromindividual hourly data points to suppress tidal oscillationsand decrease a short-period geophysical noise. This 24-hourwindow was advanced through the time series in steps of 12hours. The Sheffield MW and Saskatoon MF radar systems,as well as the preliminary data analysis, have been describedelsewhere [Mitchell et al., 1996, 1999; Beard et al., 1999;Meek, 1980; Manson et al., 1981]. The MW radar atSheffield measures horizontal winds near 95 km withoutheight resolution. At middle latitudes a substantial ampli-tude of the 7-day wave is observed in meridional wind[Clark et al., 2002] and so here we will consider only thiswind component. Amplitude spectra of the Morlet transform[Torrence and Compo, 1998] for the meridional windobserved by the MLT radar systems at Sheffield andSaskatoon (height 94 km) are shown in Figure 1. One can
see from this figure a strong 4-day wave activity during lateAugust (days 225–240) and a substantial quasi-7-day waveduring early September. Comparison of the wavelet spectraobtained for the Sheffield and Saskatoon wind data showsin general a good agreement, however, the 4-day waveactivity increases above Saskatoon slightly earlier and themagnitude of quasi-7-day wave observed at Sheffield inSeptember is larger in comparison with that at Saskatoon.[7] To more accurately determine the periods of hidden
oscillations present in time series and interpret the differ-ences observed at two sites, the modified Lomb-Scargle(LS) periodogram method proposed by Aushev et al. [2000]was used (the application of this approach to analysis ofMW radar data has been described in Pogoreltsev et al.[2002]). A quadratic fit was subtracted from the initial 12-hourly data and the Hanning windowing function wasapplied to reduce the effect of spectral linkage. The LSmethod [Press and Teukolsky, 1988] and least squaresapproach involving a singular value decomposition (SVD)technique are suitable for unevenly time spaced data and/ordata with gaps, and so we did not fill any gaps existing inthe time series considered.
Figure 1. Wavelet amplitude spectra of meridional winddata recorded by MW radar at Sheffield and by MF radar atSaskatoon (height 94 km) in August/September 1993.Contour interval is 2.5 m/s.
ACL 24 - 2 POGORELTSEV ET AL.: GLOBAL FREE OSCILLATIONS AND SECONDARY WAVES

[8] The normalized periodograms obtained after refiningthe periods from the meridional wind data recorded atSheffield and Saskatoon during 8 August to 17 September1993 are shown in Figure 2. Each line in this figure
represents the power spectrum obtained for a single har-monic when the quadratic trend and all other harmonics aresubtracted from the initial time series. One can see from thisfigure that there exists a set of statistically significantoscillations in the frequency range associated with PWs(note that a significance level is 0.01, i.e., 99% confidencelevel, if a maximum in the power spectra is about 10 [Pressand Teukolsky, 1988]). Comparison of power spectraobtained for meridional wind observed at Sheffield andSaskatoon shows a good agreement, however, the magni-tudes of the maxima obtained for MW radar data are slightlylarger. This increase in the amplitude of maxima is con-nected with a decrease in the uncorrelated geophysicalnoise, which can be explained by the altitude and horizon-tal-spatial averaging of the information about the horizontalwind in the MW radar measurements. As a result themeasurements made with the MF radar system at Saskatooncontain additional information, for instance, on internalgravity waves with relatively short wavelengths.[9] To obtain the amplitudes and phases of the harmonics
corresponding to the maxima in the power spectra, weapply a least squares approach using SVD technique to theinitial time series (without the Hanning windowing func-tion). Observed wave fields show a substantial variability(Figure 1) and we assume that each separate maximum inthe power spectra cannot be identified with the PW, butinstead of that the observed wave events have to be describedby combinations of several harmonics. For instance, Figure3 shows the superposition of three harmonics correspondingto the maxima in Figure 2 highlighted by solid lines.Comparison with results of wavelet analysis (Figure 1)shows that these three harmonics describe the behaviour
Figure 2. LS periodogram power spectra of meridionalwind data recorded at Sheffield and Saskatoon (height 94 km)during 8 August–17 September 1993. The spectra corre-sponding to the 6.5-day wave highlighted by solid lines.
Figure 3. The restored time series of meridional wind forthe 6.5-day wave observed at Sheffield (solid line) andSaskatoon (dashed line).
POGORELTSEV ET AL.: GLOBAL FREE OSCILLATIONS AND SECONDARY WAVES ACL 24 - 3

of the quasi-7-day oscillations in the meridional windobserved at Sheffield and Saskatoon. The averaged periodof these oscillations in September (day numbers 240–260)is about 6.4 days, and, following Meyer and Forbes [1997],we will refer to this event as the 6.5-day wave to distinguishit from the 7-day wave (second asymmetric normal atmos-pheric mode with m = 2).[10] Figure 3 shows a substantial difference in the ampli-
tude of the 6.5-day wave over Sheffield and Saskatoon inSeptember, which suggests a co-existence of at least twowaves with different zonal wave numbers. Assuming thatthis 6.5-day wave event consists of two westward propagat-ing waves with the same period T and different zonal wavenumbers m1 and m2, we can represent the time series asfollows
fk tð Þ ¼ Ak cos2pT
t � jk
� �
¼X2i¼1
ai sin milk þ2pT
t
� �þ bi cos milk þ
2pT
t
� �� �;
where k = 1 and 2 correspond to Sheffield and Saskatoon,respectively. For t = 0 and t = p/4 we obtain the followingrelations X2
i¼1
ai sinmilk þ bi cosmilkð Þ ¼ Ak cosjk ; ð1Þ
X2i¼1
ai cosmilk � bi sinmilkð Þ ¼ Ak sinjk :
If we have the information on the amplitudes Ak and phasesjk obtained at two sites, we can solve the set of equation (1)and obtain the amplitudes and phases of waves with zonalwave numbers m1 and m2. In general, when observations atseveral sites are available, we have to use a least squaresapproach or include into consideration additional zonalharmonics and/or eastward propagating waves.[11] Assuming that t = 0 corresponds to one of the nodal
points in meridional wind observed at Sheffield (forinstance, day number 242, see Figure 2), and setting T =6.4 days, m1 = 1, m2 = 2, l1 = 2�, A1 = 12 m/s, j1 = 96� (theposition of ridge is at t = 1.7 days), l2 = 107�, A2 = 9 m/s,j2 = 225� (the position of ridge is at t = 4 days), where A1,A2 and j1, j2 are the amplitudes and phases of the 6.5-dayoscillation over Sheffield and Saskatoon, we can solve theset of equations (1). The information about the phases isnot important for our purposes, and for amplitudes weobtain A(m = 1) =
ffiffiffiffiffiffiffiffiffiffiffiffiffiffiffiffiffiffiffia21 þ b21� �q
= 8.7 m/s, A(m = 2) =ffiffiffiffiffiffiffiffiffiffiffiffiffiffiffiffiffiffiffia22 þ b22� �q
= 3.3 m/s. We will return to discussion of thesetwo waves later, when we will consider the results ofnumerical simulations. It should be noted that in general,when there are substantial variations of amplitude depend-ing on longitude, a linear fitting of longitudinal changes ofthe phase [Pancheva et al., 2002] is not justified. Therequirement for latitude-independent amplitude is veryrigorous, and account of longitudinal changes of amplitudecan influence significantly the estimations of zonal wavenumbers, especially in the case of relatively small secondarywaves.[12] Figure 1 shows a strong variability of the 4-day wave
in August/September 1993, and to describe this wave eventby a limited set of harmonics, we have to consider a shorter
time interval. The normalized periodograms obtained fromthe meridional wind velocities observed at Sheffield andSaskatoon during 8 August–7 September 1993 are shownin Figure 4.
Figure 4. LS periodogram power spectra of meridionalwind data recorded at Sheffield and Saskatoon (height 94km) during 8 August–7 September 1993. The spectracorresponding to the 4-day wave highlighted by solid lines.
ACL 24 - 4 POGORELTSEV ET AL.: GLOBAL FREE OSCILLATIONS AND SECONDARY WAVES

[13] One can see an increase in magnitude of the powerspectra near a period of about 4 days, and the superpositionof the three harmonics highlighted by solid lines in Figure 4is presented in Figure 5.[14] This figure shows that amplitudes of the oscillations
at two sites are approximately the same. The phase shiftbetween oscillations above Sheffield and Saskatoon indi-cates that zonal wave number is close to 2, which allows usto interpret this wave as a manifestation of the firstsymmetric normal atmospheric mode with m = 2, the so-called 4-day wave.
3. Simulation With a 2-D Model
[15] Wavelet analysis shows an increase in the magni-tudes of the 4- and 7-day waves during time intervalconsidered (Figure 1). Using the results obtained in thetheory of free atmospheric oscillations, we can suggest thatthese events are connected with the first symmetric andsecond asymmetric normal atmospheric modes with zonalwave number 2, the so-called (2,1) and (2,2) modes. Thenormalized atmospheric responses to the lower boundaryforcing (symmetric or asymmetric in respect to equatorvertical motions at lower boundary) for westward propagat-ing waves with m = 2 are shown in Figure 6 (the details ofthese calculations have been described elsewhere [Pogor-eltsev, 1999]).[16] It should be noted that during the greater part of the
year these waves are not propagating modes (for instance,Figure 7 shows the calculated latitude-height sections of theamplitude of geopotential height perturbations for these
waves under August 8 background conditions), and theycan propagate into the MLT region only during a favorabledistribution of the zonal mean flow. To investigate theinfluence of the seasonal changes of the zonal mean flowon propagation conditions of these waves, a set of numericalsimulations with a steady state 2-D linearized model hasbeen performed. The numerical model of planetary waveshas been described elsewhere [Pogoreltsev, 1999; Pogor-eltsev, 2001]. The latest version of this model includesrealistic radiative damping and thermal conduction, butthe mechanical dissipative processes are parameterized byRayleigh friction. The reason for this is that in the middleatmosphere the mechanical dissipation due to the diffusionof momentum is not significant for planetary waves incomparison with the radiative damping, and we use thelarge values of the Rayleigh friction coefficient to param-eterize mainly the wave transience and losses of the waveenergy due to a nonlinear interaction with other waves. Themodel domain extends from pole to pole, and from thesurface to the lower thermosphere.[17] The numerical simulations of planetary waves are
performed for the August/September climatic conditions.The background temperature and zonal mean wind are takenfrom the MSISE90 [Hedin, 1991] and HWM93 [Hedin etal., 1996] empirical models. The latitude-height sections ofthe background wind and its changes during August/Sep-tember are shown in Figure 8. One can see that during thetime interval considered the zonal mean wind undergoessubstantial seasonal changes, especially in the Northern(summer) Hemisphere.
Figure 5. The restored time series of meridional wind forthe 4-day wave observed at Sheffield (solid line) andSaskatoon (dashed line).
Figure 6. Global atmospheric response to the symmetric(solid line) and asymmetric (dashed line) lower boundaryforcing for westward propagating PWs with m = 2.
POGORELTSEV ET AL.: GLOBAL FREE OSCILLATIONS AND SECONDARY WAVES ACL 24 - 5
[18] Figure 9 shows calculated changes of the amplitudesof horizontal wind components in the MLT region (the 4-day wave and meridional wind for the 7-day wave) and/orin stratosphere (zonal wind for the 7-day wave) conditionedby the changes of zonal mean flow during 8 August to 17September (day numbers 220–260). All these calculationsare performed with the same magnitude of lower boundaryforcing. This figure shows that the 4- and 7-day waves arecapable of effectively penetrating into the upper atmos-pheric layers only during relatively short time intervalsunder the zonal mean flow representative of late August(the 4-day wave) and early September (the 7-day wave)background conditions exactly as observed over Sheffieldand Saskatoon (Figure 1).[19] The latitude-height sections of the amplitude of
geopotential height, zonal and meridional wind perturba-tions for the 4- and 7-day wave during these favorablebackground conditions are shown in Figures 10 and 11,respectively. Note that to reproduce realistic conditions, thelower boundary forcing in all calculations of primaryplanetary waves is calibrated using the amplitudes of thesewaves extracted from the UKMO assimilated stratosphericdata (see the next section).
[20] Figures 10 and 11 show that the 4- and 7-day wavescan be observed by radar measurements in the midlatitudeMLT region only in the meridional wind (correspondingeigen-functions for zonal wind have the nodes at middlelatitudes). This result is in a good agreement with measure-ments [Clark et al., 2002], and can explain the presence of
Figure 8. Latitude-height sections of the zonal mean flowfor 8 and 23 August and 7 September conditions (daynumbers 220, 235, and 250, respectively). Contour intervalis 10 m/s.
Figure 7. Latitude-height sections of geopotential heightamplitude for the 4- and 7-day waves calculated using thebackground zonal mean flow for 8 August conditions.Contour interval is 5 geopotential meters.
ACL 24 - 6 POGORELTSEV ET AL.: GLOBAL FREE OSCILLATIONS AND SECONDARY WAVES

the quasi-7-day wave with m = 2 in radar wind measure-ments (see discussion after Figure 3 in the present paper).Nevertheless, the simulation of primary waves cannotexplain the appearance and properties of the quasi-7-daywave with m = 1 (the 6.5-day wave in our nomenclature)observed in the meridional wind. Meyer and Forbes [1997]investigated different possible sources of this wave andconcluded that the most likely mechanism is an instabilityin the planetary wind field of summer mesosphere. Analternative explanation for the origin of this 6.5-day waveinvolving the nonlinear interaction between the 4- and 10-day waves was suggested by Pogoreltsev et al. [2002] andTalaat et al. [2002]. However, preliminary calculationsshow that nonlinear interaction between symmetric andasymmetric modes is not effective, and cannot explain theobserved amplitudes of the 6.5-day wave. For instance, thecalculated amplitude of the meridional wind perturbation inMLT region for the secondary 6.5-day wave arising from anonlinear interaction between the 4- and 10-day waves atthe beginning of September is about of 1–2 m/s. To furtherinvestigate question of the origin of the 6.5-day wave, ananalysis of UKMO assimilated geopotential height andzonal wind fields has been performed.
4. Analysis of UKMO Data
[21] The UKMO assimilated 1 hPa pressure level (alti-tude of about 50 km) data [Swinbank and O’Neill, 1994]
have been used to obtain information on global-scale wavesin the stratosphere during August/September 1993 timeinterval. These geopotential height and zonal wind datafor each latitudinal circle are first separated into large-scale(m = 1–3) zonal modes by a Fourier analysis for each day,
Figure 9. The calculated changes of the zonal andmeridional wind amplitudes conditioned by seasonal changesof the zonal mean flow during time interval considered.
Figure 10. Latitude-height sections of geopotential height,zonal and meridional wind amplitudes for the 4-day wavecalculated using the background zonal mean flow for 23August conditions. Contour intervals are 25 geopotentialmeters, and 2 m/s, respectively.
POGORELTSEV ET AL.: GLOBAL FREE OSCILLATIONS AND SECONDARY WAVES ACL 24 - 7

as proposed by Hayashi [1971]). The new time series withdaily values of geopotential height and zonal wind for thecosine and sine terms (the real and imaginary parts of awave field, or the behavior of these fields at longitudes 0�and 90�W in the case of m = 1 and 0� and 45�W in the case
of m = 2) for each mode and each latitude are used tocalculate the power spectral estimates. The set of statisti-cally significant maxima in power spectra is then obtainedfor each zonal mode. Using a least squares approach andinformation about the periods existing in time series, theamplitudes and phases of each harmonic are calculated fortwo longitudes shifted by a quarter of the longitudinal wavelength. Then, using an approach similar to described in thesecond section and obtained values of amplitudes andphases at different longitudes, each harmonic is separatedinto westward and eastward propagating waves. New timeseries for geopotential height and zonal wind accountingonly the westward propagating waves are calculated foreach zonal wave number, and wavelet analysis has beenapplied to these time series.[22] The results of numerical simulation (Figures 10 and
11) show that the 4- and 7-day waves can be observed atstratospheric altitudes at middle latitudes in the geopotentialheight, and/or in zonal wind above the equator. Waveletamplitude spectra of the geopotential height (latitude 54�N)and zonal wind (equator) for westward propagating waveswith m = 2 extracted from UKMO assimilated data at 1 hPa
Figure 11. Latitude-height sections of geopotential height,zonal and meridional wind amplitudes for the 7-day wavecalculated using the background zonal mean flow for 7September conditions. Contour intervals are 10 geopotentialmeters, and 0.5 m/s, respectively.
Figure 12. Wavelet amplitude spectra of geopotentialheight (54�N) and zonal wind (equator) for westwardpropagating waves with m = 2 extracted from UKMOassimilated fields at 1 hPa pressure level. Contour intervalsare 5 geopotential meters and 0.2 m/s, respectively.
ACL 24 - 8 POGORELTSEV ET AL.: GLOBAL FREE OSCILLATIONS AND SECONDARY WAVES
pressure level are shown in Figure 12. The wavelet spectrapresented in Figure 12 are calculated for time series restoredat longitude 0�, but the difference in amplitude spectracalculated for another longitude will be insignificant if weconsider only westward (or eastward) propagating modes.[23] One can see from Figure 12 that the 4-day wave
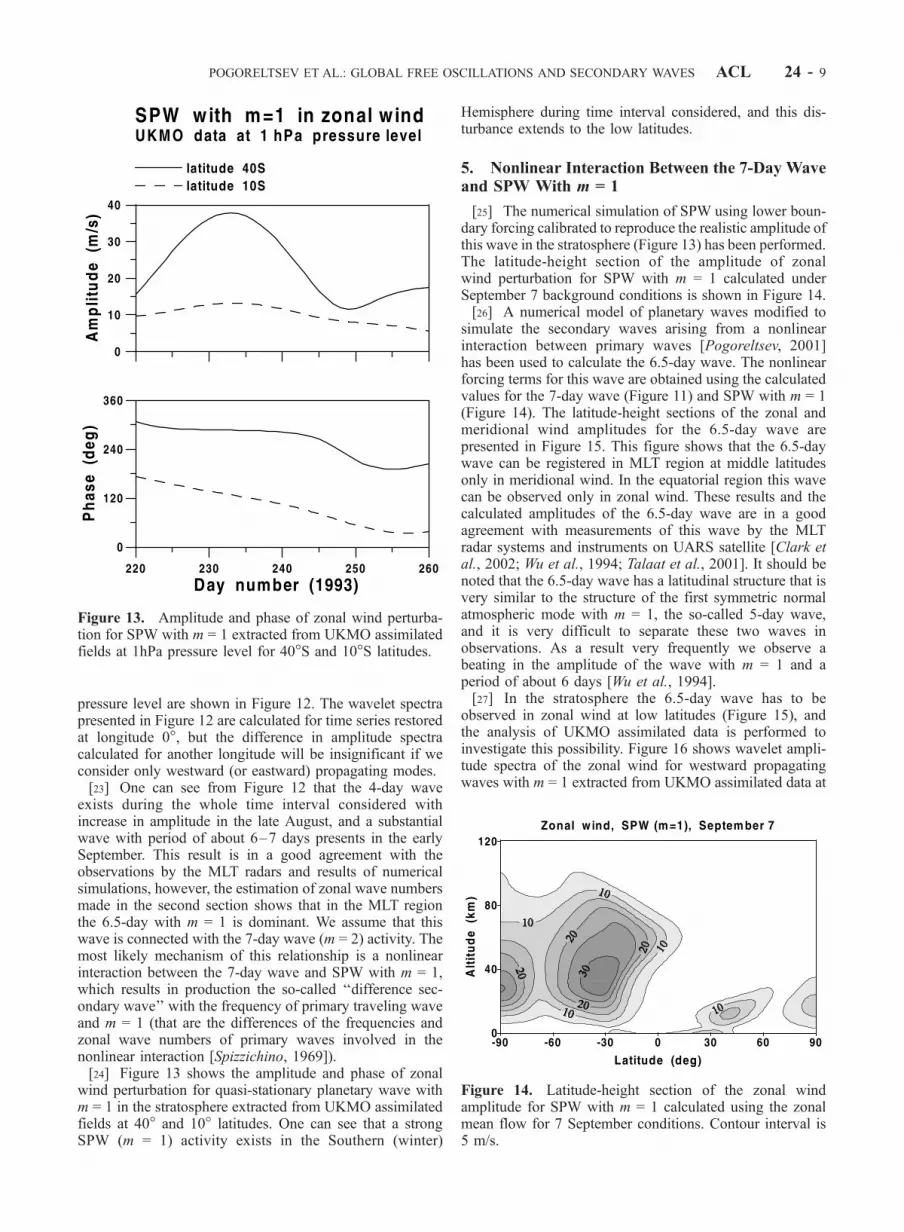
exists during the whole time interval considered withincrease in amplitude in the late August, and a substantialwave with period of about 6–7 days presents in the earlySeptember. This result is in a good agreement with theobservations by the MLT radars and results of numericalsimulations, however, the estimation of zonal wave numbersmade in the second section shows that in the MLT regionthe 6.5-day with m = 1 is dominant. We assume that thiswave is connected with the 7-day wave (m = 2) activity. Themost likely mechanism of this relationship is a nonlinearinteraction between the 7-day wave and SPW with m = 1,which results in production the so-called ‘‘difference sec-ondary wave’’ with the frequency of primary traveling waveand m = 1 (that are the differences of the frequencies andzonal wave numbers of primary waves involved in thenonlinear interaction [Spizzichino, 1969]).[24] Figure 13 shows the amplitude and phase of zonal
wind perturbation for quasi-stationary planetary wave withm = 1 in the stratosphere extracted from UKMO assimilatedfields at 40� and 10� latitudes. One can see that a strongSPW (m = 1) activity exists in the Southern (winter)
Hemisphere during time interval considered, and this dis-turbance extends to the low latitudes.
5. Nonlinear Interaction Between the 7-Day Waveand SPW With m = 1
[25] The numerical simulation of SPW using lower boun-dary forcing calibrated to reproduce the realistic amplitude ofthis wave in the stratosphere (Figure 13) has been performed.The latitude-height section of the amplitude of zonalwind perturbation for SPW with m = 1 calculated underSeptember 7 background conditions is shown in Figure 14.[26] A numerical model of planetary waves modified to
simulate the secondary waves arising from a nonlinearinteraction between primary waves [Pogoreltsev, 2001]has been used to calculate the 6.5-day wave. The nonlinearforcing terms for this wave are obtained using the calculatedvalues for the 7-day wave (Figure 11) and SPW with m = 1(Figure 14). The latitude-height sections of the zonal andmeridional wind amplitudes for the 6.5-day wave arepresented in Figure 15. This figure shows that the 6.5-daywave can be registered in MLT region at middle latitudesonly in meridional wind. In the equatorial region this wavecan be observed only in zonal wind. These results and thecalculated amplitudes of the 6.5-day wave are in a goodagreement with measurements of this wave by the MLTradar systems and instruments on UARS satellite [Clark etal., 2002; Wu et al., 1994; Talaat et al., 2001]. It should benoted that the 6.5-day wave has a latitudinal structure that isvery similar to the structure of the first symmetric normalatmospheric mode with m = 1, the so-called 5-day wave,and it is very difficult to separate these two waves inobservations. As a result very frequently we observe abeating in the amplitude of the wave with m = 1 and aperiod of about 6 days [Wu et al., 1994].[27] In the stratosphere the 6.5-day wave has to be
observed in zonal wind at low latitudes (Figure 15), andthe analysis of UKMO assimilated data is performed toinvestigate this possibility. Figure 16 shows wavelet ampli-tude spectra of the zonal wind for westward propagatingwaves with m = 1 extracted from UKMO assimilated data at
Figure 13. Amplitude and phase of zonal wind perturba-tion for SPW with m = 1 extracted from UKMO assimilatedfields at 1hPa pressure level for 40�S and 10�S latitudes.
Figure 14. Latitude-height section of the zonal windamplitude for SPW with m = 1 calculated using the zonalmean flow for 7 September conditions. Contour interval is5 m/s.
POGORELTSEV ET AL.: GLOBAL FREE OSCILLATIONS AND SECONDARY WAVES ACL 24 - 9

1 hPa pressure level. One can see from this figure that the 5-day wave has a substantial amplitude during practically alltime interval considered, and in the late August and earlySeptember there is an increase in amplitude of the 6.5-day
wave. Comparison of Figure 12 and 16 shows that the 6.5-day wave follows the behaviour of the 7-day wave withm = 2. This fact strongly support the idea that the 6.5-daywave is a result of nonlinear interaction between theprimary 7-day wave and SPW with m = 1.[28] To investigate a possibility of the resonant atmos-
pheric response with m = 1 to the lower boundary forcingwith m = 2 involving into consideration a nonlinear inter-action between the primary (forced) wave and SPW withm = 1, a set of calculations has been performed. In thissimulation the constant amplitude of the SPW and lowerboundary forcing for the primary wave with m = 2 havebeen used. The calculated amplitudes of the zonal andmeridional wind perturbations in MLT region at equatorand 54�N, respectively, are presented in Figure 17. One cansee from this figure that there is a resonant response at theperiod between 6 and 7 days, and the 6.5-day wave can beconsidered as secondary normal atmospheric mode, whichcan be excited by random meteorological motions in thelower atmosphere in presence of SPW with m = 1.
6. Summary and Conclusions
[29] Wavelet analysis of MLT radar data shows a sub-stantial increase in long-period PW activity during lateAugust and early September. The modified LS periodogrammethod is used to investigate the power spectra of themeridional wind during the time interval considered. The
Figure 15. Latitude-height sections of zonal and meridio-nal wind amplitudes for the 6.5-day secondary wavecalculated using the zonal mean flow for 7 Septemberconditions. Contour interval is 2.5 m/s.
Figure 16. Wavelet amplitude spectra of the zonal windfor westward propagating waves with m = 1 extracted fromUKMO assimilated fields at 1 hPa pressure level above theequator. Contour interval is 0.5 m/s.
Figure 17. The amplitudes of zonal and meridional windperturbations in MLT region above the equator and atlatitude 54�N, respectively, for the secondary waves arisingfrom nonlinear interaction between asymmetric mode withm = 2 and SPW with m = 1.
ACL 24 - 10 POGORELTSEV ET AL.: GLOBAL FREE OSCILLATIONS AND SECONDARY WAVES

results show that there exists a set of statistically significantharmonics in the time series considered. It is suggested thatevery separate harmonic cannot be identified with the PW,but instead that the observed wave fields have to bedescribed by the combinations of several harmonics. Theseadditional harmonics arise from seasonal changes of thebackground zonal mean flow, which modulates the effi-ciency of PW propagation into the MLT region, and due to avariability of the lower-atmosphere forcing. Considerationof a superposition of several harmonics and estimation ofthe zonal wave numbers of resulting wave fields allow us toidentify a part of the maxima in MLT wind power spectrawith the well-known normal atmospheric modes. Never-theless, a strong activity of PW with period of about 6.5days and zonal wave number 1 cannot be explained by theclassical theory of the free atmospheric oscillations.[30] Numerical simulation shows that some of the long-
period normal atmospheric modes (first symmetric andsecond asymmetric modes with zonal wave number two,the so-called 4- and 7-day waves), thought to be exited byrandom meteorological motions in the lower atmosphere,are capable of effectively penetrating into the upper atmos-pheric layers only during a relatively short time interval inlate August and early September.[31] Wavelet analysis of the time series extracted from
UKMO stratospheric fields for westward propagating wavesshows a good agreement with the observations in the MLTregion and with the results of simulation, and allows us tosuggest that the most likely source of the 6.5-day wavegeneration is a nonlinear interaction between the 7-day wavewith m = 2 and SPW with m = 1, which is well developedduring the time interval considered. The results of numericalsimulation support this idea and show that the 6.5-day waveobserved in the MLT region can be explained as a result ofnonlinear interaction in the stratosphere between the 7-daywave (m = 2) and SPWwithm = 1. This interaction results inproduction of the so-called ‘‘difference secondary wave’’with the period of primary traveling wave and zonal wavenumber that is a difference of zonal wave numbers of theinteracting waves. The calculations of the atmosphericresponse performed with constant amplitude of the SPWand lower boundary forcing for the primary wave with m = 2show that there is a resonant response at the period between 6and 7 days, and the 6.5-day wave can be considered as asecondary normal atmospheric mode, which has been excitedby random meteorological motions in the lower atmospherein presence of SPW with m = 1.[32] There exists a good agreement between the results of
numerical simulation and the analysis of MLT radar andstratospheric UKMO assimilated data; however, the oscil-lations of zonal wind for considered wave modes cannot beobserved at middle latitudes in the MLT region, and furtherinvestigations involving into consideration radar datarecorded at tropical and/or subtropical latitudes, have tobe performed to understand better the problem of PWvariability and the potential role of a nonlinear interactionbetween the primary planetary waves.
[33] Acknowledgments. We are grateful to the UKMO and BADCfor access to the data. We also acknowledge many important and helpfuldiscussions from D. Riggin and R. S. Lieberman.[34] The Editor would like to thank the reviewer of this manuscript.
ReferencesAushev, V. M., A. I. Pogoreltsev, V. V. Vodyannikov, R. H. Wiens, andG. G. Shepherd, Results of the airglow and temperature observations byMORTI at the Almaty site (43.05N, 76.97E), Phys. Chem. Earth Part B,25, 409–415, 2000.
Beard, A. G., N. J. Mitchell, P. J. S. Williams, and M. Kunitake, Non-linearinteractions between tides and planetary waves resulting in periodic tidalvariability, J. Atmos.Sol. Terr. Phys., 61, 363–376, 1999.
Cevolani, G., and S. Kingsley, Non-linear effects on tidal and planetarywaves in the lower thermosphere: Preliminary results, Adv. Space Res.,12(10), 77–80, 1992.
Clark, R. R., M. D. Burrage, S. J. Franke, A. H. Manson, C. E. Meek, N. J.Mitchell, and H. G. Muller, Observations of planetary waves with MLTradars and the UARS-HRDI instrument, J. Atmos. Sol. Terr. Phys., 64,1217–1228, 2002.
Hayashi, Y., A generalized method of resolving disturbances into progres-sive and retrogressive waves by space Fourier and time cross-spectralanalysis, J. Meteorol. Soc. Jpn., 49, 125–128, 1971.
Hedin, A. E., Extension of the MSIS thermosphere model into the middleand lower atmosphere, J. Geophys. Res., 96, 1159–1172, 1991.
Hedin, A. E., et al., Empirical wind model for the upper, middle and loweratmosphere, J. Atmos. Terr. Phys., 58, 1421–1447, 1996.
Jacobi, C., R. Schminder, and D. Kurschner, Non-linear interaction of thequasi 2-day wave and long-term oscillations in the summer midlatitudemesopause region as seen from LF D1 wind measurements over centralEurope (Collm, 52�N, 15�E), J. Atmos. Sol. Terr. Phys., 60, 1175–1191,1998.
Kamalabadi, F., J. M. Forbes, N. M. Makarov, and Y. I. Portnyagin, Evi-dence for nonlinear coupling of planetary waves and tides in the Antarcticmesopause, J. Geophys. Res., 102, 4437–4446, 1997.
Longuet-Higgins, M. S., The eigenfunctions of Laplace’s tidal equationover a sphere, Philos. Trans. R. Soc. London, Part A, 262, 511–607,1968.
Madden, R. A., Observations of large-scale traveling Rossby waves, Rev.Geophys. Space Phys., 17, 1935–1949, 1979.
Manson, A. H., J. B. Gregory, and C. E. Meek, Atmospheric waves (10min-30 days) in the mesosphere and thermosphere at Saskatoon (52�N,107�W) October 1978–September 1979, Planet. Space Sci., 29, 615–625, 1981.
Meek, C. E., An efficient method for analyzing ionospheric drift data,J. Atmos. Terr. Phys., 41, 251–258, 1980.
Meyer, C. K., and J. M. Forbes, A 6.5-day westward propagating wave:Origin and characteristics, J. Geophys. Res., 102, 26,173–26,178, 1997.
Mitchell, N. J., P. J. S. Williams, A. G. Beard, G. R. Buesnel, and H. G.Muller, Non-linear planetary/tidal interactions in the lower thermosphereobserved by meteor radar, Ann. Geophys., 14, 364–366, 1996.
Mitchell, N. J., H. R. Middleton, A. G. Beard, P. J. S. Williams, and H. G.Muller, The 16-day planetary wave in the mesosphere and lower thermo-sphere, Ann. Geophys., 17, 1447–1456, 1999.
Pancheva, D., A. G. Beard, N. J. Mitchell, and H. G. Muller, Nonlinearinteractions between planetary waves in the mesosphere/lower thermo-sphere region, J. Geophys. Res., 105, 157–170, 2000.
Pancheva, D., et al., Global-scale tidal variability during the PSMOS cam-paign on June-August 1999: Interaction with planetary waves, J. Atmos.Sol. Terr. Phys., 64, 1865–1896, 2002.
Pogoreltsev, A. I., Simulation of planetary waves and their influence on thezonally averaged circulation in the middle atmosphere, Earth PlanetsSpace, 51, 773–784, 1999.
Pogoreltsev, A. I., Numerical simulation of secondary planetary wavesarising from the nonlinear interaction of the normal atmospheric modes,Phys. Chem. Earth, Part C, 26, 395–403, 2001.
Pogoreltsev, A. I., D. Pancheva, and N. J. Mitchell, Secondary planetarywaves in the middle atmosphere: Numerical simulation and analysis ofthe neutral wind data, J. Atmos. Sol. Terr. Phys., 64, 1251–1261, 2002.
Press, W. H., and S. A. Teukolsky, Search algorithm for weak periodicsignal in unevenly spaced data, Comput. Phys., 2, 77–82, 1988.
Salby, M. L., Survey of planetary-scale traveling waves: The state of theoryand observations, Rev. Geophys., 22, 209–236, 1984.
Spizzichino, A., Etude des interactions entre les differentes composantes duvent dans la haute atmosphere, Ann. Geophys., 25, 773–783, 1969.
Swinbank, R., and A. O’Neill, A stratosphere-troposphere assimilationsystem, Mon. Weather Rev., 122, 686–702, 1994.
Talaat, E. R., J.-H. Yee, and Xun Zhu, Observations of the 6.5-day wave inthe mesosphere and lower thermosphere, J. Geophys. Res., 106, 20,715–20,724, 2001.
Talaat, E. R., J.-H. Yee, and Xun Zhu, The 6.5-daywave in the tropicalstratosphere and mesosphere, J.Geophys. Res., 107(D12), 4133,doi:10.1029/2001JD000822, 2002.
Torrence, C., and G. P. Compo, A practical guide to wavelet analysis, Bull.Am. Meteorol. Soc., 79, 61–78, 1998.
POGORELTSEV ET AL.: GLOBAL FREE OSCILLATIONS AND SECONDARY WAVES ACL 24 - 11

Wu, D. L., P. B. Hays, and W. R. Skinner, Observations of the 5-day in themesosphere and lower thermosphere, Geophys. Res. Lett., 21, 2733–2736, 1994.
�����������������������I. N. Fedulina, Institute of Ionosphere, Ministry of Education and
Science, Almaty 480020, Kazakhstan. ([email protected])Y. Luo, Canada Centre for Remote Sensing, Natural Resources Canada,
Ottawa, Ontario, Canada. ([email protected])
A. H. Manson and C. E. Meek, Institute of Space and AtmosphericStudies, University of Saskatchewan, Saskatoon, Saskatchewan, SK S7N5E2, Canada. ([email protected]; [email protected])N. J. Mitchell, Department of Electronic and Electrical Engineering,
University of Bath, Bath, UK. ([email protected])H. G. Muller, University of Cranfield, Royal Military College of Science,
Shrivenham, Swindon, UK.A. I. Pogoreltsev, Institute for Meteorology, Leipzig University, Leipzig,
Germany. ([email protected])
ACL 24 - 12 POGORELTSEV ET AL.: GLOBAL FREE OSCILLATIONS AND SECONDARY WAVES


