Embed Size (px)
Citation preview

H2O Vapor Transmission Rate through Polyethylene NaphthalatePolymer Using the Electrical Ca TestJ. A. Bertrand,† D. J. Higgs,† M. J. Young,‡ and S. M. George*,†,§
†Department of Chemistry and Biochemistry, ‡Department of Chemical and Biological Engineering, and §Department of MechanicalEngineering, University of Colorado, Boulder, Colorado 80309-0215, United States
ABSTRACT: The electrical Ca test was used to measure H2O vaportransmission through polyethylene naphthalate (PEN) polymer with athickness of 200 μm. On the basis of the time required for the normalizedconductance of the Ca film to reach zero, the H2O vapor transmission ratewas determined versus H2O flux, temperature, and saturation of the PENpolymer with H2O. The H2O vapor transmission rate was proportional tothe H2O flux and only weakly dependent on temperature at constant H2Oflux. The transmission coefficient, Γ, for H2O through the PEN polymer at70 °C was Γ ∼ 3.2 × 10⁻¹⁰. The corresponding water vapor transmissionrate (WVTR) at 70 °C/80% RH was 0.65 g/(m2 day). The temperature dependence of the H2O vapor transmission rate throughPEN at constant H2O flux yielded an activation barrier of E = 12.4 kJ/mol. There was no observable reservoir effect for H2O inthe PEN polymer. The H2O vapor transmission rates for initially dry or H2O-saturated PEN polymer substrates were nearlyidentical at various temperatures. Although the time required for the normalized conductance of the Ca film to reach zero wasinversely proportional to the H2O flux, the Ca film conductance did not decrease linearly versus H2O exposure. The Ca filmconductance changed very little during initial H2O exposure. This behavior may be caused by the nonlinear oxidation kinetics ofthe Ca film.
1. INTRODUCTIONThe transmission of water through polymers is important inmany polymer applications including the packaging of food,medicines, and organic electronics. The transmission rate of apolymer is determined by the permeability multiplied by thepressure and divided by the polymer thickness. According tothe solution-diffusion model,1 the permeability, P, isdetermined by the product of the diffusivity and solubility,i.e., P = DS, where D is the diffusion coefficient and S is thesolubility. The diffusion coefficient is a kinetic parameter, andthe solubility is a thermodynamic parameter. The diffusioncoefficient will be influenced by local activation barriers forH2O migration in the polymer. The solubility will be affectedby the interaction energy between H2O and the polymer.The diffusion coefficients and solubilities are not known for
many different gaseous molecules in various polymers. Becauseof the importance of water, there have been measurements ofH2O permeability through a wide range of polymers.2−9 H2Opermeabilities vary widely from 12 barrer in polyethylene3 to40 000 barrer in polydimethylsiloxane.2 (1 barrer = 10−10 (cm3
(STP) cm)/(s cm2 cm Hg) where STP is standard temperatureand pressure.)10 The differences in permeabilities reflect theunderlying diffusion coefficients and solubilities for H2O inthese polymers. At high H2O concentrations, water also addscomplexity because of its strong hydrogen bonding that leads toH2O clustering and a lower H2O permeability.4,6,8
Polyethylene naphthalate (PEN) is an optically clearpolyester polymer that has been targeted as the substrate forflexible organic light-emitting diodes (OLEDs).11 To ourknowledge, there are no peer-reviewed literature water vapor
transmission rate (WVTR) values reported for PEN. However,H2O permeability in PEN is known to be reasonably high andPEN requires a gas diffusion barrier to be useful for OLEDapplications.11 Without the gas diffusion barrier, H2O willoxidize the low work function metals used in the cathodes ofOLED devices. Al2O3 coatings grown using atomic layerdeposition (ALD) on PEN have been demonstrated to be veryeffective gas diffusion barriers. WVTRs of ≤5 × 10⁻⁵ g/(m2
day) at 38 °C/85% RH have been reported for Al2O3 ALDcoatings on PEN substrates.12,13 These low WVTRs are close tothe ultralow WVTRs of ∼10−5 to 10−6 g/(m2 day) that arerequired for OLEDs on polymers.14
There are no standard testing methods that can measureultralow WVTRs. The commercial MOCON test is capable ofmeasuring WVTRs only as low as 5 × 10⁻⁴ g/(m2 day). The“Ca test” is one custom method that has been employed tomeasure ultralow WVTRs. The calcium test uses a thin,metallic, Ca layer as a sensor to measure water vaportransmission rates.15−17 The Ca film can be monitored as theopaque, metallic Ca film oxidizes to transparent and electricallyinsulating calcium hydroxide [Ca(OH)2].
18,19 The electricalconductance of the Ca film can be used to measure the Ca filmoxidation.17 The optical transmittance of the Ca film can alsobe utilized to characterize the extent of Ca film oxidation.16
Special Issue: Curt Wittig Festschrift
Received: May 1, 2013Revised: July 12, 2013
Article
pubs.acs.org/JPCA
© XXXX American Chemical Society A dx.doi.org/10.1021/jp4043057 | J. Phys. Chem. A XXXX, XXX, XXX−XXX

Other versions of the Ca test involve measuring the oxidizedarea of the Ca film.15 The Ca test has been employed by manyinvestigators to measure WVTRs.12,13,15−17,20−24
In this study, the H2O vapor transmission rate through PENpolymer with a thickness of 200 μm was measured using theelectrical Ca test. Initial experiments measured the H2O vaportransmission through the PEN polymer with an Al2O3 ALDdiffusion barrier. Because the electrical conductance did notdecrease linearly versus H2O exposure, additional experimentsexplored the PEN polymer by itself. The H2O vaportransmission rate through the PEN polymer was measuredversus H2O flux at constant temperature. The H2O vaportransmission through the PEN polymer is expected to scalelinearly with H2O flux if the H2O molecules do not cluster oralter the PEN polymer.The H2O vapor transmission rate was also measured versus
temperature at constant H2O flux. The temperature depend-ence of the H2O vapor transmission reveals details about thekinetics of H2O adsorption, desorption, absorption, andtransport through the PEN polymer. The H2O vaportransmission rate was also determined versus saturation of thePEN polymer with H2O at different relative humidities. Thesemeasurements assess whether there is a H2O reservoir in thePEN polymer. These studies help to understand H2O vaportransmission through PEN polymer with and without an Al2O3ALD diffusion barrier and reveal characteristics of the electricalCa test versus H2O exposure.
2. EXPERIMENTAL SECTION
A. Preparation of Ca Films and Polymer Samples. TheCa films were prepared on 3 in. × 1 in. glass slides. The slideswere first base-bathed to remove any oils and then washed withwater, acetone, and methanol. They were left in the methanolbath and placed under a HEPA particle hood where they weresubsequently blown dry with filtered N2. Double-sided tape wasthen used to attach stainless steel masks to the glass slides. Themasks covered a 0.5 in. strip down the center of the glass slide,leaving a 0.25 in. section on either side to be coated withchromium (Cr) metal. Multiple masked slides were thenattached to a sample platter that was placed inside a physicalvapor deposition (PVD) chamber. This PVD chamber attachedto a glovebox has been described previously.25
Chromium metal was deposited by sputtering using 400 Wof forward power with a 15 mTorr partial pressure of Ar for 20min. These conditions produced a Cr contact thickness of∼540 nm. The glass slides were then removed, unmasked, andvisually inspected for contact uniformity. The coated slideswere washed with acetone and methanol to remove adhesiveresidue. After being blown dry, they were then cut into three 1in. × 1 in. squares and placed in the N2 glovebox for Cadeposition.Immediately prior to each Ca test run, one of the 1 in. × 1 in.
glass squares was placed on a custom PVD sample platter andmasked to produce a 0.75 in. × 0.5 in. area for Ca deposition.The platter was then inserted into the PVD chamber from theglovebox via a transfer arm and gate valve. Calcium films weredeposited using 300 W of forward power with a 15 mTorrpartial pressure of Ar. Ca deposition times were typically ∼10min. These conditions deposited a Ca film with a thickness of275 nm as determined by focused ion beam (FIB) scanningelectron microscopy (SEM) measurements. The thickness was275 ±15 nm on the basis of five separate FIB-SEM
measurements. The Ca-coated glass squares were then returnedto the N2 glovebox for assembly into the Ca test apparatus.X-ray photoelectron spectroscopy (XPS) analysis revealed
that the Ca films contained 20 at. % oxygen.25 For these XPSmeasurements, Ca was sputtered onto a glass slide using a maskto define the Ca film. A protective Cr film was then sputteredonto and around the Ca film using a larger mask. This Cr filmprotected the Ca film from direct exposure to atmosphere. Thesample was then removed from the glovebox and placed in theXPS instrument. Argon was used to sputter through theprotective Cr film and XPS data was then obtained from the Cafilm. The XPS signals showed a consistent value of 20 at. % Othroughout the Ca film from the protective Cr film to the glasssubstrate.The PEN polymer samples were Teonex Q65F from DuPont
Teijin Films with a thickness of 200 μm (8 mil). The polymersamples were defined using a custom die to cut circles from asheet of the PEN polymer. The polymer sheet was stored in theH2O/O2-free glovebox. The polymer samples were immediatelyreturned to the glovebox after cutting and stored until neededfor the experiments.
B. Ca Test Apparatus. The Ca test apparatus was designedto (1) measure the electrical conductance of the Ca film withminimal residual H2O in the apparatus and (2) prevent H2Oingress that did not pass through the polymer substrate. A topview of the Ca film sensor is shown in Figure 1. A side view of
the Ca test apparatus is displayed in Figure 2. The Ca testapparatus consisted of a base flange, an electrical flange, anadapter flange, a sample cover flange (small flange and outerring), and a Ca sensor and holder.The base flange was made from a standard 41/2 in. CF
viewport and was fitted with a holder for the Ca film sensor.The viewport allowed the Ca film to be visually monitored witha USB microscope. The holder was made from stainless steel.Contact insulators on the holder were made from Macor. Theseinsulators prevented the electrical contacts from shorting to the
Figure 1. Schematic top-down view of the calcium film sensor.
The Journal of Physical Chemistry A Article
dx.doi.org/10.1021/jp4043057 | J. Phys. Chem. A XXXX, XXX, XXX−XXXB
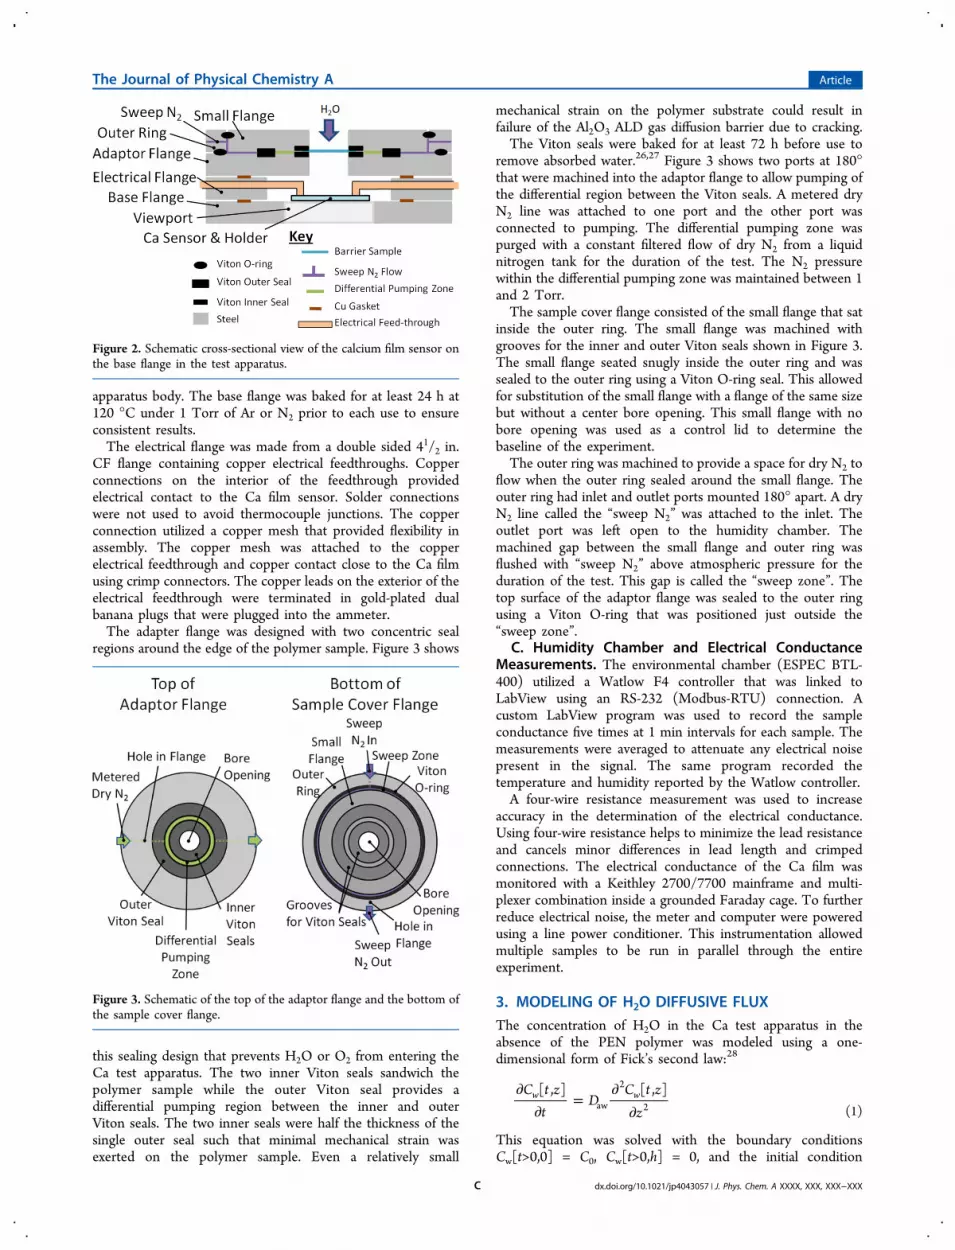
apparatus body. The base flange was baked for at least 24 h at120 °C under 1 Torr of Ar or N2 prior to each use to ensureconsistent results.The electrical flange was made from a double sided 41/2 in.
CF flange containing copper electrical feedthroughs. Copperconnections on the interior of the feedthrough providedelectrical contact to the Ca film sensor. Solder connectionswere not used to avoid thermocouple junctions. The copperconnection utilized a copper mesh that provided flexibility inassembly. The copper mesh was attached to the copperelectrical feedthrough and copper contact close to the Ca filmusing crimp connectors. The copper leads on the exterior of theelectrical feedthrough were terminated in gold-plated dualbanana plugs that were plugged into the ammeter.The adapter flange was designed with two concentric seal
regions around the edge of the polymer sample. Figure 3 shows
this sealing design that prevents H2O or O2 from entering theCa test apparatus. The two inner Viton seals sandwich thepolymer sample while the outer Viton seal provides adifferential pumping region between the inner and outerViton seals. The two inner seals were half the thickness of thesingle outer seal such that minimal mechanical strain wasexerted on the polymer sample. Even a relatively small
mechanical strain on the polymer substrate could result infailure of the Al2O3 ALD gas diffusion barrier due to cracking.The Viton seals were baked for at least 72 h before use to
remove absorbed water.26,27 Figure 3 shows two ports at 180°that were machined into the adaptor flange to allow pumping ofthe differential region between the Viton seals. A metered dryN2 line was attached to one port and the other port wasconnected to pumping. The differential pumping zone waspurged with a constant filtered flow of dry N2 from a liquidnitrogen tank for the duration of the test. The N2 pressurewithin the differential pumping zone was maintained between 1and 2 Torr.The sample cover flange consisted of the small flange that sat
inside the outer ring. The small flange was machined withgrooves for the inner and outer Viton seals shown in Figure 3.The small flange seated snugly inside the outer ring and wassealed to the outer ring using a Viton O-ring seal. This allowedfor substitution of the small flange with a flange of the same sizebut without a center bore opening. This small flange with nobore opening was used as a control lid to determine thebaseline of the experiment.The outer ring was machined to provide a space for dry N2 to
flow when the outer ring sealed around the small flange. Theouter ring had inlet and outlet ports mounted 180° apart. A dryN2 line called the “sweep N2” was attached to the inlet. Theoutlet port was left open to the humidity chamber. Themachined gap between the small flange and outer ring wasflushed with “sweep N2” above atmospheric pressure for theduration of the test. This gap is called the “sweep zone”. Thetop surface of the adaptor flange was sealed to the outer ringusing a Viton O-ring that was positioned just outside the“sweep zone”.
C. Humidity Chamber and Electrical ConductanceMeasurements. The environmental chamber (ESPEC BTL-400) utilized a Watlow F4 controller that was linked toLabView using an RS-232 (Modbus-RTU) connection. Acustom LabView program was used to record the sampleconductance five times at 1 min intervals for each sample. Themeasurements were averaged to attenuate any electrical noisepresent in the signal. The same program recorded thetemperature and humidity reported by the Watlow controller.A four-wire resistance measurement was used to increase
accuracy in the determination of the electrical conductance.Using four-wire resistance helps to minimize the lead resistanceand cancels minor differences in lead length and crimpedconnections. The electrical conductance of the Ca film wasmonitored with a Keithley 2700/7700 mainframe and multi-plexer combination inside a grounded Faraday cage. To furtherreduce electrical noise, the meter and computer were poweredusing a line power conditioner. This instrumentation allowedmultiple samples to be run in parallel through the entireexperiment.
3. MODELING OF H2O DIFFUSIVE FLUXThe concentration of H2O in the Ca test apparatus in theabsence of the PEN polymer was modeled using a one-dimensional form of Fick’s second law:28
∂∂
=∂
∂C t z
tD
C t zz
[ , ] [ , ]w waw
2
2 (1)
This equation was solved with the boundary conditionsCw[t>0,0] = C0, Cw[t>0,h] = 0, and the initial condition
Figure 2. Schematic cross-sectional view of the calcium film sensor onthe base flange in the test apparatus.
Figure 3. Schematic of the top of the adaptor flange and the bottom ofthe sample cover flange.
The Journal of Physical Chemistry A Article
dx.doi.org/10.1021/jp4043057 | J. Phys. Chem. A XXXX, XXX, XXX−XXXC

Cw[0,z] = 0. In this equation, Cw is the concentration of water,Daw is the diffusivity of water in air, and h = 6.2 cm is thedistance from the top face of the sample cover flange to thesurface of the Ca film.The boundary condition Cw[t>0,h] = 0 assumes the
instantaneous reaction of every H2O molecule that collideswith the calcium surface. In addition, there is no radialdependence of the H2O concentration. There is also a uniformtemperature in the Ca test apparatus. The solution for Cw[t,z]with these boundary conditions takes the form of a Fourierseries:29
∑ λ= + λ
∞
=−C t z C A z[ , ] e sin[ ]w
n
nD t
nwss
1n
2aw
(2)
where
λ π= nhn (3)
∫ λ= −Ah
C z C z z2
( [0, ] ) sin[ ] dn
h
n0
w wss
(4)
= −⎜ ⎟⎛⎝
⎞⎠C C
zh
1wss
0 (5)
These equations also yield the H2O flux onto the calciumsurface as
= −∂
∂ =
J t DC t z
z[ ]
[ , ]h
z haw
w
(6)
Under the assumption that all the H2O molecules that collidewith the Ca film react with the Ca film, the total moles of waterreacted per unit area of calcium is
∫= ′ ′N t J t t[ ] [ ] dt
h0 (7)
Results obtained using this model included only the first 20terms of the Fourier series given in eq 2.
4. RESULTS AND DISCUSSIONThe conductance of the Ca sensor film decreases as the Ca filmis oxidized by O2 or H2O exposure. Because the humiditychamber is purged with N2, all Ca oxidation will be attributedto water. H2O has also been shown to be much more effectiveat oxidizing Ca than O2.
18,30 A conductance curve for a PENpolymer coated with an Al2O3 ALD barrier with a thickness of25 nm is shown in Figure 4. These results were obtained using70 °C and 80% relative humidity (RH). The conductance curveshows a characteristic form. The conductance is initially veryflat versus H2O exposure time. The conductance then dropsrapidly at later H2O exposure times. The conductance reacheszero at ∼280 h with an Al2O3 ALD gas diffusion barrier on thePEN polymer.Initial conductance that does not change for a certain H2O
exposure time is often interpreted as a “lag time”.31 This lagtime could be caused by a long tortuous path for H2Omolecules through the barrier film. The lag time may also beexplained as a “reservoir effect” where H2O must fill up thepolymer prior to leaving the polymer.32 In addition, the lagtime may be caused by resistance in series with the Ca film thatis larger than the Ca film itself.33 The Ca film then does notinfluence the resistance measurements until later stages of Cafilm oxidation. The transition to the “fall off” region may also be
caused by H2O dissolution of the Al2O3 barrier.34 To determine
whether the negligible change in the initial conductance isrelated to the Al2O3 ALD barrier or the PEN polymer, a seriesof experiments were performed to examine the behavior of thePEN polymer by itself.The conductance versus time for a bare PEN polymer at 70
°C/40% RH is shown in Figure 5. The functional form of the
conductance versus H2O exposure time in Figure 5 is verysimilar to the results in Figure 4. However, the time requiredfor the conductance to reach zero is much shorter. Theconductance reaches zero in ∼23 h in Figure 5 for the PENpolymer compared with ∼280 h in Figure 4 for the PENpolymer coated with the Al2O3 ALD barrier. The Ca filmthickness was constant at ∼275 nm for the results in Figures 4and 5.Figure 5 is also used to define the terms for the different
parts of the Ca film conductance versus H2O exposure timecurve. The initial conductance is nearly constant in the “lagregion”. The lag region occurs until the “knee”. After the knee,the decrease of the conductance is the “fall off region”. Thepoint at which the conductance reaches zero is the “end point”.From t = 0 to the end point when the conductance is zero is the“sensor lifetime”.
Figure 4. Normalized conductance versus time for a 0.025 μm Al2O3ALD barrier on a PEN polymer with a thickness of 200 μm. The Cafilm thickness was 275 nm, and the experimental conditions were 70°C and 80% RH.
Figure 5. Normalized conductance versus time for a bare PENpolymer with a thickness of 200 μm. The Ca film thickness was 275nm, and the experimental conditions were 70 °C and 40% RH.
The Journal of Physical Chemistry A Article
dx.doi.org/10.1021/jp4043057 | J. Phys. Chem. A XXXX, XXX, XXX−XXXD

Additional conductance measurements were performed todetermine the sensor lifetime as a function of relative humidityat 70 °C. These experiments were again performed for barePEN polymer substrates. The results at 25% RH and 60% RHare shown in Figure 6. The effect of the H2O % RH on the Ca
film lifetime is significant. The sensor lifetime for 25% RH is∼36 h. The sensor lifetime for 60% RH is ∼18 h. The sensorlifetime is approximately inversely related to the % RH.Figure 7 shows the dependence of the sensor lifetime versus
1/flux at 70 °C. The Ca film lifetime is linearly dependent on
1/flux. The sensor lifetime is shorter for the higher H2O vaporpressures at 70 °C. This dependence is consistent with a simplemechanism where each H2O collision with the PEN polymerhas a certain probability of transmitting H2O through thepolymer. A schematic of the interaction and transmission ofH2O through a polymer is shown in Figure 8.The assumed mechanism displayed in Figure 8 is a multistep
process. The incident water molecule first adsorbs and resideson the polymer surface prior to either desorbing from thepolymer or absorbing into the polymer. After absorbing and
subsequently diffusing through the polymer, the H2O moleculecan desorb from the other side of the polymer. The H2Omolecules that desorb from the other side of the polymer arethe transmitted H2O molecules. These H2O molecules enterthe Ca test apparatus and oxidize the Ca film.The transmission coefficient for H2O through the PEN
polymer is the number of H2O molecules that are transmittedthrough the PEN polymer divided by the number of H2O ofmolecules that are incident on the PEN polymer surface. Thetransmission coefficient is calculated by
Γ = NJ t0 f (8)
N is the number of H2O molecules that are needed to oxidizethe Ca film to form Ca(OH)2, J0 is the incident H2O flux on thePEN polymer, and tf is the sensor lifetime, i.e., the timerequired for the normalized conductance to reach zero. Thetransmission coefficient and the incident H2O flux define thewater vapor transmission rate (WVTR) according to
= ΓJWVTR 0 (9)
This WVTR has units of molecules/(m2 h) and can be easilyconverted to the units of g/(m2 day) more commonlyemployed for the WVTR. For the determination of thetransmission coefficient, the H2O flux onto the polymer surfacewas derived from kinetic gas theory:
π=J P mkT/ 20 (10)
P is the partial pressure of water, m is the mass of a watermolecule, k is the Boltzmann constant, and T is thetemperature.For a given calcium film thickness, h, the number of water
molecules needed to fully oxidize a unit area of the calcium filmwith 20 at. % oxygen as determined by XPS analysis is given by
ρ=N
h w qnNmCa A
Ca (11)
In this equation, the density of the Ca film was derived byassuming that the Ca film with 20 atom % oxygen is composedof bulk Ca and bulk CaO. If all the oxygen is present as CaO,then a simple “rule of mixtures” calculation yields a density of ρ≅ 1.86 g/cm3. wCa ≅ 0.91 is the mass fraction of calcium in thefilm, q ≅ 0.825 is the fraction of Ca atoms available to beoxidized, n = 2 is the stoichiometric ratio for H2O:Ca for thecalcium oxidation reaction to form Ca(OH)2, NA is Avogadro’snumber, and mCa is the atomic mass of calcium.For the H2O vapor transmission measurements at 70 °C, eq
10 can be simplified to J0 ≅ 3.78 × 1028 molecules/(m2 h) × %
Figure 6. Normalized conductance versus time for a bare PENpolymer with a thickness of 200 μm at 70 °C/25% RH and 70 °C/60% RH. The Ca film thickness was 275 nm.
Figure 7. Sensor lifetime versus 1/flux at 70 °C for a bare PENpolymer with a thickness of 200 μm. The Ca film thickness was 275nm.
Figure 8. Schematic of the H2O processes on the polymer includingadsorption, desorption, absorption, and transmission.
The Journal of Physical Chemistry A Article
dx.doi.org/10.1021/jp4043057 | J. Phys. Chem. A XXXX, XXX, XXX−XXXE

RH. Equation 11 yields N ≅ 1.16 × 10²² molecules/m2 for acalcium thickness of 275 nm. Therefore, the transmissioncoefficient at these conditions is given by
Γ ≅ ××
−
t3.07 10% RH
7
f (12)
where tf is in units of hours. These definitions can be used todetermine transmission coefficients and WVTRs for the data inFigures 4−7 on the basis of the time required to oxidize the Cafilm. This sensor lifetime is based on the end point for thenormalized conductance of the Ca film. The transmissioncoefficient and WVTR values are given in Table 1.
Additional experiments examined the temperature depend-ence of the Ca film lifetime at constant H2O flux. A constantflux onto the polymer surface was maintained by changing bothtemperature and humidity within the environmental chamber.Figure 9 shows that the sensor lifetime versus temperature
decreased only slightly with temperature at a fixed flux of J0 =2.9 × 1026 molecules/(m2 s). The error bars represent onestandard deviation for the three samples that were tested ateach temperature.The temperature dependent sensor lifetime data in Figure 9
was analyzed assuming Arrhenius dependence. The plot of ln(1/sensor lifetime) versus 1/T is displayed in Figure 10. Thisplot yields an activation energy of E = 12.4 kJ/mol. Thisactivation energy results from the temperature dependence of
the H2O sticking coefficient, the barrier for H2O desorptionfrom the polymer surface, and the barrier for H2O vaportransmission through the PEN polymer. H2O desorption willlower the H2O residence time on the polymer surface anddecrease the number of H2O molecules entering the polymer.The effect of increased H2O desorption alone would beexpected to decrease the transmission coefficient and increasethe sensor lifetime.Figure 9 shows that the sensor lifetime decreases at higher
temperatures. This decreasing sensor lifetime is consistent withmore H2O molecules transmitted through the PEN polymer athigher temperature. This behavior argues that the activationbarrier for H2O vapor transmission through the polymer islarger than the activation barrier for H2O desorption from thepolymer surface. The actual barrier for H2O vapor transmissionthrough the polymer is expected to be higher than E = 12.4 kJ/mol because H2O desorption lowers the H2O vapor trans-mission rate at higher temperatures.The interpretation of the “lag time” is still uncertain. The
sensor lifetime is inversely dependent on the H2O flux atconstant temperature and the sensor lifetime includes the lagtime. To check whether a reservoir effect causes the lag time,the sensor lifetime was measured for both dry and water-saturated PEN polymers at 70 °C. Figure 11 shows the resultsfor a dry polymer and a polymer saturated with H2O at 60%RH. The sensor lifetime showed no observable differencebetween a dry or H2O saturated PEN polymer.The sensor lifetimes were measured versus % RH at 70 °C.
The relative humidity was varied between the lower and upperlimits of the humidity chamber from 25% to 80% RH. Figure 12reveals that there is no difference between dry or H2O-saturated PEN polymers. Estimates of the transmissioncoefficient and water vapor transmission rate for theseconditions yield values of Γ = 3.0 × 10⁻¹⁰ and WVTR = 0.49g/(m2 day) for the saturated polymer at 60% RH, and Γ = 2.7× 10⁻¹⁰ and WVTR = 0.44 g/(m2 day) for the dry polymer at60% RH. These results indicate that there is no H2O reservoirin the PEN polymer. The lag region in the plots of conductanceversus time cannot be attributed to a H2O reservoir effect.Because the lag region cannot be attributed to the PEN
polymer, additional experiments were performed by measuringthe conductance versus H2O exposure time with no polymerf ilm between the H2O flux and the Ca film. The polymer was
Table 1. Transmission Coefficients and WVTR Values forH2O Vapor Transmission through the PEN Polymer at 70°Cand different H2O Relative Humiditiesa
conditionRH(%) tf (h)
J0 [1029 molecules/(m2·h)]
Γ(10−11)
WVTR [g/(m2·day)]
ALD onPEN
80 280 30 1.4 0.030
bare PEN 80 13 30 30 0.65bare PEN 60 17 23 30 0.49bare PEN 40 23 15 33 0.36bare PEN 25 36 9.5 34 0.23aThe H2O fluxes corresponding to the H2O relative humidities andthe times required for the normalized conductance to reach zero arealso given.
Figure 9. Sensor lifetime for a Ca film thickness of 275 nm with a H2Oflux of 2.9 × 10¹⁶ molecules/(m2 s) on a bare PEN polymer with athickness of 200 μm at various temperatures.
Figure 10. Arrhenius plot of the sensor lifetimes versus temperature inFigure 9.
The Journal of Physical Chemistry A Article
dx.doi.org/10.1021/jp4043057 | J. Phys. Chem. A XXXX, XXX, XXX−XXXF

removed from the test apparatus before measuring theconductance. Figure 13 shows the experimental conductanceversus time at 70 °C and 25% RH. The low humidity waschosen to extend the life of the Ca film for as long as possible.In addition, the Ca film thickness was increased to ∼550 nm bydoubling the Ca deposition time to ∼20 min. This larger Cafilm thickness was confirmed by FIB-SEM measurements.The experimental conductance versus time shown in Figure
13 again has the same functional form as the previous curvesshown in Figures 4−6 and 11. However, the sensor lifetime isnow only ∼9 min. This experiment was conducted six times.Each experiment showed the same response with the samefunctional form for the conductance versus time and sensorlifetimes between 7 and 9 min.The results for the sensor lifetime with no polymer film were
modeled using one-dimensional Fickian diffusion. Thesecalculations determined whether H2O diffusion into the Catest apparatus could account for the ∼8 min lag region. The Cafilm was assumed to oxidize linearly versus H2O exposure. Thenormalized conductance was assumed to be proportional to theunreacted Ca film thickness. These calculations assumed
oxidation of the Ca film to form Ca(OH)2 and an initial Cafilm thickness of 550 nm.The predicted normalized conductances shown in Figure 13
were generated for 70 °C/25% RH and 25 °C/25% RH. Thepredictions at 25 °C/25% RH were performed to establish anupper limit on the predictions at 25% RH. For 70 °C/25% RH,C0 = 3.10 μmol/cm3 and Daw = 19.2 cm2/min.35,36 For 25 °C/25% RH, C0 = 0.32 μmol/cm3 and Daw = 15.0 cm2/min.35,36
The difference between the predictions at 25 and 70 °C resultsfrom the higher absolute H2O concentration for 25% RH at 70°C.The model predicts a sensor lifetime of 0.77 min at 70 °C/
25% RH. This prediction is an order of magnitude less than theexperimental value at 70 °C/25% RH. The model predicts asensor lifetime of 5.19 min at 25 °C/25% RH. This predictionis 42% less than the experimental value at 70 °C/25% RH.These predictions reveal that H2O diffusion into the Ca testapparatus cannot be the sole cause of the lag in the Ca filmsensor response. These results suggest that the lag in the Cafilm response must be caused by the oxidation of the Ca filmitself.The experimental Ca film conductance versus H2O exposure
time shows the same functional form whether there is nopolymer, a bare PEN polymer, or an ALD barrier on the PENpolymer to restrict the H2O flux. Only the time scale changesbetween the different experiments. The results for the barePEN polymer and the ALD barrier on the PEN polymer couldbe explained by a resistance in series with the Ca film thatdominates the measurements until the Ca film resistanceincreases at later stages of Ca film oxidation.33
To measure the resistance in series with the Ca film, theresistance was determined for different Ca film thicknessesusing four-wire resistance measurements performed inside theglovebox with a Cr film thickness of ∼540 nm. Resistancemeasurements were obtained for Ca film thicknesses of 270,410, and 570 nm. These thicknesses were determined usingFIB/SEM analysis on reference samples. The slope of the plotof resistance versus 1/thickness was then employed todetermine the film resistivity using R = ρl/A where R isresistance, ρ is resistivity, l is the length of the film, and A is thecross-sectional area of the film. A resistivity of ρ = 1.34 × 10⁻⁴
Ω cm was obtained for these Ca films containing 20 at. % O.
Figure 11. Normalized conductance versus time for a dry andsaturated PEN polymer with a thickness of 200 μm. The Ca filmthickness was 275 nm and the experimental conditions were 70 °C and60% RH.
Figure 12. Sensor lifetimes versus % RH at 70 °C for dry andsaturated PEN polymer with a thickness of 200 μm. The Ca filmthickness was 275 nm.
Figure 13. Normalized conductance versus time at 70 °C/25% RH fora Ca film with a thickness of 550 nm with no PEN polymer.Calculations of the predicted conductance based on a diffusion modelare shown for comparison at 70 °C/25% RH and 25 °C/25% RH.
The Journal of Physical Chemistry A Article
dx.doi.org/10.1021/jp4043057 | J. Phys. Chem. A XXXX, XXX, XXX−XXXG

The y-intercept of the plot of resistance versus 1/thicknessyielded a resistance of 0.23 Ω. This is the resistance in serieswith the Ca film. This series resistance is attributed to the Cu/Cr contact resistances, the Cr film resistances, and the Cr film/Ca contact resistances. This series resistance is negligiblecompared with the measured resistance of ∼10 Ω for the initialCa film samples. These measurements argue that resistance inseries with the Ca film does not dominate the resistance at theinitial stages of Ca film oxidation. The nearly constant Ca filmconductance during the initial H2O exposure is attributed to thenonlinear oxidation kinetics of the Ca film.Although the initial oxidation kinetics of the Ca film display
nonlinearity, the time required for the normalized conductanceto reach zero is inversely dependent on the H2O flux. Thisbehavior indicates that the Ca film may require a thresholdnumber of H2O molecules to initiate Ca film oxidation. Afterreaching this threshold, the Ca film may react readily with allthe H2O molecules. This explanation could explain theobservation that the sensor lifetime is inversely dependent onthe H2O flux.The nonlinear oxidation kinetics of the Ca film may not be
surprising given the very inhomogeneous nature of Ca filmoxidation that has been revealed by recent atomic forcemicroscope (AFM) studies.33,37 The AFM investigationsshowed that H2O exposure leads to considerable filmroughening. Nonlinear oxidation kinetics were also reportedby previous studies of Ca film oxidation by H2O.
18,19,38 The Cafilm oxidation kinetics varied versus temperature and H2Oexposure time. Deviations from linearity were especiallyapparent during the initial stages of Ca film oxidation.The nonlinear oxidation kinetics of the Ca film will affect the
WVTR values determined using the Ca test. The Ca testassumes a linear oxidation of the Ca film versus H2O exposure.This linear oxidation is then assumed to produce a lineardecrease in the conductance of the Ca film. The rate of theconductance change versus time yields a WVTR value.17 Incontrast, a nonlinear decrease in the conductance of the Ca filmis observed as exemplified by the results shown in Figure 4. Theconductance versus time in Figure 4 can be analyzed todetermine how the nonlinear oxidation kinetics affect thederived WVTR values.At early times during the H2O exposure, the change in the
conductance versus time is negligible. This region was definedas the “lag region” in Figure 5. The “lag region” of Figure 4yields a WVTR value of ∼0.002 g/(m2 day). At later timesduring the H2O exposure, the change in the conductance versustime is substantial. This region was defined as the “fall off”region in Figure 5. The “fall off” region of Figure 4 yields aWVTR value of ∼0.40 g/(m2 day). In contrast, end pointanalysis using the “sensor lifetime” was employed to calculatethe WVTR values given in Table 1. Using end point analysis,Figure 4 yields a WVTR value of ∼0.03 g/(m2 day). End pointanalysis is equivalent to assuming a linear decrease inconductance of the Ca film.The WVTR values obtained from Figure 4 vary from ∼0.002
to ∼0.40 g/(m2 day). The WVTR value derived from the endpoint analysis is ∼0.03 g/(m2 day). This WVTR is in themiddle between the low WVTR value obtained from the “lagregion” and the high WVTR value obtained from the “fall off”region. The WVTR value derived from the end point analysis isthe most reliable because this value does not depend on thespecific oxidation kinetics of the Ca film. The only assumptionof the end point analysis is that all the H2O molecules will
eventually react with the Ca film. Future applications of the Catest to determine WVTR values should be performed until theCa film is completely oxidized to remove the uncertainty fromthe nonlinear oxidation kinetics of the Ca film.
5. CONCLUSIONSH2O vapor transmission through PEN polymer with a thicknessof 200 μm was measured using the electrical Ca test. The H2Ovapor transmission rate was determined as a function of theH2O flux, temperature, and saturation of the PEN polymer withH2O. Using the time required for the normalized conductanceof the Ca film to reach zero, the measurements revealed thatthe H2O vapor transmission rate was dependent on the H2Oflux and only weakly dependent on temperature at constantH2O flux. The transmission coefficient for H2O through thePEN polymer was Γ ∼ 3.2 × 10⁻¹⁰ at 70 °C. The WVTR at 70°C/80% RH corresponding to this transmission rate was 0.65g/(m2 day). An activation barrier of E = 12.4 kJ/mol wasobtained from the temperature dependence of the H2O vaportransmission rate through PEN polymer at constant H2O flux.The H2O vapor transmission rates for initially dry or H2O-saturated PEN polymer substrates at various temperatures werenearly identical. These results indicate that there is no reservoireffect for H2O in the PEN polymer.The Ca film conductance did not decrease linearly versus
H2O exposure. The initial Ca film conductance was nearlyconstant during H2O exposure. The conductance thendecreased abruptly after longer H2O exposure times. Thenearly constant initial Ca film conductance versus H2Oexposure could not be explained by a resistance in series withthe Ca film. In addition, the results for Ca film oxidation in theabsence of the PEN polymer are not consistent with linearoxidation kinetics. Nonlinear initial oxidation kinetics of the Cafilm are required to explain the nonlinear dependence of the Cafilm conductance versus H2O exposure.
■ AUTHOR INFORMATIONCorresponding Author*E-mail: [email protected].
NotesThe authors declare no competing financial interest.
■ ACKNOWLEDGMENTSThis work was supported by the Defense Advanced ResearchProjects Agency (DARPA) under Contract NumbersN10PC20168 and D11PC20172, through SBIR Phase I andII programs led by Dr. Markus Groner at ALD NanoSolutions,Inc. The authors acknowledge useful discussions with UweSchroder and Hannes Klumbies at the University of Dresden.The authors also thank Andrew S. Cavanagh for XPS analysis ofthe Ca films.
■ REFERENCES(1) Wijmans, J. G.; Baker, R. W. The Solution-Diffusion Model - AReview. J. Membr. Sci. 1995, 107, 1−21.(2) Allen, S. M.; Fujii, M.; Stannett, V.; Hopfenberg, H. B.; Williams,J. L. Barrier Properties of Polyacrylonitrile. J. Membr. Sci. 1977, 2,153−164.(3) Barrie, J. A. In Diffusion in Polymers; Crank, J., Park, G. S., Eds.;Academic Press: New York, 1968.(4) Barrie, J. A.; Platt, B. The Diffusion and Clustering of WaterVapour in Polymers. Polymer 1963, 4, 303−313.
The Journal of Physical Chemistry A Article
dx.doi.org/10.1021/jp4043057 | J. Phys. Chem. A XXXX, XXX, XXX−XXXH

(5) Chen, G. Q.; Scholes, C. A.; Qiao, G. G.; Kentish, S. E. WaterVapor Permeation in Polyimide Membranes. J. Membr. Sci. 2011, 379,479−487.(6) Debeaufort, F.; Voilley, A.; Meares, P. Water-Vapor Permeabilityand Diffusivity through Methylcellulose Edible Films. J. Membr. Sci.1994, 91, 125−133.(7) Despond, S.; Espuche, E.; Domard, A. Water Sorption andPermeation in Chitosan Films: Relation Between Gas Permeability andRelative Humidity. J. Polym. Sci. Polym. Phys. 2001, 39, 3114−3127.(8) Schult, K. A.; Paul, D. R. Water Sorption and Transport in aSeries of Polysulfones. J. Polym. Sci. Polym. Phys. 1996, 34, 2805−2817.(9) Zhang, Z. B.; Britt, I. J.; Tung, M. A. Permeation of Oxygen andWater Vapor Through EVOH Films As Influenced by RelativeHumidity. J. Appl. Polym. Sci. 2001, 82, 1866−1872.(10) Stern, S. A. Barrer Permeability Unit. J. Polym. Sci. A2 1968, 6,1933−1934.(11) MacDonald, W. A. Engineered Films for Display Technologies.J. Mater. Chem. 2004, 14, 4−10.(12) Carcia, P. F.; McLean, R. S.; Groner, M. D.; Dameron, A. A.;George, S. M. Gas Diffusion Ultrabarriers on Polymer SubstratesUsing Al2O3 Atomic Layer Deposition and SiN Plasma-EnhancedChemical Vapor Deposition. J. Appl. Phys. 2009, 106, 023533.(13) Carcia, P. F.; McLean, R. S.; Reilly, M. H.; Groner, M. D.;George, S. M. Ca Test of Al2O3 Gas Diffusion Barriers Grown byAtomic Layer Deposition on Polymers. Appl. Phys. Lett. 2006, 89,031915.(14) Lewis, J. S.; Weaver, M. S. Thin-Film Permeation-BarrierTechnology for Flexible Organic Light-Emitting Devices. IEEE J. Sel.Top. Quant. Elect. 2004, 10, 45−57.(15) Kumar, R. S.; Auch, M.; Ou, E.; Ewald, G.; Jin, C. S. LowMoisture Permeation Measurement through Polymer Substrates forOrganic Light Emitting Devices. Thin Solid Films 2002, 417, 120−126.(16) Nisato, G.; Bouten, P. C. P.; Slikkerveer, P. J.; Bennett, W. D.;Graff, G. L.; Rutherford, N.; Wiese, L. Evaluating Higher PerformanceDiffusion Barriers: The Calcium Test. Proc. Asia Display/IDW ’012001, 1435.(17) Paetzold, R.; Winnacker, A.; Henseler, D.; Cesari, V.; Heuser, K.Permeation Rate Measurements by Electrical Analysis of CalciumCorrosion. Rev. Sci. Instrum. 2003, 74, 5147−5150.(18) Gregg, S. J.; Jepson, W. B. Oxidation of Calcium in MoistOxygen. J. Chem. Soc. 1961, 884−888.(19) Svec, H. J.; Apel, C. Metal-Water Reactions. 4. Kinetics of theReaction Between Calcium and Water Vapor. J. Electrochem. Soc. 1957,104, 346−349.(20) Chen, T. N.; Wuu, D. S.; Wu, C. C.; Chiang, C. C.; Chen, Y. P.;Horng, R. H. Improvements of Permeation Barrier Coatings UsingEncapsulated Parylene Interlayers for Flexible Electronic Applications.Plasma Process. Polym. 2007, 4, 180−185.(21) Choi, J. H.; Kim, Y. M.; Park, Y. W.; Huh, J. W.; Ju, B. K.; Kim,I. S.; Hwang, H. N. Evaluation of Gas Permeation Barrier PropertiesUsing Electrical Measurements of Calcium Degradation. Rev. Sci.Instrum. 2007, 78, 064701.(22) Kim, T. W.; Yan, M.; Erlat, G.; McConnelee, P. A.; Pellow, M.;Deluca, J.; Feist, T. P.; Duggal, A. R.; Schaepkens, M. TransparentHybrid Inorganic/Organic Barrier Coatings for Plastic Organic Light-Emitting Diode Substrates. J. Vac. Sci. Technol. A 2005, 23, 971−977.(23) Meyer, J.; Gorrn, P.; Bertram, F.; Hamwi, S.; Winkler, T.;Johannes, H. H.; Weimann, T.; Hinze, P.; Riedl, T.; Kowalsky, W.Al2O3/ZrO2 Nanolaminates as Ultrahigh Gas-Diffusion Barriers-AStrategy for Reliable Encapsulation of Organic Electronics. Adv. Mater.2009, 21, 1845−1849.(24) Reese, M. O.; Dameron, A. A.; Kempe, M. D. QuantitativeCalcium Resistivity Based Method for Accurate and Scalable WaterVapor Transmission Rate Measurement Rev. Sci. Instrum. 2011, 82,(25) Bertrand, J. A.; George, S. M. Evaluating Al2O3 Gas DiffusionBarriers Grown Directly on Ca Films Using Atomic Layer DepositionTechniques J. Vac. Sci. Technol. A 2013, 31,(26) Crawley, D. J.; Decserna., L. Degassing Characteristics of SomeO-Ring Materials. Vacuum 1964, 14, 7−9.
(27) De Csernatony, L. The Properties of Viton A Elastomers. II.Influence of Permeation, Diffusion and Solubility of Gases on GasEmission Rate from an O-Ring Used as an Atmospheric Seal or HighVacuum Immersed. Vacuum 1966, 16, 129−134.(28) Bird, R.; Stewart, W.; Lightfoot, E. Transport Phenomena; JohnWiley & Sons: New York, 2002.(29) Asmar, N. H. Partial Differential Equations with Fourier Series andBoundary Value Problems: Pearson/Prentice Hall: Englewood Cliffs,NJ, 2005.(30) Cros, S.; Firon, M.; Lenfant, S.; Trouslard, P.; Beck, L. Study ofThin Calcium Electrode Degradation by Ion Beam Analysis. Nucl.Instrum. Methods Phys. Res., Sect. B 2006, 251, 257−260.(31) Graff, G. L.; Williford, R. E.; Burrows, P. E. Mechanisms ofVapor Permeation Through Multilayer Barrier Films: Lag Time versusEquilibrium Permeation. J. Appl. Phys. 2004, 96, 1840−1849.(32) van der Wel, G. K.; Adan, O. C. G. Moisture in OrganicCoatings - A Review. Prog. Org. Coat. 1999, 37, 1−14.(33) Schubert, S.; Klumbies, H.; Muller-Meskamp, L.; Leo, K.Electrical Calcium Test for Moisture Barrier Evaluation for OrganicDevices. Rev. Sci. Instrum. 2011, 82, 094101.(34) Dameron, A. A.; Davidson, S. D.; Burton, B. B.; Carcia, P. F.;McLean, R. S.; George, S. M. Gas Diffusion Barriers on PolymersUsing Multilayers Fabricated by Al2O3 and Rapid SiO2 Atomic LayerDeposition. J. Phys. Chem. C 2008, 112, 4573−4580.(35) Bolz, R. E.; Tuve, G. L. CRC Handbook of Tables for AppliedEngineering; CRC Press: New York, 1976.(36) Hirschfelder, J. O.; Curtiss, C. F.; Bird, R. B. Molecular Theory ofGases and Liquids; John Wiley & Sons: New York, 1967.(37) Klumbies, H.; Muller-Meskamp, L.; Monch, T.; Schubert, S.;Leo, K. The Influence of Laterally Inhomogeous Corrosion onElectrical and Optical Calcium Moisture Barrier Characterization. Rev.Sci. Instrum. 2013, 84, 024103.(38) Nissen, D. A. Low-Temperature Oxidation of Calcium by WaterVapor. Oxid. Met. 1977, 11, 241−261.
The Journal of Physical Chemistry A Article
dx.doi.org/10.1021/jp4043057 | J. Phys. Chem. A XXXX, XXX, XXX−XXXI


