Embed Size (px)
Citation preview
Ministry of Health and Family Welfare
HARYANA DISTRICT LEVEL HOUSEHOLD AND FACILITY SURVEY (2012-13)
DLHS-4
International Institute for Population Sciences (Deemed University)
Mumbai
INTERNATIONAL INSTITUTE FOR POPULATION SCIENCES
Vision: “To position IIPS as a premier teaching and research institution in
population sciences responsive to emerging national and global needs based on values of inclusion, sensitivity and rights protection.”
Mission: “The Institute will strive to be a centre of excellence on population, health
and development issues through high quality education, teaching and research. This will be achieved by (a) creating competent professionals, (b) generating and disseminating scientific knowledge and evidence, (c) collaboration and exchange of knowledge, and (d) advocacy and awareness.”
Ministry of Health and Family Welfare
New Delhi-110 011
District Level Household and Facility Survey 2012-13
Haryana
International Institute for Population Sciences
(Deemed University) Mumbai-400 088
2014
Suggested citation:- International Institute for Population Sciences (IIPS), 2014. District Level Household and Facility Survey (DLHS-4), 2012-13: India. Haryana: Mumbai: IIPS.
For additional information, please contact: Director/Project Coordinator (DLHS-4) International Institute for Population Sciences Govandi Station Road, Deonar Mumbai - 400 088 (India) Telephone: 022-2556 3254/5/6, 022-4237 2465, 42372411 Fax: 022-25563257, 25555895 Email: [email protected], [email protected] Website: http://www.rchiips.org http://www.iipsindia.org Additional Director General (Stat.) Ministry of Health and Family Welfare Government of India Nirman Bhavan New Delhi 110 011 Telephone: 011 - 23061334 Fax: 011 - 23061334 Email: [email protected] Chief Director (Stat.) Ministry of Health and Family Welfare Government of India Nirman Bhavan New Delhi 110 011 Telephone: 011 - 23062699 Fax: 011 - 23062699 Email: [email protected]
Website: http: //www.mohfw.nic.in
CONTRIBUTORS B. Paswan S. K. Singh Imran Ahmad Ashish Kumar Upadhyay

vii
CONTENTS PAGE
1. INTRODUCTION AND HOUSEHOLD CHARACTERISTICS ......................... 1
2. SURVEY DESIGN....... ......................................................................................... 2
3. SURVEY INSTRUMENTS ................................................................................... 4
4. DEMOGRAPHIC BACKGROUND OF HARYANA .......................................... 6
5. CHARACTERISTICS OF WOMEN AND FERTILITY ..................................... 8
6. MATERNAL HEALTH CARE ............................................................................. 12
7. CHILD HEALTH AND IMMUNIZATION.......................................................... 15
8. FAMILY PLANNING AND CONTRACEPTIVE USE ....................................... 19
9. REPRODUCTIVE HEALTH ............................................................................... 22
10. PERSONAL HABITS .......................................................................................... 24
11. MORBIDITY STATUS ....................................................................................... 28
12. NUTRITION AND HEALTH ............................................................................. 32
13. HEALTH FACILITIES ....................................................................................... 38
TABLES ..................................................................................................................... 43-173
APPENDIX ................................................................................................................ 175-179
viii
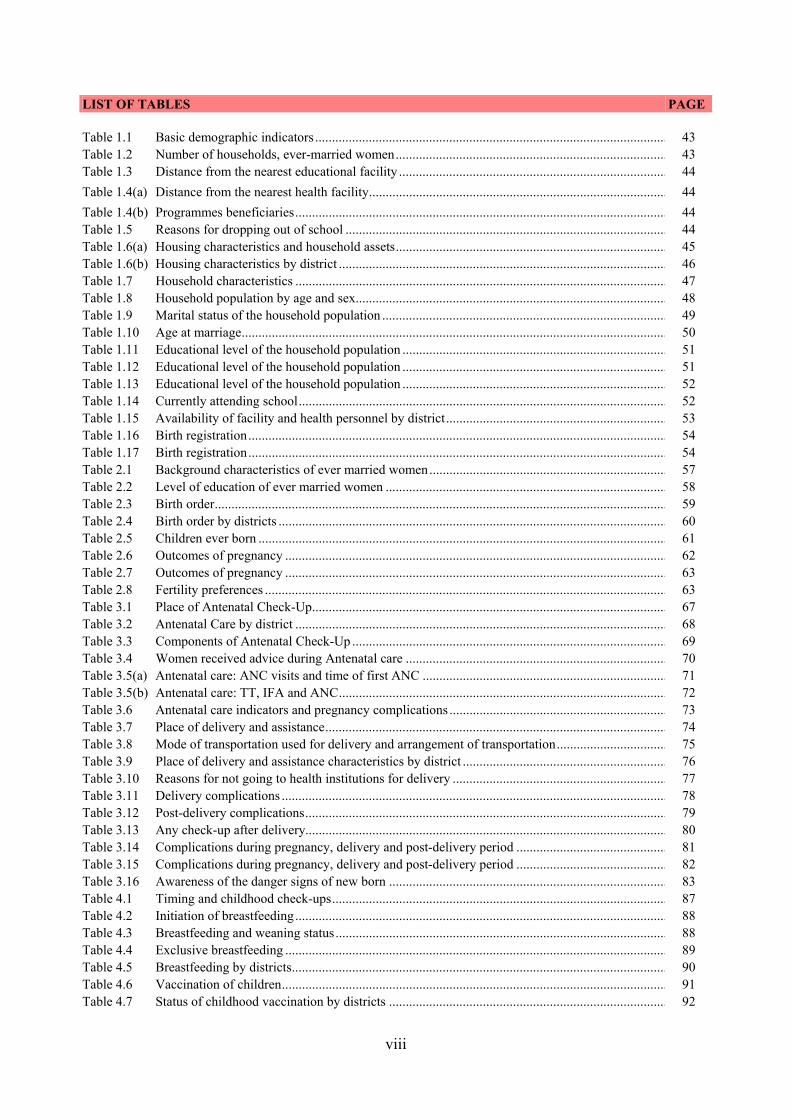
LIST OF TABLES PAGE
Table 1.1 Basic demographic indicators ......................................................................................................... 43 Table 1.2 Number of households, ever-married women ................................................................................. 43 Table 1.3 Distance from the nearest educational facility ................................................................................ 44
Table 1.4(a) Distance from the nearest health facility ......................................................................................... 44
Table 1.4(b) Programmes beneficiaries ............................................................................................................... 44 Table 1.5 Reasons for dropping out of school ................................................................................................ 44 Table 1.6(a) Housing characteristics and household assets ................................................................................. 45 Table 1.6(b) Housing characteristics by district .................................................................................................. 46 Table 1.7 Household characteristics ............................................................................................................... 47 Table 1.8 Household population by age and sex............................................................................................. 48 Table 1.9 Marital status of the household population ..................................................................................... 49 Table 1.10 Age at marriage ............................................................................................................................... 50 Table 1.11 Educational level of the household population ............................................................................... 51 Table 1.12 Educational level of the household population ............................................................................... 51 Table 1.13 Educational level of the household population ............................................................................... 52 Table 1.14 Currently attending school .............................................................................................................. 52 Table 1.15 Availability of facility and health personnel by district .................................................................. 53 Table 1.16 Birth registration ............................................................................................................................. 54 Table 1.17 Birth registration ............................................................................................................................. 54 Table 2.1 Background characteristics of ever married women ....................................................................... 57 Table 2.2 Level of education of ever married women .................................................................................... 58 Table 2.3 Birth order ....................................................................................................................................... 59 Table 2.4 Birth order by districts .................................................................................................................... 60 Table 2.5 Children ever born .......................................................................................................................... 61 Table 2.6 Outcomes of pregnancy .................................................................................................................. 62 Table 2.7 Outcomes of pregnancy .................................................................................................................. 63 Table 2.8 Fertility preferences ........................................................................................................................ 63 Table 3.1 Place of Antenatal Check-Up .......................................................................................................... 67 Table 3.2 Antenatal Care by district ............................................................................................................... 68 Table 3.3 Components of Antenatal Check-Up .............................................................................................. 69 Table 3.4 Women received advice during Antenatal care .............................................................................. 70 Table 3.5(a) Antenatal care: ANC visits and time of first ANC ......................................................................... 71 Table 3.5(b) Antenatal care: TT, IFA and ANC .................................................................................................. 72 Table 3.6 Antenatal care indicators and pregnancy complications ................................................................. 73 Table 3.7 Place of delivery and assistance ...................................................................................................... 74 Table 3.8 Mode of transportation used for delivery and arrangement of transportation ................................. 75 Table 3.9 Place of delivery and assistance characteristics by district ............................................................. 76 Table 3.10 Reasons for not going to health institutions for delivery ................................................................ 77 Table 3.11 Delivery complications ................................................................................................................... 78 Table 3.12 Post-delivery complications ............................................................................................................ 79 Table 3.13 Any check-up after delivery............................................................................................................ 80 Table 3.14 Complications during pregnancy, delivery and post-delivery period ............................................. 81 Table 3.15 Complications during pregnancy, delivery and post-delivery period ............................................. 82 Table 3.16 Awareness of the danger signs of new born ................................................................................... 83 Table 4.1 Timing and childhood check-ups .................................................................................................... 87 Table 4.2 Initiation of breastfeeding ............................................................................................................... 88 Table 4.3 Breastfeeding and weaning status ................................................................................................... 88 Table 4.4 Exclusive breastfeeding .................................................................................................................. 89 Table 4.5 Breastfeeding by districts ................................................................................................................ 90 Table 4.6 Vaccination of children ................................................................................................................... 91 Table 4.7 Status of childhood vaccination by districts ................................................................................... 92
ix
LIST OF TABLES PAGE Table 4.8 Place of childhood vaccination ....................................................................................................... 93 Table 4.9 Vitamin-A and Hepatitis-B supplementation for children .............................................................. 94 Table 4.10 Awareness regarding diarrhoea management ................................................................................. 95 Table 4.11 Treatment of diarrhoea .................................................................................................................... 96 Table 4.12 Awareness and treatment of Acute Respiratory Infection (ARI) .................................................... 97 Table 4.13 Awareness of ors and Acute Respiratory Infection (ARI) by districts ......................................... 98 Table 5.1 Awareness of contraceptive methods ........................................................................................... 101 Table 5.2 Awareness of contraceptive methods ........................................................................................... 102 Table 5.3 Awareness of contraceptive methods by district .......................................................................... 103 Table 5.4 Ever use of contraceptive method ................................................................................................ 104 Table 5.5(a) Current use of contraceptive methods .......................................................................................... 105 Table 5.5(b) Duration of use of spacing methods ............................................................................................. 107 Table 5.6 Age at the time of sterilization ..................................................................................................... 108 Table 5.7 Contraceptive prevalence rate by district ..................................................................................... 109 Table 5.8 Sources of modern contraceptive methods .................................................................................. 110 Table 5.9 Cash benefits received after sterilization ..................................................................................... 111 Table 5.10 Health problems with current use of contraception and treatment received ................................ 112 Table 5.11 Reasons for discontinuation of contraception .............................................................................. 113 Table 5.12 Future intention to use contraception ........................................................................................... 114 Table 5.13 Advice on contraceptive use ........................................................................................................ 115 Table 5.14 Reasons for not using modern contraceptive methods among rhythm and withdrawal method
users ............................................................................................................................................. 116 Table 5.15 Unmet need for family planning services .................................................................................... 117 Table 5.16 Unmet need for family planning services by district ................................................................... 118 Table 6.1 Menstruation related problems by background characteristics .................................................... 121 Table 6.2 Source of knowledge about RTI/STI by background characteristics ........................................... 123 Table 6.3 Knowledge of mode of transmission of RTI/STI by background characteristics ........................ 125 Table 6.4 Symptoms of RTI/STI by background characteristics ................................................................. 126 Table 6.5 Discussed about RTI/STI problems with husband and sought treatment by background
characteristics .............................................................................................................................. 128 Table 6.6 RTI/STI indicators by districts..................................................................................................... 129 Table 6.7 Knowledge of HIV/AIDS ............................................................................................................ 130
Table 6.8 Knowledge about mode of transmission of HIV/AIDS by background characteristics ............... 132
Table 6.9 Knowledge of HIV prevention methods by background characteristics ...................................... 133
Table 6.10 Misconception about transmission of HIV/AIDS by background characteristics ........................ 134
Table 6.11 Knowledge about the place where HIV/AIDS test can be done .................................................. 135 Table 6.12 Undergone HIV/AIDS test ........................................................................................................... 137 Table 6.13 HIV/AIDS indicators by districts ................................................................................................. 138 Table 7.1 Personal habits ............................................................................................................................. 141 Table 7.2 Personal habits-Men .................................................................................................................... 142 Table 7.3 Personal habits-Women ............................................................................................................... 143 Table 7.4 Personal habits ............................................................................................................................. 144 Table 7.5 Personal habits tobacco ................................................................................................................ 144 Table 7.6 Personal habits smoke .................................................................................................................. 144 Table 7.7 Personal habits drink alcohol ....................................................................................................... 145 Table 7.8 Morbidity details .......................................................................................................................... 145 Table 7.9 Morbidity details .......................................................................................................................... 145 Table 7.10 Morbidity details .......................................................................................................................... 145 Table 7.11 Morbidity details .......................................................................................................................... 146 Table 7.12 Morbidity details .......................................................................................................................... 146 Table 7.13 Morbidity details .......................................................................................................................... 147 Table 7.14 Morbidity details .......................................................................................................................... 147
x
LIST OF TABLES PAGE Table 7.15 Morbidity details .......................................................................................................................... 147 Table 7.16 Tuberculosis ................................................................................................................................. 148 Table 8.1 Nutritional status of children ....................................................................................................... 151 Table 8.2 Nutritional status of children by districts ..................................................................................... 152 Table 8.3 BMI (Body Mass Index) of women ............................................................................................. 153 Table 8.4 BMI (Body Mass Index) of women ............................................................................................. 153 Table 8.5 Prevalence of anaemia among children ....................................................................................... 154 Table 8.6 Anaemia among school going/adolescent population .................................................................. 154 Table 8.7 Anaemia among population aged 20 years and above ................................................................. 155 Table 8.8 Anaemia among population children, adolescents aged 20 years and above ............................... 156 Table 8.9 Anaemia among pregnant women ............................................................................................... 156 Table 8.10 Prevalence of diabetes ................................................................................................................. 157 Table 8.11 Prevalence of diabetes ................................................................................................................. 157 Table 8.12 Prevalence of diabetes ................................................................................................................. 158 Table 8.13 Prevalence of diabetes ................................................................................................................. 158 Table 8.14 Blood pressure ............................................................................................................................. 159 Table 8.15 Blood pressure ............................................................................................................................. 160 Table 8.16 Blood pressure ............................................................................................................................. 161 Table 8.17 Blood pressure ............................................................................................................................. 162 Table 8.18 Presence of iodized salt in household .......................................................................................... 163 Table 8.19 Presence of iodized salt in household .......................................................................................... 163 Table 9.1 Average population covered by health facility by districts .......................................................... 167 Table 9.2 Status of infrastructure at Sub-Health Centre functioning in government building by districts .. 167 Table 9.3 Percentage of Sub-Health Centres having different activities by districts ................................... 168 Table 9.4 Available human resources at Sub-Health Centres by districts ................................................... 168 Table 9.5 Available human resources at Primary Health Centres by districts ............................................. 169 Table 9.6 Available infrastructure at Primary Health Centres by districts................................................... 169 Table 9.7 Specific health facilities available at Primary Health Centres by districts .................................. 170 Table 9.8 Number of Primary Health Centres having different activities by districts ................................. 170 Table 9.9 Human resources available at Community Health Centres by districts ...................................... 171 Table 9.10 Specific health care facilities available at Community Health Centres by districts .................... 171 Table 9.11 Number of Community Health Centres having different activities by districts ........................... 172 Table 9.12 Human resources & other services available at Sub-Divisional Hospitals by districts .............. 172 Table 9.13 Human resources & other services available at District Hospitals by districts ......................... 173
xi
LIST OF FIGURES PAGE
Figure 1 Source of drinking water ................................................................................................... 7 Figure 2 Toilet facilities .................................................................................................................. 7 Figure 3 Age-sex composition of Haryana, 2012-13 ....................................................................... 7 Figure 4 School attendance by age and sex ..................................................................................... 8 Figure 5 Mean children ever born by districts ................................................................................. 10 Figure 6 Desire for the additional child/next child .......................................................................... 11 Figure 7 Any ANC by selected background characteristics ............................................................ 12 Figure 8 Progress in institutional delivery ....................................................................................... 14 Figure 9 Change in full immunization coverage of children ......................................................... 16 Figure 10 Percent of currently married women using contraceptive methods ................................... 19 Figure 11 Change in contraceptive prevalence rate ........................................................................... 19 Figure 12 Change in unmet need for contraception ........................................................................... 20 Figure 13 Contraceptive prevalence rate and unmet need by districts ............................................... 22
LIST OF MAPS PAGE
Map 1 Full ante-natal checkup by districts ......................................................................................... 13 Map 2 Institutional delivery by districts ............................................................................................. 14 Map 3 Full immunization coverage of children aged 12-23 months by districts................................ 18 Map 4 Contraceptive prevalence rate for any method by districts .................................................... 21
xii
ACRONYMS
AFMC Administrative and Financial Management Committee AHS Annual Health Survey AIDS Acquired Immuno Deficiency Syndrome ANC Antenatal Care ANM Auxiliary Nurse Midwife ARI Acute Respiratory Infection ASHA Accredited Social Health Activist AWW Anganwadi Worker AYUSH Ayurveda, Yoga and Naturopathy, Unani, Siddha and Homeopathy BCG Bacillus Calmette Guerin BP Blood Pressure BPL Below Poverty Line CAB Clinical Anthropometric Biochemical (Test) CAPI Computer Assisted Personnel Interviewing CHC Community Health Centre CPR Contraceptive Prevalence Rate DBS Dried Blood Spot DH District Hospital DLHS District Level Household and Facility Survey DPT Diphtheria, Pertussis and Tetanus EAG Empowered Action Group ECG Electrocardiogram ECP Emergency Contraceptive Pill ELISA Enzyme-linked Immunosorbent Assay EPI Expanded Programme on Immunization FA Field Agency FBS Fasting Blood Sugar FHW Female Health Worker FRU First Referral Unit FOD Field Operation Division FP Family Planning FS Female Sterilization FSU First Stage Unit GPS Global Positioning System GoI Government of India HH Household HIV Human Immuno Deficiency Virus ICDS Integrated Child Development Scheme ICTC Integrated Counselling and Testing Centre IEC Information, Education and Communication IFA Iron and Folic Acid IIPS International Institute for Population Sciences IMNCI Integrated Management of Neonatal and Childhood Illnesses IMR Infant Mortality Rate IPHS Indian Public Health Standards IUD Intra-uterine Device JSY Janani Suraksha Yojana LMO Lady Medical Officer LPG Liquefied Petroleum Gas MCEB Mean Children Ever Born MDG Millennium Development Goal MMR Maternal Mortality Ratio MO Medical Officer MoHFW Ministry of Health and Family Welfare MoU Memorandum of Understanding
xiii
ACRONYMS
MoA Memorandum of Agreement MTP Medical Termination of Pregnancy NC Natal Care NIC National Informatics Centre NIHFW National Institute of Health and Family Welfare NGO Non-Governmental Organisation NPP National Population Policy NRHM National Rural Health Mission NSSO National Sample Survey Organization NSV Non-scalpel Vasectomy OBC Other Backward Class OPD Out-Patient Department ORS Oral Re-hydration Salt ORT Oral Re-hydration Therapy OT Operation Theatre PHC Primary Health Centre PI Partner Institute PNC Post Natal Care PRC Population Research Centre PPS Probability Proportional to Size PSU Primary Sampling Unit RCH Reproductive and Child Health RKS Rogi Kalyan Samiti RTI Reproductive Tract Infection SDH Sub-Divisional Hospital SDRD Survey Design and Research Division SC Scheduled Caste SHC Sub-Health Centre ST Scheduled Tribe STI Sexually Transmitted Infection TBA Trained Birth Attendant TAC Technical Advisory Committee TOT Training of Trainers TT Tetanus Toxoid TV Television UFS Urban Frame Survey UFWC Urban Family Welfare Centre UHP Urban Health Post UIP Universal Immunization Programme UNFPA United Nations Population Fund UNICEF United Nation Children's Fund USU Ultimate Stage Sampling Unit UT Union Territory VCTC Voluntary Counseling and Testing Centre VHNSC Village Health Nutrition and Sanitation Committee WHO World Health Organisation

Preface and Acknowledgements
The District Level Household and Facility Survey-4 (DLHS-4) is a nationwide survey covering 640 districts from 36 States and Union Territories of India. This is the fourth round of the district level household survey which was conducted during 2012-13. The Survey was funded by the Ministry of Health and Family Welfare, Government of India.
At the outset, we acknowledge our sincere gratitude to the Ministry of Health & Family Welfare, Government of India for designating the International Institute for Population Sciences (IIPS) as the nodal agency for conducting District Level Household and Facility Survey-4 (DLHS-4) in India. We would also like to take this opportunity to acknowledge Shri Bhanu Pratap Sharma, Secretary-Ministry of Health and Family Welfare (MoHFW), Government of India for his advice, suggestions and support. Our special thanks are due to Shri Lov Verma and Shri Keshav Desiraju former Secretaries, Ministry of Health and Family Welfare (MoHFW), Government of India, for providing overall guidance and support extended to the project. We gratefully acknowledge the active involvement, assistance, help, co-operation and suggestions received time to time from Shri C.R.K. Nair, Additional Director General, Dr. Rattan Chand, Chief Director and Shri Biswajit Das, Director-Statistics Division, Ministry of Health and Family Welfare, Government of India. We also extend our thanks to Smt. Madhu Bala, former Additional Director General and Shri Rajesh Bhatia, former Director-Statistics Division, Ministry of Health and Family Welfare, Government of India for their support from time to time.
We gratefully acknowledge the NIHFW, New Delhi, especially Dr. M. M. Misro, Dr. T. G. Srivastava and Dr. Kalpna, for their immense help, assistance, support and coordination with all Partner Institutes to bring out quality DBS results/data. We also acknowledge our sincere gratitude to all Partner Institutes for providing training and support of CAB components and bringing out the quality DBS results.
We sincerely extend our appreciation to HLL Life Care Ltd., New Delhi, for procuring CAB equipments and consumables also supply chain to different states across the country.
Our special thanks are all the members of Technical Advisory Committee of DLHS-4, particularly Dr. N. S. Shastry, Chairman, Former DG & CEO (NSSO), for their constant involvement and technical inputs and support at various stages of the survey.
We also gratefully acknowledge all members of Sub-Committee on Sampling especially Shri G. C. Manna, Chairman, DDG, CSO, MoSPI for their technical support received from time to time.
Thanks are also due to Dr. Rajiv Mehta and Shri A. K. Mehra, former Additional Director Generals at the National Sample Survey Organisations, Kolkata for providing UFS blocks.
We thank Dr. T. K. Roy, Former Director, IIPS, for reviewing the model report and for his useful suggestions.
This acknowledgement cannot be concluded without expressing appreciation for the efforts and hard work put in by the field investigators, supervisors, health investigators in collecting data and timely transferring data to IIPS.
Last but not the least, we are grateful and appreciate the efforts of all the respondents who participated and spared their valuable time with us by providing the required information.
DLHS-4 Coordinators International Institute for Population Sciences

1
1. INTRODUCTION AND HOUSEHOLD CHARACTERISTICS
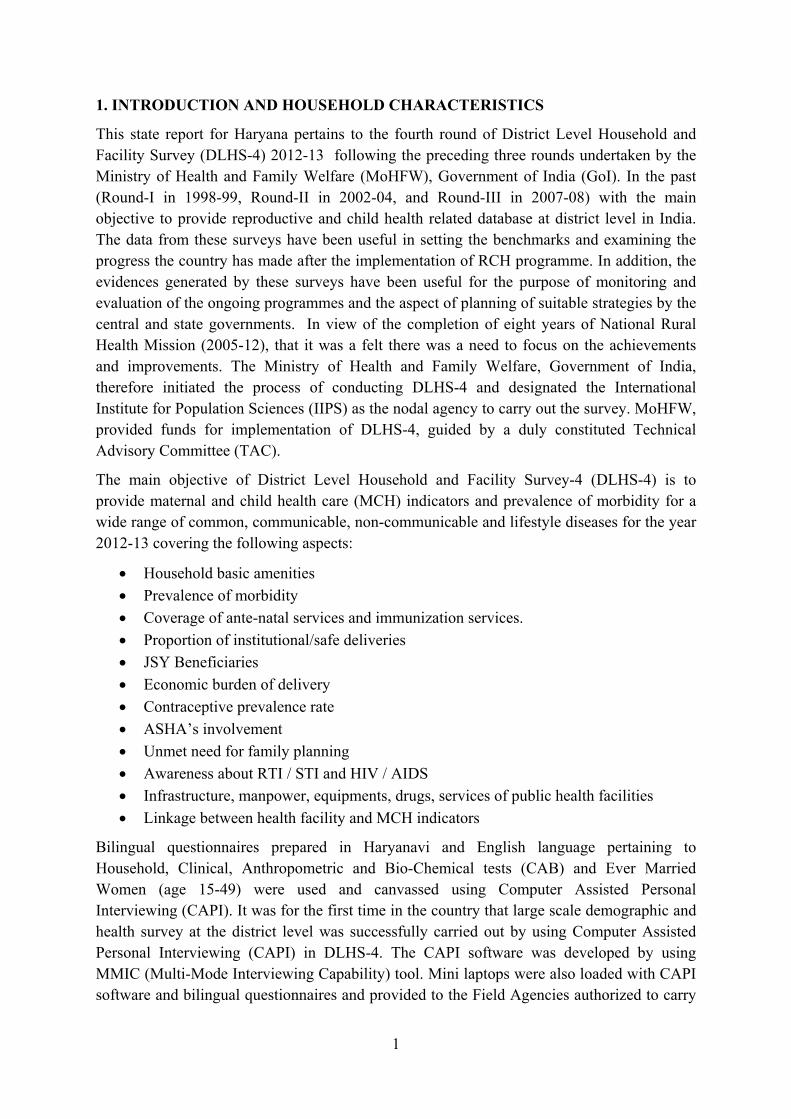
This state report for Haryana pertains to the fourth round of District Level Household and Facility Survey (DLHS-4) 2012-13 following the preceding three rounds undertaken by the Ministry of Health and Family Welfare (MoHFW), Government of India (GoI). In the past (Round-I in 1998-99, Round-II in 2002-04, and Round-III in 2007-08) with the main objective to provide reproductive and child health related database at district level in India. The data from these surveys have been useful in setting the benchmarks and examining the progress the country has made after the implementation of RCH programme. In addition, the evidences generated by these surveys have been useful for the purpose of monitoring and evaluation of the ongoing programmes and the aspect of planning of suitable strategies by the central and state governments. In view of the completion of eight years of National Rural Health Mission (2005-12), that it was a felt there was a need to focus on the achievements and improvements. The Ministry of Health and Family Welfare, Government of India, therefore initiated the process of conducting DLHS-4 and designated the International Institute for Population Sciences (IIPS) as the nodal agency to carry out the survey. MoHFW, provided funds for implementation of DLHS-4, guided by a duly constituted Technical Advisory Committee (TAC).
The main objective of District Level Household and Facility Survey-4 (DLHS-4) is to provide maternal and child health care (MCH) indicators and prevalence of morbidity for a wide range of common, communicable, non-communicable and lifestyle diseases for the year 2012-13 covering the following aspects:
Household basic amenities
Prevalence of morbidity
Coverage of ante-natal services and immunization services.
Proportion of institutional/safe deliveries
JSY Beneficiaries
Economic burden of delivery
Contraceptive prevalence rate
ASHA’s involvement
Unmet need for family planning
Awareness about RTI / STI and HIV / AIDS
Infrastructure, manpower, equipments, drugs, services of public health facilities
Linkage between health facility and MCH indicators
Bilingual questionnaires prepared in Haryanavi and English language pertaining to Household, Clinical, Anthropometric and Bio-Chemical tests (CAB) and Ever Married Women (age 15-49) were used and canvassed using Computer Assisted Personal Interviewing (CAPI). It was for the first time in the country that large scale demographic and health survey at the district level was successfully carried out by using Computer Assisted Personal Interviewing (CAPI) in DLHS-4. The CAPI software was developed by using MMIC (Multi-Mode Interviewing Capability) tool. Mini laptops were also loaded with CAPI software and bilingual questionnaires and provided to the Field Agencies authorized to carry
2
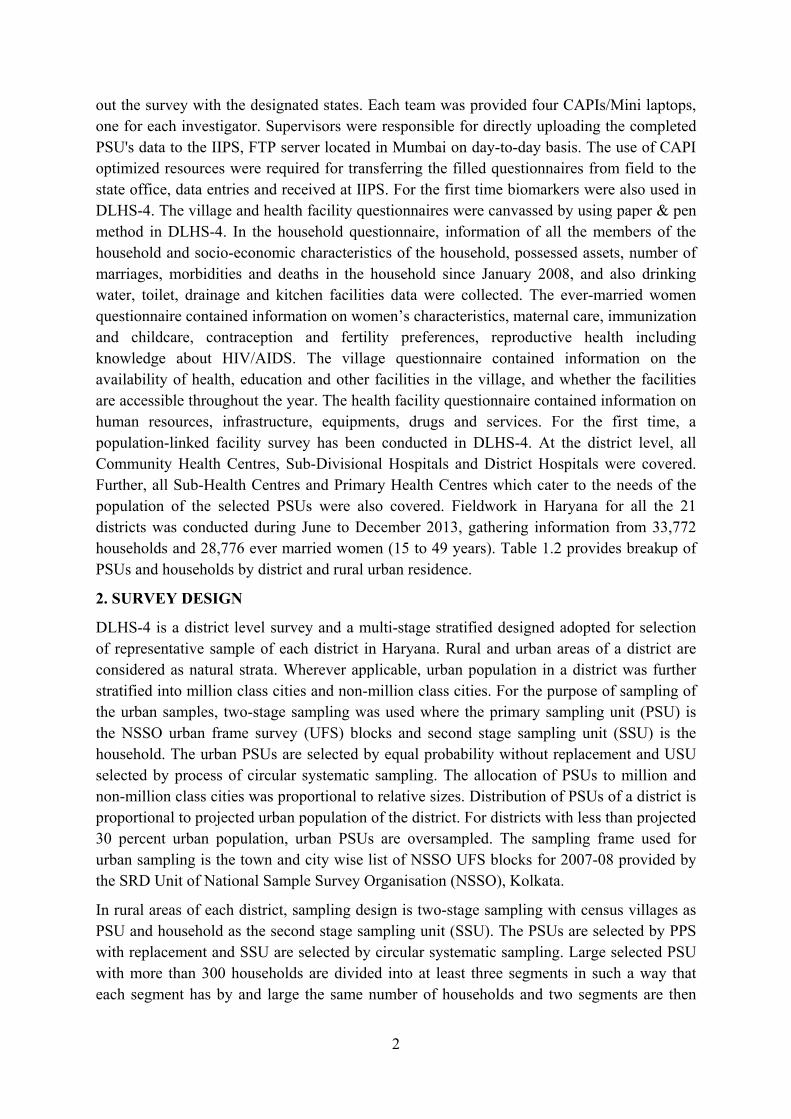
out the survey with the designated states. Each team was provided four CAPIs/Mini laptops, one for each investigator. Supervisors were responsible for directly uploading the completed PSU's data to the IIPS, FTP server located in Mumbai on day-to-day basis. The use of CAPI optimized resources were required for transferring the filled questionnaires from field to the state office, data entries and received at IIPS. For the first time biomarkers were also used in DLHS-4. The village and health facility questionnaires were canvassed by using paper & pen method in DLHS-4. In the household questionnaire, information of all the members of the household and socio-economic characteristics of the household, possessed assets, number of marriages, morbidities and deaths in the household since January 2008, and also drinking water, toilet, drainage and kitchen facilities data were collected. The ever-married women questionnaire contained information on women’s characteristics, maternal care, immunization and childcare, contraception and fertility preferences, reproductive health including knowledge about HIV/AIDS. The village questionnaire contained information on the availability of health, education and other facilities in the village, and whether the facilities are accessible throughout the year. The health facility questionnaire contained information on human resources, infrastructure, equipments, drugs and services. For the first time, a population-linked facility survey has been conducted in DLHS-4. At the district level, all Community Health Centres, Sub-Divisional Hospitals and District Hospitals were covered. Further, all Sub-Health Centres and Primary Health Centres which cater to the needs of the population of the selected PSUs were also covered. Fieldwork in Haryana for all the 21 districts was conducted during June to December 2013, gathering information from 33,772 households and 28,776 ever married women (15 to 49 years). Table 1.2 provides breakup of PSUs and households by district and rural urban residence.
2. SURVEY DESIGN
DLHS-4 is a district level survey and a multi-stage stratified designed adopted for selection of representative sample of each district in Haryana. Rural and urban areas of a district are considered as natural strata. Wherever applicable, urban population in a district was further stratified into million class cities and non-million class cities. For the purpose of sampling of the urban samples, two-stage sampling was used where the primary sampling unit (PSU) is the NSSO urban frame survey (UFS) blocks and second stage sampling unit (SSU) is the household. The urban PSUs are selected by equal probability without replacement and USU selected by process of circular systematic sampling. The allocation of PSUs to million and non-million class cities was proportional to relative sizes. Distribution of PSUs of a district is proportional to projected urban population of the district. For districts with less than projected 30 percent urban population, urban PSUs are oversampled. The sampling frame used for urban sampling is the town and city wise list of NSSO UFS blocks for 2007-08 provided by the SRD Unit of National Sample Survey Organisation (NSSO), Kolkata.
In rural areas of each district, sampling design is two-stage sampling with census villages as PSU and household as the second stage sampling unit (SSU). The PSUs are selected by PPS with replacement and SSU are selected by circular systematic sampling. Large selected PSU with more than 300 households are divided into at least three segments in such a way that each segment has by and large the same number of households and two segments are then
3
selected by SRS. List of villages in a district in Census 2001 are updated by removing villages of 2001 which have been designated as urban in 2007-08, NSSO UFS block list and this serves as the sampling frame for sampling of rural PSUs from a district.
Selection of rural health facilities in DLHS-4 is linked with the sampled rural PSUs. Primary Health Centres (PHC) and Sub-Health Centres (SHC) catered to the health care needs of the sampled rural PSUs were included in the Facility Survey (FS) of DLHS-4. All Community Health Centres (CHC), Sub-Divisional Hospitals and District Hospitals are covered under the Facility Survey of DLHS-4.
2.1. Sampling Weight
In generating district level demographic indicators, sample weight for household, women and children will be used. The weights for a particular district are based on three selection probabilities
f1i, f2
i and f3i pertaining to ith PSU of the district. These probabilities are defined as
f1i = Probability of selection of ith PSU in a district
= (n r* Hi)/H,
Where nr is the number of rural PSU to be selected in a district, Hi refers to the number of
household in the ith PSU and H = Hi , total number of household in a district.
f2i = Probability of selecting segment (s) from segmented PSU (in case the ith selected PSU
is segmented) = (Number of segments selected after segmentation of PSU)/(number of segment created a PSU)
The value of f2i is to be equal to one for un-segmented PSUs.
f3i = probability of selecting a household from the total listed households of a PSU or in
segment(s) of a PSU
= (25*HRi)/ HLi
Where HRi is the household response rate of the ith sampled PSU and HLi is the number of households listed in ith PSU in a district.
For urban PSU, f1i is computed either as the ratio of number of UFS blocks included in the
sample to the total number of UFS blocks of the district.
The probability of selecting a household from the district works out to be
f i = f1i * f2
i * f3
i
The non-normalized weight for the ith PSU of the district is, wi = 1/f i while the normalized weight used in the generation of district indicators for the ith district would be
i
i
ii
ii
wwn
n*
*
Where ni is the number of households interviewed in the ith PSU. The weight for women and children are computed in the similar manner considering corresponding response rate.
4
3. SURVEY INSTRUMENTS
The main instrument for collection of data in DLHS-4 was a set of structured questionnaires, namely, household, ever married woman, and village questionnaires as components of household survey. In the facility, separate questionnaires are used for Sub-Health Centre (SHC), Primary Health Centre (PHC), Community Health Centre (CHC), Sub-Divisional Hospital (SDH) and District Hospital (DH). Household and ever married women questionnaires are bilingual, with questions in both Haryanavi and English languages.
3.1 Household Questionnaire:- The household questionnaire starts with listing of all usual residents in each sample household including visitors who had stayed the night before the interview. The listing of usual resident members is used for identification of eligible respondents for ever married women and CAB (Clinical, Anthropometric and Biochemical) tests. For individual household member information on age, sex and marital status, relationship to the head of the household and education were collected. Marriages and deaths to members of household were also recorded. Efforts were made to get information about maternal deaths. Information were also collected on the main source of drinking water, type of toilet facility, source of lighting, type of cooking fuel, religion and caste of household head and ownership of durable goods in the household.
An added feature of household questionnaire of DLHS-4 is the collection of data on disability status, injury, acute and chronic illness for all members of the household.
Clinical, Anthropometric and Biochemical (CAB) tests: An important component of household questionnaire is the collection of biomarkers of eligible household members for the first time on a large scale demographic and health survey in the country at district level. This includes weight and height for all household members of age one month and above, Haemoglobin level for all household members aged 6 months and older, random blood sugar test and blood pressure measurements for all household members aged 18 years and above.
3.2 Ever Married Woman's Questionnaire:- The respondents for the ever married woman's questionnaire are ever married women in 15-49 years of age living in the sampled households. Details on age, age at marriage, place of birth, educational attainment, number of biological children ever born and surviving by sex were collected. Accounts of ante-natal checks, experience of pregnancy related complications, place of delivery, delivery attendant and post-partum care, together with history of contraceptive use, sex preference of children and fertility intentions were recorded. For the recent births, immunization status of children was collected either from the immunization card or asking the mother about the status of immunization of the child. The other information collected includes knowledge and awareness about RTI/STI and HIV/AIDS by source and treatment seeking behavior of RTI/STI.
3.3 Village Questionnaire:- This questionnaire was designed to collect information on availability and accessibility of education, health, transport and communication facilities at village level. Functioning of village committees and utilization of fund were additionally collected from the sampled villages. Information relating to implementation and beneficiaries of various government programmes on girl child, maternal care, sanitation, food security,
5
employment generation, and women's empowerment are also gathered as part of village information.
3.4 Facility Questionnaire:- In the facility survey, the information collected at the SHC level were availability of human resources, physical infrastructure, equipments and essential drugs and MCH service provided in one month preceding the survey. From the PHC, status of availability for 24x7 facility and services for delivery and new born care were collected. Additional information collected at PHC level were availability of Lady Medical Officer, functional Labour Room, Operation Theater, number of beds, drug storage facilities, waiting room for OPD, availability of RCH related equipments, essential drugs and essential laboratory testing facilities. Information that were collected for Community Health Centre (CHC) includes availability of 24X7 services for delivery and new born care, status of in-position clinical, supporting and Para-medical staff, availability of specialists trained for NSV (Non-Scalpel Vasectomy), emergency obstetric, MTP, new born care, treatment of RTI / STI, IMNCI, ECG etc. Physical infrastructure of CHC such as water supply, electricity, communication, waste disposal facilities, OT, Labour Room and availability of residential quarters for medical doctors were also collected in the facility survey. From the Sub-Divisional and District Hospitals status of availability of essential laboratory and ambulance services, emergency obstetric care service, availability of specialists, nurses, paramedics and technicians either on regular or contractual basis were collected in addition to infrastructure, provision for bio-medical and waste disposal and availability of residential quarters for doctors, nurses and staff. The mode of collection of information for health facilities is directly asking to the concerned officials, physical inspection and recording from relevant registers.
3.5 Sample Implementation
The field implementation starts with the preparation of location and layout maps of sampled PSUs in rural areas and obtaining map of sampled NSSO UFS blocks in urban areas. This is followed by preparation of list of households which served as the sampling frame for selection of representative households and it involved mapping and listing of structures and households for each sampled primary sampling unit (PSU) following the preparation of location and layout maps. The mapping and listing was carried out for each PSU by a team comprising of a mapper, a lister and a supervisor. A PSU in rural area is a village or part of a village or a group of small villages and it is NSSO UFS block in an urban area.
From the sampling frame of households prepared by mapping and listing, a sample of 28 households were selected by circular systematic sampling. Household and ever married women's questionnaires were canvassed by a team of 3 female and one male investigators, one supervisor and two health investigators were assigned for collection of CAB information. For quality assurance, field teams were monitored constantly by Project Officers, Officials of PRC, MoHFW, and Partner Institutes who facilitates DBS testing. Time to time DLHS-4 Project Coordinators of IIPS also made field visits to check and provide support to field teams.
6
4. DEMOGRAPHIC BACKGROUND OF HARYANA
Basic demographic indicators of Haryana and its districts based on Census 2011 are shown in Table 1.1. The population of the state in Census 2011 is enumerated as 25,352 in thousands and population of the state is concentrated mainly in the districts of Karnal, Sonipat, Hisar, Bhiwani, Gurgaon and Mewat. The decadal growth rate of the state during 2001-2011 Census is 19.9 percent. Decadal growth rate is highest in Gurgaon (73.1%) and lowest in Jhajjar district (8.9%) during this period. The sex ratio of the state is 879 females per 1000 males, it is lowest (854) in Gurgaon and highest (907) in Faridabad district. The overall literacy rate is 75.6 percent and literacy rate is 84.1 percent for males and 65.9 percent for females.
4.1 Sample Coverage
DLHS-4 surveyed a total of 1,259 primary sampling units (PSUs) covering 33,772 households with 95.7 percent response rate and 28,776 ever married women in reproductive age 15-49 years with 91.3 percent response rate. Table 1.2 shows the number of PSUs, households and ever married women interviewed and corresponding response rates by districts. Household response rate in the districts varies from 90.4 in Fatehabad district to 97.5 percent in Gurgaon district while that for the ever married women it varied from 84.7 percent in Fatehabad to 97.8 percent in Panchkula district.
4.2 Village Facilities
Total number of PSUs surveyed in Haryana is 1,259 out of this 711 are rural PSUs. Most villages (93.1%) have a primary school in the village (Table 1.1). In 60 percent of the villages, there is Sub-Health Centre (SHC) (Table 1.4a). Out of total 708 villages 80 percent (565 villages) have beneficiaries of ICDS, while 94 percent have JSY beneficiaries and 86 percent (606 villages) have beneficiaries of JSSK (Table 1.4b). As can be seen from Table 1.15 almost all sampled villages 99 percent have Anganwadi centre, 66 percent have access to any government health facility, 23 and 44 percent of the sampled villages have Primary Health Centre (PHC) and Village Health Nutrition and Sanitation Committee (VHNSC) in the villages respectively.
4.3 Household Amenities and Characteristics
As regards housing condition, as can be noted from Table 1.6 (a), 69 percent of the surveyed households live in pucca houses, 7 percent in kachha houses and 24 percent in semi-pucca houses. As many as 98 percent of households have electricity connection, 23 percent of households use woods for cooking while 46 percent use LPG, 89 percent of households have mobile phone, 85 percent owned television, 42 percent owned bicycle while 41 percent owned motor cycle/ scooter and 10 percent owned car/jeep/van.
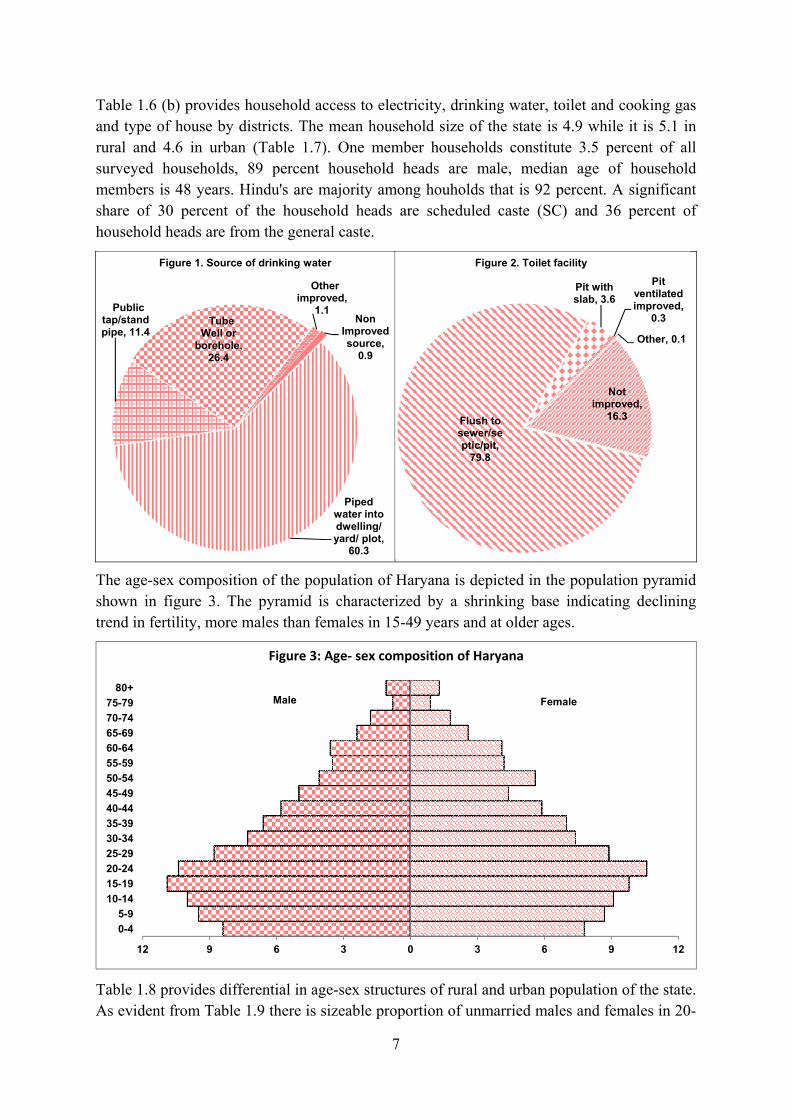
The sources of drinking water are shown in figure 1 and it is noted that 72 percent of households are using piped water in to dwelling/ yard/plot and public tap/stand pipe for drinking and 26 percent of households are using tube well or borehole water. As can be seen from figure 2, households which do not have access to improved clean toilet constitute 16 percent of the total surveyed households and more than two-third of the households have access to improved flush/septic/pit toilets.
7
Table 1.6 (b) provides household access to electricity, drinking water, toilet and cooking gas and type of house by districts. The mean household size of the state is 4.9 while it is 5.1 in rural and 4.6 in urban (Table 1.7). One member households constitute 3.5 percent of all surveyed households, 89 percent household heads are male, median age of household members is 48 years. Hindu's are majority among houholds that is 92 percent. A significant share of 30 percent of the household heads are scheduled caste (SC) and 36 percent of household heads are from the general caste.
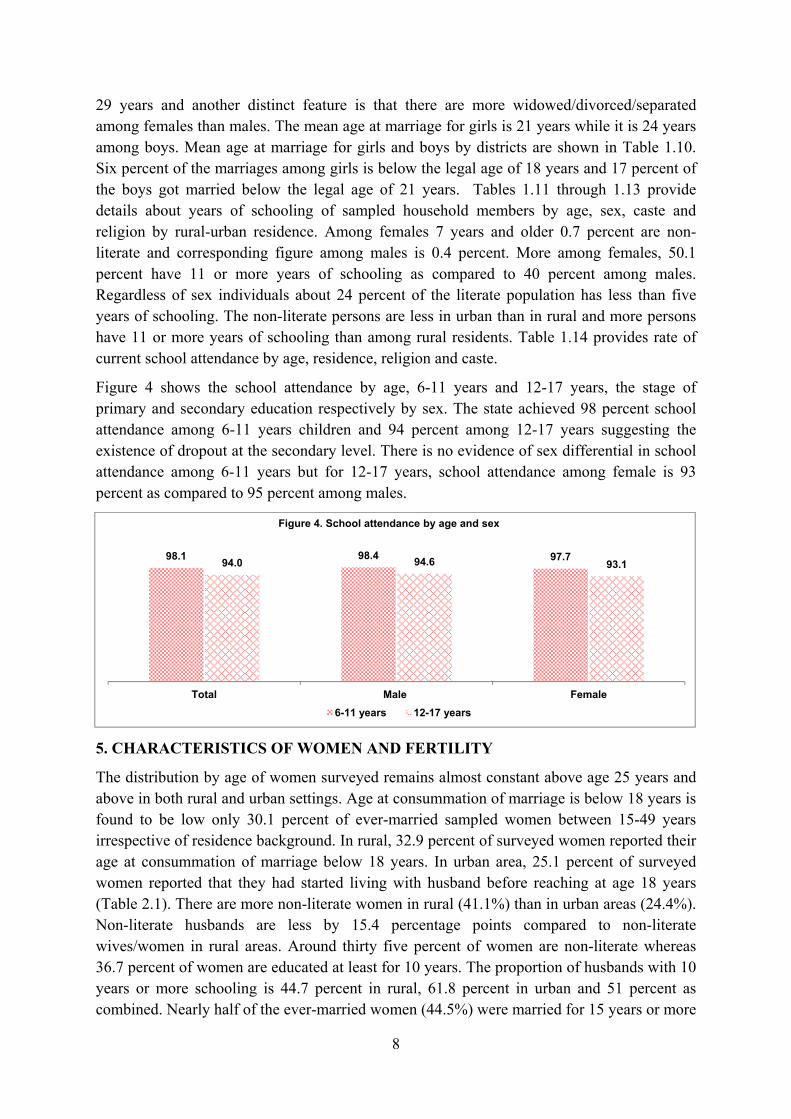
The age-sex composition of the population of Haryana is depicted in the population pyramid shown in figure 3. The pyramid is characterized by a shrinking base indicating declining trend in fertility, more males than females in 15-49 years and at older ages.
Table 1.8 provides differential in age-sex structures of rural and urban population of the state. As evident from Table 1.9 there is sizeable proportion of unmarried males and females in 20-
Piped water into dwelling/yard/ plot,
60.3
Public tap/standpipe, 11.4
Tube Well or
borehole, 26.4
Other improved,
1.1Non
Improved source,
0.9
Figure 1. Source of drinking water
Flush to sewer/septic/pit,
79.8
Pit with slab, 3.6
Pit ventilated improved,
0.3
Other, 0.1
Not improved,
16.3
Figure 2. Toilet facility
12 9 6 3 0 3 6 9 12
0-4
5-9
10-14
15-19
20-24
25-29
30-34
35-39
40-44
45-49
50-54
55-59
60-64
65-69
70-74
75-79
80+Male Female
Figure 3: Age‐ sex composition of Haryana
8
29 years and another distinct feature is that there are more widowed/divorced/separated among females than males. The mean age at marriage for girls is 21 years while it is 24 years among boys. Mean age at marriage for girls and boys by districts are shown in Table 1.10. Six percent of the marriages among girls is below the legal age of 18 years and 17 percent of the boys got married below the legal age of 21 years. Tables 1.11 through 1.13 provide details about years of schooling of sampled household members by age, sex, caste and religion by rural-urban residence. Among females 7 years and older 0.7 percent are non-literate and corresponding figure among males is 0.4 percent. More among females, 50.1 percent have 11 or more years of schooling as compared to 40 percent among males. Regardless of sex individuals about 24 percent of the literate population has less than five years of schooling. The non-literate persons are less in urban than in rural and more persons have 11 or more years of schooling than among rural residents. Table 1.14 provides rate of current school attendance by age, residence, religion and caste.
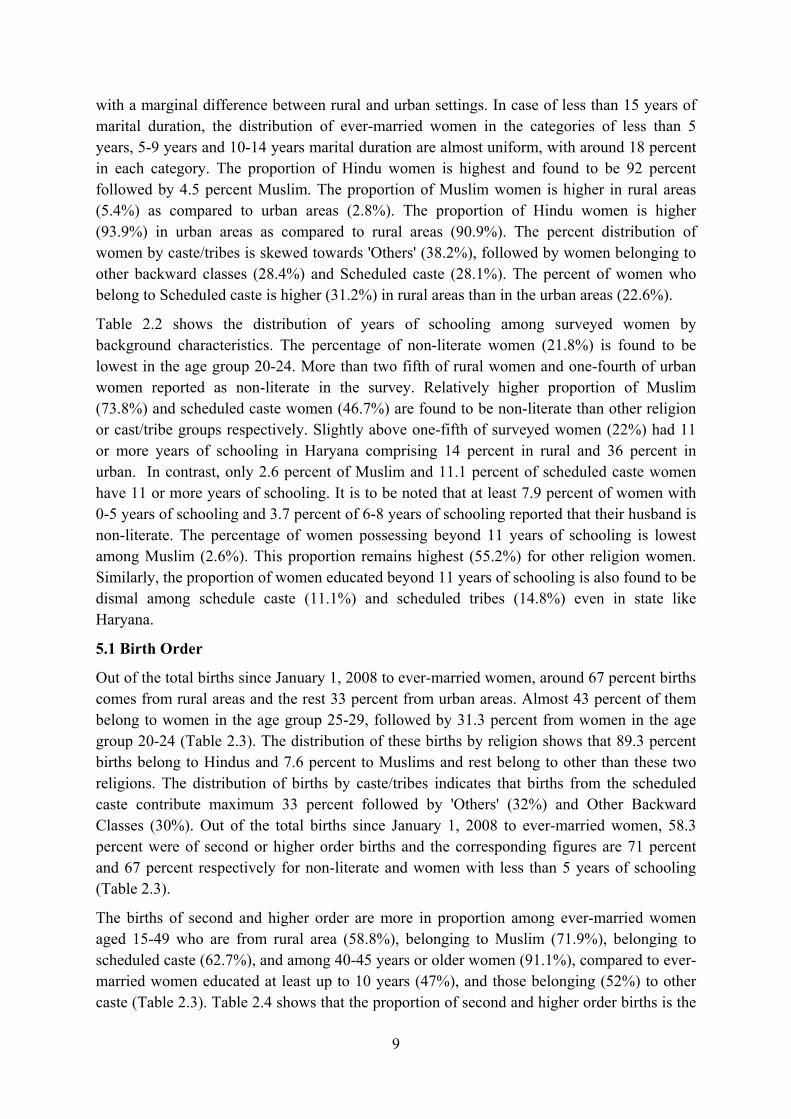
Figure 4 shows the school attendance by age, 6-11 years and 12-17 years, the stage of primary and secondary education respectively by sex. The state achieved 98 percent school attendance among 6-11 years children and 94 percent among 12-17 years suggesting the existence of dropout at the secondary level. There is no evidence of sex differential in school attendance among 6-11 years but for 12-17 years, school attendance among female is 93 percent as compared to 95 percent among males.
5. CHARACTERISTICS OF WOMEN AND FERTILITY
The distribution by age of women surveyed remains almost constant above age 25 years and above in both rural and urban settings. Age at consummation of marriage is below 18 years is found to be low only 30.1 percent of ever-married sampled women between 15-49 years irrespective of residence background. In rural, 32.9 percent of surveyed women reported their age at consummation of marriage below 18 years. In urban area, 25.1 percent of surveyed women reported that they had started living with husband before reaching at age 18 years (Table 2.1). There are more non-literate women in rural (41.1%) than in urban areas (24.4%). Non-literate husbands are less by 15.4 percentage points compared to non-literate wives/women in rural areas. Around thirty five percent of women are non-literate whereas 36.7 percent of women are educated at least for 10 years. The proportion of husbands with 10 years or more schooling is 44.7 percent in rural, 61.8 percent in urban and 51 percent as combined. Nearly half of the ever-married women (44.5%) were married for 15 years or more
98.1 98.4 97.794.0 94.6 93.1
Total Male Female
6-11 years 12-17 years
Figure 4. School attendance by age and sex
9
with a marginal difference between rural and urban settings. In case of less than 15 years of marital duration, the distribution of ever-married women in the categories of less than 5 years, 5-9 years and 10-14 years marital duration are almost uniform, with around 18 percent in each category. The proportion of Hindu women is highest and found to be 92 percent followed by 4.5 percent Muslim. The proportion of Muslim women is higher in rural areas (5.4%) as compared to urban areas (2.8%). The proportion of Hindu women is higher (93.9%) in urban areas as compared to rural areas (90.9%). The percent distribution of women by caste/tribes is skewed towards 'Others' (38.2%), followed by women belonging to other backward classes (28.4%) and Scheduled caste (28.1%). The percent of women who belong to Scheduled caste is higher (31.2%) in rural areas than in the urban areas (22.6%).
Table 2.2 shows the distribution of years of schooling among surveyed women by background characteristics. The percentage of non-literate women (21.8%) is found to be lowest in the age group 20-24. More than two fifth of rural women and one-fourth of urban women reported as non-literate in the survey. Relatively higher proportion of Muslim (73.8%) and scheduled caste women (46.7%) are found to be non-literate than other religion or cast/tribe groups respectively. Slightly above one-fifth of surveyed women (22%) had 11 or more years of schooling in Haryana comprising 14 percent in rural and 36 percent in urban. In contrast, only 2.6 percent of Muslim and 11.1 percent of scheduled caste women have 11 or more years of schooling. It is to be noted that at least 7.9 percent of women with 0-5 years of schooling and 3.7 percent of 6-8 years of schooling reported that their husband is non-literate. The percentage of women possessing beyond 11 years of schooling is lowest among Muslim (2.6%). This proportion remains highest (55.2%) for other religion women. Similarly, the proportion of women educated beyond 11 years of schooling is also found to be dismal among schedule caste (11.1%) and scheduled tribes (14.8%) even in state like Haryana.
5.1 Birth Order
Out of the total births since January 1, 2008 to ever-married women, around 67 percent births comes from rural areas and the rest 33 percent from urban areas. Almost 43 percent of them belong to women in the age group 25-29, followed by 31.3 percent from women in the age group 20-24 (Table 2.3). The distribution of these births by religion shows that 89.3 percent births belong to Hindus and 7.6 percent to Muslims and rest belong to other than these two religions. The distribution of births by caste/tribes indicates that births from the scheduled caste contribute maximum 33 percent followed by 'Others' (32%) and Other Backward Classes (30%). Out of the total births since January 1, 2008 to ever-married women, 58.3 percent were of second or higher order births and the corresponding figures are 71 percent and 67 percent respectively for non-literate and women with less than 5 years of schooling (Table 2.3).
The births of second and higher order are more in proportion among ever-married women aged 15-49 who are from rural area (58.8%), belonging to Muslim (71.9%), belonging to scheduled caste (62.7%), and among 40-45 years or older women (91.1%), compared to ever-married women educated at least up to 10 years (47%), and those belonging (52%) to other caste (Table 2.3). Table 2.4 shows that the proportion of second and higher order births is the
10
highest in Mewat district (70.3%) and the lowest in Panchkula district (50.8%). The proportion of first order birth has crossed the mark of 45 percent in Panchkula, Ambala, Yamunanagar, Kurukshetra, Rewari and Gurgaon. Each of Hisar, Karnal and Sirsa contributes around 7 percent of the all births.
5.2 Mean Children Ever Born
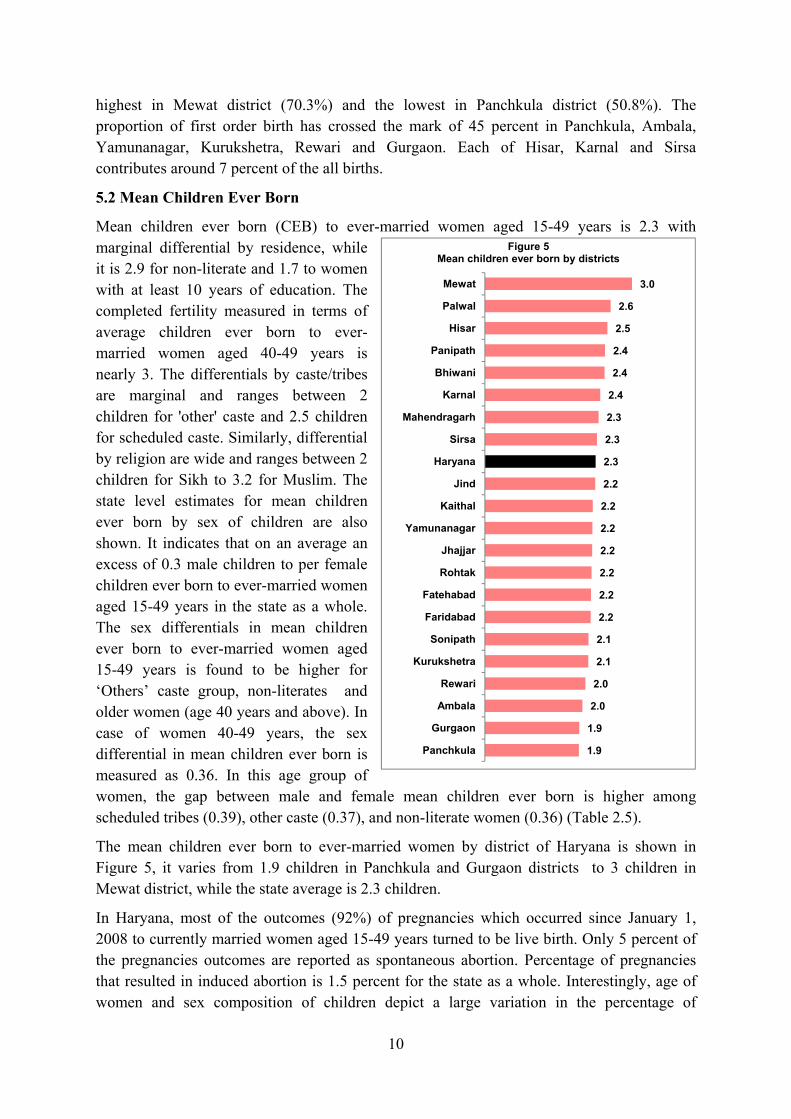
Mean children ever born (CEB) to ever-married women aged 15-49 years is 2.3 with marginal differential by residence, while it is 2.9 for non-literate and 1.7 to women with at least 10 years of education. The completed fertility measured in terms of average children ever born to ever-married women aged 40-49 years is nearly 3. The differentials by caste/tribes are marginal and ranges between 2 children for 'other' caste and 2.5 children for scheduled caste. Similarly, differential by religion are wide and ranges between 2 children for Sikh to 3.2 for Muslim. The state level estimates for mean children ever born by sex of children are also shown. It indicates that on an average an excess of 0.3 male children to per female children ever born to ever-married women aged 15-49 years in the state as a whole. The sex differentials in mean children ever born to ever-married women aged 15-49 years is found to be higher for ‘Others’ caste group, non-literates and older women (age 40 years and above). In case of women 40-49 years, the sex differential in mean children ever born is measured as 0.36. In this age group of women, the gap between male and female mean children ever born is higher among scheduled tribes (0.39), other caste (0.37), and non-literate women (0.36) (Table 2.5).
The mean children ever born to ever-married women by district of Haryana is shown in Figure 5, it varies from 1.9 children in Panchkula and Gurgaon districts to 3 children in Mewat district, while the state average is 2.3 children.
In Haryana, most of the outcomes (92%) of pregnancies which occurred since January 1, 2008 to currently married women aged 15-49 years turned to be live birth. Only 5 percent of the pregnancies outcomes are reported as spontaneous abortion. Percentage of pregnancies that resulted in induced abortion is 1.5 percent for the state as a whole. Interestingly, age of women and sex composition of children depict a large variation in the percentage of
1.9
1.9
2.0
2.0
2.1
2.1
2.2
2.2
2.2
2.2
2.2
2.2
2.2
2.3
2.3
2.3
2.4
2.4
2.4
2.5
2.6
3.0
Panchkula
Gurgaon
Ambala
Rewari
Kurukshetra
Sonipath
Faridabad
Fatehabad
Rohtak
Jhajjar
Yamunanagar
Kaithal
Jind
Haryana
Sirsa
Mahendragarh
Karnal
Bhiwani
Panipath
Hisar
Palwal
Mewat
Figure 5Mean children ever born by districts
11
pregnancies resulted as induced abortion. For example, women having one daughter (7.5%) or three daughters (4.9%) have relatively higher rate of spontaneous abortion. Similarly, women aged above 40 years have a relatively higher induced abortion rate than their younger counterparts (Table 2.6). Percentage of pregnancies resulted into spontaneous abortions varies from 0.8 percent in Gurgaon district to 10.1 percent in Mahendragarh district. The induced abortion rate (3.5%) and still birth rate (2.4%) are found to be highest in district Bhiwani and Sonipath respectively. As a result 92 percent of pregnancies since Jan 1, 2008, among in the low state, are reported as live births, which should draw attention of reproductive and child health programme managers (Table 2.7).
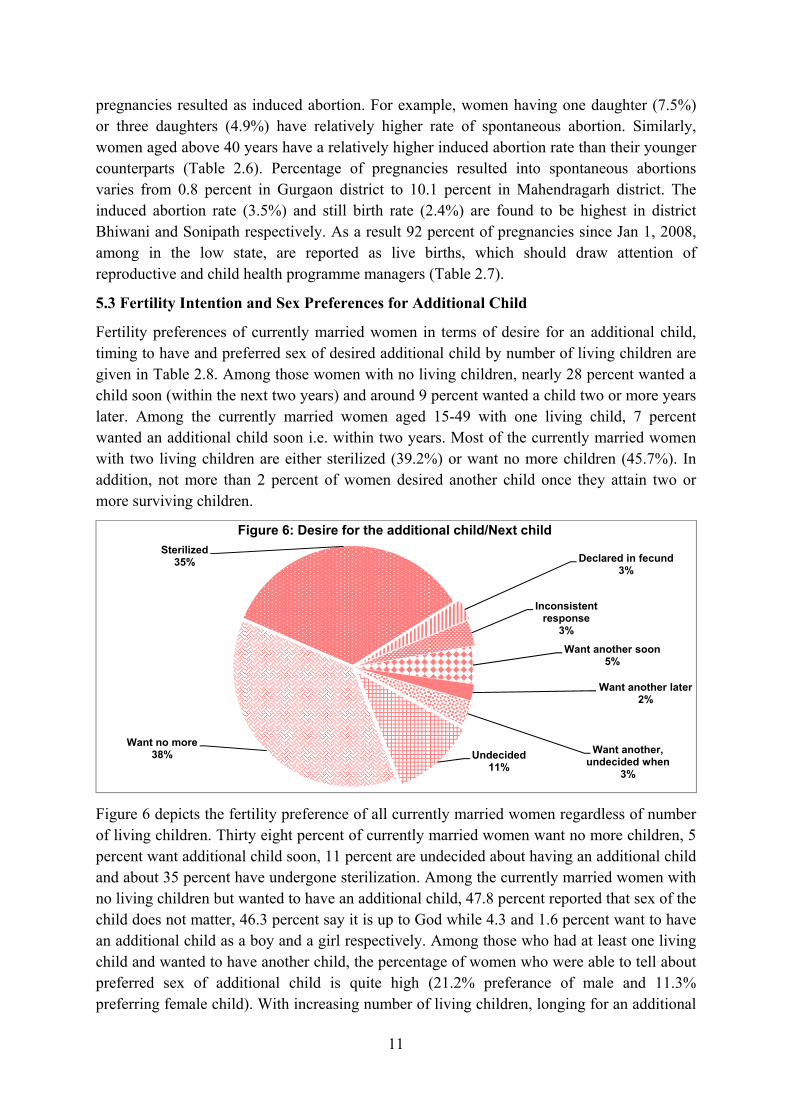
5.3 Fertility Intention and Sex Preferences for Additional Child
Fertility preferences of currently married women in terms of desire for an additional child, timing to have and preferred sex of desired additional child by number of living children are given in Table 2.8. Among those women with no living children, nearly 28 percent wanted a child soon (within the next two years) and around 9 percent wanted a child two or more years later. Among the currently married women aged 15-49 with one living child, 7 percent wanted an additional child soon i.e. within two years. Most of the currently married women with two living children are either sterilized (39.2%) or want no more children (45.7%). In addition, not more than 2 percent of women desired another child once they attain two or more surviving children.
Figure 6 depicts the fertility preference of all currently married women regardless of number of living children. Thirty eight percent of currently married women want no more children, 5 percent want additional child soon, 11 percent are undecided about having an additional child and about 35 percent have undergone sterilization. Among the currently married women with no living children but wanted to have an additional child, 47.8 percent reported that sex of the child does not matter, 46.3 percent say it is up to God while 4.3 and 1.6 percent want to have an additional child as a boy and a girl respectively. Among those who had at least one living child and wanted to have another child, the percentage of women who were able to tell about preferred sex of additional child is quite high (21.2% preferance of male and 11.3% preferring female child). With increasing number of living children, longing for an additional
Want another soon5%
Want another later2%
Want another, undecided when
3%
Undecided11%
Want no more38%
Sterilized35% Declared in fecund
3%
Inconsistent response
3%
Figure 6: Desire for the additional child/Next child
12
male child becomes more and more magnified from 21.2 percent among currently married women with one child to 43.9 percent among currently married women with four and more living children (Table 2.8).
6. MATERNAL HEALTH CARE
Maternal Health Care package of RCH programme focused more on ANC. The Maternal health care activities are implemented to strengthen and fulfill the RCH goals. ANC services provided by medical and paramedical professionals comprises of the regular physical checks with weight, height and blood pressure measure, Hemoglobin level test, consumption of IFA, Tetanus (TT) injection and growth status and position of fetus. These primary services are made compulsory to be provided during the ANC check up from health facility. At least four checkups are made compulsory to complete the full ANC course in order to prevent and protect women from pregnancy related complication faced during the pregnancy and till the delivery. Janani Suraksha Yojna (JSY) scheme is implemented in health facilities under the aegis of NRHM/NHM to promote the Institutional Delivery and post natal care to prevent from maternal deaths.
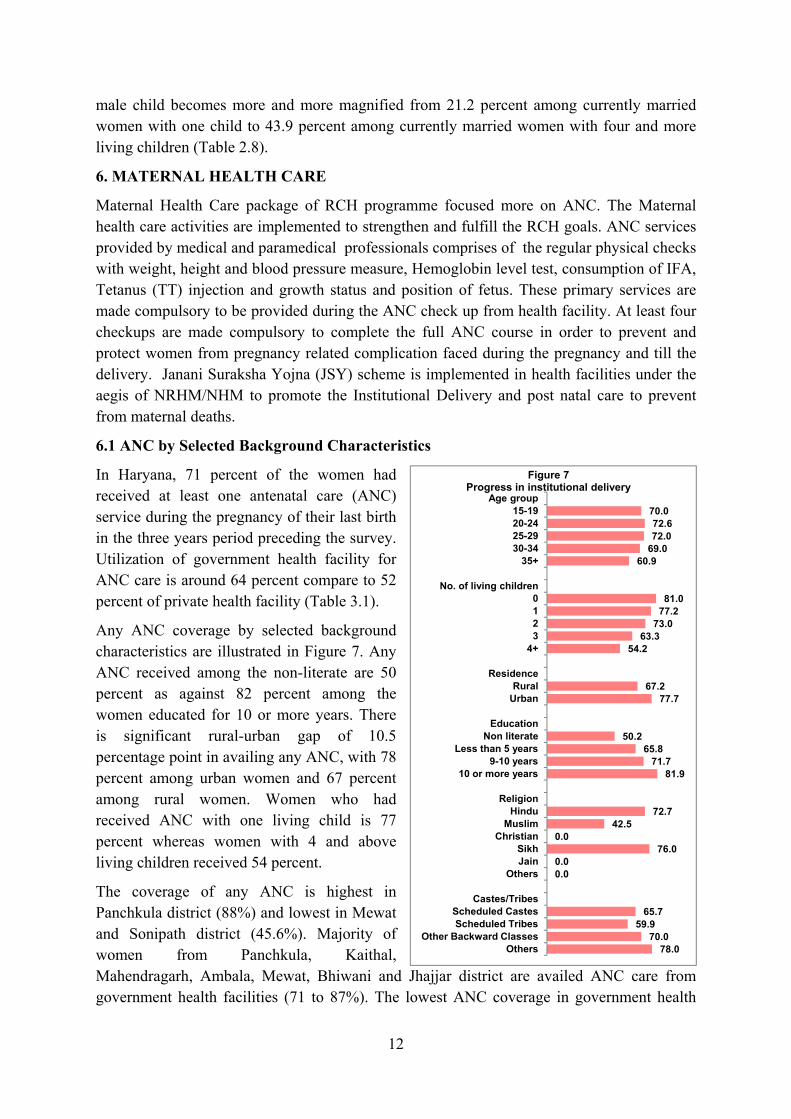
6.1 ANC by Selected Background Characteristics
In Haryana, 71 percent of the women had received at least one antenatal care (ANC) service during the pregnancy of their last birth in the three years period preceding the survey. Utilization of government health facility for ANC care is around 64 percent compare to 52 percent of private health facility (Table 3.1).
Any ANC coverage by selected background characteristics are illustrated in Figure 7. Any ANC received among the non-literate are 50 percent as against 82 percent among the women educated for 10 or more years. There is significant rural-urban gap of 10.5 percentage point in availing any ANC, with 78 percent among urban women and 67 percent among rural women. Women who had received ANC with one living child is 77 percent whereas women with 4 and above living children received 54 percent.
The coverage of any ANC is highest in Panchkula district (88%) and lowest in Mewat and Sonipath district (45.6%). Majority of women from Panchkula, Kaithal, Mahendragarh, Ambala, Mewat, Bhiwani and Jhajjar district are availed ANC care from government health facilities (71 to 87%). The lowest ANC coverage in government health
70.072.672.0
69.060.9
81.077.2
73.063.3
54.2
67.277.7
50.265.8
71.781.9
72.742.5
0.076.0
0.00.0
65.759.9
70.078.0
Age group15-1920-2425-2930-34
35+
No. of living children0123
4+
ResidenceRural
Urban
EducationNon literate
Less than 5 years9-10 years
10 or more years
ReligionHindu
MuslimChristian
SikhJain
Others
Castes/TribesScheduled CastesScheduled Tribes
Other Backward ClassesOthers
Figure 7Progress in institutional delivery
13
facilities was in Panipath district (29%), where women prefer more the private health facilities. The DLHS-4 data reveals that more women availed from government health facilities for ANC as compared to private health facilities.
The specific components of ANC checkup which are supposed to be received by the women during the pregnancy were asked to response. The proportion of women who received weight, height and blood pressure measurement, blood and urine tested, abdomen examined and sonography/ ultrasound test done are 61.2, 25.7, 41.1, 49.7, 51.9, 34.5 & 56.5 percent respectively (Table 3.3). One important feature of ANC check up in Haryana in case of ultrasound test done is high among women who are having one children than four or more living children (63.8% and 36.4% respectively), having ten years of education (68.3%), rural-urban residence (52.8% and 63.7% respectively), and Sikh religion (59%). The women from other caste are the highest (64.5%) as compared to all others caste (Table 3.3).
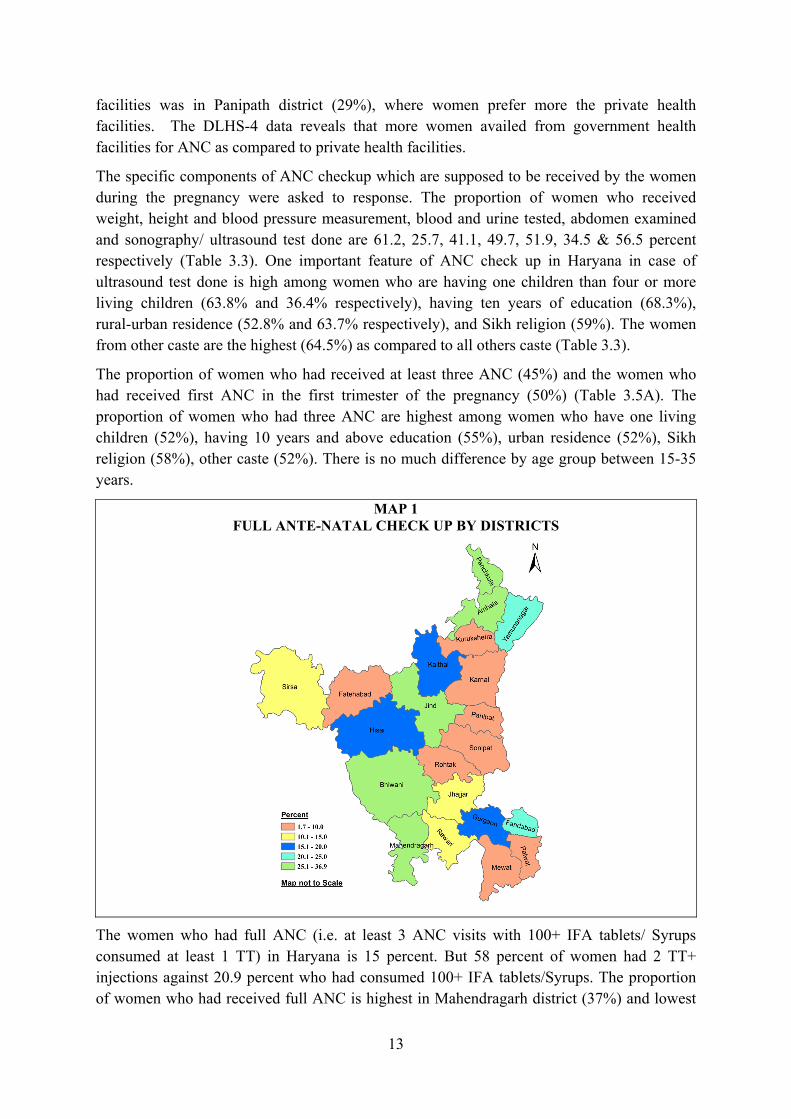
The proportion of women who had received at least three ANC (45%) and the women who had received first ANC in the first trimester of the pregnancy (50%) (Table 3.5A). The proportion of women who had three ANC are highest among women who have one living children (52%), having 10 years and above education (55%), urban residence (52%), Sikh religion (58%), other caste (52%). There is no much difference by age group between 15-35 years.
The women who had full ANC (i.e. at least 3 ANC visits with 100+ IFA tablets/ Syrups consumed at least 1 TT) in Haryana is 15 percent. But 58 percent of women had 2 TT+ injections against 20.9 percent who had consumed 100+ IFA tablets/Syrups. The proportion of women who had received full ANC is highest in Mahendragarh district (37%) and lowest
MAP 1 FULL ANTE-NATAL CHECK UP BY DISTRICTS
14
is 1.6 percent in Mewat district (Table 3.6). District wise variation in coverage of full ANC is shown in the Map 1. The proportions of women who consumed 100 IFA tablets/syrup and received at least one TT injection are 15 percent and 66 percent respectively in Haryana during DLHS-4 (Table 3.6).
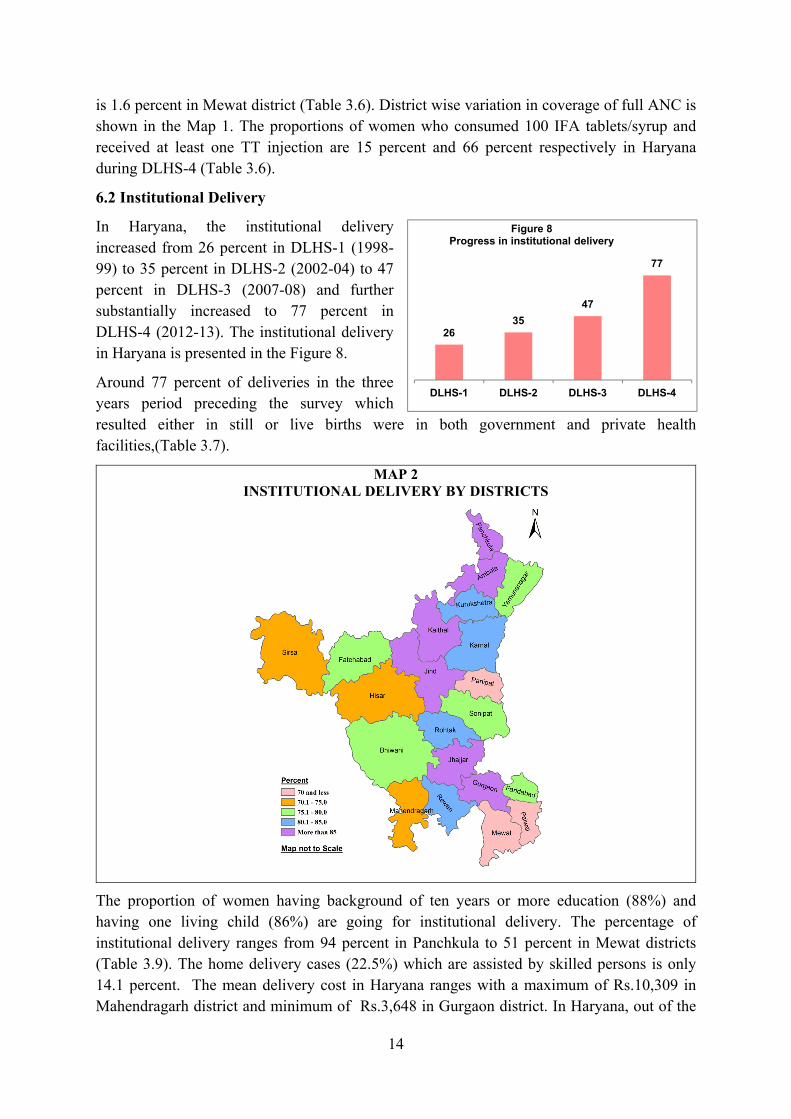
6.2 Institutional Delivery
In Haryana, the institutional delivery increased from 26 percent in DLHS-1 (1998-99) to 35 percent in DLHS-2 (2002-04) to 47 percent in DLHS-3 (2007-08) and further substantially increased to 77 percent in DLHS-4 (2012-13). The institutional delivery in Haryana is presented in the Figure 8.
Around 77 percent of deliveries in the three years period preceding the survey which resulted either in still or live births were in both government and private health facilities,(Table 3.7).
MAP 2 INSTITUTIONAL DELIVERY BY DISTRICTS
The proportion of women having background of ten years or more education (88%) and having one living child (86%) are going for institutional delivery. The percentage of institutional delivery ranges from 94 percent in Panchkula to 51 percent in Mewat districts (Table 3.9). The home delivery cases (22.5%) which are assisted by skilled persons is only 14.1 percent. The mean delivery cost in Haryana ranges with a maximum of Rs.10,309 in Mahendragarh district and minimum of Rs.3,648 in Gurgaon district. In Haryana, out of the
2635
47
77
DLHS-1 DLHS-2 DLHS-3 DLHS-4
Figure 8Progress in institutional delivery
15
21 districts, only 4 districts are having the institutional delivery 90 percent and above and in remaining 17 districts the percentage is varies from 51 to 89 percent of institutional delivery.District wise variations in institutional delivery is presented in the Map 2.
In Haryana, 24.9 percent of institutional delivery used ambulance and 31.6 percent jeep or car for transportation of delivery with an average cost of Rs.1,058. The use of ambulance for transportation for institutional delivery was low among women with background of having zero living children (16%), 10 or more years of education (21.9%), Muslim (17.1%) and Other caste (21.8%). The mean delivery cost is Rs.3,464 in government health facilities and Rs.10,222 in private health facilities. There is a large variation of institutional delivery cost compare to government and private health facilities.
The JSY financial assistance for institutional delivery had benefitted to 8.3 percent and Home delivery 2.6 percent (Table 3.8). The highest benefitted women for institutional delivery are those in the age group of 25-29 years (8.8%), rural residence (9.5%), having 3 and above living children (11.1%), Hindus (8.4%) and scheduled caste (13.2%).
6.3 Complications during Pregnancy, Delivery and Post-delivery Period
Women who either do not take ANC or had an incomplete course of ANC are exposed to the risk of maternal death. In Haryana as much as 37.5 percent women who had still/live births in the three years preceding the survey had some complications during pregnancy (Table 3.6). Out of 21 districts, in 8 districts women faced pregnancy complication percentage ranges from 56 percent in Sonipath to 40.7 percent in Panchkula. The remaining 13 districts' women faced pregnancy complication ranges from 15.1 percent in Palwal to 40.0 percent in Kaithal. Forty five percent of women who had reported complication during pregnancy had sought treatment for the problem in Haryana (Table 3.15).
Around 42.9 percent of women in Haryana had faced at least one delivery complication. The main type of delivery complications experienced by women who had still or live births in the three years period preceding the survey are mainly premature labour (61%), obstructed labour (43.7%), prolonged labour (17.5%), excessive bleeding (10.7%) and convulsion or high blood pressure (5.6%). Delivery complications are higher among those who undergone by caesarean (54.6%) compared to normal delivery (41.7%) (Table 3.11). In all the districts of Haryana, in Yamunanagar district is the highest proportion of women who had a delivery complication (66.6%) and is lowest in Faridabad (27.7%) (Table 3.15).
In Haryana, around 15.2 percent women reported post-delivery complications. The major problem during post delivery period is high fever (52.4%), lower abdominal pain (49.5%) and followed by excessive bleeding (15.6%) (Table 3.12). Among the women who had post-delivery complications 53.3 percent had sought treatment (Table 3.15). Women sought treatment for post delivery complications are highest in Mahendragarh (86.2%) and lowest in Rohtak district (35.9%).
7. CHILD HEALTH AND IMMUNIZATION
To promote child survival and prevent infant mortality, NHM/NRHM envisages new born care, breastfeeding initiation, infant food supplementation at the right time, and a complete package of routine immunization for children. About 56 percent of newborns were examined
16
within 24 hours of birth (Table 4.1). In Haryana, women who availed newborn care from government health facility constitute 49.9 percent as compared to 42.9 percent from private, at home (6.4%) and others (0.7%). There was a substantial increase from DLHS-3 (22.9%). There is variation in rural areas in utilization of government health facilities (56%) and private health facilities (36.3%), whereas in urban areas it is 38.3 percent for government health facilities and 55.6 percent for private health facilities. Majority of women from Scheduled caste and Scheduled tribes communities check-up in government health facilities (60.5% & 55.2%) than in the private health facilities (32.4% & 31.6%). Other back ward classes also use government health facilities (52.9%) more than private 39.2 precent (Table 4.1).
Majority (84%) of children under 3 years of age (born after January 1, 2008) were fed with colostrums and there is not much variation across selected background characteristics of women (Table 4.2). Highest proportion of children being fed with colostrums (95.3%) is observed in Faridabad district and the lowest in Panipat district (73.9%) (Table 4.5).
In Haryana, only 50.9 percent of women had initiated breastfeeding within one hour of the birth of the child. Among the women, initiation of breastfeeding within one hour of birth is least practiced in Panipat district (32.2%) and most widely practiced in Rewari (69%). However, 82.8 percent of women in Haryana initiated breastfeeding within 24 hours of birth of their children, ranging from 66.2 percent in Panipat district to 97 percent in Faridabad (Table 4.5). The proportion of women who initiated breastfeeding within one hour, within 24 hours and after 24 hours of birth are 51, 83 and 8.5 percent respectively.
Duration of exclusive breast feeding practiced is high (among infant under 2 to 5 months old) and is ranged from 59.7 to 46.6 percent and it declines as the age increases in Haryana. The introduction of food supplementation with semi-solid and solid food started below the age of 2 months along with breastfeeding. As the age increases the percentage of the breast feeding declines and 19 percent of children under 24 to 35 months were breast fed along with other fluids, semi solid and solid foods (Table 4.3).
7.1 Immunization Coverage of Children (aged 12-23 Months)
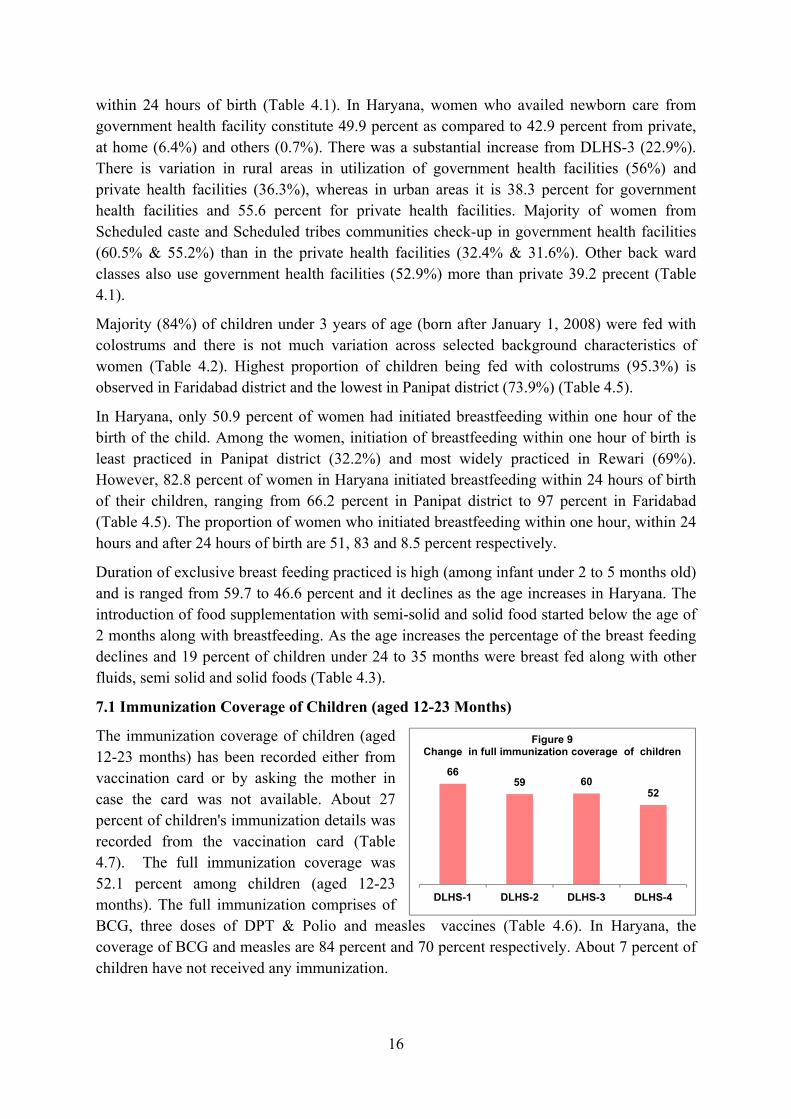
The immunization coverage of children (aged 12-23 months) has been recorded either from vaccination card or by asking the mother in case the card was not available. About 27 percent of children's immunization details was recorded from the vaccination card (Table 4.7). The full immunization coverage was 52.1 percent among children (aged 12-23 months). The full immunization comprises of BCG, three doses of DPT & Polio and measles vaccines (Table 4.6). In Haryana, the coverage of BCG and measles are 84 percent and 70 percent respectively. About 7 percent of children have not received any immunization.
6659 60
52
DLHS-1 DLHS-2 DLHS-3 DLHS-4
Figure 9Change in full immunization coverage of children
17
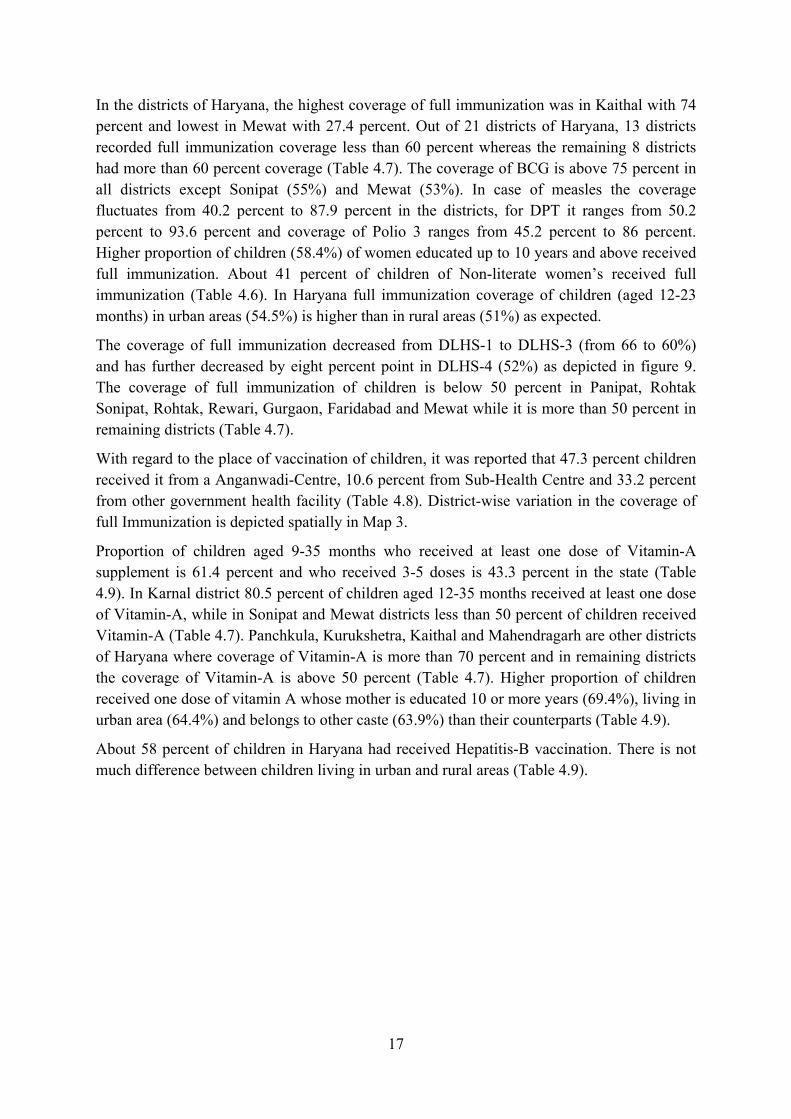
In the districts of Haryana, the highest coverage of full immunization was in Kaithal with 74 percent and lowest in Mewat with 27.4 percent. Out of 21 districts of Haryana, 13 districts recorded full immunization coverage less than 60 percent whereas the remaining 8 districts had more than 60 percent coverage (Table 4.7). The coverage of BCG is above 75 percent in all districts except Sonipat (55%) and Mewat (53%). In case of measles the coverage fluctuates from 40.2 percent to 87.9 percent in the districts, for DPT it ranges from 50.2 percent to 93.6 percent and coverage of Polio 3 ranges from 45.2 percent to 86 percent. Higher proportion of children (58.4%) of women educated up to 10 years and above received full immunization. About 41 percent of children of Non-literate women’s received full immunization (Table 4.6). In Haryana full immunization coverage of children (aged 12-23 months) in urban areas (54.5%) is higher than in rural areas (51%) as expected.
The coverage of full immunization decreased from DLHS-1 to DLHS-3 (from 66 to 60%) and has further decreased by eight percent point in DLHS-4 (52%) as depicted in figure 9. The coverage of full immunization of children is below 50 percent in Panipat, Rohtak Sonipat, Rohtak, Rewari, Gurgaon, Faridabad and Mewat while it is more than 50 percent in remaining districts (Table 4.7).
With regard to the place of vaccination of children, it was reported that 47.3 percent children received it from a Anganwadi-Centre, 10.6 percent from Sub-Health Centre and 33.2 percent from other government health facility (Table 4.8). District-wise variation in the coverage of full Immunization is depicted spatially in Map 3.
Proportion of children aged 9-35 months who received at least one dose of Vitamin-A supplement is 61.4 percent and who received 3-5 doses is 43.3 percent in the state (Table 4.9). In Karnal district 80.5 percent of children aged 12-35 months received at least one dose of Vitamin-A, while in Sonipat and Mewat districts less than 50 percent of children received Vitamin-A (Table 4.7). Panchkula, Kurukshetra, Kaithal and Mahendragarh are other districts of Haryana where coverage of Vitamin-A is more than 70 percent and in remaining districts the coverage of Vitamin-A is above 50 percent (Table 4.7). Higher proportion of children received one dose of vitamin A whose mother is educated 10 or more years (69.4%), living in urban area (64.4%) and belongs to other caste (63.9%) than their counterparts (Table 4.9).
About 58 percent of children in Haryana had received Hepatitis-B vaccination. There is not much difference between children living in urban and rural areas (Table 4.9).
18
MAP 3 FULL IMMUNIZATION COVERAGE OF CHILDREN (AGED 12-23 MONTHS) BY
DISTRICTS
7.2 Management of Diarrhoea and Acute Respiratory Infection (ARI)
The information on knowledge of diarrhoea and ARI management was collected from women respondents as part of assessment of child care knowledge. Majority of women (82%) have knowledge of diarrhoea management (Table 4.10) and more than 75 percent of the women are aware of danger signs of ARI (Table 4.12).
The common practice followed by women for treatment of children who had diarrhoea was to give ORS (68%), salt and sugar solution (54%), plenty of fluids (32%), continue normal food (25%) and continue breastfeeding (15%) (Table 4.10). In Haryana, 45 percent children who suffered from diarrhoea were treated by ORS, while 69 percent of them were given some treatment or the other (Table 4.11). Majority (79%) of children who had suffered from diarrhoea are treated in a private health facility and 22.3 percent in a government health facility (Table 4.11).
In Haryana, 75.2 percent of women are aware of danger signs of ARI. Among them, 46 percent of women knew that difficulty in breathing, 37 percent knew pain in chest and productive cough, 27 percent consider rapid breathing, 24 percent knew wheezing/whistling, and 30.1 percent having knowledge of others signs of ARI (Table 4.12).
More than three percent children had suffered from ARI in the last two weeks prior to the survey. Out of total children suffered from ARI, 85 percent had sought advice/treatment. Majority (71%) of children had treatment at private health facility and only 30 percent went to government health facility (Table 4.12).
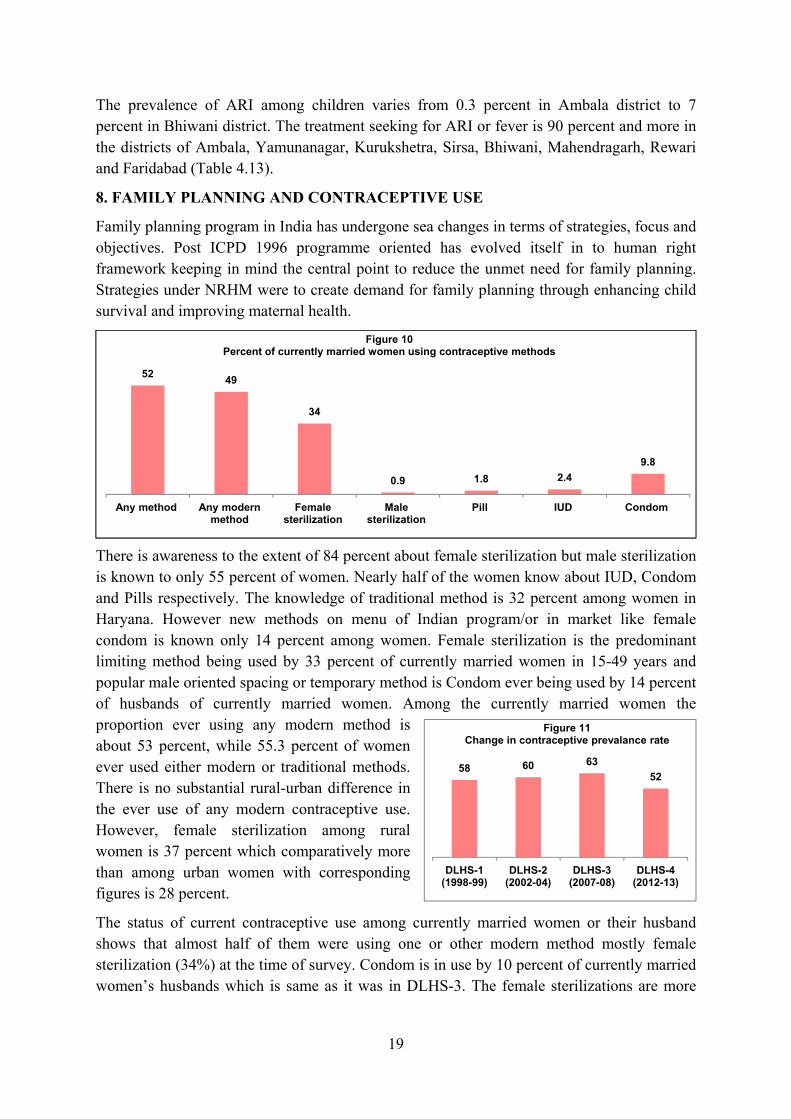
19
58 60 63
52
DLHS-1 (1998-99)
DLHS-2 (2002-04)
DLHS-3 (2007-08)
DLHS-4 (2012-13)
Figure 11Change in contraceptive prevalance rate
The prevalence of ARI among children varies from 0.3 percent in Ambala district to 7 percent in Bhiwani district. The treatment seeking for ARI or fever is 90 percent and more in the districts of Ambala, Yamunanagar, Kurukshetra, Sirsa, Bhiwani, Mahendragarh, Rewari and Faridabad (Table 4.13).
8. FAMILY PLANNING AND CONTRACEPTIVE USE
Family planning program in India has undergone sea changes in terms of strategies, focus and objectives. Post ICPD 1996 programme oriented has evolved itself in to human right framework keeping in mind the central point to reduce the unmet need for family planning. Strategies under NRHM were to create demand for family planning through enhancing child survival and improving maternal health.
There is awareness to the extent of 84 percent about female sterilization but male sterilization is known to only 55 percent of women. Nearly half of the women know about IUD, Condom and Pills respectively. The knowledge of traditional method is 32 percent among women in Haryana. However new methods on menu of Indian program/or in market like female condom is known only 14 percent among women. Female sterilization is the predominant limiting method being used by 33 percent of currently married women in 15-49 years and popular male oriented spacing or temporary method is Condom ever being used by 14 percent of husbands of currently married women. Among the currently married women the proportion ever using any modern method is about 53 percent, while 55.3 percent of women ever used either modern or traditional methods. There is no substantial rural-urban difference in the ever use of any modern contraceptive use. However, female sterilization among rural women is 37 percent which comparatively more than among urban women with corresponding figures is 28 percent.
The status of current contraceptive use among currently married women or their husband shows that almost half of them were using one or other modern method mostly female sterilization (34%) at the time of survey. Condom is in use by 10 percent of currently married women’s husbands which is same as it was in DLHS-3. The female sterilizations are more
5249
34
0.9 1.8 2.4
9.8
Any method Any modern method
Female sterilization
Male sterilization
Pill IUD Condom
Figure 10Percent of currently married women using contraceptive methods
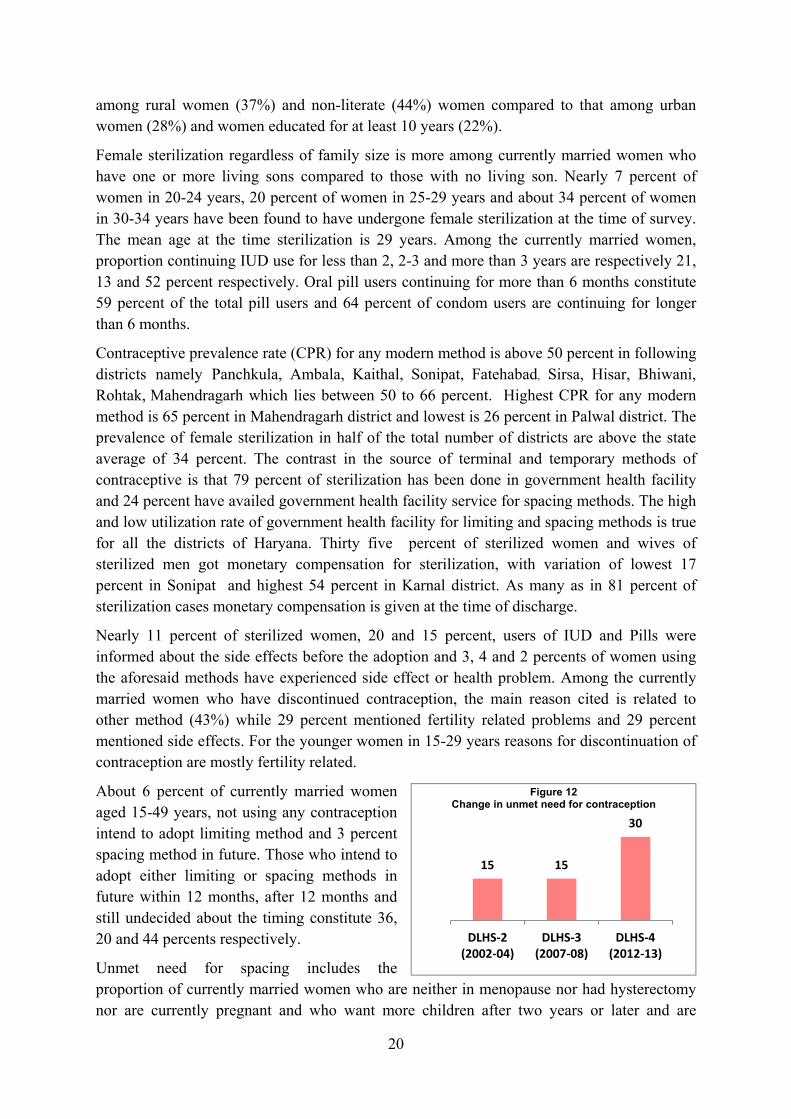
20
15 15
30
DLHS‐2 (2002‐04)
DLHS‐3 (2007‐08)
DLHS‐4 (2012‐13)
Figure 12Change in unmet need for contraception
among rural women (37%) and non-literate (44%) women compared to that among urban women (28%) and women educated for at least 10 years (22%).
Female sterilization regardless of family size is more among currently married women who have one or more living sons compared to those with no living son. Nearly 7 percent of women in 20-24 years, 20 percent of women in 25-29 years and about 34 percent of women in 30-34 years have been found to have undergone female sterilization at the time of survey. The mean age at the time sterilization is 29 years. Among the currently married women, proportion continuing IUD use for less than 2, 2-3 and more than 3 years are respectively 21, 13 and 52 percent respectively. Oral pill users continuing for more than 6 months constitute 59 percent of the total pill users and 64 percent of condom users are continuing for longer than 6 months.
Contraceptive prevalence rate (CPR) for any modern method is above 50 percent in following districts namely Panchkula, Ambala, Kaithal, Sonipat, Fatehabad, Sirsa, Hisar, Bhiwani, Rohtak, Mahendragarh which lies between 50 to 66 percent. Highest CPR for any modern method is 65 percent in Mahendragarh district and lowest is 26 percent in Palwal district. The prevalence of female sterilization in half of the total number of districts are above the state average of 34 percent. The contrast in the source of terminal and temporary methods of contraceptive is that 79 percent of sterilization has been done in government health facility and 24 percent have availed government health facility service for spacing methods. The high and low utilization rate of government health facility for limiting and spacing methods is true for all the districts of Haryana. Thirty five percent of sterilized women and wives of sterilized men got monetary compensation for sterilization, with variation of lowest 17 percent in Sonipat and highest 54 percent in Karnal district. As many as in 81 percent of sterilization cases monetary compensation is given at the time of discharge.
Nearly 11 percent of sterilized women, 20 and 15 percent, users of IUD and Pills were informed about the side effects before the adoption and 3, 4 and 2 percents of women using the aforesaid methods have experienced side effect or health problem. Among the currently married women who have discontinued contraception, the main reason cited is related to other method (43%) while 29 percent mentioned fertility related problems and 29 percent mentioned side effects. For the younger women in 15-29 years reasons for discontinuation of contraception are mostly fertility related.
About 6 percent of currently married women aged 15-49 years, not using any contraception intend to adopt limiting method and 3 percent spacing method in future. Those who intend to adopt either limiting or spacing methods in future within 12 months, after 12 months and still undecided about the timing constitute 36, 20 and 44 percents respectively.
Unmet need for spacing includes the proportion of currently married women who are neither in menopause nor had hysterectomy nor are currently pregnant and who want more children after two years or later and are
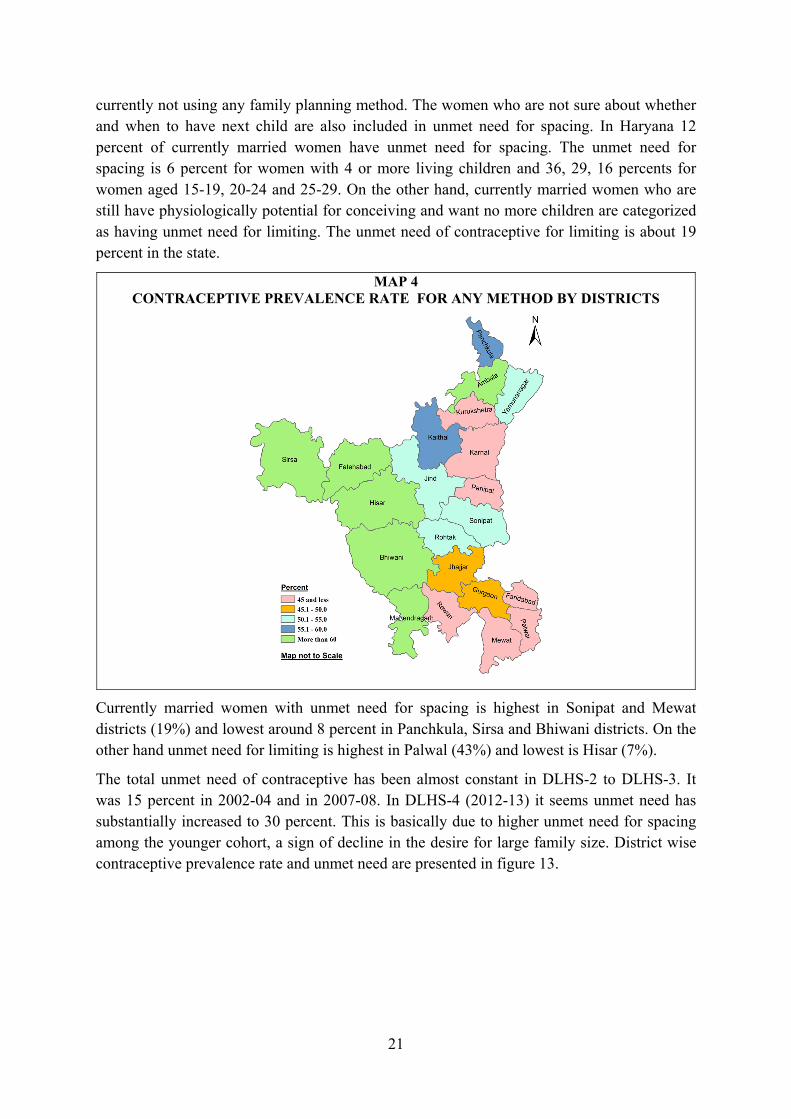
21
currently not using any family planning method. The women who are not sure about whether and when to have next child are also included in unmet need for spacing. In Haryana 12 percent of currently married women have unmet need for spacing. The unmet need for spacing is 6 percent for women with 4 or more living children and 36, 29, 16 percents for women aged 15-19, 20-24 and 25-29. On the other hand, currently married women who are still have physiologically potential for conceiving and want no more children are categorized as having unmet need for limiting. The unmet need of contraceptive for limiting is about 19 percent in the state.
MAP 4 CONTRACEPTIVE PREVALENCE RATE FOR ANY METHOD BY DISTRICTS
Currently married women with unmet need for spacing is highest in Sonipat and Mewat districts (19%) and lowest around 8 percent in Panchkula, Sirsa and Bhiwani districts. On the other hand unmet need for limiting is highest in Palwal (43%) and lowest is Hisar (7%).
The total unmet need of contraceptive has been almost constant in DLHS-2 to DLHS-3. It was 15 percent in 2002-04 and in 2007-08. In DLHS-4 (2012-13) it seems unmet need has substantially increased to 30 percent. This is basically due to higher unmet need for spacing among the younger cohort, a sign of decline in the desire for large family size. District wise contraceptive prevalence rate and unmet need are presented in figure 13.
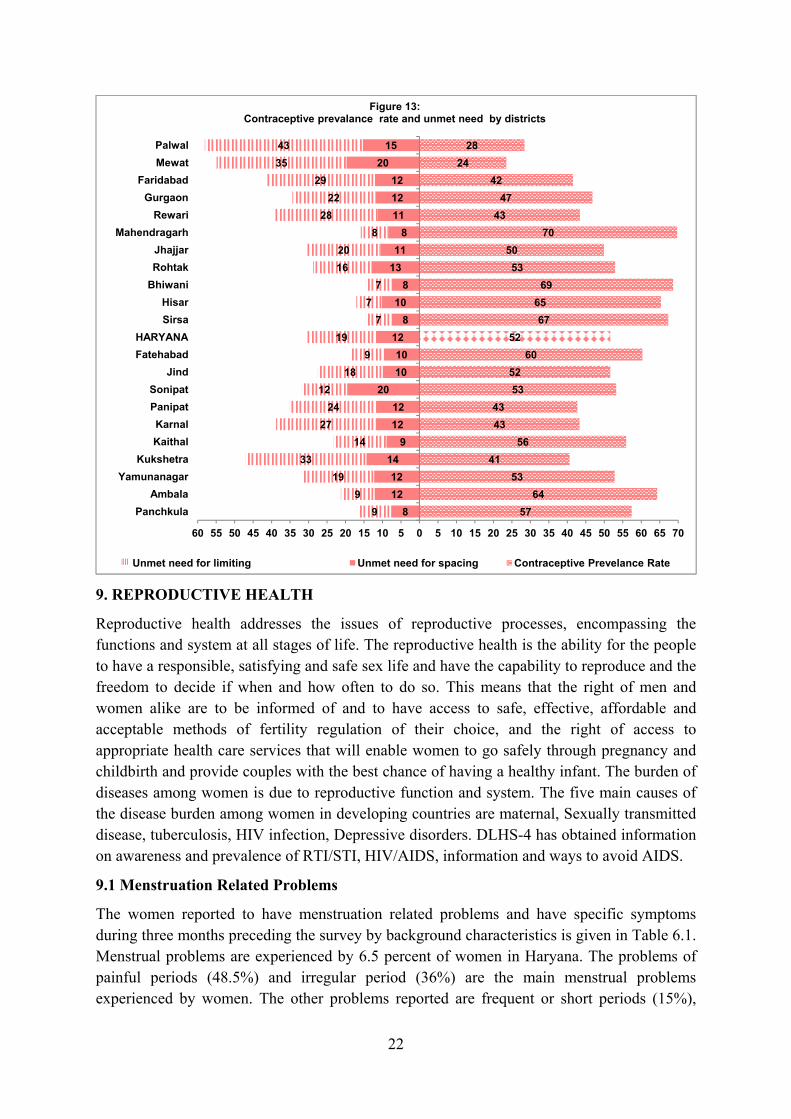
22
9. REPRODUCTIVE HEALTH
Reproductive health addresses the issues of reproductive processes, encompassing the functions and system at all stages of life. The reproductive health is the ability for the people to have a responsible, satisfying and safe sex life and have the capability to reproduce and the freedom to decide if when and how often to do so. This means that the right of men and women alike are to be informed of and to have access to safe, effective, affordable and acceptable methods of fertility regulation of their choice, and the right of access to appropriate health care services that will enable women to go safely through pregnancy and childbirth and provide couples with the best chance of having a healthy infant. The burden of diseases among women is due to reproductive function and system. The five main causes of the disease burden among women in developing countries are maternal, Sexually transmitted disease, tuberculosis, HIV infection, Depressive disorders. DLHS-4 has obtained information on awareness and prevalence of RTI/STI, HIV/AIDS, information and ways to avoid AIDS.
9.1 Menstruation Related Problems
The women reported to have menstruation related problems and have specific symptoms during three months preceding the survey by background characteristics is given in Table 6.1. Menstrual problems are experienced by 6.5 percent of women in Haryana. The problems of painful periods (48.5%) and irregular period (36%) are the main menstrual problems experienced by women. The other problems reported are frequent or short periods (15%),
8
12
12
14
9
12
12
20
10
10
12
8
10
8
13
11
8
11
12
12
20
15
9
9
19
33
14
27
24
12
18
9
19
7
7
7
16
20
8
28
22
29
35
43
57
64
53
41
56
43
43
53
52
60
52
67
65
69
53
50
70
43
47
42
24
28
60 55 50 45 40 35 30 25 20 15 10 5 0 5 10 15 20 25 30 35 40 45 50 55 60 65 70
Panchkula
Ambala
Yamunanagar
Kukshetra
Kaithal
Karnal
Panipat
Sonipat
Jind
Fatehabad
HARYANA
Sirsa
Hisar
Bhiwani
Rohtak
Jhajjar
Mahendragarh
Rewari
Gurgaon
Faridabad
Mewat
Palwal
Unmet need for spacing Contraceptive Prevelance Rate
Figure 13:Contraceptive prevalance rate and unmet need by districts
Unmet need for limiting
23
prolonged bleeding (14%), scanty bleeding (7%), absences of periods (13%) and blood clots/excessive bleeding (4%). The differentials in menstruation related problems are found by age, place of residences and education of both husband and the women. Women who had consummated their marriage below 18 years of age have had more menstruation related problems (7%). The menstrual related problems also increased with duration of marriage. Around 7 percent of women had reported to have menstrual problems whose marital duration was 10-14 years and just above 7 percent for women whose marital duration was more than 15 years. The menstrual related problems did not differ drastically by caste and religion.
9.2 Awareness of RTI/STI
The awareness of RTI/STI was obtained from ever married women. The women who are aware about RTI/STI were further asked on the modes of transmission and symptoms of the disease. Table 6.2 shows the percentage of women who have heard of RTI/STI by background characteristics. About one-fourth of women in Haryana had heard of RTI/STI. The proportion of women who were aware of RTI/STI was comparatively higher in urban areas (34%) than in rural areas (20%). Awareness of RTI/STI was lower among young women, women with low age at consummation of marriage, non-literate and women from Scheduled tribes. Awareness of RTI/STI increases with education of women. Thirty seven percent of women who had completed ten or more years of schooling were aware about RTI/STI.
Television is an important source of knowledge about RTI/STI, 66 percent women reported they had heard about RTI/STI from TV. Forty five percent of women reported Leaders/Community meeting as source of knowledge of RTI/STI. Another major important sources of information about RTI/STI are from print media (39%), cinema (33%), health personnel (20%). The sources of knowledge about RTI/STI differ by education of women and husband.
9.3 Knowledge Regarding Mode of Transmission of RTI/STI
The knowledge regarding mode of transmission of RTI/STI was asked to women who had heard of RTI/STI (Table 6.3). About 43 percent of women reported unsafe delivery, 40 percent unsafe abortion, 33 percent unsafe IUD insertion, 30 percent unsafe sex with persons who have many partners and 21 percent who have unsafe sex with sex workers as a mode of transmission of RTI/STI. More than one fourth of the women reported that unsafe sex with homosexuals were also as mode of the transmission of RTI/STI. The knowledge varies by residence, age at consummation, education of women and education of the husband.
Table 6.4 shows the common symptoms of reproductive tract infections/sexually transmitted infections among women. More than 12 percent of ever married women have reported having symptoms related RTIs/STIs and 6 percent experienced abnormal vaginal discharge. The women reported itching or irritation over vulva (3%), pain in lower abdomen not related to menses (3%). More than 55 percent of women discussed the RTI/STI related problems with their husband or partner (Table 6.5). The women mostly sought treatment for RTI/STI (72%) from private health facility.
24
The women who have heard about RTI/STI varies from 7 percent in Panipath district to 56 percent in Panchkula district. The districts where more than one-third of the women have heard about RTI/STI are Kaithal, Jind, Hisar, Bhiwani, Jhajjar, Gurgaon and faridabad. Women reporting any abnormal vaginal discharge varied from 2 percent in Ambala district to 11 percent in Mahendragarh district. More than half of the women in five districts (Panchkula, Yamunanagar, Fatehabad, Sirsa and Mahendragarh) had Sought treatment for any RTI/STI including abnormal discharge.
9.4 Awareness of HIV/AIDS
The awareness on HIV/AIDS was asked to ever-married women age 15-49 years. More than 52 percent of the women had heard about HIV/AIDS. Television is the one of the major source of knowledge on HIV/AIDS. Ninety percent of women reported that TV is the main source of knowledge on HIV/AIDS, followed by cinema and Community's leaders meetings (43% each), print media (36%), school adult education programs (31%), health personal (22%), husband (6%) and radio (9%) (Table 6.7). More than half of the women reported unsafe sex with person having many partners, transfusion of infected blood (51%) and sharing of injection/needle (43%) as mode of transmission of HIV/AIDS (Table 6.8). The reported modes of transmission of HIV/AIDS differ by residence, education of women and husband.
Table 6.9 shows knowledge of methods of preventing HIV. About two-fifth of women were of the view that HIV/AIDS can be prevented by avoiding risks of getting infected through blood. Nearly one-third of women were of the opinion that by using condom correctly during each sexual intercourse and having sex with one uninfected partner can prevent HIV/AIDS. The differences in the preventing HIV/AIDs were found by residence, age at consummation of marriage, education of women and husband. The misconception about transmission of HIV/AIDS from mosquito, flea or bedbug was reported by 9 percent of women. The other misconception was sharing food (3.5%), stepping on someone’s urine/stool (4.7%), sharing clothes (3%), hugging and shaking hand (2.2%) respectively.
The women who had heard about HIV/AIDS were asked the place to test the HIV/AIDS (Table 6.11). More than two-fifth of the women know the place where the HIV/AIDS could be tested. The differences in the place of test were found by residence, age at consummation of marriage, education of women and husband. Forty three percent of women reported government hospital/dispensary and 46 percent reported private hospital/clinic as a place where people can go to test HIV/AIDS. The women who have heard about HIV/AIDS were asked if they had gone for the test. Thirteen percent of women had undergone for HIV/AIDS test (Table 6.12).
10. PERSONAL HABITS
Personal habits of adults (age 15 and above) such as consumption or abuse of tobacco and alcohol, and eating unhealthy foods are usually viewed from the lens of risk-taking behaviour due to their adverse health outcomes. The emerging morbidity pattern from the personal habits is a crucial predictor of current as well as future health status of a population. It has become increasingly important to understand and examine the impact, these habits have on
25
overall health status in India in the context of the epidemiologic and demographic transitions. Besides, the treatment seeking behaviours for these illnesses reflects the availability, accessibility, as well as quality of health care services. Studies have shown evidences of correlation between the shift towards non-communicable diseases (NCD) and increasing risk-taking behaviours among adult individuals. For instance, excessive drinking is linked to acute and chronic physical health problems, particularly those related to the heart, blood circulation, respiratory, diabetes, mental health, cancer, crime and disorder, domestic violence, unprotected sex, unintended pregnancy, etc., (Room, Baboor, and Rehm, (2005). Alcohol consumption contributes to many diseases and is now the fifth leading risk-factor for the global disease (Lim, Vos, Flaxman, et al, 2012). Also, the economic burden of these NCD is equally serious - i.e., a 10 percent rise in NCDs is found associated with 1 percent lower rates of annual economic growth. However, programmes to combat NCDs were tremendously underfunded, and a low priority policy, as it is not part of the millennium development goals (MDG).
The WHO has recently stated that NCD such as cancer, diabetes, and hypertension are largest causes of death, and by 2020 cardiovascular diseases will be the largest cause of death and disability, including developing countries like India (WHO 2010). In 2012, the UN conference on sustainable development (Rio+20), referred to non-communicable diseases as “one of the major challenges for sustainable development in the 21st century”, emphasising the fundamental link between health and development. In the same year, the World Health Assembly endorsed an important new health goal: to reduce avoidable mortality from non-communicable diseases (NCDs) by 25% by 2025 (the 25 by 25 goal). The future threat to health is from NCDs, as the world also urbanizes faster than before.
Since 1990s India’s overall health status has shown tremendous improvement, which signals a change and shift in pattern of morbidity and causes of death to non-communicable diseases (NCD), despite still substantial contribution of communicable diseases. The NCD accounted for 42 percent of all deaths in India (56% in urban areas and 40% in rural areas), as compared to communicable diseases with 38 percent (RGI, 2003). Estimated prevalence of diabetes, hypertension, ischemic heart diseases (IHD) and stroke is 62.5, 159.5, 37.0 and 1.54 per 1000 respectively. In the National Health Policy (NHP), the Government of India (GOI) has committed to eradicating infectious illnesses and reducing the mortality associated with such illness (MOHFW, 2002). One of the goals of the NHP 2002 is a 50 percent reduction of deaths from TB, malaria, and other vector and water borne diseases by the year 2010.
This chapter presents findings on the personal risk-taking habits, acute and chronic (infectious and non-communicable) diseases, and their treatment-seeking behaviours.
10.1 Tobacco and Alcohol Use in India
Tobacco and alcohol use have been associated with a wide range of major diseases, including several types of cancers and heart and lung diseases. Studies have shown that in addition to sharing the same health risks as men, women who use tobacco or alcohol also experience difficulty in becoming pregnant, are at an increased risk of infertility, pregnancy complications, premature births, low-birth-weight infants, stillbirths, and infant deaths (USDHHS, 2004).
26
In India, information about tobacco and alcohol use among adults has been collected by various household surveys such as the National Sample Survey (NSSO) (50th round, 1998), NFHS (1992-93, 1998-99, and 2005-06), DLHS (2007-08), the Global Adult Tobacco Survey-India (GATS-India, 2009-10), etc., each survey with specific objectives and methodology. According to GATS India, 35 percent of adults in India age 15 and over use tobacco in some form or the other, with higher use among adults in most North eastern region (39-67%), east (36-50%), and central (40-53%) (IIPS & MoH&FW, 2010).
In India, there are varieties of tobacco products and its use is also very diverse. The most common ways of tobacco use are the smoking and oral (smokeless) variety. Dominant among the smoking form include cigarettes and bidis, while in case of the oral use of smokeless tobacco, chewing or applying to the teeth or gums (scented/unscented, with paan) are the popular forms, which has also become very popular in most parts of the country. The DLHS-4 also collects information related to tobacco and alcohol usage directly from among the eligible adults (women age 15-49 and men age 15-54).
In case of alcohol consumption, household surveys in India show that alcohol use among adults, both men and women, is not uncommon, but the use is found much lesser than tobacco use. Alcohol consumption is higher among men than females. Study in India indicated the prevalence of current use of alcohol ranged from about 7 percent in Gujarat (state officially under prohibition) to a very high 75 percent in Arunachal Pradesh, and its consumption among women exceeded 5 percent only in the North Eastern region. DLHS-4 information on alcohol use by adult men and women comes from a substantial number of respondents (40,830 men and 46,415 women).
10.2 Tobacco Use in Haryana
As shown in Table 7.1, overall 16 percent of adults in Haryana use any kind of tobacco in one way or the other. However, tobacco use varies across the state by age, residence, education, region, etc. The survey clearly indicates that tobacco use is highest and more likely among men (29%), older persons age 40 plus (over 20%), non literates and people with less than 5 years of education (18-24%), rural residents (18%), and among scheduled caste (18%), etc.
In Haryana, the adults are using more of the smoking form (14%) as compared to the oral form (smokeless variety) of tobacco (3%). Use of smoke tobacco is higher among men (27%) as compared with females (2%), in rural areas (16%) and also more likely to be higher among the older adults aged 40 and above (19-22%), and those with less than 5 years of education (22%), and also among the scheduled caste (17%).
In general, it is observed that in Haryana use of tobacco among adults increases with age, but in contrast, declines with increase in educational status. The pattern of using tobacco among adults also shows an interesting scenario across the districts in Haryana. Of the 21 districts in the state, two districts, namely Karnal and Kuruksherta stand out as lower use of tobacco in the state, but it is highest in Fatehabad and Yamunanagar (about 6% each), followed by Ambala and Sirsa (5% each) in the state. In case of smoking form of tobacco the use among adults ranges from 9 percent in Fatehabad and yamunanagar to 23 percent in Bhiwani (Table
27
7.4). Other districts in which at least 15-20 percent of adults are likely to smoke are Kaithal, Panipat, Jind, Hisar, Jhajjar, Mahendragarh, Gurgaon, Mewat and Palwal.
The use of tobacco (all forms) among men is not substantially high in Haryana (5% for oral or smokeless and 27% for smoking). It is interesting to note that both forms of tobacco use is the lowest among teenagers (1% for smokeless and 3% for smoking), but increases sharply from age 20 onwards (among youth) to older ages. Smoking is more common among men in rural areas (30%) than urban males (22%). Among men also, age and education emerge as important factors. The older males say age 45 and above are more likely (6% for smokeless and 38% for smoking) to use tobacco products than those aged less than 20 (1% for smokeless and 3% for smoking). Similarly, as education level increases use of tobacco in any form is more likely to diminish among men. The more educated males are nearly two to three times less likely to use tobacco than their counterparts who are illiterate (Table 7.2).
In Haryana, strictly speaking, smoking form of tobacco is used widely by men (about 27%) than oral or smokeless form (5%). Around 2 percent of adult men use tobacco with paan, while 3 percent use other forms of tobacco. About 19 percent of men are usual smokers (smoke at least once a day) in Haryana. The proportion of usual smokers is 22 percent in rural areas as compared with 15 percent in urban areas (Table 7.6).
Generally, use of tobacco is found to be very less among women, more so when compared with men. However, in Haryana (Table 7.1), a small proportion of adult women (2%) reported using any kind of tobacco. Among the women tobacco users, while only about 2 percent smoke, a very small proportion of them (below 1%) use the oral form or chew tobacco (Table 7.3).
The pattern of tobacco use observed among women is similar to that found among men. For instance, majority of women tobacco users prefer the smoking form and they belong to rural areas (3%), as compared with urban women (about 1%). As presented in Tables 7.3, women tobacco users are mostly to be over age 30 and those with less education. Clearly, age and education play an important role in influencing such personal habits. Among those women who use non-smoke form/chew tobacco, below 1 percent use betel nut or paan (Table 7.5). Among women who smoke, just about 1 percent are usual smokers (smoke at least once a day), which is found to be higher in rural areas (Table 7.6).
10.3 Use of Alcohol in Haryana
Household surveys in India show that alcohol use among adults, both men and women, is not uncommon, but the use is found much lesser than tobacco use. Alcohol consumption is higher among men than women. Study in India indicated the prevalence of current use of alcohol ranged from about 7 percent in Gujarat (state officially under prohibition) to a very high 75 percent in Arunachal Pradesh, and its consumption among women exceeded 5 percent only in the North Eastern region. DLHS-4 information on alcohol use by adult men and women comes from a substantial number of respondents (40,830 men and 46,415 women).
As presented in Table 7.1, in Haryana 10 percent of adults consume alcohol. In the state, the level of consumption is found much higher among adults age above 30 (13-16%), in rural areas (11%), with less than 5 years of education (14%), and highest among scheduled caste
28
(12%). The proportion of men consuming alcohol is much higher (20%) as compared with women (below 1%). Unlike use of tobacco, education does not make much impact as an important factor. Undoubtedly, use of alcohol is higher among adults with lesser education, as compared to the more educated persons but the proportions do not differ drastically. The level of alcohol consumption by religious affiliation shows that the least consumption is among Jains (3%) and highest among ‘Others’ (18%).
In Haryana, alcohol consumption across the districts shows that of the 21 districts, only in 10 districts the level is less than 10 percent (Table 7.4). The prevalence of alcohol use across the state ranges from 5 percent in Mewat to about 19 percent in Gurgaon. Consumption of alcohol is found high in districts such as Bhiwani (14%), followed by Panchkula, Jind, Jhajjar, Faridabad and Kaithal (around 13% each), Sirsa (12%), Ambala (11%) and Hisar and Rohtak (about 10% each). Districts with less than 10 percent of adults consuming alcohol are Yamunanagar, Kuruksherta, Karnal, Panipat, Sonipat, Fatehabad, Mahendragarh, Rewari, Mewat and Palwal.
In Haryana, consumption of alcohol is found more concentrated among males (20%), much higher than among females (below 1%). Men who are more likely to consume alcohol are those in their 30’s and 40’s (around 25%), non-literates (27%), who follow ‘Other’ religions (28%) and scheduled caste (22%). The reporting of consumption of alcohol is seen among the teenagers (2%). It is interesting to note that more or less equal proportion of men in both rural and urban areas consume alcohol (around 20%).
Only about 1 percent of adult females reported consuming alcohol in Haryana (Table 7.3). The consumption of alcohol increases by age, with higher intake among older females age 45 and above (0.8%). A very small proportion of adult women (0.2%) reported as being a usual drinker.
11. MORBIDITY STATUS
In DLHS-4, for the first time, information on morbidity status of the household members was collected from the household respondent. The main objective is to get a somewhat fair idea about the prevalence of both acute illnesses (suffered for a week) and chronic illnesses (for a month or more), including disability (current) and injury (in last one year), suffered by any household member prior to the survey. Respondents were asked about occurrences of such illnesses among the household members, and to name the illness, including those diagnosed. Further, in case of occurrence of any disability, injury or illness, respondents were also asked about the nature of care sought, the type and place of health facility where treatment was done.
Depending on the nature and duration, all the illnesses or diseases are classified as (a) acute, and (b) chronic. Acute illness refers to those that occur suddenly with severe symptoms for short period during the last 15 days prior to the survey. Example includes diarrhoea, dysentery, acute respiratory tract infection (ARI), jaundice with fever, fever with chill/rigors/malaria, fever with rash, reproductive tract infections (RTI), etc. In case of chronic illness, those symptoms that persist for longer than one month in the past one year
29
prior to the survey. The list provided includes both symptoms and associated diseases categories.
11.1 Disability and Injury
From each of the selected household, DLHS-4 collected information from the head of the household or adult respondent on any injury and on five specific disabilities that household members may have suffered from such as mental, visual, hearing, speech, and locomotor. As it is difficult to capture the type of injury and its severity from lay reporting, assessment is made indirectly from the type and duration of hospitalization required for the injury.
As presented in Table 7.8, in Haryana about 2 percent of the sample population reported suffering from any injury. The prevalence of any injury is a little higher in the rural areas (1.9%) compared to urban areas (1.4%). The prevalence of any injury is observed to be higher in males (1.8%) as compared with females (1.3%) in the state.
About 4 percent of the injuries reported were treated in intensive care. However, 13 percent of injuries were treated as in-patient with stay for less than a week, and 9 percent reported they treated as in-patient with stay for more than 2 weeks. Interestingly, in Haryana, about 67 percent of injuries were treated using other form of treatments, i.e. other than intensive care or staying/in-patient, such as out-patient, traditional healers, or home remedies. More of females go for other treatments (68%) as compared with males. There is not much variation observed in terms of treatment of any injury by residence in Haryana.
In Haryana, among the five disabilities, the prevalence of visual disability is a little higher (0.3%) as compared to other disabilities. Mental, Speech and hearing disabilities are the other disabilities reported in Haryana (0.2%, 0.1% and 0.1% respectively). The prevalence of all the disabilities is more or less similar between men and women. No variation is observed in all the disabilities between the rural and urban areas (Table 7.9).
11.2 Reported Illnesses: Acute and Chronic
In order to assess the prevalence of illnesses from the selected household level in DLHS-4, the household respondents were first asked if any member of their households had suffered from any illness in the past one month or year. If reported that someone had suffered, more detail of the illness recorded, including main source of treatment. As mentioned earlier, all the illnesses are classified into (a) acute and (b) chronic, based on the nature and duration, and the information is collected from head or any adult member of the household.
Acute Illnesses
The prevalence of acute illness at the household level in Haryana is 13 percent. The differential in the prevalence of acute illness by residence shows little variation, with a higher rate in the rural areas (13.4 against 12.5 in urban areas).
About 13 percent of household members reported suffering from any acute illness in Haryana, and more of women (14%) than men (13%) reported to have suffered from any acute illness. Among the prevailing acute illnesses, fever (other than those with rash or jaundice) is reported by nearly 38 percent, followed by acute respiratory tract infection (ARTI) (27%), malaria (13%), diarrhoea/dysentery (4%) and fever with rash (3%).
30
Interestingly, more men are suffered from acute respiratory tract infection (ARTI) than women, whereas a higher proportion of women (39%) reported as being suffered with other type of fever than men (37%). Prevalence of acute respiratory tract infection (ARTI) is found higher in urban areas, whereas malaria and other type of fever is found to be higher in rural areas.
Nearly everyone who had suffered from any acute illness sought treatment. Among those who had sought treatment, 80 percent preferred treatment at private facility, mainly in a clinic/dispensary (61%), followed by hospital (19%). About 10 percent of those who had acute illnesses got treated in a government facility, mainly in a hospital (7%). About 3 percent with any acute illnesses were treated at DOTS centre or at home. In Haryana, use of private health facility for treatment of acute illness is quite common even in rural areas (81%), and more or less equally accessed by both males and females.
Chronic Illnesses
Survey results of chronic illnesses described pertain to prevalence, type, and source of treatment by sex and residence. In Haryana about 15 percent of the households reported a member suffering from chronic illnesses that lasted for over a month in the past one year prior to the survey (Table 7.8). As shown in Table 7.13, reporting by symptoms of chronic illnesses suffered by household members is highest for diseases of the musculoskeletal system (24%), followed by diseases of respiratory system (10%) and gastrointestinal system (7%). Diseases related to cardiovascular system, central nervous system and skin account for about 5 percent respectively. Interestingly, reporting of symptoms of chronic diseases other than the twelve identified diseases account for 32 percent.
In Haryana, not much differences observed in the reporting of symptoms of chronic diseases between males and females, except in case of some diseases. For instance, more males reported symptoms related to respiratory system (12% as compared with 8% among females), cardiovascular system (7% versus 4% by females) and skin diseases (6% against 4% among females). In contrast, females reported more of symptoms related to disease of musculoskeletal system (28% compared to 18% among males).
By and large, most chronic illnesses show more or less similar prevalence in both rural and urban areas. However, some of these chronic illnesses show slightly higher prevalence either in rural or urban areas. For instance, urban residents reported more of diseases of cardiovascular system (6%) and ‘others’ (39%) than rural residents. In case of rural areas, much higher reporting related to diseases of respiratory system (10%), musculoskeletal system (25%), gastrointestinal system (8%), and skin (6%) is observed.
Household respondents were also asked about the nature and source of treatment for chronic illnesses suffered by any of their household member. In Haryana, only 55 percent of those who suffered from chronic illnesses have details of diagnosis or treatment. About one-third has no details of diagnosis or treatment, and about 14 percent do not sought treatment at all. The proportion not seeking treatment (16%) or with no details of treatment (33%) is more in the rural areas as compared to urban areas (12% and 29% respectively). Overall, 51 percent of rural residents and 61 percent of urban residents have details of diagnosis or treatment for
31
the chronic illnesses. It is also observed that a higher proportion of males (57%) have details of diagnosis or treatment than females (53%).
Interestingly, in Haryana most people who suffered from chronic illnesses sought treatment at private facility (78%), which is observed to be equally accessible for both urban and rural residents. About 19 percent were treated at government facility, while 1 percent reported being treated at home, and 2 percent sought other form of treatment.
Persons who sought treatment for chronic illnesses were also asked about the details of the diagnoses at the facility. In Haryana, hypertension (12%) and diabetes (8%) are the most commonly diagnosed chronic illnesses, followed by diseases related to heart and asthma or chronic respiratory failure (around 4% each). Goitre accounts for about 1 percent of the diagnosed chronic illnesses, and about 1 percent with tuberculosis (TB). As expected, the proportion diagnosed with these chronic illnesses is much higher in urban areas, particularly hypertension and diabetes. The results show that more females suffered from hypertension (14% against 10% among males), while men are more suffered from diabetes (10% against 6% among females), diseases related to heart (6% against 3% among females), asthma or chronic respiratory failure (4% against 3% among females) and tuberculosis (2% against 1%).
Contrast to situation in the general population, among the older persons age 60 and above the prevalence of most chronic illnesses is much higher. For instance, about 14 percent of older persons were diagnosed with hypertension, 11 percent with diabetes, and about 6 percent each with diseases related to heart and asthma or chronic respiratory failure (Table 7.15). The prevalence of some of these chronic illnesses indicates that higher proportion of older persons in urban areas suffered from hypertension (19% as compared with 12% in rural areas), diabetes (19% against 7% in rural areas) and diseases related to heart (7% against 6%), while in rural areas a higher proportion older persons reported as being suffered from asthma or chronic respiratory failure (7% as compared with 4% in urban areas) and tuberculosis (2% against 1%). Similar to the situation in the general population, among the older persons also it is found that more females are diagnosed with hypertension (16% as compared with 13% among males). More of male older persons are diagnosed with diabetes, diseases related to heart, asthma or chronic respiratory failure, TB and stroke. The proportion of older persons diagnosed with these chronic illnesses is much higher in urban areas, particularly hypertension and diabetes.
11.3 Tuberculosis (TB)
Tuberculosis has re-emerged as a major public health problem in many parts of the world, often as a concomitant illness to HIV/AIDS. Tuberculosis, once known as the ‘White Plague’, is contagious and spreads through droplets that can travel through the air when a person with the infection coughs, talks, or sneezes. Today, TB is a leading cause of death among people who are HIV-positive. Worldwide, an estimated one-third of the nearly 40 million people living with HIV/AIDS are co-infected with TB. In most developing countries, TB would continue to be a serious health threat even in the absence of HIV/AIDS due to the public health challenges posed by poverty, high illiteracy, and poor sanitation. The GOI has stated that ‘In 2005, a total of 97 percent population was covered under the Revised National
32
Tuberculosis Programme.’ The government allocated Rs. 680 crores for the National Tuberculosis Control Programme (NTCP) in the 10th Plan (DGHS and WHO, 2005).
In Haryana, about 1 percent of the household population diagnosed with TB, which is found higher among males and in rural areas.
12. NUTRITION AND HEALTH
The DLHS-4 collected data on the nutritional status of children by measuring the height and weight of all children under age five in the selected households. The nutritional status assessment helps to identify sub groups of child population that face increase risk of faltered growth and potential health risks and vulnerabilities. The nutritional status of children in the survey population is compared with WHO child growth standards, which are based on an international sample of ethnically, culturally and genetically diverse healthy children living under optimum condition that are conducive to achieving a Child’s full genetic growth potential (WHO, 2006)1. These standards can therefore be used to assess nutritional status of children all over the world, regardless of ethnicity, social and economic influence and child feeding practices. Accordingly, three standard indices of physical growth that describes the nutritional status of children are height-for-age (stunting), weight-for-height (wasting) and weight-for-age (underweight). Each of these indices provides different information about growth and body composition that can be used to assess nutritional status.
In DLHS-4, all children listed in the household, who were born in year 2008 or later were eligible for measurement of their height and weight. Thus, height and weight measurements were collected even from those children whose mothers may not have been interviewed in the survey. For this purpose, all the survey team carried with them two scales and two height boards, which were standardized in all aspects and calibrated for accuracy. Recumbent length was recorded for children under age two years. Standing height was measured for all other children. Table 8.1 represents percentage of children below age five classified as malnourished according to three anthropometric indices of nutritional status (height for age, weight for height and weight for age) by some selected background characteristics. The analysis is based on information collected from 12153 children from Haryana for whom complete and erodible anthropometric and age data are available.
12.1 Height-for-Age (Stunting)
Height-for-age measures linear growth. A child who is more than two standard deviations below the median (-2SD) of the WHO reference population in terms of height-for-age is considered short for his or her age are stunted. This condition reflects the cumulative effect of chronic malnutrition. If a child is below three standard deviations (-3SD) from the reference median, he or she is considered to be severely stunted. In Haryana 32 percent children under age five are stunted and more than 15 percent are severely stunted. Variation in the prevalence of stunting by age group shows that stunting is highest (42%) in children age 19-24 months, followed by those in age 25-35 months (37%) and the lowest (12%) in children
1 World Health Organization (WHO) Multicentre Growth Reference Study Group. 2006. WHO Child
Growth Standards: Length/Height-for-Age, Weight-for-Length, Weight-for-Height and Body Mass Indexfor- Age: Methods and Development. Geneva, Switzerland: WHO.
33
below age 6 months. Prevalence of severe stunting shows a similar pattern, with the height proportion of severe stunting in children age 19-24 months (30%), followed by among those age 25-35 months (19%). Sex differential in the prevalence of stunting is not pronounced as both male and female children are equally likely to be stunted (32% each). The sex differential remains by and large the same even in ease of severe stunting. Children under age five living in rural areas and coming from schedule caste families as more likely to be stunted than others.
The prevalence of stunting is not uniform across different districts in Haryana. Stunting is the lowest in Mewat district (7%) followed by Karnal and Rewari (17% each). While, the prevalence of stunting is the highest in Kaithal (59%) followed by Ambala (48%). Severe stunting is the lowest in Mewat (3%), followed by Karnal and Panipat (9%). On the other hand, Kaithal portrays the highest prevalence even in case of severe stunting.
12.2 Weight-for-Height (Wasting)
Weight-for-height describes the current nutritional status. A child who is more than two standard deviations below (-2SD) the reference median for weight-for-height is considered to be too thin for his or her height, or wasted. This condition reflects acute or recent nutritional deficit. As with stunting, wasting is considered sever if the child is more than three standard deviations below the reference median. Overall 32 percent children in Haryana are wasted and 19 percent are severely wasted. Analysis by age group shows that wasting rages from a minimum 29 percent in children age 19-24 months to the maximum 40 percentage in children in age 0-6 months. Children residing in rural areas are more likely to be wasted (34%) than children living in urban areas (31%). Children from scheduled caste are more likely to be wasted (35%) than the children in other caste groups. Variations by district portray that wasting in children ranges from 15 percent in each of Mahendragarh to 46 percent in Karnal.
12.3 Weight-for-Age (Underweight)
Weight-for-age is a composite index of weight-for-height and height-for-age. Thus, it is does not distinguish between acute malnutrition (wasting) and chronic malnutrition (stunting). A child can be underweight for his age because he or she is stunted, because he or she is wasted, or both.
Table 8.1 reveals that 36 percent of children under age 5 are underweight and 15 percent are severely underweight. The proportion of underweight children is the highest (40%) among children age 25-35 months and the lowest (27%) among children age 7-12 months. The sex differential in the proportion of underweight children is not so much pronounced. Rural children are more likely to be underweight (37%) than the urban children (35%). Children from scheduled tribes are relatively more likely to be underweight than other caste groups. By districts, proportion of underweight children ranges from 52 percent in Kaithal to 20 percent in Mewat.
34
12.4 Body Mass Index of Women
In many countries, chronic energy deficiency characterized by BMI of less than 18.5 among adults remains the predominant problem, leading to low productivity and reduced resistance to illness. Prevalence of overweight among women is also growing problem in developing countries. Overweight individuals are predisposed to a wide range of health problem including diabetes and heart diseases and also poor birth outcomes for pregnant women. The BMI is used to measure thinness or obesity. It is defined as weight in kilograms divided by height in meters squared (Kg/m2). A BMI of less than 18.5 is used to define thinness or acute under nutrition. A BMI of 25 or above usually indicates overweight and a BMI of 30 or above indicates obesity.
In DLHS-4, height and weight measurements in Haryana were obtained for 29,378 women age 15-49 years who were present in the sample households at the time of survey. Table 8.3 presents percentage of women age 15-49 by their BMI. The mean BMI is 22.5, which falls in the normal BMI classification. Around 59 percent of the women age 15-49 have a normal BMI , 22 percent are undernourished or thin (BMI less than 18.5) and 19 percent are overweight or obese ( BMI 25 or higher ). It is evident from the table that there is profound variation in BMI by some selected background characteristics of the women. The women age 15-19 are more likely to be thin are or undernourished (44%) than women in other age cohorts. Rural women are more likely to be thin or undernourished (25%) than their urban counterpart (17%), whereas urban women are more likely to be overweight or obese as compared to rural women (25% and 16% respectively). Educational attainment doesn’t show any consistent relationship with the proportion of thin or undernourished women. Among women who are non literate, nearly one fifth of them (21%) are thin or underweight and 18 percent are overweight or obese. The percentage of overweight or obese is highest among women having more than 10 years of schooling. The women from scheduled caste households, having larger potential to have food insecurity, are comparatively more likely to be thin in comparison to those households from rest caste-groups. Proportion of the women who are thin or underweight is not uniform across districts of Haryana. It ranges from the minimum of 13 percent in Kurukshetra and Faridabad to 29 percent in Hisar. On the other hand, proportion of ever married women who are overweight or obese is the highest in Sonipat (27%) and lowest in Mewat.
12.5 Prevalence of Anaemia
Anaemia, characterized by a low level of hemoglobin in the blood, is major health problem in developing countries, especially among young children and pregnant women. Anaemia among pregnant women may be an underlying cause of maternal mortality, spontaneous abortion, premature births, and low birth weight. The most common cause of anaemia is inadequate dietary intake of nutrients necessary for synthesis of hemoglobin, such as iron, folic acid, and vitamin B12. Anaemia also results from sickle cell disease, malaria, and parasitic infections (Benoist et al. 2008)2. It is against this background, a number of
2 Benoist, B. D., E. McLean, I. Egli, I., and M. Cogswell (eds.). 2008. Worldwide Prevalence of Anaemia 1993–2005: WHO Global Database on Anaemia. Geneva, Switzerland: World Health Organization
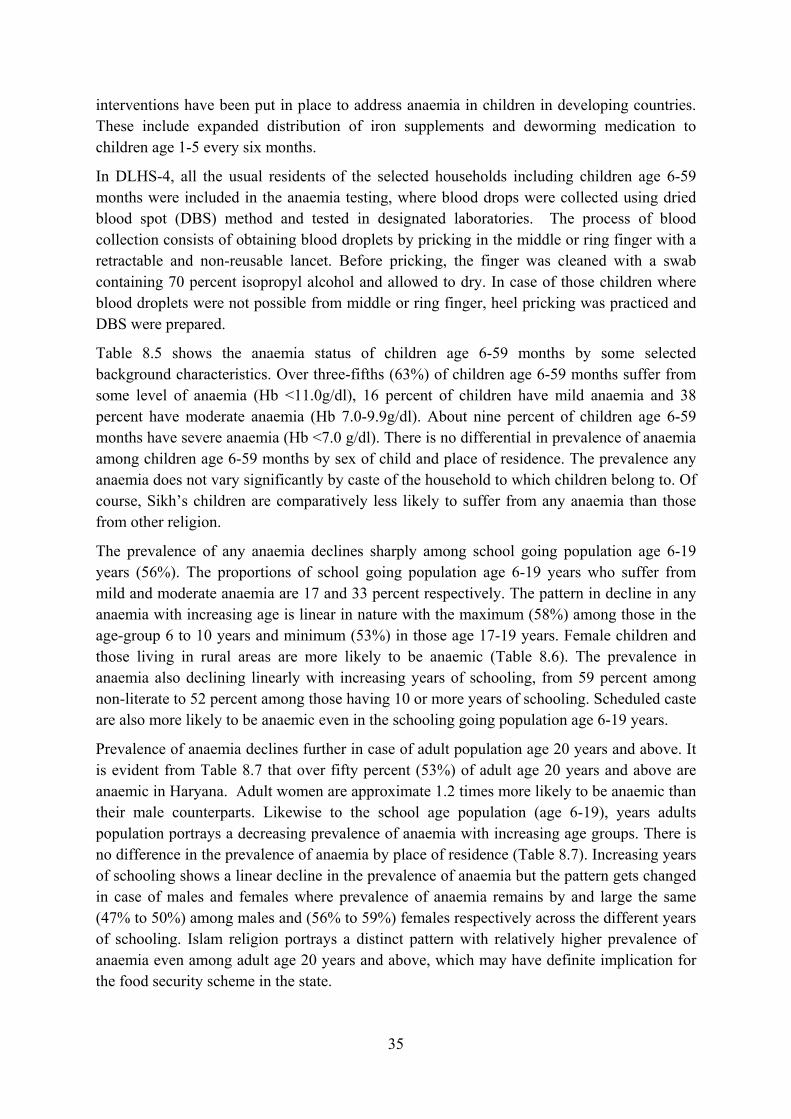
35
interventions have been put in place to address anaemia in children in developing countries. These include expanded distribution of iron supplements and deworming medication to children age 1-5 every six months.
In DLHS-4, all the usual residents of the selected households including children age 6-59 months were included in the anaemia testing, where blood drops were collected using dried blood spot (DBS) method and tested in designated laboratories. The process of blood collection consists of obtaining blood droplets by pricking in the middle or ring finger with a retractable and non-reusable lancet. Before pricking, the finger was cleaned with a swab containing 70 percent isopropyl alcohol and allowed to dry. In case of those children where blood droplets were not possible from middle or ring finger, heel pricking was practiced and DBS were prepared.
Table 8.5 shows the anaemia status of children age 6-59 months by some selected background characteristics. Over three-fifths (63%) of children age 6-59 months suffer from some level of anaemia (Hb <11.0g/dl), 16 percent of children have mild anaemia and 38 percent have moderate anaemia (Hb 7.0-9.9g/dl). About nine percent of children age 6-59 months have severe anaemia (Hb <7.0 g/dl). There is no differential in prevalence of anaemia among children age 6-59 months by sex of child and place of residence. The prevalence any anaemia does not vary significantly by caste of the household to which children belong to. Of course, Sikh’s children are comparatively less likely to suffer from any anaemia than those from other religion.
The prevalence of any anaemia declines sharply among school going population age 6-19 years (56%). The proportions of school going population age 6-19 years who suffer from mild and moderate anaemia are 17 and 33 percent respectively. The pattern in decline in any anaemia with increasing age is linear in nature with the maximum (58%) among those in the age-group 6 to 10 years and minimum (53%) in those age 17-19 years. Female children and those living in rural areas are more likely to be anaemic (Table 8.6). The prevalence in anaemia also declining linearly with increasing years of schooling, from 59 percent among non-literate to 52 percent among those having 10 or more years of schooling. Scheduled caste are also more likely to be anaemic even in the schooling going population age 6-19 years.
Prevalence of anaemia declines further in case of adult population age 20 years and above. It is evident from Table 8.7 that over fifty percent (53%) of adult age 20 years and above are anaemic in Haryana. Adult women are approximate 1.2 times more likely to be anaemic than their male counterparts. Likewise to the school age population (age 6-19), years adults population portrays a decreasing prevalence of anaemia with increasing age groups. There is no difference in the prevalence of anaemia by place of residence (Table 8.7). Increasing years of schooling shows a linear decline in the prevalence of anaemia but the pattern gets changed in case of males and females where prevalence of anaemia remains by and large the same (47% to 50%) among males and (56% to 59%) females respectively across the different years of schooling. Islam religion portrays a distinct pattern with relatively higher prevalence of anaemia even among adult age 20 years and above, which may have definite implication for the food security scheme in the state.
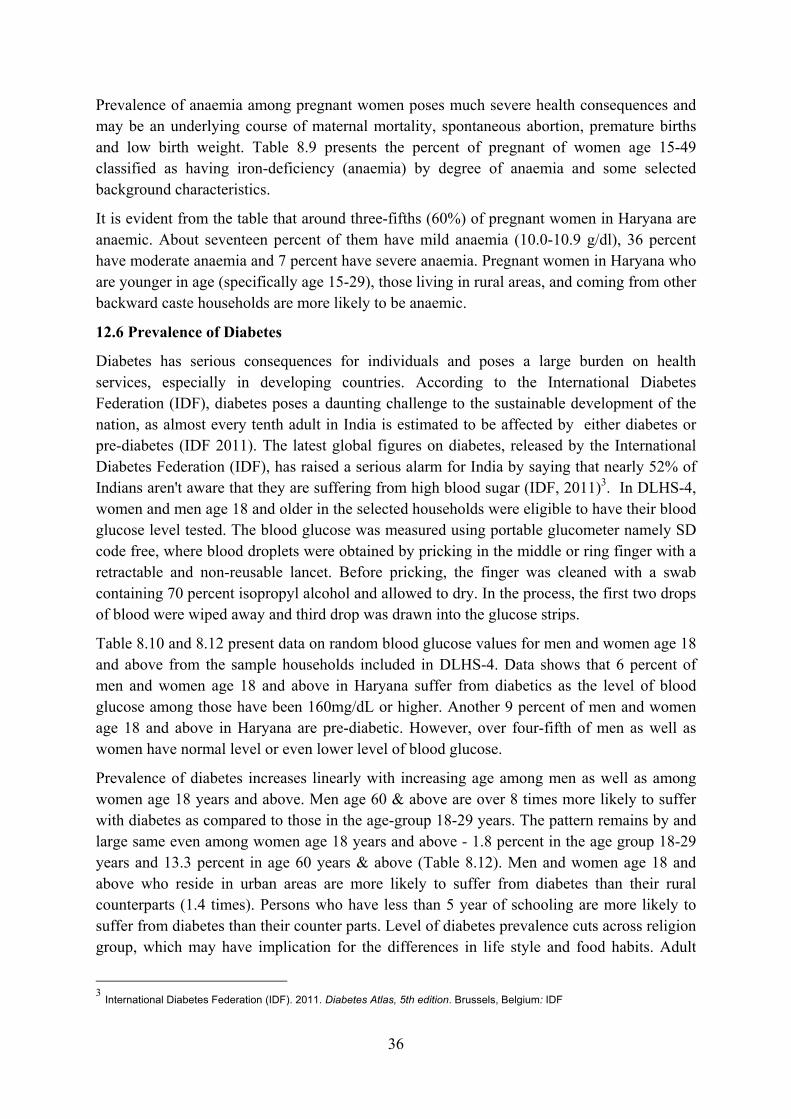
36
Prevalence of anaemia among pregnant women poses much severe health consequences and may be an underlying course of maternal mortality, spontaneous abortion, premature births and low birth weight. Table 8.9 presents the percent of pregnant of women age 15-49 classified as having iron-deficiency (anaemia) by degree of anaemia and some selected background characteristics.
It is evident from the table that around three-fifths (60%) of pregnant women in Haryana are anaemic. About seventeen percent of them have mild anaemia (10.0-10.9 g/dl), 36 percent have moderate anaemia and 7 percent have severe anaemia. Pregnant women in Haryana who are younger in age (specifically age 15-29), those living in rural areas, and coming from other backward caste households are more likely to be anaemic.
12.6 Prevalence of Diabetes
Diabetes has serious consequences for individuals and poses a large burden on health services, especially in developing countries. According to the International Diabetes Federation (IDF), diabetes poses a daunting challenge to the sustainable development of the nation, as almost every tenth adult in India is estimated to be affected by either diabetes or pre-diabetes (IDF 2011). The latest global figures on diabetes, released by the International Diabetes Federation (IDF), has raised a serious alarm for India by saying that nearly 52% of Indians aren't aware that they are suffering from high blood sugar (IDF, 2011)3. In DLHS-4, women and men age 18 and older in the selected households were eligible to have their blood glucose level tested. The blood glucose was measured using portable glucometer namely SD code free, where blood droplets were obtained by pricking in the middle or ring finger with a retractable and non-reusable lancet. Before pricking, the finger was cleaned with a swab containing 70 percent isopropyl alcohol and allowed to dry. In the process, the first two drops of blood were wiped away and third drop was drawn into the glucose strips.
Table 8.10 and 8.12 present data on random blood glucose values for men and women age 18 and above from the sample households included in DLHS-4. Data shows that 6 percent of men and women age 18 and above in Haryana suffer from diabetics as the level of blood glucose among those have been 160mg/dL or higher. Another 9 percent of men and women age 18 and above in Haryana are pre-diabetic. However, over four-fifth of men as well as women have normal level or even lower level of blood glucose.
Prevalence of diabetes increases linearly with increasing age among men as well as among women age 18 years and above. Men age 60 & above are over 8 times more likely to suffer with diabetes as compared to those in the age-group 18-29 years. The pattern remains by and large same even among women age 18 years and above - 1.8 percent in the age group 18-29 years and 13.3 percent in age 60 years & above (Table 8.12). Men and women age 18 and above who reside in urban areas are more likely to suffer from diabetes than their rural counterparts (1.4 times). Persons who have less than 5 year of schooling are more likely to suffer from diabetes than their counter parts. Level of diabetes prevalence cuts across religion group, which may have implication for the differences in life style and food habits. Adult
3 International Diabetes Federation (IDF). 2011. Diabetes Atlas, 5th edition. Brussels, Belgium: IDF
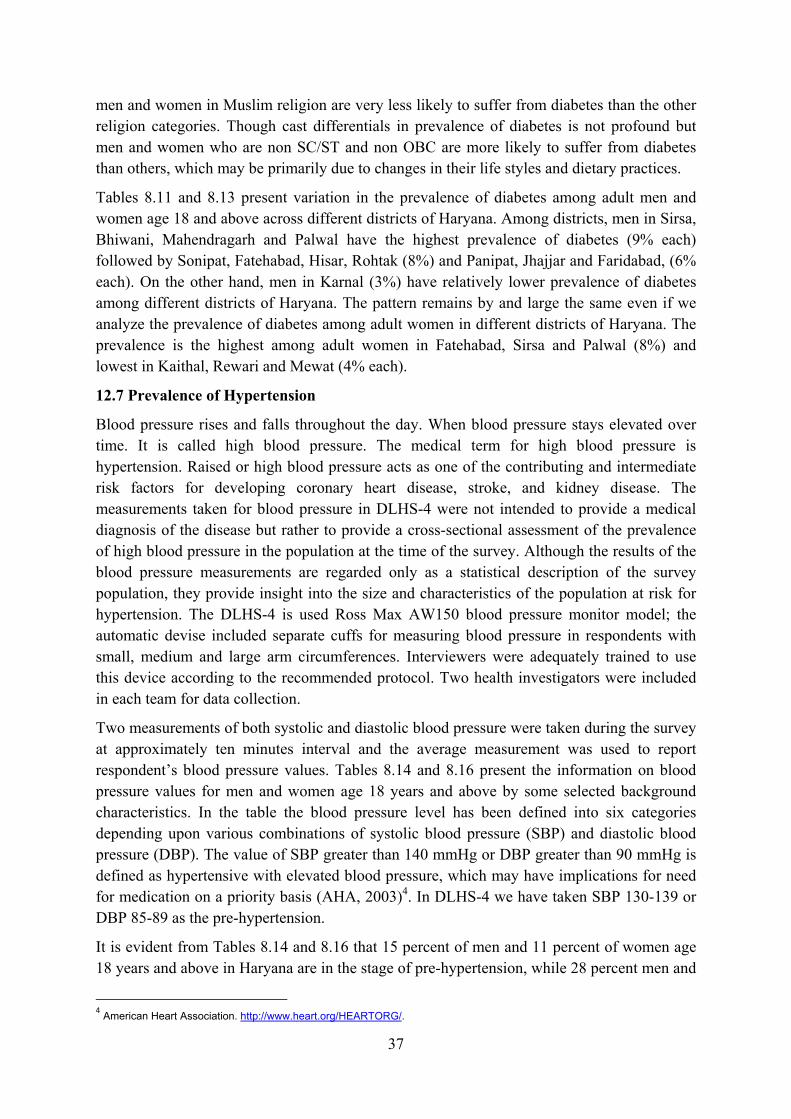
37
men and women in Muslim religion are very less likely to suffer from diabetes than the other religion categories. Though cast differentials in prevalence of diabetes is not profound but men and women who are non SC/ST and non OBC are more likely to suffer from diabetes than others, which may be primarily due to changes in their life styles and dietary practices.
Tables 8.11 and 8.13 present variation in the prevalence of diabetes among adult men and women age 18 and above across different districts of Haryana. Among districts, men in Sirsa, Bhiwani, Mahendragarh and Palwal have the highest prevalence of diabetes (9% each) followed by Sonipat, Fatehabad, Hisar, Rohtak (8%) and Panipat, Jhajjar and Faridabad, (6% each). On the other hand, men in Karnal (3%) have relatively lower prevalence of diabetes among different districts of Haryana. The pattern remains by and large the same even if we analyze the prevalence of diabetes among adult women in different districts of Haryana. The prevalence is the highest among adult women in Fatehabad, Sirsa and Palwal (8%) and lowest in Kaithal, Rewari and Mewat (4% each).
12.7 Prevalence of Hypertension
Blood pressure rises and falls throughout the day. When blood pressure stays elevated over time. It is called high blood pressure. The medical term for high blood pressure is hypertension. Raised or high blood pressure acts as one of the contributing and intermediate risk factors for developing coronary heart disease, stroke, and kidney disease. The measurements taken for blood pressure in DLHS-4 were not intended to provide a medical diagnosis of the disease but rather to provide a cross-sectional assessment of the prevalence of high blood pressure in the population at the time of the survey. Although the results of the blood pressure measurements are regarded only as a statistical description of the survey population, they provide insight into the size and characteristics of the population at risk for hypertension. The DLHS-4 is used Ross Max AW150 blood pressure monitor model; the automatic devise included separate cuffs for measuring blood pressure in respondents with small, medium and large arm circumferences. Interviewers were adequately trained to use this device according to the recommended protocol. Two health investigators were included in each team for data collection.
Two measurements of both systolic and diastolic blood pressure were taken during the survey at approximately ten minutes interval and the average measurement was used to report respondent’s blood pressure values. Tables 8.14 and 8.16 present the information on blood pressure values for men and women age 18 years and above by some selected background characteristics. In the table the blood pressure level has been defined into six categories depending upon various combinations of systolic blood pressure (SBP) and diastolic blood pressure (DBP). The value of SBP greater than 140 mmHg or DBP greater than 90 mmHg is defined as hypertensive with elevated blood pressure, which may have implications for need for medication on a priority basis (AHA, 2003)4. In DLHS-4 we have taken SBP 130-139 or DBP 85-89 as the pre-hypertension.
It is evident from Tables 8.14 and 8.16 that 15 percent of men and 11 percent of women age 18 years and above in Haryana are in the stage of pre-hypertension, while 28 percent men and
4 American Heart Association. http://www.heart.org/HEARTORG/.
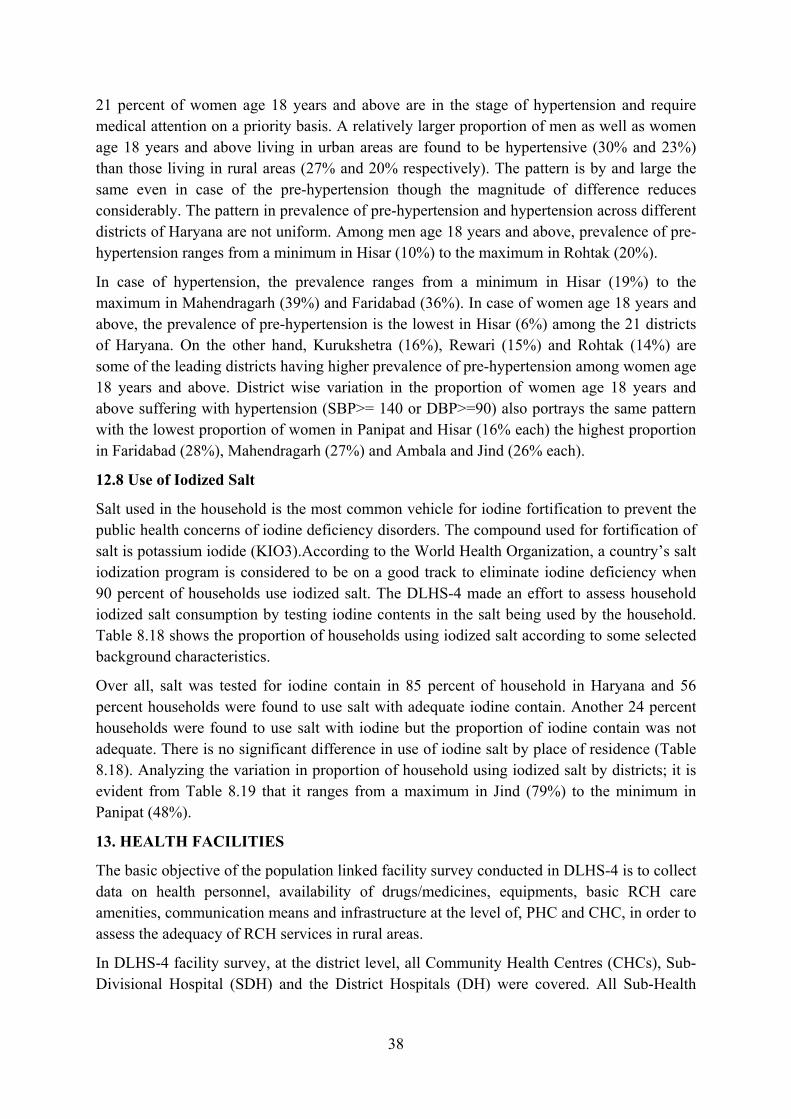
38
21 percent of women age 18 years and above are in the stage of hypertension and require medical attention on a priority basis. A relatively larger proportion of men as well as women age 18 years and above living in urban areas are found to be hypertensive (30% and 23%) than those living in rural areas (27% and 20% respectively). The pattern is by and large the same even in case of the pre-hypertension though the magnitude of difference reduces considerably. The pattern in prevalence of pre-hypertension and hypertension across different districts of Haryana are not uniform. Among men age 18 years and above, prevalence of pre-hypertension ranges from a minimum in Hisar (10%) to the maximum in Rohtak (20%).
In case of hypertension, the prevalence ranges from a minimum in Hisar (19%) to the maximum in Mahendragarh (39%) and Faridabad (36%). In case of women age 18 years and above, the prevalence of pre-hypertension is the lowest in Hisar (6%) among the 21 districts of Haryana. On the other hand, Kurukshetra (16%), Rewari (15%) and Rohtak (14%) are some of the leading districts having higher prevalence of pre-hypertension among women age 18 years and above. District wise variation in the proportion of women age 18 years and above suffering with hypertension (SBP>= 140 or DBP>=90) also portrays the same pattern with the lowest proportion of women in Panipat and Hisar (16% each) the highest proportion in Faridabad (28%), Mahendragarh (27%) and Ambala and Jind (26% each).
12.8 Use of Iodized Salt
Salt used in the household is the most common vehicle for iodine fortification to prevent the public health concerns of iodine deficiency disorders. The compound used for fortification of salt is potassium iodide (KIO3).According to the World Health Organization, a country’s salt iodization program is considered to be on a good track to eliminate iodine deficiency when 90 percent of households use iodized salt. The DLHS-4 made an effort to assess household iodized salt consumption by testing iodine contents in the salt being used by the household. Table 8.18 shows the proportion of households using iodized salt according to some selected background characteristics.
Over all, salt was tested for iodine contain in 85 percent of household in Haryana and 56 percent households were found to use salt with adequate iodine contain. Another 24 percent households were found to use salt with iodine but the proportion of iodine contain was not adequate. There is no significant difference in use of iodine salt by place of residence (Table 8.18). Analyzing the variation in proportion of household using iodized salt by districts; it is evident from Table 8.19 that it ranges from a maximum in Jind (79%) to the minimum in Panipat (48%).
13. HEALTH FACILITIES
The basic objective of the population linked facility survey conducted in DLHS-4 is to collect data on health personnel, availability of drugs/medicines, equipments, basic RCH care amenities, communication means and infrastructure at the level of, PHC and CHC, in order to assess the adequacy of RCH services in rural areas.
In DLHS-4 facility survey, at the district level, all Community Health Centres (CHCs), Sub-Divisional Hospital (SDH) and the District Hospitals (DH) were covered. All Sub-Health
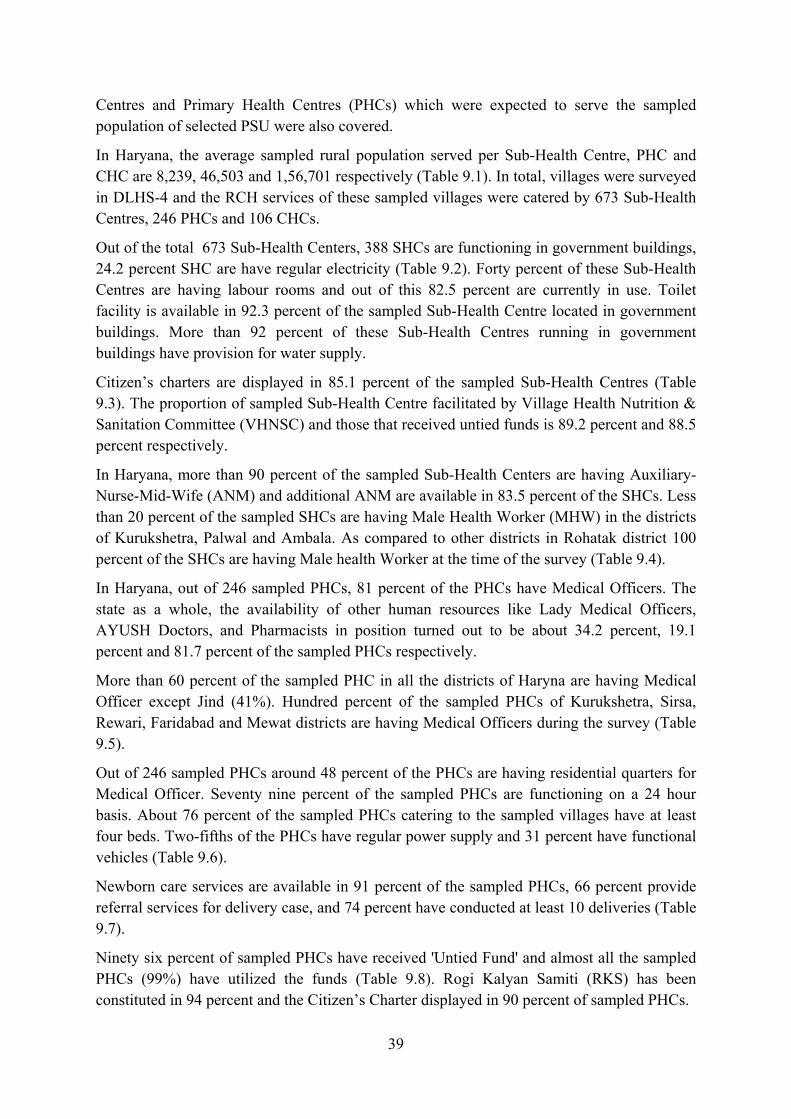
39
Centres and Primary Health Centres (PHCs) which were expected to serve the sampled population of selected PSU were also covered.
In Haryana, the average sampled rural population served per Sub-Health Centre, PHC and CHC are 8,239, 46,503 and 1,56,701 respectively (Table 9.1). In total, villages were surveyed in DLHS-4 and the RCH services of these sampled villages were catered by 673 Sub-Health Centres, 246 PHCs and 106 CHCs.
Out of the total 673 Sub-Health Centers, 388 SHCs are functioning in government buildings, 24.2 percent SHC are have regular electricity (Table 9.2). Forty percent of these Sub-Health Centres are having labour rooms and out of this 82.5 percent are currently in use. Toilet facility is available in 92.3 percent of the sampled Sub-Health Centre located in government buildings. More than 92 percent of these Sub-Health Centres running in government buildings have provision for water supply.
Citizen’s charters are displayed in 85.1 percent of the sampled Sub-Health Centres (Table 9.3). The proportion of sampled Sub-Health Centre facilitated by Village Health Nutrition & Sanitation Committee (VHNSC) and those that received untied funds is 89.2 percent and 88.5 percent respectively.
In Haryana, more than 90 percent of the sampled Sub-Health Centers are having Auxiliary-Nurse-Mid-Wife (ANM) and additional ANM are available in 83.5 percent of the SHCs. Less than 20 percent of the sampled SHCs are having Male Health Worker (MHW) in the districts of Kurukshetra, Palwal and Ambala. As compared to other districts in Rohatak district 100 percent of the SHCs are having Male health Worker at the time of the survey (Table 9.4).
In Haryana, out of 246 sampled PHCs, 81 percent of the PHCs have Medical Officers. The state as a whole, the availability of other human resources like Lady Medical Officers, AYUSH Doctors, and Pharmacists in position turned out to be about 34.2 percent, 19.1 percent and 81.7 percent of the sampled PHCs respectively.
More than 60 percent of the sampled PHC in all the districts of Haryna are having Medical Officer except Jind (41%). Hundred percent of the sampled PHCs of Kurukshetra, Sirsa, Rewari, Faridabad and Mewat districts are having Medical Officers during the survey (Table 9.5).
Out of 246 sampled PHCs around 48 percent of the PHCs are having residential quarters for Medical Officer. Seventy nine percent of the sampled PHCs are functioning on a 24 hour basis. About 76 percent of the sampled PHCs catering to the sampled villages have at least four beds. Two-fifths of the PHCs have regular power supply and 31 percent have functional vehicles (Table 9.6).
Newborn care services are available in 91 percent of the sampled PHCs, 66 percent provide referral services for delivery case, and 74 percent have conducted at least 10 deliveries (Table 9.7).
Ninety six percent of sampled PHCs have received 'Untied Fund' and almost all the sampled PHCs (99%) have utilized the funds (Table 9.8). Rogi Kalyan Samiti (RKS) has been constituted in 94 percent and the Citizen’s Charter displayed in 90 percent of sampled PHCs.
40
In Haryna total 106 CHCs have surveyed. Out of this, 14 CHCs are having an Obstetric Gynecologist in position, 7 CHCs are having Pediatrician, 9 CHCs are having Anesthetist and 12 CHCs are having Public Health Manager (Table 9.9).
Out of the total surveyed CHCs, only 8 CHCs have blood storage facility and 76 CHCs have designated as First Referral Units (FRUs). Out of total 106 CHCs around 49 and 97 CHCs are having functional Operation Theaters (OTs) and newborn care services respectively (Table 9.10).
In Haryana out of the total surveyed CHCs, 95 CHCs have utilized untied funds, 100 CHCs have constituted RKS and 99 CHCs are monitoring regularly and displayed citizen's charter in 98 CHCs (Table 9.11).
Total 21 Sub-Divisional Hospitals (SDHs) have surveyed in Haryana out of this only 6 SDHs are having pediatricians and only 2 SDHs are having radiographers in position. Only one Sub-Divisional Hospital namely Faridabad district is having 2D echo facility. Ultra sound facilities are available in only 3 Sub-Divisional Hospitals, three phase connection is available in nineteen SDHs, critical care area is available in 9 Sub-Divisional Hospitals and suggestions and complaint boxes are available in all Sub-Divisional Hospitals.
In Haryana total 21 District Hospitals have surveyed out of this 20 District Hospitals having pediatricians in position and eight of the District Hospitals are having radiographers. Eight District Hospitals are having 2D echo facility and 19 District Hospitals are having ultra sound facilities. Three phase connection is available in all districts, critical care area is available in 16 District Hospitals and suggestions and complaint boxes are available in all the District Hospitals.
BACKGROUND CHARACTERISTICS

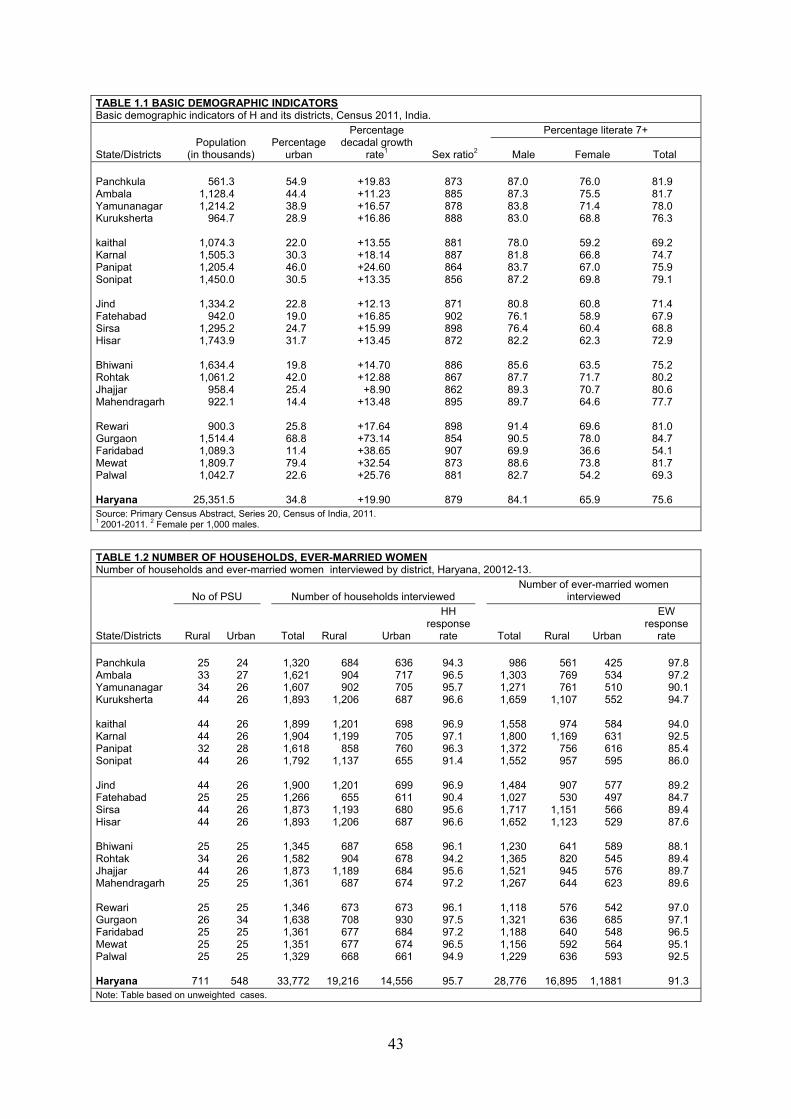
43
TABLE 1.1 BASIC DEMOGRAPHIC INDICATORS Basic demographic indicators of H and its districts, Census 2011, India.
State/Districts Population
(in thousands) Percentage
urban
Percentage decadal growth
rate1 Sex ratio2
Percentage literate 7+
Male Female Total Panchkula Ambala Yamunanagar Kuruksherta kaithal Karnal Panipat Sonipat Jind Fatehabad Sirsa Hisar Bhiwani Rohtak Jhajjar Mahendragarh Rewari Gurgaon Faridabad Mewat Palwal Haryana
561.3
1,128.4 1,214.2
964.7
1,074.3 1,505.3 1,205.4 1,450.0
1,334.2
942.0 1,295.2 1,743.9
1,634.4 1,061.2
958.4 922.1
900.3
1,514.4 1,089.3 1,809.7 1,042.7
25,351.5
54.9 44.4 38.9 28.9
22.0 30.3 46.0 30.5
22.8 19.0 24.7 31.7
19.8 42.0 25.4 14.4
25.8 68.8 11.4 79.4 22.6
34.8
+19.83 +11.23 +16.57 +16.86
+13.55 +18.14 +24.60 +13.35
+12.13 +16.85 +15.99 +13.45
+14.70 +12.88
+8.90 +13.48
+17.64 +73.14 +38.65 +32.54 +25.76
+19.90
873 885 878 888
881 887 864 856
871 902 898 872
886 867 862 895
898 854 907 873 881
879
87.0 87.3 83.8 83.0
78.0 81.8 83.7 87.2
80.8 76.1 76.4 82.2
85.6 87.7 89.3 89.7
91.4 90.5 69.9 88.6 82.7
84.1
76.0 75.5 71.4 68.8
59.2 66.8 67.0 69.8
60.8 58.9 60.4 62.3
63.5 71.7 70.7 64.6
69.6 78.0 36.6 73.8 54.2
65.9
81.9 81.7 78.0 76.3
69.2 74.7 75.9 79.1
71.4 67.9 68.8 72.9
75.2 80.2 80.6 77.7
81.0 84.7 54.1 81.7 69.3
75.6
Source: Primary Census Abstract, Series 20, Census of India, 2011. 1 2001-2011. 2 Female per 1,000 males.
TABLE 1.2 NUMBER OF HOUSEHOLDS, EVER-MARRIED WOMEN Number of households and ever-married women interviewed by district, Haryana, 20012-13.
State/Districts
No of PSU Number of households interviewed Number of ever-married women
interviewed
Rural Urban Total Rural Urban
HH response
rate Total Rural Urban
EW response
rate Panchkula Ambala Yamunanagar Kuruksherta kaithal Karnal Panipat Sonipat Jind Fatehabad Sirsa Hisar Bhiwani Rohtak Jhajjar Mahendragarh Rewari Gurgaon Faridabad Mewat Palwal Haryana
25 33 34 44
44 44 32 44
44 25 44 44
25 34 44 25
25 26 25 25 25
711
24 27 26 26
26 26 28 26
26 25 26 26
25 26 26 25
25 34 25 25 25
548
1,320 1,621 1,607 1,893
1,899 1,904 1,618 1,792
1,900 1,266 1,873 1,893
1,345 1,582 1,873 1,361
1,346 1,638 1,361 1,351 1,329
33,772
684 904 902
1,206
1,201 1,199
858 1,137
1,201
655 1,193 1,206
687 904
1,189 687
673 708 677 677 668
19,216
636 717 705 687
698 705 760 655
699 611 680 687
658 678 684 674
673 930 684 674 661
14,556
94.3 96.5 95.7 96.6
96.9 97.1 96.3 91.4
96.9 90.4 95.6 96.6
96.1 94.2 95.6 97.2
96.1 97.5 97.2 96.5 94.9
95.7
9861,3031,2711,659
1,5581,8001,3721,552
1,4841,0271,7171,652
1,2301,3651,5211,267
1,1181,3211,1881,1561,229
28,776
561 769 761
1,107
974 1,169
756 957
907 530
1,151 1,123
641 820 945 644
576 636 640 592 636
16,895
425 534 510 552
584 631 616 595
577 497 566 529
589 545 576 623
542 685 548 564 593
1,1881
97.8 97.2 90.1 94.7
94.0 92.5 85.4 86.0
89.2 84.7 89.4 87.6
88.1 89.4 89.7 89.6
97.0 97.1 96.5 95.1 92.5
91.3
Note: Table based on unweighted cases.
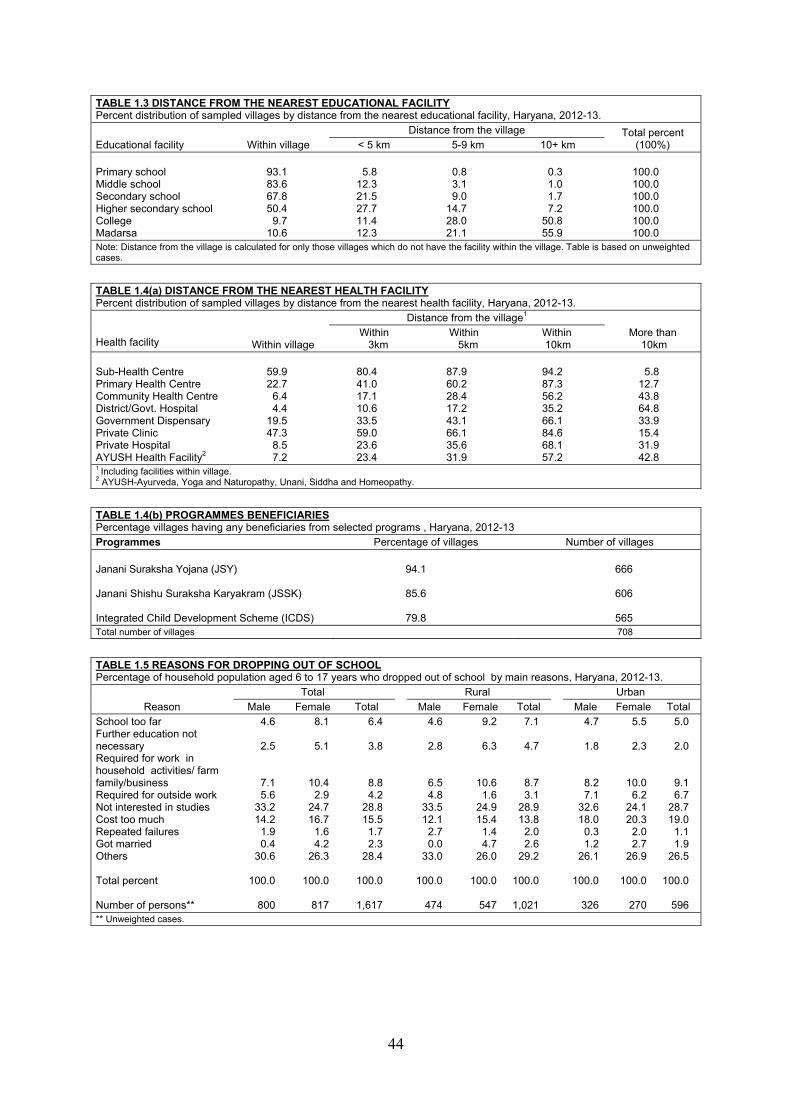
44
TABLE 1.3 DISTANCE FROM THE NEAREST EDUCATIONAL FACILITY Percent distribution of sampled villages by distance from the nearest educational facility, Haryana, 2012-13.
Educational facility Within village Distance from the village Total percent
(100%) < 5 km 5-9 km 10+ km Primary school Middle school Secondary school Higher secondary school College Madarsa
93.1 83.6 67.8 50.4
9.7 10.6
5.8
12.3 21.5 27.7 11.4 12.3
0.8 3.1 9.0
14.7 28.0 21.1
0.3 1.0 1.7 7.2
50.8 55.9
100.0 100.0 100.0 100.0 100.0 100.0
Note: Distance from the village is calculated for only those villages which do not have the facility within the village. Table is based on unweighted cases.
TABLE 1.4(a) DISTANCE FROM THE NEAREST HEALTH FACILITY Percent distribution of sampled villages by distance from the nearest health facility, Haryana, 2012-13.
Health facility Within village
Distance from the village1 More than
10km Within
3km Within
5km Within 10km
Sub-Health Centre Primary Health Centre Community Health Centre District/Govt. Hospital Government Dispensary Private Clinic Private Hospital AYUSH Health Facility2
59.9 22.7
6.4 4.4
19.5 47.3
8.5 7.2
80.4 41.0 17.1 10.6 33.5 59.0 23.6 23.4
87.9 60.2 28.4 17.2 43.1 66.1 35.6 31.9
94.2 87.3 56.2 35.2 66.1 84.6 68.1 57.2
5.8
12.7 43.8 64.8 33.9 15.4 31.9 42.8
1 Including facilities within village. 2 AYUSH-Ayurveda, Yoga and Naturopathy, Unani, Siddha and Homeopathy.
TABLE 1.4(b) PROGRAMMES BENEFICIARIES Percentage villages having any beneficiaries from selected programs , Haryana, 2012-13 Programmes Percentage of villages Number of villages Janani Suraksha Yojana (JSY) Janani Shishu Suraksha Karyakram (JSSK) Integrated Child Development Scheme (ICDS)
94.1
85.6
79.8
666
606
565
Total number of villages 708
TABLE 1.5 REASONS FOR DROPPING OUT OF SCHOOL Percentage of household population aged 6 to 17 years who dropped out of school by main reasons, Haryana, 2012-13.
Reason Total Rural Urban
Male Female Total Male Female Total Male Female Total School too far Further education not necessary Required for work in household activities/ farm family/business Required for outside work Not interested in studies Cost too much Repeated failures Got married Others Total percent Number of persons**
4.6
2.5
7.1 5.6
33.2 14.2
1.9 0.4
30.6
100.0
800
8.1
5.1
10.4 2.9
24.7 16.7
1.6 4.2
26.3
100.0
817
6.4
3.8
8.8 4.2
28.8 15.5
1.7 2.3
28.4
100.0
1,617
4.6
2.8
6.5 4.8
33.5 12.1
2.7 0.0
33.0
100.0
474
9.2
6.3
10.6 1.6
24.9 15.4
1.4 4.7
26.0
100.0
547
7.1
4.7
8.7 3.1
28.9 13.8
2.0 2.6
29.2
100.0
1,021
4.7
1.8
8.2 7.1
32.6 18.0
0.3 1.2
26.1
100.0
326
5.5
2.3
10.0 6.2
24.1 20.3
2.0 2.7
26.9
100.0
270
5.0
2.0
9.1 6.7
28.7 19.0
1.1 1.9
26.5
100.0
596 ** Unweighted cases.
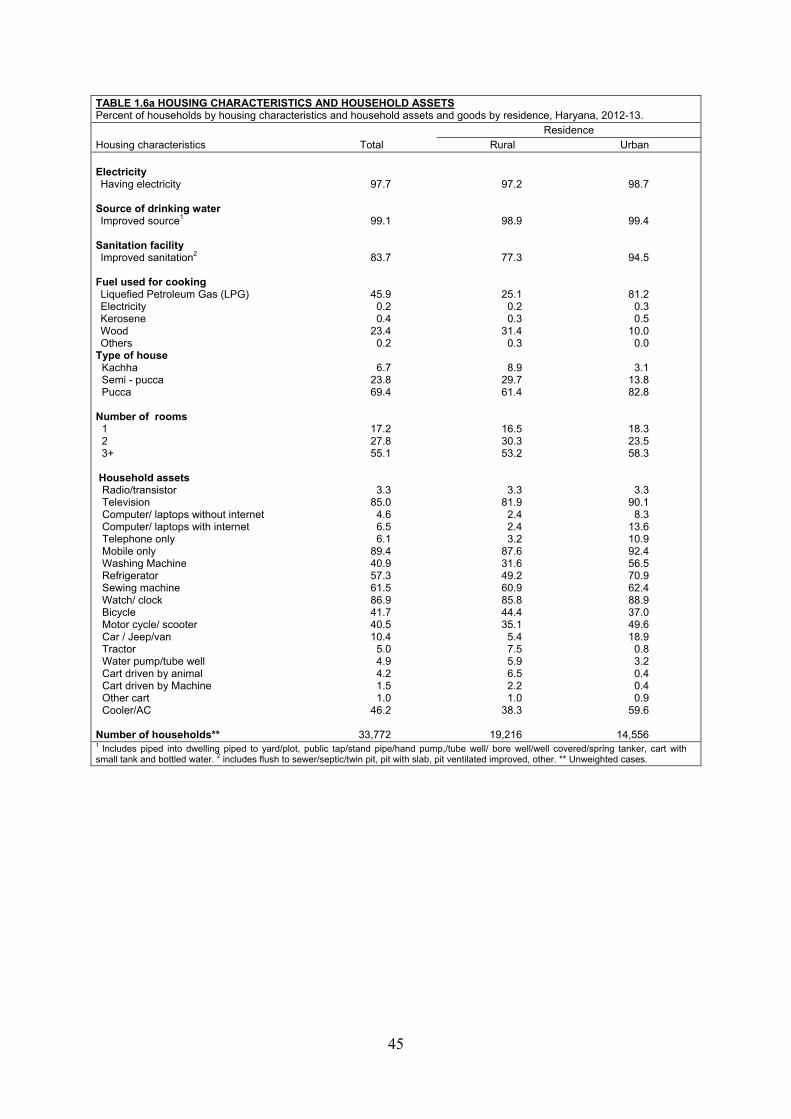
45
TABLE 1.6a HOUSING CHARACTERISTICS AND HOUSEHOLD ASSETS Percent of households by housing characteristics and household assets and goods by residence, Haryana, 2012-13.
Housing characteristics Total Residence
Rural Urban Electricity Having electricity
Source of drinking water Improved source1
Sanitation facility Improved sanitation2
Fuel used for cooking Liquefied Petroleum Gas (LPG) Electricity Kerosene Wood Others
Type of house Kachha Semi - pucca Pucca
Number of rooms
1 2 3+
Household assets Radio/transistor Television Computer/ laptops without internet Computer/ laptops with internet Telephone only Mobile only Washing Machine Refrigerator Sewing machine Watch/ clock Bicycle Motor cycle/ scooter Car / Jeep/van Tractor Water pump/tube well Cart driven by animal Cart driven by Machine Other cart Cooler/AC
Number of households**
97.7
99.1
83.7
45.9 0.2 0.4
23.4 0.2
6.7
23.8 69.4
17.2 27.8 55.1
3.3 85.0
4.6 6.5 6.1
89.4 40.9 57.3 61.5 86.9 41.7 40.5 10.4
5.0 4.9 4.2 1.5 1.0
46.2
33,772
97.2
98.9
77.3
25.1 0.2 0.3
31.4 0.3
8.9
29.7 61.4
16.5 30.3 53.2
3.3 81.9
2.4 2.4 3.2
87.6 31.6 49.2 60.9 85.8 44.4 35.1
5.4 7.5 5.9 6.5 2.2 1.0
38.3
19,216
98.7
99.4
94.5
81.2 0.3 0.5
10.0 0.0
3.1
13.8 82.8
18.3 23.5 58.3
3.3 90.1
8.3 13.6 10.9 92.4 56.5 70.9 62.4 88.9 37.0 49.6 18.9
0.8 3.2 0.4 0.4 0.9
59.6
14,556 1 Includes piped into dwelling piped to yard/plot, public tap/stand pipe/hand pump,/tube well/ bore well/well covered/spring tanker, cart with small tank and bottled water. 2 includes flush to sewer/septic/twin pit, pit with slab, pit ventilated improved, other. ** Unweighted cases.
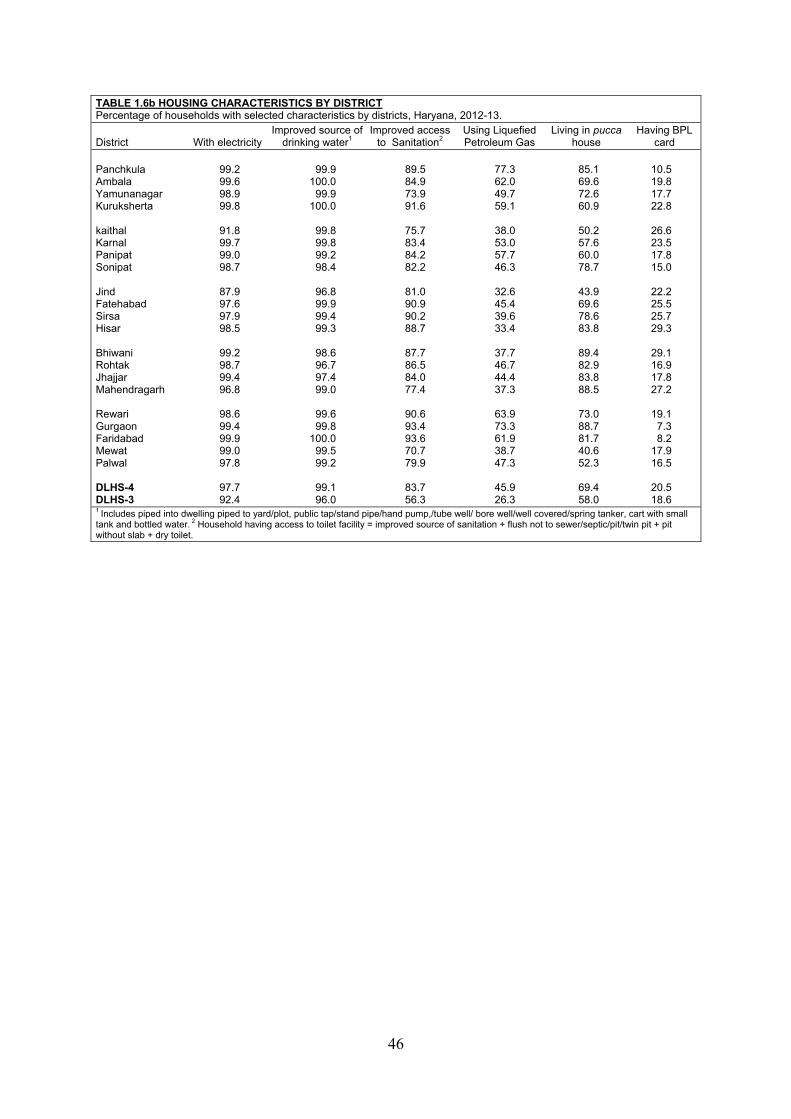
46
TABLE 1.6b HOUSING CHARACTERISTICS BY DISTRICT Percentage of households with selected characteristics by districts, Haryana, 2012-13.
District With electricity Improved source of
drinking water1 Improved access
to Sanitation2 Using Liquefied Petroleum Gas
Living in pucca house
Having BPL card
Panchkula Ambala Yamunanagar Kuruksherta kaithal Karnal Panipat Sonipat Jind Fatehabad Sirsa Hisar Bhiwani Rohtak Jhajjar Mahendragarh Rewari Gurgaon Faridabad Mewat Palwal DLHS-4 DLHS-3
99.2 99.6 98.9 99.8
91.8 99.7 99.0 98.7
87.9 97.6 97.9 98.5
99.2 98.7 99.4 96.8
98.6 99.4 99.9 99.0 97.8
97.7 92.4
99.9
100.0 99.9
100.0
99.8 99.8 99.2 98.4
96.8 99.9 99.4 99.3
98.6 96.7 97.4 99.0
99.6 99.8
100.0 99.5 99.2
99.1 96.0
89.5 84.9 73.9 91.6
75.7 83.4 84.2 82.2
81.0 90.9 90.2 88.7
87.7 86.5 84.0 77.4
90.6 93.4 93.6 70.7 79.9
83.7 56.3
77.3 62.0 49.7 59.1
38.0 53.0 57.7 46.3
32.6 45.4 39.6 33.4
37.7 46.7 44.4 37.3
63.9 73.3 61.9 38.7 47.3
45.9 26.3
85.1 69.6 72.6 60.9
50.2 57.6 60.0 78.7
43.9 69.6 78.6 83.8
89.4 82.9 83.8 88.5
73.0 88.7 81.7 40.6 52.3
69.4 58.0
10.5 19.8 17.7 22.8
26.6 23.5 17.8 15.0
22.2 25.5 25.7 29.3
29.1 16.9 17.8 27.2
19.1
7.3 8.2
17.9 16.5
20.5 18.6
1 Includes piped into dwelling piped to yard/plot, public tap/stand pipe/hand pump,/tube well/ bore well/well covered/spring tanker, cart with small tank and bottled water. 2 Household having access to toilet facility = improved source of sanitation + flush not to sewer/septic/pit/twin pit + pit without slab + dry toilet.
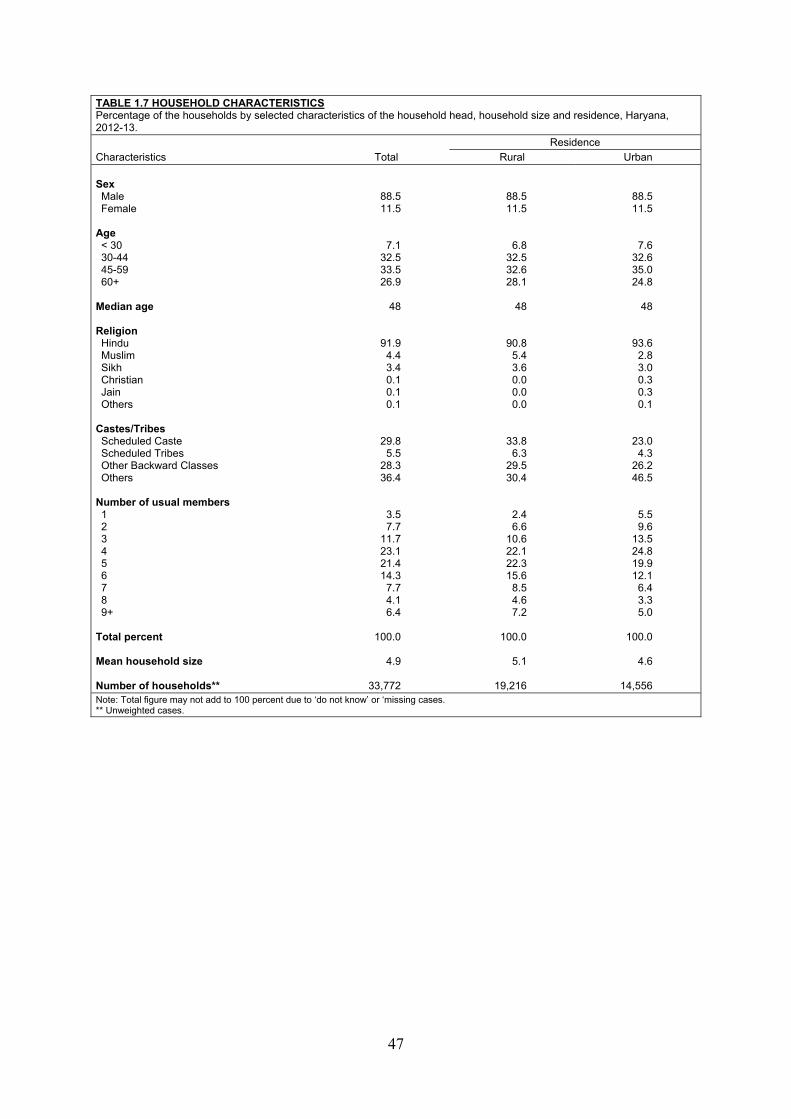
47
TABLE 1.7 HOUSEHOLD CHARACTERISTICS Percentage of the households by selected characteristics of the household head, household size and residence, Haryana, 2012-13.
Characteristics Total Residence
Rural Urban Sex Male Female
Age < 30 30-44 45-59 60+
Median age Religion Hindu Muslim Sikh Christian Jain Others
Castes/Tribes Scheduled Caste Scheduled Tribes Other Backward Classes Others
Number of usual members 1 2 3 4 5 6 7 8 9+
Total percent Mean household size Number of households**
88.5 11.5
7.1 32.5 33.5 26.9
48
91.9 4.4 3.4 0.1 0.1 0.1
29.8 5.5
28.3 36.4
3.5 7.7
11.7 23.1 21.4 14.3
7.7 4.1 6.4
100.0
4.9
33,772
88.5 11.5
6.8 32.5 32.6 28.1
48
90.8 5.4 3.6 0.0 0.0 0.0
33.8 6.3
29.5 30.4
2.4 6.6
10.6 22.1 22.3 15.6
8.5 4.6 7.2
100.0
5.1
19,216
88.5 11.5
7.6 32.6 35.0 24.8
48
93.6 2.8 3.0 0.3 0.3 0.1
23.0 4.3
26.2 46.5
5.5 9.6
13.5 24.8 19.9 12.1
6.4 3.3 5.0
100.0
4.6
14,556
Note: Total figure may not add to 100 percent due to ‘do not know’ or ‘missing cases. ** Unweighted cases.
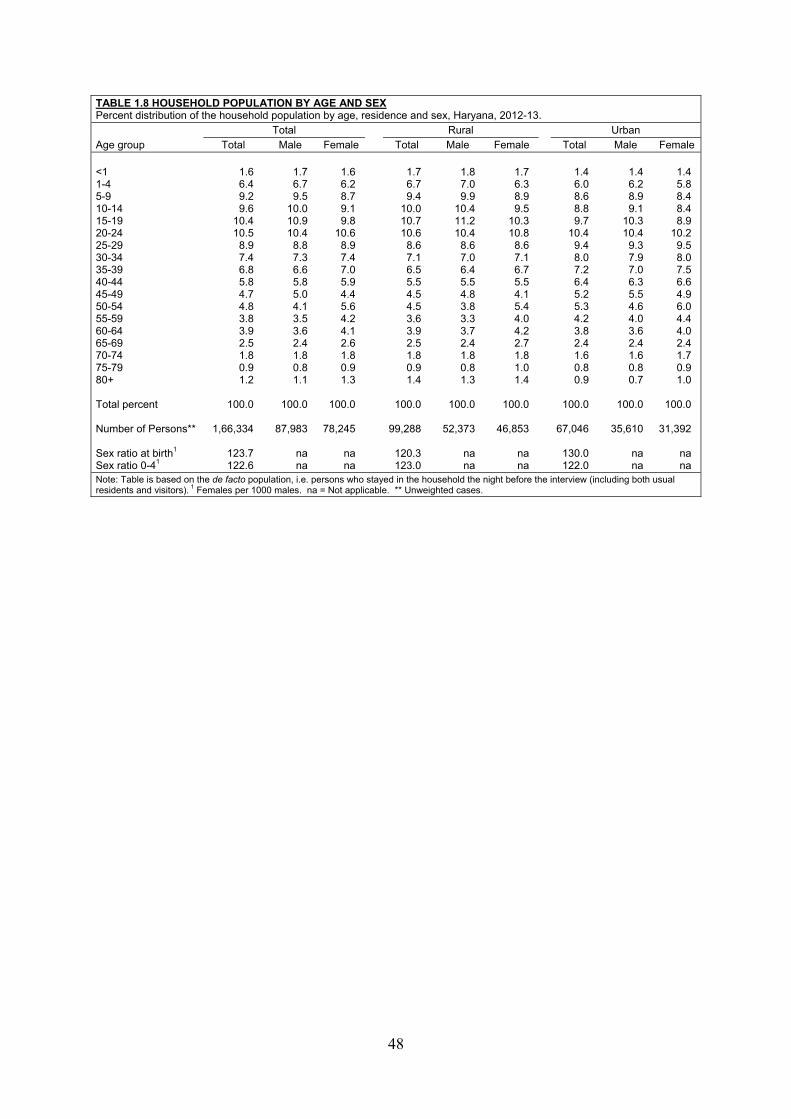
48
TABLE 1.8 HOUSEHOLD POPULATION BY AGE AND SEX Percent distribution of the household population by age, residence and sex, Haryana, 2012-13.
Age group Total Rural Urban
Total Male Female Total Male Female Total Male Female <1 1-4 5-9 10-14 15-19 20-24 25-29 30-34 35-39 40-44 45-49 50-54 55-59 60-64 65-69 70-74 75-79 80+ Total percent Number of Persons** Sex ratio at birth1 Sex ratio 0-41
1.6 6.4 9.2 9.6
10.4 10.5
8.9 7.4 6.8 5.8 4.7 4.8 3.8 3.9 2.5 1.8 0.9 1.2
100.0
1,66,334
123.7 122.6
1.7 6.7 9.5
10.0 10.9 10.4
8.8 7.3 6.6 5.8 5.0 4.1 3.5 3.6 2.4 1.8 0.8 1.1
100.0
87,983
na na
1.6 6.2 8.7 9.1 9.8
10.6 8.9 7.4 7.0 5.9 4.4 5.6 4.2 4.1 2.6 1.8 0.9 1.3
100.0
78,245
na na
1.7 6.7 9.4
10.0 10.7 10.6
8.6 7.1 6.5 5.5 4.5 4.5 3.6 3.9 2.5 1.8 0.9 1.4
100.0
99,288
120.3 123.0
1.8 7.0 9.9
10.4 11.2 10.4
8.6 7.0 6.4 5.5 4.8 3.8 3.3 3.7 2.4 1.8 0.8 1.3
100.0
52,373
na na
1.7 6.3 8.9 9.5
10.3 10.8
8.6 7.1 6.7 5.5 4.1 5.4 4.0 4.2 2.7 1.8 1.0 1.4
100.0
46,853
na na
1.4 6.0 8.6 8.8 9.7
10.4 9.4 8.0 7.2 6.4 5.2 5.3 4.2 3.8 2.4 1.6 0.8 0.9
100.0
67,046
130.0 122.0
1.4 6.2 8.9 9.1
10.3 10.4
9.3 7.9 7.0 6.3 5.5 4.6 4.0 3.6 2.4 1.6 0.8 0.7
100.0
35,610
na na
1.4 5.8 8.4 8.4 8.9
10.2 9.5 8.0 7.5 6.6 4.9 6.0 4.4 4.0 2.4 1.7 0.9 1.0
100.0
31,392
na na
Note: Table is based on the de facto population, i.e. persons who stayed in the household the night before the interview (including both usual residents and visitors). 1 Females per 1000 males. na = Not applicable. ** Unweighted cases.
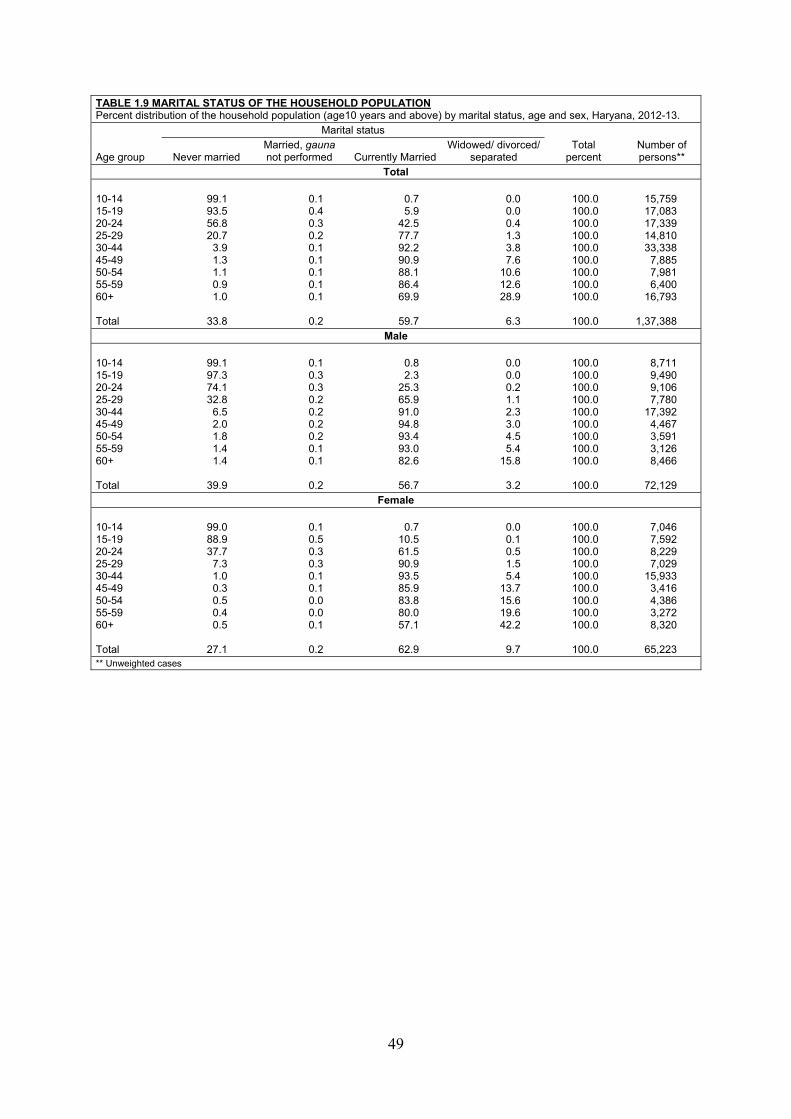
49
TABLE 1.9 MARITAL STATUS OF THE HOUSEHOLD POPULATION Percent distribution of the household population (age10 years and above) by marital status, age and sex, Haryana, 2012-13.
Age group
Marital status Total
percent Number of persons** Never married
Married, gauna not performed Currently Married
Widowed/ divorced/ separated
Total 10-14 15-19 20-24 25-29 30-44 45-49 50-54 55-59 60+ Total
99.1 93.5 56.8 20.7
3.9 1.3 1.1 0.9 1.0
33.8
0.1 0.4 0.3 0.2 0.1 0.1 0.1 0.1 0.1
0.2
0.7 5.9
42.5 77.7 92.2 90.9 88.1 86.4 69.9
59.7
0.0 0.0 0.4 1.3 3.8 7.6
10.6 12.6 28.9
6.3
100.0 100.0 100.0 100.0 100.0 100.0 100.0 100.0 100.0
100.0
15,759 17,083 17,339 14,810 33,338
7,885 7,981 6,400
16,793
1,37,388 Male
10-14 15-19 20-24 25-29 30-44 45-49 50-54 55-59 60+ Total
99.1 97.3 74.1 32.8
6.5 2.0 1.8 1.4 1.4
39.9
0.1 0.3 0.3 0.2 0.2 0.2 0.2 0.1 0.1
0.2
0.8 2.3
25.3 65.9 91.0 94.8 93.4 93.0 82.6
56.7
0.0 0.0 0.2 1.1 2.3 3.0 4.5 5.4
15.8
3.2
100.0 100.0 100.0 100.0 100.0 100.0 100.0 100.0 100.0
100.0
8,711 9,490 9,106 7,780
17,392 4,467 3,591 3,126 8,466
72,129
Female 10-14 15-19 20-24 25-29 30-44 45-49 50-54 55-59 60+ Total
99.0 88.9 37.7
7.3 1.0 0.3 0.5 0.4 0.5
27.1
0.1 0.5 0.3 0.3 0.1 0.1 0.0 0.0 0.1
0.2
0.7
10.5 61.5 90.9 93.5 85.9 83.8 80.0 57.1
62.9
0.0 0.1 0.5 1.5 5.4
13.7 15.6 19.6 42.2
9.7
100.0 100.0 100.0 100.0 100.0 100.0 100.0 100.0 100.0
100.0
7,046 7,592 8,229 7,029
15,933 3,416 4,386 3,272 8,320
65,223
** Unweighted cases
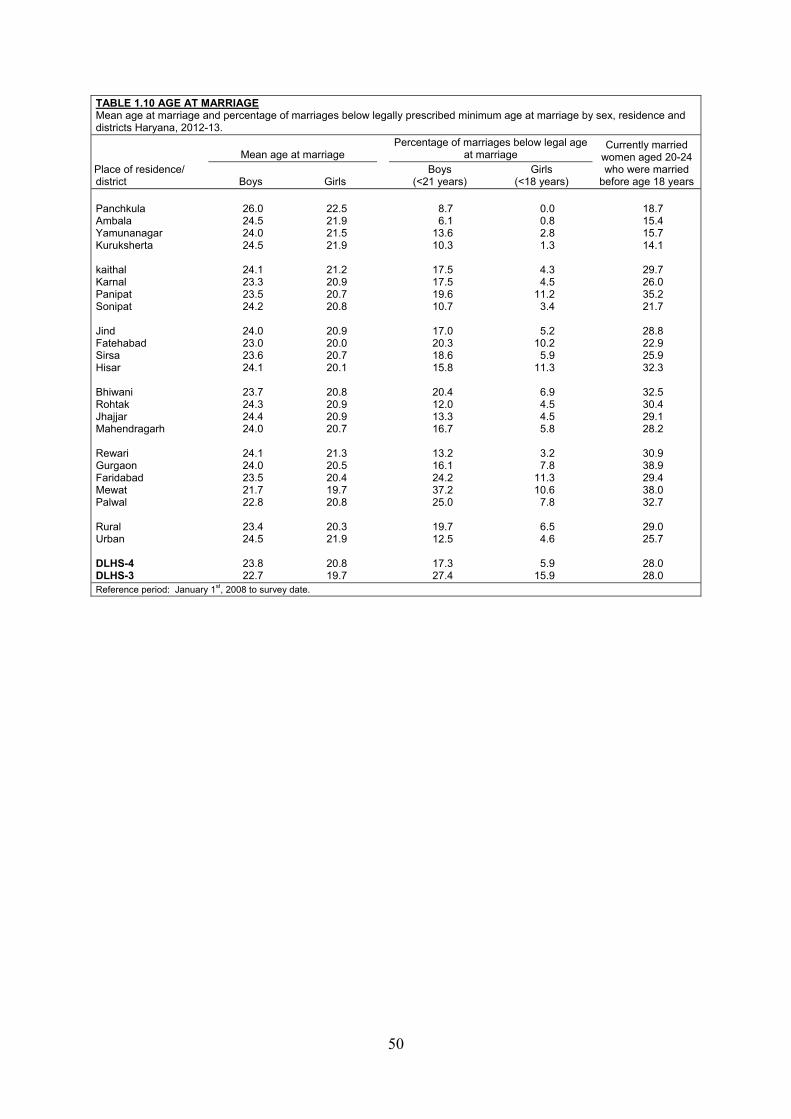
50
TABLE 1.10 AGE AT MARRIAGE Mean age at marriage and percentage of marriages below legally prescribed minimum age at marriage by sex, residence and districts Haryana, 2012-13.
Place of residence/ district
Mean age at marriage Percentage of marriages below legal age
at marriage Currently married
women aged 20-24 who were married
before age 18 years Boys Girls Boys
(<21 years) Girls
(<18 years) Panchkula Ambala Yamunanagar Kuruksherta kaithal Karnal Panipat Sonipat Jind Fatehabad Sirsa Hisar Bhiwani Rohtak Jhajjar Mahendragarh Rewari Gurgaon Faridabad Mewat Palwal Rural Urban DLHS-4 DLHS-3
26.0 24.5 24.0 24.5
24.1 23.3 23.5 24.2
24.0 23.0 23.6 24.1
23.7 24.3 24.4 24.0
24.1 24.0 23.5 21.7 22.8
23.4 24.5
23.8 22.7
22.5 21.9 21.5 21.9
21.2 20.9 20.7 20.8
20.9 20.0 20.7 20.1
20.8 20.9 20.9 20.7
21.3 20.5 20.4 19.7 20.8
20.3 21.9
20.8 19.7
8.7 6.1
13.6 10.3
17.5 17.5 19.6 10.7
17.0 20.3 18.6 15.8
20.4 12.0 13.3 16.7
13.2 16.1 24.2 37.2 25.0
19.7 12.5
17.3 27.4
0.0 0.8 2.8 1.3
4.3 4.5
11.2 3.4
5.2
10.2 5.9
11.3
6.9 4.5 4.5 5.8
3.2 7.8
11.3 10.6
7.8
6.5 4.6
5.9
15.9
18.7 15.4 15.7 14.1
29.7 26.0 35.2 21.7
28.8 22.9 25.9 32.3
32.5 30.4 29.1 28.2
30.9 38.9 29.4 38.0 32.7
29.0 25.7
28.0 28.0
Reference period: January 1st, 2008 to survey date.
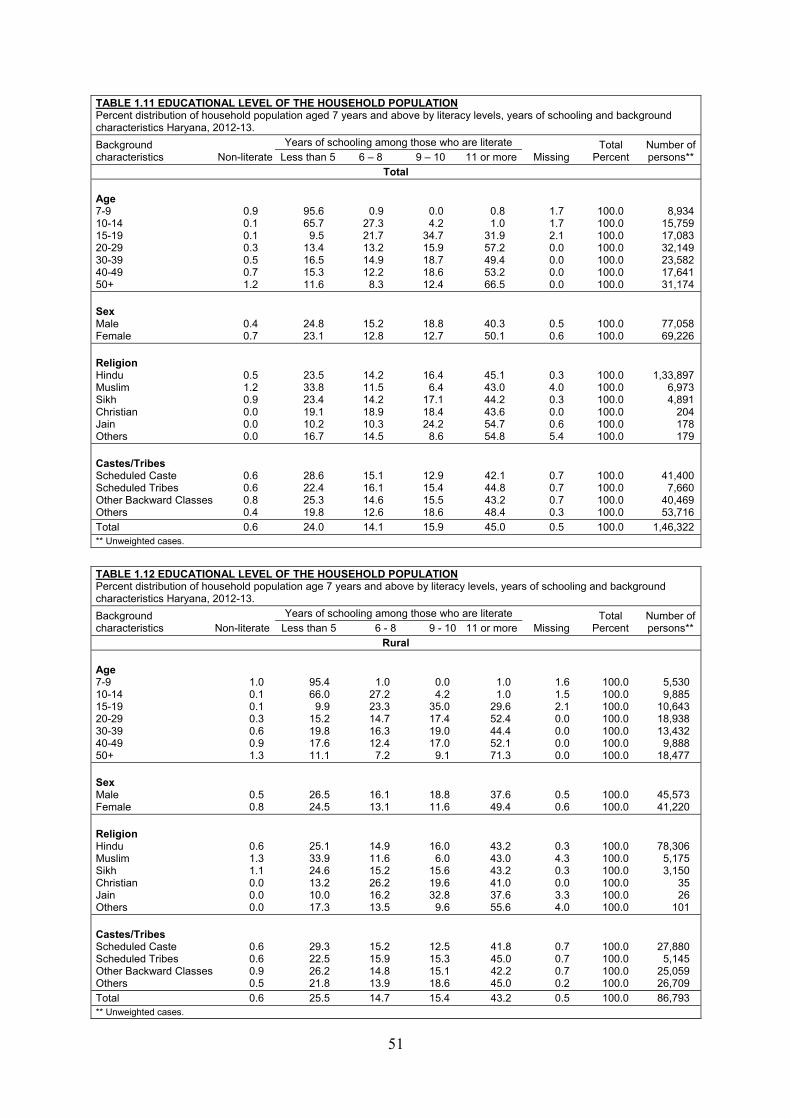
51
TABLE 1.11 EDUCATIONAL LEVEL OF THE HOUSEHOLD POPULATION Percent distribution of household population aged 7 years and above by literacy levels, years of schooling and background characteristics Haryana, 2012-13.
Background characteristics Non-literate
Years of schooling among those who are literate Missing
Total Percent
Number ofpersons** Less than 5 6 – 8 9 – 10 11 or more
Total Age 7-9 10-14 15-19 20-29 30-39 40-49 50+
0.9 0.1 0.1 0.3 0.5 0.7 1.2
95.6 65.7
9.5 13.4 16.5 15.3 11.6
0.9 27.3 21.7 13.2 14.9 12.2
8.3
0.0 4.2
34.7 15.9 18.7 18.6 12.4
0.8 1.0
31.9 57.2 49.4 53.2 66.5
1.7 1.7 2.1 0.0 0.0 0.0 0.0
100.0 100.0 100.0 100.0 100.0 100.0 100.0
8,934 15,759 17,083 32,149 23,582 17,641 31,174
Sex Male Female
0.4 0.7
24.8 23.1
15.2 12.8
18.8 12.7
40.3 50.1
0.5 0.6
100.0 100.0
77,058 69,226
Religion Hindu Muslim Sikh Christian Jain Others
0.5 1.2 0.9 0.0 0.0 0.0
23.5 33.8 23.4 19.1 10.2 16.7
14.2 11.5 14.2 18.9 10.3 14.5
16.4 6.4
17.1 18.4 24.2
8.6
45.1 43.0 44.2 43.6 54.7 54.8
0.3 4.0 0.3 0.0 0.6 5.4
100.0 100.0 100.0 100.0 100.0 100.0
1,33,897 6,973 4,891
204 178 179
Castes/Tribes Scheduled Caste Scheduled Tribes Other Backward ClassesOthers
0.6 0.6 0.8 0.4
28.6 22.4 25.3 19.8
15.1 16.1 14.6 12.6
12.9 15.4 15.5 18.6
42.1 44.8 43.2 48.4
0.7 0.7 0.7 0.3
100.0 100.0 100.0 100.0
41,400 7,660
40,469 53,716
Total 0.6 24.0 14.1 15.9 45.0 0.5 100.0 1,46,322 ** Unweighted cases.
TABLE 1.12 EDUCATIONAL LEVEL OF THE HOUSEHOLD POPULATION Percent distribution of household population age 7 years and above by literacy levels, years of schooling and background characteristics Haryana, 2012-13.
Background characteristics Non-literate
Years of schooling among those who are literate Missing
Total Percent
Number ofpersons** Less than 5 6 - 8 9 - 10 11 or more
Rural Age 7-9 10-14 15-19 20-29 30-39 40-49 50+
1.0 0.1 0.1 0.3 0.6 0.9 1.3
95.4 66.0
9.9 15.2 19.8 17.6 11.1
1.0
27.2 23.3 14.7 16.3 12.4
7.2
0.0 4.2
35.0 17.4 19.0 17.0
9.1
1.0 1.0
29.6 52.4 44.4 52.1 71.3
1.6 1.5 2.1 0.0 0.0 0.0 0.0
100.0 100.0 100.0 100.0 100.0 100.0 100.0
5,530 9,885
10,643 18,938 13,432
9,888 18,477
Sex Male Female
0.5 0.8
26.5 24.5
16.1 13.1
18.8 11.6
37.6 49.4
0.5 0.6
100.0 100.0
45,573 41,220
Religion Hindu Muslim Sikh Christian Jain Others
0.6 1.3 1.1 0.0 0.0 0.0
25.1 33.9 24.6 13.2 10.0 17.3
14.9 11.6 15.2 26.2 16.2 13.5
16.0
6.0 15.6 19.6 32.8
9.6
43.2 43.0 43.2 41.0 37.6 55.6
0.3 4.3 0.3 0.0 3.3 4.0
100.0 100.0 100.0 100.0 100.0 100.0
78,306
5,175 3,150
35 26
101 Castes/Tribes Scheduled Caste Scheduled Tribes Other Backward Classes Others
0.6 0.6 0.9 0.5
29.3 22.5 26.2 21.8
15.2 15.9 14.8 13.9
12.5 15.3 15.1 18.6
41.8 45.0 42.2 45.0
0.7 0.7 0.7 0.2
100.0 100.0 100.0 100.0
27,880
5,145 25,059 26,709
Total 0.6 25.5 14.7 15.4 43.2 0.5 100.0 86,793 ** Unweighted cases.
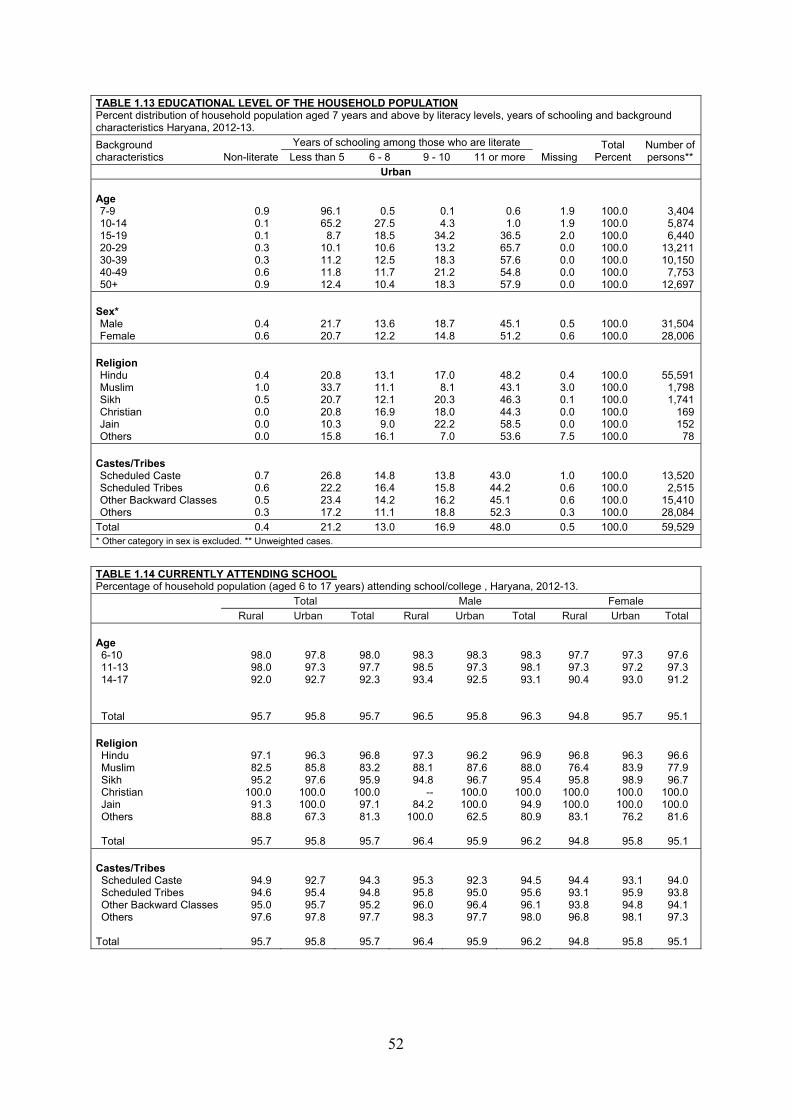
52
TABLE 1.13 EDUCATIONAL LEVEL OF THE HOUSEHOLD POPULATION Percent distribution of household population aged 7 years and above by literacy levels, years of schooling and background characteristics Haryana, 2012-13.
Background characteristics Non-literate
Years of schooling among those who are literate Missing
Total Percent
Number of persons** Less than 5 6 - 8 9 - 10 11 or more
Urban Age 7-9 10-14 15-19 20-29 30-39 40-49 50+
0.9 0.1 0.1 0.3 0.3 0.6 0.9
96.1 65.2
8.7 10.1 11.2 11.8 12.4
0.5
27.5 18.5 10.6 12.5 11.7 10.4
0.1 4.3
34.2 13.2 18.3 21.2 18.3
0.6 1.0
36.5 65.7 57.6 54.8 57.9
1.9 1.9 2.0 0.0 0.0 0.0 0.0
100.0 100.0 100.0 100.0 100.0 100.0 100.0
3,404 5,874 6,440
13,211 10,150
7,753 12,697
Sex* Male Female
0.4 0.6
21.7 20.7
13.6 12.2
18.7 14.8
45.1 51.2
0.5 0.6
100.0 100.0
31,504 28,006
Religion Hindu Muslim Sikh Christian Jain Others
0.4 1.0 0.5 0.0 0.0 0.0
20.8 33.7 20.7 20.8 10.3 15.8
13.1 11.1 12.1 16.9
9.0 16.1
17.0 8.1
20.3 18.0 22.2
7.0
48.2 43.1 46.3 44.3 58.5 53.6
0.4 3.0 0.1 0.0 0.0 7.5
100.0 100.0 100.0 100.0 100.0 100.0
55,591 1,798 1,741
169 152
78 Castes/Tribes Scheduled Caste Scheduled Tribes Other Backward Classes Others
0.7 0.6 0.5 0.3
26.8 22.2 23.4 17.2
14.8 16.4 14.2 11.1
13.8 15.8 16.2 18.8
43.0 44.2 45.1 52.3
1.0 0.6 0.6 0.3
100.0 100.0 100.0 100.0
13,520 2,515
15,410 28,084
Total 0.4 21.2 13.0 16.9 48.0 0.5 100.0 59,529 * Other category in sex is excluded. ** Unweighted cases.
TABLE 1.14 CURRENTLY ATTENDING SCHOOL Percentage of household population (aged 6 to 17 years) attending school/college , Haryana, 2012-13.
Total Male Female Rural Urban Total Rural Urban Total Rural Urban Total
Age 6-10 11-13 14-17 Total
98.0 98.0 92.0
95.7
97.8 97.3 92.7
95.8
98.0 97.7 92.3
95.7
98.3 98.5 93.4
96.5
98.3 97.3 92.5
95.8
98.3 98.1 93.1
96.3
97.7 97.3 90.4
94.8
97.3 97.2 93.0
95.7
97.6 97.3 91.2
95.1 Religion Hindu Muslim Sikh Christian Jain Others
Total
97.1 82.5 95.2
100.0 91.3 88.8
95.7
96.3 85.8 97.6
100.0 100.0
67.3
95.8
96.8 83.2 95.9
100.0 97.1 81.3
95.7
97.3 88.1 94.8
-- 84.2
100.0
96.4
96.2 87.6 96.7
100.0 100.0
62.5
95.9
96.9 88.0 95.4
100.0 94.9 80.9
96.2
96.8 76.4 95.8
100.0 100.0
83.1
94.8
96.3 83.9 98.9
100.0 100.0
76.2
95.8
96.6 77.9 96.7
100.0 100.0
81.6
95.1
Castes/Tribes Scheduled Caste Scheduled Tribes Other Backward Classes Others
Total
94.9 94.6 95.0 97.6
95.7
92.7 95.4 95.7 97.8
95.8
94.3 94.8 95.2 97.7
95.7
95.3 95.8 96.0 98.3
96.4
92.3 95.0 96.4 97.7
95.9
94.5 95.6 96.1 98.0
96.2
94.4 93.1 93.8 96.8
94.8
93.1 95.9 94.8 98.1
95.8
94.0 93.8 94.1 97.3
95.1
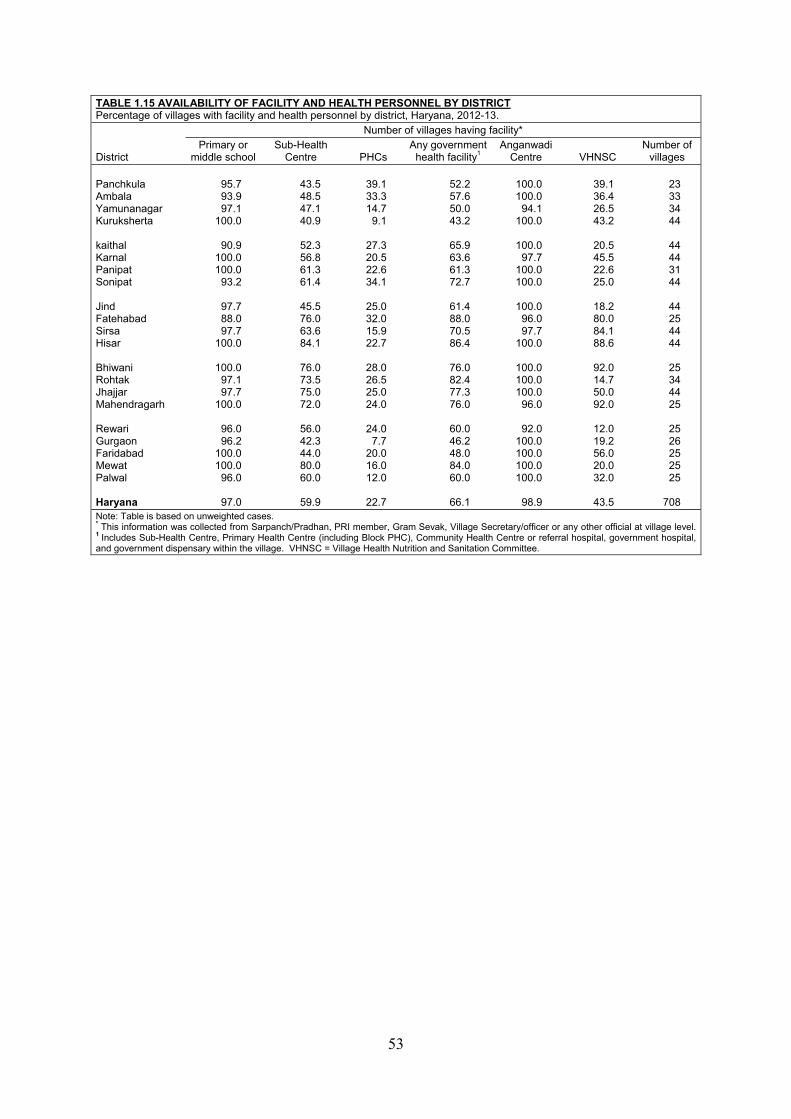
53
TABLE 1.15 AVAILABILITY OF FACILITY AND HEALTH PERSONNEL BY DISTRICT Percentage of villages with facility and health personnel by district, Haryana, 2012-13.
District
Number of villages having facility* Primary or
middle school Sub-Health
Centre PHCs Any government
health facility1 Anganwadi
Centre VHNSC Number of
villages Panchkula Ambala Yamunanagar Kuruksherta kaithal Karnal Panipat Sonipat Jind Fatehabad Sirsa Hisar Bhiwani Rohtak Jhajjar Mahendragarh Rewari Gurgaon Faridabad Mewat Palwal Haryana
95.7 93.9 97.1
100.0
90.9 100.0 100.0
93.2
97.7 88.0 97.7
100.0
100.0 97.1 97.7
100.0
96.0 96.2
100.0 100.0
96.0
97.0
43.5 48.5 47.1 40.9
52.3 56.8 61.3 61.4
45.5 76.0 63.6 84.1
76.0 73.5 75.0 72.0
56.0 42.3 44.0 80.0 60.0
59.9
39.1 33.3 14.7
9.1
27.3 20.5 22.6 34.1
25.0 32.0 15.9 22.7
28.0 26.5 25.0 24.0
24.0
7.7 20.0 16.0 12.0
22.7
52.2 57.6 50.0 43.2
65.9 63.6 61.3 72.7
61.4 88.0 70.5 86.4
76.0 82.4 77.3 76.0
60.0 46.2 48.0 84.0 60.0
66.1
100.0 100.0
94.1 100.0
100.0
97.7 100.0 100.0
100.0
96.0 97.7
100.0
100.0 100.0 100.0
96.0
92.0 100.0 100.0 100.0 100.0
98.9
39.1 36.4 26.5 43.2
20.5 45.5 22.6 25.0
18.2 80.0 84.1 88.6
92.0 14.7 50.0 92.0
12.0 19.2 56.0 20.0 32.0
43.5
23 33 34 44
44 44 31 44
44 25 44 44
25 34 44 25
25 26 25 25 25
708
Note: Table is based on unweighted cases. * This information was collected from Sarpanch/Pradhan, PRI member, Gram Sevak, Village Secretary/officer or any other official at village level. 1 Includes Sub-Health Centre, Primary Health Centre (including Block PHC), Community Health Centre or referral hospital, government hospital, and government dispensary within the village. VHNSC = Village Health Nutrition and Sanitation Committee.
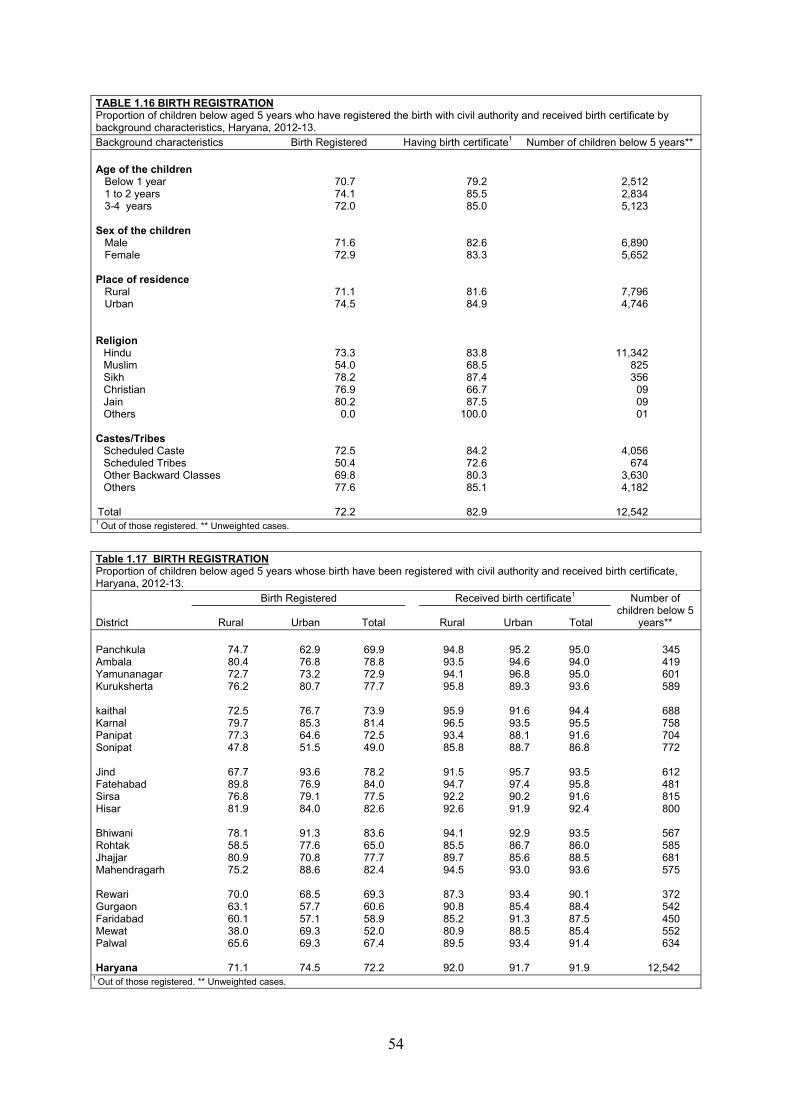
54
TABLE 1.16 BIRTH REGISTRATION Proportion of children below aged 5 years who have registered the birth with civil authority and received birth certificate by background characteristics, Haryana, 2012-13. Background characteristics Birth Registered Having birth certificate1 Number of children below 5 years** Age of the children Below 1 year 1 to 2 years 3-4 years Sex of the children Male Female Place of residence Rural Urban Religion Hindu Muslim Sikh Christian Jain Others Castes/Tribes Scheduled Caste Scheduled Tribes Other Backward Classes Others Total
70.7 74.1 72.0
71.6 72.9
71.1 74.5
73.3 54.0 78.2 76.9 80.2
0.0
72.5 50.4 69.8 77.6
72.2
79.2 85.5 85.0
82.6 83.3
81.6 84.9
83.8 68.5 87.4 66.7 87.5
100.0
84.2 72.6 80.3 85.1
82.9
2,512 2,834 5,123
6,890 5,652
7,796 4,746
11,342 825 356
09 09 01
4,056 674
3,630 4,182
12,542
1 Out of those registered. ** Unweighted cases.
Table 1.17 BIRTH REGISTRATION Proportion of children below aged 5 years whose birth have been registered with civil authority and received birth certificate, Haryana, 2012-13.
District
Birth Registered Received birth certificate1 Number of children below 5
years** Rural Urban Total Rural Urban Total Panchkula Ambala Yamunanagar Kuruksherta kaithal Karnal Panipat Sonipat Jind Fatehabad Sirsa Hisar Bhiwani Rohtak Jhajjar Mahendragarh Rewari Gurgaon Faridabad Mewat Palwal Haryana
74.7 80.4 72.7 76.2
72.5 79.7 77.3 47.8
67.7 89.8 76.8 81.9
78.1 58.5 80.9 75.2
70.0 63.1 60.1 38.0 65.6
71.1
62.9 76.8 73.2 80.7
76.7 85.3 64.6 51.5
93.6 76.9 79.1 84.0
91.3 77.6 70.8 88.6
68.5 57.7 57.1 69.3 69.3
74.5
69.9 78.8 72.9 77.7
73.9 81.4 72.5 49.0
78.2 84.0 77.5 82.6
83.6 65.0 77.7 82.4
69.3 60.6 58.9 52.0 67.4
72.2
94.8 93.5 94.1 95.8
95.9 96.5 93.4 85.8
91.5 94.7 92.2 92.6
94.1 85.5 89.7 94.5
87.3 90.8 85.2 80.9 89.5
92.0
95.2 94.6 96.8 89.3
91.6 93.5 88.1 88.7
95.7 97.4 90.2 91.9
92.9 86.7 85.6 93.0
93.4 85.4 91.3 88.5 93.4
91.7
95.0 94.0 95.0 93.6
94.4 95.5 91.6 86.8
93.5 95.8 91.6 92.4
93.5 86.0 88.5 93.6
90.1 88.4 87.5 85.4 91.4
91.9
345 419 601 589
688 758 704 772
612 481 815 800
567 585 681 575
372 542 450 552 634
12,542
1 Out of those registered. ** Unweighted cases.
CHARACTERISTICS OF WOMEN AND FERTILITY

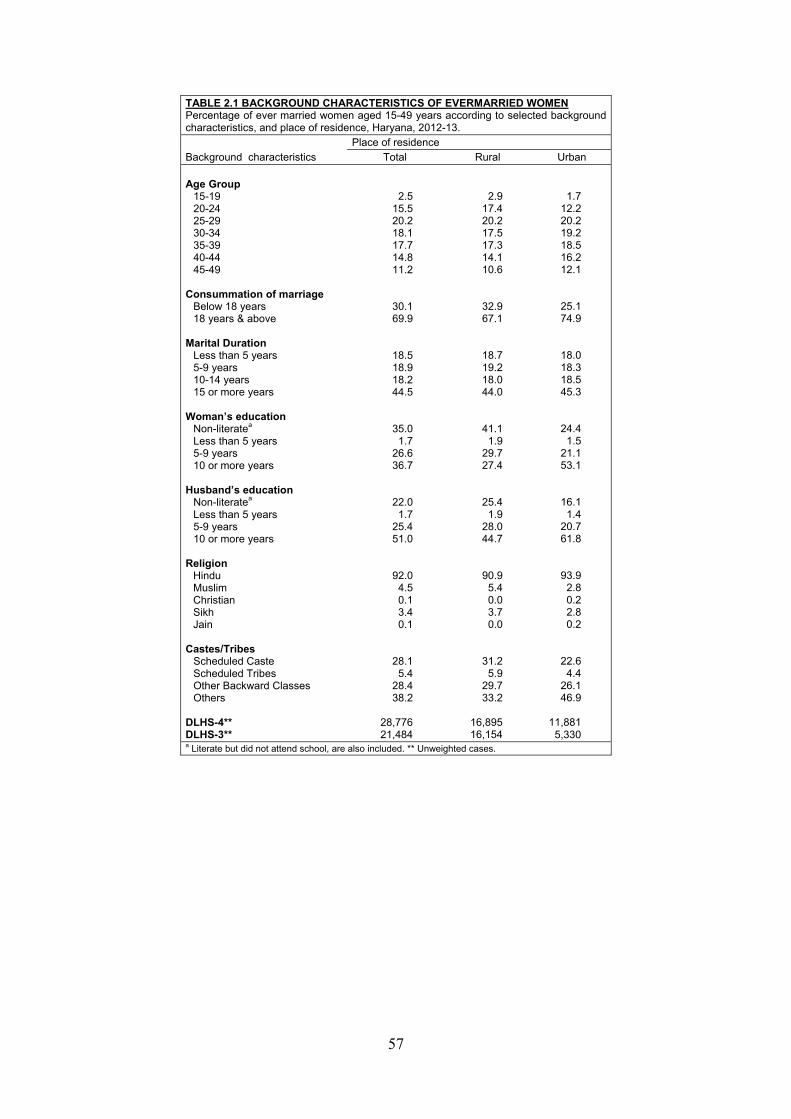
57
TABLE 2.1 BACKGROUND CHARACTERISTICS OF EVERMARRIED WOMEN Percentage of ever married women aged 15-49 years according to selected background characteristics, and place of residence, Haryana, 2012-13.
Background characteristics Place of residence
Total Rural Urban
Age Group 15-19 20-24 25-29 30-34 35-39 40-44 45-49
Consummation of marriage Below 18 years 18 years & above
Marital Duration Less than 5 years 5-9 years 10-14 years 15 or more years
Woman’s education Non-literatea Less than 5 years 5-9 years 10 or more years
Husband’s education Non-literatea Less than 5 years 5-9 years 10 or more years
Religion Hindu Muslim Christian Sikh Jain
Castes/Tribes Scheduled Caste Scheduled Tribes Other Backward Classes Others
DLHS-4** DLHS-3**
2.5 15.5 20.2 18.1 17.7 14.8 11.2
30.1 69.9
18.5 18.9 18.2 44.5
35.0 1.7
26.6 36.7
22.0 1.7
25.4 51.0
92.0 4.5 0.1 3.4 0.1
28.1 5.4
28.4 38.2
28,776 21,484
2.9 17.4 20.2 17.5 17.3 14.1 10.6
32.9 67.1
18.7 19.2 18.0 44.0
41.1 1.9
29.7 27.4
25.4 1.9
28.0 44.7
90.9 5.4 0.0 3.7 0.0
31.2 5.9
29.7 33.2
16,895 16,154
1.7 12.2 20.2 19.2 18.5 16.2 12.1
25.1 74.9
18.0 18.3 18.5 45.3
24.4 1.5
21.1 53.1
16.1 1.4
20.7 61.8
93.9 2.8 0.2 2.8 0.2
22.6 4.4
26.1 46.9
11,881 5,330
a Literate but did not attend school, are also included. ** Unweighted cases.
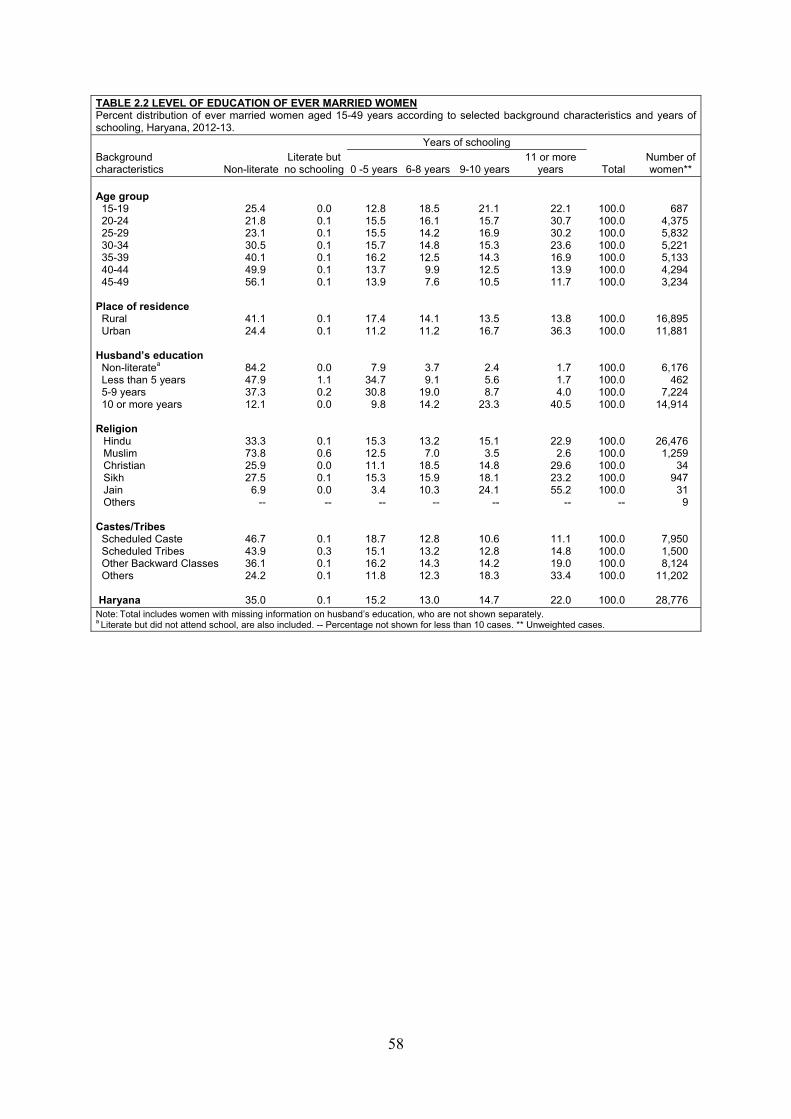
58
TABLE 2.2 LEVEL OF EDUCATION OF EVER MARRIED WOMEN Percent distribution of ever married women aged 15-49 years according to selected background characteristics and years of schooling, Haryana, 2012-13.
Background characteristics Non-literate
Literate but no schooling
Years of schooling
Total Number of women** 0 -5 years 6-8 years 9-10 years
11 or more years
Age group 15-19 20-24 25-29 30-34 35-39 40-44 45-49 Place of residence Rural Urban Husband’s education Non-literatea Less than 5 years 5-9 years 10 or more years Religion
Hindu Muslim Christian Sikh Jain Others
Castes/Tribes Scheduled Caste Scheduled Tribes Other Backward Classes Others Haryana
25.4 21.8 23.1 30.5 40.1 49.9 56.1
41.1 24.4
84.2 47.9 37.3 12.1
33.3 73.8 25.9 27.5
6.9 --
46.7 43.9 36.1 24.2
35.0
0.0 0.1 0.1 0.1 0.1 0.1 0.1
0.1 0.1
0.0 1.1 0.2 0.0
0.1 0.6 0.0 0.1 0.0
--
0.1 0.3 0.1 0.1
0.1
12.8 15.5 15.5 15.7 16.2 13.7 13.9
17.4 11.2
7.9 34.7 30.8
9.8
15.3 12.5 11.1 15.3
3.4 --
18.7 15.1 16.2 11.8
15.2
18.5 16.1 14.2 14.8 12.5
9.9 7.6
14.1 11.2
3.7 9.1
19.0 14.2
13.2 7.0
18.5 15.9 10.3
--
12.8 13.2 14.3 12.3
13.0
21.1 15.7 16.9 15.3 14.3 12.5 10.5
13.5 16.7
2.4 5.6 8.7
23.3
15.1 3.5
14.8 18.1 24.1
--
10.6 12.8 14.2 18.3
14.7
22.1 30.7 30.2 23.6 16.9 13.9 11.7
13.8 36.3
1.7 1.7 4.0
40.5
22.9 2.6
29.6 23.2 55.2
--
11.1 14.8 19.0 33.4
22.0
100.0 100.0 100.0 100.0 100.0 100.0 100.0
100.0 100.0
100.0 100.0 100.0 100.0
100.0 100.0 100.0 100.0 100.0
--
100.0 100.0 100.0 100.0
100.0
687 4,375 5,832 5,221 5,133 4,294 3,234
16,895 11,881
6,176 462
7,224 14,914
26,476 1,259
34 947
31 9
7,950 1,500 8,124
11,202
28,776 Note: Total includes women with missing information on husband’s education, who are not shown separately. a Literate but did not attend school, are also included. -- Percentage not shown for less than 10 cases. ** Unweighted cases.
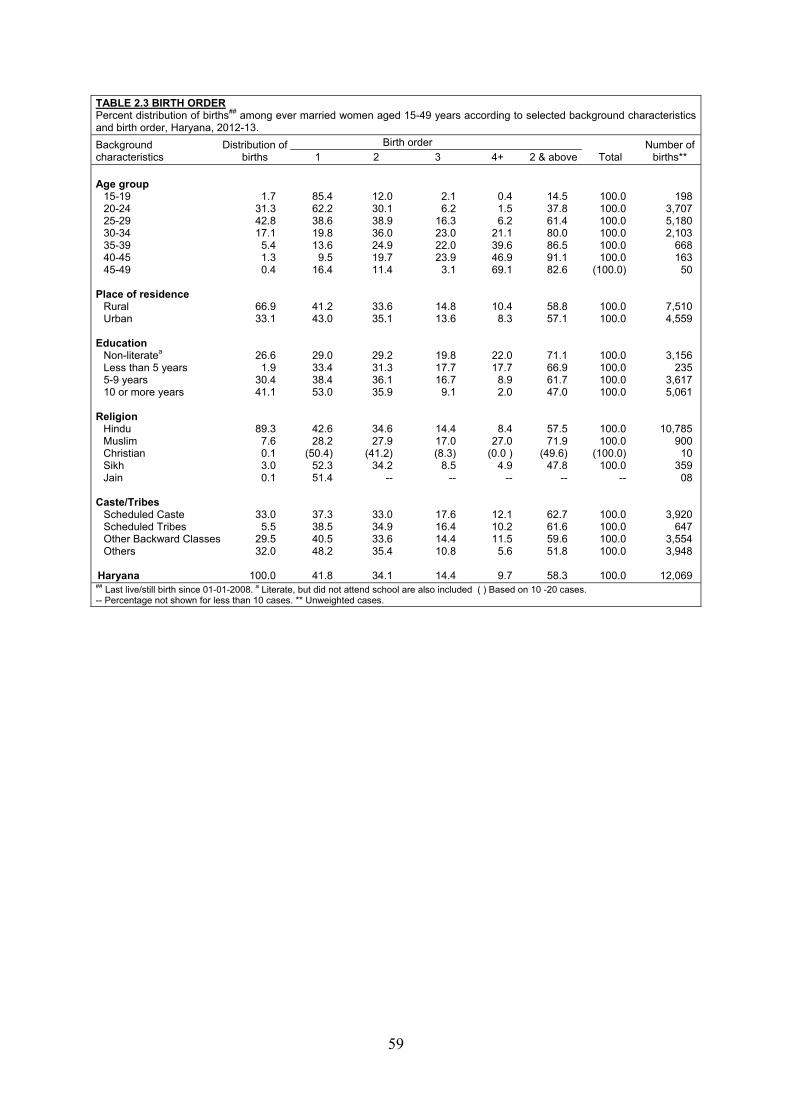
59
TABLE 2.3 BIRTH ORDER Percent distribution of births## among ever married women aged 15-49 years according to selected background characteristics and birth order, Haryana, 2012-13.
Background characteristics
Distribution of births
Birth order Total
Number of births** 1 2 3 4+ 2 & above
Age group 15-19 20-24 25-29 30-34 35-39 40-45 45-49 Place of residence Rural Urban Education Non-literatea Less than 5 years 5-9 years 10 or more years Religion
Hindu Muslim Christian Sikh Jain
Caste/Tribes Scheduled Caste Scheduled Tribes Other Backward Classes Others Haryana
1.7 31.3 42.8 17.1
5.4 1.3 0.4
66.9 33.1
26.6 1.9
30.4 41.1
89.3 7.6 0.1 3.0 0.1
33.0 5.5
29.5 32.0
100.0
85.4 62.2 38.6 19.8 13.6
9.5 16.4
41.2 43.0
29.0 33.4 38.4 53.0
42.6 28.2
(50.4) 52.3 51.4
37.3 38.5 40.5 48.2
41.8
12.0 30.1 38.9 36.0 24.9 19.7 11.4
33.6 35.1
29.2 31.3 36.1 35.9
34.6 27.9
(41.2) 34.2
--
33.0 34.9 33.6 35.4
34.1
2.1 6.2
16.3 23.0 22.0 23.9
3.1
14.8 13.6
19.8 17.7 16.7
9.1
14.4 17.0 (8.3)
8.5 --
17.6 16.4 14.4 10.8
14.4
0.4 1.5 6.2
21.1 39.6 46.9 69.1
10.4 8.3
22.0 17.7
8.9 2.0
8.4 27.0
(0.0 ) 4.9
--
12.1 10.2 11.5
5.6
9.7
14.5 37.8 61.4 80.0 86.5 91.1 82.6
58.8 57.1
71.1 66.9 61.7 47.0
57.5 71.9
(49.6) 47.8
--
62.7 61.6 59.6 51.8
58.3
100.0 100.0 100.0 100.0 100.0 100.0
(100.0)
100.0 100.0
100.0 100.0 100.0 100.0
100.0 100.0
(100.0) 100.0
--
100.0 100.0 100.0 100.0
100.0
198 3,707 5,180 2,103
668 163
50
7,510 4,559
3,156 235
3,617 5,061
10,785 900
10 359
08
3,920 647
3,554 3,948
12,069
## Last live/still birth since 01-01-2008. a Literate, but did not attend school are also included ( ) Based on 10 -20 cases. -- Percentage not shown for less than 10 cases. ** Unweighted cases.
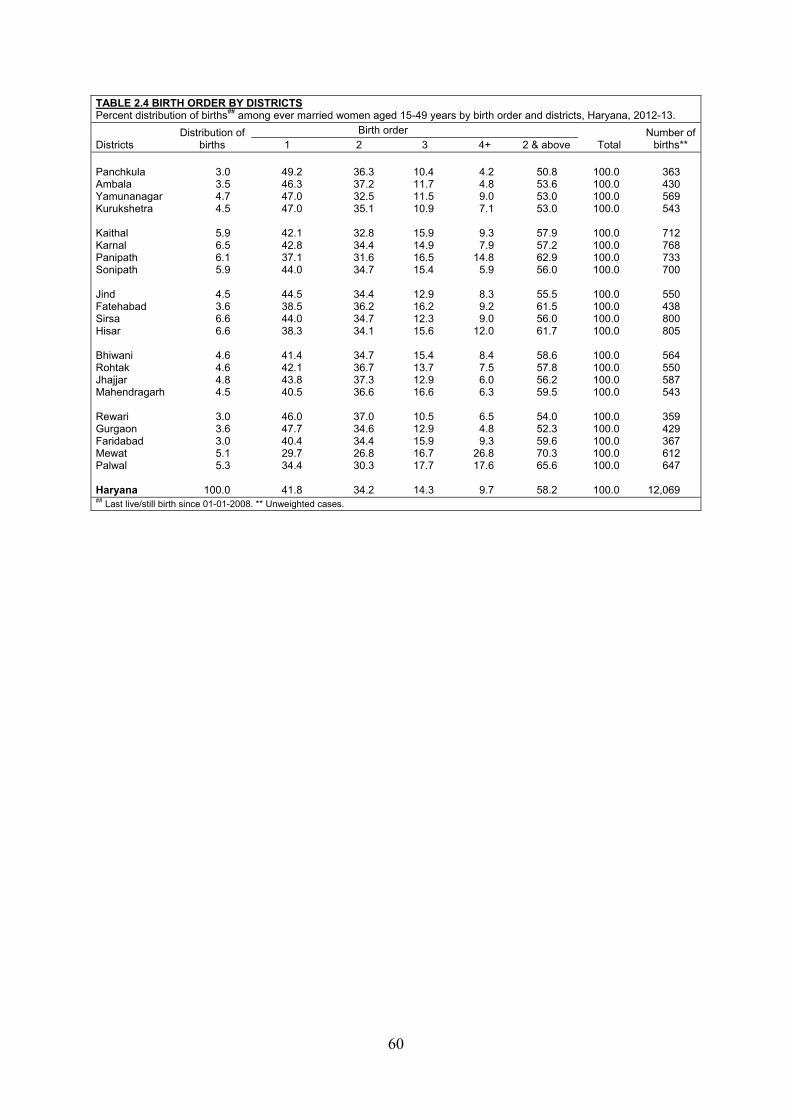
60
TABLE 2.4 BIRTH ORDER BY DISTRICTS Percent distribution of births## among ever married women aged 15-49 years by birth order and districts, Haryana, 2012-13.
Districts Distribution of
births Birth order
Total Number of
births** 1 2 3 4+ 2 & above Panchkula Ambala Yamunanagar Kurukshetra Kaithal Karnal Panipath Sonipath Jind Fatehabad Sirsa Hisar Bhiwani Rohtak Jhajjar Mahendragarh Rewari Gurgaon Faridabad Mewat Palwal Haryana
3.0 3.5 4.7 4.5
5.9 6.5 6.1 5.9
4.5 3.6 6.6 6.6
4.6 4.6 4.8 4.5
3.0 3.6 3.0 5.1 5.3
100.0
49.2 46.3 47.0 47.0
42.1 42.8 37.1 44.0
44.5 38.5 44.0 38.3
41.4 42.1 43.8 40.5
46.0 47.7 40.4 29.7 34.4
41.8
36.3 37.2 32.5 35.1
32.8 34.4 31.6 34.7
34.4 36.2 34.7 34.1
34.7 36.7 37.3 36.6
37.0 34.6 34.4 26.8 30.3
34.2
10.4 11.7 11.5 10.9
15.9 14.9 16.5 15.4
12.9 16.2 12.3 15.6
15.4 13.7 12.9 16.6
10.5 12.9 15.9 16.7 17.7
14.3
4.2 4.8 9.0 7.1
9.3 7.9
14.8 5.9
8.3 9.2 9.0
12.0
8.4 7.5 6.0 6.3
6.5 4.8 9.3
26.8 17.6
9.7
50.8 53.6 53.0 53.0
57.9 57.2 62.9 56.0
55.5 61.5 56.0 61.7
58.6 57.8 56.2 59.5
54.0 52.3 59.6 70.3 65.6
58.2
100.0 100.0 100.0 100.0
100.0 100.0 100.0 100.0
100.0 100.0 100.0 100.0
100.0 100.0 100.0 100.0
100.0 100.0 100.0 100.0 100.0
100.0
363 430 569 543
712 768 733 700
550 438 800 805
564 550 587 543
359 429 367 612 647
12,069
## Last live/still birth since 01-01-2008. ** Unweighted cases.
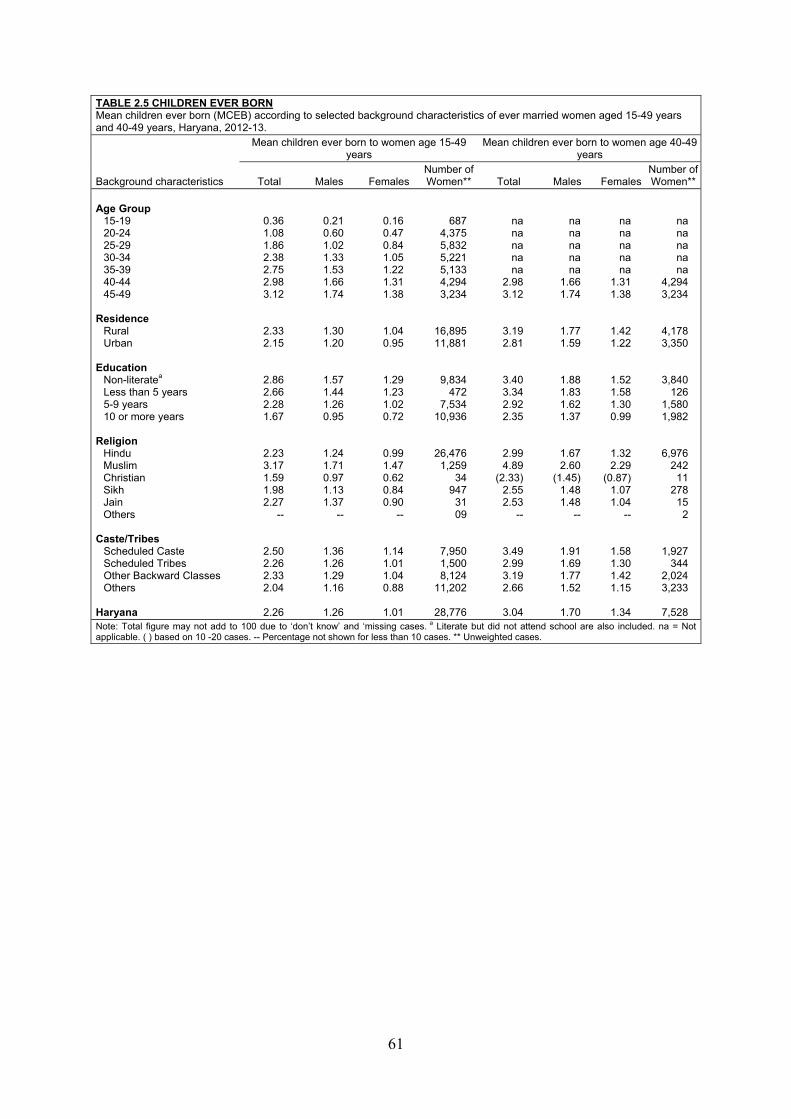
61
TABLE 2.5 CHILDREN EVER BORN Mean children ever born (MCEB) according to selected background characteristics of ever married women aged 15-49 years and 40-49 years, Haryana, 2012-13.
Background characteristics
Mean children ever born to women age 15-49 years
Mean children ever born to women age 40-49 years
Total Males Females Number ofWomen** Total Males Females
Number ofWomen**
Age Group 15-19 20-24 25-29 30-34 35-39 40-44 45-49 Residence Rural Urban Education Non-literatea Less than 5 years 5-9 years 10 or more years Religion
Hindu Muslim Christian Sikh Jain Others
Caste/Tribes Scheduled Caste Scheduled Tribes Other Backward Classes Others Haryana
0.36 1.08 1.86 2.38 2.75 2.98 3.12
2.33 2.15
2.86 2.66 2.28 1.67
2.23 3.17 1.59 1.98 2.27
--
2.50 2.26 2.33 2.04
2.26
0.21 0.60 1.02 1.33 1.53 1.66 1.74
1.30 1.20
1.57 1.44 1.26 0.95
1.24 1.71 0.97 1.13 1.37
--
1.36 1.26 1.29 1.16
1.26
0.16 0.47 0.84 1.05 1.22 1.31 1.38
1.04 0.95
1.29 1.23 1.02 0.72
0.99 1.47 0.62 0.84 0.90
--
1.14 1.01 1.04 0.88
1.01
687 4,375 5,832 5,221 5,133 4,294 3,234
16,895 11,881
9,834 472
7,534 10,936
26,476 1,259
34 947
31 09
7,950 1,500 8,124
11,202
28,776
na na na na na
2.98 3.12
3.19 2.81
3.40 3.34 2.92 2.35
2.99 4.89
(2.33) 2.55 2.53
--
3.49 2.99 3.19 2.66
3.04
na na na na na
1.66 1.74
1.77 1.59
1.88 1.83 1.62 1.37
1.67 2.60
(1.45) 1.48 1.48
--
1.91 1.69 1.77 1.52
1.70
na na na na na
1.31 1.38
1.42 1.22
1.52 1.58 1.30 0.99
1.32 2.29
(0.87) 1.07 1.04
--
1.58 1.30 1.42 1.15
1.34
na na na na na
4,294 3,234
4,178 3,350
3,840 126
1,580 1,982
6,976 242
11 278
15 2
1,927 344
2,024 3,233
7,528
Note: Total figure may not add to 100 due to ‘don’t know’ and ‘missing cases. a Literate but did not attend school are also included. na = Not applicable. ( ) based on 10 -20 cases. -- Percentage not shown for less than 10 cases. ** Unweighted cases.
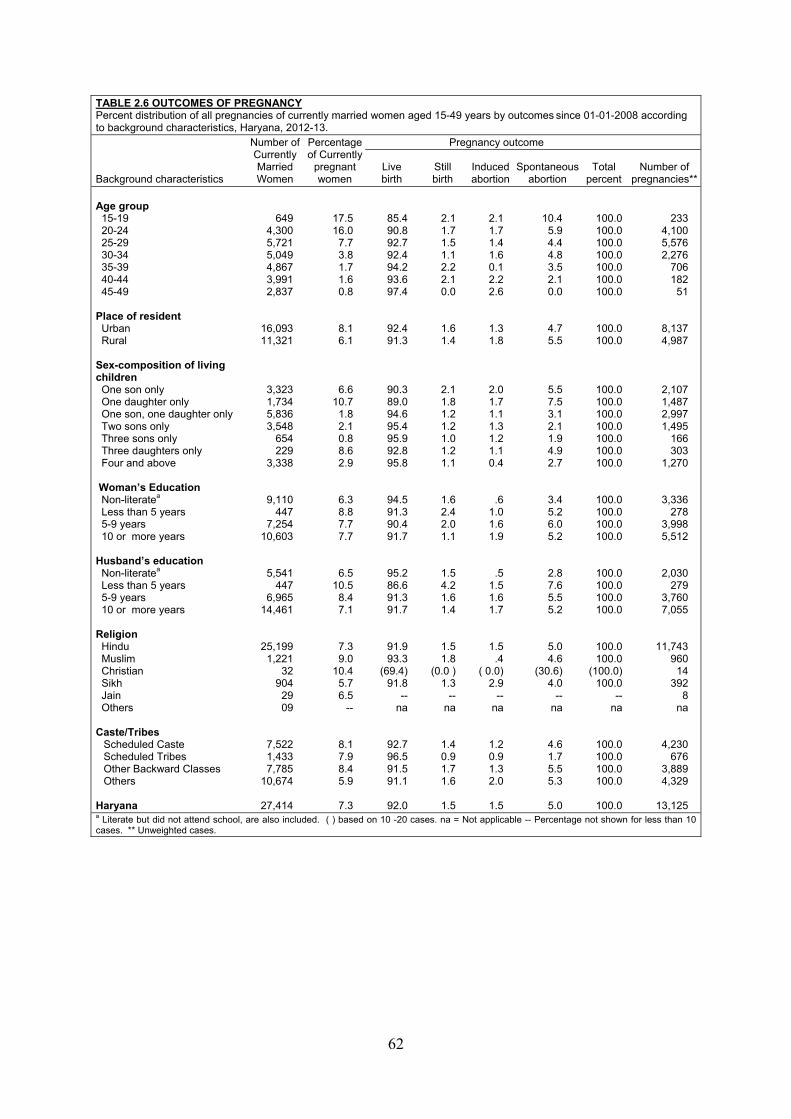
62
TABLE 2.6 OUTCOMES OF PREGNANCY Percent distribution of all pregnancies of currently married women aged 15-49 years by outcomes since 01-01-2008 according to background characteristics, Haryana, 2012-13.
Background characteristics
Number of Currently Married Women
Percentage of Currently
pregnant women
Pregnancy outcome
Live birth
Still birth
Induced abortion
Spontaneous abortion
Total percent
Number of pregnancies**
Age group 15-19 20-24 25-29 30-34 35-39 40-44 45-49
Place of resident Urban Rural
Sex-composition of living children One son only One daughter only One son, one daughter only Two sons only Three sons only Three daughters only Four and above
Woman’s Education Non-literatea Less than 5 years 5-9 years 10 or more years
Husband’s education Non-literatea Less than 5 years 5-9 years 10 or more years
Religion Hindu Muslim Christian Sikh Jain Others
Caste/Tribes Scheduled Caste Scheduled Tribes Other Backward Classes Others
Haryana
649 4,300 5,721 5,049 4,867 3,991 2,837
16,093 11,321
3,323 1,734 5,836 3,548
654 229
3,338
9,110 447
7,254 10,603
5,541 447
6,965 14,461
25,199 1,221
32 904
29 09
7,522 1,433 7,785
10,674
27,414
17.5 16.0
7.7 3.8 1.7 1.6 0.8
8.1 6.1
6.6 10.7
1.8 2.1 0.8 8.6 2.9
6.3 8.8 7.7 7.7
6.5 10.5
8.4 7.1
7.3 9.0
10.4 5.7 6.5
--
8.1 7.9 8.4 5.9
7.3
85.4 90.8 92.7 92.4 94.2 93.6 97.4
92.4 91.3
90.3 89.0 94.6 95.4 95.9 92.8 95.8
94.5 91.3 90.4 91.7
95.2 86.6 91.3 91.7
91.9 93.3
(69.4) 91.8
-- na
92.7 96.5 91.5 91.1
92.0
2.1 1.7 1.5 1.1 2.2 2.1 0.0
1.6 1.4
2.1 1.8 1.2 1.2 1.0 1.2 1.1
1.6 2.4 2.0 1.1
1.5 4.2 1.6 1.4
1.5 1.8
(0.0 ) 1.3
-- na
1.4 0.9 1.7 1.6
1.5
2.1 1.7 1.4 1.6 0.1 2.2 2.6
1.3 1.8
2.0 1.7 1.1 1.3 1.2 1.1 0.4
.6 1.0 1.6 1.9
.5 1.5 1.6 1.7
1.5 .4
( 0.0) 2.9
-- na
1.2 0.9 1.3 2.0
1.5
10.4 5.9 4.4 4.8 3.5 2.1 0.0
4.7 5.5
5.5 7.5 3.1 2.1 1.9 4.9 2.7
3.4 5.2 6.0 5.2
2.8 7.6 5.5 5.2
5.0 4.6
(30.6) 4.0
-- na
4.6 1.7 5.5 5.3
5.0
100.0 100.0 100.0 100.0 100.0 100.0 100.0
100.0 100.0
100.0 100.0 100.0 100.0 100.0 100.0 100.0
100.0 100.0 100.0 100.0
100.0 100.0 100.0 100.0
100.0 100.0
(100.0) 100.0
-- na
100.0 100.0 100.0 100.0
100.0
233 4,100 5,576 2,276
706 182
51
8,137 4,987
2,107 1,487 2,997 1,495
166 303
1,270
3,336 278
3,998 5,512
2,030 279
3,760 7,055
11,743 960
14 392
8 na
4,230 676
3,889 4,329
13,125
a Literate but did not attend school, are also included. ( ) based on 10 -20 cases. na = Not applicable -- Percentage not shown for less than 10 cases. ** Unweighted cases.
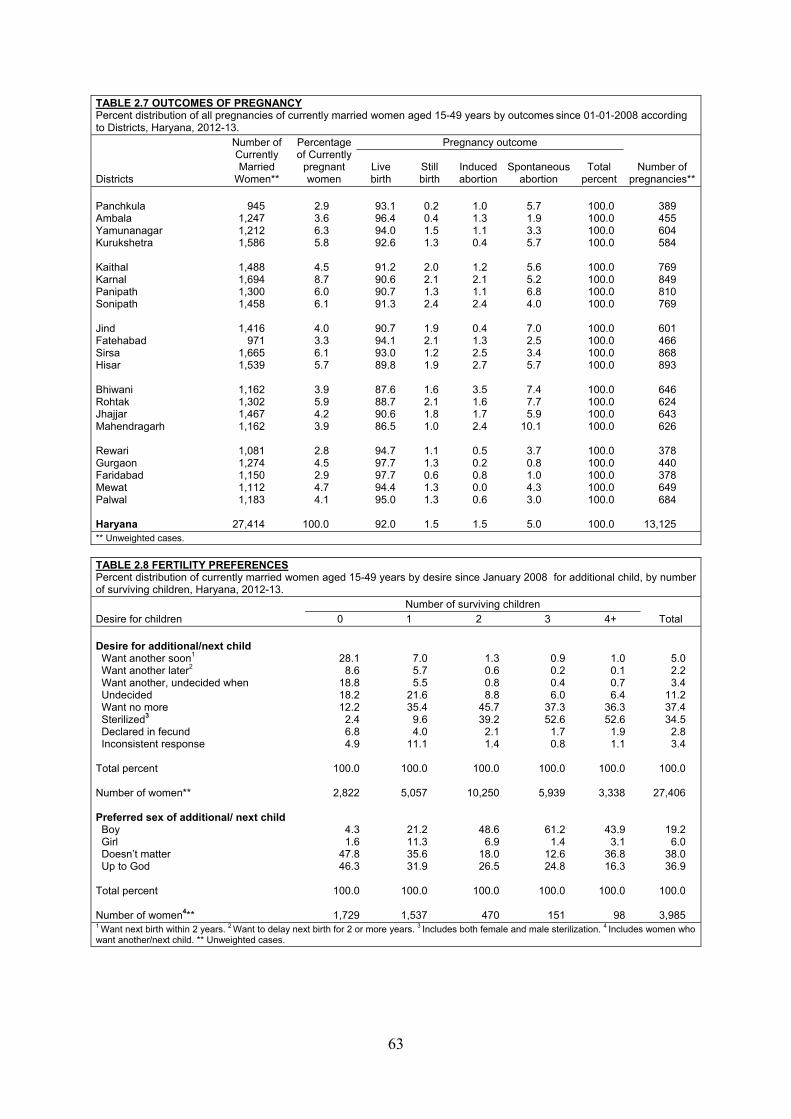
63
TABLE 2.7 OUTCOMES OF PREGNANCY Percent distribution of all pregnancies of currently married women aged 15-49 years by outcomes since 01-01-2008 according to Districts, Haryana, 2012-13.
Districts
Number of Currently Married
Women**
Percentage of Currently
pregnant women
Pregnancy outcome
Number of pregnancies**
Live birth
Still birth
Induced abortion
Spontaneous abortion
Total percent
Panchkula Ambala Yamunanagar Kurukshetra Kaithal Karnal Panipath Sonipath Jind Fatehabad Sirsa Hisar Bhiwani Rohtak Jhajjar Mahendragarh Rewari Gurgaon Faridabad Mewat Palwal Haryana
945
1,247 1,212 1,586
1,488 1,694 1,300 1,458
1,416
971 1,665 1,539
1,162 1,302 1,467 1,162
1,081 1,274 1,150 1,112 1,183
27,414
2.9 3.6 6.3 5.8
4.5 8.7 6.0 6.1
4.0 3.3 6.1 5.7
3.9 5.9 4.2 3.9
2.8 4.5 2.9 4.7 4.1
100.0
93.1 96.4 94.0 92.6
91.2 90.6 90.7 91.3
90.7 94.1 93.0 89.8
87.6 88.7 90.6 86.5
94.7 97.7 97.7 94.4 95.0
92.0
0.2 0.4 1.5 1.3
2.0 2.1 1.3 2.4
1.9 2.1 1.2 1.9
1.6 2.1 1.8 1.0
1.1 1.3
0.6 1.3 1.3
1.5
1.0 1.3 1.1 0.4
1.2 2.1 1.1 2.4
0.4 1.3 2.5 2.7
3.5 1.6 1.7 2.4
0.5 0.2 0.8 0.0 0.6
1.5
5.7 1.9 3.3 5.7
5.6 5.2 6.8 4.0
7.0 2.5 3.4 5.7
7.4 7.7 5.9
10.1
3.7 0.8 1.0 4.3 3.0
5.0
100.0 100.0 100.0 100.0
100.0 100.0 100.0 100.0
100.0 100.0 100.0 100.0
100.0 100.0 100.0 100.0
100.0 100.0 100.0 100.0 100.0
100.0
389 455 604 584
769 849 810 769
601 466 868 893
646 624 643 626
378 440 378 649 684
13,125
** Unweighted cases.
TABLE 2.8 FERTILITY PREFERENCES Percent distribution of currently married women aged 15-49 years by desire since January 2008 for additional child, by number of surviving children, Haryana, 2012-13.
Desire for children Number of surviving children
Total 0 1 2 3 4+ Desire for additional/next child Want another soon1 Want another later2 Want another, undecided when Undecided Want no more Sterilized3 Declared in fecund Inconsistent response
Total percent Number of women** Preferred sex of additional/ next child Boy Girl Doesn’t matter Up to God
Total percent Number of women4**
28.1 8.6
18.8 18.2 12.2
2.4 6.8 4.9
100.0
2,822
4.3 1.6
47.8 46.3
100.0
1,729
7.0 5.7 5.5
21.6 35.4
9.6 4.0
11.1
100.0
5,057
21.2 11.3 35.6 31.9
100.0
1,537
1.3 0.6 0.8 8.8
45.7 39.2
2.1 1.4
100.0
10,250
48.6 6.9
18.0 26.5
100.0
470
0.9 0.2 0.4 6.0
37.3 52.6
1.7 0.8
100.0
5,939
61.2 1.4
12.6 24.8
100.0
151
1.0 0.1 0.7 6.4
36.3 52.6
1.9 1.1
100.0
3,338
43.9 3.1
36.8 16.3
100.0
98
5.0 2.2 3.4
11.2 37.4 34.5
2.8 3.4
100.0
27,406
19.2 6.0
38.0 36.9
100.0
3,985
1 Want next birth within 2 years. 2 Want to delay next birth for 2 or more years. 3 Includes both female and male sterilization. 4 Includes women who want another/next child. ** Unweighted cases.

MATERNAL HEALTH CARE

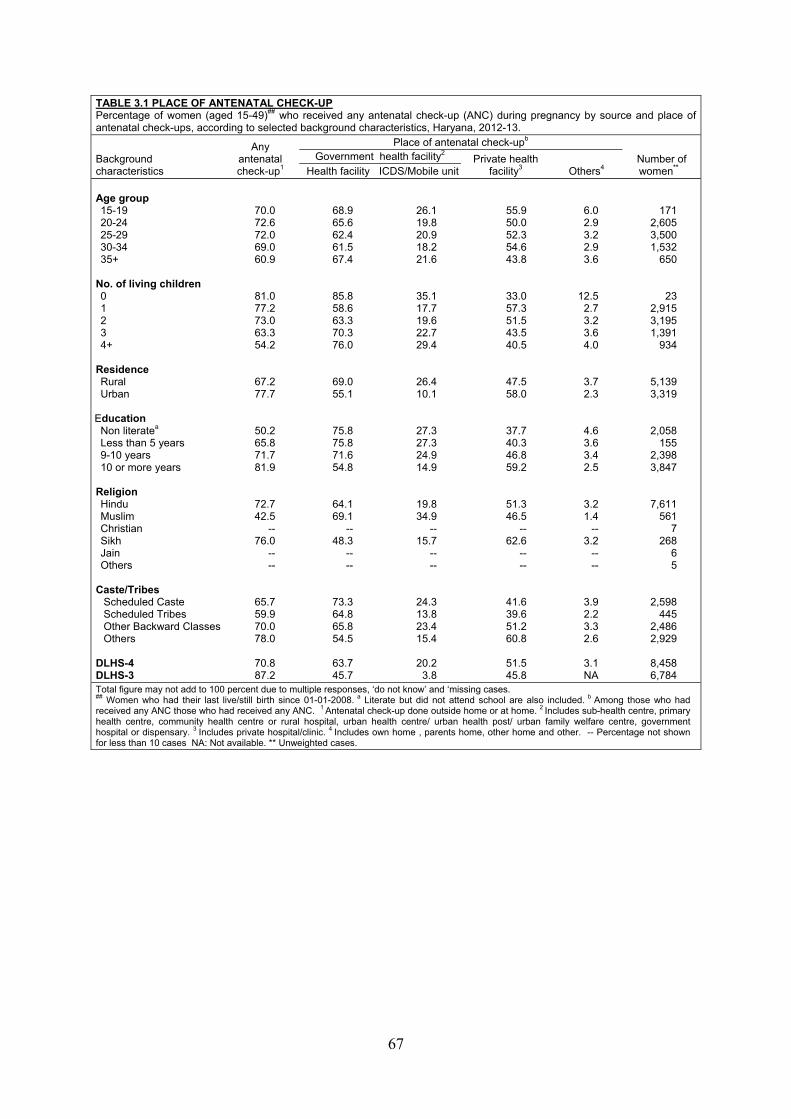
67
TABLE 3.1 PLACE OF ANTENATAL CHECK-UP Percentage of women (aged 15-49)## who received any antenatal check-up (ANC) during pregnancy by source and place of antenatal check-ups, according to selected background characteristics, Haryana, 2012-13.
Background characteristics
Any
antenatal check-up1
Place of antenatal check-upb
Number of women**
Government health facility2 Private health facility3 Others4 Health facility ICDS/Mobile unit
Age group 15-19 20-24 25-29 30-34 35+
No. of living children 0 1 2 3 4+
Residence Rural Urban
Education
Non literatea Less than 5 years 9-10 years 10 or more years
Religion Hindu Muslim Christian Sikh Jain Others
Caste/Tribes Scheduled Caste Scheduled Tribes Other Backward Classes Others DLHS-4 DLHS-3
70.0 72.6 72.0 69.0 60.9
81.0 77.2 73.0 63.3 54.2
67.2 77.7
50.2 65.8 71.7 81.9
72.7 42.5
-- 76.0
-- --
65.7 59.9 70.0 78.0
70.8 87.2
68.9 65.6 62.4 61.5 67.4
85.8 58.6 63.3 70.3 76.0
69.0 55.1
75.8 75.8 71.6 54.8
64.1 69.1
-- 48.3
-- --
73.3 64.8 65.8 54.5
63.7 45.7
26.1 19.8 20.9 18.2 21.6
35.1 17.7 19.6 22.7 29.4
26.4 10.1
27.3 27.3 24.9 14.9
19.8 34.9
-- 15.7
-- --
24.3 13.8 23.4 15.4
20.2
3.8
55.9 50.0 52.3 54.6 43.8
33.0 57.3 51.5 43.5 40.5
47.5 58.0
37.7 40.3 46.8 59.2
51.3 46.5
-- 62.6
-- --
41.6 39.6 51.2 60.8
51.5 45.8
6.0 2.9 3.2 2.9 3.6
12.5 2.7 3.2 3.6 4.0
3.7 2.3
4.6 3.6 3.4 2.5
3.2 1.4
-- 3.2
-- --
3.9 2.2 3.3 2.6
3.1 NA
171 2,605 3,500 1,532
650
23 2,915 3,195 1,391
934
5,139 3,319
2,058 155
2,398 3,847
7,611 561
7 268
6 5
2,598 445
2,486 2,929
8,458 6,784
Total figure may not add to 100 percent due to multiple responses, ‘do not know’ and ‘missing cases. ## Women who had their last live/still birth since 01-01-2008. a Literate but did not attend school are also included. b Among those who had received any ANC those who had received any ANC. 1 Antenatal check-up done outside home or at home. 2 Includes sub-health centre, primary health centre, community health centre or rural hospital, urban health centre/ urban health post/ urban family welfare centre, government hospital or dispensary. 3 Includes private hospital/clinic. 4 Includes own home , parents home, other home and other. -- Percentage not shown for less than 10 cases NA: Not available. ** Unweighted cases.
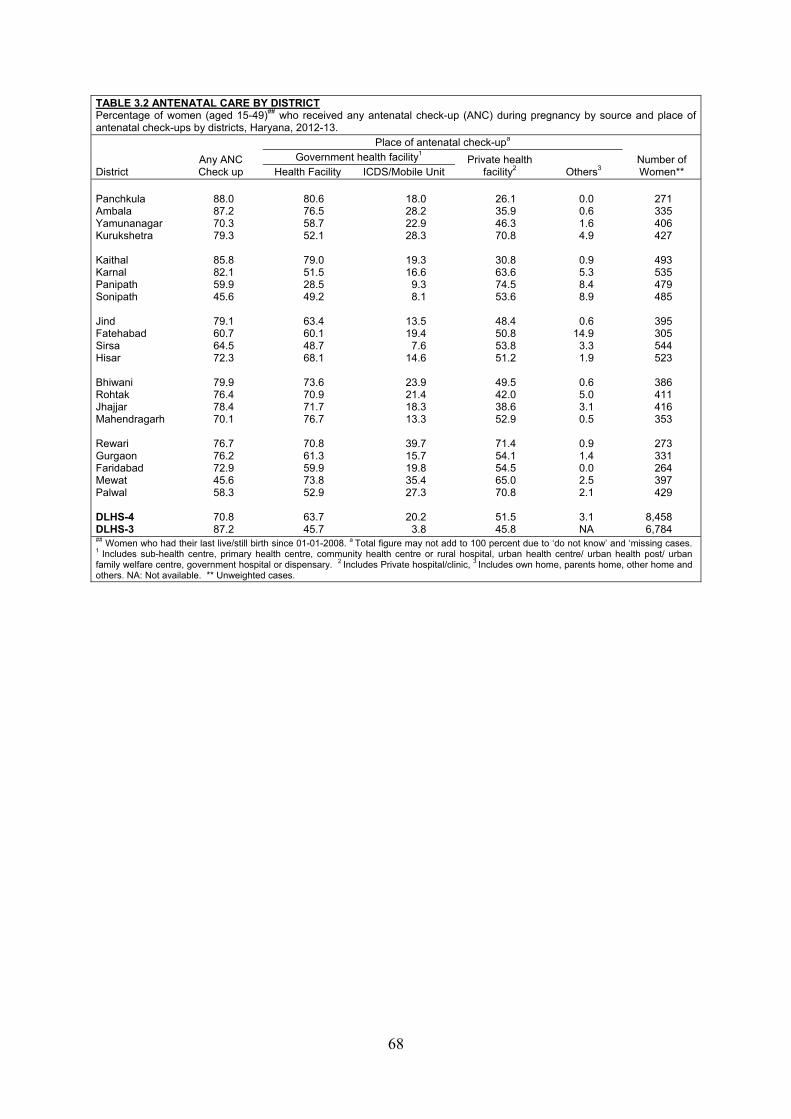
68
TABLE 3.2 ANTENATAL CARE BY DISTRICT Percentage of women (aged 15-49)## who received any antenatal check-up (ANC) during pregnancy by source and place of antenatal check-ups by districts, Haryana, 2012-13.
District Any ANC Check up
Place of antenatal check-upa
Number of Women**
Government health facility1 Private health facility2 Others3 Health Facility ICDS/Mobile Unit
Panchkula Ambala Yamunanagar Kurukshetra Kaithal Karnal Panipath Sonipath Jind Fatehabad Sirsa Hisar Bhiwani Rohtak Jhajjar Mahendragarh Rewari Gurgaon Faridabad Mewat Palwal DLHS-4 DLHS-3
88.0 87.2 70.3 79.3
85.8 82.1 59.9 45.6
79.1 60.7 64.5 72.3
79.9 76.4 78.4 70.1
76.7 76.2 72.9 45.6 58.3
70.8 87.2
80.6 76.5 58.7 52.1
79.0 51.5 28.5 49.2
63.4 60.1 48.7 68.1
73.6 70.9 71.7 76.7
70.8 61.3 59.9 73.8 52.9
63.7 45.7
18.0 28.2 22.9 28.3
19.3 16.6
9.3 8.1
13.5 19.4
7.6 14.6
23.9 21.4 18.3 13.3
39.7 15.7 19.8 35.4 27.3
20.2
3.8
26.1 35.9 46.3 70.8
30.8 63.6 74.5 53.6
48.4 50.8 53.8 51.2
49.5 42.0 38.6 52.9
71.4 54.1 54.5 65.0 70.8
51.5 45.8
0.0 0.6 1.6 4.9
0.9 5.3 8.4 8.9
0.6
14.9 3.3 1.9
0.6 5.0 3.1 0.5
0.9 1.4 0.0 2.5 2.1
3.1 NA
271 335 406 427
493 535 479 485
395 305 544 523
386 411 416 353
273 331 264 397 429
8,458 6,784
## Women who had their last live/still birth since 01-01-2008. a Total figure may not add to 100 percent due to ‘do not know’ and ‘missing cases. 1 Includes sub-health centre, primary health centre, community health centre or rural hospital, urban health centre/ urban health post/ urban family welfare centre, government hospital or dispensary. 2 Includes Private hospital/clinic, 3 Includes own home, parents home, other home and others. NA: Not available. ** Unweighted cases.
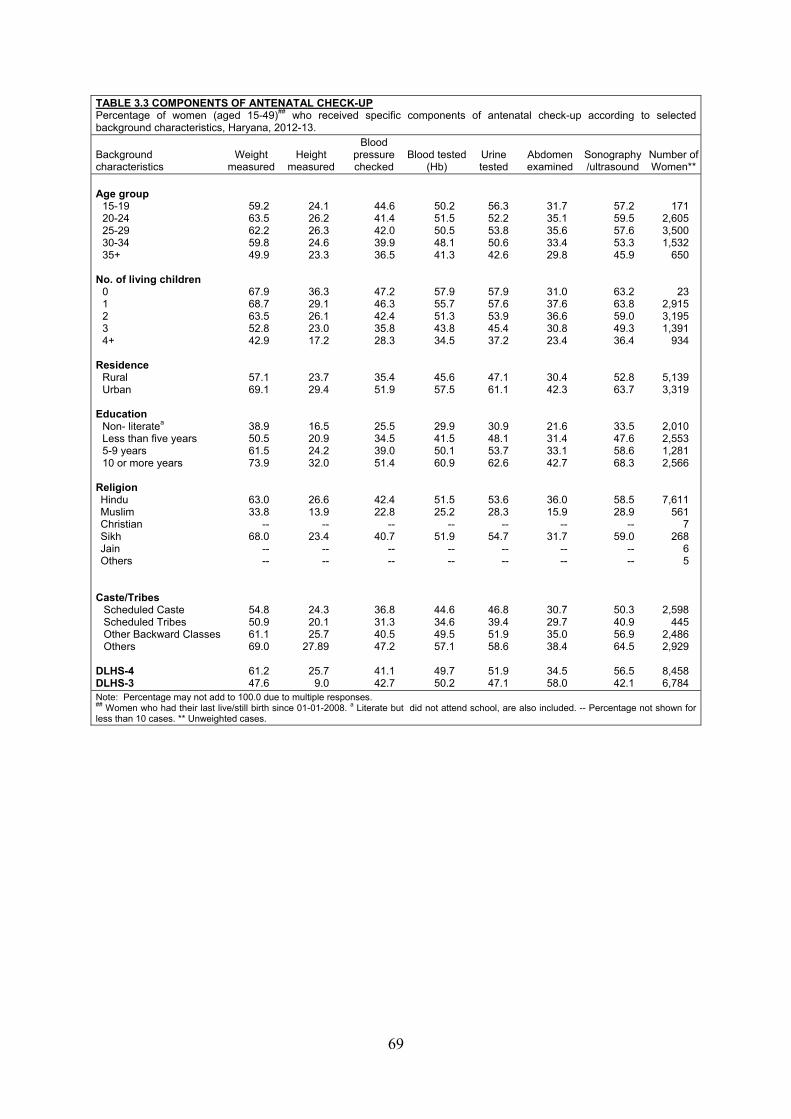
69
TABLE 3.3 COMPONENTS OF ANTENATAL CHECK-UP Percentage of women (aged 15-49)## who received specific components of antenatal check-up according to selected background characteristics, Haryana, 2012-13.
Background characteristics
Weight measured
Height measured
Blood pressure checked
Blood tested (Hb)
Urine tested
Abdomen examined
Sonography /ultrasound
Number of Women**
Age group
15-19 20-24 25-29 30-34 35+
No. of living children
0 1 2 3 4+
Residence
Rural Urban
Education
Non- literatea Less than five years 5-9 years 10 or more years
Religion Hindu Muslim Christian Sikh Jain Others
Caste/Tribes Scheduled Caste Scheduled Tribes Other Backward Classes Others DLHS-4 DLHS-3
59.2 63.5 62.2 59.8 49.9
67.9 68.7 63.5 52.8 42.9
57.1 69.1
38.9 50.5 61.5 73.9
63.0 33.8
-- 68.0
-- --
54.8 50.9 61.1 69.0
61.2 47.6
24.1 26.2 26.3 24.6 23.3
36.3 29.1 26.1 23.0 17.2
23.7 29.4
16.5 20.9 24.2 32.0
26.6 13.9
-- 23.4
-- --
24.3 20.1 25.7
27.89
25.7 9.0
44.6 41.4 42.0 39.9 36.5
47.2 46.3 42.4 35.8 28.3
35.4 51.9
25.5 34.5 39.0 51.4
42.4 22.8
-- 40.7
-- --
36.8 31.3 40.5 47.2
41.1 42.7
50.2 51.5 50.5 48.1 41.3
57.9 55.7 51.3 43.8 34.5
45.6 57.5
29.9 41.5 50.1 60.9
51.5 25.2
-- 51.9
-- --
44.6 34.6 49.5 57.1
49.7 50.2
56.3 52.2 53.8 50.6 42.6
57.9 57.6 53.9 45.4 37.2
47.1 61.1
30.9 48.1 53.7 62.6
53.6 28.3
-- 54.7
-- --
46.8 39.4 51.9 58.6
51.9 47.1
31.7 35.1 35.6 33.4 29.8
31.0 37.6 36.6 30.8 23.4
30.4 42.3
21.6 31.4 33.1 42.7
36.0 15.9
-- 31.7
-- --
30.7 29.7 35.0 38.4
34.5 58.0
57.2 59.5 57.6 53.3 45.9
63.2 63.8 59.0 49.3 36.4
52.8 63.7
33.5 47.6 58.6 68.3
58.5 28.9
-- 59.0
-- --
50.3 40.9 56.9 64.5
56.5 42.1
171 2,605 3,500 1,532
650
23 2,915 3,195 1,391
934
5,139 3,319
2,010 2,553 1,281 2,566
7,611 561
7 268
6 5
2,598 445
2,486 2,929
8,458 6,784
Note: Percentage may not add to 100.0 due to multiple responses. ## Women who had their last live/still birth since 01-01-2008. a Literate but did not attend school, are also included. -- Percentage not shown for less than 10 cases. ** Unweighted cases.
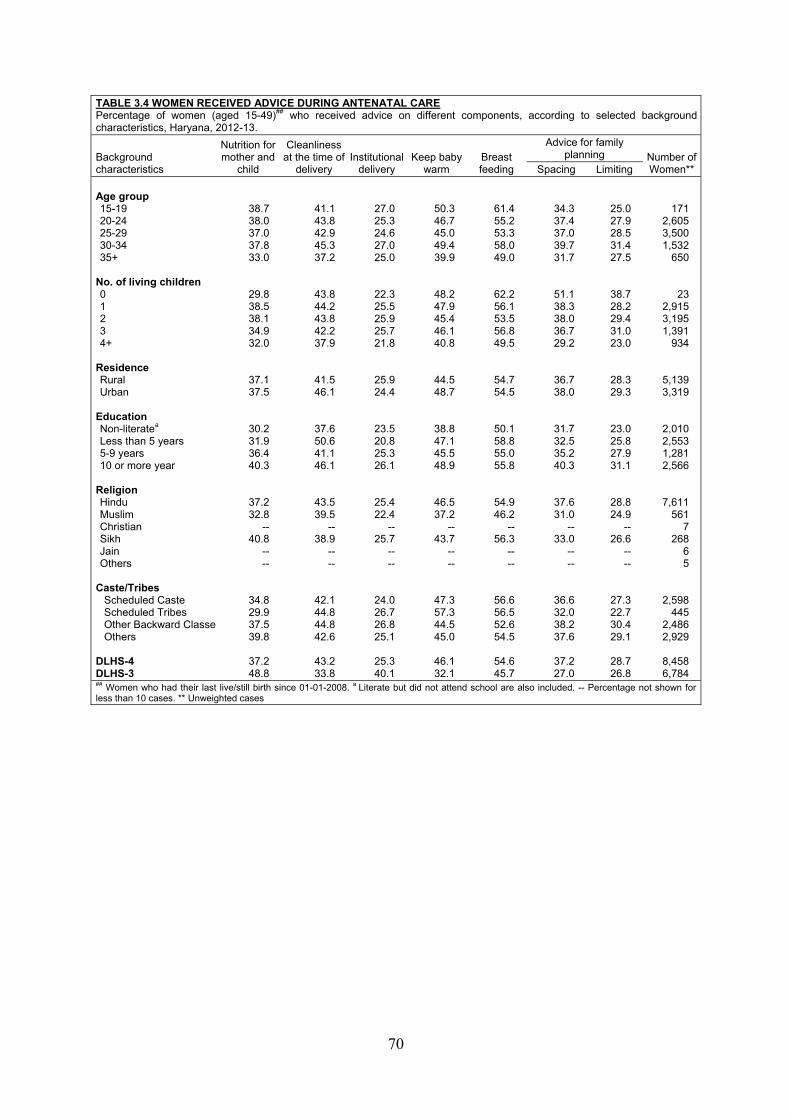
70
TABLE 3.4 WOMEN RECEIVED ADVICE DURING ANTENATAL CARE Percentage of women (aged 15-49)## who received advice on different components, according to selected background characteristics, Haryana, 2012-13.
Background characteristics
Nutrition for mother and
child
Cleanliness at the time of
delivery
Institutional
delivery Keep baby
warm Breast feeding
Advice for family planning Number of
Women** Spacing Limiting Age group 15-19 20-24 25-29 30-34 35+
No. of living children 0 1 2 3 4+
Residence Rural Urban
Education Non-literatea Less than 5 years 5-9 years 10 or more year
Religion Hindu Muslim Christian Sikh Jain Others
Caste/Tribes Scheduled Caste Scheduled Tribes Other Backward Classe Others DLHS-4 DLHS-3
38.7 38.0 37.0 37.8 33.0
29.8 38.5 38.1 34.9 32.0
37.1 37.5
30.2 31.9 36.4 40.3
37.2 32.8
-- 40.8
-- --
34.8 29.9 37.5 39.8
37.2 48.8
41.1 43.8 42.9 45.3 37.2
43.8 44.2 43.8 42.2 37.9
41.5 46.1
37.6 50.6 41.1 46.1
43.5 39.5
-- 38.9
-- --
42.1 44.8 44.8 42.6
43.2 33.8
27.0 25.3 24.6 27.0 25.0
22.3 25.5 25.9 25.7 21.8
25.9 24.4
23.5 20.8 25.3 26.1
25.4 22.4
-- 25.7
-- --
24.0 26.7 26.8 25.1
25.3 40.1
50.3 46.7 45.0 49.4 39.9
48.2 47.9 45.4 46.1 40.8
44.5 48.7
38.8 47.1 45.5 48.9
46.5 37.2
-- 43.7
-- --
47.3 57.3 44.5 45.0
46.1 32.1
61.4 55.2 53.3 58.0 49.0
62.2 56.1 53.5 56.8 49.5
54.7 54.5
50.1 58.8 55.0 55.8
54.9 46.2
-- 56.3
-- --
56.6 56.5 52.6 54.5
54.6 45.7
34.3 37.4 37.0 39.7 31.7
51.1 38.3 38.0 36.7 29.2
36.7 38.0
31.7 32.5 35.2 40.3
37.6 31.0
-- 33.0
-- --
36.6 32.0 38.2 37.6
37.2 27.0
25.0 27.9 28.5 31.4 27.5
38.7 28.2 29.4 31.0 23.0
28.3 29.3
23.0 25.8 27.9 31.1
28.8 24.9
-- 26.6
-- --
27.3 22.7 30.4 29.1
28.7 26.8
171 2,605 3,500 1,532
650
23 2,915 3,195 1,391
934
5,139 3,319
2,010 2,553 1,281 2,566
7,611 561
7 268
6 5
2,598 445
2,486 2,929
8,458 6,784
## Women who had their last live/still birth since 01-01-2008. a Literate but did not attend school are also included. -- Percentage not shown for less than 10 cases. ** Unweighted cases
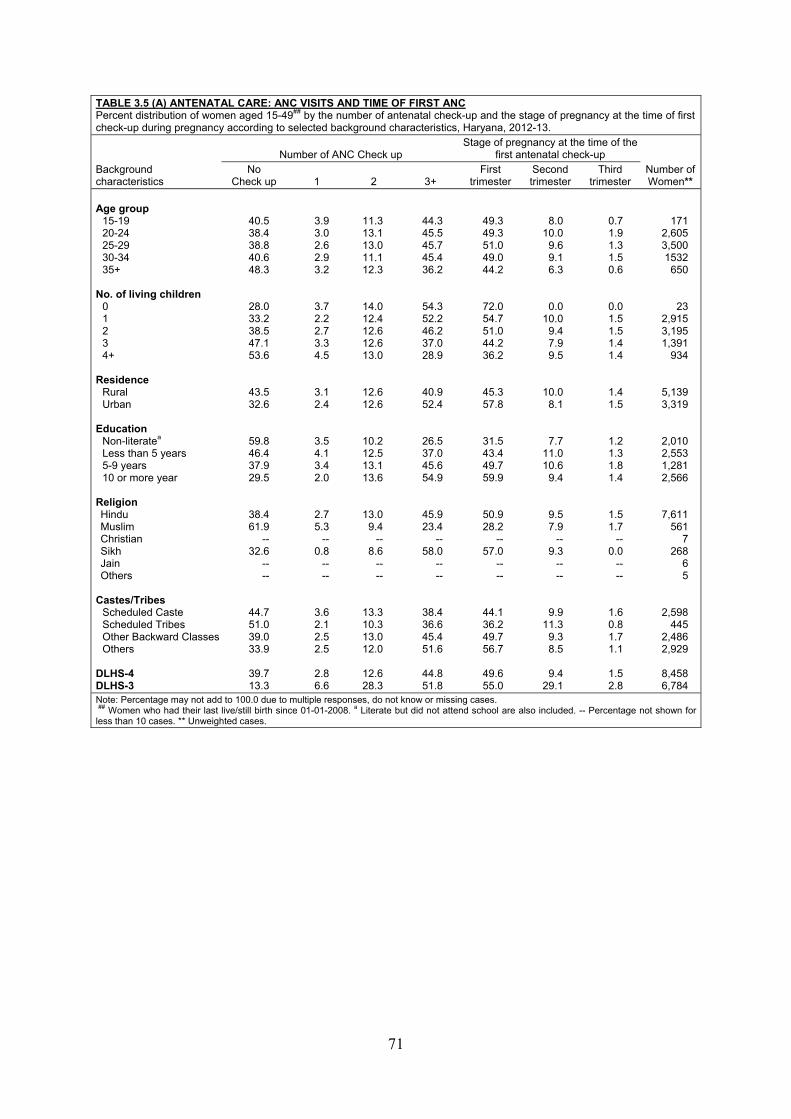
71
TABLE 3.5 (A) ANTENATAL CARE: ANC VISITS AND TIME OF FIRST ANC Percent distribution of women aged 15-49## by the number of antenatal check-up and the stage of pregnancy at the time of first check-up during pregnancy according to selected background characteristics, Haryana, 2012-13.
Background characteristics
Number of ANC Check up Stage of pregnancy at the time of the
first antenatal check-up Number of Women**
No Check up 1 2 3+
First trimester
Second trimester
Third trimester
Age group
15-19 20-24 25-29 30-34 35+
No. of living children
0 1 2 3 4+
Residence
Rural Urban
Education
Non-literatea Less than 5 years 5-9 years 10 or more year
Religion Hindu Muslim Christian Sikh Jain Others
Castes/Tribes
Scheduled Caste Scheduled Tribes Other Backward Classes Others
DLHS-4 DLHS-3
40.5 38.4 38.8 40.6 48.3
28.0 33.2 38.5 47.1 53.6
43.5 32.6
59.8 46.4 37.9 29.5
38.4 61.9
-- 32.6
-- --
44.7 51.0 39.0 33.9
39.7 13.3
3.9 3.0 2.6 2.9 3.2
3.7 2.2 2.7 3.3 4.5
3.1 2.4
3.5 4.1 3.4 2.0
2.7 5.3
-- 0.8
-- --
3.6 2.1 2.5 2.5
2.8 6.6
11.3 13.1 13.0 11.1 12.3
14.0 12.4 12.6 12.6 13.0
12.6 12.6
10.2 12.5 13.1 13.6
13.0 9.4
-- 8.6
-- --
13.3 10.3 13.0 12.0
12.6 28.3
44.3 45.5 45.7 45.4 36.2
54.3 52.2 46.2 37.0 28.9
40.9 52.4
26.5 37.0 45.6 54.9
45.9 23.4
-- 58.0
-- --
38.4 36.6 45.4 51.6
44.8 51.8
49.3 49.3 51.0 49.0 44.2
72.0 54.7 51.0 44.2 36.2
45.3 57.8
31.5 43.4 49.7 59.9
50.9 28.2
-- 57.0
-- --
44.1 36.2 49.7 56.7
49.6 55.0
8.0 10.0
9.6 9.1 6.3
0.0 10.0
9.4 7.9 9.5
10.0 8.1
7.7 11.0 10.6
9.4
9.5 7.9
-- 9.3
-- --
9.9 11.3
9.3 8.5
9.4
29.1
0.7 1.9 1.3 1.5 0.6
0.0 1.5 1.5 1.4 1.4
1.4 1.5
1.2 1.3 1.8 1.4
1.5 1.7
-- 0.0
-- --
1.6 0.8 1.7 1.1
1.5 2.8
171 2,605 3,500 1532
650
23 2,915 3,195 1,391
934
5,139 3,319
2,010 2,553 1,281 2,566
7,611 561
7 268
6 5
2,598 445
2,486 2,929
8,458 6,784
Note: Percentage may not add to 100.0 due to multiple responses, do not know or missing cases. ## Women who had their last live/still birth since 01-01-2008. a Literate but did not attend school are also included. -- Percentage not shown for less than 10 cases. ** Unweighted cases.
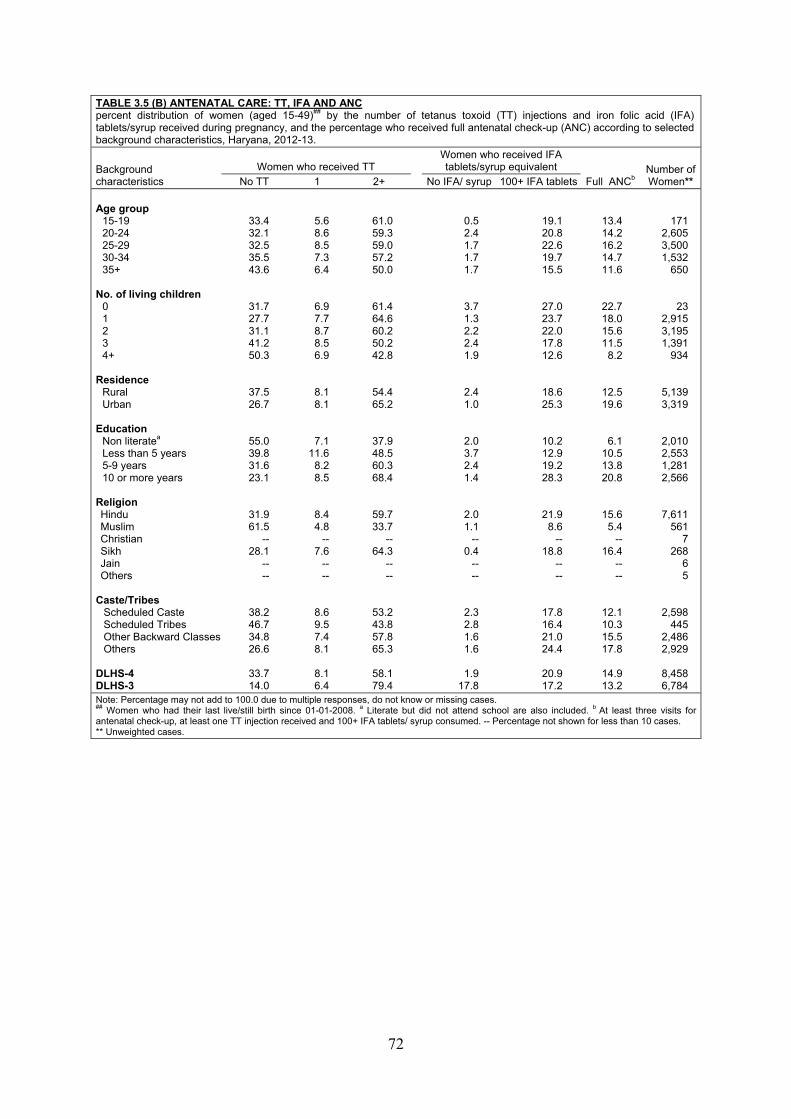
72
TABLE 3.5 (B) ANTENATAL CARE: TT, IFA AND ANC percent distribution of women (aged 15-49)## by the number of tetanus toxoid (TT) injections and iron folic acid (IFA) tablets/syrup received during pregnancy, and the percentage who received full antenatal check-up (ANC) according to selected background characteristics, Haryana, 2012-13.
Background characteristics
Women who received TT Women who received IFA tablets/syrup equivalent
Full ANCb Number of Women** No TT 1 2+ No IFA/ syrup 100+ IFA tablets
Age group
15-19 20-24 25-29 30-34 35+
No. of living children
0 1 2 3 4+
Residence
Rural Urban
Education
Non literatea Less than 5 years 5-9 years 10 or more years
Religion Hindu Muslim Christian Sikh Jain Others
Caste/Tribes Scheduled Caste Scheduled Tribes Other Backward Classes Others DLHS-4 DLHS-3
33.4 32.1 32.5 35.5 43.6
31.7 27.7 31.1 41.2 50.3
37.5 26.7
55.0 39.8 31.6 23.1
31.9 61.5
-- 28.1
-- --
38.2 46.7 34.8 26.6
33.7 14.0
5.6 8.6 8.5 7.3 6.4
6.9 7.7 8.7 8.5 6.9
8.1 8.1
7.1 11.6
8.2 8.5
8.4 4.8
-- 7.6
-- --
8.6 9.5 7.4 8.1
8.1 6.4
61.0 59.3 59.0 57.2 50.0
61.4 64.6 60.2 50.2 42.8
54.4 65.2
37.9 48.5 60.3 68.4
59.7 33.7
-- 64.3
-- --
53.2 43.8 57.8 65.3
58.1 79.4
0.5 2.4 1.7 1.7 1.7
3.7 1.3 2.2 2.4 1.9
2.4 1.0
2.0 3.7 2.4 1.4
2.0 1.1
-- 0.4
-- --
2.3 2.8 1.6 1.6
1.9
17.8
19.1 20.8 22.6 19.7 15.5
27.0 23.7 22.0 17.8 12.6
18.6 25.3
10.2 12.9 19.2 28.3
21.9 8.6
-- 18.8
-- --
17.8 16.4 21.0 24.4
20.9 17.2
13.4 14.2 16.2 14.7 11.6
22.7 18.0 15.6 11.5
8.2
12.5 19.6
6.1 10.5 13.8 20.8
15.6 5.4
-- 16.4
-- --
12.1 10.3 15.5 17.8
14.9 13.2
171 2,605 3,500 1,532
650
23 2,915 3,195 1,391
934
5,139 3,319
2,010 2,553 1,281 2,566
7,611 561
7 268
6 5
2,598 445
2,486 2,929
8,458 6,784
Note: Percentage may not add to 100.0 due to multiple responses, do not know or missing cases. ## Women who had their last live/still birth since 01-01-2008. a Literate but did not attend school are also included. b At least three visits for antenatal check-up, at least one TT injection received and 100+ IFA tablets/ syrup consumed. -- Percentage not shown for less than 10 cases. ** Unweighted cases.
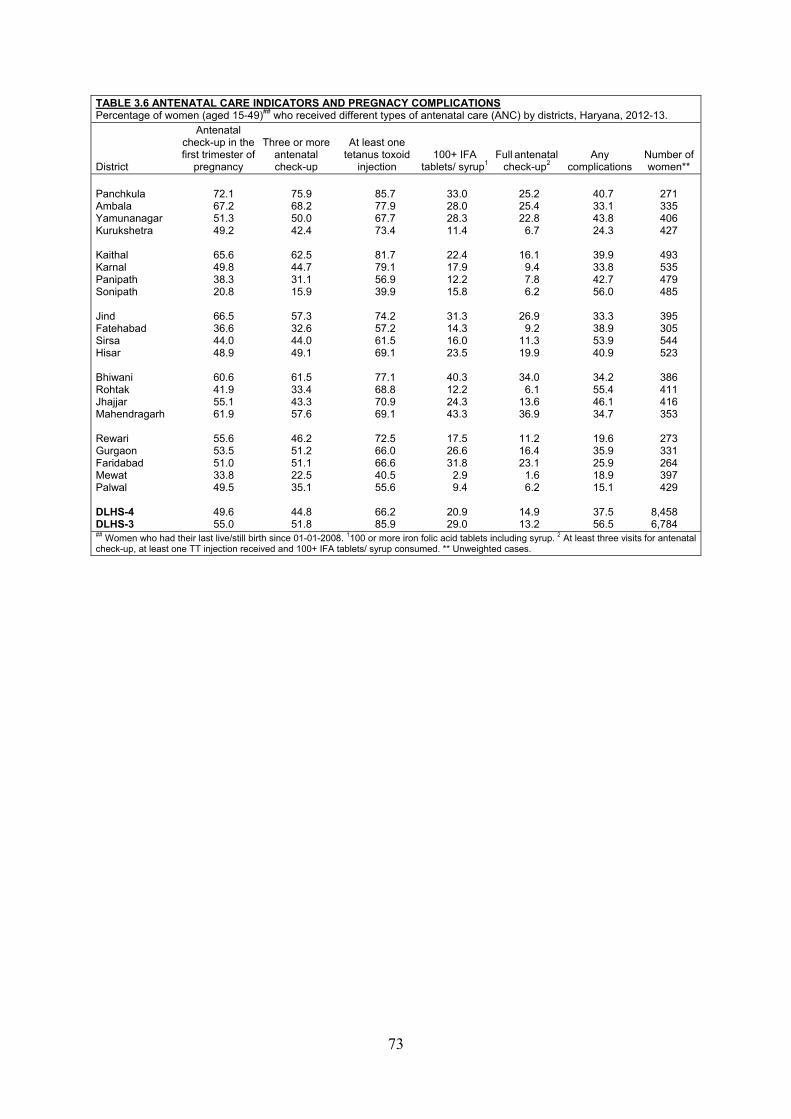
73
TABLE 3.6 ANTENATAL CARE INDICATORS AND PREGNACY COMPLICATIONS Percentage of women (aged 15-49)## who received different types of antenatal care (ANC) by districts, Haryana, 2012-13.
District
Antenatal check-up in the first trimester of
pregnancy
Three or more antenatal check-up
At least one tetanus toxoid
injection 100+ IFA
tablets/ syrup1Full antenatal
check-up2 Any
complications Number of women**
Panchkula Ambala Yamunanagar Kurukshetra Kaithal Karnal Panipath Sonipath Jind Fatehabad Sirsa Hisar Bhiwani Rohtak Jhajjar Mahendragarh Rewari Gurgaon Faridabad Mewat Palwal DLHS-4 DLHS-3
72.1 67.2 51.3 49.2
65.6 49.8 38.3 20.8
66.5 36.6 44.0 48.9
60.6 41.9 55.1 61.9
55.6 53.5 51.0 33.8 49.5
49.6 55.0
75.9 68.2 50.0 42.4
62.5 44.7 31.1 15.9
57.3 32.6 44.0 49.1
61.5 33.4 43.3 57.6
46.2 51.2 51.1 22.5 35.1
44.8 51.8
85.7 77.9 67.7 73.4
81.7 79.1 56.9 39.9
74.2 57.2 61.5 69.1
77.1 68.8 70.9 69.1
72.5 66.0 66.6 40.5 55.6
66.2 85.9
33.0 28.0 28.3 11.4
22.4 17.9 12.2 15.8
31.3 14.3 16.0 23.5
40.3 12.2 24.3 43.3
17.5 26.6 31.8
2.9 9.4
20.9 29.0
25.2 25.4 22.8
6.7
16.1 9.4 7.8 6.2
26.9
9.2 11.3 19.9
34.0
6.1 13.6 36.9
11.2 16.4 23.1
1.6 6.2
14.9 13.2
40.7 33.1 43.8 24.3
39.9 33.8 42.7 56.0
33.3 38.9 53.9 40.9
34.2 55.4 46.1 34.7
19.6 35.9 25.9 18.9 15.1
37.5 56.5
271 335 406 427
493 535 479 485
395 305 544 523
386 411 416 353
273 331 264 397 429
8,458 6,784
## Women who had their last live/still birth since 01-01-2008. 1100 or more iron folic acid tablets including syrup. 2 At least three visits for antenatal check-up, at least one TT injection received and 100+ IFA tablets/ syrup consumed. ** Unweighted cases.
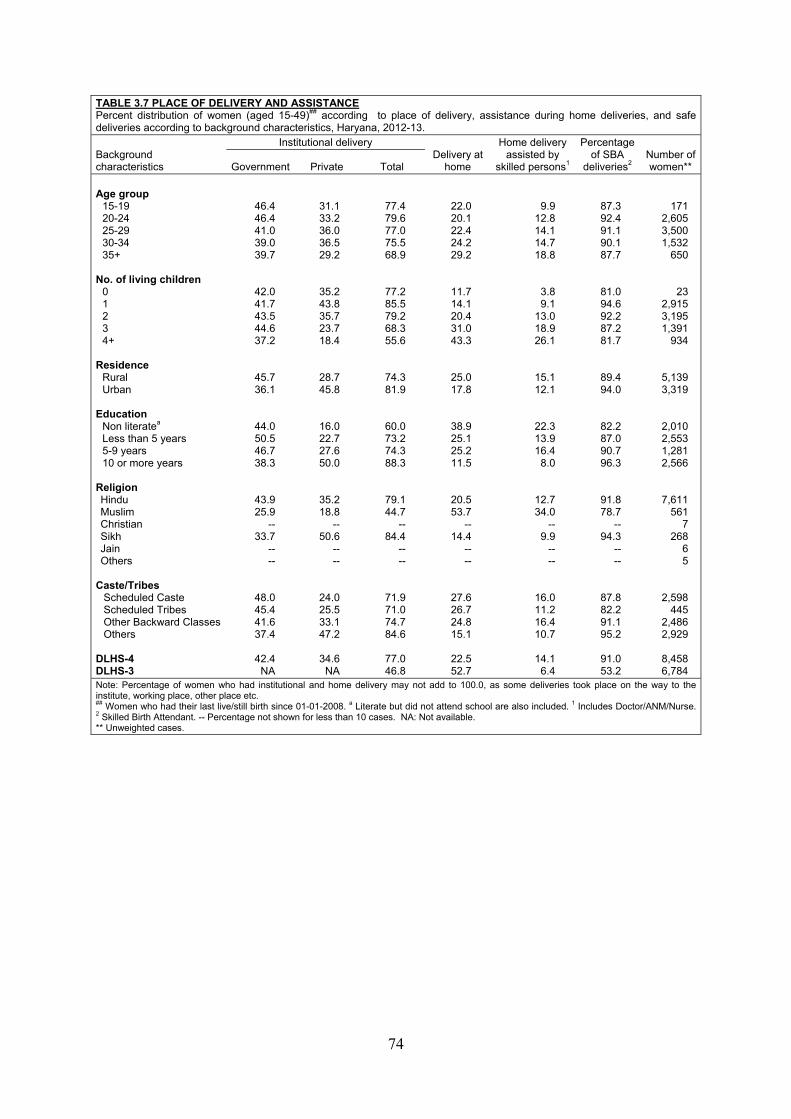
74
TABLE 3.7 PLACE OF DELIVERY AND ASSISTANCE Percent distribution of women (aged 15-49)## according to place of delivery, assistance during home deliveries, and safe deliveries according to background characteristics, Haryana, 2012-13.
Background characteristics
Institutional delivery Delivery at
home
Home delivery assisted by
skilled persons1
Percentage of SBA
deliveries2 Number of women** Government Private Total
Age group
15-19 20-24 25-29 30-34 35+
No. of living children
0 1 2 3 4+
Residence
Rural Urban
Education
Non literatea Less than 5 years 5-9 years 10 or more years
Religion Hindu Muslim Christian Sikh Jain Others
Caste/Tribes Scheduled Caste Scheduled Tribes Other Backward Classes Others DLHS-4 DLHS-3
46.4 46.4 41.0 39.0 39.7
42.0 41.7 43.5 44.6 37.2
45.7 36.1
44.0 50.5 46.7 38.3
43.9 25.9
-- 33.7
-- --
48.0 45.4 41.6 37.4
42.4
NA
31.1 33.2 36.0 36.5 29.2
35.2 43.8 35.7 23.7 18.4
28.7 45.8
16.0 22.7 27.6 50.0
35.2 18.8
-- 50.6
-- --
24.0 25.5 33.1 47.2
34.6
NA
77.4 79.6 77.0 75.5 68.9
77.2 85.5 79.2 68.3 55.6
74.3 81.9
60.0 73.2 74.3 88.3
79.1 44.7
-- 84.4
-- --
71.9 71.0 74.7 84.6
77.0 46.8
22.0 20.1 22.4 24.2 29.2
11.7 14.1 20.4 31.0 43.3
25.0 17.8
38.9 25.1 25.2 11.5
20.5 53.7
-- 14.4
-- --
27.6 26.7 24.8 15.1
22.5 52.7
9.9 12.8 14.1 14.7 18.8
3.8 9.1
13.0 18.9 26.1
15.1 12.1
22.3 13.9 16.4
8.0
12.7 34.0
-- 9.9
-- --
16.0 11.2 16.4 10.7
14.1
6.4
87.3 92.4 91.1 90.1 87.7
81.0 94.6 92.2 87.2 81.7
89.4 94.0
82.2 87.0 90.7 96.3
91.8 78.7
-- 94.3
-- --
87.8 82.2 91.1 95.2
91.0 53.2
171 2,605 3,500 1,532
650
23 2,915 3,195 1,391
934
5,139 3,319
2,010 2,553 1,281 2,566
7,611 561
7 268
6 5
2,598 445
2,486 2,929
8,458 6,784
Note: Percentage of women who had institutional and home delivery may not add to 100.0, as some deliveries took place on the way to the institute, working place, other place etc. ## Women who had their last live/still birth since 01-01-2008. a Literate but did not attend school are also included. 1 Includes Doctor/ANM/Nurse. 2 Skilled Birth Attendant. -- Percentage not shown for less than 10 cases. NA: Not available. ** Unweighted cases.
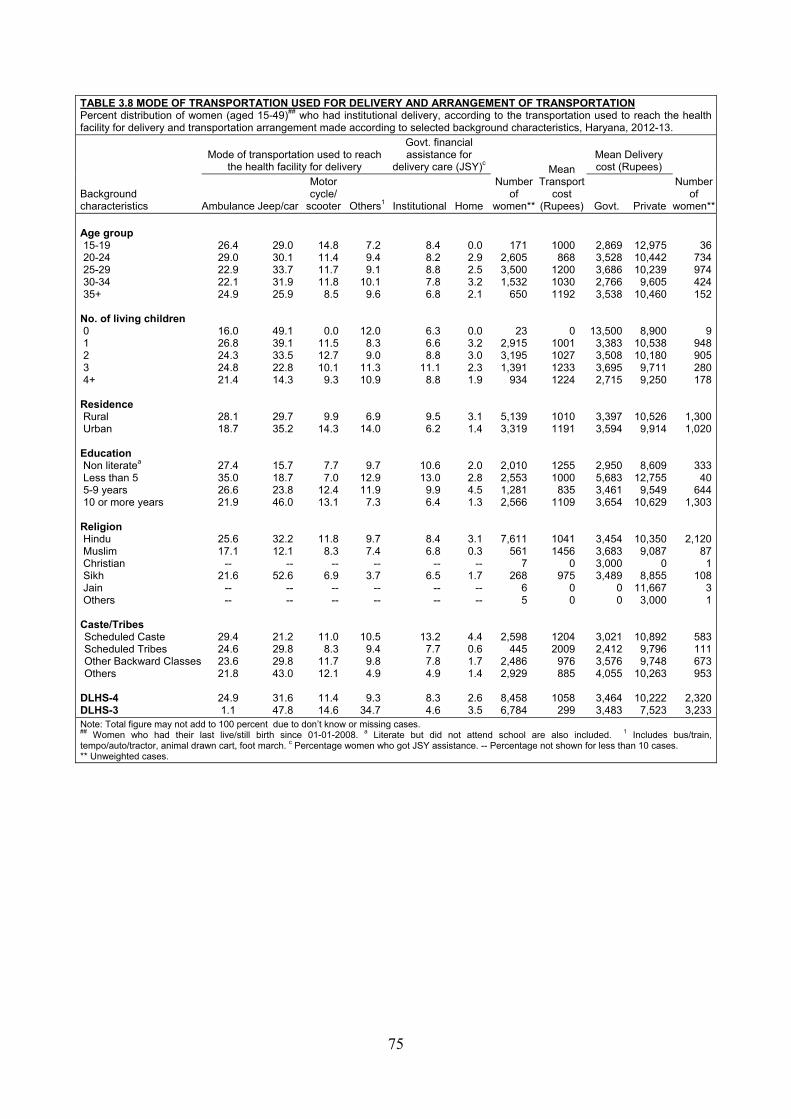
75
TABLE 3.8 MODE OF TRANSPORTATION USED FOR DELIVERY AND ARRANGEMENT OF TRANSPORTATION Percent distribution of women (aged 15-49)## who had institutional delivery, according to the transportation used to reach the health facility for delivery and transportation arrangement made according to selected background characteristics, Haryana, 2012-13.
Background characteristics
Mode of transportation used to reach the health facility for delivery
Govt. financial assistance for
delivery care (JSY)c
Number of
women**
Mean Transport
cost (Rupees)
Mean Delivery cost (Rupees)
Number of
women**Ambulance Jeep/car
Motor cycle/
scooter Others1 Institutional Home Govt. Private Age group 15-19 20-24 25-29 30-34 35+
No. of living children 0 1 2 3 4+
Residence Rural Urban
Education Non literatea Less than 5 5-9 years 10 or more years
Religion Hindu Muslim Christian Sikh Jain Others
Caste/Tribes Scheduled Caste Scheduled Tribes Other Backward Classes Others DLHS-4 DLHS-3
26.4 29.0 22.9 22.1 24.9
16.0 26.8 24.3 24.8 21.4
28.1 18.7
27.4 35.0 26.6 21.9
25.6 17.1
-- 21.6
-- --
29.4 24.6 23.6 21.8
24.9 1.1
29.0 30.1 33.7 31.9 25.9
49.1 39.1 33.5 22.8 14.3
29.7 35.2
15.7 18.7 23.8 46.0
32.2 12.1
-- 52.6
-- --
21.2 29.8 29.8 43.0
31.6 47.8
14.8 11.4 11.7 11.8
8.5
0.0 11.5 12.7 10.1
9.3
9.9 14.3
7.7 7.0
12.4 13.1
11.8 8.3
-- 6.9
-- --
11.0 8.3
11.7 12.1
11.4 14.6
7.2 9.4 9.1
10.1 9.6
12.0 8.3 9.0
11.3 10.9
6.9 14.0
9.7 12.9 11.9
7.3
9.7 7.4
-- 3.7
-- --
10.5 9.4 9.8 4.9
9.3
34.7
8.4 8.2 8.8 7.8 6.8
6.3 6.6 8.8
11.1 8.8
9.5 6.2
10.6 13.0
9.9 6.4
8.4 6.8
-- 6.5
-- --
13.2 7.7 7.8 4.9
8.3 4.6
0.0 2.9 2.5 3.2 2.1
0.0 3.2 3.0 2.3 1.9
3.1 1.4
2.0 2.8 4.5 1.3
3.1 0.3
-- 1.7
-- --
4.4 0.6 1.7 1.4
2.6 3.5
171 2,605 3,500 1,532
650
23 2,915 3,195 1,391
934
5,139 3,319
2,010 2,553 1,281 2,566
7,611 561
7 268
6 5
2,598 445
2,486 2,929
8,458 6,784
1000 868
1200 1030 1192
0 1001 1027 1233 1224
1010 1191
1255 1000
835 1109
1041 1456
0 975
0 0
1204 2009
976 885
1058
299
2,869 3,528 3,686 2,766 3,538
13,500 3,383 3,508 3,695 2,715
3,397 3,594
2,950 5,683 3,461 3,654
3,454 3,683 3,000 3,489
0 0
3,021 2,412 3,576 4,055
3,464 3,483
12,975 10,442 10,239
9,605 10,460
8,900 10,538 10,180
9,711 9,250
10,526 9,914
8,609 12,755
9,549 10,629
10,350 9,087
0 8,855
11,667 3,000
10,892 9,796 9,748
10,263
10,222 7,523
36734974424152
9948905280178
1,3001,020
33340
6441,303
2,12087
1108
31
583111673953
2,3203,233
Note: Total figure may not add to 100 percent due to don’t know or missing cases. ## Women who had their last live/still birth since 01-01-2008. a Literate but did not attend school are also included. 1 Includes bus/train, tempo/auto/tractor, animal drawn cart, foot march. c Percentage women who got JSY assistance. -- Percentage not shown for less than 10 cases. ** Unweighted cases.
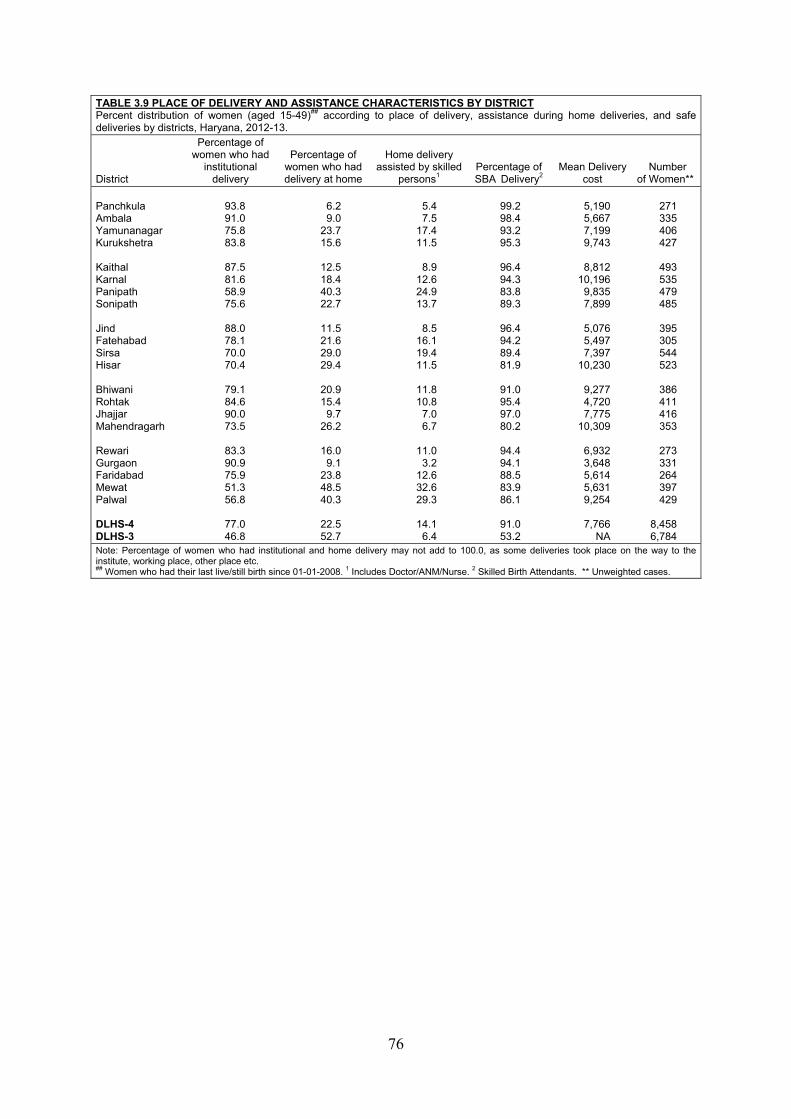
76
TABLE 3.9 PLACE OF DELIVERY AND ASSISTANCE CHARACTERISTICS BY DISTRICT Percent distribution of women (aged 15-49)## according to place of delivery, assistance during home deliveries, and safe deliveries by districts, Haryana, 2012-13.
District
Percentage of women who had
institutional delivery
Percentage of women who had delivery at home
Home delivery assisted by skilled
persons1 Percentage of SBA Delivery2
Mean Delivery cost
Number of Women**
Panchkula Ambala Yamunanagar Kurukshetra Kaithal Karnal Panipath Sonipath Jind Fatehabad Sirsa Hisar Bhiwani Rohtak Jhajjar Mahendragarh Rewari Gurgaon Faridabad Mewat Palwal DLHS-4 DLHS-3
93.8 91.0 75.8 83.8
87.5 81.6 58.9 75.6
88.0 78.1 70.0 70.4
79.1 84.6 90.0 73.5
83.3 90.9 75.9 51.3 56.8
77.0 46.8
6.2 9.0
23.7 15.6
12.5 18.4 40.3 22.7
11.5 21.6 29.0 29.4
20.9 15.4
9.7 26.2
16.0
9.1 23.8 48.5 40.3
22.5 52.7
5.4 7.5
17.4 11.5
8.9
12.6 24.9 13.7
8.5
16.1 19.4 11.5
11.8 10.8
7.0 6.7
11.0
3.2 12.6 32.6 29.3
14.1
6.4
99.2 98.4 93.2 95.3
96.4 94.3 83.8 89.3
96.4 94.2 89.4 81.9
91.0 95.4 97.0 80.2
94.4 94.1 88.5 83.9 86.1
91.0 53.2
5,190 5,667 7,199 9,743
8,812
10,196 9,835 7,899
5,076 5,497 7,397
10,230
9,277 4,720 7,775
10,309
6,932 3,648 5,614 5,631 9,254
7,766
NA
271 335 406 427
493 535 479 485
395 305 544 523
386 411 416 353
273 331 264 397 429
8,458 6,784
Note: Percentage of women who had institutional and home delivery may not add to 100.0, as some deliveries took place on the way to the institute, working place, other place etc. ## Women who had their last live/still birth since 01-01-2008. 1 Includes Doctor/ANM/Nurse. 2 Skilled Birth Attendants. ** Unweighted cases.
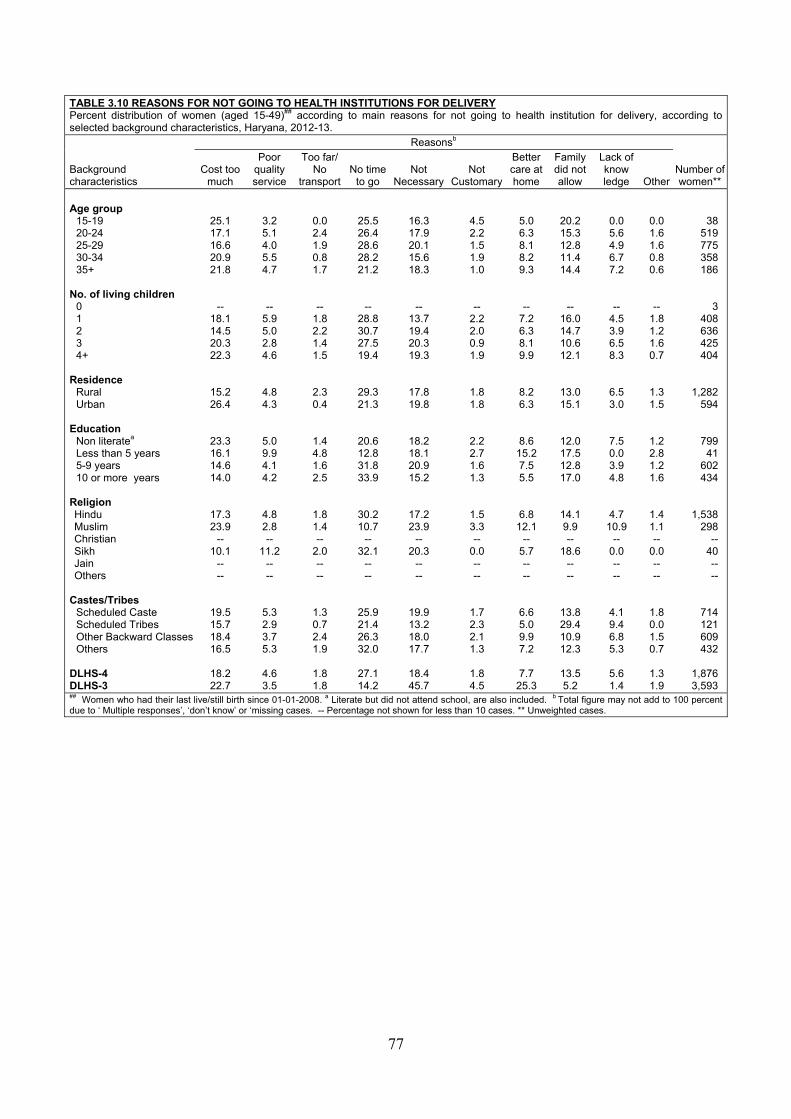
77
TABLE 3.10 REASONS FOR NOT GOING TO HEALTH INSTITUTIONS FOR DELIVERY Percent distribution of women (aged 15-49)## according to main reasons for not going to health institution for delivery, according to selected background characteristics, Haryana, 2012-13.
Background characteristics
Reasonsb
Number of women**
Cost too much
Poor quality service
Too far/ No
transport No time
to go Not
NecessaryNot
Customary
Better care athome
Family did not allow
Lack of know ledge Other
Age group
15-19 20-24 25-29 30-34 35+
No. of living children
0 1 2 3 4+
Residence
Rural Urban
Education
Non literatea Less than 5 years 5-9 years 10 or more years
Religion Hindu Muslim Christian Sikh Jain Others
Castes/Tribes
Scheduled Caste Scheduled Tribes Other Backward Classes Others
DLHS-4 DLHS-3
25.1 17.1 16.6 20.9 21.8
-- 18.1 14.5 20.3 22.3
15.2 26.4
23.3 16.1 14.6 14.0
17.3 23.9
-- 10.1
-- --
19.5 15.7 18.4 16.5
18.2 22.7
3.2 5.1 4.0 5.5 4.7
-- 5.9 5.0 2.8 4.6
4.8 4.3
5.0 9.9 4.1 4.2
4.8 2.8 --
11.2 -- --
5.3 2.9 3.7 5.3
4.6 3.5
0.0 2.4 1.9 0.8 1.7
-- 1.8 2.2 1.4 1.5
2.3 0.4
1.4 4.8 1.6 2.5
1.8 1.4 --
2.0 -- --
1.3 0.7 2.4 1.9
1.8 1.8
25.5 26.4 28.6 28.2 21.2
-- 28.8 30.7 27.5 19.4
29.3 21.3
20.6 12.8 31.8 33.9
30.2 10.7
-- 32.1
-- --
25.9 21.4 26.3 32.0
27.1 14.2
16.3 17.9 20.1 15.6 18.3
-- 13.7 19.4 20.3 19.3
17.8 19.8
18.2 18.1 20.9 15.2
17.2 23.9
-- 20.3
-- --
19.9 13.2 18.0 17.7
18.4 45.7
4.5 2.2 1.5 1.9 1.0
-- 2.2 2.0 0.9 1.9
1.8 1.8
2.2 2.7 1.6 1.3
1.5 3.3 --
0.0 -- --
1.7 2.3 2.1 1.3
1.8 4.5
5.0 6.3 8.1 8.2 9.3
-- 7.2 6.3 8.1 9.9
8.2 6.3
8.6 15.2 7.5 5.5
6.8 12.1
-- 5.7 -- --
6.6 5.0 9.9 7.2
7.7
25.3
20.2 15.3 12.8 11.4 14.4
-- 16.0 14.7 10.6 12.1
13.0 15.1
12.0 17.5 12.8 17.0
14.1 9.9 --
18.6 -- --
13.8 29.4 10.9 12.3
13.5 5.2
0.0 5.6 4.9 6.7 7.2
-- 4.5 3.9 6.5 8.3
6.5 3.0
7.5 0.0 3.9 4.8
4.7 10.9
-- 0.0 -- --
4.1 9.4 6.8 5.3
5.6 1.4
0.0 1.6 1.6 0.8 0.6
-- 1.8 1.2 1.6 0.7
1.3 1.5
1.2 2.8 1.2 1.6
1.4 1.1 --
0.0 -- --
1.8 0.0 1.5 0.7
1.3 1.9
38 519 775 358 186
3 408 636 425 404
1,282 594
799 41
602 434
1,538 298
-- 40 -- --
714 121 609 432
1,876 3,593
## Women who had their last live/still birth since 01-01-2008. a Literate but did not attend school, are also included. b Total figure may not add to 100 percent due to ‘ Multiple responses’, ‘don’t know’ or ‘missing cases. -- Percentage not shown for less than 10 cases. ** Unweighted cases.
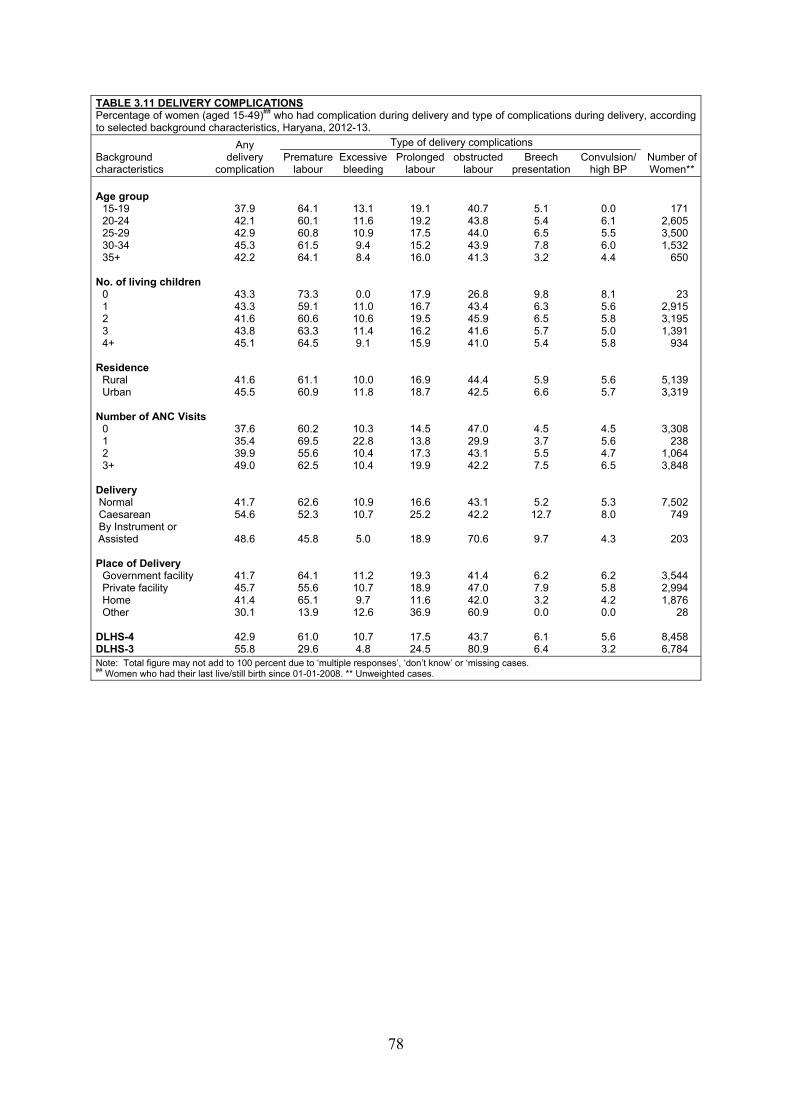
78
TABLE 3.11 DELIVERY COMPLICATIONS Percentage of women (aged 15-49)## who had complication during delivery and type of complications during delivery, according to selected background characteristics, Haryana, 2012-13.
Background characteristics
Any delivery
complication
Type of delivery complications Number of Women**
Premature labour
Excessive bleeding
Prolonged labour
obstructed labour
Breech presentation
Convulsion/ high BP
Age group
15-19 20-24 25-29 30-34 35+
No. of living children
0 1 2 3 4+
Residence
Rural Urban
Number of ANC Visits
0 1 2 3+
Delivery Normal Caesarean By Instrument or Assisted
Place of Delivery Government facility Private facility Home Other
DLHS-4 DLHS-3
37.9 42.1 42.9 45.3 42.2
43.3 43.3 41.6 43.8 45.1
41.6 45.5
37.6 35.4 39.9 49.0
41.7 54.6
48.6
41.7 45.7 41.4 30.1
42.9 55.8
64.1 60.1 60.8 61.5 64.1
73.3 59.1 60.6 63.3 64.5
61.1 60.9
60.2 69.5 55.6 62.5
62.6 52.3
45.8
64.1 55.6 65.1 13.9
61.0 29.6
13.1 11.6 10.9 9.4 8.4
0.0 11.0 10.6 11.4 9.1
10.0 11.8
10.3 22.8 10.4 10.4
10.9 10.7
5.0
11.2 10.7 9.7
12.6
10.7 4.8
19.1 19.2 17.5 15.2 16.0
17.9 16.7 19.5 16.2 15.9
16.9 18.7
14.5 13.8 17.3 19.9
16.6 25.2
18.9
19.3 18.9 11.6 36.9
17.5 24.5
40.7 43.8 44.0 43.9 41.3
26.8 43.4 45.9 41.6 41.0
44.4 42.5
47.0 29.9 43.1 42.2
43.1 42.2
70.6
41.4 47.0 42.0 60.9
43.7 80.9
5.1 5.4 6.5 7.8 3.2
9.8 6.3 6.5 5.7 5.4
5.9 6.6
4.5 3.7 5.5 7.5
5.2 12.7
9.7
6.2 7.9 3.2 0.0
6.1 6.4
0.0 6.1 5.5 6.0 4.4
8.1 5.6 5.8 5.0 5.8
5.6 5.7
4.5 5.6 4.7 6.5
5.3 8.0
4.3
6.2 5.8 4.2 0.0
5.6 3.2
171 2,605 3,500 1,532
650
23 2,915 3,195 1,391
934
5,139 3,319
3,308 238
1,064 3,848
7,502 749
203
3,544 2,994 1,876
28
8,458 6,784
Note: Total figure may not add to 100 percent due to ‘multiple responses’, ‘don’t know’ or ‘missing cases. ## Women who had their last live/still birth since 01-01-2008. ** Unweighted cases.
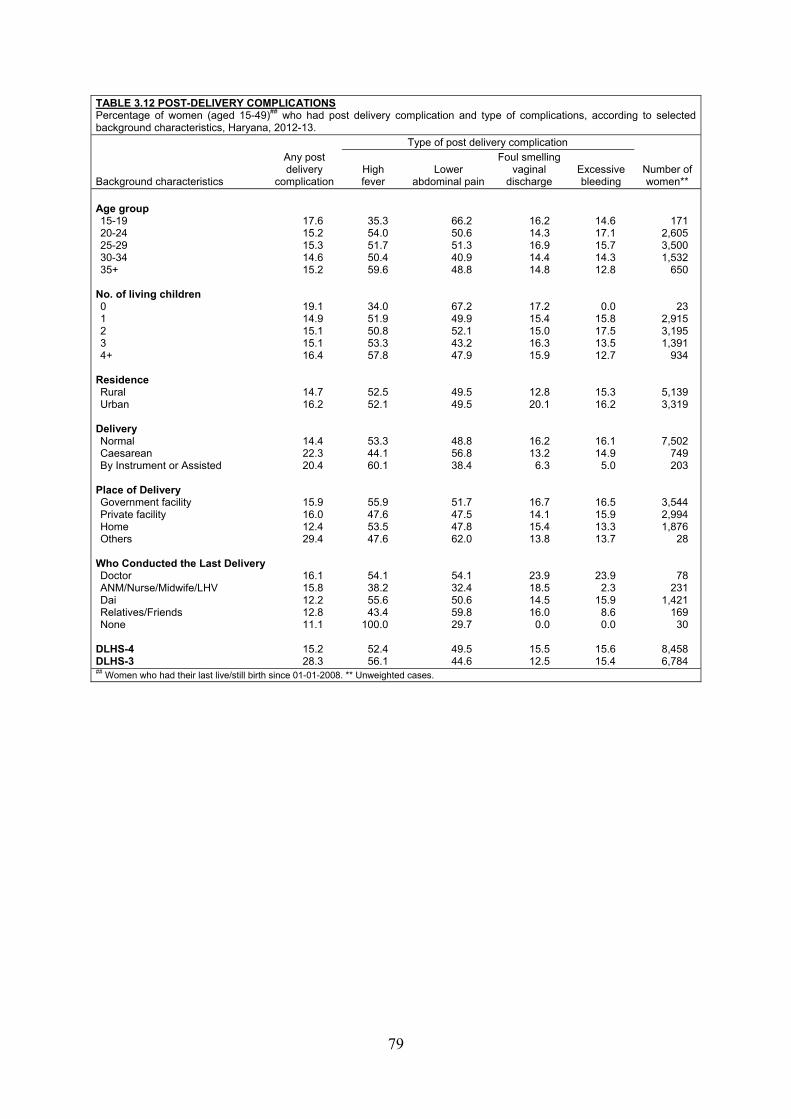
79
TABLE 3.12 POST-DELIVERY COMPLICATIONS Percentage of women (aged 15-49)## who had post delivery complication and type of complications, according to selected background characteristics, Haryana, 2012-13.
Background characteristics
Any post delivery
complication
Type of post delivery complication
Number of women**
High fever
Lower abdominal pain
Foul smelling vaginal
discharge Excessive bleeding
Age group 15-19 20-24 25-29 30-34 35+
No. of living children 0 1 2 3 4+ Residence Rural Urban
Delivery Normal Caesarean By Instrument or Assisted
Place of Delivery Government facility Private facility Home Others
Who Conducted the Last Delivery Doctor ANM/Nurse/Midwife/LHV Dai Relatives/Friends None
DLHS-4 DLHS-3
17.6 15.2 15.3 14.6 15.2
19.1 14.9 15.1 15.1 16.4
14.7 16.2
14.4 22.3 20.4
15.9 16.0 12.4 29.4
16.1 15.8 12.2 12.8 11.1
15.2 28.3
35.3 54.0 51.7 50.4 59.6
34.0 51.9 50.8 53.3 57.8
52.5 52.1
53.3 44.1 60.1
55.9 47.6 53.5 47.6
54.1 38.2 55.6 43.4
100.0
52.4 56.1
66.2 50.6 51.3 40.9 48.8
67.2 49.9 52.1 43.2 47.9
49.5 49.5
48.8 56.8 38.4
51.7 47.5 47.8 62.0
54.1 32.4 50.6 59.8 29.7
49.5 44.6
16.2 14.3 16.9 14.4 14.8
17.2 15.4 15.0 16.3 15.9
12.8 20.1
16.2 13.2
6.3
16.7 14.1 15.4 13.8
23.9 18.5 14.5 16.0
0.0
15.5 12.5
14.6 17.1 15.7 14.3 12.8
0.0 15.8 17.5 13.5 12.7
15.3 16.2
16.1 14.9
5.0
16.5 15.9 13.3 13.7
23.9 2.3
15.9 8.6 0.0
15.6 15.4
171 2,605 3,500 1,532
650
23 2,915 3,195 1,391
934
5,139 3,319
7,502 749 203
3,544 2,994 1,876
28
78 231
1,421 169
30
8,458 6,784
## Women who had their last live/still birth since 01-01-2008. ** Unweighted cases.
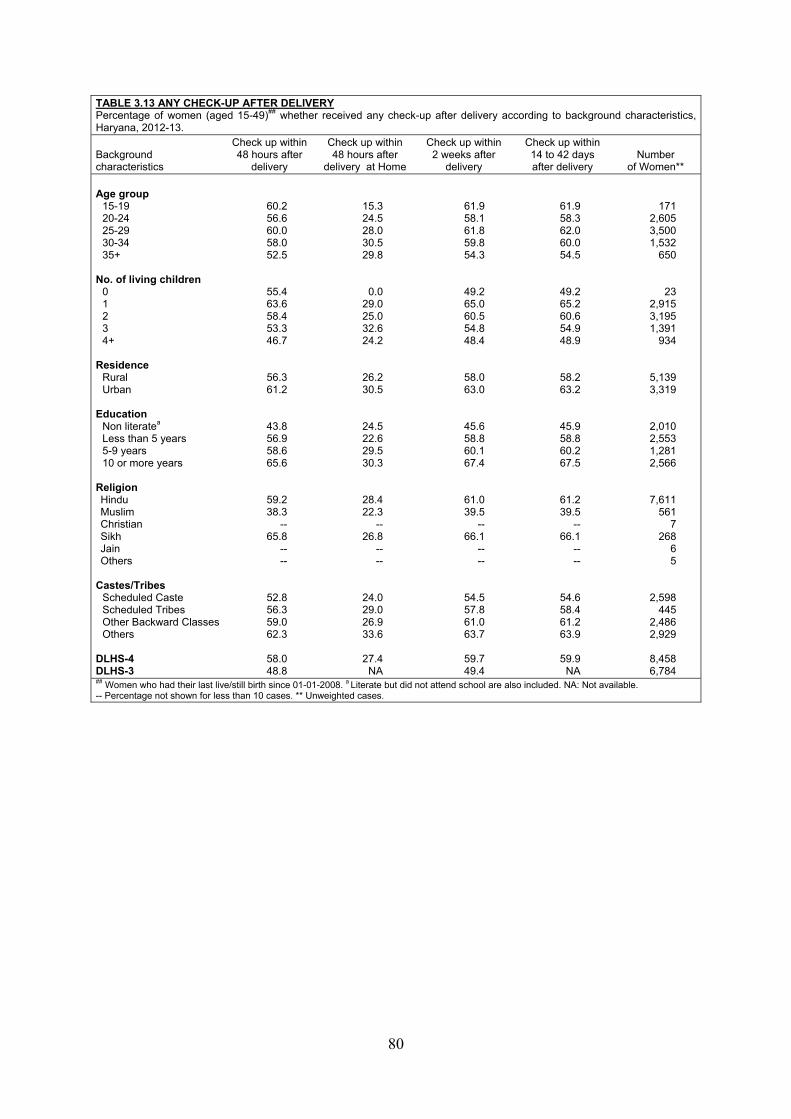
80
TABLE 3.13 ANY CHECK-UP AFTER DELIVERY Percentage of women (aged 15-49)## whether received any check-up after delivery according to background characteristics, Haryana, 2012-13. Background characteristics
Check up within 48 hours after
delivery
Check up within 48 hours after
delivery at Home
Check up within 2 weeks after
delivery
Check up within 14 to 42 days after delivery
Number of Women**
Age group
15-19 20-24 25-29 30-34 35+
No. of living children
0 1 2 3 4+
Residence
Rural Urban
Education
Non literatea Less than 5 years 5-9 years 10 or more years
Religion Hindu Muslim Christian Sikh Jain Others
Castes/Tribes
Scheduled Caste Scheduled Tribes Other Backward Classes Others
DLHS-4 DLHS-3
60.2 56.6 60.0 58.0 52.5
55.4 63.6 58.4 53.3 46.7
56.3 61.2
43.8 56.9 58.6 65.6
59.2 38.3
-- 65.8
-- --
52.8 56.3 59.0 62.3
58.0 48.8
15.3 24.5 28.0 30.5 29.8
0.0 29.0 25.0 32.6 24.2
26.2 30.5
24.5 22.6 29.5 30.3
28.4 22.3
-- 26.8
-- --
24.0 29.0 26.9 33.6
27.4
NA
61.9 58.1 61.8 59.8 54.3
49.2 65.0 60.5 54.8 48.4
58.0 63.0
45.6 58.8 60.1 67.4
61.0 39.5
-- 66.1
-- --
54.5 57.8 61.0 63.7
59.7 49.4
61.9 58.3 62.0 60.0 54.5
49.2 65.2 60.6 54.9 48.9
58.2 63.2
45.9 58.8 60.2 67.5
61.2 39.5
-- 66.1
-- --
54.6 58.4 61.2 63.9
59.9
NA
171 2,605 3,500 1,532
650
23 2,915 3,195 1,391
934
5,139 3,319
2,010 2,553 1,281 2,566
7,611 561
7 268
6 5
2,598 445
2,486 2,929
8,458 6,784
## Women who had their last live/still birth since 01-01-2008. a Literate but did not attend school are also included. NA: Not available. -- Percentage not shown for less than 10 cases. ** Unweighted cases.
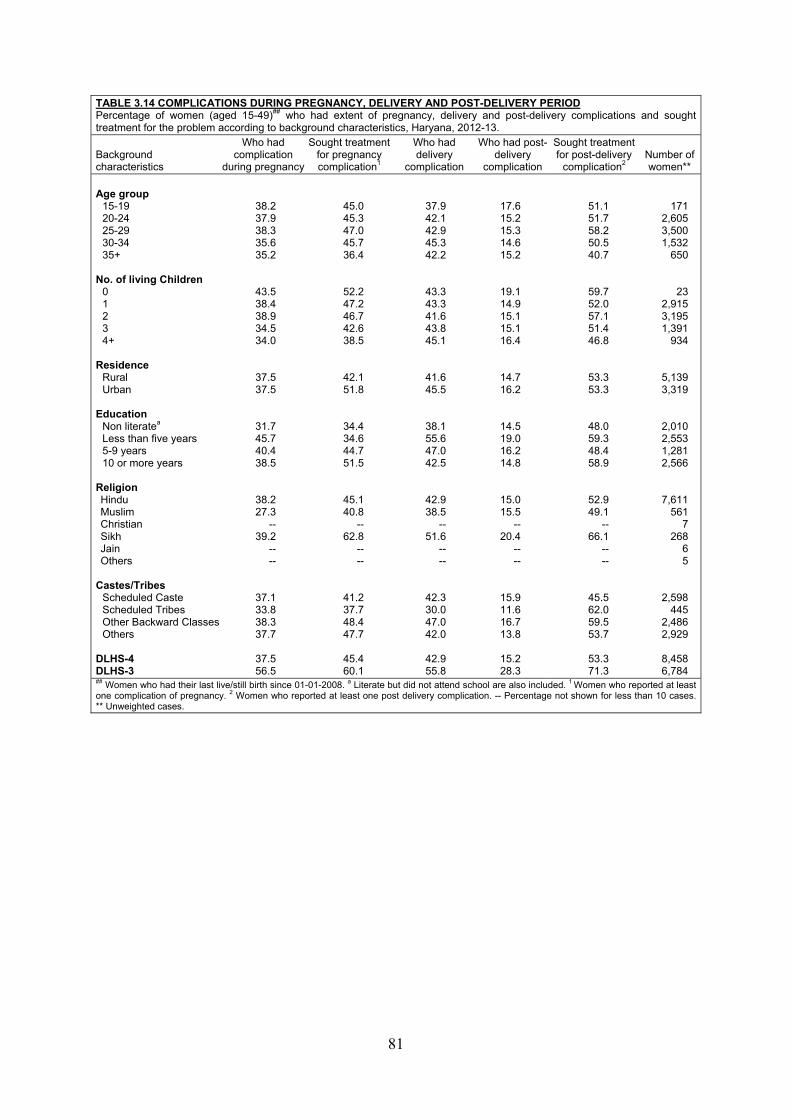
81
TABLE 3.14 COMPLICATIONS DURING PREGNANCY, DELIVERY AND POST-DELIVERY PERIOD Percentage of women (aged 15-49)## who had extent of pregnancy, delivery and post-delivery complications and sought treatment for the problem according to background characteristics, Haryana, 2012-13.
Background characteristics
Who had complication
during pregnancy
Sought treatment for pregnancy complication1
Who had delivery
complication
Who had post-delivery
complication
Sought treatment for post-delivery
complication2 Number of women**
Age group
15-19 20-24 25-29 30-34 35+
No. of living Children
0 1 2 3 4+
Residence
Rural Urban
Education
Non literatea Less than five years 5-9 years 10 or more years
Religion Hindu Muslim Christian Sikh Jain Others
Castes/Tribes
Scheduled Caste Scheduled Tribes Other Backward Classes Others
DLHS-4 DLHS-3
38.2 37.9 38.3 35.6 35.2
43.5 38.4 38.9 34.5 34.0
37.5 37.5
31.7 45.7 40.4 38.5
38.2 27.3
-- 39.2
-- --
37.1 33.8 38.3 37.7
37.5 56.5
45.0 45.3 47.0 45.7 36.4
52.2 47.2 46.7 42.6 38.5
42.1 51.8
34.4 34.6 44.7 51.5
45.1 40.8
-- 62.8
-- --
41.2 37.7 48.4 47.7
45.4 60.1
37.9 42.1 42.9 45.3 42.2
43.3 43.3 41.6 43.8 45.1
41.6 45.5
38.1 55.6 47.0 42.5
42.9 38.5
-- 51.6
-- --
42.3 30.0 47.0 42.0
42.9 55.8
17.6 15.2 15.3 14.6 15.2
19.1 14.9 15.1 15.1 16.4
14.7 16.2
14.5 19.0 16.2 14.8
15.0 15.5
-- 20.4
-- --
15.9 11.6 16.7 13.8
15.2 28.3
51.1 51.7 58.2 50.5 40.7
59.7 52.0 57.1 51.4 46.8
53.3 53.3
48.0 59.3 48.4 58.9
52.9 49.1
-- 66.1
-- --
45.5 62.0 59.5 53.7
53.3 71.3
171 2,605 3,500 1,532
650
23 2,915 3,195 1,391
934
5,139 3,319
2,010 2,553 1,281 2,566
7,611 561
7 268
6 5
2,598 445
2,486 2,929
8,458 6,784
## Women who had their last live/still birth since 01-01-2008. a Literate but did not attend school are also included. 1 Women who reported at least one complication of pregnancy. 2 Women who reported at least one post delivery complication. -- Percentage not shown for less than 10 cases. ** Unweighted cases.
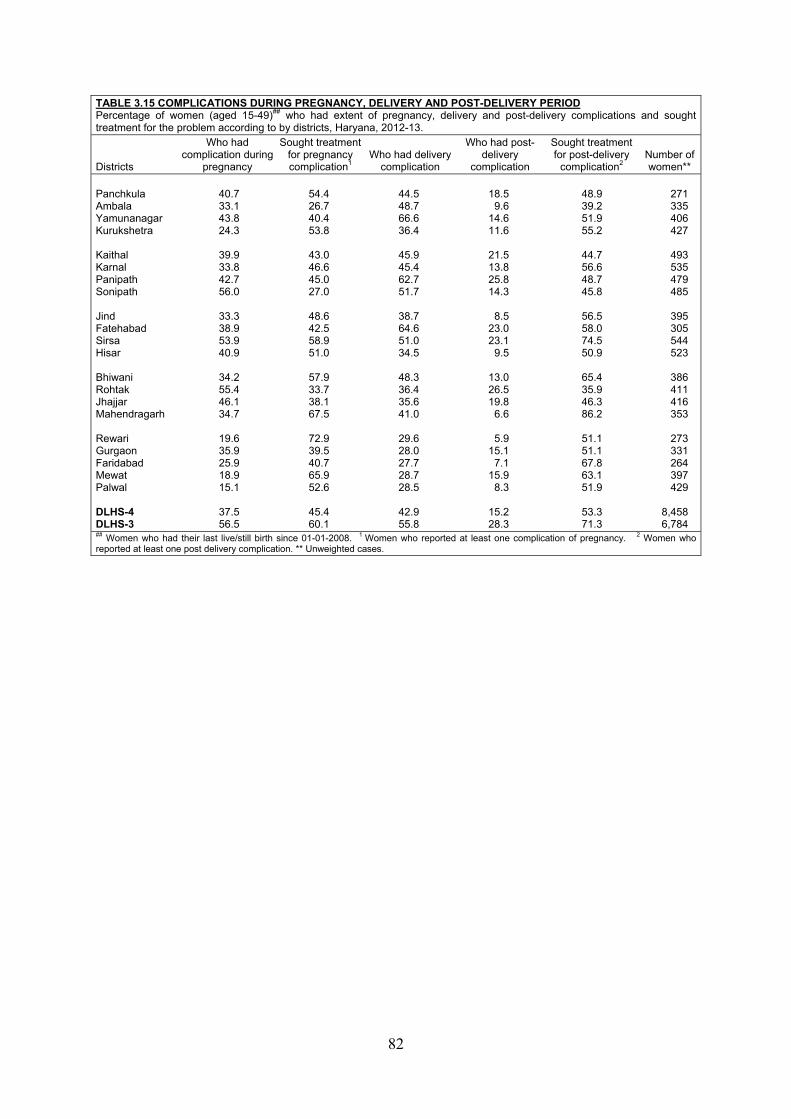
82
TABLE 3.15 COMPLICATIONS DURING PREGNANCY, DELIVERY AND POST-DELIVERY PERIOD Percentage of women (aged 15-49)## who had extent of pregnancy, delivery and post-delivery complications and sought treatment for the problem according to by districts, Haryana, 2012-13.
Districts
Who had complication during
pregnancy
Sought treatment for pregnancy complication1
Who had delivery complication
Who had post- delivery
complication
Sought treatment for post-delivery
complication2 Number of women**
Panchkula Ambala Yamunanagar Kurukshetra Kaithal Karnal Panipath Sonipath Jind Fatehabad Sirsa Hisar Bhiwani Rohtak Jhajjar Mahendragarh Rewari Gurgaon Faridabad Mewat Palwal DLHS-4 DLHS-3
40.7 33.1 43.8 24.3
39.9 33.8 42.7 56.0
33.3 38.9 53.9 40.9
34.2 55.4 46.1 34.7
19.6 35.9 25.9 18.9 15.1
37.5 56.5
54.4 26.7 40.4 53.8
43.0 46.6 45.0 27.0
48.6 42.5 58.9 51.0
57.9 33.7 38.1 67.5
72.9 39.5 40.7 65.9 52.6
45.4 60.1
44.5 48.7 66.6 36.4
45.9 45.4 62.7 51.7
38.7 64.6 51.0 34.5
48.3 36.4 35.6 41.0
29.6 28.0 27.7 28.7 28.5
42.9 55.8
18.5
9.6 14.6 11.6
21.5 13.8 25.8 14.3
8.5
23.0 23.1
9.5
13.0 26.5 19.8
6.6
5.9 15.1
7.1 15.9
8.3
15.2 28.3
48.9 39.2 51.9 55.2
44.7 56.6 48.7 45.8
56.5 58.0 74.5 50.9
65.4 35.9 46.3 86.2
51.1 51.1 67.8 63.1 51.9
53.3 71.3
271 335 406 427
493 535 479 485
395 305 544 523
386 411 416 353
273 331 264 397 429
8,458 6,784
## Women who had their last live/still birth since 01-01-2008. 1 Women who reported at least one complication of pregnancy. 2 Women who reported at least one post delivery complication. ** Unweighted cases.
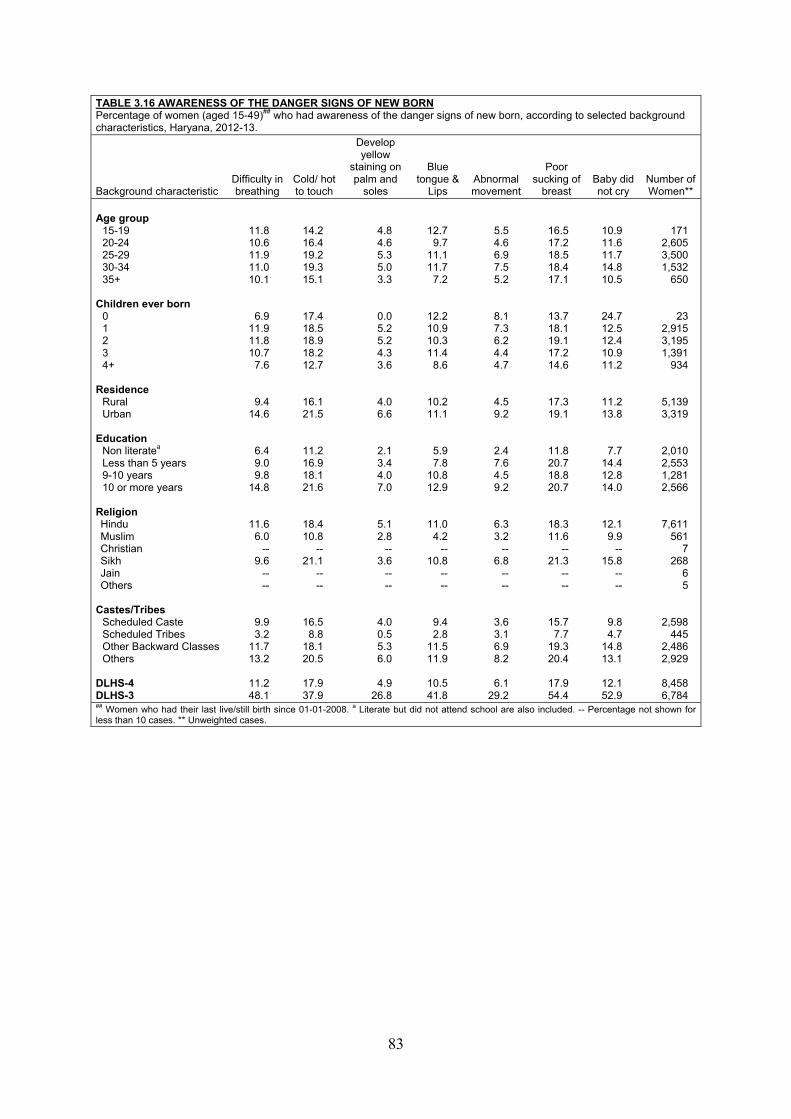
83
TABLE 3.16 AWARENESS OF THE DANGER SIGNS OF NEW BORN Percentage of women (aged 15-49)## who had awareness of the danger signs of new born, according to selected background characteristics, Haryana, 2012-13.
Background characteristic Difficulty in breathing
Cold/ hot to touch
Develop yellow
staining on palm and
soles
Blue tongue &
Lips Abnormal movement
Poor sucking of
breast Baby did not cry
Number of Women**
Age group
15-19 20-24 25-29 30-34 35+
Children ever born
0 1 2 3 4+
Residence
Rural Urban
Education Non literatea Less than 5 years 9-10 years 10 or more years
Religion Hindu Muslim Christian Sikh Jain Others
Castes/Tribes
Scheduled Caste Scheduled Tribes Other Backward Classes Others
DLHS-4 DLHS-3
11.8 10.6 11.9 11.0 10.1
6.9 11.9 11.8 10.7
7.6
9.4 14.6
6.4 9.0 9.8
14.8
11.6 6.0
-- 9.6
-- --
9.9 3.2
11.7 13.2
11.2 48.1
14.2 16.4 19.2 19.3 15.1
17.4 18.5 18.9 18.2 12.7
16.1 21.5
11.2 16.9 18.1 21.6
18.4 10.8
-- 21.1
-- --
16.5 8.8
18.1 20.5
17.9 37.9
4.8 4.6 5.3 5.0 3.3
0.0 5.2 5.2 4.3 3.6
4.0 6.6
2.1 3.4 4.0 7.0
5.1 2.8
-- 3.6
-- --
4.0 0.5 5.3 6.0
4.9
26.8
12.7 9.7
11.1 11.7
7.2
12.2 10.9 10.3 11.4
8.6
10.2 11.1
5.9 7.8
10.8 12.9
11.0 4.2
-- 10.8
-- --
9.4 2.8
11.5 11.9
10.5 41.8
5.5 4.6 6.9 7.5 5.2
8.1 7.3 6.2 4.4 4.7
4.5 9.2
2.4 7.6 4.5 9.2
6.3 3.2
-- 6.8
-- --
3.6 3.1 6.9 8.2
6.1
29.2
16.5 17.2 18.5 18.4 17.1
13.7 18.1 19.1 17.2 14.6
17.3 19.1
11.8 20.7 18.8 20.7
18.3 11.6
-- 21.3
-- --
15.7 7.7
19.3 20.4
17.9 54.4
10.9 11.6 11.7 14.8 10.5
24.7 12.5 12.4 10.9 11.2
11.2 13.8
7.7 14.4 12.8 14.0
12.1 9.9
-- 15.8
-- --
9.8 4.7
14.8 13.1
12.1 52.9
171 2,605 3,500 1,532
650
23 2,915 3,195 1,391
934
5,139 3,319
2,010 2,553 1,281 2,566
7,611 561
7 268
6 5
2,598 445
2,486 2,929
8,458 6,784
## Women who had their last live/still birth since 01-01-2008. a Literate but did not attend school are also included. -- Percentage not shown for less than 10 cases. ** Unweighted cases.

CHILD HEALTH CARE AND IMMUNIZATION

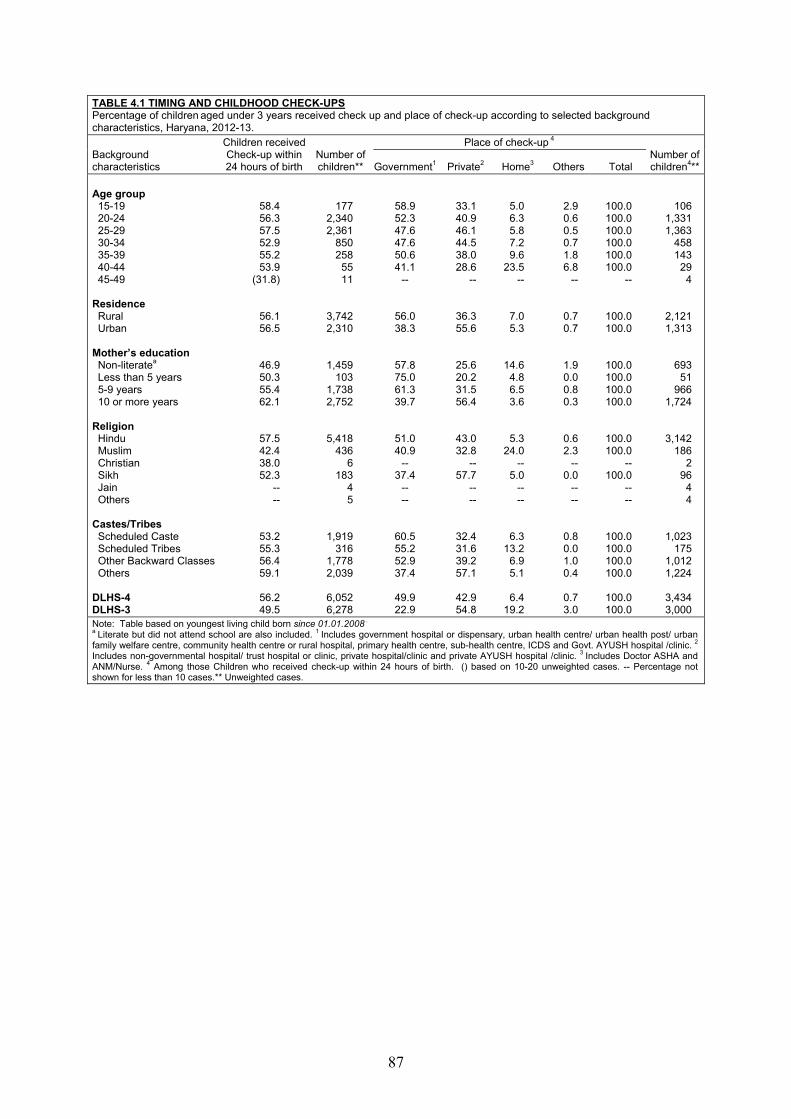
87
TABLE 4.1 TIMING AND CHILDHOOD CHECK-UPS Percentage of children aged under 3 years received check up and place of check-up according to selected background characteristics, Haryana, 2012-13.
Background characteristics
Children received Check-up within 24 hours of birth
Number of children**
Place of check-up 4 Number ofchildren4**Government1 Private2 Home3 Others Total
Age group 15-19 20-24 25-29 30-34 35-39 40-44 45-49
Residence Rural Urban
Mother’s education Non-literatea Less than 5 years 5-9 years 10 or more years
Religion Hindu Muslim Christian Sikh Jain Others
Castes/Tribes Scheduled Caste Scheduled Tribes Other Backward Classes Others
DLHS-4 DLHS-3
58.4 56.3 57.5 52.9 55.2 53.9
(31.8)
56.1 56.5
46.9 50.3 55.4 62.1
57.5 42.4 38.0 52.3
-- --
53.2 55.3 56.4 59.1
56.2 49.5
177 2,340 2,361
850 258
55 11
3,742 2,310
1,459 103
1,738 2,752
5,418 436
6 183
4 5
1,919 316
1,778 2,039
6,052 6,278
58.9 52.3 47.6 47.6 50.6 41.1
--
56.0 38.3
57.8 75.0 61.3 39.7
51.0 40.9
-- 37.4
-- --
60.5 55.2 52.9 37.4
49.9 22.9
33.1 40.9 46.1 44.5 38.0 28.6
--
36.3 55.6
25.6 20.2 31.5 56.4
43.0 32.8
-- 57.7
-- --
32.4 31.6 39.2 57.1
42.9 54.8
5.0 6.3 5.8 7.2 9.6
23.5 --
7.0 5.3
14.6 4.8 6.5 3.6
5.3 24.0
-- 5.0
-- --
6.3 13.2
6.9 5.1
6.4
19.2
2.9 0.6 0.5 0.7 1.8 6.8
--
0.7 0.7
1.9 0.0 0.8 0.3
0.6 2.3
-- 0.0
-- --
0.8 0.0 1.0 0.4
0.7 3.0
100.0 100.0 100.0 100.0 100.0 100.0
--
100.0 100.0
100.0 100.0 100.0 100.0
100.0 100.0
-- 100.0
-- --
100.0 100.0 100.0 100.0
100.0 100.0
106 1,331 1,363
458 143
29 4
2,121 1,313
693 51
966 1,724
3,142 186
2 96
4 4
1,023 175
1,012 1,224
3,434 3,000
Note: Table based on youngest living child born since 01.01.2008 .
a Literate but did not attend school are also included. 1 Includes government hospital or dispensary, urban health centre/ urban health post/ urban family welfare centre, community health centre or rural hospital, primary health centre, sub-health centre, ICDS and Govt. AYUSH hospital /clinic. 2
Includes non-governmental hospital/ trust hospital or clinic, private hospital/clinic and private AYUSH hospital /clinic. 3 Includes Doctor ASHA and ANM/Nurse. 4 Among those Children who received check-up within 24 hours of birth. () based on 10-20 unweighted cases. -- Percentage not shown for less than 10 cases.** Unweighted cases.
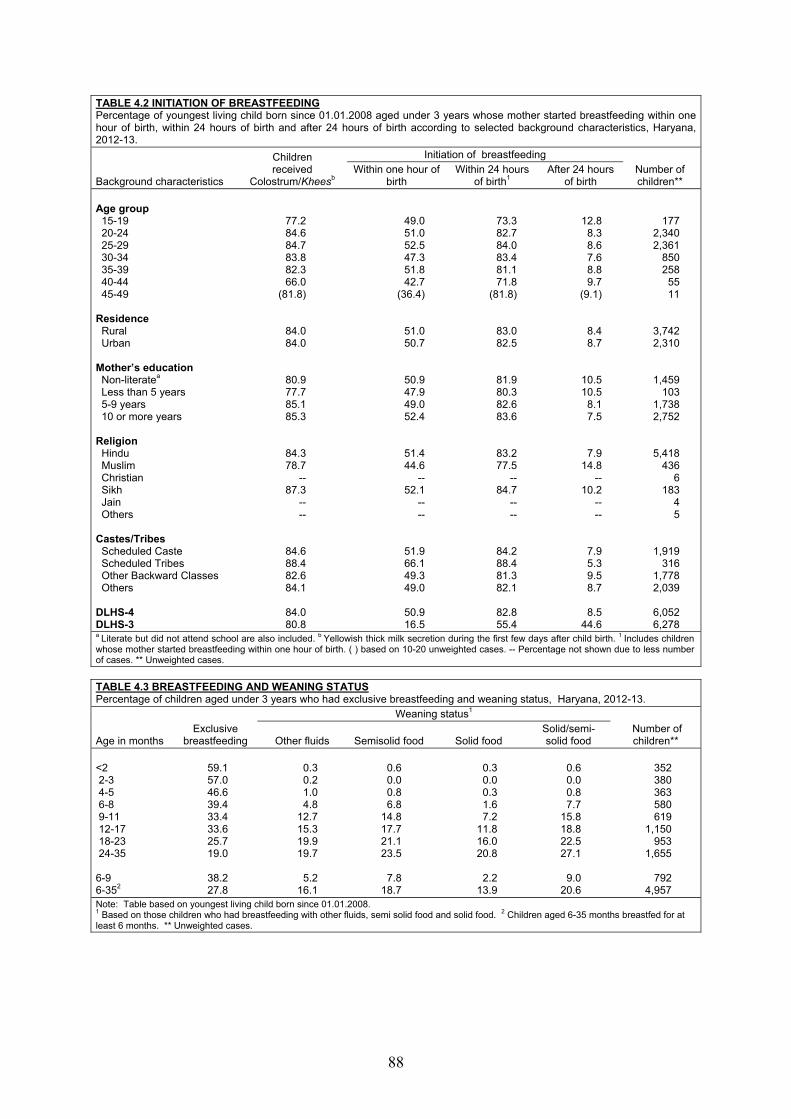
88
TABLE 4.2 INITIATION OF BREASTFEEDING Percentage of youngest living child born since 01.01.2008 aged under 3 years whose mother started breastfeeding within one hour of birth, within 24 hours of birth and after 24 hours of birth according to selected background characteristics, Haryana, 2012-13.
Background characteristics
Children received
Colostrum/Kheesb
Initiation of breastfeeding Number of children**
Within one hour of birth
Within 24 hours of birth1
After 24 hours of birth
Age group 15-19 20-24 25-29 30-34 35-39 40-44 45-49
Residence Rural Urban
Mother’s education Non-literatea Less than 5 years 5-9 years 10 or more years
Religion Hindu Muslim Christian Sikh Jain Others
Castes/Tribes Scheduled Caste Scheduled Tribes Other Backward Classes Others
DLHS-4 DLHS-3
77.2 84.6 84.7 83.8 82.3 66.0
(81.8)
84.0 84.0
80.9 77.7 85.1 85.3
84.3 78.7
-- 87.3
-- --
84.6 88.4 82.6 84.1
84.0 80.8
49.0 51.0 52.5 47.3 51.8 42.7
(36.4)
51.0 50.7
50.9 47.9 49.0 52.4
51.4 44.6
-- 52.1
-- --
51.9 66.1 49.3 49.0
50.9 16.5
73.3 82.7 84.0 83.4 81.1 71.8
(81.8)
83.0 82.5
81.9 80.3 82.6 83.6
83.2 77.5
-- 84.7
-- --
84.2 88.4 81.3 82.1
82.8 55.4
12.8 8.3 8.6 7.6 8.8 9.7
(9.1)
8.4 8.7
10.5 10.5
8.1 7.5
7.9 14.8
-- 10.2
-- --
7.9 5.3 9.5 8.7
8.5
44.6
177 2,340 2,361
850 258
55 11
3,742 2,310
1,459 103
1,738 2,752
5,418 436
6 183
4 5
1,919 316
1,778 2,039
6,052 6,278
a Literate but did not attend school are also included. b Yellowish thick milk secretion during the first few days after child birth. 1 Includes children whose mother started breastfeeding within one hour of birth. ( ) based on 10-20 unweighted cases. -- Percentage not shown due to less number of cases. ** Unweighted cases.
TABLE 4.3 BREASTFEEDING AND WEANING STATUS Percentage of children aged under 3 years who had exclusive breastfeeding and weaning status, Haryana, 2012-13.
Age in months Exclusive
breastfeeding
Weaning status1 Number of children** Other fluids Semisolid food Solid food
Solid/semi-solid food
<2 2-3 4-5 6-8 9-11 12-17 18-23 24-35 6-9 6-352
59.1 57.0 46.6 39.4 33.4 33.6 25.7 19.0
38.2 27.8
0.3 0.2 1.0 4.8
12.7 15.3 19.9 19.7
5.2
16.1
0.6 0.0 0.8 6.8
14.8 17.7 21.1 23.5
7.8
18.7
0.3 0.0 0.3 1.6 7.2
11.8 16.0 20.8
2.2
13.9
0.6 0.0 0.8 7.7
15.8 18.8 22.5 27.1
9.0
20.6
352 380 363 580 619
1,150 953
1,655
792 4,957
Note: Table based on youngest living child born since 01.01.2008. 1 Based on those children who had breastfeeding with other fluids, semi solid food and solid food. 2 Children aged 6-35 months breastfed for at least 6 months. ** Unweighted cases.
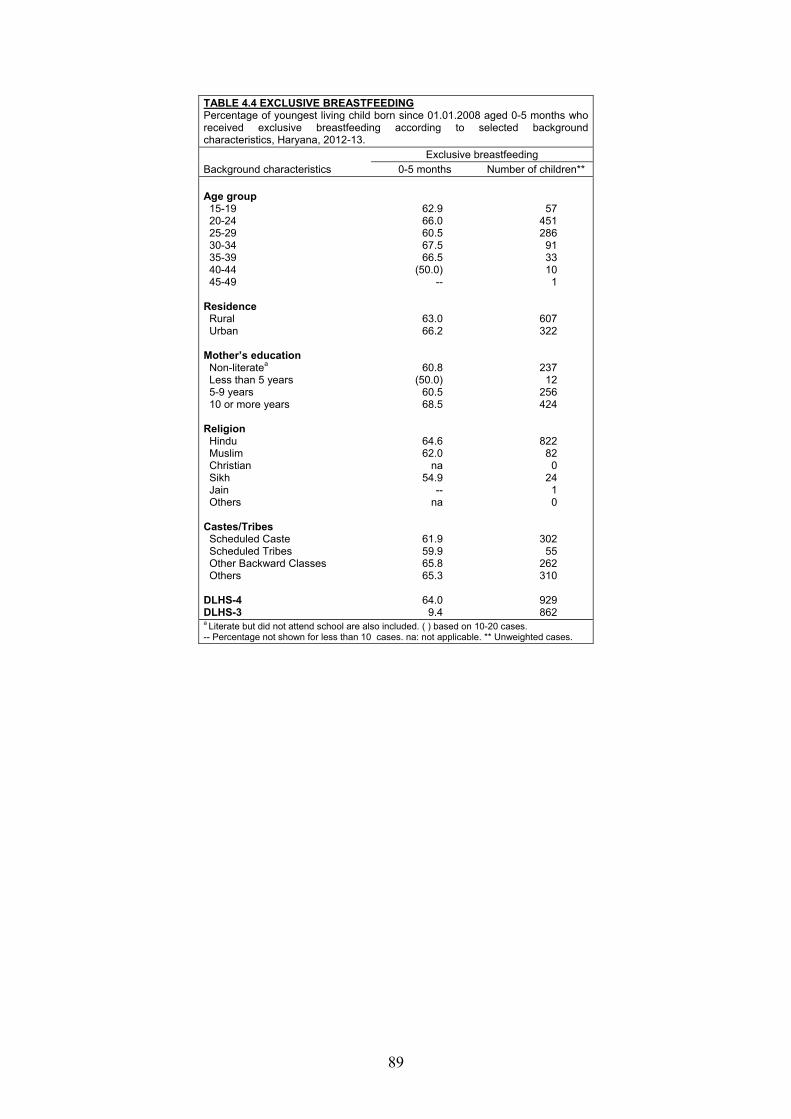
89
TABLE 4.4 EXCLUSIVE BREASTFEEDING Percentage of youngest living child born since 01.01.2008 aged 0-5 months who received exclusive breastfeeding according to selected background characteristics, Haryana, 2012-13.
Background characteristics Exclusive breastfeeding
0-5 months Number of children** Age group 15-19 20-24 25-29 30-34 35-39 40-44 45-49
Residence Rural Urban
Mother’s education Non-literatea Less than 5 years 5-9 years 10 or more years
Religion Hindu Muslim Christian Sikh Jain Others
Castes/Tribes Scheduled Caste Scheduled Tribes Other Backward Classes Others
DLHS-4 DLHS-3
62.9 66.0 60.5 67.5 66.5
(50.0) --
63.0 66.2
60.8 (50.0)
60.5 68.5
64.6 62.0
na 54.9
-- na
61.9 59.9 65.8 65.3
64.0
9.4
57 451 286
91 33 10
1
607 322
237 12
256 424
822 82
0 24
1 0
302 55
262 310
929 862
a Literate but did not attend school are also included. ( ) based on 10-20 cases. -- Percentage not shown for less than 10 cases. na: not applicable. ** Unweighted cases.
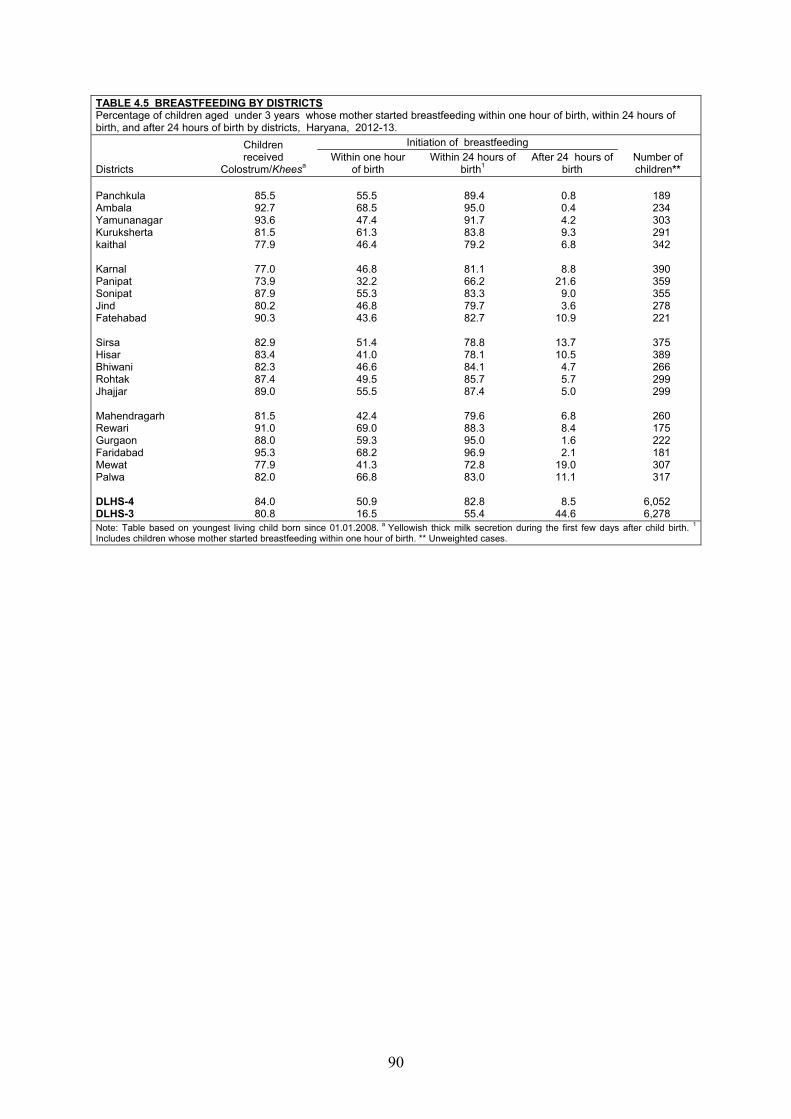
90
TABLE 4.5 BREASTFEEDING BY DISTRICTS Percentage of children aged under 3 years whose mother started breastfeeding within one hour of birth, within 24 hours of birth, and after 24 hours of birth by districts, Haryana, 2012-13.
Districts
Children received
Colostrum/Kheesa
Initiation of breastfeeding Number of children**
Within one hour of birth
Within 24 hours of birth1
After 24 hours of birth
Panchkula Ambala Yamunanagar Kuruksherta kaithal Karnal Panipat Sonipat Jind Fatehabad Sirsa Hisar Bhiwani Rohtak Jhajjar Mahendragarh Rewari Gurgaon Faridabad Mewat Palwa DLHS-4 DLHS-3
85.5 92.7 93.6 81.5 77.9
77.0 73.9 87.9 80.2 90.3
82.9 83.4 82.3 87.4 89.0
81.5 91.0 88.0 95.3 77.9 82.0
84.0 80.8
55.5 68.5 47.4 61.3 46.4
46.8 32.2 55.3 46.8 43.6
51.4 41.0 46.6 49.5 55.5
42.4 69.0 59.3 68.2 41.3 66.8
50.9 16.5
89.4 95.0 91.7 83.8 79.2
81.1 66.2 83.3 79.7 82.7
78.8 78.1 84.1 85.7 87.4
79.6 88.3 95.0 96.9 72.8 83.0
82.8 55.4
0.8 0.4 4.2 9.3 6.8
8.8
21.6 9.0 3.6
10.9
13.7 10.5
4.7 5.7 5.0
6.8 8.4 1.6 2.1
19.0 11.1
8.5
44.6
189 234 303 291 342
390 359 355 278 221
375 389 266 299 299
260 175 222 181 307 317
6,052 6,278
Note: Table based on youngest living child born since 01.01.2008. a Yellowish thick milk secretion during the first few days after child birth. 1
Includes children whose mother started breastfeeding within one hour of birth. ** Unweighted cases.
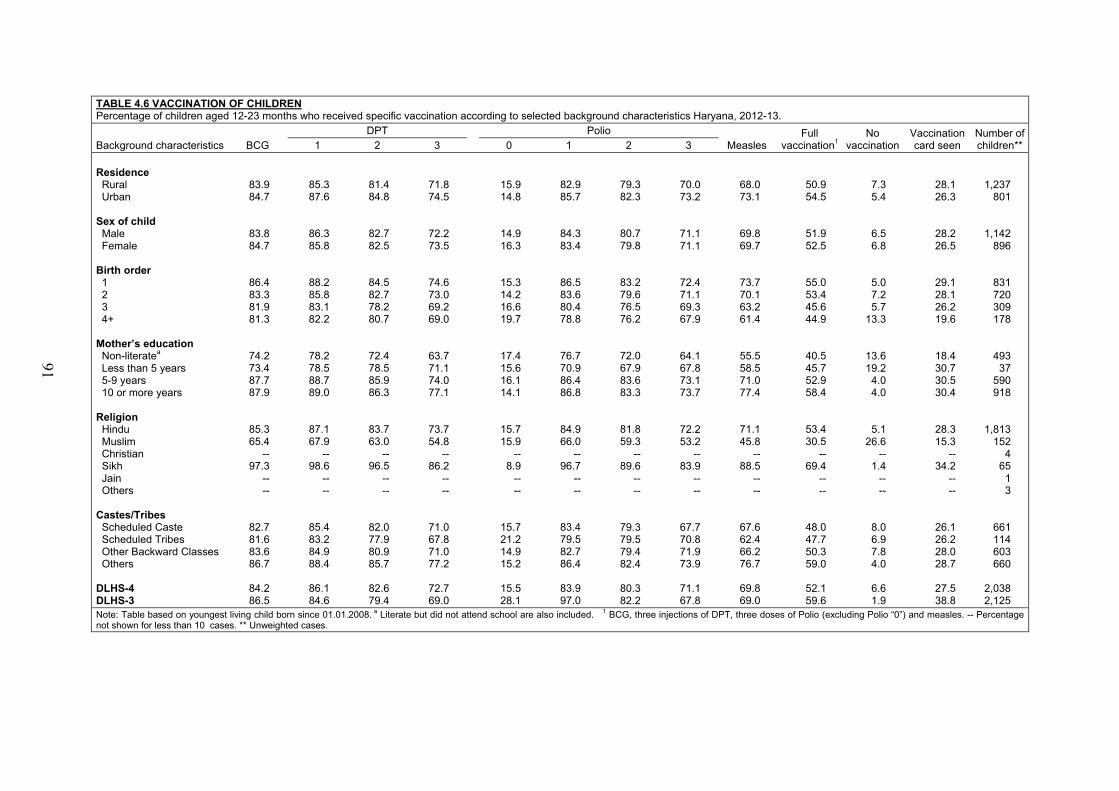
91
TABLE 4.6 VACCINATION OF CHILDREN Percentage of children aged 12-23 months who received specific vaccination according to selected background characteristics Haryana, 2012-13.
Background characteristics BCG DPT Polio
Measles Full
vaccination1 No
vaccinationVaccination card seen
Number of children** 1 2 3 0 1 2 3
Residence Rural Urban
Sex of child Male Female
Birth order 1 2 3 4+
Mother’s education Non-literatea Less than 5 years 5-9 years 10 or more years
Religion Hindu Muslim Christian Sikh Jain Others
Castes/Tribes Scheduled Caste Scheduled Tribes Other Backward Classes Others
DLHS-4 DLHS-3
83.9 84.7
83.8 84.7
86.4 83.3 81.9 81.3
74.2 73.4 87.7 87.9
85.3 65.4
-- 97.3
-- --
82.7 81.6 83.6 86.7
84.2 86.5
85.3 87.6
86.3 85.8
88.2 85.8 83.1 82.2
78.2 78.5 88.7 89.0
87.1 67.9
-- 98.6
-- --
85.4 83.2 84.9 88.4
86.1 84.6
81.4 84.8
82.7 82.5
84.5 82.7 78.2 80.7
72.4 78.5 85.9 86.3
83.7 63.0
-- 96.5
-- --
82.0 77.9 80.9 85.7
82.6 79.4
71.8 74.5
72.2 73.5
74.6 73.0 69.2 69.0
63.7 71.1 74.0 77.1
73.7 54.8
-- 86.2
-- --
71.0 67.8 71.0 77.2
72.7 69.0
15.9 14.8
14.9 16.3
15.3 14.2 16.6 19.7
17.4 15.6 16.1 14.1
15.7 15.9
-- 8.9
-- --
15.7 21.2 14.9 15.2
15.5 28.1
82.9 85.7
84.3 83.4
86.5 83.6 80.4 78.8
76.7 70.9 86.4 86.8
84.9 66.0
-- 96.7
-- --
83.4 79.5 82.7 86.4
83.9 97.0
79.3 82.3
80.7 79.8
83.2 79.6 76.5 76.2
72.0 67.9 83.6 83.3
81.8 59.3
-- 89.6
-- --
79.3 79.5 79.4 82.4
80.3 82.2
70.0 73.2
71.1 71.1
72.4 71.1 69.3 67.9
64.1 67.8 73.1 73.7
72.2 53.2
-- 83.9
-- --
67.7 70.8 71.9 73.9
71.1 67.8
68.0 73.1
69.8 69.7
73.7 70.1 63.2 61.4
55.5 58.5 71.0 77.4
71.1 45.8
-- 88.5
-- --
67.6 62.4 66.2 76.7
69.8 69.0
50.9 54.5
51.9 52.5
55.0 53.4 45.6 44.9
40.5 45.7 52.9 58.4
53.4 30.5
-- 69.4
-- --
48.0 47.7 50.3 59.0
52.1 59.6
7.3 5.4
6.5 6.8
5.0 7.2 5.7
13.3
13.6 19.2 4.0 4.0
5.1 26.6
-- 1.4
-- --
8.0 6.9 7.8 4.0
6.6 1.9
28.1 26.3
28.2 26.5
29.1 28.1 26.2 19.6
18.4 30.7 30.5 30.4
28.3 15.3
-- 34.2
-- --
26.1 26.2 28.0 28.7
27.5 38.8
1,237 801
1,142 896
831 720 309 178
493 37
590 918
1,813 152
4 65 1 3
661 114 603 660
2,038 2,125
Note: Table based on youngest living child born since 01.01.2008. a Literate but did not attend school are also included. 1 BCG, three injections of DPT, three doses of Polio (excluding Polio “0”) and measles. -- Percentage not shown for less than 10 cases. ** Unweighted cases.
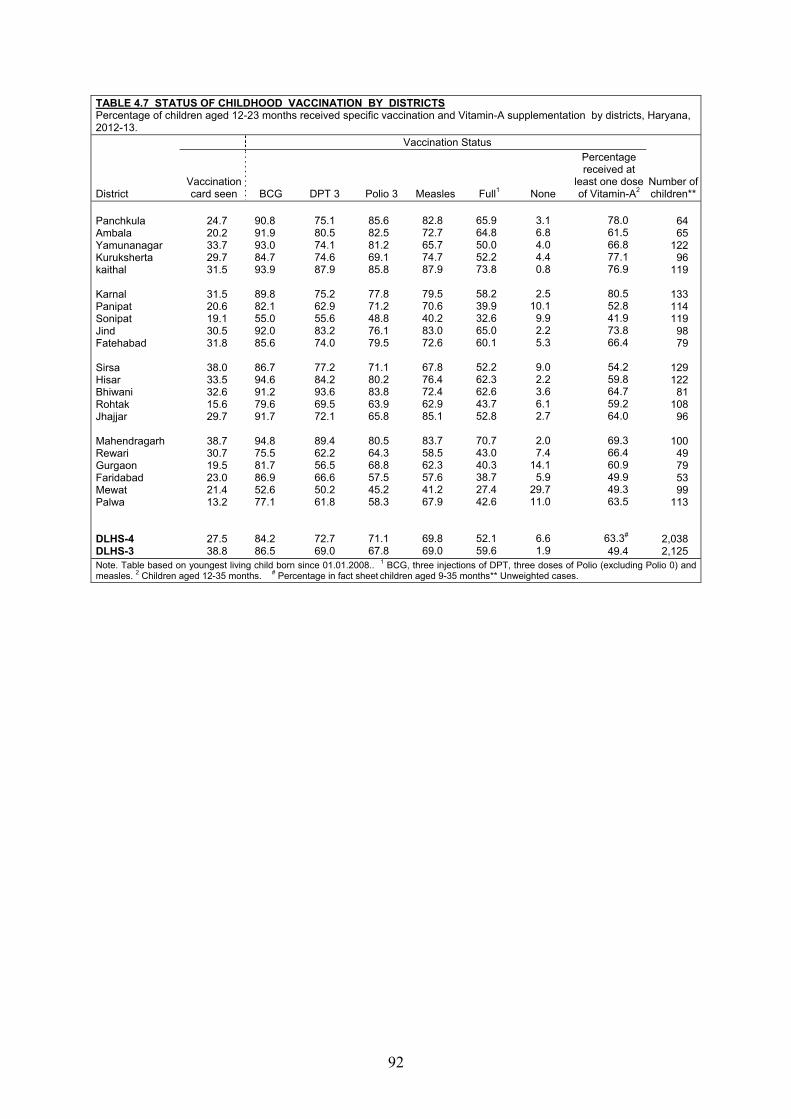
92
TABLE 4.7 STATUS OF CHILDHOOD VACCINATION BY DISTRICTS Percentage of children aged 12-23 months received specific vaccination and Vitamin-A supplementation by districts, Haryana, 2012-13.
District
Vaccination Status
Number ofchildren**
Vaccination card seen BCG DPT 3 Polio 3 Measles Full1 None
Percentage received at
least one dose of Vitamin-A2
Panchkula Ambala Yamunanagar Kuruksherta kaithal
Karnal Panipat Sonipat Jind Fatehabad
Sirsa Hisar Bhiwani Rohtak Jhajjar
Mahendragarh Rewari Gurgaon Faridabad Mewat Palwa
DLHS-4 DLHS-3
24.7 20.2 33.7 29.7 31.5
31.5 20.6 19.1 30.5 31.8
38.0 33.5 32.6 15.6 29.7
38.7 30.7 19.5 23.0 21.4 13.2
27.5 38.8
90.8 91.9 93.0 84.7 93.9
89.8 82.1 55.0 92.0 85.6
86.7 94.6 91.2 79.6 91.7
94.8 75.5 81.7 86.9 52.6 77.1
84.2 86.5
75.1 80.5 74.1 74.6 87.9
75.2 62.9 55.6 83.2 74.0
77.2 84.2 93.6 69.5 72.1
89.4 62.2 56.5 66.6 50.2 61.8
72.7 69.0
85.6 82.5 81.2 69.1 85.8
77.8 71.2 48.8 76.1 79.5
71.1 80.2 83.8 63.9 65.8
80.5 64.3 68.8 57.5 45.2 58.3
71.1 67.8
82.8 72.7 65.7 74.7 87.9
79.5 70.6 40.2 83.0 72.6
67.8 76.4 72.4 62.9 85.1
83.7 58.5 62.3 57.6 41.2 67.9
69.8 69.0
65.9 64.8 50.0 52.2 73.8
58.2 39.9 32.6 65.0 60.1
52.2 62.3 62.6 43.7 52.8
70.7 43.0 40.3 38.7 27.4 42.6
52.1 59.6
3.1 6.8 4.0 4.4 0.8
2.5 10.1 9.9 2.2 5.3
9.0 2.2 3.6 6.1 2.7
2.0 7.4
14.1 5.9
29.7 11.0
6.6 1.9
78.0 61.5 66.8 77.1 76.9
80.5 52.8 41.9 73.8 66.4
54.2 59.8 64.7 59.2 64.0
69.3 66.4 60.9 49.9 49.3 63.5
63.3# 49.4
64 65
122 96
119
133 114 119 98 79
129 122 81
108 96
100 49 79 53 99
113
2,038 2,125
Note. Table based on youngest living child born since 01.01.2008.. 1 BCG, three injections of DPT, three doses of Polio (excluding Polio 0) and measles. 2 Children aged 12-35 months. # Percentage in fact sheet children aged 9-35 months** Unweighted cases.
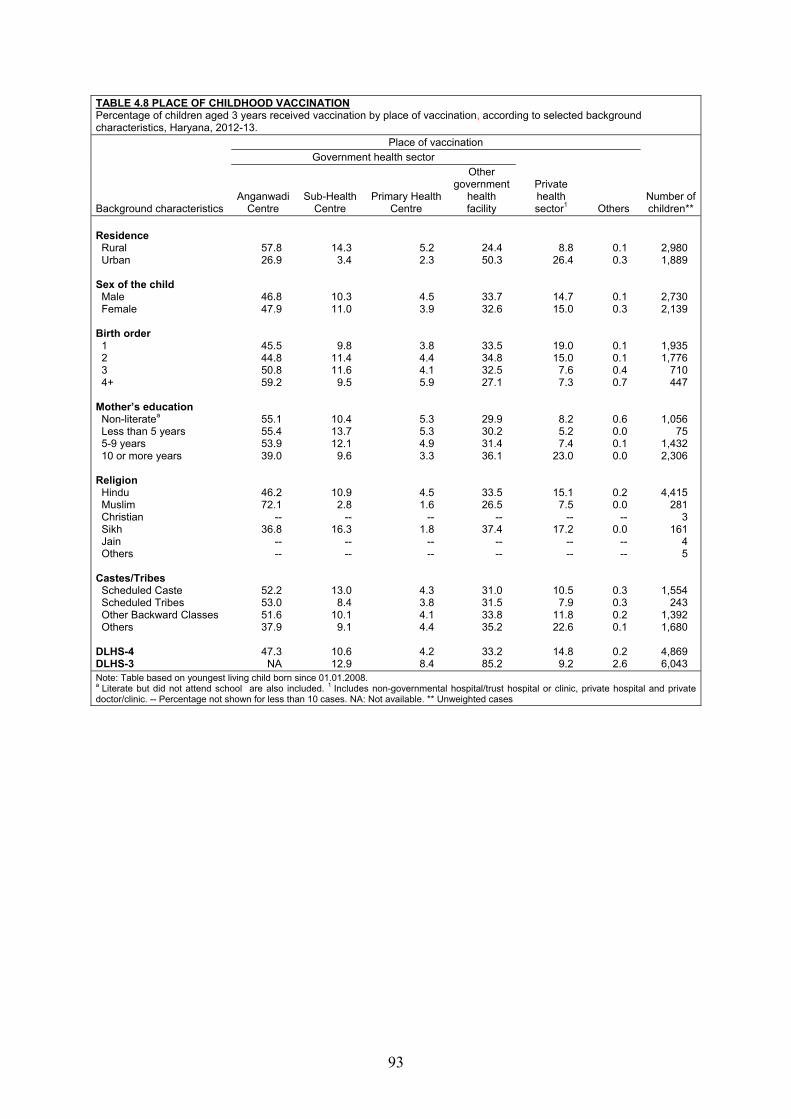
93
TABLE 4.8 PLACE OF CHILDHOOD VACCINATION Percentage of children aged 3 years received vaccination by place of vaccination, according to selected background characteristics, Haryana, 2012-13.
Background characteristics
Place of vaccination
Number of children**
Government health sector
Private health sector1 Others
Anganwadi Centre
Sub-Health Centre
Primary Health Centre
Other government
health facility
Residence Rural Urban
Sex of the child Male Female
Birth order 1 2 3 4+
Mother’s education Non-literatea Less than 5 years 5-9 years 10 or more years
Religion Hindu Muslim Christian Sikh Jain Others
Castes/Tribes Scheduled Caste Scheduled Tribes Other Backward Classes Others
DLHS-4 DLHS-3
57.8 26.9
46.8 47.9
45.5 44.8 50.8 59.2
55.1 55.4 53.9 39.0
46.2 72.1
-- 36.8
-- --
52.2 53.0 51.6 37.9
47.3
NA
14.3 3.4
10.3 11.0
9.8 11.4 11.6
9.5
10.4 13.7 12.1
9.6
10.9 2.8
-- 16.3
-- --
13.0 8.4
10.1 9.1
10.6 12.9
5.2 2.3
4.5 3.9
3.8 4.4 4.1 5.9
5.3 5.3 4.9 3.3
4.5 1.6
-- 1.8
-- --
4.3 3.8 4.1 4.4
4.2 8.4
24.4 50.3
33.7 32.6
33.5 34.8 32.5 27.1
29.9 30.2 31.4 36.1
33.5 26.5
-- 37.4
-- --
31.0 31.5 33.8 35.2
33.2 85.2
8.8 26.4
14.7 15.0
19.0 15.0
7.6 7.3
8.2 5.2 7.4
23.0
15.1 7.5
-- 17.2
-- --
10.5 7.9
11.8 22.6
14.8
9.2
0.1 0.3
0.1 0.3
0.1 0.1 0.4 0.7
0.6 0.0 0.1 0.0
0.2 0.0
-- 0.0
-- --
0.3 0.3 0.2 0.1
0.2 2.6
2,980 1,889
2,730 2,139
1,935 1,776
710 447
1,056 75
1,432 2,306
4,415 281
3 161
4 5
1,554 243
1,392 1,680
4,869 6,043
Note: Table based on youngest living child born since 01.01.2008. a Literate but did not attend school are also included. 1 Includes non-governmental hospital/trust hospital or clinic, private hospital and private doctor/clinic. -- Percentage not shown for less than 10 cases. NA: Not available. ** Unweighted cases
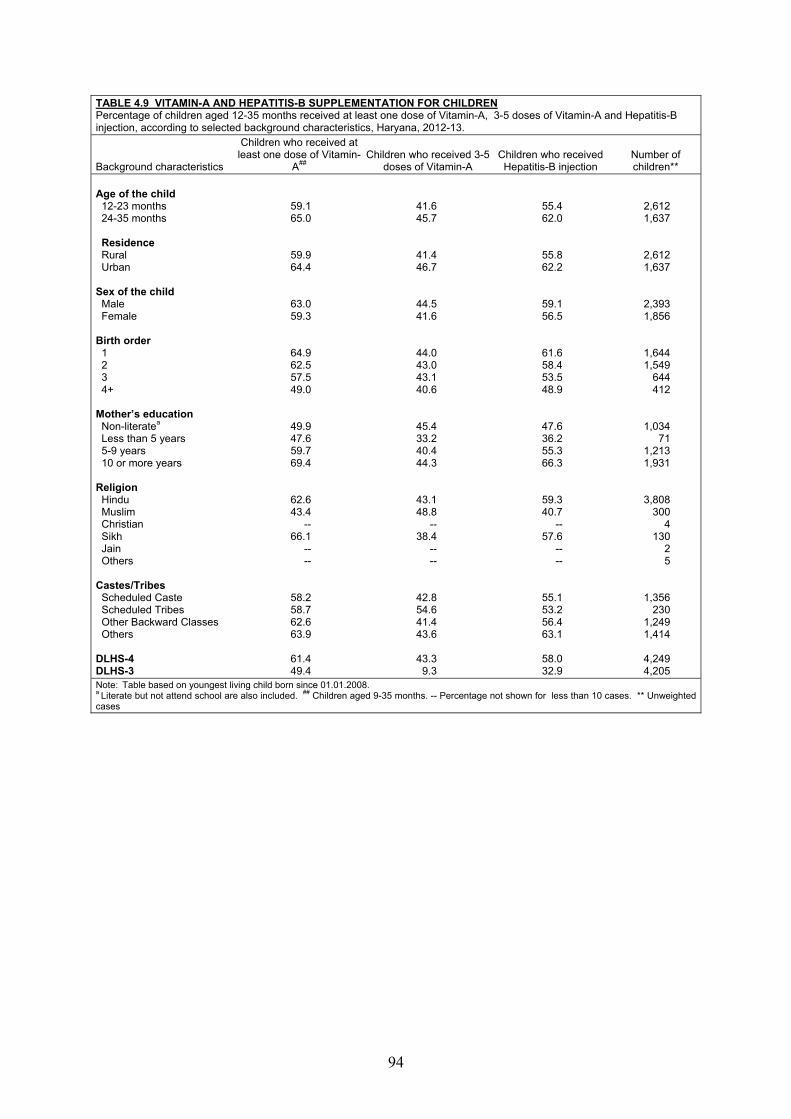
94
TABLE 4.9 VITAMIN-A AND HEPATITIS-B SUPPLEMENTATION FOR CHILDREN Percentage of children aged 12-35 months received at least one dose of Vitamin-A, 3-5 doses of Vitamin-A and Hepatitis-B injection, according to selected background characteristics, Haryana, 2012-13.
Background characteristics
Children who received at least one dose of Vitamin-
A## Children who received 3-5
doses of Vitamin-A Children who received Hepatitis-B injection
Number of children**
Age of the child 12-23 months 24-35 months Residence Rural Urban
Sex of the child Male Female
Birth order 1 2 3 4+
Mother’s education Non-literatea Less than 5 years 5-9 years 10 or more years
Religion Hindu Muslim Christian Sikh Jain Others
Castes/Tribes Scheduled Caste Scheduled Tribes Other Backward Classes Others
DLHS-4 DLHS-3
59.1 65.0
59.9 64.4
63.0 59.3
64.9 62.5 57.5 49.0
49.9 47.6 59.7 69.4
62.6 43.4
-- 66.1
-- --
58.2 58.7 62.6 63.9
61.4 49.4
41.6 45.7
41.4 46.7
44.5 41.6
44.0 43.0 43.1 40.6
45.4 33.2 40.4 44.3
43.1 48.8
-- 38.4
-- --
42.8 54.6 41.4 43.6
43.3
9.3
55.4 62.0
55.8 62.2
59.1 56.5
61.6 58.4 53.5 48.9
47.6 36.2 55.3 66.3
59.3 40.7
-- 57.6
-- --
55.1 53.2 56.4 63.1
58.0 32.9
2,612 1,637
2,612 1,637
2,393 1,856
1,644 1,549
644 412
1,034 71
1,213 1,931
3,808 300
4 130
2 5
1,356 230
1,249 1,414
4,249 4,205
Note: Table based on youngest living child born since 01.01.2008. a Literate but not attend school are also included. ## Children aged 9-35 months. -- Percentage not shown for less than 10 cases. ** Unweighted cases
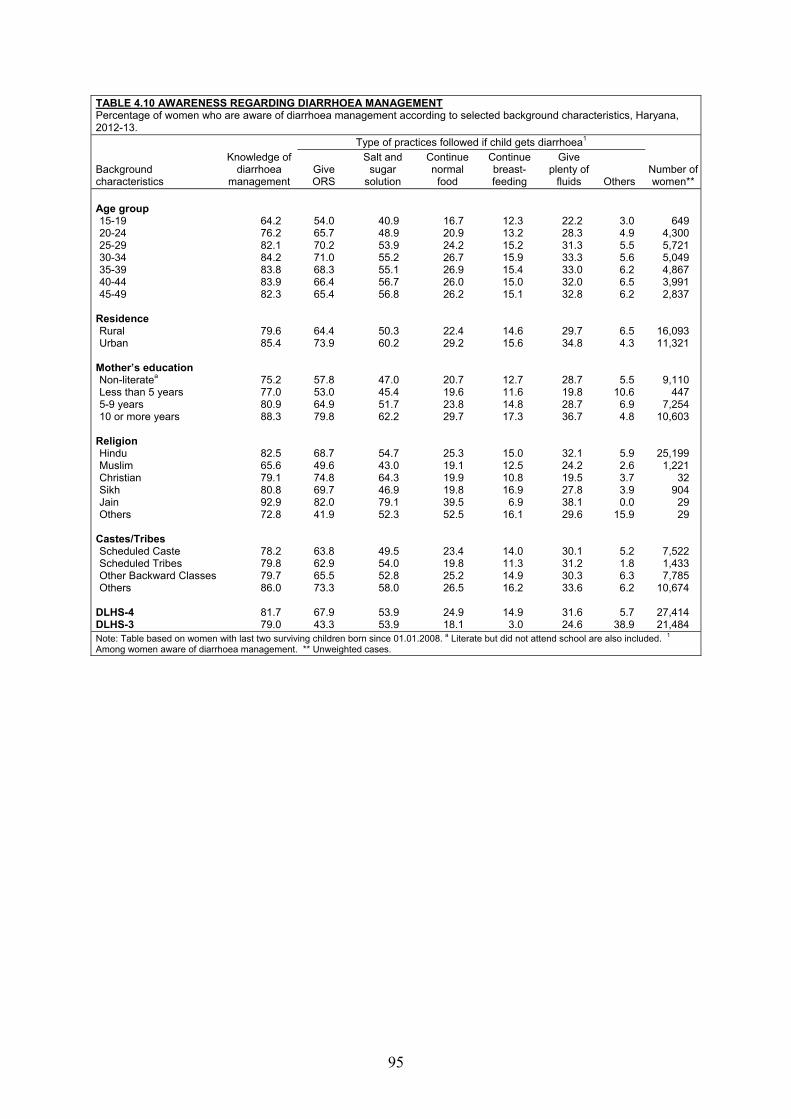
95
TABLE 4.10 AWARENESS REGARDING DIARRHOEA MANAGEMENT Percentage of women who are aware of diarrhoea management according to selected background characteristics, Haryana, 2012-13.
Background characteristics
Knowledge of diarrhoea
management
Type of practices followed if child gets diarrhoea1
Number ofwomen**
Give ORS
Salt and sugar
solution
Continue normal
food
Continue breast- feeding
Give plenty of
fluids Others Age group 15-19 20-24 25-29 30-34 35-39 40-44 45-49
Residence Rural Urban
Mother’s education Non-literatea Less than 5 years 5-9 years 10 or more years
Religion Hindu Muslim Christian Sikh Jain Others
Castes/Tribes Scheduled Caste Scheduled Tribes Other Backward Classes Others
DLHS-4 DLHS-3
64.2 76.2 82.1 84.2 83.8 83.9 82.3
79.6 85.4
75.2 77.0 80.9 88.3
82.5 65.6 79.1 80.8 92.9 72.8
78.2 79.8 79.7 86.0
81.7 79.0
54.0 65.7 70.2 71.0 68.3 66.4 65.4
64.4 73.9
57.8 53.0 64.9 79.8
68.7 49.6 74.8 69.7 82.0 41.9
63.8 62.9 65.5 73.3
67.9 43.3
40.9 48.9 53.9 55.2 55.1 56.7 56.8
50.3 60.2
47.0 45.4 51.7 62.2
54.7 43.0 64.3 46.9 79.1 52.3
49.5 54.0 52.8 58.0
53.9 53.9
16.7 20.9 24.2 26.7 26.9 26.0 26.2
22.4 29.2
20.7 19.6 23.8 29.7
25.3 19.1 19.9 19.8 39.5 52.5
23.4 19.8 25.2 26.5
24.9 18.1
12.3 13.2 15.2 15.9 15.4 15.0 15.1
14.6 15.6
12.7 11.6 14.8 17.3
15.0 12.5 10.8 16.9
6.9 16.1
14.0 11.3 14.9 16.2
14.9
3.0
22.2 28.3 31.3 33.3 33.0 32.0 32.8
29.7 34.8
28.7 19.8 28.7 36.7
32.1 24.2 19.5 27.8 38.1 29.6
30.1 31.2 30.3 33.6
31.6 24.6
3.0 4.9 5.5 5.6 6.2 6.5 6.2
6.5 4.3
5.5 10.6
6.9 4.8
5.9 2.6 3.7 3.9 0.0
15.9
5.2 1.8 6.3 6.2
5.7
38.9
649 4,300 5,721 5,049 4,867 3,991 2,837
16,093 11,321
9,110 447
7,254 10,603
25,199 1,221
32 904
29 29
7,522 1,433 7,785
10,674
27,414 21,484
Note: Table based on women with last two surviving children born since 01.01.2008. a Literate but did not attend school are also included. 1 Among women aware of diarrhoea management. ** Unweighted cases.
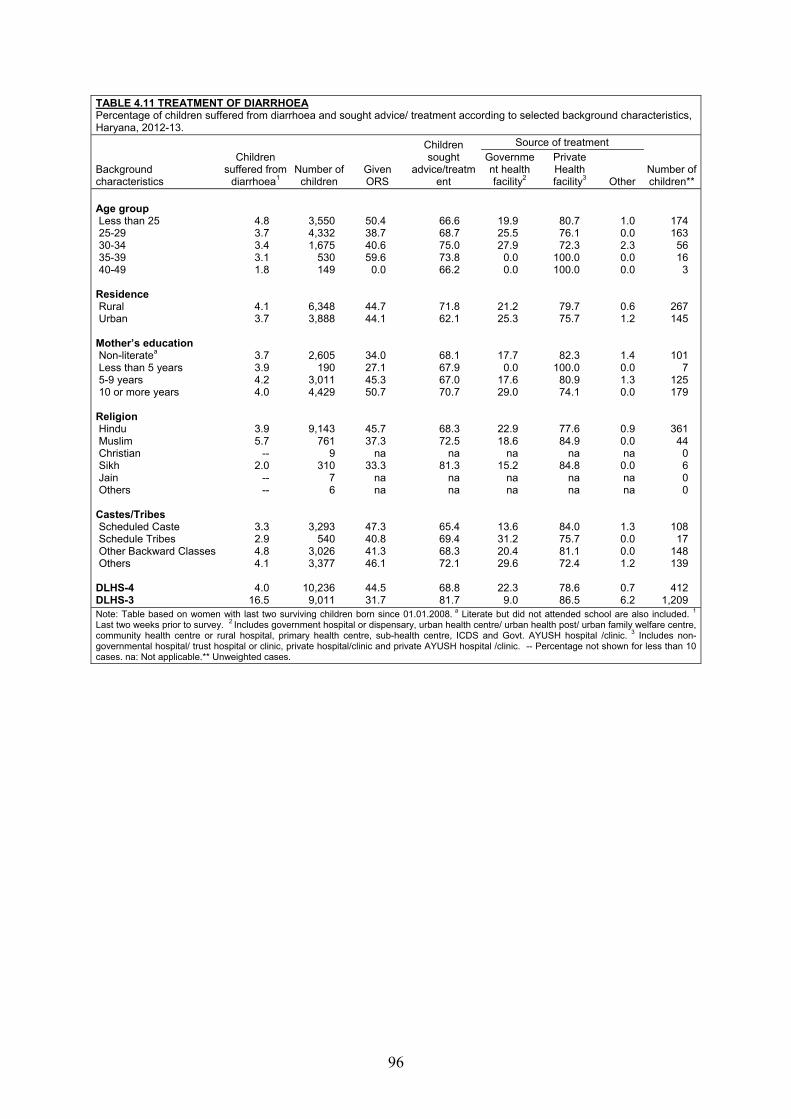
96
TABLE 4.11 TREATMENT OF DIARRHOEA Percentage of children suffered from diarrhoea and sought advice/ treatment according to selected background characteristics, Haryana, 2012-13.
Background characteristics
Children suffered from
diarrhoea1 Number of
children
Given ORS
Children sought
advice/treatment
Source of treatment
Number ofchildren**
Government health facility2
Private Health facility3 Other
Age group Less than 25 25-29 30-34 35-39 40-49
Residence Rural Urban
Mother’s education Non-literatea Less than 5 years 5-9 years 10 or more years
Religion Hindu Muslim Christian Sikh Jain Others
Castes/Tribes Scheduled Caste Schedule Tribes Other Backward Classes Others
DLHS-4 DLHS-3
4.8 3.7 3.4 3.1 1.8
4.1 3.7
3.7 3.9 4.2 4.0
3.9 5.7
-- 2.0
-- --
3.3 2.9 4.8 4.1
4.0
16.5
3,550 4,332 1,675
530 149
6,348 3,888
2,605 190
3,011 4,429
9,143 761
9 310
7 6
3,293 540
3,026 3,377
10,236
9,011
50.4 38.7 40.6 59.6
0.0
44.7 44.1
34.0 27.1 45.3 50.7
45.7 37.3
na 33.3
na na
47.3 40.8 41.3 46.1
44.5 31.7
66.6 68.7 75.0 73.8 66.2
71.8 62.1
68.1 67.9 67.0 70.7
68.3 72.5
na 81.3
na na
65.4 69.4 68.3 72.1
68.8 81.7
19.9 25.5 27.9
0.0 0.0
21.2 25.3
17.7 0.0
17.6 29.0
22.9 18.6
na 15.2
na na
13.6 31.2 20.4 29.6
22.3
9.0
80.7 76.1 72.3
100.0 100.0
79.7 75.7
82.3 100.0
80.9 74.1
77.6 84.9
na 84.8
na na
84.0 75.7 81.1 72.4
78.6 86.5
1.0 0.0 2.3 0.0 0.0
0.6 1.2
1.4 0.0 1.3 0.0
0.9 0.0 na
0.0 na na
1.3 0.0 0.0 1.2
0.7 6.2
174 163
56 16
3
267 145
101 7
125 179
361 44
0 6 0 0
108 17
148 139
412
1,209 Note: Table based on women with last two surviving children born since 01.01.2008. a Literate but did not attended school are also included. 1 Last two weeks prior to survey. 2 Includes government hospital or dispensary, urban health centre/ urban health post/ urban family welfare centre, community health centre or rural hospital, primary health centre, sub-health centre, ICDS and Govt. AYUSH hospital /clinic. 3 Includes non-governmental hospital/ trust hospital or clinic, private hospital/clinic and private AYUSH hospital /clinic. -- Percentage not shown for less than 10 cases. na: Not applicable.** Unweighted cases.
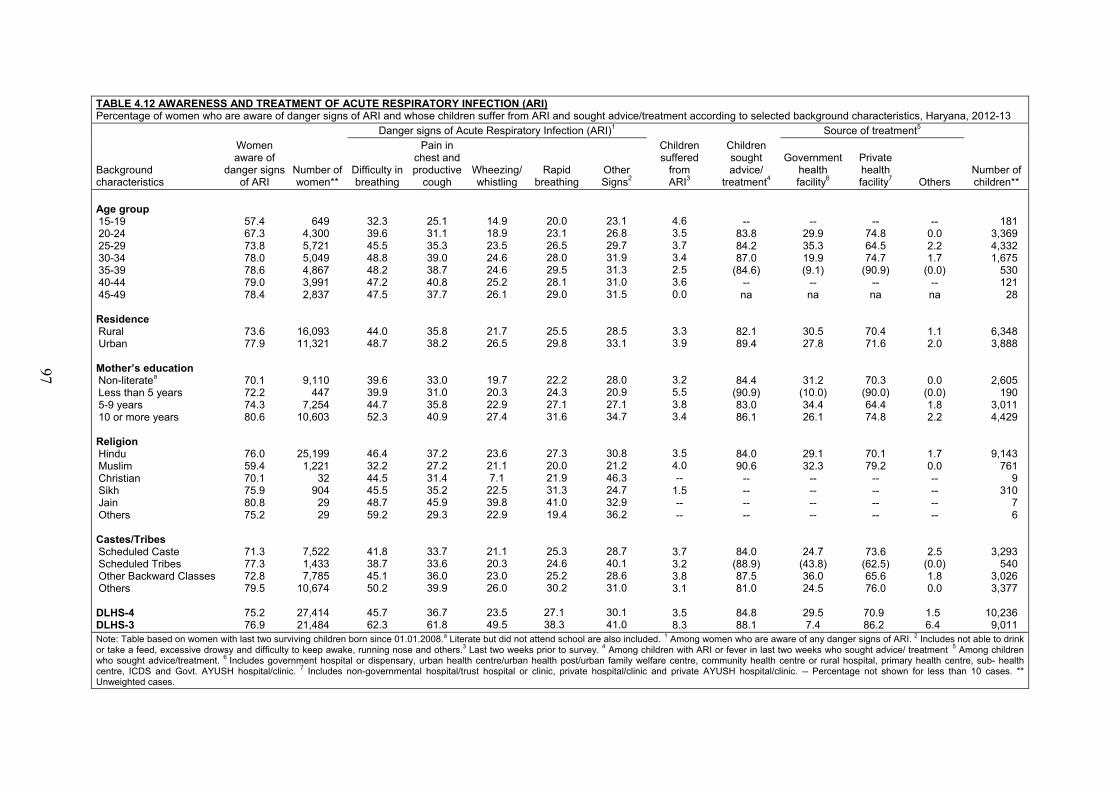
97
TABLE 4.12 AWARENESS AND TREATMENT OF ACUTE RESPIRATORY INFECTION (ARI) Percentage of women who are aware of danger signs of ARI and whose children suffer from ARI and sought advice/treatment according to selected background characteristics, Haryana, 2012-13
Background characteristics
Women aware of
danger signs of ARI
Number ofwomen**
Danger signs of Acute Respiratory Infection (ARI)1 Children suffered
from ARI3
Children sought advice/
treatment4
Source of treatment5
Number of children**
Difficulty in breathing
Pain in chest and productive
cough Wheezing/whistling
Rapid breathing
Other Signs2
Governmenthealth facility6
Private health facility7 Others
Age group 15-19 20-24 25-29 30-34 35-39 40-44 45-49
Residence Rural Urban
Mother’s education Non-literatea Less than 5 years 5-9 years 10 or more years
Religion Hindu Muslim Christian Sikh Jain Others
Castes/Tribes Scheduled Caste Scheduled Tribes Other Backward Classes Others
DLHS-4 DLHS-3
57.4 67.3 73.8 78.0 78.6 79.0 78.4
73.6 77.9
70.1 72.2 74.3 80.6
76.0 59.4 70.1 75.9 80.8 75.2
71.3 77.3 72.8 79.5
75.2 76.9
649 4,300 5,721 5,049 4,867 3,991 2,837
16,093 11,321
9,110 447
7,254 10,603
25,199 1,221
32 904 29 29
7,522 1,433 7,785
10,674
27,414 21,484
32.3 39.6 45.5 48.8 48.2 47.2 47.5
44.0 48.7
39.6 39.9 44.7 52.3
46.4 32.2 44.5 45.5 48.7 59.2
41.8 38.7 45.1 50.2
45.7 62.3
25.1 31.1 35.3 39.0 38.7 40.8 37.7
35.8 38.2
33.0 31.0 35.8 40.9
37.2 27.2 31.4 35.2 45.9 29.3
33.7 33.6 36.0 39.9
36.7 61.8
14.9 18.9 23.5 24.6 24.6 25.2 26.1
21.7 26.5
19.7 20.3 22.9 27.4
23.6 21.1 7.1
22.5 39.8 22.9
21.1 20.3 23.0 26.0
23.5 49.5
20.0 23.1 26.5 28.0 29.5 28.1 29.0
25.5 29.8
22.2 24.3 27.1 31.6
27.3 20.0 21.9 31.3 41.0 19.4
25.3 24.6 25.2 30.2
27.1 38.3
23.1 26.8 29.7 31.9 31.3 31.0 31.5
28.5 33.1
28.0 20.9 27.1 34.7
30.8 21.2 46.3 24.7 32.9 36.2
28.7 40.1 28.6 31.0
30.1 41.0
4.6 3.5 3.7 3.4 2.5 3.6 0.0
3.3 3.9
3.2 5.5 3.8 3.4
3.5 4.0 --
1.5 -- --
3.7 3.2 3.8 3.1
3.5 8.3
-- 83.8 84.2 87.0
(84.6) -- na
82.1 89.4
84.4 (90.9) 83.0 86.1
84.0 90.6
-- -- -- --
84.0 (88.9) 87.5 81.0
84.8 88.1
-- 29.9 35.3 19.9 (9.1)
-- na
30.5 27.8
31.2 (10.0) 34.4 26.1
29.1 32.3
-- -- -- --
24.7 (43.8) 36.0 24.5
29.5 7.4
-- 74.8 64.5 74.7
(90.9) -- na
70.4 71.6
70.3 (90.0) 64.4 74.8
70.1 79.2
-- -- -- --
73.6 (62.5) 65.6 76.0
70.9 86.2
-- 0.0 2.2 1.7
(0.0) -- na
1.1 2.0
0.0 (0.0) 1.8 2.2
1.7 0.0 -- -- -- --
2.5 (0.0) 1.8 0.0
1.5 6.4
181 3,369 4,332 1,675
530 121 28
6,348 3,888
2,605 190
3,011 4,429
9,143 761
9 310
7 6
3,293 540
3,026 3,377
10,236 9,011
Note: Table based on women with last two surviving children born since 01.01.2008.a Literate but did not attend school are also included. 1 Among women who are aware of any danger signs of ARI. 2 Includes not able to drink or take a feed, excessive drowsy and difficulty to keep awake, running nose and others.3 Last two weeks prior to survey. 4 Among children with ARI or fever in last two weeks who sought advice/ treatment. 5 Among children who sought advice/treatment. 6 Includes government hospital or dispensary, urban health centre/urban health post/urban family welfare centre, community health centre or rural hospital, primary health centre, sub- health centre, ICDS and Govt. AYUSH hospital/clinic. 7 Includes non-governmental hospital/trust hospital or clinic, private hospital/clinic and private AYUSH hospital/clinic. -- Percentage not shown for less than 10 cases. ** Unweighted cases.
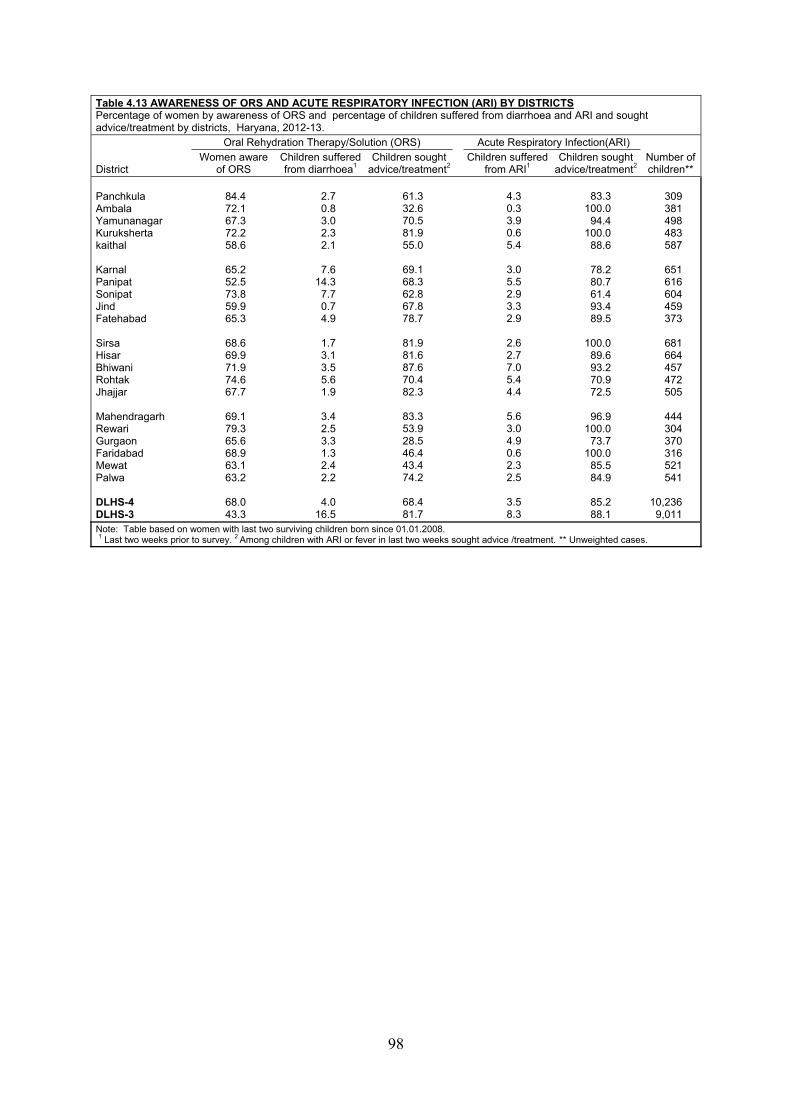
98
Table 4.13 AWARENESS OF ORS AND ACUTE RESPIRATORY INFECTION (ARI) BY DISTRICTS Percentage of women by awareness of ORS and percentage of children suffered from diarrhoea and ARI and sought advice/treatment by districts, Haryana, 2012-13.
District
Oral Rehydration Therapy/Solution (ORS) Acute Respiratory Infection(ARI) Number of children**
Women aware of ORS
Children suffered from diarrhoea1
Children sought advice/treatment2
Children suffered from ARI1
Children sought advice/treatment2
Panchkula Ambala Yamunanagar Kuruksherta kaithal
Karnal Panipat Sonipat Jind Fatehabad
Sirsa Hisar Bhiwani Rohtak Jhajjar
Mahendragarh Rewari Gurgaon Faridabad Mewat Palwa
DLHS-4 DLHS-3
84.4 72.1 67.3 72.2 58.6
65.2 52.5 73.8 59.9 65.3
68.6 69.9 71.9 74.6 67.7
69.1 79.3 65.6 68.9 63.1 63.2
68.0 43.3
2.7 0.8 3.0 2.3 2.1
7.6 14.3 7.7 0.7 4.9
1.7 3.1 3.5 5.6 1.9
3.4 2.5 3.3 1.3 2.4 2.2
4.0 16.5
61.3 32.6 70.5 81.9 55.0
69.1 68.3 62.8 67.8 78.7
81.9 81.6 87.6 70.4 82.3
83.3 53.9 28.5 46.4 43.4 74.2
68.4 81.7
4.3 0.3 3.9 0.6 5.4
3.0 5.5 2.9 3.3 2.9
2.6 2.7 7.0 5.4 4.4
5.6 3.0 4.9 0.6 2.3 2.5
3.5 8.3
83.3 100.0
94.4 100.0
88.6
78.2 80.7 61.4 93.4 89.5
100.0 89.6 93.2 70.9 72.5
96.9 100.0
73.7 100.0
85.5 84.9
85.2 88.1
309 381 498 483 587
651 616 604 459 373
681 664 457 472 505
444 304 370 316 521 541
10,236 9,011
Note: Table based on women with last two surviving children born since 01.01.2008. 1 Last two weeks prior to survey. 2 Among children with ARI or fever in last two weeks sought advice /treatment. ** Unweighted cases.
FAMILY PLANNING

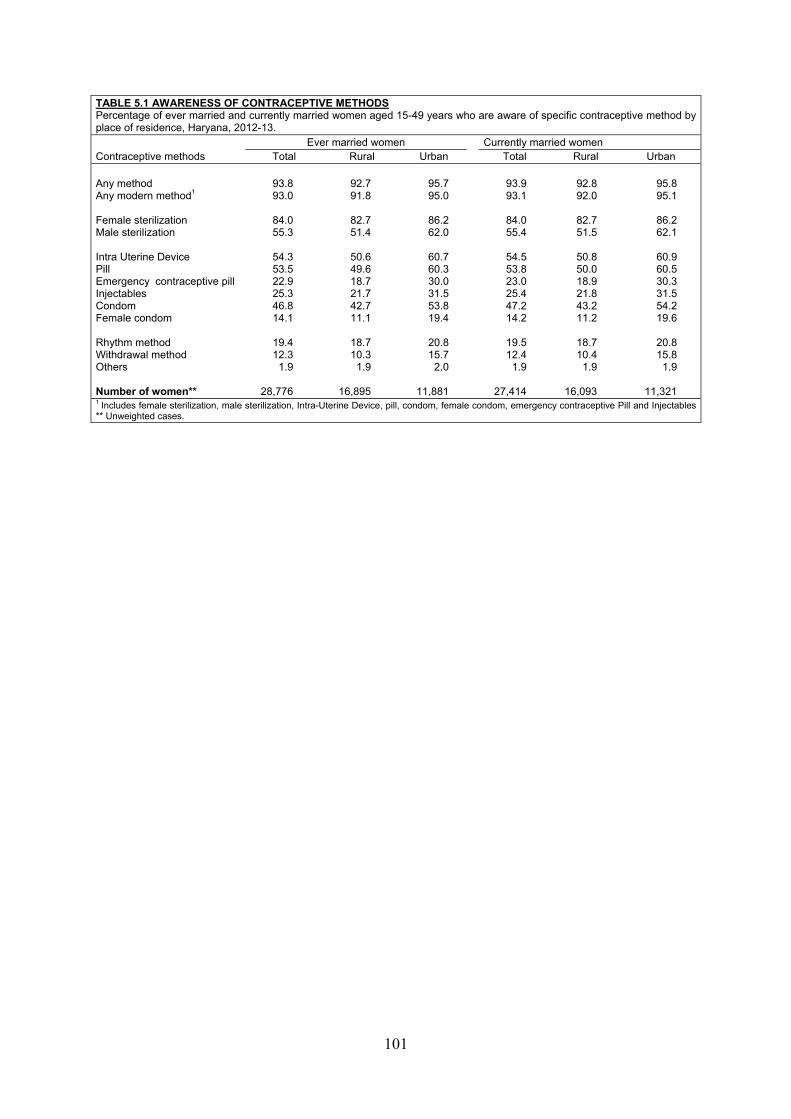
101
TABLE 5.1 AWARENESS OF CONTRACEPTIVE METHODS Percentage of ever married and currently married women aged 15-49 years who are aware of specific contraceptive method by place of residence, Haryana, 2012-13.
Contraceptive methods Ever married women Currently married women
Total Rural Urban Total Rural Urban Any method Any modern method1 Female sterilization Male sterilization Intra Uterine Device Pill Emergency contraceptive pill Injectables Condom Female condom Rhythm method Withdrawal method Others Number of women**
93.8 93.0
84.0 55.3
54.3 53.5 22.9 25.3 46.8 14.1
19.4 12.3
1.9
28,776
92.7 91.8
82.7 51.4
50.6 49.6 18.7 21.7 42.7 11.1
18.7 10.3
1.9
16,895
95.7 95.0
86.2 62.0
60.7 60.3 30.0 31.5 53.8 19.4
20.8 15.7
2.0
11,881
93.9 93.1
84.0 55.4
54.5 53.8 23.0 25.4 47.2 14.2
19.5 12.4
1.9
27,414
92.8 92.0
82.7 51.5
50.8 50.0 18.9 21.8 43.2 11.2
18.7 10.4
1.9
16,093
95.8 95.1
86.2 62.1
60.9 60.5 30.3 31.5 54.2 19.6
20.8 15.8
1.9
11,321 1 Includes female sterilization, male sterilization, Intra-Uterine Device, pill, condom, female condom, emergency contraceptive Pill and Injectables ** Unweighted cases.
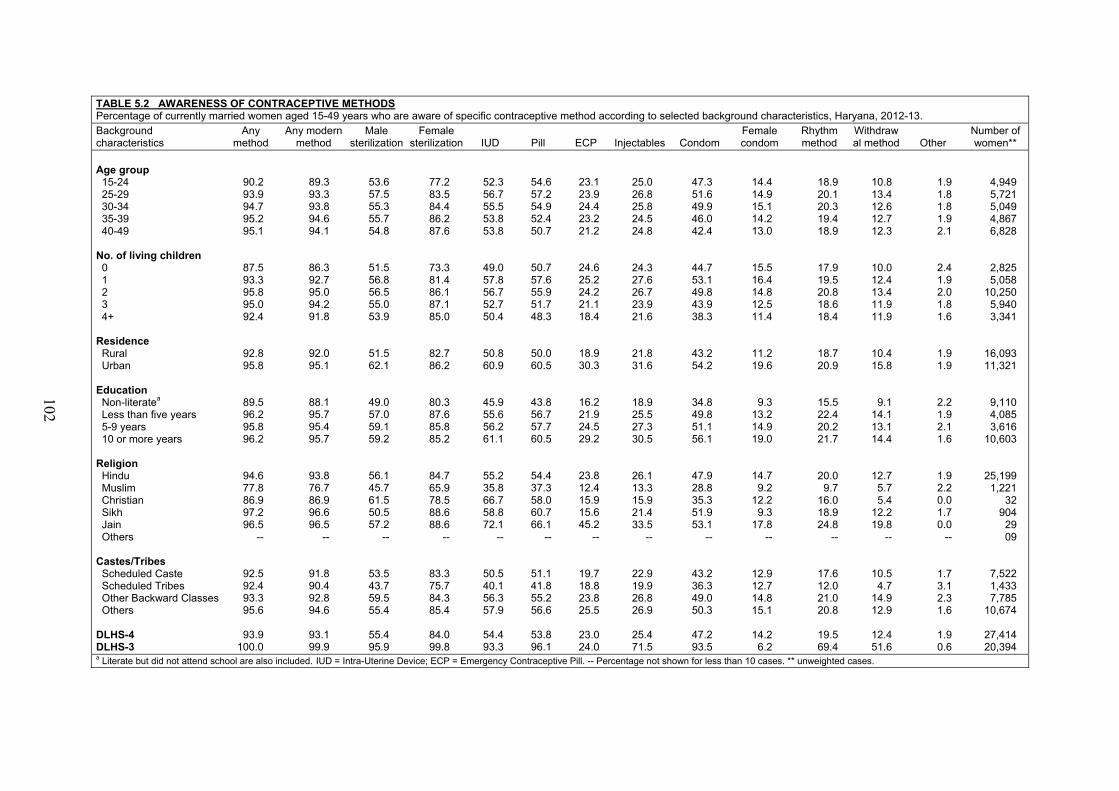
102
TABLE 5.2 AWARENESS OF CONTRACEPTIVE METHODS Percentage of currently married women aged 15-49 years who are aware of specific contraceptive method according to selected background characteristics, Haryana, 2012-13. Background characteristics
Any method
Any modern method
Male sterilization
Female sterilization IUD Pill ECP Injectables Condom
Female condom
Rhythm method
Withdrawal method Other
Number of women**
Age group 15-24 25-29 30-34 35-39 40-49
No. of living children 0 1 2 3 4+
Residence Rural Urban
Education Non-literatea Less than five years 5-9 years 10 or more years
Religion Hindu Muslim Christian Sikh Jain Others
Castes/Tribes Scheduled Caste Scheduled Tribes Other Backward ClassesOthers
DLHS-4 DLHS-3
90.2 93.9 94.7 95.2 95.1
87.5 93.3 95.8 95.0 92.4
92.8 95.8
89.5 96.2 95.8 96.2
94.6 77.8 86.9 97.2 96.5
--
92.5 92.4 93.3 95.6
93.9 100.0
89.3 93.3 93.8 94.6 94.1
86.3 92.7 95.0 94.2 91.8
92.0 95.1
88.1 95.7 95.4 95.7
93.8 76.7 86.9 96.6 96.5
--
91.8 90.4 92.8 94.6
93.1 99.9
53.6 57.5 55.3 55.7 54.8
51.5 56.8 56.5 55.0 53.9
51.5 62.1
49.0 57.0 59.1 59.2
56.1 45.7 61.5 50.5 57.2
--
53.5 43.7 59.5 55.4
55.4 95.9
77.2 83.5 84.4 86.2 87.6
73.3 81.4 86.1 87.1 85.0
82.7 86.2
80.3 87.6 85.8 85.2
84.7 65.9 78.5 88.6 88.6
--
83.3 75.7 84.3 85.4
84.0 99.8
52.3 56.7 55.5 53.8 53.8
49.0 57.8 56.7 52.7 50.4
50.8 60.9
45.9 55.6 56.2 61.1
55.2 35.8 66.7 58.8 72.1
--
50.5 40.1 56.3 57.9
54.4 93.3
54.6 57.2 54.9 52.4 50.7
50.7 57.6 55.9 51.7 48.3
50.0 60.5
43.8 56.7 57.7 60.5
54.4 37.3 58.0 60.7 66.1
--
51.1 41.8 55.2 56.6
53.8 96.1
23.1 23.9 24.4 23.2 21.2
24.6 25.2 24.2 21.1 18.4
18.9 30.3
16.2 21.9 24.5 29.2
23.8 12.4 15.9 15.6 45.2
--
19.7 18.8 23.8 25.5
23.0 24.0
25.0 26.8 25.8 24.5 24.8
24.3 27.6 26.7 23.9 21.6
21.8 31.6
18.9 25.5 27.3 30.5
26.1 13.3 15.9 21.4 33.5
--
22.9 19.9 26.8 26.9
25.4 71.5
47.3 51.6 49.9 46.0 42.4
44.7 53.1 49.8 43.9 38.3
43.2 54.2
34.8 49.8 51.1 56.1
47.9 28.8 35.3 51.9 53.1
--
43.2 36.3 49.0 50.3
47.2 93.5
14.4 14.9 15.1 14.2 13.0
15.5 16.4 14.8 12.5 11.4
11.2 19.6
9.3 13.2 14.9 19.0
14.7 9.2
12.2 9.3
17.8 --
12.9 12.7 14.8 15.1
14.2 6.2
18.9 20.1 20.3 19.4 18.9
17.9 19.5 20.8 18.6 18.4
18.7 20.9
15.5 22.4 20.2 21.7
20.0 9.7
16.0 18.9 24.8
--
17.6 12.0 21.0 20.8
19.5 69.4
10.8 13.4 12.6 12.7 12.3
10.0 12.4 13.4 11.9 11.9
10.4 15.8
9.1 14.1 13.1 14.4
12.7 5.7 5.4
12.2 19.8
--
10.5 4.7
14.9 12.9
12.4 51.6
1.9 1.8 1.8 1.9 2.1
2.4 1.9 2.0 1.8 1.6
1.9 1.9
2.2 1.9 2.1 1.6
1.9 2.2 0.0 1.7 0.0
--
1.7 3.1 2.3 1.6
1.9 0.6
4,949 5,721 5,049 4,867 6,828
2,825 5,058
10,250 5,940 3,341
16,093 11,321
9,110 4,085 3,616
10,603
25,199 1,221
32 904 29 09
7,522 1,433 7,785
10,674
27,414 20,394
a Literate but did not attend school are also included. IUD = Intra-Uterine Device; ECP = Emergency Contraceptive Pill. -- Percentage not shown for less than 10 cases. ** unweighted cases.
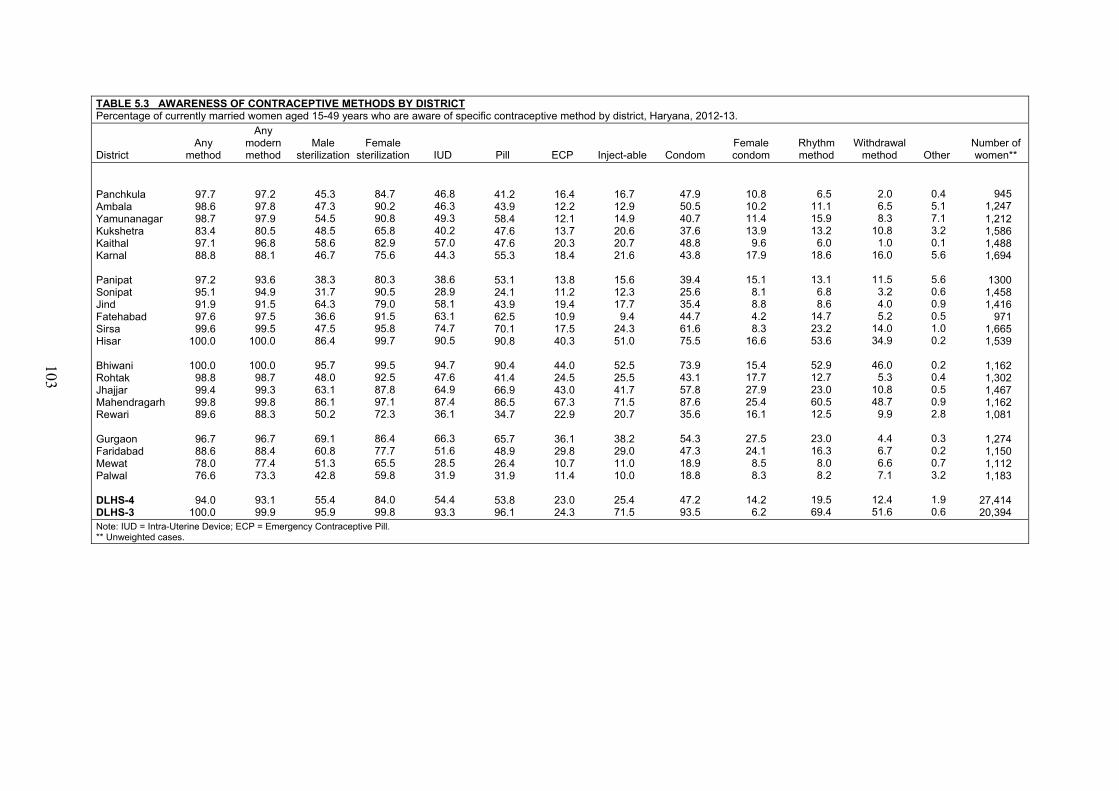
103
TABLE 5.3 AWARENESS OF CONTRACEPTIVE METHODS BY DISTRICT Percentage of currently married women aged 15-49 years who are aware of specific contraceptive method by district, Haryana, 2012-13.
District Any
method
Any modern method
Male sterilization
Female sterilization IUD Pill ECP Inject-able Condom
Female condom
Rhythm method
Withdrawal method Other
Number of women**
Panchkula Ambala Yamunanagar Kukshetra Kaithal Karnal
Panipat Sonipat Jind Fatehabad Sirsa Hisar
Bhiwani Rohtak Jhajjar Mahendragarh Rewari
Gurgaon Faridabad Mewat Palwal
DLHS-4 DLHS-3
97.7 98.6 98.7 83.4 97.1 88.8
97.2 95.1 91.9 97.6 99.6
100.0
100.0 98.8 99.4 99.8 89.6
96.7 88.6 78.0 76.6
94.0 100.0
97.2 97.8 97.9 80.5 96.8 88.1
93.6 94.9 91.5 97.5 99.5
100.0
100.0 98.7 99.3 99.8 88.3
96.7 88.4 77.4 73.3
93.1 99.9
45.3 47.3 54.5 48.5 58.6 46.7
38.3 31.7 64.3 36.6 47.5 86.4
95.7 48.0 63.1 86.1 50.2
69.1 60.8 51.3 42.8
55.4 95.9
84.7 90.2 90.8 65.8 82.9 75.6
80.3 90.5 79.0 91.5 95.8 99.7
99.5 92.5 87.8 97.1 72.3
86.4 77.7 65.5 59.8
84.0 99.8
46.8 46.3 49.3 40.2 57.0 44.3
38.6 28.9 58.1 63.1 74.7 90.5
94.7 47.6 64.9 87.4 36.1
66.3 51.6 28.5 31.9
54.4 93.3
41.2 43.9 58.4 47.6 47.6 55.3
53.1 24.1 43.9 62.5 70.1 90.8
90.4 41.4 66.9 86.5 34.7
65.7 48.9 26.4 31.9
53.8 96.1
16.4 12.2 12.1 13.7 20.3 18.4
13.8 11.2 19.4 10.9 17.5 40.3
44.0 24.5 43.0 67.3 22.9
36.1 29.8 10.7 11.4
23.0 24.3
16.7 12.9 14.9 20.6 20.7 21.6
15.6 12.3 17.7 9.4
24.3 51.0
52.5 25.5 41.7 71.5 20.7
38.2 29.0 11.0 10.0
25.4 71.5
47.9 50.5 40.7 37.6 48.8 43.8
39.4 25.6 35.4 44.7 61.6 75.5
73.9 43.1 57.8 87.6 35.6
54.3 47.3 18.9 18.8
47.2 93.5
10.8 10.2 11.4 13.9 9.6
17.9
15.1 8.1 8.8 4.2 8.3
16.6
15.4 17.7 27.9 25.4 16.1
27.5 24.1 8.5 8.3
14.2 6.2
6.5 11.1 15.9 13.2 6.0
18.6
13.1 6.8 8.6
14.7 23.2 53.6
52.9 12.7 23.0 60.5 12.5
23.0 16.3 8.0 8.2
19.5 69.4
2.0 6.5 8.3
10.8 1.0
16.0
11.5 3.2 4.0 5.2
14.0 34.9
46.0 5.3
10.8 48.7 9.9
4.4 6.7 6.6 7.1
12.4 51.6
0.4 5.1 7.1 3.2 0.1 5.6
5.6 0.6 0.9 0.5 1.0 0.2
0.2 0.4 0.5 0.9 2.8
0.3 0.2 0.7 3.2
1.9 0.6
945 1,247 1,212 1,586 1,488 1,694
1300 1,458 1,416
971 1,665 1,539
1,162 1,302 1,467 1,162 1,081
1,274 1,150 1,112 1,183
27,414 20,394
Note: IUD = Intra-Uterine Device; ECP = Emergency Contraceptive Pill. ** Unweighted cases.
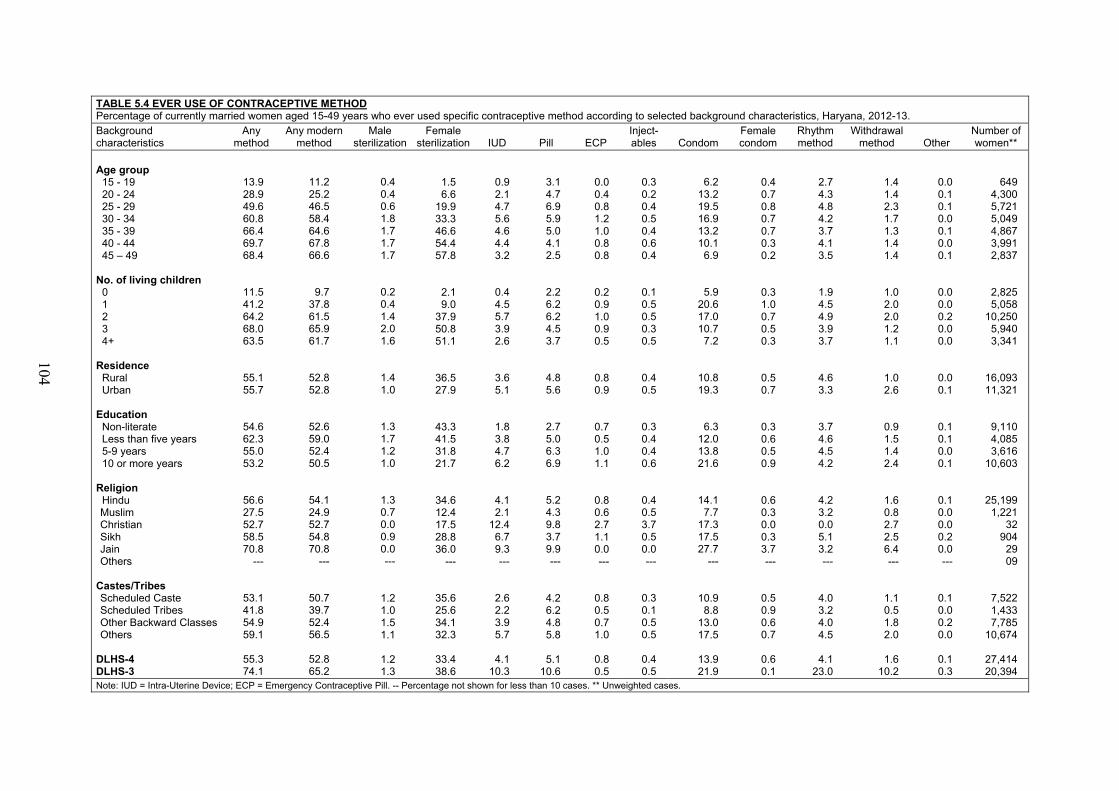
104
TABLE 5.4 EVER USE OF CONTRACEPTIVE METHOD Percentage of currently married women aged 15-49 years who ever used specific contraceptive method according to selected background characteristics, Haryana, 2012-13. Background characteristics
Any method
Any modernmethod
Male sterilization
Female sterilization IUD Pill ECP
Inject-ables Condom
Female condom
Rhythm method
Withdrawal method Other
Number of women**
Age group 15 - 19 20 - 24 25 - 29 30 - 34 35 - 39 40 - 44 45 – 49
No. of living children 0 1 2 3 4+
Residence Rural Urban
Education Non-literate Less than five years 5-9 years 10 or more years
Religion Hindu Muslim Christian Sikh Jain Others
Castes/Tribes Scheduled Caste Scheduled Tribes Other Backward ClassesOthers
DLHS-4 DLHS-3
13.9 28.9 49.6 60.8 66.4 69.7 68.4
11.5 41.2 64.2 68.0 63.5
55.1 55.7
54.6 62.3 55.0 53.2
56.6 27.5 52.7 58.5 70.8
---
53.1 41.8 54.9 59.1
55.3 74.1
11.2 25.2 46.5 58.4 64.6 67.8 66.6
9.7 37.8 61.5 65.9 61.7
52.8 52.8
52.6 59.0 52.4 50.5
54.1 24.9 52.7 54.8 70.8
---
50.7 39.7 52.4 56.5
52.8 65.2
0.4 0.4 0.6 1.8 1.7 1.7 1.7
0.2 0.4 1.4 2.0 1.6
1.4 1.0
1.3 1.7 1.2 1.0
1.3 0.7 0.0 0.9 0.0 ---
1.2 1.0 1.5 1.1
1.2 1.3
1.5 6.6
19.9 33.3 46.6 54.4 57.8
2.1 9.0
37.9 50.8 51.1
36.5 27.9
43.3 41.5 31.8 21.7
34.6 12.4 17.5 28.8 36.0
---
35.6 25.6 34.1 32.3
33.4 38.6
0.9 2.1 4.7 5.6 4.6 4.4 3.2
0.4 4.5 5.7 3.9 2.6
3.6 5.1
1.8 3.8 4.7 6.2
4.1 2.1
12.4 6.7 9.3 ---
2.6 2.2 3.9 5.7
4.1 10.3
3.1 4.7 6.9 5.9 5.0 4.1 2.5
2.2 6.2 6.2 4.5 3.7
4.8 5.6
2.7 5.0 6.3 6.9
5.2 4.3 9.8 3.7 9.9 ---
4.2 6.2 4.8 5.8
5.1 10.6
0.0 0.4 0.8 1.2 1.0 0.8 0.8
0.2 0.9 1.0 0.9 0.5
0.8 0.9
0.7 0.5 1.0 1.1
0.8 0.6 2.7 1.1 0.0 ---
0.8 0.5 0.7 1.0
0.8 0.5
0.3 0.2 0.4 0.5 0.4 0.6 0.4
0.1 0.5 0.5 0.3 0.5
0.4 0.5
0.3 0.4 0.4 0.6
0.4 0.5 3.7 0.5 0.0 ---
0.3 0.1 0.5 0.5
0.4 0.5
6.2 13.2 19.5 16.9 13.2 10.1 6.9
5.9 20.6 17.0 10.7 7.2
10.8 19.3
6.3 12.0 13.8 21.6
14.1 7.7
17.3 17.5 27.7
---
10.9 8.8
13.0 17.5
13.9 21.9
0.4 0.7 0.8 0.7 0.7 0.3 0.2
0.3 1.0 0.7 0.5 0.3
0.5 0.7
0.3 0.6 0.5 0.9
0.6 0.3 0.0 0.3 3.7 ---
0.5 0.9 0.6 0.7
0.6 0.1
2.7 4.3 4.8 4.2 3.7 4.1 3.5
1.9 4.5 4.9 3.9 3.7
4.6 3.3
3.7 4.6 4.5 4.2
4.2 3.2 0.0 5.1 3.2 ---
4.0 3.2 4.0 4.5
4.1 23.0
1.4 1.4 2.3 1.7 1.3 1.4 1.4
1.0 2.0 2.0 1.2 1.1
1.0 2.6
0.9 1.5 1.4 2.4
1.6 0.8 2.7 2.5 6.4 ---
1.1 0.5 1.8 2.0
1.6 10.2
0.0 0.1 0.1 0.0 0.1 0.0 0.1
0.0 0.0 0.2 0.0 0.0
0.0 0.1
0.1 0.1 0.0 0.1
0.1 0.0 0.0 0.2 0.0 ---
0.1 0.0 0.2 0.0
0.1 0.3
649 4,300 5,721 5,049 4,867 3,991 2,837
2,825 5,058
10,250 5,940 3,341
16,093 11,321
9,110 4,085 3,616
10,603
25,199 1,221
32 904 29 09
7,522 1,433 7,785
10,674
27,414 20,394
Note: IUD = Intra-Uterine Device; ECP = Emergency Contraceptive Pill. -- Percentage not shown for less than 10 cases. ** Unweighted cases.
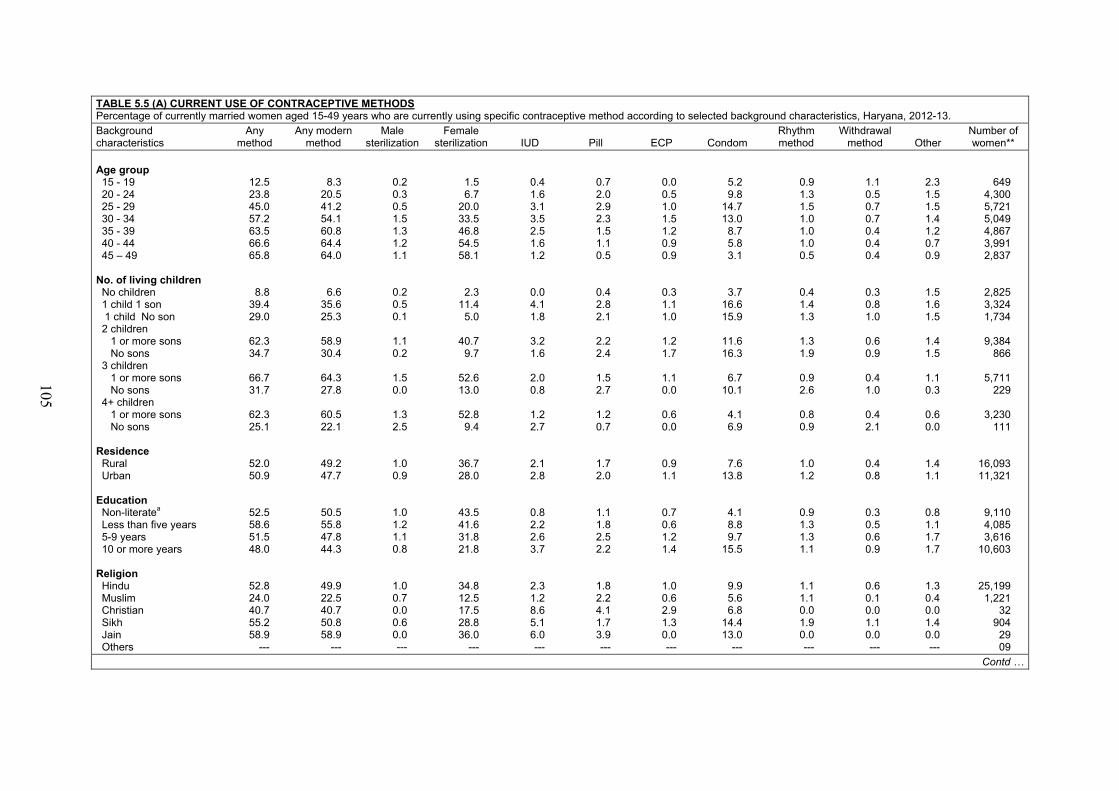
105
TABLE 5.5 (A) CURRENT USE OF CONTRACEPTIVE METHODS Percentage of currently married women aged 15-49 years who are currently using specific contraceptive method according to selected background characteristics, Haryana, 2012-13. Background characteristics
Any method
Any modern method
Male sterilization
Female sterilization IUD Pill ECP Condom
Rhythm method
Withdrawal method Other
Number of women**
Age group 15 - 19 20 - 24 25 - 29 30 - 34 35 - 39 40 - 44 45 – 49
No. of living children No children 1 child 1 son 1 child No son 2 children 1 or more sons No sons 3 children 1 or more sons No sons 4+ children 1 or more sons No sons
Residence Rural Urban
Education Non-literatea Less than five years 5-9 years 10 or more years
Religion Hindu Muslim Christian Sikh Jain Others
12.5 23.8 45.0 57.2 63.5 66.6 65.8
8.8 39.4 29.0
62.3 34.7
66.7 31.7
62.3 25.1
52.0 50.9
52.5 58.6 51.5 48.0
52.8 24.0 40.7 55.2 58.9
---
8.3 20.5 41.2 54.1 60.8 64.4 64.0
6.6 35.6 25.3
58.9 30.4
64.3 27.8
60.5 22.1
49.2 47.7
50.5 55.8 47.8 44.3
49.9 22.5 40.7 50.8 58.9
---
0.2 0.3 0.5 1.5 1.3 1.2 1.1
0.2 0.5 0.1
1.1 0.2
1.5 0.0
1.3 2.5
1.0 0.9
1.0 1.2 1.1 0.8
1.0 0.7 0.0 0.6 0.0 ---
1.5 6.7
20.0 33.5 46.8 54.5 58.1
2.3 11.4 5.0
40.7 9.7
52.6 13.0
52.8 9.4
36.7 28.0
43.5 41.6 31.8 21.8
34.8 12.5 17.5 28.8 36.0
---
0.4 1.6 3.1 3.5 2.5 1.6 1.2
0.0 4.1 1.8
3.2 1.6
2.0 0.8
1.2 2.7
2.1 2.8
0.8 2.2 2.6 3.7
2.3 1.2 8.6 5.1 6.0 ---
0.7 2.0 2.9 2.3 1.5 1.1 0.5
0.4 2.8 2.1
2.2 2.4
1.5 2.7
1.2 0.7
1.7 2.0
1.1 1.8 2.5 2.2
1.8 2.2 4.1 1.7 3.9 ---
0.0 0.5 1.0 1.5 1.2 0.9 0.9
0.3 1.1 1.0
1.2 1.7
1.1 0.0
0.6 0.0
0.9 1.1
0.7 0.6 1.2 1.4
1.0 0.6 2.9 1.3 0.0 ---
5.2 9.8
14.7 13.0 8.7 5.8 3.1
3.7 16.6 15.9
11.6 16.3
6.7 10.1
4.1 6.9
7.6 13.8
4.1 8.8 9.7
15.5
9.9 5.6 6.8
14.4 13.0
---
0.9 1.3 1.5 1.0 1.0 1.0 0.5
0.4 1.4 1.3
1.3 1.9
0.9 2.6
0.8 0.9
1.0 1.2
0.9 1.3 1.3 1.1
1.1 1.1 0.0 1.9 0.0 ---
1.1 0.5 0.7 0.7 0.4 0.4 0.4
0.3 0.8 1.0
0.6 0.9
0.4 1.0
0.4 2.1
0.4 0.8
0.3 0.5 0.6 0.9
0.6 0.1 0.0 1.1 0.0 ---
2.3 1.5 1.5 1.4 1.2 0.7 0.9
1.5 1.6 1.5
1.4 1.5
1.1 0.3
0.6 0.0
1.4 1.1
0.8 1.1 1.7 1.7
1.3 0.4 0.0 1.4 0.0 ---
649 4,300 5,721 5,049 4,867 3,991 2,837
2,825 3,324 1,734
9,384 866
5,711 229
3,230 111
16,093 11,321
9,110 4,085 3,616
10,603
25,199 1,221
32 904 29 09
Contd …
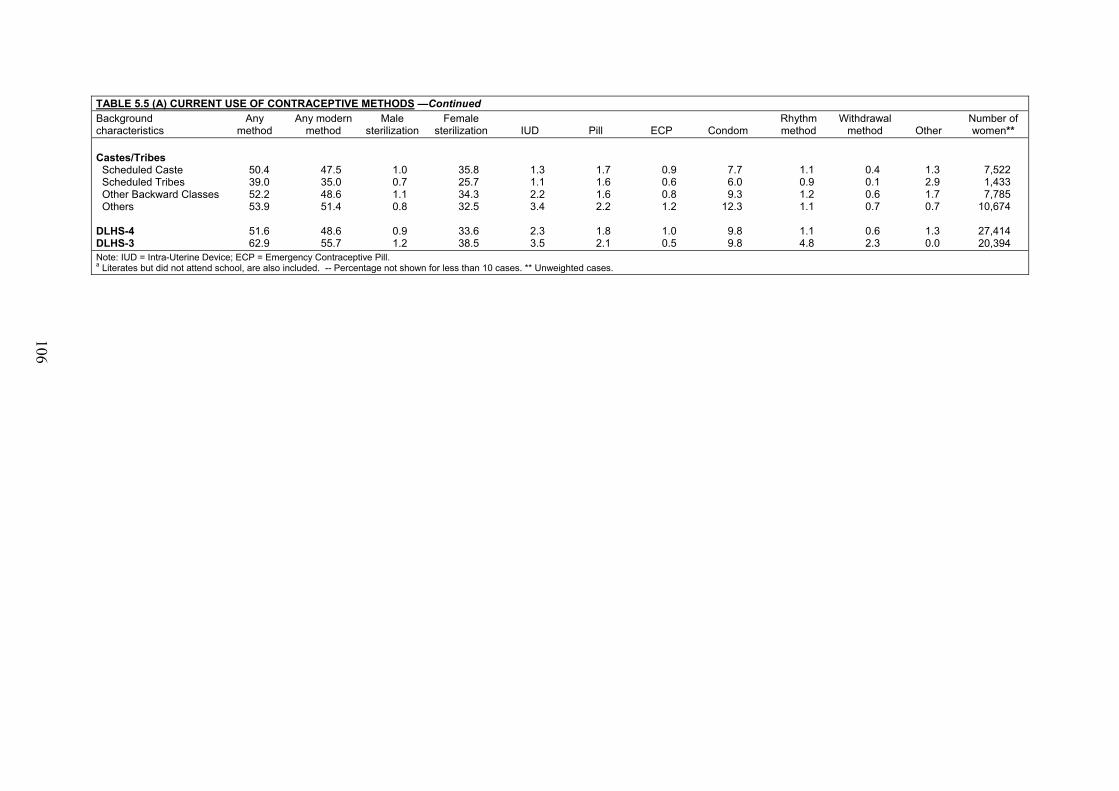
106
TABLE 5.5 (A) CURRENT USE OF CONTRACEPTIVE METHODS —Continued Background characteristics
Any method
Any modern method
Male sterilization
Female sterilization IUD Pill ECP Condom
Rhythm method
Withdrawal method Other
Number of women**
Castes/Tribes Scheduled Caste Scheduled Tribes Other Backward ClassesOthers
DLHS-4 DLHS-3
50.4 39.0 52.2 53.9
51.6 62.9
47.5 35.0 48.6 51.4
48.6 55.7
1.0 0.7 1.1 0.8
0.9 1.2
35.8 25.7 34.3 32.5
33.6 38.5
1.3 1.1 2.2 3.4
2.3 3.5
1.7 1.6 1.6 2.2
1.8 2.1
0.9 0.6 0.8 1.2
1.0 0.5
7.7 6.0 9.3
12.3
9.8 9.8
1.1 0.9 1.2 1.1
1.1 4.8
0.4 0.1 0.6 0.7
0.6 2.3
1.3 2.9 1.7 0.7
1.3 0.0
7,522 1,433 7,785
10,674
27,414 20,394
Note: IUD = Intra-Uterine Device; ECP = Emergency Contraceptive Pill. a Literates but did not attend school, are also included. -- Percentage not shown for less than 10 cases. ** Unweighted cases.
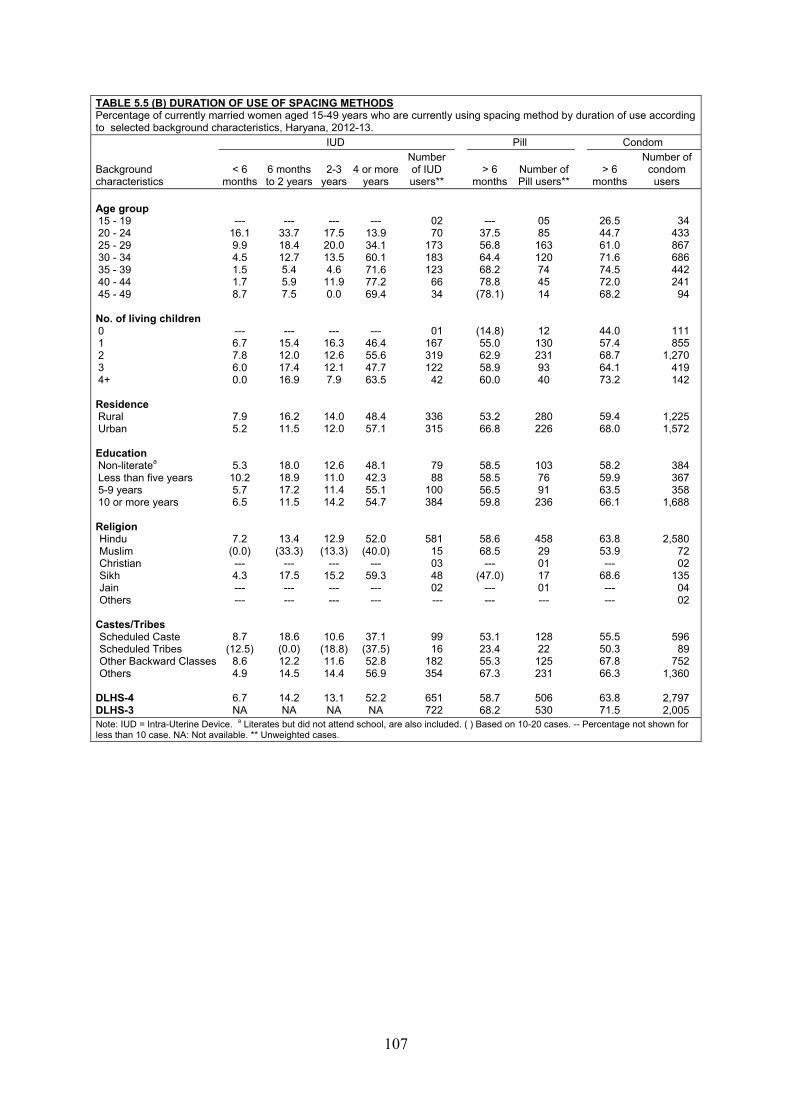
107
TABLE 5.5 (B) DURATION OF USE OF SPACING METHODS Percentage of currently married women aged 15-49 years who are currently using spacing method by duration of use according to selected background characteristics, Haryana, 2012-13.
Background characteristics
IUD Pill Condom
< 6 months
6 months to 2 years
2-3 years
4 or more years
Number of IUD users**
> 6 months
Number of Pill users**
> 6 months
Number of condom users
Age group 15 - 19 20 - 24 25 - 29 30 - 34 35 - 39 40 - 44 45 - 49
No. of living children 0 1 2 3 4+
Residence Rural Urban
Education Non-literatea Less than five years 5-9 years 10 or more years
Religion Hindu Muslim Christian Sikh Jain Others
Castes/Tribes Scheduled Caste Scheduled Tribes Other Backward Classes Others
DLHS-4 DLHS-3
--- 16.1 9.9 4.5 1.5 1.7 8.7
--- 6.7 7.8 6.0 0.0
7.9 5.2
5.3 10.2 5.7 6.5
7.2 (0.0) --- 4.3 --- ---
8.7 (12.5)
8.6 4.9
6.7 NA
--- 33.7 18.4 12.7 5.4 5.9 7.5
--- 15.4 12.0 17.4 16.9
16.2 11.5
18.0 18.9 17.2 11.5
13.4 (33.3)
--- 17.5 --- ---
18.6 (0.0) 12.2 14.5
14.2 NA
--- 17.5 20.0 13.5 4.6
11.9 0.0
--- 16.3 12.6 12.1 7.9
14.0 12.0
12.6 11.0 11.4 14.2
12.9 (13.3)
--- 15.2 --- ---
10.6 (18.8)11.6 14.4
13.1 NA
--- 13.9 34.1 60.1 71.6 77.2 69.4
--- 46.4 55.6 47.7 63.5
48.4 57.1
48.1 42.3 55.1 54.7
52.0 (40.0)
--- 59.3 --- ---
37.1 (37.5) 52.8 56.9
52.2 NA
02 70
173 183 123 66 34
01 167 319 122 42
336 315
79 88
100 384
581 15 03 48 02 ---
99 16
182 354
651 722
--- 37.5 56.8 64.4 68.2 78.8
(78.1)
(14.8) 55.0 62.9 58.9 60.0
53.2 66.8
58.5 58.5 56.5 59.8
58.6 68.5 ---
(47.0) --- ---
53.1 23.4 55.3 67.3
58.7 68.2
05 85
163 120 74 45 14
12 130 231 93 40
280 226
103 76 91
236
458 29 01 17 01 ---
128 22
125 231
506 530
26.5 44.7 61.0 71.6 74.5 72.0 68.2
44.0 57.4 68.7 64.1 73.2
59.4 68.0
58.2 59.9 63.5 66.1
63.8 53.9 ---
68.6 --- ---
55.5 50.3 67.8 66.3
63.8 71.5
34 433 867 686 442 241 94
111 855
1,270 419 142
1,225 1,572
384 367 358
1,688
2,580 72 02
135 04 02
596 89
752 1,360
2,797 2,005
Note: IUD = Intra-Uterine Device. a Literates but did not attend school, are also included. ( ) Based on 10-20 cases. -- Percentage not shown for less than 10 case. NA: Not available. ** Unweighted cases.
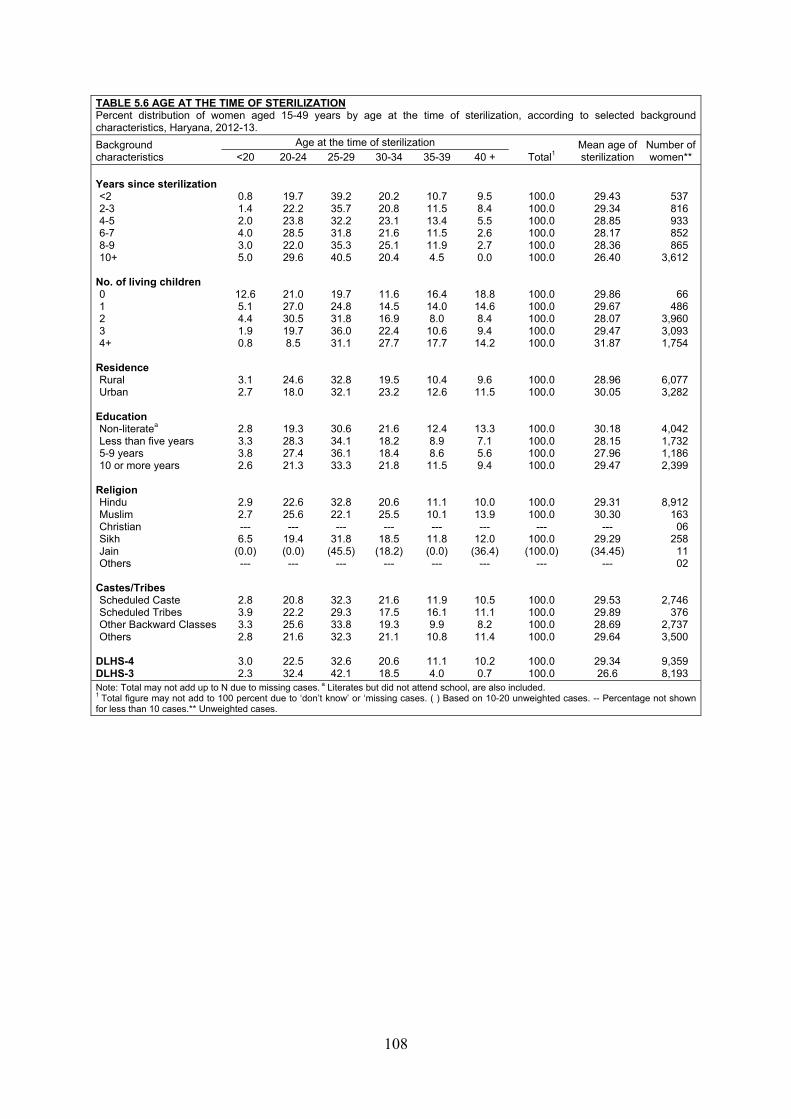
108
TABLE 5.6 AGE AT THE TIME OF STERILIZATION Percent distribution of women aged 15-49 years by age at the time of sterilization, according to selected background characteristics, Haryana, 2012-13.
Background characteristics
Age at the time of sterilization Total1
Mean age of sterilization
Number ofwomen** <20 20-24 25-29 30-34 35-39 40 +
Years since sterilization <2 2-3 4-5 6-7 8-9 10+
No. of living children 0 1 2 3 4+
Residence Rural Urban
Education Non-literatea Less than five years 5-9 years 10 or more years
Religion Hindu Muslim Christian Sikh Jain Others
Castes/Tribes Scheduled Caste Scheduled Tribes Other Backward Classes Others
DLHS-4 DLHS-3
0.8 1.4 2.0 4.0 3.0 5.0
12.6 5.1 4.4 1.9 0.8
3.1 2.7
2.8 3.3 3.8 2.6
2.9 2.7 --- 6.5
(0.0) ---
2.8 3.9 3.3 2.8
3.0 2.3
19.7 22.2 23.8 28.5 22.0 29.6
21.0 27.0 30.5 19.7 8.5
24.6 18.0
19.3 28.3 27.4 21.3
22.6 25.6 ---
19.4 (0.0) ---
20.8 22.2 25.6 21.6
22.5 32.4
39.2 35.7 32.2 31.8 35.3 40.5
19.7 24.8 31.8 36.0 31.1
32.8 32.1
30.6 34.1 36.1 33.3
32.8 22.1 ---
31.8 (45.5)
---
32.3 29.3 33.8 32.3
32.6 42.1
20.2 20.8 23.1 21.6 25.1 20.4
11.6 14.5 16.9 22.4 27.7
19.5 23.2
21.6 18.2 18.4 21.8
20.6 25.5 ---
18.5 (18.2)
---
21.6 17.5 19.3 21.1
20.6 18.5
10.7 11.5 13.4 11.5 11.9 4.5
16.4 14.0 8.0
10.6 17.7
10.4 12.6
12.4 8.9 8.6
11.5
11.1 10.1 ---
11.8 (0.0) ---
11.9 16.1 9.9
10.8
11.1 4.0
9.5 8.4 5.5 2.6 2.7 0.0
18.8 14.6 8.4 9.4
14.2
9.6 11.5
13.3 7.1 5.6 9.4
10.0 13.9 ---
12.0 (36.4)
---
10.5 11.1 8.2
11.4
10.2 0.7
100.0 100.0 100.0 100.0 100.0 100.0
100.0 100.0 100.0 100.0 100.0
100.0 100.0
100.0 100.0 100.0 100.0
100.0 100.0
--- 100.0
(100.0) ---
100.0 100.0 100.0 100.0
100.0 100.0
29.43 29.34 28.85 28.17 28.36 26.40
29.86 29.67 28.07 29.47 31.87
28.96 30.05
30.18 28.15 27.96 29.47
29.31 30.30
--- 29.29
(34.45) ---
29.53 29.89 28.69 29.64
29.34 26.6
537 816 933 852 865
3,612
66 486
3,960 3,093 1,754
6,077 3,282
4,042 1,732 1,186 2,399
8,912 163
06 258
11 02
2,746 376
2,737 3,500
9,359 8,193
Note: Total may not add up to N due to missing cases. a Literates but did not attend school, are also included. 1 Total figure may not add to 100 percent due to ‘don’t know’ or ‘missing cases. ( ) Based on 10-20 unweighted cases. -- Percentage not shown for less than 10 cases.** Unweighted cases.
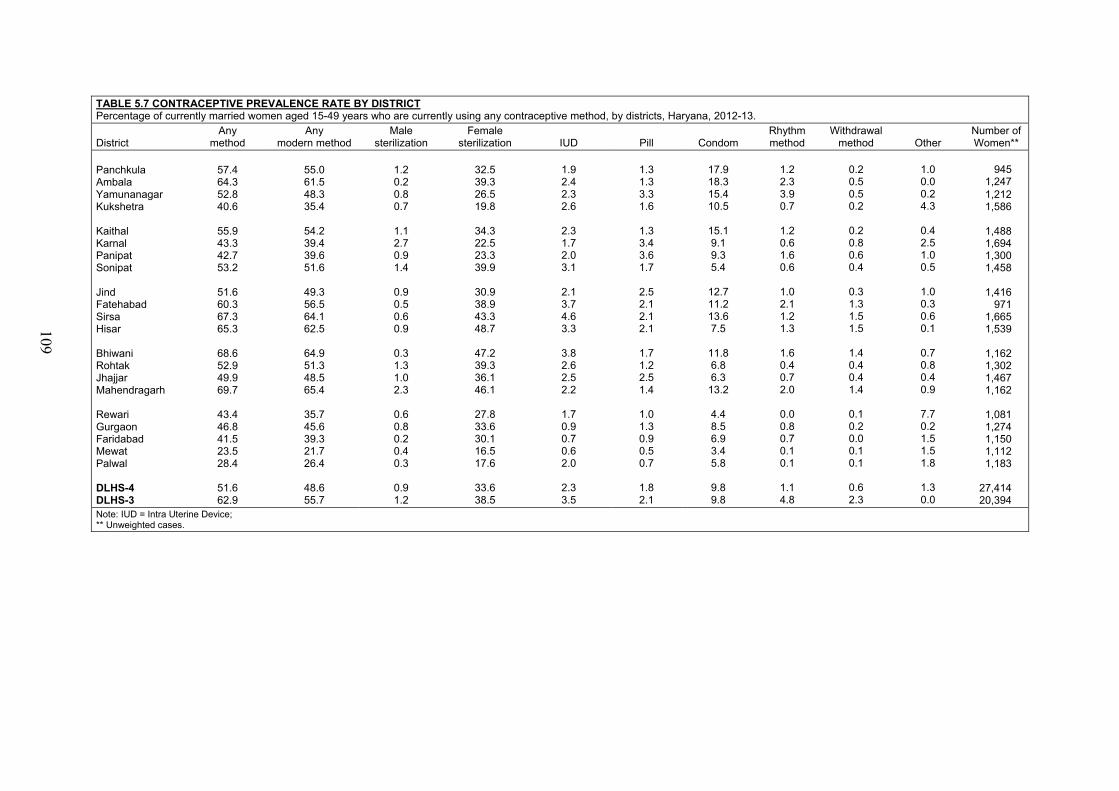
109
TABLE 5.7 CONTRACEPTIVE PREVALENCE RATE BY DISTRICT Percentage of currently married women aged 15-49 years who are currently using any contraceptive method, by districts, Haryana, 2012-13.
District Any
method Any
modern method Male
sterilization Female
sterilization IUD Pill Condom Rhythm method
Withdrawal method Other
Number of Women**
Panchkula Ambala Yamunanagar Kukshetra
Kaithal Karnal Panipat Sonipat
Jind Fatehabad Sirsa Hisar
Bhiwani Rohtak Jhajjar Mahendragarh
Rewari Gurgaon Faridabad Mewat Palwal
DLHS-4 DLHS-3
57.4 64.3 52.8 40.6
55.9 43.3 42.7 53.2
51.6 60.3 67.3 65.3
68.6 52.9 49.9 69.7
43.4 46.8 41.5 23.5 28.4
51.6 62.9
55.0 61.5 48.3 35.4
54.2 39.4 39.6 51.6
49.3 56.5 64.1 62.5
64.9 51.3 48.5 65.4
35.7 45.6 39.3 21.7 26.4
48.6 55.7
1.2 0.2 0.8 0.7
1.1 2.7 0.9 1.4
0.9 0.5 0.6 0.9
0.3 1.3 1.0 2.3
0.6 0.8 0.2 0.4 0.3
0.9 1.2
32.5 39.3 26.5 19.8
34.3 22.5 23.3 39.9
30.9 38.9 43.3 48.7
47.2 39.3 36.1 46.1
27.8 33.6 30.1 16.5 17.6
33.6 38.5
1.9 2.4 2.3 2.6
2.3 1.7 2.0 3.1
2.1 3.7 4.6 3.3
3.8 2.6 2.5 2.2
1.7 0.9 0.7 0.6 2.0
2.3 3.5
1.3 1.3 3.3 1.6
1.3 3.4 3.6 1.7
2.5 2.1 2.1 2.1
1.7 1.2 2.5 1.4
1.0 1.3 0.9 0.5 0.7
1.8 2.1
17.9 18.3 15.4 10.5
15.1 9.1 9.3 5.4
12.7 11.2 13.6 7.5
11.8 6.8 6.3
13.2
4.4 8.5 6.9 3.4 5.8
9.8 9.8
1.2 2.3 3.9 0.7
1.2 0.6 1.6 0.6
1.0 2.1 1.2 1.3
1.6 0.4 0.7 2.0
0.0 0.8 0.7 0.1 0.1
1.1 4.8
0.2 0.5 0.5 0.2
0.2 0.8 0.6 0.4
0.3 1.3 1.5 1.5
1.4 0.4 0.4 1.4
0.1 0.2 0.0 0.1 0.1
0.6 2.3
1.0 0.0 0.2 4.3
0.4 2.5 1.0 0.5
1.0 0.3 0.6 0.1
0.7 0.8 0.4 0.9
7.7 0.2 1.5 1.5 1.8
1.3 0.0
945 1,247 1,212 1,586
1,488 1,694 1,300 1,458
1,416 971
1,665 1,539
1,162 1,302 1,467 1,162
1,081 1,274 1,150 1,112 1,183
27,414 20,394
Note: IUD = Intra Uterine Device; ** Unweighted cases.
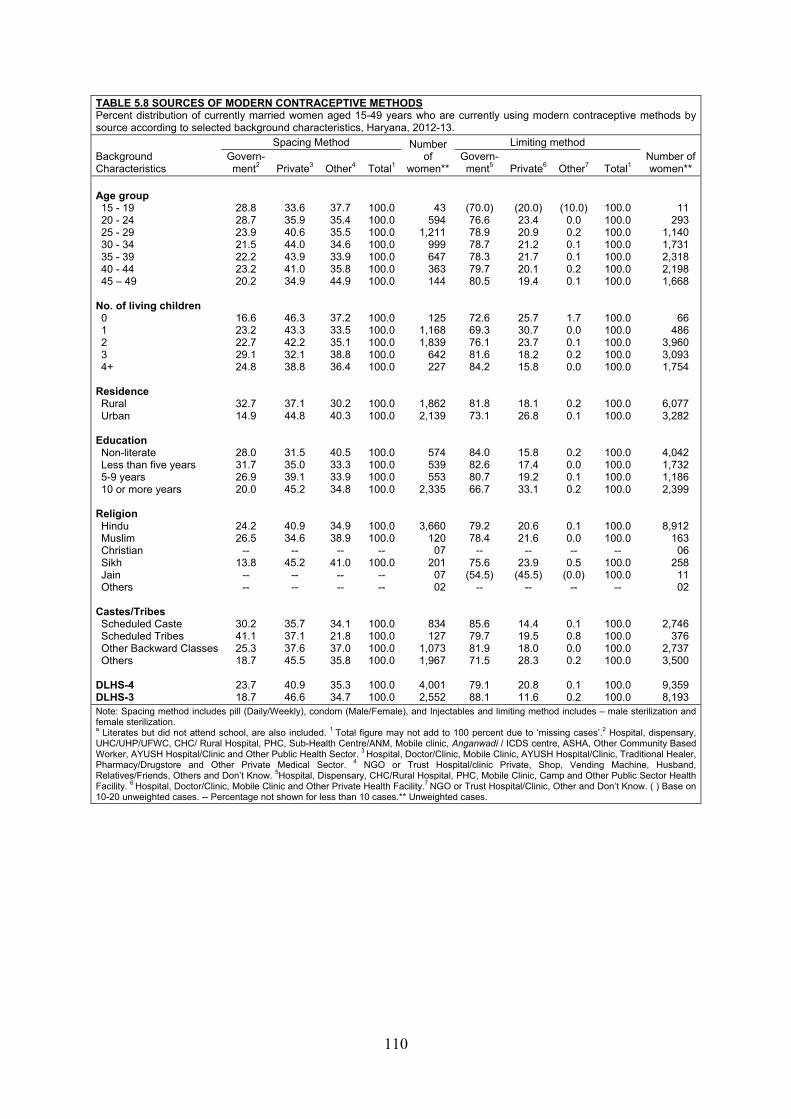
110
TABLE 5.8 SOURCES OF MODERN CONTRACEPTIVE METHODS Percent distribution of currently married women aged 15-49 years who are currently using modern contraceptive methods by source according to selected background characteristics, Haryana, 2012-13.
Background Characteristics
Spacing Method Number of
women**
Limiting method Number ofwomen**
Govern-ment2 Private3 Other4 Total1
Govern-ment5 Private6 Other7 Total1
Age group 15 - 19 20 - 24 25 - 29 30 - 34 35 - 39 40 - 44 45 – 49
No. of living children 0 1 2 3 4+
Residence Rural Urban
Education Non-literate Less than five years 5-9 years 10 or more years
Religion Hindu Muslim Christian Sikh Jain Others
Castes/Tribes Scheduled Caste Scheduled Tribes Other Backward Classes Others
DLHS-4 DLHS-3
28.8 28.7 23.9 21.5 22.2 23.2 20.2
16.6 23.2 22.7 29.1 24.8
32.7 14.9
28.0 31.7 26.9 20.0
24.2 26.5
-- 13.8
-- --
30.2 41.1 25.3 18.7
23.7 18.7
33.6 35.9 40.6 44.0 43.9 41.0 34.9
46.3 43.3 42.2 32.1 38.8
37.1 44.8
31.5 35.0 39.1 45.2
40.9 34.6
-- 45.2
-- --
35.7 37.1 37.6 45.5
40.9 46.6
37.7 35.4 35.5 34.6 33.9 35.8 44.9
37.2 33.5 35.1 38.8 36.4
30.2 40.3
40.5 33.3 33.9 34.8
34.9 38.9
-- 41.0
-- --
34.1 21.8 37.0 35.8
35.3 34.7
100.0 100.0 100.0 100.0 100.0 100.0 100.0
100.0 100.0 100.0 100.0 100.0
100.0 100.0
100.0 100.0 100.0 100.0
100.0 100.0
-- 100.0
-- --
100.0 100.0 100.0 100.0
100.0 100.0
43 594
1,211 999 647 363 144
125 1,168 1,839
642 227
1,862 2,139
574 539 553
2,335
3,660 120 07
201 07 02
834 127
1,073 1,967
4,001 2,552
(70.0) 76.6 78.9 78.7 78.3 79.7 80.5
72.6 69.3 76.1 81.6 84.2
81.8 73.1
84.0 82.6 80.7 66.7
79.2 78.4
-- 75.6
(54.5) --
85.6 79.7 81.9 71.5
79.1 88.1
(20.0) 23.4 20.9 21.2 21.7 20.1 19.4
25.7 30.7 23.7 18.2 15.8
18.1 26.8
15.8 17.4 19.2 33.1
20.6 21.6
-- 23.9
(45.5) --
14.4 19.5 18.0 28.3
20.8 11.6
(10.0) 0.0 0.2 0.1 0.1 0.2 0.1
1.7 0.0 0.1 0.2 0.0
0.2 0.1
0.2 0.0 0.1 0.2
0.1 0.0 --
0.5 (0.0)
--
0.1 0.8 0.0 0.2
0.1 0.2
100.0 100.0 100.0 100.0 100.0 100.0 100.0
100.0 100.0 100.0 100.0 100.0
100.0 100.0
100.0 100.0 100.0 100.0
100.0 100.0
-- 100.0 100.0
--
100.0 100.0 100.0 100.0
100.0 100.0
11 293
1,140 1,731 2,318 2,198 1,668
66 486
3,960 3,093 1,754
6,077 3,282
4,042 1,732 1,186 2,399
8,912 163 06
258 11 02
2,746 376
2,737 3,500
9,359 8,193
Note: Spacing method includes pill (Daily/Weekly), condom (Male/Female), and Injectables and limiting method includes – male sterilization and female sterilization.a Literates but did not attend school, are also included. 1 Total figure may not add to 100 percent due to ‘missing cases’.2 Hospital, dispensary, UHC/UHP/UFWC, CHC/ Rural Hospital, PHC, Sub-Health Centre/ANM, Mobile clinic, Anganwadi / ICDS centre, ASHA, Other Community Based Worker, AYUSH Hospital/Clinic and Other Public Health Sector. 3 Hospital, Doctor/Clinic, Mobile Clinic, AYUSH Hospital/Clinic, Traditional Healer, Pharmacy/Drugstore and Other Private Medical Sector. 4 NGO or Trust Hospital/clinic Private, Shop, Vending Machine, Husband, Relatives/Friends, Others and Don’t Know. 5Hospital, Dispensary, CHC/Rural Hospital, PHC, Mobile Clinic, Camp and Other Public Sector Health Facility. 6 Hospital, Doctor/Clinic, Mobile Clinic and Other Private Health Facility.7 NGO or Trust Hospital/Clinic, Other and Don’t Know. ( ) Base on 10-20 unweighted cases. -- Percentage not shown for less than 10 cases.** Unweighted cases.
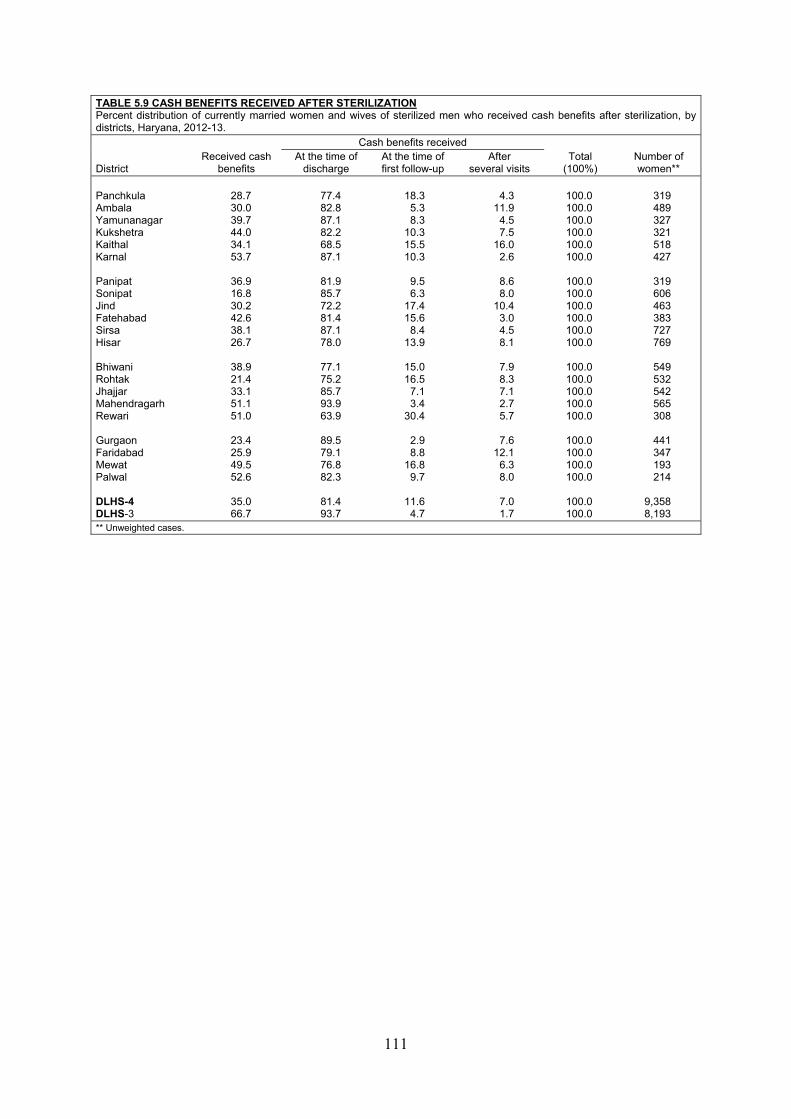
111
TABLE 5.9 CASH BENEFITS RECEIVED AFTER STERILIZATION Percent distribution of currently married women and wives of sterilized men who received cash benefits after sterilization, by districts, Haryana, 2012-13.
District Received cash
benefits
Cash benefits received Total
(100%) Number of women**
At the time of discharge
At the time of first follow-up
After several visits
Panchkula Ambala Yamunanagar Kukshetra Kaithal Karnal Panipat Sonipat Jind Fatehabad Sirsa Hisar Bhiwani Rohtak Jhajjar Mahendragarh Rewari Gurgaon Faridabad Mewat Palwal DLHS-4 DLHS-3
28.7 30.0 39.7 44.0 34.1 53.7
36.9 16.8 30.2 42.6 38.1 26.7
38.9 21.4 33.1 51.1 51.0
23.4 25.9 49.5 52.6
35.0 66.7
77.4 82.8 87.1 82.2 68.5 87.1
81.9 85.7 72.2 81.4 87.1 78.0
77.1 75.2 85.7 93.9 63.9
89.5 79.1 76.8 82.3
81.4 93.7
18.3
5.3 8.3
10.3 15.5 10.3
9.5 6.3
17.4 15.6
8.4 13.9
15.0 16.5
7.1 3.4
30.4
2.9 8.8
16.8 9.7
11.6
4.7
4.3
11.9 4.5 7.5
16.0 2.6
8.6 8.0
10.4 3.0 4.5 8.1
7.9 8.3 7.1 2.7 5.7
7.6
12.1 6.3 8.0
7.0 1.7
100.0 100.0 100.0 100.0 100.0 100.0
100.0 100.0 100.0 100.0 100.0 100.0
100.0 100.0 100.0 100.0 100.0
100.0 100.0 100.0 100.0
100.0 100.0
319 489 327 321 518 427
319 606 463 383 727 769
549 532 542 565 308
441 347 193 214
9,358 8,193
** Unweighted cases.
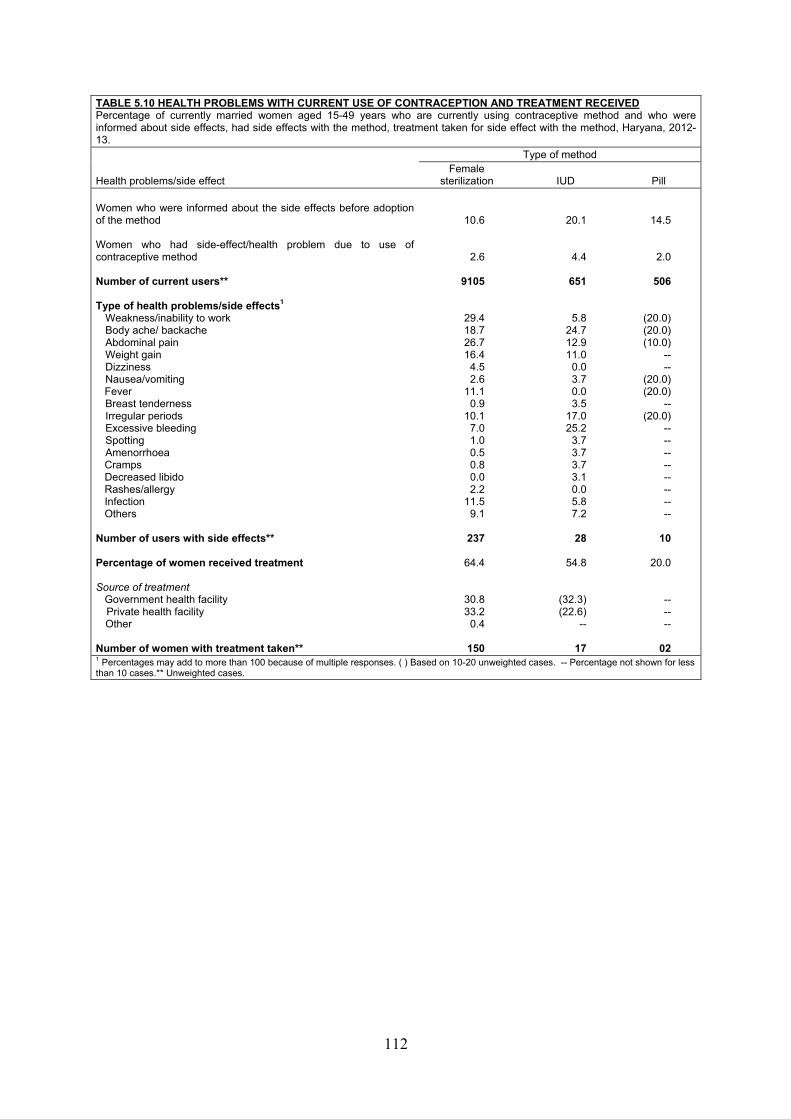
112
TABLE 5.10 HEALTH PROBLEMS WITH CURRENT USE OF CONTRACEPTION AND TREATMENT RECEIVED Percentage of currently married women aged 15-49 years who are currently using contraceptive method and who were informed about side effects, had side effects with the method, treatment taken for side effect with the method, Haryana, 2012-13.
Health problems/side effect
Type of method Female
sterilization IUD Pill Women who were informed about the side effects before adoption of the method Women who had side-effect/health problem due to use of contraceptive method Number of current users** Type of health problems/side effects1 Weakness/inability to work Body ache/ backache Abdominal pain Weight gain Dizziness Nausea/vomiting Fever Breast tenderness Irregular periods Excessive bleeding Spotting Amenorrhoea Cramps Decreased libido Rashes/allergy Infection Others Number of users with side effects** Percentage of women received treatment Source of treatment Government health facility Private health facility Other Number of women with treatment taken**
10.6
2.6
9105
29.4 18.7 26.7 16.4
4.5 2.6
11.1 0.9
10.1 7.0 1.0 0.5 0.8 0.0 2.2
11.5 9.1
237
64.4
30.8 33.2
0.4
150
20.1
4.4
651
5.8 24.7 12.9 11.0
0.0 3.7 0.0 3.5
17.0 25.2
3.7 3.7 3.7 3.1 0.0 5.8 7.2
28
54.8
(32.3) (22.6)
--
17
14.5
2.0
506
(20.0) (20.0) (10.0)
-- --
(20.0) (20.0)
-- (20.0)
-- -- -- -- -- -- -- --
10
20.0
-- -- --
02
1 Percentages may add to more than 100 because of multiple responses. ( ) Based on 10-20 unweighted cases. -- Percentage not shown for less than 10 cases.** Unweighted cases.
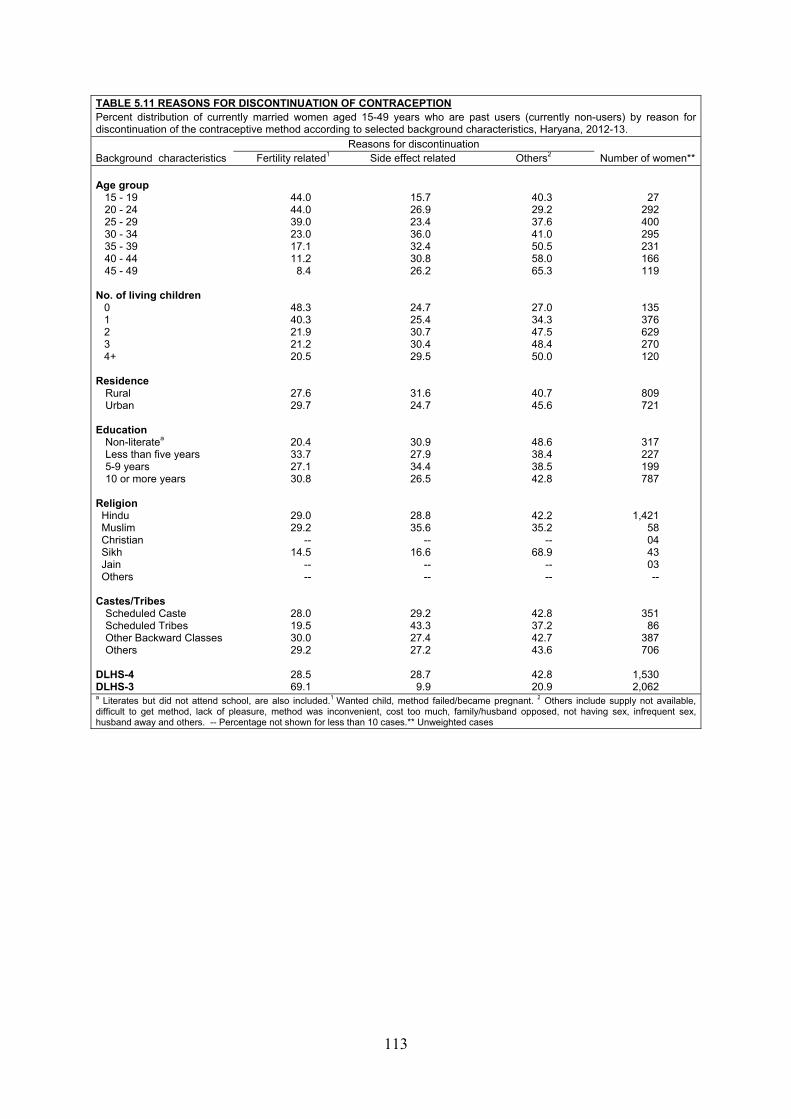
113
TABLE 5.11 REASONS FOR DISCONTINUATION OF CONTRACEPTION Percent distribution of currently married women aged 15-49 years who are past users (currently non-users) by reason for discontinuation of the contraceptive method according to selected background characteristics, Haryana, 2012-13.
Background characteristics Reasons for discontinuation
Number of women**Fertility related1 Side effect related Others2 Age group 15 - 19 20 - 24 25 - 29 30 - 34 35 - 39 40 - 44 45 - 49 No. of living children
0 1 2 3 4+
Residence Rural Urban Education Non-literatea Less than five years 5-9 years 10 or more years Religion Hindu Muslim Christian Sikh Jain Others
Castes/Tribes Scheduled Caste Scheduled Tribes Other Backward Classes Others DLHS-4 DLHS-3
44.0 44.0 39.0 23.0 17.1 11.2
8.4
48.3 40.3 21.9 21.2 20.5
27.6 29.7
20.4 33.7 27.1 30.8
29.0 29.2
-- 14.5
-- --
28.0 19.5 30.0 29.2
28.5 69.1
15.7 26.9 23.4 36.0 32.4 30.8 26.2
24.7 25.4 30.7 30.4 29.5
31.6 24.7
30.9 27.9 34.4 26.5
28.8 35.6
-- 16.6
-- --
29.2 43.3 27.4 27.2
28.7
9.9
40.3 29.2 37.6 41.0 50.5 58.0 65.3
27.0 34.3 47.5 48.4 50.0
40.7 45.6
48.6 38.4 38.5 42.8
42.2 35.2
-- 68.9
-- --
42.8 37.2 42.7 43.6
42.8 20.9
27 292 400 295 231 166 119
135 376 629 270 120
809 721
317 227 199 787
1,421 58 04 43 03 --
351 86
387 706
1,530 2,062
a Literates but did not attend school, are also included.1 Wanted child, method failed/became pregnant. 2 Others include supply not available, difficult to get method, lack of pleasure, method was inconvenient, cost too much, family/husband opposed, not having sex, infrequent sex, husband away and others. -- Percentage not shown for less than 10 cases.** Unweighted cases
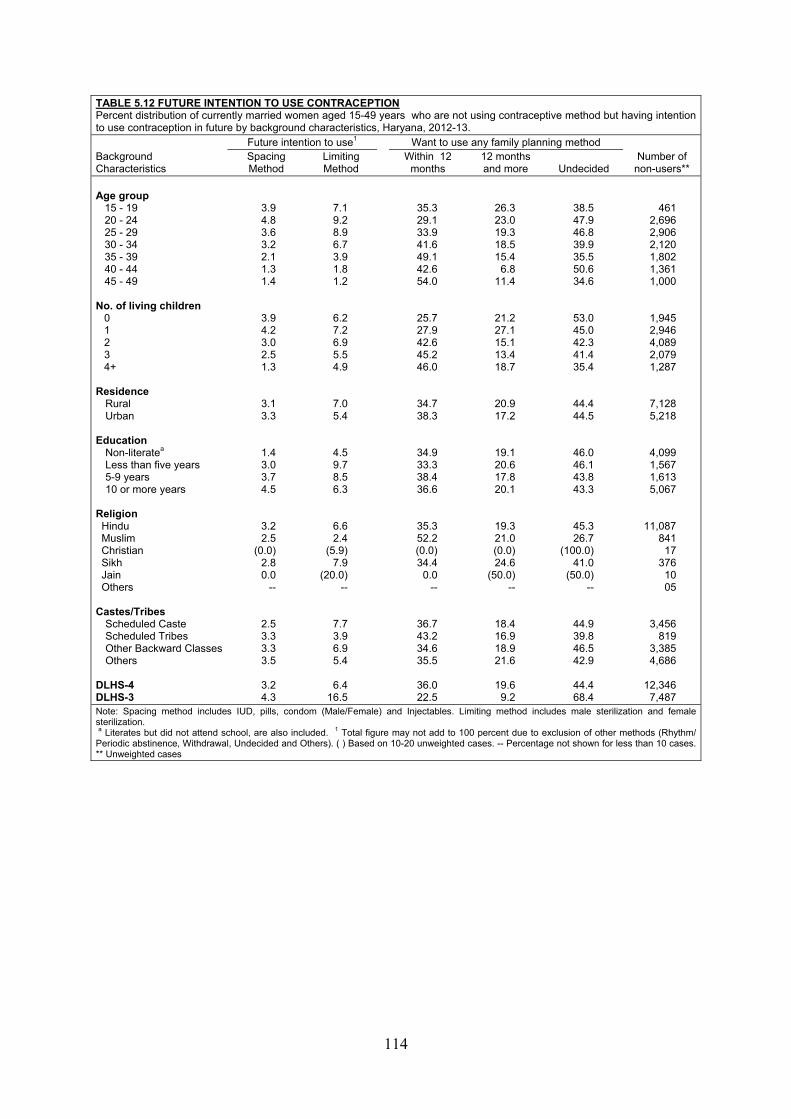
114
TABLE 5.12 FUTURE INTENTION TO USE CONTRACEPTION Percent distribution of currently married women aged 15-49 years who are not using contraceptive method but having intention to use contraception in future by background characteristics, Haryana, 2012-13.
Background Characteristics
Future intention to use1
Want to use any family planning method Number of
non-users** Spacing Method
Limiting Method
Within 12 months
12 months and more Undecided
Age group 15 - 19 20 - 24 25 - 29 30 - 34 35 - 39 40 - 44 45 - 49 No. of living children
0 1 2 3 4+
Residence Rural Urban Education Non-literatea Less than five years 5-9 years 10 or more years Religion Hindu Muslim Christian Sikh Jain Others
Castes/Tribes Scheduled Caste Scheduled Tribes Other Backward Classes Others DLHS-4 DLHS-3
3.9 4.8 3.6 3.2 2.1 1.3 1.4
3.9 4.2 3.0 2.5 1.3
3.1 3.3
1.4 3.0 3.7 4.5
3.2 2.5
(0.0) 2.8 0.0
--
2.5 3.3 3.3 3.5
3.2 4.3
7.1 9.2 8.9 6.7 3.9 1.8 1.2
6.2 7.2 6.9 5.5 4.9
7.0 5.4
4.5 9.7 8.5 6.3
6.6 2.4
(5.9) 7.9
(20.0) --
7.7 3.9 6.9 5.4
6.4
16.5
35.3 29.1 33.9 41.6 49.1 42.6 54.0
25.7 27.9 42.6 45.2 46.0
34.7 38.3
34.9 33.3 38.4 36.6
35.3 52.2 (0.0) 34.4
0.0 --
36.7 43.2 34.6 35.5
36.0 22.5
26.3 23.0 19.3 18.5 15.4
6.8 11.4
21.2 27.1 15.1 13.4 18.7
20.9 17.2
19.1 20.6 17.8 20.1
19.3 21.0 (0.0) 24.6
(50.0) --
18.4 16.9 18.9 21.6
19.6
9.2
38.5 47.9 46.8 39.9 35.5 50.6 34.6
53.0 45.0 42.3 41.4 35.4
44.4 44.5
46.0 46.1 43.8 43.3
45.3 26.7
(100.0) 41.0
(50.0) --
44.9 39.8 46.5 42.9
44.4 68.4
461 2,696 2,906 2,120 1,802 1,361 1,000
1,945 2,946 4,089 2,079 1,287
7,128 5,218
4,099 1,567 1,613 5,067
11,087 841
17 376
10 05
3,456 819
3,385 4,686
12,346
7,487 Note: Spacing method includes IUD, pills, condom (Male/Female) and Injectables. Limiting method includes male sterilization and female sterilization. a Literates but did not attend school, are also included. 1 Total figure may not add to 100 percent due to exclusion of other methods (Rhythm/ Periodic abstinence, Withdrawal, Undecided and Others). ( ) Based on 10-20 unweighted cases. -- Percentage not shown for less than 10 cases. ** Unweighted cases
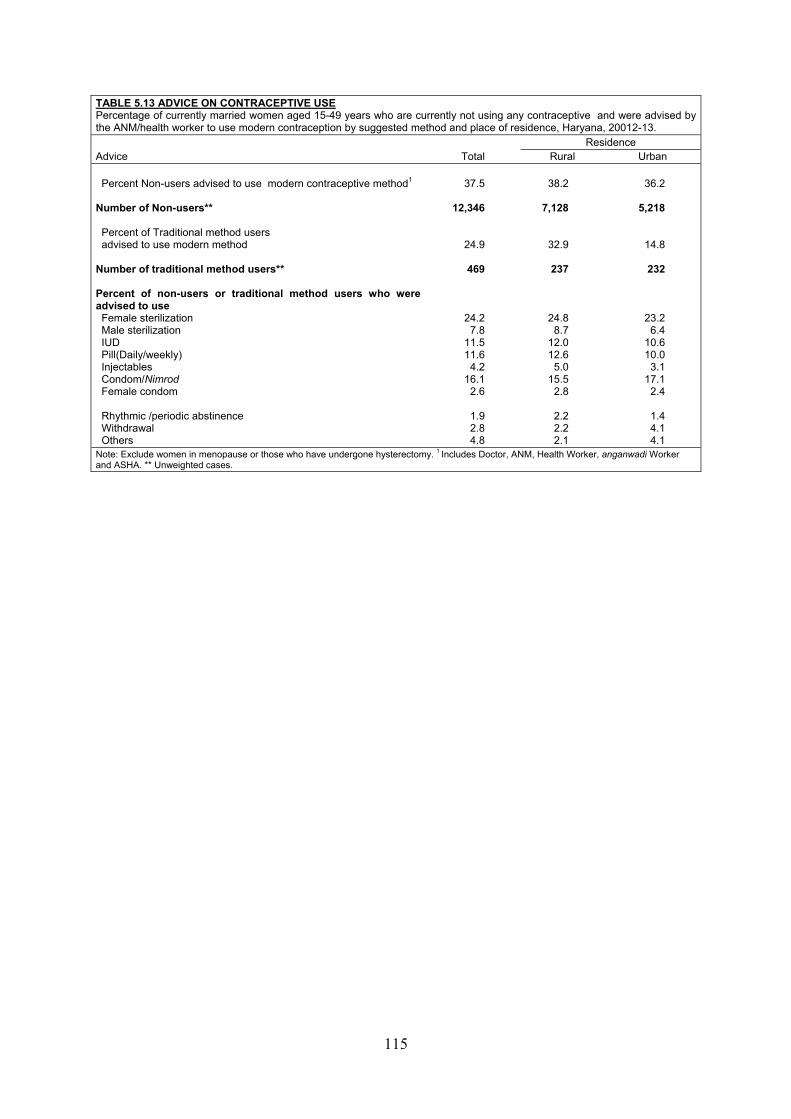
115
TABLE 5.13 ADVICE ON CONTRACEPTIVE USE Percentage of currently married women aged 15-49 years who are currently not using any contraceptive and were advised by the ANM/health worker to use modern contraception by suggested method and place of residence, Haryana, 20012-13.
Advice Total Residence
Rural Urban Percent Non-users advised to use modern contraceptive method1
Number of Non-users** Percent of Traditional method users advised to use modern method
Number of traditional method users** Percent of non-users or traditional method users who were advised to use Female sterilization Male sterilization IUD Pill(Daily/weekly) Injectables Condom/Nimrod Female condom Rhythmic /periodic abstinence Withdrawal Others
37.5
12,346
24.9
469
24.2 7.8
11.5 11.6
4.2 16.1
2.6
1.9 2.8 4.8
38.2
7,128
32.9
237
24.8 8.7
12.0 12.6
5.0 15.5
2.8
2.2 2.2 2.1
36.2
5,218
14.8
232
23.2 6.4
10.6 10.0
3.1 17.1
2.4
1.4 4.1 4.1
Note: Exclude women in menopause or those who have undergone hysterectomy. 1 Includes Doctor, ANM, Health Worker, anganwadi Worker and ASHA. ** Unweighted cases.
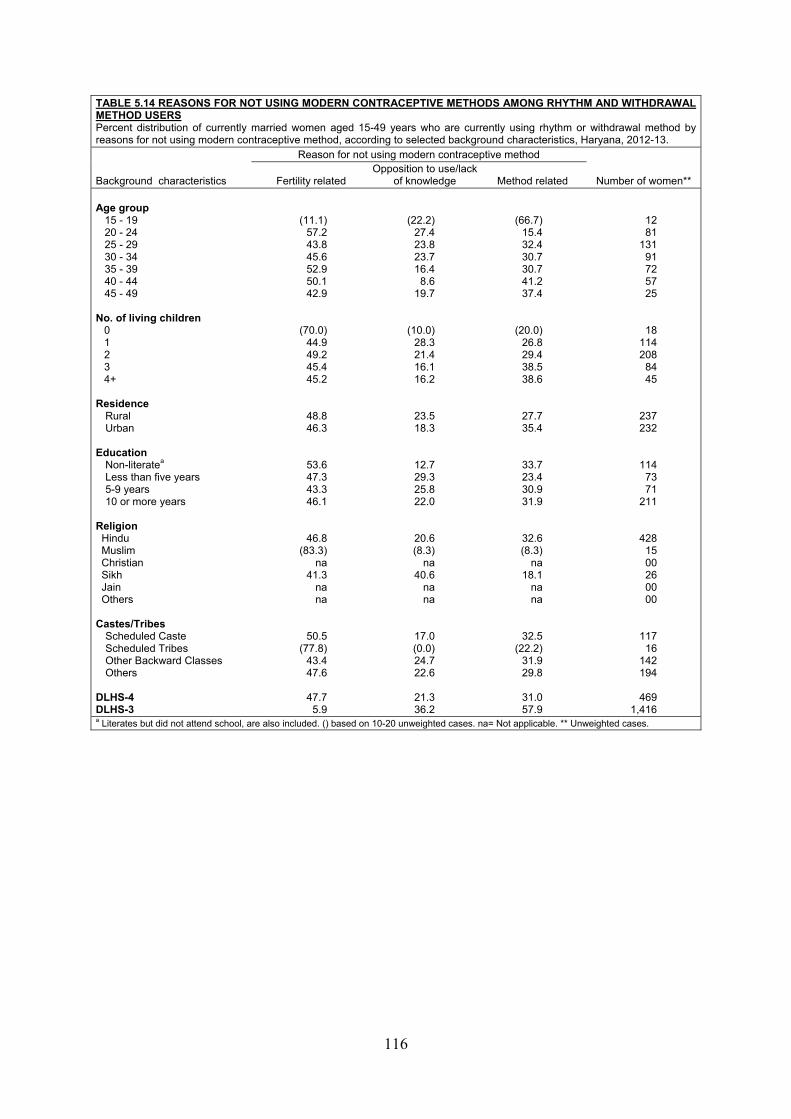
116
TABLE 5.14 REASONS FOR NOT USING MODERN CONTRACEPTIVE METHODS AMONG RHYTHM AND WITHDRAWAL METHOD USERS Percent distribution of currently married women aged 15-49 years who are currently using rhythm or withdrawal method by reasons for not using modern contraceptive method, according to selected background characteristics, Haryana, 2012-13.
Background characteristics
Reason for not using modern contraceptive method
Number of women** Fertility related Opposition to use/lack
of knowledge Method related Age group 15 - 19 20 - 24 25 - 29 30 - 34 35 - 39 40 - 44 45 - 49
No. of living children
0 1 2 3 4+
Residence Rural Urban
Education Non-literatea Less than five years 5-9 years 10 or more years
Religion Hindu Muslim Christian Sikh Jain Others
Castes/Tribes Scheduled Caste Scheduled Tribes Other Backward Classes Others
DLHS-4 DLHS-3
(11.1) 57.2 43.8 45.6 52.9 50.1 42.9
(70.0) 44.9 49.2 45.4 45.2
48.8 46.3
53.6 47.3 43.3 46.1
46.8 (83.3)
na 41.3
na na
50.5 (77.8)
43.4 47.6
47.7
5.9
(22.2) 27.4 23.8 23.7 16.4
8.6 19.7
(10.0) 28.3 21.4 16.1 16.2
23.5 18.3
12.7 29.3 25.8 22.0
20.6 (8.3)
na 40.6
na na
17.0 (0.0) 24.7 22.6
21.3 36.2
(66.7) 15.4 32.4 30.7 30.7 41.2 37.4
(20.0) 26.8 29.4 38.5 38.6
27.7 35.4
33.7 23.4 30.9 31.9
32.6 (8.3)
na 18.1
na na
32.5 (22.2)
31.9 29.8
31.0 57.9
12 81
131 91 72 57 25
18 114 208
84 45
237 232
114 73 71
211
428 15 00 26 00 00
117 16
142 194
469
1,416 a Literates but did not attend school, are also included. () based on 10-20 unweighted cases. na= Not applicable. ** Unweighted cases.
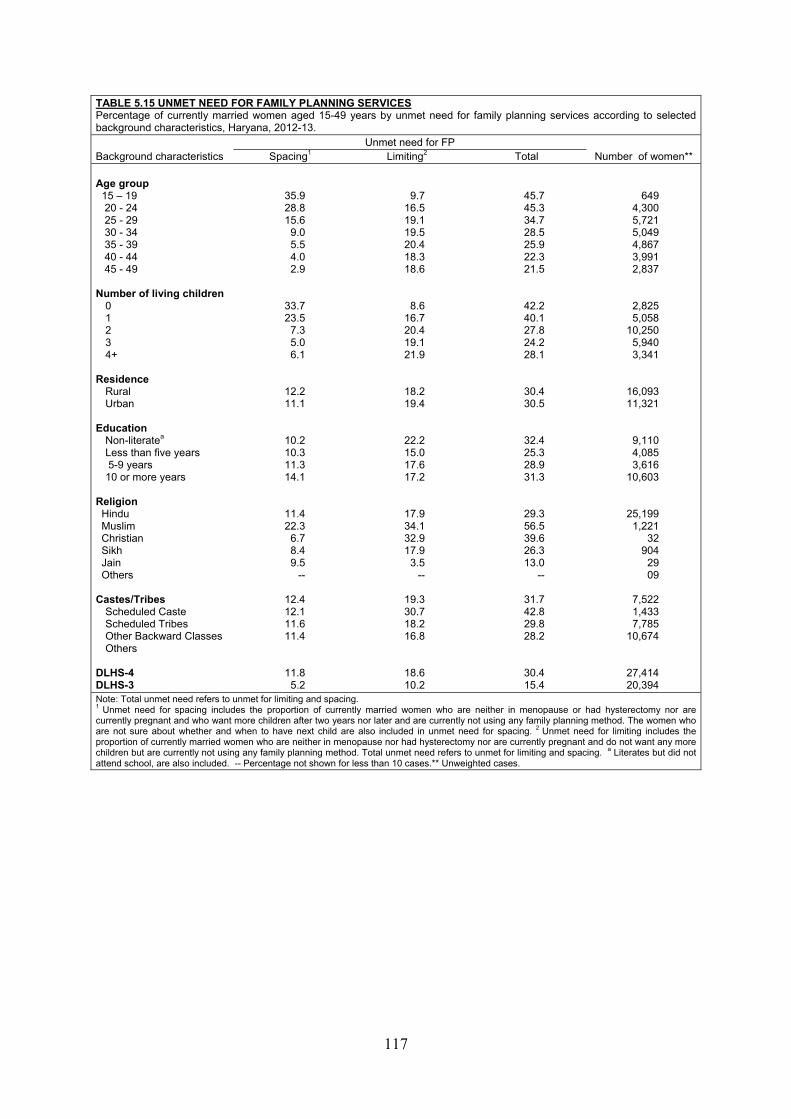
117
TABLE 5.15 UNMET NEED FOR FAMILY PLANNING SERVICES Percentage of currently married women aged 15-49 years by unmet need for family planning services according to selected background characteristics, Haryana, 2012-13.
Background characteristics Unmet need for FP
Number of women** Spacing1 Limiting2 Total Age group 15 – 19 20 - 24 25 - 29 30 - 34 35 - 39 40 - 44 45 - 49 Number of living children 0 1 2 3 4+ Residence Rural Urban Education Non-literatea Less than five years 5-9 years 10 or more years Religion Hindu Muslim Christian Sikh Jain Others
Castes/Tribes Scheduled Caste Scheduled Tribes Other Backward Classes Others DLHS-4 DLHS-3
35.9 28.8 15.6
9.0 5.5 4.0 2.9
33.7 23.5
7.3 5.0 6.1
12.2 11.1
10.2 10.3 11.3 14.1
11.4 22.3
6.7 8.4 9.5
--
12.4 12.1 11.6 11.4
11.8 5.2
9.7 16.5 19.1 19.5 20.4 18.3 18.6
8.6 16.7 20.4 19.1 21.9
18.2 19.4
22.2 15.0 17.6 17.2
17.9 34.1 32.9 17.9
3.5 --
19.3 30.7 18.2 16.8
18.6 10.2
45.7 45.3 34.7 28.5 25.9 22.3 21.5
42.2 40.1 27.8 24.2 28.1
30.4 30.5
32.4 25.3 28.9 31.3
29.3 56.5 39.6 26.3 13.0
--
31.7 42.8 29.8 28.2
30.4 15.4
649 4,300 5,721 5,049 4,867 3,991 2,837
2,825 5,058
10,250 5,940 3,341
16,093 11,321
9,110 4,085 3,616
10,603
25,199 1,221
32 904
29 09
7,522 1,433 7,785
10,674
27,414 20,394
Note: Total unmet need refers to unmet for limiting and spacing. 1 Unmet need for spacing includes the proportion of currently married women who are neither in menopause or had hysterectomy nor are currently pregnant and who want more children after two years nor later and are currently not using any family planning method. The women who are not sure about whether and when to have next child are also included in unmet need for spacing. 2 Unmet need for limiting includes the proportion of currently married women who are neither in menopause nor had hysterectomy nor are currently pregnant and do not want any more children but are currently not using any family planning method. Total unmet need refers to unmet for limiting and spacing. a Literates but did not attend school, are also included. -- Percentage not shown for less than 10 cases.** Unweighted cases.
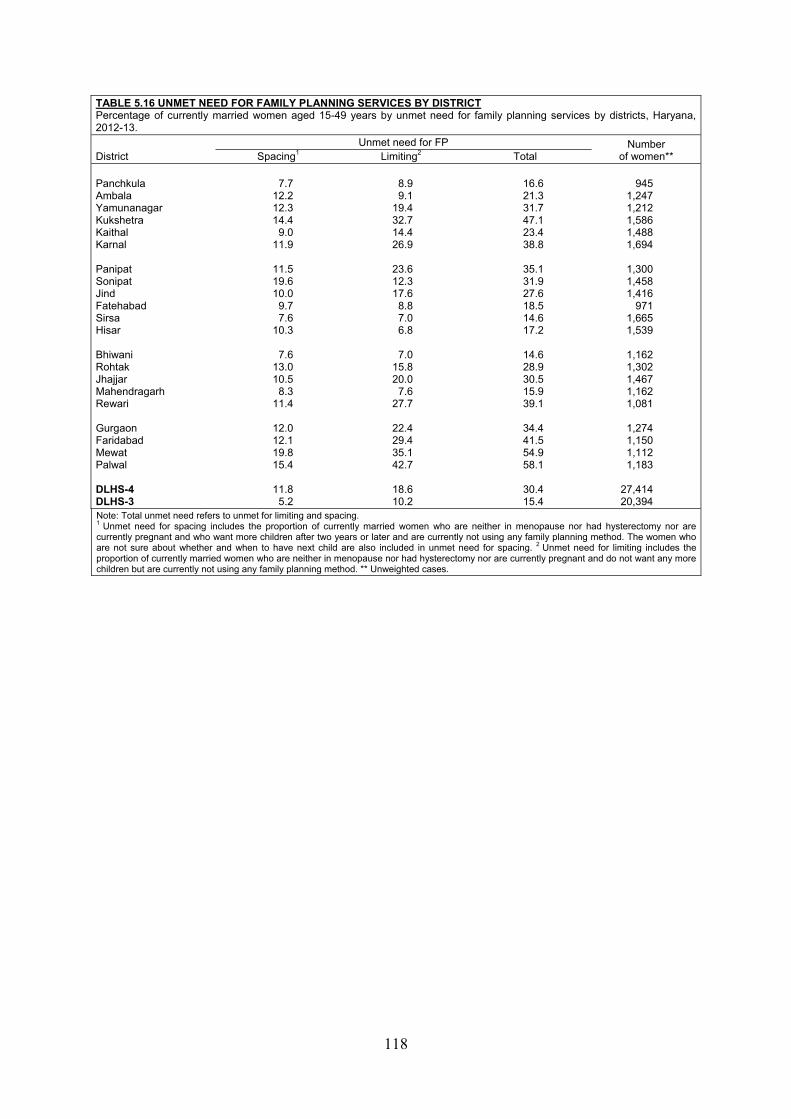
118
TABLE 5.16 UNMET NEED FOR FAMILY PLANNING SERVICES BY DISTRICT Percentage of currently married women aged 15-49 years by unmet need for family planning services by districts, Haryana, 2012-13.
District Unmet need for FP Number
of women** Spacing1 Limiting2 Total Panchkula Ambala Yamunanagar Kukshetra Kaithal Karnal Panipat Sonipat Jind Fatehabad Sirsa Hisar Bhiwani Rohtak Jhajjar Mahendragarh Rewari Gurgaon Faridabad Mewat Palwal DLHS-4 DLHS-3
7.7
12.2 12.3 14.4
9.0 11.9
11.5 19.6 10.0
9.7 7.6
10.3
7.6 13.0 10.5
8.3 11.4
12.0 12.1 19.8 15.4
11.8
5.2
8.9 9.1
19.4 32.7 14.4 26.9
23.6 12.3 17.6
8.8 7.0 6.8
7.0
15.8 20.0
7.6 27.7
22.4 29.4 35.1 42.7
18.6 10.2
16.6 21.3 31.7 47.1 23.4 38.8
35.1 31.9 27.6 18.5 14.6 17.2
14.6 28.9 30.5 15.9 39.1
34.4 41.5 54.9 58.1
30.4 15.4
945
1,247 1,212 1,586 1,488 1,694
1,300 1,458 1,416
971 1,665 1,539
1,162 1,302 1,467 1,162 1,081
1,274 1,150 1,112 1,183
27,414 20,394
Note: Total unmet need refers to unmet for limiting and spacing. 1 Unmet need for spacing includes the proportion of currently married women who are neither in menopause nor had hysterectomy nor are currently pregnant and who want more children after two years or later and are currently not using any family planning method. The women who are not sure about whether and when to have next child are also included in unmet need for spacing. 2 Unmet need for limiting includes the proportion of currently married women who are neither in menopause nor had hysterectomy nor are currently pregnant and do not want any more children but are currently not using any family planning method. ** Unweighted cases.
REPRODUCTIVE HEALTH PROBLEMS AND AWARENESS

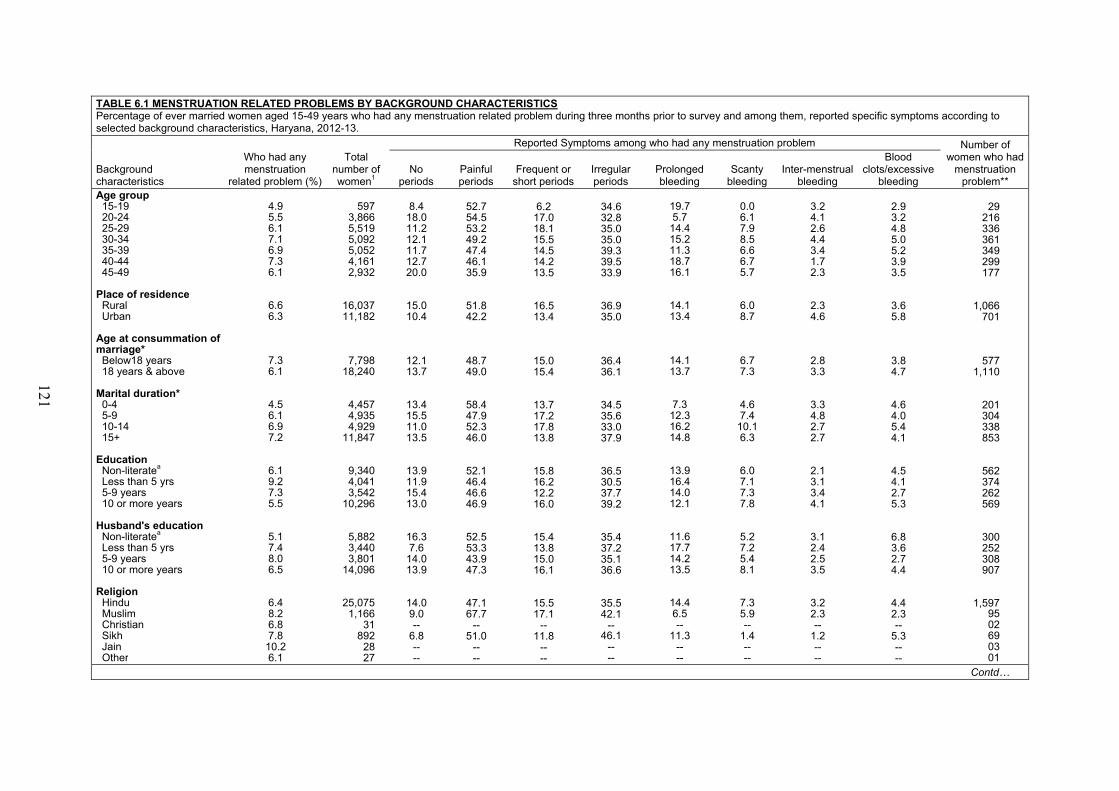
121
TABLE 6.1 MENSTRUATION RELATED PROBLEMS BY BACKGROUND CHARACTERISTICS Percentage of ever married women aged 15-49 years who had any menstruation related problem during three months prior to survey and among them, reported specific symptoms according to selected background characteristics, Haryana, 2012-13.
Background characteristics
Who had any menstruation
related problem (%)
Total number of women1
Reported Symptoms among who had any menstruation problem Number of women who had
menstruation problem**
No periods
Painful periods
Frequent or short periods
Irregular periods
Prolonged bleeding
Scanty bleeding
Inter-menstrual bleeding
Blood clots/excessive
bleeding Age group 15-19 20-24 25-29 30-34 35-39 40-44 45-49
Place of residence Rural Urban
Age at consummation of marriage* Below18 years 18 years & above
Marital duration* 0-4 5-9 10-14 15+
Education Non-literatea Less than 5 yrs 5-9 years 10 or more years
Husband's education Non-literatea Less than 5 yrs 5-9 years 10 or more years
Religion Hindu Muslim Christian Sikh Jain Other
4.9 5.5 6.1 7.1 6.9 7.3 6.1
6.6 6.3
7.3 6.1
4.5 6.1 6.9 7.2
6.1 9.2 7.3 5.5
5.1 7.4 8.0 6.5
6.4 8.2 6.8 7.8
10.2 6.1
597 3,866 5,519 5,092 5,052 4,161 2,932
16,037 11,182
7,798 18,240
4,457 4,935 4,929
11,847
9,340 4,041 3,542
10,296
5,882 3,440 3,801
14,096
25,075 1,166
31 892 28 27
8.4 18.0 11.2 12.1 11.7 12.7 20.0
15.0 10.4
12.1 13.7
13.4 15.5 11.0 13.5
13.9 11.9 15.4 13.0
16.3 7.6
14.0 13.9
14.0 9.0 --
6.8 -- --
52.7 54.5 53.2 49.2 47.4 46.1 35.9
51.8 42.2
48.7 49.0
58.4 47.9 52.3 46.0
52.1 46.4 46.6 46.9
52.5 53.3 43.9 47.3
47.1 67.7
-- 51.0
-- --
6.2 17.0 18.1 15.5 14.5 14.2 13.5
16.5 13.4
15.0 15.4
13.7 17.2 17.8 13.8
15.8 16.2 12.2 16.0
15.4 13.8 15.0 16.1
15.5 17.1
-- 11.8
-- --
34.6 32.8 35.0 35.0 39.3 39.5 33.9
36.9 35.0
36.4 36.1
34.5 35.6 33.0 37.9
36.5 30.5 37.7 39.2
35.4 37.2 35.1 36.6
35.5 42.1
-- 46.1
-- --
19.7 5.7
14.4 15.2 11.3 18.7 16.1
14.1 13.4
14.1 13.7
7.3 12.3 16.2 14.8
13.9 16.4 14.0 12.1
11.6 17.7 14.2 13.5
14.4 6.5 --
11.3 -- --
0.0 6.1 7.9 8.5 6.6 6.7 5.7
6.0 8.7
6.7 7.3
4.6 7.4
10.1 6.3
6.0 7.1 7.3 7.8
5.2 7.2 5.4 8.1
7.3 5.9 --
1.4 -- --
3.2 4.1 2.6 4.4 3.4 1.7 2.3
2.3 4.6
2.8 3.3
3.3 4.8 2.7 2.7
2.1 3.1 3.4 4.1
3.1 2.4 2.5 3.5
3.2 2.3 --
1.2 -- --
2.9 3.2 4.8 5.0 5.2 3.9 3.5
3.6 5.8
3.8 4.7
4.6 4.0 5.4 4.1
4.5 4.1 2.7 5.3
6.8 3.6 2.7 4.4
4.4 2.3 --
5.3 -- --
29 216 336 361 349 299 177
1,066 701
577 1,110
201 304 338 853
562 374 262 569
300 252 308 907
1,597 95 02 69 03 01
Contd…
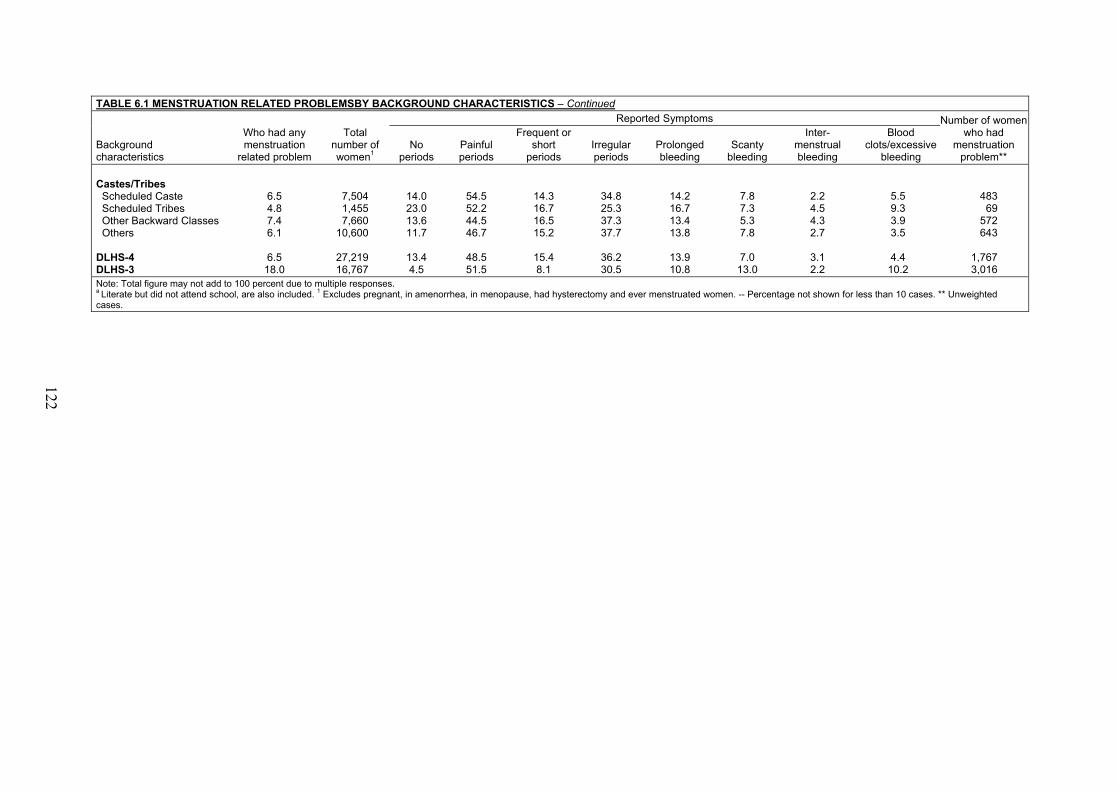
122
TABLE 6.1 MENSTRUATION RELATED PROBLEMSBY BACKGROUND CHARACTERISTICS – Continued
Background characteristics
Who had any menstruation
related problem
Total number of women1
Reported Symptoms Number of women who had
menstruation problem**
No periods
Painful periods
Frequent or short
periods Irregular periods
Prolonged bleeding
Scanty bleeding
Inter-menstrual bleeding
Blood clots/excessive
bleeding
Castes/Tribes Scheduled Caste Scheduled Tribes Other Backward Classes Others
DLHS-4 DLHS-3
6.5 4.8 7.4 6.1
6.5 18.0
7,504 1,455 7,660
10,600
27,219 16,767
14.0 23.0 13.6 11.7
13.4 4.5
54.5 52.2 44.5 46.7
48.5 51.5
14.3 16.7 16.5 15.2
15.4 8.1
34.8 25.3 37.3 37.7
36.2 30.5
14.2 16.7 13.4 13.8
13.9 10.8
7.8 7.3 5.3 7.8
7.0 13.0
2.2 4.5 4.3 2.7
3.1 2.2
5.5 9.3 3.9 3.5
4.4 10.2
483 69
572 643
1,767 3,016
Note: Total figure may not add to 100 percent due to multiple responses. a Literate but did not attend school, are also included. 1 Excludes pregnant, in amenorrhea, in menopause, had hysterectomy and ever menstruated women. -- Percentage not shown for less than 10 cases. ** Unweighted cases.
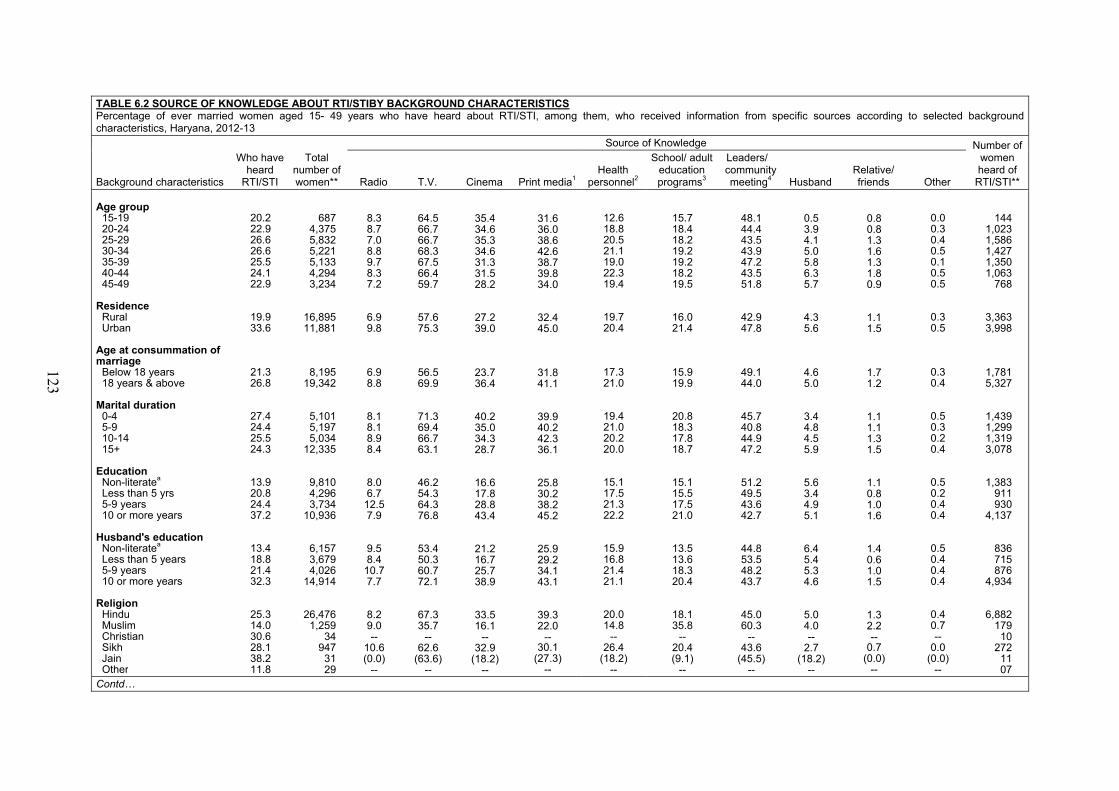
123
TABLE 6.2 SOURCE OF KNOWLEDGE ABOUT RTI/STIBY BACKGROUND CHARACTERISTICS Percentage of ever married women aged 15- 49 years who have heard about RTI/STI, among them, who received information from specific sources according to selected background characteristics, Haryana, 2012-13
Background characteristics
Who have heard
RTI/STI
Total number of women**
Source of Knowledge Number of women heard of
RTI/STI** Radio T.V. Cinema Print media1Health
personnel2
School/ adult education programs3
Leaders/ community meeting4 Husband
Relative/ friends Other
Age group 15-19 20-24 25-29 30-34 35-39 40-44 45-49
Residence Rural Urban
Age at consummation of marriage Below 18 years 18 years & above
Marital duration 0-4 5-9 10-14 15+
Education Non-literatea Less than 5 yrs 5-9 years 10 or more years
Husband's education Non-literatea Less than 5 years 5-9 years 10 or more years
Religion Hindu Muslim Christian Sikh Jain Other
20.2 22.9 26.6 26.6 25.5 24.1 22.9
19.9 33.6
21.3 26.8
27.4 24.4 25.5 24.3
13.9 20.8 24.4 37.2
13.4 18.8 21.4 32.3
25.3 14.0 30.6 28.1 38.2 11.8
687 4,375 5,832 5,221 5,133 4,294 3,234
16,895 11,881
8,195 19,342
5,101 5,197 5,034
12,335
9,810 4,296 3,734
10,936
6,157 3,679 4,026
14,914
26,476 1,259
34 947 31 29
8.3 8.7 7.0 8.8 9.7 8.3 7.2
6.9 9.8
6.9 8.8
8.1 8.1 8.9 8.4
8.0 6.7
12.5 7.9
9.5 8.4
10.7 7.7
8.2 9.0 --
10.6 (0.0)
--
64.5 66.7 66.7 68.3 67.5 66.4 59.7
57.6 75.3
56.5 69.9
71.3 69.4 66.7 63.1
46.2 54.3 64.3 76.8
53.4 50.3 60.7 72.1
67.3 35.7
-- 62.6
(63.6) --
35.4 34.6 35.3 34.6 31.3 31.5 28.2
27.2 39.0
23.7 36.4
40.2 35.0 34.3 28.7
16.6 17.8 28.8 43.4
21.2 16.7 25.7 38.9
33.5 16.1
-- 32.9
(18.2) --
31.6 36.0 38.6 42.6 38.7 39.8 34.0
32.4 45.0
31.8 41.1
39.9 40.2 42.3 36.1
25.8 30.2 38.2 45.2
25.9 29.2 34.1 43.1
39.3 22.0
-- 30.1
(27.3) --
12.6 18.8 20.5 21.1 19.0 22.3 19.4
19.7 20.4
17.3 21.0
19.4 21.0 20.2 20.0
15.1 17.5 21.3 22.2
15.9 16.8 21.4 21.1
20.0 14.8
-- 26.4
(18.2) --
15.7 18.4 18.2 19.2 19.2 18.2 19.5
16.0 21.4
15.9 19.9
20.8 18.3 17.8 18.7
15.1 15.5 17.5 21.0
13.5 13.6 18.3 20.4
18.1 35.8
-- 20.4 (9.1)
--
48.1 44.4 43.5 43.9 47.2 43.5 51.8
42.9 47.8
49.1 44.0
45.7 40.8 44.9 47.2
51.2 49.5 43.6 42.7
44.8 53.5 48.2 43.7
45.0 60.3
-- 43.6
(45.5) --
0.5 3.9 4.1 5.0 5.8 6.3 5.7
4.3 5.6
4.6 5.0
3.4 4.8 4.5 5.9
5.6 3.4 4.9 5.1
6.4 5.4 5.3 4.6
5.0 4.0 --
2.7 (18.2)
--
0.8 0.8 1.3 1.6 1.3 1.8 0.9
1.1 1.5
1.7 1.2
1.1 1.1 1.3 1.5
1.1 0.8 1.0 1.6
1.4 0.6 1.0 1.5
1.3 2.2 --
0.7 (0.0)
--
0.0 0.3 0.4 0.5 0.1 0.5 0.5
0.3 0.5
0.3 0.4
0.5 0.3 0.2 0.4
0.5 0.2 0.4 0.4
0.5 0.4 0.4 0.4
0.4 0.7 --
0.0 (0.0)
--
144 1,023 1,586 1,427 1,350 1,063
768
3,363 3,998
1,781 5,327
1,439 1,299 1,319 3,078
1,383 911 930
4,137
836 715 876
4,934
6,882 179 10
272 11 07
Contd…
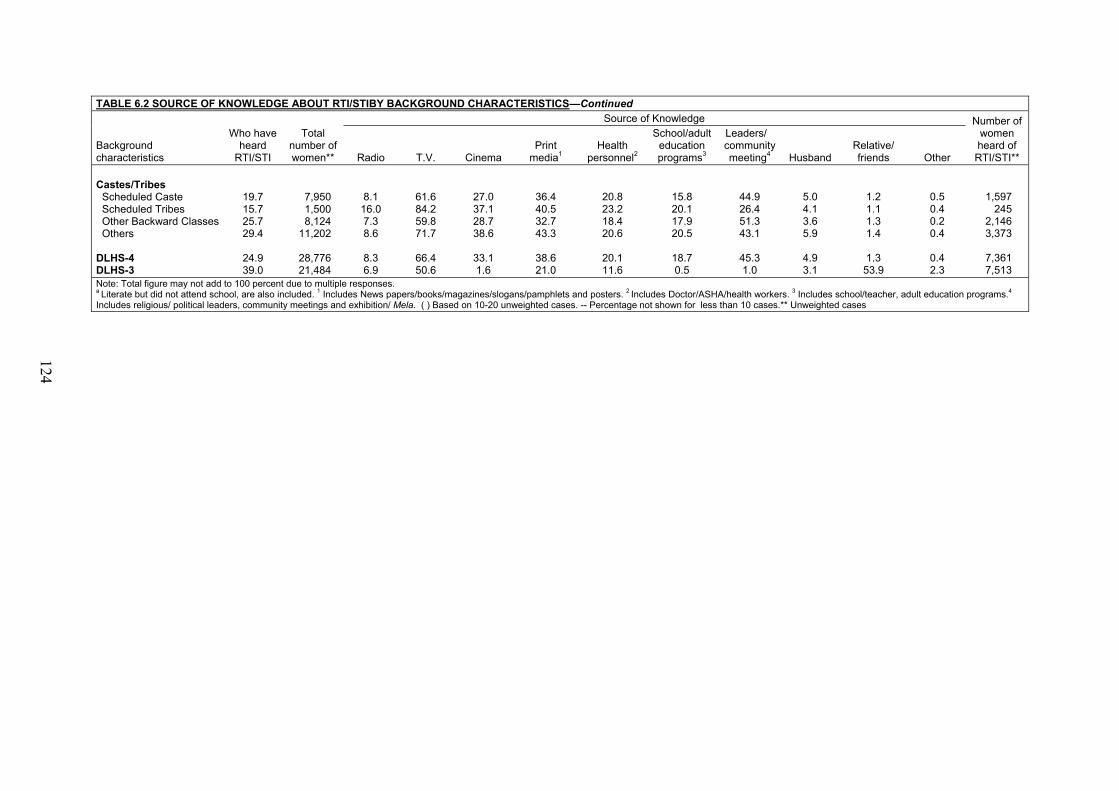
124
TABLE 6.2 SOURCE OF KNOWLEDGE ABOUT RTI/STIBY BACKGROUND CHARACTERISTICS—Continued
Background characteristics
Who have heard
RTI/STI
Total number of women**
Source of Knowledge Number of women heard of
RTI/STI** Radio T.V. Cinema Print
media1 Health
personnel2
School/adult education programs3
Leaders/ community meeting4 Husband
Relative/ friends Other
Castes/Tribes Scheduled Caste Scheduled Tribes Other Backward Classes Others
DLHS-4 DLHS-3
19.7 15.7 25.7 29.4
24.9 39.0
7,950 1,500 8,124
11,202
28,776 21,484
8.1 16.0 7.3 8.6
8.3 6.9
61.6 84.2 59.8 71.7
66.4 50.6
27.0 37.1 28.7 38.6
33.1 1.6
36.4 40.5 32.7 43.3
38.6 21.0
20.8 23.2 18.4 20.6
20.1 11.6
15.8 20.1 17.9 20.5
18.7 0.5
44.9 26.4 51.3 43.1
45.3 1.0
5.0 4.1 3.6 5.9
4.9 3.1
1.2 1.1 1.3 1.4
1.3 53.9
0.5 0.4 0.2 0.4
0.4 2.3
1,597 245
2,146 3,373
7,361 7,513
Note: Total figure may not add to 100 percent due to multiple responses. a Literate but did not attend school, are also included. 1 Includes News papers/books/magazines/slogans/pamphlets and posters. 2 Includes Doctor/ASHA/health workers. 3 Includes school/teacher, adult education programs.4
Includes religious/ political leaders, community meetings and exhibition/ Mela. ( ) Based on 10-20 unweighted cases. -- Percentage not shown for less than 10 cases.** Unweighted cases
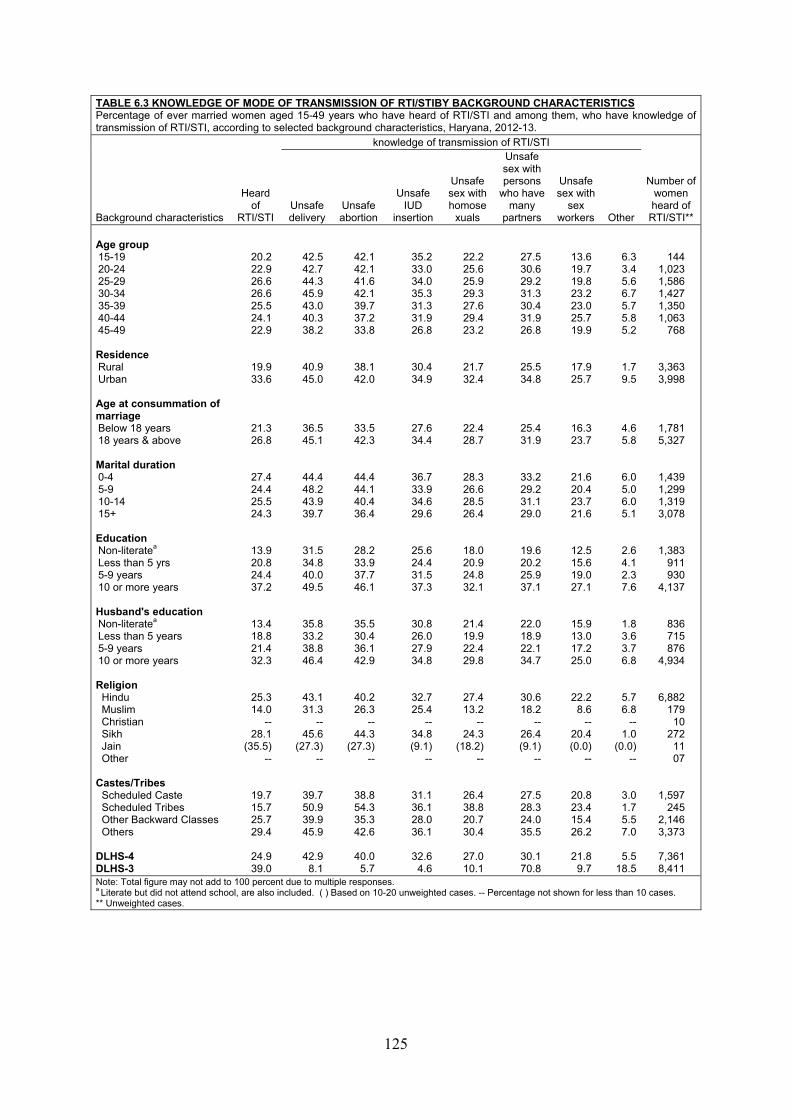
125
TABLE 6.3 KNOWLEDGE OF MODE OF TRANSMISSION OF RTI/STIBY BACKGROUND CHARACTERISTICS Percentage of ever married women aged 15-49 years who have heard of RTI/STI and among them, who have knowledge of transmission of RTI/STI, according to selected background characteristics, Haryana, 2012-13.
Background characteristics
Heard of
RTI/STI
knowledge of transmission of RTI/STI
Number of women heard of
RTI/STI** Unsafe delivery
Unsafe abortion
Unsafe IUD
insertion
Unsafe sex with homose
xuals
Unsafe sex with persons
who have many
partners
Unsafe sex with
sex workers Other
Age group 15-19 20-24 25-29 30-34 35-39 40-44 45-49 Residence Rural Urban Age at consummation of marriage Below 18 years 18 years & above Marital duration 0-4 5-9 10-14 15+ Education Non-literatea Less than 5 yrs 5-9 years 10 or more years Husband's education Non-literatea Less than 5 years 5-9 years 10 or more years Religion Hindu Muslim Christian Sikh Jain Other Castes/Tribes Scheduled Caste Scheduled Tribes Other Backward Classes Others DLHS-4 DLHS-3
20.2 22.9 26.6 26.6 25.5 24.1 22.9
19.9 33.6
21.3 26.8
27.4 24.4 25.5 24.3
13.9 20.8 24.4 37.2
13.4 18.8 21.4 32.3
25.3 14.0
-- 28.1
(35.5) --
19.7 15.7 25.7 29.4
24.9 39.0
42.5 42.7 44.3 45.9 43.0 40.3 38.2
40.9 45.0
36.5 45.1
44.4 48.2 43.9 39.7
31.5 34.8 40.0 49.5
35.8 33.2 38.8 46.4
43.1 31.3
-- 45.6
(27.3) --
39.7 50.9 39.9 45.9
42.9
8.1
42.1 42.1 41.6 42.1 39.7 37.2 33.8
38.1 42.0
33.5 42.3
44.4 44.1 40.4 36.4
28.2 33.9 37.7 46.1
35.5 30.4 36.1 42.9
40.2 26.3
-- 44.3
(27.3) --
38.8 54.3 35.3 42.6
40.0
5.7
35.2 33.0 34.0 35.3 31.3 31.9 26.8
30.4 34.9
27.6 34.4
36.7 33.9 34.6 29.6
25.6 24.4 31.5 37.3
30.8 26.0 27.9 34.8
32.7 25.4
-- 34.8 (9.1)
--
31.1 36.1 28.0 36.1
32.6
4.6
22.2 25.6 25.9 29.3 27.6 29.4 23.2
21.7 32.4
22.4 28.7
28.3 26.6 28.5 26.4
18.0 20.9 24.8 32.1
21.4 19.9 22.4 29.8
27.4 13.2
-- 24.3
(18.2) --
26.4 38.8 20.7 30.4
27.0 10.1
27.5 30.6 29.2 31.3 30.4 31.9 26.8
25.5 34.8
25.4 31.9
33.2 29.2 31.1 29.0
19.6 20.2 25.9 37.1
22.0 18.9 22.1 34.7
30.6 18.2
-- 26.4 (9.1)
--
27.5 28.3 24.0 35.5
30.1 70.8
13.6 19.7 19.8 23.2 23.0 25.7 19.9
17.9 25.7
16.3 23.7
21.6 20.4 23.7 21.6
12.5 15.6 19.0 27.1
15.9 13.0 17.2 25.0
22.2 8.6
-- 20.4 (0.0)
--
20.8 23.4 15.4 26.2
21.8
9.7
6.3 3.4 5.6 6.7 5.7 5.8 5.2
1.7 9.5
4.6 5.8
6.0 5.0 6.0 5.1
2.6 4.1 2.3 7.6
1.8 3.6 3.7 6.8
5.7 6.8
-- 1.0
(0.0) --
3.0 1.7 5.5 7.0
5.5
18.5
144 1,023 1,586 1,427 1,350 1,063
768
3,363 3,998
1,781 5,327
1,439 1,299 1,319 3,078
1,383 911 930
4,137
836 715 876
4,934
6,882 179
10 272
11 07
1,597 245
2,146 3,373
7,361 8,411
Note: Total figure may not add to 100 percent due to multiple responses. a Literate but did not attend school, are also included. ( ) Based on 10-20 unweighted cases. -- Percentage not shown for less than 10 cases. ** Unweighted cases.
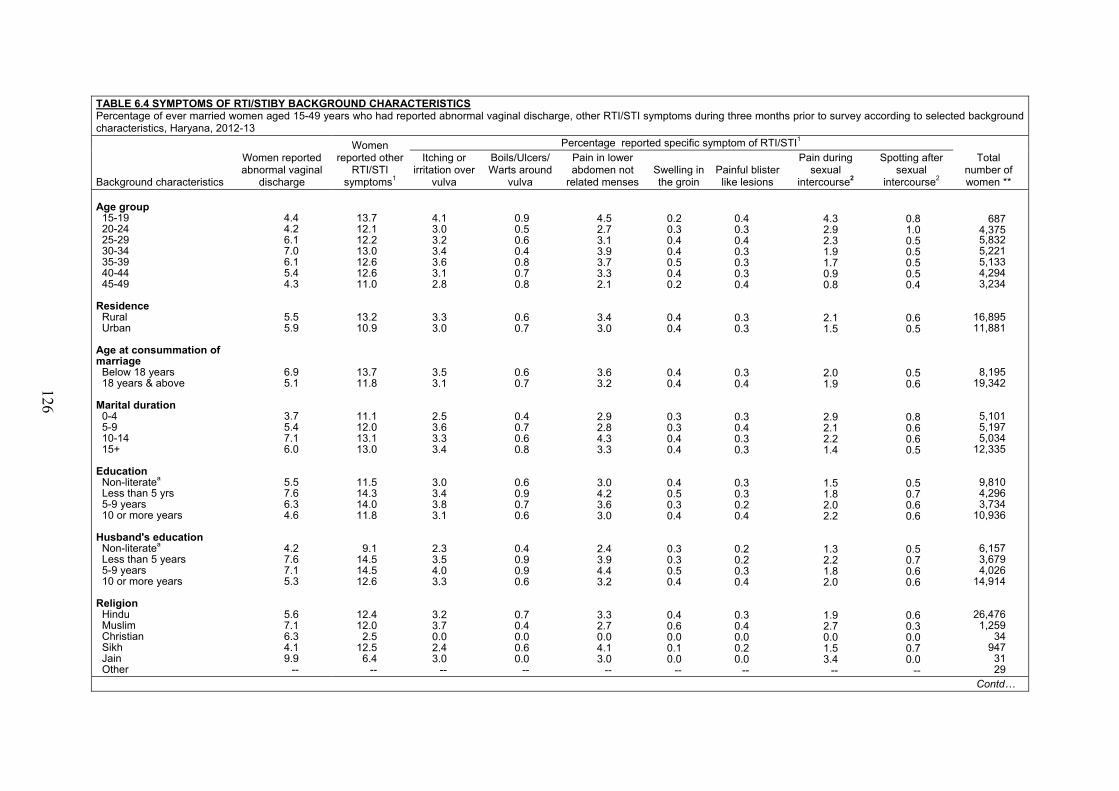
126
TABLE 6.4 SYMPTOMS OF RTI/STIBY BACKGROUND CHARACTERISTICS Percentage of ever married women aged 15-49 years who had reported abnormal vaginal discharge, other RTI/STI symptoms during three months prior to survey according to selected background characteristics, Haryana, 2012-13
Background characteristics
Women reported abnormal vaginal
discharge
Women reported other
RTI/STI symptoms1
Percentage reported specific symptom of RTI/STI1 Total
number of women **
Itching or irritation over
vulva
Boils/Ulcers/ Warts around
vulva
Pain in lower abdomen not
related menses Swelling in the groin
Painful blister like lesions
Pain during sexual
intercourse2
Spotting after sexual
intercourse2
Age group 15-19 20-24 25-29 30-34 35-39 40-44 45-49
Residence Rural Urban
Age at consummation of marriage Below 18 years 18 years & above
Marital duration 0-4 5-9 10-14 15+
Education Non-literatea Less than 5 yrs 5-9 years 10 or more years
Husband's education Non-literatea Less than 5 years 5-9 years 10 or more years
Religion Hindu Muslim Christian Sikh Jain Other
4.4 4.2 6.1 7.0 6.1 5.4 4.3
5.5 5.9
6.9 5.1
3.7 5.4 7.1 6.0
5.5 7.6 6.3 4.6
4.2 7.6 7.1 5.3
5.6 7.1 6.3 4.1 9.9
--
13.7 12.1 12.2 13.0 12.6 12.6 11.0
13.2 10.9
13.7 11.8
11.1 12.0 13.1 13.0
11.5 14.3 14.0 11.8
9.1 14.5 14.5 12.6
12.4 12.0 2.5
12.5 6.4
--
4.1 3.0 3.2 3.4 3.6 3.1 2.8
3.3 3.0
3.5 3.1
2.5 3.6 3.3 3.4
3.0 3.4 3.8 3.1
2.3 3.5 4.0 3.3
3.2 3.7 0.0 2.4 3.0
--
0.9 0.5 0.6 0.4 0.8 0.7 0.8
0.6 0.7
0.6 0.7
0.4 0.7 0.6 0.8
0.6 0.9 0.7 0.6
0.4 0.9 0.9 0.6
0.7 0.4 0.0 0.6 0.0
--
4.5 2.7 3.1 3.9 3.7 3.3 2.1
3.4 3.0
3.6 3.2
2.9 2.8 4.3 3.3
3.0 4.2 3.6 3.0
2.4 3.9 4.4 3.2
3.3 2.7 0.0 4.1 3.0
--
0.2 0.3 0.4 0.4 0.5 0.4 0.2
0.4 0.4
0.4 0.4
0.3 0.3 0.4 0.4
0.4 0.5 0.3 0.4
0.3 0.3 0.5 0.4
0.4 0.6 0.0 0.1 0.0
--
0.4 0.3 0.4 0.3 0.3 0.3
0.4
0.3 0.3
0.3 0.4
0.3 0.4 0.3 0.3
0.3 0.3 0.2 0.4
0.2 0.2 0.3 0.4
0.3 0.4 0.0 0.2 0.0
--
4.3 2.9 2.3 1.9 1.7 0.9 0.8
2.1 1.5
2.0 1.9
2.9 2.1 2.2 1.4
1.5 1.8 2.0 2.2
1.3 2.2 1.8 2.0
1.9 2.7 0.0 1.5 3.4
--
0.8 1.0 0.5 0.5 0.5 0.5 0.4
0.6 0.5
0.5 0.6
0.8 0.6 0.6 0.5
0.5 0.7 0.6 0.6
0.5 0.7 0.6 0.6
0.6 0.3 0.0 0.7 0.0
--
687 4,375 5,832 5,221 5,133 4,294 3,234
16,895 11,881
8,195 19,342
5,101 5,197 5,034
12,335
9,810 4,296 3,734
10,936
6,157 3,679 4,026
14,914
26,476 1,259
34 947 31 29
Contd…
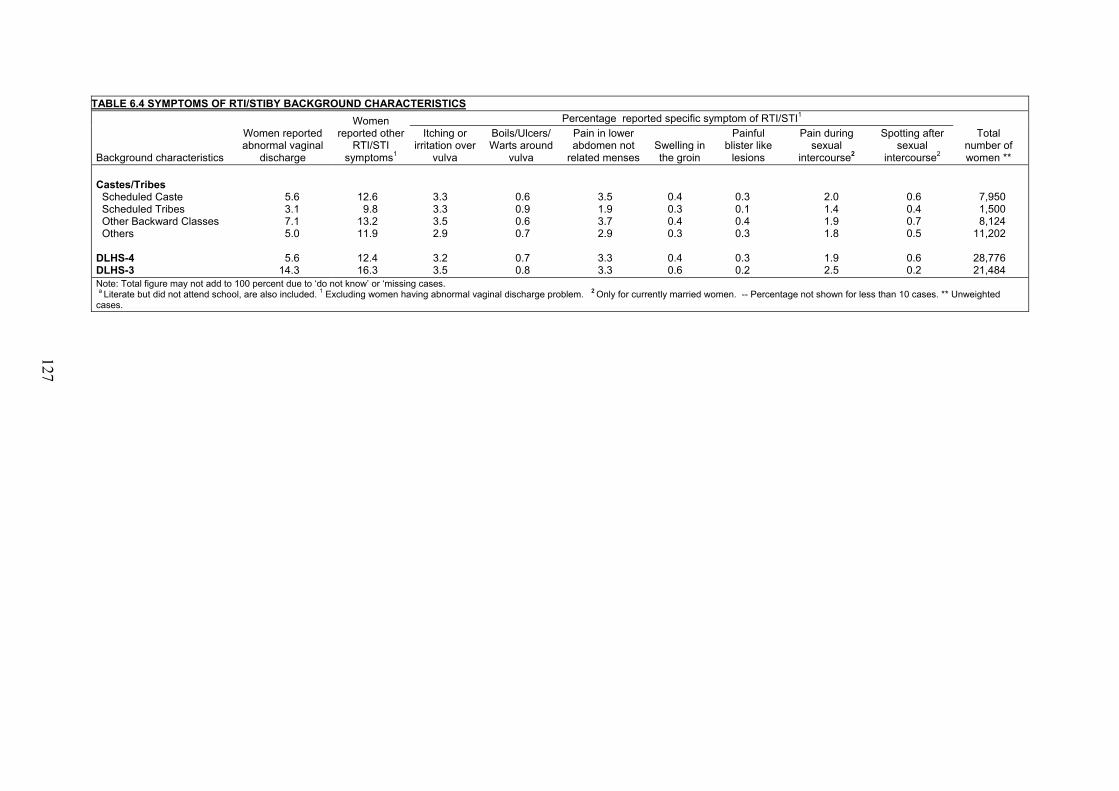
127
TABLE 6.4 SYMPTOMS OF RTI/STIBY BACKGROUND CHARACTERISTICS
Background characteristics
Women reported abnormal vaginal
discharge
Women reported other
RTI/STI symptoms1
Percentage reported specific symptom of RTI/STI1 Total
number of women **
Itching or irritation over
vulva
Boils/Ulcers/ Warts around
vulva
Pain in lower abdomen not
related menses Swelling in the groin
Painful blister like
lesions
Pain during sexual
intercourse2
Spotting after sexual
intercourse2
Castes/Tribes Scheduled Caste Scheduled Tribes Other Backward Classes Others
DLHS-4 DLHS-3
5.6 3.1 7.1 5.0
5.6 14.3
12.6 9.8
13.2 11.9
12.4 16.3
3.3 3.3 3.5 2.9
3.2 3.5
0.6 0.9 0.6 0.7
0.7 0.8
3.5 1.9 3.7 2.9
3.3 3.3
0.4 0.3 0.4 0.3
0.4 0.6
0.3 0.1 0.4 0.3
0.3 0.2
2.0 1.4 1.9 1.8
1.9 2.5
0.6 0.4 0.7 0.5
0.6 0.2
7,950 1,500 8,124
11,202
28,776 21,484
Note: Total figure may not add to 100 percent due to ‘do not know’ or ‘missing cases. a Literate but did not attend school, are also included. 1 Excluding women having abnormal vaginal discharge problem. 2 Only for currently married women. -- Percentage not shown for less than 10 cases. ** Unweighted cases.
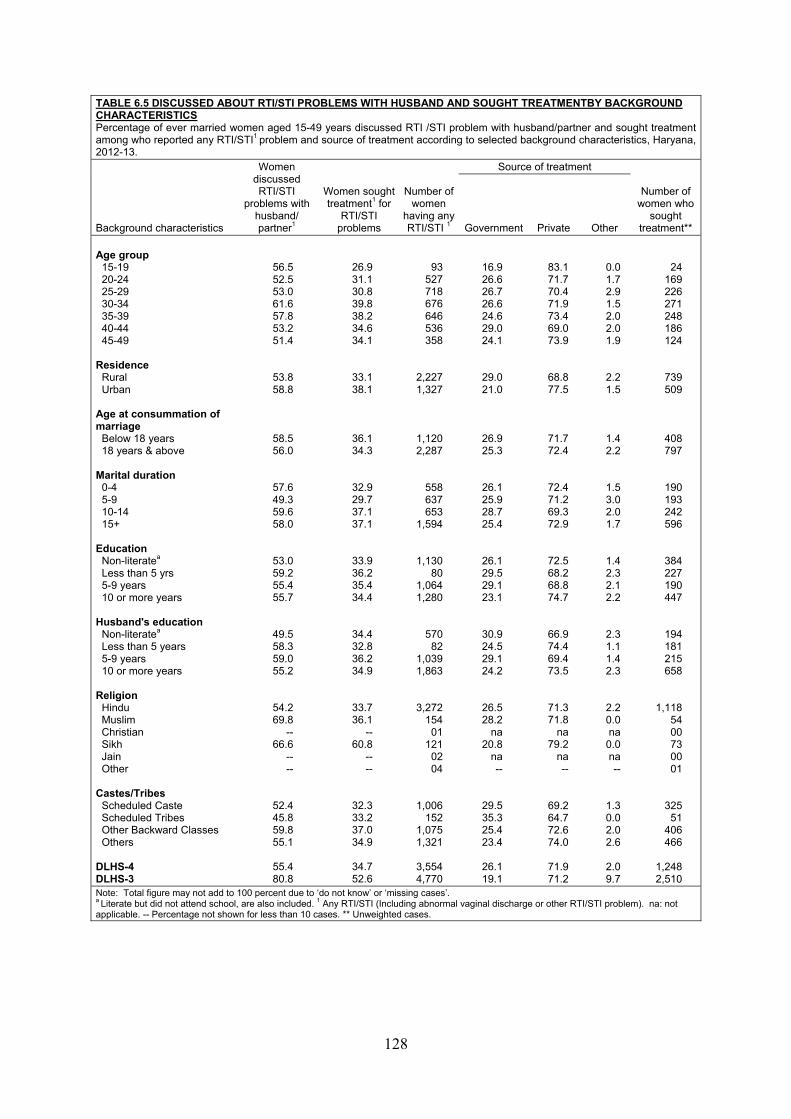
128
TABLE 6.5 DISCUSSED ABOUT RTI/STI PROBLEMS WITH HUSBAND AND SOUGHT TREATMENTBY BACKGROUND CHARACTERISTICS Percentage of ever married women aged 15-49 years discussed RTI /STI problem with husband/partner and sought treatment among who reported any RTI/STI1 problem and source of treatment according to selected background characteristics, Haryana, 2012-13.
Background characteristics
Women discussed RTI/STI
problems with husband/ partner1
Women sought treatment1 for
RTI/STI problems
Number of women
having any RTI/STI 1
Source of treatment
Number of women who
sought treatment** Government Private Other
Age group 15-19 20-24 25-29 30-34 35-39 40-44 45-49
Residence Rural Urban
Age at consummation of marriage
Below 18 years 18 years & above
Marital duration 0-4 5-9 10-14 15+
Education Non-literatea Less than 5 yrs 5-9 years 10 or more years
Husband's education Non-literatea Less than 5 years 5-9 years 10 or more years
Religion Hindu
Muslim Christian Sikh Jain Other
Castes/Tribes Scheduled Caste Scheduled Tribes Other Backward Classes Others
DLHS-4 DLHS-3
56.5 52.5 53.0 61.6 57.8 53.2 51.4
53.8 58.8
58.5 56.0
57.6 49.3 59.6 58.0
53.0 59.2 55.4 55.7
49.5 58.3 59.0 55.2
54.2 69.8
-- 66.6
-- --
52.4 45.8 59.8 55.1
55.4 80.8
26.9 31.1 30.8 39.8 38.2 34.6 34.1
33.1 38.1
36.1 34.3
32.9 29.7 37.1 37.1
33.9 36.2 35.4 34.4
34.4 32.8 36.2 34.9
33.7 36.1
-- 60.8
-- --
32.3 33.2 37.0 34.9
34.7 52.6
93 527 718 676 646 536 358
2,227 1,327
1,120 2,287
558 637 653
1,594
1,130 80
1,064 1,280
570 82
1,039 1,863
3,272 154 01
121 02 04
1,006 152
1,075 1,321
3,554 4,770
16.9 26.6 26.7 26.6 24.6 29.0 24.1
29.0 21.0
26.9 25.3
26.1 25.9 28.7 25.4
26.1 29.5 29.1 23.1
30.9 24.5 29.1 24.2
26.5 28.2
na 20.8
na --
29.5 35.3 25.4 23.4
26.1 19.1
83.1 71.7 70.4 71.9 73.4 69.0 73.9
68.8 77.5
71.7 72.4
72.4 71.2 69.3 72.9
72.5 68.2 68.8 74.7
66.9 74.4 69.4 73.5
71.3 71.8
na 79.2
na --
69.2 64.7 72.6 74.0
71.9 71.2
0.0 1.7 2.9 1.5 2.0 2.0 1.9
2.2 1.5
1.4 2.2
1.5 3.0 2.0 1.7
1.4 2.3 2.1 2.2
2.3 1.1 1.4 2.3
2.2 0.0 na
0.0 na --
1.3 0.0 2.0 2.6
2.0 9.7
24 169 226 271 248 186 124
739 509
408 797
190 193 242 596
384 227 190 447
194 181 215 658
1,118 54 00 73 00 01
325 51
406 466
1,248 2,510
Note: Total figure may not add to 100 percent due to ‘do not know’ or ‘missing cases’. a Literate but did not attend school, are also included. 1 Any RTI/STI (Including abnormal vaginal discharge or other RTI/STI problem). na: not applicable. -- Percentage not shown for less than 10 cases. ** Unweighted cases.
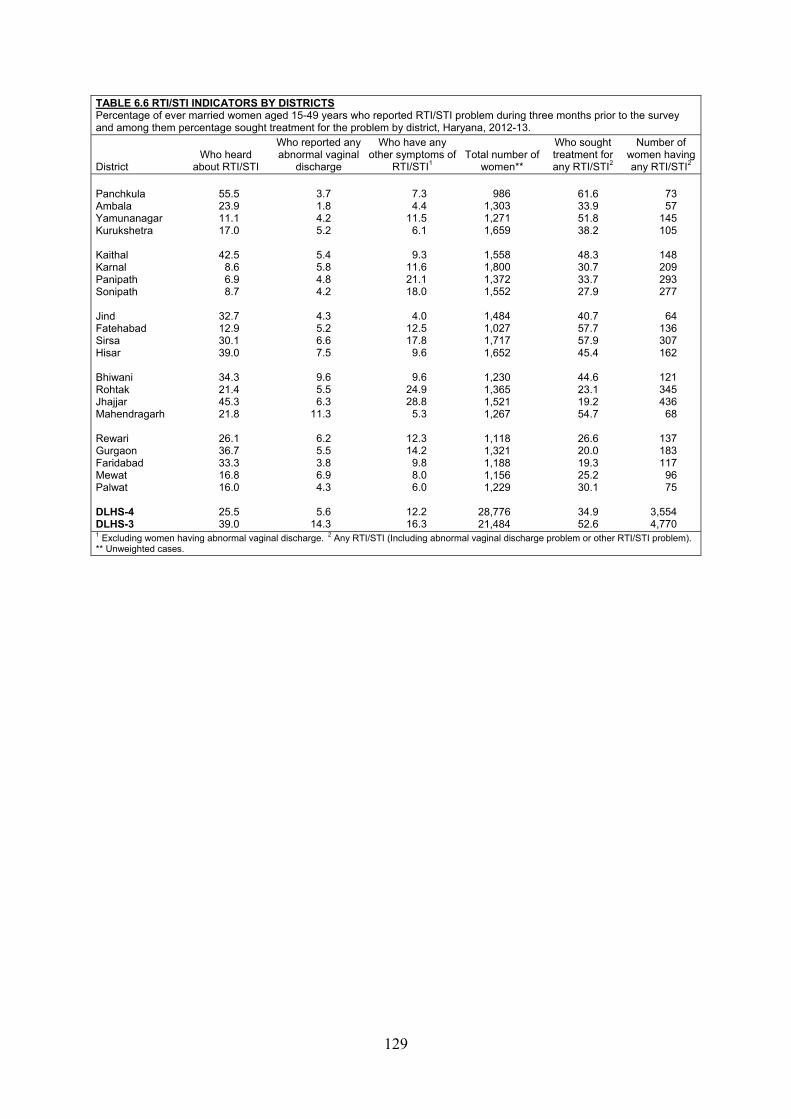
129
TABLE 6.6 RTI/STI INDICATORS BY DISTRICTS Percentage of ever married women aged 15-49 years who reported RTI/STI problem during three months prior to the survey and among them percentage sought treatment for the problem by district, Haryana, 2012-13.
District Who heard
about RTI/STI
Who reported any abnormal vaginal
discharge
Who have any other symptoms of
RTI/STI1 Total number of
women**
Who sought treatment for any RTI/STI2
Number of women having any RTI/STI2
Panchkula Ambala Yamunanagar Kurukshetra
Kaithal Karnal Panipath Sonipath
Jind Fatehabad Sirsa Hisar
Bhiwani Rohtak Jhajjar Mahendragarh
Rewari Gurgaon Faridabad Mewat Palwat
DLHS-4 DLHS-3
55.5 23.9 11.1 17.0
42.5 8.6 6.9 8.7
32.7 12.9 30.1 39.0
34.3 21.4 45.3 21.8
26.1 36.7 33.3 16.8 16.0
25.5 39.0
3.7 1.8 4.2 5.2
5.4 5.8 4.8 4.2
4.3 5.2 6.6 7.5
9.6 5.5 6.3
11.3
6.2 5.5 3.8 6.9 4.3
5.6 14.3
7.3 4.4
11.5 6.1
9.3 11.6 21.1 18.0
4.0 12.5 17.8 9.6
9.6 24.9 28.8 5.3
12.3 14.2 9.8 8.0 6.0
12.2 16.3
986 1,303 1,271 1,659
1,558 1,800 1,372 1,552
1,484 1,027 1,717 1,652
1,230 1,365 1,521 1,267
1,118 1,321 1,188 1,156 1,229
28,776 21,484
61.6 33.9 51.8 38.2
48.3 30.7 33.7 27.9
40.7 57.7 57.9 45.4
44.6 23.1 19.2 54.7
26.6 20.0 19.3 25.2 30.1
34.9 52.6
73 57
145 105
148 209 293 277
64 136 307 162
121 345 436 68
137 183 117 96 75
3,554 4,770
1 Excluding women having abnormal vaginal discharge. 2 Any RTI/STI (Including abnormal vaginal discharge problem or other RTI/STI problem). ** Unweighted cases.
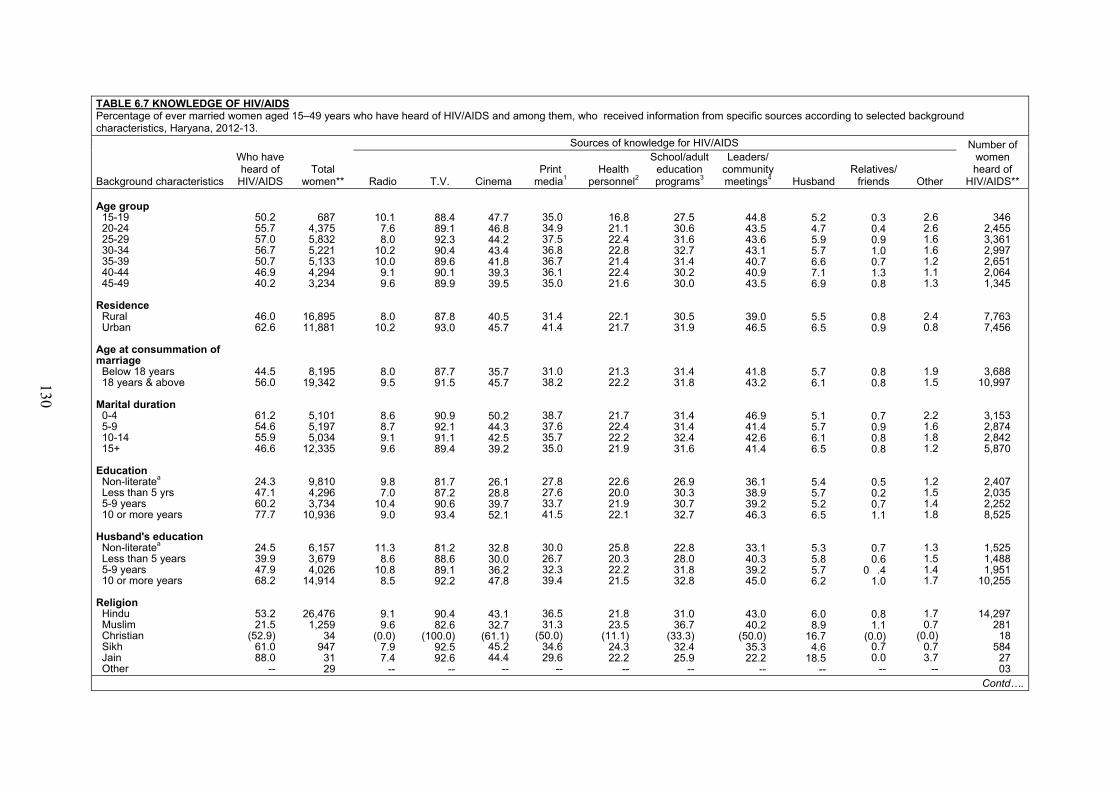
130
TABLE 6.7 KNOWLEDGE OF HIV/AIDS Percentage of ever married women aged 15–49 years who have heard of HIV/AIDS and among them, who received information from specific sources according to selected background characteristics, Haryana, 2012-13.
Background characteristics
Who have heard of
HIV/AIDS Total
women**
Sources of knowledge for HIV/AIDS Number of women heard of
HIV/AIDS** Radio T.V. Cinema Print
media1 Health
personnel2
School/adult education programs3
Leaders/ community meetings4 Husband
Relatives/ friends Other
Age group 15-19 20-24 25-29 30-34 35-39 40-44 45-49
Residence Rural Urban
Age at consummation of marriage Below 18 years 18 years & above
Marital duration 0-4 5-9 10-14 15+
Education Non-literatea Less than 5 yrs 5-9 years 10 or more years
Husband's education Non-literatea Less than 5 years 5-9 years 10 or more years
Religion Hindu Muslim Christian Sikh Jain Other
50.2 55.7 57.0 56.7 50.7 46.9 40.2
46.0 62.6
44.5 56.0
61.2 54.6 55.9 46.6
24.3 47.1 60.2 77.7
24.5 39.9 47.9 68.2
53.2 21.5
(52.9) 61.0 88.0
--
687 4,375 5,832 5,221 5,133 4,294 3,234
16,895 11,881
8,195 19,342
5,101 5,197 5,034
12,335
9,810 4,296 3,734
10,936
6,157 3,679 4,026
14,914
26,476 1,259
34 947 31 29
10.1 7.6 8.0
10.2 10.0 9.1 9.6
8.0 10.2
8.0 9.5
8.6 8.7 9.1 9.6
9.8 7.0
10.4 9.0
11.3 8.6
10.8 8.5
9.1 9.6
(0.0) 7.9 7.4
--
88.4 89.1 92.3 90.4 89.6 90.1 89.9
87.8 93.0
87.7 91.5
90.9 92.1 91.1 89.4
81.7 87.2 90.6 93.4
81.2 88.6 89.1 92.2
90.4 82.6
(100.0) 92.5 92.6
--
47.7 46.8 44.2 43.4 41.8 39.3 39.5
40.5 45.7
35.7 45.7
50.2 44.3 42.5 39.2
26.1 28.8 39.7 52.1
32.8 30.0 36.2 47.8
43.1 32.7
(61.1) 45.2 44.4
--
35.0 34.9 37.5 36.8 36.7 36.1 35.0
31.4 41.4
31.0 38.2
38.7 37.6 35.7 35.0
27.8 27.6 33.7 41.5
30.0 26.7 32.3 39.4
36.5 31.3
(50.0) 34.6 29.6
--
16.8 21.1 22.4 22.8 21.4 22.4 21.6
22.1 21.7
21.3 22.2
21.7 22.4 22.2 21.9
22.6 20.0 21.9 22.1
25.8 20.3 22.2 21.5
21.8 23.5
(11.1) 24.3 22.2
--
27.5 30.6 31.6 32.7 31.4 30.2 30.0
30.5 31.9
31.4 31.8
31.4 31.4 32.4 31.6
26.9 30.3 30.7 32.7
22.8 28.0 31.8 32.8
31.0 36.7
(33.3) 32.4 25.9
--
44.8 43.5 43.6 43.1 40.7 40.9 43.5
39.0 46.5
41.8 43.2
46.9 41.4 42.6 41.4
36.1 38.9 39.2 46.3
33.1 40.3 39.2 45.0
43.0 40.2
(50.0) 35.3 22.2
--
5.2 4.7 5.9 5.7 6.6 7.1 6.9
5.5 6.5
5.7 6.1
5.1 5.7 6.1 6.5
5.4 5.7 5.2 6.5
5.3 5.8 5.7 6.2
6.0 8.9
16.7 4.6
18.5 --
0.3 0.4 0.9 1.0 0.7 1.3 0.8
0.8 0.9
0.8 0.8
0.7 0.9 0.8 0.8
0.5 0.2 0.7 1.1
0.7 0.6
0 .4 1.0
0.8 1.1
(0.0) 0.7 0.0
--
2.6 2.6 1.6 1.6 1.2 1.1 1.3
2.4 0.8
1.9 1.5
2.2 1.6 1.8 1.2
1.2 1.5 1.4 1.8
1.3 1.5 1.4 1.7
1.7 0.7
(0.0) 0.7 3.7
--
346 2,455 3,361 2,997 2,651 2,064 1,345
7,763 7,456
3,688 10,997
3,153 2,874 2,842 5,870
2,407 2,035 2,252 8,525
1,525 1,488 1,951
10,255
14,297 281 18
584 27 03
Contd….
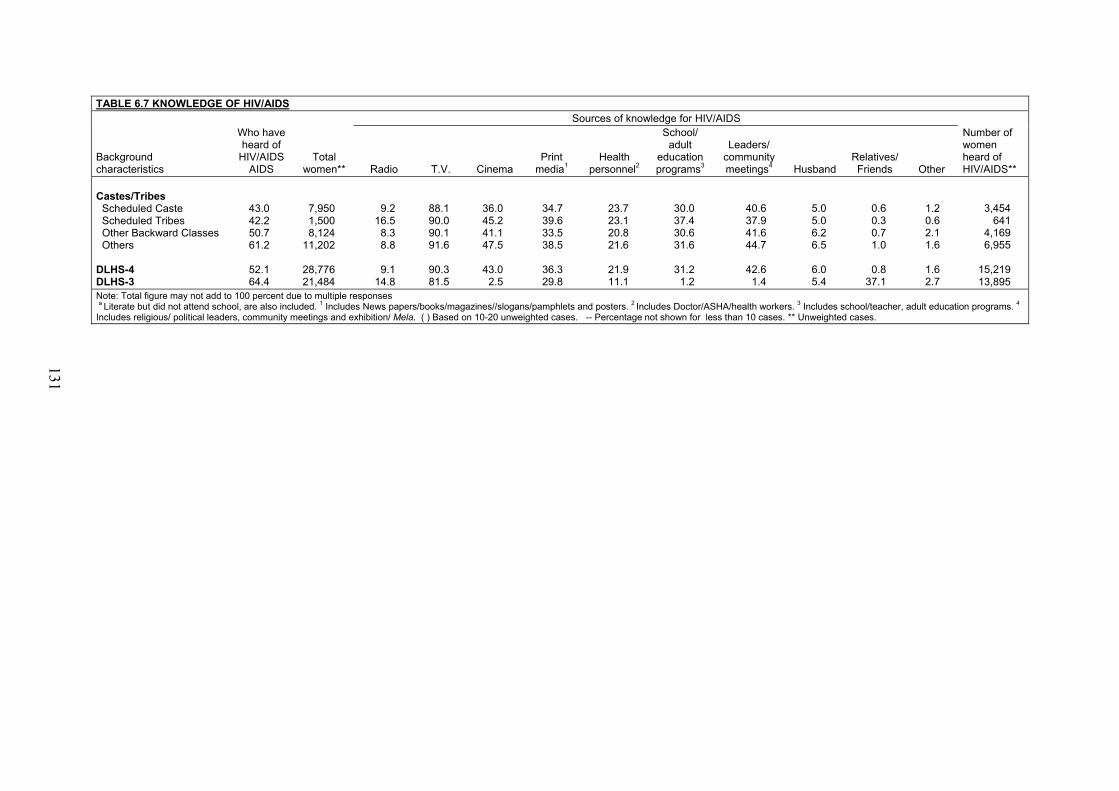
131
TABLE 6.7 KNOWLEDGE OF HIV/AIDS
Background characteristics
Who have heard of
HIV/AIDS AIDS
Total women**
Sources of knowledge for HIV/AIDS Number of women heard of HIV/AIDS** Radio T.V. Cinema
Print media1
Health personnel2
School/ adult
education programs3
Leaders/ community meetings4 Husband
Relatives/ Friends Other
Castes/Tribes Scheduled Caste Scheduled Tribes Other Backward Classes Others
DLHS-4 DLHS-3
43.0 42.2 50.7 61.2
52.1 64.4
7,950 1,500 8,124
11,202
28,776 21,484
9.2 16.5 8.3 8.8
9.1 14.8
88.1 90.0 90.1 91.6
90.3 81.5
36.0 45.2 41.1 47.5
43.0 2.5
34.7 39.6 33.5 38.5
36.3 29.8
23.7 23.1 20.8 21.6
21.9 11.1
30.0 37.4 30.6 31.6
31.2 1.2
40.6 37.9 41.6 44.7
42.6 1.4
5.0 5.0 6.2 6.5
6.0 5.4
0.6 0.3 0.7 1.0
0.8 37.1
1.2 0.6 2.1 1.6
1.6 2.7
3,454 641
4,169 6,955
15,219 13,895
Note: Total figure may not add to 100 percent due to multiple responses a Literate but did not attend school, are also included. 1 Includes News papers/books/magazines//slogans/pamphlets and posters. 2 Includes Doctor/ASHA/health workers. 3 Includes school/teacher, adult education programs. 4
Includes religious/ political leaders, community meetings and exhibition/ Mela. ( ) Based on 10-20 unweighted cases. -- Percentage not shown for less than 10 cases. ** Unweighted cases.
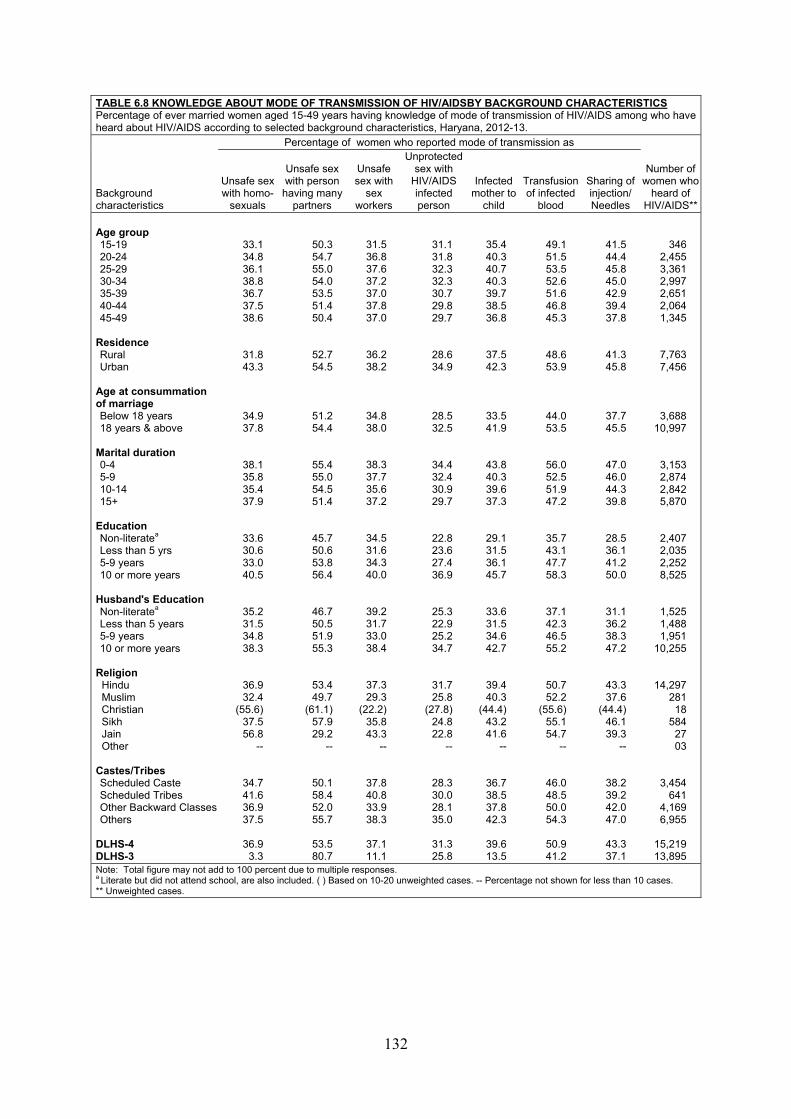
132
TABLE 6.8 KNOWLEDGE ABOUT MODE OF TRANSMISSION OF HIV/AIDSBY BACKGROUND CHARACTERISTICS Percentage of ever married women aged 15-49 years having knowledge of mode of transmission of HIV/AIDS among who have heard about HIV/AIDS according to selected background characteristics, Haryana, 2012-13.
Background characteristics
Percentage of women who reported mode of transmission as
Number of women who
heard of HIV/AIDS**
Unsafe sex with homo-
sexuals
Unsafe sex with person
having many partners
Unsafe sex with
sex workers
Unprotected sex with
HIV/AIDS infected person
Infected mother to
child
Transfusion of infected
blood
Sharing of injection/ Needles
Age group 15-19 20-24 25-29 30-34 35-39 40-44 45-49
Residence Rural Urban
Age at consummation of marriage Below 18 years 18 years & above
Marital duration 0-4 5-9 10-14 15+
Education Non-literatea Less than 5 yrs 5-9 years 10 or more years
Husband's Education Non-literatea Less than 5 years 5-9 years 10 or more years
Religion Hindu Muslim Christian Sikh Jain Other
Castes/Tribes Scheduled Caste Scheduled Tribes Other Backward Classes Others
DLHS-4 DLHS-3
33.1 34.8 36.1 38.8 36.7 37.5 38.6
31.8 43.3
34.9 37.8
38.1 35.8 35.4 37.9
33.6 30.6 33.0 40.5
35.2 31.5 34.8 38.3
36.9 32.4
(55.6) 37.5 56.8
--
34.7 41.6 36.9 37.5
36.9 3.3
50.3 54.7 55.0 54.0 53.5 51.4 50.4
52.7 54.5
51.2 54.4
55.4 55.0 54.5 51.4
45.7 50.6 53.8 56.4
46.7 50.5 51.9 55.3
53.4 49.7
(61.1) 57.9 29.2
--
50.1 58.4 52.0 55.7
53.5 80.7
31.5 36.8 37.6 37.2 37.0 37.8 37.0
36.2 38.2
34.8 38.0
38.3 37.7 35.6 37.2
34.5 31.6 34.3 40.0
39.2 31.7 33.0 38.4
37.3 29.3
(22.2) 35.8 43.3
--
37.8 40.8 33.9 38.3
37.1 11.1
31.1 31.8 32.3 32.3 30.7 29.8 29.7
28.6 34.9
28.5 32.5
34.4 32.4 30.9 29.7
22.8 23.6 27.4 36.9
25.3 22.9 25.2 34.7
31.7 25.8
(27.8) 24.8 22.8
--
28.3 30.0 28.1 35.0
31.3 25.8
35.4 40.3 40.7 40.3 39.7 38.5 36.8
37.5 42.3
33.5 41.9
43.8 40.3 39.6 37.3
29.1 31.5 36.1 45.7
33.6 31.5 34.6 42.7
39.4 40.3
(44.4) 43.2 41.6
--
36.7 38.5 37.8 42.3
39.6 13.5
49.1 51.5 53.5 52.6 51.6 46.8 45.3
48.6 53.9
44.0 53.5
56.0 52.5 51.9 47.2
35.7 43.1 47.7 58.3
37.1 42.3 46.5 55.2
50.7 52.2
(55.6) 55.1 54.7
--
46.0 48.5 50.0 54.3
50.9 41.2
41.5 44.4 45.8 45.0 42.9 39.4 37.8
41.3 45.8
37.7 45.5
47.0 46.0 44.3 39.8
28.5 36.1 41.2 50.0
31.1 36.2 38.3 47.2
43.3 37.6
(44.4) 46.1 39.3
--
38.2 39.2 42.0 47.0
43.3 37.1
346 2,455 3,361 2,997 2,651 2,064 1,345
7,763 7,456
3,688 10,997
3,153 2,874 2,842 5,870
2,407 2,035 2,252 8,525
1,525 1,488 1,951
10,255
14,297 281 18
584 27 03
3,454 641
4,169 6,955
15,219 13,895
Note: Total figure may not add to 100 percent due to multiple responses. a Literate but did not attend school, are also included. ( ) Based on 10-20 unweighted cases. -- Percentage not shown for less than 10 cases. ** Unweighted cases.
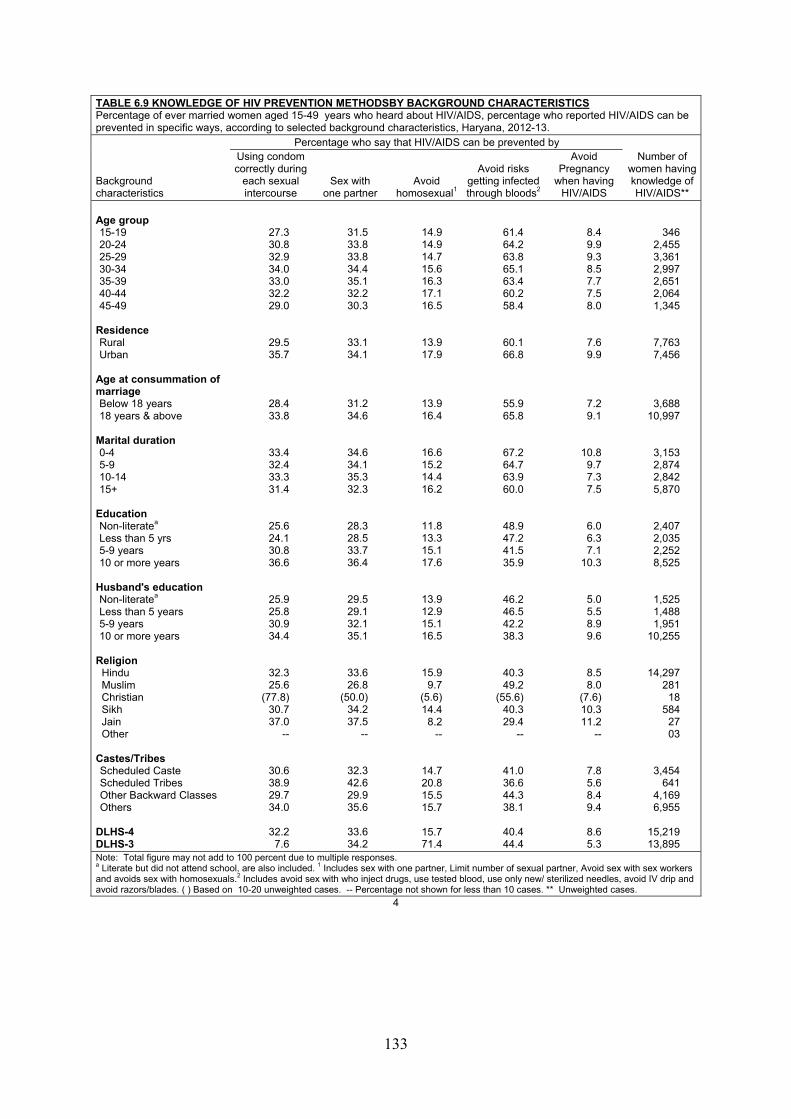
133
TABLE 6.9 KNOWLEDGE OF HIV PREVENTION METHODSBY BACKGROUND CHARACTERISTICS Percentage of ever married women aged 15-49 years who heard about HIV/AIDS, percentage who reported HIV/AIDS can be prevented in specific ways, according to selected background characteristics, Haryana, 2012-13.
Background characteristics
Percentage who say that HIV/AIDS can be prevented by Number of
women having knowledge of HIV/AIDS**
Using condom correctly during
each sexual intercourse
Sex with one partner
Avoid homosexual1
Avoid risks getting infected through bloods2
Avoid Pregnancy
when having HIV/AIDS
Age group 15-19 20-24 25-29 30-34 35-39 40-44 45-49
Residence Rural Urban
Age at consummation of marriage Below 18 years 18 years & above
Marital duration 0-4 5-9 10-14 15+
Education Non-literatea Less than 5 yrs 5-9 years 10 or more years
Husband's education Non-literatea Less than 5 years 5-9 years 10 or more years
Religion Hindu Muslim Christian Sikh Jain Other
Castes/Tribes Scheduled Caste Scheduled Tribes Other Backward Classes Others
DLHS-4 DLHS-3
27.3 30.8 32.9 34.0 33.0 32.2 29.0
29.5 35.7
28.4 33.8
33.4 32.4 33.3 31.4
25.6 24.1 30.8 36.6
25.9 25.8 30.9 34.4
32.3 25.6
(77.8) 30.7 37.0
--
30.6 38.9 29.7 34.0
32.2 7.6
31.5 33.8 33.8 34.4 35.1 32.2 30.3
33.1 34.1
31.2 34.6
34.6 34.1 35.3 32.3
28.3 28.5 33.7 36.4
29.5 29.1 32.1 35.1
33.6 26.8
(50.0) 34.2 37.5
--
32.3 42.6 29.9 35.6
33.6 34.2
14.9 14.9 14.7 15.6 16.3 17.1 16.5
13.9 17.9
13.9 16.4
16.6 15.2 14.4 16.2
11.8 13.3 15.1 17.6
13.9 12.9 15.1 16.5
15.9 9.7
(5.6) 14.4 8.2
--
14.7 20.8 15.5 15.7
15.7 71.4
61.4 64.2 63.8 65.1 63.4 60.2 58.4
60.1 66.8
55.9 65.8
67.2 64.7 63.9 60.0
48.9 47.2 41.5 35.9
46.2 46.5 42.2 38.3
40.3 49.2
(55.6) 40.3 29.4
--
41.0 36.6 44.3 38.1
40.4 44.4
8.4 9.9 9.3 8.5 7.7 7.5 8.0
7.6 9.9
7.2 9.1
10.8 9.7 7.3 7.5
6.0 6.3 7.1
10.3
5.0 5.5 8.9 9.6
8.5 8.0
(7.6) 10.3 11.2
--
7.8 5.6 8.4 9.4
8.6 5.3
346 2,455 3,361 2,997 2,651 2,064 1,345
7,763 7,456
3,688 10,997
3,153 2,874 2,842 5,870
2,407 2,035 2,252 8,525
1,525 1,488 1,951
10,255
14,297 281 18
584 27 03
3,454 641
4,169 6,955
15,219 13,895
Note: Total figure may not add to 100 percent due to multiple responses. a Literate but did not attend school, are also included. 1 Includes sex with one partner, Limit number of sexual partner, Avoid sex with sex workers and avoids sex with homosexuals.2 Includes avoid sex with who inject drugs, use tested blood, use only new/ sterilized needles, avoid IV drip and avoid razors/blades. ( ) Based on 10-20 unweighted cases. -- Percentage not shown for less than 10 cases. ** Unweighted cases.
4
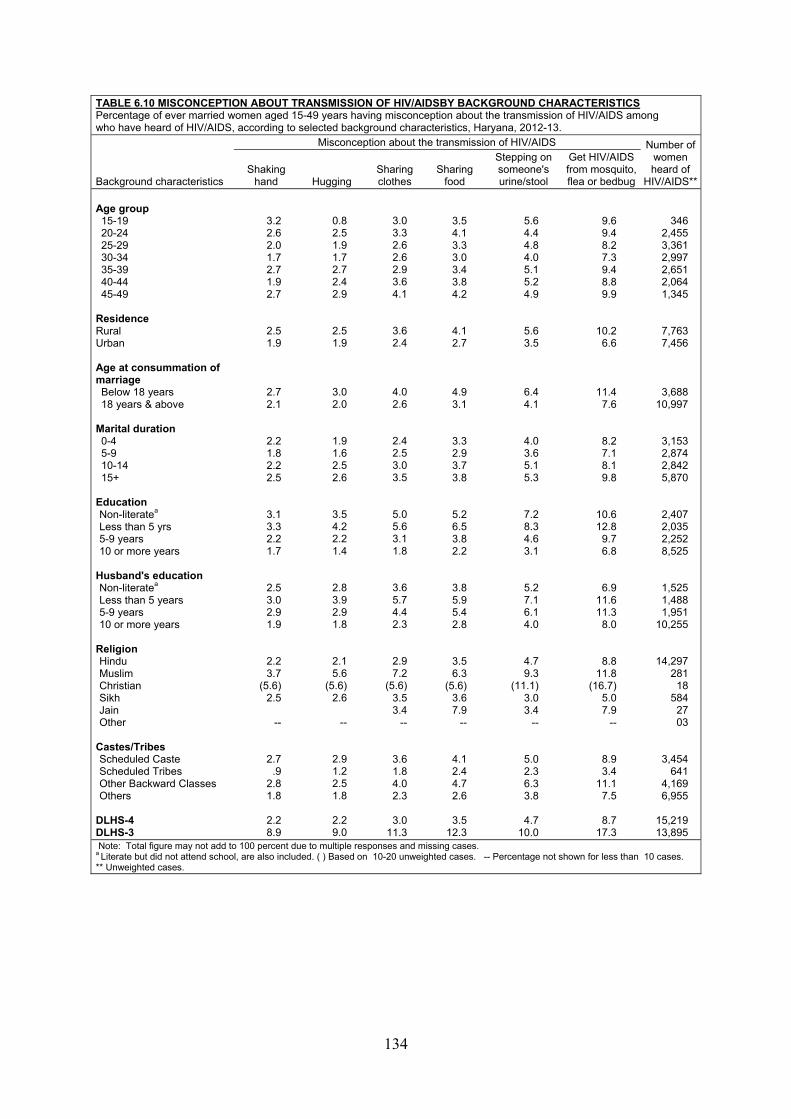
134
TABLE 6.10 MISCONCEPTION ABOUT TRANSMISSION OF HIV/AIDSBY BACKGROUND CHARACTERISTICS Percentage of ever married women aged 15-49 years having misconception about the transmission of HIV/AIDS among who have heard of HIV/AIDS, according to selected background characteristics, Haryana, 2012-13.
Background characteristics
Misconception about the transmission of HIV/AIDS Number of women heard of
HIV/AIDS**Shaking
hand Hugging Sharing clothes
Sharing food
Stepping on someone's urine/stool
Get HIV/AIDS from mosquito, flea or bedbug
Age group 15-19 20-24 25-29 30-34 35-39 40-44 45-49
Residence Rural Urban
Age at consummation of marriage Below 18 years 18 years & above
Marital duration 0-4 5-9 10-14 15+
Education Non-literatea Less than 5 yrs 5-9 years 10 or more years
Husband's education Non-literatea Less than 5 years 5-9 years 10 or more years
Religion Hindu Muslim Christian Sikh Jain Other
Castes/Tribes Scheduled Caste Scheduled Tribes Other Backward Classes Others
DLHS-4 DLHS-3
3.2 2.6 2.0 1.7 2.7 1.9 2.7
2.5 1.9
2.7 2.1
2.2 1.8 2.2 2.5
3.1 3.3 2.2 1.7
2.5 3.0 2.9 1.9
2.2 3.7
(5.6) 2.5
--
2.7 .9
2.8 1.8
2.2 8.9
0.8 2.5 1.9 1.7 2.7 2.4 2.9
2.5 1.9
3.0 2.0
1.9 1.6 2.5 2.6
3.5 4.2 2.2 1.4
2.8 3.9 2.9 1.8
2.1 5.6
(5.6) 2.6
--
2.9 1.2 2.5 1.8
2.2 9.0
3.0 3.3 2.6 2.6 2.9 3.6 4.1
3.6 2.4
4.0 2.6
2.4 2.5 3.0 3.5
5.0 5.6 3.1 1.8
3.6 5.7 4.4 2.3
2.9 7.2
(5.6) 3.5 3.4
--
3.6 1.8 4.0 2.3
3.0 11.3
3.5 4.1 3.3 3.0 3.4 3.8 4.2
4.1 2.7
4.9 3.1
3.3 2.9 3.7 3.8
5.2 6.5 3.8 2.2
3.8 5.9 5.4 2.8
3.5 6.3
(5.6) 3.6 7.9
--
4.1 2.4 4.7 2.6
3.5 12.3
5.6 4.4 4.8 4.0 5.1 5.2 4.9
5.6 3.5
6.4 4.1
4.0 3.6 5.1 5.3
7.2 8.3 4.6 3.1
5.2 7.1 6.1 4.0
4.7 9.3
(11.1) 3.0 3.4
--
5.0 2.3 6.3 3.8
4.7 10.0
9.6 9.4 8.2 7.3 9.4 8.8 9.9
10.2 6.6
11.4 7.6
8.2 7.1 8.1 9.8
10.6 12.8 9.7 6.8
6.9 11.6 11.3 8.0
8.8 11.8
(16.7) 5.0 7.9
--
8.9 3.4
11.1 7.5
8.7 17.3
346 2,455 3,361 2,997 2,651 2,064 1,345
7,763 7,456
3,688 10,997
3,153 2,874 2,842 5,870
2,407 2,035 2,252 8,525
1,525 1,488 1,951
10,255
14,297 281 18
584 27 03
3,454 641
4,169 6,955
15,219 13,895
Note: Total figure may not add to 100 percent due to multiple responses and missing cases. a Literate but did not attend school, are also included. ( ) Based on 10-20 unweighted cases. -- Percentage not shown for less than 10 cases. ** Unweighted cases.
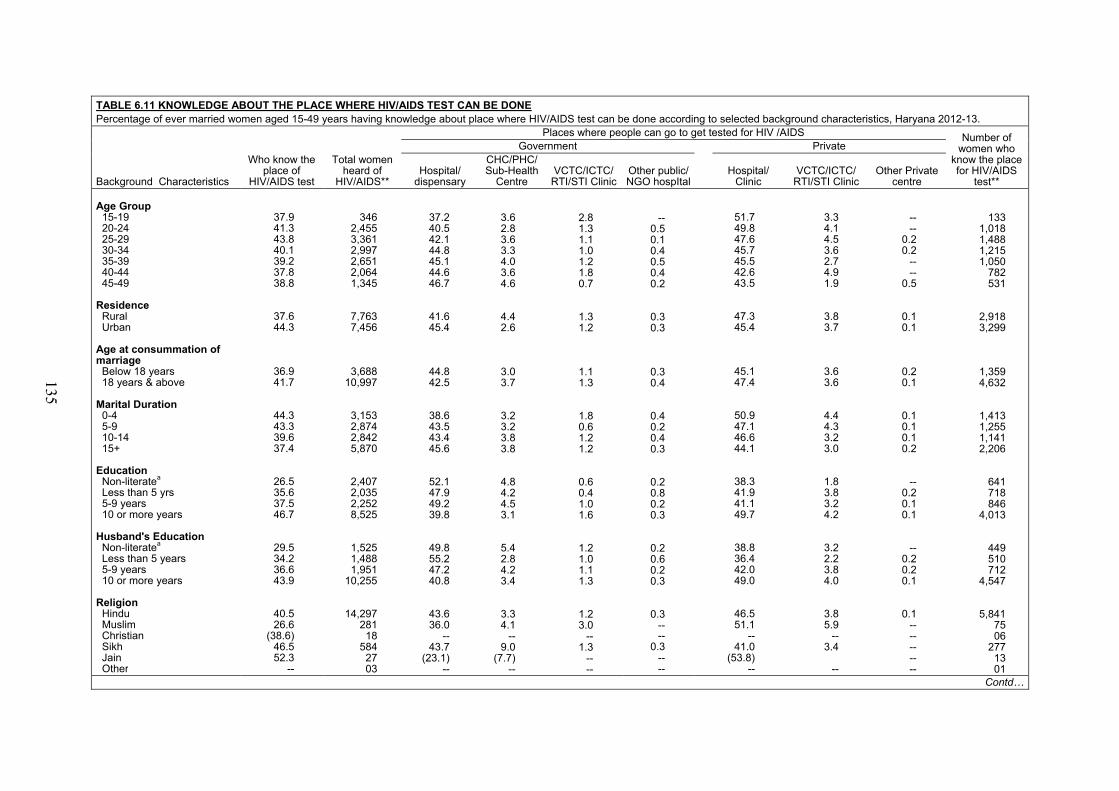
135
TABLE 6.11 KNOWLEDGE ABOUT THE PLACE WHERE HIV/AIDS TEST CAN BE DONE Percentage of ever married women aged 15-49 years having knowledge about place where HIV/AIDS test can be done according to selected background characteristics, Haryana 2012-13.
Background Characteristics
Who know the place of
HIV/AIDS test
Total women heard of
HIV/AIDS**
Places where people can go to get tested for HIV /AIDS Number of women who
know the place for HIV/AIDS
test**
Government Private
Hospital/ dispensary
CHC/PHC/Sub-Health
CentreVCTC/ICTC/
RTI/STI Clinic Other public/ NGO hospItal
Hospital/ Clinic
VCTC/ICTC/ RTI/STI Clinic
Other Private centre
Age Group 15-19 20-24 25-29 30-34 35-39 40-44 45-49
Residence Rural Urban
Age at consummation of marriage Below 18 years 18 years & above
Marital Duration 0-4 5-9 10-14 15+
Education Non-literatea Less than 5 yrs 5-9 years 10 or more years
Husband's Education Non-literatea Less than 5 years 5-9 years 10 or more years
Religion Hindu Muslim Christian Sikh Jain Other
37.9 41.3 43.8 40.1 39.2 37.8 38.8
37.6 44.3
36.9 41.7
44.3 43.3 39.6 37.4
26.5 35.6 37.5 46.7
29.5 34.2 36.6 43.9
40.5 26.6
(38.6) 46.5 52.3
--
346 2,455 3,361 2,997 2,651 2,064 1,345
7,763 7,456
3,688 10,997
3,153 2,874 2,842 5,870
2,407 2,035 2,252 8,525
1,525 1,488 1,951
10,255
14,297 281 18
584 27 03
37.2 40.5 42.1 44.8 45.1 44.6 46.7
41.6 45.4
44.8 42.5
38.6 43.5 43.4 45.6
52.1 47.9 49.2 39.8
49.8 55.2 47.2 40.8
43.6 36.0
-- 43.7
(23.1) --
3.6 2.8 3.6 3.3 4.0 3.6 4.6
4.4 2.6
3.0 3.7
3.2 3.2 3.8 3.8
4.8 4.2 4.5 3.1
5.4 2.8 4.2 3.4
3.3 4.1
-- 9.0
(7.7) --
2.8 1.3 1.1 1.0 1.2 1.8 0.7
1.3 1.2
1.1 1.3
1.8 0.6 1.2 1.2
0.6 0.4 1.0 1.6
1.2 1.0 1.1 1.3
1.2 3.0
-- 1.3
-- --
-- 0.5 0.1 0.4 0.5 0.4 0.2
0.3 0.3
0.3 0.4
0.4 0.2 0.4 0.3
0.2 0.8 0.2 0.3
0.2 0.6 0.2 0.3
0.3 -- --
0.3 -- --
51.7 49.8 47.6 45.7 45.5 42.6 43.5
47.3 45.4
45.1 47.4
50.9 47.1 46.6 44.1
38.3 41.9 41.1 49.7
38.8 36.4 42.0 49.0
46.5 51.1
-- 41.0
(53.8) --
3.3 4.1 4.5 3.6 2.7 4.9 1.9
3.8 3.7
3.6 3.6
4.4 4.3 3.2 3.0
1.8 3.8 3.2 4.2
3.2 2.2 3.8 4.0
3.8 5.9
-- 3.4
--
-- --
0.2 0.2
-- --
0.5
0.1 0.1
0.2 0.1
0.1 0.1 0.1 0.2
-- 0.2 0.1 0.1
-- 0.2 0.2 0.1
0.1 -- -- -- -- --
133 1,018 1,488 1,215 1,050
782 531
2,918 3,299
1,359 4,632
1,413 1,255 1,141 2,206
641 718 846
4,013
449 510 712
4,547
5,841 75 06
277 13 01
Contd…
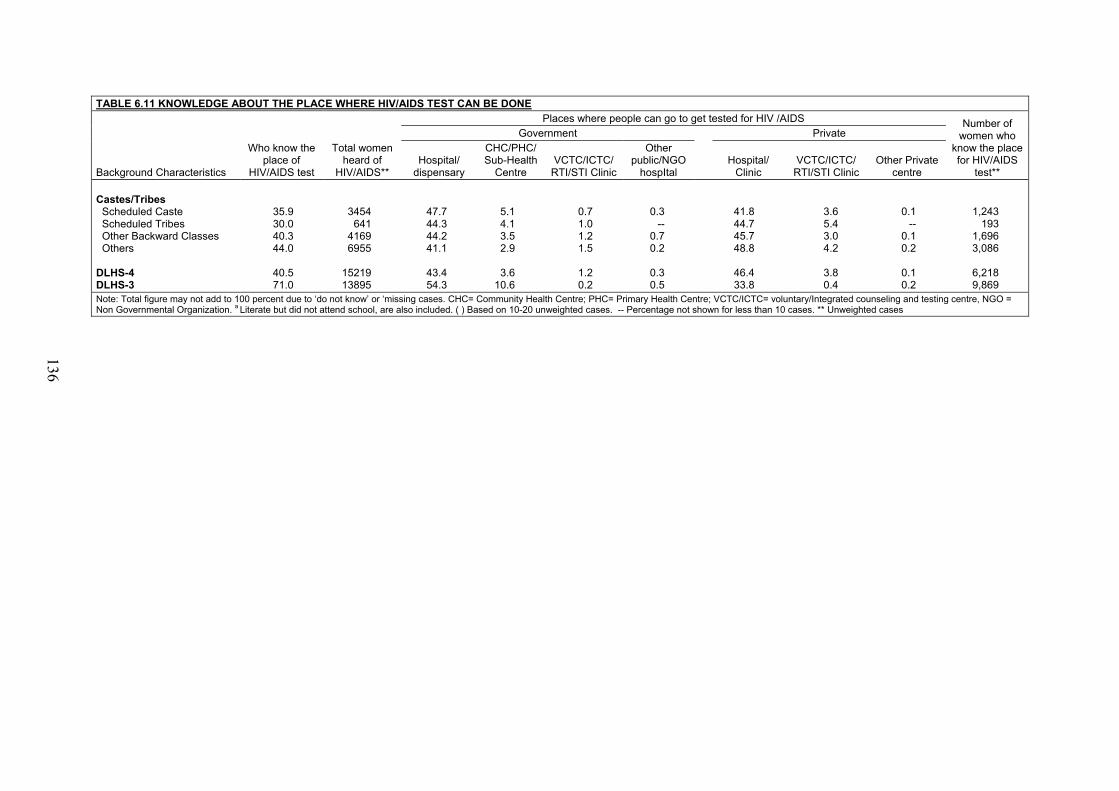
136
TABLE 6.11 KNOWLEDGE ABOUT THE PLACE WHERE HIV/AIDS TEST CAN BE DONE
Background Characteristics
Who know the place of
HIV/AIDS test
Total women heard of
HIV/AIDS**
Places where people can go to get tested for HIV /AIDS Number of women who
know the place for HIV/AIDS
test**
Government Private
Hospital/ dispensary
CHC/PHC/Sub-Health
Centre VCTC/ICTC/
RTI/STI Clinic
Other public/NGO
hospItal Hospital/
Clinic VCTC/ICTC/
RTI/STI Clinic Other Private
centre
Castes/Tribes Scheduled Caste Scheduled Tribes Other Backward Classes Others
DLHS-4 DLHS-3
35.9 30.0 40.3 44.0
40.5 71.0
3454 641
4169 6955
15219 13895
47.7 44.3 44.2 41.1
43.4 54.3
5.1 4.1 3.5 2.9
3.6 10.6
0.7 1.0 1.2 1.5
1.2 0.2
0.3 --
0.7 0.2
0.3 0.5
41.8 44.7 45.7 48.8
46.4 33.8
3.6 5.4 3.0 4.2
3.8 0.4
0.1 --
0.1 0.2
0.1 0.2
1,243 193
1,696 3,086
6,218 9,869
Note: Total figure may not add to 100 percent due to ‘do not know’ or ‘missing cases. CHC= Community Health Centre; PHC= Primary Health Centre; VCTC/ICTC= voluntary/Integrated counseling and testing centre, NGO = Non Governmental Organization. a Literate but did not attend school, are also included. ( ) Based on 10-20 unweighted cases. -- Percentage not shown for less than 10 cases. ** Unweighted cases
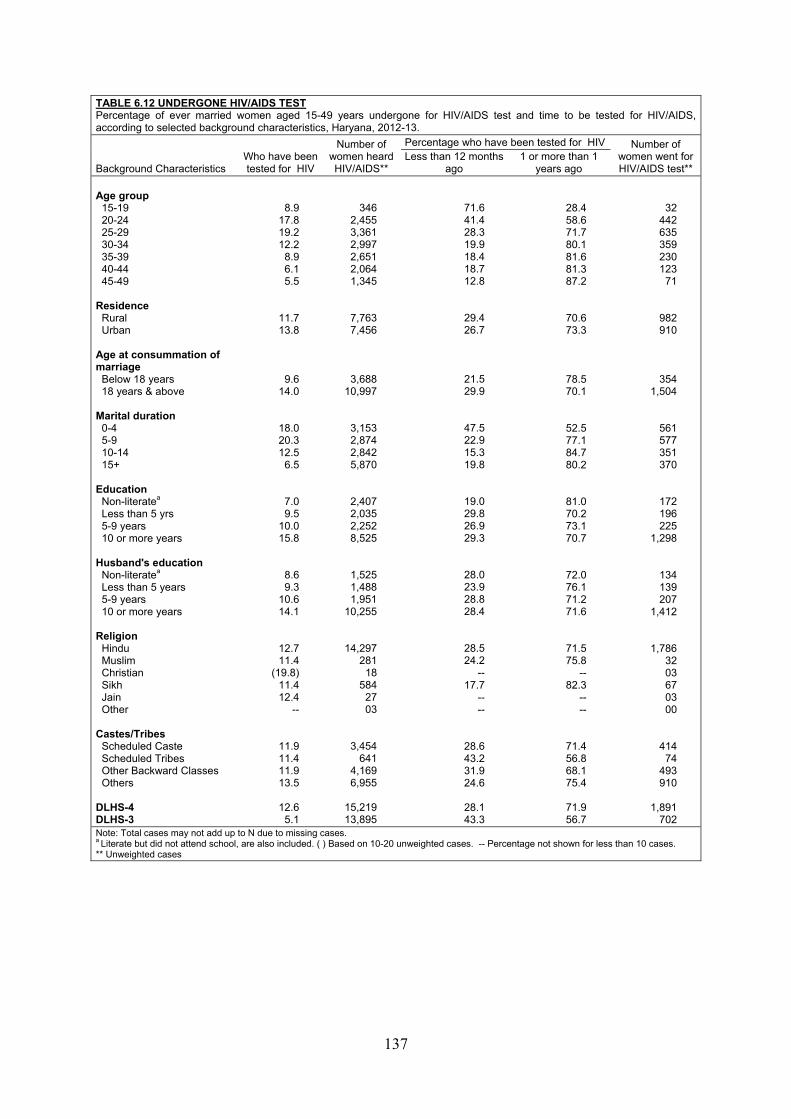
137
TABLE 6.12 UNDERGONE HIV/AIDS TEST Percentage of ever married women aged 15-49 years undergone for HIV/AIDS test and time to be tested for HIV/AIDS, according to selected background characteristics, Haryana, 2012-13.
Background Characteristics Who have been tested for HIV
Number of women heard HIV/AIDS**
Percentage who have been tested for HIV Number of women went for HIV/AIDS test**
Less than 12 months ago
1 or more than 1 years ago
Age group 15-19 20-24 25-29 30-34 35-39 40-44 45-49
Residence Rural Urban
Age at consummation of marriage Below 18 years 18 years & above
Marital duration 0-4 5-9 10-14 15+
Education Non-literatea Less than 5 yrs 5-9 years 10 or more years
Husband's education Non-literatea Less than 5 years 5-9 years 10 or more years
Religion Hindu Muslim Christian Sikh Jain Other
Castes/Tribes Scheduled Caste Scheduled Tribes Other Backward Classes Others
DLHS-4 DLHS-3
8.9 17.8 19.2 12.2 8.9 6.1 5.5
11.7 13.8
9.6 14.0
18.0 20.3 12.5 6.5
7.0 9.5
10.0 15.8
8.6 9.3
10.6 14.1
12.7 11.4
(19.8) 11.4 12.4
--
11.9 11.4 11.9 13.5
12.6 5.1
346 2,455 3,361 2,997 2,651 2,064 1,345
7,763 7,456
3,688 10,997
3,153 2,874 2,842 5,870
2,407 2,035 2,252 8,525
1,525 1,488 1,951
10,255
14,297 281 18
584 27 03
3,454 641
4,169 6,955
15,219 13,895
71.6 41.4 28.3 19.9 18.4 18.7 12.8
29.4 26.7
21.5 29.9
47.5 22.9 15.3 19.8
19.0 29.8 26.9 29.3
28.0 23.9 28.8 28.4
28.5 24.2
-- 17.7
-- --
28.6 43.2 31.9 24.6
28.1 43.3
28.4 58.6 71.7 80.1 81.6 81.3 87.2
70.6 73.3
78.5 70.1
52.5 77.1 84.7 80.2
81.0 70.2 73.1 70.7
72.0 76.1 71.2 71.6
71.5 75.8
-- 82.3
-- --
71.4 56.8 68.1 75.4
71.9 56.7
32 442 635 359 230 123 71
982 910
354 1,504
561 577 351 370
172 196 225
1,298
134 139 207
1,412
1,786 32 03 67 03 00
414 74
493 910
1,891 702
Note: Total cases may not add up to N due to missing cases. a Literate but did not attend school, are also included. ( ) Based on 10-20 unweighted cases. -- Percentage not shown for less than 10 cases. ** Unweighted cases
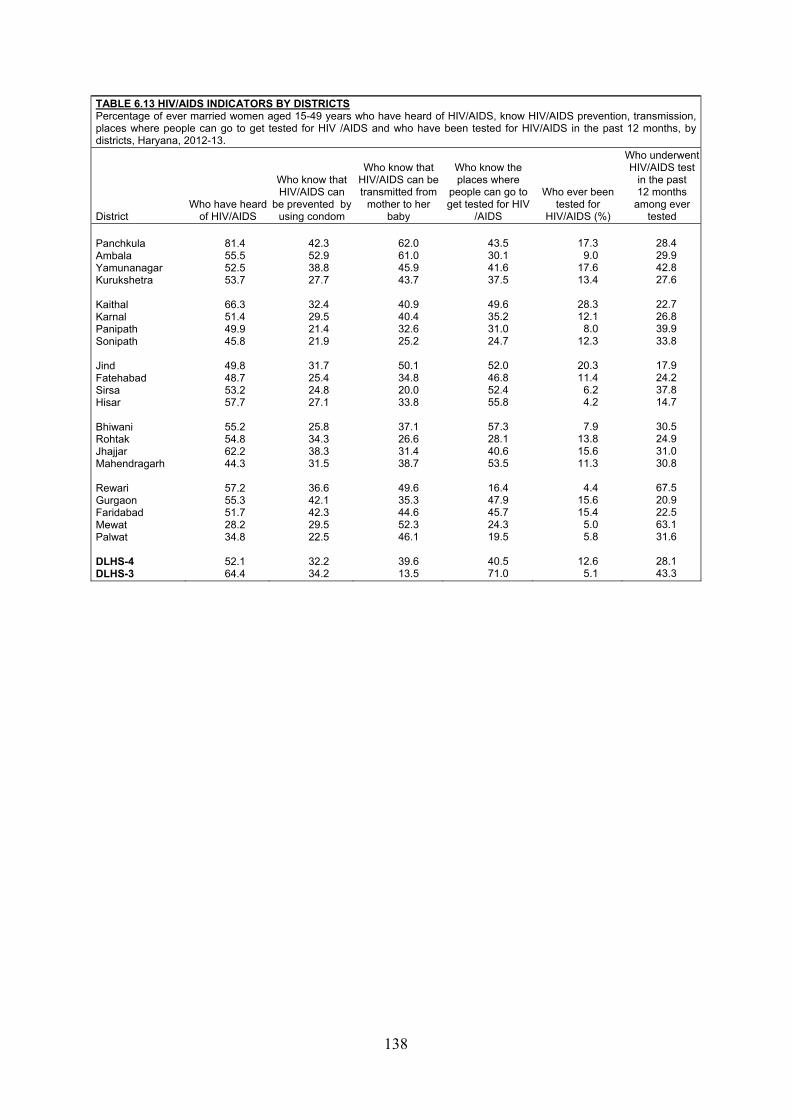
138
TABLE 6.13 HIV/AIDS INDICATORS BY DISTRICTS Percentage of ever married women aged 15-49 years who have heard of HIV/AIDS, know HIV/AIDS prevention, transmission, places where people can go to get tested for HIV /AIDS and who have been tested for HIV/AIDS in the past 12 months, by districts, Haryana, 2012-13.
District Who have heard
of HIV/AIDS
Who know that HIV/AIDS can
be prevented by using condom
Who know that HIV/AIDS can be transmitted from
mother to her baby
Who know the places where
people can go to get tested for HIV
/AIDS
Who ever been tested for
HIV/AIDS (%)
Who underwent HIV/AIDS test
in the past 12 months
among ever tested
Panchkula Ambala Yamunanagar Kurukshetra
Kaithal Karnal Panipath Sonipath
Jind Fatehabad Sirsa Hisar
Bhiwani Rohtak Jhajjar Mahendragarh
Rewari Gurgaon Faridabad Mewat Palwat
DLHS-4 DLHS-3
81.4 55.5 52.5 53.7
66.3 51.4 49.9 45.8
49.8 48.7 53.2 57.7
55.2 54.8 62.2 44.3
57.2 55.3 51.7 28.2 34.8
52.1 64.4
42.3 52.9 38.8 27.7
32.4 29.5 21.4 21.9
31.7 25.4 24.8 27.1
25.8 34.3 38.3 31.5
36.6 42.1 42.3 29.5 22.5
32.2 34.2
62.0 61.0 45.9 43.7
40.9 40.4 32.6 25.2
50.1 34.8 20.0 33.8
37.1 26.6 31.4 38.7
49.6 35.3 44.6 52.3 46.1
39.6 13.5
43.5 30.1 41.6 37.5
49.6 35.2 31.0 24.7
52.0 46.8 52.4 55.8
57.3 28.1 40.6 53.5
16.4 47.9 45.7 24.3 19.5
40.5 71.0
17.3 9.0
17.6 13.4
28.3 12.1 8.0
12.3
20.3 11.4 6.2 4.2
7.9 13.8 15.6 11.3
4.4 15.6 15.4 5.0 5.8
12.6 5.1
28.4 29.9 42.8 27.6
22.7 26.8 39.9 33.8
17.9 24.2 37.8 14.7
30.5 24.9 31.0 30.8
67.5 20.9 22.5 63.1 31.6
28.1 43.3
PERSONAL HABITS AND MORBIDITY

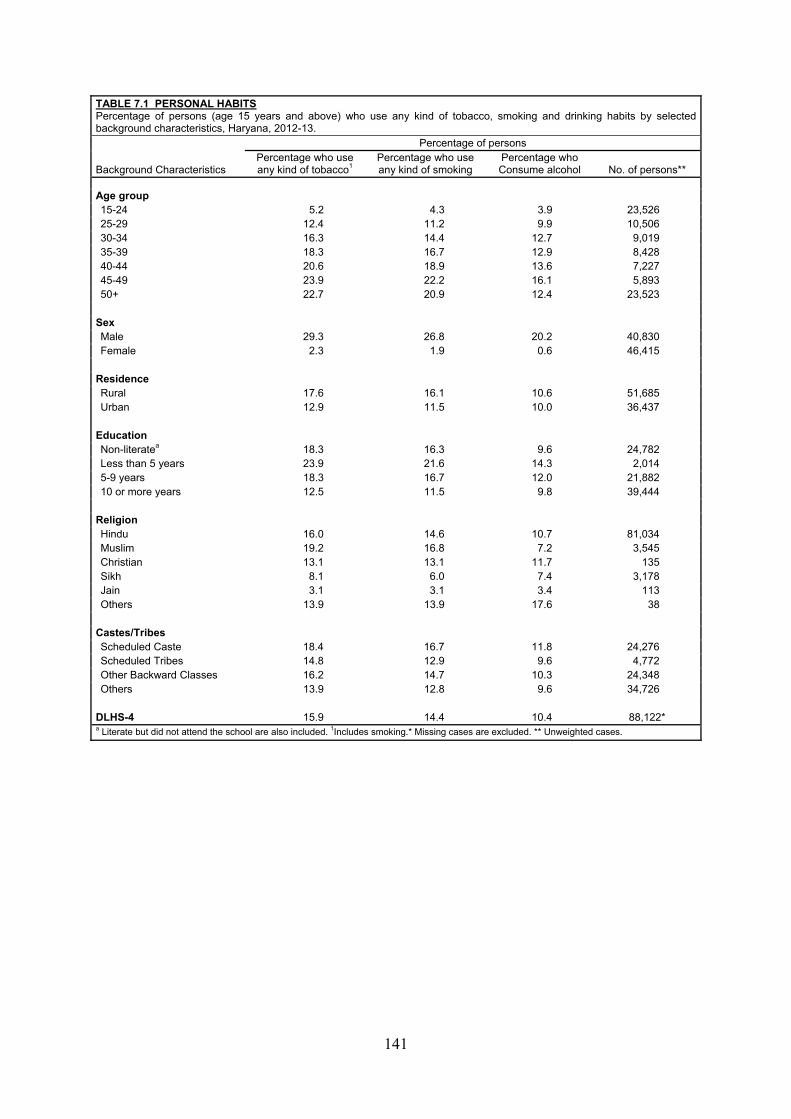
141
TABLE 7.1 PERSONAL HABITS Percentage of persons (age 15 years and above) who use any kind of tobacco, smoking and drinking habits by selected background characteristics, Haryana, 2012-13.
Background Characteristics
Percentage of persons Percentage who use any kind of tobacco1
Percentage who use any kind of smoking
Percentage who Consume alcohol No. of persons**
Age group 15-24 5.2 4.3 3.9 23,526 25-29 12.4 11.2 9.9 10,506 30-34 16.3 14.4 12.7 9,019 35-39 18.3 16.7 12.9 8,428 40-44 20.6 18.9 13.6 7,227 45-49 23.9 22.2 16.1 5,893 50+ 22.7 20.9 12.4 23,523
Sex Male 29.3 26.8 20.2 40,830 Female 2.3 1.9 0.6 46,415
Residence Rural 17.6 16.1 10.6 51,685 Urban 12.9 11.5 10.0 36,437
Education Non-literatea 18.3 16.3 9.6 24,782 Less than 5 years 23.9 21.6 14.3 2,014 5-9 years 18.3 16.7 12.0 21,882 10 or more years 12.5 11.5 9.8 39,444
Religion Hindu 16.0 14.6 10.7 81,034 Muslim 19.2 16.8 7.2 3,545 Christian 13.1 13.1 11.7 135 Sikh 8.1 6.0 7.4 3,178 Jain 3.1 3.1 3.4 113 Others 13.9 13.9 17.6 38
Castes/Tribes Scheduled Caste 18.4 16.7 11.8 24,276 Scheduled Tribes 14.8 12.9 9.6 4,772 Other Backward Classes 16.2 14.7 10.3 24,348 Others 13.9 12.8 9.6 34,726
DLHS-4 15.9 14.4 10.4 88,122* a Literate but did not attend the school are also included. 1Includes smoking.* Missing cases are excluded. ** Unweighted cases.
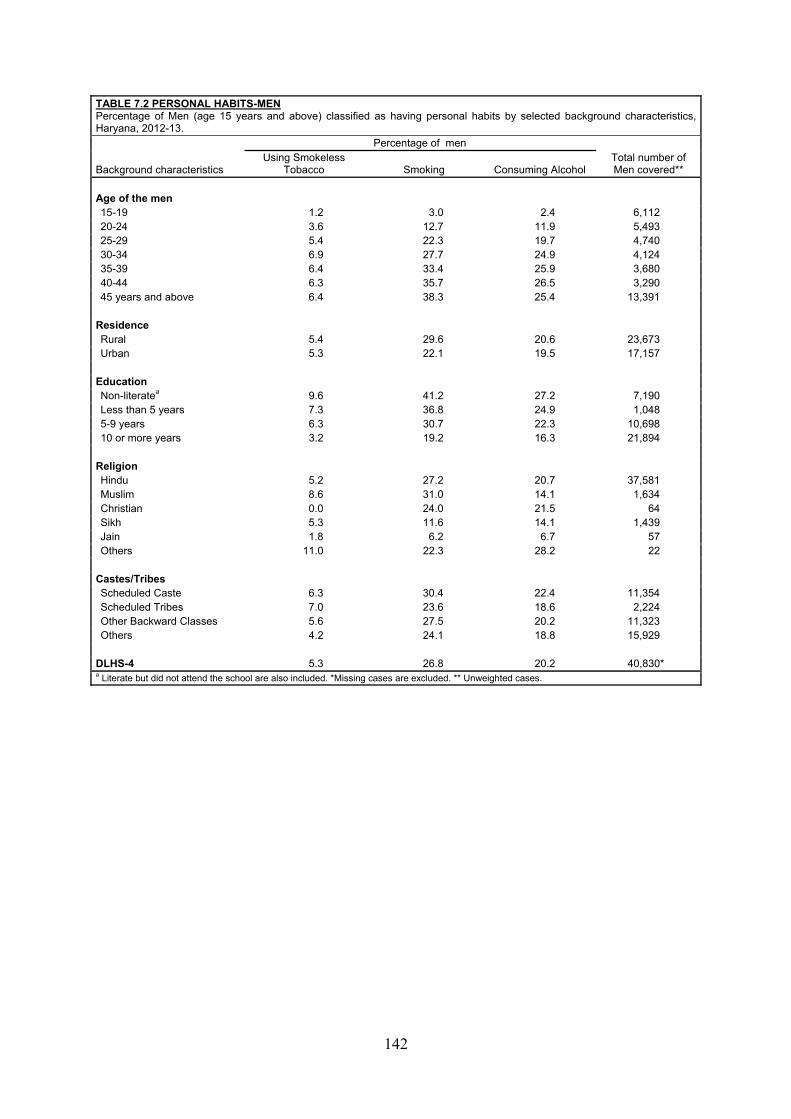
142
TABLE 7.2 PERSONAL HABITS-MEN Percentage of Men (age 15 years and above) classified as having personal habits by selected background characteristics, Haryana, 2012-13.
Background characteristics
Percentage of men Total number of Men covered**
Using Smokeless Tobacco Smoking Consuming Alcohol
Age of the men 15-19 1.2 3.0 2.4 6,112 20-24 3.6 12.7 11.9 5,493 25-29 5.4 22.3 19.7 4,740 30-34 6.9 27.7 24.9 4,124 35-39 6.4 33.4 25.9 3,680 40-44 6.3 35.7 26.5 3,290 45 years and above 6.4 38.3 25.4 13,391
Residence Rural 5.4 29.6 20.6 23,673 Urban 5.3 22.1 19.5 17,157
Education Non-literatea 9.6 41.2 27.2 7,190 Less than 5 years 7.3 36.8 24.9 1,048 5-9 years 6.3 30.7 22.3 10,698 10 or more years 3.2 19.2 16.3 21,894
Religion Hindu 5.2 27.2 20.7 37,581 Muslim 8.6 31.0 14.1 1,634 Christian 0.0 24.0 21.5 64 Sikh 5.3 11.6 14.1 1,439 Jain 1.8 6.2 6.7 57 Others 11.0 22.3 28.2 22
Castes/Tribes Scheduled Caste 6.3 30.4 22.4 11,354 Scheduled Tribes 7.0 23.6 18.6 2,224 Other Backward Classes 5.6 27.5 20.2 11,323 Others 4.2 24.1 18.8 15,929
DLHS-4 5.3 26.8 20.2 40,830* a Literate but did not attend the school are also included. *Missing cases are excluded. ** Unweighted cases.
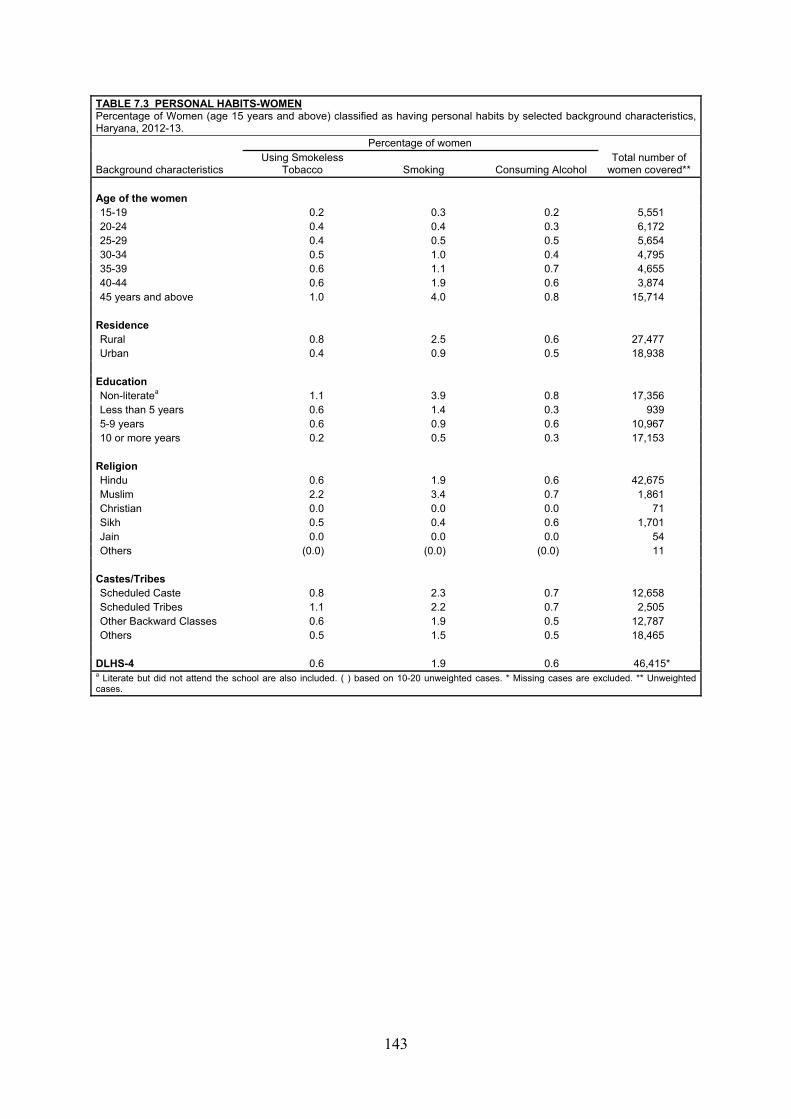
143
TABLE 7.3 PERSONAL HABITS-WOMEN Percentage of Women (age 15 years and above) classified as having personal habits by selected background characteristics, Haryana, 2012-13.
Background characteristics
Percentage of women Total number of
women covered** Using Smokeless
Tobacco Smoking Consuming Alcohol Age of the women 15-19 0.2 0.3 0.2 5,551 20-24 0.4 0.4 0.3 6,172 25-29 0.4 0.5 0.5 5,654 30-34 0.5 1.0 0.4 4,795 35-39 0.6 1.1 0.7 4,655 40-44 0.6 1.9 0.6 3,874 45 years and above 1.0 4.0 0.8 15,714
Residence Rural 0.8 2.5 0.6 27,477 Urban 0.4 0.9 0.5 18,938
Education Non-literatea 1.1 3.9 0.8 17,356 Less than 5 years 0.6 1.4 0.3 939 5-9 years 0.6 0.9 0.6 10,967 10 or more years 0.2 0.5 0.3 17,153
Religion Hindu 0.6 1.9 0.6 42,675 Muslim 2.2 3.4 0.7 1,861 Christian 0.0 0.0 0.0 71 Sikh 0.5 0.4 0.6 1,701 Jain 0.0 0.0 0.0 54 Others (0.0) (0.0) (0.0) 11
Castes/Tribes Scheduled Caste 0.8 2.3 0.7 12,658 Scheduled Tribes 1.1 2.2 0.7 2,505 Other Backward Classes 0.6 1.9 0.5 12,787 Others 0.5 1.5 0.5 18,465
DLHS-4 0.6 1.9 0.6 46,415* a Literate but did not attend the school are also included. ( ) based on 10-20 unweighted cases. * Missing cases are excluded. ** Unweighted cases.
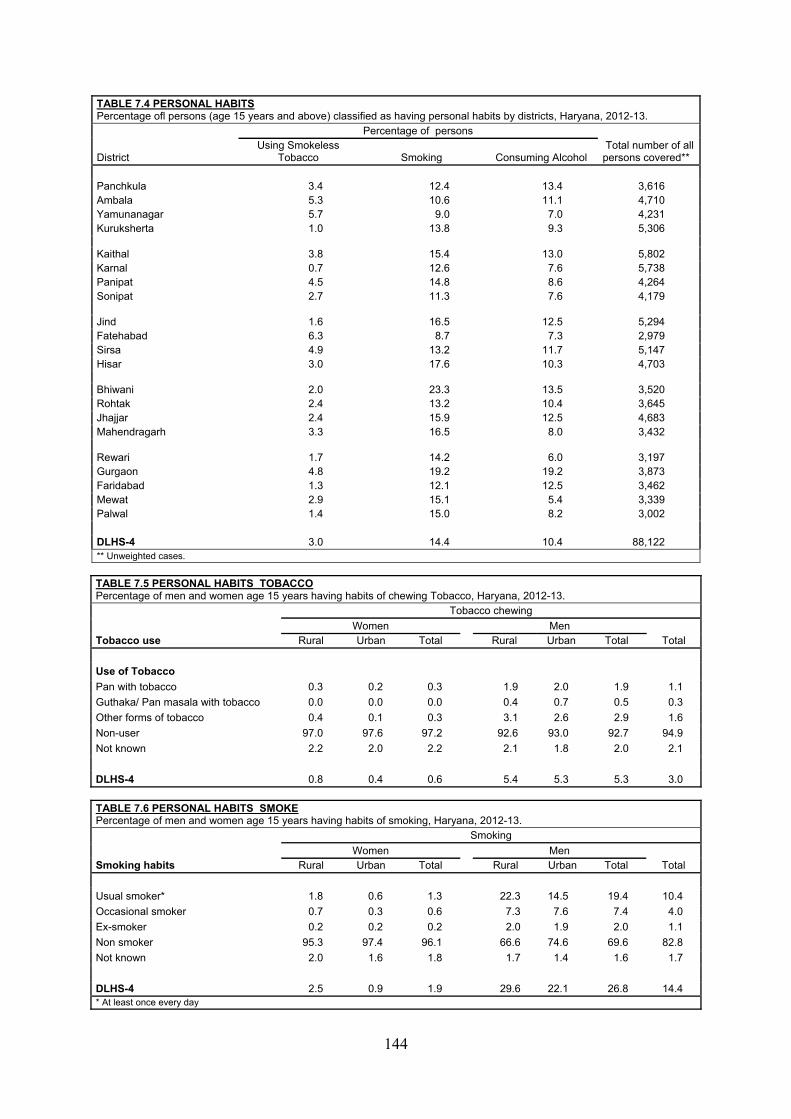
144
TABLE 7.4 PERSONAL HABITS Percentage ofl persons (age 15 years and above) classified as having personal habits by districts, Haryana, 2012-13.
District
Percentage of persons Total number of all persons covered**
Using Smokeless Tobacco Smoking Consuming Alcohol
Panchkula 3.4 12.4 13.4 3,616 Ambala 5.3 10.6 11.1 4,710 Yamunanagar 5.7 9.0 7.0 4,231 Kuruksherta 1.0 13.8 9.3 5,306
Kaithal 3.8 15.4 13.0 5,802 Karnal 0.7 12.6 7.6 5,738 Panipat 4.5 14.8 8.6 4,264 Sonipat 2.7 11.3 7.6 4,179
Jind 1.6 16.5 12.5 5,294 Fatehabad 6.3 8.7 7.3 2,979 Sirsa 4.9 13.2 11.7 5,147 Hisar 3.0 17.6 10.3 4,703
Bhiwani 2.0 23.3 13.5 3,520 Rohtak 2.4 13.2 10.4 3,645 Jhajjar 2.4 15.9 12.5 4,683 Mahendragarh 3.3 16.5 8.0 3,432
Rewari 1.7 14.2 6.0 3,197 Gurgaon 4.8 19.2 19.2 3,873 Faridabad 1.3 12.1 12.5 3,462 Mewat 2.9 15.1 5.4 3,339 Palwal 1.4 15.0 8.2 3,002 DLHS-4 3.0 14.4 10.4 88,122 ** Unweighted cases.
TABLE 7.5 PERSONAL HABITS TOBACCO Percentage of men and women age 15 years having habits of chewing Tobacco, Haryana, 2012-13.
Tobacco use
Tobacco chewing
Women Men Total Rural Urban Total Rural Urban Total
Use of Tobacco
Pan with tobacco 0.3 0.2 0.3 1.9 2.0 1.9 1.1
Guthaka/ Pan masala with tobacco 0.0 0.0 0.0 0.4 0.7 0.5 0.3
Other forms of tobacco 0.4 0.1 0.3 3.1 2.6 2.9 1.6
Non-user 97.0 97.6 97.2 92.6 93.0 92.7 94.9
Not known 2.2 2.0 2.2 2.1 1.8 2.0 2.1
DLHS-4 0.8 0.4 0.6 5.4 5.3 5.3 3.0 TABLE 7.6 PERSONAL HABITS SMOKE Percentage of men and women age 15 years having habits of smoking, Haryana, 2012-13.
Smoking habits
Smoking
Women Men Total Rural Urban Total Rural Urban Total
Usual smoker* 1.8 0.6 1.3 22.3 14.5 19.4 10.4
Occasional smoker 0.7 0.3 0.6 7.3 7.6 7.4 4.0
Ex-smoker 0.2 0.2 0.2 2.0 1.9 2.0 1.1
Non smoker 95.3 97.4 96.1 66.6 74.6 69.6 82.8
Not known 2.0 1.6 1.8 1.7 1.4 1.6 1.7
DLHS-4 2.5 0.9 1.9 29.6 22.1 26.8 14.4 * At least once every day
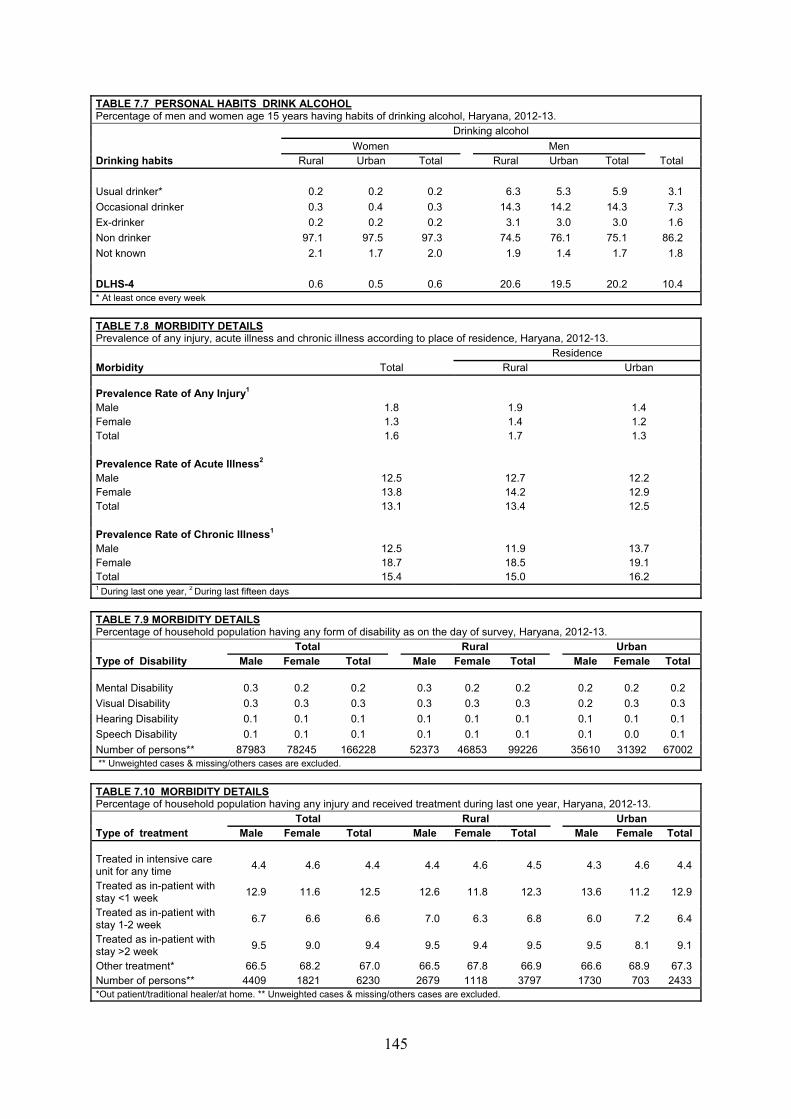
145
TABLE 7.7 PERSONAL HABITS DRINK ALCOHOL Percentage of men and women age 15 years having habits of drinking alcohol, Haryana, 2012-13.
Drinking habits
Drinking alcohol
Women Men Total Rural Urban Total Rural Urban Total
Usual drinker* 0.2 0.2 0.2 6.3 5.3 5.9 3.1
Occasional drinker 0.3 0.4 0.3 14.3 14.2 14.3 7.3
Ex-drinker 0.2 0.2 0.2 3.1 3.0 3.0 1.6
Non drinker 97.1 97.5 97.3 74.5 76.1 75.1 86.2
Not known 2.1 1.7 2.0 1.9 1.4 1.7 1.8
DLHS-4 0.6 0.5 0.6 20.6 19.5 20.2 10.4 * At least once every week
TABLE 7.8 MORBIDITY DETAILS Prevalence of any injury, acute illness and chronic illness according to place of residence, Haryana, 2012-13.
Morbidity Residence
Total Rural Urban
Prevalence Rate of Any Injury1 Male 1.8 1.9 1.4 Female 1.3 1.4 1.2 Total 1.6 1.7 1.3 Prevalence Rate of Acute Illness2 Male 12.5 12.7 12.2 Female 13.8 14.2 12.9 Total 13.1 13.4 12.5 Prevalence Rate of Chronic Illness1 Male 12.5 11.9 13.7 Female 18.7 18.5 19.1 Total 15.4 15.0 16.2 1 During last one year, 2 During last fifteen days
TABLE 7.9 MORBIDITY DETAILS Percentage of household population having any form of disability as on the day of survey, Haryana, 2012-13.
Type of Disability Total Rural Urban
Male Female Total Male Female Total Male Female Total
Mental Disability 0.3 0.2 0.2 0.3 0.2 0.2 0.2 0.2 0.2
Visual Disability 0.3 0.3 0.3 0.3 0.3 0.3 0.2 0.3 0.3
Hearing Disability 0.1 0.1 0.1 0.1 0.1 0.1 0.1 0.1 0.1
Speech Disability 0.1 0.1 0.1 0.1 0.1 0.1 0.1 0.0 0.1
Number of persons** 87983 78245 166228 52373 46853 99226 35610 31392 67002 ** Unweighted cases & missing/others cases are excluded.
TABLE 7.10 MORBIDITY DETAILS Percentage of household population having any injury and received treatment during last one year, Haryana, 2012-13.
Type of treatment Total Rural Urban
Male Female Total Male Female Total Male Female Total
Treated in intensive care unit for any time
4.4 4.6 4.4
4.4 4.6 4.5
4.3 4.6 4.4
Treated as in-patient with stay <1 week
12.9 11.6 12.5 12.6 11.8 12.3 13.6 11.2 12.9
Treated as in-patient with stay 1-2 week
6.7 6.6 6.6 7.0 6.3 6.8 6.0 7.2 6.4
Treated as in-patient with stay >2 week
9.5 9.0 9.4 9.5 9.4 9.5 9.5 8.1 9.1
Other treatment* 66.5 68.2 67.0 66.5 67.8 66.9 66.6 68.9 67.3 Number of persons** 4409 1821 6230 2679 1118 3797 1730 703 2433 *Out patient/traditional healer/at home. ** Unweighted cases & missing/others cases are excluded.
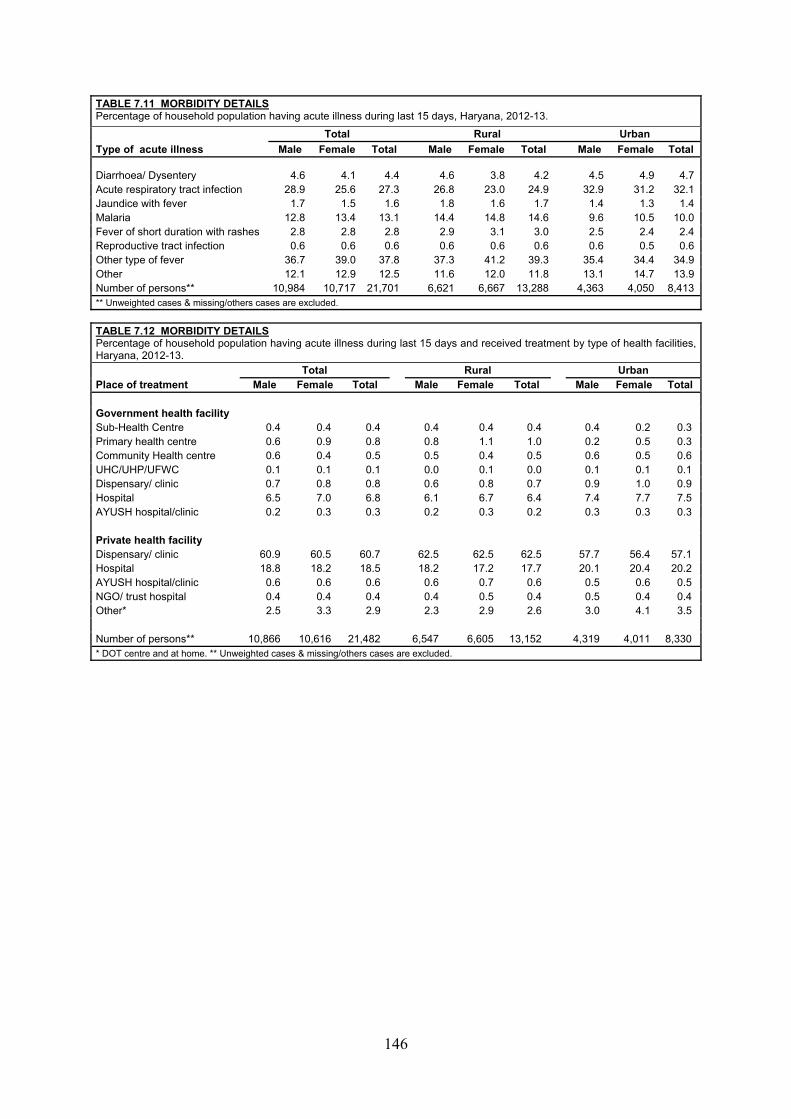
146
TABLE 7.11 MORBIDITY DETAILS Percentage of household population having acute illness during last 15 days, Haryana, 2012-13.
Type of acute illness
Total Rural Urban
Male Female Total Male Female Total Male Female Total
Diarrhoea/ Dysentery 4.6 4.1 4.4 4.6 3.8 4.2 4.5 4.9 4.7 Acute respiratory tract infection 28.9 25.6 27.3 26.8 23.0 24.9 32.9 31.2 32.1 Jaundice with fever 1.7 1.5 1.6 1.8 1.6 1.7 1.4 1.3 1.4 Malaria 12.8 13.4 13.1 14.4 14.8 14.6 9.6 10.5 10.0 Fever of short duration with rashes 2.8 2.8 2.8 2.9 3.1 3.0 2.5 2.4 2.4 Reproductive tract infection 0.6 0.6 0.6 0.6 0.6 0.6 0.6 0.5 0.6 Other type of fever 36.7 39.0 37.8 37.3 41.2 39.3 35.4 34.4 34.9 Other 12.1 12.9 12.5 11.6 12.0 11.8 13.1 14.7 13.9 Number of persons** 10,984 10,717 21,701 6,621 6,667 13,288 4,363 4,050 8,413 ** Unweighted cases & missing/others cases are excluded.
TABLE 7.12 MORBIDITY DETAILS Percentage of household population having acute illness during last 15 days and received treatment by type of health facilities, Haryana, 2012-13.
Place of treatment Total Rural Urban
Male Female Total Male Female Total Male Female Total Government health facility Sub-Health Centre 0.4 0.4 0.4 0.4 0.4 0.4 0.4 0.2 0.3 Primary health centre 0.6 0.9 0.8 0.8 1.1 1.0 0.2 0.5 0.3 Community Health centre 0.6 0.4 0.5 0.5 0.4 0.5 0.6 0.5 0.6 UHC/UHP/UFWC 0.1 0.1 0.1 0.0 0.1 0.0 0.1 0.1 0.1 Dispensary/ clinic 0.7 0.8 0.8 0.6 0.8 0.7 0.9 1.0 0.9 Hospital 6.5 7.0 6.8 6.1 6.7 6.4 7.4 7.7 7.5 AYUSH hospital/clinic 0.2 0.3 0.3 0.2 0.3 0.2 0.3 0.3 0.3 Private health facility Dispensary/ clinic 60.9 60.5 60.7 62.5 62.5 62.5 57.7 56.4 57.1 Hospital 18.8 18.2 18.5 18.2 17.2 17.7 20.1 20.4 20.2 AYUSH hospital/clinic 0.6 0.6 0.6 0.6 0.7 0.6 0.5 0.6 0.5 NGO/ trust hospital 0.4 0.4 0.4 0.4 0.5 0.4 0.5 0.4 0.4 Other* 2.5 3.3 2.9 2.3 2.9 2.6 3.0 4.1 3.5 Number of persons** 10,866 10,616 21,482 6,547 6,605 13,152 4,319 4,011 8,330 * DOT centre and at home. ** Unweighted cases & missing/others cases are excluded.
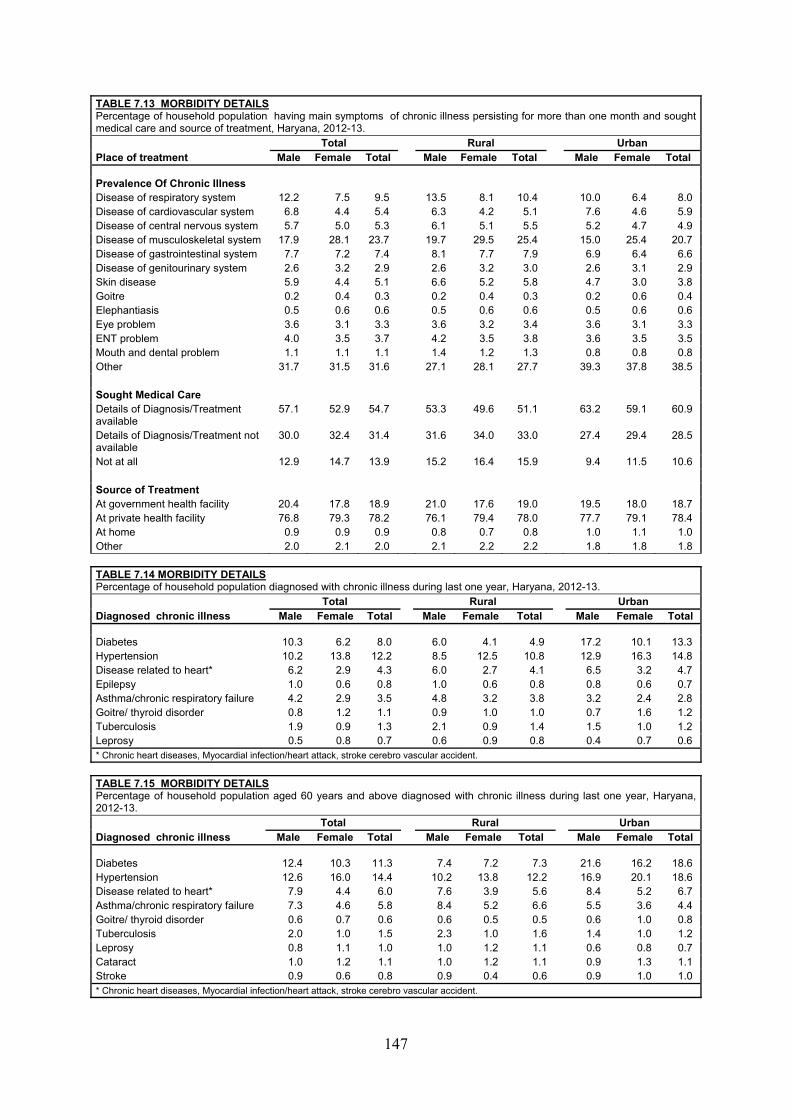
147
TABLE 7.13 MORBIDITY DETAILS Percentage of household population having main symptoms of chronic illness persisting for more than one month and sought medical care and source of treatment, Haryana, 2012-13.
Place of treatment Total Rural Urban
Male Female Total Male Female Total Male Female Total
Prevalence Of Chronic Illness Disease of respiratory system 12.2 7.5 9.5 13.5 8.1 10.4 10.0 6.4 8.0 Disease of cardiovascular system 6.8 4.4 5.4 6.3 4.2 5.1 7.6 4.6 5.9 Disease of central nervous system 5.7 5.0 5.3 6.1 5.1 5.5 5.2 4.7 4.9 Disease of musculoskeletal system 17.9 28.1 23.7 19.7 29.5 25.4 15.0 25.4 20.7 Disease of gastrointestinal system 7.7 7.2 7.4 8.1 7.7 7.9 6.9 6.4 6.6 Disease of genitourinary system 2.6 3.2 2.9 2.6 3.2 3.0 2.6 3.1 2.9 Skin disease 5.9 4.4 5.1 6.6 5.2 5.8 4.7 3.0 3.8 Goitre 0.2 0.4 0.3 0.2 0.4 0.3 0.2 0.6 0.4 Elephantiasis 0.5 0.6 0.6 0.5 0.6 0.6 0.5 0.6 0.6 Eye problem 3.6 3.1 3.3 3.6 3.2 3.4 3.6 3.1 3.3 ENT problem 4.0 3.5 3.7 4.2 3.5 3.8 3.6 3.5 3.5 Mouth and dental problem 1.1 1.1 1.1 1.4 1.2 1.3 0.8 0.8 0.8 Other 31.7 31.5 31.6 27.1 28.1 27.7 39.3 37.8 38.5 Sought Medical Care Details of Diagnosis/Treatment available
57.1 52.9 54.7 53.3 49.6 51.1 63.2 59.1 60.9
Details of Diagnosis/Treatment not available
30.0 32.4 31.4 31.6 34.0 33.0 27.4 29.4 28.5
Not at all 12.9 14.7 13.9 15.2 16.4 15.9 9.4 11.5 10.6 Source of Treatment At government health facility 20.4 17.8 18.9 21.0 17.6 19.0 19.5 18.0 18.7 At private health facility 76.8 79.3 78.2 76.1 79.4 78.0 77.7 79.1 78.4 At home 0.9 0.9 0.9 0.8 0.7 0.8 1.0 1.1 1.0 Other 2.0 2.1 2.0 2.1 2.2 2.2 1.8 1.8 1.8 TABLE 7.14 MORBIDITY DETAILS Percentage of household population diagnosed with chronic illness during last one year, Haryana, 2012-13.
Diagnosed chronic illness Total Rural Urban
Male Female Total Male Female Total Male Female Total
Diabetes 10.3 6.2 8.0 6.0 4.1 4.9 17.2 10.1 13.3 Hypertension 10.2 13.8 12.2 8.5 12.5 10.8 12.9 16.3 14.8 Disease related to heart* 6.2 2.9 4.3 6.0 2.7 4.1 6.5 3.2 4.7 Epilepsy 1.0 0.6 0.8 1.0 0.6 0.8 0.8 0.6 0.7 Asthma/chronic respiratory failure 4.2 2.9 3.5 4.8 3.2 3.8 3.2 2.4 2.8 Goitre/ thyroid disorder 0.8 1.2 1.1 0.9 1.0 1.0 0.7 1.6 1.2 Tuberculosis 1.9 0.9 1.3 2.1 0.9 1.4 1.5 1.0 1.2 Leprosy 0.5 0.8 0.7 0.6 0.9 0.8 0.4 0.7 0.6 * Chronic heart diseases, Myocardial infection/heart attack, stroke cerebro vascular accident.
TABLE 7.15 MORBIDITY DETAILS Percentage of household population aged 60 years and above diagnosed with chronic illness during last one year, Haryana, 2012-13.
Diagnosed chronic illness Total Rural Urban
Male Female Total Male Female Total Male Female Total
Diabetes 12.4 10.3 11.3 7.4 7.2 7.3 21.6 16.2 18.6 Hypertension 12.6 16.0 14.4 10.2 13.8 12.2 16.9 20.1 18.6 Disease related to heart* 7.9 4.4 6.0 7.6 3.9 5.6 8.4 5.2 6.7 Asthma/chronic respiratory failure 7.3 4.6 5.8 8.4 5.2 6.6 5.5 3.6 4.4 Goitre/ thyroid disorder 0.6 0.7 0.6 0.6 0.5 0.5 0.6 1.0 0.8 Tuberculosis 2.0 1.0 1.5 2.3 1.0 1.6 1.4 1.0 1.2 Leprosy 0.8 1.1 1.0 1.0 1.2 1.1 0.6 0.8 0.7 Cataract 1.0 1.2 1.1 1.0 1.2 1.1 0.9 1.3 1.1 Stroke 0.9 0.6 0.8 0.9 0.4 0.6 0.9 1.0 1.0 * Chronic heart diseases, Myocardial infection/heart attack, stroke cerebro vascular accident.
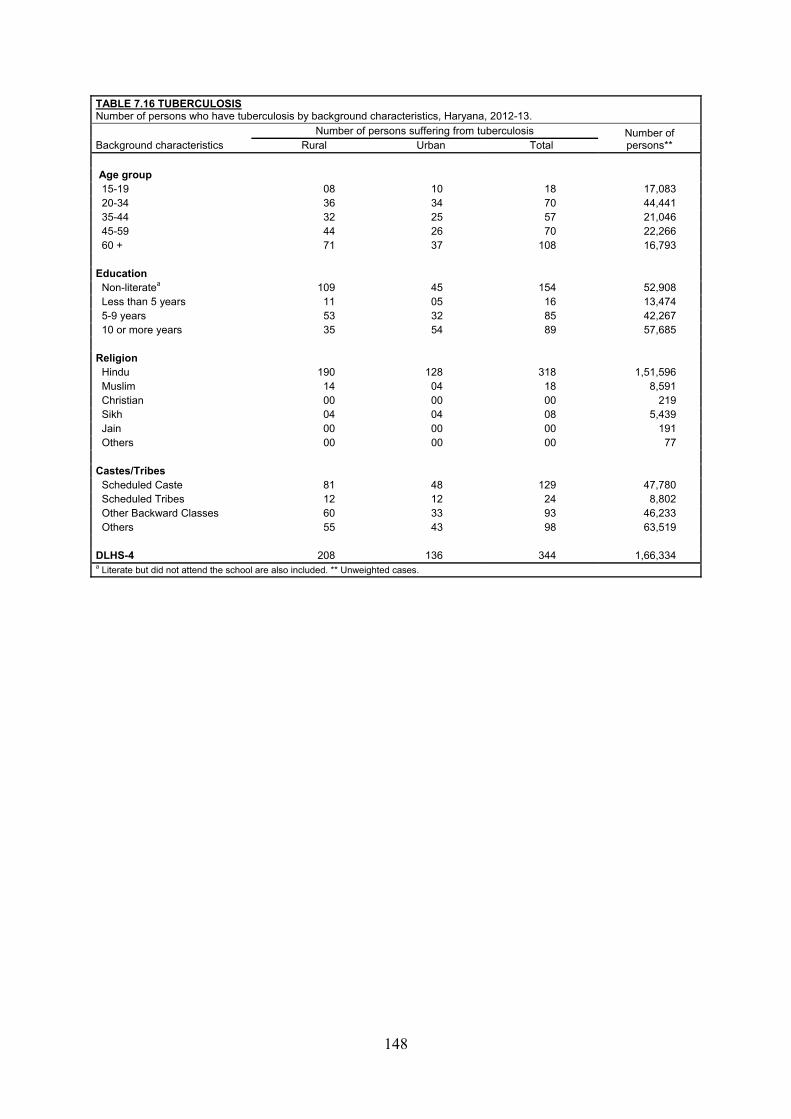
148
TABLE 7.16 TUBERCULOSIS Number of persons who have tuberculosis by background characteristics, Haryana, 2012-13.
Background characteristics Number of persons suffering from tuberculosis Number of
persons** Rural Urban Total
Age group
15-19 08 10 18 17,083 20-34 36 34 70 44,441 35-44 32 25 57 21,046 45-59 44 26 70 22,266 60 + 71 37 108 16,793
Education
Non-literatea 109 45 154 52,908 Less than 5 years 11 05 16 13,474 5-9 years 53 32 85 42,267 10 or more years 35 54 89 57,685
Religion
Hindu 190 128 318 1,51,596 Muslim 14 04 18 8,591 Christian 00 00 00 219 Sikh 04 04 08 5,439 Jain 00 00 00 191 Others 00 00 00 77
Castes/Tribes
Scheduled Caste 81 48 129 47,780 Scheduled Tribes 12 12 24 8,802 Other Backward Classes 60 33 93 46,233 Others 55 43 98 63,519
DLHS-4 208 136 344 1,66,334 a Literate but did not attend the school are also included. ** Unweighted cases.
HEALTH AND NUTRITIONAL STATUS

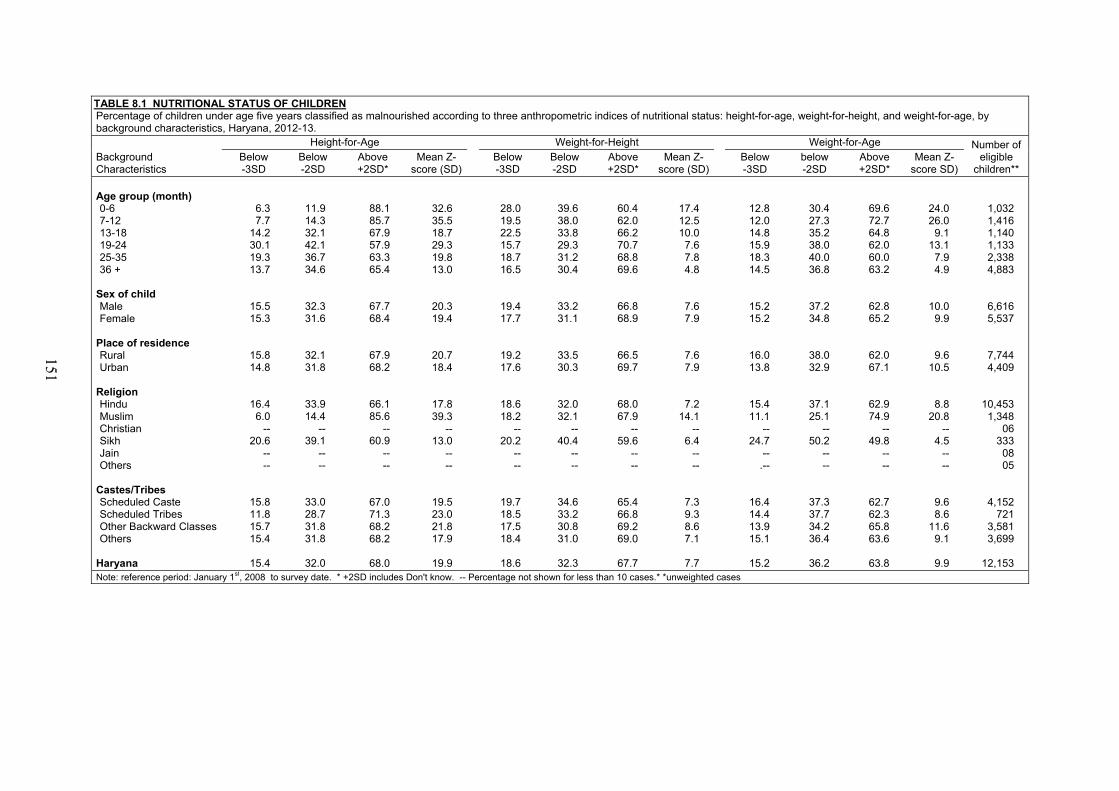
151
TABLE 8.1 NUTRITIONAL STATUS OF CHILDREN Percentage of children under age five years classified as malnourished according to three anthropometric indices of nutritional status: height-for-age, weight-for-height, and weight-for-age, by background characteristics, Haryana, 2012-13.
Background Characteristics
Height-for-Age Weight-for-Height Weight-for-Age Number of eligible
children** Below -3SD
Below -2SD
Above +2SD*
Mean Z- score (SD)
Below -3SD
Below -2SD
Above +2SD*
Mean Z- score (SD)
Below -3SD
below -2SD
Above +2SD*
Mean Z- score SD)
Age group (month) 0-6 7-12 13-18 19-24 25-35 36 +
Sex of child Male Female
Place of residence Rural Urban
Religion Hindu Muslim Christian Sikh Jain Others
Castes/Tribes Scheduled Caste Scheduled Tribes Other Backward ClassesOthers
Haryana
6.3 7.7
14.2 30.1 19.3 13.7
15.5 15.3
15.8 14.8
16.4 6.0
-- 20.6
-- --
15.8 11.8 15.7 15.4
15.4
11.9 14.3 32.1 42.1 36.7 34.6
32.3 31.6
32.1 31.8
33.9 14.4
-- 39.1
-- --
33.0 28.7 31.8 31.8
32.0
88.1 85.7 67.9 57.9 63.3 65.4
67.7 68.4
67.9 68.2
66.1 85.6
-- 60.9
-- --
67.0 71.3 68.2 68.2
68.0
32.6 35.5 18.7 29.3 19.8 13.0
20.3 19.4
20.7 18.4
17.8 39.3
-- 13.0
-- --
19.5 23.0 21.8 17.9
19.9
28.0 19.5 22.5 15.7 18.7 16.5
19.4 17.7
19.2 17.6
18.6 18.2
-- 20.2
-- --
19.7 18.5 17.5 18.4
18.6
39.6 38.0 33.8 29.3 31.2 30.4
33.2 31.1
33.5 30.3
32.0 32.1
-- 40.4
-- --
34.6 33.2 30.8 31.0
32.3
60.4 62.0 66.2 70.7 68.8 69.6
66.8 68.9
66.5 69.7
68.0 67.9
-- 59.6
-- --
65.4 66.8 69.2 69.0
67.7
17.4 12.5 10.0 7.6 7.8 4.8
7.6 7.9
7.6 7.9
7.2 14.1
-- 6.4
-- --
7.3 9.3 8.6 7.1
7.7
12.8 12.0 14.8 15.9 18.3 14.5
15.2 15.2
16.0 13.8
15.4 11.1
-- 24.7
-- .--
16.4 14.4 13.9 15.1
15.2
30.4 27.3 35.2 38.0 40.0 36.8
37.2 34.8
38.0 32.9
37.1 25.1
-- 50.2
-- --
37.3 37.7 34.2 36.4
36.2
69.6 72.7 64.8 62.0 60.0 63.2
62.8 65.2
62.0 67.1
62.9 74.9
-- 49.8
-- --
62.7 62.3 65.8 63.6
63.8
24.0 26.0 9.1
13.1 7.9 4.9
10.0 9.9
9.6 10.5
8.8 20.8
-- 4.5
-- --
9.6 8.6
11.6 9.1
9.9
1,032 1,416 1,140 1,133 2,338 4,883
6,616 5,537
7,744 4,409
10,453 1,348
06 333 08 05
4,152 721
3,581 3,699
12,153 Note: reference period: January 1st, 2008 to survey date. * +2SD includes Don't know. -- Percentage not shown for less than 10 cases.* *unweighted cases
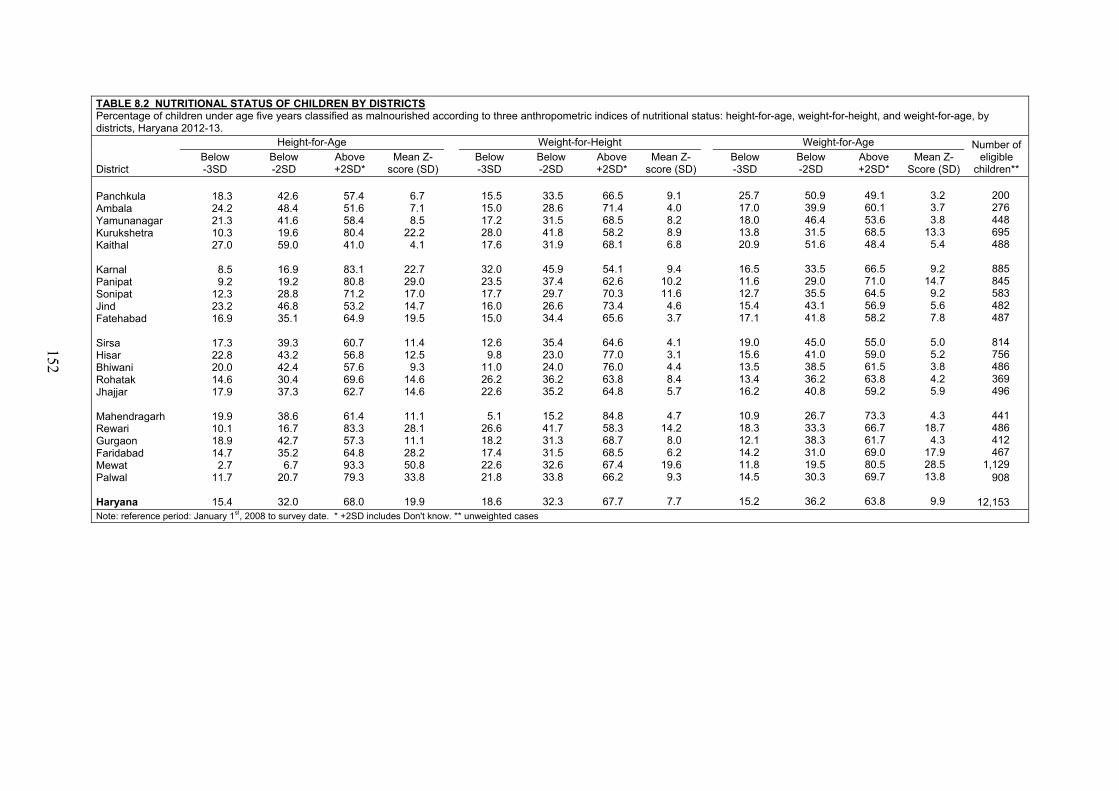
152
TABLE 8.2 NUTRITIONAL STATUS OF CHILDREN BY DISTRICTS Percentage of children under age five years classified as malnourished according to three anthropometric indices of nutritional status: height-for-age, weight-for-height, and weight-for-age, by districts, Haryana 2012-13.
District
Height-for-Age Weight-for-Height Weight-for-Age Number of eligible
children** Below -3SD
Below -2SD
Above +2SD*
Mean Z- score (SD)
Below -3SD
Below -2SD
Above +2SD*
Mean Z- score (SD)
Below -3SD
Below -2SD
Above +2SD*
Mean Z- Score (SD)
Panchkula Ambala Yamunanagar Kurukshetra Kaithal
Karnal Panipat Sonipat Jind Fatehabad
Sirsa Hisar Bhiwani Rohatak Jhajjar
Mahendragarh Rewari Gurgaon Faridabad Mewat Palwal
Haryana
18.3 24.2 21.3 10.3 27.0
8.5 9.2
12.3 23.2 16.9
17.3 22.8 20.0 14.6 17.9
19.9 10.1 18.9 14.7 2.7
11.7
15.4
42.6 48.4 41.6 19.6 59.0
16.9 19.2 28.8 46.8 35.1
39.3 43.2 42.4 30.4 37.3
38.6 16.7 42.7 35.2 6.7
20.7
32.0
57.4 51.6 58.4 80.4 41.0
83.1 80.8 71.2 53.2 64.9
60.7 56.8 57.6 69.6 62.7
61.4 83.3 57.3 64.8 93.3 79.3
68.0
6.7 7.1 8.5
22.2 4.1
22.7 29.0 17.0 14.7 19.5
11.4 12.5 9.3
14.6 14.6
11.1 28.1 11.1 28.2 50.8 33.8
19.9
15.5 15.0 17.2 28.0 17.6
32.0 23.5 17.7 16.0 15.0
12.6 9.8
11.0 26.2 22.6
5.1 26.6 18.2 17.4 22.6 21.8
18.6
33.5 28.6 31.5 41.8 31.9
45.9 37.4 29.7 26.6 34.4
35.4 23.0 24.0 36.2 35.2
15.2 41.7 31.3 31.5 32.6 33.8
32.3
66.5 71.4 68.5 58.2 68.1
54.1 62.6 70.3 73.4 65.6
64.6 77.0 76.0 63.8 64.8
84.8 58.3 68.7 68.5 67.4 66.2
67.7
9.1 4.0 8.2 8.9 6.8
9.4 10.2 11.6 4.6 3.7
4.1 3.1 4.4 8.4 5.7
4.7 14.2 8.0 6.2
19.6 9.3
7.7
25.7 17.0 18.0 13.8 20.9
16.5 11.6 12.7 15.4 17.1
19.0 15.6 13.5 13.4 16.2
10.9 18.3 12.1 14.2 11.8 14.5
15.2
50.9 39.9 46.4 31.5 51.6
33.5 29.0 35.5 43.1 41.8
45.0 41.0 38.5 36.2 40.8
26.7 33.3 38.3 31.0 19.5 30.3
36.2
49.1 60.1 53.6 68.5 48.4
66.5 71.0 64.5 56.9 58.2
55.0 59.0 61.5 63.8 59.2
73.3 66.7 61.7 69.0 80.5 69.7
63.8
3.2 3.7 3.8
13.3 5.4
9.2 14.7 9.2 5.6 7.8
5.0 5.2 3.8 4.2 5.9
4.3 18.7 4.3
17.9 28.5 13.8
9.9
200 276 448 695 488
885 845 583 482 487
814 756 486 369 496
441 486 412 467
1,129 908
12,153 Note: reference period: January 1st, 2008 to survey date. * +2SD includes Don't know. ** unweighted cases
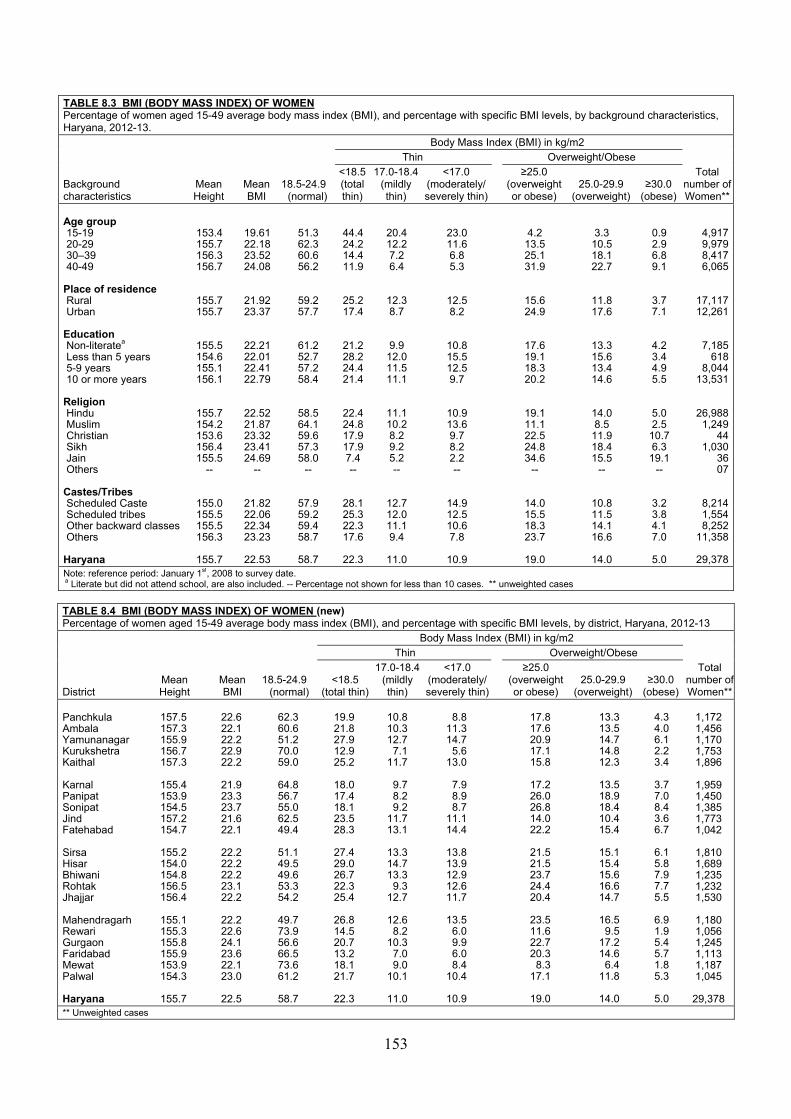
153
TABLE 8.3 BMI (BODY MASS INDEX) OF WOMEN Percentage of women aged 15-49 average body mass index (BMI), and percentage with specific BMI levels, by background characteristics, Haryana, 2012-13.
Body Mass Index (BMI) in kg/m2
Background characteristics
Mean Height
Mean BMI
18.5-24.9 (normal)
Thin Overweight/ObeseTotal
number of Women**
<18.5 (total thin)
17.0-18.4 (mildly thin)
<17.0 (moderately/ severely thin)
≥25.0 (overweight or obese)
25.0-29.9 (overweight)
≥30.0 (obese)
Age group 15-19 20-29 30–39 40-49
Place of residence Rural Urban
Education Non-literatea Less than 5 years 5-9 years 10 or more years
Religion Hindu Muslim Christian Sikh Jain Others
Castes/Tribes Scheduled Caste Scheduled tribes Other backward classes Others
Haryana
153.4 155.7 156.3 156.7
155.7 155.7
155.5 154.6 155.1 156.1
155.7 154.2 153.6 156.4 155.5
--
155.0 155.5 155.5 156.3
155.7
19.61 22.18 23.52 24.08
21.92 23.37
22.21 22.01 22.41 22.79
22.52 21.87 23.32 23.41 24.69
--
21.82 22.06 22.34 23.23
22.53
51.3 62.3 60.6 56.2
59.2 57.7
61.2 52.7 57.2 58.4
58.5 64.1 59.6 57.3 58.0
--
57.9 59.2 59.4 58.7
58.7
44.4 24.2 14.4 11.9
25.2 17.4
21.2 28.2 24.4 21.4
22.4 24.8 17.9 17.9 7.4 --
28.1 25.3 22.3 17.6
22.3
20.4 12.2 7.2 6.4
12.3 8.7
9.9 12.0 11.5 11.1
11.1 10.2 8.2 9.2 5.2 --
12.7 12.0 11.1 9.4
11.0
23.0 11.6 6.8 5.3
12.5 8.2
10.8 15.5 12.5 9.7
10.9 13.6 9.7 8.2 2.2 --
14.9 12.5 10.6 7.8
10.9
4.2 13.5 25.1 31.9
15.6 24.9
17.6 19.1 18.3 20.2
19.1 11.1 22.5 24.8 34.6
--
14.0 15.5 18.3 23.7
19.0
3.3 10.5 18.1 22.7
11.8 17.6
13.3 15.6 13.4 14.6
14.0 8.5
11.9 18.4 15.5
--
10.8 11.5 14.1 16.6
14.0
0.9 2.9 6.8 9.1
3.7 7.1
4.2 3.4 4.9 5.5
5.0 2.5
10.7 6.3
19.1 --
3.2 3.8 4.1 7.0
5.0
4,9179,9798,4176,065
17,11712,261
7,185618
8,04413,531
26,9881,249
441,030
3607
8,2141,5548,252
11,358
29,378Note: reference period: January 1st, 2008 to survey date. a Literate but did not attend school, are also included. -- Percentage not shown for less than 10 cases. ** unweighted cases
TABLE 8.4 BMI (BODY MASS INDEX) OF WOMEN (new) Percentage of women aged 15-49 average body mass index (BMI), and percentage with specific BMI levels, by district, Haryana, 2012-13
Body Mass Index (BMI) in kg/m2
District Mean Height
Mean BMI
18.5-24.9 (normal)
Thin Overweight/ObeseTotal
number of Women**
<18.5 (total thin)
17.0-18.4 (mildly thin)
<17.0 (moderately/severely thin)
≥25.0 (overweight or obese)
25.0-29.9 (overweight)
≥30.0 (obese)
Panchkula Ambala Yamunanagar Kurukshetra Kaithal
Karnal Panipat Sonipat Jind Fatehabad
Sirsa Hisar Bhiwani Rohtak Jhajjar
Mahendragarh Rewari Gurgaon Faridabad Mewat Palwal
Haryana
157.5 157.3 155.9 156.7 157.3
155.4 153.9 154.5 157.2 154.7
155.2 154.0 154.8 156.5 156.4
155.1 155.3 155.8 155.9 153.9 154.3
155.7
22.6 22.1 22.2 22.9 22.2
21.9 23.3 23.7 21.6 22.1
22.2 22.2 22.2 23.1 22.2
22.2 22.6 24.1 23.6 22.1 23.0
22.5
62.3 60.6 51.2 70.0 59.0
64.8 56.7 55.0 62.5 49.4
51.1 49.5 49.6 53.3 54.2
49.7 73.9 56.6 66.5 73.6 61.2
58.7
19.9 21.8 27.9 12.9 25.2
18.0 17.4 18.1 23.5 28.3
27.4 29.0 26.7 22.3 25.4
26.8 14.5 20.7 13.2 18.1 21.7
22.3
10.8 10.3 12.7 7.1
11.7
9.7 8.2 9.2
11.7 13.1
13.3 14.7 13.3 9.3
12.7
12.6 8.2
10.3 7.0 9.0
10.1
11.0
8.8 11.3 14.7 5.6
13.0
7.9 8.9 8.7
11.1 14.4
13.8 13.9 12.9 12.6 11.7
13.5 6.0 9.9 6.0 8.4
10.4
10.9
17.8 17.6 20.9 17.1 15.8
17.2 26.0 26.8 14.0 22.2
21.5 21.5 23.7 24.4 20.4
23.5 11.6 22.7 20.3 8.3
17.1
19.0
13.3 13.5 14.7 14.8 12.3
13.5 18.9 18.4 10.4 15.4
15.1 15.4 15.6 16.6 14.7
16.5 9.5
17.2 14.6 6.4
11.8
14.0
4.3 4.0 6.1 2.2 3.4
3.7 7.0 8.4 3.6 6.7
6.1 5.8 7.9 7.7 5.5
6.9 1.9 5.4 5.7 1.8 5.3
5.0
1,172 1,456 1,170 1,753 1,896
1,959 1,450 1,385 1,773 1,042
1,810 1,689 1,235 1,232 1,530
1,180 1,056 1,245 1,113 1,187 1,045
29,378** Unweighted cases
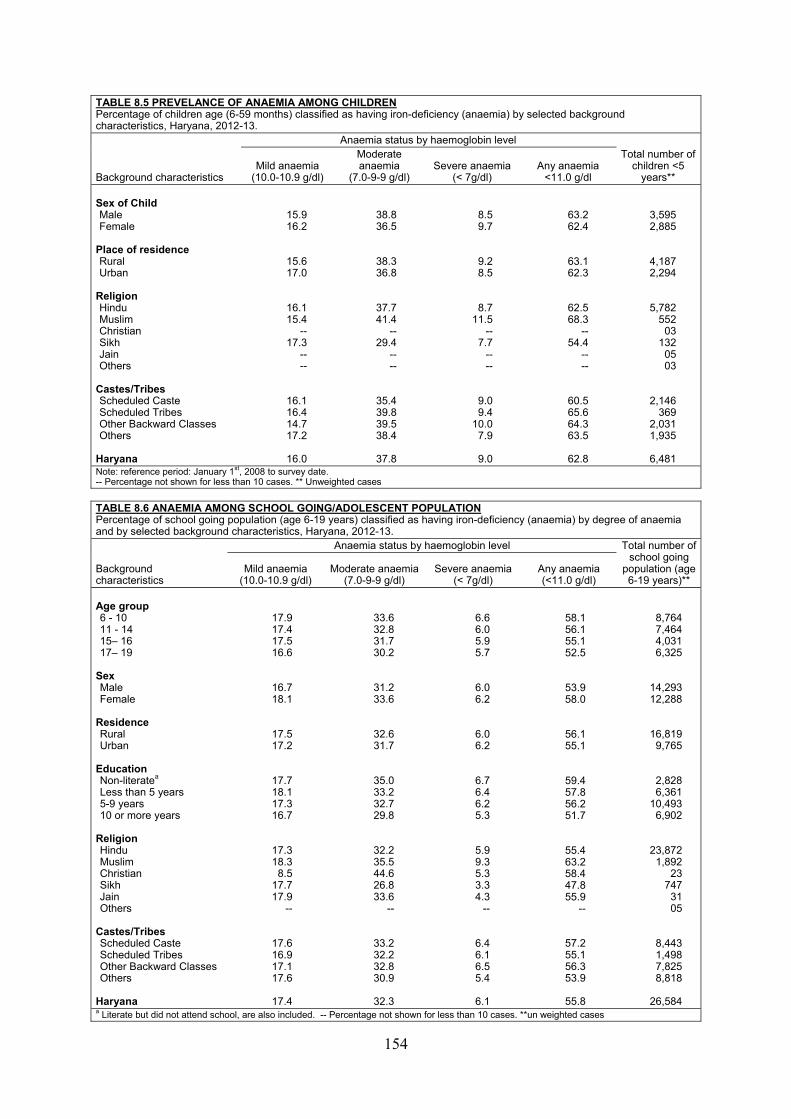
154
TABLE 8.5 PREVELANCE OF ANAEMIA AMONG CHILDRENPercentage of children age (6-59 months) classified as having iron-deficiency (anaemia) by selected background characteristics, Haryana, 2012-13.
Background characteristics
Anaemia status by haemoglobin levelTotal number of
children <5 years**
Mild anaemia (10.0-10.9 g/dl)
Moderate anaemia
(7.0-9-9 g/dl) Severe anaemia
(< 7g/dl) Any anaemia
<11.0 g/dl
Sex of Child Male Female
Place of residence Rural Urban
Religion Hindu Muslim Christian Sikh Jain Others
Castes/Tribes Scheduled Caste Scheduled Tribes Other Backward Classes Others
Haryana
15.9 16.2
15.6 17.0
16.1 15.4
-- 17.3
-- --
16.1 16.4 14.7 17.2
16.0
38.8 36.5
38.3 36.8
37.7 41.4
-- 29.4
-- --
35.4 39.8 39.5 38.4
37.8
8.5 9.7
9.2 8.5
8.7 11.5
-- 7.7
-- --
9.0 9.4
10.0 7.9
9.0
63.2 62.4
63.1 62.3
62.5 68.3
-- 54.4
-- --
60.5 65.6 64.3 63.5
62.8
3,595 2,885
4,187 2,294
5,782 552 03
132 05 03
2,146 369
2,031 1,935
6,481Note: reference period: January 1st, 2008 to survey date.-- Percentage not shown for less than 10 cases. ** Unweighted cases
TABLE 8.6 ANAEMIA AMONG SCHOOL GOING/ADOLESCENT POPULATIONPercentage of school going population (age 6-19 years) classified as having iron-deficiency (anaemia) by degree of anaemia and by selected background characteristics, Haryana, 2012-13.
Background characteristics
Anaemia status by haemoglobin level Total number of school going
population (age 6-19 years)**
Mild anaemia (10.0-10.9 g/dl)
Moderate anaemia (7.0-9-9 g/dl)
Severe anaemia (< 7g/dl)
Any anaemia (<11.0 g/dl)
Age group 6 - 10 11 - 14 15– 16 17– 19
Sex Male Female
Residence Rural Urban
Education Non-literatea Less than 5 years 5-9 years 10 or more years
Religion Hindu Muslim Christian Sikh Jain Others
Castes/Tribes Scheduled Caste Scheduled Tribes Other Backward Classes Others
Haryana
17.9 17.4 17.5 16.6
16.7 18.1
17.5 17.2
17.7 18.1 17.3 16.7
17.3 18.3 8.5
17.7 17.9
--
17.6 16.9 17.1 17.6
17.4
33.6 32.8 31.7 30.2
31.2 33.6
32.6 31.7
35.0 33.2 32.7 29.8
32.2 35.5 44.6 26.8 33.6
--
33.2 32.2 32.8 30.9
32.3
6.6 6.0 5.9 5.7
6.0 6.2
6.0 6.2
6.7 6.4 6.2 5.3
5.9 9.3 5.3 3.3 4.3
--
6.4 6.1 6.5 5.4
6.1
58.1 56.1 55.1 52.5
53.9 58.0
56.1 55.1
59.4 57.8 56.2 51.7
55.4 63.2 58.4 47.8 55.9
--
57.2 55.1 56.3 53.9
55.8
8,764 7,464 4,031 6,325
14,293 12,288
16,819 9,765
2,828 6,361
10,493 6,902
23,872 1,892
23 747 31 05
8,443 1,498 7,825 8,818
26,584a Literate but did not attend school, are also included. -- Percentage not shown for less than 10 cases. **un weighted cases
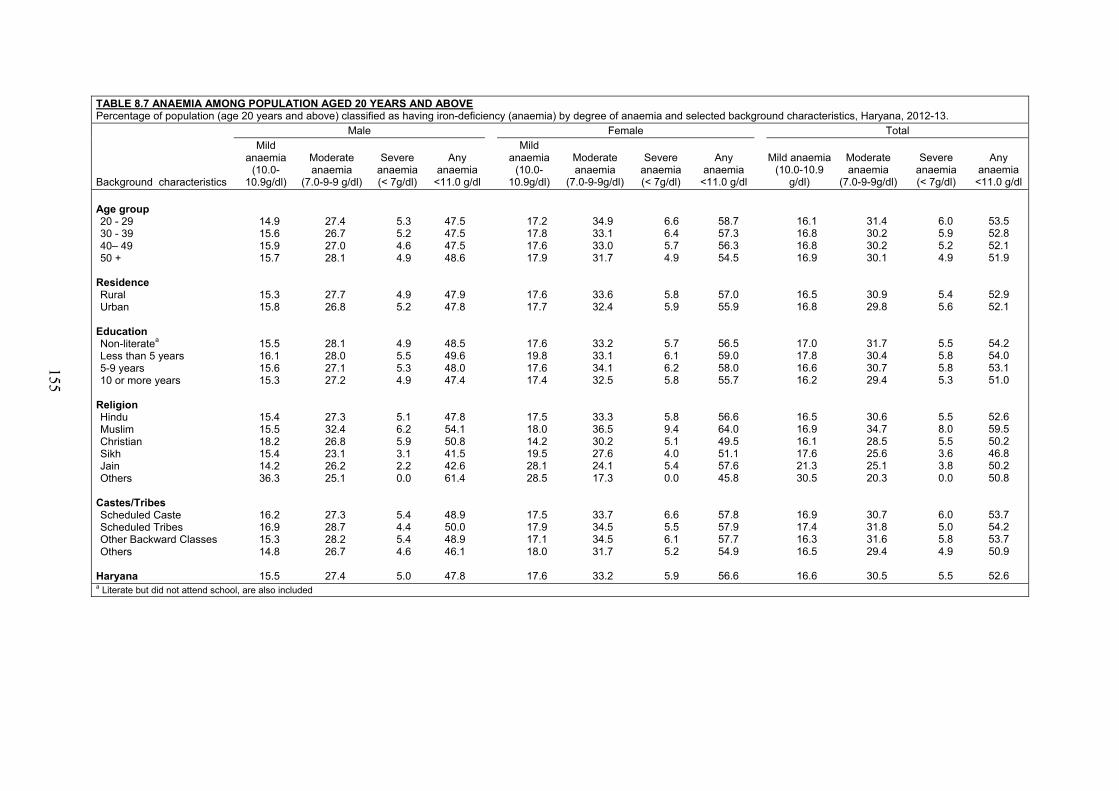
155
TABLE 8.7 ANAEMIA AMONG POPULATION AGED 20 YEARS AND ABOVE Percentage of population (age 20 years and above) classified as having iron-deficiency (anaemia) by degree of anaemia and selected background characteristics, Haryana, 2012-13.
Background characteristics
Male Female TotalMild
anaemia (10.0-
10.9g/dl)
Moderate anaemia
(7.0-9-9 g/dl)
Severe anaemia (< 7g/dl)
Any anaemia
<11.0 g/dl
Mild anaemia
(10.0-10.9g/dl)
Moderate anaemia
(7.0-9-9g/dl)
Severe anaemia (< 7g/dl)
Any anaemia
<11.0 g/dl
Mild anaemia(10.0-10.9
g/dl)
Moderate anaemia
(7.0-9-9g/dl)
Severe anaemia (< 7g/dl)
Any anaemia
<11.0 g/dl
Age group 20 - 29 30 - 39 40– 49 50 +
Residence Rural Urban
Education Non-literatea Less than 5 years 5-9 years 10 or more years
Religion Hindu Muslim Christian Sikh Jain Others
Castes/Tribes Scheduled Caste Scheduled Tribes Other Backward Classes Others
Haryana
14.9 15.6 15.9 15.7
15.3 15.8
15.5 16.1 15.6 15.3
15.4 15.5 18.2 15.4 14.2 36.3
16.2 16.9 15.3 14.8
15.5
27.4 26.7 27.0 28.1
27.7 26.8
28.1 28.0 27.1 27.2
27.3 32.4 26.8 23.1 26.2 25.1
27.3 28.7 28.2 26.7
27.4
5.3 5.2 4.6 4.9
4.9 5.2
4.9 5.5 5.3 4.9
5.1 6.2 5.9 3.1 2.2 0.0
5.4 4.4 5.4 4.6
5.0
47.5 47.5 47.5 48.6
47.9 47.8
48.5 49.6 48.0 47.4
47.8 54.1 50.8 41.5 42.6 61.4
48.9 50.0 48.9 46.1
47.8
17.2 17.8 17.6 17.9
17.6 17.7
17.6 19.8 17.6 17.4
17.5 18.0 14.2 19.5 28.1 28.5
17.5 17.9 17.1 18.0
17.6
34.9 33.1 33.0 31.7
33.6 32.4
33.2 33.1 34.1 32.5
33.3 36.5 30.2 27.6 24.1 17.3
33.7 34.5 34.5 31.7
33.2
6.6 6.4 5.7 4.9
5.8 5.9
5.7 6.1 6.2 5.8
5.8 9.4 5.1 4.0 5.4 0.0
6.6 5.5 6.1 5.2
5.9
58.7 57.3 56.3 54.5
57.0 55.9
56.5 59.0 58.0 55.7
56.6 64.0 49.5 51.1 57.6 45.8
57.8 57.9 57.7 54.9
56.6
16.1 16.8 16.8 16.9
16.5 16.8
17.0 17.8 16.6 16.2
16.5 16.9 16.1 17.6 21.3 30.5
16.9 17.4 16.3 16.5
16.6
31.4 30.2 30.2 30.1
30.9 29.8
31.7 30.4 30.7 29.4
30.6 34.7 28.5 25.6 25.1 20.3
30.7 31.8 31.6 29.4
30.5
6.0 5.9 5.2 4.9
5.4 5.6
5.5 5.8 5.8 5.3
5.5 8.0 5.5 3.6 3.8 0.0
6.0 5.0 5.8 4.9
5.5
53.5 52.8 52.1 51.9
52.9 52.1
54.2 54.0 53.1 51.0
52.6 59.5 50.2 46.8 50.2 50.8
53.7 54.2 53.7 50.9
52.6 a Literate but did not attend school, are also included
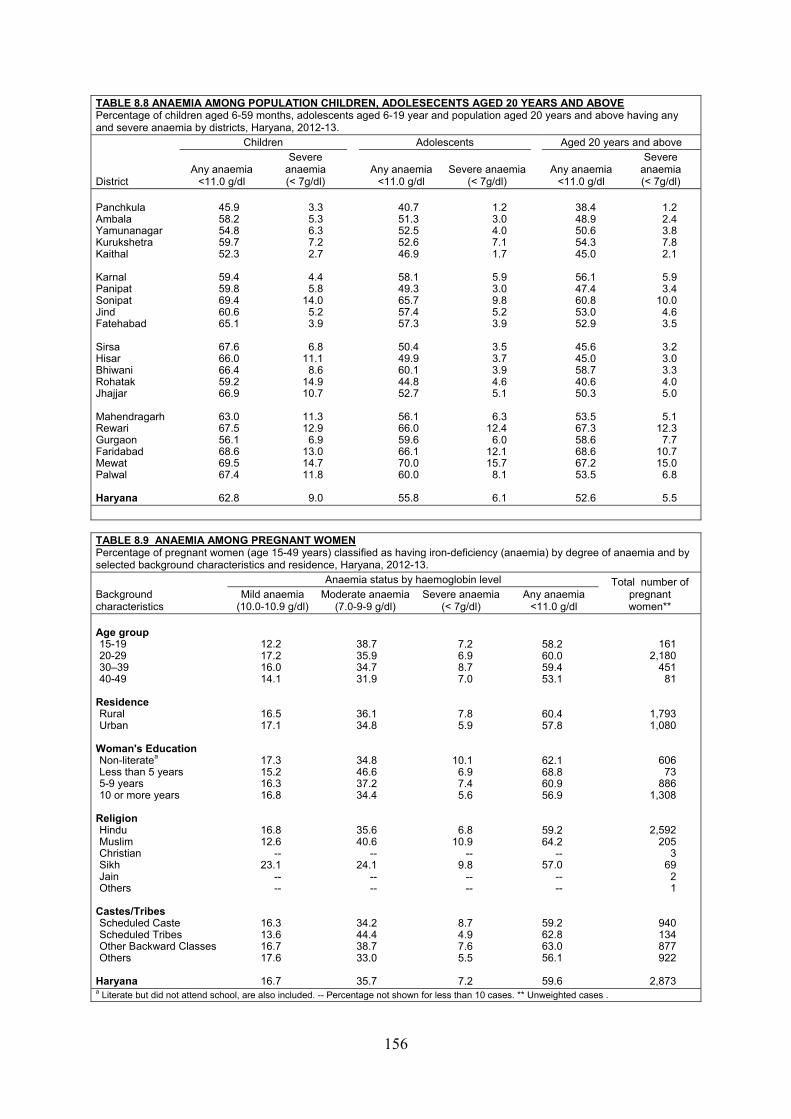
156
TABLE 8.8 ANAEMIA AMONG POPULATION CHILDREN, ADOLESECENTS AGED 20 YEARS AND ABOVE Percentage of children aged 6-59 months, adolescents aged 6-19 year and population aged 20 years and above having any and severe anaemia by districts, Haryana, 2012-13.
District
Children Adolescents Aged 20 years and above
Any anaemia <11.0 g/dl
Severe anaemia (< 7g/dl)
Any anaemia <11.0 g/dl
Severe anaemia(< 7g/dl)
Any anaemia <11.0 g/dl
Severe anaemia (< 7g/dl)
Panchkula Ambala Yamunanagar Kurukshetra Kaithal
Karnal Panipat Sonipat Jind Fatehabad
Sirsa Hisar Bhiwani Rohatak Jhajjar
Mahendragarh Rewari Gurgaon Faridabad Mewat Palwal
Haryana
45.9 58.2 54.8 59.7 52.3
59.4 59.8 69.4 60.6 65.1
67.6 66.0 66.4 59.2 66.9
63.0 67.5 56.1 68.6 69.5 67.4
62.8
3.3 5.3 6.3 7.2 2.7
4.4 5.8
14.0 5.2 3.9
6.8 11.1 8.6
14.9 10.7
11.3 12.9 6.9
13.0 14.7 11.8
9.0
40.7 51.3 52.5 52.6 46.9
58.1 49.3 65.7 57.4 57.3
50.4 49.9 60.1 44.8 52.7
56.1 66.0 59.6 66.1 70.0 60.0
55.8
1.2 3.0 4.0 7.1 1.7
5.9 3.0 9.8 5.2 3.9
3.5 3.7 3.9 4.6 5.1
6.3 12.4 6.0
12.1 15.7 8.1
6.1
38.4 48.9 50.6 54.3 45.0
56.1 47.4 60.8 53.0 52.9
45.6 45.0 58.7 40.6 50.3
53.5 67.3 58.6 68.6 67.2 53.5
52.6
1.2 2.4 3.8 7.8 2.1
5.9 3.4
10.0 4.6 3.5
3.2 3.0 3.3 4.0 5.0
5.1 12.3 7.7
10.7 15.0 6.8
5.5
TABLE 8.9 ANAEMIA AMONG PREGNANT WOMEN Percentage of pregnant women (age 15-49 years) classified as having iron-deficiency (anaemia) by degree of anaemia and by selected background characteristics and residence, Haryana, 2012-13.
Background characteristics
Anaemia status by haemoglobin level Total number of pregnant women**
Mild anaemia (10.0-10.9 g/dl)
Moderate anaemia(7.0-9-9 g/dl)
Severe anaemia (< 7g/dl)
Any anaemia <11.0 g/dl
Age group 15-19 20-29 30–39 40-49
Residence Rural Urban
Woman's Education Non-literatea Less than 5 years 5-9 years 10 or more years
Religion Hindu Muslim Christian Sikh Jain Others
Castes/Tribes Scheduled Caste Scheduled Tribes Other Backward Classes Others
Haryana
12.2 17.2 16.0 14.1
16.5 17.1
17.3 15.2 16.3 16.8
16.8 12.6
-- 23.1
-- --
16.3 13.6 16.7 17.6
16.7
38.7 35.9 34.7 31.9
36.1 34.8
34.8 46.6 37.2 34.4
35.6 40.6
-- 24.1
-- --
34.2 44.4 38.7 33.0
35.7
7.2 6.9 8.7 7.0
7.8 5.9
10.1 6.9 7.4 5.6
6.8 10.9
-- 9.8
-- --
8.7 4.9 7.6 5.5
7.2
58.2 60.0 59.4 53.1
60.4 57.8
62.1 68.8 60.9 56.9
59.2 64.2
-- 57.0
-- --
59.2 62.8 63.0 56.1
59.6
161 2,180
451 81
1,793 1,080
606 73
886 1,308
2,592 205
3 69 2 1
940 134 877 922
2,873 a Literate but did not attend school, are also included. -- Percentage not shown for less than 10 cases. ** Unweighted cases .
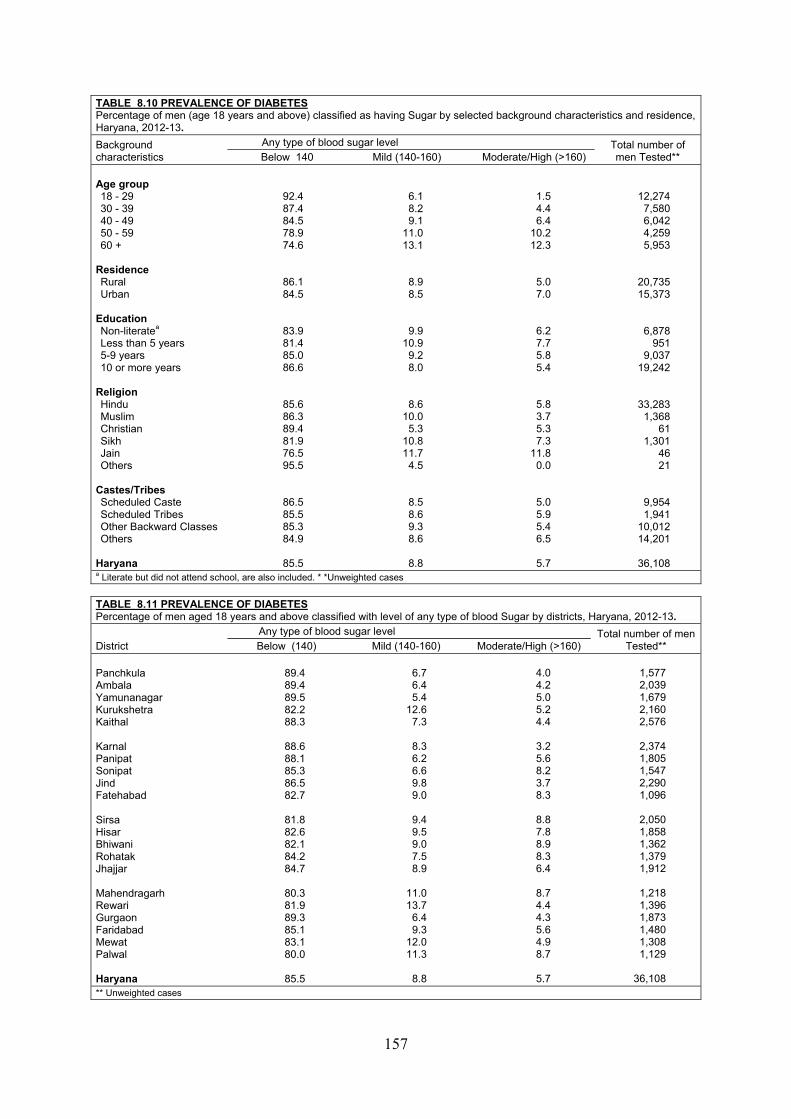
157
TABLE 8.10 PREVALENCE OF DIABETES Percentage of men (age 18 years and above) classified as having Sugar by selected background characteristics and residence, Haryana, 2012-13.
Background characteristics
Any type of blood sugar level Total number of men Tested** Below 140 Mild (140-160) Moderate/High (>160)
Age group 18 - 29 30 - 39 40 - 49 50 - 59 60 +
Residence Rural Urban
Education Non-literatea Less than 5 years 5-9 years 10 or more years
Religion Hindu Muslim Christian Sikh Jain Others
Castes/Tribes Scheduled Caste Scheduled Tribes Other Backward Classes Others
Haryana
92.4 87.4 84.5 78.9 74.6
86.1 84.5
83.9 81.4 85.0 86.6
85.6 86.3 89.4 81.9 76.5 95.5
86.5 85.5 85.3 84.9
85.5
6.1 8.2 9.1
11.0 13.1
8.9 8.5
9.9 10.9 9.2 8.0
8.6 10.0 5.3
10.8 11.7 4.5
8.5 8.6 9.3 8.6
8.8
1.5 4.4 6.4
10.2 12.3
5.0 7.0
6.2 7.7 5.8 5.4
5.8 3.7 5.3 7.3
11.8 0.0
5.0 5.9 5.4 6.5
5.7
12,274 7,580 6,042 4,259 5,953
20,735 15,373
6,878 951
9,037 19,242
33,283 1,368
61 1,301
46 21
9,954 1,941
10,012 14,201
36,108 a Literate but did not attend school, are also included. * *Unweighted cases
TABLE 8.11 PREVALENCE OF DIABETES Percentage of men aged 18 years and above classified with level of any type of blood Sugar by districts, Haryana, 2012-13.
District Any type of blood sugar level Total number of men
Tested** Below (140) Mild (140-160) Moderate/High (>160)
Panchkula Ambala Yamunanagar Kurukshetra Kaithal
Karnal Panipat Sonipat Jind Fatehabad
Sirsa Hisar Bhiwani Rohatak Jhajjar
Mahendragarh Rewari Gurgaon Faridabad Mewat Palwal
Haryana
89.4 89.4 89.5 82.2 88.3
88.6 88.1 85.3 86.5 82.7
81.8 82.6 82.1 84.2 84.7
80.3 81.9 89.3 85.1 83.1 80.0
85.5
6.7 6.4 5.4
12.6 7.3
8.3 6.2 6.6 9.8 9.0
9.4 9.5 9.0 7.5 8.9
11.0 13.7 6.4 9.3
12.0 11.3
8.8
4.0 4.2 5.0 5.2 4.4
3.2 5.6 8.2 3.7 8.3
8.8 7.8 8.9 8.3 6.4
8.7 4.4 4.3 5.6 4.9 8.7
5.7
1,577 2,039 1,679 2,160 2,576
2,374 1,805 1,547 2,290 1,096
2,050 1,858 1,362 1,379 1,912
1,218 1,396 1,873 1,480 1,308 1,129
36,108 ** Unweighted cases
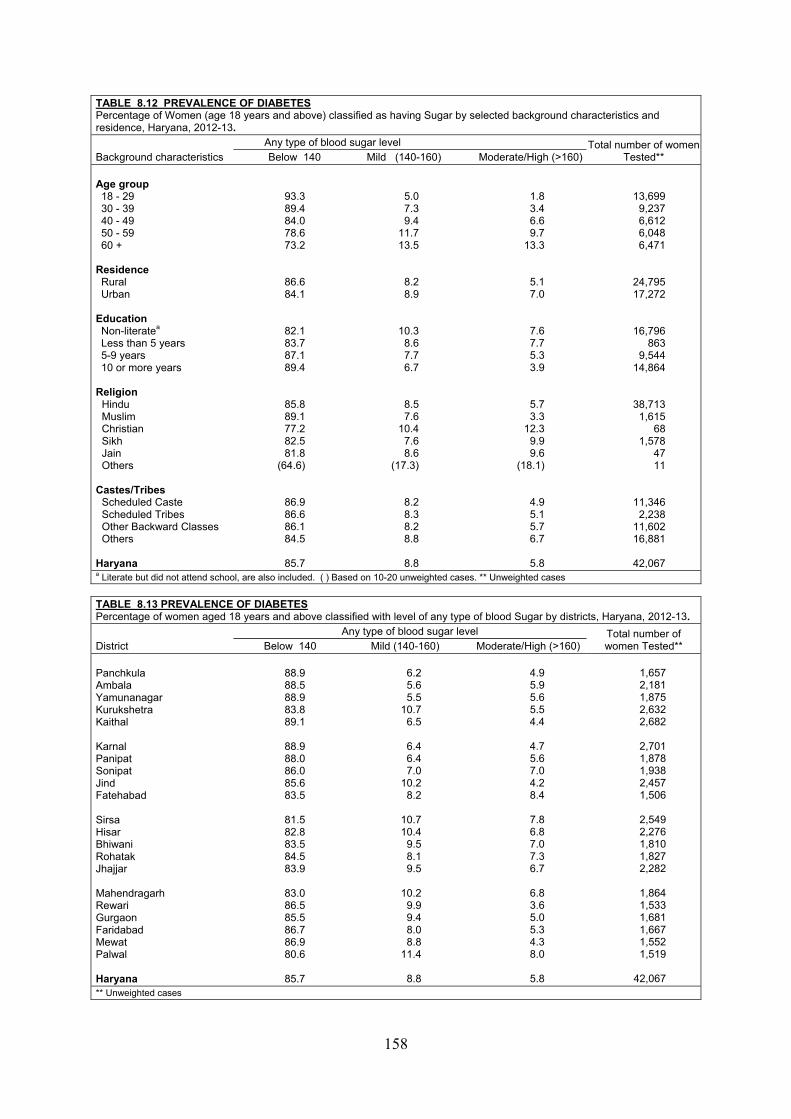
158
TABLE 8.12 PREVALENCE OF DIABETES Percentage of Women (age 18 years and above) classified as having Sugar by selected background characteristics and residence, Haryana, 2012-13.
Background characteristics Any type of blood sugar level Total number of women
Tested** Below 140 Mild (140-160) Moderate/High (>160)
Age group 18 - 29 30 - 39 40 - 49 50 - 59 60 +
Residence Rural Urban
Education Non-literatea Less than 5 years 5-9 years 10 or more years
Religion Hindu Muslim Christian Sikh Jain Others
Castes/Tribes Scheduled Caste Scheduled Tribes Other Backward Classes Others
Haryana
93.3 89.4 84.0 78.6 73.2
86.6 84.1
82.1 83.7 87.1 89.4
85.8 89.1 77.2 82.5 81.8
(64.6)
86.9 86.6 86.1 84.5
85.7
5.0 7.3 9.4
11.7 13.5
8.2 8.9
10.3 8.6 7.7 6.7
8.5 7.6
10.4 7.6 8.6
(17.3)
8.2 8.3 8.2 8.8
8.8
1.8 3.4 6.6 9.7
13.3
5.1 7.0
7.6 7.7 5.3 3.9
5.7 3.3
12.3 9.9 9.6
(18.1)
4.9 5.1 5.7 6.7
5.8
13,699 9,237 6,612 6,048 6,471
24,795 17,272
16,796 863
9,544 14,864
38,713 1,615
68 1,578
47 11
11,346 2,238
11,602 16,881
42,067 a Literate but did not attend school, are also included. ( ) Based on 10-20 unweighted cases. ** Unweighted cases
TABLE 8.13 PREVALENCE OF DIABETES Percentage of women aged 18 years and above classified with level of any type of blood Sugar by districts, Haryana, 2012-13.
District Any type of blood sugar level Total number of
women Tested** Below 140 Mild (140-160) Moderate/High (>160)
Panchkula Ambala Yamunanagar Kurukshetra Kaithal
Karnal Panipat Sonipat Jind Fatehabad
Sirsa Hisar Bhiwani Rohatak Jhajjar
Mahendragarh Rewari Gurgaon Faridabad Mewat Palwal
Haryana
88.9 88.5 88.9 83.8 89.1
88.9 88.0 86.0 85.6 83.5
81.5 82.8 83.5 84.5 83.9
83.0 86.5 85.5 86.7 86.9 80.6
85.7
6.2 5.6 5.5
10.7 6.5
6.4 6.4 7.0
10.2 8.2
10.7 10.4 9.5 8.1 9.5
10.2 9.9 9.4 8.0 8.8
11.4
8.8
4.9 5.9 5.6 5.5 4.4
4.7 5.6 7.0 4.2 8.4
7.8 6.8 7.0 7.3 6.7
6.8 3.6 5.0 5.3 4.3 8.0
5.8
1,657 2,181 1,875 2,632 2,682
2,701 1,878 1,938 2,457 1,506
2,549 2,276 1,810 1,827 2,282
1,864 1,533 1,681 1,667 1,552 1,519
42,067 ** Unweighted cases
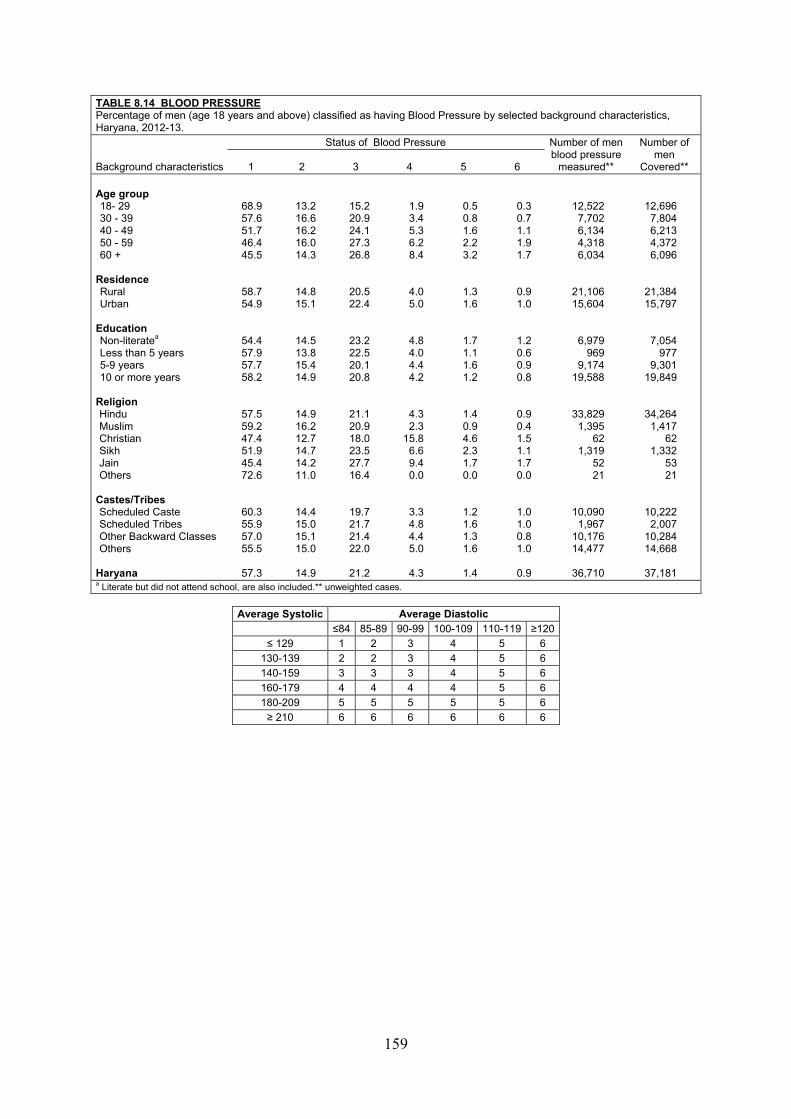
159
TABLE 8.14 BLOOD PRESSURE Percentage of men (age 18 years and above) classified as having Blood Pressure by selected background characteristics, Haryana, 2012-13.
Background characteristics
Status of Blood Pressure Number of men blood pressure
measured**
Number of men
Covered** 1 2 3 4 5 6 Age group 18- 29 30 - 39 40 - 49 50 - 59 60 +
Residence Rural Urban
Education Non-literatea Less than 5 years 5-9 years 10 or more years
Religion Hindu Muslim Christian Sikh Jain Others
Castes/Tribes Scheduled Caste Scheduled Tribes Other Backward Classes Others
Haryana
68.9 57.6 51.7 46.4 45.5
58.7 54.9
54.4 57.9 57.7 58.2
57.5 59.2 47.4 51.9 45.4 72.6
60.3 55.9 57.0 55.5
57.3
13.2 16.6 16.2 16.0 14.3
14.8 15.1
14.5 13.8 15.4 14.9
14.9 16.2 12.7 14.7 14.2 11.0
14.4 15.0 15.1 15.0
14.9
15.2 20.9 24.1 27.3 26.8
20.5 22.4
23.2 22.5 20.1 20.8
21.1 20.9 18.0 23.5 27.7 16.4
19.7 21.7 21.4 22.0
21.2
1.9 3.4 5.3 6.2 8.4
4.0 5.0
4.8 4.0 4.4 4.2
4.3 2.3
15.8 6.6 9.4 0.0
3.3 4.8 4.4 5.0
4.3
0.5 0.8 1.6 2.2 3.2
1.3 1.6
1.7 1.1 1.6 1.2
1.4 0.9 4.6 2.3 1.7 0.0
1.2 1.6 1.3 1.6
1.4
0.3 0.7 1.1 1.9 1.7
0.9 1.0
1.2 0.6 0.9 0.8
0.9 0.4 1.5 1.1 1.7 0.0
1.0 1.0 0.8 1.0
0.9
12,522 7,702 6,134 4,318 6,034
21,106 15,604
6,979 969
9,174 19,588
33,829 1,395
62 1,319
52 21
10,090 1,967
10,176 14,477
36,710
12,696 7,804 6,213 4,372 6,096
21,384 15,797
7,054 977
9,301 19,849
34,264 1,417
62 1,332
53 21
10,222 2,007
10,284 14,668
37,181
a Literate but did not attend school, are also included.** unweighted cases.
Average Systolic Average Diastolic ≤84 85-89 90-99 100-109 110-119 ≥120
≤ 129 1 2 3 4 5 6 130-139 2 2 3 4 5 6 140-159 3 3 3 4 5 6 160-179 4 4 4 4 5 6 180-209 5 5 5 5 5 6 ≥ 210 6 6 6 6 6 6
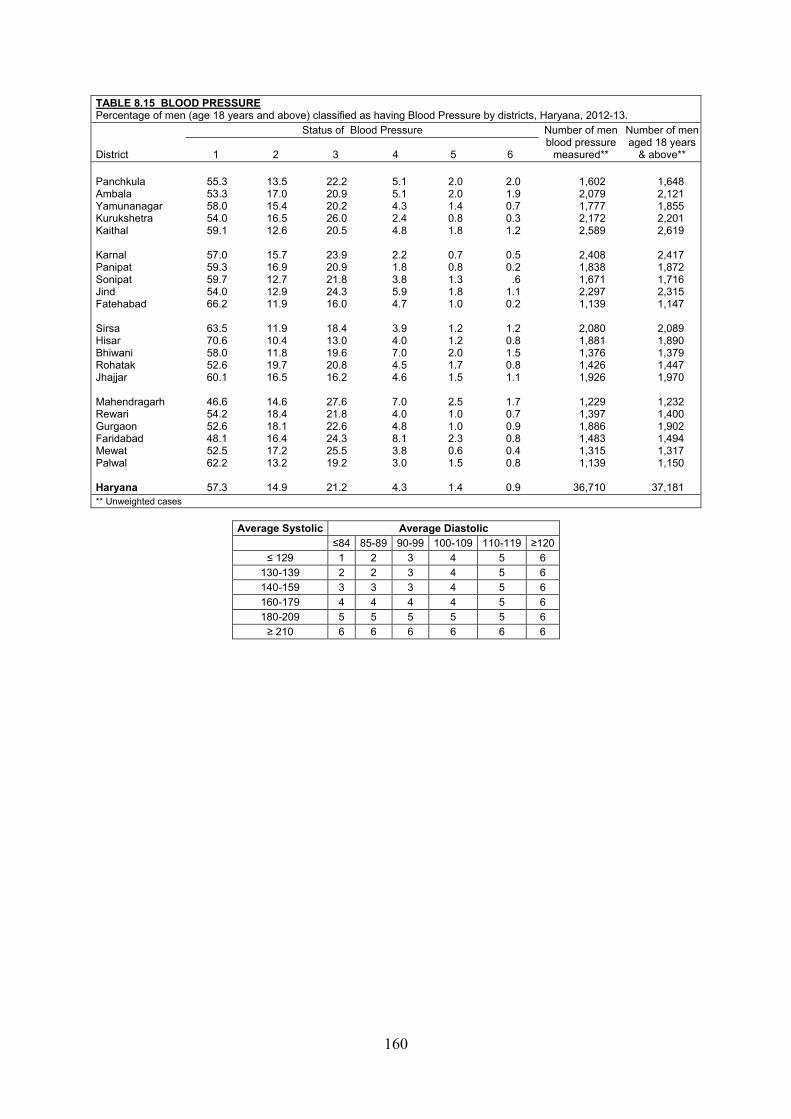
160
TABLE 8.15 BLOOD PRESSURE Percentage of men (age 18 years and above) classified as having Blood Pressure by districts, Haryana, 2012-13.
District
Status of Blood Pressure Number of men blood pressure
measured**
Number of men aged 18 years
& above** 1 2 3 4 5 6 Panchkula Ambala Yamunanagar Kurukshetra Kaithal Karnal Panipat Sonipat Jind Fatehabad Sirsa Hisar Bhiwani Rohatak Jhajjar Mahendragarh Rewari Gurgaon Faridabad Mewat Palwal Haryana
55.3 53.3 58.0 54.0 59.1
57.0 59.3 59.7 54.0 66.2
63.5 70.6 58.0 52.6 60.1
46.6 54.2 52.6 48.1 52.5 62.2
57.3
13.5 17.0 15.4 16.5 12.6
15.7 16.9 12.7 12.9 11.9
11.9 10.4 11.8 19.7 16.5
14.6 18.4 18.1 16.4 17.2 13.2
14.9
22.2 20.9 20.2 26.0 20.5
23.9 20.9 21.8 24.3 16.0
18.4 13.0 19.6 20.8 16.2
27.6 21.8 22.6 24.3 25.5 19.2
21.2
5.1 5.1 4.3 2.4 4.8
2.2 1.8 3.8 5.9 4.7
3.9 4.0 7.0 4.5 4.6
7.0 4.0 4.8 8.1 3.8 3.0
4.3
2.0 2.0 1.4 0.8 1.8
0.7 0.8 1.3 1.8 1.0
1.2 1.2 2.0 1.7 1.5
2.5 1.0 1.0 2.3 0.6 1.5
1.4
2.0 1.9 0.7 0.3 1.2
0.5 0.2
.6 1.1 0.2
1.2 0.8 1.5 0.8 1.1
1.7 0.7 0.9 0.8 0.4 0.8
0.9
1,602 2,079 1,777 2,172 2,589
2,408 1,838 1,671 2,297 1,139
2,080 1,881 1,376 1,426 1,926
1,229 1,397 1,886 1,483 1,315 1,139
36,710
1,648 2,121 1,855 2,201 2,619
2,417 1,872 1,716 2,315 1,147
2,089 1,890 1,379 1,447 1,970
1,232 1,400 1,902 1,494 1,317 1,150
37,181
** Unweighted cases
Average Systolic Average Diastolic ≤84 85-89 90-99 100-109 110-119 ≥120
≤ 129 1 2 3 4 5 6 130-139 2 2 3 4 5 6 140-159 3 3 3 4 5 6 160-179 4 4 4 4 5 6 180-209 5 5 5 5 5 6 ≥ 210 6 6 6 6 6 6
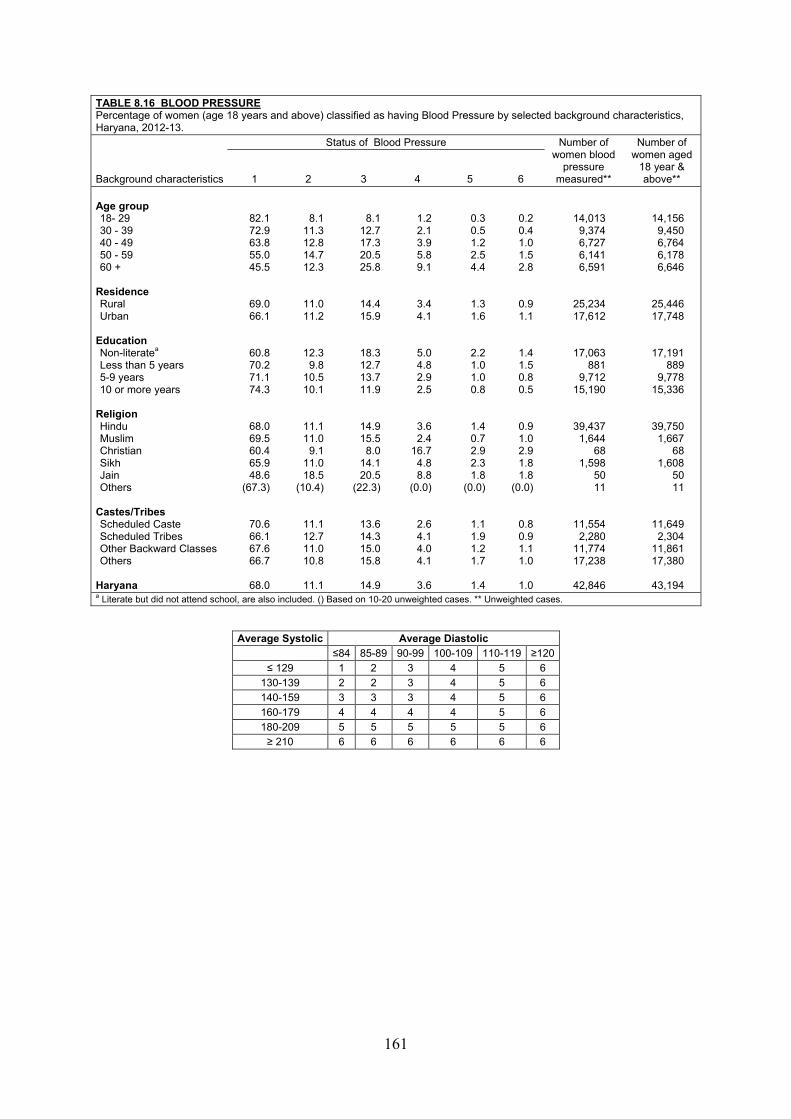
161
TABLE 8.16 BLOOD PRESSURE Percentage of women (age 18 years and above) classified as having Blood Pressure by selected background characteristics, Haryana, 2012-13.
Background characteristics
Status of Blood Pressure Number of women blood
pressure measured**
Number of women aged
18 year & above** 1 2 3 4 5 6
Age group 18- 29 30 - 39 40 - 49 50 - 59 60 +
Residence Rural Urban
Education Non-literatea Less than 5 years 5-9 years 10 or more years
Religion Hindu Muslim Christian Sikh Jain Others
Castes/Tribes Scheduled Caste Scheduled Tribes Other Backward Classes Others
Haryana
82.1 72.9 63.8 55.0 45.5
69.0 66.1
60.8 70.2 71.1 74.3
68.0 69.5 60.4 65.9 48.6
(67.3)
70.6 66.1 67.6 66.7
68.0
8.1 11.3 12.8 14.7 12.3
11.0 11.2
12.3 9.8
10.5 10.1
11.1 11.0
9.1 11.0 18.5
(10.4)
11.1 12.7 11.0 10.8
11.1
8.1 12.7 17.3 20.5 25.8
14.4 15.9
18.3 12.7 13.7 11.9
14.9 15.5
8.0 14.1 20.5
(22.3)
13.6 14.3 15.0 15.8
14.9
1.2 2.1 3.9 5.8 9.1
3.4 4.1
5.0 4.8 2.9 2.5
3.6 2.4
16.7 4.8 8.8
(0.0)
2.6 4.1 4.0 4.1
3.6
0.3 0.5 1.2 2.5 4.4
1.3 1.6
2.2 1.0 1.0 0.8
1.4 0.7 2.9 2.3 1.8
(0.0)
1.1 1.9 1.2 1.7
1.4
0.2 0.4 1.0 1.5 2.8
0.9 1.1
1.4 1.5 0.8 0.5
0.9 1.0 2.9 1.8 1.8
(0.0)
0.8 0.9 1.1 1.0
1.0
14,013 9,374 6,727 6,141 6,591
25,234 17,612
17,063 881
9,712 15,190
39,437 1,644
68 1,598
50 11
11,554 2,280
11,774 17,238
42,846
14,156 9,450 6,764 6,178 6,646
25,446 17,748
17,191 889
9,778 15,336
39,750 1,667
68 1,608
50 11
11,649 2,304
11,861 17,380
43,194
a Literate but did not attend school, are also included. () Based on 10-20 unweighted cases. ** Unweighted cases.
Average Systolic Average Diastolic ≤84 85-89 90-99 100-109 110-119 ≥120
≤ 129 1 2 3 4 5 6 130-139 2 2 3 4 5 6 140-159 3 3 3 4 5 6 160-179 4 4 4 4 5 6 180-209 5 5 5 5 5 6 ≥ 210 6 6 6 6 6 6
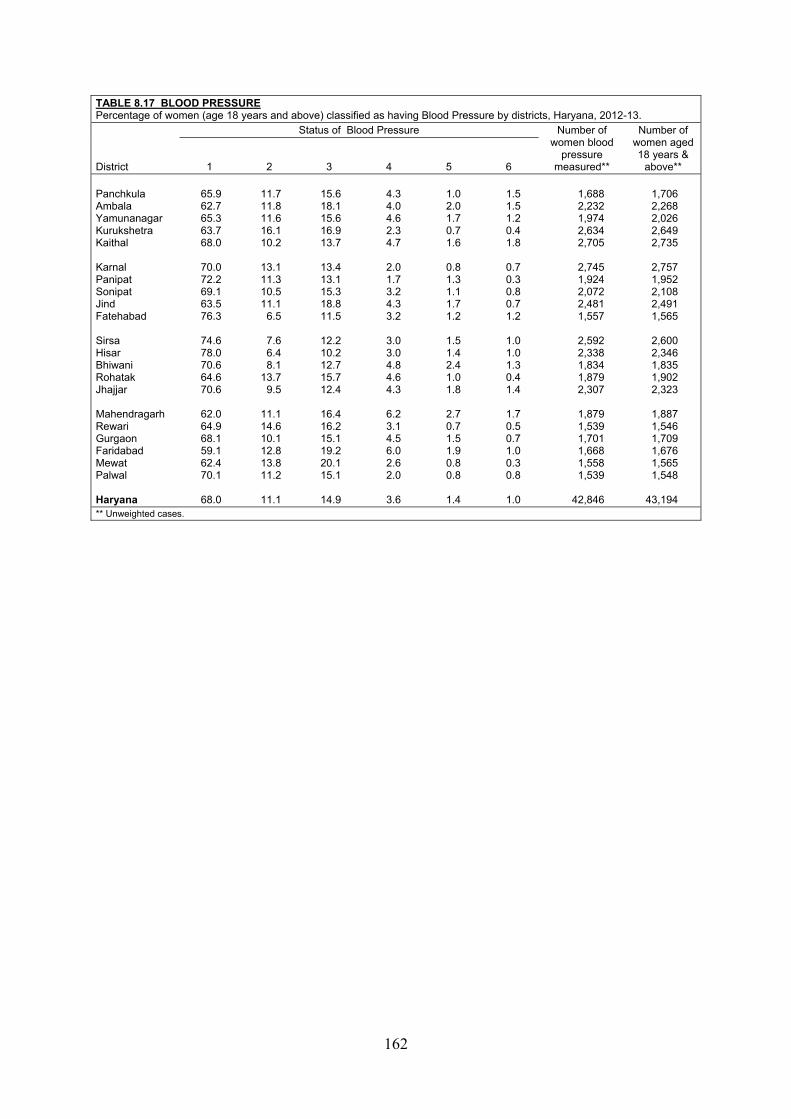
162
TABLE 8.17 BLOOD PRESSURE Percentage of women (age 18 years and above) classified as having Blood Pressure by districts, Haryana, 2012-13.
District
Status of Blood Pressure Number of women blood
pressure measured**
Number of women aged 18 years &
above** 1 2 3 4 5 6 Panchkula Ambala Yamunanagar Kurukshetra Kaithal Karnal Panipat Sonipat Jind Fatehabad Sirsa Hisar Bhiwani Rohatak Jhajjar Mahendragarh Rewari Gurgaon Faridabad Mewat Palwal Haryana
65.9 62.7 65.3 63.7 68.0
70.0 72.2 69.1 63.5 76.3
74.6 78.0 70.6 64.6 70.6
62.0 64.9 68.1 59.1 62.4 70.1
68.0
11.7 11.8 11.6 16.1 10.2
13.1 11.3 10.5 11.1
6.5
7.6 6.4 8.1
13.7 9.5
11.1 14.6 10.1 12.8 13.8 11.2
11.1
15.6 18.1 15.6 16.9 13.7
13.4 13.1 15.3 18.8 11.5
12.2 10.2 12.7 15.7 12.4
16.4 16.2 15.1 19.2 20.1 15.1
14.9
4.3 4.0 4.6 2.3 4.7
2.0 1.7 3.2 4.3 3.2
3.0 3.0 4.8 4.6 4.3
6.2 3.1 4.5 6.0 2.6 2.0
3.6
1.0 2.0 1.7 0.7 1.6
0.8 1.3 1.1 1.7 1.2
1.5 1.4 2.4 1.0 1.8
2.7 0.7 1.5 1.9 0.8 0.8
1.4
1.5 1.5 1.2 0.4 1.8
0.7 0.3 0.8 0.7 1.2
1.0 1.0 1.3 0.4 1.4
1.7 0.5 0.7 1.0 0.3 0.8
1.0
1,688 2,232 1,974 2,634 2,705
2,745 1,924 2,072 2,481 1,557
2,592 2,338 1,834 1,879 2,307
1,879 1,539 1,701 1,668 1,558 1,539
42,846
1,706 2,268 2,026 2,649 2,735
2,757 1,952 2,108 2,491 1,565
2,600 2,346 1,835 1,902 2,323
1,887 1,546 1,709 1,676 1,565 1,548
43,194
** Unweighted cases.
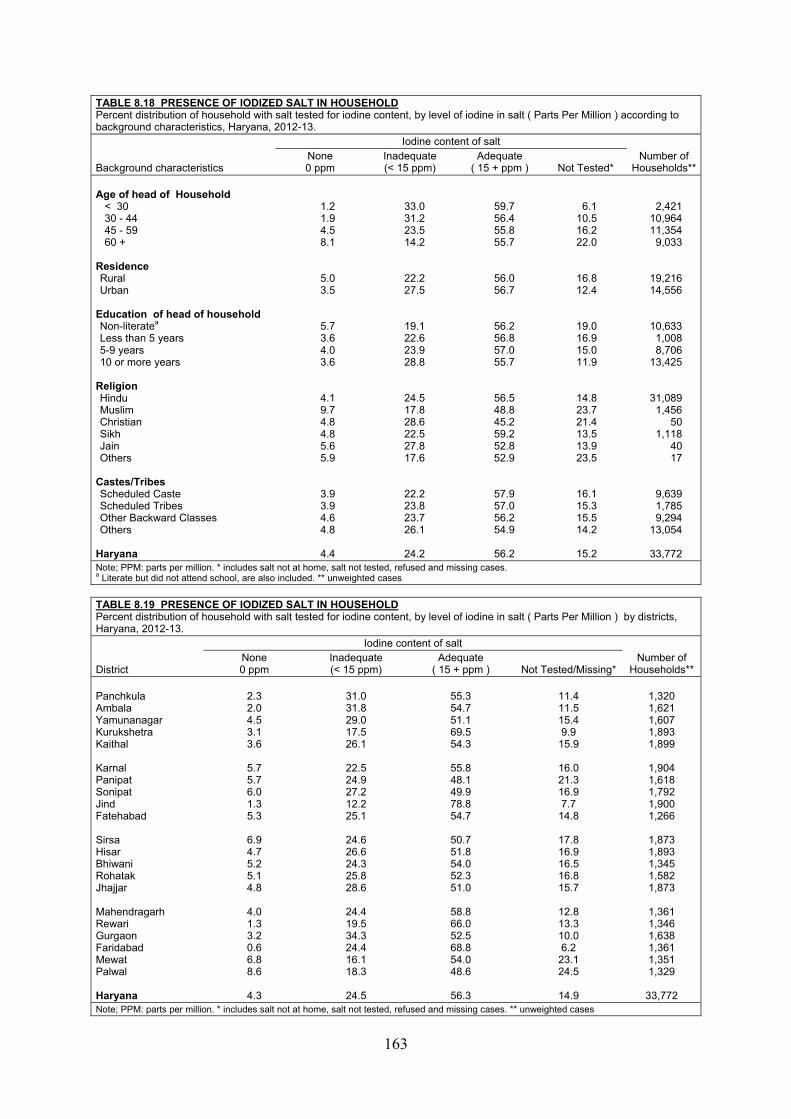
163
TABLE 8.18 PRESENCE OF IODIZED SALT IN HOUSEHOLDPercent distribution of household with salt tested for iodine content, by level of iodine in salt ( Parts Per Million ) according to background characteristics, Haryana, 2012-13.
Background characteristics
Iodine content of saltNumber of
Households**None 0 ppm
Inadequate (< 15 ppm)
Adequate ( 15 + ppm ) Not Tested*
Age of head of Household < 30 30 - 44 45 - 59 60 + Residence Rural Urban
Education of head of household Non-literatea Less than 5 years 5-9 years 10 or more years
Religion Hindu Muslim Christian Sikh Jain Others
Castes/Tribes Scheduled Caste Scheduled Tribes Other Backward Classes Others
Haryana
1.2 1.9 4.5 8.1
5.0 3.5
5.7 3.6 4.0 3.6
4.1 9.7 4.8 4.8 5.6 5.9
3.9 3.9 4.6 4.8
4.4
33.0 31.2 23.5 14.2
22.2 27.5
19.1 22.6 23.9 28.8
24.5 17.8 28.6 22.5 27.8 17.6
22.2 23.8 23.7 26.1
24.2
59.7 56.4 55.8 55.7
56.0 56.7
56.2 56.8 57.0 55.7
56.5 48.8 45.2 59.2 52.8 52.9
57.9 57.0 56.2 54.9
56.2
6.1 10.5 16.2 22.0
16.8 12.4
19.0 16.9 15.0 11.9
14.8 23.7 21.4 13.5 13.9 23.5
16.1 15.3 15.5 14.2
15.2
2,421 10,964 11,354
9,033
19,216 14,556
10,633 1,008 8,706
13,425
31,089 1,456
50 1,118
40 17
9,639 1,785 9,294
13,054
33,772Note; PPM: parts per million. * includes salt not at home, salt not tested, refused and missing cases. a Literate but did not attend school, are also included. ** unweighted cases
TABLE 8.19 PRESENCE OF IODIZED SALT IN HOUSEHOLDPercent distribution of household with salt tested for iodine content, by level of iodine in salt ( Parts Per Million ) by districts, Haryana, 2012-13.
District
Iodine content of saltNumber of
Households** None 0 ppm
Inadequate (< 15 ppm)
Adequate ( 15 + ppm ) Not Tested/Missing*
Panchkula Ambala Yamunanagar Kurukshetra Kaithal Karnal Panipat Sonipat Jind Fatehabad Sirsa Hisar Bhiwani Rohatak Jhajjar Mahendragarh Rewari Gurgaon Faridabad Mewat Palwal Haryana
2.3 2.0 4.5 3.1 3.6
5.7 5.7 6.0 1.3 5.3
6.9 4.7 5.2 5.1 4.8
4.0 1.3 3.2 0.6 6.8 8.6
4.3
31.0 31.8 29.0 17.5 26.1
22.5 24.9 27.2 12.2 25.1
24.6 26.6 24.3 25.8 28.6
24.4 19.5 34.3 24.4 16.1 18.3
24.5
55.3 54.7 51.1 69.5 54.3
55.8 48.1 49.9 78.8 54.7
50.7 51.8 54.0 52.3 51.0
58.8 66.0 52.5 68.8 54.0 48.6
56.3
11.4 11.5 15.4 9.9
15.9
16.0 21.3 16.9 7.7
14.8
17.8 16.9 16.5 16.8 15.7
12.8 13.3 10.0 6.2
23.1 24.5
14.9
1,320 1,621 1,607 1,893 1,899
1,904 1,618 1,792 1,900 1,266
1,873 1,893 1,345 1,582 1,873
1,361 1,346 1,638 1,361 1,351 1,329
33,772
Note; PPM: parts per million. * includes salt not at home, salt not tested, refused and missing cases. ** unweighted cases

HEALTH FACILITY

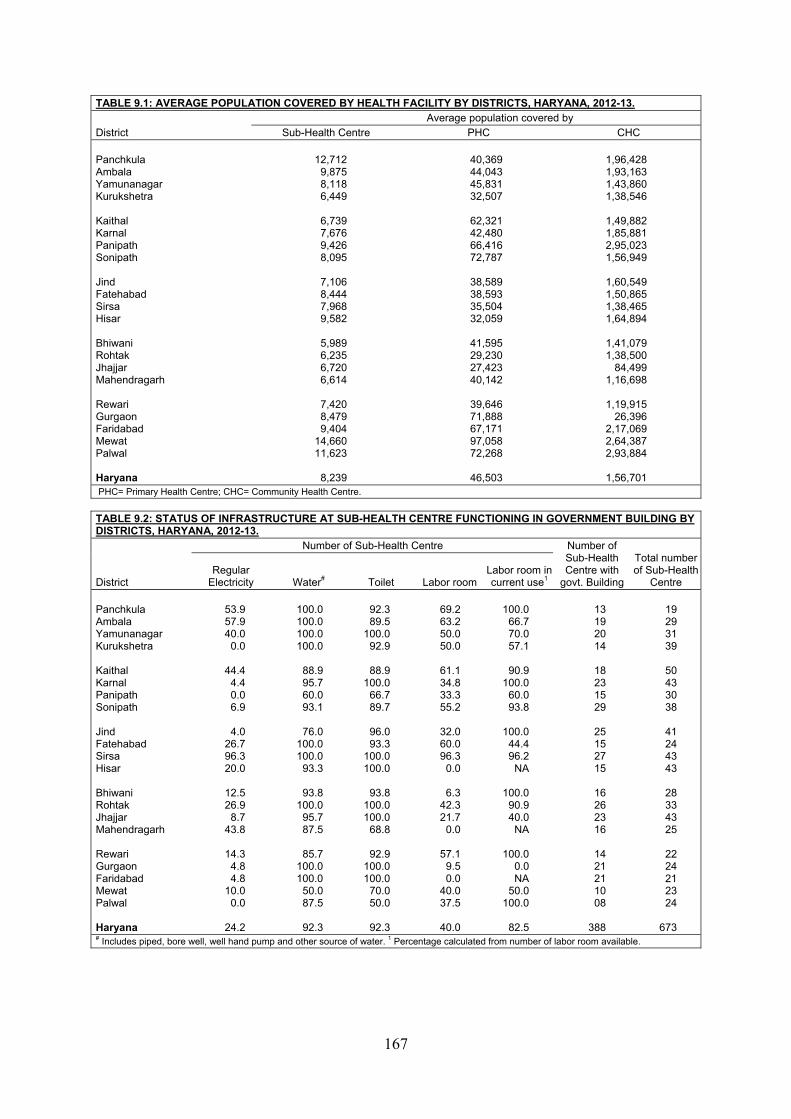
167
TABLE 9.1: AVERAGE POPULATION COVERED BY HEALTH FACILITY BY DISTRICTS, HARYANA, 2012-13.
District Average population covered by
Sub-Health Centre PHC CHC Panchkula Ambala Yamunanagar Kurukshetra Kaithal Karnal Panipath Sonipath Jind Fatehabad Sirsa Hisar Bhiwani Rohtak Jhajjar Mahendragarh Rewari Gurgaon Faridabad Mewat Palwal Haryana
12,712
9,875 8,118 6,449
6,739 7,676 9,426 8,095
7,106 8,444 7,968 9,582
5,989 6,235 6,720 6,614
7,420 8,479 9,404
14,660 11,623
8,239
40,369 44,043 45,831 32,507
62,321 42,480 66,416 72,787
38,589 38,593 35,504 32,059
41,595 29,230 27,423 40,142
39,646 71,888 67,171 97,058 72,268
46,503
1,96,428 1,93,163 1,43,860 1,38,546
1,49,882 1,85,881 2,95,023 1,56,949
1,60,549 1,50,865 1,38,465 1,64,894
1,41,079 1,38,500
84,499 1,16,698
1,19,915
26,396 2,17,069 2,64,387 2,93,884
1,56,701
PHC= Primary Health Centre; CHC= Community Health Centre.
TABLE 9.2: STATUS OF INFRASTRUCTURE AT SUB-HEALTH CENTRE FUNCTIONING IN GOVERNMENT BUILDING BY DISTRICTS, HARYANA, 2012-13.
District
Number of Sub-Health Centre Number of Sub-Health Centre with
govt. Building
Total number of Sub-Health
Centre Regular
Electricity Water# Toilet Labor room Labor room in current use1
Panchkula Ambala Yamunanagar Kurukshetra Kaithal Karnal Panipath Sonipath Jind Fatehabad Sirsa Hisar Bhiwani Rohtak Jhajjar Mahendragarh Rewari Gurgaon Faridabad Mewat Palwal Haryana
53.9 57.9 40.0
0.0
44.4 4.4 0.0 6.9
4.0
26.7 96.3 20.0
12.5 26.9
8.7 43.8
14.3
4.8 4.8
10.0 0.0
24.2
100.0 100.0 100.0 100.0
88.9 95.7 60.0 93.1
76.0
100.0 100.0
93.3
93.8 100.0
95.7 87.5
85.7
100.0 100.0
50.0 87.5
92.3
92.3 89.5
100.0 92.9
88.9
100.0 66.7 89.7
96.0 93.3
100.0 100.0
93.8
100.0 100.0
68.8
92.9 100.0 100.0
70.0 50.0
92.3
69.2 63.2 50.0 50.0
61.1 34.8 33.3 55.2
32.0 60.0 96.3
0.0
6.3 42.3 21.7
0.0
57.1 9.5 0.0
40.0 37.5
40.0
100.0
66.7 70.0 57.1
90.9
100.0 60.0 93.8
100.0
44.4 96.2
NA
100.0 90.9 40.0
NA
100.0 0.0 NA
50.0 100.0
82.5
13 19 20 14
18 23 15 29
25 15 27 15
16 26 23 16
14 21 21 10 08
388
19 29 31 39
50 43 30 38
41 24 43 43
28 33 43 25
22 24 21 23 24
673
# Includes piped, bore well, well hand pump and other source of water. 1 Percentage calculated from number of labor room available.
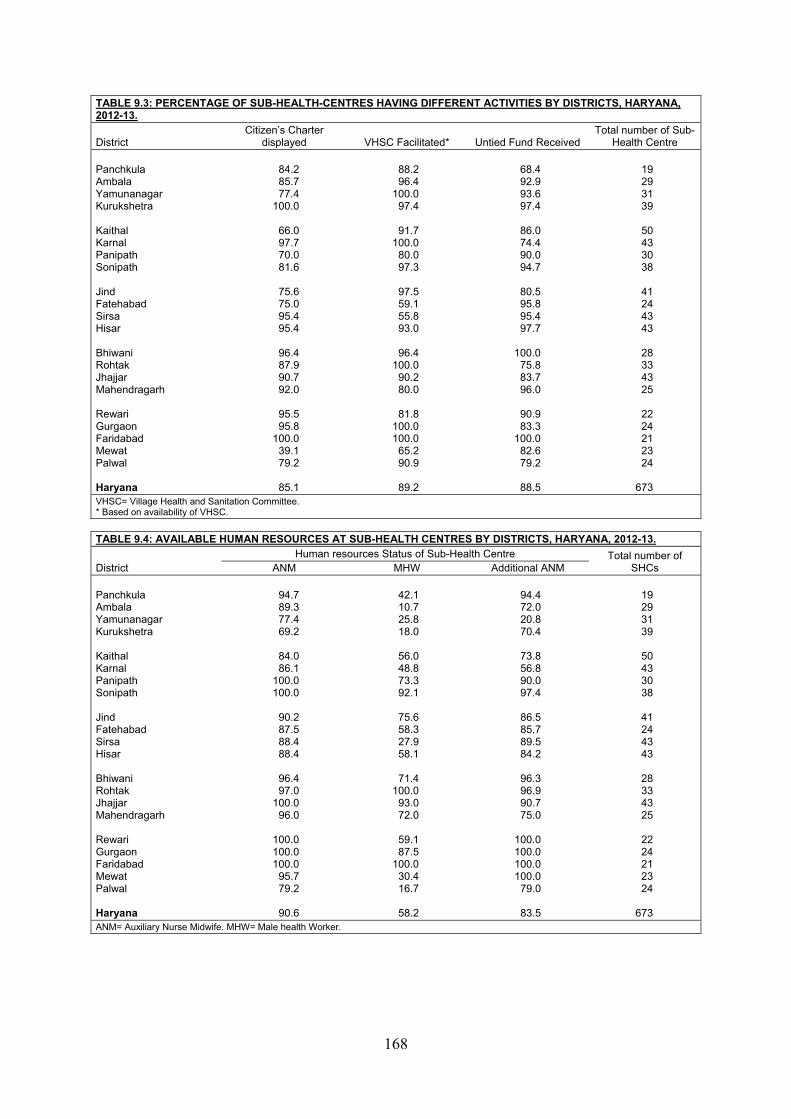
168
TABLE 9.3: PERCENTAGE OF SUB-HEALTH-CENTRES HAVING DIFFERENT ACTIVITIES BY DISTRICTS, HARYANA, 2012-13.
District Citizen’s Charter
displayed VHSC Facilitated* Untied Fund Received Total number of Sub-
Health Centre Panchkula Ambala Yamunanagar Kurukshetra Kaithal Karnal Panipath Sonipath Jind Fatehabad Sirsa Hisar Bhiwani Rohtak Jhajjar Mahendragarh Rewari Gurgaon Faridabad Mewat Palwal Haryana
84.2 85.7 77.4
100.0
66.0 97.7 70.0 81.6
75.6 75.0 95.4 95.4
96.4 87.9 90.7 92.0
95.5 95.8
100.0 39.1 79.2
85.1
88.2 96.4
100.0 97.4
91.7
100.0 80.0 97.3
97.5 59.1 55.8 93.0
96.4
100.0 90.2 80.0
81.8
100.0 100.0
65.2 90.9
89.2
68.4 92.9 93.6 97.4
86.0 74.4 90.0 94.7
80.5 95.8 95.4 97.7
100.0
75.8 83.7 96.0
90.9 83.3
100.0 82.6 79.2
88.5
19 29 31 39
50 43 30 38
41 24 43 43
28 33 43 25
22 24 21 23 24
673
VHSC= Village Health and Sanitation Committee. * Based on availability of VHSC.
TABLE 9.4: AVAILABLE HUMAN RESOURCES AT SUB-HEALTH CENTRES BY DISTRICTS, HARYANA, 2012-13.
District Human resources Status of Sub-Health Centre Total number of
SHCs ANM MHW Additional ANM Panchkula Ambala Yamunanagar Kurukshetra Kaithal Karnal Panipath Sonipath Jind Fatehabad Sirsa Hisar Bhiwani Rohtak Jhajjar Mahendragarh Rewari Gurgaon Faridabad Mewat Palwal Haryana
94.7 89.3 77.4 69.2
84.0 86.1
100.0 100.0
90.2 87.5 88.4 88.4
96.4 97.0
100.0 96.0
100.0 100.0 100.0
95.7 79.2
90.6
42.1 10.7 25.8 18.0
56.0 48.8 73.3 92.1
75.6 58.3 27.9 58.1
71.4
100.0 93.0 72.0
59.1 87.5
100.0 30.4 16.7
58.2
94.4 72.0 20.8 70.4
73.8 56.8 90.0 97.4
86.5 85.7 89.5 84.2
96.3 96.9 90.7 75.0
100.0 100.0 100.0 100.0
79.0
83.5
19 29 31 39
50 43 30 38
41 24 43 43
28 33 43 25
22 24 21 23 24
673
ANM= Auxiliary Nurse Midwife. MHW= Male health Worker.
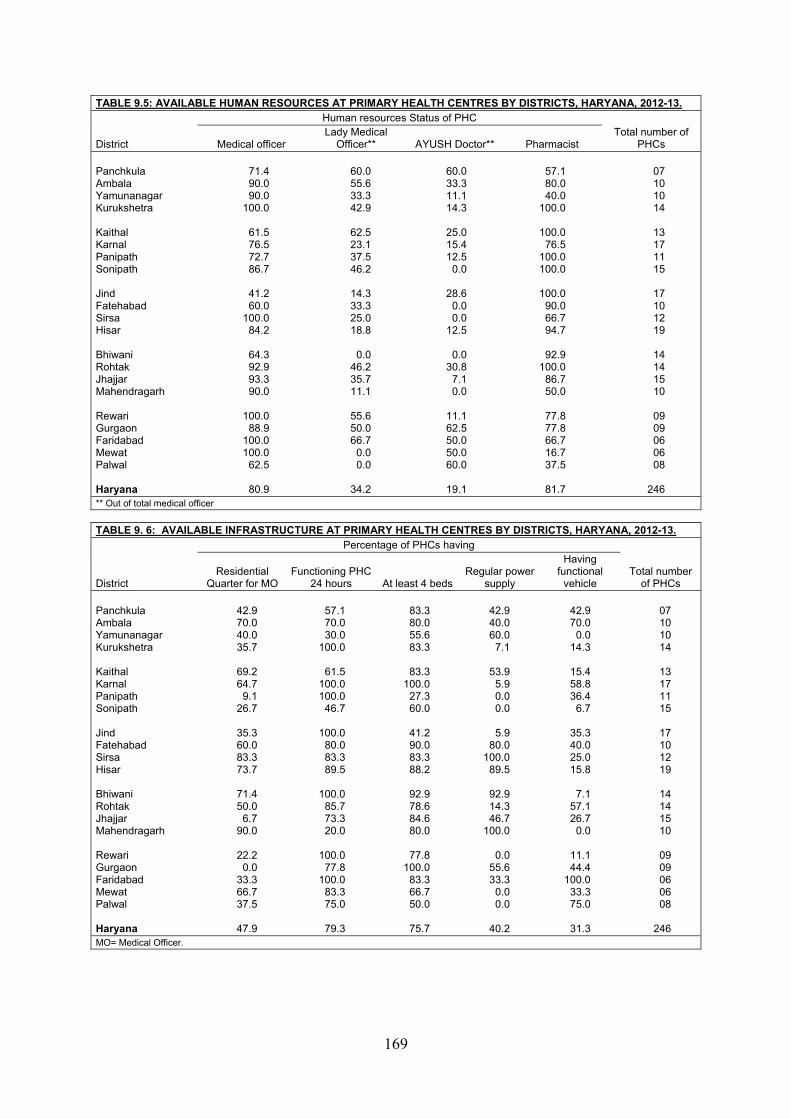
169
TABLE 9.5: AVAILABLE HUMAN RESOURCES AT PRIMARY HEALTH CENTRES BY DISTRICTS, HARYANA, 2012-13.
District
Human resources Status of PHC Total number of
PHCs Medical officer Lady Medical
Officer**
AYUSH Doctor**
Pharmacist Panchkula Ambala Yamunanagar Kurukshetra Kaithal Karnal Panipath Sonipath Jind Fatehabad Sirsa Hisar Bhiwani Rohtak Jhajjar Mahendragarh Rewari Gurgaon Faridabad Mewat Palwal Haryana
71.4 90.0 90.0
100.0
61.5 76.5 72.7 86.7
41.2 60.0
100.0 84.2
64.3 92.9 93.3 90.0
100.0
88.9 100.0 100.0
62.5
80.9
60.0 55.6 33.3 42.9
62.5 23.1 37.5 46.2
14.3 33.3 25.0 18.8
0.0
46.2 35.7 11.1
55.6 50.0 66.7
0.0 0.0
34.2
60.0 33.3 11.1 14.3
25.0 15.4 12.5
0.0
28.6 0.0 0.0
12.5
0.0 30.8
7.1 0.0
11.1 62.5 50.0 50.0 60.0
19.1
57.1 80.0 40.0
100.0
100.0 76.5
100.0 100.0
100.0
90.0 66.7 94.7
92.9
100.0 86.7 50.0
77.8 77.8 66.7 16.7 37.5
81.7
07 10 10 14
13 17 11 15
17 10 12 19
14 14 15 10
09 09 06 06 08
246
** Out of total medical officer
TABLE 9. 6: AVAILABLE INFRASTRUCTURE AT PRIMARY HEALTH CENTRES BY DISTRICTS, HARYANA, 2012-13.
District
Percentage of PHCs having
Total number of PHCs
Residential Quarter for MO
Functioning PHC 24 hours At least 4 beds
Regular power supply
Having functional
vehicle Panchkula Ambala Yamunanagar Kurukshetra Kaithal Karnal Panipath Sonipath Jind Fatehabad Sirsa Hisar Bhiwani Rohtak Jhajjar Mahendragarh Rewari Gurgaon Faridabad Mewat Palwal Haryana
42.9 70.0 40.0 35.7
69.2 64.7
9.1 26.7
35.3 60.0 83.3 73.7
71.4 50.0
6.7 90.0
22.2
0.0 33.3 66.7 37.5
47.9
57.1 70.0 30.0
100.0
61.5 100.0 100.0
46.7
100.0 80.0 83.3 89.5
100.0
85.7 73.3 20.0
100.0
77.8 100.0
83.3 75.0
79.3
83.3 80.0 55.6 83.3
83.3
100.0 27.3 60.0
41.2 90.0 83.3 88.2
92.9 78.6 84.6 80.0
77.8
100.0 83.3 66.7 50.0
75.7
42.9 40.0 60.0
7.1
53.9 5.9 0.0 0.0
5.9
80.0 100.0
89.5
92.9 14.3 46.7
100.0
0.0 55.6 33.3
0.0 0.0
40.2
42.9 70.0
0.0 14.3
15.4 58.8 36.4
6.7
35.3 40.0 25.0 15.8
7.1
57.1 26.7
0.0
11.1 44.4
100.0 33.3 75.0
31.3
07 10 10 14
13 17 11 15
17 10 12 19
14 14 15 10
09 09 06 06 08
246
MO= Medical Officer.
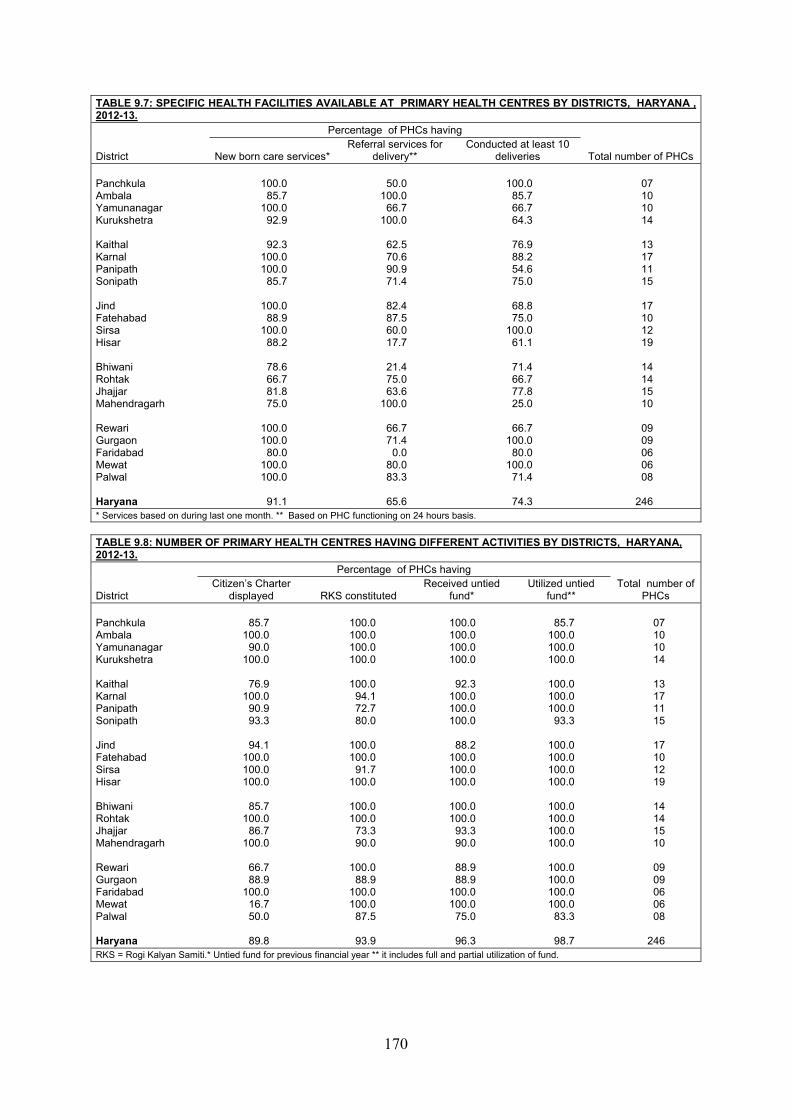
170
TABLE 9.7: SPECIFIC HEALTH FACILITIES AVAILABLE AT PRIMARY HEALTH CENTRES BY DISTRICTS, HARYANA , 2012-13.
District
Percentage of PHCs having
Total number of PHCs New born care services*Referral services for
delivery** Conducted at least 10
deliveries Panchkula Ambala Yamunanagar Kurukshetra Kaithal Karnal Panipath Sonipath Jind Fatehabad Sirsa Hisar Bhiwani Rohtak Jhajjar Mahendragarh Rewari Gurgaon Faridabad Mewat Palwal Haryana
100.0
85.7 100.0
92.9
92.3 100.0 100.0
85.7
100.0 88.9
100.0 88.2
78.6 66.7 81.8 75.0
100.0 100.0
80.0 100.0 100.0
91.1
50.0
100.0 66.7
100.0
62.5 70.6 90.9 71.4
82.4 87.5 60.0 17.7
21.4 75.0 63.6
100.0
66.7 71.4
0.0 80.0 83.3
65.6
100.0
85.7 66.7 64.3
76.9 88.2 54.6 75.0
68.8 75.0
100.0 61.1
71.4 66.7 77.8 25.0
66.7
100.0 80.0
100.0 71.4
74.3
07 10 10 14
13 17 11 15
17 10 12 19
14 14 15 10
09 09 06 06 08
246
* Services based on during last one month. ** Based on PHC functioning on 24 hours basis.
TABLE 9.8: NUMBER OF PRIMARY HEALTH CENTRES HAVING DIFFERENT ACTIVITIES BY DISTRICTS, HARYANA, 2012-13.
District
Percentage of PHCs having Total number of
PHCs Citizen’s Charter
displayed RKS constituted Received untied
fund* Utilized untied
fund** Panchkula Ambala Yamunanagar Kurukshetra Kaithal Karnal Panipath Sonipath Jind Fatehabad Sirsa Hisar Bhiwani Rohtak Jhajjar Mahendragarh Rewari Gurgaon Faridabad Mewat Palwal Haryana
85.7
100.0 90.0
100.0
76.9 100.0
90.9 93.3
94.1
100.0 100.0 100.0
85.7
100.0 86.7
100.0
66.7 88.9
100.0 16.7 50.0
89.8
100.0 100.0 100.0 100.0
100.0
94.1 72.7 80.0
100.0 100.0
91.7 100.0
100.0 100.0
73.3 90.0
100.0
88.9 100.0 100.0
87.5
93.9
100.0 100.0 100.0 100.0
92.3
100.0 100.0 100.0
88.2
100.0 100.0 100.0
100.0 100.0
93.3 90.0
88.9 88.9
100.0 100.0
75.0
96.3
85.7
100.0 100.0 100.0
100.0 100.0 100.0
93.3
100.0 100.0 100.0 100.0
100.0 100.0 100.0 100.0
100.0 100.0 100.0 100.0
83.3
98.7
07 10 10 14
13 17 11 15
17 10 12 19
14 14 15 10
09 09 06 06 08
246
RKS = Rogi Kalyan Samiti.* Untied fund for previous financial year ** it includes full and partial utilization of fund.
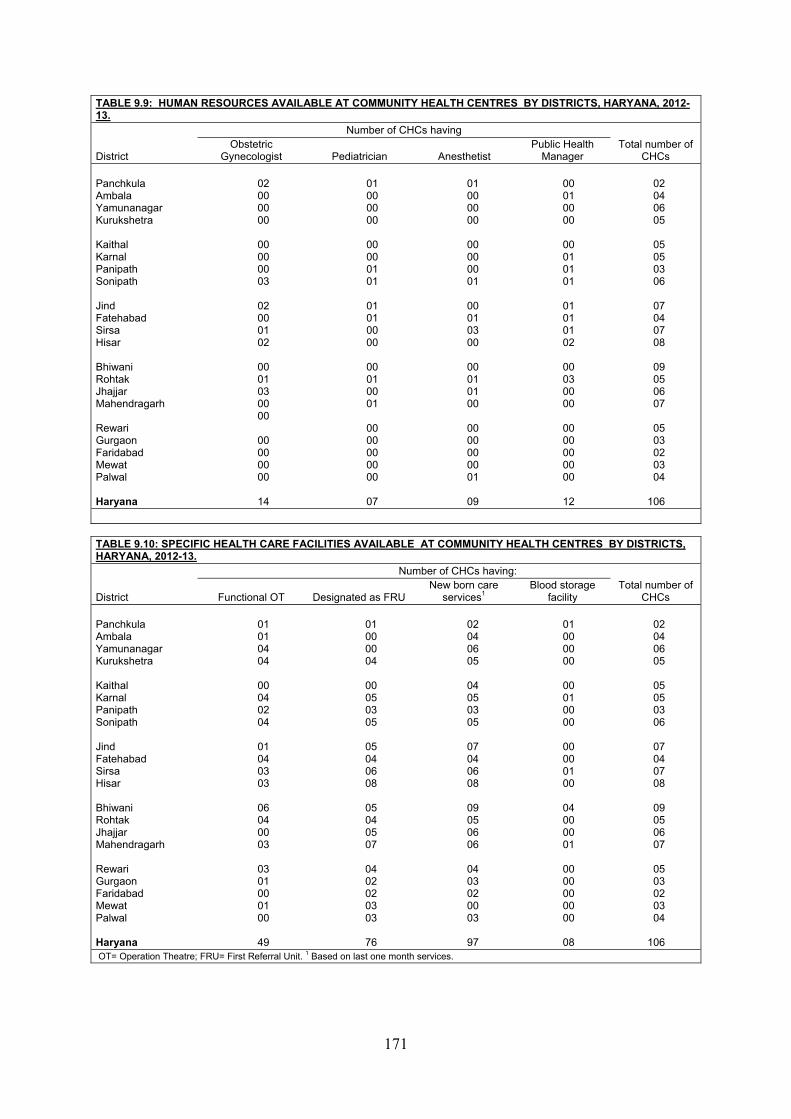
171
TABLE 9.9: HUMAN RESOURCES AVAILABLE AT COMMUNITY HEALTH CENTRES BY DISTRICTS, HARYANA, 2012-13.
District
Number of CHCs having Total number of
CHCs Obstetric
Gynecologist Pediatrician Anesthetist Public Health
Manager Panchkula Ambala Yamunanagar Kurukshetra Kaithal Karnal Panipath Sonipath Jind Fatehabad Sirsa Hisar Bhiwani Rohtak Jhajjar Mahendragarh Rewari Gurgaon Faridabad Mewat Palwal Haryana
02 00 00 00
00 00 00 03
02 00 01 02
00 01 03 00 00
00 00 00 00
14
01 00 00 00
00 00 01 01
01 01 00 00
00 01 00 01
00 00 00 00 00
07
01 00 00 00
00 00 00 01
00 01 03 00
00 01 01 00
00 00 00 00 01
09
00 01 00 00
00 01 01 01
01 01 01 02
00 03 00 00
00 00 00 00 00
12
02 04 06 05
05 05 03 06
07 04 07 08
09 05 06 07
05 03 02 03 04
106
TABLE 9.10: SPECIFIC HEALTH CARE FACILITIES AVAILABLE AT COMMUNITY HEALTH CENTRES BY DISTRICTS, HARYANA, 2012-13.
District
Number of CHCs having: Total number of
CHCs Functional OT Designated as FRU New born care
services1 Blood storage
facility
Panchkula Ambala Yamunanagar Kurukshetra Kaithal Karnal Panipath Sonipath Jind Fatehabad Sirsa Hisar Bhiwani Rohtak Jhajjar Mahendragarh Rewari Gurgaon Faridabad Mewat Palwal Haryana
01 01 04 04
00 04 02 04
01 04 03 03
06 04 00 03
03 01 00 01 00
49
01 00 00 04
00 05 03 05
05 04 06 08
05 04 05 07
04 02 02 03 03
76
02 04 06 05
04 05 03 05
07 04 06 08
09 05 06 06
04 03 02 00 03
97
01 00 00 00
00 01 00 00
00 00 01 00
04 00 00 01
00 00 00 00 00
08
02 04 06 05
05 05 03 06
07 04 07 08
09 05 06 07
05 03 02 03 04
106
OT= Operation Theatre; FRU= First Referral Unit. 1 Based on last one month services.
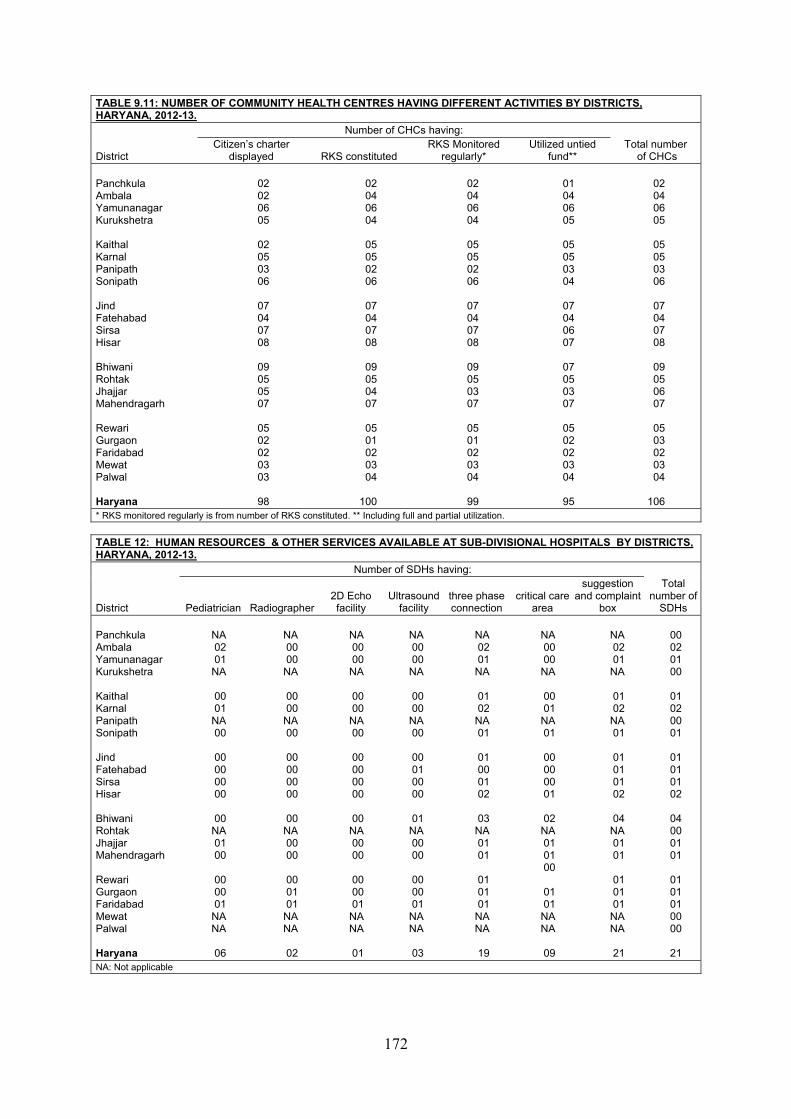
172
TABLE 9.11: NUMBER OF COMMUNITY HEALTH CENTRES HAVING DIFFERENT ACTIVITIES BY DISTRICTS, HARYANA, 2012-13.
District
Number of CHCs having: Total number
of CHCs Citizen’s charter
displayed RKS constituted RKS Monitored
regularly* Utilized untied
fund** Panchkula Ambala Yamunanagar Kurukshetra Kaithal Karnal Panipath Sonipath Jind Fatehabad Sirsa Hisar Bhiwani Rohtak Jhajjar Mahendragarh Rewari Gurgaon Faridabad Mewat Palwal Haryana
02 02 06 05
02 05 03 06
07 04 07 08
09 05 05 07
05 02 02 03 03
98
02 04 06 04
05 05 02 06
07 04 07 08
09 05 04 07
05 01 02 03 04
100
02 04 06 04
05 05 02 06
07 04 07 08
09 05 03 07
05 01 02 03 04
99
01 04 06 05
05 05 03 04
07 04 06 07
07 05 03 07
05 02 02 03 04
95
02 04 06 05
05 05 03 06
07 04 07 08
09 05 06 07
05 03 02 03 04
106
* RKS monitored regularly is from number of RKS constituted. ** Including full and partial utilization.
TABLE 12: HUMAN RESOURCES & OTHER SERVICES AVAILABLE AT SUB-DIVISIONAL HOSPITALS BY DISTRICTS, HARYANA, 2012-13.
District
Number of SDHs having: Total
number of SDHs
Pediatrician Radiographer
2D Echo facility
Ultrasound facility
three phase connection
critical care area
suggestion and complaint
box Panchkula Ambala Yamunanagar Kurukshetra Kaithal Karnal Panipath Sonipath Jind Fatehabad Sirsa Hisar Bhiwani Rohtak Jhajjar Mahendragarh Rewari Gurgaon Faridabad Mewat Palwal Haryana
NA 02 01
NA
00 01
NA 00
00 00 00 00
00
NA 01 00
00 00 01
NA NA
06
NA 00 00
NA
00 00
NA 00
00 00 00 00
00
NA 00 00
00 01 01
NA NA
02
NA 00 00
NA
00 00
NA 00
00 00 00 00
00
NA 00 00
00 00 01
NA NA
01
NA 00 00
NA
00 00
NA 00
00 01 00 00
01
NA 00 00
00 00 01
NA NA
03
NA 02 01
NA
01 02
NA 01
01 00 01 02
03
NA 01 01
01 01 01
NA NA
19
NA 00 00
NA
00 01
NA 01
00 00 00 01
02
NA 01 01 00
01 01
NA NA
09
NA 02 01
NA
01 02
NA 01
01 01 01 02
04
NA 01 01
01 01 01
NA NA
21
00 02 01 00
01 02 00 01
01 01 01 02
04 00 01 01
01 01 01 00 00
21
NA: Not applicable
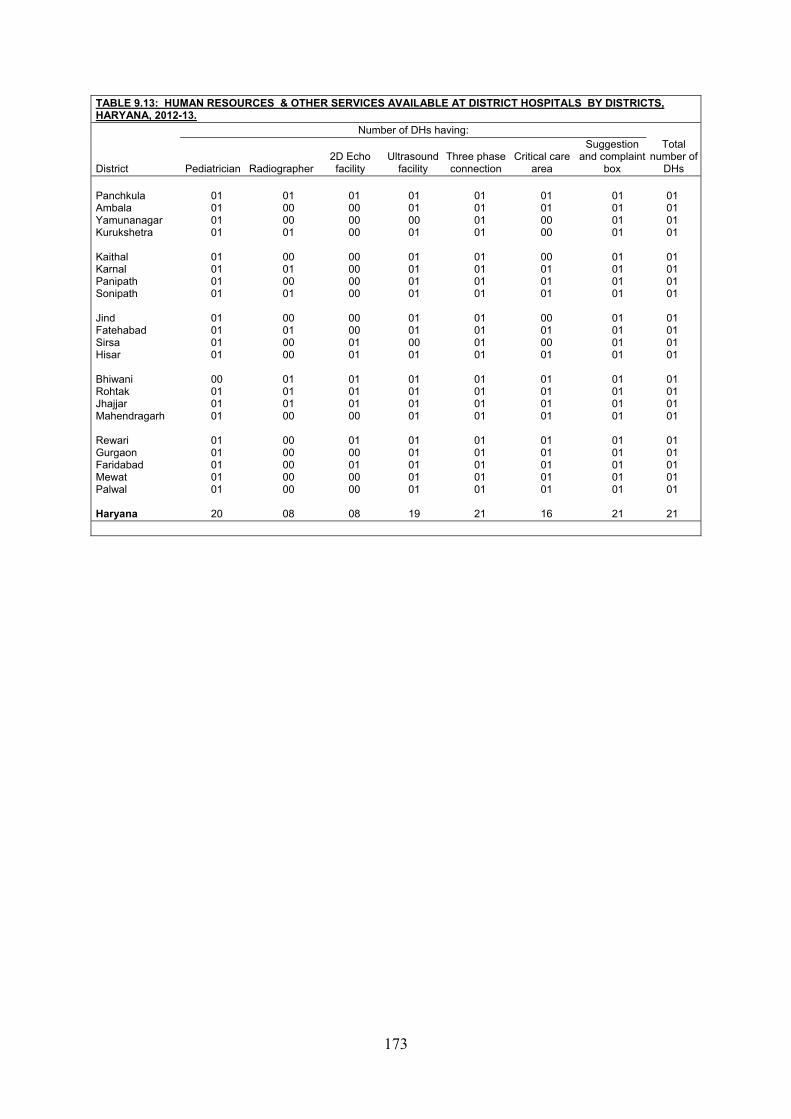
173
TABLE 9.13: HUMAN RESOURCES & OTHER SERVICES AVAILABLE AT DISTRICT HOSPITALS BY DISTRICTS, HARYANA, 2012-13.
District
Number of DHs having: Total
number of DHs
Pediatrician Radiographer
2D Echo facility
Ultrasound facility
Three phase connection
Critical care area
Suggestion and complaint
box Panchkula Ambala Yamunanagar Kurukshetra Kaithal Karnal Panipath Sonipath Jind Fatehabad Sirsa Hisar Bhiwani Rohtak Jhajjar Mahendragarh Rewari Gurgaon Faridabad Mewat Palwal Haryana
01 01 01 01
01 01 01 01
01 01 01 01
00 01 01 01
01 01 01 01 01
20
01 00 00 01
00 01 00 01
00 01 00 00
01 01 01 00
00 00 00 00 00
08
01 00 00 00
00 00 00 00
00 00 01 01
01 01 01 00
01 00 01 00 00
08
01 01 00 01
01 01 01 01
01 01 00 01
01 01 01 01
01 01 01 01 01
19
01 01 01 01
01 01 01 01
01 01 01 01
01 01 01 01
01 01 01 01 01
21
01 01 00 00
00 01 01 01
00 01 00 01
01 01 01 01
01 01 01 01 01
16
01 01 01 01
01 01 01 01
01 01 01 01
01 01 01 01
01 01 01 01 01
21
01 01 01 01
01 01 01 01
01 01 01 01
01 01 01 01
01 01 01 01 01
21

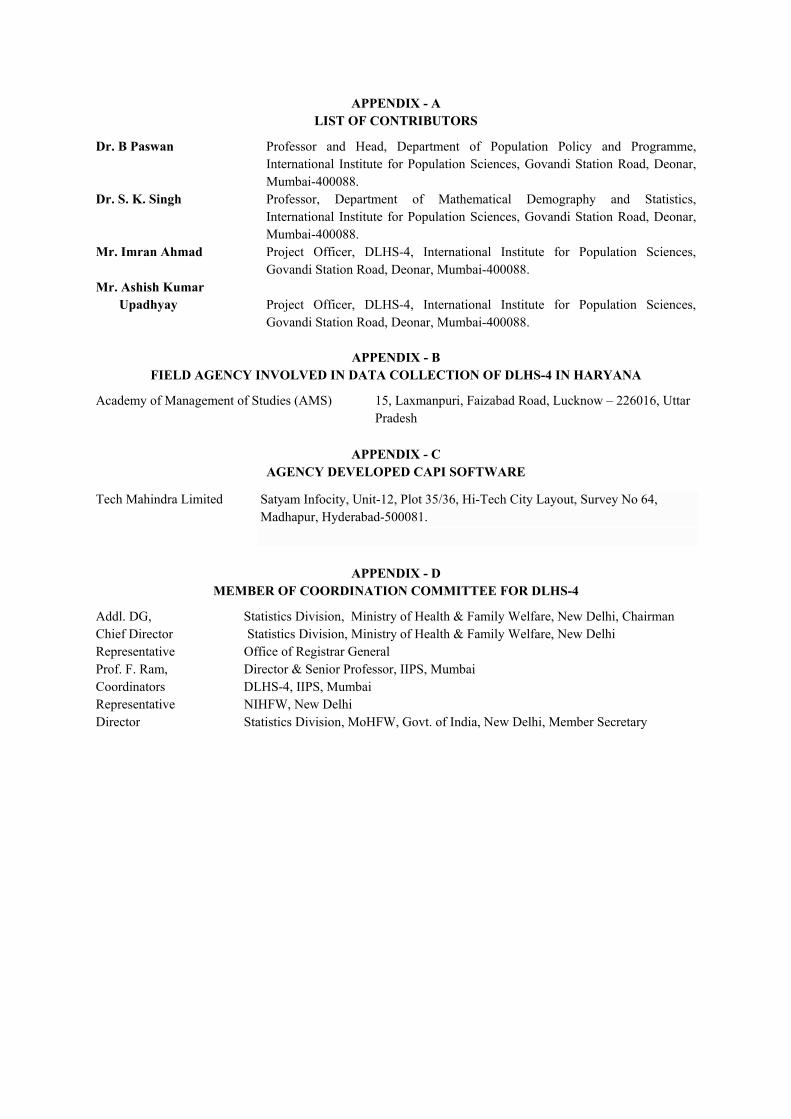
APPENDIX - A LIST OF CONTRIBUTORS
Dr. B Paswan Professor and Head, Department of Population Policy and Programme, International Institute for Population Sciences, Govandi Station Road, Deonar, Mumbai-400088.
Dr. S. K. Singh Professor, Department of Mathematical Demography and Statistics, International Institute for Population Sciences, Govandi Station Road, Deonar, Mumbai-400088.
Mr. Imran Ahmad Project Officer, DLHS-4, International Institute for Population Sciences, Govandi Station Road, Deonar, Mumbai-400088.
Mr. Ashish Kumar Upadhyay Project Officer, DLHS-4, International Institute for Population Sciences,
Govandi Station Road, Deonar, Mumbai-400088.
APPENDIX - B FIELD AGENCY INVOLVED IN DATA COLLECTION OF DLHS-4 IN HARYANA
Academy of Management of Studies (AMS) 15, Laxmanpuri, Faizabad Road, Lucknow – 226016, Uttar Pradesh
APPENDIX - C AGENCY DEVELOPED CAPI SOFTWARE
Tech Mahindra Limited Satyam Infocity, Unit-12, Plot 35/36, Hi-Tech City Layout, Survey No 64, Madhapur, Hyderabad-500081.
APPENDIX - D MEMBER OF COORDINATION COMMITTEE FOR DLHS-4
Addl. DG, Statistics Division, Ministry of Health & Family Welfare, New Delhi, Chairman Chief Director Statistics Division, Ministry of Health & Family Welfare, New Delhi Representative Office of Registrar General Prof. F. Ram, Director & Senior Professor, IIPS, Mumbai Coordinators DLHS-4, IIPS, Mumbai Representative NIHFW, New Delhi Director Statistics Division, MoHFW, Govt. of India, New Delhi, Member Secretary
176
APPENDIX - E MEMBER OF STEERING COMMITTEE OF DLHS-4
Shri K. Chandramouli, Former Secretary (H&FW), Govt. of India, New Delhi, Chairman Shri Naved Masood, SS & FA, MoHFW, Govt. of India, New Delhi Shri P. K. Pradhan, S & MD, (NRHM), MoHFW, Govt. of India, New Delhi Smt. Madhu Bala, Former ADG (Stats.), MoHFW, Govt. of India, New Delhi Shri R. C. Sethi, Addl. RGI, Office of RGI, Govt. of India, New Delhi Dr. Shiv Lal, Former Spl. DG & Advisor (PH), DGHS, MoHFW, Govt. of India, New Delhi Shri Ambrish Kumar, Advisor (Health), Planning Commission, Govt. of India, New Delhi Dr. Rattan Chand, Chief Director (Stats.), MoHFW, Govt. of India, New Delhi Prof. F. Ram, Director & Senior Professor, IIPS, Mumbai Prof. Arvind Pandey, Director, NIMS, ICMR, New Delhi Prof. Deoki Nandan, Director, NIHFW, New Delhi Shri Bhaskar Mishra, Deputy RGI, Office of RGI, Govt. of India, New Delhi Shri Pravin Srivastava, DDG, MoHFW, Govt. of India, New Delhi Shri V. Parameswaran, DDG, CSO, MoS&PI, Govt. of India, New Delhi Dr. Pavitra Mohan, Health Specialist, UNICEF, New Delhi Shri Shantanu Gupta, M & E Officer, UNICEF, New Delhi Shri K. D. Maiti, Planning, Monitoring & Evaluation Specialist, UNICEF, New Delhi Prof. M. M. Misro, Professor, NIHFW, New Delhi Prof. K. Kalaivani, Professor, NIHFW, New Delhi Shri Rajesh Bhatia, Director (Stats.), MoHFW, Govt. of India, New Delhi Shri Aditya Prakash, Statistical Advisor MoWCD, Govt. of India, New Delhi Dr. A. K. Harit, CMO, DGHS, MoHFW, Govt. of India, New Delhi Smt. Kmkum Marwah, Joint Technical Advisor, MoWCD, Govt. of India, New Delhi Dr. Paul Fancis, WHO, New Delhi Smt. Anagha Khot, NPO, WHO, New Delhi Dr. Subodh S. Gupta, NPO, WHO, New Delhi Shri Ramesh Babu, Sr. Proframme Manager, USAID, New Delhi Shri Sathyanaraynan, Sr. NPO, UNFPA, New Delhi Dr. S. C. Agrawal, AD, MoHFW, Govt. of India, New Delhi
APPENDIX -F MEMBER OF ADMINISTRATIVE AND FINANCIAL MANAGEMENT COMMITTEE OF DLHS-4
Addl. Secretary & Financial Advisory
Ministry of Health & Family Welfare, Chairperson
Addl. DG Statistics Division, Ministry of Health & Family Welfare Chief Director Statistics Division, Ministry of Health & Family Welfare Dy. Secretary (IFD) Ministry of Health & Family Welfare Director IIPS, MumbaiCoordinators DLHS-4, IIPS, Mumbai Director Statistics Division, Ministry of Health & Family Welfare, Member Secretary
177
APPENDIX - G MEMBERS OF SUB-COMMITTEE ON SAMPLING OF DLHS-4
Shri G. C. Manna, DDG, CSO, MoSPI, New Delhi, Chairman Dr. U. C. Sud, Director, IASRI, New Delhi Dr. J. P. Bhattacharjee, DDG, SDRD, NSSO, Kolkata Prof. L. Ladu Singh, Professor & DLHS-4 Coordinator, IIPS, Mumbai Shri Bhaskar Mishra, Deputy RGI, Office of RGI, Govt. of India, New Delhi Dr. Rattan Chand, Chief Director (Stats), MoHFW, Govt of India, New Delhi Shri Rajesh Bhatia, Former Director (Stats.), MoHFW, Govt. of India, New Delhi
APPENDIX -H
MEMBERS OF TECHNICAL ADVISORY COMMITTEE (TAC) FOR DLHS-4
Dr. N. S. Shastry, Former DG & CEO, NSSO, Govt. of India, New Delhi, Chairman Addl. DG Statistics Division, MoHFW, Govt. of India, New Delhi Prof. Arvind Pandey, Director, NIMS, ICMR, New Delhi P. M. Kulkarni JNU, New Delhi DG National Sample Survey Organisation (NSSO) Chief Director Statistics Division, Ministry of Health Family Welfare DDG Statistics Division, Ministry of Health Family Welfare Programme Officer Ministry of Health Family Welfare Representative Office of Registrar General, GOI Representative Ministry of Women & Child Development Prof. F. Ram, Director Senior Professor, IIPS, Mumbai Coordinator DLHS-4, IIPS, Mumbai Representatives World Bank, UNICEF, UNFPA, WHO, DFID and USAID Shri Rajesh Bhatia, Former Director (Stats.), MoHFW, Govt. of India, New Delhi, Member Secretary
APPENDIX - I
MEMBERS OF SUB-COMMITTEE TO TAC OF DLHS-4 TO EXAMINE THE DATA
Dr. N. S. Shastry, Former DG & CEO, NSSO, Govt. of India, New Delhi, Chairman Dr. Rattan Chand, Chief Director (Stats.), MoHFW, Govt. of India, New Delhi Representative Office of Registrar General Prof. P. M. Kulkarni JNU, New Delhi Prof. F. Ram, Director & Senior Professor, IIPS, Mumbai Director NIHFW, New Delhi Representative USAID Representative UNFPA Representative UNICEF Director Statistics Division, MoHFW, Govt. of India, New Delhi, Member Secretary
APPENDIX - J CAB COMPONENTS NODAL AGENCY OF DLHS-4
National Institute for Health & Family Welfare (NIHFW), Baba Gang Nath Marg, Murnika, New Delhi
178
APPENDIX-K LIST OF THE PARTNER INSTITUTES FOR CAB COMPONENTS INVOLVED IN DLHS-4
Name of the Partner Institute States Sher-E Kashmir Institute of Medical Sciences Kashmir and Ladakh Region Dr. R.P. Govt. Medical College, Tanda, Himachal Pradesh
Jammu region and Himachal Pradesh
PGIMER, Chandigarh Punjab, Chandigarh and Haryana NIHFW, New Delhi Delhi NIOH, Ahmedabad Gujarat, Daman & Diu and Dadra Nagar Haveli NIRRH, Mumbai Maharashtra (excluding Vidharbha) and Goa MGIMS, Sewagram Only Vidharbha, Maharashtra RMRC, Dibrugarh Sikkim and Arunachal Pradesh RIMS, Imphal Manipur, Mizoram & Nagaland NEIGRIHMS, Shillong Meghalaya Government Medical College, Agartala Tripura Gandhi Medical College, Hyderabad Andhra Pradesh & Telangana NIE, Chennai Tamil Nadu, Puducherry and Andaman & Nicobar Island JN Medical Collage, Belgaum North Karnataka Kasturba Medical College, Manglore South Karnataka Thiruvananthapuram Medical College, Kerala & Lakshadweep NICED, Kolkata West Bengal
APPENDIX -L PROCUREMENT OF CAB EQUIPMENTS FOR DLHS-4
HLL Life Care Limited, B-14, A, Sector-62, Noida
APPENDIX - M STAFF INVOLVED IN DLHS-4
International Institute for Population Sciences, Mumbai
Coordinators Prof. F. Ram Prof. L. Ladu Singh Prof. B. Paswan Prof. S. K. Singh Prof. H. Lhungdim Prof. T. V. Sekher Prof. K. M. Ponnapalli Prof. Chander Shekhar Dr. Manoj Alagarajan
Project Coordinator Dr. Gopal Singh Kshetrimayum Dr. Akash N. Wankhede Dr. G. P. Kumar
Health Coordinator
Dr. Mithilesh Verma IT & Data Manager
Mr. Dnyaneshwar Kale Mr. Prabhu Ponnusamy Ms. Rojalin Behura
179
Project Officer (Office)
Mr. L. Priyananda Singh (IT) Mr. Ashish Pardhi Mr. Ashish Kumar Upadhyay Mr. Junaid Khan Mr. Imran Ahmad Mr. Mohd Usman, Mr. Mahadev Digambar Bhise Mr. N. Brahmanandam Mr. Mukesh Ranjan Ms. Rati Parihar Ms. Ragini Mishra Ms. Swati Srivastava Mr. Santosh Bhagwanrao Phad Mr. Raj Kr. Verma Mr: Shrikant D. Kuntla Ms. Shalini Meshram Ms. Arpita Paul Mr. Manish Singh Mr. P.R.A. Nair Mr. AnupamVerma Mr. Satish Kumar Chauhan Mr. Rahul Koli Ms. Renu Sisodia Ms. Preetam D. Gaikwad Ms. Kakoli Borkotoky Mr. Ajit Kumar Yadav Mr. Ankit Anand Mr. Prakash Chand D. Meher Mr. Satish Kumar Chauhan Ms. Mamta Rajbhar
Project Officer (Field)
Mr. Bhagawat Singh ADMINISTRATIVE STAFF
Project Coordinator (Adm. & Finance)
C. A. Gurudutt Belhekar
ACCOUNTANT CUM OFF. ASSISTANT OFFICE ASSISTANT
Ms. Pratidnya Kasare Ms. Namarta Thorat Mr. Jay Kavashik Davda Ms. Ranjita Nimbalkar Ms. Sumita Bohra Mrs. Remya Pradeep Mr. Roshan D'souza
OFFICE ATTENDANTS
Mr. Prakash Kandera Mr. Nitin M. Dekhane Mr. Vishal P. Patil Mr. Asif D. Kokane Mr. Ravindra P. Gawade


181
DLHS-4
HARYANA