Embed Size (px)
Citation preview

TECHNICAL PAPER
HDPE-Quasicrystal Composite: Fabrication and Wear Resistance
Ankush Kothalkar • Amit S. Sharma •
Garima Tripathi • Bikramjit Basu •
Krishanu Biswas
Received: 2 November 2010 / Accepted: 4 March 2011 / Published online: 30 March 2012
� Indian Institute of Metals 2012
Abstract The present paper reports, for the first time the
processing, characterization and wear property of novel
HDPE-decagonal quasicrystal (QC) composite prepared by
the compression molding technique. The composites are
prepared at 130�C at applied pressure of 735 kPa with
different holding time to obtain fully dense product. It has
been found that a holding time of 60 min is the optimum at
the specified molding temperature and pressure. The sec-
ond phase (QC) content is varied from 5 to 20 wt% to
obtain optimum mechanical properties. SEM observations
indicate well-dispersed QC particles within the HDPE
matrix, with fine scale distribution for 20 wt% QC. Ball-
on-disc wear test reveals that composites showing better
wear resistance than pure HDPE sample. The results are
discussed using currently available literature.
Keywords HDPE � Quasicrystals � Microstructure �Friction � Wear
1 Introduction
The study of the effect of fillers to polymeric materials has
emerged lately as one of the important fields of research
activities in polymer science. The polymer industry has
long been using fillers as one of the additives to reduce the
cost of the plastics by replacing a more expensive resin
(with non-expensive materials such as CaCO3, SiO2, clays,
talc etc.) [1]. In addition to saving, the addition of fillers
leads to value-added properties. The fillers are reported to
improve the physical, mechanical, rheological as well as
chemical properties [1, 2]. For example, the addition of
fillers, such as talc, leads to higher stiffness and better
creep resistance. Similarly, the electrical and thermal
conductivities of polymers can be improved by addition of
metallic filler [3]. Thus, properties of the filled polymers
can be tailored by addition of many such types of filler.
Hence, new filler materials have continuously been inves-
tigated in the polymer research with the promise of
developing material with the combination of the properties
of the fillers and processibility.
The role of fillers in the design of high strength wear
resistant plastics can be thought of quite similar to their
function in the development of ceramic reinforced metal-
matrix composite [2]. The addition of a particulate filler
leads to the production of materials with increased strength
and wear resistance, when compared to their unfilled
counterparts. In practical applications, it has commonly
been observed that machinery contains parts made from
various alloys and hard ceramics. Therefore, a filler that
improves wear resistance of a polymer while having the
ability to slide against these materials without causing
significant damage is desirable. To address this issue, new
quasicrystalline Al–Co–Ni fillers are evaluated in the
present study.
The focus of the present work is therefore to use novel
quasicrystalline (QC) particulate fillers in high density
polyethylene (HDPE) matrix. QCs discovered in 1984 [4],
are complex metallic alloys that possess distinct physical
properties such as low co-efficient of friction (0.05–0.2)
[5], high hardness (HV0.2 *800) [6], low surface energy
(*25 mJ/m2) [7] etc. The novel physico-chemical prop-
erties of these materials stem from their unusual quasi-
periodic lattice structure. The name QC originates from the
A. Kothalkar � A. S. Sharma � G. Tripathi �B. Basu � K. Biswas (&)
Department of Materials Science and Engineering, Indian
Institute of Technology, Kanpur, Kanpur 208016, UP, India
e-mail: [email protected]
123
Trans Indian Inst Met (February 2012) 65(1):13–20
DOI 10.1007/s12666-012-0120-2

unique rotational symmetries arising out of their aperiodic
atomic structure. QCs exhibit symmetries that are forbid-
den by classical crystallography, such as fivefold, eight-
fold, tenfold and 12-fold. Since their discovery [8], several
hundred alloys have been found to exhibit QC phases. Al–
Ni–Co system forms stable decagonal quasicrystalline
phases, exhibiting unique tenfold symmetry [9]. The Al–
Ni–Co system is the most attractive and remarkable alloy
system, because it forms stable decagonal phase with a
wide range of compositions (Al72NixCo28-x with x varying
from 8 to 20) [8]. In addition, the brittle nature [6] of the
QC phase allows us to obtain fine powder with low cost.
This has made them ideal materials for evaluation as
reinforcing fillers in polymeric materials. Earlier study [2,
3, 10] carried out on the addition of Al–Cu–Fe icosahedral
quasicrystals to various polymeric materials (both ther-
moplastics and thermosets) to prepare a wear-resistant fil-
ler. It was shown that Al–Cu–Fe QC filled polymers could
exhibit wear resistance behavior with nominal improve-
ments in other mechanical properties associated with rigid
low- aspect ratio fillers. In addition, the QC powder in the
polymer matrix has been reported to cause almost no
abrasion to the steel counterface materials during the wear
testing [10].
In the present contribution, we have reported the pro-
cessing, characterization and wear resistance of Al–Ni–Co
decagonal QC filled HDPE composites. The process opti-
mization to obtain fully dense composite with various
amount of QC filler will be discussed. One of important
aspects of this work is also to understand the wear resis-
tance of QC filled polymers in comparison to the pure
polymer.
2 Experimental Details
2.1 Materials
Quasicrystalline (Al72Ni8Co20) decagonal phase powders
were prepared in our laboratory by ball milling alloy but-
tons. The alloy buttons were made by arc melting pure
elements (99.9% purity) in argon atmosphere in a vacuum
arc-melting furnace. These buttons were then crushed by
mortars followed by dry balling milling (P7, Fritsch, Ger-
many) at 100 rpm with ball-to-powder weight ratio of 7:1
for 2 h to obtain fine powders. Low rpm was used so that no
structural change would occur in the alloy powder during
milling operation. The powders thus obtained have been
found to contain only decagonal phase (confirmed by X-ray
diffraction analysis). Commercially available high-density
polyethylene (HDPE) powder of density 0.948 gm/cc
(Pohong Industries, China) was used for matrix. Differen-
tial scanning calorimetric (TGA/DSC1, Mettler Toledo,
Switzerland) observations of HDPE powder shows melting
temperature of 130�C. Scanning electron microscopic
observation showed that the average particle size of QC and
HDPE were 20 ± 2 and 174 ± 4 lm, respectively.
2.2 Composite Fabrication
The pure HDPE and Al–Ni–Co alloy powder of different
compositions (HDPE with 0, 5, 10, 15 and 20 wt% QC
powder) were mechanically mixed by dry milling in a ball
mill (P7, Fritsch, Germany) operating at rpm of 200 for
6 h. The ball-to-powder ratio maintained was 7:1. The
resulting QC/Polymer powder mixture was placed in a die
mold (diameter of 2.5 cm and height of 4 cm). The powder
mixture was then compressed using a compression molding
set up SCM30 (SANTEC Laboratory, India) at a pressure
of 735 kPa and temperature of 130�C. The mold tempera-
ture was monitored with a thermocouple attached to the
mold wall. The samples were held at the set temperature
for different time duration ranging from 15 to 90 min
before cooling under pressure to room temperature. The
resulting composite pellets were polished with 400-grade
emery paper followed by washing in distilled water.
2.3 Characterization
The density of all pellets was measured according to
Archimedes’ principle using distilled water. The theoretical
density for the compression molding composition was cal-
culated following the rule of mixtures, considering the theo-
retical densities of pure HDPE and QC as 0.948 [11] and
3.939 gm/cc [9], respectively. The phase identification of the
polished and flat samples was performed by X-ray diffraction
(XRD) (Seifert, USA) using Cu-Ka (k = 0.154056 nm)
radiation at a scan rate of 1�/min. The phase distribution of all
the polished samples were observed using a field emission
scanning electron microscope (FESEM, Carl Zeiss SUPRA
40VP), operated at 10 kV. The compositional analysis of the
phases were conducted using energy dispersive x-ray spec-
troscopic (EDS) analyzer attached to the SEM. Differential
scanning calorimetry (DSC) as well as thermogravimetric
(TGA) analysis were performed on a Mettler-Toledo TGA/
DSC1 under argon purge at a heating rate of 10 K/min. Wear
test of the developed composites was performed in a ball-on-
disc type commercial tribometer (DUCOM, India) under
mode-I fretting condition. The compression-molded pellets
were used as flat materials (moving) and the alumina ball of
9 mm in diameter with mirror finish surfaces was the count-
erbody material. Before the fretting tests, alumina balls were
ultrasonically cleaned in acetone. The testing parameters
included a normal load of 5 N, frequency of 5 Hz, stroke of
100 lm and testing duration of 60,000 cycles. In fretting
tribometer, an inductive displacement transducer monitored
14 Trans Indian Inst Met (February 2012) 65(1):13–20
123

the displacement of the flat sample. The friction force was
recorded with a piezoelectric transducer attached to the holder
that supports the counterbody. The friction coefficient was
obtained from the online measured tangential force. After a
wear test was performed, the laser surface profilometry
(MAHR, Perthometer, Germany) was utilized to obtain
3-dimenional shape of the wear scar. These data were utilized
to obtain wear volume of all samples. The hardness of the
pellets was measured on polished compression molded sam-
ples using Vickers hardness tester (Bareiss Prufgeratebau,
GmbH) with 10 gm load. At least 5 indentations were taken
for each sample and hardness value was reported as the
average of all the measurements with error bars.
3 Results and Discussion
3.1 Optimization of Densification
We shall first discuss the process optimization to prepare
dense composite using compression molding. The com-
pression molding of the composite powder mixture has
been carried out at 130�C and pressure of 735 kPa for
different holding time ranging from 15 to 90 min to opti-
mize the densification. The selection of holding tempera-
ture has been done based on differential scanning
calorimetry results, which will be discussed later. Figure 1
shows the variation of relative density of the composite
with time for HDPE-5 wt% QC compression molded at
735 kPa. The relative density of the composite increases as
a function of holding time up to 60 min reaching
99.9% qth, where qth is the theoretical density of the
composite calculated using rule of mixture. The relative
density decreases with further increase in holding time
(90 min). Similar trend in densification behavior has been
observed for other compositions. Therefore, the holding
time of 60 min and applied pressure of 735 kPa at 130�C
has been used as optimized processing conditions in the
compression molding experiments in the present investi-
gation. Table 1 shows the relative density of all the com-
posite compression molded with same applied pressure and
temperature. It is clear that pellets can be fully sintered
irrespective the composition of the composite.
3.2 X-ray Diffraction (XRD) Study
X-ray diffraction analysis of all the composites (5, 10, 15
and 20 wt%) as well as pure HDPE pellets has been carried
out. However, we shall present representative XRD anal-
ysis of HDPE-10 wt% QC composite. Figure 2 shows such
analysis. The XRD patterns obtained from individual
powder are shown in Fig. 2a, b, whereas Fig. 2d is the
XRD pattern obtained from the compression-molded pellet.
Figure 2c reveals XRD pattern from the mixed powder.
Figures 2c, d show that all peaks in the XRD patterns can
be indexed using the characteristic peaks of decagonal
quasicrystal and pure HDPE. The observation of rather
Fig. 1 The relative density of HDPE-5 wt% QC composite is plotted
against holding time. The pellet was compression molded at 130�C at
735 kPa pressure. q is the measured density of the composite and qth
is the theoretical density of the composite calculated using rule of
mixture
Table 1 Relative density of the
composite pellets with different
QC content
Wt% of QC
in HDPE
Relative
density
(=qmeasured
qtheoretical)
0 99.8
5 99.9
10 99.9
15 99.9
20 99.8
20 30 40 50 60 70 80 90 100
Carbon
Inte
nsit
y (a
rb. u
nits
)
HDPEAl-Co-NiAl-Co-Ni(10wt %)+HDPE compositeAl-Co-Ni(10wt %)+HDPE Pellet
(a)
(b)
(c)
(d)
2θ (in degrees)
decagonal
Fig. 2 X-ray diffraction patterns: a pure HDPE powder,
b Al72Co20Ni8 QC powder, c HDPE-10 wt% QC powder mixture
and d HDPE-10 wt% QC composite pellet
Trans Indian Inst Met (February 2012) 65(1):13–20 15
123

broad HDPE peak can be ascribed to the semi-crystalline
nature of the polymer. The presence of any unwanted phase
or reaction product cannot be detected in the compression-
molded pellet. As amount of QC phase increases in the
composite, there is concomitant increase in intensity of QC
peaks. Therefore, it is possible to retain the constituent
phases in the compression-molded pellets.
3.3 Differential Scanning Calorimetric (DSC)
and Thermogravitometry (TGA) Study
Differential scanning calorimetric and TGA were carried
out for five samples (0, 5, 10, 15 and 20 wt% QC in HDPE)
to study crystallinity of HDPE in the pellets and to under-
stand the stability of the composites. It has been observed
that pure HDPE pellet melts at 130.5�C, which is the
equilibrium melting temperature, reported in the literature
[9]. As far as processing temperature of the composites are
concerned, the compression molding experiments have
been carried out at 130�C so that QC particles get well
mixed during the holding time and we can obtain well
dispersed QC particles in the pellet. The crystallinity of the
pure HDPE and composite pellets can be calculated using
normalized enthalpy of melting of the composite from DSC
measurements and comparing it with the enthalpy of pure
HDPE with 100% crystallinity (234.2 J/g) [10]. Table 2
provides the results obtained from such analysis. It is clear
that the samples are not 100% crystalline, rather they show
semi-crystalline nature. The crystallinity of the composite
decreases by addition of QC particles. TGA measurements
indicate the % change in mass of the samples during mea-
surement. TGA results show that the mass of the samples
does not change appreciably. Therefore, the samples are
found to be not reactive with the atmospheric oxygen during
the measurement and hence these composites are very sta-
ble during heating to high temperatures.
3.4 Scanning Electron Microscopic (SEM) Analysis
of Composite
Scanning electron microscopic observations of the com-
posite pellets are presented in Fig. 3. These are back-
Fig. 3 BSE SEM micrographs of the composites samples with
a 5 wt% QC, b 10 wt% QC, c 15 wt% QC and d 20 wt% QC. The
inset in each figure shows higher magnification micrographs revealing
distribution of QC particles in HDPE matrix
Table 2 DSC-TGA results of the composites and pure HDPE pellets
Wt% of QC
in HDPE
% Crystallinity Wt. change in
TGA (% initial weight)
0 46.41 1.571
5 41.19 1.328
10 44.83 0.996
15 45.64 0.756
20 43.44 1.329
16 Trans Indian Inst Met (February 2012) 65(1):13–20
123

scattered electron (BSE) micrographs, depicting distribu-
tion of QC particles within HDPE matrix. Figure 3a–d
reveals the BSE micrographs with varying QC content
(5–20 wt%) in the composite, clearly showing the well-
dispersed QC particles in the composite. The inset in each
micrograph reveals higher magnification micrographs to
reveal the size and shape of QC particles. One can clearly
observe (marked by broken arrows in the inset of Fig. 3a,
b) the presence of finer scale QC particles (\1 lm) in case
of HDPE- 5 wt% QC composite. It is to be noted that SEM
micrographs (not shown here) of QC powder indicate the
average particle size to be 20 ± 2 lm. The dispersion of
quasicrystalline particles in the polymer matrix is found to
be uniform. However, as concentration of the QC increa-
ses, QC particles form agglomerates, as indicated by white
arrows in Fig. 3c, d as well as in the insets of the figures.
The agglomeration of QC particles is mainly due to the
close proximity in HDPE melting during compression-
molding experiments.
3.5 Hardness and Friction Measurements
Figure 4 shows the hardness of the composites as a func-
tion of QC content. The hardness measurements have been
carried out using Vickers hardness tester. Pure HDPE pellet
shows a hardness of 55 MPa. There is a steady increase in
the hardness of composites as we increase the QC content
from 5 to 20 wt%. In fact, the hardness of the HDPE-
20 wt% QC is more than twice that of pure HDPE.
Therefore, the addition of harder QC particles to softer
HDPE matrix leads to substantial improvement of hardness
of the composite. The hardness values obtained in the
present investigation are comparable with earlier studies on
Al–Cu–Fe QC filled ultrahigh molecular polyethylene as
well as epoxy composites [2–4].
The coefficient of friction (COF) of all samples has been
measured using ball-on-disc type commercial tribometer
under mode-I fretting condition. We shall present the
results obtained from representative samples to elucidate
the salient results of the test. The evolution in frictional
response of pure HDPE and HDPE-10 wt% QC pellets,
measured using 4.9 N load, 100 lm stroke and 5 Hz fre-
quency with Al2O3 as counterbody, is shown in Fig. 5a.
Both the materials have qualitatively similar frictional
response in a sense that the COF reaches a peak value of
0.16 during the running-in period (first 1,000 cycle) and
thereafter, drops to steady state value. The steady state
COF of QC composites is comparable with that of pure
HDPE. It is clear that the COF of the decagonal QC
composite is slightly (0.15) higher than that of pure HDPE
pellets tested under identical conditions. It is reported in
the literature that the Al–Ni–Co decagonal QC has higher
COF (0.2) [12, 13] than pure HDPE (0.1) [11]. The addi-
tion of QC, in the present case, therefore does not lead to
substantial change of COF of the composite as compared to
pure HDPE. COF measured for all the composites, as listed
Fig. 4 Hardness of the pellets is plotted as a function of QC content
of the composites
Fig. 5 a Coefficient of friction versus no of cycles plot for HDPE-
20 wt% QC composite, b wear volume versus wt% QC
Trans Indian Inst Met (February 2012) 65(1):13–20 17
123
in Table 3, shows similar trend. This is one of the advan-
tages of addition of harder QC particles in HDPE as
compared to other metallic or ceramic fillers [1]. Figure 5b
shows the wear volume measured with the HDPE-based
pellets. The wear volume of the pellets has been calculated
using 3-dimensional wear scars profiles obtained from LSP
measurements. The results clearly indicate that wear vol-
ume of the composites is at least one order of magnitude
lower than that of pure HDPE samples. The wear volume
decreases as the wt% QC phase increases in the composite.
At least four times less wear volume is measured with
HDPE-20 wt% QC composite as compared to unfilled
HDPE. This clearly shows the efficacy of the addition of
harder QC particles for enhancement of wear resistance.
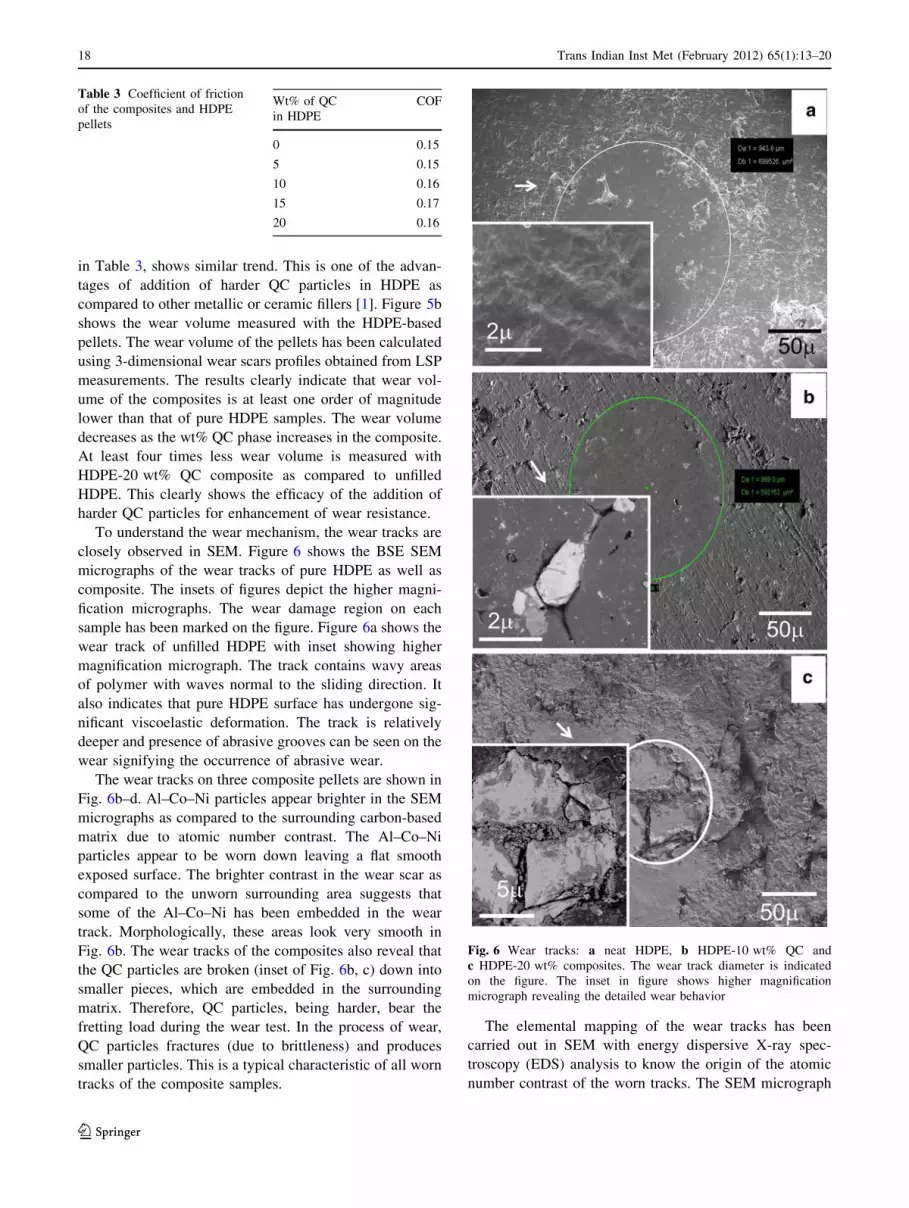
To understand the wear mechanism, the wear tracks are
closely observed in SEM. Figure 6 shows the BSE SEM
micrographs of the wear tracks of pure HDPE as well as
composite. The insets of figures depict the higher magni-
fication micrographs. The wear damage region on each
sample has been marked on the figure. Figure 6a shows the
wear track of unfilled HDPE with inset showing higher
magnification micrograph. The track contains wavy areas
of polymer with waves normal to the sliding direction. It
also indicates that pure HDPE surface has undergone sig-
nificant viscoelastic deformation. The track is relatively
deeper and presence of abrasive grooves can be seen on the
wear signifying the occurrence of abrasive wear.
The wear tracks on three composite pellets are shown in
Fig. 6b–d. Al–Co–Ni particles appear brighter in the SEM
micrographs as compared to the surrounding carbon-based
matrix due to atomic number contrast. The Al–Co–Ni
particles appear to be worn down leaving a flat smooth
exposed surface. The brighter contrast in the wear scar as
compared to the unworn surrounding area suggests that
some of the Al–Co–Ni has been embedded in the wear
track. Morphologically, these areas look very smooth in
Fig. 6b. The wear tracks of the composites also reveal that
the QC particles are broken (inset of Fig. 6b, c) down into
smaller pieces, which are embedded in the surrounding
matrix. Therefore, QC particles, being harder, bear the
fretting load during the wear test. In the process of wear,
QC particles fractures (due to brittleness) and produces
smaller particles. This is a typical characteristic of all worn
tracks of the composite samples.
The elemental mapping of the wear tracks has been
carried out in SEM with energy dispersive X-ray spec-
troscopy (EDS) analysis to know the origin of the atomic
number contrast of the worn tracks. The SEM micrograph
Table 3 Coefficient of friction
of the composites and HDPE
pellets
Wt% of QC
in HDPE
COF
0 0.15
5 0.15
10 0.16
15 0.17
20 0.16
Fig. 6 Wear tracks: a neat HDPE, b HDPE-10 wt% QC and
c HDPE-20 wt% composites. The wear track diameter is indicated
on the figure. The inset in figure shows higher magnification
micrograph revealing the detailed wear behavior
18 Trans Indian Inst Met (February 2012) 65(1):13–20
123

on Fig. 7a reveals the QC particle has been worn during
wear test. The X-ray map of this area (marked by pink box)
clearly shows the presence of aluminum (Fig. 7b), cobalt
(Fig. 7b), nickel (Fig. 7c) and oxygen (Fig. 7d) as well as
carbon (not shown here). Therefore, during wear test, the
QC particles appear to be broken down into very small
particles that are embedded in the polymer matrix to pro-
duce a smooth, metal-oxide rich wear track. It has been
reported that Al-based QC particles are always covered
with an aluminum oxide shell [9]. During fretting wear this
oxide layer is continuously broken, making the virgin QC
surface in contact with atmosphere and further oxidized.
This is clearly observed in case of HDPE- 20 wt% QC
composite surface (inset of Fig. 6c). The wear debris par-
ticles adjacent to the wear track of the composite samples
are collected and investigated in SEM. The wear debris
particles have been found to contain small fragmented
particles, which appears similar in composition to the worn
areas as composite pellet. EDS analysis as well as com-
positional mapping (not shown here) show the presence of
ubiquitous Al, Co, Ni and O throughout the debris. Thus,
the oxide particles form on the virgin surface of the QC
particles and get fragmented during fretting wear. It is to be
noted here that no debris has been found during wear test of
HDPE pellet.
As expected, no observable wear damage could be
recorded on worn Al2O3 ball surface after testing with all
the investigated materials. Figure 8a, b show low and high
magnification micrographs of the surface of the ball,
illustrating almost no sign of wear.
The excellent wear resistance of HDPE-QC composites
in combination with low counter-body abrasion can be
attributed to the unique properties of Al–Co–Ni QC; low
surface energy [7], low COF [5] and high hardness [6]. In
addition, the presence of hard particulate fillers in the
polymer is known to increase the shear strength and thus
wear resistance of the polymer composite [13, 14]. The low
COF of the QC originates from reduced electronic inter-
actions, whereas higher electronic interactions in materials
like steels contributes to sticking effect, which increases
Fig. 7 SEM image and
elemental mapping of
aluminum, cobalt, nickel and
oxygen in the wear track of
HDPE-10 wt% QC composite
Trans Indian Inst Met (February 2012) 65(1):13–20 19
123

friction. It is to be noted that the presence of newly formed
smooth metal-oxide layer at the worn surface may also
contribute to enhancement of wear resistance. The wear
resistance of the composite increases as the wt% of QC
increases from 5 to 20. This is due to the increase of the
volume of hard QC particles. Moreover, the uniform dis-
tribution of the QC particles also leads to wear resistance.
The wear resistance improves with the increase in hardness
of the material. This is typically observed in case of
abrasive and adhesive wear of metallic materials, which is
primarily worn by extensive plastic deformation. The
present experimental results however indicate that an
increase in hardness also leads to improvement in wear
resistance in case of materials undergoing viscoelastic
deformation.
4 Concluding Remarks
The following conclusions can be drawn from the present
study:
(i) HDPE-decagonal QC composite can be obtained with
near theoretical density by compression moulding at
130�C for 1 h at 735 kPa pressure. Longer curing time
leads to a decrease in density.
(ii) The QC addition (up to 20 wt%) leads to consider-
able improvement in hardness with 120 MPa Vickers
hardness being measured with HDPE-20 wt% QC
composite.
(iii) The wear resistance of the newly developed com-
posites is superior to the pure HDPE without
compromising on frictional properties. The frictional
response as well as steady state COF of the
composite remains almost similar to that of pure
HDPE.
(iv) The high wear resistance can be attributed to high
hardness and uniform distribution of QC phase.
References
1. Zebarjad S M, Sajjadi S A, Tahani M, and Lazzeri A, J AchievMater Manuf Eng 17 (2006) 173.
2. Bloom P D, Baikerikar K G, Otaigbe J U, and Sheares V V,
Mater Sci Eng A 294–296 (2000) 156.
3. Bloom P D, Baikerikar K G, Anderegg J W, and Sheares V V,
Mater Sci Eng A 360 (2003) 46.
4. Shechtman D, Blech I, Gratias D and Cahn J W, Phy Rev Lett 53(1984) 1951.
5. Dubois J M, Kang S S and Perrot A, Mater Sci Eng A 179/180(1994) 122.
6. Koster U, Liu W, Liebertz H and Michel M, J Non-Cryst Solids153/154 (1993) 446.
7. Jenks C J and Thiel P, MRS Bull 22 (1997) 55.
8. Tsai A P, Acc Chem Res 36 (2003) 31.
9. Tsai A P, Phil Mag Lett 74 (1996) 233.
10. Anderson B C, Bloom P D, Baikerikar K G, Sheares V V and
Mallapragada S K, Biomaterials 23 (2002) 1761.
11. Hutchings I M, Tribology: Friction and wear of engineering
materials, Edward Arnold, London (1992), p 261
12. Schurack F, Eckert J and Schultz L, Phil Mag 83 (2003) 807.
13. Bandyopadhyay P P and Siegmann S, Surf Coat Technol 197(2005) 1.
14. Woishnis W, Polypropylene, PDI publisher, New York (1998),
p 68
Fig. 8 SEM image of surface of Al2O3 ball (used as counterbody):
a low magnification and b high magnification micrograph
20 Trans Indian Inst Met (February 2012) 65(1):13–20
123


