Embed Size (px)
Citation preview
HAL Id: hal-03316952https://hal.archives-ouvertes.fr/hal-03316952
Submitted on 6 Aug 2021
HAL is a multi-disciplinary open accessarchive for the deposit and dissemination of sci-entific research documents, whether they are pub-lished or not. The documents may come fromteaching and research institutions in France orabroad, or from public or private research centers.
L’archive ouverte pluridisciplinaire HAL, estdestinée au dépôt et à la diffusion de documentsscientifiques de niveau recherche, publiés ou non,émanant des établissements d’enseignement et derecherche français ou étrangers, des laboratoirespublics ou privés.
Two-dimensional oxide quasicrystal approximants withtunable electronic and magnetic properties
Thiago Trevizam Dorini, Florian Brix, Corentin Chatelier, Anton Kokalj,Émilie Gaudry
To cite this version:Thiago Trevizam Dorini, Florian Brix, Corentin Chatelier, Anton Kokalj, Émilie Gaudry. Two-dimensional oxide quasicrystal approximants with tunable electronic and magnetic properties.Nanoscale, Royal Society of Chemistry, 2021, 13 (24), pp.10771-10779. �10.1039/D1NR02407H�. �hal-03316952�
Journal NameTwo-dimensional oxide quasicrystal approximantswith tunable electronic and magnetic properties†
Thiago T. Dorini,a,b Florian Brix,a,b Corentin Chatelier,a,b Anton Kokalj,b,c ÉmilieGaudry∗a,b
Recently, the discovery of the quasiperiodic order in ultra-thin perovskite films reinvigorated thefield of 2-dimensional oxides on metals, and raised the question of the reasons behind the emer-gence of the quasiperiodic order in these systems. The effect of size-mismatch between the twoseparate systems has been widely reported as a key factor governing the formation of new oxidestructures on metals. Herein, we show that electronic effects can play an important role as well. Tothis end, the structural, thermodynamic, electronic and magnetic properties of freestanding two-dimensional oxide quasicrystalline approximants and their characteristics when deposited overmetallic substrates are systematically investigated to unveil the structure-property relationshipswithin the series. Our thermodynamic approach suggests that the formation of these aperiodicsystems is likely for a large range of compositions. In addition, the magnetic properties and workfunctions of the thin films can be controlled by tuning their chemical composition. This work pro-vides well-founded general insights into the driving forces behind the emergence of the quasiperi-odic order in ternary oxides grown on elemental metals and offers guidelines for the discovery ofnew oxide quasicrystalline ultra-thin films with interesting physical properties.
1 IntroductionThin perovskite films, made of a few-layer thick nano-sheets, haveattracted considerable attention due to their extensive structuraland electronic variability, linked to the huge number of conceiv-able unique chemical compositions — more than'107, accordingto Li et al..1The combination of the low dimension with the struc-tural flexibility of this class of crystals opened the door to a richspectrum of applications in many fields, such as energy transitionand catalysis,2 correlated materials3 and electronic devices.4,5
Decreasing the thickness of two-dimensional (2D) perovskitesdown to the mono-layer limit is expected to deeply alter theirstructures and modify the physical and chemical properties,as already demonstrated in the case of other types of ultra-thin 2D oxides films6–8 — TiOx/Pt(111),9 MnOx/Pd(100)10 andVOx/Pd(111),11,12 to name a few. This has recently led to theemergence of novel structures with aperiodic ordering, i.e. do-decagonal oxide quasicrystal interfaces in the BaTiO3/Pt(111)and SrTiO3/Pt(111) systems.13–16 The driving force for these
a Université de Lorraine, CNRS, Institut Jean Lamour – UMR 7198, F-54011, Nancy,France. E-mail: [email protected] International Associated Laboratory PACS2, CNRS UniversitÃl’ de Lorraine, Nancy,Francec Jožef Stefan Institute, Jamova cesta 39, 1000 Ljubljana, Slovenia† Electronic Supplementary Information (ESI) available: [details of any supplemen-tary information available should be included here]. See DOI: 00.0000/00000000.
unique structural modifications, resulting from thickness reduc-tion, are far from being fully unveiled. Reduced bonding coordi-nations, possible strong surface polarizations, support effects andexperimental conditions are supposed to play a role, but no clearpicture has yet been drawn.6–8
A key parameter for the emergence of quasiperiodic order isthe existence of double-well interaction potentials defining twodifferent length-scales.17,18 The presence of at least two elementsfulfil this criterion for intermetallic quasicrystals,19 whose aperi-odic order can be transferred to 2D atomic or molecular over-layers, grown at their surfaces, like Pb/Ag–In–Yb,20 Pb/Al–Co–Ni21 or Pb/Al–Pd–Mn.22 These are only scarce examples illustrat-ing the formation of 2D quasiperiodic films on periodic substrates.Most of the them deals with molecular assembly — fullerenes or-ganised as 2D small patches of a quasicrystalline triangle-squaretiling on Pt3Ti(111)23 and molecules aperiodically organised byCe-directed assembly on Ag(111).24,25 The case of the 2D Ox-ide QuasiCrystals (OQCs) on dense metallic surfaces remainsunique.13 The stoichiometric ratio and concentration, as well asthe coordinative plasticity, charge and ionic radii of cations, areinvoked as key parameters towards the formation of quasiperiodicfilms. In the case of the 2D BaTiO3/Pt(111) OQC, the frustrationat the interface between two periodic materials is suggested toplay a role in the formation of the OQC phase, as proposed previ-ously in the Ag/GaAs(110) system.26 Such argument is also sup-
Journal Name, [year], [vol.], 1–9 | 1
ported by experimental evidences of interface and support effectson the structure of the (thick) BaTiO3 films.27,28 However, no sys-tematic structural and electronic investigations have been under-taken so far to evaluate the impact of elastic, electronic and chem-ical factors on the emergence of the quasiperiodic order, which isprobably due to the complexity and the non-periodic character ofthe structures.
Periodic approximant structures to quasicrystals represent avery useful approach to deepen our understanding of quasicrys-talline phases. When modelled with large crystal supercells, ap-proximants exhibit atomic arrangements similar to those encoun-tered in quasicrystals, hence they bridge the gap between peri-odic and aperiodic positional order. Due to their lattice period-icity, approximants can be studied by methods based on densityfunctional theory (DFT). Focusing on OQCs, approximants havebeen experimentally observed and theoretically investigated inthe BaTiO3/Pt(111), SrTiO3/Pt(111) and BaFeO3/Pt(111) sys-tems.14,16,29,30 Beyond these examples, and starting from thestructural model derived for the BaTiO3/Pt(111) approximant,14
the structural, thermodynamic, electronic and magnetic prop-erties of freestanding 2D Oxide Quasicrystalline Approximants(OQAs) — ABO3 where A = Ba, Ca, Sr and B = Ti, V, Cr, Mn,Fe, Ni — as well as their characteristics when deposited overMe(111) substrates (Me = Pt, Pd, Au) are systematically investi-gated herein to unveil the structure-property relationships withinthe series. The relative stabilities of the supported OQAs, com-pared to those of periodic systems with similar compositions, sug-gest a good experimental feasibility for many of them. Whilesize-mismatch is generally invoked as the main driving force to-wards the formation of ultra-thin oxide layers on metal, includ-ing OQAs,6,31 we show here that electronic effects (interfacialelectron transfer and hybridisation) play a significant role inthe stability and properties of the films. Our study reveals thattuning the magnetic properties and the work functions of theseaperiodic-like metallic supported ultra-thin oxide films is achiev-able by controlling their chemical composition. This work pro-vides well-founded general guidelines to the discovery of newOQCs with interesting physical and chemical properties.
2 Relative stabilities of OQA films
2.1 Structures
One of the aims of our study is to assess the relative thermody-namic stability of supported OQAs against the periodic systemswith similar compositions. Hence, three types of structures areconsidered.
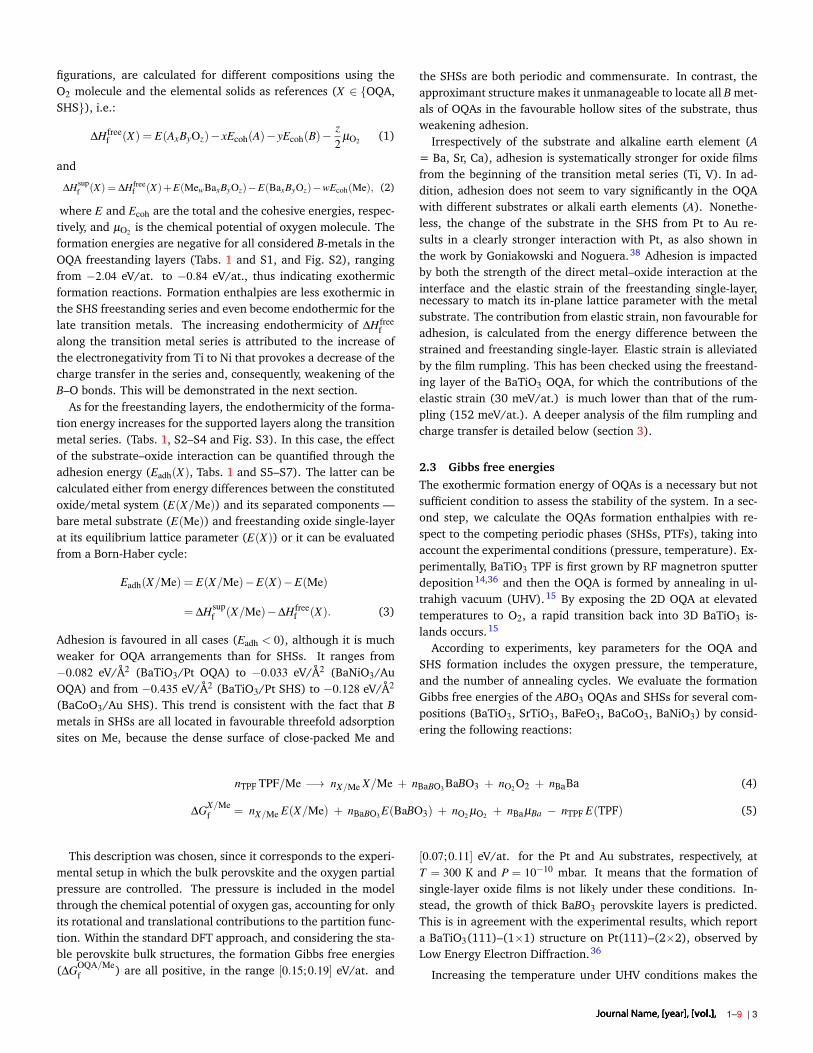
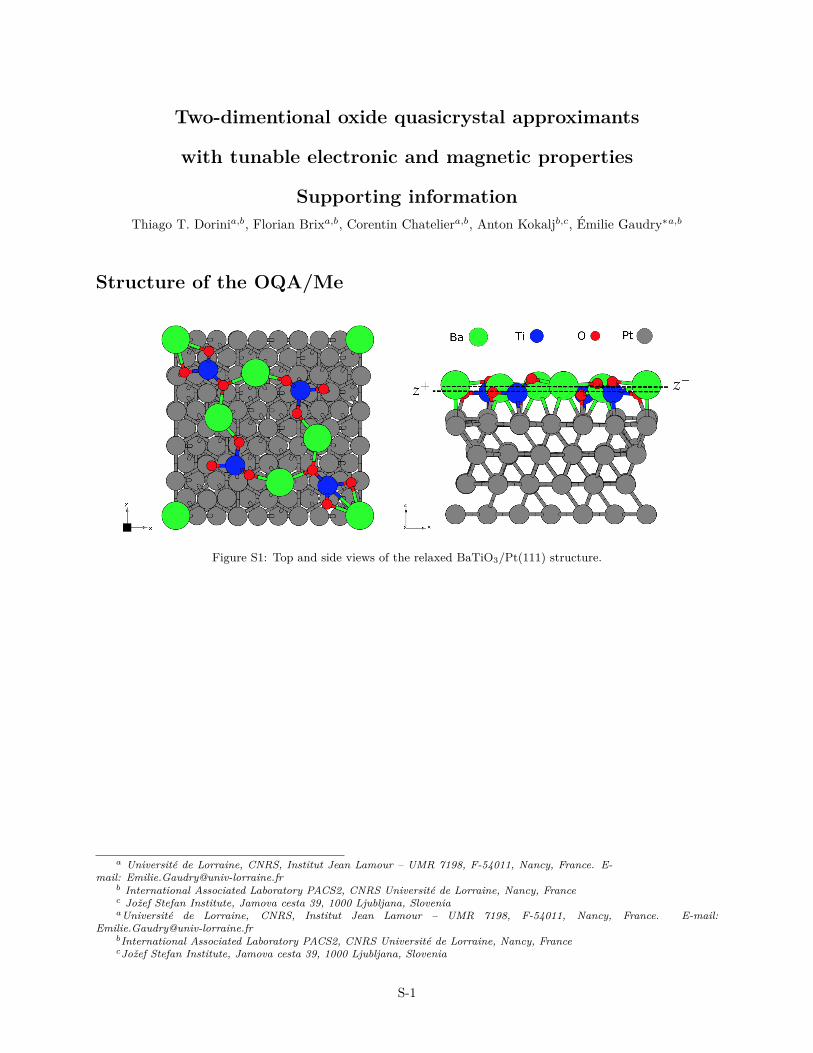
The 2D OQA series is studied using structural models derivedfrom the one designed for BaTiO3/Pt(111).14 According to a com-bination of scanning tunnelling microscopy, low-energy electrondiffraction, surface X-ray diffraction and ab initio calculations, itconsists in a 32.4.3.4 Archimedean tiling, with Ti atoms at the cor-ners of each tiling element and threefold coordinated to oxygenatoms (Figs. 1a and S1). A wide variety of chemical compositionsis considered herein, through atomic substitutions based on theA5B4O12 chemical motif, with A = Ba, Ca, Sr and B = Ti, V, Cr,Mn, Fe, Ni.
To evaluate the relative stability of the previous aperiodic-like single oxide layers against possible periodic arrangements,we considered a second model, which is an archetypal struc-ture for 2D periodic ultra-thin oxide films. It consists ofa single-layer hexagonal structured (SHS) B2O3, doped withalkali earth elements (A). Such a honeycomb structure, de-posited on Me(111), has been experimentally observed forTi2O3/Au(111)32, Nb2O3/Au,33 FeWO3/Au34 and copper oxideon Au35 (Fig. 1b). In contrast to the OQA model, the SHS modelcontains the A-element as a dopant. Thus, its content is muchlower than the one of the B-element (AB4O6 is the surface cellmotif).
The experimentally observed OQA structure of BaTiO3/Pt(111)is prepared from Thick BaTiO3 Perovskite Films (TPFs) grownby RF magnetron sputter deposition.36 The TPFs are modelledhere by 7 Å-thick films. TPFs films are built with the [abc] direc-tion of the bulk crystal perpendicular to the Me(111) terminationplanes, with [abc]=[111] for cubic perovskites and [abc]=[100]for hexagonal perovskites (Figs. 1c–1d). The simulation box con-tains two interfaces: Me/TPF and TPF/void. Since bulk per-ovskite crystals are described by a stacking of two types of planesalong the [abc] direction — low-density pure B-element planesand AO3 planes — several configurations are possible. We choseAO3/Me and AO3/void interfaces, because the atomic density ofthe AO3 planes are much higher than the pure B-element ones.
Z
YX
Z
YX
(b) SHS
(c) TPF - cubic (d) TPF - hexagonal
(a) OQA
A B MeO
Z
X
Z
YXY
Fig. 1 Structural models for the oxide films grown on Pt(111), plotted us-ing XCrySDen: 37 OQA (a), SHS (b), TPF built from the cubic perovskitestructure (c) and TPF built from the hexagonal perovskite structure (d).
2.2 Formation enthalpies
The formation energies of the freestanding and supported 2D ox-ides (∆Hfree
f and ∆Hsupf , respectively), in both OQA and SHS con-
2 | 1–9Journal Name, [year], [vol.],
figurations, are calculated for different compositions using theO2 molecule and the elemental solids as references (X ∈ {OQA,SHS}), i.e.:
∆Hfreef (X) = E(AxByOz)− xEcoh(A)− yEcoh(B)−
z2
µO2 (1)
and
∆Hsupf (X) = ∆Hfree
f (X)+E(MewBaxByOz)−E(BaxByOz)−wEcoh(Me), (2)
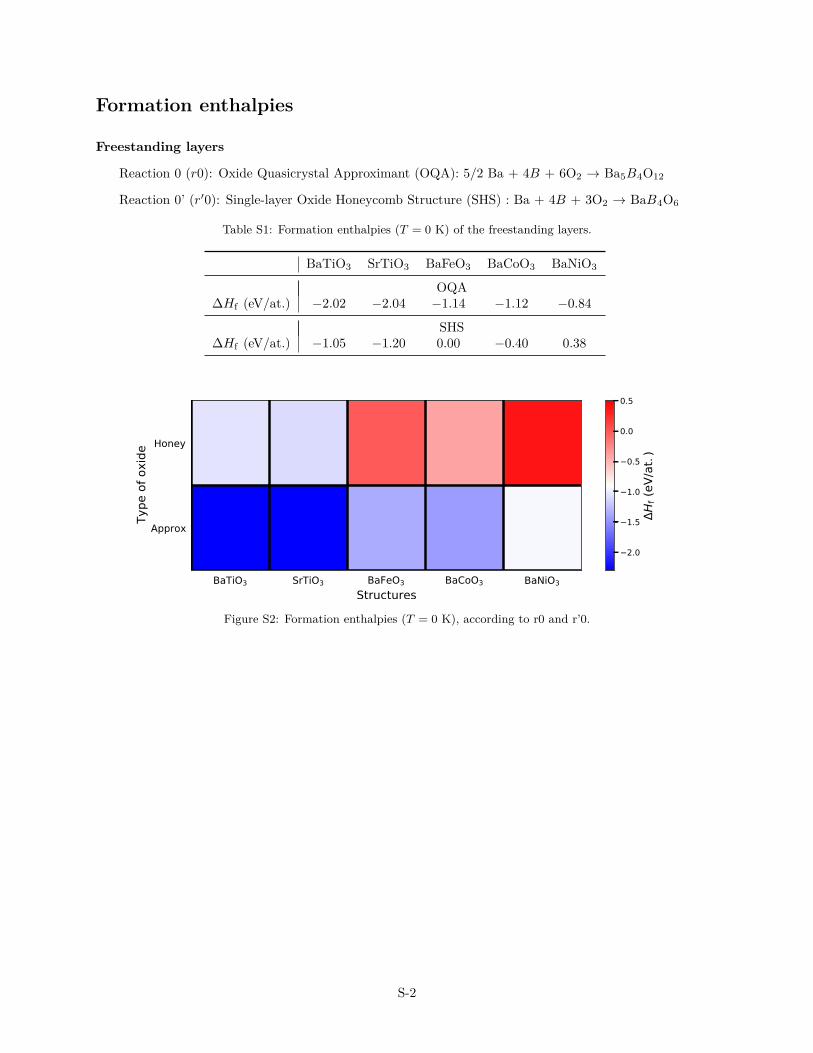
where E and Ecoh are the total and the cohesive energies, respec-tively, and µO2 is the chemical potential of oxygen molecule. Theformation energies are negative for all considered B-metals in theOQA freestanding layers (Tabs. 1 and S1, and Fig. S2), rangingfrom −2.04 eV/at. to −0.84 eV/at., thus indicating exothermicformation reactions. Formation enthalpies are less exothermic inthe SHS freestanding series and even become endothermic for thelate transition metals. The increasing endothermicity of ∆Hfree
falong the transition metal series is attributed to the increase ofthe electronegativity from Ti to Ni that provokes a decrease of thecharge transfer in the series and, consequently, weakening of theB–O bonds. This will be demonstrated in the next section.
As for the freestanding layers, the endothermicity of the forma-tion energy increases for the supported layers along the transitionmetal series. (Tabs. 1, S2–S4 and Fig. S3). In this case, the effectof the substrate–oxide interaction can be quantified through theadhesion energy (Eadh(X), Tabs. 1 and S5–S7). The latter can becalculated either from energy differences between the constitutedoxide/metal system (E(X/Me)) and its separated components —bare metal substrate (E(Me)) and freestanding oxide single-layerat its equilibrium lattice parameter (E(X)) or it can be evaluatedfrom a Born-Haber cycle:
Eadh(X/Me) = E(X/Me)−E(X)−E(Me)
= ∆Hsupf (X/Me)−∆Hfree
f (X). (3)
Adhesion is favoured in all cases (Eadh < 0), although it is muchweaker for OQA arrangements than for SHSs. It ranges from−0.082 eV/Å2 (BaTiO3/Pt OQA) to −0.033 eV/Å2 (BaNiO3/AuOQA) and from −0.435 eV/Å2 (BaTiO3/Pt SHS) to −0.128 eV/Å2
(BaCoO3/Au SHS). This trend is consistent with the fact that Bmetals in SHSs are all located in favourable threefold adsorptionsites on Me, because the dense surface of close-packed Me and
the SHSs are both periodic and commensurate. In contrast, theapproximant structure makes it unmanageable to locate all B met-als of OQAs in the favourable hollow sites of the substrate, thusweakening adhesion.
Irrespectively of the substrate and alkaline earth element (A= Ba, Sr, Ca), adhesion is systematically stronger for oxide filmsfrom the beginning of the transition metal series (Ti, V). In ad-dition, adhesion does not seem to vary significantly in the OQAwith different substrates or alkali earth elements (A). Nonethe-less, the change of the substrate in the SHS from Pt to Au re-sults in a clearly stronger interaction with Pt, as also shown inthe work by Goniakowski and Noguera.38 Adhesion is impactedby both the strength of the direct metal–oxide interaction at theinterface and the elastic strain of the freestanding single-layer,necessary to match its in-plane lattice parameter with the metalsubstrate. The contribution from elastic strain, non favourable foradhesion, is calculated from the energy difference between thestrained and freestanding single-layer. Elastic strain is alleviatedby the film rumpling. This has been checked using the freestand-ing layer of the BaTiO3 OQA, for which the contributions of theelastic strain (30 meV/at.) is much lower than that of the rum-pling (152 meV/at.). A deeper analysis of the film rumpling andcharge transfer is detailed below (section 3).
2.3 Gibbs free energiesThe exothermic formation energy of OQAs is a necessary but notsufficient condition to assess the stability of the system. In a sec-ond step, we calculate the OQAs formation enthalpies with re-spect to the competing periodic phases (SHSs, PTFs), taking intoaccount the experimental conditions (pressure, temperature). Ex-perimentally, BaTiO3 TPF is first grown by RF magnetron sputterdeposition14,36 and then the OQA is formed by annealing in ul-trahigh vacuum (UHV).15 By exposing the 2D OQA at elevatedtemperatures to O2, a rapid transition back into 3D BaTiO3 is-lands occurs.15
According to experiments, key parameters for the OQA andSHS formation includes the oxygen pressure, the temperature,and the number of annealing cycles. We evaluate the formationGibbs free energies of the ABO3 OQAs and SHSs for several com-positions (BaTiO3, SrTiO3, BaFeO3, BaCoO3, BaNiO3) by consid-ering the following reactions:
nTPF TPF/Me −→ nX/Me X/Me + nBaBO3 BaBO3 + nO2 O2 + nBaBa (4)
∆GX/Mef = nX/Me E(X/Me) + nBaBO3 E(BaBO3) + nO2 µO2 + nBaµBa − nTPF E(TPF) (5)
This description was chosen, since it corresponds to the experi-mental setup in which the bulk perovskite and the oxygen partialpressure are controlled. The pressure is included in the modelthrough the chemical potential of oxygen gas, accounting for onlyits rotational and translational contributions to the partition func-tion. Within the standard DFT approach, and considering the sta-ble perovskite bulk structures, the formation Gibbs free energies(∆GOQA/Me
f ) are all positive, in the range [0.15;0.19] eV/at. and
[0.07;0.11] eV/at. for the Pt and Au substrates, respectively, atT = 300 K and P = 10−10 mbar. It means that the formation ofsingle-layer oxide films is not likely under these conditions. In-stead, the growth of thick BaBO3 perovskite layers is predicted.This is in agreement with the experimental results, which reporta BaTiO3(111)–(1×1) structure on Pt(111)–(2×2), observed byLow Energy Electron Diffraction.36
Increasing the temperature under UHV conditions makes the
Journal Name, [year], [vol.], 1–9 | 3
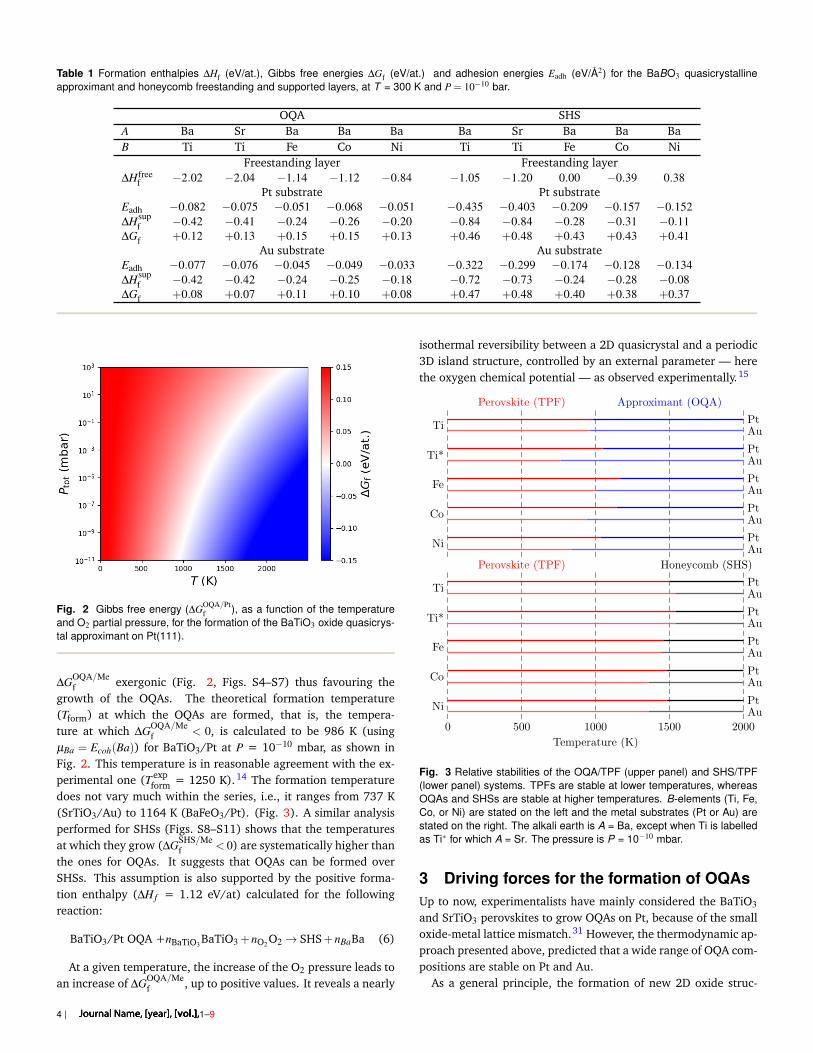
Table 1 Formation enthalpies ∆Hf (eV/at.), Gibbs free energies ∆Gf (eV/at.) and adhesion energies Eadh (eV/Å2) for the BaBO3 quasicrystallineapproximant and honeycomb freestanding and supported layers, at T = 300 K and P = 10−10 bar.
OQA SHSA Ba Sr Ba Ba Ba Ba Sr Ba Ba BaB Ti Ti Fe Co Ni Ti Ti Fe Co Ni
Freestanding layer Freestanding layer∆Hfree
f −2.02 −2.04 −1.14 −1.12 −0.84 −1.05 −1.20 0.00 −0.39 0.38Pt substrate Pt substrate
Eadh −0.082 −0.075 −0.051 −0.068 −0.051 −0.435 −0.403 −0.209 −0.157 −0.152∆Hsup
f −0.42 −0.41 −0.24 −0.26 −0.20 −0.84 −0.84 −0.28 −0.31 −0.11∆Gf +0.12 +0.13 +0.15 +0.15 +0.13 +0.46 +0.48 +0.43 +0.43 +0.41
Au substrate Au substrateEadh −0.077 −0.076 −0.045 −0.049 −0.033 −0.322 −0.299 −0.174 −0.128 −0.134∆Hsup
f −0.42 −0.42 −0.24 −0.25 −0.18 −0.72 −0.73 −0.24 −0.28 −0.08∆Gf +0.08 +0.07 +0.11 +0.10 +0.08 +0.47 +0.48 +0.40 +0.38 +0.37
Fig. 2 Gibbs free energy (∆GOQA/Ptf ), as a function of the temperature
and O2 partial pressure, for the formation of the BaTiO3 oxide quasicrys-tal approximant on Pt(111).
∆GOQA/Mef exergonic (Fig. 2, Figs. S4–S7) thus favouring the
growth of the OQAs. The theoretical formation temperature(Tform) at which the OQAs are formed, that is, the tempera-ture at which ∆GOQA/Me
f < 0, is calculated to be 986 K (usingµBa = Ecoh(Ba)) for BaTiO3/Pt at P = 10−10 mbar, as shown inFig. 2. This temperature is in reasonable agreement with the ex-perimental one (T exp
form = 1250 K).14 The formation temperaturedoes not vary much within the series, i.e., it ranges from 737 K(SrTiO3/Au) to 1164 K (BaFeO3/Pt). (Fig. 3). A similar analysisperformed for SHSs (Figs. S8–S11) shows that the temperaturesat which they grow (∆GSHS/Me
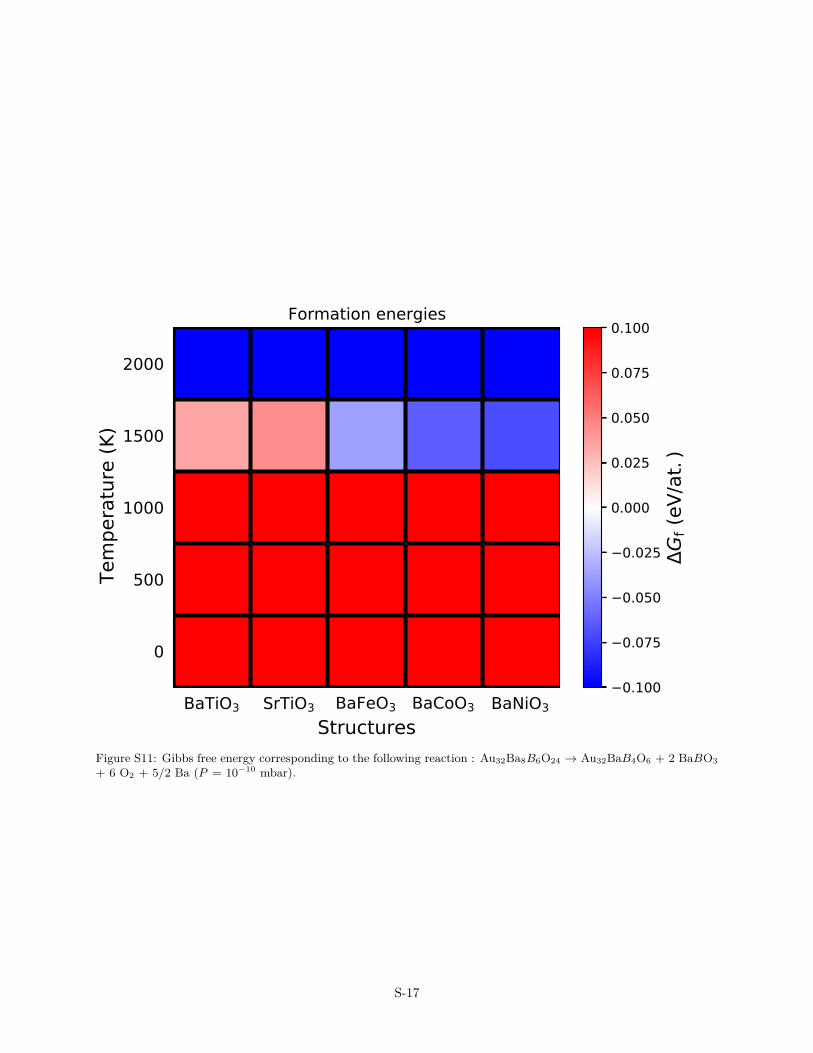
f < 0) are systematically higher thanthe ones for OQAs. It suggests that OQAs can be formed overSHSs. This assumption is also supported by the positive forma-tion enthalpy (∆H f = 1.12 eV/at) calculated for the followingreaction:
BaTiO3/Pt OQA +nBaTiO3 BaTiO3 +nO2 O2→ SHS+nBaBa (6)
At a given temperature, the increase of the O2 pressure leads toan increase of ∆GOQA/Me
f , up to positive values. It reveals a nearly
isothermal reversibility between a 2D quasicrystal and a periodic3D island structure, controlled by an external parameter — herethe oxygen chemical potential — as observed experimentally.15
Fig. 3 Relative stabilities of the OQA/TPF (upper panel) and SHS/TPF(lower panel) systems. TPFs are stable at lower temperatures, whereasOQAs and SHSs are stable at higher temperatures. B-elements (Ti, Fe,Co, or Ni) are stated on the left and the metal substrates (Pt or Au) arestated on the right. The alkali earth is A = Ba, except when Ti is labelledas Ti∗ for which A = Sr. The pressure is P = 10−10 mbar.
3 Driving forces for the formation of OQAsUp to now, experimentalists have mainly considered the BaTiO3
and SrTiO3 perovskites to grow OQAs on Pt, because of the smalloxide-metal lattice mismatch.31 However, the thermodynamic ap-proach presented above, predicted that a wide range of OQA com-positions are stable on Pt and Au.
As a general principle, the formation of new 2D oxide struc-
4 | 1–9Journal Name, [year], [vol.],
tures has been attributed to size-mismatch. A severe lattice mis-match between the oxide and the metal surface tends to avoidthe formation of ordered oxide films over metals. A typical ex-ample is CaO deposited on Mo(001).39 Amorphous CaO films areformed at low growth temperature, but a rocksalt-type Ca3MoO4
structure, with a small oxide-metal lattice mismatch, is obtainedafter annealing at high temperature. Here, a detailed analysisof the structural properties of OQA freestanding and supportedsystems has been performed to address the question of how thesize-mismatch impacts the OQAs formation. In this section, wealso address the influence of electronic effects on the OQAs for-mation, through charge transfer and density of states analyses.
3.1 Size-mismatch and rumpling
Atomic relaxations of the freestanding OQA layers lead to flatplanes, distorted from the initial orthorhombic lattice, with pa-rameters larger than the ones of the substrate. This result is inagreement with the literature, at least for the BaFeO3/Pt OQA.30
The B–O first neighbour distances are almost identical in all sys-tems (Tab. S8), due to the similarity of the transition metal (B)ionic radii, with only a weak systematic decrease along the transi-tion metal series. In contrast, the distances between the alkalineearth metals (A) and their oxygen neighbours (A–O distances) in-crease consistently with the A ionic radii (rCa > rSr > rBa).
The surface cell mismatch (∆) is defined as:
∆ =||~a∧~b||sub−||~a∧~b||free
||~a∧~b||sub(7)
where ~a and~b are the in-plane lattice vectors of the relaxed free-standing layer (labelled by subscript free) and of the substrate(sub). Cell mismatch can reach quite high values (up to 50 %). Itremains around 20 to 35% for a number of systems, being higherwhen the OQA layer is supported on Au rather than on Pt or Pd.
With respect to the perfectly planar geometry of the free-standing films, supported OQAs display significant structural re-laxations, quantified by the vertical separation (rumpling, R =
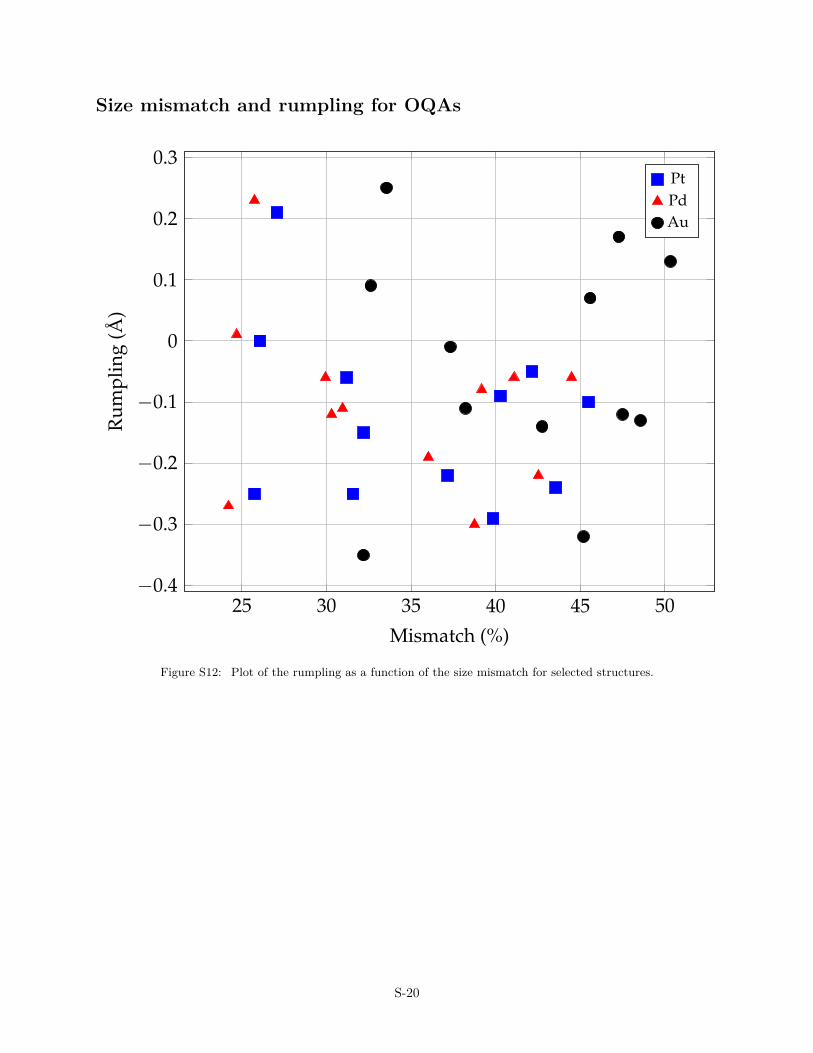
z+− z−) between the average z-position of the anions (z−) andcation (z+), where z-coordinate represents the surface normal di-rection. Overall, in most systems, on average, the cations arecloser to the substrate than the oxygen atoms, thus resulting innegative values for R. A more detailed analysis shows that theoxygen atoms are positioned either in one plane or in two planesseparated by about 1.4 Å (BaTiO3 OQA). The B–O and Ba–O dis-tances in the supported films are similar to the ones in the free-standing layer (but slightly longer by c.a. 0.05 Å and 0.11 Å,respectively). This is consistent with a contraction of interatomicdistances when the atomic coordination decreases.40 It also high-lights that lattice mismatches can be rather easily accommodatedby the rumpling of the film, the bending distortions being of muchlower energies than bond-length modifications.41 However, noclear correlation has been found between the surface cell mis-match and the rumpling (Fig. S12), suggesting that electronic ef-fects also influence the atomic structure of the OQAs.
3.2 Charge transfer
The structural distortions described in the previous section can beunderstood as a response to the electrostatic dipole produced bythe interface charge transfer.42,43 A negatively charged substrate(QMe < 0) attracts the cations and thus tends to produce a nega-tive rumpling (R < 0) whereas a positive rumpling is expected fora positive charging of the substrate. The negative rumpling calcu-lated for all investigated OQAs and SHSs series is then attributedto a charge transfer from the oxide film to the substrate. Thispicture is in agreement with the planar integrated charge densitydifferences, which indicates that the net electron charge is beingconcentrated in the oxide/metal bonding region with the predom-inant electron donation coming from the oxide layer (Figs. S13–S14).
The aforementioned hypothesis of the oxide–to–substratecharge transfer is also consistent with the Bader charge analy-sis (Tabs. S5–S7). While in the freestanding layer, the positivecharge of A- and B-type atoms originates from an “in plane” elec-tron transfer toward the more electronegative oxygen atoms, thepicture is slightly altered in the supported films, in which thecharge transfer also occurs towards the substrate. In compari-son to the freestanding film, the B-metal of supported OQAs andSHSs carry a higher positive charge, and the oxygen atoms havea less negative charge, thus leading to interfacial Me atoms car-rying an excess of electrons. The charge transfer decreases in thetransition metal series, but is similar for all considered substrates(Au, Pt, Pd). In contrast, the charges on the alkaline earth atoms(Ba, Sr, Ca) are quite constant (1.5–1.6 e), suggesting that theyonly weakly participate to the oxide/metal interaction.
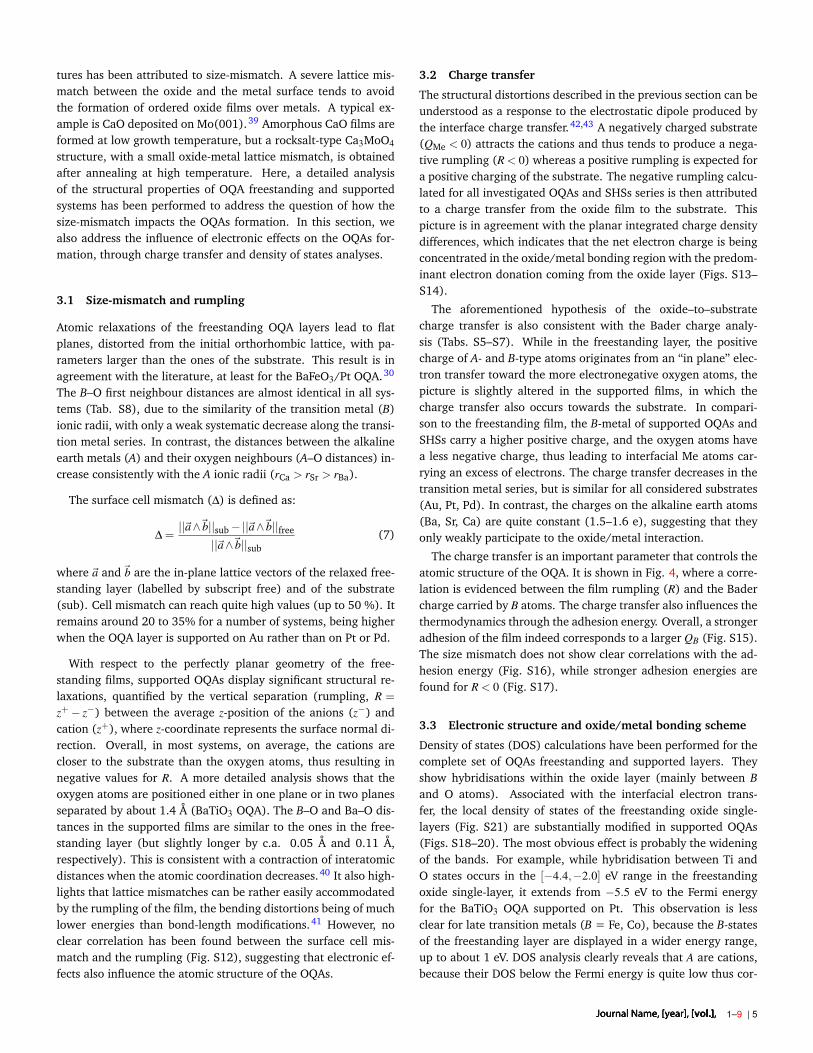
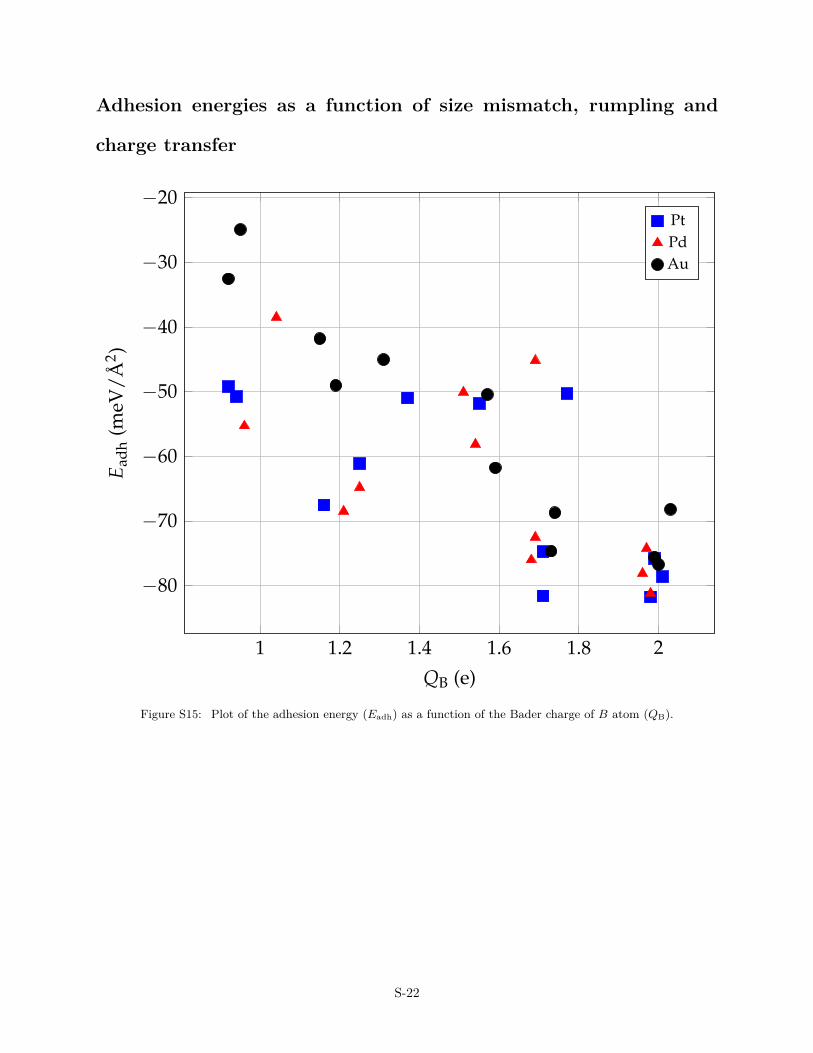
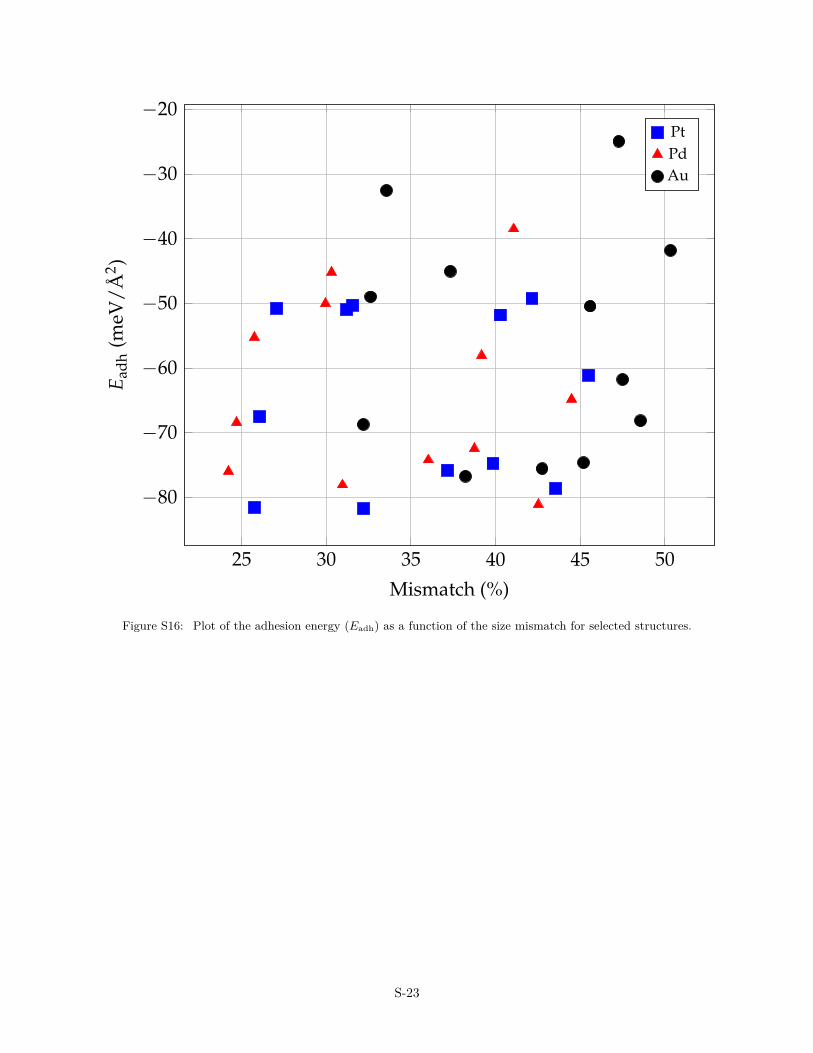
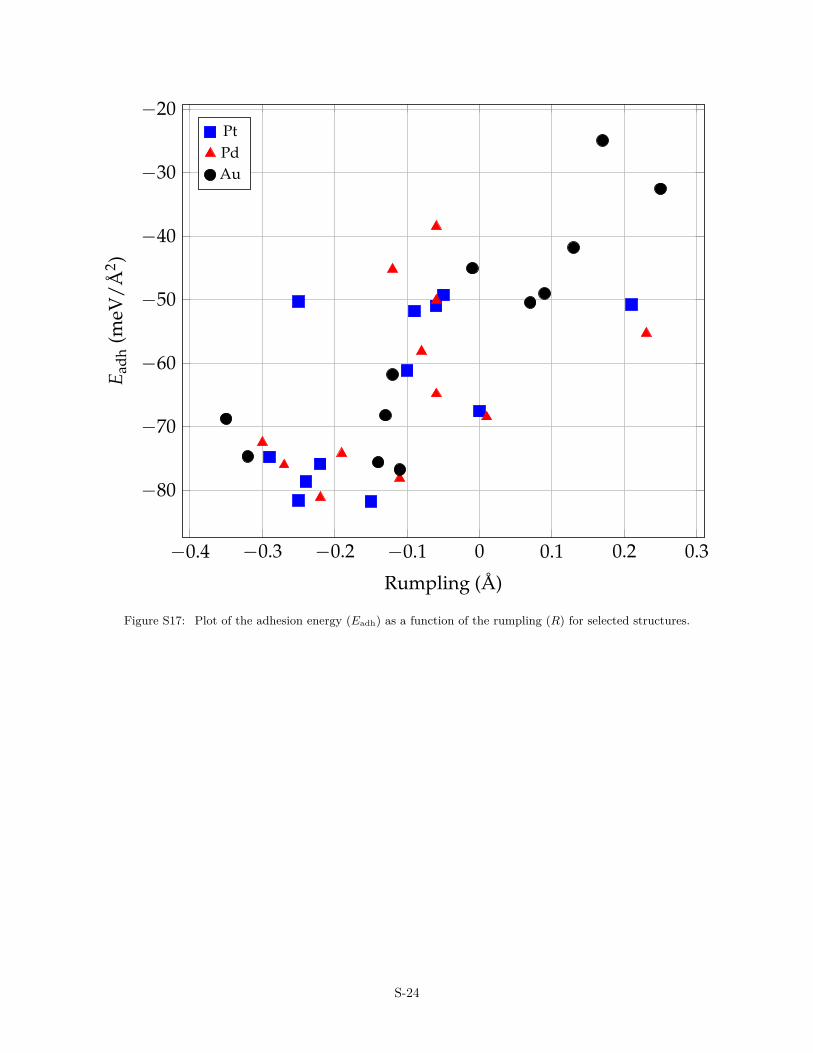
The charge transfer is an important parameter that controls theatomic structure of the OQA. It is shown in Fig. 4, where a corre-lation is evidenced between the film rumpling (R) and the Badercharge carried by B atoms. The charge transfer also influences thethermodynamics through the adhesion energy. Overall, a strongeradhesion of the film indeed corresponds to a larger QB (Fig. S15).The size mismatch does not show clear correlations with the ad-hesion energy (Fig. S16), while stronger adhesion energies arefound for R < 0 (Fig. S17).
3.3 Electronic structure and oxide/metal bonding scheme
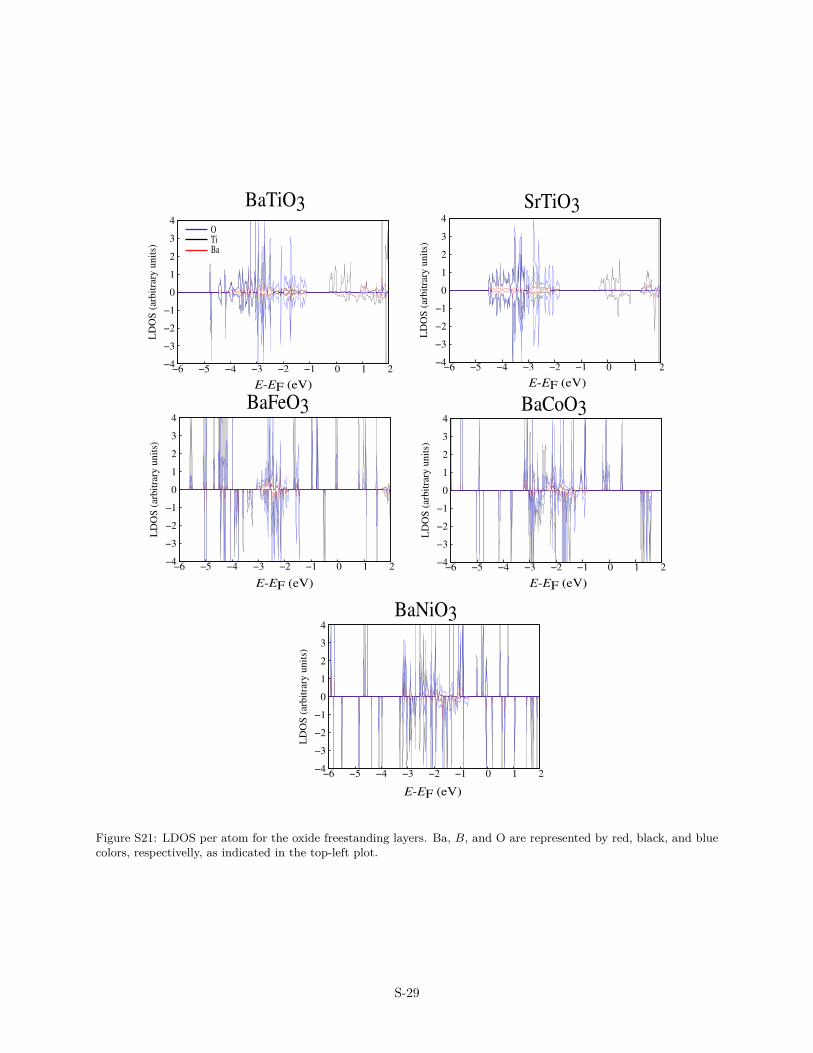
Density of states (DOS) calculations have been performed for thecomplete set of OQAs freestanding and supported layers. Theyshow hybridisations within the oxide layer (mainly between Band O atoms). Associated with the interfacial electron trans-fer, the local density of states of the freestanding oxide single-layers (Fig. S21) are substantially modified in supported OQAs(Figs. S18–20). The most obvious effect is probably the wideningof the bands. For example, while hybridisation between Ti andO states occurs in the [−4.4,−2.0] eV range in the freestandingoxide single-layer, it extends from −5.5 eV to the Fermi energyfor the BaTiO3 OQA supported on Pt. This observation is lessclear for late transition metals (B = Fe, Co), because the B-statesof the freestanding layer are displayed in a wider energy range,up to about 1 eV. DOS analysis clearly reveals that A are cations,because their DOS below the Fermi energy is quite low thus cor-
Journal Name, [year], [vol.], 1–9 | 5
0.8 1 1.2 1.4 1.6 1.8 2
−0.4
−0.2
0
0.2
0.4
QB (e)
Rum
plin
g(A
)
PtPdAu
Fig. 4 Plot of the film rumpling (R) as a function of the Bader chargecarried by B-type atoms (QB; note that positive QB values correspond tocations). The data located around QB = 1.8 and QB = 2.0 correspond toB=V and B=Ti, respectively.
roborating the Bader analysis. Their DOS becomes appreciableonly about 2 eV above the EF and beyond. Overall, the interac-tion with the substrate leads to OQAs with a metallic character,with a strong overlap between O- and B-states, indicating a stronginteraction. For BaTiO3/Pt, this is in agreement with the hybridis-ation of O-2p and Ti-3d states and with the occupied Ti-3d statesat EF that have been experimentally observed.44
Within the transition metal series, the spin-up contributionfrom the B-type atoms of the OQAs is progressively shifted awayfrom the Fermi energy, from Ti to Ni, in agreement with the fill-ing of d-states and the magnetic properties of the oxide layer.By combining the previous trends with the variations inducedby the different substrates, we can obtain insight into the Me–OQA interactions. The decreasing work function from Pt to Pd(WPt(111) = 5.644 eV and WPd(111) = 5.207 eV)45 shifts the metalFermi energy slightly upwards. This comes in addition to thebandwidth increase from 4d to 5d metals. As a consequence, theoverlap between the states of the oxide layer and the substrate,which is effective for BaTiO3 and BaVO3, start to be weaker fromB = Cr, in agreement with the predicted lower adhesion. Thiseffect is stronger for Me = Pd than for Me = Pt, in relation to thelarger bandwidth of Pt compared to Pd. The situation is slightlydifferent in the case of gold, since its d-band centre is significantlydownshifted and is located considerably below the Fermi energy.Here, the weaker Me–OQA interaction is attributed to the smalloverlap in the region just below EF (−2 eV ≤ E ≤ EF).
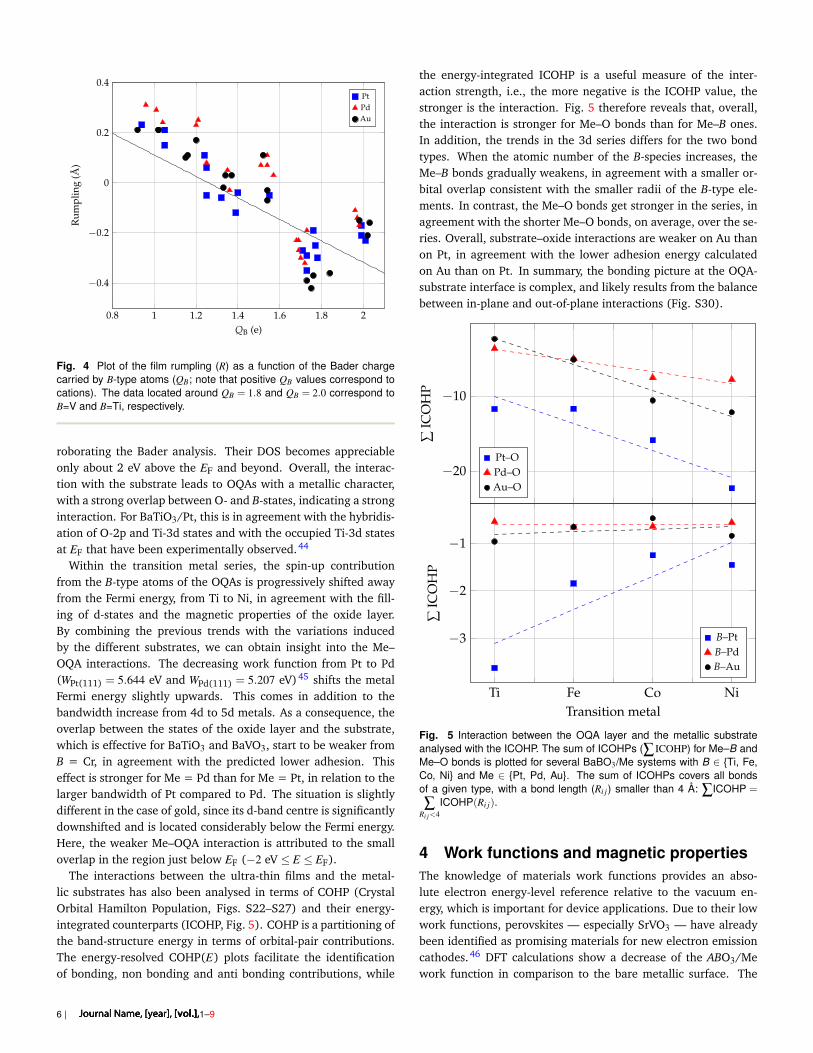
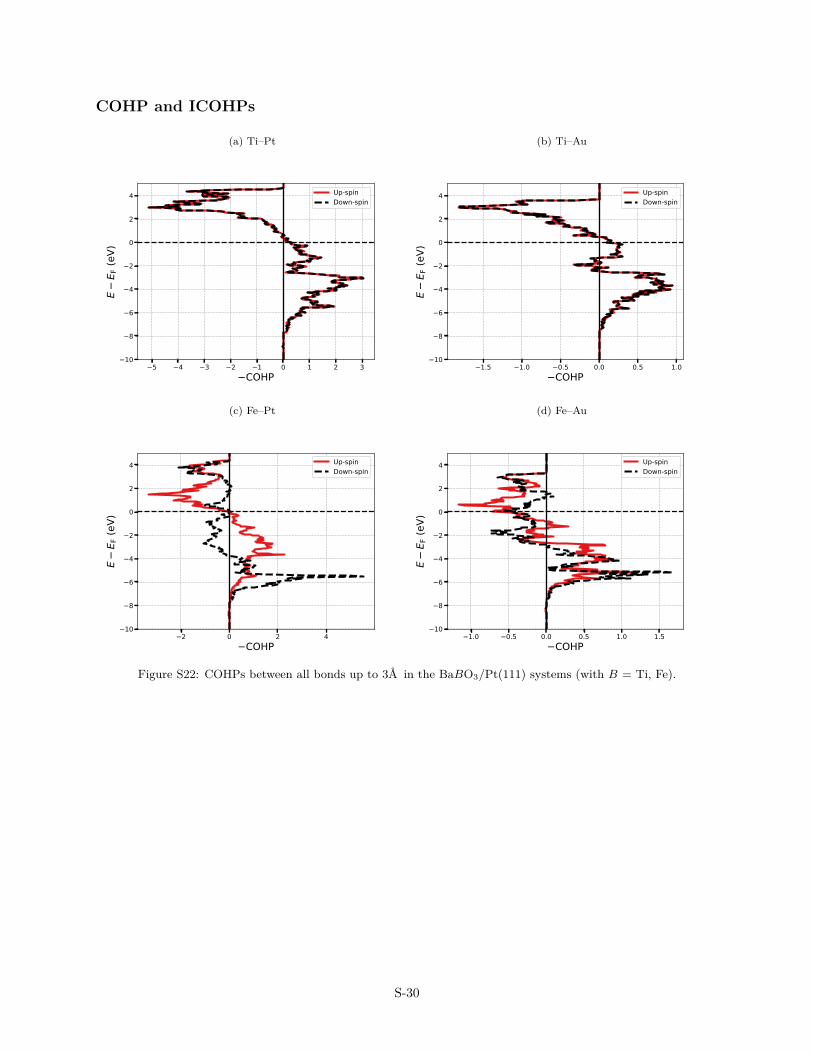
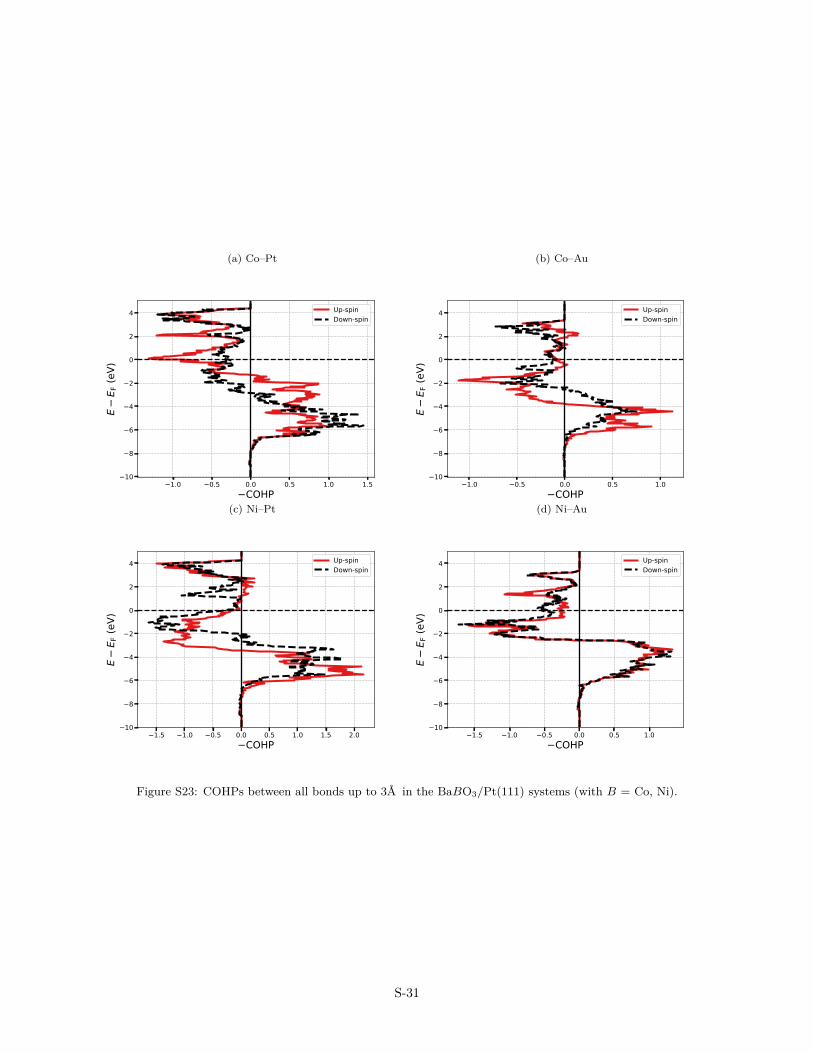
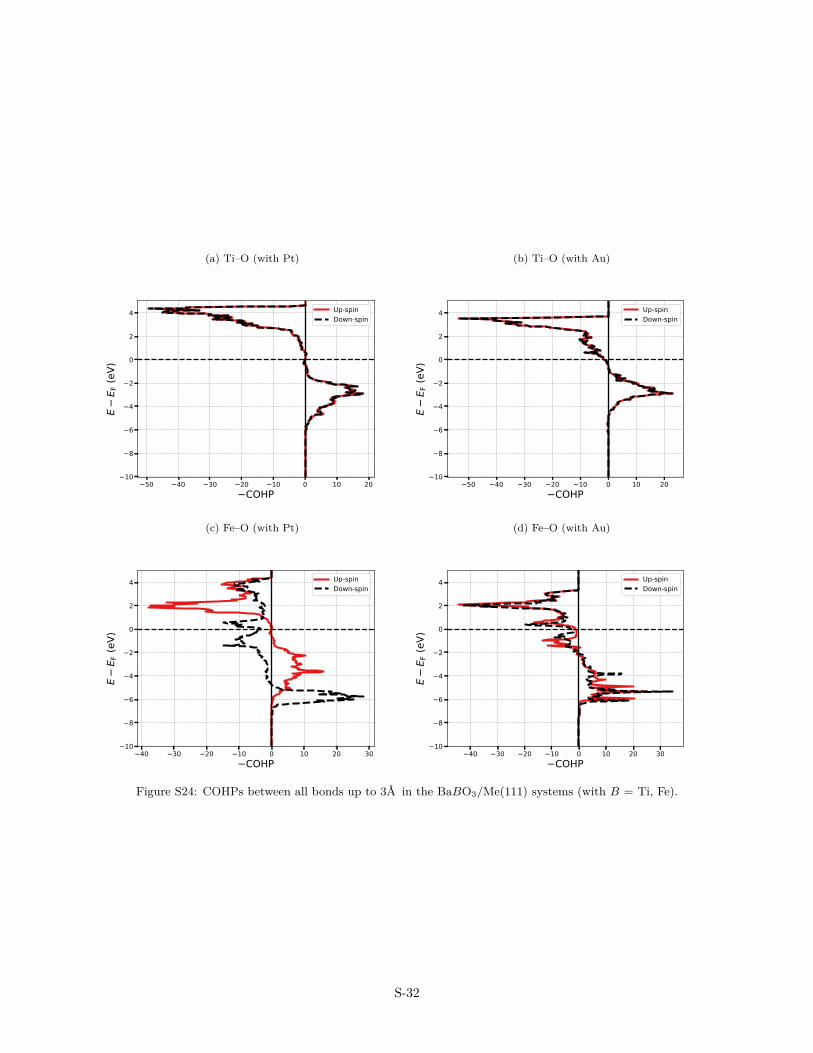
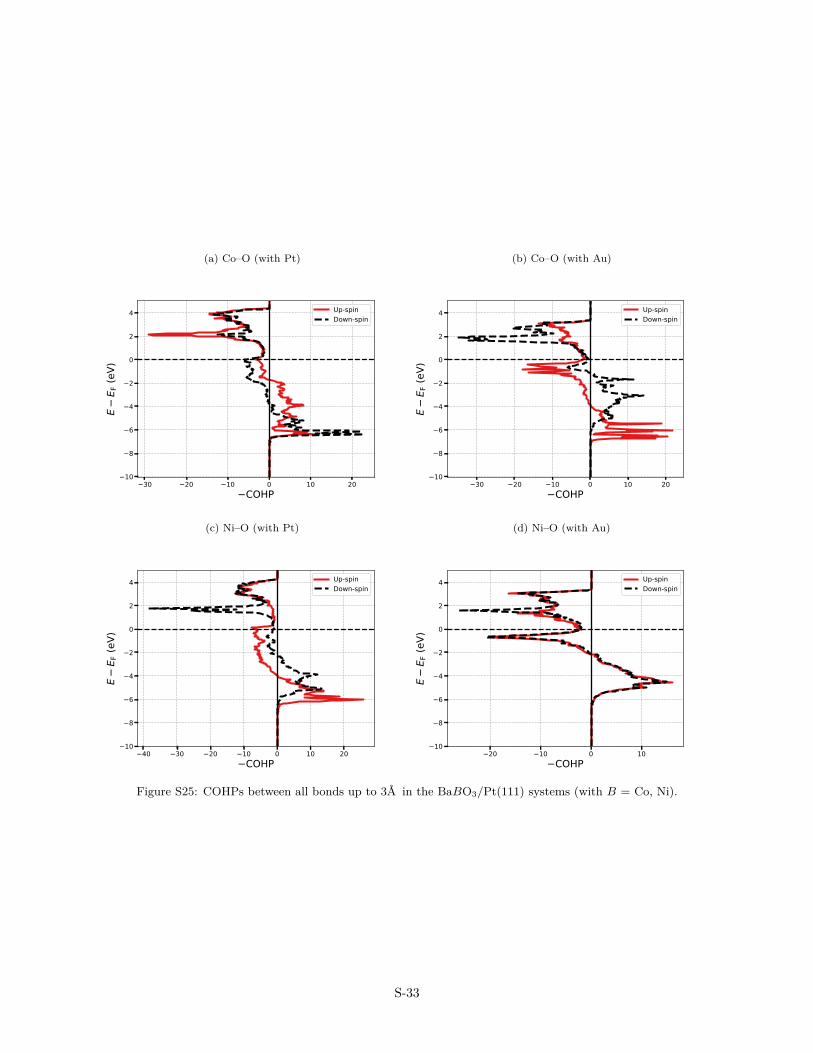
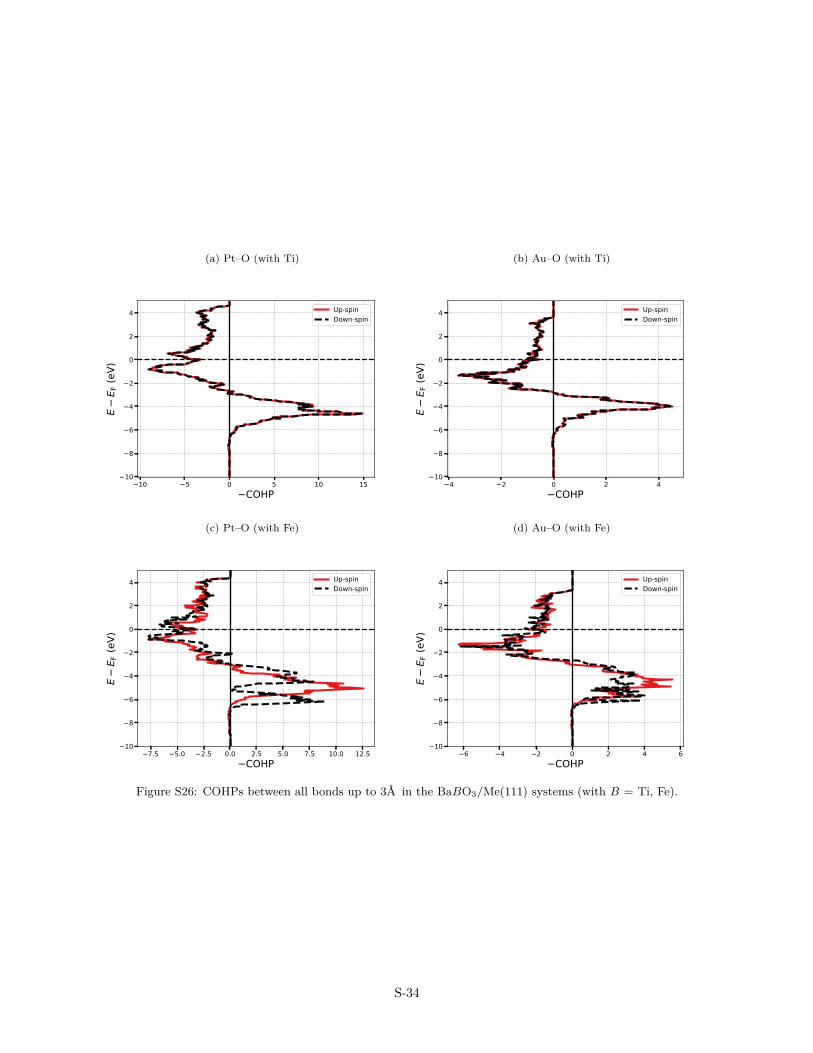
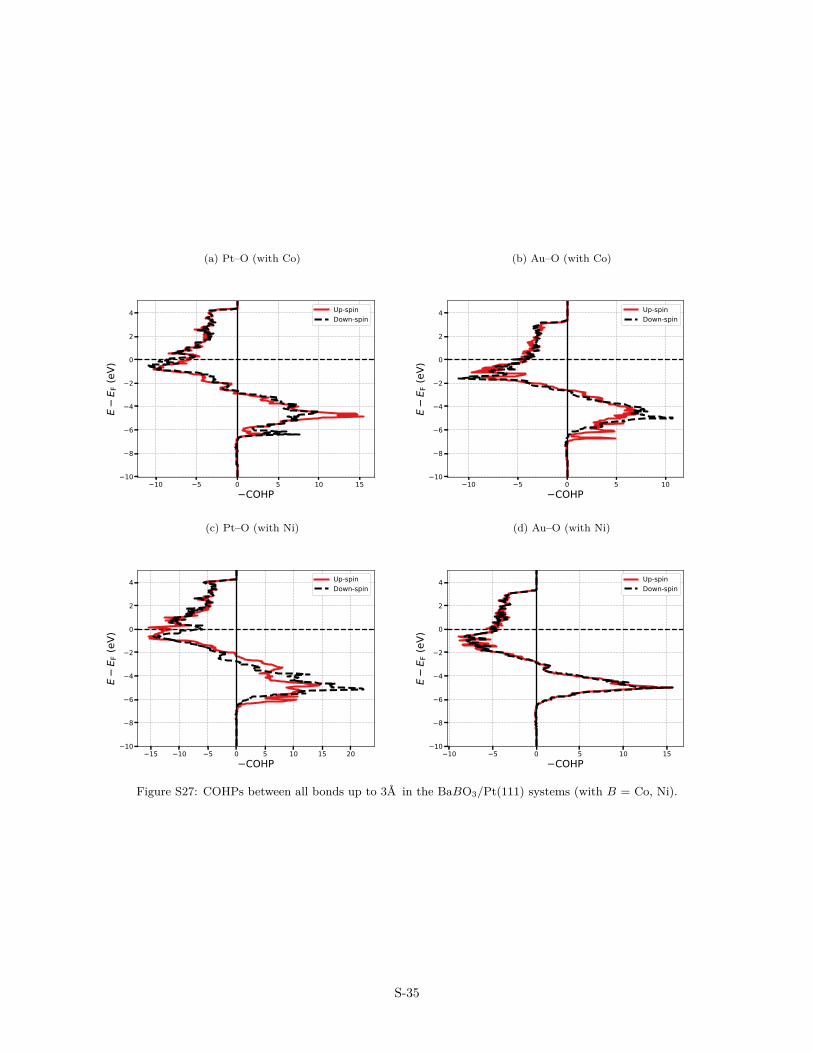
The interactions between the ultra-thin films and the metal-lic substrates has also been analysed in terms of COHP (CrystalOrbital Hamilton Population, Figs. S22–S27) and their energy-integrated counterparts (ICOHP, Fig. 5). COHP is a partitioning ofthe band-structure energy in terms of orbital-pair contributions.The energy-resolved COHP(E) plots facilitate the identificationof bonding, non bonding and anti bonding contributions, while
the energy-integrated ICOHP is a useful measure of the inter-action strength, i.e., the more negative is the ICOHP value, thestronger is the interaction. Fig. 5 therefore reveals that, overall,the interaction is stronger for Me–O bonds than for Me–B ones.In addition, the trends in the 3d series differs for the two bondtypes. When the atomic number of the B-species increases, theMe–B bonds gradually weakens, in agreement with a smaller or-bital overlap consistent with the smaller radii of the B-type ele-ments. In contrast, the Me–O bonds get stronger in the series, inagreement with the shorter Me–O bonds, on average, over the se-ries. Overall, substrate–oxide interactions are weaker on Au thanon Pt, in agreement with the lower adhesion energy calculatedon Au than on Pt. In summary, the bonding picture at the OQA-substrate interface is complex, and likely results from the balancebetween in-plane and out-of-plane interactions (Fig. S30).
Fig. 5 Interaction between the OQA layer and the metallic substrateanalysed with the ICOHP. The sum of ICOHPs (∑ ICOHP) for Me–B andMe–O bonds is plotted for several BaBO3/Me systems with B ∈ {Ti, Fe,Co, Ni} and Me ∈ {Pt, Pd, Au}. The sum of ICOHPs covers all bondsof a given type, with a bond length (Ri j) smaller than 4 Å: ∑ICOHP =
∑Ri j<4
ICOHP(Ri j).
4 Work functions and magnetic propertiesThe knowledge of materials work functions provides an abso-lute electron energy-level reference relative to the vacuum en-ergy, which is important for device applications. Due to their lowwork functions, perovskites — especially SrVO3 — have alreadybeen identified as promising materials for new electron emissioncathodes.46 DFT calculations show a decrease of the ABO3/Mework function in comparison to the bare metallic surface. The
6 | 1–9Journal Name, [year], [vol.],
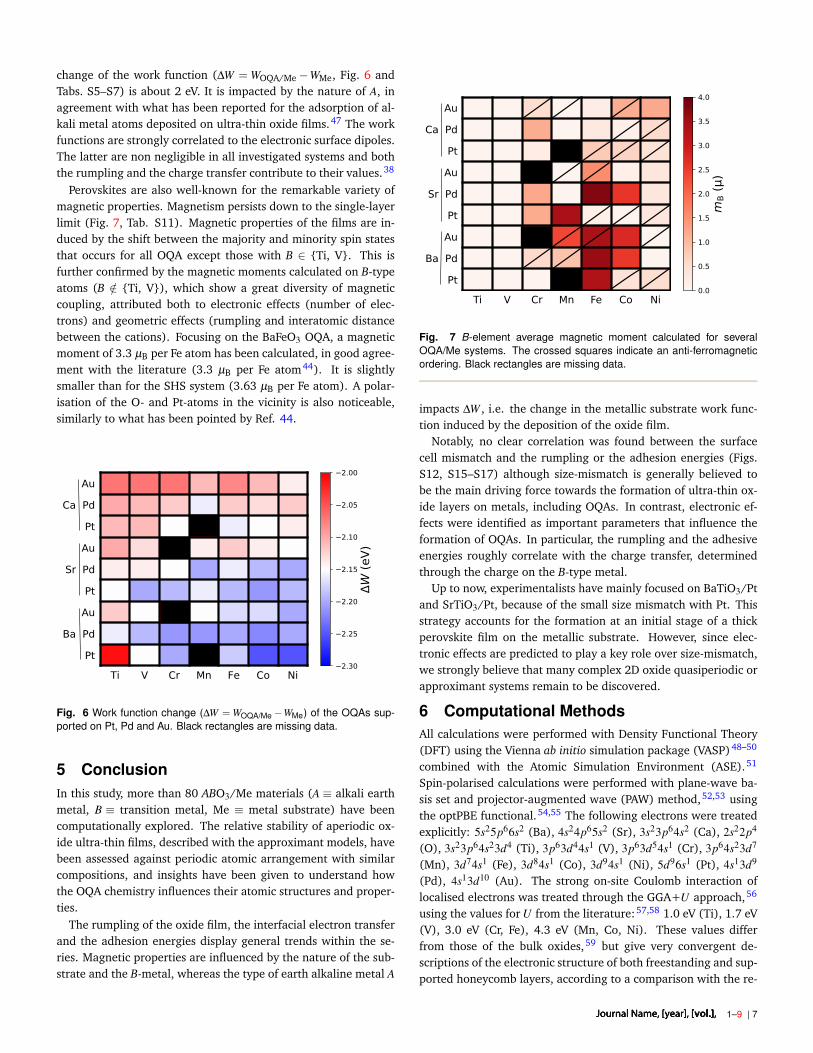
change of the work function (∆W = WOQA/Me−WMe, Fig. 6 andTabs. S5–S7) is about 2 eV. It is impacted by the nature of A, inagreement with what has been reported for the adsorption of al-kali metal atoms deposited on ultra-thin oxide films.47 The workfunctions are strongly correlated to the electronic surface dipoles.The latter are non negligible in all investigated systems and boththe rumpling and the charge transfer contribute to their values.38
Perovskites are also well-known for the remarkable variety ofmagnetic properties. Magnetism persists down to the single-layerlimit (Fig. 7, Tab. S11). Magnetic properties of the films are in-duced by the shift between the majority and minority spin statesthat occurs for all OQA except those with B ∈ {Ti, V}. This isfurther confirmed by the magnetic moments calculated on B-typeatoms (B /∈ {Ti, V}), which show a great diversity of magneticcoupling, attributed both to electronic effects (number of elec-trons) and geometric effects (rumpling and interatomic distancebetween the cations). Focusing on the BaFeO3 OQA, a magneticmoment of 3.3 µB per Fe atom has been calculated, in good agree-ment with the literature (3.3 µB per Fe atom44). It is slightlysmaller than for the SHS system (3.63 µB per Fe atom). A polar-isation of the O- and Pt-atoms in the vicinity is also noticeable,similarly to what has been pointed by Ref. 44.
Fig. 6 Work function change (∆W = WOQA/Me−WMe) of the OQAs sup-ported on Pt, Pd and Au. Black rectangles are missing data.
5 ConclusionIn this study, more than 80 ABO3/Me materials (A ≡ alkali earthmetal, B ≡ transition metal, Me ≡ metal substrate) have beencomputationally explored. The relative stability of aperiodic ox-ide ultra-thin films, described with the approximant models, havebeen assessed against periodic atomic arrangement with similarcompositions, and insights have been given to understand howthe OQA chemistry influences their atomic structures and proper-ties.
The rumpling of the oxide film, the interfacial electron transferand the adhesion energies display general trends within the se-ries. Magnetic properties are influenced by the nature of the sub-strate and the B-metal, whereas the type of earth alkaline metal A
Fig. 7 B-element average magnetic moment calculated for severalOQA/Me systems. The crossed squares indicate an anti-ferromagneticordering. Black rectangles are missing data.
impacts ∆W , i.e. the change in the metallic substrate work func-tion induced by the deposition of the oxide film.
Notably, no clear correlation was found between the surfacecell mismatch and the rumpling or the adhesion energies (Figs.S12, S15–S17) although size-mismatch is generally believed tobe the main driving force towards the formation of ultra-thin ox-ide layers on metals, including OQAs. In contrast, electronic ef-fects were identified as important parameters that influence theformation of OQAs. In particular, the rumpling and the adhesiveenergies roughly correlate with the charge transfer, determinedthrough the charge on the B-type metal.
Up to now, experimentalists have mainly focused on BaTiO3/Ptand SrTiO3/Pt, because of the small size mismatch with Pt. Thisstrategy accounts for the formation at an initial stage of a thickperovskite film on the metallic substrate. However, since elec-tronic effects are predicted to play a key role over size-mismatch,we strongly believe that many complex 2D oxide quasiperiodic orapproximant systems remain to be discovered.
6 Computational MethodsAll calculations were performed with Density Functional Theory(DFT) using the Vienna ab initio simulation package (VASP)48–50
combined with the Atomic Simulation Environment (ASE).51
Spin-polarised calculations were performed with plane-wave ba-sis set and projector-augmented wave (PAW) method,52,53 usingthe optPBE functional.54,55 The following electrons were treatedexplicitly: 5s25p66s2 (Ba), 4s24p65s2 (Sr), 3s23p64s2 (Ca), 2s22p4
(O), 3s23p64s23d4 (Ti), 3p63d44s1 (V), 3p63d54s1 (Cr), 3p64s23d7
(Mn), 3d74s1 (Fe), 3d84s1 (Co), 3d94s1 (Ni), 5d96s1 (Pt), 4s13d9
(Pd), 4s13d10 (Au). The strong on-site Coulomb interaction oflocalised electrons was treated through the GGA+U approach,56
using the values for U from the literature:57,58 1.0 eV (Ti), 1.7 eV(V), 3.0 eV (Cr, Fe), 4.3 eV (Mn, Co, Ni). These values differfrom those of the bulk oxides,59 but give very convergent de-scriptions of the electronic structure of both freestanding and sup-ported honeycomb layers, according to a comparison with the re-
Journal Name, [year], [vol.], 1–9 | 7
sults obtained using the hybrid HSE03 exchange-correlation func-tional.38,57 The one-electron Kohn-Sham orbitals were expandedin a plane-wave basis set with a kinetic energy cutoff of 500 eV.Total energies were minimised until the energy differences wereless than 10−5 eV between two electronic cycles. The recipro-cal space integration was approximated with a Monkhorst-Packk-point grid of 3×3×1 and 6×6×1 (surface cell 14.107 Å× 14.660Å) for the structural relaxations and the density of state calcula-tions for the approximant structures, respectively. For the cubicperovskites and honeycomb slabs we used a 8×4×1 (surface cell5.643 Å × 9.760 Å) respectively, and 8×8×1 (surface cell 5.643 Å× 5.643 Å) for the hexagonal perovskite slabs.
The ABO3/Me(111) systems have been built using 5-layer thickasymmetric slabs consisting of four Me(111) layers and oneoxide-layer with the approximant structure shown in Fig. 1 anddetailed in Ref. 14. Adjacent slabs (along the surface normal di-rection) were separated by 20 Å of vacuum and a dipole correc-tion was applied to cancel an artificial electric field that developsdue to imposed periodic boundary conditions in surface normaldirection. All atomic positions, with the exception of the bottomlayer of Me, were relaxed using the Conjugate Gradient Algorithmuntil all forces were less than 0.05 eV/Å2 (Pt and Pd substrates)and 0.1 eV/Å2 (Au substrate). This set-up gives cohesive energiesand lattice parameters of bulk systems in good agreement withthe experimental data (Tab. S9–S10).
Conflicts of interestThere are no conflicts to declare.
AcknowledgementsT.T.D. acknowledges the French PIA project “Lorraine Universitéd’Excellence” (ANR-15-IDEX-04-LUE) for financial support. Theauthors thank Vincent Fournée, Julian Ledieu and Muriel Sicotfor fruitful discussions. This work is supported by the EuropeanIntegrated Center for the Development of New Metallic Alloysand Compounds. E.G. acknowledge financial support throughthe COMETE project (COnception in silico de Matériaux pourl’EnvironnemenT et l’Énergie) co-funded by the European Unionunder the program FEDER-FSE Lorraine et Massif des Vosges2014-2020. This work was granted access to the HPC resourcesof TGCC, CINES and IDRIS under the allocation 99642 attributedby GENCI (Grand Equipement National de Calcul Intensif). HighPerformance Computing resources were also partially provided bythe EXPLOR centre hosted by the University de Lorraine (project2017M4XXX0108).
References1 W. Li, R. Jacobs and D. Morgan, Comp. Mater. Sci., 2018, 150,
454–463.2 C. Heard, J. Cejka, M. Opanasenko, P. Nachtigall, G. Centi
and S. Perathoner, Adv. Mater., 2019, 31, 1801712.3 D. Ji, S. Cai, T. R. Paudel, H. Sun, C. Zhang, L. Han, Y. Wei,
Y. Zang, M. Gu, Y. Zhang, W. Gao, H. Huyan, W. Guo, D. Wu,Z. Gu, E. Y. Tsymbal, P. Wang, Y. Nie and X. Pan, Nature, 2019,570, 87–90.
4 S. Li, Y. Zhang, W. Yang, H. Liu and X. Fang, Adv. Mater., 2020,32, 1905443.
5 T. Tybell, P. Paruch, T. Giamarchi and J.-M. Triscone, Phys.Rev. Lett., 2002, 89, 097601.
6 G. Barcaro and A. Fortunelli, Phys. Chem. Chem. Phys., 2019,21, 11510.
7 Oxide Ultrathin Films: Science and Technology, ed. G. Pacchioniand S. Valeri, John Wiley & Sons, Weinheim, Germany, 2012.
8 C. Tan, X. Cao, X.-J. Wu, Q. He, J. Yang, X. Zhang, J. Chen,W. Zhao, S. Han, G.-H. Nam, M. Sindoro and H. Zhang, Chem.Rev., 2017, 117, 6225–6331.
9 F. Sedona, G. A. Rizzi, S. Agnoli, F. X. L. i Xamena, A. Papa-georgiou, D. Ostermann, M. Sambi, P. Finetti, K. Schierbaumand G. Granozzi, J. Phys. Chem. B, 2005, 109, 24411–24426.
10 F. Li, G. Parteder, F. Allegretti, C. Franchini, R. Podloucky,S. Surnev and F. P. Netzer, J. Phys.: Condens. Matter, 2009,21, 134008.
11 S. Surnev, G. Kresse, M. G. Ramsey and F. P. Netzer, Phys. Rev.Lett., 2001, 87, 086102.
12 G. Kresse, S. Surnev, M. Ramsey and F. Netzer, Surf. Sci., 2001,329, 329–344.
13 S. Förster, K. Meinel, R. Hammer, M. Trautmann and W. Wid-dra, Nature, 2013, 502, 216–218.
14 S. Förster, M. Trautmann, S. Roy, W. Adeagbo, E. Zollner,R. Hammer, F. Schumann, K. Meinel, S. Nayak, K. Mohseni,W. Hergert, H. Meyerhei and W. Widdra, Phys. Rev. Lett.,2016, 117, 095501.
15 S. Förster, J. Flege, E. Zollner, F. Schumann, R. Hammer,A. Bayat, K.-M. Schindler, K.-M. Falta and W. Widdra, Ann.Phys., 2017, 529, 1600250.
16 S. Schenk, S. Förster, K. Meinel, R. Hammer, B. Leibundgut,M. Paleschke, J. Pantzer, C. Dresler, F. O. Schumann andW. Widdra, J. Phys. Condens. Matter, 2017, 29, 134002.
17 M. Engel, P. F. Damasceno, C. L. Phillips and S. C. Glotzer,Nat. Mater., 2015, 14, 109–116.
18 W. Steurer, Acta Crystallogr. Sect. A : Found. Crystallogr., 2018,74, 1–11.
19 C. Janot, Quasicrystals, A Primer, Oxford Science Publications,Oxford, 1992, p. 187.
20 H. R. Sharma, K. Nozawa, J. A. Smerdon, P. J. Nugent,I. McLeod, V. R. Dhanak, M. Shimoda, Y. Ishii, A. P. Tsai andR. McGrath, Nat. Commun., 2013, 4, 2715.
21 J. Smerdon, L. Leung, J. Parle, C. Jenks, R. McGrath,V. Fournée and J. Ledieu, Surf. Sci., 2008, 602, 2496 – 2501.
22 J. Ledieu, M. Krajcí, J. Hafner, L. Leung, L. Wearing, R. Mc-Grath, T. Lograsso, D. Wu and V. Fournée, Phys. Rev. B, 2009,79, 165430.
23 M. Paens, V. Caciuc, N. Atodiresei, M. Feuerbacher, M. Moors,R. Dunin-Borkowski, S. Blugel, R. Waser and S. Karthaüser,Nat. Comm., 2017, 8, 15367.
24 D. Écija, J. I. Urgel, A. C. Papageorgiou, S. Joshi, W. Auwärter,A. P. Seitsonen, S. Klyatskaya, M. Ruben, S. Fischer, S. Vija-yaraghavan, J. Reichert and J. V. Barth, PNAS, 2013, 110,6678–6681.
8 | 1–9Journal Name, [year], [vol.],
25 L. Voigt, M. Kubus and K. S. Pedersen, Nat. Comm., 2020, 11,4705.
26 A. R. Smith, K.-J. Chao, Q. Niu and C.-K. Shih, Science, 1996,273, 226–228.
27 H. L. Meyerheim and F. Klimenta and A. Ernst and K. Mohseniand S. Ostanin and M. Fechner and S. Parihar and I. V.Maznichenko and I. Mertig and J. Kirschner, Phys. Rev. Lett.,2011, 106, 087203.
28 H. L. Meyerheim, A. Ernst, K. Mohseni, I. V. Maznichenko,J. Henk, S. Ostanin, N. Jedrecy, F. Klimenta, J. Zegenhagen,C. Schlueter, I. Mertig and J. Kirschner, Phys. Rev. Lett., 2013,111, 105501.
29 E. Cockayne, M. Mihalkovic and C. L. Henley, Phys. Rev. B,2016, 93, 020101.
30 W. A. Adeagbo, I. V. Maznichenko, H. BenHamed, I. Mertig,A. Ernst and W. Hergert, Phys. Status Solid B, 2020, 257,1900649.
31 S. Förster and W. Widdra, in Oxide Materials at the Two-Dimensional Limit, Springer, Switzerland, F. P. Netzer and A.Fortunelli edn, 2016, ch. Ultrathin Perovskites: From BulkStructures to New Interface Concepts.
32 C. Wu, M. R. Castell, J. Goniakowski and C. Noguera, Phys.Rev. B, 2015, 91, 155424.
33 S. Wang, J. Goniakowski, C. Noguera and M. R. Castell, Phys.Rev. B, 2019, 100, 125408.
34 S. Pomp, D. Kuhness, G. Barcaro, L. Sementa, V. Mankad,A. Fortunelli, M. Sterrer, F. P. Netzer and S. Surnev, J. Phys.Chem. C, 2016, 120, 7629–7638.
35 C. Moller, H. Fedderwitz, C. Noguera, J. Goniakowski andN. Niliu, Phys.Chem.Chem.Phys., 2018, 20, 5636.
36 S. Förster and W. Widdra, Surf. Sci., 2010, 604, 2163–2169.37 A. Kokalj, J. Mol. Graphics and Modell., 1999, 17, 176–179.38 J. Goniakowski and C. Noguera, J. Phys. Chem. C, 2020, 124,
8186–8197.39 X. Shao and N. Nilius and P. Myrach and H. J. Freund and
U. Martinez and S. Prada and L. Giordano and G. Pacchioni,Phys. Rev. B, 2011, 83, 245407.
40 C. Noguera, Physics and Chemistry at Oxide Surfaces, Cam-bridge University Press, Cambridge, 2005.
41 J. Goniakowski and C. Noguera, J. Phys. Chem. C, 2019, 123,9272–9281.
42 J. Goniakowski and C. Noguera, Phys. Rev. B, 2009, 79,155433.
43 J. Goniakowski, C. Noguera, L. Giordano and G. Pacchioni,Phys. Rev. B, 2009, 80, 125403.
44 C.-T. Chiang and M. Ellguth and F. O. Schumann and Ch.Tusche and R. Kraska and S. Förster and W. Widdra, Phys.Rev. B, 2019, 100, 125149.
45 R. Tran, X.-G. Li, J. H. Montoya, D. Winston, K. A. Persson andS. P. Ong, Surf. Sci., 2019, 687, 48–55.
46 R. Jacobs, B. Zheng, B. Puchala, P. M. Voyles, A. B. Yankovichand D. Morgan, J. Phys. Chem. Letters, 2016, 7, 4483–4487.
47 U. Martinez, L. Giordano and G. Pacchioni, J. Chem. Phys.,2008, 128, 164707.
48 G. Kresse and J. Hafner, Phys. Rev. B, 1993, 47, 558–561.49 G. Kresse and J. Furthmüller, Phys. Rev. B, 1996, 54, 11169 –
11186.50 G. Kresse and J. Furthmüller, Comput. Mater. Sci., 1996, 6,
15–50.51 A. H. Larsen, J. J. Mortensen, J. Blomqvist, I. E. Castelli,
R. Christensen, M. Dulak, J. Friis, M. N. Groves, B. Ham-mer, C. Hargus, E. D. Hermes, P. C. Jennings, P. B. Jensen,J. Kermode, J. R. Kitchin, E. L. Kolsbjerg, J. Kubal, K. Kaas-bjerg, S. Lysgaard, J. B. Maronsson, T. Maxson, T. Olsen,L. Pastewka, A. Peterson, C. Rostgaard, J. Schiotz, O. Schütt,M. Strange, K. S. Thygesen, T. Vegge, L. Vilhelmsen, M. Wal-ter, Z. Zeng and K. W. Jacobsen, J. of Phys.: Condens. Matter,2017, 29, 273002.
52 P. E. Blochl, Phys. Rev. B, 1994, 50, 17953–17979.53 G. Kresse and D. Joubert, Phys. Rev. B, 1999, 59, 1758–1775.54 J. Klimeš, D. R. Bowler and A. Michaelides, J. Phys.: Condens.
Mat., 2010, 22, 022201.55 J. Klimeš, D. R. Bowler and A. Michaelides, Phys. Rev. B, 2011,
83, 195131.56 S. L. Dudarev, G. A. Botton, S. Y. Savrasov, C. J. Humphreys
and A. P. Sutton, Phys. Rev. B, 1998, 57, 1505.57 J. Goniakowski and C. Noguera, J. Phys. Chem. C, 2018, 123,
7898–7910.58 O. Köksal, S. Baidya and R. Pentcheva, Phys. Rev. B, 2018, 97,
035126.59 G. Barcaro, I. O. Thomas and A. Fortunelli, J. Chem. Phys.,
2010, 132, 124703.
Journal Name, [year], [vol.], 1–9 | 9
Two-dimentional oxide quasicrystal approximants
with tunable electronic and magnetic properties
Supporting informationThiago T. Dorinia,b, Florian Brixa,b, Corentin Chateliera,b, Anton Kokaljb,c, Emilie Gaudry∗a,b
Structure of the OQA/Me
Figure S1: Top and side views of the relaxed BaTiO3/Pt(111) structure.
a Universite de Lorraine, CNRS, Institut Jean Lamour – UMR 7198, F-54011, Nancy, France. E-mail: [email protected]
b International Associated Laboratory PACS2, CNRS Universite de Lorraine, Nancy, Francec Jozef Stefan Institute, Jamova cesta 39, 1000 Ljubljana, SloveniaaUniversite de Lorraine, CNRS, Institut Jean Lamour – UMR 7198, F-54011, Nancy, France. E-mail:
[email protected] Associated Laboratory PACS2, CNRS Universite de Lorraine, Nancy, FrancecJozef Stefan Institute, Jamova cesta 39, 1000 Ljubljana, Slovenia
S-1
Formation enthalpies
Freestanding layers
Reaction 0 (r0): Oxide Quasicrystal Approximant (OQA): 5/2 Ba + 4B + 6O2 → Ba5B4O12
Reaction 0’ (r′0): Single-layer Oxide Honeycomb Structure (SHS) : Ba + 4B + 3O2 → BaB4O6
Table S1: Formation enthalpies (T = 0 K) of the freestanding layers.
BaTiO3 SrTiO3 BaFeO3 BaCoO3 BaNiO3
OQA∆Hf (eV/at.) −2.02 −2.04 −1.14 −1.12 −0.84
SHS∆Hf (eV/at.) −1.05 −1.20 0.00 −0.40 0.38
BaTiO3 SrTiO3 BaFeO3 BaCoO3 BaNiO3Structures
Approx
Honey
Type
of o
xide
2.0
1.5
1.0
0.5
0.0
0.5
Hf (
eV/a
t.)
Figure S2: Formation enthalpies (T = 0 K), according to r0 and r’0.
S-2
Supported layers
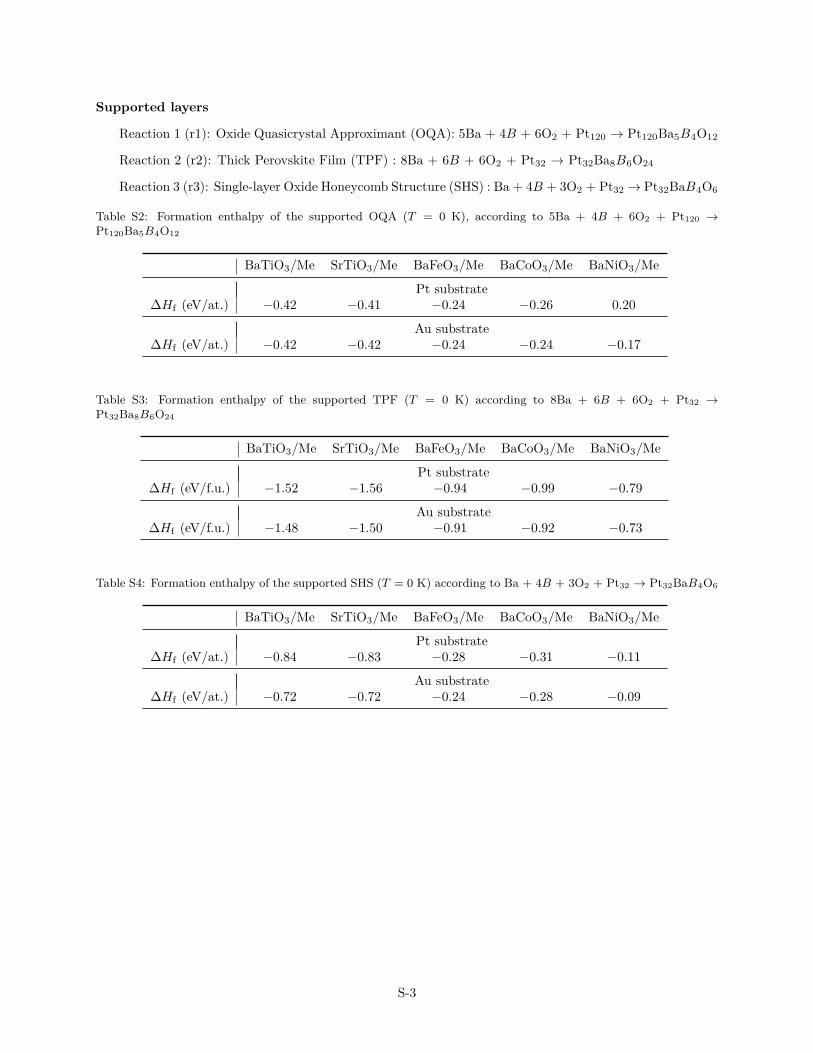
Reaction 1 (r1): Oxide Quasicrystal Approximant (OQA): 5Ba + 4B + 6O2 + Pt120 → Pt120Ba5B4O12
Reaction 2 (r2): Thick Perovskite Film (TPF) : 8Ba + 6B + 6O2 + Pt32 → Pt32Ba8B6O24
Reaction 3 (r3): Single-layer Oxide Honeycomb Structure (SHS) : Ba + 4B + 3O2 + Pt32→ Pt32BaB4O6
Table S2: Formation enthalpy of the supported OQA (T = 0 K), according to 5Ba + 4B + 6O2 + Pt120 →Pt120Ba5B4O12
BaTiO3/Me SrTiO3/Me BaFeO3/Me BaCoO3/Me BaNiO3/Me
Pt substrate∆Hf (eV/at.) −0.42 −0.41 −0.24 −0.26 0.20
Au substrate∆Hf (eV/at.) −0.42 −0.42 −0.24 −0.24 −0.17
Table S3: Formation enthalpy of the supported TPF (T = 0 K) according to 8Ba + 6B + 6O2 + Pt32 →Pt32Ba8B6O24
BaTiO3/Me SrTiO3/Me BaFeO3/Me BaCoO3/Me BaNiO3/Me
Pt substrate∆Hf (eV/f.u.) −1.52 −1.56 −0.94 −0.99 −0.79
Au substrate∆Hf (eV/f.u.) −1.48 −1.50 −0.91 −0.92 −0.73
Table S4: Formation enthalpy of the supported SHS (T = 0 K) according to Ba + 4B + 3O2 + Pt32 → Pt32BaB4O6
BaTiO3/Me SrTiO3/Me BaFeO3/Me BaCoO3/Me BaNiO3/Me
Pt substrate∆Hf (eV/at.) −0.84 −0.83 −0.28 −0.31 −0.11
Au substrate∆Hf (eV/at.) −0.72 −0.72 −0.24 −0.28 −0.09
S-3
BaTiO3 SrTiO3 BaFeO3 BaCoO3 BaNiO3Structures
Bulk
Approx
Honey
Type
of o
xide
2.00
1.75
1.50
1.25
1.00
0.75
0.50
0.25
0.00
Hf (
eV/a
t.)
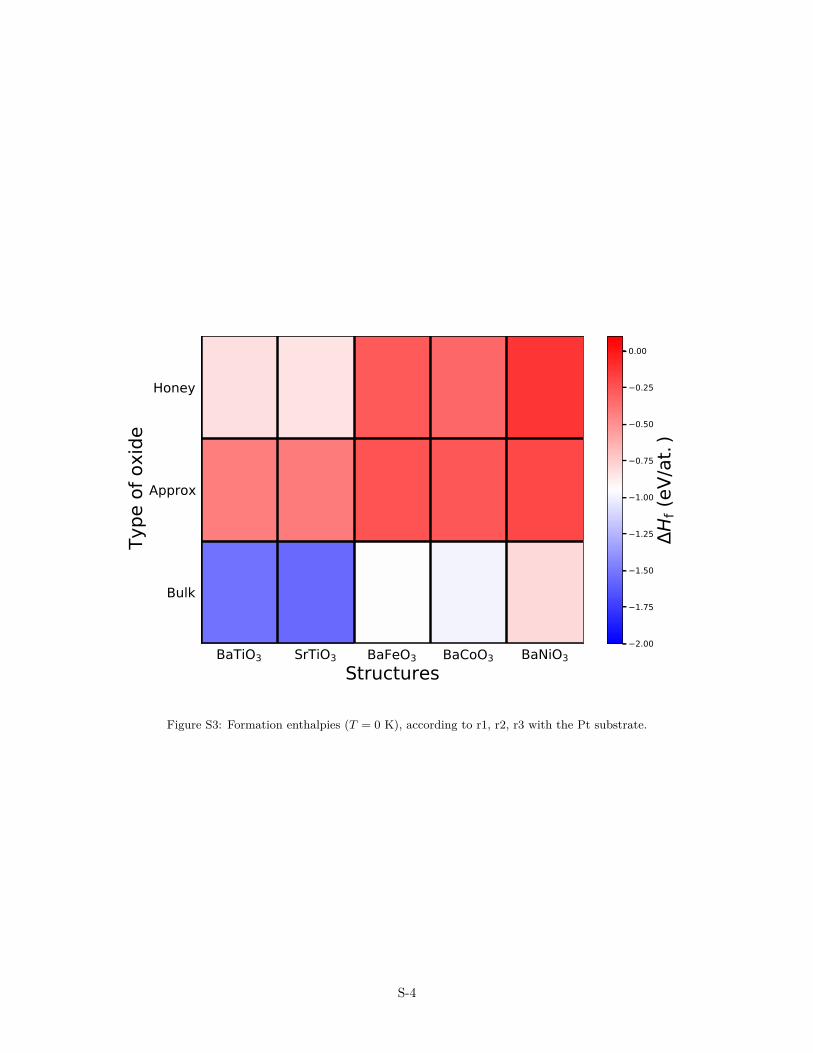
Figure S3: Formation enthalpies (T = 0 K), according to r1, r2, r3 with the Pt substrate.
S-4

Properties of OQA films
S-5
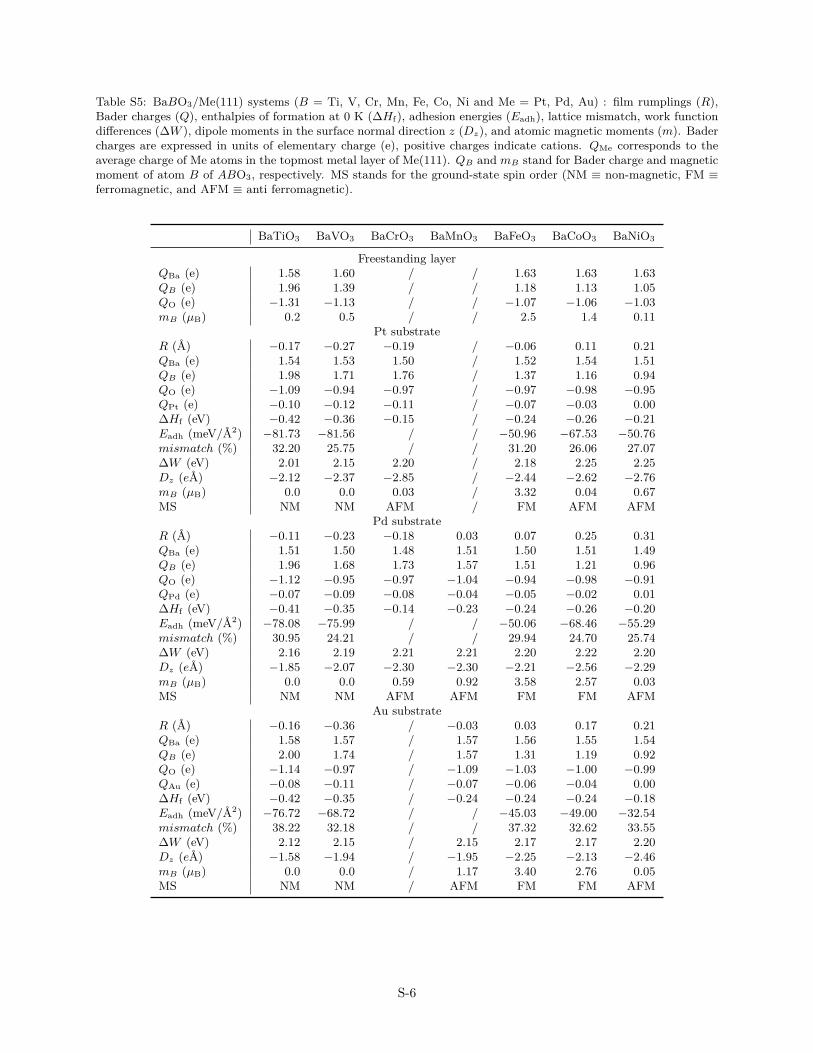
Table S5: BaBO3/Me(111) systems (B = Ti, V, Cr, Mn, Fe, Co, Ni and Me = Pt, Pd, Au) : film rumplings (R),Bader charges (Q), enthalpies of formation at 0 K (∆Hf), adhesion energies (Eadh), lattice mismatch, work functiondifferences (∆W ), dipole moments in the surface normal direction z (Dz), and atomic magnetic moments (m). Badercharges are expressed in units of elementary charge (e), positive charges indicate cations. QMe corresponds to theaverage charge of Me atoms in the topmost metal layer of Me(111). QB and mB stand for Bader charge and magneticmoment of atom B of ABO3, respectively. MS stands for the ground-state spin order (NM ≡ non-magnetic, FM ≡ferromagnetic, and AFM ≡ anti ferromagnetic).
BaTiO3 BaVO3 BaCrO3 BaMnO3 BaFeO3 BaCoO3 BaNiO3
Freestanding layerQBa (e) 1.58 1.60 / / 1.63 1.63 1.63QB (e) 1.96 1.39 / / 1.18 1.13 1.05QO (e) −1.31 −1.13 / / −1.07 −1.06 −1.03mB (µB) 0.2 0.5 / / 2.5 1.4 0.11
Pt substrateR (A) −0.17 −0.27 −0.19 / −0.06 0.11 0.21QBa (e) 1.54 1.53 1.50 / 1.52 1.54 1.51QB (e) 1.98 1.71 1.76 / 1.37 1.16 0.94QO (e) −1.09 −0.94 −0.97 / −0.97 −0.98 −0.95QPt (e) −0.10 −0.12 −0.11 / −0.07 −0.03 0.00∆Hf (eV) −0.42 −0.36 −0.15 / −0.24 −0.26 −0.21Eadh (meV/A2) −81.73 −81.56 / / −50.96 −67.53 −50.76mismatch (%) 32.20 25.75 / / 31.20 26.06 27.07∆W (eV) 2.01 2.15 2.20 / 2.18 2.25 2.25Dz (eA) −2.12 −2.37 −2.85 / −2.44 −2.62 −2.76mB (µB) 0.0 0.0 0.03 / 3.32 0.04 0.67MS NM NM AFM / FM AFM AFM
Pd substrateR (A) −0.11 −0.23 −0.18 0.03 0.07 0.25 0.31QBa (e) 1.51 1.50 1.48 1.51 1.50 1.51 1.49QB (e) 1.96 1.68 1.73 1.57 1.51 1.21 0.96QO (e) −1.12 −0.95 −0.97 −1.04 −0.94 −0.98 −0.91QPd (e) −0.07 −0.09 −0.08 −0.04 −0.05 −0.02 0.01∆Hf (eV) −0.41 −0.35 −0.14 −0.23 −0.24 −0.26 −0.20Eadh (meV/A2) −78.08 −75.99 / / −50.06 −68.46 −55.29mismatch (%) 30.95 24.21 / / 29.94 24.70 25.74∆W (eV) 2.16 2.19 2.21 2.21 2.20 2.22 2.20Dz (eA) −1.85 −2.07 −2.30 −2.30 −2.21 −2.56 −2.29mB (µB) 0.0 0.0 0.59 0.92 3.58 2.57 0.03MS NM NM AFM AFM FM FM AFM
Au substrateR (A) −0.16 −0.36 / −0.03 0.03 0.17 0.21QBa (e) 1.58 1.57 / 1.57 1.56 1.55 1.54QB (e) 2.00 1.74 / 1.57 1.31 1.19 0.92QO (e) −1.14 −0.97 / −1.09 −1.03 −1.00 −0.99QAu (e) −0.08 −0.11 / −0.07 −0.06 −0.04 0.00∆Hf (eV) −0.42 −0.35 / −0.24 −0.24 −0.24 −0.18Eadh (meV/A2) −76.72 −68.72 / / −45.03 −49.00 −32.54mismatch (%) 38.22 32.18 / / 37.32 32.62 33.55∆W (eV) 2.12 2.15 / 2.15 2.17 2.17 2.20Dz (eA) −1.58 −1.94 / −1.95 −2.25 −2.13 −2.46mB (µB) 0.0 0.0 / 1.17 3.40 2.76 0.05MS NM NM / AFM FM FM AFM
S-6
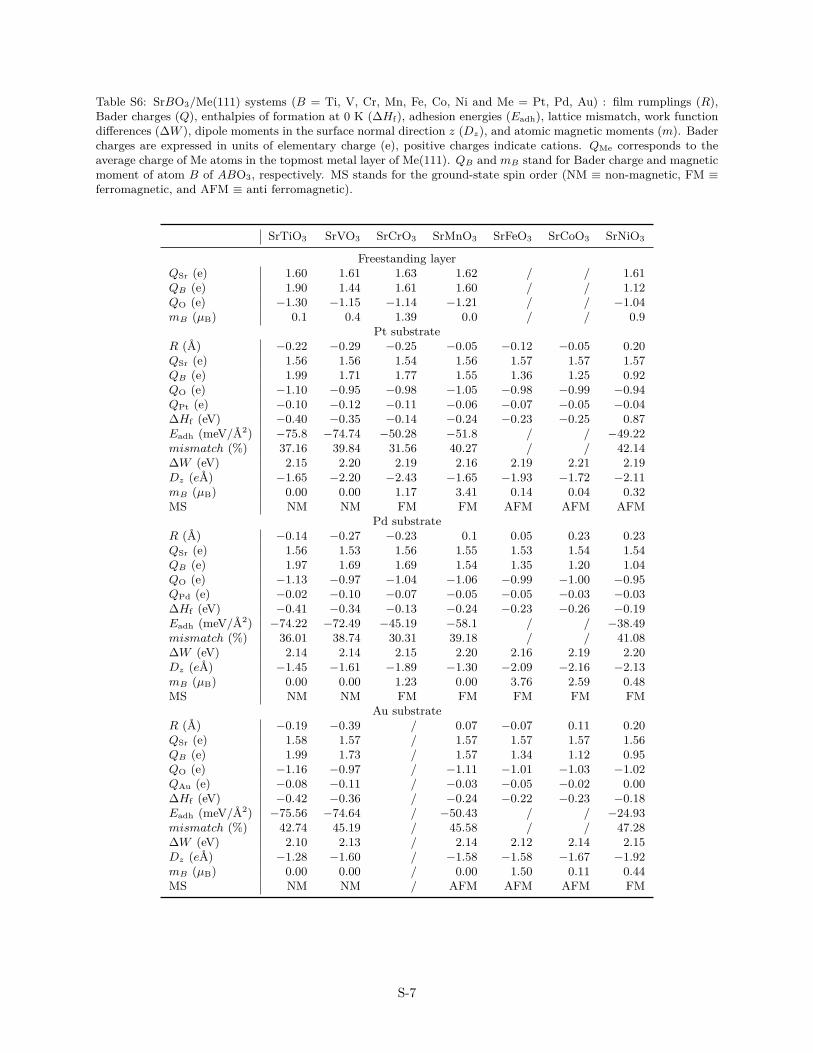
Table S6: SrBO3/Me(111) systems (B = Ti, V, Cr, Mn, Fe, Co, Ni and Me = Pt, Pd, Au) : film rumplings (R),Bader charges (Q), enthalpies of formation at 0 K (∆Hf), adhesion energies (Eadh), lattice mismatch, work functiondifferences (∆W ), dipole moments in the surface normal direction z (Dz), and atomic magnetic moments (m). Badercharges are expressed in units of elementary charge (e), positive charges indicate cations. QMe corresponds to theaverage charge of Me atoms in the topmost metal layer of Me(111). QB and mB stand for Bader charge and magneticmoment of atom B of ABO3, respectively. MS stands for the ground-state spin order (NM ≡ non-magnetic, FM ≡ferromagnetic, and AFM ≡ anti ferromagnetic).
SrTiO3 SrVO3 SrCrO3 SrMnO3 SrFeO3 SrCoO3 SrNiO3
Freestanding layerQSr (e) 1.60 1.61 1.63 1.62 / / 1.61QB (e) 1.90 1.44 1.61 1.60 / / 1.12QO (e) −1.30 −1.15 −1.14 −1.21 / / −1.04mB (µB) 0.1 0.4 1.39 0.0 / / 0.9
Pt substrateR (A) −0.22 −0.29 −0.25 −0.05 −0.12 −0.05 0.20QSr (e) 1.56 1.56 1.54 1.56 1.57 1.57 1.57QB (e) 1.99 1.71 1.77 1.55 1.36 1.25 0.92QO (e) −1.10 −0.95 −0.98 −1.05 −0.98 −0.99 −0.94QPt (e) −0.10 −0.12 −0.11 −0.06 −0.07 −0.05 −0.04∆Hf (eV) −0.40 −0.35 −0.14 −0.24 −0.23 −0.25 0.87Eadh (meV/A2) −75.8 −74.74 −50.28 −51.8 / / −49.22mismatch (%) 37.16 39.84 31.56 40.27 / / 42.14∆W (eV) 2.15 2.20 2.19 2.16 2.19 2.21 2.19Dz (eA) −1.65 −2.20 −2.43 −1.65 −1.93 −1.72 −2.11mB (µB) 0.00 0.00 1.17 3.41 0.14 0.04 0.32MS NM NM FM FM AFM AFM AFM
Pd substrateR (A) −0.14 −0.27 −0.23 0.1 0.05 0.23 0.23QSr (e) 1.56 1.53 1.56 1.55 1.53 1.54 1.54QB (e) 1.97 1.69 1.69 1.54 1.35 1.20 1.04QO (e) −1.13 −0.97 −1.04 −1.06 −0.99 −1.00 −0.95QPd (e) −0.02 −0.10 −0.07 −0.05 −0.05 −0.03 −0.03∆Hf (eV) −0.41 −0.34 −0.13 −0.24 −0.23 −0.26 −0.19Eadh (meV/A2) −74.22 −72.49 −45.19 −58.1 / / −38.49mismatch (%) 36.01 38.74 30.31 39.18 / / 41.08∆W (eV) 2.14 2.14 2.15 2.20 2.16 2.19 2.20Dz (eA) −1.45 −1.61 −1.89 −1.30 −2.09 −2.16 −2.13mB (µB) 0.00 0.00 1.23 0.00 3.76 2.59 0.48MS NM NM FM FM FM FM FM
Au substrateR (A) −0.19 −0.39 / 0.07 −0.07 0.11 0.20QSr (e) 1.58 1.57 / 1.57 1.57 1.57 1.56QB (e) 1.99 1.73 / 1.57 1.34 1.12 0.95QO (e) −1.16 −0.97 / −1.11 −1.01 −1.03 −1.02QAu (e) −0.08 −0.11 / −0.03 −0.05 −0.02 0.00∆Hf (eV) −0.42 −0.36 / −0.24 −0.22 −0.23 −0.18Eadh (meV/A2) −75.56 −74.64 / −50.43 / / −24.93mismatch (%) 42.74 45.19 / 45.58 / / 47.28∆W (eV) 2.10 2.13 / 2.14 2.12 2.14 2.15Dz (eA) −1.28 −1.60 / −1.58 −1.58 −1.67 −1.92mB (µB) 0.00 0.00 / 0.00 1.50 0.11 0.44MS NM NM / AFM AFM AFM FM
S-7
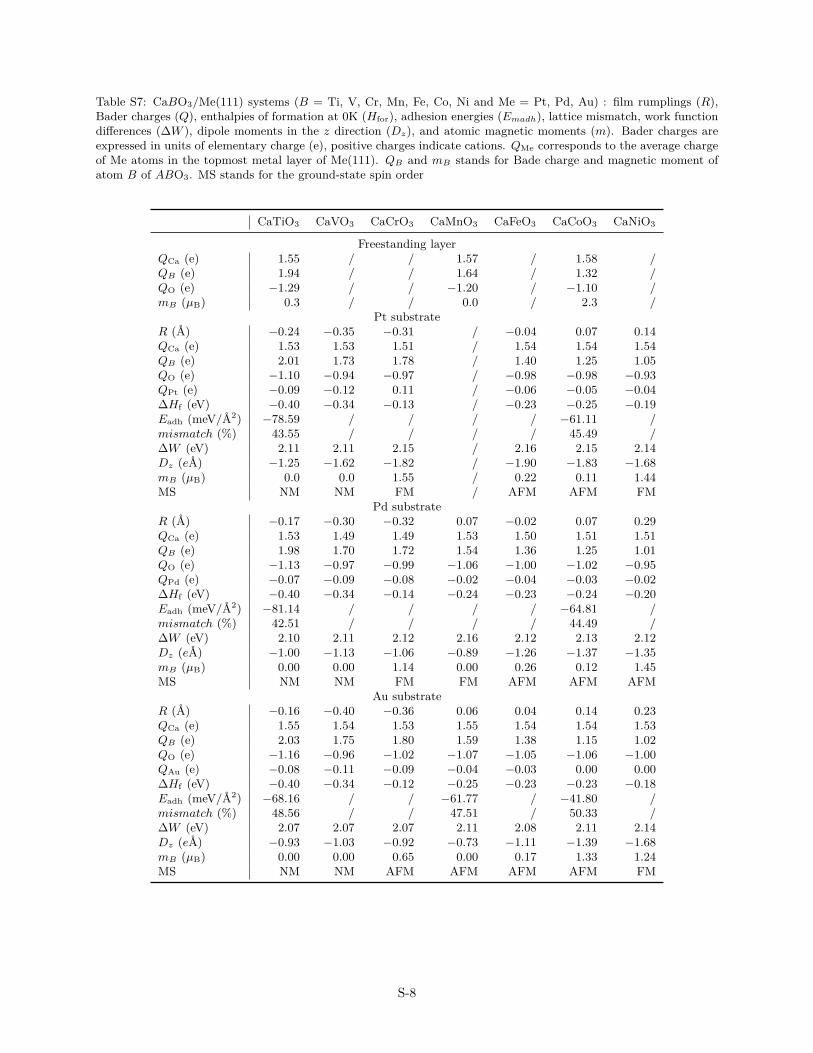
Table S7: CaBO3/Me(111) systems (B = Ti, V, Cr, Mn, Fe, Co, Ni and Me = Pt, Pd, Au) : film rumplings (R),Bader charges (Q), enthalpies of formation at 0K (Hfor), adhesion energies (Emadh), lattice mismatch, work functiondifferences (∆W ), dipole moments in the z direction (Dz), and atomic magnetic moments (m). Bader charges areexpressed in units of elementary charge (e), positive charges indicate cations. QMe corresponds to the average chargeof Me atoms in the topmost metal layer of Me(111). QB and mB stands for Bade charge and magnetic moment ofatom B of ABO3. MS stands for the ground-state spin order
CaTiO3 CaVO3 CaCrO3 CaMnO3 CaFeO3 CaCoO3 CaNiO3
Freestanding layerQCa (e) 1.55 / / 1.57 / 1.58 /QB (e) 1.94 / / 1.64 / 1.32 /QO (e) −1.29 / / −1.20 / −1.10 /mB (µB) 0.3 / / 0.0 / 2.3 /
Pt substrateR (A) −0.24 −0.35 −0.31 / −0.04 0.07 0.14QCa (e) 1.53 1.53 1.51 / 1.54 1.54 1.54QB (e) 2.01 1.73 1.78 / 1.40 1.25 1.05QO (e) −1.10 −0.94 −0.97 / −0.98 −0.98 −0.93QPt (e) −0.09 −0.12 0.11 / −0.06 −0.05 −0.04∆Hf (eV) −0.40 −0.34 −0.13 / −0.23 −0.25 −0.19Eadh (meV/A2) −78.59 / / / / −61.11 /mismatch (%) 43.55 / / / / 45.49 /∆W (eV) 2.11 2.11 2.15 / 2.16 2.15 2.14Dz (eA) −1.25 −1.62 −1.82 / −1.90 −1.83 −1.68mB (µB) 0.0 0.0 1.55 / 0.22 0.11 1.44MS NM NM FM / AFM AFM FM
Pd substrateR (A) −0.17 −0.30 −0.32 0.07 −0.02 0.07 0.29QCa (e) 1.53 1.49 1.49 1.53 1.50 1.51 1.51QB (e) 1.98 1.70 1.72 1.54 1.36 1.25 1.01QO (e) −1.13 −0.97 −0.99 −1.06 −1.00 −1.02 −0.95QPd (e) −0.07 −0.09 −0.08 −0.02 −0.04 −0.03 −0.02∆Hf (eV) −0.40 −0.34 −0.14 −0.24 −0.23 −0.24 −0.20Eadh (meV/A2) −81.14 / / / / −64.81 /mismatch (%) 42.51 / / / / 44.49 /∆W (eV) 2.10 2.11 2.12 2.16 2.12 2.13 2.12Dz (eA) −1.00 −1.13 −1.06 −0.89 −1.26 −1.37 −1.35mB (µB) 0.00 0.00 1.14 0.00 0.26 0.12 1.45MS NM NM FM FM AFM AFM AFM
Au substrateR (A) −0.16 −0.40 −0.36 0.06 0.04 0.14 0.23QCa (e) 1.55 1.54 1.53 1.55 1.54 1.54 1.53QB (e) 2.03 1.75 1.80 1.59 1.38 1.15 1.02QO (e) −1.16 −0.96 −1.02 −1.07 −1.05 −1.06 −1.00QAu (e) −0.08 −0.11 −0.09 −0.04 −0.03 0.00 0.00∆Hf (eV) −0.40 −0.34 −0.12 −0.25 −0.23 −0.23 −0.18Eadh (meV/A2) −68.16 / / −61.77 / −41.80 /mismatch (%) 48.56 / / 47.51 / 50.33 /∆W (eV) 2.07 2.07 2.07 2.11 2.08 2.11 2.14Dz (eA) −0.93 −1.03 −0.92 −0.73 −1.11 −1.39 −1.68mB (µB) 0.00 0.00 0.65 0.00 0.17 1.33 1.24MS NM NM AFM AFM AFM AFM FM
S-8

Gibbs free energies
S-9
(a) BaTiO3/Pt(111) (b) BaTiO3/Au(111)
(c) SrTiO3/Pt(111) (d) SrTiO3/Au(111)
(e) BaFeO3/Pt(111) (f) BaFeO3/Au(111)
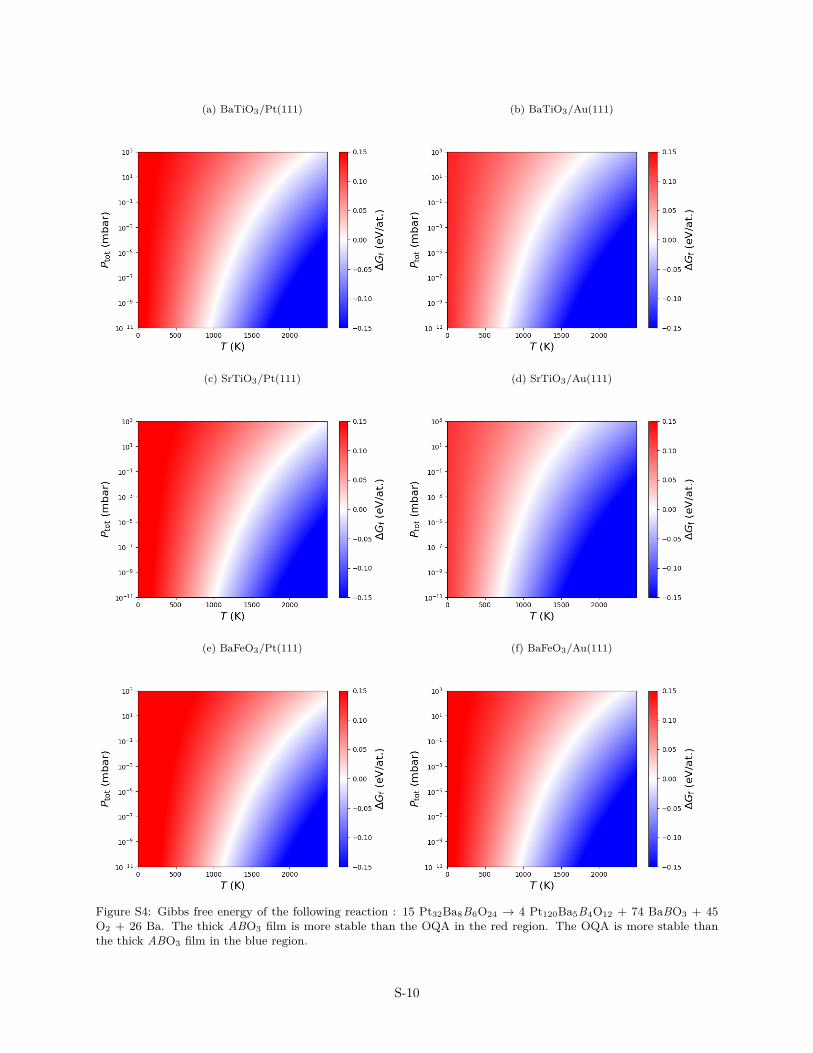
Figure S4: Gibbs free energy of the following reaction : 15 Pt32Ba8B6O24 → 4 Pt120Ba5B4O12 + 74 BaBO3 + 45O2 + 26 Ba. The thick ABO3 film is more stable than the OQA in the red region. The OQA is more stable thanthe thick ABO3 film in the blue region.
S-10
(a) BaCoO3/Pt(111) (b) BaCoO3/Au(111)
(c) BaNiO3/Pt(111) (d) BaNiO3/Au(111)
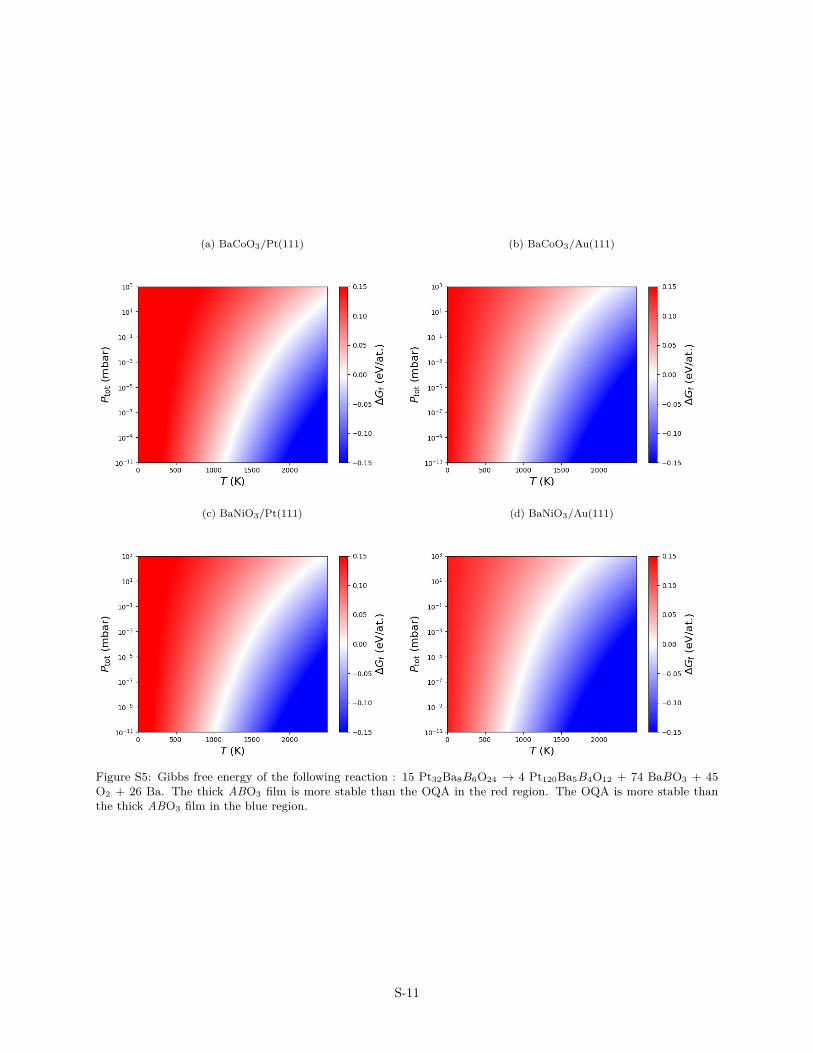
Figure S5: Gibbs free energy of the following reaction : 15 Pt32Ba8B6O24 → 4 Pt120Ba5B4O12 + 74 BaBO3 + 45O2 + 26 Ba. The thick ABO3 film is more stable than the OQA in the red region. The OQA is more stable thanthe thick ABO3 film in the blue region.
S-11
BaTiO3 SrTiO3 BaFeO3 BaCoO3 BaNiO3Structures
0
500
1000
1500
2000
Tem
pera
ture
(K)
Formation energies
0.100
0.075
0.050
0.025
0.000
0.025
0.050
0.075
0.100
Gf (
eV/a
t.)
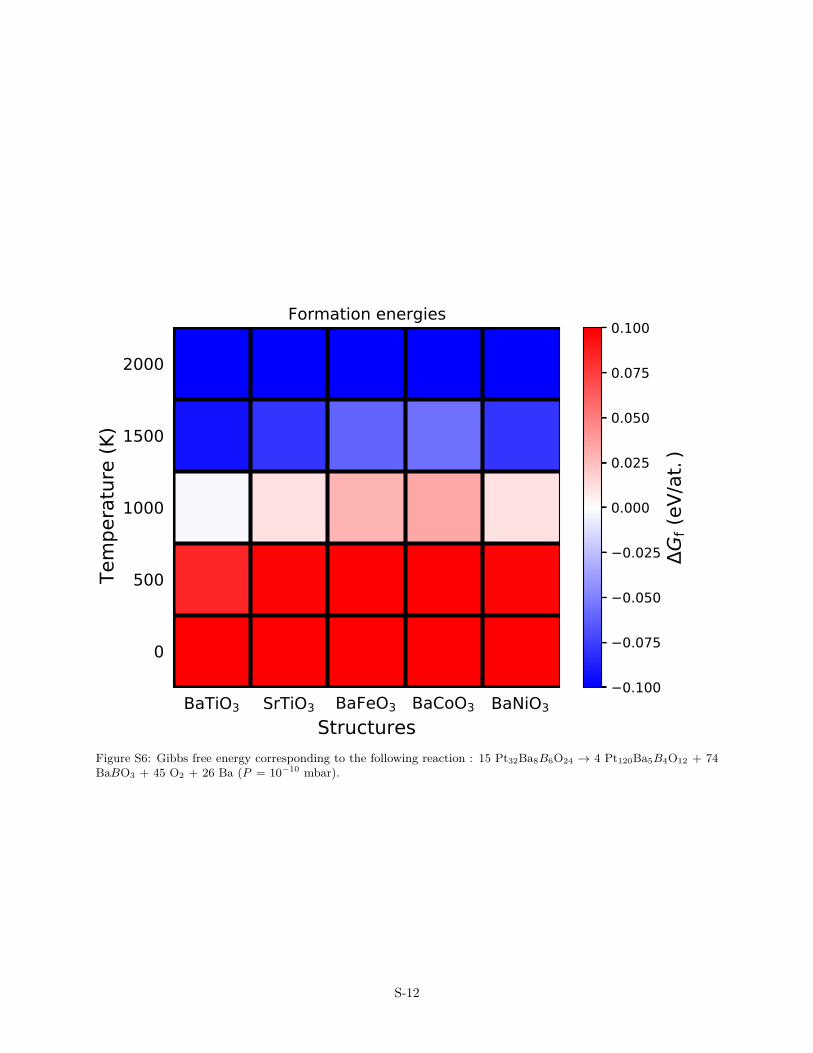
Figure S6: Gibbs free energy corresponding to the following reaction : 15 Pt32Ba8B6O24 → 4 Pt120Ba5B4O12 + 74BaBO3 + 45 O2 + 26 Ba (P = 10−10 mbar).
S-12
BaTiO3 SrTiO3 BaFeO3 BaCoO3 BaNiO3Structures
0
500
1000
1500
2000
Tem
pera
ture
(K)
Formation energies
0.100
0.075
0.050
0.025
0.000
0.025
0.050
0.075
0.100
Gf (
eV/a
t.)
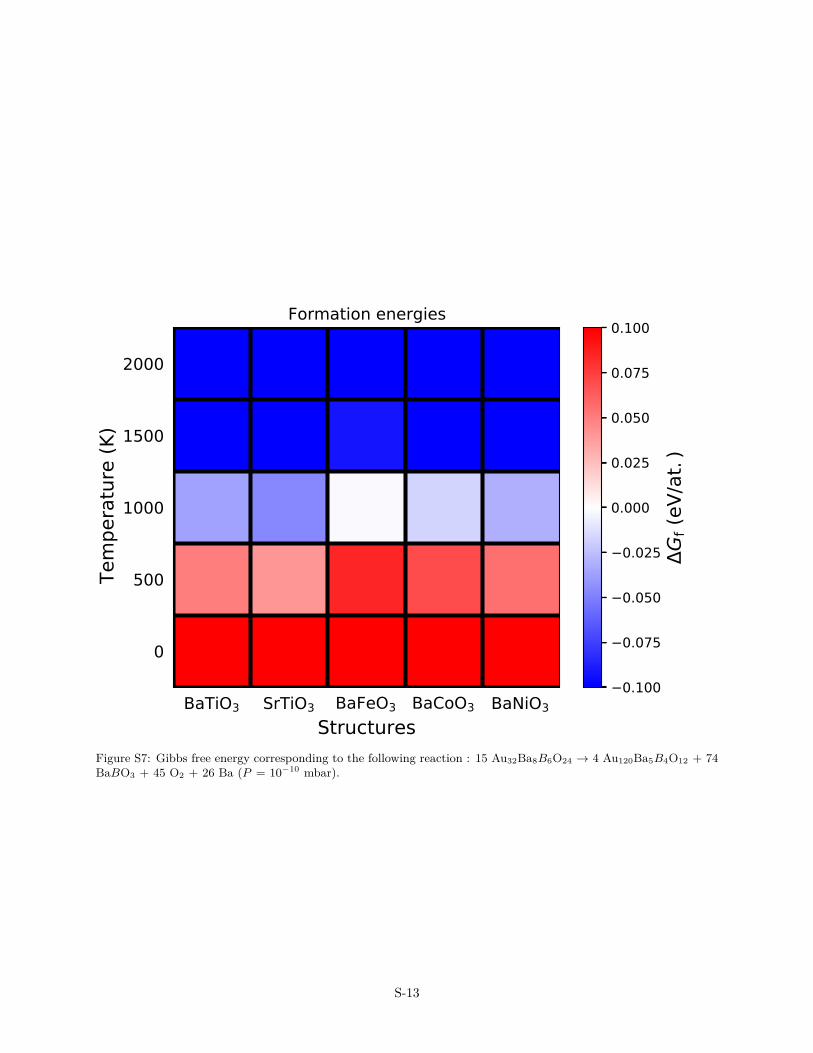
Figure S7: Gibbs free energy corresponding to the following reaction : 15 Au32Ba8B6O24 → 4 Au120Ba5B4O12 + 74BaBO3 + 45 O2 + 26 Ba (P = 10−10 mbar).
S-13
(a) BaTiO3/Pt(111) (b) BaTiO3/Au(111)
(c) SrTiO3/Pt(111) (d) SrTiO3/Au(111)
(e) BaFeO3/Pt(111) (f) BaFeO3/Au(111)
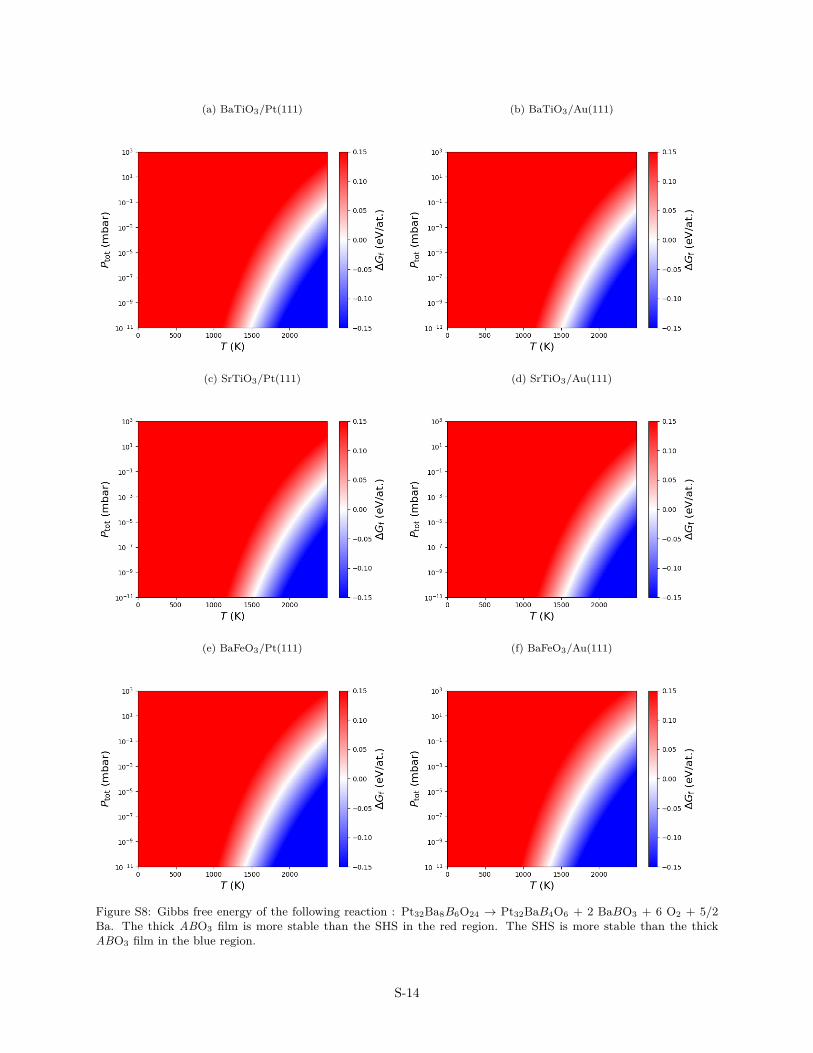
Figure S8: Gibbs free energy of the following reaction : Pt32Ba8B6O24 → Pt32BaB4O6 + 2 BaBO3 + 6 O2 + 5/2Ba. The thick ABO3 film is more stable than the SHS in the red region. The SHS is more stable than the thickABO3 film in the blue region.
S-14
(a) BaCoO3/Pt(111) (b) BaCoO3/Au(111)
(c) BaNiO3/Pt(111) (d) BaNiO3/Au(111)
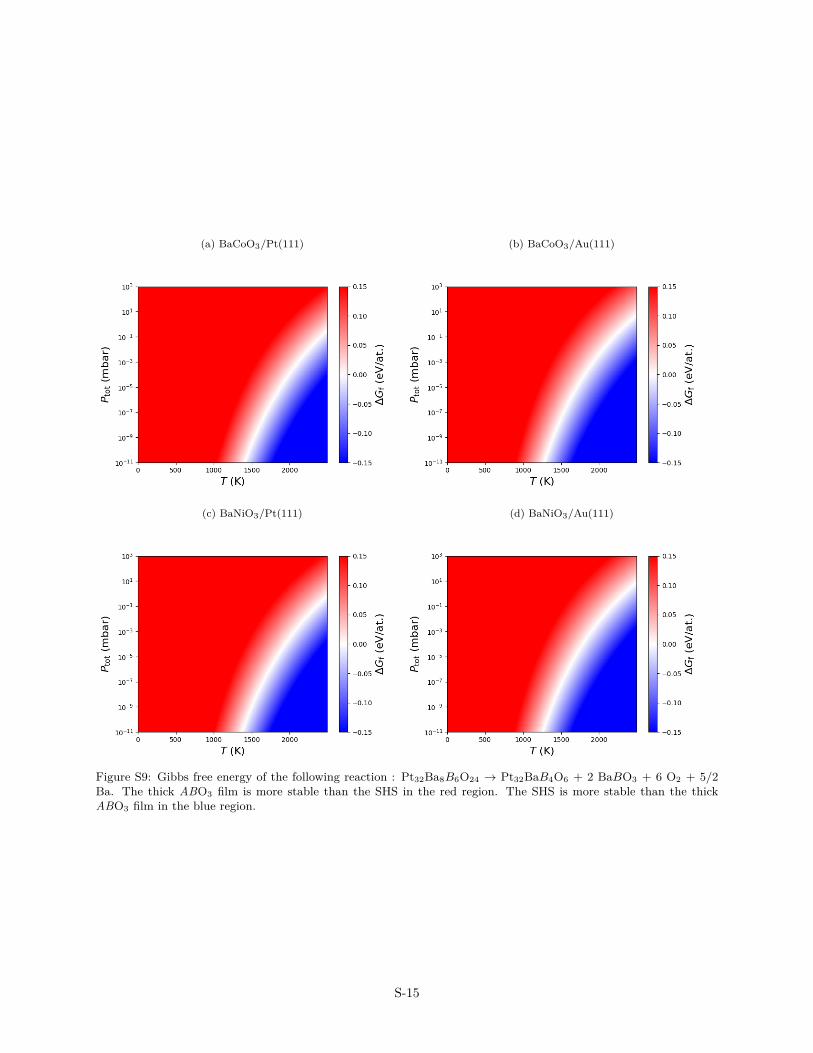
Figure S9: Gibbs free energy of the following reaction : Pt32Ba8B6O24 → Pt32BaB4O6 + 2 BaBO3 + 6 O2 + 5/2Ba. The thick ABO3 film is more stable than the SHS in the red region. The SHS is more stable than the thickABO3 film in the blue region.
S-15
BaTiO3 SrTiO3 BaFeO3 BaCoO3 BaNiO3Structures
0
500
1000
1500
2000
Tem
pera
ture
(K)
Formation energies
0.100
0.075
0.050
0.025
0.000
0.025
0.050
0.075
0.100
Gf (
eV/a
t.)
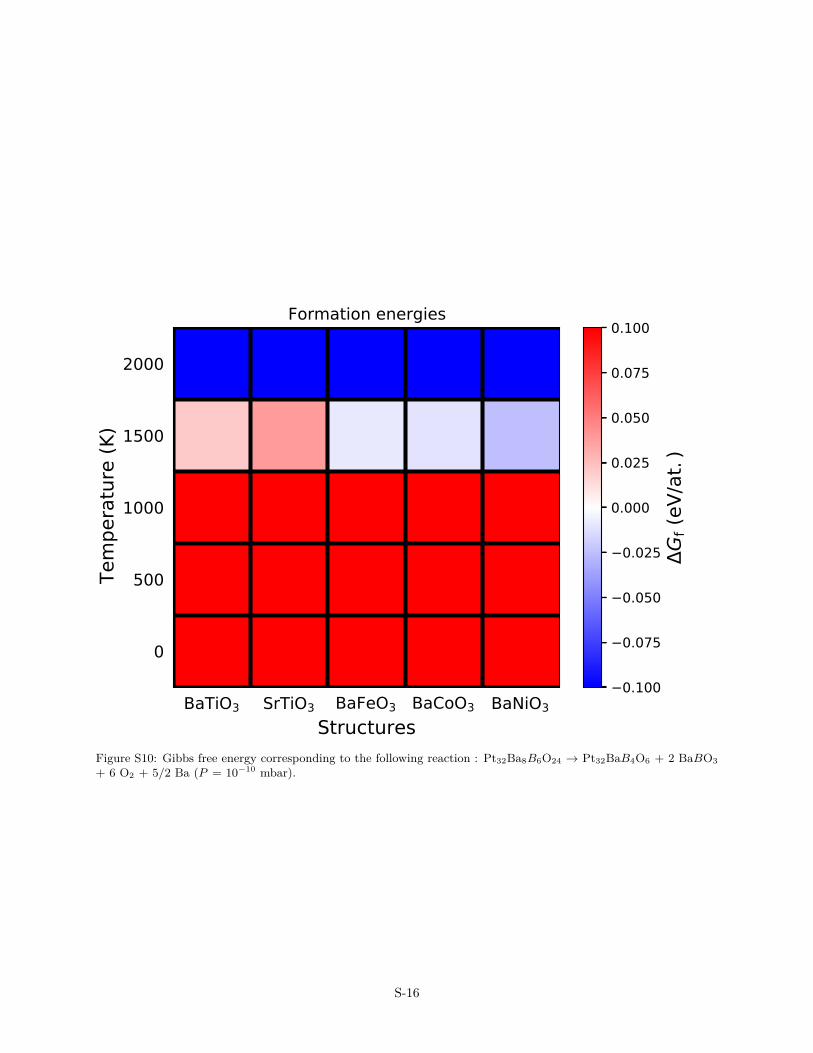
Figure S10: Gibbs free energy corresponding to the following reaction : Pt32Ba8B6O24 → Pt32BaB4O6 + 2 BaBO3+ 6 O2 + 5/2 Ba (P = 10−10 mbar).
S-16
BaTiO3 SrTiO3 BaFeO3 BaCoO3 BaNiO3Structures
0
500
1000
1500
2000
Tem
pera
ture
(K)
Formation energies
0.100
0.075
0.050
0.025
0.000
0.025
0.050
0.075
0.100
Gf (
eV/a
t.)
Figure S11: Gibbs free energy corresponding to the following reaction : Au32Ba8B6O24 → Au32BaB4O6 + 2 BaBO3+ 6 O2 + 5/2 Ba (P = 10−10 mbar).
S-17
Atomic structures of OQAs
S-18
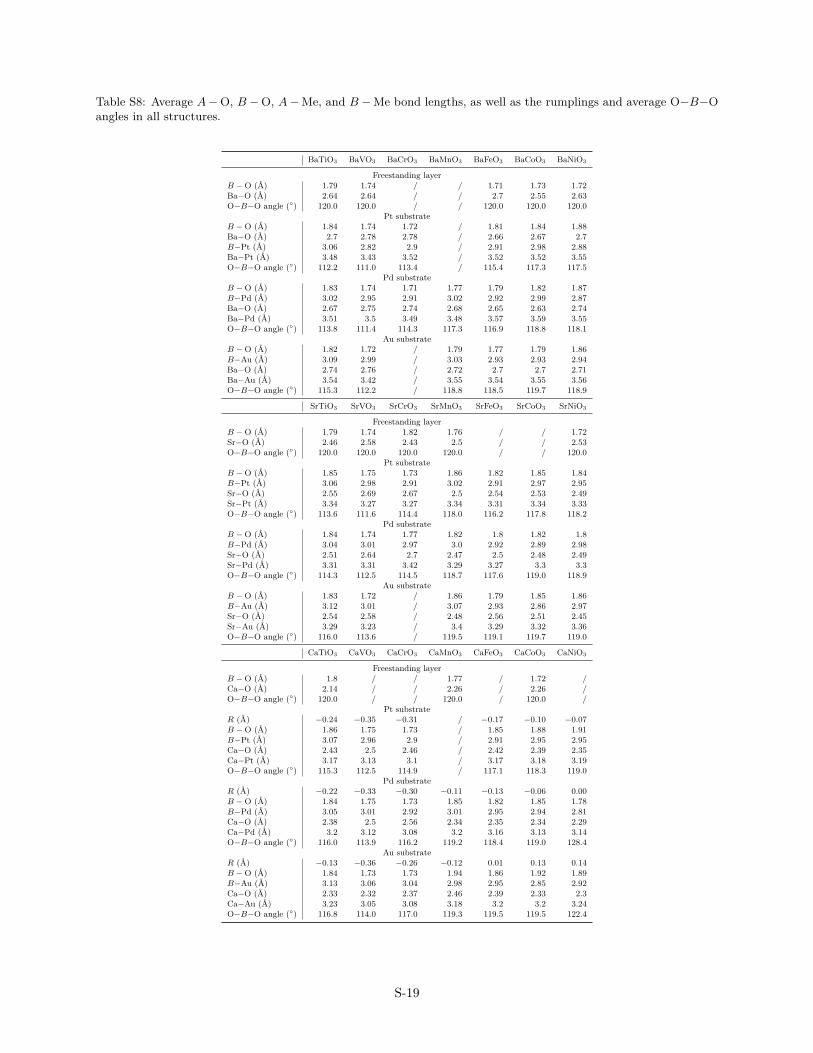
Table S8: Average A−O, B −O, A−Me, and B −Me bond lengths, as well as the rumplings and average O−B−Oangles in all structures.
BaTiO3 BaVO3 BaCrO3 BaMnO3 BaFeO3 BaCoO3 BaNiO3
Freestanding layerB −O (A) 1.79 1.74 / / 1.71 1.73 1.72Ba−O (A) 2.64 2.64 / / 2.7 2.55 2.63O−B−O angle (◦) 120.0 120.0 / / 120.0 120.0 120.0
Pt substrateB −O (A) 1.84 1.74 1.72 / 1.81 1.84 1.88Ba−O (A) 2.7 2.78 2.78 / 2.66 2.67 2.7B−Pt (A) 3.06 2.82 2.9 / 2.91 2.98 2.88Ba−Pt (A) 3.48 3.43 3.52 / 3.52 3.52 3.55O−B−O angle (◦) 112.2 111.0 113.4 / 115.4 117.3 117.5
Pd substrateB −O (A) 1.83 1.74 1.71 1.77 1.79 1.82 1.87B−Pd (A) 3.02 2.95 2.91 3.02 2.92 2.99 2.87Ba−O (A) 2.67 2.75 2.74 2.68 2.65 2.63 2.74Ba−Pd (A) 3.51 3.5 3.49 3.48 3.57 3.59 3.55O−B−O angle (◦) 113.8 111.4 114.3 117.3 116.9 118.8 118.1
Au substrateB −O (A) 1.82 1.72 / 1.79 1.77 1.79 1.86B−Au (A) 3.09 2.99 / 3.03 2.93 2.93 2.94Ba−O (A) 2.74 2.76 / 2.72 2.7 2.7 2.71Ba−Au (A) 3.54 3.42 / 3.55 3.54 3.55 3.56O−B−O angle (◦) 115.3 112.2 / 118.8 118.5 119.7 118.9
SrTiO3 SrVO3 SrCrO3 SrMnO3 SrFeO3 SrCoO3 SrNiO3
Freestanding layerB −O (A) 1.79 1.74 1.82 1.76 / / 1.72Sr−O (A) 2.46 2.58 2.43 2.5 / / 2.53O−B−O angle (◦) 120.0 120.0 120.0 120.0 / / 120.0
Pt substrateB −O (A) 1.85 1.75 1.73 1.86 1.82 1.85 1.84B−Pt (A) 3.06 2.98 2.91 3.02 2.91 2.97 2.95Sr−O (A) 2.55 2.69 2.67 2.5 2.54 2.53 2.49Sr−Pt (A) 3.34 3.27 3.27 3.34 3.31 3.34 3.33O−B−O angle (◦) 113.6 111.6 114.4 118.0 116.2 117.8 118.2
Pd substrateB −O (A) 1.84 1.74 1.77 1.82 1.8 1.82 1.8B−Pd (A) 3.04 3.01 2.97 3.0 2.92 2.89 2.98Sr−O (A) 2.51 2.64 2.7 2.47 2.5 2.48 2.49Sr−Pd (A) 3.31 3.31 3.42 3.29 3.27 3.3 3.3O−B−O angle (◦) 114.3 112.5 114.5 118.7 117.6 119.0 118.9
Au substrateB −O (A) 1.83 1.72 / 1.86 1.79 1.85 1.86B−Au (A) 3.12 3.01 / 3.07 2.93 2.86 2.97Sr−O (A) 2.54 2.58 / 2.48 2.56 2.51 2.45Sr−Au (A) 3.29 3.23 / 3.4 3.29 3.32 3.36O−B−O angle (◦) 116.0 113.6 / 119.5 119.1 119.7 119.0
CaTiO3 CaVO3 CaCrO3 CaMnO3 CaFeO3 CaCoO3 CaNiO3
Freestanding layerB −O (A) 1.8 / / 1.77 / 1.72 /Ca−O (A) 2.14 / / 2.26 / 2.26 /O−B−O angle (◦) 120.0 / / 120.0 / 120.0 /
Pt substrateR (A) −0.24 −0.35 −0.31 / −0.17 −0.10 −0.07B −O (A) 1.86 1.75 1.73 / 1.85 1.88 1.91B−Pt (A) 3.07 2.96 2.9 / 2.91 2.95 2.95Ca−O (A) 2.43 2.5 2.46 / 2.42 2.39 2.35Ca−Pt (A) 3.17 3.13 3.1 / 3.17 3.18 3.19O−B−O angle (◦) 115.3 112.5 114.9 / 117.1 118.3 119.0
Pd substrateR (A) −0.22 −0.33 −0.30 −0.11 −0.13 −0.06 0.00B −O (A) 1.84 1.75 1.73 1.85 1.82 1.85 1.78B−Pd (A) 3.05 3.01 2.92 3.01 2.95 2.94 2.81Ca−O (A) 2.38 2.5 2.56 2.34 2.35 2.34 2.29Ca−Pd (A) 3.2 3.12 3.08 3.2 3.16 3.13 3.14O−B−O angle (◦) 116.0 113.9 116.2 119.2 118.4 119.0 128.4
Au substrateR (A) −0.13 −0.36 −0.26 −0.12 0.01 0.13 0.14B −O (A) 1.84 1.73 1.73 1.94 1.86 1.92 1.89B−Au (A) 3.13 3.06 3.04 2.98 2.95 2.85 2.92Ca−O (A) 2.33 2.32 2.37 2.46 2.39 2.33 2.3Ca−Au (A) 3.23 3.05 3.08 3.18 3.2 3.2 3.24O−B−O angle (◦) 116.8 114.0 117.0 119.3 119.5 119.5 122.4
S-19
Size mismatch and rumpling for OQAs
25 30 35 40 45 50−0.4
−0.3
−0.2
−0.1
0
0.1
0.2
0.3
Mismatch (%)
Rum
plin
g(A
)
PtPdAu
Figure S12: Plot of the rumpling as a function of the size mismatch for selected structures.
S-20
Averaged planar differences
−40
−35
−30
−25
−20
−15
−10
−5
0
5
10
0 5 10 15 20 25 30
metal oxide
EFermi
Φ1
Φ2V
(eV
)
z (Å)
BaTiO3
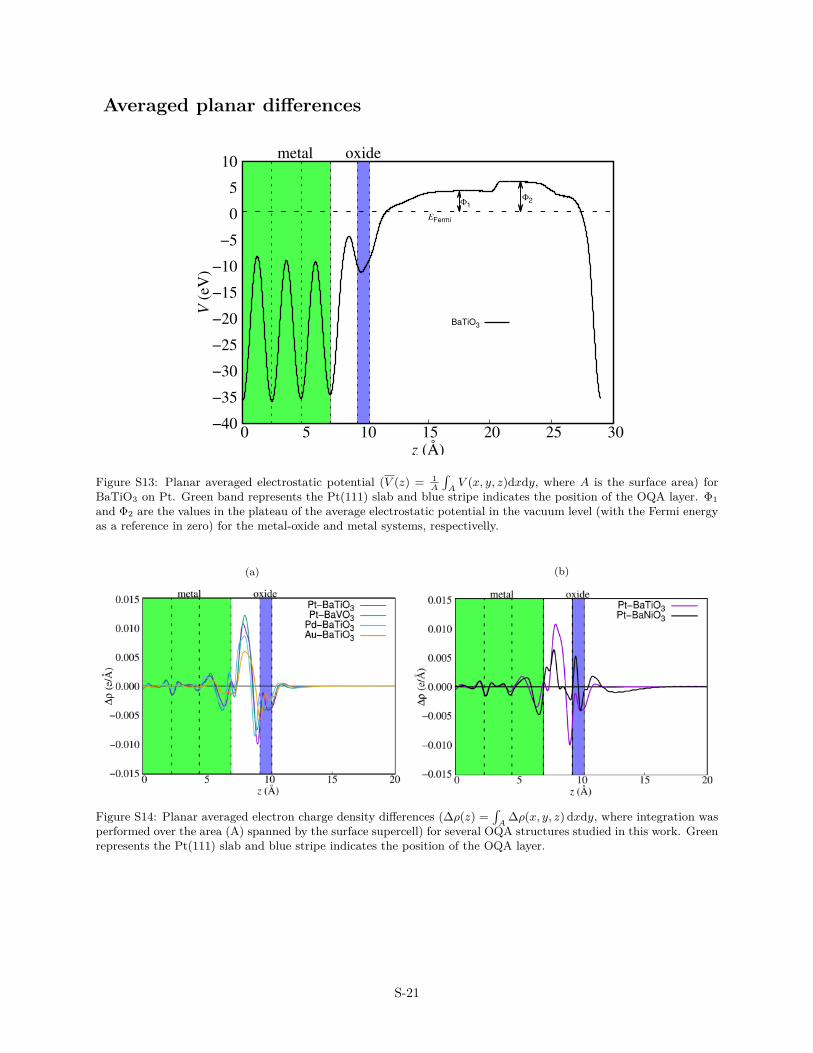
Figure S13: Planar averaged electrostatic potential (V (z) = 1A
∫AV (x, y, z)dxdy, where A is the surface area) for
BaTiO3 on Pt. Green band represents the Pt(111) slab and blue stripe indicates the position of the OQA layer. Φ1and Φ2 are the values in the plateau of the average electrostatic potential in the vacuum level (with the Fermi energyas a reference in zero) for the metal-oxide and metal systems, respectivelly.
(a) (b)
Figure S14: Planar averaged electron charge density differences (∆ρ(z) =∫
A∆ρ(x, y, z) dxdy, where integration was
performed over the area (A) spanned by the surface supercell) for several OQA structures studied in this work. Greenrepresents the Pt(111) slab and blue stripe indicates the position of the OQA layer.
S-21
Adhesion energies as a function of size mismatch, rumpling and
charge transfer
1 1.2 1.4 1.6 1.8 2
−80
−70
−60
−50
−40
−30
−20
QB (e)
Ead
h(m
eV/A
2 )
PtPdAu
Figure S15: Plot of the adhesion energy (Eadh) as a function of the Bader charge of B atom (QB).
S-22
25 30 35 40 45 50
−80
−70
−60
−50
−40
−30
−20
Mismatch (%)
E adh
(meV
/A2 )
PtPdAu
Figure S16: Plot of the adhesion energy (Eadh) as a function of the size mismatch for selected structures.
S-23
−0.4 −0.3 −0.2 −0.1 0 0.1 0.2 0.3
−80
−70
−60
−50
−40
−30
−20
Rumpling (A)
E adh
(meV
/A2 )
PtPdAu
Figure S17: Plot of the adhesion energy (Eadh) as a function of the rumpling (R) for selected structures.
S-24
Electronic properties
Density of states
S-25
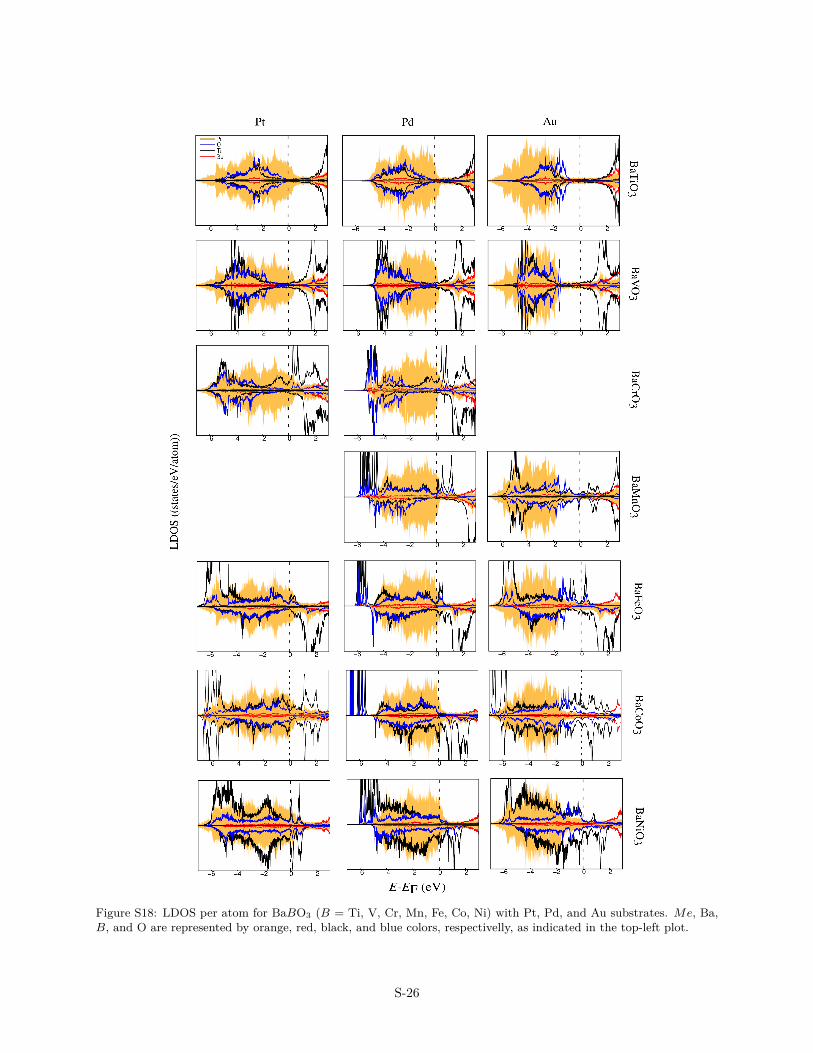
Figure S18: LDOS per atom for BaBO3 (B = Ti, V, Cr, Mn, Fe, Co, Ni) with Pt, Pd, and Au substrates. Me, Ba,B, and O are represented by orange, red, black, and blue colors, respectivelly, as indicated in the top-left plot.
S-26
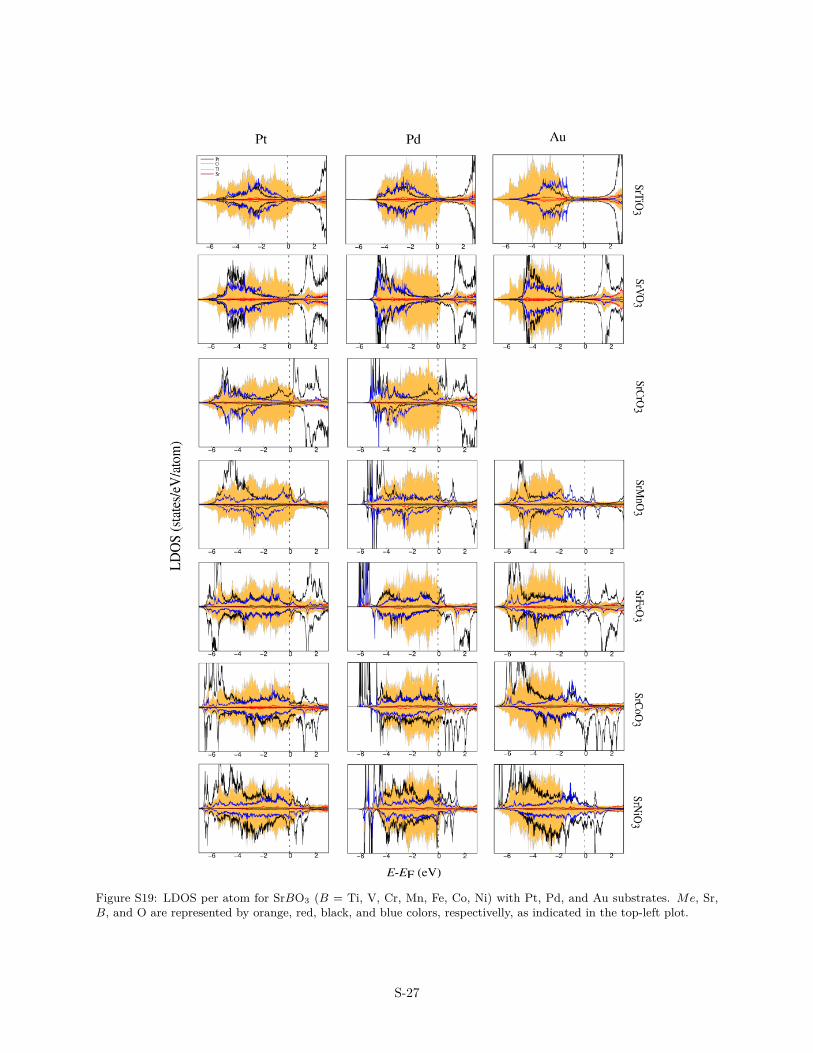
Figure S19: LDOS per atom for SrBO3 (B = Ti, V, Cr, Mn, Fe, Co, Ni) with Pt, Pd, and Au substrates. Me, Sr,B, and O are represented by orange, red, black, and blue colors, respectivelly, as indicated in the top-left plot.
S-27
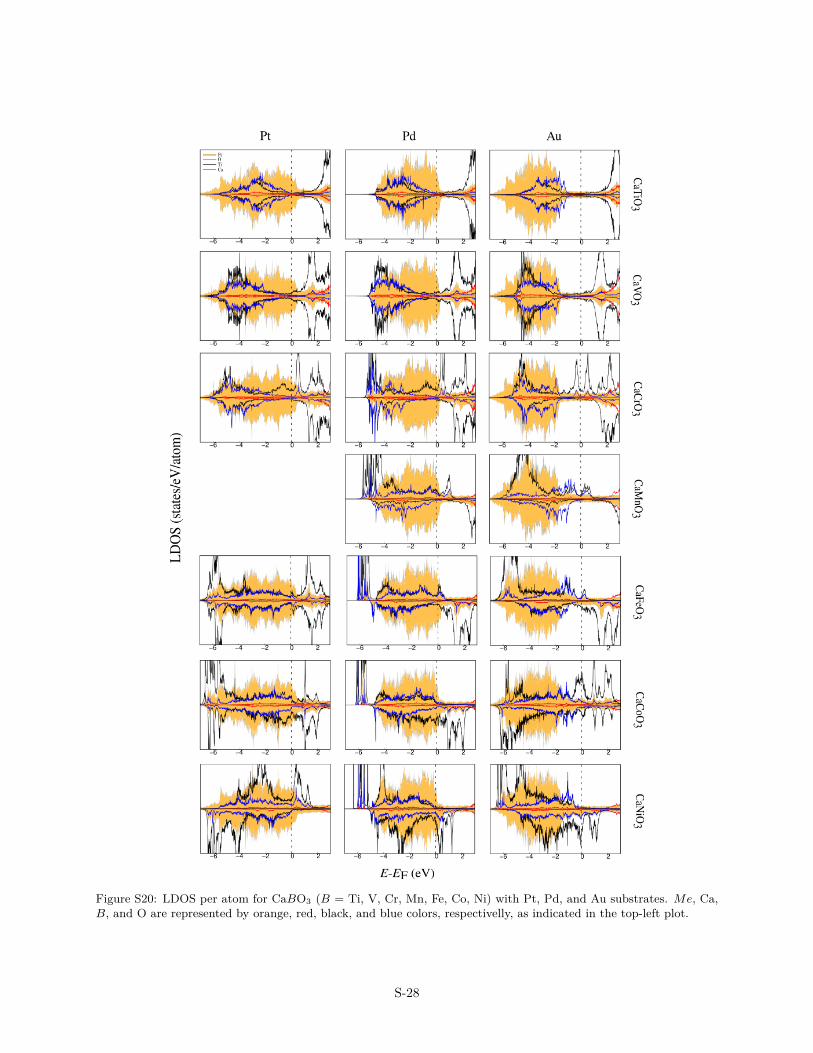
Figure S20: LDOS per atom for CaBO3 (B = Ti, V, Cr, Mn, Fe, Co, Ni) with Pt, Pd, and Au substrates. Me, Ca,B, and O are represented by orange, red, black, and blue colors, respectivelly, as indicated in the top-left plot.
S-28
BaTiO3 SrTiO3
BaFeO3 BaCoO3
BaNiO3
E-EF (eV)
E-EF (eV)E-EF (eV)
E-EF (eV)E-EF (eV)
OTiBa
Figure S21: LDOS per atom for the oxide freestanding layers. Ba, B, and O are represented by red, black, and bluecolors, respectivelly, as indicated in the top-left plot.
S-29
COHP and ICOHPs
(a) Ti–Pt
5 4 3 2 1 0 1 2 3COHP
10
8
6
4
2
0
2
4
EE F
(eV)
Up-spinDown-spin
(b) Ti–Au
1.5 1.0 0.5 0.0 0.5 1.0COHP
10
8
6
4
2
0
2
4
EE F
(eV)
Up-spinDown-spin
(c) Fe–Pt
2 0 2 4COHP
10
8
6
4
2
0
2
4
EE F
(eV)
Up-spinDown-spin
(d) Fe–Au
1.0 0.5 0.0 0.5 1.0 1.5COHP
10
8
6
4
2
0
2
4
EE F
(eV)
Up-spinDown-spin
Figure S22: COHPs between all bonds up to 3A in the BaBO3/Pt(111) systems (with B = Ti, Fe).
S-30
(a) Co–Pt
1.0 0.5 0.0 0.5 1.0 1.5COHP
10
8
6
4
2
0
2
4
EE F
(eV)
Up-spinDown-spin
(b) Co–Au
1.0 0.5 0.0 0.5 1.0COHP
10
8
6
4
2
0
2
4
EE F
(eV)
Up-spinDown-spin
(c) Ni–Pt
1.5 1.0 0.5 0.0 0.5 1.0 1.5 2.0COHP
10
8
6
4
2
0
2
4
EE F
(eV)
Up-spinDown-spin
(d) Ni–Au
1.5 1.0 0.5 0.0 0.5 1.0COHP
10
8
6
4
2
0
2
4
EE F
(eV)
Up-spinDown-spin
Figure S23: COHPs between all bonds up to 3A in the BaBO3/Pt(111) systems (with B = Co, Ni).
S-31
(a) Ti–O (with Pt)
50 40 30 20 10 0 10 20COHP
10
8
6
4
2
0
2
4
EE F
(eV)
Up-spinDown-spin
(b) Ti–O (with Au)
50 40 30 20 10 0 10 20COHP
10
8
6
4
2
0
2
4
EE F
(eV)
Up-spinDown-spin
(c) Fe–O (with Pt)
40 30 20 10 0 10 20 30COHP
10
8
6
4
2
0
2
4
EE F
(eV)
Up-spinDown-spin
(d) Fe–O (with Au)
40 30 20 10 0 10 20 30COHP
10
8
6
4
2
0
2
4
EE F
(eV)
Up-spinDown-spin
Figure S24: COHPs between all bonds up to 3A in the BaBO3/Me(111) systems (with B = Ti, Fe).
S-32
(a) Co–O (with Pt)
30 20 10 0 10 20COHP
10
8
6
4
2
0
2
4
EE F
(eV)
Up-spinDown-spin
(b) Co–O (with Au)
30 20 10 0 10 20COHP
10
8
6
4
2
0
2
4
EE F
(eV)
Up-spinDown-spin
(c) Ni–O (with Pt)
40 30 20 10 0 10 20COHP
10
8
6
4
2
0
2
4
EE F
(eV)
Up-spinDown-spin
(d) Ni–O (with Au)
20 10 0 10COHP
10
8
6
4
2
0
2
4
EE F
(eV)
Up-spinDown-spin
Figure S25: COHPs between all bonds up to 3A in the BaBO3/Pt(111) systems (with B = Co, Ni).
S-33
(a) Pt–O (with Ti)
10 5 0 5 10 15COHP
10
8
6
4
2
0
2
4
EE F
(eV)
Up-spinDown-spin
(b) Au–O (with Ti)
4 2 0 2 4COHP
10
8
6
4
2
0
2
4
EE F
(eV)
Up-spinDown-spin
(c) Pt–O (with Fe)
7.5 5.0 2.5 0.0 2.5 5.0 7.5 10.0 12.5COHP
10
8
6
4
2
0
2
4
EE F
(eV)
Up-spinDown-spin
(d) Au–O (with Fe)
6 4 2 0 2 4 6COHP
10
8
6
4
2
0
2
4
EE F
(eV)
Up-spinDown-spin
Figure S26: COHPs between all bonds up to 3A in the BaBO3/Me(111) systems (with B = Ti, Fe).
S-34
(a) Pt–O (with Co)
10 5 0 5 10 15COHP
10
8
6
4
2
0
2
4
EE F
(eV)
Up-spinDown-spin
(b) Au–O (with Co)
10 5 0 5 10COHP
10
8
6
4
2
0
2
4
EE F
(eV)
Up-spinDown-spin
(c) Pt–O (with Ni)
15 10 5 0 5 10 15 20COHP
10
8
6
4
2
0
2
4
EE F
(eV)
Up-spinDown-spin
(d) Au–O (with Ni)
10 5 0 5 10 15COHP
10
8
6
4
2
0
2
4
EE F
(eV)
Up-spinDown-spin
Figure S27: COHPs between all bonds up to 3A in the BaBO3/Pt(111) systems (with B = Co, Ni).
S-35
Elemental metals and bulk perovskites
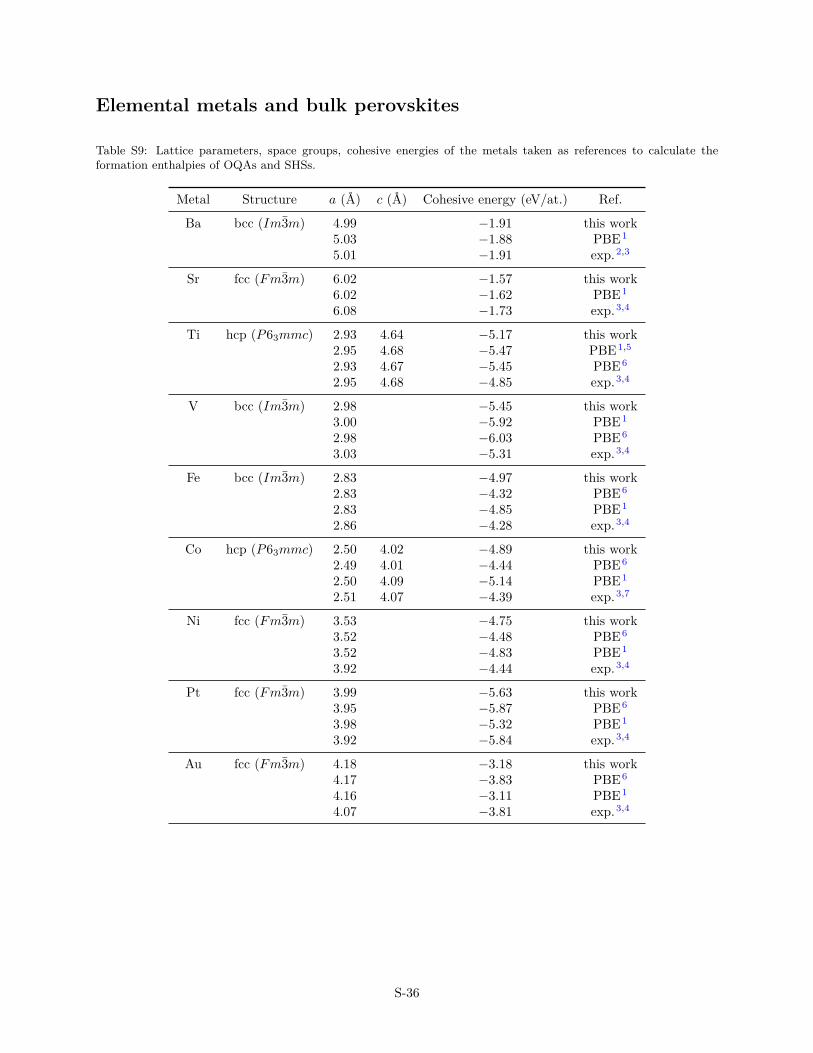
Table S9: Lattice parameters, space groups, cohesive energies of the metals taken as references to calculate theformation enthalpies of OQAs and SHSs.
Metal Structure a (A) c (A) Cohesive energy (eV/at.) Ref.
Ba bcc (Im3m) 4.99 −1.91 this work5.03 −1.88 PBE1
5.01 −1.91 exp.2,3
Sr fcc (Fm3m) 6.02 −1.57 this work6.02 −1.62 PBE1
6.08 −1.73 exp.3,4
Ti hcp (P63mmc) 2.93 4.64 −5.17 this work2.95 4.68 −5.47 PBE1,5
2.93 4.67 −5.45 PBE6
2.95 4.68 −4.85 exp.3,4
V bcc (Im3m) 2.98 −5.45 this work3.00 −5.92 PBE1
2.98 −6.03 PBE6
3.03 −5.31 exp.3,4
Fe bcc (Im3m) 2.83 −4.97 this work2.83 −4.32 PBE6
2.83 −4.85 PBE1
2.86 −4.28 exp.3,4
Co hcp (P63mmc) 2.50 4.02 −4.89 this work2.49 4.01 −4.44 PBE6
2.50 4.09 −5.14 PBE1
2.51 4.07 −4.39 exp.3,7
Ni fcc (Fm3m) 3.53 −4.75 this work3.52 −4.48 PBE6
3.52 −4.83 PBE1
3.92 −4.44 exp.3,4
Pt fcc (Fm3m) 3.99 −5.63 this work3.95 −5.87 PBE6
3.98 −5.32 PBE1
3.92 −5.84 exp.3,4
Au fcc (Fm3m) 4.18 −3.18 this work4.17 −3.83 PBE6
4.16 −3.11 PBE1
4.07 −3.81 exp.3,4
S-36
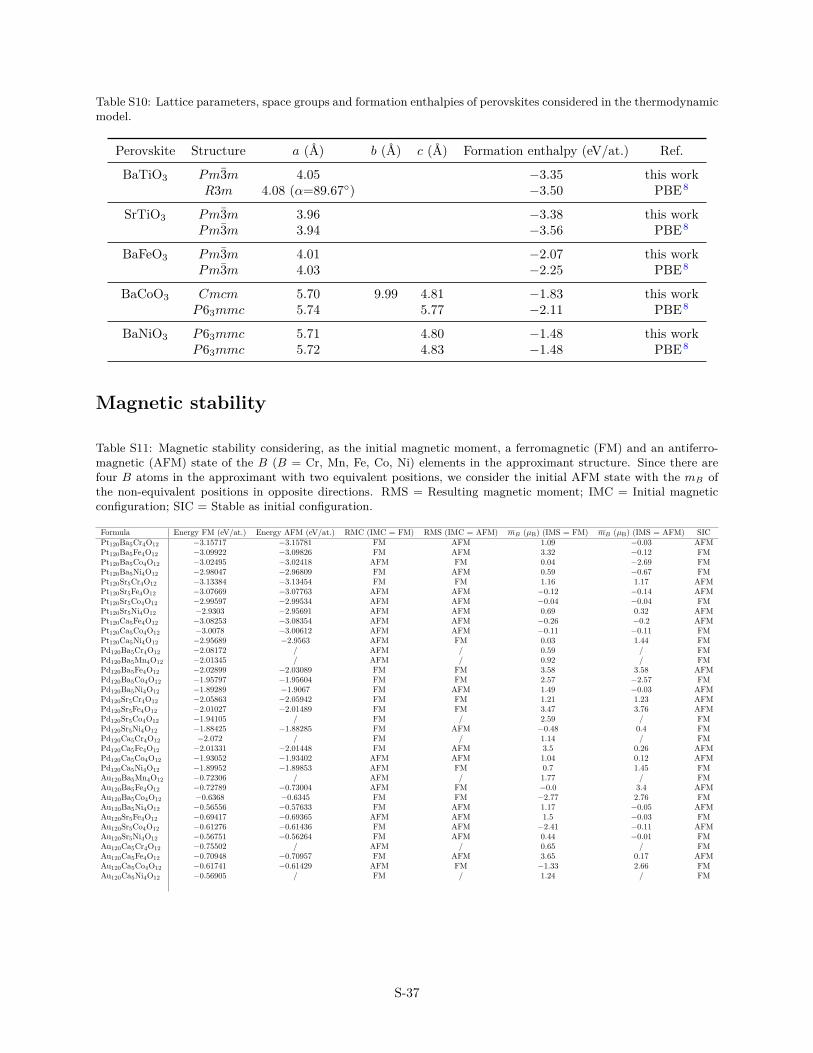
Table S10: Lattice parameters, space groups and formation enthalpies of perovskites considered in the thermodynamicmodel.
Perovskite Structure a (A) b (A) c (A) Formation enthalpy (eV/at.) Ref.
BaTiO3 Pm3m 4.05 −3.35 this workR3m 4.08 (α=89.67◦) −3.50 PBE8
SrTiO3 Pm3m 3.96 −3.38 this workPm3m 3.94 −3.56 PBE8
BaFeO3 Pm3m 4.01 −2.07 this workPm3m 4.03 −2.25 PBE8
BaCoO3 Cmcm 5.70 9.99 4.81 −1.83 this workP63mmc 5.74 5.77 −2.11 PBE8
BaNiO3 P63mmc 5.71 4.80 −1.48 this workP63mmc 5.72 4.83 −1.48 PBE8
Magnetic stability
Table S11: Magnetic stability considering, as the initial magnetic moment, a ferromagnetic (FM) and an antiferro-magnetic (AFM) state of the B (B = Cr, Mn, Fe, Co, Ni) elements in the approximant structure. Since there arefour B atoms in the approximant with two equivalent positions, we consider the initial AFM state with the mB ofthe non-equivalent positions in opposite directions. RMS = Resulting magnetic moment; IMC = Initial magneticconfiguration; SIC = Stable as initial configuration.
Formula Energy FM (eV/at.) Energy AFM (eV/at.) RMC (IMC = FM) RMS (IMC = AFM) mB (µB) (IMS = FM) mB (µB) (IMS = AFM) SICPt120Ba5Cr4O12 −3.15717 −3.15781 FM AFM 1.09 −0.03 AFMPt120Ba5Fe4O12 −3.09922 −3.09826 FM AFM 3.32 −0.12 FMPt120Ba5Co4O12 −3.02495 −3.02418 AFM FM 0.04 −2.69 FMPt120Ba5Ni4O12 −2.98047 −2.96809 FM AFM 0.59 −0.67 FMPt120Sr5Cr4O12 −3.13384 −3.13454 FM FM 1.16 1.17 AFMPt120Sr5Fe4O12 −3.07669 −3.07763 AFM AFM −0.12 −0.14 AFMPt120Sr5Co4O12 −2.99597 −2.99534 AFM AFM −0.04 −0.04 FMPt120Sr5Ni4O12 −2.9303 −2.95691 AFM AFM 0.69 0.32 AFMPt120Ca5Fe4O12 −3.08253 −3.08354 AFM AFM −0.26 −0.2 AFMPt120Ca5Co4O12 −3.0078 −3.00612 AFM AFM −0.11 −0.11 FMPt120Ca5Ni4O12 −2.95689 −2.9563 AFM FM 0.03 1.44 FMPd120Ba5Cr4O12 −2.08172 / AFM / 0.59 / FMPd120Ba5Mn4O12 −2.01345 / AFM / 0.92 / FMPd120Ba5Fe4O12 −2.02899 −2.03089 FM FM 3.58 3.58 AFMPd120Ba5Co4O12 −1.95797 −1.95604 FM FM 2.57 −2.57 FMPd120Ba5Ni4O12 −1.89289 −1.9067 FM AFM 1.49 −0.03 AFMPd120Sr5Cr4O12 −2.05863 −2.05942 FM FM 1.21 1.23 AFMPd120Sr5Fe4O12 −2.01027 −2.01489 FM FM 3.47 3.76 AFMPd120Sr5Co4O12 −1.94105 / FM / 2.59 / FMPd120Sr5Ni4O12 −1.88425 −1.88285 FM AFM −0.48 0.4 FMPd120Ca5Cr4O12 −2.072 / FM / 1.14 / FMPd120Ca5Fe4O12 −2.01331 −2.01448 FM AFM 3.5 0.26 AFMPd120Ca5Co4O12 −1.93052 −1.93402 AFM AFM 1.04 0.12 AFMPd120Ca5Ni4O12 −1.89952 −1.89853 AFM FM 0.7 1.45 FMAu120Ba5Mn4O12 −0.72306 / AFM / 1.77 / FMAu120Ba5Fe4O12 −0.72789 −0.73004 AFM FM −0.0 3.4 AFMAu120Ba5Co4O12 −0.6368 −0.6345 FM FM −2.77 2.76 FMAu120Ba5Ni4O12 −0.56556 −0.57633 FM AFM 1.17 −0.05 AFMAu120Sr5Fe4O12 −0.69417 −0.69365 AFM AFM 1.5 −0.03 FMAu120Sr5Co4O12 −0.61276 −0.61436 FM AFM −2.41 −0.11 AFMAu120Sr5Ni4O12 −0.56751 −0.56264 FM AFM 0.44 −0.01 FMAu120Ca5Cr4O12 −0.75502 / AFM / 0.65 / FMAu120Ca5Fe4O12 −0.70948 −0.70957 FM AFM 3.65 0.17 AFMAu120Ca5Co4O12 −0.61741 −0.61429 AFM FM −1.33 2.66 FMAu120Ca5Ni4O12 −0.56905 / FM / 1.24 / FM
S-37
References
(1) Lejaeghere, K.; Speybroeck, V. V.; Oost, G. V.; Cottenier, S. Error estimates for solid-state density-
functional theory predictions: an overview by means of the ground-state elemental crystals. Critical
Reviews in Solid State and Materials Sciences 2014, 39, 1–24.
(2) Barrett, C. S. The crystal structure of barium and europium at 293, 78 and 5 K. Journal of Chemical
Physics 1956, 25, 1123–1124.
(3) Kittel, C. Introduction to Solid State Physics, 7th ed.; John Wiley & Sons: USA, 1996.
(4) Villars, P.; Calvert, L. D. Pearson´s Handbook of Crystallographic Data for Intermetallic Phases; ASM
International: Metals Park, Ohio, USA, 1998.
(5) Spreadborough, J.; Christian, J. The measurement of the lattice expansions and Debye temperatures of
titanium and silver by X-ray methods. Proceedings of the Physical Society (1958-1967) 1959, 74, 609.
(6) Janthon, P.; Luo, S.; Kozlov, S. M.; Vines, F.; Limtrakul, J.; Truhlar, D. G.; Illas, F. Bulk Properties
of Transition Metals: A Challenge for the Design of Universal Density Functionals. J. Chem. Theory
Comput. 2014, 10, 3832–3839.
(7) Hofer, L. J. E.; Peebles, W. C. Preparation and X-Ray Diffraction Studies of A New Cobalt Carbide. J.
Am. Chem. Soc. 1947, 69, 893–899.
(8) Jain, A.; Hautier, S. P. O. G.; Chen, W.; Richards, W. D.; Dacek, W.; Cholia, S.; Gunter, D.; Skinner, D.;
Ceder, G.; Persson, K. A. Commentary: The Materials Project: A materials genome approach to
accelerating materials innovation. APL Mater. 2013, 1, 011002.
S-38


