Embed Size (px)
Citation preview

ORIGINAL PAPER
He+ ion implantation and electron irradiation effectson cathodoluminescence of plagioclase
Masahiro Kayama • Hirotsugu Nishido •
Shin Toyoda • Kosei Komuro • Adrian A. Finch •
Martin R. Lee • Kiyotaka Ninagawa
Received: 9 December 2012 / Accepted: 5 April 2013 / Published online: 17 April 2013
� Springer-Verlag Berlin Heidelberg 2013
Abstract Cathodoluminescence (CL) spectra of unirra-
diated, He? ion-implanted and electron-irradiated plagio-
clase minerals contain the following emission bands: (1)
below 300 nm due to Pb2?, (2) at *320 and *350 nm to
Ce3?, (3) at 380–420 nm to Eu2?, Ti4? and/or Al–O-–Al/
Ti defects, (4) at 560–580 nm to Mn2? and (5) at
720–760 nm to Fe3?. During the implantation of He? ion,
much of their energy may be dissipated by partial
destruction and strain of the feldspar framework, resulting
in quenching of CL. Deconvolution of CL spectra acquired
from albite and oligoclase reveals an emission component
at 1.86 eV (666 nm) assigned to a radiation-induced defect
center associated with Na? atoms. As its intensity increases
with radiation dose, this emission component has potential
for geodosimetry and geochronometry. Electron irradiation
causes Na? migration in plagioclase, and then a consider-
able reduction in intensity of emissions assigned to impu-
rity centers, which is responsible for an alteration in the
energy state or a decrease in luminescence efficiency fol-
lowing the change of activation energy. Emission intensity
at 1.86 eV positively correlates with electron irradiation
time for unimplanted and He? ion-implanted albite and
oligoclase, but negatively for the implanted albite above
1.07 9 10-4 C/cm2. It implies that radiation halo produced
by a-particles should not be measured using CL spectros-
copy to estimate b radiation dose on albite in the high
radiation level.
Keywords Cathodoluminescence � Plagioclase � He? ion
implantation � Electron irradiation � Radiation-induced
defect center
Introduction
The formation of radiation-induced defect centers in
feldspars has been actively and extensively investigated in
order to interpret the effects of ion, proton, neutron,
electron and X-ray irradiation on their crystal structure,
chemical composition, diffusivity and optical properties,
and to explore the geoscientific and planetary scientific
applications. Thermoluminescence (TL), optical stimu-
lated luminescence (OSL) and electron spin resonance
(ESR) analyses of minerals enable estimation of the
density of various types of lattice defects produced by
natural radiations over geological timescales and can be
used for geodosimetry and geochronometry of minerals
M. Kayama (&)
Department of Earth and Planetary Systems Science, Graduate
School of Science, Hiroshima University, 1-3-1 Kagami-yama,
Higashi-Hiroshima, Hiroshima 739-8526, Japan
e-mail: [email protected]
H. Nishido
Department of Biosphere-Geosphere Science, Okayama
University of Science, 1-1 Ridaicho, Kita-ku, Okayama,
Okayama 700-0005, Japan
S. Toyoda � K. Ninagawa
Department of Applied Physics, Okayama University of Science,
1-1 Ridaicho, Kita-ku, Okayama, Okayama 700-0005, Japan
K. Komuro
Earth Evolution Sciences, University of Tsukuba,
1-1-1 Ten-nodai, Tsukuba, Ibaraki 305-8571, Japan
A. A. Finch
Department of Earth Sciences, University of St Andrews, Irvine
Building, North Street, St Andrews, Fife KY16 9AL, UK
M. R. Lee
School of Geographical and Earth Sciences, University of
Glasgow, Lilybank Gardens, Glasgow G12 8QQ, UK
123
Phys Chem Minerals (2013) 40:531–545
DOI 10.1007/s00269-013-0590-8

such as feldspar in sedimentary rocks, and volcanic ejecta
provided that the annual dose rate is also known (Wintle
and Huntly 1979; Guerin and Valldas 1980; Huntly et al.
1985; Petrov 1994). The transportation and deposition of
fluvial sediments can also be investigated using feldspar
OSL because the luminescence signals are derived from
radiative transitions of electrons trapped at lattice defects
by natural radiation after deposition and shielding from
sunlight (Shirai et al. 2008). Ion, proton and X-ray
bombardment of plagioclase crystals exposed on the sur-
faces of Moon and Mercury (i.e. space weathering) con-
tributes to the production of the lattice defects and release
of Na atoms, which is the origin of sodium ions in the
exospheres (Sprague et al. 2002; Wurz and Lammer 2003;
Lowitzer et al. 2008). As described above, there is con-
siderable scientific interest in radiation-induced defect
centers in feldspar, especially plagioclase, but their for-
mation process has not been clarified in detail. This is due
to the difficulty in characterizing radiation effect on
feldspars by ions, protons and electrons as well as a and bparticles that are seen from grain surfaces to depth of
several tens to hundreds of micrometers because con-
ventional analytical methods require the extraction of
large quantities of the mineral grains from the target
sediments.
Cathodoluminescence (CL) is the electron-stimulated
emission of photons at ultraviolet (UV) to infrared (IR)
wavelengths from a material. CL spectroscopy and
microscopy provide valuable information on the existence
and distribution of the radiation-induced defects in miner-
als with a spatial resolution of a few micrometers, and so
can elucidate the effects of radiation on the near-surface
region of mineral grains (i.e. within layers several tens to
hundreds of micrometer in thickness). According to Owen
(1988), micrometer-sized radiation halos produced by aparticles appear prominently in quartz using a CL micro-
scope, but are indistinct or invisible under a petrographic
microscope. Recently, CL measurements on ion-implanted
quartz and albite have enabled interpretation of radiation
effects, including observation of radiation damage as a CL
halo and estimation of the radiation dose (Komuro et al.
2002; Okumura et al. 2008; Krickl et al. 2008; Kayama
et al. 2011a, b; King et al. 2011). These results indicate that
the technique has the potential for estimating the a radia-
tion dose from natural radionuclides on albite. However,
almost all CL studies have focused on ion-implanted albite
rather than on other plagioclase group minerals. Also, there
have been many important studies of the radiation effects
on TL, OSL and ESR of X-ray- and c-ray-irradiated feld-
spars (Wintle and Huntly 1979; Guerin and Valldas 1980;
Huntly et al. 1985; Petrov 1994), whereas very few
investigators have reported ion implantation and electron
irradiation effects.
This study has sought to determine the impact of: (1)
He? ion implantation at 4.0 MeV, corresponding to the
energy of a-ray generated by the disintegration of 238U and232Th and (2) electron irradiation on assuming b-ray.
Samples and methods
Cathodoluminescence (CL) and Raman analyses were
carried out for single crystals of the following minerals:
albite (Ab) (Or0Ab99Or1) form a pegmatite in a Pre-
cambrian granite from Minas Gerais, Brazil; oligoclase
(Ol) (Or0Ab76An23) phenocrysts from a Late Cretaceous
granite in the Ryoke metamorphic belts from Inabu, Aichi,
Japan; andesine (Ad) (Or2Ab51An47) phenocrysts from a
Pleistocene trachyandesite in the Izu-Boin volcanic arc of
Iwo Jima, Tokyo, Japan; labradorite (La) (Or2Ab29An69)
phenocrysts from a Precambrian granitic gneiss from
Bekily, Madagascar; bytownite (By) (Or1Ab21An78)
phenocrysts from a Cenozoic weathered basalt from Chi-
huahua, Mexico; anorthite (An) (Or0Ab3An97) phenocrysts
from a Cenozoic andesite in Yoichi, Hokkaido, Japan.
Microstructures and microtextures associated with exsolu-
tion and twining were located by optical microscopy and
backscattered electron SEM imaging of the plagioclase
grains and avoid in subsequent CL work owing to their
potential impact on the results. Slices of the single crystals
(10 9 10 9 1 mm) were cut perpendicular to c-axis for
CL and Raman measurements in order to avoid a polari-
zation effects as suggested by Finch et al. (2003). The
sliced samples were polished and finished with a 1-lm
diamond abrasive. CL microscopy and spectroscopy were
preliminarily conducted on the surface of the sliced sam-
ples to select the areas with comparable CL intensity and
homogeneous distribution of the intensity before the He?
ion implantation experiments.
He? ion implantation was performed perpendicular to the
surfaces of the slices using a 3M-tandem ion accelerator
located at Takasaki Research Center of the Japan Atomic
Energy Research Institute. The ion beam had a 4.0 MeV
implantation energy which corresponds to the energy of an aparticle from 238U and 232Th disintegration. A specific dose
density was set in the range from 2.18 9 10-6 to
6.33 9 10-4 C/cm2 for the albite, bytownite and anorthite
and 5.37 9 10-6 to 5.01 9 10-4 C/cm2 for the oligoclase,
andesine and labradorite (Table 1). The implanted samples
are denoted according to their relative dose density, for
example, Ab00 for unimplanted albite and Ab10 for albite
that received the highest dose. CL spectra were acquired
from the implanted surface of the samples, which is indi-
cated by the postscript ‘‘S,’’ for example, Ol01S for oligo-
clase implanted at the lowest dose and Ol08S for oligoclase
implanted at the highest dose. The implanted samples were
532 Phys Chem Minerals (2013) 40:531–545
123
also cut perpendicular to the exposed surfaces for CL line
analysis and high-resolution CL imaging of the cross-sec-
tions. The sectional samples are denoted by the postscript
‘‘C,’’ for example, Ad00C for unimplanted andesine and
Ad10C for andesine implanted at the highest radiation dose.
The details of the He? ion implantation experiments and
sample preparation are described by Okumura et al. (2008)
and Kayama et al. (2011a).
Prolonged electron irradiation experiments were carried
out on unimplanted and He? ion-implanted plagioclase at the
highest radiation doses of 6.33 9 10-4 C/cm2 for the albite,
bytownite and anorthite and 5.01 9 10-4 C/cm2 for the
oligoclase, andesine and labradorite. The electron irradiation
was undertaken in a scanning electron microscopy-cath-
odoluminescence (SEM-CL) instrument, which comprised a
JEOL: JSM-5410 SEM and a grating monochromator
(Oxford: Mono CL2). The SEM was operated at a 15 kV
accelerating voltage and 50 nA beam current. The electron
beam was scanned over an area of 110 9 93 lm for 1 h.
Scanning electron microscopy-cathodoluminescence
(SEM-CL) was also used to obtain CL spectra with operating
conditions of 15 kV and 2.0 nA in scanning mode with a
110 9 93 lm scanning area. This beam condition was
established based on the preliminary CL spectroscopy for
the prevention of electron irradiation damage and
enhancement of the signal/noise (S/N) ratio. All CL spectra
were obtained in the range from 300 to 800 nm in 1-nm steps
and were corrected for the total instrumental response using
a calibrated standard lamp. Following Stevens-Kalceff
(2009) and Kayama et al. (2010), the corrected CL spectra in
energy units were deconvoluted into the Gaussian compo-
nents corresponding to each emission center using the peak-
fitting software (peak analyzer) implemented in OriginPro
8J SR2. High-resolution CL images were acquired using a
Gatan: MiniCL imaging system under the same condition as
CL spectral analysis by SEM-CL. More details of the
equipment construction and analytical procedures can be
found in Ikenaga et al. (2000) and Kayama et al. (2010).
Raman spectral and line analyses were performed with a
laser Raman microscope (Thermo Electron Nicolet:
Almega XR), where the Nd:YAG laser (532 nm excitation
line) were selected and controlled at 20 mW with a *1 lm
spot size. The operating conditions were set as five accu-
mulations of 10 s each in the range 200–900 cm-1 in steps
of 1 cm-1. Raman bands were calibrated by monitoring the
position of the O–Si–O bending vibration (464 cm-1) in a
high optical grade quartz standard before and after the
measurements. Further details of the instruments and ana-
lytical procedures are described by Kayama et al. (2009).
Results
He? ion-implanted plagioclase
CL microscopy and spectroscopy
Panchromatic CL images of the cross-sections of the
implanted albite (Ab01C to Ab05C, Ab09C and Ab10C) and
oligoclase (Ol05C and Ol06C) reveal a bright luminescent
band (CL halo) on dull background that extends to a depth of
*12–14 lm beneath the implanted surface (Fig. 1a).
However, cross-sections of the other albite (Ab06C, Ab07C
and Ab08C) and oligoclase (Ol01C to Ol04C, Ol07C and
Ol08C) samples have a *1-lm-wide dark line on a bright
luminescent background at *12–14 lm beneath the
implanted surface (Fig. 1b). A similar dark line was
observed in CL images of all cross-section samples of the
implanted andesine, labradorite, bytownite and anorthite,
regardless of their radiation dose (Fig. 1c–f).
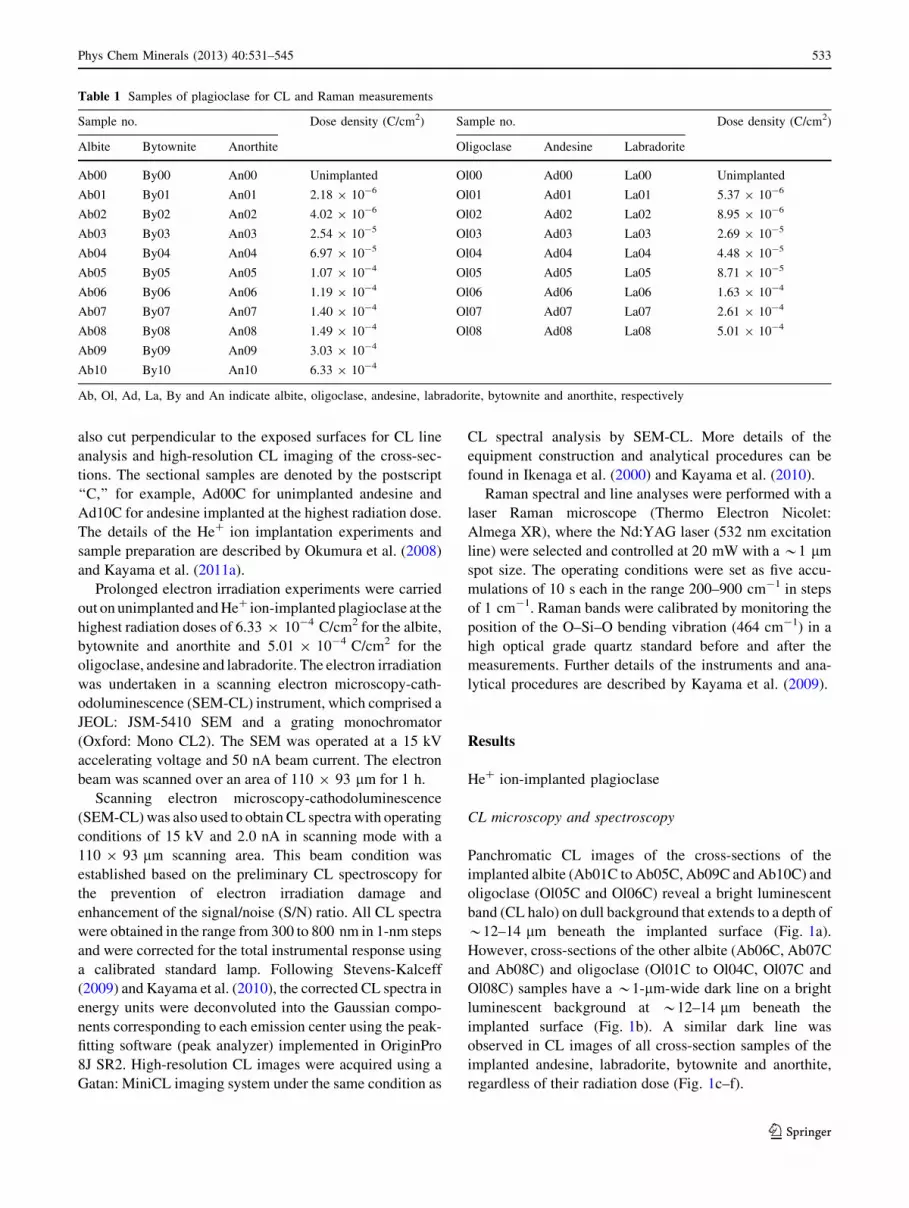
Table 1 Samples of plagioclase for CL and Raman measurements
Sample no. Dose density (C/cm2) Sample no. Dose density (C/cm2)
Albite Bytownite Anorthite Oligoclase Andesine Labradorite
Ab00 By00 An00 Unimplanted Ol00 Ad00 La00 Unimplanted
Ab01 By01 An01 2.18 9 10-6 Ol01 Ad01 La01 5.37 9 10-6
Ab02 By02 An02 4.02 9 10-6 Ol02 Ad02 La02 8.95 9 10-6
Ab03 By03 An03 2.54 9 10-5 Ol03 Ad03 La03 2.69 9 10-5
Ab04 By04 An04 6.97 9 10-5 Ol04 Ad04 La04 4.48 9 10-5
Ab05 By05 An05 1.07 9 10-4 Ol05 Ad05 La05 8.71 9 10-5
Ab06 By06 An06 1.19 9 10-4 Ol06 Ad06 La06 1.63 9 10-4
Ab07 By07 An07 1.40 9 10-4 Ol07 Ad07 La07 2.61 9 10-4
Ab08 By08 An08 1.49 9 10-4 Ol08 Ad08 La08 5.01 9 10-4
Ab09 By09 An09 3.03 9 10-4
Ab10 By10 An10 6.33 9 10-4
Ab, Ol, Ad, La, By and An indicate albite, oligoclase, andesine, labradorite, bytownite and anorthite, respectively
Phys Chem Minerals (2013) 40:531–545 533
123

The CL spectrum of Ab00S has an intense emission
band with peak wavelength centered below 300 nm, and
weaker bands that peak at *380, *560 and *740 nm
(Fig. 2a). Similar emission bands occur in CL spectra of
the implanted albite, where the emission intensities at
*560 and *740 nm are lower than those of unimplanted
albite, but the intensity differences vary with radiation
dose. On the other hand, the intensity of CL emission at
*380 nm increases slightly with radiation dose. The
implanted albite also shows red CL emission at
700–750 nm, and its intensity correlates with radiation
dose. CL spectra of unimplanted and implanted oligoclase
have an intense emission band overlapped with two peaks
at *320 and *350 nm, a weak band at *420 nm and
moderate emission bands at *560, 700–750 and
*740 nm. The intensities at *420 and 700–750 nm
increase slightly with the radiation dose, but those at
*320, *350, *560 and *740 nm decrease with
increasing dose (Fig. 2b). Andesine, labradorite and
bytownite with or without implantation show doublet
Fig. 1 Panchromatic CL images of cross-sections of He? ion-
implanted a albite (Ab10C), b oligoclase (Ol08C), c andesine
(Ad08C), d labradorite (La08C), e bytownite (By10C) and f anorthite
(An10C). White lines indicate the traces of Raman line analyses for
the plagioclase, shown in Fig. 4. Scale bars are 20 lm
534 Phys Chem Minerals (2013) 40:531–545
123

emission bands at *320 and *350 nm, intense bands at
*420 and *760 nm and relatively weak emission at
560–580 nm (Fig. 2c–e). The andesine, labradorite and
bytownite implanted at high radiation dose have lower CL
intensities in these emission bands than those samples that
received a lower dose. CL spectra of unimplanted and
implanted anorthite contain emission bands at *380,
*560 and *720 nm, which show a slight decrease or no
change in their intensity with radiation dose (Fig. 2f).
Raman spectroscopy and line analysis
Raman spectra acquired from the CL halo or dark line at
*12–14 lm depth in cross-sections of the plagioclase
samples have various peaks with a lower intensity and
broader bandwidth than those of the unirradiated sample
region at 20 lm depth (Fig. 3). Furthermore, Raman peaks
of the CL halo or dark line in each plagioclase show a
decrease in the intensity and increase in the full width at
half maximum (FWHM) and background with radiation
dose. Figure 3 also reveals that Ca-rich plagioclase tends to
have greater rate of reduction in intensity of the peaks with
He? ion implantation than Na-rich plagioclase.
The intensity of the Raman peak at *508 cm-1 was
monitored in the cross-sections of each sample implanted at
the highest radiation dose. Measurements were taken per-
pendicular to the implanted surface to 20 lm depth across
the CL halo or dark line at *12–14 lm, as illustrated by the
white line in Fig. 1. These traverses show a gradual decrease
in intensity of the peak at *508 cm-1 with implantation
depth to*11–13 lm, a sharp decrease to*12–14 lm, then
increase to 16 lm (Fig. 4). The rate of reduction in intensity
at *12–14 lm depth in Ca-rich plagioclase is appreciably
greater than for Na-rich plagioclase.
Electron-irradiated plagioclase
Panchromatic CL images of plagioclase show rectangular
areas of dull CL on a bright luminescent background; they
correspond to areas that had undergone 1 h of electron
Fig. 2 CL spectra of
a unimplanted (Ab00S) and
He? ion-implanted albite
(Ab10S), b unimplanted
(Ol00S) and He? ion-implanted
oligoclase (Ol08S),
c unimplanted (Ad00S) and He?
ion-implanted andesine
(Ad08S), d unimplanted
(La00S) and He? ion-implanted
labradorite (La08S),
e unimplanted (By00S) and He?
ion-implanted bytownite
(By10S) and f unimplanted
(An00S) and He? ion-implanted
anorthite (An10S)
Phys Chem Minerals (2013) 40:531–545 535
123

irradiation (Fig. 5). CL spectra of the electron-irradiated
areas in unimplanted plagioclase show emission bands
centered below 300 nm in the UV peaks at *320, *350,
380–420, 560–580 and 720–760 nm in the UV-blue, yel-
low and red-IR regions, which also occur in the unirradi-
ated areas (Fig. 6). Electron irradiation reduces the
intensity of these CL emission bands relative to unirradi-
ated parts of the samples, where the rate of reduction in
intensity for An00S is appreciably lower than in the other
plagioclase minerals. Red emission at 700–750 nm is also
detectable in CL spectra of the electron-irradiated areas of
Ab00S and Ol00S, but not in Ad00S, La00S, By00S and
An00S. Figure 7 shows a change in the red emission
intensity during 600 s of electron irradiation. It reveals that
there is a large increase in intensity up to *50 s and
subsequent gradual increase to 600-s irradiation for Ab00S
and Ol00S.
Analogous emissions at *320, *350, 380–420,
560–580, 700–750 and 720–760 nm were obtained from
CL spectra of the prolonged electron-irradiated areas in the
implanted plagioclase (Ab10S, Ol08S, Ad08S, La08S,
By10S and An10S) (Fig. 8). Electron irradiation of the
implanted plagioclase, especially Na-rich samples, leads to
a sharp reduction in emission intensity, except for the red
emissions at 700–750 nm in Ol08S. With an increase in
duration up to *50 s, the red emission intensity of Ol08S
increases, but that of Ab10S decreases (Fig. 7). Subse-
quently, a gradual increase in the intensity of Ol08S and
decrease in Ab10S continues up to 600 s of electron
irradiation.
Discussion
He? ion implantation
The *12–14 lm distances of CL halo or dark line beneath
sample surfaces recognized in CL images are concordant
Fig. 3 Raman spectra obtained
from the CL halo or dark line at
*12–14 lm beneath the He?
ion-implanted surface of the
cross-section samples (‘‘Halo’’)
and unimplanted host at 20 lm
depth (‘‘Host’’) for a Ab10C,
b Ol08C, c Ad08C, d La08C,
e By10C and f An10C
536 Phys Chem Minerals (2013) 40:531–545
123

with the maximum of the electronic energy loss of
4.0 MeV He? ions in plagioclase (Bragg and Kleeman
1905; Nogami and Hurley 1948; Faul 1954; Owen 1988;
Komuro et al. 2002; Okumura et al. 2008), but not in
complete agreement, probably due to the He? ion
implantation condition or spatial resolution of CL micros-
copy proposed by Okumura et al. (2008). Nevertheless, it is
noteworthy that He? ion implantation significantly affects
CL properties, but the impact differs between plagioclase
minerals and varies with radiation dose. He? ion implan-
tation into plagioclase leads to partial destruction of the
feldspar framework or introduction of strain, migration of
monovalent cations such as Na? to an unirradiated sample
regions and formation of lattice defects; individually or in
combination these effects result in a change of the CL
properties with the radiation dose. Outcomes of these
processes should be closely linked to chemical composi-
tion, crystal structure, diffusivity of cations, and type and
concentration of emission centers, as described in the fol-
lowing sections.
Partial destruction or strain of the framework structure
Raman spectra of these plagioclase minerals commonly
have a pronounced peak at *508 cm-1 (Fig. 3), which is
assigned to the symmetric stretching of bridging oxygens
in T–O–T linkages (ms (T–O–T)) (Matson et al. 1986). The
CL halo or dark line at *12–14 lm depth beneath the
implanted surface shows a lower intensity, broader band-
width and higher background than the unirradiated sample
region (Fig. 3). With an increase in radiation dose, the
Raman peak at *508 cm-1 also shows a decrease in the
intensity and increase in the FWHM and background
acquired from the CL halo or dark line at *12–14 lm.
These findings, therefore, reveal that He? ion implantation
partially destroys or induces strain into the feldspar
framework, and to an extent that is proportional to radia-
tion dose.
Raman spectra acquired from cross-sections of the pla-
gioclase samples and along a line normal to their implanted
surface indicate that the intensity of the peak at
Fig. 4 A plot showing the
change in intensity of the
Raman peak at 508 cm-1 from
the implanted surfaces of cross-
section samples to 20 lm depth
for a Ab10C, b Ol08C,
c Ad08C, d La08C, e By10C
and f An10C. The transects
along which Raman analyses
were acquired are indicated as
white lines in Fig. 1
Phys Chem Minerals (2013) 40:531–545 537
123

*508 cm-1 decreases from the surface to *12–14 lm
depth (Fig. 4). The rate of reduction in intensity with depth
is greatest for anorthite followed by bytownite, labradorite,
andesine, oligoclase and albite, and so is compositionally
dependent. According to Fritz et al. (2005), the relatively
weak Al–O bonds in the plagioclase structure are broken in
preference to the stronger Si–O bonds. This suggests that
damage should scale to Al content in feldspar, and so
damage from He? ion implantation should be greater for
Ca- rather than Na-rich plagioclase. Raman line analyses of
bytownite and anorthite also show a slight decrease in the
intensity at *508 cm-1 from 6 to 12 lm regardless of the
depths with quite low electronic energy loss of He? ion,
although those of other plagioclase exhibit almost no
change in intensity up to 12 lm. This may be also due to
high sensitivity of Al-rich plagioclase to lattice damage by
He? ion implantation. Therefore, He? ion implantation
destroys the feldspar framework or induces strain, and to an
extent that depends on radiation dose and Al content,
which may be responsible for the change in CL intensity.
Fig. 5 Panchromatic CL images of a Ab00S, b Ol00S, c Ad00S, d La00S, e By00S and f An00S after electron irradiation of 110 9 93 lm areas
at 15 kV and 50 nA in scanning mode for 1 h. The electron irradiation areas are labeled
538 Phys Chem Minerals (2013) 40:531–545
123

Cation migration
Migration of monovalent cations such Na? occurs in
feldspar due to ion implantation and electron irradiation,
where the diffusivity is closely related to radiation dose,
chemical composition and defect density (Lineweaver
1963; Jambon and Carron 1976; Petit et al. 1987; Watson
and Dohmen 2010). The extent of lattice damage caused by
ion implantation and its consequent diffusion are deter-
mined by the implantation dose (Watson and Dohmen
2010). Behrens et al. (1990) demonstrated that Na? diffu-
sivity increases with Na content in plagioclase, and Li-
neweaver (1963) found that electron irradiation transfers
alkali elements into unirradiated areas due to the formation
of the electric fields produced by displacement of oxygen.
This may be potentially caused by He? ion implantation
because the implantation leads to the formation of various
types of oxygen vacancy centers associated with Al–O-–
Al/Ti defect center and the radiation-induced defect center,
as will be described in the following section of ‘‘Defect
centers.’’ The process of alkali element migration varies
greatly between feldspar and glass, so that the diffusion
coefficient in feldspar glass is approximately one hundred
times higher than that of feldspar (Jambon and Carron
1976; Giletti and Shanahan 1997). According to Jambon
and Carron (1976), this phenomenon may be explained by
the substantially higher defect density of feldspar glass.
Since various types of lattice defects form in feldspar as the
framework is damaged during He? ion implantation
(Kayama et al. 2011a, b), structural resistance to ion
implantation, which depends on Al content in feldspar,
should link closely to Na? diffusion.
As a result, He? ion implantation into plagioclase causes
a partial destruction or strain of the framework and Na?
migration, where the ion particles may lose much of their
energy during destruction of the crystal structure or strain
than by the process during Na? migration. Chemical
analysis by wavelength dispersive X-ray spectroscopy
(WDS) reveals a slight difference in Na content of the
plagioclase between unimplanted and He? ion-implanted
Fig. 6 CL spectra of
unirradiated and electron-
irradiated areas in a Ab00S,
b Ol00S, c Ad00S, d La00S,
e By00S and f An00S
Phys Chem Minerals (2013) 40:531–545 539
123

plagioclases at highest radiation dose (Table 2). As Raman
spectra of the implanted plagioclase exhibit a decrease in
intensity and an increase in FWHM and background with
radiation dose, the main impact on plagioclase of He? ion
implantation undertaken for the present study may be a
partial destruction or strain of the framework rather than
Na? migration.
Formation of defect centers
Various types of defect centers are produced in feldspar by
radiation including He? ion implantation, resulting in the
sensitizing of CL in feldspar. Finch and Klein (1999)
demonstrated that the emission intensity of UV-blue CL, as
activated by the Al–O-–Al/Ti defect center, depends on
radiation dose as a function of the defect density. Red CL
emission assigned to radiation-induced defect center is
recognized in He? ion-implanted albite, of which the
intensity increases with radiation dose and the defect
density (Kayama et al. 2011a, b). CL spectra of the present
Na-rich plagioclase reveal an increase in UV-blue and red
emission intensities with radiation dose (Fig. 2), which
may be due to the formation of radiation-induced defect
centers accompanying He? ion implantation.
Change of luminescence properties
Cathodoluminescence (CL) spectra of unimplanted and
He? ion-implanted plagioclase consist of multicausal
emission bands in the UV-blue, yellow, red and IR regions
(Fig. 2). These bands are assigned to various types of
emission centers as follows. The UV emissions, centered
below 300 nm, occur in CL spectra of unimplanted and
implanted albite and oligoclase, and may correspond to the
band at 284 nm caused by the Pb2? impurity center, as
demonstrated by Vaggelli et al. (2005). CL spectra of un-
implanted and the implanted oligoclase, andesine and
labradorite have a doublet emission band at *320 and
*350 nm, which is composed of overlapping of multiple
narrow peaks attributed to the Ce3? impurity center (Laud
et al. 1971; Gotze et al. 2000). Previous studies of feldspars
have assigned the UV-blue CL emissions at 380–420 nm to
the Eu2? impurity, Ti4? impurity centers and/or Al–O-–
Al/Ti defect (Mariano et al. 1973; Gorobets et al. 1989;
Finch and Klein 1999; Gotze et al. 2000; Lee et al. 2007;
Parsons et al. 2008; Kayama et al. 2010). The Eu2?
impurity, Ti4? impurity and Al–O-–Al/Ti defect centers
act as a dominant activator for the emission bands at
*380 nm, *405 nm and *420 nm, respectively (Kay-
ama et al. 2010, 2011a). CL spectra of unimplanted and the
implanted plagioclase show yellow emissions at
560–580 nm that are assigned to the Mn2? impurity and
red-IR emissions at 720–760 nm due to the Fe3? impurity
centers, respectively (e.g. Smith and Stenstrom 1965;
Telfer and Walker 1978; Gotze et al. 2000; Krbetschek
et al. 2002). The red emissions at *660 nm, which are
overlapped and so concealed by the yellow and the red-IR
emissions, have also been observed in CL spectra of the
implanted albite and oligoclase. The red emission intensity
increases with the radiation dose as a function of radiation-
induced defect centers, and similar patterns have been
observed in ion-implanted albite and quartz (Komuro et al.
2002; Krickl et al. 2008; Okumura et al. 2008; Kayama
et al. 2011a). The response of these CL emission intensities
to He? ion implantation seems to be significantly different
between types of emission centers, that is, the impurity and
lattice defect (Fig. 2).
Impurity center
Cathodoluminescence (CL) emission assigned to the Pb2?,
Ce3?, Eu2?, Mn2? and Fe3? impurity centers decreases in
intensity with an increase in the radiation dose (Fig. 2).
This quenching of the CL may be caused by the following
processes; ion implantation makes a change in activation
energy associated with hopping between adjacent channels
and consequently produces a reduction in the luminescence
efficiency (Curie 1963; Brooks et al. 2001). According to
Fig. 7 Plots of the change in the red emission intensity with duration
of electron irradiation up to 600 s for a Ab00S and Ab10S, and
b Ol00S and Ol08S
540 Phys Chem Minerals (2013) 40:531–545
123

Blasse and Grabmaier (1994) and Kayama et al. (2009),
both luminescence efficiency and activation energy vary
depending on the energy state in the host structure. An
outermost electron in the impurities, related to radiative
transition, is susceptible to electronic states in the ligand
atoms, resulting in a variation of CL intensity and peak
wavelength depending on the crystal field that is a function
of the distance between impurity and the ligand (Telfer and
Walker 1978; Blasse and Grabmaier 1994). Therefore, the
partial destruction, strain or Na? migration due to He? ion
implantation may lead to a change of the energy state in the
plagioclase, resulting in a decrease in luminescence effi-
ciency of the impurity centers due to a change in the
activation energy. Alternatively, atomic bonds between the
impurities and their ligands are broken by He? ion
implantation so that the impurity centers are converted to
non-luminescent centers as the energy state is altered.
Although highly metamict zircon and glass include impu-
rity centers such as transition element and rare earth ele-
ments with sufficient contents for luminescence, there has
been less or almost no CL signal of the impurity centers
from them (e.g. Stevens-Kalceff et al. 2000; Nasdala et al.
2002). These facts suggest that the impurity centers
unlinked with their ligands (e.g. Fe3? impurity uncon-
nected with oxygens) may be non-luminescent centers even
Fig. 8 CL spectra of
unirradiated and electron-
irradiated areas in a Ab10S,
b Ol08S, c Ad08S, d La08S,
e By10S and f An10S
Table 2 Na content in unimplanted and He? ion-implanted
plagioclase
Na2O content
Ab00 Ol00 Ad00 La00 By00 An00
Unirradiated 11.67 10.25 6.29 5.55 4.45 0.41
Electron-irradiated 5.14 4.86 3.16 5.53 3.95 0.37
Ab10 Ol08 Ad08 La08 By10 An10
Unirradiated 11.54 9.48 6.20 5.22 4.45 0.40
Electron-irradiated 5.13 4.87 3.03 5.31 4.44 0.40
Na2O content are expressed as wt%
Phys Chem Minerals (2013) 40:531–545 541
123

if they exist in the structural materials. Nevertheless, these
outcomes of these processes may quench CL of the pla-
gioclase activated by the impurity centers. Comparable
quenching of CL arises from Na? migration, as will be
described in the following section of ‘‘Electron
irradiation.’’
The implanted anorthite shows a slight decrease in
yellow and red-IR emission intensities with radiation dose,
in spite of being the plagioclase that is most prone to
damage. This suggests that in feldspars with high concen-
trations of emission centers, there is a greater probability
that a bond related to an emission center will be broken and
also that Na? will migrate adjacent to an emission center.
This may be responsible for the lower degree of quenching
of the CL in anorthite. However, the UV, yellow and red-
IR emission intensities of the albite decrease to variable
extents with enhanced radiation dose, regardless of rela-
tively low concentration of the impurity centers. According
to Behrens et al. (1990), the diffusivity of Na? cations
increases with Na content, and this may explain the greater
rate of reduction in these emission intensities for albite than
anorthite. Furthermore, the higher the Ca content in pla-
gioclase, the lower the probability that an impurity center
will be related to Na, so that there will be less quenching of
CL caused by Na? migration. These facts imply that Na?
migration may be a more important determinant of CL
quenching in plagioclase rather than the partial destruction
of the feldspar framework.
Defect centers
Cathodoluminescence (CL) spectra of oligoclase show an
increase in the intensity of the emission band at
*420 nm with the radiation dose (Fig. 2), which may be
due to the formation of Al–O-–Al/Ti defect centers
accompanying He? ion implantation. Finch and Klein
(1999) concluded from modeling that the intensity of the
blue CL in feldspar scales with the percentage of
Lowenstein bridges with electron holes (Al–O-–Al
defect) in the crystal structure, which is closely related to
the natural radiation dose that it has received during its
geological history. According to Petrov et al. (1989),
electron holes are trapped in the oxygen position of
feldspar by natural c-ray and X-ray irradiation. Therefore,
the Al–O-–Al/Ti defect center is formed as a conse-
quence of trapping of electron holes in Lowenstein
bridges by He? ion implantation, which may contribute to
an increase in the intensity of UV-blue emission. How-
ever, albite, andesine, labradorite, bytownite and anorthite
do not show a corresponding increase in the UV-blue
emission intensity with radiation dose (Fig. 2). According
to Petrov (1994), the ESR signal from the Al–O-–Al
defect center is almost undetectable in Ca-rich feldspar,
and this may be the explanation for the lack of an
increase in the UV-blue emission intensity in plagioclases
apart for oligoclase. With regard to the albite, electron
holes may have been already trapped in almost all
Lowenstein bridges before He? ion implantation, or the
percentage of Lowenstein bridges could have been too
low to produce a detectable variation in the intensity of
UV-blue CL.
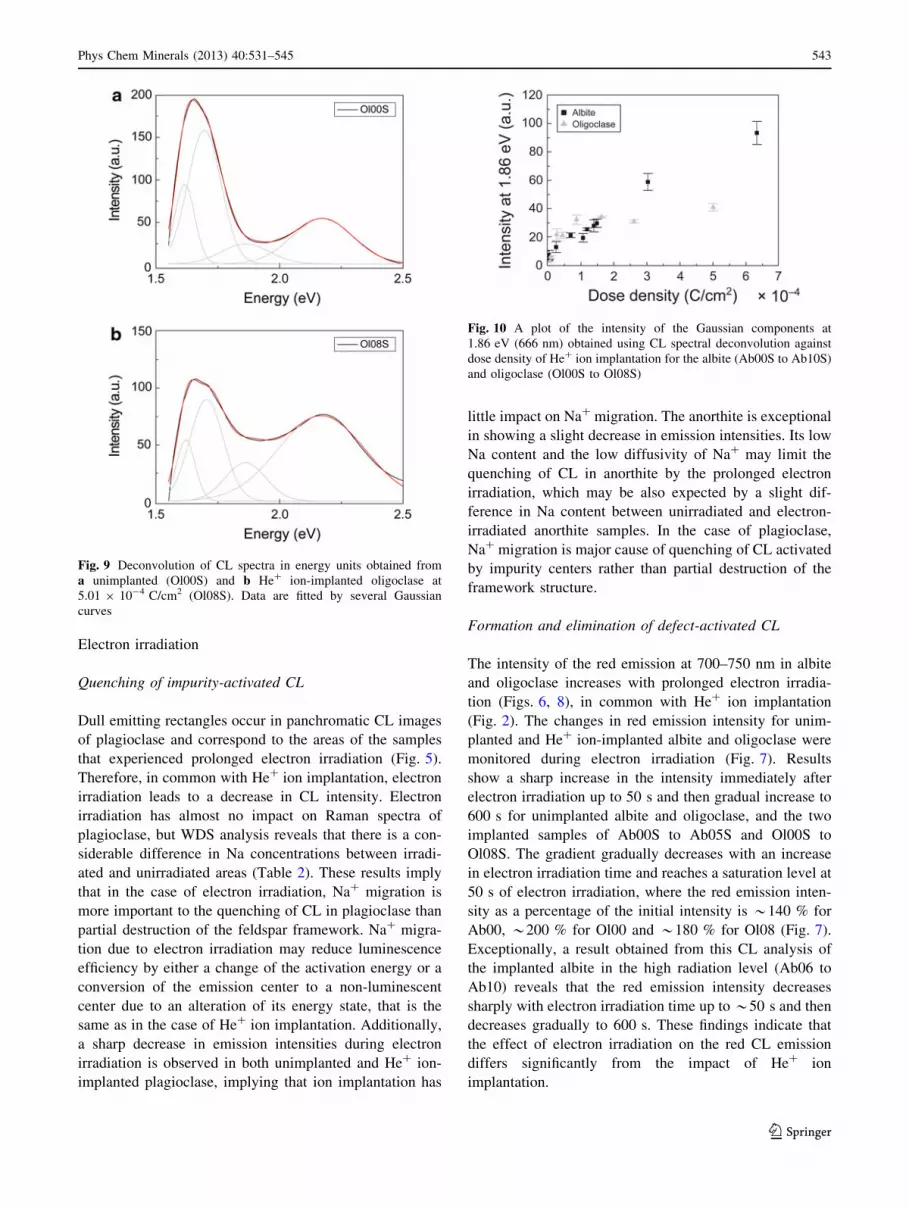
Cathodoluminescence (CL) spectra of He? ion-implan-
ted albite and oligoclase show an increase in red emission
intensity at *700–750 nm with radiation dose (Fig. 2).
Deconvolution of CL spectra from these samples by
Gaussian fitting reveals an emission component at 1.86 eV
(666 nm) (Fig. 9), which has been recognized previously in
the deconvoluted CL spectra of He? ion-implanted albite
(Kayama et al. 2011a, b). As this emission component is
undetectable in andesine, labradorite, bytownite and anor-
thite, it is assigned to the radiation-induced defect center
associated with Na atoms. However, further studies such as
annealing experiment and ESR analysis will be necessary
for an identification of type of the radiation-induced defect
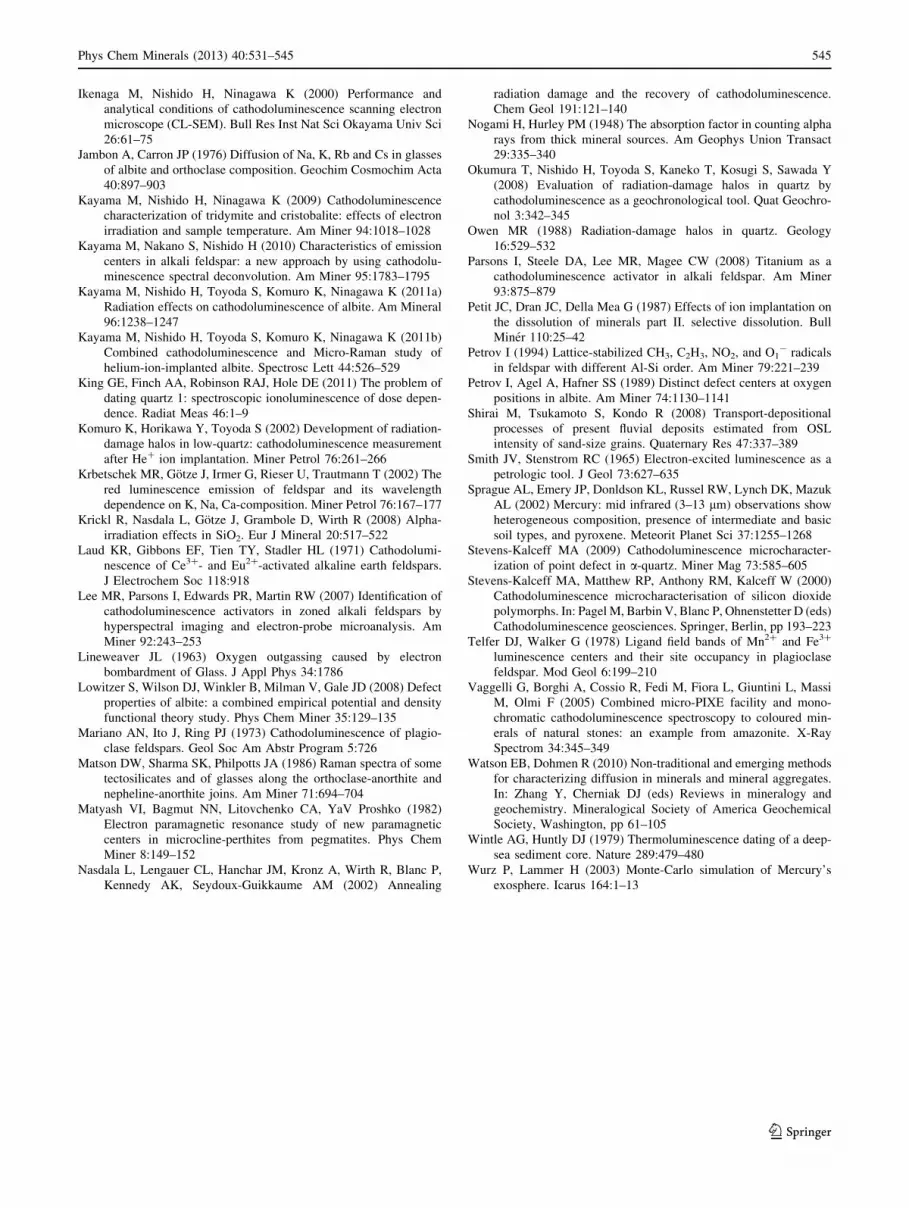
center. The intensity of the component at 1.86 eV
(666 nm) correlates with the radiation dose, of which an
increasing behavior significantly differs between the albite
and oligoclase (Fig. 10). Albite shows a linear correlation
between intensity and radiation dose up to 6.33 9 10-4 C/cm2,
whereas the oligoclase exhibits an exponential increase up
to 8.71 9 10-5 C/cm2 then a more gradual increase to
5.01 9 10-4 C/cm2. There is little difference in the gra-
dient of intensity versus dose between the albite and oli-
goclase up to 8.71 9 10-5 C/cm2. Taken together these
findings indicate that the efficiency of formation of the
radiation-induced defect center scales closely to Na content
in feldspar at the high radiation levels, but shows little
correspondence at lower doses. He? ion implantation into
oligoclase above 8.71 9 10-5 C/cm2 may change almost
the precursors into the radiation-induced defect centers
associated with Na atoms, similar to the case for red CL
in He? ion-implanted quartz (Okumura et al. 2008).
According to Kayama et al. (2011b), the intensity at
1.86 eV (666 nm) is essentially independent of the con-
centration and distribution of other emission centers, the
presence of microstructures or microtextures and crystal-
lographic orientation, which should be also recognized in
the oligoclase because of characteristic of the radiation-
induced defect center associated with Na atoms. The
radiation sensitivity obtained from CL spectral deconvo-
lution may potentially be used to estimate the natural aradiation dose that the Na-rich plagioclase has experienced.
Without a calibration of responses for mineralogical fea-
tures, this geodosimetry tool may be applied for albite in
the wide dose range, but for the oligoclase only in the low
dose range.
542 Phys Chem Minerals (2013) 40:531–545
123
Electron irradiation
Quenching of impurity-activated CL
Dull emitting rectangles occur in panchromatic CL images
of plagioclase and correspond to the areas of the samples
that experienced prolonged electron irradiation (Fig. 5).
Therefore, in common with He? ion implantation, electron
irradiation leads to a decrease in CL intensity. Electron
irradiation has almost no impact on Raman spectra of
plagioclase, but WDS analysis reveals that there is a con-
siderable difference in Na concentrations between irradi-
ated and unirradiated areas (Table 2). These results imply
that in the case of electron irradiation, Na? migration is
more important to the quenching of CL in plagioclase than
partial destruction of the feldspar framework. Na? migra-
tion due to electron irradiation may reduce luminescence
efficiency by either a change of the activation energy or a
conversion of the emission center to a non-luminescent
center due to an alteration of its energy state, that is the
same as in the case of He? ion implantation. Additionally,
a sharp decrease in emission intensities during electron
irradiation is observed in both unimplanted and He? ion-
implanted plagioclase, implying that ion implantation has
little impact on Na? migration. The anorthite is exceptional
in showing a slight decrease in emission intensities. Its low
Na content and the low diffusivity of Na? may limit the
quenching of CL in anorthite by the prolonged electron
irradiation, which may be also expected by a slight dif-
ference in Na content between unirradiated and electron-
irradiated anorthite samples. In the case of plagioclase,
Na? migration is major cause of quenching of CL activated
by impurity centers rather than partial destruction of the
framework structure.
Formation and elimination of defect-activated CL
The intensity of the red emission at 700–750 nm in albite
and oligoclase increases with prolonged electron irradia-
tion (Figs. 6, 8), in common with He? ion implantation
(Fig. 2). The changes in red emission intensity for unim-
planted and He? ion-implanted albite and oligoclase were
monitored during electron irradiation (Fig. 7). Results
show a sharp increase in the intensity immediately after
electron irradiation up to 50 s and then gradual increase to
600 s for unimplanted albite and oligoclase, and the two
implanted samples of Ab00S to Ab05S and Ol00S to
Ol08S. The gradient gradually decreases with an increase
in electron irradiation time and reaches a saturation level at
50 s of electron irradiation, where the red emission inten-
sity as a percentage of the initial intensity is *140 % for
Ab00, *200 % for Ol00 and *180 % for Ol08 (Fig. 7).
Exceptionally, a result obtained from this CL analysis of
the implanted albite in the high radiation level (Ab06 to
Ab10) reveals that the red emission intensity decreases
sharply with electron irradiation time up to *50 s and then
decreases gradually to 600 s. These findings indicate that
the effect of electron irradiation on the red CL emission
differs significantly from the impact of He? ion
implantation.
Fig. 9 Deconvolution of CL spectra in energy units obtained from
a unimplanted (Ol00S) and b He? ion-implanted oligoclase at
5.01 9 10-4 C/cm2 (Ol08S). Data are fitted by several Gaussian
curves
Fig. 10 A plot of the intensity of the Gaussian components at
1.86 eV (666 nm) obtained using CL spectral deconvolution against
dose density of He? ion implantation for the albite (Ab00S to Ab10S)
and oligoclase (Ol00S to Ol08S)
Phys Chem Minerals (2013) 40:531–545 543
123

The changes in red emission intensity during electron
irradiation may be closely related to the formation and
elimination of radiation-induced defect centers associated
with Na atoms in albite and oligoclase. Natural and artifi-
cial radiation, including He? ion implantation and electron
irradiation, produce not only the radiation-induced defect
center associated with Na atom and Al–O-–Al/Ti defect
center, but other types of defect centers such as another
type of oxygen vacancy, O- center associated with [Si,
M2?], Ag? and Pb2?, BOmn radical (e.g. SiO3
3-, PO32- and
NO2) and organic radical (e.g. C2H5 and CH3) (Matyash
et al. 1982; Petrov et al. 1989; Finch and Klein 1999; Gotze
et al. 2000; King et al. 2011). The oxygen vacancy con-
tributes to formation of positive charge at the oxygen
position and a consequent production of the electric fields
by displacement of oxygen. With an increase in radiation
dose, the population of oxygen vacancies and the amount
of positive charge both increase, resulting in a migration of
cations such as H?, Li? and Na? into non-radiated areas in
the structure (Lineweaver 1963; Jambon and Carron 1976;
Giletti and Shanahan 1997). According to King et al.
(2011), blue emission intensity decreases and red emission
intensity increases with radiation dose, which is caused by
a change of [AlO4/M?]0 (an emission center related to a
component at 3.3 eV) into [AlO4]- (a non-luminescence
center) plus non-bridging oxygen hole centers (NBOHC)
(emission center related to component at 1.9 eV) via
[AlO4]0 (an emission center related to a component at
3.6 eV) plus M? (free) due to ion and electron migration.
These results confirm that electron irradiation forms the
radiation-induced defect center associated with Na? atoms
and eliminates the defect center by Na? migration in the
structure due to production of large amount of the positive
charge in the oxygen position. These processes may be
responsible for an increase and decrease, respectively, in
the red emission intensity with duration of electron irra-
diation. In the case of unimplanted albite, the albite
implanted with He? ions at low doses, and the oligoclase,
formation of the radiation-induced defect center associated
with Na? cations should be a dominant process rather than
elimination of the defect center, leading to a considerable
increase in the red CL intensity up to *50 s of irradiation.
Subsequently, the formation and elimination processes may
reach equilibrium, which leads to saturation of the red
emission intensity above *50 s. The albite implanted at
high radiation doses has a sharp decrease in the emission
intensity up to *50 s and then gradual decrease to 600 s
because the elimination process predominantly occurs by
electron irradiation rather than the formation process. This
quenching of the red CL may be due to an increase in the
diffusivity of Na? cation by a partial destruction of the
feldspar framework to extent that depends on radiation
dose of He? ion implantation. Red emission intensity
correlates with electron irradiation time for unimplanted
and He? ion-implanted albite below 1.07 9 10-4 C/cm2
and for the oligoclase up to 5.01 9 10-4 C/cm2, indicating
that this emission may be used in geodosimetry to quantify
the b radiation to which the Na-rich plagioclase has been
exposed. However, there is a negative correlation between
the red emission intensity and electron irradiation time for
He? ion-implanted albite above 1.07 9 10-4 C/cm2.
Eventually, radiation halo produced by a-particles should
not be selected for the estimation of b radiation dose on
albite in the high radiation level using CL spectroscopy.
Acknowledgments We are deeply indebted to Dr. S. Nakano (Shiga
University, Shiga, Japan) for helpful suggestions on CL of feldspar.
We thank Dr. Y. Shibata (Technical center, Hiroshima University,
Hiroshima, Japan) for technical support on WDS using EPMA. The
measurement of EPMA was made using JXA-8200 at the Natural
Science Center for Basic Research and Development (N-BARD),
Hiroshima University. He? ion implantation experiments were sup-
ported by the Inter-University Program for the Joint Use of the Japan
Atomic Energy Agency (Takasaki), Grant No. 12010 to H. N.
References
Behrens H, Johannes W, Schmalzried H (1990) On the mechanisms of
cation diffusion processes in ternary feldspar. Phys Chem Miner
17:62–78
Blasse G, Grabmaier BC (1994) Radiative return to the ground state:
emission. In: Blasse G, Grabmaier BC (eds) Luminescent
Materials, 52. Springer, Berlin, pp 33–70
Bragg WH, Kleeman R (1905) Alpha particles or radium, and their
loss of range passing through various atoms and molecules.
Philos Mag 10:318–334
Brooks RJ, Ramachandran V, Hole DE, Townsend PD (2001) Dose
rate effects in ion beam luminescence. Radiat Eff Defects Solid
155:177–181
Curie D (1963) Thermal and optical activation of trapped electrons:
quenching effects. In: Curie D (ed) Luminescence in crystals,
chapter 7, Methuen, London, pp 202–208
Faul H (1954) Nuclear geology. Wiley, New York, p 414
Finch AA, Klein J (1999) The causes and petrological significance of
cathodoluminescence emission from alkali feldspars. Contrib
Mineral Petrol 135:234–243
Finch AA, Hole DE, Townsend PD (2003) Orientation dependence of
luminescence in plagioclase. Phys Chem Miner 30:373–381
Fritz J, Greshake A, Stoffler D (2005) Micro-Raman spectroscopy of
plagioclase and maskelynite in Martian meteorites: evidence of
progressive shock metamorphism. Antarct Meteor Res 18:
96–116
Giletti BJ, Shanahan TM (1997) Alkali diffusion in plagioclase
feldspar. Chem Geol 139:3–20
Gorobets BS, Gaft ML, Podolskyi AM (1989) Luminescence of
minerals and ores. Ministry of Geology, Moscow
Gotze J, Krbetschek MR, Habermann D, Wold D (2000) High-
resolution cathodoluminescence of feldspar minerals. In: Pagel
M, Barbin V, Blanc P, Ohnenstetter D (eds) Cathodolumines-
cence geosciences. Springer, Berlin, pp 245–270
Guerin G, Valldas G (1980) Thermoluminescence dating of volcanic
plagioclase. Nature 286:697–699
Huntly DJ, Godfrey-Smith DI, Thewalt MLW (1985) Optical dating
of sediments. Nature 313:105–107
544 Phys Chem Minerals (2013) 40:531–545
123
Ikenaga M, Nishido H, Ninagawa K (2000) Performance and
analytical conditions of cathodoluminescence scanning electron
microscope (CL-SEM). Bull Res Inst Nat Sci Okayama Univ Sci
26:61–75
Jambon A, Carron JP (1976) Diffusion of Na, K, Rb and Cs in glasses
of albite and orthoclase composition. Geochim Cosmochim Acta
40:897–903
Kayama M, Nishido H, Ninagawa K (2009) Cathodoluminescence
characterization of tridymite and cristobalite: effects of electron
irradiation and sample temperature. Am Miner 94:1018–1028
Kayama M, Nakano S, Nishido H (2010) Characteristics of emission
centers in alkali feldspar: a new approach by using cathodolu-
minescence spectral deconvolution. Am Miner 95:1783–1795
Kayama M, Nishido H, Toyoda S, Komuro K, Ninagawa K (2011a)
Radiation effects on cathodoluminescence of albite. Am Mineral
96:1238–1247
Kayama M, Nishido H, Toyoda S, Komuro K, Ninagawa K (2011b)
Combined cathodoluminescence and Micro-Raman study of
helium-ion-implanted albite. Spectrosc Lett 44:526–529
King GE, Finch AA, Robinson RAJ, Hole DE (2011) The problem of
dating quartz 1: spectroscopic ionoluminescence of dose depen-
dence. Radiat Meas 46:1–9
Komuro K, Horikawa Y, Toyoda S (2002) Development of radiation-
damage halos in low-quartz: cathodoluminescence measurement
after He? ion implantation. Miner Petrol 76:261–266
Krbetschek MR, Gotze J, Irmer G, Rieser U, Trautmann T (2002) The
red luminescence emission of feldspar and its wavelength
dependence on K, Na, Ca-composition. Miner Petrol 76:167–177
Krickl R, Nasdala L, Gotze J, Grambole D, Wirth R (2008) Alpha-
irradiation effects in SiO2. Eur J Mineral 20:517–522
Laud KR, Gibbons EF, Tien TY, Stadler HL (1971) Cathodolumi-
nescence of Ce3?- and Eu2?-activated alkaline earth feldspars.
J Electrochem Soc 118:918
Lee MR, Parsons I, Edwards PR, Martin RW (2007) Identification of
cathodoluminescence activators in zoned alkali feldspars by
hyperspectral imaging and electron-probe microanalysis. Am
Miner 92:243–253
Lineweaver JL (1963) Oxygen outgassing caused by electron
bombardment of Glass. J Appl Phys 34:1786
Lowitzer S, Wilson DJ, Winkler B, Milman V, Gale JD (2008) Defect
properties of albite: a combined empirical potential and density
functional theory study. Phys Chem Miner 35:129–135
Mariano AN, Ito J, Ring PJ (1973) Cathodoluminescence of plagio-
clase feldspars. Geol Soc Am Abstr Program 5:726
Matson DW, Sharma SK, Philpotts JA (1986) Raman spectra of some
tectosilicates and of glasses along the orthoclase-anorthite and
nepheline-anorthite joins. Am Miner 71:694–704
Matyash VI, Bagmut NN, Litovchenko CA, YaV Proshko (1982)
Electron paramagnetic resonance study of new paramagnetic
centers in microcline-perthites from pegmatites. Phys Chem
Miner 8:149–152
Nasdala L, Lengauer CL, Hanchar JM, Kronz A, Wirth R, Blanc P,
Kennedy AK, Seydoux-Guikkaume AM (2002) Annealing
radiation damage and the recovery of cathodoluminescence.
Chem Geol 191:121–140
Nogami H, Hurley PM (1948) The absorption factor in counting alpha
rays from thick mineral sources. Am Geophys Union Transact
29:335–340
Okumura T, Nishido H, Toyoda S, Kaneko T, Kosugi S, Sawada Y
(2008) Evaluation of radiation-damage halos in quartz by
cathodoluminescence as a geochronological tool. Quat Geochro-
nol 3:342–345
Owen MR (1988) Radiation-damage halos in quartz. Geology
16:529–532
Parsons I, Steele DA, Lee MR, Magee CW (2008) Titanium as a
cathodoluminescence activator in alkali feldspar. Am Miner
93:875–879
Petit JC, Dran JC, Della Mea G (1987) Effects of ion implantation on
the dissolution of minerals part II. selective dissolution. Bull
Miner 110:25–42
Petrov I (1994) Lattice-stabilized CH3, C2H3, NO2, and O1- radicals
in feldspar with different Al-Si order. Am Miner 79:221–239
Petrov I, Agel A, Hafner SS (1989) Distinct defect centers at oxygen
positions in albite. Am Miner 74:1130–1141
Shirai M, Tsukamoto S, Kondo R (2008) Transport-depositional
processes of present fluvial deposits estimated from OSL
intensity of sand-size grains. Quaternary Res 47:337–389
Smith JV, Stenstrom RC (1965) Electron-excited luminescence as a
petrologic tool. J Geol 73:627–635
Sprague AL, Emery JP, Donldson KL, Russel RW, Lynch DK, Mazuk
AL (2002) Mercury: mid infrared (3–13 lm) observations show
heterogeneous composition, presence of intermediate and basic
soil types, and pyroxene. Meteorit Planet Sci 37:1255–1268
Stevens-Kalceff MA (2009) Cathodoluminescence microcharacter-
ization of point defect in a-quartz. Miner Mag 73:585–605
Stevens-Kalceff MA, Matthew RP, Anthony RM, Kalceff W (2000)
Cathodoluminescence microcharacterisation of silicon dioxide
polymorphs. In: Pagel M, Barbin V, Blanc P, Ohnenstetter D (eds)
Cathodoluminescence geosciences. Springer, Berlin, pp 193–223
Telfer DJ, Walker G (1978) Ligand field bands of Mn2? and Fe3?
luminescence centers and their site occupancy in plagioclase
feldspar. Mod Geol 6:199–210
Vaggelli G, Borghi A, Cossio R, Fedi M, Fiora L, Giuntini L, Massi
M, Olmi F (2005) Combined micro-PIXE facility and mono-
chromatic cathodoluminescence spectroscopy to coloured min-
erals of natural stones: an example from amazonite. X-Ray
Spectrom 34:345–349
Watson EB, Dohmen R (2010) Non-traditional and emerging methods
for characterizing diffusion in minerals and mineral aggregates.
In: Zhang Y, Cherniak DJ (eds) Reviews in mineralogy and
geochemistry. Mineralogical Society of America Geochemical
Society, Washington, pp 61–105
Wintle AG, Huntly DJ (1979) Thermoluminescence dating of a deep-
sea sediment core. Nature 289:479–480
Wurz P, Lammer H (2003) Monte-Carlo simulation of Mercury’s
exosphere. Icarus 164:1–13
Phys Chem Minerals (2013) 40:531–545 545
123


