Embed Size (px)
Citation preview

TRANSLATIONAL PHYSIOLOGY
CALL FOR PAPERS Energy Homeostasis and Metabolic Diseases
High-fat diet induces site-specific unresponsiveness to LPS-stimulated STAT3activation in the hypothalamus
Beatriz de Carvalho Borges,1 Rodrigo Rorato,1 Ernane Torres Uchoa,1 Paula Marangon,1
Glauber S. F. da Silva,1,3 Francisco José de Paula,2 Luiz G. S. Branco,3 José Antunes-Rodrigues,1
and Lucila Leico Kagohara Elias1
1Department of Physiology and 2Department of Internal Medicine, School of Medicine of Ribeirao Preto, University of SaoPaulo, Brazil; and 3Department of Morphology, Physiology and Basic Pathology, Dental School of Ribeirao Preto, Universityof Sao Paulo, Brazil
Submitted 20 March 2013; accepted in final form 28 October 2013
Borges BC, Rorato R, Uchoa ET, Marangon P, da Silva GS, dePaula FJ, Branco LS, Antunes-Rodrigues J, Elias LK. High-fatdiet induces site-specific unresponsiveness to LPS-stimulated STAT3activation in the hypothalamus. Am J Physiol Regul Integr CompPhysiol 306: R34–R44, 2014. First published November 13, 2013;doi:10.1152/ajpregu.00147.2013.—Hypophagia induced by inflam-mation is associated with Janus kinase (JAK)-2/signal transducer andactivator of transcription (STAT) 3 signaling pathway, and leptin-mediated hypophagia is also mediated by JAK2-STAT3 pathway. Wehave previously reported that lipopolysaccharide (LPS) did not reducefood intake in leptin-resistant high-fat diet (HFD) rats but maintainedbody weight loss. We investigated whether changes in p-STAT3expression in the hypothalamus and brain stem could account for thedesensitization of hypophagia in HFD animals after a low LPS dose(100 �g/kg). Wistar rats fed standard diet (3.95 kcal/g) or HFD (6.3kcal/g) for 8 wk were assigned into control diet-saline, controldiet-LPS, HFD-saline, and HFD-LPS groups. LPS reduced feeding inthe control diet but not HFD. This group showed no p-STAT3expression in the paraventricular nucleus (PVN) and ventromedialhypothalamic nucleus (VMH), but sustained, though lower than con-trol, p-STAT3 in the nucleus of the solitary tract (NTS) and raphepallidus (RPa). LPS decreased body weight in HFD rats and increasedFos expression in the NTS. LPS increased body temperature, oxygenconsumption, and energy expenditure in both control diet and HFDrats, and this response was more pronounced in HFD-LPS group.Brown adipose tissue (BAT) thermogenesis and increased energyexpenditure seem to contribute to body weight loss in HFD-LPS. Thisresponse might be related with increased brain stem activation. Inconclusion, LPS activates STAT3-mediated pathway in the hypothal-amus and brain stem, leading to hypophagia, however, LPS effects onfood intake, but not body weight loss, are abolished by leptin resis-tance induced by HFD. The preserved STAT3 phosphorylation in thebrain stem suggests that unresponsiveness to LPS on STAT3 activa-tion under HFD might be selective to the hypothalamus.
high-fat diet; lipopolysaccharide; phospho-STAT3; Fos; uncouplingprotein-1; body temperature; indirect calorimetry
OBESITY, one of the largest public health problems, has beenreported to be coupled with chronic low-grade inflammation,
which is a causal factor of a range of metabolic disturbancessuch as diabetes and hypertension (14, 42). In diet-inducedexperimental obesity, rats fed high-fat diet (HFD) show resis-tance to leptin and increased inflammatory response, express-ing high levels of cytokines in the hypothalamus (38, 59).Lipopolysaccharide (LPS) from the outer lipid bilayer ofGram-negative bacteria cell wall is an important component ofinflammation during obesity development in mice, whoseplasma LPS levels increase two to three times after 4-wk HFDtreatment (10). Kelly and co-workers (34) reported that circu-lating LPS may transiently increase following energy-richmeals in both healthy and obese human subjects. Experimentalapproaches with nonobese rodents have shown that LPSacutely leads to hypophagia, cytokine production, and leptinsecretion (5, 26, 33, 48, 50).
Leptin participates to some extent in the anorexigenic re-sponses during endotoxemia induced by LPS (6, 50). In hypo-thalamic cells of the arcuate nucleus (ARC), leptin activatesJanus kinase (JAK)-2/signal transducer and activator of tran-scription (STAT) 3 signaling, stimulating the expression ofproopiomelanocortin (POMC) and cocaine- and amphetamine-regulated transcript (CART) peptides, known to drive, at leastin part, the anorexigenic effect of leptin (12, 23, 31). Inaddition to the hypothalamus, leptin receptor is also expressedwithin the brain stem, which is a crucial area for processingboth peripheral signals of energy metabolism and the control ofsatiety (37, 54). Furthermore, brain stem neurons have recip-rocal interconnections with the hypothalamic paraventricularnucleus (PVN) (52) known to take part in the anorexigeniceffects during endotoxemia.
Examining the interplay between leptin signaling and LPS-induced hypophagia, we reported in a previous study that HFDrats showed no hypophagic response induced by leptin, indi-cating leptin resistance and acute LPS treatment failed toinduce hypophagia in these leptin-resistant rats (6). Althoughthere was no effect on food intake, we observed that LPSreduced body weight in HFD rats (6). Body weight reductionand increasing of energy expenditure in rodents might berelated with the expression of uncoupling protein-1 (UCP-1) inbrown adipose tissue (BAT), which produces heat by oxidationof fatty acids, preventing the progress of obesity (2, 19, 22). An
Address for reprint requests and other correspondence: L. L. K. Elias,Avenida Bandeirantes, 3900 14049-900 Ribeirao Preto, Sao Paulo, Brazil(e-mail: [email protected]).
Am J Physiol Regul Integr Comp Physiol 306: R34–R44, 2014.First published November 13, 2013; doi:10.1152/ajpregu.00147.2013.
0363-6119/14 Copyright © 2014 the American Physiological Society http://www.ajpregu.orgR34

overview of the current literature shows increased BAT UCP-1mRNA and protein content after feeding a HFD in mice andrats. Furthermore, Cannon and co-workers (11) have proposedthat BAT thermogenesis is also stimulated by cytokines such asinterleukin (IL)-1� and IL-6, which are produced in responseto LPS.
From the aforementioned data as indicative of commonsignaling pathway recruited by leptin and LPS in the hypothal-amus to modulate food intake reduction, and because STAT3phosphorylation is not only a marker of leptin signaling butalso an indicator of cytokine activation (4, 8, 61), in the presentreport we intended to investigate whether STAT3 phosphory-lation in response to LPS in the hypothalamus and brain stemcould be affected by leptin resistance induced by HFD, leadingto desensitization of hypophagia induced by LPS. We alsoevaluated the neuronal Fos expression in the brain stem toverify whether neuronal activation in HFD-fed rats after LPStreatment could, at least in part, account for body weight loss.To better address the LPS-induced weight loss in HFD-fed rats,we also investigated BAT UCP-1 protein expression, corebody temperature, oxygen consumption, and energy expendi-ture.
MATERIALS AND METHODS
Animals
Male Wistar rats, 100–110 g (4 wk old) (Central Animal Facility ofthe University of Sao Paulo, Campus Ribeirao Preto), were individ-ually housed in a light/dark- (lights on: 06:00 AM-06:00 PM) andtemperature- (23 � 1°C) controlled room with food and water avail-able ad libitum, unless otherwise stated. Obesity was induced duringan 8-wk interval of HFD consumption, whereas the control groupreceived standard diet consumption. Diets were prepared every weekbased on the American Institute of Nutrition (AIN)-93 guidelines forlaboratory rodent’s diets (47). Rats were adapted to the laboratoryenvironment for at least 3 days before the experimental procedures.During this period, rats were daily handled. All experimental proto-cols were approved by Ethical Committee for Animal Use of theSchool of Medicine of Ribeirao Preto.
Animal Treatment Protocol
The animals were subjected to intraperitoneal injection of saline(0.15 M NaCl, 1 ml/kg) or LPS from Escherichia coli (100 �g/kg in1 ml/kg, serotype 026:B6, Sigma) between 04:00 PM and 04:30 PM,2 h before lights off.
Experimental Procedures
Measurement of food, caloric intake, body weight gain, and BATUCP-1 content in HFD rats after LPS stimulation. Rats were indi-vidually housed and fed for 8 wk with standard diet (3.95 kcal/g; 7%fat) or HFD (6.3 kcal/g; 50% fat). Food/caloric intake by each rat wasmeasured every other day and body weight was measured once aweek. After 8 wk of control or HFD, rats were anesthetized with 2.5%tribromoethanol (TBE) for body fat content determination. Leanmuscle, bone, and fat mass were determined using the dual-energyX-ray technique in a densitometer provided with software for smallanimals (Discovery Wi, Hologic). Rats were randomly assigned intofour different groups of treatment (n � 7–8/group): 1) control diet-saline; 2) control diet-LPS, 3) HFD-saline, and 4) HFD-LPS. On theday of the experiment, food was withdrawn for 2 h at 04:00 PM andrats were refed at 06:00 PM. At 04:00 PM rats received intraperitonealinjections of saline or LPS (100 �g/kg). Food consumption wasmeasured 2 and 24 h after the injection. Body weight was determined
before injection and 24 h after. Twenty-four hours after saline or LPSinjections, animals were decapitated, and BAT from the interscapulardepots was carefully excised and snap frozen in dry ice for storage at�80°C until protein extraction for Western blotting performance.
Analysis of STAT3 phosphorylation, Fos, and Fos/tyrosine hydrox-ylase expression in HFD rats after LPS stimulation. Another set ofrats treated for 8 wk with standard diet or HFD was assigned into fourabove-mentioned groups (n � 5–6/group). On the day of the exper-iment, food was withdrawn at 04:00 PM, when rats received intra-peritoneal injection of vehicle (0.15 M NaCl in 1 ml/kg) or LPS (100�g/kg), and 2 h after, they were anesthetized with an overdose of2.5% TBE and transcardially perfused with 200 ml of saline followedby 300 ml of 4% formaldehyde in 0.1 M phosphate buffer (PBS).Brains were collected, postfixed in the same fixative solution for 1 h,placed in PBS containing 30% sucrose, and stored at 4°C for posteriorimmunohistochemistry procedures.
Analysis of core body temperature, oxygen consumption, RQ, andenergy expenditure in HFD-fed rats after LPS stimulation. Ratstreated for 8 wk with standard diet or HFD were assigned into the fourabove-mentioned groups (n � 6–9/group). Seven days before theexperiment, anesthetized rats (mixture of ketamine and xylazine, 3:2,in a dose of 60 mg/kg ketamine and 7.5 mg/kg xylazine at a volumeof 0.1 ml/100 g) were submitted to paramedian laparotomy for theinsertion of a temperature datalogger (SubCue, Calgary, Canada).After surgery, the rats received a prophylactic injection of penicillin(50,000 units im). Each datalogger was programmed to acquire bodytemperature (Tb) every 5 min, at least 2 days before and throughoutthe experiments. On the day of the experiment, at 4:00 PM, ratsreceived intraperineal injection of saline or LPS (100 �g/kg). Twentyfour hours after the end of the experiments, animals were killed bydecapitation, the dataloggers were removed, and the data were down-loaded using SubCue software.
Another set of rats treated for 8 wk with standard diet and HFD wassubmitted to the laparotomy for the insertion of the datalogger, asdescribed above, and the rats were used for measurements of oxygenconsumption, respiratory quotient (RQ), and energy expenditure byindirect calorimetry. For these purposes, each animal was placedindividually into the chamber for gas measurements, as describedbelow, and allowed to rest for at least 40 min before starting baselinemeasurement, which was recorded during 45 min. After that, rats wereinjected with LPS (100 �g/kg ip, at 4:00 PM) and allowed to rest inthe chamber for 60 min before post-LPS measurements were started,which were performed during 120 min (from 1 to 3 h post-LPS). Datawere collected every minute and averaged over the period of mea-surement. The temperature of the chamber was monitored duringindirect calorimetry measurements. During the experiments of Tb
measurements and indirect calorimetry, the room temperature wassimilar (22–23°C) in all groups.
Indirect Calorimetry
Measurements of oxygen consumption (V̇O2) and carbon dioxideproduction (V̇CO2) were performed in a 5-liter chamber using openrespirometry approach. O2 and CO2 were analyzed (Gas analyzerML206, AdInstruments, NSW, Australia) from the inflow and outflowgas, and V̇O2 and V̇CO2 were computed from the inflow outflowconcentration difference of the respective gases, multiplied by theflow, which was maintained steady (1,500 ml/min) and continuouslymonitored by a flowmeter. V̇CO2 and V̇O2 were expressed as millilitersper minute or as percentage of baseline values. The RQ was obtainedby the ratio between V̇CO2 and V̇O2 (V̇CO2/V̇O2). Energy expenditure(EE, expressed as kcal/min) was calculated as the product of caloricvalue of oxygen (CV) and V̇O2, where CV � 3.815 � 1.232(RQ) (15,18, 54).
R35LPS-STIMULATED STAT3 ACTIVATION IN THE HYPOTHALAMUS
AJP-Regul Integr Comp Physiol • doi:10.1152/ajpregu.00147.2013 • www.ajpregu.org

Immunohistochemistry
Brain coronal sections were cut at 30-�m thickness and preservedin cryoprotectant (ethylene glycol and glycerol) at �20°C. One ofevery fourth section was immunostained for p-STAT3 and Fos/tyrosine hydroxylase (TH). Immunohistochemistry procedures werecarried out as previously described (6, 49). Briefly, sections wererinsed with buffer and incubated for 24 h at room temperature withrabbit anti-Fos antibody (Ab-5, 1:10,000, Calbiochem) or for 48 h at4°C with rabbit anti-p-STAT3 antibody (1:1,000, Cell Signaling).After rinsing was completed, sections were incubated for 1 h withsecondary biotinylated antibody goat anti-rabbit (1:200, Vector) andprocessed using the Vectastain Elite avidin-biotin immunoperoxidasemethod (Vector Laboratories). Solutions of diaminobenzidine (DAB),
nickel sulfate, and H2O2 were used to generate blue-black immuno-labeling. For double labeling, sections processed for Fos were incu-bated for 48 h at 4°C with monoclonal anti-TH antibody (anti-TH),raised in mouse (1:1,000, Chemicon), to identify catecholaminergicneurons. After incubation, sections were rinsed and submitted to thesame protocol described above, using biotinylated antibody anti-mouse (1:200, Vector) followed by avidin-biotin-peroxidase complex.The brown cytoplasmic color was detected using nonintensified DABsolution. Finally, sections were mounted on gelatinized slides, air-dried overnight, dehydrated, cleared in xylene, and placed under acoverslip with Entellan.
Immunopositive cells were identified in hypothalamic regions accord-ing to coordinates from the rat brain atlas of Paxinos and Watson (43):PVN: �0.92 mm to �2.12 mm from bregma; ARC and ventromedialhypothalamic nucleus (VMH):�2.3 mm to �3.5 mm from bregma; andin the brain stem rostral raphe pallidus nucleus (RPa): �12.30–14.30from bregma, and medial nucleus of the solitary tract (NTS): �13.68 mmfrom bregma. Photomicrographs were captured with a Leica microscopeequipped with a DC 200 digital camera, attached to a contrast enhance-ment device. The number of immunoreactive-positive cells of all thesections in the series (8–18 sections) per rat were obtained by countingblack (nuclear) staining or black (nuclear)/brown (cytoplasmic) stainingfrom a constant area of the PVN, ARC, VMH, RPa, and NTS, usingImage J software (Version 1.38, NIH).
Immunoblot Analysis
Total BAT protein was extracted using ice-cold sucrose buffer (300mM sucrose, 2 mM EDTA, 10 mM Trizma base, 1% Triton; pH � 7,2).Tissue samples (0.1 g/100 ml) were homogenized, and the homogenatewas centrifuged at 4°C, 2,500 rpm for 10 min. The supernatants were
Table 1. Food and caloric intake, body weight gain, andpercentage of body fat of rats fed with standard diet or HFDfor 8 wk
Control Diet HFD
Starting body weight, g 128.7 � 2.4 132.6 � 1.39Final body weight, g 512.5 � 14.12 576.9 � 16.25*Change in body weight, g 390.98 � 8.15 444.35 � 17.52*% Body fat 16.8 � 1.59 25.32 � 1.53*Average food consumption per day, g 26.08 � 0.53 18.81 � 0.51*Average caloric consumption per day,
kcal 103.02 � 2.09 115.11 � 3.12*
Data are means � SE; (n � 8). Control diet: 3.95 kcal/g; high-fat diet(HFD): 6.3 kcal/g. Student’s t-test was performed. *P � 0.05 when comparedwith the control group.
0
50
100
150
200
*
Fat m
ass
(g)
0
100
200
300
400
500
Lean
+ b
one
mas
s (g
)
0
10
20
30 *
Control dietHFD
% F
atA B C
-20
-10
0
10
20
**
Control Diet HFD
Bod
y w
eigh
t gai
n (g
)
0
50
100
150
200SalineLPS
2h 24h 2h 24h
Control Diet HFD
*
*
Cal
oric
inta
ke (K
cal)
**D E
Fig. 1. Lean � bone mass (g) (A), fat mass (g) (B), %Fat (C), cumulative caloric intake (kcal) during 2 and 24 h after LPS (D), and body weight 24 h afterlipopolysaccharide (LPS) injection (E) in rats fed with control diet (3.95 kcal/g) or high-fat diet (HFD, 6.3 kcal/g) for 8 wk. Student’s t-test was performed toanalyze A, B, and C (n � 6). Two-way ANOVA, followed by Newman-Keuls post hoc test was performed to analyze D and E (n � 7–8). Data are expressedas means � SE. *P � 0.05.
R36 LPS-STIMULATED STAT3 ACTIVATION IN THE HYPOTHALAMUS
AJP-Regul Integr Comp Physiol • doi:10.1152/ajpregu.00147.2013 • www.ajpregu.org

collected and protein concentrations were determined using the Bradfordmethod (7). Aliquots of the lysates containing 10 �g of protein weredenatured in Laemmli sample buffer [6% SDS, 30% glycerol, 0.02%bromophenol blue, 200 mm Tris·HCl (pH 6.8), and 250 mm mercapto-ethanol], at 95°C for 5 min. The samples were blotted onto nitrocellulosemembrane (Bio-Rad Laboratories). Nonspecific binding was preventedby immersing the membranes in blocking buffer (10% nonfat dry milk inTris-buffered saline-Tween 20, TBS-T) for 1 h at room temperature. Themembranes were then incubated overnight at 4°C with primary antibodygoat anti-UCP-1 (1:1,750; Santa Cruz Biotechnology) or mouse anti-�-tubulin (1:12,000; Santa Cruz Biotechnology). Blots were rinsed inTBS-T and then incubated with horseradish peroxidase-conjugated anti-goat (1:5,000) or anti-mouse (1:5,000) for 1 h at room temperature.Antibody-antigen complexes were visualized by detecting enhancedchemiluminescence by ECL detection system (Amersham Biosciences)in digital images using Quantity One 4.5.0 software (Bio-Rad).
Statistical Analysis
Results are expressed as means � SE and were analyzed usingSigma statistical software. Two-way analysis of variance (ANOVA)followed by Newman-Keuls posttest was used to analyze the exper-iments. We used Student’s t-test to analyze differences betweenmuscle, bone, and fat mass after control diet and HFD treatment.Differences were accepted as significant at P � 0.05.
RESULTS
Measurement of Food, Caloric Intake, and Body WeightGain in HFD-Fed Rats After LPS Stimulation
Food and caloric intake, body weight gain, and percentage ofbody fat of rats fed with standard diet or HFD for 8 wk arepresented in the Table 1. Rats fed with control diet ingestedhigher amount of food (g) than rats fed with HFD (P � 0.05).Despite the lower food consumption, rats from the HFD groupshowed higher (P � 0.05) daily average caloric intake (kcal).
The body weight gain increased similarly in both control dietand HFD group, and it had a significant divergence in HFD ratscompared with control rats from the eighth week on. We found
higher (P � 0.05) fat mass and percentage of body fat in ratsfed with HFD compared with control diet-fed rats, with nochanges in lean and bone mass (Fig. 1, A–C), indicating thedevelopment of obesity.
LPS reduced (P � 0.05) food intake 2 and 24 h afterinjection only in the animals from the control diet group, withno effect on feeding of HFD animals (Fig. 1D). Interestingly,LPS reduced (P � 0.05) body weight gain, in both the controldiet and HFD animals (Fig. 1E).
Analysis of STAT3 Phosphorylation, Fos, and Fos/THExpression After LPS Stimulation in HFD-Fed Rats
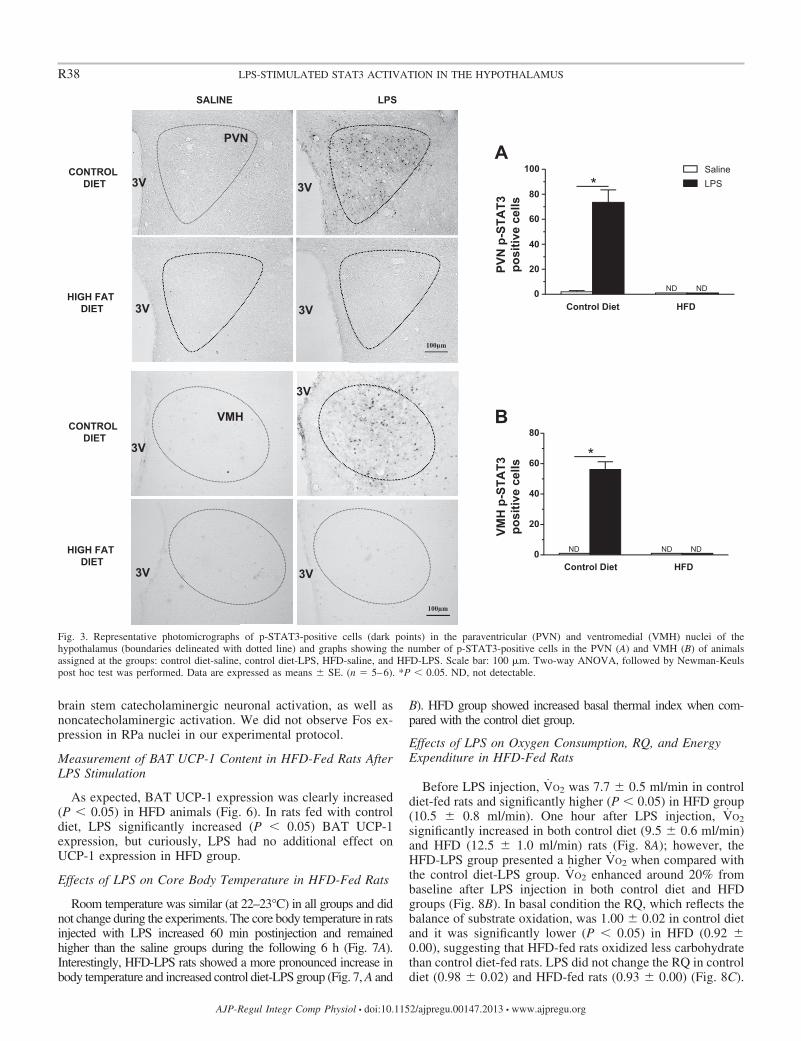
HFD increased the number of p-STAT3-positive cells (P �0.05) in the ARC compared with the control diet (Fig. 2). Incontrol diet-fed rats, LPS increased (P � 0.05) the STAT3phosphorylation in the ARC (Fig. 2), PVN (Fig. 3), and VMH(Fig. 3), but it had no additional effect in HFD animals.
Similar to control diet group, HFD treatment did not induceSTAT3 phosphorylation in the brain stem NTS and RPaneurons (Fig. 4). On the other hand, LPS increased (P � 0.05)the number of p-STAT3-positive cells in both control diet andHFD-fed rats in these nuclei. Nevertheless, LPS-induced p-STAT3 expression in the NTS and RPa of HFD group wassignificantly reduced (P � 0.05) when compared with controldiet group.
To investigate the activity of noncatecholaminergic andcatecholaminergic neurons in the brain stem, we performedFos and Fos/TH double labeling. We observed that HFDtreatment did not induce Fos and Fos/TH expression in theNTS (Fig. 5). LPS, in turn, increased (P � 0.05) the number ofFos and Fos/TH-expressing neurons in both control diet andHFD-fed animals. Interestingly, in HFD-fed rats LPS promotedan additional Fos and Fos/TH expression in the NTS. In controldiet-fed rats 13.3% of TH neurons were activated by LPS,whereas in HFD-fed rats 33.3% of TH neurons were activated,suggesting that in diet-induced obese rats, LPS exacerbates the
0
20
40
60
80
100
SalineLPS
* *
Control Diet HFD
AR
C p
-STA
T3po
sitiv
e ce
lls
CONTROL DIET
HIGH FAT DIET
SALINE LPS
3V 3V
3V 3V
100μm
ARC
Fig. 2. Representative photomicrographs of p-STAT3-positive cells (dark points) in the arcuate nucleus of the hypothalamus (ARC) (boundaries delineated withdotted line) and graph showing the number of p-STAT3-positive cells in the ARC (right) of animals assigned at the groups: control diet-saline, control diet-LPS,HFD-saline and HFD-LPS. 3V, third ventricle limits. Scale bar: 100 �m. Two-way ANOVA, followed by Newman-Keuls post hoc test was performed. Dataare expressed as means � SE. (n � 5–6). *P � 0.05.
R37LPS-STIMULATED STAT3 ACTIVATION IN THE HYPOTHALAMUS
AJP-Regul Integr Comp Physiol • doi:10.1152/ajpregu.00147.2013 • www.ajpregu.org
brain stem catecholaminergic neuronal activation, as well asnoncatecholaminergic activation. We did not observe Fos ex-pression in RPa nuclei in our experimental protocol.
Measurement of BAT UCP-1 Content in HFD-Fed Rats AfterLPS Stimulation
As expected, BAT UCP-1 expression was clearly increased(P � 0.05) in HFD animals (Fig. 6). In rats fed with controldiet, LPS significantly increased (P � 0.05) BAT UCP-1expression, but curiously, LPS had no additional effect onUCP-1 expression in HFD group.
Effects of LPS on Core Body Temperature in HFD-Fed Rats
Room temperature was similar (at 22–23°C) in all groups and didnot change during the experiments. The core body temperature in ratsinjected with LPS increased 60 min postinjection and remainedhigher than the saline groups during the following 6 h (Fig. 7A).Interestingly, HFD-LPS rats showed a more pronounced increase inbody temperature and increased control diet-LPS group (Fig. 7, A and
B). HFD group showed increased basal thermal index when com-pared with the control diet group.
Effects of LPS on Oxygen Consumption, RQ, and EnergyExpenditure in HFD-Fed Rats
Before LPS injection, V̇O2 was 7.7 � 0.5 ml/min in controldiet-fed rats and significantly higher (P � 0.05) in HFD group(10.5 � 0.8 ml/min). One hour after LPS injection, V̇O2
significantly increased in both control diet (9.5 � 0.6 ml/min)and HFD (12.5 � 1.0 ml/min) rats (Fig. 8A); however, theHFD-LPS group presented a higher V̇O2 when compared withthe control diet-LPS group. V̇O2 enhanced around 20% frombaseline after LPS injection in both control diet and HFDgroups (Fig. 8B). In basal condition the RQ, which reflects thebalance of substrate oxidation, was 1.00 � 0.02 in control dietand it was significantly lower (P � 0.05) in HFD (0.92 �0.00), suggesting that HFD-fed rats oxidized less carbohydratethan control diet-fed rats. LPS did not change the RQ in controldiet (0.98 � 0.02) and HFD-fed rats (0.93 � 0.00) (Fig. 8C).
A
B
CONTROL DIET
HIGH FAT DIET
SALINE LPS
3V 3V
3V 3V
100µm
3V 3V
3V
3V
CONTROL DIET
HIGH FAT DIET
PVN
VMH
100µm
0
20
40
60
80
100
*
Control Diet HFD
ND ND
SalineLPS
PVN
p-S
TAT3
posi
tive
cells
0
20
40
60
80
*
Control Diet HFD
NDND ND
VMH
p-S
TAT3
posi
tive
cells
Fig. 3. Representative photomicrographs of p-STAT3-positive cells (dark points) in the paraventricular (PVN) and ventromedial (VMH) nuclei of thehypothalamus (boundaries delineated with dotted line) and graphs showing the number of p-STAT3-positive cells in the PVN (A) and VMH (B) of animalsassigned at the groups: control diet-saline, control diet-LPS, HFD-saline, and HFD-LPS. Scale bar: 100 �m. Two-way ANOVA, followed by Newman-Keulspost hoc test was performed. Data are expressed as means � SE. (n � 5–6). *P � 0.05. ND, not detectable.
R38 LPS-STIMULATED STAT3 ACTIVATION IN THE HYPOTHALAMUS
AJP-Regul Integr Comp Physiol • doi:10.1152/ajpregu.00147.2013 • www.ajpregu.org

In basal condition, HFD rats showed an increased EE whencompared with control diet. Accordingly, rats injected withLPS showed a higher EE, compared with basal conditions, inboth control diet and HFD groups; however, HFD-LPS showeda more pronounced EE than control diet-LPS group (Fig. 8D).
DISCUSSION
The present data demonstrate that HFD abolishes the hypo-phagic effect of acute low-dose LPS stimulus in rats, and thiseffect is associated in part with reduced STAT3 phosphorylationin the hypothalamus. Additionally, our results show for the firsttime that, in contrast to the failure to activate STAT3 in thehypothalamus, this response is preserved, to some extent, in theNTS and RPa. Furthermore, the preserved sympathetic autonomicresponsiveness and the increase in thermogenesis and energyexpenditure could account for the body weight loss after acutedose of LPS despite the failure of LPS to reduce food intake inHFD rats.
Diet-induced obesity (DIO) is characterized by elevatedserum leptin and reduced response to exogenous leptin, usuallycaused by defects in leptin signaling (53). In 2004, Münzberget al. (41) mapped leptin-responsive cells in brains from DIOmice using p-STAT3 immunohistochemistry and reported acareful description that ARC is the major site of leptin resis-tance, in contrast to other hypothalamic and extrahypothalamicnuclei, which maintain the responsiveness to leptin. Leptinresistance also emerges after increased inflammatory responsein the hypothalamus, which contributes to the altered foodintake both in genetic or dietary fat-induced obesity (38, 56).
In our study, obesity induced by HFD for 8 wk led toenhanced STAT3 phosphorylation in the ARC but not in thePVN and VMH. p-STAT3 expression in the ARC of HFDgroup might be due to increased hypothalamic inflammation(15, 56), given that STAT3 can be also phosphorylated by localaction of cytokines (45). This finding is in accordance withprevious report from Martin et al. (36) that described elevated
0
50
100
150
200
250
SalineLPS
Control Diet HFD
*
**
NTS
p-S
TAT3
posi
tive
cells
0
20
40
60
80
100
*
**
Control diet HFD
RPa
p-S
TAT3
posi
tive
cells
A
BCONTROL
DIET
HIGH FATDIET
RPa
CONTROLDIET
HIGH FATDIET
SALINE LPS
APAP
AP AP
NTS
Fig. 4. Representative photomicrographs of p-STAT3-positive cells (dark points) in the brain stem nucleus of the solitary tract (NTS) and raphe pallidus (RPa)(boundaries delineated with dotted line) and graphs showing the number of p-STAT3-positive cells in the NTS (A) and RPa (B) of animals assigned at the groups:control diet-saline, control diet-LPS, HFD-saline, and HFD-LPS. AP, area postrema. Scale bar: 100 �m. Two-way ANOVA, followed by Newman-Keuls posthoc test was performed. Data are expressed as means � SE. (n � 5–6). *P � 0.05.
R39LPS-STIMULATED STAT3 ACTIVATION IN THE HYPOTHALAMUS
AJP-Regul Integr Comp Physiol • doi:10.1152/ajpregu.00147.2013 • www.ajpregu.org

basal STAT3 phosphorylation in the arcuate nucleus of DIOmice. We could not rule out that endogenous metabolic endo-toxemia could induce STAT3 phosphorylation. Anorectic ac-tion of leptin depends on its ability to phosphorylate STAT3(8). Mice specifically lacking the STAT3-binding site in theleptin receptor (4) and mice with reduced levels of STAT3proteins selectively in the central nervous system (24) arehyperphagic and obese. We found that cumulative food intake(g) and daily average food consumption (g) of control diet-fedrats were higher than HFD. In contrast, considering all amountof food consumed during the 8 wk of treatment, the average ofcaloric intake in HFD was higher than control diet-fed rats(Table 1). However, at the end of 8 wk HFD-fed rats injectedwith saline showed reduced caloric intake compared withcontrol diet-fed rats. Previous reports showed that hyperphagicresponse in HFD rodents depends on the composition of thediet and may be transient with initial increased followed bydecreased food intake (46).
LPS reduced food intake in control diet-fed rats but not inHFD. Our data give support to the hypothesis that LPS-inducedhypophagia also depends on the intact STAT3 signaling, as wepreviously demonstrated that control diet-fed rats challengedwith LPS showed hypophagia and high p-STAT3 expression inthe hypothalamus (6). Moreover, the present data expand thisnotion showing that STAT3 activation in the PVN and VMH isimportant to reduce food intake, since STAT3 activation onlyin the ARC was not sufficient to induce hypophagia after LPS
in HFD group. We cannot exclude the contributions of otherhypothalamic and extrahypothalamic sites, such as lateral hy-pothalamus, dorsomedial nucleus of the hypothalamus, cortex,amygdala, and hippocampus, not examined in our study, in thehypophagic effect of LPS.
In contrast to our results, Lawrence and co-workers (35)found that in mice fed with HFD for a longer period (20 wk),LPS (100 �g/kg) caused a greater and more prolonged hypo-phagic effect compared with control mice. They also found thatLPS induced Fos expression in several brain regions of controlmice, but, in contrast to our findings, they found fewer Fos-positive cells observed in the brains of obese mice. These miceexhibited an altered inflammatory response to LPS, evidencingthat obesity impairs the ability of the immune system toappropriately respond to bacterial infection. The divergenthypophagic and Fos response, observed between our resultsand the above-mentioned report, could be due to the differentspecies studied (mice vs. rat) and different period of HFDfeeding (20 wk vs. 8 wk). Of note, the rats used in our studywere younger (4 wk old) than the mice used in the cited study(8 wk old), suggesting that the age of subjects during the LPStreatment could also be an important factor to affect LPSresponsiveness in obese rodents.
Immunohistochemical studies demonstrate rapid activationof STAT3 by leptin in extrahypothalamic brain regions, suchas the periaqueductal gray and the dorsal raphe (DR) in themidbrain and the parabrachial nucleus and NTS in the brain
0
10
20
30
40
Control Diet HFD
*
**
NTS
Fos
posi
tive
neur
ons
0
2
4
6
8SalineLPS
SalineLPS
Control Diet HFD
*
**
NTS
Fos
/TH
posi
tive
neur
ons
A B
AP
AP AP
AP
CONTROLDIET
HIGH FATDIET
SALINE LPS
NTS
100µm
Fig. 5. Representative photomicrographs ofFos/tyrosine hydroxylase (TH)-positive neu-rons (dark nuclear Fos and brown cytoplas-mic TH) in the brain stem nucleus of thesolitary tract (NTS) (boundaries delineatedwith dotted line) and graphs showing thenumber of Fos (A) and Fos/TH (B)-positiveneurons in the NTS of animals assigned at thegroups: control diet-saline, control diet-LPS,HFD-saline, and HFD-LPS. Scale bar: 100�m. Arrows indicate TH neurons, expressingor not Fos. Inset: show representative neuroncoexpressing or not TH and Fos, 40 mag-nification. Two-way ANOVA, followed byNewman-Keuls post hoc test was performed.Data are expressed as means � SE. (n �5–6). *P � 0.05.
R40 LPS-STIMULATED STAT3 ACTIVATION IN THE HYPOTHALAMUS
AJP-Regul Integr Comp Physiol • doi:10.1152/ajpregu.00147.2013 • www.ajpregu.org

stem (29, 30, 40). Specific function(s) of each nucleus in leptinaction remains an open question (51). Descending projectionsfrom the hypothalamus to the caudal brain stem are thought tocooperate in the modulation of brain stem reflex activity,participating in the control of energy status and other motivatedbehaviors. POMC/CART neurons in the ARC, the primarycentral site of action of circulating leptin, strongly inhibit foodintake through their downstream signaling via MC4R in thePVN (3). Another possibility is that ARC POMC/CART neu-rons project directly to the caudal brain stem, where MC3R/MC4R ligands powerfully modulate meal size and food intake(18, 60). These projections provide a pathway by which leptin,acting at the level of the hypothalamus, may modulate thestrength of vagal afferent input to the NTS.
Similarly to leptin, LPS also induces STAT3 activation inbrain stem areas. In our study, we observed an intense p-STAT3 expression in the NTS and RPa after LPS injectionboth in control diet- and HFD-fed rats. However, in HFD-fedrats, p-STAT3 expression was significantly lower than incontrols. The massive p-STAT3 expression observed in controldiet group after LPS may be explained, in part, by the presenceof higher levels of endogenous leptin stimulated by the endo-toxin (6), in addition to p-STAT3 induction by LPS-stimulatedcytokines. Therefore, the present results show that inability toactivate STAT3 in response to LPS in HFD is site specific,with unresponsiveness in the hypothalamus but maintenance ofbrain stem responsiveness. These results are in accordancewith the recent evidence showing that resistance to leptinappear to be specific for the p-STAT3 expression in thehypothalamus (16, 41) and consequent effect on the control of
food intake, with no resistance on leptin effect on sympatheticautonomic activity (55).
Despite the unchanged food intake in obese HFD rats aftersingle LPS injection, as reported earlier (6), we observed thatendotoxin had a prominent effect on body weight reduction, bothin control diet and HFD group. Furthermore, we observed in-creased Fos and Fos/TH double-labeled neurons in the medialNTS after LPS, which were significantly higher in HFD than incontrol diet group. The lower number of double-labeled Fos/THneurons in the NTS indicates that besides catecholaminergicneurons other neuronal phenotypes are involved in the activationof NTS in response to acute LPS stimulation. Activation ofperipheral vagal afferents directly by cytokines may induce Fosexpression in the NTS (27). Pohl et al. (44) showed an increase inhypothalamic expression of the mRNA for IL-1�, IL-6, andSOCS-3 and higher levels of IL-6 in the white adipose tissueafter exposure to LPS in DIO mice. Taken together, theseresults demonstrate that diet-induced obesity produces an al-teration in the acute inflammatory response at multiple levels,and could explain, in part, the enhanced activity of brain stemneurons of HFD-fed rats after LPS injection. Furthermore,treatment with the same low LPS dose (100 �g/kg) was shownto induce a significant increase in core body temperature inboth lean (control diet) and obese (HFD) rats (41), contributingto the body weight loss. Accordingly, in our study we observedthat HFD-fed rats showed increased core body temperature andincreased energy expenditure compared with control diet-fedrats stimulated with LPS.
445
450
455
460SalineLPS
Control Diet HFD
**
*
*
Ther
mal
inde
x (º
C·h
)
-1 0 1 2 3 4 5 6 7 8 9 10 11 1236.5
37.0
37.5
38.0
38.5
39.0
Control Diet Saline
Control Diet LPSHFD Saline
HFD LPS
Time post injection (h)
Tb (°
C)
* # #
A
B
Fig. 7. Twelve hours core body temperature (Tb) time course (A) and thermalindex (calculated from area under the curve) (B) of animals assigned at thegroups: control diet-saline, control diet-LPS, HFD-saline, and HFD-LPS.Black horizontal line corresponds to dark period. Two-way ANOVA, followedby Newman-Keuls post hoc test was performed. Data are expressed as means �SE. (n � 7–9). *P � 0.05 LPS vs. saline; #P � 0.05 HFD-LPS vs. controldiet-LPS.
0
100
200Saline
LPS*
Control Diet HFD
*
BA
T U
CP-
1/α
-tubu
lin(%
con
trol
)Control diet
+ Saline
Control diet +
LPS
HFD +
Saline
HFD +
LPS
Control diet +
Saline
Control diet +
LPS
HFD +
Saline
HFD +
LPS
Control diet +
Saline
Control diet +
LPS
HFD +
Saline
HFD +
LPS
Control diet +
Saline
Control diet +
LPS
HFD +
Saline
HFD +
LPS
α-tubulin
UCP-1
Fig. 6. Percentage uncoupling protein-1 (UCP-1) expression in the brownadipose tissue (BAT) of animals assigned at the groups: control diet-saline,control diet-LPS, HFD-saline, and HFD-LPS. Two-way ANOVA, followed byNewman-Keuls post hoc test was performed. Data are expressed as means �SE. (n � 5–6). *P � 0.05.
R41LPS-STIMULATED STAT3 ACTIVATION IN THE HYPOTHALAMUS
AJP-Regul Integr Comp Physiol • doi:10.1152/ajpregu.00147.2013 • www.ajpregu.org

Brain stem and parasympathetic and sympathetic pregangli-onic cells in the spinal cord, which innervate BAT, are denselyinnervated by projections from the PVN (11, 52). Leptintriggers the synthesis of UCP-1 in BAT mitochondria by therelease of norepinephrine from its sympathetic nerve terminals,leading to thermogenesis (19). To clarify the body weight lossin HFD obese rats during endotoxemia, we tested the hypoth-esis that increased BAT UCP-1 expression induced by LPS inHFD group might be, at least in part, responsible for the weightloss by the enhancement of thermogenesis and energy expen-diture. In our observations, as expected, fat-rich diet clearlyincreased BAT UCP-1 expression. Accordingly, Fromme andKlingenspor (22) reported a compilation of several reports onmice and rats fed with different types of fat-rich diets, showinga thermoregulatory effect mediated by UCP-1. In our study,control diet-fed rats showed increased UCP-1 expression afterLPS injection, and these data are in agreement with previousreport (11) showing that cytokines produced in response toLPS stimulate BAT thermogenesis. However, LPS had noadditional effect on UCP-1 expression in HFD-fed group,suggesting that changes in UCP-1 could be limited as anindicator of BAT thermogenesis during endotoxemia.
Activity of neurons in the rostral RPa in the brain stem ispredominantly involved in determining the level of sympa-thetic nerve discharge to target tissues involved in metabolismand thermoregulation. RPa contains premotor neurons thatinnervate the intermedio-lateral cell column containing sym-pathetic preganglionic neurons that control BAT functions (9).In the present study Fos expression was not observed after LPSin the RPa, both in control and HFD group. Although there wasno Fos expression, STAT3 phosphorylation induced by LPS inthe RPa is maintained in HFD group, but to a lesser extent thanin control diet group, showing that in obese rats the brain stemareas remain sensitive to the circulating cytokines stimulatedby the endotoxin.
Despite unchanged UCP-1 expression, increased BAT ther-mogenesis in fact may contribute, at least in part, to bodyweight loss in HFD rats challenged with LPS. Jepson et al. (32)
demonstrated that below thermoneutral conditions the febrileresponse developed by animals challenged with LPS depends,in part, on sympathetic activation of BAT thermogenesis.Accordingly, we observed that control diet and HFD LPS-treated rats, placed below thermoneutral conditions, showedincreased thermal index (calculated from area under the curve)and increased body temperature. Interestingly, as observedpreviously by Pohl et al. (44), fever response was higher inHFD-LPS than in control diet-LPS group.
We also observed an enhancement of V̇O2 induced by LPS inboth control diet and HFD rats, with an exacerbated V̇O2 inHFD-LPS rats compared with control diet-LPS. In the litera-ture, studies have shown an evident positive correlation be-tween thermogenesis and V̇O2 (21, 25). Horan and co-workers(28) first reported increases in V̇O2 and body temperature inadult endotoxemic rats. As expected, the enhancement of theV̇O2 during 2 h coincided with the increased body temperatureobserved in LPS-treated groups. We found that HFD ratsshowed higher V̇O2 and EE in basal condition compared withcontrol diet group, which could be due to the higher UCP-1expression and, at least in part, to the higher basal thermalindex observed in HFD animals. This is in line with previousdata showing that HFD increased V̇O2, heat production, and EE(1, 13, 39). In our study, HFD rats showed lower RQ (RQ), asindicative of lower utilization of carbohydrate as fuel com-pared with control diet rats (25). LPS injection had no effect onRQ. We observed that EE increased after LPS injection in bothcontrol diet-and HFD-fed rats, being more prominent in theHFD group. It is important to point out that below the ther-moneutral zone an organism must expend energy to generateheat (58).
In conclusion, our data indicate that LPS activates STAT3-mediated pathway in the hypothalamus and brain stem, leadingto hypophagia; however, acute effects of LPS on food intake,but not body weight loss, is abolished in HFD leptin-resistantrats. Despite the absence of hypophagic effect, body weightloss induced by LPS is sustained and this response is associatedwith higher brain stem neuron activation and increased ther-
0.03
0.04
0.05
0.06
0.07
0.08
0.09
Control Diet HFD0.8
1.0
1.2BasalLPS
Control Diet HFD
90
100
110
120
130
140
150
Control Diet HFD
8
10
12
14BasalLPS
Control Diet HFD
0.03
0.04
0.05
0.06
0.07
0.08
0.09
Control Diet HFD
EE (K
cal/m
in)
0.8
1.0
1.2BasalLPS
Control Diet HFD
RQ
90
100
110
120
130
140
150
Control Diet HFD
8
10
12
14BasalLPS
Control Diet HFD
*
*
*
* *
*
*
*
** *
*
*
**
* *
VO2 (
ml/m
in)
.
VO2 (
% B
asel
ine)
.
Fig. 8. Oxygen consumption (V̇O2, in ml/min) (A), percentage of baseline V̇O2 values(B), respiratory quotient (RQ) (C), and en-ergy expenditure (EE, in kcal/min) (D) inrats fed with control diet (3.95 kcal/g) orHFD (6.3 kcal/g) for 8 wk measured in basalconditions and during 120 min (from 1 to 3h) post-LPS injection. Two-way ANOVA,followed by Newman-Keuls post hoc testwas performed. Data are expressed as means �SE. (n � 6). *P � 0.05.
R42 LPS-STIMULATED STAT3 ACTIVATION IN THE HYPOTHALAMUS
AJP-Regul Integr Comp Physiol • doi:10.1152/ajpregu.00147.2013 • www.ajpregu.org

mogenesis and energy expenditure. Thus resistance to acuteLPS effects under HFD seems to be selective to food intakecontrol.
Perspectives and Significance
The prevalence of overweight and obesity is increasingworldwide and it makes the investigation of mechanisms un-derlying the unbalance of energy homeostasis crucial for theunderstanding of the pathophysiology of obesity. In this con-text, leptin resistance is a hallmark of obesity, which has beenshown to be associated with metabolic endotoxemia. Our datagive support to the notion that leptin resistance has an effect onendotoxemia-induced hypophagia but is unlikely to alter ther-mogenesis and EE. The comprehension of the common mech-anisms between leptin and LPS signaling pathways will con-tribute to the development of strategies to fight against obesity.
ACKNOWLEDGMENTS
Authors are grateful to Lilian Eslaine Costa Mendes Silva, Maria ValciAparecida dos Santos Silva, and Milene Mantovani for their technical support.We thank Dr. Renato Nery Soriano for the body temperature analysis, and alsoDr. Mogens L. Glass for kindly allowing us to use the O2 and CO2 gasanalyzer.
GRANTS
We thank FAPESP and CNPq for the financial support.
DISCLOSURES
No conflicts of interest, financial or otherwise, are declared by the author(s).
AUTHOR CONTRIBUTIONS
Author contributions: B.d.C.B. and L.L.E. conception and design of re-search; B.d.C.B., R.R., E.T.U., P.M., G.S.F.d.S., and F.J.d.P. performedexperiments; B.d.C.B., G.S.F.d.S., and L.L.E. analyzed data; B.d.C.B., R.R.,and L.L.E. interpreted results of experiments; B.d.C.B. prepared figures;B.d.C.B. and L.L.E. drafted manuscript; B.d.C.B., F.J.d.P., L.G.S.B., J.A.-R.,and L.L.E. edited and revised manuscript; B.d.C.B., R.R., E.T.U., P.M.,F.J.d.P., J.A.-R., and L.L.E. approved final version of manuscript.
REFERENCES
1. Araujo RL, Andrade BM, Padrón AS, Gaidhu MP, Perry RL, Car-valho DP, Ceddia RB. High-fat diet increases thyrotropin and oxygenconsumption without altering circulating 3,5,3=-triiodothyronine (T3) andthyroxine in rats: the role of iodothyronine deiodinases, reverse T3production, and whole-body fat oxidation. Endocrinology 151: 3460–3469, 2010.
2. Argyropoulos G, Harper ME. Uncoupling proteins and thermoregula-tion. J Appl Physiol 92: 2187–2198, 2002.
3. Balthasar N, Dalgaard LT, Lee CE, Yu J, Funahashi H, Williams T,Ferreira M, Tang V, McGovern RA, Kenny CD, Christiansen LM,Edelstein E, Choi B, Boss O, Aschkenasi C, Zhang CY, Mountjoy K,Kishi T, Elmquist JK, Lowell BB. Divergence of melanocortin pathwaysin the control of food intake and energy expenditure. Cell 123: 493–505,2005.
4. Bates SH, Stearns WH, Dundon TA, Schubert M, Tso W, Wang Y,Banks AS, Lavery HJ, Haq AK, Maratos-Flier E, Neel BG, SchwartzMW, Myers MG Jr. STAT3 signalling is required for leptin regulation ofenergy balance but not reproduction. Nature 421: 856–859, 2003.
5. Borges BC, Antunes-Rodrigues J, Castro M, Bittencourt JC, Elias CF,Elias LL. Expression of hypothalamic neuropeptides and the desensitiza-tion of pituitary-adrenal axis and hypophagia in the endotoxin tolerance.Horm Behav 52: 508–519, 2007.
6. Borges BC, Rorato R, Avraham Y, da Silva LE, Castro M, VorobiavL, Berry E, Antunes-Rodrigues J, Elias LL. Leptin resistance anddesensitization of hypophagia during prolonged inflammatory challenge.Am J Physiol Endocrinol Metab 300: E858–E869, 2011.
7. Bradford MM. A rapid and sensitive method for the quantitation ofmicrogram quantities of protein utilizing the principle of protein-dyebinding. Anal Biochem 72: 248–254, 1976.
8. Buettner C, Pocai A, Muse ED, Etgen AM, Myers MG Jr, Rossetti L.Critical role of STAT3 in leptin’s metabolic actions. Cell Metab 4: 49–60,2006.
9. Cabral A, Valdivia S, Reynaldo M, Cyr NE, Nillni EA, Perello M.Short-term cold exposure activates TRH neurons exclusively in the hypo-thalamic paraventricular nucleus and raphe pallidus. Neurosci Lett 518:86–91, 2012.
10. Cani PD, Amar J, Iglesias MA, Poggi M, Knauf C, Bastelica D,Neyrinck AM, Fava F, Tuohy KM, Chabo C, Waget A, Delmée E,Cousin B, Sulpice T, Chamontin B, Ferrières J, Tanti JF, Gibson GR,Casteilla L, Delzenne NM, Alessi MC, Burcelin R. Metabolic endotox-emia initiates obesity and insulin resistance. Diabetes 56: 1761–1772,2007.
11. Cannon B, Houstek J, Nedergaard J. Brown adipose tissue. More thanan effector of thermogenesis? Ann NY Acad Sci 856: 171–187, 1998.
12. Cone DR. Anatomy and regulation of the central melanocortin system.Nat Neurosci 8: 571–578, 2005.
13. Corbett SW, Stern JS, Keesey RE. Energy expenditure in rats withdiet-induced obesity. Am J Clin Nutr 44: 173–180, 1986.
14. de Heredia FP, Gómez-Martínez S, Marcos A. Obesity, inflammationand the immune system. Proc Nutr Soc 71: 332–338, 2012.
15. De Souza CT, Araujo EP, Bordin S, Ashimine R, Zollner RL,Boschero AC, Saad MJ, Velloso LA. Consumption of a fat-rich dietactivates a proinflammatory response and induces insulin resistance in thehypothalamus. Endocrinology 146: 4192–4199, 2005.
16. El-Haschimi K, Pierroz DD, Hileman SM, Bjørbaek C, Flier JS. Twodefects contribute to hypothalamic leptin resistance in mice with diet-induced obesity. J Clin Invest 105: 1827–1832, 2000.
17. Elia M, Livesey G. Energy expenditure and fuel selection in biologicalsystems: the theory and practice of calculations based on indirect calo-rimetry and tracer methods. World Rev Nutr Diet 70: 68–131, 1992.
18. Ellacott KL, Halatchev IG, Cone RD. Characterization of leptin-respon-sive neurons in the caudal brainstem. Endocrinology 147: 3190–3195,2006.
19. Erlanson-Albertsson C. The role of uncoupling proteins in the regulationof metabolism. Acta Physiol Scand 178: 405–412, 2003.
20. Flatt JP. The RQ/FQ concept and body weght maintenance. NestleFoundation Ann Rep, 49–71, 1991.
21. Flatt JP. Body composition, respiratory quotient and weight maintenance.Am J Clin Nutr 62: 1075–11175, 1995.
22. Fromme T, Klingenspor M. Uncoupling protein 1 expression and high-fat diets. Am J Physiol Regul Integr Comp Physiol 300: R1–R8, 2011.
23. Frühbeck G. Intracellular signaling pathways activated by leptin.Biochem J 393: 7–20, 2006.
24. Gao Q, Wolfgang MJ, Neschen S, Morino K, Horvath TL, ShulmanGI, Fu XY. Disruption of neural signal transducer and activator oftranscription 3 causes obesity, diabetes, infertility, and thermal dysregu-lation. Proc Natl Acad Sci USA 101: 4661–4666, 2004.
25. Garrett-Cox RG, Pierro A, Spitz L, Eaton S. Body temperature and heatproduction in suckling rat endotoxaemia: beneficial effects of glutamine. JPediatr Surg 38: 37–44, 2003.
26. Gautron L, Mingam R, Moranis A, Combe C, Laye S. Influence offeeding status on neuronal activity in the hypothalamus during lipopoly-saccharide-induced anorexia in rats. Neuroscience 134: 933–946, 2005.
27. Gaykema RP, Daniels TE, Shapiro NJ, Thacker GC, Park & GoehlerLE SM. Immune challenge and satiety-related activation of both distinctand overlapping neuronal populations in the brainstem indicate parallelpathways for viscerosensory signaling. Brain Res 1294: 61–79, 2009.
28. Horan MA, Little RA, Rothwell NJ, Strijbos PJ. Comparison of theeffects of several endotoxin preparations on body temperature and meta-bolic rate in the rat. Can J Physiol Pharmacol 67: 1011–1014, 1989.
29. Hosoi T, Kawagishi T, Okuma Y, Tanaka J, Nomura Y. Brain stem isa direct target for leptin’s action in the central nervous system. Endocri-nology 143: 3498–3504, 2002.
30. Hübschle T, Thom E, Watson A, Roth J, Klaus S, Meyerhof W.Leptin-induced nuclear translocation of STAT3 immunoreactivity in hy-pothalamic nuclei involved in body weight regulation. J Neurosci 21:2413–2424, 2001.
31. Hunter RG, Philpot K, Vicentic A, Dominguez G, Hubert GW, KuharMJ. CART in feeding and obesity. Trends Endocrinol Metab 15: 454–459, 2004.
R43LPS-STIMULATED STAT3 ACTIVATION IN THE HYPOTHALAMUS
AJP-Regul Integr Comp Physiol • doi:10.1152/ajpregu.00147.2013 • www.ajpregu.org

32. Jepson MM, Millward DJ, Rothwell NJ, Stock MJ. Involvement ofsympathetic nervous system and brown fat in endotoxin-induced fever inrats. Am J Physiol Endocrinol Metab 255: E617–E620, 1988.
33. Johnson RW. Immune and endocrine regulation of food intake in sickanimals. Domest Anim Endocrinol 15: 309–319, 1998.
34. Kelly CJ, Colgan SP, Frank DN. Of Microbes and Meals: The HealthConsequences of Dietary Endotoxemia. Nutrition Clin Pract 1941–2452,2012.
35. Lawrence CB, Brough D, Knight EM. Obese mice exhibit an alteredbehavioural and inflammatory response to lipopolysaccharide. Dis ModelMech 5: 649–659, 2012.
36. Martin TL, Alquier T, Asakura K, Furukawa N, Preitner F, Kahn BB.Diet-induced obesity alters AMP kinase activity in hypothalamus andskeletal muscle. J Biol Chem 281: 18933–18941, 2006.
37. Mercer JG, Moar KM, Findlay PA, Hoggard N, Adam CL. Associa-tion of leptin receptor (OB-Rb), NPY and GLP-1 gene expression in theovine and murine brainstem. Regul Pept 75–76: 271–278, 1998.
38. Milanski M, Degasperi G, Coope A, Morari J, Denis R, Cintra DE,Tsukumo DM, Anhe G, Amaral ME, Takahashi HK, Curi R, OliveiraHC, Carvalheira JB, Bordin S, Saad MJ, Velloso LA. Saturated fattyacids produce an inflammatory response predominantly through the acti-vation of TLR4 signaling in hypothalamus: implications for the pathogen-esis of obesity. J Neurosci 29: 359–370, 2009.
39. Mollica MP, Iossa S, Liverini G, Soboll S. Stimulation of oxygenconsumption following addition of lipid substrates in liver and skeletalmuscle from rats fed a high-fat diet. Metabolism 48: 1230–1235, 1999.
40. Münzberg H, Huo L, Nillni EA, Hollenberg AN, Bjørbaek C. Role ofsignal transducer and activator of transcription 3 in regulation of hypo-thalamic proopiomelanocortin gene expression by leptin. Endocrinology144: 2121–2131, 2003.
41. Münzberg H, Flier JS, Bjørbaek C. Region-specific leptin resistancewithin the hypothalamus of diet-induced obese mice. Endocrinology 145:4880–4889, 2004.
42. Oren H, Erbay AR, Balci M, Cehreli S. Role of novel biomarkers ofinflammation in patients with stable coronary heart disease. Angiology 58:148–155, 2007.
43. Paxinos G, Watson C. The Rat Brain in Stereotaxic Coordinates, editedby Academic, 1997.
44. Pohl J, Woodside B, Luheshi GN. Changes in hypothalamically medi-ated acute-phase inflammatory responses to lipopolysaccharide in diet-induced obese rats. Endocrinology 150: 4901–4910, 2009.
45. Qin H, Roberts KL, Niyongere SA, Gong Y, Elson CO, Benveniste EN.Molecular mechanism of lipopolysaccharide-induced SOCS-3 gene ex-pression in macrophages and microglia. J Immunol 179: 5966–5976,2007.
46. Ramirez I. High-fat diets stimulate transient hyperphagia whereas wetdiets stimulate prolonged hyperphagia in Fischer rats. Physiol Behav 49:1223–1228, 1991.
47. Reeves PG, Nielsen FH, Fahey GC Jr. AIN-93 purified diets forlaboratory rodents: final report of the American Institute of Nutrition adhoc writing committee on the reformulation of the AIN-76A rodent diet.J Nutr 123: 1939–1951, 1993.
48. Rorato R, Castro M, Borges BC, Benedetti M, Germano CM, An-tunes-Rodrigues J, Elias LL. Adrenalectomy enhances endotoxemia-induced hypophagia: higher activation of corticotrophin-releasing-factorand proopiomelanocortin hypothalamic neurons. Horm Behav 54: 134–142, 2008.
49. Rorato R, Reis WL, Antunes-Rodrigues J, Elias LL. Cholecystokininand hypothalamic corticotrophin-releasing factor participate in endotoxin-induced hypophagia. Exp Physiol 96: 439–450, 2011.
50. Sachot C, Poole S, Luheshi GN. Circulating leptin mediates lipopoly-saccharide-induced anorexia and fever in rats. J Physiol 15: 263–272,2004.
51. Satoh N, Ogawa Y, Katsuura G, Numata Y, Tsuji T, Hayase M,Ebihara K, Masuzaki H, Hosoda K, Yoshimasa Y, Nakao K. Sympa-thetic activation of leptin via the ventromedial hypothalamus: leptin-induced increase in catecholamine secretion. Diabetes 48: 1787–1793,1999.
52. Sawchenko PE, Swanson LW. The organization of noradrenergic path-ways from the brainstem to the paraventricular and supraoptic nuclei in therat. Brain Res 257: 275–325, 1982.
53. Scarpace PJ, Zhang Y. Leptin resistance: a prediposing factor fordiet-induced obesity. Am J Physiol Regul Integr Comp Physiol 296:R493–R500, 2009.
54. Schwartz GJ. Integrative capacity of the caudal brainstem in the controlof food intake. Philos Trans R Soc Lond B Biol Sci 361: 1275–1280, 2006.
55. Smith MM, Minson CT. Obesity and adipokines: effects on sympatheticoveractivity. J Physiol 590: 1787–1801, 2012.
56. Thaler JP, Schwartz MW. Minireview: Inflammation and obesity patho-genesis: the hypothalamus heats up. Endocrinology 151: 4109–41015,2010.
57. Tschöp M, Smiley DL, Heiman ML. Ghrelin induces adiposity inrodents. Nature 407: 908–913, 2000.
58. Virtue S, Vidal-Puig A. Assessment of brown adipose tissue function.Front Physiol 4: 1–18, 2013.
59. Wang X, Ge A, Cheng M, Guo F, Zhao M, Zhou X, Liu L, Yang N.Increased hypothalamic inflammation associated with the susceptibility toobesity in rats exposed to high-fat diet. Exp Diabetes Res 2012: 847246,2012.
60. Zheng H, Patterson LM, Phifer CB, Berthoud HR. Brain stem mela-nocortinergic modulation of meal size and identification of hypothalamicPOMC projections. Am J Physiol Regul Integr Comp Physiol 289: R247–R258, 2005.
61. Zhong Z, Wen Z, Darnell JE Jr. Stat3: a STAT family member activatedby tyrosine phosphorylation in response to epidermal growth factor andinterleukin-6. Science 264: 95–98, 1994.
R44 LPS-STIMULATED STAT3 ACTIVATION IN THE HYPOTHALAMUS
AJP-Regul Integr Comp Physiol • doi:10.1152/ajpregu.00147.2013 • www.ajpregu.org


