Embed Size (px)
Citation preview
High-frequency Synchronization of Neuronal Activity in theSubthalamic Nucleus of Parkinsonian Patients with Limb Tremor
Ron Levy,1 William D. Hutchison,1,2,3 Andres M. Lozano,2,3 and Jonathan O. Dostrovsky1,3
1Department of Physiology, Faculty of Medicine, University of Toronto, Toronto, Ontario, Canada M5S 1A8, 2Department ofSurgery, University of Toronto, Division of Neurosurgery, The Toronto Western Hospital, Ontario, Canada M5T 2S8, and3The Toronto Western Research Institute, Toronto, Ontario, Canada M5T 2S8
It has been hypothesized that in Parkinson’s disease (PD) there isincreased synchronization of neuronal firing in the basal ganglia.This study examines the discharge activity of 121 pairs of sub-thalamic nucleus (STN) neurons in nine PD patients undergoingfunctional stereotactic mapping. Four patients had a previouspallidotomy. A double microelectrode setup was used to simul-taneously record from two neurons separated by distances assmall as 250 mm. In the six patients who had limb tremor duringthe recording session (n 5 76 pairs), the discharge pattern of 12pairs of tremor cells (TCs) was found to be coherent at thefrequency of the limb tremor. Both in-phase and out-of-phaserelationships were observed between TCs. Interestingly, in thesesix patients, 63/129 single neurons displayed 15–30 Hz oscilla-tions, whereas 36/76 pairs were coherent in this frequency range.Although the oscillatory frequencies were variable between pa-
tients, they were highly clustered within a patient. The phasedifference between these pairs was found to be close to 0.High-frequency synchronization was observed during periods oflimb tremor as well as during intermittent periods with no appar-ent limb tremor. In contrast, in the three patients without limbtremor during the recording session, only 1/84 neurons hadhigh-frequency oscillatory activity, and no TCs or synchronoushigh-frequency oscillatory activity was observed (n 5 45 pairs).These findings demonstrate that in PD patients with limb tremor,many STN neurons display high-frequency oscillations with ahigh degree of in-phase synchrony. The results suggest thathigh-frequency synchronized oscillatory activity may be associ-ated with the pathology that gives rise to tremor in PD patients.
Key words: Parkinson’s disease; limb tremor; synchronization;tremor cells; subthalamic nucleus; basal ganglia
The role of the subthalamic nucleus (STN) in the pathogenesis ofParkinsonian symptoms has gained prominence since the demon-stration of the anti-parkinsonian effect of injections of fiber-sparingneurotoxins into the STN of 1-methyl-4-phenyl-1,2,3,6-tetrahydropyridine (MPTP)-treated nonhuman primates (Berg-man et al., 1990). Deep brain stimulation (DBS) (Limousin et al.,1995) or lesions (Gill and Heywood, 1997; Obeso et al., 1997) of theSTN in Parkinson’s disease (PD) patients have been shown to bean effective treatment for rigidity, akinesia, and especially tremor(Krack et al., 1998; Kumar et al., 1998). In PD patients, thereduction of tremor by STN DBS is comparable with the responseobtained by thalamic stimulation for tremor (Krack et al., 1997). Asin the thalamus (Lenz et al., 1988), groups of STN neurons displaytremor-related spontaneous activity that is periodic at limb tremorfrequency (Hutchison et al., 1998), and microstimulation in theseregions has been shown to reduce resting tremor (Rodriguez et al.,1998).
In monkeys treated with MPTP, degeneration of the substantianigra pars compacta and subsequent depletion of striatal dopamineis related to the emergence of periodic oscillatory neuronal activityin the STN (Bergman et al., 1994). It has been hypothesized that inPD, a loss of dopamine is characterized by a reduction in theindependence between functionally segregated parallel circuits(Bergman et al., 1998a). The internal segment of the globus palli-dus (GPi) is the major output nucleus of the basal ganglia andreceives substantial excitatory input from the STN (Parent andHazrati, 1995). After MPTP-induced parkinsonism in monkeys,synchronized oscillatory neuronal activity between pairs of neu-
rons in the internal segment of the GPi (Nini et al., 1995) and thestriatum (Raz et al., 1996) is observed. In these studies, all parkin-sonian monkeys displayed signs of resting tremor and/or actiontremor. The synchronization of neuron pairs with tremor-relatedactivity has also been shown in the GPi of PD patients (Hurtado etal., 1999). However, it is unclear whether synchronized tremoractivity in the basal ganglia contributes to tremor pathogenesis oris simply the result of tremor activity occurring elsewhere. Forinstance, the synchronization of tremor cells [(TCs) neurons withlow-frequency oscillatory activity that is highly correlated with limbtremor] could be caused by common tremor-related afferent inputsto those cells.
To assess whether synchronous activity between neurons in theSTN underlies differences in parkinsonian pathophysiology, thisstudy examined the discharge activity of pairs of neurons in PDpatients with and without limb tremor. We provide evidence thatgroups of STN neurons oscillate in phase at high frequencies in PDpatients with limb tremor but are not found in those patientswithout limb tremor.
MATERIALS AND METHODSSubjects. Nine patients underwent microelectrode-guided placement ofbilateral deep brain stimulating electrodes for the treatment of the symp-toms of PD. These patients had a mean age of 51 years (62.4 SE, range34–66 years) at the time of operation. The average duration of the diseasewas 12 years (61.5 SE), and all patients had PD for at least 7 years.Individual patient characteristics are listed in Table 1. All patients werepreoperatively assessed using the Unified Parkinson’s Disease RatingScale (UPDRS). In both the preoperative assessment and during surgery,patients were studied in the practically defined OFF state, 12–14 hr afterthe last oral dose of levodopa. The mean motor UPDRS score (motorsubsection III) was 50 (62 SE) (maximum possible score is 108). UPDRSOFF period tremor score (maximum value is 28) was calculated as the sumof UPDRS item 20 (resting tremor of right hand, left hand, right leg, leftleg, face) and item 21 (action tremor of right hand, left hand). Using thefollowing criteria, patients were divided into two groups. Those with anyresting tremor of the limbs during the microelectrode recording sessionwere assigned to a “tremor” group (n 5 6). Patients without any discern-able resting tremor of the limbs during the microelectrode recordingsession were assigned to a “non-tremor” group (n 5 3). Four patients had
Received March 24, 2000; revised Aug. 1, 2000; accepted Aug. 2, 2000.This work was funded by National Institutes of Health and the Parkinson’s Foun-
dation of Canada. We thank Dr. H. Kwan and Dr. W. Mackay for their helpfulsuggestions and comments. We gratefully acknowledge Axon Instruments for provid-ing some of the electrophysiological equipment used in this study.
Correspondence should be addressed to Jonathan O. Dostrovsky, Department ofPhysiology, Room 3305, Medical Sciences Building, 1 Kings College Circle, Universityof Toronto, Toronto, Ontario, Canada M5S 1A8. E-mail: [email protected] © 2000 Society for Neuroscience 0270-6474/00/207766-10$15.00/0
The Journal of Neuroscience, October 15, 2000, 20(20):7766–7775

previously undergone a unilateral pallidotomy (Table 1). In these patients,pallidotomy was indicated for disabling drug-induced dyskinesia. Two ofthese patients were in the tremor group, and two were in the non-tremorgroup. In both of the tremor group patients (patients A, F), pallidotomyled to a moderate decrease in contralateral limb tremor at 6 months aftersurgery. However, the tremor reduction was not maintained at the time ofthe STN recordings (33 and 28 months after pallidotomy). One of the twonon-tremor group patients (patient I) did have mild facial tremor beforeand at 6 months after pallidotomy, but this tremor was not present at thetime of the STN recordings. Because it is possible to induce or enhanceParkinsonian resting limb tremor by having patients perform a cognitivetask that demands their attention, patients were periodically asked toperform mental arithmetic during some of the microelectrode recordings.
Recording procedure and apparatus. The use of microelectrode recordingto localize DBS electrode placement in the STN has been describedpreviously (Hutchison et al., 1998). Briefly, single-unit microelectroderecordings and stimulation mapping allowed the identification of physio-logical landmarks and cell localization. Parasagittal trajectories at either10.5 or 12 mm from the midline passed through the thalamic reticularnucleus and/or anterior thalamus, zona incerta, STN, and the substantianigra pars reticulata (SNr). Single units were recorded using Parylene-coated tungsten microelectrodes with an exposed tip size of 15–25 mm.Microelectrode tips were plated with gold and platinum to reduce theimpedance to ;0.2 MV at 1 kHz. Signals were amplified and filtered usingthe Guideline System GS3000 (Axon Instruments, Foster City, CA). Thetwo channels of neuronal data were recorded along with wrist flexor/extensor electromyographic (EMG) and accelerometer signals on analogvideotape (VR-100 digital recorder, Instrutech Corp., Port Washington,NY) to be analyzed off-line. The simultaneous recording of neuron pairswas performed using a double electrode setup in which two microelec-trodes were inserted either as a glued pair separated by a distance of250–300 mm or independently, in which case the electrodes were separatedby 600 mm and each electrode was driven by a separate microdrive. In mostcases dual-electrode recordings were obtained only on one side (usually thefirst). Recorded neurons were included if they were well isolated and stableand were sampled for at least 20 sec or at least 1000 action potentials. Anexample of a well isolated neuron is displayed in Figure 1 A. In this study,the average number of action potentials recorded per cell was 2830 (6130SE) over an average sample time of 62 sec (63 SE). Single-unit event timeswere discriminated off-line using two dual-window discriminators(DDIS-1, BAK Electronics, Mount Airy, MD) and storage oscilloscopes inspike-triggered mode or by template-matching spike-sorting software(Spike2, Cambridge Electronic Design, Cambridge, England).
Data analysis. Spontaneous ongoing discharge (tonic activity) analyzedin this study was collected with the patient at rest and without any passivejoint manipulation or voluntary movements. The average neuronal firingrate (FR) and the median interspike interval were calculated for each cell.Statistical analysis of group values was performed using Student’s t tests. Incases of non-normality, the Wilcoxon Signed Rank Test or Mann–WhitneyRank Sum Test was used. Statistical significance was assigned at p , 0.05(i.e., a 5 0.05; two-tailed).
Autocorrelation analysis was used to detect and grade the rhythmicneuronal activity of single neurons. Cross-correlation analysis was used todetect coincident activity between pairs of neurons and detect and gradethe rhythmic neuronal activity within these pairs. Correlation histogramsof spike trains were plotted for delays of 1.0 sec (10 msec bin width) and200 msec (2 msec bin width). Correlograms were used to index the strengthof the periodic activity. The strength of the oscillation was graded accord-ing to standard examples given by Karmon and Bergman (1993) foroscillating cells in MPTP-treated monkeys, in which only cells with astrength of five or greater were considered for further analysis. All corre-lation histograms were quantified to the units of rate (spikes per second)(Abeles, 1982). Nonrandom discharge, such as oscillatory activity of indi-
vidual neurons (autocorrelation) or between pairs of neurons (cross-correlation), was assessed by calculating confidence lines at 62 SDs(;95% confidence interval) of the 100–200 or 500–1000 msec time inter-val mean. Oscillatory modulation of ongoing discharge was initially de-tected by locating at least two successive peaks within the first 100 or 500msec of the autocorrelation functions (constructed from 100 bins of 2 or 10msec, respectively). Peaks were considered significant if they were foundoutside the area defined by the confidence lines. The frequency of oscil-lation was then determined by calculating the reciprocal of the peak-to-peak time of two successive peaks. Phase shifts were determined bycalculating the time of the highest peak (typically the peak closest to zerotime) divided by the oscillation period.
Spectral analysis was used to further characterize the frequency contentof neurons with oscillatory activity. Spike trains were transformed from aseries of events (sampled at 1000 Hz) to a continuous function represent-ing the density of spikes in time (using conversion software from Spike2,Cambridge Electronic Design) (see Fig. 1 B legend for detail). The size ofthe transform used in the fast Fourier transform (FFT) analysis was 512points, thereby yielding a frequency resolution of 1.95 Hz (i.e., waveformchannel sampling rate divided by the FFT block size). Only cells thatyielded at least 19 nonoverlapping power spectrum blocks were used tocalculate spectra (i.e., 10 sec of data > 19 blocks 3 512/1000 sec/block). Inthis study, the average number of FFT blocks per sample time was 154(618 SE). Graphic displays of frequency versus time were constructed bycalculating the frequency content within consecutive 10 sec windows andwere scaled to the ratio of signal to noise. Spectral noise was taken as theaverage of all spectral estimates between 0 and 30 Hz.
The similarity in oscillatory frequency content of pairs of neurons wascalculated using coherence techniques. Coherence is a function of fre-quency and is calculated from the cross-spectral density between the twowaveforms normalized by the power spectral density of each waveform.Coherence values can range from 0 if the spike trains are not linearlyrelated to a value of 1 if the spike trains have a perfectly linear relationship.Because coherence is a measure of linear similarity, the phase shift must beconstant, and the amplitudes of the two waveforms must have a constantratio to be completely coherent at a particular frequency over a given timerange. A statistically significant coherence value between the discharge oftwo neurons was used to indicate the presence of oscillatory synchroniza-tion. A 99% confidence level was determined by calculating a coherencevalue given by Coherence 5 1 2 (1 2 a) 1/(L21), where a 5 0.99 and L 5number of windows used (Rosenberg et al., 1989). This value or greaterwas considered to indicate a significant probability ( p , 0.01) of a linearrelationship between two cells. Phase relations were also assessed for thosepairs of neurons that had a significant coherence at some frequency fi usingPhase ( fi) 5 arctan(2Q( fi)/L( fi)), where fi is the i th spectral estimate, Qis the real part, and L is the imaginary part of the cross-spectra between apair of neurons (Glaser and Ruchkin, 1976). Graphic displays of coherenceor phase versus time were constructed by calculating the coherence orphase within consecutive 10 sec windows.
RESULTSOscillatory activity of single neurons in the STNA total of 213 single neurons (from 121 pairs) was recorded fromthe STN of the nine patients. Three types of rhythmic activitieswere identified over the range of the rhythmic frequencies investi-gated: (1) tremor cells (4% of total STN population, n 5 8), whichdisplayed rhythmic activity at tremor frequency concurrently withlimb tremor (Fig. 1C), (2) cells with high (.10 Hz) frequencyoscillations (20% of total STN population, n 5 44) (Fig. 1D), and
Table 1. Patient characteristics
Patient Agea SexYears withPDa
UPDRS motorscoreb
UPDRS tremorscoreb
Body side of sampledSTN neurons
Body side ofpallidotomyc
Limb tremor duringthe procedure? Assigned group
A 49 F 11 50 6 Left Left (33) yes TremorB 57 F 17 42 10 Right yes TremorC 66 M 13 53 14 Right yes TremorD 50 F 7 57 14 Right, left yes TremorE 55 M 18 45 19 Right yes TremorF 53 M 7 54 13 Right Right (27) yes TremorG 34 F 9 39 6 Left none Non-tremorH 50 M 10 54 1 Right Left (40) none Non-tremorI 49 M 17 55 1 Right, left Right (51) none Non-tremor
aAge and years with PD at time of STN recording.bUPDRS scores calculated from pre-operative values (see Materials and Methods).cPatients with a pallidotomy. Value in parentheses indicates number of months after pallidotomy.
Levy et al. • Subthalamic Nucleus and Parkinsonian Tremor J. Neurosci., October 15, 2000, 20(20):7766–7775 7767

(3) cells with both tremor frequency and high-frequency oscillationcomponents (6% of total STN population, n 5 12) (Fig. 1E). Themedian FR of all STN neurons was 45.7 Hz (25% 5 34.7, 75% 561.7). Cells with no oscillatory discharge had a median FR of 43.1Hz (25% 5 32.4, 75% 5 61.1), whereas cells that displayed oscil-latory activity had a median FR of 53.4 Hz (25% 5 40.2, 75% 564.4), which was significantly greater ( p , 0.05, Mann–WhitneyRank Sum Test) (Fig. 1F). There was no significant difference inthe FRs of TCs and cells with high-frequency oscillatory activity.
Almost all (63/64) of the neurons with tremor frequency activity(TCs) or high-frequency oscillations, or both, were found in the sixpatients of the tremor group (129 single neurons examined), in-cluding the two patients (A, F) with a pallidotomy (ipsilateral to therecordings). In the three patients of the non-tremor group, only1/84 STN neurons was found to have a high-frequency oscillation.Figure 1G shows box plots of the frequency distributions of the
high-frequency oscillatory neurons in the tremor group (frequencycalculated from autocorrelograms). Each of the six patients hadhigh-frequency oscillations that were tightly centered about onefrequency in the range from 15 to 25 Hz (Fig. 1G). In one patient,high-frequency oscillatory activity was recorded on both sides, andthe frequency was similar on the two sides. Three of the patients inthe tremor group had TCs; the distribution of TC frequencies isalso shown in Figure 1G. For cells that had both a tremor fre-quency oscillation and a high-frequency oscillation (n 5 12), theratio of the mean high-frequency oscillatory component to themean frequency of the tremor component was 4.0 (60.1 SE).
Highly synchronous high-frequency oscillatory activityin the STN of tremor group patientsA total of 121 neuron pairs was recorded in the STN. Singleshort-latency peaks in the cross-correlogram that would indicate
Figure 1. The oscillatory behavior of single neurons in the STN of PD patients. A, Raw trace of a well isolated STN neuron. B, Spike trains weretransformed from a series of events (sampled at 1000 Hz) to a continuous function by replacing each spike with a raised cosine with unit area under thecurve and a width of 10 msec. This resulted in a smooth continuous function with a sampling rate of 1000 Hz that was used in subsequent FFT analysis.C–E, Examples of autocorrelograms (lef t column; dashed line is mean discharge rate) and frequency spectra (right column; numbers above peaks are thesignal-to-noise ratio of the peak) for three types of oscillatory STN neurons. C, Cell with only a tremor frequency component (from patient D; see G).D, Cell with only a high-frequency oscillatory component (from patient B). E, Cell with both oscillatory components (from patient B, a raw trace of thiscell is displayed in Fig. 1A). F, Distribution of firing rates of oscillatory and non-oscillatory STN neurons (10 Hz bins, data normalized by total cell numberin each group). The mean spontaneous firing rate of cells with an oscillatory component (n 5 64) was significantly higher than the firing rate of cells withoutany oscillatory components (n 5 149) ( p , 0.05). G, Box plot of frequencies of high-frequency oscillations ( gray boxes, top) and of tremor frequencyoscillations (open boxes, bottom) of patients in tremor group. Arrows indicate the mean limb tremor frequency during the stereotaxic procedure. Numbersabove patient letter designations indicate total number of single STN neurons that were sampled in each patient. Numbers above boxes show the numberof single STN neurons in each group. In the box plot, the box indicates the 25th, 50th (median), and 75th percentiles, the error bars indicate the 10th and90th percentiles, and the dots represent outliers.
7768 J. Neurosci., October 15, 2000, 20(20):7766–7775 Levy et al. • Subthalamic Nucleus and Parkinsonian Tremor

short-interval interactions between STN neurons were never ob-served. However, 44/76 pairs of neurons were found to have asignificant cross-correlation at high frequencies (.10 Hz) in thetremor group. High-frequency oscillatory activity was more evidentin cross-correlograms than in autocorrelograms of single neurons(55/129 single STN neurons with high-frequency oscillatory activityin the tremor group). The oscillation strength ratings were strongerfor cross-correlation [7.4 (60.1 SE)] than for auto-correlation [6.9(60.1 SE)] (two-tailed t test, p , 0.01). Figure 2A shows thespontaneous ongoing discharge of two simultaneously recordedSTN neurons, and Figure 2B shows the corresponding correlo-grams and spectra for this pair. Although the spectral signal-to-
noise ratio of the high-frequency oscillation of unit 2 is lower thanfor unit 1, there is a statistically significant coherence between thepair. Figure 2C shows examples of cross-correlograms and coher-ence functions of neuron pairs with synchronous high-frequencyoscillatory activity from four patients in the tremor group; thesepairs all oscillated in phase but each patient had a unique oscilla-tion frequency. Furthermore, 36/76 pairs of STN neurons werefound to have a significant coherence at a high frequency [meansample time for the pairs of neurons was 79.3 sec (69.3 SE)].Coherence analysis revealed that fast oscillatory cells were also insynchrony for long periods of time. For example, eight of thesepairs were seen to be coherent and in phase for .2 min.
Figure 2. Synchronization of STN neurons with high-frequency oscillations. A, Traces 2 (Unit 1) and 3 (Unit 2) show the discharge activity of twosimultaneously recorded neurons during wrist tremor (patient E). The top trace is the recording of rectified wrist extensor electromyographic activity(EMG). Note that the two neurons tend to fire in synchrony with each other. B, Corresponding correlograms (top row) and spectra (bottom row) of thetraces shown in A (the total sample time used to construct these plots was 29 sec). In all correlograms, the lines indicate mean FR. In the cross-correlogram(right panel of top row), Unit 1 is used as the trigger. The thick dashed line in the coherence function indicates the level of significant coherence, and numberby the peak is the phase difference (right panel of bottom row; see Materials and Methods). C, Examples of cross-correlograms (lef t column; the dashed linesindicate mean 6 2 SD) and coherence functions (right column) of pairs of STN neurons with a high-frequency oscillatory component from four separatepatients (A, D, B, F, respectively). D, Linear regression analysis of percentage of pairs of STN neurons with a high-frequency cross-correlation as a functionof amount of total limb tremor (UPDRS: sum of action tremor and rest tremor) measured preoperatively. The triangles indicate those patients in whomtremor cells were also found. E, Linear regression analysis of the phase relationship between pairs of fast oscillatory STN neurons as a function of thedistance between the microelectrodes (phase calculated from cross-correlograms).
Levy et al. • Subthalamic Nucleus and Parkinsonian Tremor J. Neurosci., October 15, 2000, 20(20):7766–7775 7769

Figure 2D is a plot of the proportion of the pairs that displayedhigh-frequency oscillatory cross-correlation in each patient to eachpatient’s presurgical UPDRS tremor rating score. There was aroughly linear relationship between the amount of high-frequencysynchronous activity and the patients’ tremor (r2 5 0.67, p , 0.01).Data obtained from those patients in whom tremor cells wereencountered during the time of surgery are indicated by triangles.Although all six of the tremor group patients had limb tremorduring the procedure, the high-frequency rhythmic firing was alsopresent during some episodes when these patients did not have anynoticeable tremor. TCs were found in three of the six tremor grouppatients. The TCs that were encountered appeared to be localizedto regions that also contained cells with a high-frequency oscilla-tory component (see Fig. 5). There were nine instances of record-ing a TC on one electrode and no discernible TC frequencycomponent for the other neuron; three of these pairs showedsignificant high-frequency coherence. There were nine instances inwhich two TCs were recorded simultaneously, and the tremoroscillation in eight of these pairs was found to be coherent over thetotal amount of time sampled.
Figure 2E demonstrates that the phase relationship betweenhigh-frequency oscillatory pairs (detected from the cross-correlograms) was not dependent on the distance between therecording sites. There were 61 pairs of STN neurons investigatedthat were separated by 250 mm and 60 STN pairs that wereseparated by distances of .600 mm. Figure 2E shows that fast-frequency pairs were synchronous and in phase (absolute phasedifference) over distances up to 1.5 mm.
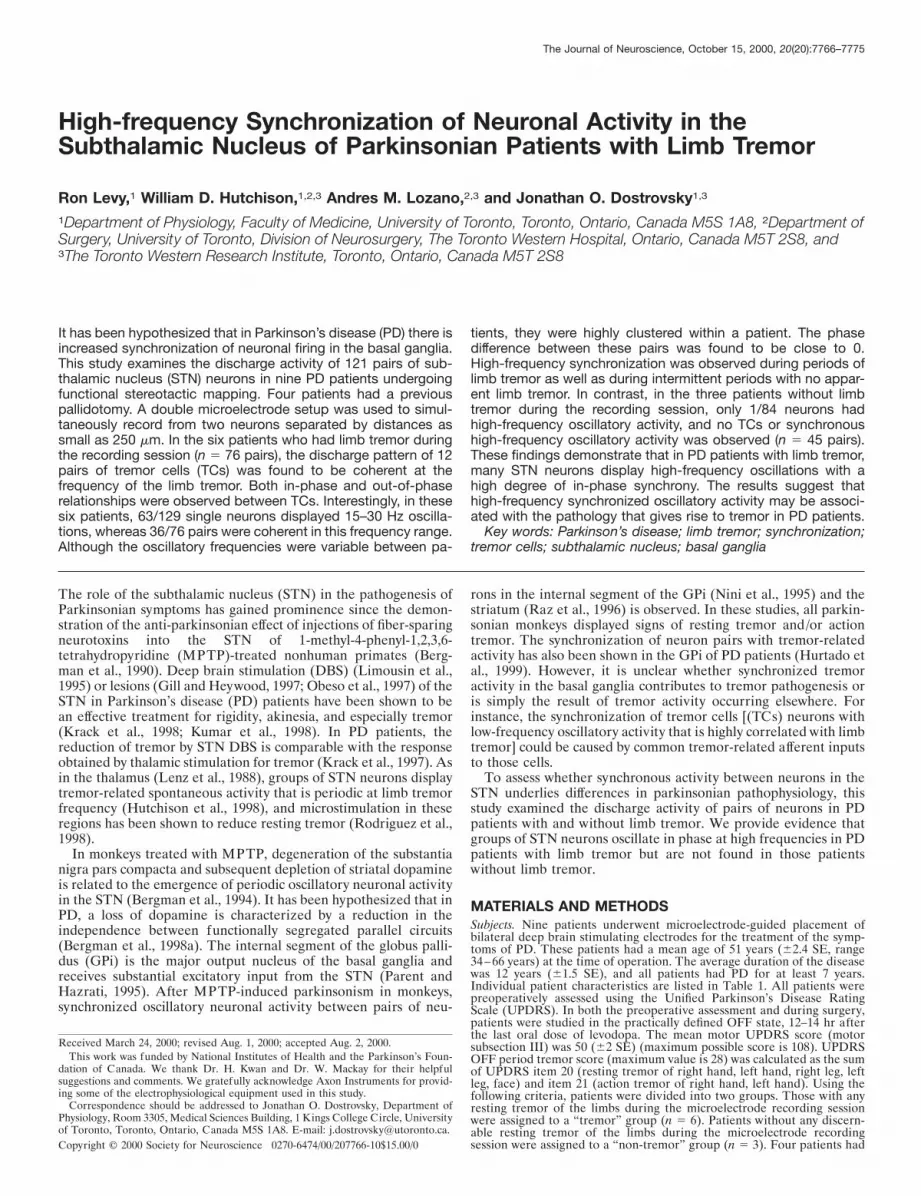
Temporal relationships between limb tremor and neural pairsynchronization are plotted in detail in Figure 3. Figure 3A displaysindividual power spectrums of two STN units (scaled to the signal-to-noise ratio; see Materials and Methods) and the coherencebetween them as a function of time during ongoing wrist tremor.Unit 1 was a STN TC with a high-frequency component, whereasunit 2 predominantly displayed high-frequency oscillatory activity.During a period of limb tremor (40–70 sec), both cells werecoherent at tremor frequency and at 20 Hz. When wrist tremor wassuppressed by an examiner holding the patient’s wrist, the pair ofunits displayed an even stronger high-frequency synchronization(as indicated by the value of the coherence). In contrast to this typeof modulation, high-frequency synchronization in several pairs wasobserved by inducing or enhancing resting tremor. Figure 3B showsthe changes in coherence between two cells in which, after a restperiod and some repetitive passive and voluntary movements [seeaccelerometer trace (Acc)], resting tremor was induced by askingthe patient to mentally count backward. It can be seen that when notremor was present, there was no coherence between the two cells,but during ankle tremor (;3.3 Hz), there was a strong high-frequency oscillatory synchronization. Because of the limited timeresolution, it is not possible to ascertain whether coherence pre-cisely coincides with the limb tremor. However, at 83 sec, the ankletremor was suppressed by having an examiner hold the patient’sankle for ;5 sec and then releasing, thereby letting tremor reap-pear. At this point (preceding the high-frequency synchronization),the two cells were coherent at tremor frequency. Note also thatthese cells were not coherent during the passive arm movementsbut did show coherence at 26–28 Hz during voluntary ankle move-ments. There was one other example in a different patient in whomthe high-frequency synchronization appeared during limb tremor(data not shown). The issue of whether high-frequency oscillatorysynchronization occurred during activity other than tremor was notfully explored. There were some neuron pairs that had ongoinghigh-frequency oscillatory synchronization during repetitive volun-tary limb movements such as pointing with one hand and tappingwith the other hand. An example is shown in Figure 4A where thepair displayed synchronization of their 24–28 Hz oscillation duringpassive repetitive elbow movements. Synchronization within thisfrequency range was absent during the voluntary pointing andtapping movements, but synchronization at ;15 Hz remained orbecame even stronger. These data indicate that high-frequency
synchronization between STN neurons is dynamic and depends onthe state of limb tremor and/or passive and voluntary movements.
Phase relationships of pairs of STN oscillatory neuronsFigure 4A also demonstrates that the pair of STN neurons with ahigh-frequency coherence had a stable phase relationship for a longperiod of time (.3 min). This is in contrast to pairs of STN TCs.An example of the phase variability of two TCs is shown in Figure4B. These cells go from being in phase at 50–60 sec to nearly outof phase at 70–80 sec. It is conceivable that lower coherence valueswere obtained in the tremor activity frequency range versus thehigh-frequency activity range because of differences in phase vari-ability between TC activity and high-frequency oscillatory activity(i.e., a high coherence value is related to a stable phase relation-ship; see Materials and Methods).
The tremor oscillations in pairs of tremor cells within the samepatients were also observed to have variable phase relationships.Figure 5 shows the spatial distribution of oscillatory activity in asingle patient in which two independent electrodes were used.During these recordings the patient had a robust 4–5 Hz restingtremor in both the contralateral hand and foot. The first STN cellwas encountered at 3.2 mm, whereas the last STN cell (a TC) wasfound at 21.0 mm. The schematic illustrates the oscillatory behav-ior of single units and the distances between the pairs of neurons.As indicated by the cross-correlograms and the correspondingcoherence function, some pairs of TCs were in phase (e.g., pair0.6 3 1.1), whereas others were out of phase (e.g., pair 0.2 3 0.0).It can also be seen that the phase relationships between neighbor-ing TCs could be out of phase even at distances as small as 200 mmbetween neurons (e.g., cells in track 2 at 0.9 and 1.1 mm vs cell at0.6 mm in track 1). Furthermore, not all pairs of TCs studied in thispatient were coherent (e.g., pair 1.3 3 1.7). Synchronization be-tween neurons with high-frequency oscillations, in contrast to TCactivity, was always close to 0. The mean phase difference betweenthe high-frequency oscillatory pairs in the two microelectrodetracks was only 8.7° (64.4 SE; maximum value is 31 degrees).Differences in coherence values between TCs and high-frequencyoscillatory neurons observed in Figure 5 could also be attributableto differences in sampling time. That is, over a long sampling time(i.e., pair 1.3 3 1.7 was sampled for 130 sec), lower coherencevalues might be obtained for pairs of TCs with a variable phaserelationship. Close inspection of Figure 5 also reveals that it waspossible to detect oscillatory synchrony from the cross-correlograms even if there was no significant oscillation in theautocorrelogram of one of the pair of neurons (e.g., pair 1.6 3 1.8,and pair 0.6 3 0.9).
DISCUSSIONThe existence of tremor-related activity in the STN in some of thePD patients in this study supports previous findings by our groupand others (Hutchison et al., 1998; Krack et al., 1998; Rodriguez etal., 1998). This study provides the first demonstration of neuronswith high-frequency oscillatory activity in the STN of PD patientsand associates the synchronization of these neurons with TC ac-tivity and limb tremor. High-frequency oscillatory activity wasbetter detected from cross-correlograms or coherence functionsthan from autocorrelograms or autospectra, suggesting that high-frequency oscillatory behavior of the STN reflects population syn-chronization rather than individual neuron behavior. Our studyfound that the median discharge rate of cells with no rhythmicdischarge was lower (43 Hz) than that for neurons with rhythmicdischarge (53 Hz). This differs from the findings of Rodriguez et al.(1998), who reported that the mean firing rate for TCs was 25 and49 Hz for other neurons. However, data from the present study areconsistent with findings from MPTP monkeys that indicate thatthere are differences in the spontaneous discharge rate of oscilla-tory versus non-oscillatory STN cells (Bergman et al., 1994). AfterMPTP treatment in African green monkeys, there was an increasein the overall spontaneous discharge of STN neurons from 19 to 26Hz, whereas tremor-related neurons showed an even more promi-
7770 J. Neurosci., October 15, 2000, 20(20):7766–7775 Levy et al. • Subthalamic Nucleus and Parkinsonian Tremor

Figure 3. Examples of the dynamic relationship between high-frequency oscillatory synchronization and limb tremor. A, Two STN neurons recorded frompatient D. The bottom two panels show the power spectrums for each neuron, scaled to the ratio of signal to total noise (see Materials and Methods). Thetop panel shows the coherence between the two neurons. The top trace shows the electromyographic activity (EMG) from the patient’s wrist flexorssmoothed to give an estimate of the strength of the tremor (shown in detail at the top right of this figure for the 60–64 sec period). Each unit displays bothfrequency components. However, the power spectrum of Unit 1 shows that Unit 1 has a larger tremor component oscillation, whereas power spectrum ofUnit 2 shows that Unit 2 has a larger high-frequency component oscillation. Note that high-frequency coherence between Units 1 and 2 becomes maximalwhen the wrist is held. B, Two STN neurons recorded from patient B. Power spectrums (bottom two panels) and coherence plot between two STN neuronsduring periods of ankle tremor, voluntary and passive ankle movements, and rest are shown. The two cells are synchronized at 15 Hz during resting limbtremor of ;3.3 Hz. Because of the time resolution of the coherence plot, it is unclear whether this synchronization precedes or follows limb tremor. Afterthe ankle is released, tremor amplitude increases, and the neuron pair resynchronizes at the same oscillation frequency. The top trace shows footaccelerometer (Acc) output. Coherence and autospectra plots were constructed by analyzing consecutive 10 sec sections of nonoverlapping data.
Levy et al. • Subthalamic Nucleus and Parkinsonian Tremor J. Neurosci., October 15, 2000, 20(20):7766–7775 7771
nent increase in FR to 35 Hz. In addition, the mean firing rates ofoscillatory neurons was greater than the firing rates of other neu-rons in all three parkinsonian monkeys. Our observations supportthe hypothesis that the STN is hyperactive in PD patients, espe-cially those patients with significant limb tremor.
The relationship between oscillatory neural activity and limbtremor has been explored in various monkey species in which limbtremor is differentially present after MPTP treatment. In a studyby Bergman et al. (1998b), neuronal oscillations in the GPi weresynchronized and more in phase in tremulous MPTP-treated
Figure 4. Changes in phase relationship between oscillatory STN neurons over time. A, Power spectrums, coherence, and phase (at ;17 Hz; see Materialsand Methods) between two STN neurons during a long sampling period containing passive and voluntary movements of elbow and arm (patient B). Notethat the phase remains constant over the 3 min sampling period. Coherence during passive repetitive elbow movements was at ;17 Hz and 24–28 Hz.Coherence during voluntary pointing and tapping with the opposite hand was limited to ;17 Hz. The top trace shows hand accelerometer (Acc) output.Same legend as in Figure 3. B, Same plots as in A showing that the phase relationship between two STN TCs varies over time (patient D). The top lef ttrace shows the smoothed EMG from the patient’s wrist extensors. Phase at ;5 Hz was calculated for time periods in which the pair of TCs displayedsignificantly coherent activity at this frequency.
7772 J. Neurosci., October 15, 2000, 20(20):7766–7775 Levy et al. • Subthalamic Nucleus and Parkinsonian Tremor

vervet (African green) monkeys than in non-tremulous parkinso-nian rhesus monkeys (i.e., MPTP-treated rhesus monkeys displayshort episodes of 10–16 Hz action tremor). Parkinsonian Africangreen monkeys have a 3–5 Hz limb tremor that closely resemblesthat found in patients with PD. It has also been demonstrated thatthe induction of limb tremor in the MPTP African green monkeymodel brings about not only low-frequency tremor-related activityin the STN, but also high-frequency oscillations in the frequencyrange of 8–20 Hz (Bergman et al., 1994). The present studysupports these observations and further demonstrates that TCs andcells with high-frequency oscillations in the STN of PD patientsdischarge in oscillatory synchrony. One caveat to this study is thatthe precise nature of the temporal relationship between limbtremor and high-frequency synchronization was not ascertained. Insome pairs of STN neurons in the tremor group, the appearance oflimb tremor coincided with high-frequency synchronization,whereas others displayed increases in oscillatory synchronizationwhen limb tremor was suppressed (Fig. 3). However, there was apaucity of single neurons with oscillatory activity and no synchro-
nous oscillations between pairs of STN neurons in the three pa-tients that did not have significant limb tremor (45 neuron pairsexamined). For the group of nine patients, the proportion ofhigh-frequency synchronized neuron pairs encountered during thestereotaxic mapping was correlated to the preoperative UPDRStremor score. Together these findings indicate that limb tremor andTC activity are associated with synchronized high-frequency oscil-lations. These results also imply that in those patients with rigidityor akinesia but little tremor, oscillatory synchronization is not anunderlying factor. That is, different neuronal activity patterns atthe level of the STN are present in PD patients expressing differentclinical features. The present study also demonstrated that in eachpatient not all STN TCs were coherent with each other andtherefore supports the hypothesis that there are independent“tremor-generating” circuits in the basal ganglia (Alberts et al.,1965; Hurtado et al., 1999; Raethjen et al., 2000). Pairs of TCs werefound to be coherent and out of phase at distances as small as ;250mm, suggesting that each tremor-generating circuit could occupy arelatively small volume of the STN. Our finding of variability in
Figure 5. The central box shows a reconstruction of simultaneously recorded neuron pairs from two microelectrode tracks in a single patient (patient D).Pairs of neurons are denoted by their location along each track (track 1 3 track 2). The meanings of the symbol shape and shading are indicated at thebottom. The strength of the high-frequency component is as follows: none 5 ,6, weak 5 6–7, strong 5 8–10 (see Materials and Methods). This patienthad a 4–5 Hz resting tremor in the hand and foot during these recordings. The first column of each pair of columns is the cross-correlogram, and the secondcolumn is the corresponding coherence function (resolution 1.95 Hz; dashed line indicates significance level) between each pair of neurons. The numbersat top lef t of each pair of plots indicate the depth of the pair of neurons in tracks 1 and 2, respectively. The numbers in parentheses indicate sampling timein seconds. The numbers beside each significant peak in the coherence function indicate the phase difference in degrees.
Levy et al. • Subthalamic Nucleus and Parkinsonian Tremor J. Neurosci., October 15, 2000, 20(20):7766–7775 7773

phase differences over time between pairs of STN TCs is alsoconsistent with the hypothesis that parkinsonian tremor is nonsta-tionary (Bergman et al., 1998b; Hurtado et al., 1999).
The STN plays a central role in basal ganglia circuitry (Alex-ander and Crutcher, 1990). In this study, no neuron pairs werefound that displayed a single short-latency peak in the cross-correlogram. This indicates that oscillatory synchronization islikely not caused by intranuclear interactions as a result of recur-rent collaterals (Kita et al., 1983) or possible interneurons (Rafolsand Fox, 1976), although the existence of interneurons in the STNremains unclear (Yelnik and Percheron, 1979; Van Der Kooy andHattori, 1980; Ryan et al., 1992). The main difference betweenneural synchronization that occurred at the tremor frequency com-pared with high-frequency synchronization was that all high-frequency oscillatory activity was consistently in phase and inde-pendent of the distance between recording sites. Pairs of neuronswith high-frequency oscillatory synchronization displayed constantphase differences over long sampling periods, whereas pairs of TCsdid not. Also, the distribution of high-frequency oscillations wastightly centered about a frequency that was unique to each patient.These findings imply that the underlying mechanisms of the twotypes of oscillatory synchrony are different. It is likely that thein-phase high-frequency synchronization observed in the STN ofPD patients is caused by synchronous activity occurring in otherareas. Two likely candidates are the external segment of the globuspallidus (GPe) and the cerebral cortex, both of which send massiveinput to the STN (Carpenter et al., 1981; Canteras et al., 1990).These two areas are integral to corticostriatal–GPe–STN–GPi(“indirect” pathway) and cortico–STN–GPi–thalamic circuitry, re-spectively (Alexander and Crutcher, 1990).
The STN sends excitatory output to the GPe and also receivesGABAergic input from the GPe, and thus the GPe may providefeedback inhibition to the STN (Rouzaire-Dubois et al., 1980). Ithas been shown that the GPe influences the firing rate and dis-charge pattern as well as the degree of correlated firing of adjacentSTN neurons in the rat (Ryan et al., 1992). In a study by Plenz andKital (1999), evidence from in vitro rat organotypic brain slices ofthe STN and the GPe suggests that together these nuclei form acentral pacemaker capable of sustained synchronous in-phase andout-of-phase oscillations. However, synchronized oscillations be-tween STN neurons occurred at frequencies that were significantlylower (,4 Hz) than those reported in this study, yet it was alsodemonstrated that a few GPe neurons have considerable controlover synchronized activity in the STN. It is therefore possible thatsynchronization could occur in the GPe or the striatum. It has alsobeen shown that tonically active neurons (cholinergic interneurons)in the striatum of monkeys display synchronized high-frequencyoscillatory activity (;15 Hz) after the depletion of dopamineattributable to MPTP treatment (Raz et al., 1996).
The STN receives a substantial excitatory glutamatergic inputfrom the cortex (Afsharpour, 1985; Rouzaire-Dubois and Scarnati,1985), and it has been shown that neighboring STN neurons sharecommon cortical inputs (Ryan et al., 1992). Furthermore, theincrease in the firing rates of the STN in 6-OHDA-treated rats isnot solely dependent on GPe (Hassani et al., 1996), suggesting thatdirect corticosubthalamic connections could be involved in thepathology of the parkinsonian STN. The response of the STN tocortical stimulation can be shaped by the GPe (Ryan and Clark,1991; Mouroux et al., 1995). The interaction between the STN andGPe is intimately related to cortical activity, and rhythmic oscilla-tory activity in STN–GPe may be driven by cortex (Magill et al.,2000). Direct cortico-STN input can also modulate the inhibitoryinfluence of the direct striatonigral pathway on SNr neurons (Mau-rice et al., 1999). It is therefore possible that the source of the overtsynchronization of high-frequency activity in the STN of PD pa-tients with limb tremor is caused by disturbances in cortical syn-chrony. The involvement of the cortex in parkinsonian tremor hasbeen well documented (Parker et al., 1992). Duffau et al. (1996)showed that during periods of limb tremor in PD patients, therewere increases in the normalized regional cerebral blood flow in
areas that were also modulated by voluntary repetitive arm move-ments. In patients with PD, cortical tremor-related network oscil-lations have been observed using magnetoencephalography (Volk-mann et al., 1996) and electroencephalography (Alberts et al.,1969). Disturbances in cortical synchronization of parkinsonianpatients at frequencies other than limb tremor frequencies havealso been reported (Makela et al., 1993; Neufeld et al., 1994; Brownand Marsden, 1999). These disturbances are hypothesized to resultfrom the inability of the parkinsonian basal ganglia to releasecortical elements from low-frequency “idling” rhythms, such as a(;10 Hz) and b (15–30 Hz), and allow for synchronization in theg range (30–50 Hz) (Brown and Marsden, 1998).
In summary, we have demonstrated that highly synchronousin-phase oscillatory activity is present in the STN of PD patientswith tremor-predominant symptoms. Synchronized high-frequencyactivity in the STN is likely involved in the pathophysiology of PDtremor and might in itself contribute to the expression of limbtremor.
REFERENCESAbeles M (1982) Quantification, smoothing, and confidence limits for
single-units’ histograms. J Neurosci Methods 5:317–325.Afsharpour S (1985) Topographical projections of the cerebral cortex to
the subthalamic nucleus. J Comp Neurol 236:14–28.Alberts WW, Libet B, Wright Jr EW, Feinstein B (1965) Physiological
mechanisms of tremor and rigidity in parkinsonism. Confin Neurol26:318–327.
Alberts WW, Wright Jr EW, Feinstein B (1969) Cortical potentials andParkinsonian tremor. Nature 221:670–672.
Alexander GE, Crutcher MD (1990) Functional architecture of basal gan-glia circuits: neural substrates of parallel processing. Trends Neurosci13:266–271.
Bergman H, Wichmann T, DeLong MR (1990) Reversal of experimentalparkinsonism by lesions of the subthalamic nucleus. Science249:1436–1438.
Bergman H, Wichmann T, Karmon B, DeLong MR (1994) The primatesubthalamic nucleus. II. Neuronal activity in the MPTP model of par-kinsonism. J Neurophysiol 72:507–520.
Bergman H, Feingold A, Nini A, Raz A, Slovin H, Abeles M, Vaadia E(1998a) Physiological aspects of information processing in the basalganglia of normal and parkinsonian primates. Trends Neurosci 21:32–38.
Bergman H, Raz A, Feingold A, Nini A, Nelken I, Hansel D, Ben Pazi H,Reches A (1998b) Physiology of MPTP tremor. Mov Disord 13[Suppl3]:29–34.
Brown P, Marsden CD (1998) What do the basal ganglia do? Lancet351:1801–1804.
Brown P, Marsden CD (1999) Bradykinesia and impairment of EEG de-synchronization in Parkinson’s disease. Mov Disord 14:423–429.
Canteras NS, Shammah-Lagnado SJ, Silva BA, Ricardo JA (1990) Affer-ent connections of the subthalamic nucleus: a combined retrograde andanterograde horseradish peroxidase study in the rat. Brain Res513:43–59.
Carpenter MB, Carleton SC, Keller JT, Conte P (1981) Connections ofthe subthalamic nucleus in the monkey. Brain Res 224:1–29.
Duffau H, Tzourio N, Caparros-Lefebvre D, Parker F, Mazoyer B (1996)Tremor and voluntary repetitive movement in Parkinson’s disease: com-parison before and after L-dopa with positron emission tomography.Exp Brain Res 107:453–462.
Glaser EM, Ruchkin DS (1976) Principals of neurobiological signal anal-ysis. New York: Academic.
Gill SS, Heywood P (1997) Bilateral dorsolateral subthalamotomy for ad-vanced Parkinson’s disease. Lancet 350:1224.
Hassani OK, Mouroux M, Feger J (1996) Increased subthalamic neuronalactivity after nigral dopaminergic lesion independent of disinhibition viathe globus pallidus. Neuroscience 72:105–115.
Hurtado JM, Gray CM, Tamas LB, Sigvardt KA (1999) Dynamics oftremor-related oscillations in the human globus pallidus: a single casestudy. Proc Natl Acad Sci USA 96:1674–1679.
Hutchison WD, Allan RJ, Opitz H, Levy R, Dostrovsky JO, Lang AE,Lozano AM (1998) Neurophysiological identification of the subtha-lamic nucleus in surgery for Parkinson’s disease. Ann Neurol 44:622–628.
Karmon B, Bergman H (1993) Detection of neuronal periodic oscillationsin the basal ganglia of normal and parkinsonian monkeys. Isr J Med Sci29:570–579.
Kita H, Chang HT, Kitai ST (1983) The morphology of intracellularlylabeled rat subthalamic neurons: a light microscopic analysis. J CompNeurol 215:245–257.
7774 J. Neurosci., October 15, 2000, 20(20):7766–7775 Levy et al. • Subthalamic Nucleus and Parkinsonian Tremor

Krack P, Pollak P, Limousin P, Benazzouz A, Benabid AL (1997) Stimu-lation of subthalamic nucleus alleviates tremor in Parkinson’s disease.Lancet 350:1675.
Krack P, Benazzouz A, Pollak P, Limousin P, Piallat B, Hoffmann D, XieJ, Benabid AL (1998) Treatment of tremor in Parkinson’s disease bysubthalamic nucleus stimulation. Mov Disord 13:907–914.
Kumar R, Lozano AM, Kim YJ, Hutchison WD, Sime E, Halket E, LangAE (1998) Double-blind evaluation of subthalamic nucleus deep brainstimulation in advanced Parkinson’s disease. Neurology 51:850–855.
Lenz FA, Tasker RR, Kwan HC, Schnider S, Kwong R, Murayama Y,Dostrovsky JO, Murphy JT (1988) Single unit analysis of the humanventral thalamic nuclear group: correlation of thalamic “tremor cells”with the 3–6 Hz component of parkinsonian tremor. J Neurosci8:754–764.
Limousin P, Pollak P, Benazzouz A, Hoffmann D, Le Bas JF, Broussolle E,Perret JE, Benabid AL (1995) Effect of parkinsonian signs and symp-toms of bilateral subthalamic nucleus stimulation. Lancet 345:91–95.
Magill PJ, Bolam JP, Bevan MD (2000) Relationship of activity in thesubthalamic nucleus-globus pallidus network to cortical electroencepha-logram. J Neurosci 20:820–833.
Makela JP, Hari P, Karhu J, Salmelin R, Teravainen H (1993) Suppres-sion of magnetic mu rhythm during parkinsonian tremor. Brain Res617:189–193.
Maurice N, Deniau JM, Glowinski J, Thierry AM (1999) Relationshipsbetween the prefrontal cortex and the basal ganglia in the rat: physiologyof the cortico-nigral circuits. J Neurosci 19:4674–4681.
Mouroux M, Hassani OK, Feger J (1995) Electrophysiological study of theexcitatory parafascicular projection to the subthalamic nucleus and evi-dence for ipsi- and contralateral controls. Neuroscience 67:399–407.
Neufeld MY, Blumen S, Aitkin I, Parmet Y, Korczyn AD (1994) EEGfrequency analysis in demented and nondemented parkinsonian patients.Dementia 5:23–28.
Nini A, Feingold A, Slovin H, Bergman H (1995) Neurons in the globuspallidus do not show correlated activity in the normal monkey, butphase-locked oscillations appear in the MPTP model of parkinsonism.J Neurophysiol 74:1800–1805.
Obeso JA, Alvarez L, Macias R (1997) Lesion of the subthalamic nucleusin Parkinson’s disease. Neurology 48:A138.
Parent A, Hazrati LN (1995) Functional anatomy of the basal ganglia. II.The place of subthalamic nucleus and external pallidum in basal gangliacircuitry. Brain Res Brain Res Rev 20:128–154.
Parker F, Tzourio N, Blond S, Petit H, Mazoyer B (1992) Evidence for acommon network of brain structures involved in parkinsonian tremor andvoluntary repetitive movement. Brain Res 584:11–17.
Plenz D, Kital ST (1999) A basal ganglia pacemaker formed by the sub-thalamic nucleus and external globus pallidus. Nature 400:677–682.
Raethjen J, Lindemann M, Schmaljohann H, Wenzelburger R, Pfister G,Deuschl G (2000) Multiple oscillators are causing parkinsonian andessential tremor. Mov Disord 15:84–94.
Rafols JA, Fox CA (1976) The neurons in the primate subthalamic nu-cleus: a Golgi and electron microscopic study. J Comp Neurol168:75–111.
Raz A, Feingold A, Zelanskaya V, Vaadia E, Bergman H (1996) Neuronalsynchronization of tonically active neurons in the striatum of normal andparkinsonian primates. J Neurophysiol 76:2083–2088.
Rodriguez MC, Guridi OJ, Alvarez L, Mewes K, Macias R, Vitek J,DeLong MR, Obeso JA (1998) The subthalamic nucleus and tremor inParkinson’s disease. Mov Disord 13[Suppl 3]:111–118.
Rosenberg JR, Amjad AM, Breeze P, Brillinger DR, Halliday DM (1989)The Fourier approach to the identification of functional coupling be-tween neuronal spike trains. Prog Biophys Mol Biol 53:1–31.
Rouzaire-Dubois B, Scarnati E (1985) Bilateral corticosubthalamic nu-cleus projections: an electrophysiological study in rats with chronic cere-bral lesions. Neuroscience 15:69–79.
Rouzaire-Dubois B, Hammond C, Hamon B, Feger J (1980) Pharmaco-logical blockade of the globus pallidus-induced inhibitory response ofsubthalamic cells in the rat. Brain Res 200:321–329.
Ryan LJ, Clark KB (1991) The role of the subthalamic nucleus in theresponse of globus pallidus neurons to stimulation of the prelimbic andagranular frontal cortices in rats. Exp Brain Res 86:641–651.
Ryan LJ, Sanders DJ, Clark KB (1992) Auto- and cross-correlation anal-ysis of subthalamic nucleus neuronal activity in neostriatal- and globuspallidal-lesioned rats. Brain Res 583:253–261.
Van Der Kooy D, Hattori T (1980) Single subthalamic nucleus neuronsproject to both the globus pallidus and substantia nigra in rat. J CompNeurol 192:751–768.
Volkmann J, Joliot M, Mogilner A, Ioannides AA, Lado F, Fazzini E,Ribary U, Llinas R (1996) Central motor loop oscillations in parkinso-nian resting tremor revealed by magnetoencephalography. Neurology46:1359–1370.
Yelnik J, Percheron G (1979) Subthalamic neurons in primates: a quanti-tative and comparative analysis. Neuroscience 4:1717–1743.
Levy et al. • Subthalamic Nucleus and Parkinsonian Tremor J. Neurosci., October 15, 2000, 20(20):7766–7775 7775


