Embed Size (px)
Citation preview

21
High Resolution Biological Visualization Techniques
Pavlina Pike1, Christian Parigger2 and Robert Splinter3 1University of Alabama at Birmingham
2University of Tennessee Space institute 3University of North Carolina at Charlotte
USA
1. Introduction Imaging with ionizing radiation is an integral part in today’s medicine. For example, breast tissue is more radiosensitive during puberty and exposures to the chest during that time would impose a higher risk of radiation-induced breast cancer (Doody et al., 2000). The use of ionizing radiation for medical imaging has significantly increased in the past 20 years, which has caused the effective dose per individual in the US to increase from 0.53 mSv in the early 1980s to 3 mSv in 2006 as reported by the National Council on Radiation Protection and Measurement. [NCRP No. 160, 93] This has naturally raised concerns about the possible risks that are associated with multiple exposures from diagnostic sources of radiation. There is a huge effort towards creating imaging modalities that can visualize tissue with a reduced dose to the patient without loss of image quality. Therefore, it would be advantageous to develop visualization techniques that employ non-ionizing radiation and that provide comparable high-resolution image quality as the currently available modalities. This is one reason why Magnetic Resonance Imaging (MRI) technology is gaining so much popularity in spite of the cost and the length of the exams. The non-invasive nature of light in the near-infrared region and its reduced attenuation in tissue are the reasons why optical imaging is gaining popularity. However, tissue scatter is a major limitation in optical imaging techniques. It is possible to combine optical imaging and ultrasound to produce images. This is accomplished by the use of ultra-short laser pulses that are absorbed in the medium, which cause the temperature of the material to rapidly rise and fall. Consequently, the irradiated volume becomes an internal source of ultrasonic waves, which can be used to obtain diagnostic information. Photo-acoustic spectroscopy has been shown to be a great tool to successfully visualize and characterize: • blood vessels (Zhang et al. 2009; Hoelen et al. 1998; Sethuraman, S. et al. 2006); • breast cancer (Ermilov et al. 2009); • brain in vivo (Wang, X. D. et al. 2003; Yang, X. et al. 2007; Lingu et al. 2007); • prostate lesions (Yaseen et al. 2010). Photo-acoustic spectroscopy has also been considered for detection of caries in its early stage (Kim et al. 2006), analysis of dental materials (Coloiano et al. 2005) and potentially for visualizations under porcelain crowns. (Pike et al. 2007) New clinical demands for imaging are continuously emerging, placing different constraints on the imaging requirements and

Laser Pulse Phenomena and Applications
434
the imaging conditions, e.g., in-vivo versus in-vitro imaging. One such new development in biology is regenerative medicine, which addresses cell structure growth for transplant purposes. In regenerative medicine the organ is grown outside the body and requires quality control before it can be implanted in a living organism with a high degree of success for survival (Hendee W et al., 2008).
2. Examples of available imaging applications The visualization of superficial vascular malformations, for instance has been shown to benefit most from thermography (Saxena AK, Willital GH, 2008). Another example is in dentistry: Dental X-ray images are problematical for clear display of the vitality of dental pulp, especially under ceramic crowns. Such an evaluation is important, because severe pain can originate from the pulp as a result of trauma or dental caries. In addition, for patients undergoing a hart valve replacement surgery or cancer patients undergoing treatment while on immunosuppressant medication such infections can be life threatening (Pike P et al., 2007). Optical Coherence Tomography (OCT) can be applied in various formats, using the respective optical characteristics of laser- light: coherence, spectral compositions, polarization and time-of-flight. The specific OCT applications available are for instance: Time domain OCT; Frequency domain OCT (FD-OCT); Polarization-sensitive OCT; spatially encoded frequency domain OCT (spectral domain or Fourier domain OCT); and time encoded frequency domain OCT (also swept source OCT) in addition to combinations of their mechanisms. Each application reveals its own particular details about the tissue composition, pathological conditions and structural formation (Huang SA et al., 2007). Microwave images use Giga Hertz electromagnetic radiation to interact with the cellular structure on an electronic level (Fear EC et al., 2002). Microwave imaging uses the fact that cells show dipole character with a membrane that act as independent electronic circuits. The electronic tissue details can provide histological and pathological information non-invasively and in-vivo. The mechanism of action relies on the cellular components’ dielectric properties that will influence the wave propagation and hence act as a sensing mechanism (Semenov et al., 1995, Semenov et al., 1996). Spectroscopic imaging for all wavelength ranges uses the alteration in the spectral structure of the input signal both in the time and frequency domain as a result of interaction with the biological medium. Time-resolved spectroscopy is gaining popularity as a result of the reduced price of sensors that are capable of the high speed, short-time response (femto-second) as well as the reduced size of the sensors. In optical, microwave and acoustic imaging techniques the spectral performance will embed crucial tissue information. However, the most accurate spectral application of Raman spectroscopy can primarily be realized free-space since the delivery device usually introduces its own Raman spectral aberrations. In this case time-resolved spectroscopy may offer a solution for all non-ionizing imaging techniques. The purpose of this chapter is to summarize both in-vivo and in-vitro techniques that involve image formation based on signals generated in tissue by the various visualization methods applying non-ionizing radiation for high-resolution signal generation and sensing/imaging. In this chapter three high resolution imaging techniques will be described each relying on the time-of-flight principle in various formats [both acoustic and optical] and the available options to enhance the level of detail that can be resolved. The importance

High Resolution Biological Visualization Techniques
435
of high resolution imaging for diagnostic clinical and laboratory applications is illustrated by the imaging requirements which is followed by the detailed description of the scientific basis of Photo-Acoustic imaging (PAI) and several potential applications, followed by the mechanism of action of ultra short laser pulses, generally crucial to the photo-acoustic technique that are particularly critical to establish non-destructive testing conditions. Additionally the coherence aspect of time-of-flight is described with Optical Coherence tomography and the available options within this technique. The chapter will conclude with a description of short-pulse measurements and in particular application of autocorrelation measurements from interference images.
3. Biological imaging requirements One possibility is to generate acoustic waves with femto-second laser pulses and analyze the recorded signals. This process is called Photo-Acoustic (PA) spectroscopy and has been shown to be highly sensitive for variety of applications, including the determination of small concentrations of molecular species, and the analysis of photo-thermal expansion and contractions of molecules. One advantage of such techniques is that the signal generation is primarily a result of the absorption of electromagnetic radiation inside the tissue. Scattering is not a major factor in the signal degeneration. This method has been shown to be useful to detect breast cancer (Ermilov SA et al., 2009), to visualize vasculature in mouse brain by adding golden nano-spheres to improve optical contrast (Lu W et al., 2010), to evaluate tissue growth and regeneration (Yuan Z et al., 2010), and 3-D visualization blood vessels (Zhang EZ et al., 2009). In fact different variations of this technique have been developed for specific clinical applications. The advantage of the PA technique is that the signal is generated primarily as a result of the absorption of light. Distortion of the signal due to scattering is not an issue as in other imaging methods. Recently, it has been shown to be viable for variety of biomedical applications, such as visualization of tumor angiogenesis and characterization of arterial walls.
4. Photo-acoustic spectroscopy 4.1 Photo-acoustic imaging mechanism of action It was Alexander Bell who reportedly first described the phenomenon of sound generation in materials by light (Bell, 1880). As he shone chopped light on strongly absorbing substances he observed that audible sound was generated. Todays laser systems can deposit energy via ultra short optical pulses and cause the rapid thermal expansion and relaxation of the targeted volume in the tissue. That in turn will cause the generation of a pressure wave which will carry information about the thermal and mechanical characteristics of the tissue in which it originated. The ultrasonic wave is then detected by the use of a transducer or an array of transducers for parallel data acquisition. The energy deposited by the laser puse will be absorbed and and then it will diffuse into the surroundings. The temperature will initially spike and then a gradual decrease will follow. The time it takes for it to reach 37% of its original value is called the thermal relaxation time, defined by equation 1:
2 / 4rτ δ α= (1)
Laser Pulse Phenomena and Applications
436
where δ is the smaller of either the optical penetration depth [mm] or the dimesion of the absorbing lesion of interest, and α is the thermal diffusivity [cm2/s]. The ultrasonic wave that is generated will travel through the thickness of the target volume. The time it takes it to do so is called the stress relaxation time, shown by equation 2:
saVδτ = (2)
where aV is the speed of sound in tissue. The energy deposition in the mterial will be defined spatially by the laser light distribution if the thermal confinement condition is fulfilled. This will happen when the laser pulse duration ( pτ ) is less than the thermal relaxation time( rτ ). When ultra-short laser pulses are used, the stress relaxation is significantly faster than the thermal relaxation and p s rτ τ τ< < . Although the temperature rise can be quite small, measurable pressure can be generated. The pressure rise ( ( )p r ) can be calculated using material properties, such as the isothermal compressibility, κ [Pa-1], the thermal coefficient of volume expansion and β [K-1] as expressed by equation 3 (Gusev & Karabutov, 1993):
( )( ) T rp r βκ
= (3)
For example, the isothermal compressibilty of dental enamel can be calculated to be about 12 18.5 10 Pa− −× using density of 3000 kg/m3 and speed of sound of 6250 m/s. If we take the
volume expansion coefficient of enamel to be about 6 120 10 K− −× and temperature rise after the interaction with a 70 fs laser pulse to be about 1 μK (Pike et al., 2007). The pressure generated is therefore about 2.35 Pa. The generation of a pressure wave and its consequent propagation through the medium is governed by the nonhomogeneous wave equation or also called the “general photoacoustic equation” given by equation 4:
2
22 2
1 =p
p HpC tv tβ∂ ∂
∇ − −∂∂
(4)
where ( ), , ,H x y z t is the absorbed electromagnetic energy density that is converted into heat per unit volume [W/cm3], β is the coefficient of thermal expansion [K-1], pC is the specific heat at constant pressure [J/kg.K], 0T is the ambient temperature [K], α is the thermal diffusivity [cm2/s] and v is the speed of sound [cm/s] (McKenzie, 1990). The amount of energy that is absorbed as a result of the deposition of the laser energy pulse depends on the optical properties of the material and more specifically, the optical absorption coefficient aμ [cm-1] and the laser energy fluence, I [J/cm2]. Therefore, we can rewrite equation 4 as:
2
22 2
1 = a
p
p IpC tv tβμ∂ ∂
∇ − −∂∂
(5)
The source term in this equation can take different forms depending on the application of interest. For example, it has been modeled as a Gaussian distribution in space and time (Heretier, 1983), Lai, 1982) as follows:

High Resolution Biological Visualization Techniques
437
2 2
3/2 2 2 20 0
2( , ) = exp2 2her
L L
E r tI r tw wπ τ τ
⎡ ⎤− −⎢ ⎥⎢ ⎥⎣ ⎦
(6)
where 0w is the laser beam waist, E is the energy per pulse, and the pulse full-width at half-maximum (FWHM) is Lτ . The solution for the pressure therefore can be expressed in terms of Bessel functions 1
4I and 1
4K , as displayed in equations 7 through 8:
1/23/2 1 2
1/2 2 2( )( , ) =
8 2e a e
p
E v d t dp r tr C dt ncv dt
τ μ β γτπ
− −⎛ ⎞′Φ Φ⎛ ⎞ ⎜ ⎟−⎜ ⎟ ⎜ ⎟′ ′⎝ ⎠ ⎝ ⎠ (7)
2 2
21/4 1/4
2( ) = exp( / 4) 2 ( )4 4
t tt t t K t Iπ
⎡ ⎤⎛ ⎞ ⎛ ⎞′ ′′ ′ ′ ′Φ − + Θ⎢ ⎥⎜ ⎟ ⎜ ⎟⎜ ⎟ ⎜ ⎟⎢ ⎥⎝ ⎠ ⎝ ⎠⎣ ⎦
(8)
= ( / ) / et t r v τ′ − (9)
2 2 1/2= ( )e p aτ τ τ+ (10)
4.2 Temperature distribution following femtosecond laser irradiation Ultra short laser radiation induces sudden temperature and pressure spikes in the local volume because the pulse duration is much shorter than the thermal relaxation time of the medium. In a previously reported experimental study (Pike at al., 2007) rather than using single femto-second pulses pulse trains of femtosecond laser pulses were employed for measurement of the temperature rise. Figure 1 shows the experimental arrangement, and it illustrates a typical experimental result of the temperature rise due to repetitive exposure of dental material to 40 ms pulse trains of 70 fs laser pulses.
Time [S econds]
Tem
pera
ture
Ris
e[C
elsi
us]
0 .9 1 1 .1 1 .2 1 .30
1
2
3
4
5
6
7
8
Fig. 1. (Left) Experimental arrangement for measurement of temperature rise due to exposure of dental material to 40 ms trains of femtosecond laser pulses that occur at a rate of 76 MHz (Spectra Physics model Tsuname Ti:Sapphire). (Right) Experimental results for the temperature rise during a 40 ms exposure – 3 Joules/cm2 is delivered to the material causing a temperature rise of typically 6 degrees Celsius due to exposure to approximately 3 million femtosecond laser pulses.

Laser Pulse Phenomena and Applications
438
From experimental data, see Fig. 1, a temperature rise of 2 µK can be inferred due to the 6 degree rise from 3 million laser pulses. Clearly the thermal relaxation time is much slower (order of 100 millisecond) than the duration of an individual laser pulse of 70 femtosecond. Modeling of the temperature rise due to ultra short laser radiation will be addressed in the following. The heat transfer equation describes the temperature distribution following laser irradiation, indicated in equation 11
20=T HT T
t tκκ βα∂ ∂
∇ − −∂ ∂
(11)
Solution for the temperature can be found by modeling the source term on the right hand side of Equ. 11 in terms of the Dirac delta distribution (Qiu, 1993) in equation 12 below
2
0 2(1 ) 2( )= exp[ ]exp[ ] ( ),
'
a aH R rT J z tt
β μ μ δκ ω
∂ −− −
∂ (12)
1/220
0 20
( )( ) = 1 z zz λω ωπω
⎛ ⎞⎛ ⎞−⎜ ⎟+ ⎜ ⎟⎜ ⎟⎜ ⎟⎝ ⎠⎝ ⎠ (13)
where R is the surface reflectivity, 0ω is the laser beam minimum waist size [cm] located at the distance z0. The analytic solution can be found utilizing Green‘s function, which can be written as follows in equation 14:
32 2 22
21 | |( , ; , ) = exp
44 ( )
'' '
' 'a a r rG r t r tt t a t tπ
⎛ ⎞ ⎡ ⎤−− −⎜ ⎟ ⎢ ⎥⎜ ⎟− −⎢ ⎥⎝ ⎠ ⎣ ⎦
(14)
In this equation 2 /a cρ κ= with ρ - mass density of the material [kg/m3], c – specific heat capacity [J/kg.K], and χ is the thermal conductivity. For spherical polar coordinates the analytic solution yields the temperature profile in equation 15:
2
0 3/2 22(1 )= exp[ ]exp[ ]
(1 ) (1 )R J rT T z
c wα α
ρ τ τ−
+ − −+ +
(15)
In Equ. 15, the scaled time τ mounts to 2 28t
a wτ = . Numerical analysis of the theoretical
model shows agreement with experimental results (Pike, 2005; Pike et al. 2007). Recent theoretical studies of temperature distribution modelling (Mukherjee & Chakrabotry, 2010) focus on developing a mathematical model of heat transfer based on identifying thermal resistances within the dental profile. Corresponding to the temperature rise, suitable laser powers are inferred for miniscule heat flux to occur.
4.3 Advantages of femtosecond laser radiation and femtosecond spectroscopy The superiority of femto-second laser pulses for precise material processing has been demonstrated in the literature. (Chichkov et al., 1996; Serbin et al., 2002) The interaction of

High Resolution Biological Visualization Techniques
439
the ultra-short laser pulses with the target material is thermally confined, i.e., the thermal diffusion takes place within the irradiated area. Therefore, the femto-second laser pulses create minimal (when compared for example to nominal nanosecond laser pulses) thermal and mechanical damage to the surrounding area during laser imaging, drilling and/or ablation. This particular feature is favorable for use of femto-second laser pulses in dental practices. (Serbin et al., 2002; Frentzen & Hamrol, 2000) The temperature profile can be controlled temporally and spatially which is beneficiary for photo-acoustic imaging. The pressure amplitude during drilling of a dentine slice with femto-second pulses is 2 to 3 orders of magnitude lower than the acoustic transients created by nanosecond pulses. (Serbin et al. 2002) Diminished pressure amplitudes are important, because otherwise generation of micro-cracks of several tens of microns in the enamel would result in new carious attacks and thus defeat the treatment process. Application of femto-second laser radiation has also seen a remarkable development in recent years (Hannaford, 2005). These developments include revolutionizing ultrahigh precision spectroscopy, development of soft X-ray femtosecond laser sources for biomedical imaging, generation of attosecond laser pulses for study of ultrafast phenomena such as electron dynamics, novel methods for measuring and characterizing ultrashort laser pulses and ultrashort pulses of light, coherent control of atomic- and molecular- and electron- dynamics, real-time spectroscopy of molecular vibrations, or multidimensional femtosecond coherent spectroscopies. However, in this chapter we focus on determination of the laser pulse-width using autocorrelation measurements, discussed in a later Section 6.
5. Optical coherent imaging One mechanism of deep tissue sensing can be accomplished using the coherence properties of light. In order to obtain clinically relevant information for diagnostic purposes the suspected tissue may need to be surgically removed in the form of a biopsy for further examination. The successful treatment of pathological conditions will rely on expedient and effective diagnostic information. Whether this needs to be invasive (i.e. biopsy) or non-invasive (i.e. sensing/imaging) will depend on the level of intricacy that can be obtained by imaging, which will also be in-vivo and ideally will be instantaneous. The primary mechanism of diagnostic sensing using the coherence properties of light is referred to as Optical Coherence Tomography (OCT). The principle of OCT will be described next. Optical coherence tomography is a non-destructive and noncontact imaging modality that reconstructs depth-resolved images of biological tissue based on local optical property distribution in two- and three-dimensional layout (Gibson et al., 2006; Choma, 2004; Jiang et al., 1998; Jiang et al., 1997; Najarian, 2005; Splinter, 2006), whereas the physical reconstruction process can be found in signal processing literature (Najarian & Splinter, 2005; Splinter & Hooper, 2006).
5.1 Optical coherence tomography Optical Coherence Tomography relies on interference between the probing source and a reference source to enhance the signal resolution. However, due to the scattering artefact in turbid media such as tissue, the signal strength quickly degenerates with depth, hence limiting the depth resolution. Optical Coherence Tomography is the superposition of the following terms: optics, coherence and tomography. Each word has a root meaning that explains its place in the method name. Optics: using electromagnetic radiation, primarily in the wavelength range of

Laser Pulse Phenomena and Applications
440
300 nm – 900 nm. Optics contains all the electromagnetic radiation properties such as amplitude, phase, frequency, polarization as well as time-of-flight. Coherence [cohaesus (Latin)]: fit together, synchronization in phase between waves of identical wavelength, allowing for interference. Tomography; contraction of tomo [tomos (Greek)]: slice/section and graphy [graphikos (Greek)]: depiction. In Optical Coherence Tomography an image is reconstructed from multiple adjacent one-dimensional signals derived from optical recordings executed in a grid pattern (Gibson et al., 2006; Choma, 2004; Jiang et al., 1998; Jiang et al., 1997; Najarian & Splinter, 2005; Splinter & Hooper, 2006). Since OCT uses optics as the signal carrier, it can be both free-space and through fiber-optics. The fundamental of the mechanism of action of conventional OCT will be followed by more complex diagnostics including the polarization and frequency information as altered by the biological scatter.
5.2 Mechanism of action of optical coherence imaging The mechanism of coherence relies on the use of two identical sources. Optical power from the light source, is divided approximately 50/50 between the two arms using a optical beam-splitter (Huang et al., 1991; Fercher et al., 1995; Splinter & Hooper, 2006). In the sample arm, light is backscattered/reflected is collected from different depths within the sample. At the splitter the light from the reference arm is recombined with the light from the sensing arm and interference will occur based on the phase of each wavelength of the returning light. The rudimentary description of OCT operation so far does not capture the physics involved. The basic principles involved in OCT are as follows: • Coherence length and the generation of low coherence light. • Low-coherence interferometer. Since the rigorous physical analysis of partial coherence interferometry is extremely involved, a narrative description will be presented that preserves the important features while attempting to provide an intuitive picture. At first the low coherence source concept is outlined.
5.3 Light sources and coherence length In order obtain the high resolution that is typically achieved in optical coherence tomography it is necessary to employ a light source that has a relatively long coherence length, compared to laser radiation. The axial resolution in OCT is limited by this coherence length (Huang et al., 1991). The coherence length of a source can be defined as the physical length in space over which one part of the electromagnetic wave train bears a constant phase relationship to another part. The coherence length is thus the net delay that can be inserted between two identical waves that still allows observation of constructive and destructive interference. The coherence length: Lc of the source, is defined in equation 16:
2
avgcL
λλ= Δ
(16)
Where: 2avgλ represents the square of the average wavelength of the spectral bandwidth of
the source and λΔ represents the bandwidth of the source. Long coherence length can be achieved by a super luminescent diode (SLD) or Q-switched laser as well as various other sources (Chen et al., 2002).

High Resolution Biological Visualization Techniques
441
5.4 Theory of optical coherence tomography Optical coherence tomography exploits the low temporal coherence of a light source to resolve, on the z-axis (i.e. in-line with the propagation direction), the position where backscattered light is being collected for identification (Choma, 2004). The diameter of the target point is related to the scanning beam diameter or the numeric aperture of the delivery/detection fiber, which also dictates the lateral resolution. A single mode fiber is generally used because the small numeric aperture reduces the solid angle from which light may be collected, providing high lateral resolution. Either the tissue or the fiber tip is then scanned in two dimensions to reconstruct point-by-point to form a two- or three-dimensional image of the specimen (Gibson et al., 2006; Choma, 2004; Jiang et al., 1998; Jiang et al., 1997; Najarian & Splinter, 2005; Splinter & Hooper, 2006). The single mode fiber satisfies the additional requirement of mandating coherence throughout the detection system. The interference signal can now be examined separate from the remainder of the returning light (Diels et al., 1985; Yan and Diels, 1991; Naganuma et al., 1989). The principles of interferometry are discussed in two parts: the intensity transfer function of the interferometer, and the dependence of the detected signal on the optical path difference between the sample and reference arms. The following initial approximations are made for the theoretical description of the operating mechanism of OCT: • Source is monochromatic. • Dispersion effects are eliminated in analyzing the detected intensity as a function of
reference mirror position. The additional approximation that the source emits plane waves, which is not truly a good approximation to the Gaussian single mode beam profile, will not be revised here for the sake of simplicity (Huang et al., 1991; Splinter & Hooper, 2006). The general source equation is the standard (scalar) wave expression shown in equation 17:
( )0
i kz tsourceE E e ω−= (17)
where ω is the angular frequency of the electric field and 0E is the real amplitude of the electric field of the wave. Equation 2 is specific to an electric wave propagating in the positive z-direction in a non-dispersive, dielectric material. The quantity k is the (pure real) wave number, which is related to wavelength of the source as defined in equation 18:
2k nπλ
= (18)
where n is the material refractive index of the medium (n=1.36 for tissues at 623 nm) and λ the wavelength of the source and collected signal. The expression for the total electric field at the detector is given by the superposition of these two returning waves as shown in equation 19 (Splinter and Hooper, 2006):
( ) ( )0 0
r si kz t i kz ttotal r sE E e E eω ω− −= + (19)
With the expression for the returning signals: reference ( rE ) and sample ( sE ). Where the subscript: r indicates the returning reference signal and the subscript: s referrers to the returning sample signal. The terms zr and zs are the respective distances to and from the reference mirror and a specific reflection site within the sample. For the electric waves

Laser Pulse Phenomena and Applications
442
described above, the detected intensity at the interferometer can be calculated from the square of the electric field amplitude as given by equation 20:
( )* 2 20 0 0 0
0 0
0 0 0 00
cos( )2 2
2 2 cos ( )
total total s r s r r s
s r s r r s
n nI E E E E E E kz kzc c
I I I I z z
μ μ
πλ
= = + + −
⎡ ⎤= + + −⎢ ⎥
⎣ ⎦
(20)
where 0μ is the magnetic permeability, c is the speed of light in vacuum, and the star denotes complex conjugation of the electric field expression. The intensity collected by an optical sensor directly correlates to the output voltage used for identification (Splinter and Hooper, 2006; Jiang et al. 1991). The detected intensity depends on the relative distance travelled by each of the electric waves resulting from the interference (cosine) term. In coherence sensing from a biological sample the interference term is relatively small compared to the background due to the relative amplitudes of the reflected reference and sample signals. Signal collection is in general affected with noise from various origins. This is particularly true for a direct-current (DC) signal (Jiang, 1998; Dunn, 1999). One way to eradicate noise is to convert to an alternating signal and more specifically by Doppler-shifting the light source by external means. Collecting the secondary source (i.e. generated inside the tissue) with the same modulation will dramatically enhance the signal-to-noise ratio. This principle is described as heterodyning. Heterodyning is the act of source modulation using a single frequency and detecting “locked-in” to that same frequency, this accomplishes a common mode rejection of any signal with random fluctuations or steady state signal (Splinter, 2006). The modulation can be based on path-length (mechanical) or amplitude (electronic) of an optical system. Heterodyning produces signal to noise ratio of up to 120 dB. Signal to noise ratios of at least 100 dB are necessary to obtain any useful depth resolution in highly scattering media (Najarian, 2006).
5.5 Coherence imaging for therapeutic feedback One specific application of optical coherence imaging uses the changes in the optical path due to alteration made to the tissue while undergoing laser photocoagulation. Coagulation changes the cellular structure and hence the optical properties, thus changing the collected signal as a function of depth. Figure 2 illustrates the differing behavior. Additionally, different tissues have their own unique and specific optical characteristics. These respective optical properties can be used to curve-fit the optical path as a function of depth against a reference library to non-invasively determine the tissue type (i.e. fat, muscle, collagen, etc.) in an attempt to allow selection of the target for treatment. All of the aforementioned imaging modalities can benefit from some form of spectral decoding. The frequency spectrum may act as a tuning fork to match a pattern to a look-up table with the listed “color-matrix” of pre-determined shapes, materials and biological conditions.

High Resolution Biological Visualization Techniques
443
Tissue Depth [μm]
Sca
led
Flue
nce
Rat
e
0 5 10 150
0.5
1
1.5 collagen
coagulatedmuscle
muscle
Fig. 2. Optical biopsy obtained by coherent imaging. Target recognition of collagen vs muscle as well as the influence of therapeutic coagulation on muscle. The depth profile of the fluence rate can be matched against a library of tissue characteristics for identification.
6. Measurement of ultra-short light pulses Recent developments of ultra-short light pulses extend to use of Frequency-Resolved –Optical-Gating (FROG) that have evolved to measurements of intensity and phase so simple that essentially no alignment is required (Gu et al., 2005). In addition, with certain FROG variations it is now possible to measure more general light pulses, i.e., light pulses much more complex than common laser pulses. The new variation of FROG, called GRENOIULLE (O’Shea et al., 2001), has no sensitive alignment knobs and is composed of only a few elements. In this section measurements of nominally 70 fs laser pulses from interference images are discussed (Guan, 1999; Guan & Parigger, 2000) in the overlap region of two beams. The analysis makes use of Fourier transform techniques to extract the interference cross term in the spatial frequency domain. The autocorrelation function is obtained by systematically varying the time delay of the two beams. The laser pulse width can subsequently be determined for an assumed pulse shape.
6.1 Background for short-pulse measurements The characterization of ultra-short laser pulses is generally required in experimental investigations with nominally 70 femtosecond laser pulses. The physical quantities of interest include wavelength, band width, coherence length and pulse width. A relatively simple characterization can be obtained by measuring the spectrum of the short pulse. The recorded spectrum yields the center wavelength and the bandwidth of the pulse. The pulse-width can be inferred for a transform-limited pulse. The temporal characteristics of the laser pulses can be alternatively obtained from the measurement of the autocorrelation function, as indicated in early works on the subject. (Diels et al., 1985; Yan and Diels, 1991; Naganuma et al., 1989) The frequency domain method was developed to unambiguously determine the pulse shape and phase. (Chilla & Martinez, 1991a; Chilla & Martinez, 1991b; Chilla & Martinez, 1992) Almost simultaneously the technique of frequency-resolved optical gating was introduced. (Kane & Trebino, 1993; Trebino and Kane, 1993; Paye et al., 1993) Subsequent works are elaborated in the literature.

Laser Pulse Phenomena and Applications
444
(Miyamoto et al., 1993; Chu et al., 1995; Meshulach et al., 1997; Li et al., 1997) A nonlinear medium is typically required to generate a second or third harmonic signal that is associated with the autocorrelation trace. The technique of interferometry or holography (Takeda et al., 1982; Macy, 1983; Kreis, 1986; Coobles, 1987; Zhu et al., 1989) may be used to measure the correlation function. The coherence length of a laser pulse can be determined from the correlation function. In this section we present measurements of the autocorrelation function by scanning the relative delay of the two laser beams and by recording interference images. A nonlinear medium is not required in the overlap region. The information in an image is decomposed according to the spatial frequencies by the use of Fourier transform techniques. (Takeda et al., 1982; Macy, 1983; Kreis, 1986) The interference information is usually restricted to a specific range of spatial frequencies in Fourier transform space. This range may be separated from the low frequency background and high frequency noise. The interference information can be extracted through an appropriate filter to yield the autocorrelation coefficients for a particular time delay. The pulse-width is determined by fitting the autocorrelation function for an assumed hyperbolic secant pulse-shape.
6.2 Experimental arrangement for pulse-width measurements The interference patterns of overlapping ultra-short pulses are directly recorded by the use of a CCD camera. Figure 3 shows the experimental arrangement. The Spectra Physics model Tsunami Ti:Sapphire laser pulses, produced at a repetition rate of 76 MHz, are specified to be as short as 60 femtosecond when dispersion due to transit through the output coupler is fully compensated.
Fig. 3. Schematic experimental arrangement for short pulse interference measurements.
The laser beam is reflected by the mirrors M1, M2 and M3. A portion of the beam (see BS1) enters a Jarrell-Ash MonoSpec 27 spectrometer and the approximately 10 nm band-width spectra are monitored by the use of a Princeton Applied Research optical multichannel analyzer (OMA). For the measurement of interference images the laser beam was further split by the use of a wedge (BS2) as a beam splitter. The tilt of the wedge and the mirrors M4 and M5 were adjusted to obtain spatial overlap of the beams in the field of view of the camera.

High Resolution Biological Visualization Techniques
445
Figure 4 shows details of the box indicated in Fig. 3. The reflected beam from the front-face of the wedge is re-directed and passed again through the wedge prior to entering the interference field. The mirror M6 is mounted on an AEROTECH translation stage to allow us to systematically vary the time delay between the beams. Two other relatively strong reflections are also illustrated in the figure. The two beams each pass the wedge once and are subject to similar dispersion. Therefore, it can be assumed that the pulses have the same temporal profile. The intensity ratio of the two beams is close to 1. However, the exact value is not important in our analysis. The translation stage is moved by a distance, / 2d , in 0.5 μ m steps which corresponds to a time-delay, /d c , of approximately 3.3 fs.
Fig. 4. Detailed arrangement of the beam path at the wedge. A digital camera, model EDC-1000HR, is used to record the interference patterns. Neutral density filters with ND 2 to 3 are selected to adjust the light intensity below camera saturation levels. The magnification lens LEICA MONOZOOM 7 allowed us to record magnified interference patterns. The exposure time of the camera and the translator's motion is controlled by the use of a personal computer.
6.3 Experimental results of pulse-width measurements In an individual experimental run, the two beam's temporal overlap is scanned, i.e., the step translator is moved to different positions and the images are recorded at these positions. The images are stored and are analyzed subsequently, although real-time recording/analyzing is possible in principle. The angle between the two beams is adjusted to = 8.7 mradα ( 0.5 ). During a 5 ms camera exposure time, interference patterns of approximately 380,000 laser pulses are generated. The individual images represent an average obtained from 380,000 spatio-temporal pulse superpositions. Figure 5 displays two typical images. These images were recorded in two separate experimental runs. Each image consists of an array of 753 244× 8-bit data. In the experimental runs with larger magnification the zoom lens was adjusted to a × 6 larger than for the small magnification experimental runs. Only a small portion of the interference pattern is recorded and it shows details of the fringes. Figure 5 (b) shows the majority of the interference pattern. Both images were recorded for approximately zero time delay between the two beams.

Laser Pulse Phenomena and Applications
446
Fig. 5. Images of interference patters. The camera lens magnification used is ×6 larger for (a) the image on the left than (b) for the image on the right. The distance perpendicular to the fringes amounts to 0.6 mm and 3.6 mm, respectively.
6.4 Short-pulse interference details The classical electromagnetic theory is used in the analysis of the ultra-short pulse interference measurements. The intensity distribution of the interference cross term is described by the first-order correlation function. For equal temporal pulse shapes the interference pattern is proportional to the autocorrelation function. This result is derived in the following. First we formulate the electric field of a laser pulse that propagates in the z direction. In this formulation we use a wave packet: (Jackson, 1975)
( )0( , ) = ( ) ( ) .i t k xE t x A x F e dωω ω ω∞ − − ⋅
−∞−∫ (21)
Here, k is the wave vector ˆ=k k cω , c is the speed of light and k is the unit vector in the k direction ( ˆk z↑↑ ). 0( )F ω ω− describes the spectral distribution of the wave packet centered at 0ω , with the usual normalization
20| ( )| = 1.F dω ω ω∞
−∞−∫ (22)
The complex, spatial amplitude, ( )A x , satisfies the spatial part of the wave equation, (Jackson, 1975; Milonni and Eberly, 1988)
2 ( ) 2 ( ) = 0.A x ik A xz∂
∇ −∂
(23)
In the paraxial approximation, the laser beam distribution ( )A x can be described by a Gaussian beam that propagates along the z direction. (Kogelnik and Li, 1966; Siegmann, 1986; Möller, 1988; Milonni and Eberly, 1988) Next we define the Fourier transform, f , of the spectral distribution F as:
ˆ( )( / )0
0ˆ( / ) = ( ) ,i t k x cf t k x c F e dω ωω ω ω∞ − − − ⋅
−∞− ⋅ −∫ (24)
with f also normalized to unity,
a b

High Resolution Biological Visualization Techniques
447
2ˆ| ( / )| = 1,f t k x c dt∞
−∞− ⋅∫ (25)
because of the unitary property of Fourier transforms. By the use of the Fourier transform (Eq. (24)) the electric field (Eq. (21)) becomes
ˆ( / )0ˆ( , ) = ( ) ( / ) .i t k x cE t x A x f t k x c e ω− − ⋅
− ⋅ (26)
Now we proceed to describe the interference patterns. The two beams of identical, linear polarization propagate in directions 1k and 2k , respectively, and are described by
ˆ( / )0 1
1 1 1 1ˆ( , ) = ( ) ( / ) ,i t k x cE t x A x f t k x c e ω− − ⋅
− ⋅ (27)
ˆ( / / )0 2
2 2 2 2ˆ( , ) = ( ) ( / / ) .i t k x c d cE t x A x f t k x c d c e ω− − ⋅ −
− ⋅ − (28)
The time delay between beam 1 and 2 equals /d c . In the overlap region of the two laser beams, the electric field is the sum of the individual fields:
1 2( , ) = ( , ) ( , )E t x E t x E t x+
ˆ( / )0 11 1 1
ˆ= ( ) ( / ) ,i t k x cA x f t k x c e ω− − ⋅− ⋅
ˆ( / / )0 2
2 2 2ˆ( ) ( / / ) .i t k x c d cA x f t k x c d c e ω− − ⋅ −
+ − ⋅ − (29)
The two pulses are assumed to have identical temporal pulse shape subsequently. This assumption is valid provided that the optical lengths of the two short pulses in a dispersive medium are equal. An ultrashort pulse can become chirped and hence stretched due to propagation through a dispersive medium or by reflection from a multilayer dielectric mirror. However, the dispersion due to propagation through the optical components results in negligible chirps in our experiment. The temporal pulse shape for both beams is described by ( )f t , i.e., the subscripts for the pulse shapes 1( )f t and 2( )f t can be omitted. The intensity ( *( , ) ( , )E t x E t x ) of the summed electric fields equals:
2 21 1 2 1
ˆ ˆ( , ) =| ( ) ( / )| | ( ) ( / ( ))|I t x A x f t k x c A x f t k x c xτ− ⋅ + − ⋅ + (30)
{ }( )* * 01 2 1 1
ˆ ˆ2 ( ) ( ) ( / ) ( / ( )) ,i xe A x A x f t k x c f t k x c x e ω ττ+ ℜ − ⋅ − ⋅ +
where the spatially dependent time-delay is
1 2ˆ ˆ( ) = ( ) / / .x k k x c d cτ − ⋅ − (31)
The interference intensity is integrated during each pulse in the ultra-short pulse interference measurements. The integration limits are extended to positive and negative infinity since the interval between subsequent pulses (generated at a repetition rate of 76 MHz) is more than five orders of magnitude larger than the pulse width. The integrated intensity, denoted by ( )I x , is calculated to be

Laser Pulse Phenomena and Applications
448
( ) = ( , )I x I t x dt∞
−∞∫
{ }( )2 2 * 01 2 1 2=| ( )| | ( )| 2 ( ) ( ) ( ( )) ,i xA x A x e A x A x g x e ω ττ+ + ℜ (32)
where we have used that the temporal pulse-shapes are normalized (see Eq.(5)). Also, the spatially dependent autocorrelation function ( ( ))g xτ of f is defined by
*( ) = ( ) ( ) .g f t f t dtτ τ∞
−∞+∫ (33)
Above equation (Eq.(32)) shows that the interference cross term (third term in Eq. (32)) is proportional to the autocorrelation function for identical temporal pulse shapes of the two beams. The autocorrelation function depends on the time delay /d c of the two beams and it also depends on the time delay introduced by the phase term that varies spatially according to 1 2
ˆ ˆ( ) /k k x c− ⋅ .
6.5 Determination of the autocorrelation function Fourier transform techniques are utilized to separate the interference cross term from the other contributions in the spatial frequency domain, (Takeda et al., 1982; Macy 1983; Kreis, 1986) The terms 1( )A x and 2( )A x are transformed only into the domain of low spatial frequency. The interference cross term is transformed into the domain of high spatial frequency mainly due to the component ( )0i xe ω τ . The Fourier transform in the x-y plane, denoted by x⊥ , of the interference cross term is:
{ }( )* 01 2
ˆ ˆ(( ) / / )* 0 1 21 2
ˆ ˆ(( ) / /* * 0 1 21 2
( ) = 2 ( ) ( ) ( ( ))
= ( ) ( ) ( ( ))
( ) ( ) ( ( )) ) .
i x i x
i k k x c d c i x
i k k x c d c i x
e A x A x g x e e dx
A x A x g x e e dx
A x A x g x e e dx
ω τ κ
ω κ
ω κ
ξ κ τ
τ
τ
∞ ∞ ⋅ ⊥⊥−∞ −∞
∞ ∞ − ⋅ − ⋅ ⊥⊥−∞ −∞
∞ ∞ − − ⋅ − ⋅ ⊥⊥−∞ −∞
ℜ
+
∫ ∫
∫ ∫
∫ ∫
(34)
In the frequency domain, Equ.(14) represents two peaks at 2 1 0ˆ ˆ= ( ) /I k k cκ ω− and
1 2 0ˆ ˆ= ( ) /II k k cκ ω− . The peak at Iκ can be isolated by using an appropriate filter, and one
obtains
ˆ ˆ(( ) / / )* 0 1 2
1 2( ) = ( ) ( ) ( ( )) .i k k x c d c i xI A x A x g x e e dxω κξ κ τ∞ ∞ − ⋅ − ⋅ ⊥⊥−∞ −∞∫ ∫ (35)
The inverse Fourier transform of this peak is:
{ } ˆ ˆ(( ) / / )1 * 0 1 21 2= ( ) ( ) ( ( )) i k k x c d cIF A x A x g x e ωξ τ − ⋅ −− (36)
The autocorrelation function ( )g τ can be determined from one image (for a relative time delay of approximately zero) for known *
1 2( ) ( )A x A x . For an accurate measurement of ( ( ))g xτ , the spatial frequency distribution of ( ( ))g xτ must be significantly broader than the
spatial frequency distribution of *1 2( ) ( )A x A x . Equivalently, for approximately constant
*1 2( ) ( )A x A x and for sufficient temporal variation due to the phase term, 1 2
ˆ ˆ( ) /k k x c− ⋅ ,
High Resolution Biological Visualization Techniques
449
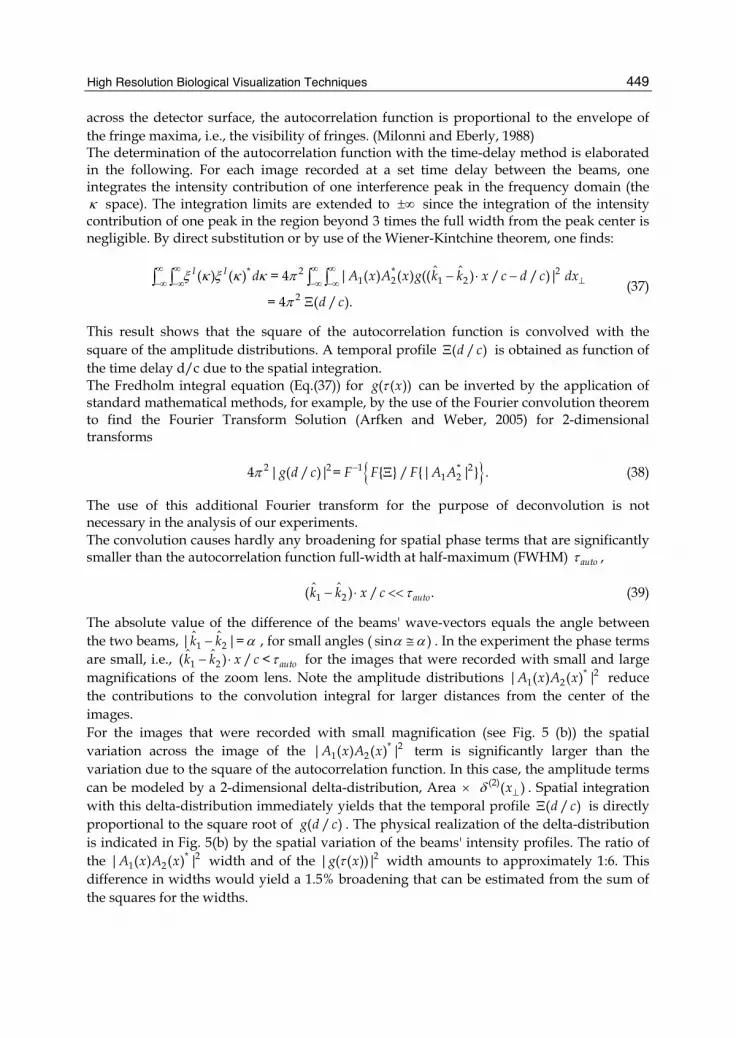
across the detector surface, the autocorrelation function is proportional to the envelope of the fringe maxima, i.e., the visibility of fringes. (Milonni and Eberly, 1988) The determination of the autocorrelation function with the time-delay method is elaborated in the following. For each image recorded at a set time delay between the beams, one integrates the intensity contribution of one interference peak in the frequency domain (the κ space). The integration limits are extended to ±∞ since the integration of the intensity contribution of one peak in the region beyond 3 times the full width from the peak center is negligible. By direct substitution or by use of the Wiener-Kintchine theorem, one finds:
* 2 * 2
1 2 1 2
2
ˆ ˆ( ) ( ) = 4 | ( ) ( ) (( ) / / )|
= 4 ( / ).
I I d A x A x g k k x c d c dx
d c
ξ κ ξ κ κ π
π
∞ ∞ ∞ ∞⊥−∞ −∞ −∞ −∞
− ⋅ −
Ξ
∫ ∫ ∫ ∫ (37)
This result shows that the square of the autocorrelation function is convolved with the square of the amplitude distributions. A temporal profile ( / )d cΞ is obtained as function of the time delay d/c due to the spatial integration. The Fredholm integral equation (Eq.(37)) for ( ( ))g xτ can be inverted by the application of standard mathematical methods, for example, by the use of the Fourier convolution theorem to find the Fourier Transform Solution (Arfken and Weber, 2005) for 2-dimensional transforms
{ }2 2 1 * 21 24 | ( / )| = { } / {| | } .g d c F F F A Aπ − Ξ (38)
The use of this additional Fourier transform for the purpose of deconvolution is not necessary in the analysis of our experiments. The convolution causes hardly any broadening for spatial phase terms that are significantly smaller than the autocorrelation function full-width at half-maximum (FWHM) autoτ ,
1 2ˆ ˆ( ) / .autok k x c τ− ⋅ << (39)
The absolute value of the difference of the beams' wave-vectors equals the angle between the two beams, 1 2
ˆ ˆ| |=k k α− , for small angles ( sin )α α≅ . In the experiment the phase terms are small, i.e., 1 2
ˆ ˆ( ) / < autok k x c τ− ⋅ for the images that were recorded with small and large magnifications of the zoom lens. Note the amplitude distributions * 2
1 2| ( ) ( ) |A x A x reduce the contributions to the convolution integral for larger distances from the center of the images. For the images that were recorded with small magnification (see Fig. 5 (b)) the spatial variation across the image of the * 2
1 2| ( ) ( ) |A x A x term is significantly larger than the variation due to the square of the autocorrelation function. In this case, the amplitude terms can be modeled by a 2-dimensional delta-distribution, Area × (2)( )xδ ⊥ . Spatial integration with this delta-distribution immediately yields that the temporal profile ( / )d cΞ is directly proportional to the square root of ( / )g d c . The physical realization of the delta-distribution is indicated in Fig. 5(b) by the spatial variation of the beams' intensity profiles. The ratio of the * 2
1 2| ( ) ( ) |A x A x width and of the 2| ( ( ))|g xτ width amounts to approximately 1:6. This difference in widths would yield a 1.5% broadening that can be estimated from the sum of the squares for the widths.

Laser Pulse Phenomena and Applications
450
The experimental arrangement was designed to minimize effects from the convolution. For an angle of = 0.5α , spatial dimensions of 0.6 mm × 0.6 mm and 3.6 mm × 3.6 mm, and a pulse-width of 70 fs, the numerically investigated broadening due to the convolution process would amount to 0.5% and 1.7 % of the FWHM of the autocorrelation function, respectively. For 70 fs pulse-width measurements this broadening would amount to typically 1 fs which is less than one half of an optical cycle (3 fs for a center wavelength of 0.9 μ m).
6.6 Image analysis and results The analysis of the recorded images is accomplished by the use of discrete Fourier transforms for the finite image which is represented by a two-dimensional array. An array element pqh that contains the integrated intensity of the corresponding pixel formally introduces the model:
1 2= ( ) 1 , 1 ,pq pqh x p M q NΠ Δ Δ ≤ ≤ ≤ ≤ (40)
where 1Δ and 2Δ are the pixel sizes in the two perpendicular directions. The total area of image is a b× . The intensity of the electric field at the point pqx may be of the same order as that in Eq. (40) for the interference pattern outside the recorded image region. In the numerical analysis, we set the array value pqh to zero outside the active area of the camera. Corrections in κ -space due to the filter are negligible. Setting pqh to zero outside the recorded area is equivalent with setting *
1 2( ) ( )A x A x to zero beyond the exposed area. In the numerical analysis we use Nyquist critical frequencies 1 1=cκ πΔ and 2 2=cκ πΔ , and evaluate at the positions 1=m cmMκ κ and 2=n cnNκ κ the discrete Fourier transform set { }mnH of the set { }pqh given by
1 1
2 / 2 /
=0 =0= .
M Nipm M iqn N
mn pqp q
H h e eπ π− −
∑ ∑ (41)
The fast Fourier transform algorithm (Press et al., 2007) was used in the computation. The upper limits in the sums in Eq. (41) are equal to numbers of power of 2 in the fast Fourier transform algorithm. Figure 6(a) shows the low-frequency or dc-component of the *( ) ( )ξ κ ξ κ distribution which corresponds to the small magnification experiment shown in Fig.5(b). The first two terms of Eq. (32) are included in the peak near the origin. Figure 6(b) shows details of the high-frequency peak near the pair ( = 0m , = 50n ); this distribution is associated with one of the interference cross terms. In the numerical evaluation of the temporal distribution ( / )d cΞ , the integration over κ reduces to a summation over m and n of the discrete values mnH near the pair (0,50) , i.e., in the restricted domain ( , )m n that corresponds to one of the specific interference cross terms for the applied filter. Figure 7 shows the correlation coefficients (or the results of the above mentioned summation) versus time delay. The autocorrelation function can be obtained by the use of smoothing algorithms. The temporal pulse shape can not be uniquely determined. This can be seen by considering the Fourier transform { }| |F f since | |f and { }| |F f transform uniquely. The absolute value of { }| |F f is determined by the Fourier transform of the autocorrelation function according to

High Resolution Biological Visualization Techniques
451
Fig. 6. Spatial frequency distribution of the recorded images . (a) Fourier transform of the intensity distribution. (b) Detailed viewof the interference cross term near the pair (m=0, n=50).
Fig. 7. Measured square of the scaled autocorrelation function (circles) and fitted curve for a hyperbolic-secant temporal pulse-shape (line) versus time delay d/c. (a) larger magnification (see Fig. 5 (a)) and (b) smaller magnification (see Fig. 5(b)).
{ } { } { }*| | | | = (| |,| |) ,F f F f F Corr f f (42)
while the phase of { }| |F f is undetermined. We assume a hyperbolic secant temporal pulse-shape,
1.76 / 1.76 /2| ( , )|= ,
p pp t tf te eτ ττ −+
(43)
which leads to an autocorrelation function of the hyperbolic secant that can be analytically obtained,
1.76 / 1.76 /
1.76 /( , ) = .
p p
pp t t
tg t
e eτ τ
ττ −−
(44)

Laser Pulse Phenomena and Applications
452
The pulse width pτ (FWHM of the beams' intensity profile 2| ( , )|pf t τ ) is determined by fitting the experimental data with 2
1 2| ( , )|pC C g t τ+ ( 1C , 2C and pτ are the fitting parameters) by the use of the nonlinear least-square method. Figure 6 also shows these results. The pulse widths amount to = 77pτ fs and = 72pτ fs for the larger and smaller magnification experiments, respectively. Note that these results are obtained from different experimental runs. The error bars are estimated from the distribution of the correlation coefficients to be at most 5% for the pulse-width pτ . Smaller error bars result for the smaller magnification experiment. This can be seen, for example, by comparing the wings of the profiles illustrated in Fig. 7. The discrete Fourier transform can be more precisely determined from approximately 36 recorded fringes for each time delay. Lens aberration effect will also be smaller when using a smaller magnification of the zoom lens. The 5 fs disparity is attributed to the difference in the available pulse-widths for the separate experimental scans.
6.7 Discussion of the short-pulse measurements The interferometric measurement of short pulses with the time-delay method involves in principle the convolution of the spatial amplitude distribution with the autocorrelation function. It is demonstrated that the autocorrelation function can be directly obtained from the fringes' spatial distribution when the small angle condition perpendicular to the fringe pattern, | |/ < autox cα τ , is satisfied. Broadening from the convolution process is insignificant for an angle of 0.5 between the beams, the recorded image dimensions | |x of 0.6 mm and 3.6 mm, and for pulse-widths pτ of typically 70 fs. The broadening amounts to approximately 0.5% and 1.5% for the large and small magnification experiments, respectively. In the experiment, about 200 images are recorded in a scan of 663 fs. However, we infer from a detailed numerical analysis (not elaborated here) that the significantly smaller number of 16 images would have been sufficient for the determination of the autocorrelation function. Measurement of the autocorrelation function from a single image would require that the amplitude distribution is approximately constant compared to the variation of the autocorrelation function across the array detector's surface and that many fringes would occur. An estimate for the number of fringes is obtained by taking the ratio of 3 times the FWHM of the autocorrelation function and of the optical cycle. For 70 fs pulses with a center wavelength of 0.88 mμ , the number of fringes would be approximately equal to 200. Increasing the angle from 0.5 (for which we measured 6 and 36 fringes, respectively) to 3 between the laser beams would result in some 200 fringes across the detector. For a 3.6 mm× 3.6 mm camera area, the individual fringes would be separated by 18 mμ for the 0.88 μ m center-wavelength beams. For typical CCD cameras the pixel size amounts to approximately 10 to 20 μ m, therefore, measurement of the autocorrelation function from a single image is only indicated for shorter pulse widths. In turn, the presented time-delay method is suitable for the direct measurement of the autocorrelation function for Ti-Sapphire pulses of nominally = 60pτ fs width or longer up to some 100 picosecond. The upper limit is obtained from the requirement that no additional spatio-temporal superposition or beam overlap occurs, and it

High Resolution Biological Visualization Techniques
453
is estimated from the geometrical arrangement and the thickness of the wedge that was used to split the femtosecond laser beams.
7. Summary The use of photo-acoustic imaging as well as coherent imaging and ultra-short optical pulse spectroscopy are showing significant potential for evolution into commercial sensing devices with likelihood for the procurement of detailed tissue information. With the continuously growing number of imaging devices there is still a gap between the clinical demands for detail and the capabilities of delivering these in a timely fashion and at a cost that will make the diagnostic devices available for a large part of humanity. However, more and more pathological data is becoming second nature due to the increasing histological and functional details that can be retrieved non-invasively and with minimal risk to the patient.
8. Acknowledgment The authors thank Dr G. Guan for his contribution, discussions and interest in this work. The experimental material is based upon work that is in part supported by the National Science Foundation under Grant No. CTS-9512489.
9. References Arfken, G.B., and Weber, H.J., (2005) Mathematical Methods for Physicists, 6th edition, ISBN:
978-0-12-059876-2, Oxford, Ohio, Academic Press. Bell, A. (1880). Upon the production of sound by radiant energy. American Journal of Science
20, 305–324, ISSN: 0002-9599. Chen, Q. and Zhang, X.-C., Electro-Optic THz Imaging, In: Ultrafast Lasers: Technology and
Applications, Fermann, Galvanauskas, Sucha, Eds. Chapter 11, Marcel Dekker, Inc. ISBN: 0-8247-0841-5, 2002.
Chichkov, B.N., Momma, C., Nolte, S., von Alvensleben, F., Tünnermann, A.(1996) Femtosecond, picosecond and nanosecond laser ablation of solids," Appl. Phys. A 63, 109-115, ISSN: 0947-8396.
Chilla, J.L.A., and Martinez, O.E., (1991a) Analysis of a Method of Phase Measurement of Ultrashort Pulses in the Frequency Domain, IEEE J. Quantum Electron., 27(5): 1228-1235, ISSN: 0018-9197.
Chilla, J.L.A., and Martinez, O.E., (1991b) Direct Determination of the Amplitude and the Phase of Femtosecond Light Pulses, Optics Letters, 16(1): 39-41, ISSN: 0146-9592.
Chilla, J.L.A., and Martinez, O.E., (1992) Frequency Domain Phase Measurement of Ultrashort Light Pulses: Effect of Noise, Optics Communications, 89(5,6): 434-440, ISSN: 0030-4018.
Choma, M.A., (2004) Optical Coherence Tomography: Applications and Next-Generation System Design, Ph.D. Dissertation, Duke University.

Laser Pulse Phenomena and Applications
454
Chu, K.C., Heritage, J.P., Grant, R.S., Liu, K.X., Dienes, A., White, W.E., Sullivan, A. (1995) Direct Measurement of the Spectral Phase of Femtosecond Pulses, Optics Letters, 20(8): 904-906, ISSN: 0146-9592.
Cobbles, J.A., (1987) Picosecond Coherene Time Measurement with a Double Slit. Applied Optics, 26(19): 4048-4051, ISSN: 0003-6935.
Coloiano, E.; Rocha, R.; Martin, A.; da Silva, M.; Acosta-Avalos, D., and Barja, D. (2005). Photyo-acoustic analysis of dental raisin polymerization. J. Phys. IV, Vol. 125, pp. 793-795, ISSN: 1155-4339.
Diels, J.C.M, Fontaine, J.J., McMichael, I.C., and Simoni, F. (1985) Control and Measurement of Ultrashort Pulse Shapes (in Amplitude and Phase) with Femtosecond Accuracy, Applied Optics, 24(9):1270-1282, ISSN: 0003-6935.
Doody MM, et al. (2000) Breast Cancer Mortality after Diagnostic Radiography: Findings From the U.S. Scoliosis Cohort Study, Spine, 25 (16), 2052-2063, ISSN: 0362-2436.
Dunn, R.C., (1999) Near-field Scanning Optical Microscopy, Chem. Rev. 99, 2391-2927, ISSN: 0009-2665.
Ermilov SA, Khamapirad T, and Conjusteau A, (2009) Laser optoacoustic imaging system for detection of breast cancer, J. Biomed. Opt., 14, 024007, ISSN: 1083-3668.
Ermilov, S. A.; Khamapirad, T., and Conjusteau, A. (2009) Laser optoacoustic imaging system for detection of breast cancer. J. Biomed. Opt., Vol. 14, 024007, ISSN: 1083-3668.
Fear EC, Li X, Hagness SC and Stuchly MA, (2002) Confocal Microwave Imaging for Breast Cancer Detection: Localization of Tumors in Three Dimensions, IEEE Trans. Biomed. Eng. 49(8) 812-823, ISSN: 0967-3334.
Fercher, A.F., (1995) Measurement of intraocular distances by backscattering spectral interferometry, Optics Communications, 117, 43-48, ISSN: 0030-4018.
Frentzen, M., and Hamrol, D. (2000) Kavitätenpräperation mit dem Er:YAG-Laser - eine histologische Studie, Carl Hanser Verlag, München, Dtsch. Zahnärztl. Z. 55, ISSN: 0012-1029.
Gibson, A.P., Austin, T., Everdell, N.L., Schweiger, M., Arridge, S.R., Meek, J.H., Wyatt, J.S., Delpy, D.T., Hebden, J.C., (2006) Three-dimensional whole-head optical tomography of passive motor evoked responses in the neonate, Neuroimage, 30(2):521-528, ISSN: 1053-8119.
Gu, X., Akturk, S., Shreenath, A., Cao, Q., Trebino, R., (2005) The measurement of ultrashort light – simple devices, complex pulses, In: Femtosecond Laser Spectroscopy, Ed. P. Hannaford. New York: Springer Science and Business Media, ISBN: 0-387-23293-1.
Guan, G., (1999) On the analysis of emission spectra and interference images, Ph.D. dissertation, The University of Tennessee, Knoxville, Tennessee.
Guan, G., and Parigger, C. G., (2000) private communication. Gusev, V. E., and Karabutov, A. A., (1993) Laser Optoacoustics. New York: American Institute
of Physics, ISBN: 1-5639-6036-2. Hannaford, P., Femtosecond Laser Spectroscopy. New York: Springer Science and Business
Media, ISBN: 0-3872-3293-1, 2005.

High Resolution Biological Visualization Techniques
455
Hendee W, et al., (2008) Bioengineering and Imaging Research Opportunities Workshop V: A white paper on imaging and characterizing structure and function in native and engineered tissues, Med. Phys., 35(8), 3428-3435, ISSN: 0094-2405.
Heretier, J. –M. (1983) Electrostrictive limit and focusing effects in pulsed Photoacoustic detection. Opt. Comm., Vol. 44, No. 4, pp. 267-272, ISSN: 0030-4018.
Hoelen, C. G.; de Mul, F. F. M.; Pongers, R., and Dekker A. (1998). Three-dimensional photo-acoustic imaging of blood in tissue, Opt. Lett., Vol. 23, No. 8, pp. 648-650, ISSN: 0146-9592.
Huang SA, Aguirre AD, Huber RA, Adler DC, and Fujimoto JG, (2007) Swept source optical coherence microscopy using Fourier domain mode-locked laser, Opt. Exp. 15, 6210-6217, ISSN: 1094-4087.
Huang, D., Swanson, E.A., Lin, C.P., Schuman, J.S., Stinson, W.G., Chang, W., Hee, M.R., Flotte, T., Gregory, K., Puliafito, C.A., (1991) Optical coherence tomography, Science, 254, 1178–1181, ISSN: 0036-8075.
Jackson, J.D., (1975) Classical Electrodynamics, 2nd Edition, Berkeley: John Wiley and Sons, ISBN: 0-4714-3132-X.
Jiang, H., (1998) Frequency-domain fluorescent diffusion tomography: a finite element algorithm and simulations, Appl Opt, 37, 5337-5343, ISSN: 0003-6935.
Jiang, H., Paulsen, K.D., Osterberg, U.L., Patterson, M.S., (1997) Frequency-domain optical image reconstruction for breast imaging: initial evaluation in multi-target tissue-like phantoms, Medical Physics, 25, 183-193, ISSN: 0094-2405.
Jiang, H., Paulsen, K.D., Osterberg, U.L., Patterson, M.S., (1998) Enhanced optical image reconstruction using DC data: initial study of detectability and evaluation in multi-target tissue-like phantoms, Phys. Med. Biol, 43, 675-693, ISSN: 0031-9155.
Kane, D.J., and Trebino, K., (1993) Characterization of Arbitrary Femtosecond Pulses Using Frequency-Resolved Optical Gating. IEEE J. Quantum Electron., 29(2): 571-577, ISSN: 0018-9197.
Kim, K.; Witte, R.; Koh, I.; Ashkenazi, S., and O’Donnell, M. (2006). Early Detection of Dental Caries using Photoacoustics, Proc. SPIE Vol. 6086 (Vol.7, No 9),60860G1-9, ISSN: 0277-786X.
Kogelnik, H., and Li, T., (1966) Laser Beams and Resonators, Proceedings of the IEEE, Vol 54, pp. 1312 – 1329, ISSN: 0018-9219.
Kreis, T., (1986) Digital Holographic Interference-phase Measurement using the Fourier-transform Method, J. Opt. Soc. Am. A, 3(6): 847-855, ISSN: 1084-7529.
Lai, H. M., and Young, K. (1982) Theory of the pulsed optoacoustic technique. J. Acoust. Soc. Am., Vol. 72, No. 6, pp. 2000-2007, ISSN: 0001-4966.
Li, Y., Baba, M., and Matsuoka, M., (1997) Femtosecond Measurement of Fluorescence by Two-photon Interference, Physical Review A, 55(4): 3177-3183, ISSN: 1050-2947.
Lingu, G.; Li, M.-L.; Xie, X.; Wang, L., and Stoica, G. (2007). In vivo imaging and characterization of hypoxia-induced neovascularization and tumor invasion. Int. J. Oncol., Vol. 30, pp. 45-54, ISSN: 1019-6439.
Lu W, et al., (2010) Photoacoustic imaging of living mouse brain vasculature using hollow gold nanospheres, Biomaterials, 31 (9), 2617-2626, ISSN: 0142-9612.

Laser Pulse Phenomena and Applications
456
Luo, M.S.C. et al., (1994) Generation of Terahertz Electromagnetic Pulses from Quantum-Well Structures, IEEE J Quantum Electr, 30, 1478-1488, ISSN: .
Macy, J.W.W., Jr., (1983) Two-dimensional Fringe-pattern Analysis, Applied Optics, 22(23): 3898-3901, ISSN: 0003-6935.
McKenzie, A. L. (1990) Physics of thermal processes in laser-tissue interaction. Phys. Med. Biol., Vol 35, No. 9. pp. 1175-1209, ISSN: 0031-9155.
Meshulach, D., Barad, Y., Silberberg, Y., (1997) Measurement of Ultrashort Optical Pulses by Third-Harmonic Generation, J. Opt. Soc. Am. B, 14(8): 2122-2125, ISSN: 0740-3224.
Milonni, P.W., and Eberly, J.H., (1986) Lasers, ISBN: , New York: John Wiley and Sons. Mirabella, F., Internal Reflection Spectroscopy, In: Practical Spectroscopy Series, vol. 15,
Marcel Dekker, ISBN: 9780824780593, 1992, New York. Miyamoto, Y., Kuga, T., Baba, M., and Matsuoka, M., (1993) Measurement of Ultrafast
Optical Pulses with Two-photon Interference. Optics Letters, 18(11):900-992, ISSN: 0146-9592.
Möller, K.D., (1988) Optics, ISBN: 978-0-9357-0245-3, Mill Valley, California: University Science Books.
Mukherjee, J., and Chakraboty, S., (2010) Modelling of temperature distribution within a dental profile on account of laser irradiation, Int. J. Biomedical Engineering and Technology, Vol. 3: 186-198, ISSN: 1752-6418.
Naganuma, K., Mogi, K., and Yamada, H. (1989) General Method for Ultrashort Light Pulse Chirp Measurement. IEEE J. Quantum Electron., 25(6):1225-1233, ISSN: .
Najarian, K, and Splinter, R., (2005) Biomedical Signal and Image Processing, CRC-Press, ISBN: 978-0-8493-2099-6, Boca Raton.
O’Shea, P., Kimmel, M., Gu, X., and Trebino, R. (2001) Highly simplified device for ultrashort-pulse measurement, Optics Letters 26: 932 -934, ISSN: 0146-9592.
Paye, J., Ramaswamy, M., Fujimoto, J.G., and Ippen, E.P., (1993) Measurement of the Amplitude and Phase of Ultrashort Light Pulses from Spectrally Resolved Autocorrelation, Optics Letters, 18(22):1946-1948, ISSN: 0146-9592.
Pike, P., (2005) Photo-acoustic analysis of dental materials and tissue, Ph.D. dissertation, The University of Tennessee, Knoxville, Tennessee.
Pike P., Parigger C., Splinter R., Lockhart P., (2007) Temperature distribution in dental tissue after interaction with femtosecond laser pulses, Appl. Opt. 46(34):8374-8378, ISSN: .
Press, W., Teukolsky, S., Vetterling, W., and Flannery, B., (2007) Numerical Recipes, The Art of Scientific Computing, 3rd edition, ISBN: 978-0-5218-8068-8, New York: Cambridge University Press.
Qiu, T. Q. and Tien, C. L., (1993) Size effects on nonequilibrium laser heating of metal films, J. Heat Trans., Vol. 115, pp. 842-847, ISSN: 1528-8943.
Rost, F.W.D., (1992) Fluorescence microscopy. Cambridge University Press, ISBN: 978-0-5214-2277-2, Cambridge.
Saxena AK, Willital GH, (2008) Infrared thermography: Experience from a decade of paediatric imaging, Eur J Pediatr, 167, 757-764, ISSN: 0340-6199.
Semenov, S.Y., Splinter, R., Svenson, R.H., Baranov, V.Y., Dezern, K.R., Tuntelder, J.R., Thompson, M., Tatsis, G.P., (1995) Dielectric properties of canine myocardium

High Resolution Biological Visualization Techniques
457
tissues in the microwave spectrum, IEEE Trans Biomed Eng. 41(9), 569-73, ISSN: 0967-3334.
Semenov, S.Y., Svenson, R.H., Boulyshev, A.E., Souvorov, A.E., Borisov, V.Y., Sizov, Y., Starostin, A.N., Dezern, K.R., Tatsis, G.P., Baranov, V.Y., Splinter, R., (1996) Microwave tomography: two-dimensional system for biological imaging, IEEE Trans Biomed Eng. 43(9), 869-77, ISSN: 0967-3334.
Serbin, J., Bauer, T., Fallnich, C., Kasenbacher A., Arnold, W.H., (2002) Femtosecond lasers as novel tool in dental surgery, Appl. Surf. Sci. 197-198, 737-740, ISSN: 0169-4332.
Sethuraman, S.; Aglyamov, S. R.; Amirian, H. J.; Smalling, R. W., and Emelianov, S. Y. (2006). Development of a combined intravascular ultrasound and photoacoustic imaging system. Proceedings of SPIE, Vol. 6086, pp 108-117, Photons Plus Ultrasound: Imaging and Sensing 2006: The 7th Conference on Biomedical Thermoacoustics, Optoacoustics, and Acousto-optics, edited by A. A. Oraevsky, et al., ISBN: 978-0-8194-6128-5.
Shu, X., Spears, K.G., Serafin, J., (1989) Ultrashort Pulsed Laser Coherence measurements by Single-pulse Holography and Four-wave Mixing, J. Opt. Soc. Am. B, 6(7):1356-1362., ISSN: 0740-3224.
Siegman, A.E. (1986) Lasers, ISBN: 0-935702-11-5, Stanford: University Science Books. Simhi, R., Gotshal, Y., Bunimovich, D., Sela, B.-A., and Katzir, A., (1996) Fiber-optic
evanescent-wave spectroscopy for fast multicomponent analysis of human blood, Appl. Opt. 39, 3421-3425, ISSN: 0003-6935.
Splinter, R., Hooper, B., (2006) An Introduction to Biomedical Optics, CRC-Press, ISBN: 978-0-7503-0938-7, Boca Raton.
Takeda, M., Ina, H., Kobayashi, S., (1982) Fourier-transform Method of Fringe-pattern Analysis for Computer-based Topography and Interferometry, J. Opt. Soc. Am., 72(1):156-160, ISSN: 1084-7529.
Trebino, R., Kane, D.J., (1993) Using Phase Retrieval to Measure the Intensity and Phase of Ultrashort Pulses: Frequency-Resolved Optical Gating, J. Opt. Soc. Am. A, 10(5):1101-1111, ISSN: 1084-7529.
Wang, X. D., Pang, Y. J., Ku, G., Xie, X. Y., Stoica G., and Wang L. H. ,(2003) Noninvasive laser-induced photoacoustic tomography for structural and functional in vivo imaging of the brain. Nat. Biotechnol. Vol. 21, No. 7, pp. 803-806, ISSN: 1087-0156.
Yan, C., and Diels, J.C. (1991) Amplitude and Phase Recording of Ultrashort Pulses, J. Opt. Soc. Amer. B, 8:1259-1263, ISSN: 0740-3224.
Yang, X., Scrabalak, S., Li, Z., Xia, Y. and Wang, L., (2007) Photoacoustic Tomography of a Rat Cerebral Cortex in vivo with Au Nanocages as an Optical Contrast Agent. Nano Lett., Vol. 7, No. 12, pp. 3798-3802, ISSN: 1530-6984.
Yaseen, M., Ermilov, S., Brecht, H.-P., Su, R., Conjusteau, A., Fronheiser, M., Bell, B., Motamedi, M., and Oraevsky, A. (2010). Optoacoustic imaging of the prostate: development toward image-guided biopsy, J. Biomed. Opt., Vol. 15, 021310, ISSN: 1083-3668.
Yuan, Z., Zakhaleva, J., Ren, H., Liu, J., Chen, W., Pan, Y., (2010) Noninvasive and high-resolution optical monitoring of healing of diabetic dermal excisional wounds
Laser Pulse Phenomena and Applications
458
implanted with biodegradable in-situ gelable hydrogels, Tissue Eng Part C Methods, 16(2), 237-47, ISSN: 1937-3384.
Zhang, E.Z., Laufer, J.G., Pedley, R.B. and Beard, P.C., (2009) In vivo high-resolution 3D photoacoustic imaging of superficial vascular anatomy, Phys. Med. Biol., 54, 1035-1046, ISSN: 0031-9155.


