Embed Size (px)
Citation preview

at SciVerse ScienceDirect
Quaternary Science Reviews 30 (2011) 3791e3802
Contents lists available
Quaternary Science Reviews
journal homepage: www.elsevier .com/locate/quascirev
Holocene deglacial history of the northeast Antarctic Peninsula e A reviewand new chronological constraints
Joanne S. Johnson a,*, Michael J. Bentley a,b, Stephen J. Roberts a, Steven A. Binnie c,1,Stewart P.H.T. Freeman d
aBritish Antarctic Survey, High Cross, Madingley Road, Cambridge CB3 0ET, UKbDepartment of Geography, Durham University, South Road, Durham DH1 3LE, UKc Institute of Geography, University of Edinburgh, Drummond Street, Edinburgh EH8 9XP, UKd Scottish Universities Environmental Research Centre, Rankine Avenue, Scottish Enterprise Technology Park, East Kilbride, G75 0QF, UK
a r t i c l e i n f o
Article history:Received 18 January 2011Received in revised form23 October 2011Accepted 24 October 2011Available online 21 November 2011
Keywords:Cosmogenic isotopesDeglaciationBathymetryJames Ross IslandAntarctica
* Corresponding author. Tel.: þ44 0 1223 221313; fE-mail address: [email protected] (J.S. Johnson).
1 Now at: Institut für Geologie und Mineralogie, UKöln, Germany.
0277-3791/$ e see front matter � 2011 Elsevier Ltd.doi:10.1016/j.quascirev.2011.10.011
a b s t r a c t
The northeast Antarctic Peninsula (NEAP) region is currently showing signs of significant environmentalchange, evidenced by acceleration of glacial retreat and collapse of both Larsen-A and -B ice shelves withinthe past 15 years. However, data on the past extent of the eastern margin of the Antarctic Peninsula IceSheet (APIS) and its Holocene retreat history are sparse, and hence we cannot yet put the recent changesinto a long-term context. In order to investigate the timing of deglaciation, we present 16 new cosmogenic10Be surface exposure ages from sites on northern James Ross Island (Cape Lachman, Johnson Mesa andTerrapin Hill) and Seymour Island. The majority of the ages cluster around 6e10 ka, with three significantlyolder (25e31 ka). We combine these ages with existing terrestrial and marine radiocarbon deglaciationages, and a compilation of existing swath bathymetry data, to quantify the temporal and spatial characterof the regional glacial history. Ice had begun to retreat from the outer shelf by 18.3 ka, reaching SeymourIsland by w8 ka. Northern James Ross Island began to deglaciate around the time of the Early HoloceneClimatic Optimum (c. 11e9.5 ka). Deglaciation continued, and a transition from grounded to floating ice inPrince Gustav Channel occurred around 8 ka, separating the James Ross Island ice cap from the APIS. Thisoccurred shortly before Prince Gustav Channel ice shelf began to disintegrate at 6.2 ka. Our results suggestthere may be a bathymetric control on the spatial pattern of deglaciation in the NEAP.
� 2011 Elsevier Ltd. All rights reserved.
1. Introduction
During the past decade, extensive evidence has been gatheredshowing that the Antarctic Peninsula Ice Sheet (APIS) is currentlyunder environmental stress, with ice shelves collapsing (Hodgsonet al., 2006), and glaciers rapidly retreating (e.g. Cook et al., 2005)and thinning (Pritchard et al., 2009). These changes are thought to belinked to the rapid regional warming recently experienced by theAPIS (2 �C since the 1950s; Vaughan et al., 2001). If we are to reliablypredict how the Antarctic ice sheets will contribute to future globalsea level, it is important that we put these recent changes intoa long-term (millennial-scale) context. The palaeo-record is vitalbecause it provides observations of real (past) behaviour that can beused to test the reliability of models. The past configuration of theAntarctic ice sheets and their rate of thinning since the Last Glacial
ax: þ44 0 1223 362616.
niversität zu Köln, D-50674
All rights reserved.
Maximum (LGM; approximately 20 ka) is still not well known, andmore observational data are required by modellers.
The aim of this paper is to present a new chronology for post-LGM deglaciation of James Ross and Seymour islands, which aresituated in the northeastern Antarctic Peninsula region (NEAP;Fig. 1). At present there are minimal data recording the retreat ofthe APIS from the continental shelf, and even fewer data from theislands themselves, despite their key position for recording thedynamics of the adjacent APIS (Smellie et al., 2008). We combineour new terrestrial data with existing marine evidence for thehistory of ice retreat to provide a long-term context for recentchanges and constraints for ice sheet models.
2. Regional context
2.1. Study area
James Ross Island (JRI) and Seymour Island (SEY) are situated inthe James Ross Basin on the eastern side of the northernmost part of

Fig. 1. Location of cosmogenic sample sites on James Ross and Seymour Islands, and all published minimum deglaciation ages for this region. A. Bathymetric data for the NEAPregion; data sources are RRS James Clark Ross cruise JR71 (British Antarctic Survey), the Antarctic and Southern Ocean Data Portal of the Marine Geoscience Data System (Carbotteet al., 2007), and the UK Hydrographic Office. The thin yellow and white lines enclose areas in which the majority of swath bathymetry data shownwere collected on RVIB NathanielB. Palmer cruises NBP0003 and NBP0107, respectively (Camerlenghi et al., 2001; Backman and Domack, 2003). These areas indicate the densest coverage of data from these twocruises, but data was also collected from outside these areas, e.g. swaths to the southeast of JRI and Seymour Islands. The relief is illuminated from the northwest. The satellite imageof the Antarctic Peninsula and surrounding islands is from the Landsat Image Mosaic of Antarctica (LIMA). Inset shows location in relation to Antarctic Peninsula. The position of theshelf break, inner shelf (InS) and outer shelf (OuS) regions are also shown. Triangles represent marine and terrestrial ages for deglaciation (Table 1; ages in italics are maxima). Redcircles are minimum 10Be cosmogenic exposure dates for deglaciation from this study (see Table 2). All ages are in kiloyears (ka). B. An enlarged image of swath bathymetric dataaround James Ross and Seymour Islands. Coloured arrows show direction of former ice flow inferred from subglacial bedforms (Evans et al., 2005; Domack et al., 2005; this study).Arrows marked ‘A’, ‘C’ and ‘H’ refer to ‘Admiralty’, ‘Croft’ and ‘Humps’ Troughs discussed in the text. C. Map of JRI and SEY identifying (with black rectangles) locations of samplingsites for cosmogenic dating. The grey shaded areas are ice-free at the present-day. (For interpretation of the references to colour in this figure legend, the reader is referred to theweb version of this article.)
J.S. Johnson et al. / Quaternary Science Reviews 30 (2011) 3791e38023792
the Antarctic Peninsula (Fig. 1). JRI is dominated by a large(1600 m a.s.l.) stratovolcano centered on Mt Haddington, and atpresent supports an ice cap 100e400 m thick. It is characterised bylava-fed deltas and distinctive flat-topped volcanic mesa landforms,which were formed by volcanic eruptions that occurred duringperiods of thepast 6.2Myrswhen the islandwas ice-covered (Smellieet al., 2008). Today, the main ice cap on JRI has many small outlet
glaciers on its south and eastern sides, which terminate as tidewaterglaciers.However, nearly 20%of the island is ice-free (Ingólfsson et al.,1992), with particularly extensive areas on its northwestern side atUlu Peninsula (Fig. 1). Two ice domes also exist on Ulu Peninsula, atDobsonDome andDavis Dome (Fig.1C).Manymesas in other parts ofthe islandhost smaller ice domes. Thedifference in ice cover betweenthe northwest (Ulu Peninsula) and southeast of JRI is due to the effect

J.S. Johnson et al. / Quaternary Science Reviews 30 (2011) 3791e3802 3793
of the precipitation shadow of the Antarctic Peninsula to the west,and is reflected in the relatively high (>400 m a.s.l.) modern equi-librium line altitude (ELA) in the northwest of JRI (Ingólfsson et al.,1992). In the south and east of the island, anticyclonic cold windsbring snow from the south, leading to a general loweringof the ELA inthose areas, and hence greater ice cover (Hjort et al., 1997).
JRI is separated from the Antarctic Peninsula to the north andwest by Prince Gustav Channel (PGC; Fig. 1). This trough is up to1280 m deep (Fig. 1A) and was probably scoured out by Pleistocene(or older) ice streams emanating from the Antarctic Peninsula.During the LGM, ice streams flowing from the Antarctic Peninsulawere channelled by this deep trough to the northeast and south-west of JRI (Camerlenghi et al., 2001; Domack et al., 2005; Evanset al., 2005). The presence of exotic (i.e. non-local) clasts in JRIdiamicts, and Antarctic Peninsula-derived erratics scattered on thelow-lying coastal areas of JRI, document an expanded APIS in thePliocene and Pleistocene (Hambrey et al., 2008; Nelson et al., 2009).However, there is no evidence that JRI was overridden by ice fromthe Antarctic Peninsula during the last glaciation (Evans et al.,2005; Hambrey et al., 2008).
In contrast to JRI, Seymour Island (SEY) is entirely ice-free at thepresent-day. A central plateau formed by sedimentary rocks domi-nates the northern part of the island and reaches w200 m altitude.Numerous erratic boulders and cobbles of various lithologies (basaltsof the James Ross Island Volcanic Group, and granites and granodi-orites of the Trinity Peninsula Group) are strewn across this plateau.Seymour Island is the most easterly onshore location in the NWWeddell Seawhere the retreat of the APIS from the outer continentalshelf can be tracked.
2.2. Ice sheet configuration during the Quaternary
Althoughmost researchers accept that the Antarctic Peninsula IceSheet mostly extended to the shelf edge during the LGM (e.g. Pudseyet al., 1994; Larter and Vanneste, 1995; Bentley and Anderson, 1998;Canals et al., 2000; Pudsey and Evans, 2001; Anderson et al., 2002;Domack et al., 2006; Sugden et al., 2006), the exact position ofgrounded ice and the timing of its retreat from the shelf edge is stilluncertain in many locations. In the NEAP region in particular, thereare very few data available on past ice sheet extent due to difficultiesencountered when radiocarbon dating young marine-based glacialdeposits in Antarctica.
2.2.1. Dating Quaternary glacial deposits in AntarcticaThe primary method used during the last two decades for dating
Quaternary glacial deposits in Antarctica has been AMS radiocarbon(14C) dating. However, for marine sediments this has proved chal-lenging due to the scarcity of calcareous material (e.g. foraminifera)suitable for 14C dating, combined with the difficulty of alternativematerials often yielding ages that are too old (e.g. Evans et al., 2005;Pudsey et al., 2006). This is particularly a problem in the NWWeddellSea where ancient carbon is reworked into marine sediments fromsedimentary rocks on the eastern coast of the Antarctic Peninsula(e.g. Pudsey and Evans, 2001). In addition, corrections are required toaccount for the large 14C reservoir effect in the Southern Ocean(Berkman and Forman, 1996; Andrews et al., 1999). Combined withdifficult access due to persistent extensive sea ice, the result is thatthere are relatively few reliable radiocarbon dates for retreat ofgrounded ice from the continental shelf around the NEAP. Mostmarine studies in Antarctica still rely on radiocarbon dating, butgeomagnetic paleointensity dating has also been used successfully todate Holocene ice shelf collapse (e.g. Brachfeld et al., 2003). Surfaceexposure dating based on in-situ produced cosmogenic isotopes has,over the past 2 decades, revolutionised our understanding of theglacial history of polar regions, and is now being used to date
terrestrial glacial deposits that are not dateable using radiocarbon.Many studies in Antarctica have focused on deposits dating back tothe LGM (e.g. Stone et al., 2003; Bentley et al., 2006; Mackintoshet al., 2007; Johnson et al., 2008). For this study, we focus onsurface exposure dating, but combine the results with the mostreliable published radiocarbon dates from marine sediments (givenin Table 1). We regard the majority of dates we report as minimumages for deglaciation,meaning theminimum length of time a site hasbeen free of grounded ice. In other words, the site in question wasice-free at the latest by that date. A few radiocarbon ages aredescribed as maximum ages for deglaciation, meaning that thosesites were deglaciated after that date. For those samples, we havegiven our reasoning in the text.We present all ages as calendar years.
2.2.2. Terrestrial evidence for timing of deglaciationMuch of the published onshore Quaternary work has focused on
the deglacial history since the LGM of the currently ice-free areas inthe NWof JRI, around Brandy Bay and the Naze (Fig.1; Rabassa,1983;Ingólfsson et al., 1992; Strelin and Malagnino, 1992; Björck et al.,1996; Hjort et al., 1997). At those sites, there is widespreadevidence for past glaciation (e.g. drumlins, glacigenic sediments,raised beaches andmarine limits). Ingólfsson et al. (1992) suggested,based on radiocarbon dating of moss, that the northern coastal areasof JRI initially deglaciated around 10.7 ka. However, Hjort et al., 1997revised that date to 8.1 ka based on radiocarbon dating of marinemolluscs from the Naze. Björck et al. (1996) dated lake sedimentsand suggested that inner Brandy Bay was deglaciated by 4.7 ka.
To date, nothing is known about the Quaternary glacial history ofsouth and east JRI, or of SEY. However, three studies report deglaci-ation ages from other islands in the region: the onset of marinesedimentation (corresponding to aminimum age for deglaciation) ina lake sediment core taken from an isolation basin on Beak Island(Fig.1A)was dated as 10.6 ka (Sterken et al., 2009). Aminimumage of7.1 ka (Zale, 1994) was obtained from lake sediments for deglaciationof Hope Bay, and an age for deglaciation of 11.8 ka (Zale and Karlén,1989) was obtained from organic material (probably freshwateralgae) found in sediment betweenmoraines on Vega Island (Fig. 1A).Due to potential contamination problems (from old carbon in glacialmeltwater) encountered with some freshwater dates around Ant-arctica (Ingólfsson et al., 1992; Hjort et al., 1997), the latter shouldprobably be regarded as a maximum, rather than minimum, age. Toour knowledge, there are no other onshore sites in the NEAP regionfor which deglaciation ages have been obtained.
There is only one published study of deglacial history usingsurface exposure dating in the NEAP region (Johnson et al., 2009).That study dated bedrock at two sites on the western coast of JRI,using cosmogenic 3He. The results suggested that both sites werecovered by thin ice formost of the last 4.6Myrs, with amaximumof15 kyrs of exposure during that time, and that JRI was completelyice-covered at the LGM. Johnson et al. (2009) suggested that theice-free period(s) may have been substantially less than this, andentirely during the Holocene. This conclusion is supported by thepublished dates from NW JRI (discussed above), which all indicateice retreat during the Holocene epoch (i.e. since 11.7 ka).
2.2.3. Holocene ice sheet fluctuationsSeveral glacial advances in the early- to mid-Holocene have been
reported for this region. For example, a glacial advance reached theouter part of Brandy Bay (Fig. 1C) around 5.4 ka (Hjort et al., 1997),depositing the Bahía Bonita Drift described by Rabassa (1983).However, lake sediments were accumulating inland by 4.7 ka (Björcket al.,1996), suggesting that the advance lasted less thanw700 years.
Several other Holocene glacial advances in northern JRI havebeen documented by Strelin et al. (2006). The oldest of theseoccurred at “Lachman Beach” (Fig. 1C) between 7.3 and 7.0 ka. The

Table 1Radiocarbon dates reviewed in this paper, all calibrated to calendar years before present (BP; relative to AD1950) using the CALIB program (version 6.0.1) (Stuiver and Reimer, 1993).
Lab ID 14C agea
yr BPRb Corrected
agec 14Cyr BP
Material Calibrated age range Median aged
yr BPMedian agerounded tonearest10yrs
Medianage ka
Location Reference
1s 2s
MarineOS-69717 8700 � 40 1280 7420 � 64 shell 8216e8352 8153e8404 8285 8290 8.3 Firth of Tay Michalchuk et al. (2009)CAMS 68469 17,450 � 60 6000 11,450 � 117 AIOe 13,194e13,411 13,102e13,578 13,310 13,310 13.3 Prince Gustav Channel Pudsey and Evans (2001)CAMS 68473 7930 � 40 6000 1930 � 108 AIO 1823e2089 1698e2251 1960 1960 2.0 Prince Gustav Channel Pudsey and Evans (2001)CAMS 68475 11,350 � 60 6000 5350 � 117 AIO 6017e6274 5902e6392 6150 6150 6.2 Prince Gustav Channel Pudsey and Evans (2001)CAM 66646 22,700 � 70 6000 16,700 � 122 AIO 19,582e19,727 (38%) 19,491e19,502 (0.5%) 19,840 19,840 19.8 S. Prince Gustav Channel Pudsey and Evans (2001)
19,777e20,046 (62%) 19,523e20,221 (99.5%)AA-50493 18,006 � 98 6000 12,006 � 140 AIO 13,710e14,026 13,456e14,189 13,860 13,860 13.9 S. Prince Gustav Channel Pudsey et al. (2006)CAM 66537 15,660 � 50 6000 9660 � 112 AIO 10,885e11,190 10,671e11,235 11,010 11,010 11.0 Prince Gustav Channel Pudsey and Evans (2001)AA-50489 15,271 � 75 6000 9271 � 125 AIO 10,367e10,681 10,223e10,914 10,540 10,540 10.5 Prince Gustav Channel Pudsey et al. (2006)AA-54032 16,340 � 120 1280 15,060 � 130 foraminifera 18,057e18,339 (70%) 17,963e18,604 18,259 18,260 18.3 Vega Trough Heroy and Anderson (2005)
18,436e18,534 (24%)Beta-194300 18,440 � 80 1280 17,160 � 94 foraminifera 20,200e20,479 20,069e20,575 (87%) 20,361 20,360 20.4 NW Weddell Sea Smith et al. (2010)
20,673e20,999 (13%)AA-5684 13,490 � 140 1280 12,210 � 149 foraminifera 13,836e14,249 (82%) 13,762e14,902 14,146 14,150 14.1 Marguerite Trough Pope and Anderson (1992)
14,334e14,485 (18%)AA-5685 12,425 � 110 1280 11,145 � 121 foraminifera 12,877e13,170 12,719e13,268 13,012 13,010 13.0 Marguerite Trough Pope and Anderson (1992)AA-10124 15,665 � 95 12,80 14,385 � 107 foraminifera 17,232e17,657 17,118e17,881 17,488 17,490 17.5 Bransfield Basin Banfield and Anderson
(1995)GX-20530-AMS 9358 � 70 1280 8078 � 86 shell 8995e9220 8880e9370 9108 9110 9.1 Lallemand Fjord Shevenell et al. (1996)NO-38245 10,600 � 55 1280 9320 � 74 foraminifera 10,503e10,659 10,398e10,813 (99.8%) 10,583 10,580 10.6 Larsen-B ice shelf Domack et al. (2005)
10,861e10,866 (0.2%)TerrestrialSUERC-12567 10,625 � 54 1280 9345 � 74 marine sediment 10,521e10,685 10,461e10,892 10,612 10,610 10.6 Beak Island Sterken et al. (2009)Ua-925* 10,235 � 225 n.a. n.a. freshwater algae 11,403e11,585 (22%) 11,265e12,396 11,811* 11,810 11.8 Vega Island Zale and Karlén (1989)
11,590e12,132 (78%)Lu-3605 8560 � 100 1280 7280 � 112 mollusc shells 8023e8264 7930e8362 8144 8140 8.1 The Naze, JRI Hjort et al. (1997)NUTA 6567 7650 � 100 1280 6370 � 112 mollusc shells 7197e7408 7040e7500 7293 7290 7.3 Lachman Beach, JRI Strelin et al. (2006)Beta 155912 7410 � 60 1280 6130 � 71 mollusc shells 6961e7141 6866e7219 7043 7040 7.0 Lachman Beach, JRI Strelin et al. (2006)SRR-3782* 9525 � 65 n.a. n.a. moss 10,586e10,787 (86%) 10521e10,533 (0.6%) 10,735* 10,740 10.7 Cape Lachman, JRI Ingólfsson et al. (1992)
10,974e10993 (4%) 10,549e10884 (75.7%)10,923e11084 (23.7%)
NUTA 6581 4930 � 100 1280 3650 � 112 mollusc shells 3917e4234 3793e4405 4083 4080 4.1 Caña Quemada Bay, JRI Strelin et al. (2006)Ua-3221 5885 � 65 1280 4605 � 82 mollusc shells 5270e5460 5122e5566 5360 5360 5.4 Brandy Bay, JRI Hjort et al. (1997)SUERC-576 8603 � 36 1280 7323 � 62 foraminifera 8131e8285 8033e8328 8194 8190 8.2 Mountonee Lake,
Alexander Isl.Bentley et al. (2005)
SUERC-578 9467 � 30 1280 8187 � 58 foraminifera 9137e9327 9067e9406 9243 9240 9.2 Mountonee Lake,Alexander Isl.
Bentley et al. (2005)
Ua-3695* 4185 � 80 n.a. n.a. Branchinectaeggs
4533e4543 (4.2%) 4438e4488 (7%) 4658* 4660 4.7 Brandy Bay, JRI Björck et al. (1996)4547e4557 (3.5%) 4497e4840 (93%)4567e4714 (61.9%)4716e4726 (3.4%)4753e4816 (27%)
ST11619* 6300 � 170 n.a. n.a. lake sediment 6939e7324 (98%) 6735e7471 7127* 7130 7.1 Hope Bay Zale (1994, p.183)7401e7410 (2%)
a Error is 1s.b R is the reservoir correction we used for calibrating the ages, except in the case of samples from Pudsey and Evans (2001) and Pudsey et al. (2006), where R includes both a correction for marine reservoir effect and a local
source correction (see Supplementary data). For details of how we have used the marine reservoir correction in our calibrations, see Supplementary Data.c The 1s error on the corrected age is calculated by the calibration program.d The calendar age we report is themedian calibrated age is rounded to the nearest 10 years. All calibrations were performed using theMARINE09 dataset (Reimer et al., 2009), except thosemarkedwith an asterisk (i.e. those of
non-marine origin), for which we used SHCal04 (McCormac et al., 2004).e AIO is Acid-Insoluble Organic fraction of marine sediments.
J.S.Johnsonet
al./Quaternary
ScienceReview
s30
(2011)3791
e3802
3794

J.S. Johnson et al. / Quaternary Science Reviews 30 (2011) 3791e3802 3795
youngest so far reported from this area is 4.1 ka (Strelin et al., 2006)for Caña Quemada Bay (Fig. 1C), although there are other undatedmoraines that may be younger.
2.2.4. Marine evidence for ice retreatStreamlined subglacial bedforms (e.g. mega scale glacial linea-
tions), grounding zone wedges, and associated soft till on theoutermost continental shelf suggest that the eastern margin of theAPIS grounded within 10 km of the shelf edge in the NW WeddellSea at the LGM (Bentley and Anderson, 1998; Anderson et al., 2002;Evans et al., 2005). The small number of radiocarbon dates availablesuggest that the APIS had started its retreat from the outer conti-nental shelf there by 18.3 ka (Heroy and Anderson, 2005). There isalso an inferred maximum age of 20.4 ka for retreat of the ice frontfrom the continental shelf edge, based on sediment core evidencefor polynyas (Smith et al., 2010). Deglaciation (retreat of groundedice and establishment of seasonally open water conditions) of theshelf on the west and SW side of JRI was inferred to have occurredbetween 19.8 and 13.3 ka (Pudsey and Evans, 2001). PGC ice shelfretreated from central PGC at 10.5 ka (Pudsey et al., 2006) and fromthe inner shelf west of JRI at 6.2 ka (Pudsey and Evans, 2001). Thereis no marine evidence that JRI was overridden by ice from theAntarctic Peninsula during the last glaciation (Evans et al., 2005).Approximately 150 km to the NE of JRI, deglaciation of the Firth ofTay had occurred by 8.3 ka (Michalchuk et al., 2009). The existingpublished data for APIS retreat from the continental shelf aroundJRI and SEY are given in Table 1.
In contrast to the easternmargin of the APIS in the NEAP, there isa relative abundance of marine data documenting retreat of itswestern margin since the LGM (Heroy and Anderson, 2007).Radiocarbon dates for retreat of ice from the outer to inner shelf ofthe western Antarctic Peninsula have been refined to 17.5 to 9.1 karespectively (age range bracketed by dates from Banfield andAnderson, 1995 and Shevenell et al., 1996; compilation in Heroyand Anderson, 2007).
During the past 15 years, several ice shelves have collapsedalong both the eastern and western coasts of the AntarcticPeninsula (e.g. Prince Gustav Channel, Larsen-A, and Larsen-B onthe eastern side; Müller, Jones, Wordie, George VI and Wilkins onthe western side). Some of these existed throughout the Holoceneand have only collapsed recently, e.g. Larsen-B ice shelf (Domacket al., 2005), whereas others have been absent at times during theHolocene and earlier (e.g. PGC and Larsen-A; Pudsey and Evans,2001; Brachfeld et al., 2003). On the western side of theAntarctic Peninsula, only George VI Ice Shelf is known to haveexperienced a collapse earlier in the Holocene. It was absentbetween 8.2 and 9.2 ka (Bentley et al., 2005), possibly in responseto both atmospheric and ocean warming (Smith et al., 2007). Incontrast, the Müller ice shelf advanced beyond its present position
Fig. 2. Photographs showing the sample sites. (A) Johnson Mesa (JOH), (B) Cape Lachman (White arrows indicate erratic cobbles that were sampled for this study.
at w0.4 ka (Domack et al., 1995). As yet, there are no data avail-able for the Holocene histories of Jones, Wordie, and Wilkins iceshelves.
3. Methods
Our objective is to improve the limited chronology of ice sheetretreat in the NEAP region by combining new surface exposuredating and existing 14C dates with evidence from bathymetric data.Sixteen samples for 10Be surface exposure dating were collectedfrom three sites on northern JRI (Johnson Mesa, Cape Lachman andTerrapin Hill) and one at the northern end of SEY (Fig. 1C). The siteswere chosen to provide data on the timing of retreat of the easternmargin of the APIS across the shelf (SEY), to determinewhen the JRIice cap first separated from the APIS (Cape Lachman; LAC), and howquickly ice retreated along Herbert Sound (Johnson Mesa andTerrapin Hill; JOH and TER).
Johnson Mesa is a plateau, consisting of a block-field of the localhyaloclastite/lava bedrock, situated 310m a.s.l. We collected graniteand granodiorite erratic cobbles which are scattered on both theplateau surface (Fig. 2A) and Crame Col at its northern end. Samplescollected from LAC are granitic erratics which lie on a small ridgetowards the northern end of the cape (Fig. 2B). The ridge is situated120 m a.s.l. At TER (80 m a.s.l.), a felsenmeer of local tuff bedrock isoverlain by patches of grey till which contain abundant granite andgranodiorite erratics (Fig. 2C). We collected samples from four ofthese. On SEY, samples were taken from granite cobbles andboulders scattered across the main central plateau at w200 m a.s.l.(Fig. 2D). The positions and elevations of all erratics collected weremeasured using hand-held GPS. Details of all analytical preparationand procedures are given in the Supplementary data, and surfaceexposure ages and associated data are given in Table 2. All previ-ously published radiocarbon ages reported in this paper havebeen recalibrated according to the methods described in theSupplementary data.
In addition, we compiled all the available swath bathymetrydata for the NEAP region (Fig. 1A). In order to identify the locationof former ice streams and their flow directions, we searched theswath data for glacial bedforms such as troughs and lineations, andcombined our observations with those of others (e.g. Pudsey andEvans, 2001; Domack et al., 2005; Evans et al., 2005; Fig. 1B).Four troughs around JRI and SEY (PGC, Croft, Humps and Admiraltytroughs; Fig. 1B) were likely channels for ice draining the AntarcticPeninsula (in the case of PGC) and JRI (for Croft, Humps andAdmiralty Troughs) at the LGM.We compared the relative timing ofdeglaciation of those troughs, determined from exposure dating ofthe adjacent coasts, with their depths, in order to determinewhether there was any bathymetric control on post-LGM retreat ofthe APIS in this region.
LAC), looking SW to Lachman Crags. (C) Terrapin Hill (TER), (D) Seymour Island (SEY).

Table 2Exposure ages from James Ross Island.
Sample BAS ID AMS ID Latitude (S) Longitude (W) Altitude(m a.s.l.)
Samplethickness(cm)
10Be conc.a
(at g�1)1s error(at g�1)
10Be ageb
(yr)1s errorint
(yr)1s errorext
(yr)
LAC-02 B6.85 b2695 �63.7847 �57.7891 120 5 50,159 2050 7979 327 767LAC-03 B6.86 b2698 �63.7851 �57.7893 122 5 51,228 2022 8132 322 777LAC-04 B6.87 b2699 �63.7851 �57.7893 123 5 67,759 2695 10,752 429 1030LAC-05 B6.88 b2839 �63.7849 �57.7892 120 6 51,786 2715 8304 436 844
SEY-01 B6.89 b2700 �64.2431 �56.6294 207 4 51,950 2340 7498 338 735SEY-02 B6.90 b2701 �64.2442 �56.6341 210 4 57,328 2268 8251 327 789SEY-03 B6.91 b2703 �64.2433 �56.6362 219 5 82,290 3188 11,841 460 1130SEY-04 B6.92 b2704 �64.2428 �56.6328 214 5 16,9814 6173 24,638 901 2334
JOH-01 B6.79 b2850 �63.8262 �57.9191 318 4.5 23,8423 8440 31,124 1110 2942JOH-02 B6.80 b2851 �63.8303 �57.9093 304 4.5 61,385 2399 8078 316 771JOH-04 B6.82 b3435 �63.8136 �57.9420 263 5 48,244 2225 6636 307 654JOH-05 B6.83 b3440 �63.8136 �57.9420 264 5 182,736 5637 25,229 783 2340
TER-04 B6.96 b2853 �63.9331 �57.5239 80 5 40,763 1719 6767 286 655TER-05 B6.97 b3441 �63.9335 �57.5239 81 5 54,777 2444 9082 406 889TER-07 B6.99 b3429 �63.9359 �57.5273 85 7 45,152 2198 7568 369 755TER-08 B6.100 b3430 �63.9359 �57.5269 85 8 50,936 2150 8607 364 833
a 10Be concentrations include the subtraction of laboratory background 10Be concentrations, measured by several blanks run in tandem with the samples. 10Be/9Bemeasurements of laboratory blanks ranged from 7.07E-14 to 7.60E-13, corresponding to corrections of sample 10Be concentrations of 1.7e14.0%. Measured 10Be/9Be ratioswere normalised to NIST SRM 4325 adopting a nominal standard value of 10Be/9Be¼ 2.79E-11 and matching NIST_27900 flag for the purposes of data entry into the CRONUS-Earth exposure age calculator (v.2.2; Balco et al., 2008), which then used the 10Be half-life of Nishiizumi et al. (2007) for the age determination.
b Exposure age assuming zero erosion, density 2.65 g/cm3 and Antarctic atmosphere. Corrections for topographic shielding ranged from 0.999 to 1.000. Exposure age wascalculated using the CRONUS-Earth 10Bee26Al exposure age calculator (version 2.2), using a constant production rate model and scaling scheme for spallation of Lal (1991)/Stone (2000). The calculator uses a reference production rate for spallation of 4.49 � 0.39 at/g/yr (Stone, 2000, renormalized to the 07KNSTD standardization) scaled to sealevel high latitude. Using the other main scaling factor schemes changes our exposure ages by no more than 7.1%.
Fig. 3. Probability density function of surface exposure ages from this study. Eachexposure age is represented by a Gaussian curve with a width determined by its internaluncertainty, with colours relating to location (as given in the legend). The thick black linerepresents the total probability density function of all the exposure ages shown.(For interpretation of the references to colour in thisfigure legend, the reader is referred tothe web version of this article.)
J.S. Johnson et al. / Quaternary Science Reviews 30 (2011) 3791e38023796
4. Results
4.1. Geomorphology
Bathymetric data from around JRI and SEY show that the mainglacial trough that forms Prince Gustav Channel is the deepest in thearea (1280 m; Fig. 1A). Ice streams have been channelled from theAntarctic Peninsula through this trough to the south and east of JRI,probably during and since the LGM (Domack et al., 2005; Evans et al.,2005). An ice divide may have been located to the NWof JRI on a sillclose to CañaQuemada Bay,which is today the shallowest seafloor inPGC (Fig. 1B; Camerlenghi et al., 2001). Extending from the northernpart of JRI are two troughs, which contain subglacial lineationsindicating the former direction of ice flow from Mt Haddingtonnorthward into Croft Bay and northeastwards into the Weddell Seapast Humps Island (Fig. 1B and C). From here onwards, we refer tothese troughs as ‘Croft’ and ‘Humps’ Troughs, respectively. Betweenthese two troughs, and to the south of Vega Island, is a shallower areawhich lies adjacent to The Naze (Fig. 1C) and close to our sample siteat TER. This shallow region isnot lineated anddoesnot appear tohaveexperienced glacial erosion, suggesting that ice flowed from MtHaddington into the bay via Humps Trough, not directly over oursample site at TER itself (in contrast with the ice flow reconstructiongiven in Domack et al., 2005). Ice in Herbert Sound adjacent to TERwas probably thinner than the ice grounded either side in Croft andHumps Troughs (which are deeper). There is a third trough imme-diately to thenorth andwestof SEY inAdmiralty Sound (Fig.1B andC;from here onwards, referred to as ‘Admiralty Trough’). Ice probablyflowed through this trough northeastwards into Vega Trough(Domack et al., 2005). Inferred ice flow directions at the LGM areshown in Fig. 1B.
4.2. Exposure ages
All except three of our 16 10Be ages record exposure of <12 kyr,and most are between 6.6 and 9.1 ka (i.e. early- to mid-Holocene;
Table 2). Fig. 3 shows their relative probability distribution. Theyform three clusters: one of 11 samples, with ages ranging between6.6� 0.7 and 9.1�0.9 ka, a second group of two samples (10.8� 1.0and 11.8 � 1.1 ka), and a third group of three samples with signif-icantly older ages from SEY and JOH. The third group also hasa broader age range (24.6 � 2.3 to 31.1 � 2.9 ka). The most likelyexplanation for the oldest group is that the cobbles were exposed tocosmic radiation prior to the last glaciation, and therefore theirolder ages reflect inherited cosmogenic isotopes from previousperiod(s) of exposure. For the purposes of our study of the timing ofdeglaciation, we decided to exclude those ages, and from here

J.S. Johnson et al. / Quaternary Science Reviews 30 (2011) 3791e3802 3797
onwards will focus on the samples that have 10Be exposure ages of<12 kyrs.
A common approach in Antarctica is to take the youngest expo-sure age at each site as that most representative of deglaciation(e.g. Stone et al., 2003; Bentley et al., 2006). For this study, thatwouldresult in deglaciation ages of 8.0� 0.8 ka for LAC, 6.6� 0.7 ka for JOH,6.8� 0.7 ka for TER, and 7.5� 0.7 ka for SEY. An alternative approachis to provide a best estimate of deglaciation age based on the meanage of all the samples in the accepted ‘younger population’ (i.e. thosewith 10Be ages of <12 kyrs) at each site. This yields deglaciation agesof 8.8 � 0.9 ka for LAC, 7.4 � 0.7 ka for JOH, 8.0 � 0.8 for TER and9.2� 0.9 for SEY. However, we suggest here that the first approach ismore appropriate, because we selected our sample sites to reducethe likelihood of snowcover, vegetation cover or exposure by erosionof overlying till (all of which would result in an erroneously youngexposure age; Gosse and Phillips, 2001). We think it is more likelythat reworking of erratic cobbles will have played a role, andtherefore we would expect an age population where the youngestrepresents the least reworking and is therefore the most reliabledeglaciation age. Those ages are shown in red in Fig. 1A.
5. Discussion
5.1. Deglacial chronology from exposure dating
According to our exposure dating results, the earliest of our sitesto become ice-free after the LGM was LAC (at 8.0 ka; Fig. 1). Nearby,ice retreated from JOH by 6.6 ka. That site may have deglaciated laterthan LAC (120 m a.s.l.) as a consequence of ice remaining on JOH(265 m a.s.l.) as a small localised ice dome forw1400 years after thesurrounding area became ice-free. Similar ice domes such as this arepresent elsewhere on the volcanic mesas of JRI today (e.g. PatalamonMesa, Crisscross Crags; Fig. 1C), and a comparable style of deglacia-tion has been suggested for flat-topped summits of southern Alex-ander Island, one of whichmay have supported a vestigial ice cap foras long as 3.3 ka (Citadel Bastion; Hodgson et al., 2009). In addition,on JOH there are proportionately more exposure ages that aresignificantly older than those in the younger two groups (i.e.>12 ka)than at the other sites we visited (Fig. 3), perhaps supporting thesuggestion of a longer-lived ice dome with more recycled erratics.The demise at 6.6 ka of ice situated on JOH occurred close to the timethat the PGC ice shelf disappeared (between 6 and 2 ka; Pudsey andEvans, 2001; Fig. 4), and thus could also be attributed to a period ofincreased warming (cf. Pudsey and Evans, 2001).
Twenty-five kilometres to the SE, our exposure dates suggest TERremained ice-covered longer than LAC, with ice retreating from thissite by 6.8 ka (compared with 8 ka at LAC; Fig. 1A). Unfortunately wewere not able to collect samples from the southernmost points ofCroft and Humps Troughs. Dates from such samples would enable usto say how quickly ice retreated along the Croft and Humps troughs,and whether it had remained in the troughs once the adjacent landhad deglaciated. The latter is possible because these troughs werefed by ice from the interior of JRI; similar situations are found inGreenland today. If we postulate that TER was deglaciated after thetroughs had become ice-free, then deglaciation of the troughs musthave occurred between 8.0 � 0.8 and 6.8 � 0.7 ka (i.e. withina maximum of 2.7 kyrs, using 1-sigma uncertainties on the exposureages). This gives a minimum average retreat rate of 11 m yr�1, whichis a similar order of magnitude to rates of retreat observed inAntarctic Peninsula glaciers over the past 50 years (Cook et al., 2005).However, it is worth noting that consideration of the 1-sigmauncertainties on these dates could lead to an alternative interpre-tation that LAC and TER have identical deglaciation ages. This wouldneed to be verified by further exposure dating along the margins ofCroft Trough, and sediment coring from the troughs themselves.
On SEY we obtained a deglaciation age of 7.5 � 0.7 ka, which isindistinguishable (within error) from the age for retreat from LAC(8.0� 0.8 ka). These ages suggest that NW JRI deglaciated at more orless the same time as SEY became free of grounded ice, and that theinner troughs of JRI (e.g. Croft Trough, Humps Trough, and possiblyalso Admiralty Trough) deglaciated around a thousand years later.
5.2. Evidence for timing of deglaciation from swath bathymetry
Herewe review evidence for the relative timing of deglaciation intheNEAP from features in our compilation of swath bathymetry data,and relate this to the new deglacial chronology we have establishedthrough our exposure dating. In particular, we look at whether thebathymetry may have controlled ice retreat in this region.
We suggest a hypothesis: that the timing of deglaciation in theNEAP inner shelf region is correlated with sea floor depth (i.e. thatice retreated from the deepest parts of the shelf first, followed bysuccessively shallower areas). The simplest situation that couldproduce this behaviour would be an ice sheet of uniform thicknessthinning at the same rate everywhere. Once an ice sheet thinsbeyond a certain thickness, it will no longer be grounded, but willlift off its bed. Moreover, less thinning is required for ice in deeptroughs to float than for ice in shallower troughs to float. So in thescenario we describe, ice grounded in the deepest troughs wouldfloat (and hence retreat) earlier than ice grounded in shallowertroughs. However, the reality is obviously more complex. Ina marine-terminating ice sheet, ice flux at the grounding line isstrongly related to ice thickness and hence depth of the sea floor(ice flux increases as depth increases), and is therefore an importantcontrol on movement of the grounding line (Schoof, 2006). Thereare other factors thatmay affect timing of retreat, e.g. accumulation,presence/absence of an ice shelf, but we base our hypothesis aroundthe simplest scenario.
We measured the relative depths of the troughs making up theNEAP inner shelf from the swath bathymetry data. The deepestpoints in each trough are: 1280 m for PGC, 410 m for Croft, 430 mfor Humps, and 440m for Admiralty. If our hypothesis is correct, wewould expect the following order of glacial retreat in the NEAPregion (first to last): 1. Outer shelf to midshelf, 2. PGC Trough, 3.Admiralty Trough, 4. Humps Trough, 5. Croft Trough. However, it isworth noting that both the deepest points (440, 430 and 410m) andmean depths (260, 350 and 290 m) of Admiralty, Humps and CroftTroughs are within <100 m of each other, so we could justifiablygroup those three together in terms of expected timing of retreat.
The APIS was grounded close to the continental shelf edge at theLGM, and had started its retreat from there by 18.3 ka (Heroy andAnderson, 2005). If our hypothesis is correct, following APISretreat onto the mid-shelf, grounded ice would have retreated fromthe deepest trough, PGC, before the other troughs became ice-free.An ice shelf has occupied PGC at various times in the past (Pudseyet al., 2006) so retreat here means transition from grounded ice tofloating ice shelf. Hence the JRI ice cap was still confluent with theAPIS when the ice sheet retreated from the shelf edge, andwas onlytruly separated from it when the PGC ice shelf was absent between6.2 and 2.0 ka (Pudsey and Evans, 2001). According to our exposuredating, the first of our sites to deglaciate after the LGM was LAC,which became ice-free at 8 ka. So here the exposure dating supportsour hypothesis.
From swath bathymetry alone, it is difficult to make manyinferences about relative timing of deglaciation of the three shal-lower troughs surrounding JRI and SEY (Croft, Humps and Admiraltytroughs; Fig. 1B). Based on its slightly greater depth, AdmiraltyTrough may have deglaciated sooner than Croft and Humps Troughs(as would be expected if ice retreated gradually from the outer toinner continental shelf). But it would seem surprising if 30 m extra
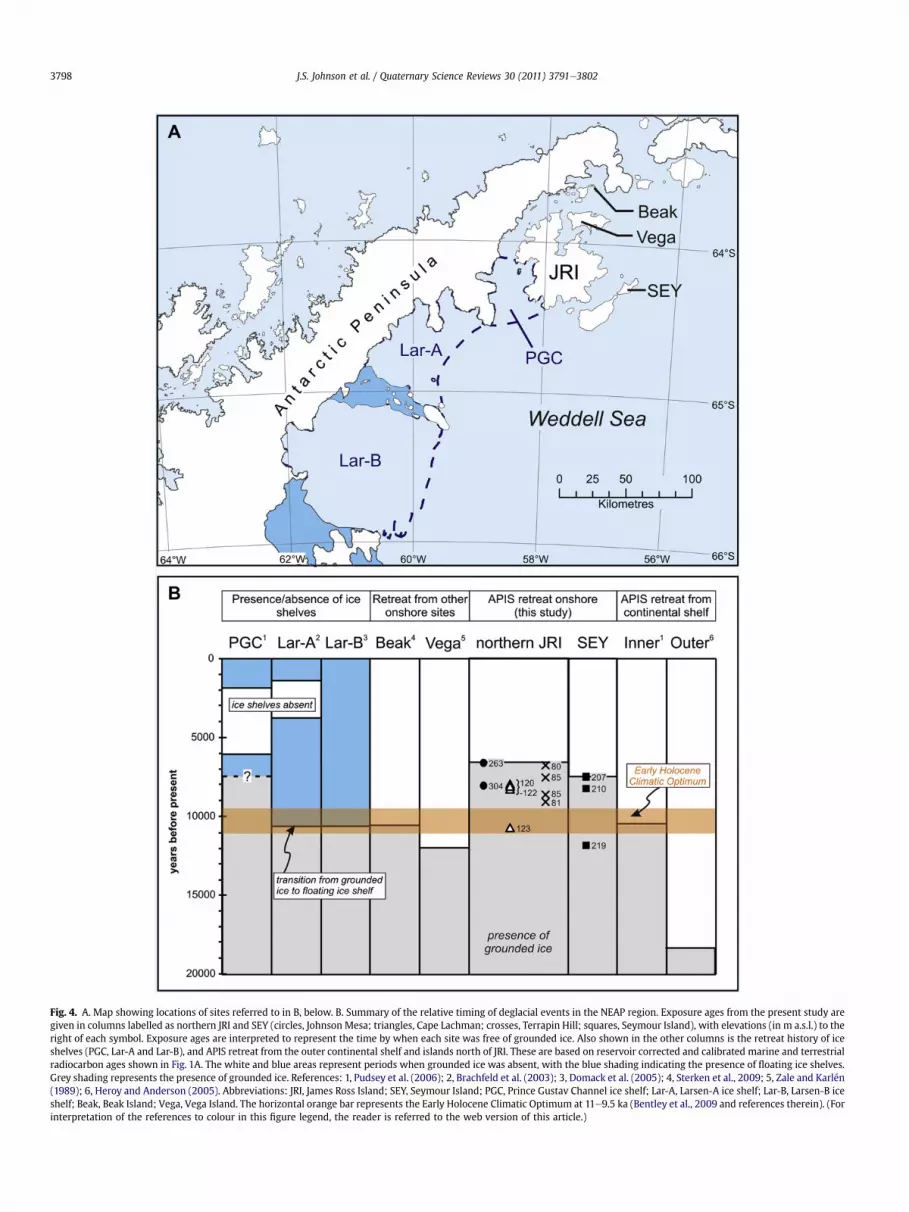
Fig. 4. A. Map showing locations of sites referred to in B, below. B. Summary of the relative timing of deglacial events in the NEAP region. Exposure ages from the present study aregiven in columns labelled as northern JRI and SEY (circles, Johnson Mesa; triangles, Cape Lachman; crosses, Terrapin Hill; squares, Seymour Island), with elevations (in m a.s.l.) to theright of each symbol. Exposure ages are interpreted to represent the time by when each site was free of grounded ice. Also shown in the other columns is the retreat history of iceshelves (PGC, Lar-A and Lar-B), and APIS retreat from the outer continental shelf and islands north of JRI. These are based on reservoir corrected and calibrated marine and terrestrialradiocarbon ages shown in Fig. 1A. The white and blue areas represent periods when grounded ice was absent, with the blue shading indicating the presence of floating ice shelves.Grey shading represents the presence of grounded ice. References: 1, Pudsey et al. (2006); 2, Brachfeld et al. (2003); 3, Domack et al. (2005); 4, Sterken et al., 2009; 5, Zale and Karlén(1989); 6, Heroy and Anderson (2005). Abbreviations: JRI, James Ross Island; SEY, Seymour Island; PGC, Prince Gustav Channel ice shelf; Lar-A, Larsen-A ice shelf; Lar-B, Larsen-B iceshelf; Beak, Beak Island; Vega, Vega Island. The horizontal orange bar represents the Early Holocene Climatic Optimum at 11e9.5 ka (Bentley et al., 2009 and references therein). (Forinterpretation of the references to colour in this figure legend, the reader is referred to the web version of this article.)
J.S. Johnson et al. / Quaternary Science Reviews 30 (2011) 3791e38023798

J.S. Johnson et al. / Quaternary Science Reviews 30 (2011) 3791e3802 3799
depth at Admiralty compared with Croft Trough made any signifi-cant (and dateable) difference to the timing. If our hypothesis iscorrect, the similar depth of all three troughs is more likely to implythat they deglaciated simultaneously. Our exposure ages do notpreclude simultaneous deglaciation of these three troughs (since LACand SEY deglaciated at the same time within error; w8 ka), but wehave insufficient data to determinewhen they became totally free ofgrounded ice, as they are today. However, unlike Humps andAdmiralty Troughs, Croft Trough is bounded by land alongmost of itslength, which may have slowed retreat of ice grounded within it.Subglacial lineations, visible in the swath data for Croft and Humpstroughs, are absent in the shallower region between TER and VegaIsland. This suggests that the shallow region probably acted asa pinning point for ice, and therefore thatwemight expect groundedice retreat from TER to have occurred later than from Croft andHumps Troughs. According to our exposure dating, TER deglaciatedlater than LAC, at 6.8 ka. That is consistent with ice being pinned onthe shallow region between TER and Vega Island. Moreover, wespeculate that ice remained at TER after grounded ice had retreatedcompletely from Croft Trough, and possibly also after Humps Troughbecame free of grounded ice.
In summary, our exposure dating supports our proposed order ofretreat, with the deepest trough (PGC) deglaciating first after ice hadinitially retreated from the outer tomidshelf between 18.3 and 7.5 ka.The three shallower troughswere deglaciated later, butwe cannot besure that they deglaciated simultaneously. The exposure datingappears to be consistent with our hypothesis at TER, where we haveevidence (lack of lineations) that ice remained there after the adja-cent troughs had begun to deglaciate. Evidence for bathymetriccontrol on retreat of outlet glaciers that terminate in the ocean hasalso been reported for a Laurentide outlet glacier retreating throughan Arctic fjord (Briner et al., 2009). However, in that situation, retreatof the glacier accelerated rapidly after it had passed a sill at the fjordmouth (retreating up to 58 m yr�1 through the middle of the fjord),later stabilising in shallowerwater inland. No such sill is visible in thebathymetry of the troughs around JRI and SEY.
5.3. Comparison with existing dates
Retreat of ice from LAC by 8.0 � 0.8 ka is consistent with pub-lished minimum ages for deglaciation from other parts of northernJRI e 4.7 ka at Brandy Bay (Björck et al., 1996), 8.1 ka at the Naze(Hjort et al., 1997) and <15 ka at Patalamon Mesa and CrisscrossCrags (Johnson et al., 2009) e and also coincident with the retreatof ice from SEY, at 7.5 � 0.7 ka. However, our LAC age is w2 kyryounger than the minimum radiocarbon age for ice retreat fromBeak Island 30 km NE of LAC (10.6 ka; Sterken et al., 2009). Wecannot rule out that the islands to the north of JRI deglaciatedslightly earlier, especially since Beak Island is situated adjacent toa deep trough (trending NeS; Fig. 1A). Such an interpretation is alsosupported by radiocarbon dates from marine sediments in PGC tothe west of JRI, which suggest retreat of grounded ice in that regionoccurred between 13.9 and 10.5 ka (Pudsey and Evans, 2001;Pudsey et al., 2006), slightly earlier than the majority of our siteson JRI (Fig. 1 and Table 1).
There are no marine (14C) deglaciation ages available frombetween the eastern edge of the outer shelf and PGC.Our age of 7.5 kafor deglaciation of SEY is therefore especially important because it isthe only constraint we have on the timing of ice retreat from theeastern margin of the James Ross basin across the mid-shelf. Thecollection of minimum radiocarbon ages from PGC imply that retreatfrom the inner shelf on the western side of JRI started slightly earlier(13.9 ka; Pudsey et al., 2006) than on the northern side, wheremaximum terrestrial radiocarbon ages suggest deglaciation noearlier than 11.8 ka (Vega Island; Zale and Karlén, 1989).
In summary, existing marine dates show a picture of ice retreatfrom the outer shelf by 18.3 ka, and subsequently from the innershelf areas to the west of JRI by 10.5 ka. To the north of JRI,terrestrial ages suggest a slightly later onset (no earlier than 11.8 ka)for retreat from the inner shelf. Our exposure ages indicate that thiswas followed by retreat from the northwest and southeast sides ofJRI/SEY simultaneously around 8.0 ka, separating the grounded JRIice cap from the merged APIS/JRI ice sheet. From our exposure ages,we suggest that the inner troughs of northern JRI began deglaci-ating around 6.8e8.0 ka, but we are unable to say how quickly theice reached its present-day configuration within them. Some smallice domes remained until later (e.g. JOH until 6.6 ka). Whilstwidespread deglaciation of JRI and SEY was underway by the early-Holocene, several localised glacial advances also occurred.
Fig. 4 summarises current understanding of the relative timing ofice retreat from different parts of the NEAP since the LGM. PGC,Larsen-A and Larsen-B ice shelves all remained intact during the timewhen ice was retreating from the outer to inner shelf and when theinner troughs of JRI began to deglaciate (i.e. 18.3e6.8 ka; Heroy andAnderson, 2005; Pudsey et al., 2006; exposure dates from thisstudy). The disintegration of the PGC ice shelf at 6.2 ka is thought tohave coincided with a period of regional climate warming deducedfrombothmarine and terrestrial paleoenvironmental records aroundthe Antarctic Peninsula (Pudsey and Evans, 2001 and referencestherein), and occurred shortly after deglaciation of northern JRI. Bothexisting radiocarbon data and our new cosmogenic data documentawidespread deglaciation of islands in theNEAP in the early- tomid-Holocene. Unfortunately there are only limited climate records(ice cores) currently available for that period, and they are not fromJRI, or even from the Antarctic Peninsula. Nevertheless, a warmperiod in Antarctica between 9.5 and 8.0 ka is recorded in several icecores from East Antarctica (e.g. EPICA Dome C, Vostok, Komso-molskaia, Taylor Dome) and one from West Antarctica (Byrd; Ciaiset al., 1992, 1994; Masson et al., 2000; Masson-Delmotte et al.,2004). This warm period followed the Early Holocene ClimaticOptimum (11e9.5 ka; Bentley et al., 2009 and references therein) andimmediately preceded the deglaciation of northern JRI and SEY. It ispossible that the warm period between 9.5 and 8.0 ka also affectedthe NEAP region (thus extending the duration of warming the NEAPexperienced), and triggered deglaciation of JRI and surroundingislands in the early- tomid-Holocene, but wewill not know this untilthe ice core collected from Mt Haddington in 2008 is analysed(Rob Mulvaney, pers. comm.).
We have demonstrated with surface exposure dating that ice onnorthern JRI had largely reached its current limits by the mid-Holocene (w6.6 ka). In Antarctica, peak temperatures during atleast the last four interglacial periods (Marine Isotope Stages 5, 7, 9and 11) were warmer than the Holocene (Jouzel et al., 2007).However, surface exposure dating using cosmogenic 3He hasshown that two sites onwestern JRI were ice-free for amaximum of15 kyrs during the past 4.6 Myrs, and likely a much shorter periodthan this (Johnson et al., 2009). Our new data are consistent withtheir suggestion that those sites were only exposed during theHolocene epoch.
5.4. Comparison with other parts of the Antarctic Peninsula
Compared with the NW Antarctic Peninsula, there is a relativelack of published data for the APIS configuration in the NEAP region(Fig. 1, Heroy and Anderson, 2007). Our dataset has begun toaddress this issue, although further terrestrial work is needed to fillgaps in our understanding of the deglacial chronology, particularlyaround the south and east of JRI. Here we outline comparisonsbetween deglaciation of the NE versus the NWAntarctic Peninsula

J.S. Johnson et al. / Quaternary Science Reviews 30 (2011) 3791e38023800
that can be drawn from a combination of our own data and pub-lished data.
Published marine data indicate that retreat of the APIS wasprogressive from the outer, middle and inner continental shelfregions on both sides of the northern Antarctic Peninsula (AP)betweenw18e9 ka (Heroy and Anderson, 2007). Aweak correlationbetween latitude and timing of retreat (retreat from N to S) has alsobeen reported (Heroy and Anderson, 2007). Terrestrial dates fordeglaciation (from cosmogenic dating; Bentley et al., 2011) indicatethat the western margin of the APIS retreated to its present-dayconfiguration on the inner shelf in the early-Holocene (by 6.5 ka atPrimavera Point, at 64�S). Our new exposure ages for deglaciation ofJRI and SEYare consistent with this observation, suggesting that bothflanks of the northern APIS had retreated close to its present-dayposition in the NEAP region by w6.6 ka. They also supporta synchronous retreat from both margins of the northern APIS.
This is interesting considering that there are significant differ-ences between the dynamics of ice retreat and climate on each sideof the AP. For example, the Marguerite Bay ice stream (western AP)retreated very rapidly from the outer shelf at 14.2 ka (Ó Cofaigh et al.,2005; Kilfeather et al., 2011), and the inner shelf around 10 ka(Bentley et al., 2011). In George VI Sound, the ice shelf calving fronthad retreated south of Ablation Point massif by 9.2 ka (Bentley et al.,2005). In contrast, from the presence of grounding zone wedges,Evans et al. (2005) inferred that retreat of the eastern margin of theice sheet was relatively slow and episodic, with stillstands on themiddle and inner shelf. However, it has since been shown thatgrounding zone wedges can form over centennial timescales(Graham et al., 2010) and may be more indicative of episodes offaster sedimentation during a rapid deglaciation than of stillstands(Larter and Vanneste, 1995). It has been suggested that any differ-ences between each side of the AP are related to the influx of warmCircumpolar Deep Water (CDW) onto the shelf in Marguerite Bay inthe early-Holocene (e.g. Bentley et al., 2005; Smith et al., 2007),whereas the analogous water mass on the eastern Antarctic Penin-sula coast,Weddell DeepWater, did not flood the continental shelf inthe NW Weddell Sea at that time (Nicholls et al., 2004). This raisesthe question as to what caused the synchronous retreat. It is possiblethat the deglaciationwas triggered by atmospheric warming, such asthat implicated in the recent break-up of several AP ice shelves(Pudsey and Evans, 2001; Hodgson et al., 2006), or rising sea level(Hughes, 1987; Heroy and Anderson, 2007). These would affect bothsides of the AP, although in the case of atmospheric warming, notequally e as today, the west coast has a polar maritime climate(warm, wet), and the east coast is polar continental (cold, dry, ina precipitation shadow). However, the APIS response to both atmo-spheric warming and rising sea level is probably influenced stronglyby topography/bathymetry (Sugden et al., 2006), which naturallydiffers according to location.
6. Conclusion
We compiled existing swath bathymetry data from the regionand combined this with new surface exposure ages and publishedterrestrial and marine radiocarbon dates to test the hypothesis thatthat the timing of deglaciation of the inner shelf in the NEAP regionis correlated with sea floor depth (bathymetry). We conclude thefollowing:
� Ice retreat from the outer shelf was underway by 18.3 ka(Heroy and Anderson, 2005), and had reached Seymour Islandby w8 ka. Northern James Ross Island and its inner troughswere probably deglaciated by 6.6 ka, with ice remaining onsome mesas for several hundred years longer (e.g. JohnsonMesa).
� Seymour Island and Cape Lachman deglaciated at the same timewithin error (w8 ka). Retreat of the grounding line had the effectof separating the JRI ice cap from its confluence with the APISwhen ice grounded inPGCbegan tofloat (i.e. becamean ice shelf).
� Northern JRI began to deglaciate around the time of the EarlyHolocene Climatic Optimum (c. 11e9.5 ka), and shortly beforePGC ice shelf began to disintegrate.
� Bathymetry does appear to have influenced the relative timingof deglaciation of the NEAP region; the most simple interpre-tation of the surface exposure and radiocarbon dating is thatice retreated from the deepest parts of the inner shelf first,followed by successively shallower areas.
Acknowledgements
We thank the captain, officers and crew of HMS Endurance forexcellent logistical support during fieldwork, and Emma Watchamfor assistance with sampling on Seymour Island. We are grateful toHilary Blagbrough, Elaine McDougall and Mike Tabecki for theirtechnical support, and to Tibor Dunai and Christoph Schnabel forfacilitating the sample preparation and AMS analyses. We acknowl-edge Eugene Domack, John Anderson and Carol Pudsey, who werePrincipal Investigators for the research cruises on which most of theswath bathymetry data presentedherewere collected. Rob Larter andPeter Fretwell kindly helped to prepare Fig. 1, and James Smith andDominic Hodgson assisted with calibrating the radiocarbon ages.Discussion with Robert Arthern, Alastair Graham, Claus-Dieter Hill-enbrand, Rob Larter, Hamish Pritchard, John Smellie and DavidVaughan improved themanuscript. This paper is published as part ofthe British Antarctic Survey ‘Polar Science for Planet Earth’ pro-gramme, funded by the Natural Environment Research Council. Itcontributes to the aims and objectives of the SCAR ACE (AntarcticClimate Evolution) initiative.We thankDavid Finkandananonymousreviewer for their constructive comments.
Appendix. Supplementary data
Supplementary data related to this article can be found online atdoi:10.1016/j.quascirev.2011.10.011.
References
Anderson, J.B., Shipp, S.S., Lowe, A.S., Wellner, J.S., Mosola, A.B., 2002. The AntarcticIce Sheet during the LGM and its subsequent retreat history: a review.Quaternary Science Reviews 21, 49e70.
Andrews, J.T., Domack, E.W., Cunningham, W.L., Leventer, A., Licht, K.J., Jull, A.J.T.,DeMaster, D.J., Jennings, A.E., 1999. Problems and possible solutions concerningradiocarbon dating of surface marine sediments, Ross Sea, Antarctica. Quater-nary Research 52, 206e216.
Backman, E., Domack, E.W., 2003. Depositional Architecture and seafloor Mappingof the Vega Drift, Erebus and Terror Gulf, Antarctic Peninsula. EOS Transactions,AGU 84 (46), Fall Meeting Supplement, Abstract PP31B-0256.
Balco, G., Stone, J.O., Lifton, N.A., Dunai, T.J., 2008. A complete and easily accessiblemeans of calculating surface exposure ages or erosion rates from 10Be and 26Almeasurements. Quaternary Geochronology 3, 174e195.
Banfield, L.A., Anderson, J.B., 1995. Seismic facies investigation of the late Quater-nary glacial history of Bransfield Basin, Antarctica. Antarctic Research Series 68,123e140.
Bentley, M.J., Anderson, J.B., 1998. Glacial and marine geological evidence for the icesheet configuration in the Weddell Sea-Antarctic Peninsula region during theLGM. Antarctic Science 10, 309e325.
Bentley, M.J., Hodgson, D.A., Sugden, D.E., Roberts, S.J., Smith, J.A., Leng, M.J.,Bryant, C., 2005. Early Holocene retreat of the George VI ice shelf, AntarcticPeninsula. Geology 33, 173e176.
Bentley, M.J., Fogwill, C.J., Kubik, P.W., Sugden, D.E., 2006. Geomorphologicalevidence and cosmogenic 10Be/26Al exposure ages for the Last Glacial Maximumand deglaciation of the Antarctic Peninsula Ice Sheet. Geological Society ofAmerica Bulletin 118 (9/10), 1149e1159.
Bentley, M.J., Hodgson, D.A., Smith, J.A., Ó Cofaigh, C., Domack, E.W., Larter, R.D.,Roberts, S.J., Brachfeld, S., Leventer, A., Hjort, C., Hillenbrand, C.-D., Evans, J.,2009. Mechanisms of Holocene palaeoenvironmental change in the AntarcticPeninsula region. The Holocene 19 (1), 51e69.

J.S. Johnson et al. / Quaternary Science Reviews 30 (2011) 3791e3802 3801
Bentley, M.J., Johnson, J.S., Hodgson, D.A., Dunai, T.J., Freeman, S., Ó Cofaigh, C., 2011.Rapid deglaciation of Marguerite Bay, western Antarctic Peninsula in the EarlyHolocene. Quaternary Science Reviews 30 (23e24), 3338e3349.
Berkman, P.A., Forman, S.L., 1996. Pre-bomb radiocarbon and the reservoir correc-tion for calcareous marine species in the Southern Ocean. Geophysical ResearchLetters 23, 633e636.
Björck, S., Olsson, S., Ellis-Evans, C., Håkansson, H., Humlun, O., Lirio, J.M., 1996. LateHolocene palaeoclimatic records from lake sediments on James Ross Island,Antarctica. Palaeogeography, Palaeoclimatology, Palaeoecology 121 (3e4),195e220.
Brachfeld, S., Domack, E., Kissel, C., Laj, C., Leventer, A., Ishman, S., Gilbert, R.,Camerlenghi, A., Eglinton, L., 2003. Holocene history of the Larsen-A Ice Shelfconstrained by geomagnetic paleointensity dating. Geology 31, 749e752.
Briner, J.P., Bini, A.C., Anderson, R.S., 2009. Rapid early Holocene retreat ofa Laurentide outlet glacier through an Arctic fjord. Nature Geoscience 2,496e499.
Camerlenghi, A., Domack, E., Rebesco, M., Gilbert, R., Ishman, S., Leventer, A.,Brachfeld, S., Drake, A., 2001. Glacial morphology and post-glacial contourites innorthern Prince Gustav Channel (NW Weddell Sea, Antarctica). MarineGeophysical Researches 22, 417e443.
Canals, M., Urgeles, R., Calafat, A., 2000. Deep sea-floor evidence of past ice streamsoff the Antarctic Peninsula. Geology 28, 31e34.
Carbotte, S.M., Ryan, W.B.F., O’Hara, S., Arko, R., Goodwillie, A., Melkonian, A.,Weissel, R.A., Ferrini, V.L., 2007. Antarctic Multibeam Bathymetry andGeophysical Data Synthesis: An On-line Digital Data Resource for MarineGeoscience Research in the Southern Ocean. doi:10.3133/of2007-1047.srp002U.S. Geological Survey Open-File Report 2007-1047.
Ciais, P., Petit, J.R., Jouzel, J., Lorius, C., Barkov, N.I., Lipenkov, V., Nicolaiev, V., 1992.Evidence for an early Holocene climatic optimum in the Antarctic deep ice-corerecord. Climate Dynamics 6 (3e4), 169e177.
Ciais, P., Jouzel, J., Petit, J.R., Lipenkov, V., White, J.W.C., 1994. Holocene temperaturevariations inferred from six Antarctic ice cores. Annals of Glaciology 20,427e436.
Cook, A.J., Fox, A.J., Vaughan, D.G., Ferrigno, J.G., 2005. Retreating glacier fronts onthe Antarctic Peninsula over the last half century. Science 308, 541e544.
Domack, E.W., Ishman, S.E., Stein, A.B., McClennen, C.E., Jull, A.J.T., 1995. LateHolocene advance of the Müller Ice Shelf, Antarctic Peninsula: sedimentolog-ical, geochemical and palaeontological evidence. Antarctic Science 7 (2),159e170.
Domack, E., Duran, D., Leventer, A., Ishman, S., Doane, S., McCallum, S., Amblas, D.,Ring, J., Gilbert, R., Prentice, M., 2005. Stability of the Larsen B ice shelf on theAntarctic Peninsula during the Holocene epoch. Nature 436, 681e685.
Domack, E., Amblàs, D., Gilbert, R., Brachfeld, S., Camerlenghi, A., Rebesco, M.,Canals, M., Urgeles, R., 2006. Subglacial morphology and glacial evolution of thePalmer Deep outlet system, Antarctic Peninsula. Geomorphology 75, 125e142.
Evans, J., Pudsey, C.J., ÓCofaigh, C., Morris, P., Domack, E., 2005. Late Quaternaryglacial history, flow dynamics and sedimentation along the eastern marginof the Antarctic Peninsula Ice Sheet. Quaternary Science Reviews 24,741e774.
Graham, A.G.C., Larter, R.D., Gohl, K., Dowdeswell, J.A., Hillenbrand, C.-D., Smith, J.A.,Evans, J., Kuhn, G., Deen, T., 2010. Flow and retreat of the Late Quaternary PineIsland e Thwaites palaeo-ice stream, West Antarctica. Journal of GeophysicalResearch 115, F03025.
Gosse, J.C., Phillips, F.M., 2001. Terrestrial in situ cosmogenic nuclides: theory andapplication. Quaternary Science Reviews 20, 1475e1560.
Hambrey, M.J., Smellie, J.L., Nelson, A.E., Johnson, J.S., 2008. Late Cenozoic gla-cierevolcano interaction on James Ross Island and adjacent areas, AntarcticPeninsula region. Geological Society of America Bulletin 120 (5/6), 709e731.doi:10.1130/B26242.1.
Heroy, D.C., Anderson, J.B., 2005. Ice-sheet extent of the Antarctic Peninsula regionduring the Last Glacial Maximum (LGM)dInsights from glacial geomorphology.Geological Society of America Bulletin 117 (11/12), 1497e1512.
Heroy, D.C., Anderson, J.B., 2007. Radiocarbon constraints on Antarctic Peninsula IceSheet retreat following the Last Glacial Maximum (LGM). Quaternary ScienceReviews 26, 3286e3297.
Hjort, C., Ingólfsson, Ó, Möller, P., Lirio, J.M., 1997. Holocene glacial history and sea-level changes on James Ross Island, Antarctic Peninsula. Journal of QuaternaryScience 12 (4), 259e273.
Hodgson, D.A., Bentley, M.J., Roberts, S.J., Smith, J.A., Sugden, D.E., Domack, E.W.,2006. Examining Holocene Stability of Antarctic Peninsula Ice Shelves. EOSTransactions, AGU 87 (31), 305e308.
Hodgson, D.A., Roberts, S.J., Bentley, M.J., Smith, J.A., Johnson, J.S., Verleyen, E.,Vyverman, W., Hodson, A.J., Leng, M.J., Cziferszky, A., Fox, A.J., Sanderson, D.C.W.,2009. Exploring former subglacial Hodgson Lake, Antarctica. Paper I: sitedescription, geomorphology and limnology. Quaternary Science Reviews 28,2295e2309.
Hughes, T.J., 1987. Deluge II and the continent of doom: rising sea level andcollapsing Antarctic ice. Boreas 16, 89e100.
Ingólfsson, Ó, Hjort, C., Björck, S., Lewis Smith, R.I., 1992. Late Pleistocene andHolocene glacial history of James Ross Island, Antarctic Peninsula. Boreas 21,209e222.
Johnson, J.S., Bentley, M.J., Gohl, K., 2008. First exposure ages from theAmundsen Sea Embayment, West Antarctica: the Late Quaternary contextfor recent thinning of Pine Island, Smith, and Pope Glaciers. Geology 36 (3),223e226.
Johnson, J.S., Smellie, J.L., Nelson, A.E., Stuart, F.M., 2009. History of the AntarcticPeninsula Ice Sheet since the Early Pliocene e evidence from cosmogenic datingof Pliocene lavas on James Ross Island, Antarctica. Global and Planetary Change69, 205e213.
Jouzel, J., Masson-Delmotte, V., Cattani, O., Dreyfus, G., Falourd, S., Hoffmann, G.,Minster, B., Nouet, J., Barnola, J.M., Chappellaz, J., Fischer, H., Gallet, J.C.,Johnsen, S., Leuenberger, M., Loulergue, L., Luethi, D., Oerter, H., Parrenin, F.,Raisbeck, G., Raynaud, D., Schilt, A., Schwander, J., Selmo, E., Souchez, R.,Spahni, R., Stauffer, B., Steffensen, J.P., Stenni, B., Stocker, T.F., Tison, J.L.,Werner, M., Wolff, E.W., 2007. Orbital and millennial climate variability over thepast 800,000 years. Science 317, 793e796.
Kilfeather, A.A., Ó Cofaigh, C., Lloyd, J.M., Dowdeswell, J.A., Xu, S., Moreton, S.G.,2011. Ice stream retreat and ice shelf history in Marguerite Trough, AntarcticPeninsula: sedimentological and foraminiferal signatures. Geological Society ofAmerica Bulletin 123, 997e1015.
Lal, D., 1991. Cosmic ray labeling of erosion surfaces: in situ nuclide productionrates and erosion models. Earth and Planetary Science Letters 104 (2e4),424e439.
Larter, R.D., Vanneste, L.E., 1995. Relict subglacial deltas on the Antarctic Peninsulaouter shelf. Geology 23 (1), 33e36.
Mackintosh, A., White, D., Fink, D., Gore, D.B., Pickard, J., Fanning, P.C., 2007.Exposure ages frommountain dipsticks in Mac. Robertson Land, East Antarctica,indicate little change in ice-sheet thickness since the Last Glacial Maximum.Geology 35 (6), 551e554.
Masson, V., Vimeux, F., Jouzel, J., Morgan, V., Delmotte, M., Ciais, P., Hammer, C.,Johnsen, S., Lipenkov, V., Mosley-Thompson, E., Petit, J.R., Steig, E.J.,Stievenard, M., Vaikmae, R., 2000. Holocene climate variability in Antarcticabased on 11 ice-core isotopic records. Quaternary Research 54, 348e358.
Masson-Delmotte, V., Stenni, B., Jouzel, J., 2004. Common millennial-scale variabilityof Antarctic and Southern Ocean temperatures during the past 5000 yearsreconstructed from the EPICA Dome C ice core. The Holocene 14 (2), 145e151.
McCormac, F.G., Hogg, A.G., Blackwell, P.G., Buck, C.E., Higham, T.F.G., Reimer, P.J.,2004. SHCal04 Southern Hemisphere calibration 0e11.0 cal Kyr BP. Radiocarbon46, 1087e1092.
Michalchuk, B.R., Anderson, J.B., Wellner, J.S., Manley, P.L., Majewski, W., Boharty, S.,2009. Holocene climate and glacial history of the northeastern AntarcticPeninsula: the marine sedimentary record from a long SHALDRIL core.Quaternary Science Reviews 28, 3049e3065.
Nelson, A.E., Smellie, J.l., Hambrey, M.J., Williams, M., Vautravers, M., Salzmann, U.,McArthur, J.M., Regelous, M., 2009. Neogene glacigenic debris flows on JamesRoss Island, northern Antarctic Peninsula, and their implications for regionalclimate history. Quaternary Science Reviews 28, 3138e3160.
Nicholls, K.W., Pudsey, C.J., Morris, P., 2004. Summertime water masses off thenorthern Larsen C Ice Shelf, Antarctica. Geophysical Research Letters 31, L09309.
Nishiizumi, K., Imamura, M., Caffee, M.W., Southon, J.R., Finkel, R.C., McAninch, J.,2007. Absolute calibration of 10Be AMS standards. Nuclear Instruments andMethods in Physics Research B 258, 403e413.
Ó Cofaigh, C., Dowdeswell, J., Allen, C., Heimstra, J., Pudsey, C., Evans, J., Evans, D.,2005. Flow dynamics and till genesis associated with the marine basedAntarctic palaeo ice streams. Quaternary Science Reviews 24, 709e740.
Pope, P.G., Anderson, J.B., 1992. Late Quaternary glacial history of the northernAntarctic Peninsula’s western continental shelf: evidence from the marinerecord. In: Elliot, D.H. (Ed.), Contributions to Antarctic Research III. AntarcticResearch Series, vol. 57, pp. 63e91.
Pritchard, H.D., Arthern, R.J., Vaughan, D.G., Edwards, L.A., 2009. Extensive dynamicthinning on the margins of the Greenland and Antarctic ice sheets. Nature 461,971e975.
Pudsey, C.J., Barker, P.F., Larter, R.D., 1994. Ice sheets retreat from the AntarcticPeninsula shelf. Continental Shelf Research 14, 1647e1675.
Pudsey, C.J., Evans, J., 2001. First survey of Antarctic sub-ice shelf sediments revealsmid-Holocene ice shelf retreat. Geology 29 (9), 787e790.
Pudsey, C.J., Murray, J.W., Appleby, P., Evans, J., 2006. Ice shelf history from petro-graphic and foraminiferal evidence, Northeast Antarctic Peninsula. QuaternaryScience Reviews 25, 2357e2379.
Rabassa, J., 1983. Stratigraphy of the glacigenic deposits in northern James RossIsland, Antarctic Peninsula. In: Evenson, E., Schlüchter, C., Rabassa, J. (Eds.), Tillsand Related Deposits. A.A. Balkema Publishers, Rotterdam, pp. 329e340.
Reimer, P.J., Baillie, M.G.L., Bard, E., Bayliss, A., Beck, J.W., Blackwell, P.G., BronkRamsey, C., Buck, C.E., Burr, G.S., Edwards, R.L., Friedrich, M., Grootes, P.M.,Guilderson, T.P., Hajdas, I., Heaton, T.J., Hogg, A.G., Hughen, K.A., Kaiser, K.F.,Kromer, B., McCormac, F.G., Manning, S.W., Reimer, R.W., Richards, D.A.,Southon, J.R., Talamo, S., Turney, C.S.M., van der Plicht, J., Weyhenmeyer, C.E.,2009. IntCal09 and Marine09 radiocarbon age calibration curves, 0e50,000years cal BP. Radiocarbon 51 (4), 1111e1150.
Schoof, C., 2006. Marine ice-sheet dynamics. Part 1. The case of rapid sliding.Journal of Fluid Mechanics 573, 27e55.
Shevenell, A.E., Domack, E.W., Kernan, G.M., 1996. Record of Holocene paleoclimatechange along the Antarctic Peninsula: evidence from glacial marine sediments, Lal-lemand Fjord. Papers and Proceedings of the Royal Society of Tasmania 130, 55e64.
Smellie, J.L., Johnson, J.S., McIntosh, W.C., Esser, R., Gudmundsson, M.T., Hambrey, M.J.,vanWyk de Vries, B., 2008. Six million years of glacial history recorded in volcaniclithofacies of the James Ross Island Volcanic Group, Antarctic Peninsula. Palae-ogeography, Palaeoclimatology, Palaeoecology 260, 122e148.
Smith, J.A., Bentley, M.J., Hodgson, D.A., Roberts, S.J., Leng, M.J., Lloyd, J.M.,Barrett, M.J., Bryant, C., Sugden, D.E., 2007. Oceanic and atmospheric forcing of

J.S. Johnson et al. / Quaternary Science Reviews 30 (2011) 3791e38023802
early Holocene ice shelf retreat, George VI Ice Shelf, Antarctica Peninsula.Quaternary Science Reviews 26 (3e4), 500e516.
Smith, J.A., Hillenbrand, C.-D., Pudsey, C.J., Allen, C.S., Graham, A.G.C., 2010. Thepresence of polynyas in the Weddell Sea during the Last Glacial period withimplications for the reconstruction of sea-ice limits and ice sheet history. Earth& Planetary Science Letters 296, 287e298.
Sterken, M., Roberts, S.J., Hodgson, D.A., Vyverman, W., Balbo, A., Sabbe, K.,Moreton, S.G., Verleyen, E., 2009. Holocene glacial and climate history of PrinceGustav Channel, northeastern Antarctic Peninsula. Quaternary Science Reviews28, 3049e3065.
Stone, J.O., 2000. Air pressure and cosmogenic isotope production. Journal ofGeophysical Research 105, 23753e23759.
Stone, J.O., Balco, G.A., Sugden, D.E., Caffee, M.W., Sass, L.C., Cowdery, S.G.,Siddoway, C., 2003. Holocene deglaciation of Marie Byrd Land, West Antarctica.Science 299, 99e102.
Strelin, J.A., Malagnino, E.C., 1992. Geomorfología de la Isla James Ross. In:Rinaldi, C.A. (Ed.), Geología de la Isla James Ross, Antártida. Instituto AntárticoArgentine, Buenos Aires, pp. 7e36.
Strelin, J.A., Sone, T., Mori, J., Torielli, C.A., Nakamura, T., 2006. New datarelated to Holocene landform development and climatic change from JamesRoss Island, Antarctic Peninsula. In: Fütterer, D., Damaske, D.,Kleinschmidt, G., Miller, H., Tessensohn, F. (Eds.), Antarctica: Contributionsto Global Earth Sciences. Springer-Verlag, Berlin Heidelberg New York,pp. 455e460.
Stuiver, M., Reimer, P.J., 1993. Extended C-14 data-base and revised Calib 3.0 C-14age calibration program. Radiocarbon 35, 215e230.
Sugden, D.E., Bentley, M.J., Ó Cofaigh, C., 2006. Geological and geomorphologicalinsights into Antarctic ice sheet evolution. Philosophical Transactions of theRoyal Society A 364 (1844), 1607e1625.
Vaughan, D.G., Marshall, G.J., Connolley, W.M., King, J.C., Mulvaney, R., 2001. Devil inthe detail. Science 293, 1777e1779.
Zale, R., Karlén, W., 1989. Lake sediment cores from the Antarctic Peninsula andsurrounding Islands. Geografiska Annaler, Series A, Physical Geography 71 (3/4),211e220.
Zale, R., 1994. 14C age corrections in Antarctic Lake-sediments inferred fromgeochemistry. Radiocarbon 36, 173e185.


