Embed Size (px)
Citation preview

Homogenization of daily maximum temperature series
in the Mediterranean
Franz G. Kuglitsch,1,2 Andrea Toreti,1,2,3 Elena Xoplaki,1,2,4 Paul M. Della-Marta,5
Jurg Luterbacher,6 and Heinz Wanner1,2
Received 9 December 2008; revised 29 May 2009; accepted 10 June 2009; published 15 August 2009.
[1] Homogenization of atmospheric variables to detect and attribute past and presentclimate trends and to predict scenarios of future meteorological extreme events is a crucialissue for the reliability of analysis results. Here we present a quality control and newhomogenization method (PENHOM) based on a penalized log likelihood procedure and anonlinear model applied to 174 daily summer maximum temperature series in the GreaterMediterranean Region covering the last 50–100 years. The break detection methoddoes not rely on homogeneous reference stations and was chosen owing to the lack ofmetadata available. The correction procedure allows the higher-order moments of thecandidate distribution to be corrected, which is important if the homogenized series are tobe used to quantify temperature extremes. Both procedures require a set of highlycorrelated neighboring stations to correct climate series reliably. After carrying out thehomogeneity procedure, 84% of all time series were found to contain at least one artificialbreakpoint. Time series of the eastern Mediterranean (one breakpoint in 24 years onaverage) show significantly more breakpoints than do series of the Western Basin (onebreakpoint in 36 years on average). The mean adjustment (standard error) of all dailysummer maximum temperatures is +0.03�C (±0.38�C) for the western Mediterranean,+0.16�C (±0.52�C) for the central Mediterranean, and +0.19�C (±0.30�C) for the easternMediterranean, indicating a reduced increase in mean summer daytime temperaturecompared to that detected by analyzing raw data. The adjustments for higher-ordermoments were not uniform. Most significant mean changes due to homogenization weredetected for both: the hottest (+0.15�C ± 0.66�C) and coldest decile (�0.83�C ± 1.28�C)compared to the raw data in the central Mediterranean. This study demonstrates thathomogenization of daily temperature data is necessary before any analysis of temperature-related extreme events such as heat waves, cold spells, and their impacts on human health,agriculture, and ecosystems can be studied.
Citation: Kuglitsch, F. G., A. Toreti, E. Xoplaki, P. M. Della-Marta, J. Luterbacher, and H. Wanner (2009), Homogenization of daily
maximum temperature series in the Mediterranean, J. Geophys. Res., 114, D15108, doi:10.1029/2008JD011606.
1. Introduction
[2] The current climate change debate requires a detailedanalysis of long instrumental series and a quantification ofnatural and anthropogenic impacts in climate data [e.g.,
Alexandersson and Moberg, 1997; Vincent et al., 2002;Caussinus and Mestre, 2004; Intergovernmental Panel onClimate Change (IPCC), 2007]. Instrumental data sets areof major interest since they are the basis for analyzing pastand present climate changes and a fundamental aspect ofmodeling future climate scenarios.[3] However, many studies have shown that most climate
series are characterized by artificial breakpoints that have tobe corrected [e.g., Peterson et al., 1998; Szentimrey, 1999;Gonzalez-Rouco et al., 2001; Cocheo and Camuffo, 2002;Maugeri et al., 2002; Brandsma and Konnen, 2006; Della-Marta and Wanner, 2006]. Usually, these breakpoints areintroduced by changes in measurement conditions, reloca-tion of weather stations, land-use changes, new instrumen-tation or changes in observational hours among others[Peterson et al., 1998; Aguilar et al., 2003]. In general,these changes are not documented by metadata or themetadata are difficult to access in archives. Statisticalhomogenization procedures have been developed for
JOURNAL OF GEOPHYSICAL RESEARCH, VOL. 114, D15108, doi:10.1029/2008JD011606, 2009ClickHere
for
FullArticle
1Oeschger Centre for Climate Change Research, University of Bern,Bern, Switzerland.
2Climatology and Meteorology Group, Institute of Geography,University of Bern, Bern, Switzerland.
3Istituto Superiore per la Protezione e la Ricerca Ambientale, Rome,Italy.
4Energy, Environment, and Water Research Center, The CyprusInstitute, Nicosia, Cyprus.
5Federal Office for Meteorology and Climatology, MeteoSwiss, Zurich,Switzerland.
6Climatology, Climate Dynamics, and Climate Change Section,Department of Geography, Justus-Liebig University of Giessen, Giessen,Germany.
Copyright 2009 by the American Geophysical Union.0148-0227/09/2008JD011606$09.00
D15108 1 of 16

detecting and adjusting such inhomogeneities on varioustemporal scales. Most approaches have been developed forhomogenizing monthly and annual mean series [e.g.,Caussinus and Lyazrhi, 1997; Vincent, 1998; Szentimrey,1999; Wang, 2003; Caussinus and Mestre, 2004] andapplied to regional studies in Europe [e.g., Caussinus andMestre, 2004; Auer et al., 2005; Begert et al., 2005; Brunettiet al., 2006; Auer et al., 2007; Toreti and Desiato, 2008],North America [e.g., Zhang et al., 2000] and Australia [e.g.,Della-Marta et al., 2004]. The extensive use of monthlydata can be explained mainly by their accessibility in digitalform [e.g., Aguilar et al., 2003; Della-Marta et al., 2004].[4] While the methods used to homogenize monthly and
annual data are well established, only a limited number ofpublications address the challenge of daily temperature datacorrection and of other spatially highly correlated climateparameters [e.g., Demaree et al., 2002; Maugeri et al.,2002; Vincent et al., 2002; Brandsma and Konnen, 2006;Brunet et al., 2006]. In general these techniques use highlycorrelated neighboring station series to correct candidatestation values and are therefore applicable only in areas withhigh station density. However, all of these methods are onlyable to homogenize inhomogeneities which affect the first-order moment of a distribution function, the mean, and donot correct higher-order moments such as the variance andskewness properties of a distribution function. The onlyreliable method to homogenize all moments of dailyextremes and averages was proposed by Trewin and Trevitt[1996] and improved by Della-Marta and Wanner [2006] touse any reference station rather than relying on simulta-neous measurement data. In an application of their method,Della-Marta et al. [2007a] homogenized 25 long-term dailymaximum temperature series over Europe. All above men-tioned studies conclude that the required adjustments oftenhave a similar magnitude as the climate signal, long-termclimate variations, trends or cycles. Hence, climate datahomogenization is necessary for all climate studies based oninstrumental data.[5] Climate change detection has moved away from doc-
umentation of changes in monthly and annual averages to befocused now on the analysis of extreme events (e.g., heatwaves, droughts, floods, and storms) [Frich et al., 2002; Stottet al., 2004; Alexander et al., 2006; Hegerl et al., 2006;Della-Marta et al., 2007b; Founda and Giannakopoulos,2009]. Therefore a continuous development of daily datahomogenization methods and its large-scale application isrequired. To meet these demands, this study (1) proposesan improved homogenization method based on well-established models [Caussinus andMestre, 2004;Della-Martaand Wanner, 2006] for the detection and the correction ofartificial breakpoints in long daily climate series and(2) applies the new method to 174 daily maximum temper-ature series in the Greater Mediterranean Region (GMR).[6] The Mediterranean area is regarded as a ‘‘Hot Spot’’
of climate change [Giorgi, 2006; Diffenbaugh et al., 2007]that suffers from more extreme temperature events, anincrease of summer heat wave frequency and duration inthe western parts [e.g., Della-Marta et al., 2007b] and risingsummer temperature variability [Xoplaki et al., 2003, 2006;Jones et al., 2008] combined with a decrease in waterresources having a unprecedented impact on ecology, econ-omy and society [IPCC, 2007].
[7] The strength of this homogenization approach is in itsability (1) to detect an unknown number of nondocumentedbreakpoints in a candidate station by using a dynamicprogramming algorithm based on mean annual maximumtemperatures of its 10 highest correlated neighboring stationsand (2) to correct daily extremes and averages using highlycorrelated and piecewise-homogeneous neighboring stations.Since the spatial correlation is highest for daily summer(JJAS) maximum temperature series a homogenization ofthese series is most reliable. The investigation of dailysummer maximum temperature extremes, the appearance ofheat waves and its stressful impacts on society and economy,agriculture and the environment is a major concern of futureresearch activities and needs further attention [e.g., Benistonet al., 2007; Diffenbaugh et al., 2007; Brown et al., 2008;Fang et al., 2008; Founda and Giannakopoulos, 2009].[8] Unfortunately, there are only a couple of studies
dealing with temperature and precipitation extremes in partsof the GMR based on nonhomogenized data [e.g., Alpert etal., 2002; Kostopoulou and Jones, 2005; Moberg andJones, 2005; Moberg et al., 2006]. Brunet et al. [2007]and Della-Marta et al. [2007b] were the first who analyzedhomogenized summer daily temperature data in WesternEurope including the Iberian Peninsula. Della-Marta et al.[2007b] found that over the period 1880–2005 the length ofsummer heat waves over Western Europe has doubled andthe frequency of hot days has almost tripled and wasaccompanied by an increase in the variance of dailymaximum temperature. Despite the very long and richhistory in monitoring climatic parameters in most parts ofthe Mediterranean, no climate studies based on homoge-nized daily data have been performed for the detection ofextreme events in the entire Mediterranean area.[9] In order to answer vital questions regarding climate
change, extreme events and their impacts in the Mediterra-nean, National Meteorological and Hydrological Services(NMHSs), the European Climate Assessment & Data set(ECA&D; eca.knmi.nl) [Klein Tank et al., 2002], privatelyfunded projects (e.g., IEDRO, http://www.iedro.com) andcollaborative projects of the WMO and the European Unionhave put great effort in building up a homogenized climatedatabase in the GMR. Ongoing international projects deal-ing with (1) climate data rescue, (2) homogenization issues,(3) the attribution of present climate trends, (4) the analysisof extreme events, and (5) their impacts on ecology,economy, and the societies of the Mediterranean environ-ment are the WMO–Initiative on Mediterranean ClimateData Rescue (WMO-MEDARE initiative [Brunet andKuglitsch, 2008], www.omm.urv.cat/MEDARE/index.html)and the integrated EU-IP CIRCE project on Climate Changeand Impact Research: The Mediterranean Environment(www.circeproject.eu), which was initiated in 2007. A strongcollaboration with these projects and the development of anew homogenization technique enabled us to build up acomprehensive quality controlled and homogenized dailymaximum temperature (TX) database including 174 sitesfrom 16 countries along the GMR covering the last decades.
2. Data and Methods
[10] The daily data used in this study consist of dailysummer (JJAS) maximum temperature time series (TX)
D15108 KUGLITSCH ET AL.: HOMOGENIZATION OF DAILY TEMPERATURE DATA
2 of 16
D15108
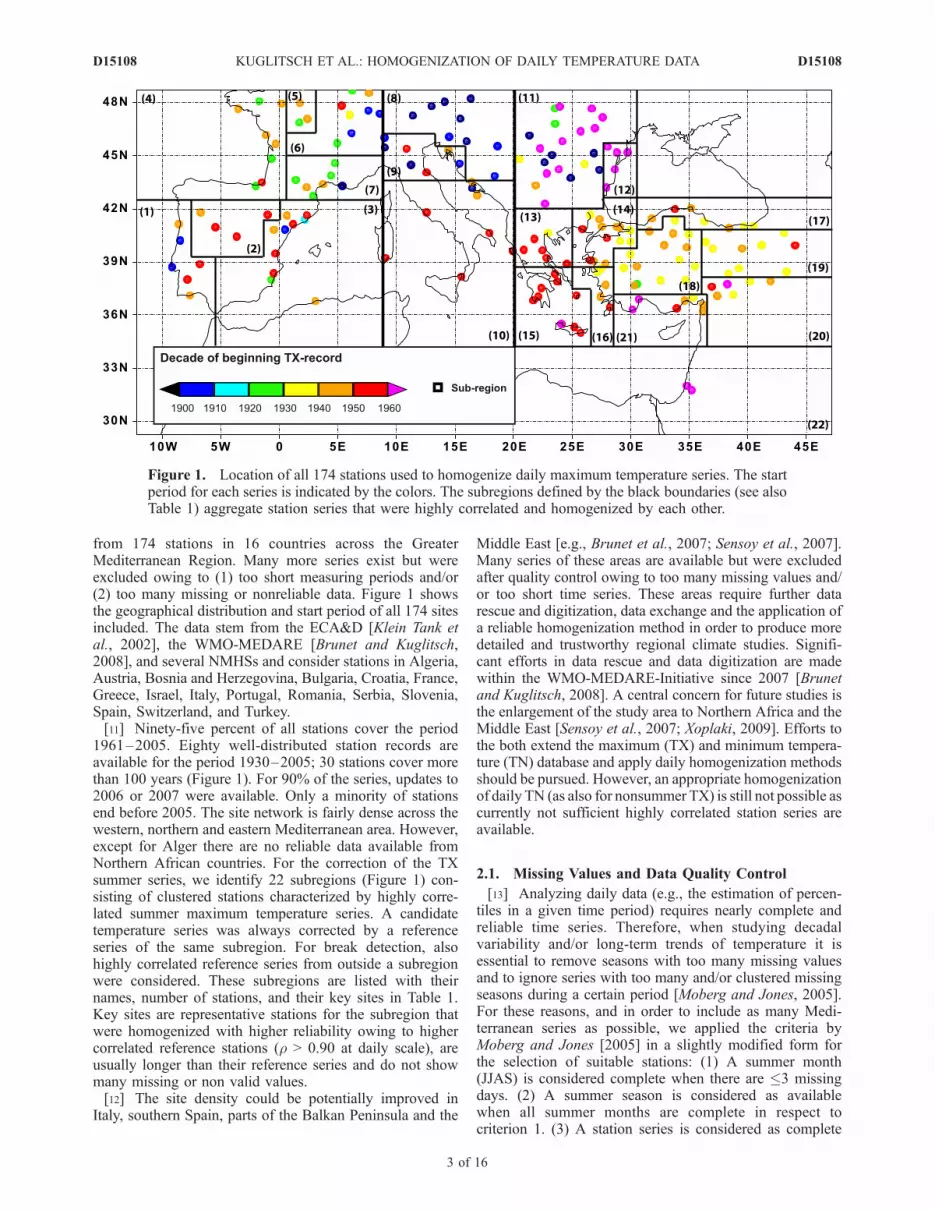
from 174 stations in 16 countries across the GreaterMediterranean Region. Many more series exist but wereexcluded owing to (1) too short measuring periods and/or(2) too many missing or nonreliable data. Figure 1 showsthe geographical distribution and start period of all 174 sitesincluded. The data stem from the ECA&D [Klein Tank etal., 2002], the WMO-MEDARE [Brunet and Kuglitsch,2008], and several NMHSs and consider stations in Algeria,Austria, Bosnia and Herzegovina, Bulgaria, Croatia, France,Greece, Israel, Italy, Portugal, Romania, Serbia, Slovenia,Spain, Switzerland, and Turkey.[11] Ninety-five percent of all stations cover the period
1961–2005. Eighty well-distributed station records areavailable for the period 1930–2005; 30 stations cover morethan 100 years (Figure 1). For 90% of the series, updates to2006 or 2007 were available. Only a minority of stationsend before 2005. The site network is fairly dense across thewestern, northern and eastern Mediterranean area. However,except for Alger there are no reliable data available fromNorthern African countries. For the correction of the TXsummer series, we identify 22 subregions (Figure 1) con-sisting of clustered stations characterized by highly corre-lated summer maximum temperature series. A candidatetemperature series was always corrected by a referenceseries of the same subregion. For break detection, alsohighly correlated reference series from outside a subregionwere considered. These subregions are listed with theirnames, number of stations, and their key sites in Table 1.Key sites are representative stations for the subregion thatwere homogenized with higher reliability owing to highercorrelated reference stations (r > 0.90 at daily scale), areusually longer than their reference series and do not showmany missing or non valid values.[12] The site density could be potentially improved in
Italy, southern Spain, parts of the Balkan Peninsula and the
Middle East [e.g., Brunet et al., 2007; Sensoy et al., 2007].Many series of these areas are available but were excludedafter quality control owing to too many missing values and/or too short time series. These areas require further datarescue and digitization, data exchange and the application ofa reliable homogenization method in order to produce moredetailed and trustworthy regional climate studies. Signifi-cant efforts in data rescue and data digitization are madewithin the WMO-MEDARE-Initiative since 2007 [Brunetand Kuglitsch, 2008]. A central concern for future studies isthe enlargement of the study area to Northern Africa and theMiddle East [Sensoy et al., 2007; Xoplaki, 2009]. Efforts tothe both extend the maximum (TX) and minimum tempera-ture (TN) database and apply daily homogenization methodsshould be pursued. However, an appropriate homogenizationof daily TN (as also for nonsummer TX) is still not possible ascurrently not sufficient highly correlated station series areavailable.
2.1. Missing Values and Data Quality Control
[13] Analyzing daily data (e.g., the estimation of percen-tiles in a given time period) requires nearly complete andreliable time series. Therefore, when studying decadalvariability and/or long-term trends of temperature it isessential to remove seasons with too many missing valuesand to ignore series with too many and/or clustered missingseasons during a certain period [Moberg and Jones, 2005].For these reasons, and in order to include as many Medi-terranean series as possible, we applied the criteria byMoberg and Jones [2005] in a slightly modified form forthe selection of suitable stations: (1) A summer month(JJAS) is considered complete when there are �3 missingdays. (2) A summer season is considered as availablewhen all summer months are complete in respect tocriterion 1. (3) A station series is considered as complete
Figure 1. Location of all 174 stations used to homogenize daily maximum temperature series. The startperiod for each series is indicated by the colors. The subregions defined by the black boundaries (see alsoTable 1) aggregate station series that were highly correlated and homogenized by each other.
D15108 KUGLITSCH ET AL.: HOMOGENIZATION OF DAILY TEMPERATURE DATA
3 of 16
D15108

when no more than three consecutive summer seasons aremissing.[14] This results in the inclusion of approximately 20%
more series than when only allowing two missing values permonth. Beside the selection of time series in terms ofmissing values, detailed analyses of the daily data qualityare an essential task before undertaking any homogeneityassessment and further data analysis. Therefore a completedata quality assessment on the full TX database recommen-ded by Aguilar et al. [2003] was undertaken to identifysuspicious values and outliers.[15] The TX series were checked for consistency, tolerance,
and temporal coherency. TX values exceeding (1) 50.0�C,(2) ± 4 standard deviations (s) of the full length of therespective station series, and (3) a difference of 25�Cbetween consecutive observations were replaced by missingvalues. Further, four or more equal consecutive values in arow were removed, and the number of days for each monthwas checked again for consistency. After applying thesecriteria to the whole data set we found the most commoncomplete time period from 1962 and 1991 (for 174 stations)showing amaximumof 3missing years. Therefore, this 30-yearperiod rather than the climatological standard-normal period(1961–1990 or 1971–2000 [Scherrer et al., 2006]) has beenused as the base period for the data homogenization.
2.2. Daily Data Homogenization
[16] A combined application of the penalized log like-lihood procedure of Caussinus and Mestre [2004] and thenonlinear modeling method of Della-Marta and Wanner[2006] is used to detect an unknown number of breakpointsand for the correction of the time series respectively. Thisapproach allows a reliable homogenization of long daily
maximum temperature measurements even when high-quality metadata that provide information on possiblebreakpoints (inhomogeneities) is limited or not available.However, both methods are based on highly correlated(r > 0.8) neighboring stations and usually allow a reliablehomogenization only for regions with high site density andsimilar climate conditions. The minimum density dependson geographical features and generally has to be higherin continental areas than in coastal areas owing to typicaldecorrelation length scales. We call this new homogeniza-tion technique PENHOM. Within this study, PENHOMwas applied to a Mediterranean daily summer maximumtemperature database.[17] In sections 2.2.1–2.2.3 we detail the break detection,
break correction and the rebreak detection part of thePENHOM method. The method is illustrated by its applica-tion to the inhomogeneous daily maximum summer temper-ature series from Kutahya, Turkey. This temperature series isone of the longest (1930–2006) in western Anatolia. Itshows only one missing day in 77 years and is highlycorrelated to many reference series in western Turkey.
2.2.1. Break Detection[18] The Caussinus-Mestre method [Caussinus and
Mestre, 2004] applied in this study accounts for the detec-tion of an unknown number of multiple breakpoints in meanannual TX difference series on the basis of the followingequation:
CKðY Þ ¼ ln 1�
Xkþ1
j¼1
njðY j � Y Þ2
Xni¼1
ðYi � Y Þ2
8>>>><>>>>:
9>>>>=>>>>;
þ 2k
n� 1lnðnÞ; ð1Þ
Table 1. Subregions Used in the Analysis
Subregion Number of Stations Key Site (Length of TX Series)
Western MediterraneanSouthAtlantic 6 Lisbon, Portugal (1901–2007)Continental 4 Salamanca, Spain (1950–2007)Mediterranean 10 Valencia, Spain (1950–2007)
NorthAtlantic 8 San Sebastian, Spain (1929–2007)Central 5 Deols Chateauroux, France (1921–2007)Continental 8 Geneva, Switzerland (1901–2007)Mediterranean 7 Montelimar, France (1925–2007)
Central MediterraneanContinental 9 Graz, Austria (1894–2004)North 7 Verona, Italy (1951–2007)South 7 Brindisi, Italy (1951–2007)
Eastern MediterraneanNorthContinental 20 Bucharest, Romania (1930–2005)Black Sea West 5 Constanta, Romania (1961–2005)
EastNorthwestern Aegean 6 Larissa, Greece (1955–2007)
Northeastern Aegean and Marmara region 12 Bursa, Turkey (1931–2006)Southwestern Aegean 9 Hellinikon, Greece (1955–2007)Southeastern Aegean 5 Manisa, Turkey (1930–2006)Turkey–Black Sea 7 Sinop (1943–2006)Turkey–Western Anatolia 15 Kutahya (1930–2006)Turkey–Eastern Anatolia 9 Erzurum (1930–2006)Turkey–Southeastern Anatolia 6 Diyarbakir (1930–2006)Turkey–Mediterranean 7 Antalya (1963–2006)Israel 2 Jerusalem (1964–2004)
D15108 KUGLITSCH ET AL.: HOMOGENIZATION OF DAILY TEMPERATURE DATA
4 of 16
D15108

where n is the number of observations, bar denotes the meanvalue over the entire period (i.e., using all the n observations),k denotes the number of possible breakpoints located at{t1,. . ., tk}, nj is the number of observations within thehomogeneous subperiod [tj�1, tj], and Y j is the mean of theseries in that subperiod. The selected set K* (i.e., our detectedbreakpoints) should satisfy: arg minK{CK(Y)}.[19] These assumptions allow a reliable detection of
breakpoints in long climate series even if they are notaccompanied with metadata that provide information onpotential breakpoints. It is assumed that between two break-points, a time series is homogeneous. Consequently, eachtime series consists of a number (�1) of several Homoge-neous Subperiods (HSPs). HSP1 is always the latest sub-period of a time series.[20] Each single mean annual TX series (candidate station)
is compared to its ten highest correlated neighboring series(reference stations) by producing difference series betweenthe candidate and its references. Note that a reference stationused in this step could be a station outside of the subregionsshown in Figure 1. These difference series are tested fordiscontinuities according to equation (1). Years of break-points are assumed to be valid if three or more breakpointsare detected throughout the set of comparisons of a candi-date station with its neighbors within two consecutive years.It there happens to be a clustering of break-detected pointsin several years close together then the year which containsthe highest number of breakpoints in this cluster is chosen
as the breakpoint year. The break detection methodologyis based on mean annual TX values since artificial shiftsare more reliably detected in annual means than inmonthly or daily time series [Easterling and Peterson,1995; Alexandersson and Moberg, 1997; Vincent, 1998;Caussinus and Mestre, 2004]. The use of standardizeddifference series based on seasonal values usually givescomparable results. However, we avoided making any apriori assumptions on the reliability of HOM procedure (seethe work of Della-Marta and Wanner [2006] for details).Indeed, where station densities are high, a reliable correc-tion was also possible for May and/or October. However,we want to use a common and reliable methodology for thewhole area, therefore we restricted our analysis to thesummer season (JJAS). The correlation coefficient is calcu-lated for the 30-year period 1962–1991 (for details, seesection 2.1).[21] The breakpoints detected in the difference series
between Kutahya and its 10 highest correlated neighboringstations are summarized in Figure 2. The alignment of thebreakpoints indicates at least three breakpoints in 1966,1978, and 1984. We assumed these breakpoints are trust-worthy even when a confirmation of the breakpointsdetected with supplementary metadata was not possible.2.2.2. Break Correction[22] After break detection, the Higher-Order Moments
(HOM) method of Della-Marta and Wanner [2006] wasapplied to adjust the breakpoints in the daily maximum
Figure 2. Synthesis of the detected breakpoints in the Kutahya series (raw data). The stations areordered from bottom to top with respect to decreasing values of correlation. Hence the reliability of thecomparisons increases from top to bottom. The red dots show the position of the detected breakpoints inthe difference series for Kutahya (Turkey) versus the other stations in Turkey. The red-highlighted yearsindicate the chosen breakpoint years.
D15108 KUGLITSCH ET AL.: HOMOGENIZATION OF DAILY TEMPERATURE DATA
5 of 16
D15108

temperature series. This method is based on a nonlinearmodel to estimate the relationship between a candidatestation and a highly correlated (r > 0.8 at daily scale)reference station. However, this reference series should notshow any breakpoints in the same years as the candidate as
well as 3 years before and after to get long enough over-lapping periods [Della-Marta and Wanner, 2006]. TheHOM method is applied to each month separately, thereforethe minimum of 3 years of reference data either side of thebreakpoint equals a minimum of approximately 90 dailyvalues to be used in each nonlinear model. In some cases itis possible that a reliable homogenization using one refer-ence station is only possible for some HSPs but not for thewhole candidate time series owing to short overlappingperiods. In this case, one should use a combination of morethan one reference series [Della-Marta and Wanner, 2006]which was applied to a couple of stations in Turkey andSpain (see Figures 10a–10c). To correct the Kutahya serieswe used the maximum temperatures from Ankara as areference. This was possible since (1) the summer TX ofAnkara is highly correlated to Kutahya (r = 0.95), (2) thesummer TX of Ankara only shows one breakpoint, and(3) HSP2 of Ankara adequately overlaps all HSPs of thecandidate. In contrast, the highest correlated neighboringstation, Afyon (r = 0.97), shows a breakpoint in the sameyear as the candidate (1966) and is therefore not suitable tohomogenize the entire Kutahya series. However, it is alsopossible to correct the first and second HSPs of Kutahyausing reference data from Afyon and reference data fromAnkara for correcting the third and fourth HSPs (seeFigure 3). There were, however, no significant changesdetected after correcting the candidate series using eitherone or a combination of two references (not shown). Aschematic overview of how to select an appropriate refer-ence series for correction is shown in Figure 3.[23] After this we fitted a nonlinear locally weighted
regression (LOESS) [Cleveland and Devlin, 1988] to esti-mate the relationship between the candidate (response, yi)and the reference (predictor, xi) before the inhomogeneity(i.e., in the period of common overlap within HSP1 of thecandidate; see Figure 3). The smoothing model is given by
yi ¼ gðxiÞ þ ei; ð2Þ
where g is the regression function, i is the ith observationfrom 1 to Nmod (the total number of observations), and ei are
Figure 3. Schematic overview of the candidate (Kutahya,Turkey), its highest correlated reference series (Afyon,Turkey), and the reference series used (Ankara, Turkey) forcorrection due to the distribution of detected breakpoints.The periods between the detected breakpoints (HSP1-n) areassumed to be homogeneous. Only the highest correlatedreference series (>0.8) are qualified for a reliable homo-genization procedure.
Figure 4. The relationship between Kutahya and the reference station Ankara before (gray circles) andafter (gray crosses) with a locally weighted regression (LOESS)-fitted curve before (solid black curve)and after (dashed black curve) each inhomogeneity in HSP1 and (a) HSP2, (b) HSP3, and (c) HSP4 forJuly. The thin black line in each plot has a slope of 1 for comparison reasons.
D15108 KUGLITSCH ET AL.: HOMOGENIZATION OF DAILY TEMPERATURE DATA
6 of 16
D15108

the random errors. A number of parameters control theregression function g: These are the smoothing parameter,a (a = 3), the degree of the local fitted polynomial l (l = 2)and the Gaussian distribution of random errors. Sometimesthese parameters were altered for individual stations to limitthe amount of overfitting of the nonlinear models. See thework of Della-Marta and Wanner [2006] for more detailson parameter settings and their sensitivity.[24] Figure 4a shows the relationship of the candidate
(Kutahya) versus the reference (Ankara) and the LOESS-fitted function for HSP1 (Figure 4a, solid black curve) andHSP2 (Figure 4a, dashed black curve) as an example forJuly. The other summer months show a very similar pattern(not shown). After correcting HSP2, this subperiod ismerged with HSP1.[25] Figures 4b and 4c present the same for the subperiod
HSP1 and HSP3, and HSP1 and HSP4, respectively. Thefitted curves are almost parallel in Figures 4a and 4b withthe dashed black curve below the solid black curve onaverage, indicating that the response of the temperatures inHSP2–3 to the reference temperature are on average lowerthan in HSP1. Only the lowest temperatures in HSP2 are onaverage higher than in HSP1. In HSP4 (Figure 4c) wedetected higher values for the majority of the records exceptfor the upper and lower tail of the temperature distribution.
[26] The model shows (Figures 4a–4c) that before andafter the inhomogeneities the overall corrections are small(on the order of 0.1–0.3�C). The model (e.g., Figure 4a,solid black line) was then used to estimate the observationsat the candidate after the first inhomogeneity (i.e., Figure 3,in HSP2 of Kutahya) given homogeneous observationsfrom the reference. The differences between the observedinhomogeneous values of the candidate (HSP2) and themodel-fitted values after the inhomogeneity were binnedaccording to which decile the model-fitted values wereplaced in the candidate observed cumulative distributionfunction (CDF), defined using the homogeneous temper-atures before the inhomogeneity. The CDF was fitted bycomparing the goodness of fit statistics of six distributions(Kolmogorov-Smirnov test). By comparing the July-CDF ofthe candidate in HSP1 and HSP2 (Figure 5a) using thegeneralized extreme value distribution (GEV), it is apparentthat the dashed black curve CDF is on average cooler thanthe solid black curve CDF.[27] The adjustments for Kutahya (Figure 6a) indicate
that for HSP2 the largest shift in the mean of approximately0.8�C is needed for decile 6, but also a change in skewnessis required by making decile 1 less extreme by up to 0.8�Cand decile 10 more extreme by 0.2�C in HSP2. After thisstep we fitted a LOESS function to the binned decile
Figure 5. The fitted and sampled CDF before (solid black curve, gray dots) and after (dashed blackcurve, gray crosses) each inhomogeneity in Kutahya, July, using the generalized extreme valuedistribution: (a) HSP1 and HSP2, (b) HSP1 and HSP3, and (c) HSP1 and HSP4.
Figure 6. The smoothed adjustments (�C) for each decile in Kutahya, July, shown as a solid black curvefitted using a LOESS function for (a) HSP2, (b) HSP3, and (c) HSP4. The box plots indicate the mean ofthe binned differences (black line), the interquartile range (shaded area), 1.5 times the interquartile range(dashed black line), and outliers (black dots). The width of the box indicates the relative number ofobservations in each. The dashed black curves show the 95% confidence interval of the fitted curve.
D15108 KUGLITSCH ET AL.: HOMOGENIZATION OF DAILY TEMPERATURE DATA
7 of 16
D15108

adjustments to obtain a smoothly varying set of adjustmentsbetween each decile. The mean of the adjustments given bythe LOESS fit calculated over all deciles and all breakpointsis +0.14�C.[28] Figure 7 compares the July averaged daily maximum
temperature series using PENHOM method with the non-homogenized July averaged raw series. It is apparent thatthe series between 1966 and 1984 has been made slightlycooler (�0.2�C on average) while the series between 1930and 1966 has been made slightly warmer (+0.2�C onaverage) after PENHOM was applied. The mean adjustmentof the coldest and warmest 10% of the temperature distri-
bution was +0.16�C and +0.29�C, respectively. For thisseries the overall trend of July temperatures has not changedover the last 78 years (1930–2007) after homogenization.
2.2.3. Rebreak Detection[29] After the correction of all breakpoint inhomogenei-
ties, each of the homogenized candidate series is testedagain for breakpoints using the methods described insection 2.2.1. This process uses the same reference seriesas used in the first application of PENHOM. The reanalysisof the homogenized Kutahya series shows few remainingand no more clustered breakpoints within two consecutiveyears (see Figure 8). Hence, we assume the Kutahya series
Figure 7. A comparison of the July monthly averaged daily Kutahya inhomogeneous time series(dashed gray curve) and the homogenized time series using PENHOM (solid black curve). Black verticallines characterize the breakpoints detected and boundaries between the HSPs.
Figure 8. Synthesis of the detected breakpoints in the corrected Kutahya series (see Figure 2 for details)after the first correction.
D15108 KUGLITSCH ET AL.: HOMOGENIZATION OF DAILY TEMPERATURE DATA
8 of 16
D15108

to be homogeneous. The single remaining breakpoints indifferent years are considered not to be reliable, and theymight indicate (1) erroneous shifts of minimal size and/or(2) an effect of breakpoints in the reference series. Anexclusion of them is needed to get long enough homoge-neous subperiods and overlapping periods allowing a reliablecorrection.[30] The break detection for many other series was not as
clear as shown for Kutahya and often needed the inclusionof additional breakpoints after the first application ofdetection/correction. Taking the corrected series from thefirst application of the detection/correction we applied thedetection method again. If we found additional breakpoints(using the criteria above) we considered them and correctedthe raw series with this additional info and so on. Thesesteps were repeated until no more clustered breakpointswere detected among the difference series. Typically, thisprocedure did not exceed four iterations.
3. Results and Discussion
[31] PENHOM has been applied to 240 daily summermaximum temperature series and gives reliable results for174 series across the GMR. The need for highly correlatedreference series means that our homogenization procedureproduces the most reliable correction of TX in coastal areasand plains for the summer season (JJAS). 60 station serieswere excluded after application of PENHOM owing to(1) too many breakpoints detected (i.e., too short over-lapping periods) and/or (2) the absence of highly correlatedreference series either for breakpoint detection or breakpointcorrection.[32] Figure 9 summarizes the number of breakpoints
detected for all 174 temperature series. In 22% of the seriesone breakpoint was found, in 47% of the series two to threebreakpoints, in 23% of the series four to five breakpointsand in 2% of the series more than five breakpoints wereidentified. The western (one breakpoint in 36 years) and
central Mediterranean sites (one breakpoint in 34 years)show significantly less breakpoints per decade than easternMediterranean ones (one breakpoint in 24 years). Only 28out of 174 original series (equals 16%) can be considered ashomogeneous. Most of them are located in southern Turkey(7 series), in Greece (5 stations), the northern Balkan(5 series) and in the Iberian Peninsula (5 series) and areoften not longer than 50 years.[33] Figure 10 shows the mean adjustments applied to all
daily summer maximum temperature data (Figure 10a), thehighest 10% of the summer maximum temperature distri-bution (Figure 10b), and the lowest 10% of the summermaximum temperature distribution (Figure 10c) for allrecords homogenized. Owing to a unique history of eachsite there is no uniform trend of the adjustments overlarge areas of the Mediterranean detectable. However, thepattern of adjustments is more homogeneous over Anatolia,Romania and some smaller areas in the western Mediterra-nean. The following summary excludes Austrian and Swisstime series owing to a different pattern compared to moresoutherly located areas.[34] The mean adjustment of all daily summer maximum
data is +0.03�C (±0.38�C; standard error) for the westernMediterranean, +0.16�C (±0.52�C) for the central Mediter-ranean, and +0.19�C (±0.30�C) for the eastern Mediterra-nean, indicating a reduced increase in summer daytimetemperature than assumed by analyzing raw data. 113 outof 174 stations show mean adjustments between �0.25�Cand +0.25�C. Only six stations were corrected by more than1.0�C (Lastovo, Croatia; Cagliari, Italy; Vila Seca, Spain;Lugano and Zurich, Switzerland; Trabzon, Turkey). Themean adjustments of the warmest decile show quite conser-vative values of�0.02�C (±0.56�C) and�0.05�C (±0.40�C)for the western and eastern Mediterranean, respectively.Mean positive adjustments of +0.15�C (±0.66�C) indicate areduced increase of hottest summer maximum temperaturesin the central Mediterranean. 98 out of 174 stations showmean adjustment between �0.25�C and +0.25�C. Sixteen
Figure 9. The number of breakpoints detected for each series indicated by color.
D15108 KUGLITSCH ET AL.: HOMOGENIZATION OF DAILY TEMPERATURE DATA
9 of 16
D15108
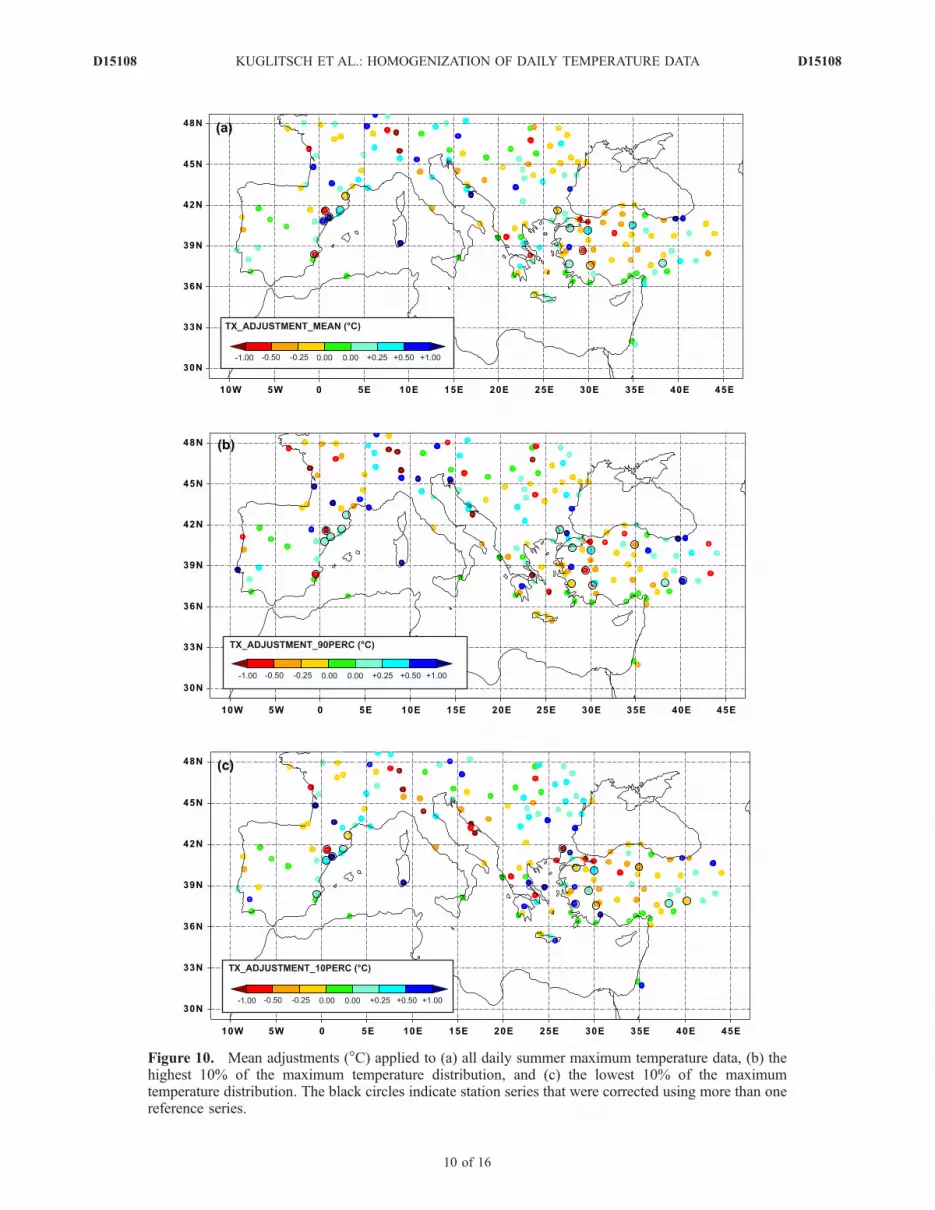
Figure 10. Mean adjustments (�C) applied to (a) all daily summer maximum temperature data, (b) thehighest 10% of the maximum temperature distribution, and (c) the lowest 10% of the maximumtemperature distribution. The black circles indicate station series that were corrected using more than onereference series.
D15108 KUGLITSCH ET AL.: HOMOGENIZATION OF DAILY TEMPERATURE DATA
10 of 16
D15108

stations were corrected by more than 1.0�C. The adjustmentsof the coldest decile are between +0.11�C (±0.47�C),�0.05�C (±0.60�C) and �0.83�C (±1.28�C) in the western,eastern, and central Mediterranean, respectively. Also here,98 out of 174 stations (56%) show mean adjustment between�0.25�C and +0.25�C. Fifteen stations were corrected bymore than 1.0�C.[35] The correction quality for each series and HSP is
based on (1) the correlation coefficient between the candi-date and the reference series and (2) the number of modeled(Nmod) and predicted values (Npred) [Della-Marta andWanner, 2006]. On the basis of the modeling study byDella-Marta and Wanner [2006], we formulated a set ofcorrection quality criteria which resulted in each correctionof each time series to be classified as either ‘‘very good,’’‘‘good,’’ ‘‘acceptable,’’ and ‘‘poor.’’ According to ourcriteria listed in Table 2, only 5% of the total number ofcorrections were identified as ‘‘poor,’’ and 79% of correc-tions were classified as either ‘‘good’’ or ‘‘very good.’’ Thestations where ‘‘poor’’ corrections were made are scatteredthroughout the GMR, however there is a tendency for poorcorrection to be made for series located in southern Italy,Sardinia, and Israel. A summary of the correction quality isgiven in Table 2.
[36] For estimating changes in maximum temperaturevariability we calculated the difference between the meanadjustments (�C) applied to the highest 10% and the lowest10% of the maximum temperature distribution. Figure 11shows an area of increasing daily maximum temperaturevariability from southeastern France across the Adriaticarea, the southern Balkan, and northern Greece towardnorthern Turkey.[37] The mean July maximum temperatures before and
after PENHOM and their changes in trends are shown forthree key stations in the western (Lisbon, Portugal; Valencia,Spain; Montelimar, France), central (Graz, Austria; Veronaand Brindisi, Italy), and eastern Mediterranean areas(Bucharest, Romania; Manisa and Diyarbakir, Turkey) inFigure 12. The overall effect of PENHOM is often accom-panied by changes in the mean long-term maximum tem-perature trend. For Graz, Austria, temperature adjustmentsof more than 2�C result in a significantly reduced temper-ature increase. The mean summer maximum temperaturetrend changed from +0.21�C before to +0.13�C/decade afterPENHOM was applied between 1900 and 2005. This agreeswith the findings of Della-Marta and Wanner [2006], whoalso corrected the daily maximum temperature of Graz inthis study. Besides Graz, summer TX was also corrected for
Table 2. Summary of the Correction Quality Based on the Correlation Coefficient of the Reference Series and the Number of the
Modeled and Predicted Temperature Valuesa
Quality of Correction Percentage of BPs Corrected, % Correlation Coefficient Number of Modeled (Nmod) + Predicted (Npred) Values
Very good 27 r � 0.90 Nmod + Npred � 1000Good 52 0.80 � r < 0.90 500 < Nmod + Npred < 1000Acceptable 16 0.80 � r < 0.90 180 < Nmod + Npred � 500Poor 5 0.80 � r < 0.90 Nmod + Npred � 180
aSee text for details.
Figure 11. Difference between the mean adjustments (�C) applied to the highest 10% and the lowest10% of the maximum temperature distribution. The black circles indicate station series that werecorrected using more than one reference series. Warm colors indicate an increase in daily maximumtemperature variance, and vice versa for cool colors.
D15108 KUGLITSCH ET AL.: HOMOGENIZATION OF DAILY TEMPERATURE DATA
11 of 16
D15108

Figure 12. A comparison of the July monthly averaged daily inhomogeneous time series (dashedcurves) and the homogenized time series using the PENHOM (solid curves) for three representativestations in (a) the western Mediterranean, (b) the central Mediterranean, and (c) the easternMediterranean. Dotted vertical lines characterize the breakpoints detected for the respective station.
D15108 KUGLITSCH ET AL.: HOMOGENIZATION OF DAILY TEMPERATURE DATA
12 of 16
D15108

Kremsmunster (Austria), Paris (France), Lisbon (Portugal),Basel, Geneva and Zurich (Switzerland) by Della-Marta[2006]. Comparison of this study with our results coveringthe same stations indicates close agreement (not shown).[38] The linear trends (�C/decade) of the mean, the high-
est 10%, and the lowest 10% of the July maximumtemperature distribution for the nine key stations are sum-marized in Table 3. Figure 13 summarizes the detecteddifferences in slopes between PENHOM and RAW trendsand identifies areas containing temperature records withsignificant changes in the p value of the trend after PENHOMwas applied. Hence, red areas characterize records witheither significantly lower r values involving an increasedtemperature trend after the data were homogenized. Suchtrends were identified for some stations in the northwesternparts (Basel, Lleida, Lyon, Montelimar, Perpignan, andVichy-Charmeil) in Italy and the Adriatic region (Bologna,Brindisi, Gospic, Ioannina, Milan, Rome, and Split), manystations in Western Anatolia (Afyon, Ankara, Bolu, Cankiri,
Erzincan, Giresun, Isparta, Konya, Nigde, Yozgat, andZonguldak), in the Marmara region (Bandirma, Florya/Istanul, Goztepe/Istanbul, Istanbul, and Izmit), in parts ofthe Aegean (Heraklion, Manisa, Skyros, and Tanagra), andalong the Romanian Black Sea coast (Sulina and Tulcea).Significantly reduced temperature trends are usually foundfor more isolated stations and not for larger areas (seeFigure 13, blue areas).[39] The station series that were excluded after PENHOM
was applied are primarily located in mountainous areas thatare affected by orographical effects (e.g., Foehn) that lead tocorrection problems. As an example for a nonreliablehomogenization, Figure 14 illustrates the smoothed adjust-ments (�C) for July and each decile in Ransol, Andorra, astation in 1645 amsl that could be homogenized neither bylowland nor by neighboring mountainous series. Highlynonlinear adjustments between �4.1�C (median, decile 1)and +2.6�C (median, decile 9) for July cannot be assumed tobe valid and underlines the need for highly correlated
Figure 13. Differences in the slopes (PENHOM-RAW) are indicated by color for each site. Light redareas characterize records with significantly lower p values involving an increased temperature trend afterPENHOM was applied.
Table 3. Long-Term Trends of the Mean, the Highest 10%, and the Lowest 10% of the July Maximum Temperature Distribution for Nine
Key Stations Before and After PENHOM Was Applieda
Station, Country
Trend of Mean July TX (�C/decade)Trend of Mean July TX90PERC
(�C/decade)Trend of Mean July TX10PERC
(�C/decade)
Before PENHOM After PENHOM Before PENHOM After PENHOM Before PENHOM After PENHOM
Lisbon, Portugal 0.22 0.25 0.13 �0.06 0.22 0.36Valencia, Spain 0.18 0.12 0.19 0.17 0.14 0.12Montelimar, France 0.12 0.16 0.13 0.14 0.00 0.12Graz, Austria 0.21 0.13 0.27 0.08 0.19 0.23Verona, Italy 0.18 0.15 0.13 0.27 0.11 0.16Brindisi, Italy 0.10 0.20 0.20 0.29 0.24 0.24Bucharest, Romania �0.05 �0.03 �0.05 �0.04 �0.08 �0.08Manisa, Turkey 0.06 0.12 0.11 0.16 0.08 0.10Diyarbakir, Turkey 0.06 �0.09 0.04 �0.11 0.12 �0.08
aValues for observed trends significant at the 5% level (Mann-Kendall test) are shown in bold.
D15108 KUGLITSCH ET AL.: HOMOGENIZATION OF DAILY TEMPERATURE DATA
13 of 16
D15108

reference series. Similar difficulties appear when correctingTX out of summer season or daily minimum temperatures(TN) owing to lower spatial correlations. A reliable homog-enization of these parameters requires much higher stationdensities.[40] Since the method only uses reference station data for
correcting the candidate data, it is important that all break-points in those series are accurately determined. If severalsuitable reference series are available to homogenize acandidate series, a comparison between the adjustmentsfrom each might be helpful. In Romania where many seriesshow only one breakpoint, or are even homogeneous, acorrection using more than one reference series was possiblefor a couple of station records (Botosani, Bucuresti, Calarasi,Cluj Napoca, Constanta, and Iasi). The mean adjustments ofall values and the highest/lowest deciles varied by less than0.05�C underlining the significance of the correction pro-cedure in this region. Unfortunately, similar investigationsare not possible for other Mediterranean areas. Therefore aconfirmation of the breakpoints detected using statisticalprocedures from metadata is highly recommended [Petersonet al., 1998; Wijngaard et al., 2003], but in many cases thisis also not possible owing to missing information or thisinformation is very difficult to be accessed in the archives.[41] The results show that 84% of all temperature series
analyzed are affected by artificial breakpoints. Even if themean adjustments for all sites are only small and slightlypositive (+0.1�C), some series changed dramatically afterPENHOM was applied leading to significant changes inregional temperature trends.[42] A direct comparison with many other previously
mentioned homogenization studies [e.g., Bohm et al.,2001; Begert et al., 2005; Brunetti et al., 2006; Auer etal., 2007] that have estimated their shifts to the mean from areference series that generally is a weighted average ofmany surrounding stations, is often not possible. A singlereference station has the advantage of representing thevariability of climate in a smaller scale, whereas weightedreference series are more representative of a climatic region.The disadvantage of weighted reference series is that theyare assumed to be homogeneous even when they are usually
based on nonhomogenized individual stations records. Inorder to take into account more than one reference series inthe correction procedure and the application of advancedstatistical methods (e.g., universal kriging) are currentlyunder investigation.
4. Conclusion and Outlook
[43] The aim of this study was to homogenize a compre-hensive and high-quality daily maximum temperature data-base for the Greater Mediterranean Region. The lack ofmetadata providing information about station history andpotential artificial breakpoints directed us to develop animproved homogenization method (PENHOM) based onstatistical methods only.[44] We show that a combination of the break detection
method by Caussinus and Mestre [2004] and the correctionmodel by Della-Marta and Wanner [2006] is a suitable wayto homogenize daily meteorological series reliably (seeresults in Table 2) given that highly correlated neighboringreference series are available. The need for highly correlatedreference series results in our procedure being most reliablein coastal areas, plains and during the summer season(JJAS).[45] PENHOM has been applied to 240 daily summer
maximum temperature series and gives reliable results for174 series in 16 countries covering the last 50–150 yearsacross the GMR. Each of the 174 series has a maximum ofthree missing values per month per season (JJAS) and ishomogenized using a reference series with which it is highlycorrelated (greater than 0.8).[46] Results show that 86% of all TX series are affected
by one or more artificial breakpoints. Station records in theeastern Mediterranean show significantly more breakpointsthan records in the western Mediterranean. Owing to aunique history of each site there is no uniform trend ofthe adjustments across the whole GMR detected. The meanadjustment of all daily summer maximum temperatures is+0.03�C (±0.38�C) for the western Mediterranean, +0.16�C(±0.52�C) for the central Mediterranean, and +0.19�C(±0.30�C) for the eastern Mediterranean, indicating areduced increase of the mean summer maximum temperaturecompared to findings from analyzing raw data.[47] This is the first time that one coherent daily temper-
ature homogenization technique has been applied to such alarge amount of data on a continental scale. Using criteriabased on the sensitivity study of Della-Marta and Wanner[2006], 79% of corrections made to the 174 series wereclassified as ‘‘good’’ or ‘‘very good.’’[48] Forthcoming work focuses on the detailed analysis of
trends in maximum temperature extremes and homogeniz-ing Mediterranean daily minimum temperature (TN) data-base. With such data sets the detailed analysis of heat wavesand related temperature based heat stress indices in theGMR over the last decades will be possible. Other benefitsof this data set would allow a better understanding ofdynamical processes causing extreme temperature eventson different time and space scales. Furthermore homoge-nized TX and TN series are a fundamental necessity for anykind of climate change impact research.[49] Beside an enhanced collaboration of the NMHS, the
WMO-MEDARE initiative (www.omm.urv.cat/MEDARE/
Figure 14. The smoothed adjustments (�C) for July andeach decile in Ransol, Andorra (see Figure 6 for furtherdetails).
D15108 KUGLITSCH ET AL.: HOMOGENIZATION OF DAILY TEMPERATURE DATA
14 of 16
D15108

index.html) aims to improve both the Mediterranean dataexchange and the recovery of climate data and metadataduring the next years. This implies more informationconcerning site history, a validation and comparison ofbreakpoints detected with documentary records, and morereliable corrections due to higher station density.
[50] Acknowledgments. We are grateful to Gerard van der Schrierand partners from the European Climate Assessment and Data set(ECA&D) at the KNMI, Franco Desiato from the ISPRA (SCIA project),Enric Aguilar, Pere Esteban, Marc Prohom, Dimitra Founda, Ozan MertGokturk, and the Turkish State Meteorological Service for providing data.We thank Olivier Mestre for his break detection routine and interestingdiscussions. This research was funded by the European Union integratedproject Climate Change and Impact Research: The Mediterranean Environ-ment (CIRCE) and the European COST Action HOME ES0601 (Advancesin homogenization methods of climate series: An integrated approach–HOME). Jurg Luterbacher acknowledges support from the 7th EU Frame-work program Assessing Climate Impacts on the Quantity and Qualityof Water (ACQWA, http://www.acqwa.ch/) and MedClivar (http://www.medclivar.eu/). The three reviewers made useful comments andsuggestions and helped to improve the quality of this study.
ReferencesAguilar, E., I. Auer, M. Brunet, T. C. Peterson, and J. Wieringa (2003),Guidance on metadata and homogenization, WMO-TD 1186, 51 pp.,World Meteorol. Organ., Geneva, Switzerland.
Alexander, L. V., et al. (2006), Global observed changes in daily climateextremes of temperature and precipitation, J. Geophys. Res., 111,D05109, doi:10.1029/2005JD006290.
Alexandersson, H., and A. Moberg (1997), Homogenization of Swedishtemperature data. Part 1: Homogeneity test for linear trends, Int. J. Climatol.,17, 25 – 34, doi:10.1002/(SICI)1097-0088(199701)17:1<25::AID-JOC103>3.0.CO;2-J.
Alpert, P., et al. (2002), The paradoxical increase of Mediterranean extremedaily rainfall in spite of decrease in total values, Geophys. Res. Lett.,29(11), 1536, doi:10.1029/2001GL013554.
Auer, I., et al. (2005), A new instrumental precipitation dataset for thegreater alpine region for the period 1800–2002, Int. J. Climatol., 25,139–166, doi:10.1002/joc.1135.
Auer, I., et al. (2007), HISTALP: Historical instrumental climatologicalsurface time series of the Greater Alpine Region, Int. J. Climatol., 27,17–46, doi:10.1002/joc.1377.
Begert, M., T. Schlegel, and W. Kirchhofer (2005), Homogeneous tempera-ture and precipitation series of Switzerland from 1864 to 2000, Int. J.Climatol., 25, 65–80, doi:10.1002/joc.1118.
Beniston, M., et al. (2007), Future extreme events in European climate: Anexploration of regional climate model projections, Clim. Change, 81,71–95, doi:10.1007/s10584-006-9226-z.
Bohm, R., I. Auer, M. Brunetti, M. Maugeri, T. Nanni, andW. Schoner (2001), Regional temperature variability in the EuropeanAlps: 1760–1998 from homogenized instrumental time series, Int.J. Climatol., 21, 1779–1801, doi:10.1002/joc.689.
Brandsma, T., and G. P. Konnen (2006), Application of nearest-neighborresampling for homogenizing temperature records on a daily to sub-dailylevel, Int. J. Climatol., 26, 75–89, doi:10.1002/joc.1236.
Brown, S. J., J. Caesar, and C. A. T. Ferro (2008), Global changes inextreme daily temperature since 1950, J. Geophys. Res., 113, D05115,doi:10.1029/2006JD008091.
Brunet, M., and F. G. Kuglitsch (Eds.) (2008), Proceedings of the Inter-national Workshop on Rescue and Digitization of Climate Records in theMediterranean Basin, WMO-TD 1432, 219 pp., World Meteorol. Organ.,Geneva, Switzerland.
Brunet,M., O. Saladie, P. D. Jones, J. Sigro, E. Aguilar, A.Moberg, D. Lister,A. Walther, D. Lopez, and C. Almarza (2006), The development of a newdataset of Spanish daily adjusted temperature series (1850–2003), Int. J.Climatol., 26, 1777–1802, doi:10.1002/joc.1338.
Brunet, M., P. D. Jones, J. Sigro, O. Saladie, E. Aguilar, A. Moberg, P. M.Della-Marta, D. Lister, A. Walther, and D. Lopez (2007), Temporal andspatial temperature variability and change over Spain during 1850–2005,J. Geophys. Res., 112, D12117, doi:10.1029/2006JD008249.
Brunetti, M., M. Maugeri, F. Monti, and T. Nanni (2006), Temperature andprecipitation variability in Italy in the last two centuries from homoge-nised instrumental time series, Int. J. Climatol., 26, 345 – 381,doi:10.1002/joc.1251.
Caussinus, H., and F. Lyazrhi (1997), Choosing a linear model with arandom number of change-points and outliers, Ann. Inst. Stat. Math.,49, 761–775, doi:10.1023/A:1003230713770.
Caussinus, H., and O. Mestre (2004), Detection and correction of artificialshifts in climate series, J. R. Stat. Soc., Ser. C, 53, 405–425, doi:10.1111/j.1467-9876.2004.05155.x.
Cleveland, W. S., and S. J. Devlin (1988), Locally weighted regression: Anapproach to regression-analysis by local fitting, J. Am. Stat. Assoc., 83,596–610, doi:10.2307/2289282.
Cocheo, C., and D. Camuffo (2002), Corrections of systematic errors anddata homogenisation in the daily temperature Padova series (1725–1998), Clim. Change, 53, 77–100, doi:10.1023/A:1014950306015.
Della-Marta, P. M. (2006), Extreme temperature events in western Europefrom 1880–2003, Ph.D. thesis, Inst. of Geogr., Univ. of Bern, Bern,Switzerland.
Della-Marta, P. M., and H. Wanner (2006), A method of homogenizing theextremes and mean of daily temperature measurements, J. Clim., 19,4179–4197, doi:10.1175/JCLI3855.1.
Della-Marta, P. M., D. Collins, and K. Braganza (2004), Updating Austra-lia’s high-quality annual temperature dataset, Aust. Meteorol. Mag., 53,75–93.
Della-Marta, P.M., J. Luterbacher, H. vonWeissenfluh, E. Xoplaki, M. Brunet,and H. Wanner (2007a), Summer heat waves over western Europe 1880–2003: Their relationship to large scale forcings and predictability, Clim.Dyn., 29, 251–275, doi:10.1007/s00382-007-0233-1.
Della-Marta, P. M., M. R. Haylock, J. Luterbacher, and H. Wanner (2007b),Doubled length of western European summer heat waves since 1880,J. Geophys. Res., 112, D15103, doi:10.1029/2007JD008510.
Demaree, G. R., P. J. Lachaert, T. Verhoeve, and E. Thoen (2002), Thelong-term daily Central Belgium Temperature (CBT) series (1767–1998)and early instrumental meteorological observations in Belgium, Clim.Change, 53, 269–293, doi:10.1023/A:1014931211466.
Diffenbaugh, N. S., J. S. Pal, F. Giorgi, and G. Xuejie (2007), Heat stressintensification in the Mediterranean climate change hotspot, Geophys.Res. Lett., 34, L11706, doi:10.1029/2007GL030000.
Easterling, D. R., and T. C. Peterson (1995), A new method for detectingundocumented discontinuities in climatological time series, Int. J. Climatol.,15, 369–377, doi:10.1002/joc.3370150403.
Fang, X. Q., A. Y. Wang, S. K. Fong, W. S. Lin, and J. Liu (2008), Changesof reanalysis-derived Northern Hemisphere summer warm extreme indicesduring 1948–2006 and links with climate variability, Global Planet.Change, 63, 67–78, doi:10.1016/j.gloplacha.2008.06.003.
Founda, D., and C. Giannakopoulos (2009), The exceptionally hot summerof 2007 in Athens, Greece: A typical summer in the future climate?,GlobalPlanet. Change, 67, 227–236, doi:10.1016/j.gloplacha.2009.03.013.
Frich, P., L. V. Alexander, P. Della-Marta, B. Gleason, M. Haylock, A. Tank,and T. Peterson (2002), Observed coherent changes in climatic extremesduring the second half of the twentieth century, Clim. Res., 19, 193–212,doi:10.3354/cr019193.
Giorgi, F. (2006), Climate change hot-spots, Geophys. Res. Lett., 33,L08707, doi:10.1029/2006GL025734.
Gonzalez-Rouco, J. F., J. L. Jimenez, V. Quesada, and F. Valero (2001),Quality control and homogeneity of precipitation data in the southwest ofEurope, J. Clim., 14, 964–978, doi:10.1175/1520-0442(2001)014<0964:QCAHOP>2.0.CO;2.
Hegerl, G. C., T. J. Crowley, W. T. Hyde, and D. J. Frame (2006), Climatesensitivity constrained by temperature reconstructions over the past sevencenturies, Nature, 440, 1029–1032, doi:10.1038/nature04679.
Intergovernmental Panel on Climate Change (IPCC) (2007), ClimateChange 2007: The Physical Basis. Contribution of Working Group I tothe Fourth Assessment Report of the Intergovernmental Panel on ClimateChange, Cambridge Univ. Press, New York.
Jones, G. S., P. A. Stott, and N. Christidis (2008), Human contribution torapidly increasing frequency of very warm Northern Hemisphere sum-mers, J. Geophys. Res., 113, D02109, doi:10.1029/2007JD008914.
Klein Tank, A., et al. (2002), Daily dataset of 20th-century surface airtemperature and precipitation series for the European Climate Assess-ment, Int. J. Climatol., 22, 1441–1453, doi:10.1002/joc.773.
Kostopoulou, E., and P. D. Jones (2005), Assessment of climate extremes inthe Eastern Mediterranean, Meteorol. Atmos. Phys., 89, 69 – 85,doi:10.1007/s00703-005-0122-2.
Maugeri, M., L. Buffoni, B. Delmonte, and A. Fassina (2002), Daily Milantemperature and pressure series (1763–1998): Completing and homogenis-ing the data, Clim. Change, 53, 119–149, doi:10.1023/A:1014923027396.
Moberg, A., and P. D. Jones (2005), Trends in indices for extremes in dailytemperature and precipitation in central and western Europe, 1901–99,Int. J. Climatol., 25, 1149–1171, doi:10.1002/joc.1163.
Moberg, A., et al. (2006), Indices for daily temperature and precipitationextremes in Europe analyzed for the period 1901–2000, J. Geophys.Res., 111, D22106, doi:10.1029/2006JD007103.
D15108 KUGLITSCH ET AL.: HOMOGENIZATION OF DAILY TEMPERATURE DATA
15 of 16
D15108
Peterson, T. C., et al. (1998), Homogeneity adjustments of in situ atmosphericclimate data: A review, Int. J. Climatol., 18, 1493–1517, doi:10.1002/(SICI)1097-0088(19981115)18:13<1493::AID-JOC329>3.0.CO;2-T.
Scherrer, S. C., C. Appenzeller, and M. A. Liniger (2006), Temperaturetrends in Switzerland and Europe: Implications for climate normals, Int.J. Climatol., 26, 565–580, doi:10.1002/joc.1270.
Sensoy, S., T. Peterson, L. Alexander, and X. Zhang (2007), EnhancingMiddle East climate change monitoring and indexes, Bull. Am. Meteorol.Soc., 88, 1249–1254, doi:10.1175/BAMS-88-8-1249.
Stott, P. A., D. A. Stone, and M. R. Allen (2004), Human contribution tothe European heatwave of 2003, Nature, 432, 610–614, doi:10.1038/nature03089.
Szentimrey, T. (1999), Multiple analysis of series for homogenisation(MASH), in Proceedings of the Second Seminar for Homogenisation ofSurface Climatological Data,WMO-TD 962, pp. 27–46, World Meteorol.Organ., Geneva, Switzerland.
Toreti, A., and F. Desiato (2008), Temperature trend over Italy from 1961 to2004, Theor. Appl. Climatol., 91, 51–58, doi:10.1007/s00704-006-0289-6.
Trewin, B. C., and A. C. F. Trevitt (1996), The development of compositetemperature records, Int. J. Climatol., 16, 1227–1242, doi:10.1002/(SICI)1097-0088(199611)16:11<1227::AID-JOC82>3.0.CO;2-P.
Vincent, L. A. (1998), A technique for the identification of inhomogeneitiesin Canadian temperature series, J. Clim., 11, 1094–1104, doi:10.1175/1520-0442(1998)011<1094:ATFTIO>2.0.CO;2.
Vincent, L. A., X. Zhang, B. R. Bonsal, and W. D. Hogg (2002), Homo-genization of daily temperatures over Canada, J. Clim., 15, 1322–1334,doi:10.1175/1520-0442(2002)015<1322:HODTOC>2.0.CO;2.
Wang, X. L. (2003), Comments on ‘‘Detection of undocumented change-points: A revision of the two-phase regressionmodel’’, J. Clim., 16, 3383–3385, doi:10.1175/1520-0442(2003)016<3383:CODOUC>2.0.CO;2.
Wijngaard, J. B., A. Tank, and G. P. Konnen (2003), Homogeneity of20th century European daily temperature and precipitation series, Int. J.Climatol., 23, 679–692, doi:10.1002/joc.906.
Xoplaki, E. (2009), Effects of extreme climate on Mediterranean societies,Eos Trans. AGU, 90(15), 131, doi:10.1029/2009EO150006.
Xoplaki, E., J. F. Gonzalez-Rouco, J. Luterbacher, and H. Wanner (2003),Mediterranean summer air temperature variability and its connection tothe large-scale atmospheric circulation and SSTs, Clim. Dyn., 20, 723–739, doi:10.1007/s00382-003-0304-x.
Xoplaki, E., J. Luterbacher, and J. F. Gonzalez-Rouco (2006), Mediterra-nean summer temperature and winter precipitation, large-scale dynamics,trends, Nuovo Cim., 29, 45–54.
Zhang,X. B., L. A. Vincent,W. D. Hogg, andA. Niitsoo (2000), Temperatureand precipitation trends in Canada during the 20th century, Atmos. Ocean,38, 395–429.
�����������������������P. M. Della-Marta, Federal Office for Meteorology and Climatology,
MeteoSwiss, CH-8044 Zurich, Switzerland.F. G. Kuglitsch, A. Toreti, H. Wanner, and E. Xoplaki, Oeschger Centre
for Climate Change Research, University of Bern, CH-3012 Bern,Switzerland. ([email protected])J. Luterbacher, Climatology, Climate Dynamics, and Climate Change
Section, Department of Geography, Justus-Liebig University of Giessen,D-35390 Giessen, Germany.
D15108 KUGLITSCH ET AL.: HOMOGENIZATION OF DAILY TEMPERATURE DATA
16 of 16
D15108


