Embed Size (px)
Citation preview
Census and Statistics Department Hong Kong
October 1991
這份刊物的 PDF 版本的文字是從印刷版掃描而成,再利用光學字符識別軟
件轉換成電子格式。由於原印刷版本已印製並保存多年,光學字符識別技
術未必能準確地識別某些文字或數字。因此,搜索或複製此 PDF 檔案內的
文字時應加以注意。 The text of this PDF publication was scanned from its printed version and then converted to electronic text using Optical Character Recognition (OCR) software. Because of the age and condition of the original printed copy, the OCR may not recognise certain characters or figures accurately. Caution should therefore be taken when searching or copying text from this PDF publication.
Hong Kong
Monthly Digest of Statistios
October 1991
Census and Statistics Department, Bong Kong

PRINTED AND PUBLISHED BY THE GOVERNMENT PRINTER, HONG KONG
Ii , I
, I
I I
'1
I 'I ,, i I
' 11 __ _
INTRODUCTION
The Hong Kong Monthly Digest of Statistics is prepared by the Census and Statistics Department. It is designed to provide up-to-date statistical information about the social and economic characteristics of Hong Kong.
Statistical data are, wherever possible, presented in the form of monthly figures for the past twenty-five months together with annual figures for the latest complete six years. Detailed description of the scope and nature of the data and definitions of the terms used in the publication are provided in the Explanatory Notes.
Most of the statistics have been compiled by the Census and Statistics Department. Where other Government departments and organizations have contributed data, references are made in the Explanatory Notes. The Census and Statistics Department gratefully acknowledges such contributions.
Symbols
The following symbols are used throughout the Digest:
nil or not applicable N.A. not available
* revised figures
Units of Measurement
1 terajoule (TJ) 277 778 kilowatt hours
9478.17 therms
1 tonne (t) 2 204.62 pounds
0.984 207 ton
1 kilogram (kg) 2.204 62 pounds
1.653 47 catties
1 square metre (m2) 10.763 9 square feet
1 cubic metre (m3 ) 219.969 imperial gallons
1 hectopascal millibar
1 km/h 0.54 knot
Values
All figures quoted are in Hong Kong dollars unless otherwise specified.
Exchange Rate
The Official rate for conversion to US dollars was HK$5.085 = US$1.00 until 25 November 1974. The Hong Kong dollar floated on 26 November 1974. As from 17 October 1983 the Hong Kong dollar was linked to US dollar, through a new arrangement in the note-issue mechanism, at a fixed exchange rate ofHK$7.80 = US$1.00.
Rounding of Figures
Some figures have been rounded off to the nearest final digit. This may result in a slight discrepancy between the sum of the individual items and the total as shown in the tables.
Hong Kong Monthly Digest of Statistics October 1991 iii
TABLE OF CONTENTS
Sections/tables
INTRODUCTION
PART I REGULAR TABLES
Section 1: Population and Vital Statistics
1.1 Estimated population, birth rate and death rate 1.2 Registered births, deaths and marriages
Section 2: Labour
2.1 Labour force, unemployment and underemployment 2.2 Establishments and persons engaged 2.3 Establishments and persons engaged by major industry group 2.4 Reported vacancies by major industry group 2.5 Establishments and persons engaged in selected industry sectors by
employment size 2.6 Employment in Civil Service 2.7 Total monthly payroll by major industry group 2.8 Nominal and real indexes of payroll per person engaged by major
industry group 2.9 Wage indexes 2.10 Average daily wages of workers engaged in Government building and
construction projects 2.11 Stoppages of work by industry 2.12 Reported occupational accidents 2.13 Industrial accidents by cause and industry in 2nd quarter 1991
Section 3: External Trade
3.1 External trade statistics 3.2 Imports by area 3.3 Domestic exports by area 3.4 Imports by major trading country 3.5 Domestic exports by major trading country 3.6 Re-exports by major country of origin 3. 7 Re-exports by major country of destination 3.8 Imports by commodity section 3.9 Domestic exports by commodity section 3.10 Re-exports by commodity section 3.11 Imports and re-exports by end-use category 3.12 Domestic exports of principal commodities 3.13 Trade index numbers 3.14 Trade index numbers for imports 3.15 Trade index numbers for domestic exports 3.16 Trade index numbers for re-exports 3.17 Trade index numbers for main suppliers of imports 3.18 Trade index numbers for main markets of domestic exports
Section 4: Production
4.1 Index of industrial production 4.2 Index of textile production 4.3 Textile production 4.4 Cement and quarry production
Section 5: Land, Housing, Building and Construction
5.1 Stock of permanent living quarters 5.2 Stock and authorized population of public housing rental flats 5.3 Residential units/flats completed by geographic area 5.4 Residential units/flats completed by floor area 5.5 Residential units/flats with consent to commence work by geographic
area 5.6 Residential units/flats with consent to commence work by floor area 5.7 Buildings completed by type 5.8 Buildings with consent to commence work by type 5.9 Price indexes by type of premises 5.10 Rental indexes by type of premises 5.11 Instruments registered in the Land Office 5.12 Gross value of construction work performed by building and civil
engineering contractors 5.13 Disposals of Government land
Section 6: Transport, Communications and Tourism
6.1 Aircraft movements 6.2 Ocean-going vessels entered and cleared 6.3 River vessels entered and cleared 6.4 International movements of commercial cargo 6.5 Containers carried by ocean-going vessels 6.6 Public transport: passenger journeys by undertaking 6. 7 Motor vehicles licensed 6.8 Vehicular traffic through toll-charged tunnels and vehicular ferry
services 6.9 Traffic accidents and casualties
iv
~-ilP : )..J:lJ.it!E1fittu'CITT Af:l~tUrtITT, till£$, 7EL:$ tll:'E, 7Et7HIHl1lttJ!llti:'f'
~.=jjp:~I
gfifJA.o , !lc~liU!lt~:;r;JEl.ilflit ~;fft'.!'J1!zti: § liU!lt~Ati: ~;fft'.!'J 1!zti: § litl9t~Ati:( J'ii:fi~fill.jj1JJtM)
'Jf¥R~1!I"/1~(J'ii:fr~fill.ll1JJtMl :.S''f :±J<:'EAiMlliJz~m• 1!zti: § lit%lt~Ati:( J'ii:%lt~Ati:%M)
0l'Ri'iAli: 4lJ, ~ if~~1!1! ( 1'i;;i'J~fill.ll1JJtM l mt~i!Pf:hl11; ~lit'.l':Wif~f.ltt ( 1'i;;fi~fill.jj1JJtM)
I.ftf.lti: fiJ!lm-il&J&~~fH11£zIA 'f:hlJ S if
fii'itfDIH4(1'1;:fi~%Ml ¥¥Rz~~:tt~HH4 -1L1L-if~=~~n~:tt~Hi:f4(1'1;:ffi\IE!litfi~%Ml
~=:w , 1m~~ Jt)'f-'j'.1hl.ilflit Jlo(J'ii:Ji!!.lil1!%Ml l'l!fUlitllo(J'ii:Ji!!.lill!?tMl Jlo (J'ii::±J<'j'.1hl!lll*%Ml l'l!fAiiliitll iJ (J'ii::±J<'j'.1hl!lll*?tMl lifO(J'ii::±J'rntAil!lll*?tMl ffiJ (J'ii::±J<§ffJ:li!!.l!lll*?tMl Jlo (J'ii:jllj,p,,,fi!J.jj1JJtMl l'l!fAii!iitll o (J'ii:lllii!iifill.ll1JJtMl ff P (J'ii:lllii!ii,fi!l.ll1JJtMl iliJ litlif P (J'ii::lii:f&Jll:it?tMl :<Fl'lli:±J'Aii!iitllf:l 'j'.1hf.lti: Jlf:l'j'.1hf.lti: l'l!fUlitf:lo'j'.1hf.lti: fff:l'j'.1hf.lti: Jlf:l :±J<*l!!('j'.1hf.ltt l'll>Aiilii tB f:l :±J'r!f~'j'.1hf.lti:
~!milP : !E~ I~:'EAif.lti: ~~~:'EAif.lti: ~~~:'EAi Jj(~lit::z:lli!l:'E&i
~lifri : ±:tt!! '11}1§. 'iii! 7j(j.,.'i'i:1iE!f~ti: ,f13.f±0~.!'J1!I~ti:litfl:'!lPJ!iSRoAti: iimtz11!:£¥1!z I %!fl1fiP¥ti:§ (J'l,:Ji!!.1®:%Ml iimtzf±!f:O.!'J1!z I ?t!fitl':f'.ti:§ (J'l,:{lilifiliffl?tMl fttl'ftifJI.z11!:£¥1.lL I ?t!fitl':f'.ti:§ (J'ii:Ji!!.1®::$1-Ml
fttl'ftifJiz11!f:O.!'J1!I I :$1-Mtl':f'.ti:§ (J'ii:tlllililiffl?tl'll limttl':f'.(J'ii:tl':f'.fll!M?tMl fttl'ftifJitl':f'.(J'ii:tl':f'.fil!M?tMl tl-OU1ili:( J'ii:!fo/J~fll!M?tMl m~f.lli:(J'ii:!fo/JUM?tMl B:i'E(ll±ttJ!llJ<it11:12z)Cjf ~~jlljE!f~I.11£,itill
il&J&±:li!!.Jlli'Rmm
~ 7'fri : JI.• ' ii.till ' ~Ji! m;mR•m~~tt'f' m;mRmmmi'4"*6Utt'f' :Jl£l'lli lit •m P-1 fPJ W.i ti:'f' jllj~ifi!iiiltll f:lll!liti: Ji#$ifQJ!U&itil:ti:'f' 0~x~'*m~fil!0~x~:r.~A.~ *!W.$lfiilili:§ i!:m!JJl•1m1rnl't•!Jl1Ht1J'$ifq*~
x~:tt7~ R11!t:tit'f'
Page Jilt
iii
2 2 4 6 7
8 9
11
13 16
16 17 18
19 20 20 21 21 22 22 23 23 24 24 25 25 26 27 28 29 29
30 31 31 32
33 33 34 35 35
36 37 37 38 38 39 40
40
43 43 45 46 47 47 48 50
51
Hong Kong Monthly Digest of Statistics October 1991
Sections/tables
6.10 Telecommunication services 6.11 Postal services 6.12 Passenger arrivals 6.13 Passenger departures 6.14 Hong Kong resident departures by destination 6.15 Visitor arrivals by country of residence 6.16 Receipts from visitors 6.17 Per capita spending and length of stay of visitors 6.18 Hotel statistics
Section 7: Money, Banking and Finance 7.1 Currency in circulation and money supply 7.2 Deposits from customers 7.3 Money supply and deposits from customers adjusted for foreign
currency swap deposits 7.4 Balance sheets: licensed banks 7 .5 Balance sheets: restricted licence banks 7.6 Balance sheets: deposit-taking companies 7.7 Balance sheets: all authorized institutions 7 .8 Money markets 7.9 Analysis of loans and advances for use in Hong Kong 7.10 Loans and advances analysed by type-licensed banks 7.11 Loans and advances analysed by type-restricted licence banks 7.12 Loans and advances analysed by type-deposit-taking companies 7 .13 Loans and advances analysed by authorized institutions and by
currency denominations 7.14 Foreign currency positions 7 .15 · Interest rates paid and charged by principal banks 7.16 Hong Kong dollar inter-bank offered rates and bank cheques cleared 7.17 Licensed banks: external liabilities and claims at 30 June 1991 7.18 Restricted licence banks: external liabilities and claims at 30 June 1991 7.19 Deposit-taking Companies: external liabilities and claims at 30 June
1991 7.20 Exchange rates and the effective exchange rate indexes (average figures) 7.21 Exchange rates and the effective exchange rate indexes (end of period
figures) 7.22 Exchange rates and the effective exchange rate indexes in September
1991 7.23 Index of share prices and value of stock exchange turnover 7 .24 Index of share prices and value of stock exchange turnover in
September 1991 7.25 Closing prices of futures exchange and turnover in September 1991 7.26 Gold and silver exchange trading prices 7.27 Gold and silver exchange trading prices in September 1991
Section 8: Prices and Retailing 8 .1 Average retail prices of selected foodstuffs 8.2 Average wholesale prices of selected foodstuffs 8.3 1989/90-based Consumer Price Index (A) 8.4 1989/90-based Consumer Price Index (B) 8.5 1989/90-based Hang Seng Consumer Price Index 8.6 Month-to-month percentage changes in the seasonally adjusted
consumer price indexes 8.7 1984/85-based Consumer Price Index (A) 8.8 1984/85-based Consumer Price Index (B) 8.9 1984/85-based Hang Seng Consumer Price Index 8.10 Restaurant receipts · 8 .11 Retail sales
Section 9: Social Statistics 9.1 Crime 9.2 In-patient and out-patient statistics in Government and
Government-assisted institutions 9.3 Notified infectious diseases 9.4 Public assistance schemes 9.5 Special needs allowance schemes
Section JO: Energy 10.1 Electricity consumption 10.2 Gas consumption 10.3 Petroleum products: releases from petroleum companies by type 10.4 Petroleum products: releases from petroleum companies, duty free
and duty paid
Section 11: Miscellaneous 11.1 Revenue and expenditure of the Hong Kong Government under the
General Revenue Account 11.2 Local and oversea companies registered and dissolved 11.3 Fire services 11.4 Water supplies 11.5 Meteorological observations
PART II PERIODIC TABLES
Section 12.' Population and Mortality Statistics
fill*
~~1UUJ1 l!illJl!iHIU% mi1U!fjl\:A.JX nlii.!r*~A.IX J!<:ii.!riiil!O\\MEii.!rA.IX(tle§l'l<JJl!l?t~) liffii.!r*~ }..IX ( tleiiilf:Ellli*?t~) liffii.!r*~rMUIJ~ liffi1.!r*~4ltA. 'f:MJIH:& l'ilii.!r~f!<i mm ilEJ!l ·iillL
~-f:;fil : lt'M' ' illfi ' ~ii mtii~'lll' :&~'11\'1~,ljj ~Ffr:ilik ~W1J1m'll\'jlj[WJ1:filikz~'ll\'1~,ljj:&~fitr:ilik
M'AA!~tHrJtilla fl* :ff~JblJAA!,iffi~fijf£Ja1l* ~~fr:ilik01'l1Jf~Ja1l* lil?.OJ:tll!ff/IJt/\ilafl* ~'11\'m~ 1~wi1.!rilEJ!l zJ'l:ilik:&~ilik?tin M'AA!~fii'l:ilik:&~ilik( tlCJ!lit~lllJ)j-;fn) :ffl!HJAA!Jffi~fii'l:ilik:&~ilik(tl(J!lit~lllJ)j-;fn) ~~fr:ilik01'lli'l:ilik:&~ilik( tlCJ!litl!i'illlJ)j-;fn) i'l:ilik:&~ilik(lil?.OJ:tli!ff/l:<'ll\''111-{II:frtff)
lil?.OJ:tll!ff/15'r'll\'Ji£Ja fl:&.iiMJl'.'lU~llL ±~~B~1~ztr:lllk:&jt:li)(.fU.¥ ~Bf"1'1ifii!f.!l!,:&~Bx:~x1* M'AA!~fi: nt-fLfL-1J07'Jl .=o-t Sti5'rlafl:&fl#l~~ :ffll&JblJAA!Jffi~fi : nt-fLfL-1J07'Jl .=o-t Sti5'rlafl:&fl#l-l\\IJ.~ ft~fr:ilik01'l1 : nt-fLfL-¥7\Jl .C:.:-t Sti5'rlafl:&fl#lt.\!J.~
7r'll\' Jtl~.¥:&i1.!r'll\'ll.¥=mtt< 'f:MJtt) 7r'll\'Jt1*.¥:&m'll\'ll.¥r.1tt(~WJtt)
-fLfL-¥ fLJl 1Mr'li\' Jt1*$:&i1.!r'll\'ll$r.11t
M~fJt*=mtt:&m*:x~~x~ -fLfL-¥fLJJfilM~•*=mtt:&m*x~~x~
-fLfL-¥fLJJfilWJ~x~~r11•:&~x~
~~~·*· -fLfL-¥fLJl {!}~~~·*•
~/\.i!li : !lm11 ' *9 ~'fit!lo/J'f:MJ~11t1Jt* ~'fit!f?u'f :MJ:Jtt~-* ~-fL/\.fL.!i':fL0¥1.il~Ml'l<l'1'MIMt!f?u1Jtr.1tt ~ - fLJ\.fL.!i>:fL0¥1.il~Wll'l<J Z.~1Mt!f?u1Jtr.1tt ~-fL/\.fL.!i>:fL0¥1.il~Ml'l<Jt][l£1f'JJl!jo/)1Jt:J11tt ~.ll!*i!littW!J~1H!f?u1Jtr.1ttztlCJl s ?t lt~ib
~ - fL/\.IJ!l .!i':/\..li ¥1.il£Wl ll911' Mlf'J Jl!f?ufJtr.111: ~ -fL/\.11'l.!i':J\.1i¥1.il~Wll'l<J Z.~lf'JJl!f?ui!(r.llt ~-fL/\.11'l.!i>:/\.1i¥1.il~Ml'l<lmt!:1Mt!f?u1Jtr.1tt !X11t'1ifiri1!f ~ 1!f !f!ri1!f
mfLW : U1!t~ITT" llll~ ilitiff :&ilitiff Jt l!IJff~:tll!ffllz 1± i;t:& P,~ti<J A.tt'f'.
Bff1i~zf!Ji~ti'l 0~til!IJiitliJ *f/l1Jl'ffi~$~1iiitl!J
m-tn = fflll '11!'.}Jlf'Jfl\ il*1:1f'J*1\ :Elill01'lltll~z:E1!1!£{fl,(tle~g,~1J1J:fr~) 1il!l!01'l1 tll~z:EIJl!lfttfl, ( tle!R.lll.:&Bll:lll.:fr~)
~-t-fii : *fllll~ITT" ilitiff-Alt~A.l!R § z~A.:&/JIJ~
J!<:Jf!l:&5'rllli01'l11tle:&M~ 1f'J/lJJHIUJ1 J!l Jj( 1~,ljj *1:~~~
~=llll ~l11Jf1J1:1Jz~ITT-*
~-t=fii=AD».?Et:~M 12.l Estimated population by age group at mid-1991
September issue appearing in -fLfL-1J01JO 'P A.ttt.1iiit ( tle1JOilU!l.ll1J)t~ )-fLJH?tfiJ tll
12.2 Deaths by cause ... appearing in June issue
Hong Ko'ng Monthly Digest of Statistics October 1991
Page ~II:
52 52 53 54 55 56 56 57 57
58 59 60
61 62 63 64 65 67 68 69 70 71
71 73 73 74 76 78
80 81
82
83 83
84 86 86
87 88 88 89 89 90
90 91 91 92 93
94 95
96 97 98
99 99
100 IOO
IOI
IOI I02 I03 103
v
Sections/tables
Section 13: Education ... appearing in February issue
13.1 Schools and enrolment
Section 14: Wages and Employee Benefits ... appearing in December issue
14.1 Salary indexes for managerial and professional employees 14.2 Percentage of managerial and professional employees entitled to
various fringe benefits for June 1991
. Section 15: National Accounts ... appearing in February, March, May, August and November issue
15.1 Expenditure-based Gross Domestic Product (GDP) estimates at current market prices by main expenditilre components
15.2 Expenditure-based Gross Domestic Product (GDP) estimates at constant (1980) market prices by main expenditure components
15.3 Production-based Gross Domestic Product (GDP) estimates at current prices by economic activity
Section 16: Summary Statistics from Annual Economic Suneys ... appearing once annually
March 1991: Summary Statistics from the Survey of Banks, Deposit-taking Companies and Representative Offices of Foreign Banks for 1988 and 1989
April 1991: Summary Statistics from the 1989 Survey of Building, Construction and Real Estate Sectors
May 1991: Summary Statistics from the 1989 Survey of Transport and Related Services
June 1991: (i) Summary Statis,tics from the 1989 Survey oflndustrial Production
(ii) Summary Statistics from the 1989 Survey of Wholesale and Retail Trades, Restaurants and Hotels
(iii) Summary Statistics from the 1989 Survey of Storage, Communications, Financing, Insurance and Business Services
PART III SPECIAL REVIEW ARTICLES ... appearing in January, March, May, July, September and November issues
January 1991: 1990 Crime Victimization Survey March 1991: Salary Statistics of Middle-Level Managerial and
Professional Employees May 1991: The 1989/90 Household Expenditure Survey and the
Rebasing of the Consumer Price Indexes July 1991: The Monthly Retail Sales Indexes September 1991: (i) The New Hong Kong Standard Industrial
Classification (HSIC) (ii) Hong Kong's Trade with China of Outward Processing
Nature in 1989 and 1990
EXPLANATORY NOTES
vi
WI*
~+.::ow = ~JJ-=JJ filflJtll *tltl§ .&*1:.Att
~-t-l!!IW : I•&-111Uiii'1J-· +=Jl ffiflJtll ~:lll!aliUJ~-Oili~zif~mtll -AA-~RJlffi~:lll!~.&-~ilili~$~~~~~™~Zaffi$
Page Ji:~
*~~rn11tt~~*~1:.~~mllllx~tt*±~~xmnitW~**
*llll)E (-nAo~ > rn11tt:ll~*~1:.~~mllllx~tt*±~Mxm RltW~**
*~~11*tt•~*~1:.£~m*~~m~**
-AA-~.::':Jl : -A/\.J\..&-AJ\.A~Jl]lHr · ~~:ff~0Rl.&5'~ ~-fi~~m~*M•~~~~m~~tt
-AA-~l!!!Jl : -AJ\.A~~~.&~H~~ttf.ltf=*liii~
-AA-~11.Jl : -AJ\.A~:lU11U.&~IJfi!HIUlm~~ttf.ltf,J11d~~
-AA-~RJl : -AJ\.A~I~1:.£~ttf.ltf=*liii~
-AJ\.A~~'!!f:J!t'itfi~ • l'l!il!.&li!Uilf~ttf.ltf!il1: liii~ -A;\.A~:it:@" · JH. ·~I!· f!f!:Wl.&J§J~Hlt~ fi~~ttf.ltf!il1:liii~
-AA-~-Jl=-AAO~~~~~~~ITT -AA:__~.::':Jl : <P.lfl1J:lll!.&:\J~ll~if~~tt
-AA-~11.Jl : -AJ\.A~A~~fifillllx~tt~~.&'i:l'inlHl !/WJ11m~£M
-AA-~~Jl:*Jl~'!!f~~~~m~ -AA-~AJJ=~m~*fi~*~~
-AJ\.Abt-AAO~~IJfiljl(J~f.i!*miJPI ~<Pm•,!)}
Hong Kong Monthly Digest of Statistics October 1991
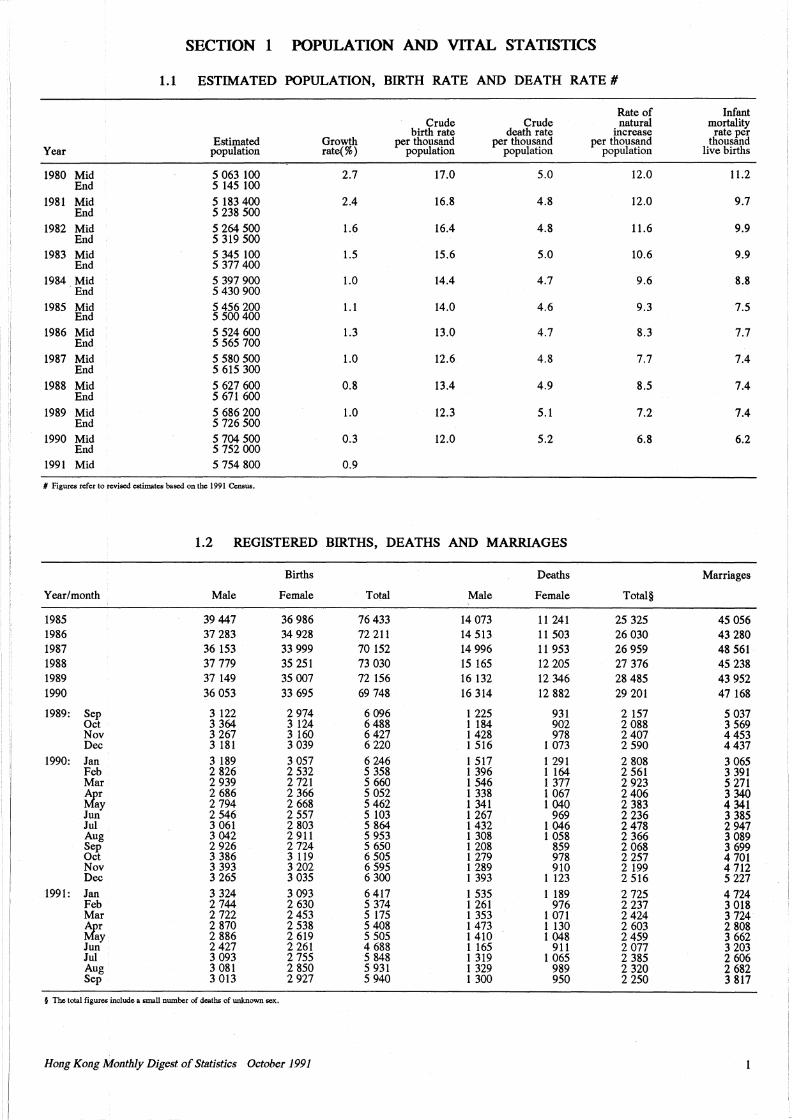
SECTION 1 POPULATION AND VITAL STATISTICS
1.1 ESTIMATED POPULATION, BIRTH RATE AND DEATH RATE#
Rate of Infant Crude Crude natural mortality
birth rate death rate increase rate per Estimated Growth per thousand per thousand per thousand thousand
Year population rate(%) population population population live births
1980 Mid 5 063 100 2.7 17.0 5.0 12.0 11.2 End 5 145 100
1981 Mid 5 183 400 2.4 16.8 4.8 12.0 9.7 End 5 238 500
1982 Mid 5 264 500 1.6 16.4 4.8 11.6 9.9 End 5 319 500
1983 Mid 5 345 100 1.5 15.6 5.0 10.6 9.9 End 5 377 400
1984 Mid 5 397 900 1.0 14.4 4.7 9.6 8.8 End 5 430 900
1985 Mid 5 456 200 1.1 14.0 4.6 9.3 7.5 End 5 500 400
1986 Mid 5 524 600 1.3 13.0 4.7 8.3 7.7 End 5 565 700
1987 Mid 5 580 500 1.0 12.6 4.8 7.7 7.4 End 5 615 300
1988 Mid 5 627 600 0.8 13.4 4.9 8.5 7.4 End 5 671 600
1989 Mid 5 686 200 1.0 12.3 5.1 7.2 7.4 End 5 726 500
1990 Mid 5 704 500 0.3 12.0 5.2 6.8 6.2 End 5 752 OOO
1991 Mid 5 754 800 0.9
# Figures refer to revised estimates based on the 1991 Census.
1.2 REGISTERED BIRTHS, DEATHS AND MARRIAGES
Births Deaths Marriages
Year/month Male Female Total Male Female Total§
1985 39 447 36 986 76 433 14 073 11 241 25 325 45 056 1986 37 283 34 928 72 211 14 513 11 503 26 030 43 280 1987 36 153 33 999 70 152 14 996 11 953 26 959 48 561 1988 37 779 35 251 73 030 15 165 12 205 27 376 45 238 1989 37 149 35 007 72 156 16 132 12 346 28 485 43 952 1990 36 053 33 695 69 748 16 314 12 882 29 201 47 168
1989: Sep 3 122 2 974 6 096 1 225 931 2 157 5 037 Oct 3 364 3 124 6 488 1 184 902 2 088 3 569 Nov 3 267 3 160 6 427 1428 978 2 407 4 453 Dec 3 181 3 039 6 220 1 516 1 073 2 590 4 437
1990: Jan 3 189 3 057 6 246 1 517 1 291 2 808 3 065 Feb 2 826 2 532 5 358 1 396 1 164 2 561 3 391 Mar 2 939 2 721 5 660 1546 1 377 2 923 5 271 ~r 2 686 2 366 5 052 1 338 1 067 2 406 3 340
ay 2 794 2 668 5 462 1 341 1 040 2 383 4 341 Jun 2 546 2 557 5 103 1 267 969 2 236 3 385 Jul 3 061 2 803 5 864 1 432 1 046 2 478 2 947 Aug 3 042 2 911 5 953 1 308 1 058 2 366 3 089 Sep 2 926 2 724 5 650 1 208 859 2 068 3 699 Oct 3 386 3 119 6 505 1 279 978 2 257 4 701 Nov 3 393 3 202 6 595 1 289 910 2 199 4 712 Dec 3 265 3 035 6 300 1 393 1 123 2 516 5 227
1991: Jan 3 324 3 093 6 417 1 535 1 189 2 725 4 724 Feb 2 744 2 630 5 374 1 261 976 2 237 3 018 Mar 2 722 2 453 5 175 1 353 1 071 2 424 3 724 ~r 2 870 2 538 5 408 1473 1 130 2 603 2 808
ay 2 886 2 619 5 505 1 410 1 048 2 459 3 662 Jun 2427 2 261 4 688 1 165 911 2 077 3 203 Jul 3 093 2 755 5 848 1 319 1 065 2 385 2 606 Aug 3 081 2 850 5 931 1 329 989 2 320 2 682 Sep 3 013 2 927 5 940 1 300 950 2 250 3 817
f The total figures include a miall number of deaths of unknown sex.
Hong Kong Monthly Digest of Statistics October 1991
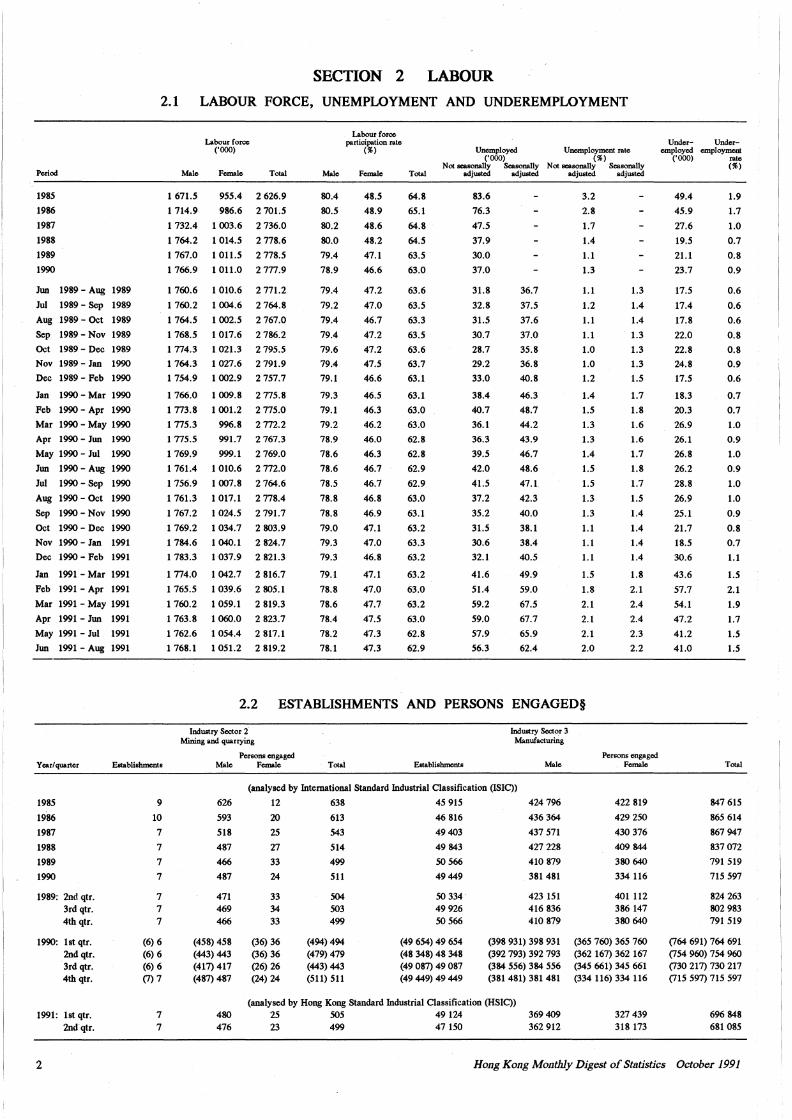
SECTION 2 LABOUR
2.1 LABOUR FORCE, UNEMPLOYMENT AND UNDEREMPLOYMENT
Period
1985
1986
1987
1988
1989
1990
Jun 1989 - Aug 1989
Jui 1989 - Sep 1989
Aug 1989 - Oct 1989
Sep 1989 - Nov 1989
Oct 1989 - Dec 1989
Nov 1989 - Jan 1990
Dec 1989- Feb 1990
Jan 1990 - Mar 1990
Feb 1990- Apr 1990
Mar 1990 - May 1990
Apr 1990 - Jun 1990
May 1990 - Jui 1990
Jun 1990- Aug 1990
Jui 1990 - Sep 1990
Aug 1990 - Oct 1990
Sep 1990 - Nov 1990
Oct 1990 - Dec 1990
Nov 1990 - Jan 1991
Dec 1990 - Feb 1991
Jan 1991 - Mar 1991
Feb 1991 - Apr 1991
Mar 1991 - May 1991
Apr 1991 - Jun 1991
May 1991 - Jui 1991
Jun 1991 - Aug 1991
Y car/ quarter Eatablishmcnts
1985
1986
1987
1988
1989
1990
1989: 2nd qtr. 3rd qtr. 4th qtr.
1990: lst qtr. 2nd qtr. 3rd qtr. 4th qtr.
1991: lst qtr. 2nd qtr.
2
9
10
7
7
7
7
7 7 7
(6) 6 (6) 6 (6) 6 (7) 7
7 7
Labour force ('OOO)
Labour force participation rate
(%) Unemployed Unemployment rate ('000) (%)
Not seasonally Seasonally Not seasonally Seasonally Male Female Total Male Female Total adjusted adjusted adjusted adjusted
1 671.5
1 714.9
1 732.4
1 764.2
1 767.0
1 766.9
1 760.6
1 760.2
1 764.5
1 768.5
1 774.3
1 764.3
1 754.9
1 766.0
1 773.8
1 775.3
1115.5
1 769.9
1 761.4
1 756.9
1 761.3
1 767.2
1 769.2
1 784.6
1 783.3
1 774.0
1 765.5
1 760.2
1 763.8
1 762.6
1 768.1
955.4 2 626.9
986.6 2 701.5
1 003.6 2 736.0
1 014.5 2 778.6
1 011.5 2 778.5
1 011.0 2 777.9
1 010.6
1 004.6
1 002.5
1 017.6
1 021.3
1 027.6
1002.9
1 009.8
1 001.2
996.8
991.7
999.1
1 010.6
1 007.8
1 017.1
1 024.5
1 034.7
1 040.1
1 037.9
1 042.7
1 039.6
1 059.1
1060.0
1 054.4
1 051.2
2 771.2
2 764.8
2 767.0
2 786.2
2 195.5
2 791.9
2 757.7
2 775.8
2 775.0
2 772.2
2 767.3
2 769.0
2 772.0
2 764.6
2 778.4
2 791.7
2 803.9
2 824.7
2 821.3
2 816.7
2 805.1
2 819.3
2 823.7
2 817.1
2 819.2
80.4
80.5
80.2
80.0
79.4
78.9
79.4
79.2
79.4
79.4
79.6
79.4
79.1
79.3
79.1
79.2
78.9
78.6
78.6
78.5
78.8
78.8
79.0
79.3
79.3
79.1
78.8
78.6
78.4
78.2
78.l
48.5
48.9
48.6
48.2
47.1
46.6
47.2
47.0
46.7
47.2
47.2
47.5
46.6
46.5
46.3
46.2
46.0
46.3
46.7
46.7
46.8
46.9
47.1
47.0
46.8
47.l
47.0
47.7
47.5
47.3
47.3
64.8
65.1
64.8
64.5
63.5
63.0
63.6
63.5
63.3
63.5
63.6
63.7
63.1
63.1
63.0
63.0
62.8
62.8
62.9
62.9
63.0
63.1
63.2
63.3
63.2
63.2
63.0
63.2
63.0
62.8
62.9
83.6
76.3
47.5
37.9
30.0
37.0
31.8
32.8
31.5
30.7
28.7
29.2
33.0
38.4
40.7
36.1
36.3
39.5
42.0
41.5
37.2
35.2
31.5
30.6
32.1
41.6
51.4
59.2
59.0
51.9
56.3
36.7
31.5
37.6
37.0
35.8
36.8
40.8
46.3
48.7
44.2
43.9
46.7
48.6
47.1
42.3
40.0
38.1
38.4
40.5
49.9
59.0
67.5
67.7
65.9
62.4
3.2
2.8
1.7
1.4
1.1
1.3
1.1
1.2
1.1
1.1
1.0
1.0
1.2
1.4
1.5
1.3
1.3
1.4
1.5
1.5
1.3
1.3
1.1
1.1
1.1
1.5
1.8
2.1
2.1
2.1
2.0
1.3
1.4
1.4
1.3
1.3
1.3
1.5
1.7
1.8
1.6
1.6
1.7
1.8
1.7
1.5
1.4
1.4
1.4
1.4
1.8
2.1
2.4
2.4
2.3
2.2
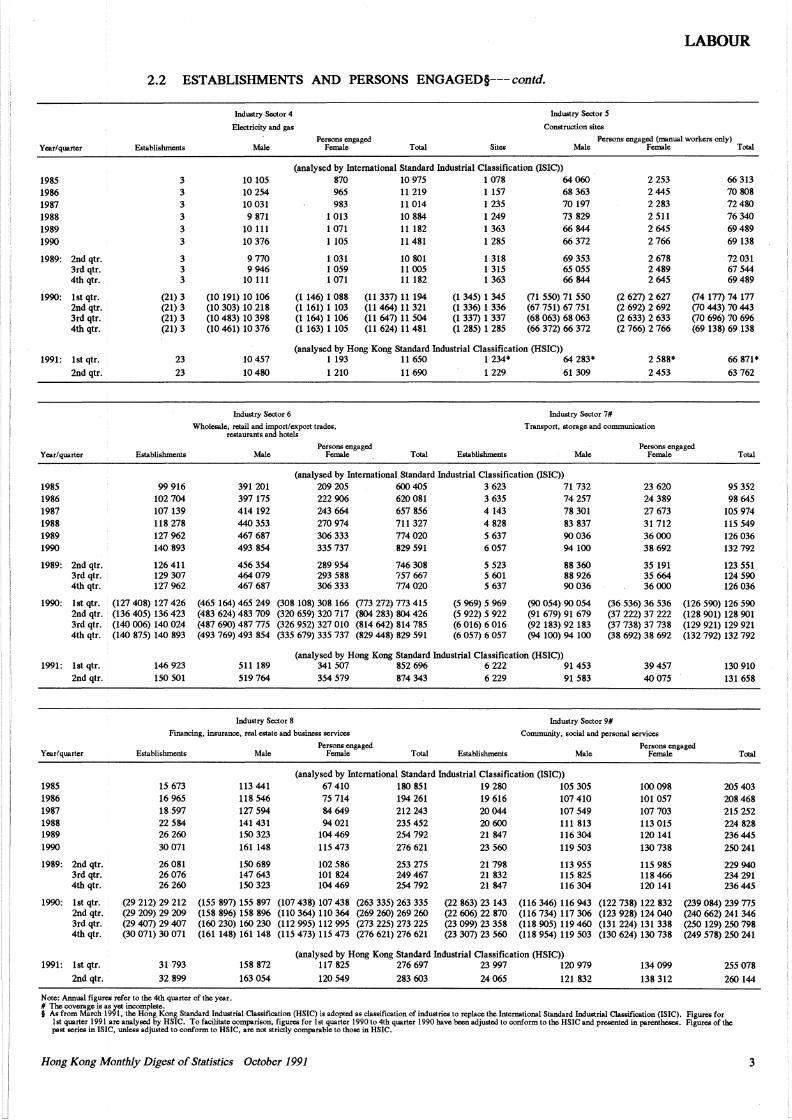
2.2 ESTABLISHMENTS AND PERSONS ENGAGED§
Industry Sector 2 Mining and quarrying
Persons engaged Male Female Total Eatablishments
Industry Sector 3 Manufacturing
Male
(analysed by International Standard Industrial Classification (!SIC))
626
593
518
487
466
487
471 469 466
(458) 458 (443) 443 (417) 417 (487) 487
u ~8 ti9~
20
25
27
33
24
33 34 33
(36) 36 (36) 36 (26) 26 (24) 24
613
543
514
499
511
504 503 499
(494) 494 (479) 479 (443) 443 (511) 511
46 816
49403
49 843
50 566
49449
50334 49 926 50 566
(49 654) 49 654 (48 348) 48 348 (49 087) 49 087 (49 449) 49 449
424 796
436 364
437 571
427 228
410 879
381 481
423 151 416 836 410 879
(398 931) 398 931 (392 793) 392 793 (384 556) 384 556 (381 481) 381 481
(analysed by Hong Kong Standard Industrial Classification (HSIC)) 480 25 505 49 124 369 409 476 23 499 47 150 362 912
Persons engaged Female
422 819
429 250
430 376
409 844
380 640
334 116
401 112 386 147 380 640
(365 760) 365 760 (362 167) 362 167 (345 661) 345 661 (334 116) 334 116
327 439 318 173
Under- Under-employed employment
('000) rate
49.4
45.9
27.6
19.5
21.1
23.7
17.5
17.4
17.8
22.0
22.8
24.8
17.5
18.3
20.3
26.9
26.1
26.8
26.2
28.8
26.9
25.1
21.7
18.5
30.6
43.6
51.1
54.1
47.2
41.2
41.0
(%)
1.9
1.7
1.0
0.7
0.8
0.9
0.6
0.6
0.6
0.8
0.8
0.9
0.6
0.7
0.7
1.0
0.9
1.0
0.9
1.0
1.0
0.9
0.8
0.7
1.1
1.5
2.1
1.9
1.7
1.5
1.5
Total
847 615
865 614
867 947
837 072
791 519
115 591
824 263 802 983 791 519
(764 691) 764 691 (754 960) 754 960 (730 217) 730 217 (715 597) 115 597
696 848 681 085
Hong Kong Monthly Digest of Stiltistics October 1991
•I
!
j
Year/ quarter
1985 1986 1987 1988 1989 1990
1989: 2nd qtr. 3rd qtr. 4th qtr.
1990: lst qtr. 2nd qtr. 3rd qtr. 4th qtr.
1991: lst qtr.
2nd qtr.
Year/ quarter
1985 1986 1987 1988 1989 1990
1989: 2nd qtr. 3rd qtr. 4th qtr.
1990: lst qtr. 2nd qtr. 3rd qtr. 4th qtr.
1991: lst qtr. 2nd qtr.
Year/ quarter
1985 1986 1987 1988 1989 1990
1989: 2nd qtr. 3rd qtr. 4th qtr.
1990: lst qtr. 2nd qtr. 3rd qtr. 4th qtr.
1991: lstqtr.
2nd qtr.
LABOUR
2.2 ESTABLISHMENTS AND PERSONS ENGAGED§---contd.
Establishments
3 3 3 3 3 3
3 3 3
(21) 3 (21) 3 (21) 3 (21) 3
23
23
Establishments
99 916 102 704 107 139 118 278 127 962 140 893
126 411 129 307 127 962
(127 408) 127 426 (136 405) 136 423 (140 006) 140 024 (140 875) 140 893
146 923 150 501
Industry Sector 4
Electricity and gas
Industry Sector 5
Construction sites
Persons engaged Female
Persons engaged (manual workers only) Male Total Sites Male Female Total
10 105 10 254 10 031 9 871
10 111 10 376
9770 9 946
10 111
(10 191) 10 106 (10 303) 10 218 (10 483) 10 398 (10 461) 10 376
10 457
10 480
Industry Sector 6
(analysed by International Standard Industrial Classification (lSIC)) 870 10 975 1 078 64 060 965 983
1013 1 071 1105
1 031 1 059 1071
(1 146) 1 088 (1 161) 1 103 (1 164) 1 106 (1163) 1 105
11 219 11 014 10 884 11182 11481
10 801 11 005 11182
(11 337) 11 194 (11 464) 11 321 (11 647) 11 504 (11 624) 11 481
1157 1 235 1249 1 363 1285
1 318 1 315 1 363
(1 345) 1 345 (1 336) 1 336 (1 337) 1 337 (1 285) 1 285
68 363 70 197 73 829 66 844 66 372
69 353 65 055 66 844
(71 550) 71 550 (67 751) 67 751 (68 063) 68 063 (66 372) 66 372
(analysed by Hong Kong Standard Industrial Classification (HSIC)) 1 193 11 650 1 234* 64 283*
1 210 11 690 1 229 61 309
Industry Sector 7#
2 253 2 445 2 283 2 511 2 645 2 766
2 678 2489 2 645
(2 627) 2 627 (2 692) 2 692 (2 633) 2 633 (2 766) 2 766
2 588*
2 453
Wholesale, retail and import/export trades, restaurants and hotels
Transport, storage and communication
66 313 70 808 72480 76 340 69 489 69138
72 031 67 544 69 489
(74 177) 74 177 (70 443) 70 443 (70 696) 70 696 (69 138) 69 138
66 871*
63 762
Male Persons engaged
Female Total Establisbrnents Male Persoru;: engaged
Female Total
(analysed by International Standard Industrial Classification (ISIC)) 391 201 397 175 414 192 440 353 467 687 493 854
209 205 600 405 3 623 71 732
456 354 464 079 467 687
222 906 243 664 270 974 306 333 335 737
289 954 293 588 306 333
620 081 657 856 711 327 774 020 829 591
746 308 757 667 774 020
(465 164) 465 249 (308 108) 308 166 (773 272) 773 415 (483 624) 483 709 (320 659) 320 717 (804 283) 804 426 (487 690) 487 775 (326 952) 327 010 (814 642) 814 785 (493 769) 493 854 (335 679) 335 737 (829 448) 829 591
3 635 4 143 4 828 5 637 6057
5 523 5 601 5 637
(5 969) 5 969 (5 922) 5 922 (6 016) 6 016 (6 057) 6 057
74 257 78 301 83 837 90036 94 100
88 360 88 926 90036
(90 054) 90 054 (91 679) 91 679 (92 183) 92 183 (94 100) 94 100
(analysed by Hong Kong Standard Industrial Classification (HSIC)) 511189 519 764
341 507 852 696 6 222 91 453 354 579 874 343 6229 91 583
23 620 24 389 27 673 31 712 36000 38 692
35 191 35 664 36000
(36 536) 36 536 (37 222) 37 222 (37 738) 37 738 (38 692) 38 692
39457 40 075
Industry Sector 8 Industry Sector 9#
95 352 98 645
105 974 115 549 126 036 132 792
123 551 124 590 126 036
(126 590) 126 590 (128 901) 128 901 (129 921) 129 921 (132 792) 132 792
130 910 13J 658
Financing, insurance, real estate and business services
Persons engaged
Community, social and personal services
Persons engaged Establishments Male Female Total Establishments Male Female Total
(analysed by International Standard Industrial Classification (lSIC)) 15 673 16 965 18 597 22 584 26 260 30071
113 441 118 546 127 594 141 431 150 323 161 148
67 410 180 851 19 280 105 305 100 098 101 057 107 703 113 015 120 141 130 738
205 403 208 468 215 252 224 828 236 445
250 241
26 081 26076 26 260
150 689 147 643 150 323
75 714 84 649 94 021
104 469 115 473
102 586 101 824 104 469
194 261 212 243 235 452 254 792 276 621
253 275 249467 254 792
(29 212) 29 212 (155 897) 155 897 (107 438) 107 438 (263 335) 263 335 (29 209) 29 209 (158 896) 158 896 (110 364) 110 364 (269 260) 269 260 (29 407) 29 407 (160 230) 160 230 (112 995) 112 995 (273 225) 273 225 (30 071) 30 071 (161 148) 161 148 (115 473) 115 473 (276 621) 276 621
19 616 20044 20600 21 847 23 560
21 798 21 832 21 847
107 410 107 549 111 813 116 304 119 503
113 955 115 825 116 304
115 985 118 466 120 141
229 940 234 291 236 445
(22 863) 23 143 (116 346) 116 943 (122 738) 122 832 (239 084) 239 775 (22 606) 22 870 (116 734) 117 306 (123 928) 124 040 (240 662) 241 346 (23 099) 23 358 (118 905) 119 460 (131 224) 131 338 (250 129) 250 798 (23 307) 23 560 (118 954) 119 503 (130 624) 130 738 (249 578) 250 241
(analysed by Hong Kong Standard Industrial Classification (HSIC)) 31 793
32 899
158 872
163 054
117 825 276 697 23 997 120 979
120 549 283 603 24065 121 832
134 099
138 312
255 078
260 144
Note: Annual figures refer to the 4th quarter of the year. # The coverage is as yet incomplete. § As from March 1991, the Hong Kong Standard Industrial Classification (HSIC) is adopted as classification of industries to replace the International Standard Industrial Classification (!SIC). Figures for
lst quarter 1991 are analysed by HSIC. To facilitate comparison, figures for lst quarter 1990 to 4th quarter 1990 have been adjusted to conform to the HSIC and presented in parentheses. Figures of the past series in ISIC, unless adjusted to conform to HSIC, are not strictly comparable to those in HSIC.
Hong Kong Monthly Digest of Statistics October 1991 3
LABOUR
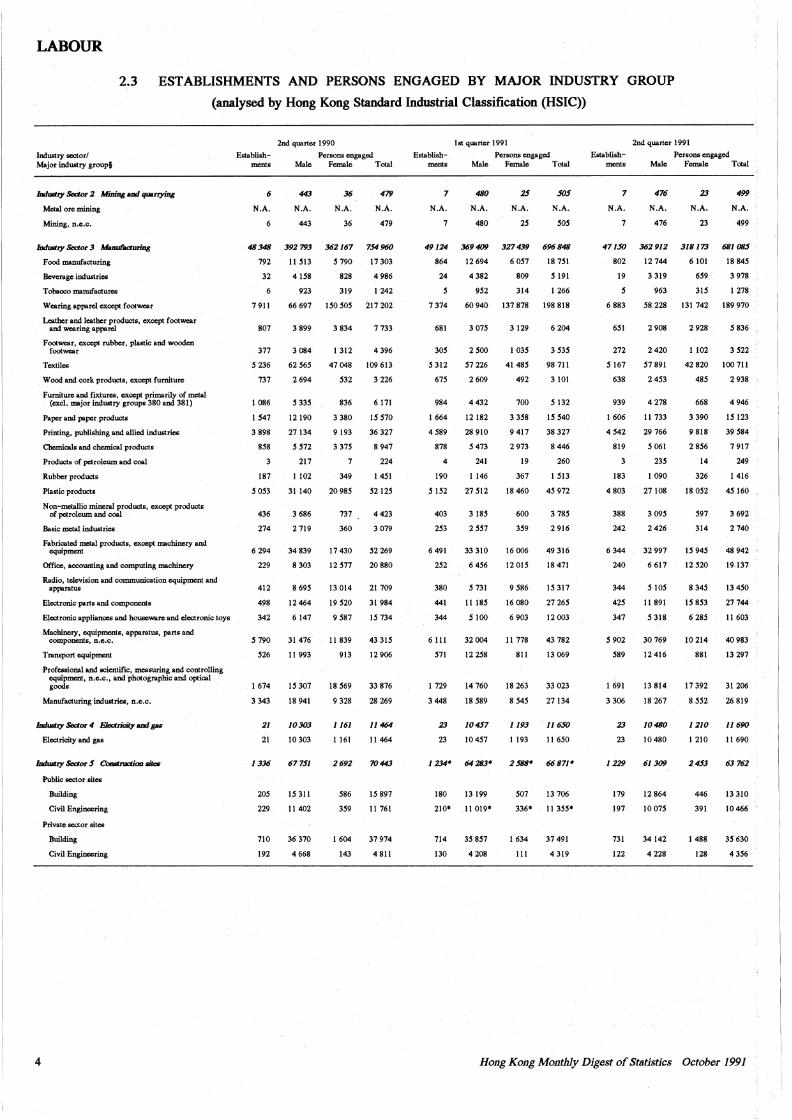
2.3 ESTABLISHMENTS AND PERSONS ENGAGED BY MAJOR INDUSTRY GROUP
(analysed by Hong Kong Standard Industrial Classification (HSIC))
Industry sector/ Major industry group§
,,,,,,,.,,,. Seclor 2 MmiD&-' quanyiD&
Metal ore mining
Mining, n.e.c.
/JJdJ1liUy Seaor3 ~
Food manufacturing
Beverage industries
Tohscco manufactures
Wearing appaiel except footwoar
Leather and leather products, except footwoar and woaring appaiel
Footwoar, except rubber, plastic and wooden footwoar
Toxtilcs
Wood and cork prod\!Cts, cxocpt furniture
·Furniture and f'ixtures, except primarily of mdal (excl. major industry groups 380 and 381)
Paper and paper products
Prinling, publishing and allied industries
Chemicals and chemical products
Products of petroleum and cos!
Rubber products
Plasiic products
N on-mdallic mineral products, except products of petroleum and cos!
Basic mdal industries
Fabricated mdal products, except machinery and . cquipmcm
Office, aoooWlling and computing machinery
Radio,· television and communication equipmcm and apparatus
Electronic parts and componcnls
E!cctronic appliances and ·houscware and electronic toys
Machinery, equipmcms, apparatus, parts and components, n.e.c.
Transport cquipmcm
Professional and scientific, measuring and controlling cquipmcm, n.e.c., and photographic and optical goods
Manufacturing industries, n.e.c.
/JJdJ1liUy Sedor 4 Elet:Uidty -1 ,,_
Electricity and gas
Public sector sites
Building
Civil Engineering
Private sector sites
Building
Civil Engineering
4
Establishments
6
N.A.
6
48348
792
32
6
7911
807
377
S236
737
I 086
I S47
3898
8S8
3
187
s OS3
436
274
6 294
229
412
498
342
S790
S26
1674
3343
21
21
1336
205
229
710
192
2nd quarter 1990
Persons engaged Male Female Total
443
N.A.
443
3921!13
ll S13
4 IS8
923
66697
3899
3084
62S6S
2694
s 33S
12190
27134
ss12 217
1102
31140
3 686
2 719
34 839
8 303
8 695
12464
6147
31476
11993
15307
18941
10303
10303
67751
l.!i 311
11402
36370
4 668
36 479
N.A. N.A.
36 479
362 167 754 960
s 190 17 303
828 4 986
319 I 242
ISOSOS 217202
3 834 7 733
1312 4 396
47 048 109 613
S32 3 226
836 6 171
3 380 IS S10
9 193 36 327
3 37S 8 947
7 224
349 I 4SI
20 98S S212S
737 4423
360 3079
17 430 52 269
12 S77 20 880
13 014 21 709
19 S20 31 984
9 587 IS 734
11 839 43 315
913 12 906
18 S69 33 876
9 328 28 269
1161 11 464
1161 11 464
2692 70443
S86
3S9
1604
143
IS 897
11 761
37974
4811
Establishmcols
ht quarter 1991
Persom engaged Maie Female Total
7 4liO 25 505
N.A. N.A. N.A. N.A.
7 480 25 SOS
49124 369 409 327 439 696 848
864 12 694 6 OS1 18 7Sl
24 4 382 809 s 191
S 9S2 314 I 266
7 374 60 940 137 878 198 818
681 3 075 3 129 6 204
305 2 SOO I 03S 3 S3S
5312 51226 41 48S 98 711
675 2 609 492 3 101
984 4 432 700 s 132
I 664 12 182 3 3S8 IS S40
4 S89 28 910 9 417 38 327
.878 s 473 2 973 8 446
4 241 19 260
190 I 146 367 I S13
s 152 27 S12 18 460 4S 972
403 3 18S 600 3 78S
2S3 2 SS7 3S9 2 916
6 491 33 310 16 006 49 316
2S2 6 4S6 12 OIS 18 471
380 S 731 9 586 IS 317
441 11 18S 16 080 27 26S
344 s 100 6 903 12 003
6 111 32 004 11 778 43 782
S71 12 258 811 13 069
I 729 14 760 18 263 33 023
3 448 18 S89 8 S4S 27 134
23 JO 457 1193 11 650
23 10 4S1 1193 11 650
180 13 199
210• 11 019*
714
130
3S8S1
4208
S07 13 706
336* 11 3SS•
I 634
111
37491
4319
Establishments
7
N.A.
7
471.10
802
19
s 6 883
6SI
272
5167
638
939
1606
4S42
819
3
183
4803
388
242
6344
240
344
42S
347
5902
S89
I 691
3 306
23
23
1229
179
197
731
122
2nd quarter 1991
Persons engaged Male Female Total
476
N.A.
476
362912
12 744
3319
963
S8228
2908
2420
S7891
24S3
4278
11 733
29766
S061
23S
I 090
27108
3 09S
2426
32 997
6617
SIOS
11891
5318
30769
12416
13814
18 267
10480
10480
61309
12864
l007S
34142
4228
23
N.A.
23
318173
6Hil
6S9
31S
131 742
2928
1102
42820
48S
668
3390
9 818
28S6
14
326
18052
597
314
IS 94S
12S20
8 34S
IS 853
6 28S
10214
881
17392
8SS2
1210
1210
2453
446
391
I 488
128
499
N.A.
499
681 OB.1
18 84S
3 978
I 278
189 970
s 836
3 S22
100 711
2938
.4946
IS 123
39584
7917
249
1416
45 160
3692
2 740
48942
19137
13450
27744
11 603
40 983
13 297
31206
26819
11690
11690
63762
13310
10466
35 630
4 356
Hong Kong Monthly Digest of Statistics October 1991
LABOUR
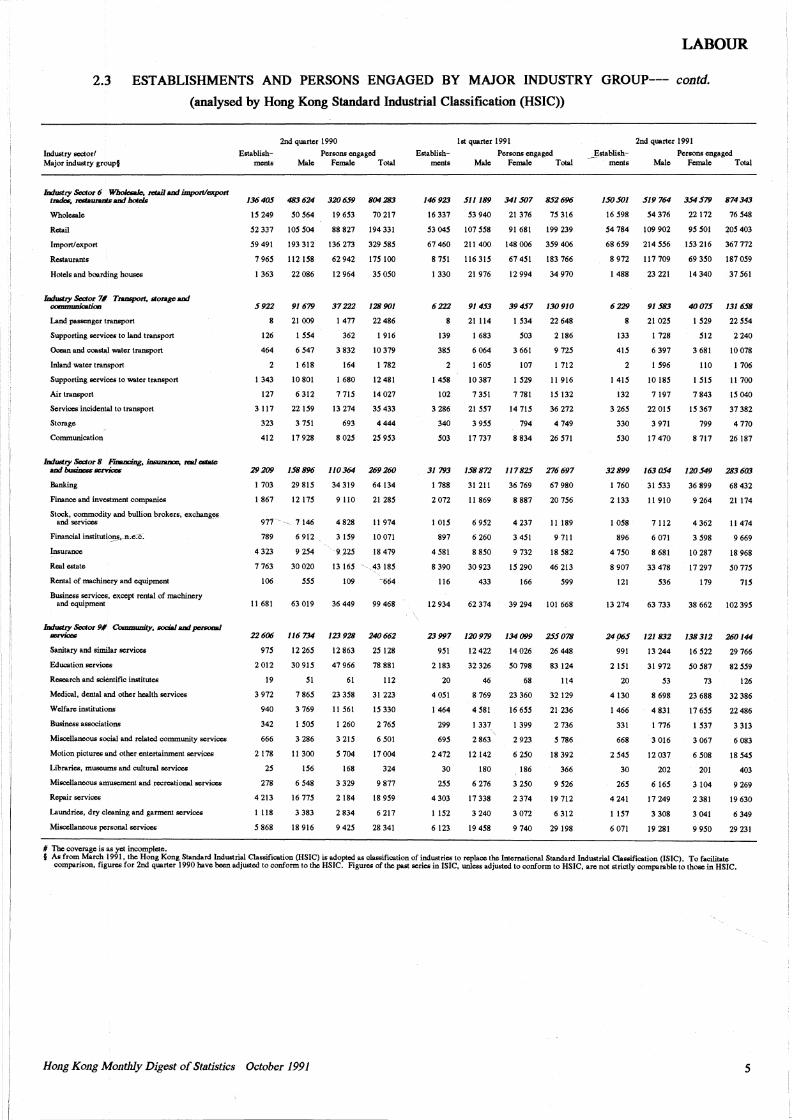
2.3 ESTABLISHMENTS AND PERSONS ENGAGED BY MAJOR INDUSTRY GROUP--- contd.
(analysed by Hong Kong Standard Industrial Classification (HSIC))
Industry sector/ Major industry group§
IDdustry Sector 6 Wholaoalc; man and import/<:JCport Inda, n»tllunmtsand botds
Wholesale
Retail
Import/export
Restaurants
Hotels and boarding houses
IDdustzy Sector 7# Transport, storage and comrmmicatioa
Land passenger transport
Supporting services to land transport
Ocean and coastal water transport
Inland water transport
Supporting services to water transport
Air transport
Services incidental to transport
Storage
Communication
Industry Sector 8 FJDtADCing, fusunDoc, real°"""" andbu&fut:ss~
Banking
Finance and investment companies
Stock, commodity and bullion brokers, exchange§ and services ,
Insuranoe
Real estate
Rental of machinery and equipment
Business services, except rental of machinery and equipment
Industry Sector 9# C'<Jmnnmity, tKJCial and pcn><XW ~
Sanitary and similar services
Education services
Research and scientific institutes
Medical, dental and other health services
Welfare institutions
Business associations
Miscellaneous social and related community services
Motion pictures and other entertainment services
Libraries, museums and cultural services
Miscellaneous amusement and recreational services
Repair services
Laundries, dry cleaning and garment services
Miscellaneous personal services
# The coverage is as yet incomplete.
Establishments
2nd quarter 1990
Persons engaged Male Female Total
136 405 483 624 320 659 804 283
15249 50564 19653 70217
52337 105504 88827 194331
59491 193312 136273 329585
7965 112158 62942 175100
1 363 22 086 12 964 35 050
$922 91679 37222 128901
126
464
21 009
1 554
6 547
1 618
1 477
362
3 832
164
22 486
1 916
10 379
1 782
1 343 10 801 1 680 12 481
127 6 312 7 715 14 027
3117 22159 13274 35433
323 3 751 693 4 444
412 17928 8025 25953
29 209 1$8 896 110 364 269 260
1 703 29 815 34 319 64 134
1 867 12 175 9 110 21 285
977 7 146 4 828 11 974
789 6 9(2 3 159 10 071
4 323 9 254 9. 225 18 479
7 763 30020 13 165 ' .43 185
106 555 109 ~664
11681 63019 36449 99468
22 606 116 734 123 928 240 662
975 12 265 12 863 25 128
2012 30915 47966 78881
19 51 61 112
3 972 7 865 23 358 31 223
940 3 769 11 561 15 330
342 1 505 1 260 2 765
666 3 286 3 215 6 501
2178 11300 5704 17004
25 156 168 324
278 6 548 3 329 9 877
4 213 16 775 2 184 18 959
1118 3383 2834 6217
5868 18916 9425 28341
lst quarter 1991 2nd quarter 1991
Establishments
Persons engaged __ Establish- Persons engaged Male Female Total ments Male Female Total
146923 $11189 341.507 8.52696
16 337 53 940 21 376 75 316
53045 107558 91681 199239
67 460 211 400 148 006 359 406
8 751 116 315 67 451 183 766
1 330 21 976 12 994 34 970
6222 914$3 394$7 130910
139
385
2
21 114
1 683
6 064
1605
1 534
503
3 661
107
22 648
2186
9 725
I 712
1 458 10 387 1 529 11 916
102 7 351 7 781 15 132
3 286 21 557 14 715 36 272
340 3 955 794 4 749
503 17 737 8 834 26 571
31 793 1$8 872 117 82.5 276 697
1 788 31 211 36 769 67 980
2 072 11 869 8 887 20 756
1 015 6 952 4 237 11 189
897 6 260 3 451 9 711
4 581 8 850 9 732 18 582
8 390 30923 15 290 46 213
116 433 166 599
12 934 62 374 39 294 101 668
23 997 120 979 134 099 2.5$ 078
951 12422 14026 26448
2 183 32 326 50 798 83 124
20 46 68 114
4 051 8 769 23 360 32 129
1 464 4 581 16 655 21 236
299 1 337 1 399 2 736
695 2 863 2 923 5 786
2 472 12 142 6 250 18 392
30 180 186 366
255 6 276 3 250 9 526
4303 17338 2374 19712
1 152 3 240 3 072 6 312
6 123 19 458 9 740 29 198
1.50.501 $19764 3.54$79 874343
16 598 54 376 22172 76 548
54 784 109 902 95 501 205 403
68 659 214 556 153 216 367 772
8 972 117 709 69 350 187 059
I 488 23 221 14 340 37 561
6 229 91 $83 40 07$ 131 6$8
133
415
2
21 025
1 728
6 397
1 596
1 529
512
3 681
110
22 554
2240
10 078
1 706
1 415 10 185 1 515 11 700
132 7 197 7 843 15 040
3265 22015 15367 37382
330 3 971 799 4 770
530 17 470 8 717 26 187
32899 1630$4 120549 283603
I 760 31 533 36 899 68 432
2 133 11 910 9 264 21 174
1 058 7 112 4 362 11 474
896 6 071 3 598 9 669
4 750 8 681 10 287 18 968
8 907 33 478 17 297 50 715
121 536 179 715
13 274 63 733 38 662 102 395
24 .065 121 832 138 312 260144
991 13244 16522 29766
2 151 31 972 50 587 82 559
20 53 73 126
4 130 8 698 23 688 32 386
1 466 4 831 17 655 22 486
331 1 776 1 537 3 313
668 3 016 3 067 6 083
2 545 12 037 6 508 18 545
30 202 20 I 403
265 6 165 3 104 9 269
4241 17249 2381 19630
1 157 3 308 3 041 6 349
6071 19281 9950 29231
§ As from March 1991, the Hong Kong Standard Industrial Classification (HSIC) is adopted as classification of industries to replace the International Standard Industrial Classification (ISIC). To facilitate comparison, figures for 2nd quarter 1990 have been adjusted to conform to the HSIC. Figures of the past series in !SIC, unless adjusted to conform to HSIC, are not strictly comparable to those in HSJC.
Hong Kong Monthly Digest of Statistics October 1991 5
I
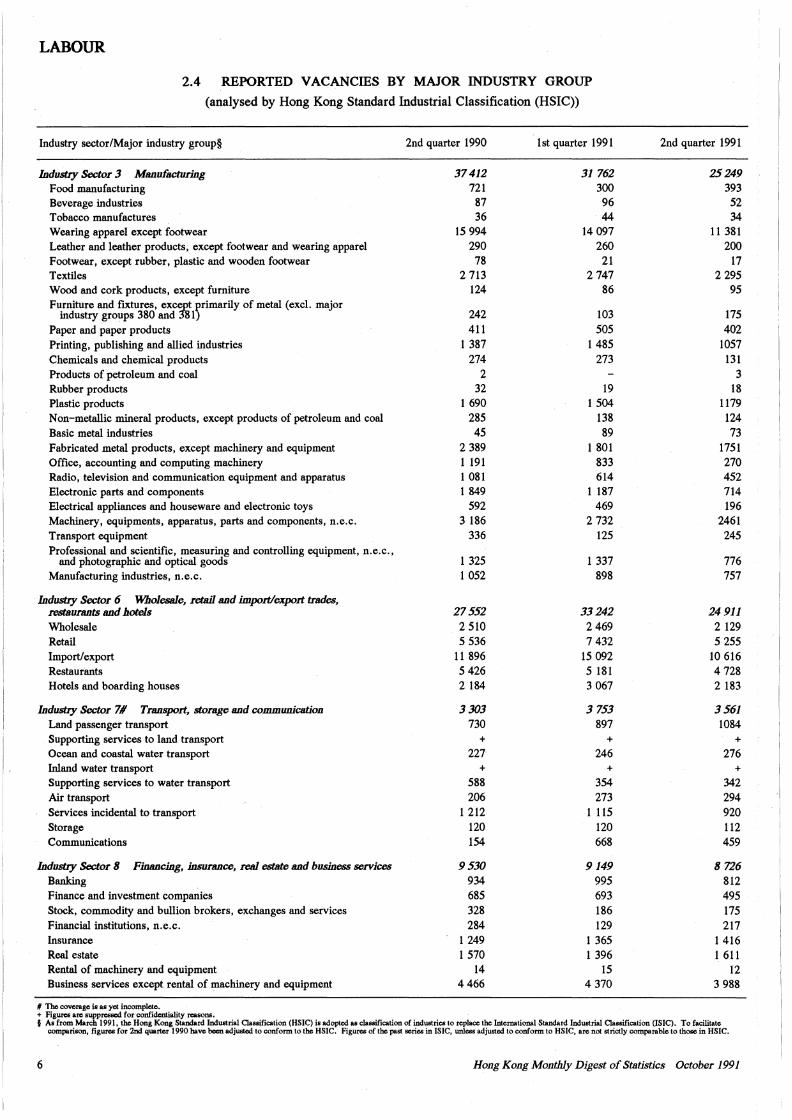
LABOUR
2.4 REPORTED VACANCIES BY MAJOR INDUSTRY GROUP
(analysed by Hong Kong Standard Industrial Classification (HSIC))
Industry sector/Major industry group§ 2nd quarter 1990 1 st quarter 1991 2nd quarter 1991
Industry Sector 3 Manufacturing 37412 31762 25249 Food manufacturing 721 300 393 Beverage industries 87 96 52 Tobacco manufactures 36 44 34 Wearing apparel except footwear 15 994 14 097 11 381 Leather and leather products, except footwear and wearing apparel 290 260 200 Footwear, except rubber, plastic and wooden footwear 78 21 17 Textiles 2 713 2 747 2 295 Wood and cork products, except furniture 124 86 95 Furniture and fixtures, exc~t rimarily of metal (excl. major
industry groups 380 and 81 242 103 175 Paper and paper products 411 505 402 Printing, publishing and allied industries 1 387 1485 1057 Chemicals and chemical products 274 273 131 Products of petroleum and coal 2 3 Rubber products 32 19 18 Plastic products 1 690 1 504 1179 Non-metallic mineral products, except products of petroleum and coal 285 138 124 Basic metal industries 45 89 73 Fabricated metal products, except machinery and equipment 2 389 l 801 1751 Office, accounting and computing machinery 1 191 833 270 Radio, television and communication equipment and apparatus 1 081 614 452 Electronic parts and components 1 849 1 187 714 Electrical appliances and houseware and electronic toys 592 469 196 Machinery, equipments, apparatus, parts and components, n.e.c. 3 186 2 732 2461 Transport equipment 336 125 245 Professional and scientific, measuring and controlling equipment, n.e.c.,
and photographic and optical goods 1 325 1 337 776 Manufacturing industries, n.e.c. 1 052 898 757
Industry Sector 6 Wholesale, reW1 and import/ex.port trades, restaurants and hotels 27552 33242 24911 Wholesale 2 510 2 469 2 129 Retail 5 536 7 432 5 255 Import/export 11 896 15 092 10 616 Restaurants 5 426 5 181 4 728 Hotels and boarding houses 2 184 3 067 2 183
Industry Sect.or 7# Transport, storage and communication 3303 3753 3561 Land passenger transport 730 897 1084 Supporting services to land transport + + + Ocean and coastal water transport 227 246 276 Inland water transport + + + Supporting services to water transport 588 354 342 Air transport 206 273 294 Services incidental to transport 1 212 1 115 920 Storage 120 120 112 Communications 154 668 459
Industry Sect.or 8 Financing, insurance, real estate and business services 9530 9149 8726 Banking 934 995 812 Finance and investment companies 685 693 495 Stock, commodity and bullion brokers, exchanges and services 328 186 175 Financial institutions, n.e.c. 284 129 217 Insurance 1 249 1 365 1 416 Real estate 1 570 1 396 1 611 Rental of machinery and equipment 14 15 12 Business services except rental of machinery and equipment 4466 4 370 3 988
# The coverage is as yet incomplete. + Figures arc suppressed for confidentiality reasons. § As from March 1991, the Hong Kong Standard Industrial Classification (HSIC) is adopted as classification of industries to replace the International Standard Industrial Classification (ISIC). To facilitate
comparison, figures for 2nd quarter 1990 have been adjusted to conform to the HSIC. Figures of the past series in !SIC, unless adjusted to conform to HSIC, are not strictly comparable to those in HSIC.
6 Hong Kong Monthly Digest of Statistics October 1991
LABOUR
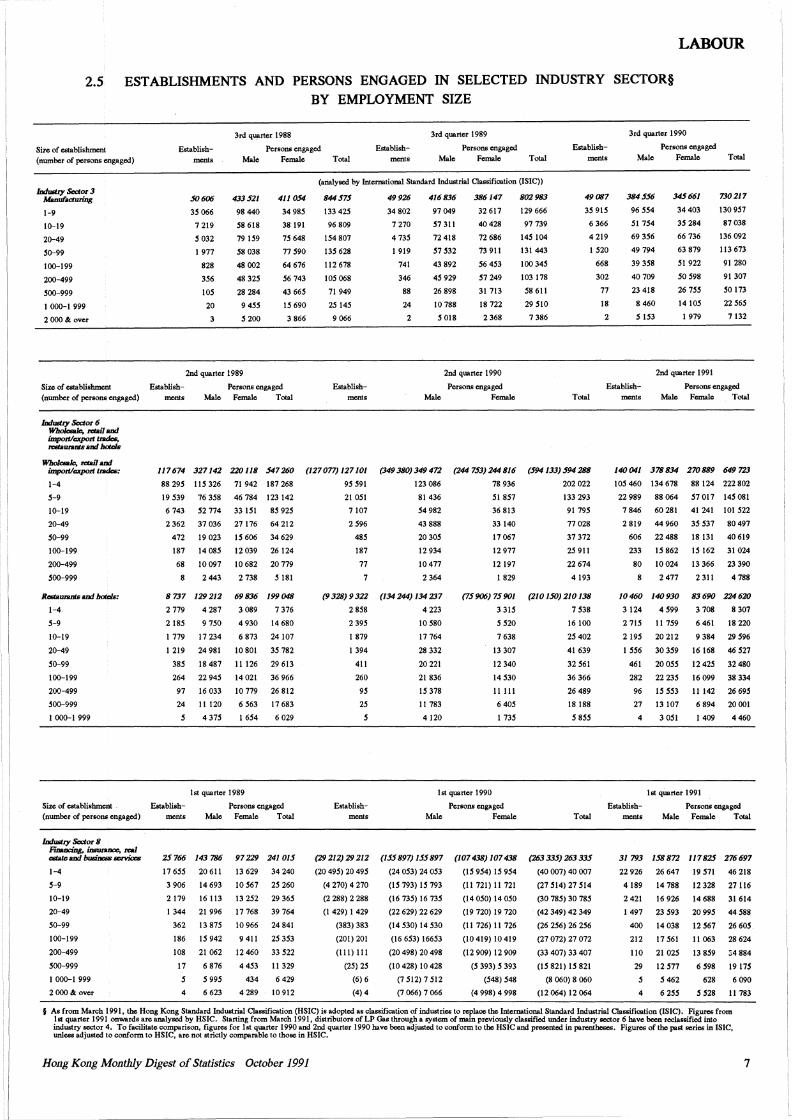
2.5 ESTABLISHMENTS AND PERSONS ENGAGED IN SELECTED INDUSTRY SECTOR§ BY EMPLOYMENT SIZE
3rd quarter 1988 3rd quarter 1989 3rd quarter 1990
Sue of cstablishmen! (number of persons engaged)
Establishments
Persons engaged Establishments
Persons engaged Establishments
Persons engaged
Male Female Total Male Female Total Male Female Total
Industry S«tor 3 Manufaauring
1-9
10-19
20-49
S0-99
100-199
200-499
S00-999
I 000-1 999
2 OOO & over
50606
3S 066
7219
s 032
I 977
828
3S6
IOS
20
433521
98 440
S8 618
79 IS9
S8 038
48 002
48 32S
28 284
9 4SS
s 200
2nd quarter 1989
411054
34 98S
38 191
7S 648
77 S90
64 676
S6 743
43 66S
IS 690
3 866
Size of establishment Establish- Persons engaged (number of persons engaged) mcnts Male Female Total
(analysed by International Standard Industrial Classification (ISIC))
844575
133 42S
96 809
IS4 807
13S 628
112 678
105 068
71 949
2S 14S
9 066
Establishments
49 926
34 802
7 270
4 73S
I 919
741
346
88
24
2
416836
97 049
S7 311
72418
S7 S32
43 892
45 929
26 898
10 788
s 018
386147
32 617
40 428
72 686
73 911
S6 4S3
S7 249
31 713
18 722
2 368
2nd quarter 1990
Persons engaged Male Female
802983
129 666
97 739
14S 104
131 443
100 34S
103 178
58 611
29 SIO
7 386
49087
3S 91S
6 366
4219
1520
668
302
77
18
2
384556
96 554
SI 7S4
69 356
49 794
39 358
40709
23 418
8 460
s 153
345661
34 403
3S 284
66 736
63 879
SI 922
so S98
261SS
14 IOS
I 979
2nd quarter 1991
730217
130 9S7
87038
136 092
113 673
91 280
91 307
so 173
22 S6S
7132
Establish- Persons engaged Total mcnts Male Female Total
Wbokstk, n:taiJ and imponle:icport tndes: 117674 327142 220118 547260 (127077)127101 (349380)349472 (244753)244816 (594133)594288 140 041 3'18 834 270 889 649 723
1-4
S-9
10-19
20-49
S0-99
100-199
200-499
S00-999
RemUlllDls and bott:ls:
1-4
S-9
10-19
20-49
S0-99
100-199
200-499
S00-999
I 000-1 999
88 29S I IS 326 71 942 187 268
19 539 76 3S8 46 784 123 142
6 743 S2 774 33 IS! 85 92S
2362 37036 27176 64212
472 19023 IS606 34629
187 14 08S 12 039 26 124
68 10 097 10 682 20 779
8 2443 2738 S 181
8 737 129212
2 779 4 287
2 185 9 7SO
I 779
I 219
385
264
97
24
s
17 234
24 981
18 487
22 94S
16 033
II 120
4 37S
69 836 199 048
3 089 7 376
4 930 14 680
6 873
10 801
II 126
14 021
10 779
6563
I 6S4
24 107
3S 782
29 613
36 966
26 812
17 683
6 029
lst quarter 1989
Size of establishment . Establish- Persons engaged (number of persons•cngaged) mcnts Male Female Total
Industry S«tor 8 FmanciDg. mswanco, real - and busint:ss st:nioc6 1-4
S-9
10-19
20-49
S0-99
100-199
200-499
S00-999
I 000-1 999
2 OOO & over
25 766 143 '186 97 229 241 015
17 6SS
3 906
2 179
I 344
362
186
108
17
s 4
20 611
14 693
16 113
21 996
13 87S
15 942
21 062
6 876
s 99S
6 623
13 629
10 S67
13 2S2
17 768
10 966
9 411
12 460
4 4S3
434
4 289
34 240
2S 260
29 36S
39 764
24 841
2S 3S3
33 S22
11 329
6 429
10 912
9S S91
21 OSI
7107
2 S96
48S
187
77
123 086
81 436
54 982
43 888
2030S
12 934
10477
2 364
(9 328) 9 322 (134 244) 134 237
2 SSS 4 223
239S !OSSO
I 879
I 394
411
260
9S
25
s
17 764
28 332
20 221
21 836
IS 378
11 783
4120
78 936
51 8S7
36 813
33 140
17067
12 977
12 197
I 829
(75906) 75901
3 31S
s S20
7 638
13 307
12 340
14 S30
11 Ill
6 40S
I 73S
I st quarter 1990
Persons engaged
202 022
133 293
91 79S
77 028
37 372
25 911
22 674
4 193
(210150) 210138
7 S38
16100
2S 402
41 639
32 S61
36 366
26 489
18 188
s 8S5
IOS460 134678 88124 222802
22 989 88 064 S7 017 14S 081
7 846 60 281 41 241 IOI S22
2 819 44 960 3S S37 80 497
606 22 488 18 131 40 619
233 IS 862 IS 162 31 024
80 10024 13366 23390
2 477 2 311 4 788
10 460 140 930 83 690 224 620
3124 4S99 3708 8307
2 71S II 7S9 6 461 18 220
219S
I SS6
461
282
96
27
4
Establish-
20212
30 3S9
20 oss 22 23S
15 SS3
13107
3 OSI
9 384
16 168
12 425
16 099
II 142
6 894
I 409
lst quarter 1991
29 S96
46 527
32480
38 334
26 69S
20001
4460
Persons engaged Establishments Male Female Total mcnts Male Female Total
(29 212) 29 212 (155 897) 155 897 (107 438) 107 438 (263 335) 263 335
(20 49S) 20 49S
(4 270) 4 270
(2 288) 2 288
(I 429) I 429
(383) 383
(201) 201
(111) 111
(2S) 2S
(6) 6
(4) 4
(24 OS3) 24 OS3
(IS 793) IS 793
(16 735) 16 73S
(22 629) 22 629
(14 S30) 14 S30
(16 6S3) 166S3
(20 498) 20 498
(10 428) 10 428
(7 Sl2) 7 512
(7 066) 7 066
(IS 954) IS 9S4
(II 721) 11 721
(14 OSO) 14 050
(19 720) 19 720
(I I 726) II 726
(10419) 10419
(12909) 12909
(S 393) S 393
(548) 548
(4 998) 4 998
( 40 007) 40 007
(27 Sl4) 27 Sl4
(30 78S) 30 78S
(42 349) 42 349
(26 2S6) 26 2S6
(27 072) 27 072
(33 407) 33 407
(15821) 15821
(8 060) 8 060
(12 064) 12 064
31793 158872 117825 276697
22 926
4 189
2421
I 497
400
212
110
29
s 4
26 647
14 788
16 926
23 593
14 038
17 S61
21 02S
12 S77
s 462
6 2SS
19 S11
12 328
14 688
20 99S
12 S67
II 063
13 8S9
6 S98
628
s S28
46 218
27116
31 614
44 SSS
26 60S
28 624
34 884
19 17S
6 090
11783
§ As from March 1991, the Hong Kong Standard Industrial Classification (HSIC) is adopted as classification of industries to rq>lacc the International Standard Industrial Classification (!SIC). Figures from I st quarter 1991 onwards are analysed by HSJC. Starting from March 1991, distributors of LP Gas through a system of main previously classified under industry sector 6 have been reclassified into industry sector 4. To facilitate comparison. figures for lst quarter 1990 and 2nd quarter 1990 have been adjusted to conform to the HSIC and presented in parentheses. Figures of the past series in ISIC, unless adjusted to conform to HSIC, are not strictly comparable to those in HSIC.
Ho11g Kong Monthly Digest of Statistics October 1991 7
LABOUR
Purpose
General public services
General administration
Public order and safety
Police
Judiciary and correctional scrvic~
Fire protection
Education
Health
Social security and welfare services
Housing and community amenities
Housing
Community infrastructure
Sanitary scrvices
Other community and social services
Recreation and related cultural services
Economic servicc.s
8
Agriculture, fisheries and forestry
Mining, manufacturing
Water
Land transport
Water transport
Air transport
Commerce and industry
Post services
To"'1
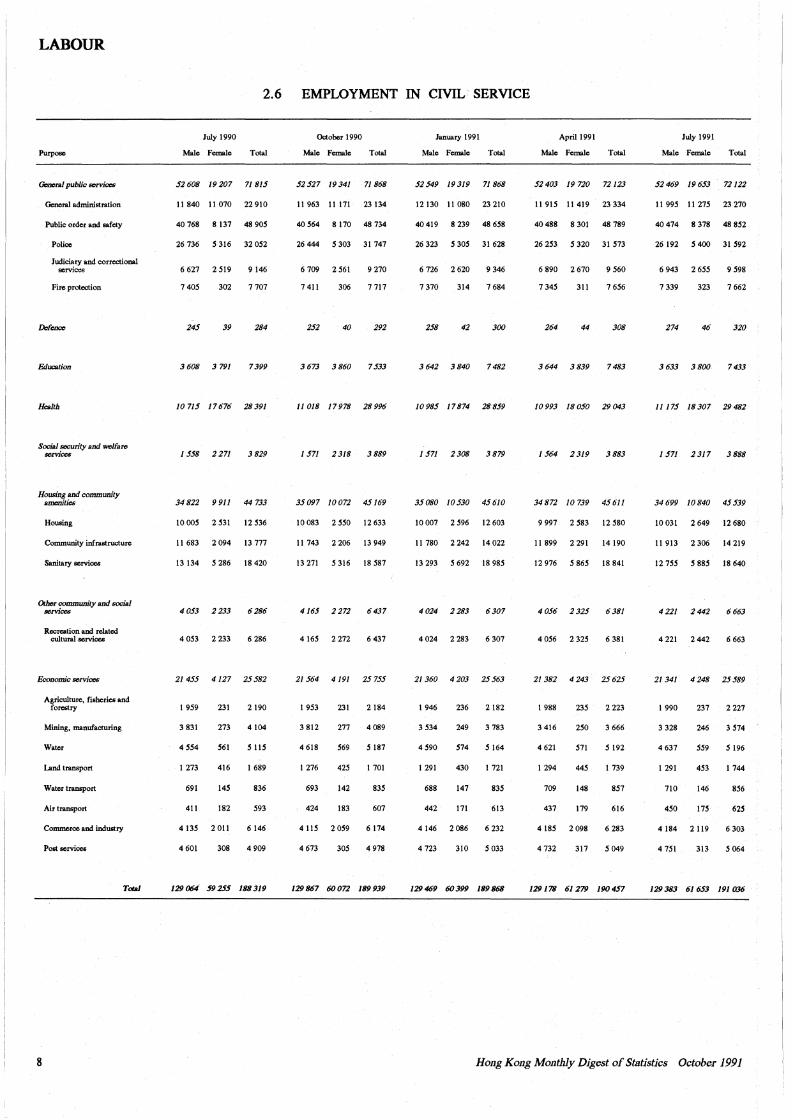
2.6 EMPLOYMENT IN CIVIL. SERVICE
July 1990 October 1990 January 1991 April 1991 July 1991
Male Female Total Male Female Total Male Female Total Male Female Total Male Female Total
52 608 19 207 71 815 52 527 19 341 71 868 52 549 19 319 71 868 52 403 19 720 72 123 52 469 19 653 72122
II 840 II 070 22 910 II 963 II 171 23 134 12 130 II 080 23 210 11 915 II 419 23 334 II 995 II 275 23 270
40 768 8 137 48 905 40 564 8 170 48 734 40419 8239 48658 40 488 8 301 48 789 40 474 8 378 48 852
26 736 5 316 32 052 26 444 s 303 31 747 26 323 5 305 31 628 26 253 5 320 31 573 26 192 5 400 31 592
6627 2519 9146 6 709 2 561 9 270 6 726 2 620 9 346 6 890 2 670 9 560 6 943 2 655 9 598
7 405 302 7 707 7 411 306 7 717 7 370 314 7 684 7 345 311 7 656 7 339 323 7 662
245 39 284 2.52 40 292 258 42 300 264 44 308 274 46 320
3 608 3 791 7 399 3 673 3 860 7 533 3 642 3 840 7 482 3 644 3 839 7 483 3 633 3 800 7 433
10715 17676 28391 11018 17978 28996 10985 17874 28859 10993 18050 29043 II 175 18 307 29 482
1558 2 271 3829 1571 2318 3889 I 571 2 308 3 879 1564 2319 3883 1571 2317 3888
34 822 9 911 44 733 35097 10072 45169 35080 10530 45610 34 872 10 739 45 611 34 699 10 840 45 539
10005 2531 12536 10 083 2 550 12 633 lO 007 2 596 12 603 9 997 2 583 12 580 JO 031 2 649 12 680
II 683 2 094 13 777 II 743 2 206 13 949 11780 2242 14022 11899 2291 14190 11913 2306 14219
13 134 5 286 18 420 13271 5316 18587 13 293 5 692 18 985 12976 5865 18841 12155 5885 18640
4 053 2 233 6 286 4 165 2 272 6 437 4 024 2 283 6 307 4056 2325 6381 4 221 2 442 6 663
4 053 2 233 6 286 4 165 2 272 6 437 4 024 2 283 6 307 4056 2325 6381 4 221 2 442 6 663
21 455 4 127 25 582 21 564 4 191 25 755 21 360 4 203 25 563 21 382 4 243 25 625 21 341 4 248 25 589
I 959 231 2 190 I 953 231 2 184 I 946 236 2 182 I 988 235 2 223 l 990 237 2 227
3 831 273 4 104 3 812 277 4 089 3 534 249 3 783 3 416 250 3 666 3 328 246 3 574
4 554 561 5 115 4 618 569 5 187 4 590 574 5 164 4 621 571 5 192 4 637 559 5 196
I 273 416 I 689 I 276 425 I 701 I 291 430 I 721 I 294 445 I 739 I 291 453 I 744
691 145 836 693 142 835 688 147 835 709 148 857 710 146 856
411 182 593 424 183 607 442 171 613 437 179 616 450 175 625
4135 2011 6146 4115 2059 6174 4146 2086 6232 4 185 2 098 6 283 4 184 2 119 6 303
4 601 308 4 909 4 673 305 4 978 4 723 310 5 033 4 732 317 5 049 4 751 313 5 064
129 064 59 255 188 319 129 867 60 072 189 939 129469 60399 189868 129178 61 279 190457 129 383 61 653 191 036
HongKong Monthly Digest of Statistics October 1991
I , I
I
I
LABOUR
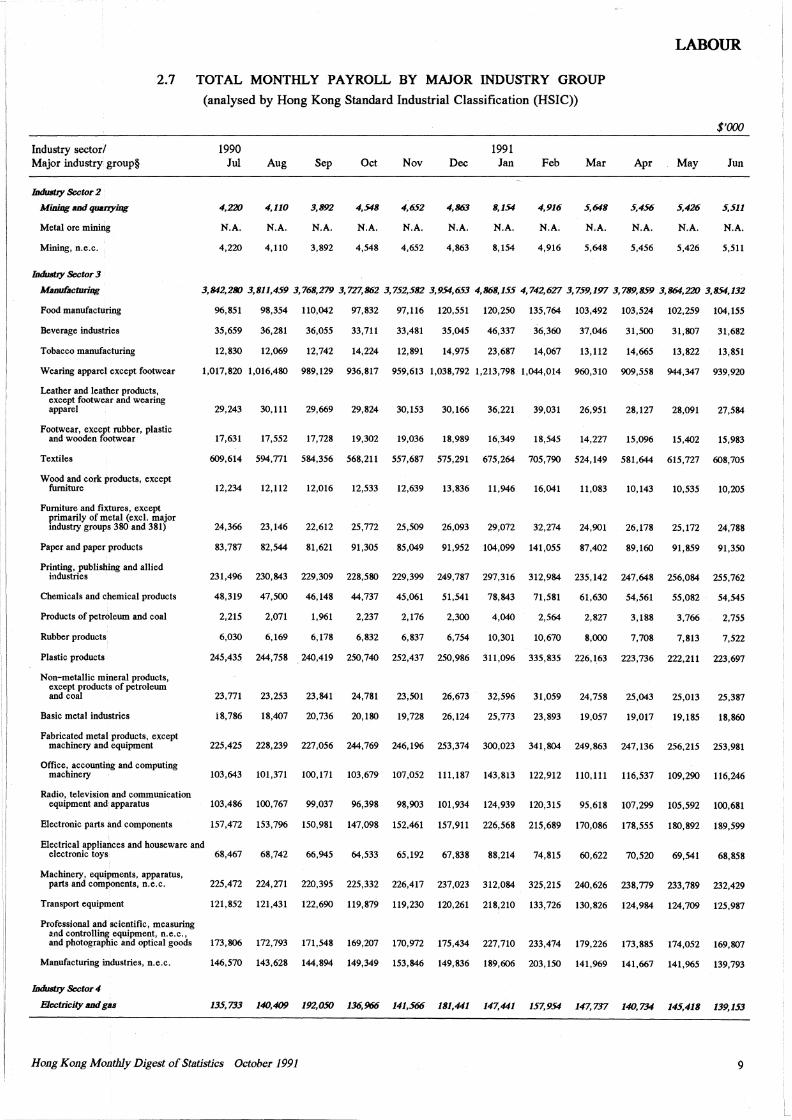
2.7 TOTAL MONTHLY PAYROLL BY MAJOR INDUSTRY GROUP
Industry sector/ Major industry group§
Industly Sector 2
Mining and quarrying
Metal ore mining
Mining, n.e.c.
Industly Sector 3
Manufacturiog
Food manufacturing
Beverage industries
Tobacco manufacturing
Wearing apparel except footwear
Leather and leather products, except footwear and wearing apparel
Footwear, except rubber, plastic and wooden footwear
Textiles
Wood and cork products, except furniture
Furniture and fixtures, except primarily of metal (excl. major industry groups 380 and 381)
Paper and paper products
Printing, publishing and allied industries
Chemicals and chemical products
Products of petroleum and coal
Rubber products
Plastic products
Non-metallic mineral products, except products of petroleum and coal
Basic metal industries
Fabricated metal products, except machinery and equipment
Office, accounting and computing machinery
Radio, television and communication equipment and: apparatus
(analysed by Hong Kong Standard Industrial Classification (HSIC))
1990 Jul
4,220
N.A.
4,220
Aug
4,110
N.A.
4,110
Sep
3,892
N.A.
3,892
Oct
4,548
N.A.
4,548
Nov
4,652
N.A.
4,652
Dec
4,863
N.A.
4,863
1991 Jan
8,154
N.A.
8,154
Feb
4,916
N.A.
4,916
Mar
5,648
N.A.
5,648
Apr
5,456
N.A.
5,456
May
5,426
N.A.
5,426
$'000
Jun
5,511
N.A.
5,511
~~~~m~~~~~m~~m~~~m~•m~~~~~~~-~~~~~~~
96,851 98,354 110,042 97,832 97,116 120,551 120,250 135,764 103,492 103,524 102,259 104,155
35,659 36,281 36,055 33,711 33,481 35,045 46,337 36,360 37,046 31,500 31,807 31,682
12,830 12,069 12,742 14,224 12,891 14,975 23,687 14,067 13, 112 14,665 13,822 13,851
1,017,820 1,016,480 989,129 936,817 959,613 1,038,792 1,213,798 1,044,014 960,310 909,558 944,347 939,920
29,243 30,111 29,669 29,824 30,153 30,166 36,221 39,031 26,951 28,127 28,091 27,584
17,631 17,552 17,728 19,302 19,036 18,989 16,349 18,545 14,227 15,096 15,402 15,983
609,614 594,771 584,356 568,211 557,687 575,291 675,264 705,790 524,149 581,644 615,727 608,705
12,234 12,112 12,016 12,533 12,639 13,836 11,946 16,041 11,083 10,143 10,535 10,205
24,366 23,146 22,612 25,772 25,509 26,093 29,072 32,274 24,901 26,178 25,172 24,788
83,787 82,544 81,621 91,305 85,049 91,952 104,099 141,055 87,402 89,160 91,859 91,350
231,496 230,843 229,309 228,580 229,399 249,787 297,316 312,984 235,142 247,648 256,084 255,762
48,319 47,500 46,148 44,737 45,061 51,541 78,843 71,581 61,630 54,561 55,082 54,545
2,215 2,071 1,961 2,237 2,176 2,300 4,040 2,564 2,827 3,188 3,766 2,755
6,030 6,169 6,178 6,832 6,837 6,754 10,301 10,670 8,000 7,708 7,813 7,522
245,435 244,758 240,419 250,740 252,437 250,986 311,096 335,835 226,163 223,736 222,211 223,697
23,771 23,253 23,841 24,781 23,501 26,673 32,596 31,059 24,758 25,043 25,013 25,387
18,786 18,407 20,736 20,180 19,728 26,124 25,773 23,893 19,057 19,017 19,185 18,860
225,425 228,239 227,056 244,769 246,196 253,374 300,023 341,804 249,863 247,136 256,215 253,981
103,643 101,371 100,171 103,679 107,052 111,187 143,813 122,912 110,111 116,537 109,290 116,246
103,486 100,767 99,037 96,398 98,903 101,934 124,939 120,315 95,618 107,299 105,592 100,681
Electronic parts and components 157,472 153,796 150,981 147,098 152,461 157,911 226,568 215,689 170,086 178,555 180,892 189,599
Electrical appliances and houseware and electronic toys 68,467 68,742 66,945 64,533 65,192 67,838 88,214 74,815 60,622 70,520 69,541 68,858
Machinery, equipments, apparatus, parts and components, n.e.c. 225,472 224,271 220,395 225,332 226,417 237,023 312,084 325,215 240,626 238,779 233,789 232,429
Transport equipment 121,852 121,431 122,690 119,879 119,230 120,261 218,210 133,726 130,826 124,984 124,709 125,987
Professional and scientific, measuring and controlling equipment, n.e.c., and photographic and optical goods 173,806 172,793 171,548 169,207 170,972 175,434 227,710 233,474 179,226 173,885 174,052 169,807
Manufacturing industries, n.e.c. 146,570 143,628 144,894 149,349 153,846 149,836 189,606 203,150 141,969 141,667 141,965 139,793
Industly Sector 4
Electricity and gas 135, 733 140,409 192,050 136,966 141,566 181,441 147,441 157,954 147, 737 140, 734 145,418 139,153
Hong Kong Monthly Digest of Statistics October 1991 9
LABOUR
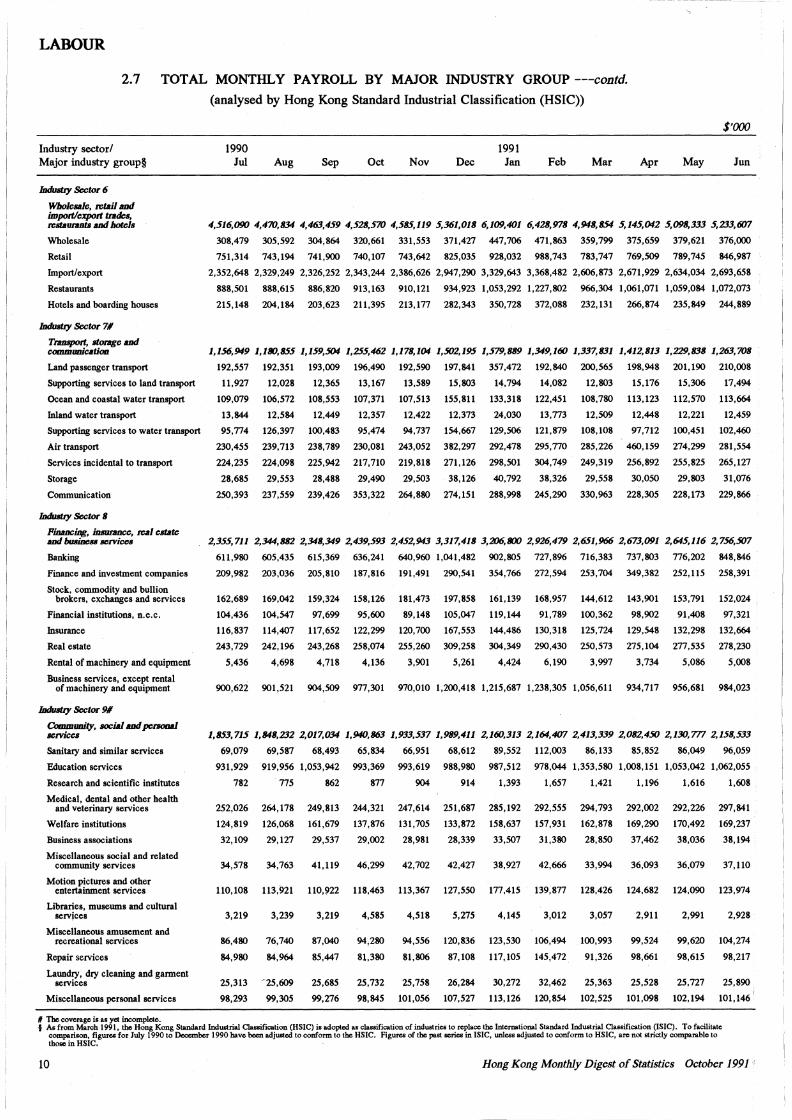
2.7 TOTAL MONTHLY PAYROLL BY MAJOR INDUSTRY GROUP ---contd.
Industry s«-tor/ Major industry group§
1nduatty Sector 6
Wholesale, retail and impolflexport trades, restaunnts and hotels
Wholesale
Retail
Import/export
Restaurants
Hotels and boarding houses
1nduatty Sector 7#
Transport, storage and communicatioa
Land passenger transport
Supporting services to land transport
Ocean and coastal water transport
Inland water transport
Supporting services to water transport
Air transport
Services incidental to transport
Storage
Communication
1nduatty Sector 6
Financing, huunmce, real estate and busincsll services
Banking
Finance and investment companies
Stock, commodity and bullion brokers, exchanges and services
Financial institutions, n.e.c.
Insurance
Real estate
Rental of machinery and equipment
Business services, except rental of machinery and equipment
1nduatty Sector 9#
Community, social and pcnoaal services
Sanitary and similar services
Education services
Research and scientific institutes
Medical, dental and other health and veterinary services
Welfare institutions
Business associations
Miscellaneous social and related community services
Motion pictures and other entertainment services
Libraries, museums and cultural servjces
Miscellaneous amusement and recreational services
Repair services
Laundry, dry cleaning and garment services
Miscellaneous personal services
# The coverage is as yet incomplete.
(analysed by Hong Kong Standard Industrial Classification (HSIC))
1990 Jut Aug Sep Oct Nov DIX
1991 Jan Feb
$'()()()
Mar Apr May Jun
4,516,090 4,470,634 4,463,459 4,526,570 4,585,119 5,361,016 6,109,401 6,426,976 4,946,854 5,145,042 5,096,333 5,233,607
308,479 305,592 304,864 320,661 331,553 371,427 447,706 471,863 359,799 375,659 379,621 376,000
751,314 743,194 741,900 740,107 743,642 825,035 928,032 988,743 783,747 769,509 789,745 846,987
2,352,648 2,329,249 2,326,252 2,343,244 2,386,626 2,947,290 3,329,643 3,368,482 2,606,873 2,671,929 2,634,034 2,693,658
888,501 888,615 886,820 913,163 910,121 934,923 1,053,292 1,227,802 966,304 1,061,071 1,059,084 1,072,073
215,148 204,184 203,623 211,395 213,177 282,343 350,728 372,088 232,131 266,874 235,849 244,889
1,156,949 1,180,855 1,159,504 1,255,462 1,176,104 1,502,195 1,579,BB9 1,349,160 1,337,631 1,412,613 1,229,636 1,263,706
192,557 192,351
11,927 12,028
109,079 106,572
13,844 12,584
95, 774 126,397
230,455 239, 713
224,235 224,098
28,685 29,553
250,393 237,559
193,009
12,365
108,553
12,449
100,483
238,789
225,942
28,488
239,426
196,490
13,167
107,371
12,357
95,474
230,081
217,710
29,490
353,322
192,590 197,841
13,589 15,803
107,513 155,811
12,422 12,373
94,737 154,667
243,052 382,297
219,818 271,126
29,503 38, 126
264,880 274,151
357,472 192,840
14, 794 14,082
133,318 122,451
24,030 13,773
129,506 121,879
292,478 295,770
298,501 304,749
40,792 38,326
288,998 245,290
200,565
12,803
108,780
12,509
108,108
285,226
249,319
29,558
330,963
198,948
15,176
113,123
12,448
97,712
460,159
256,892
30,050
228,305
201,190
15,306
112,570
12,221
100,451
274,299
255,825
29,803
228,173
210,008
17,494
113,664
12,459
102,460
281,554
265,127
31,076
229,866
2,355,711 2,344,BB2 2,346,349 2,439,593 2,452,943 3,317,416 3,206,BOO 2,926,479 2,651,966 2,673,091 2,645,116 2,756,507
611,980 605,435 615,369 636,241 640,960 1,041,482 902,805 727,896 716,383 737,803 776,202 848,846
209,982
162,689
104,436
116,837
243,729
5,436
203,036
169,042
104,547
114,407
242,196
4,698
205,810
159,324
97,699
117,652
243,268
4,718
187,816
158,126
95,600
122,299
258,074
4,136
191,491
181,473
89,148
120,700
255,260
3,901
290,541
197,858
105,047
167,553
309,258
5,261
354,766
161,139
119,144
144,486
304,349
4,424
272,594
168,957
91,789
130,318
290,430
6,190
253,704
144,612
100,362
125,724
250,573
3,997
349,382
143,901
98,902
129,548
275,104
3,734
252,115
153,791
91,408
132,298
277,535
5,086
258,391
152,024
97,321
132,664
278,230
5,008
900,622 901,521 904,509 977,301 970,010 1,200,418 1,215,687 1,238,305 1,056,611 934,717 956,681 984,023
1,853,715 1,IU6,232 2,017,034 1,940,663 1,933,537 1,969,411 2,160,313 2,164,407 2,413,339 2,062,450 2,130,777 2,156,533
69,079 69,587 68,493 65,834 66,951 68,612 89,552 112,003 86,133 85,852 86,049 96,059
931,929
782
919,956 1,053,942 993,369 993,619
775 862 877 904
252,026 264,178
124,819 126,068
32,109 29,127
34,578 34,763
110,108 113,921
3,219 3,239
86,480 76,740
84,980 84,964
25,313 -25,609
98,293 99,305
249,813
161,679
29,537
41,119
110,922
3,219
87,040
85,447
25,685
99,276
244,321
137,876
29,002
46,299
118,463
4,585
94,280
81,380
25,732
98,845
247,614
131,705
28,981
42,702
113,367
4,518
94,556
81,806
25,758
101,056
988,980
914
251,687
133,872
28,339
42,427
127,550
5,275
120,836
87,108
26,284
107,527
987,512
1,393
285,192
158,637
33,507
38,927
177,415
4,145
123,530
117, 105
30,272
113,126
978,044 1,353,580 1,008,151 1,053,042 1,062,055
1,657
292,555
157,931
31,380
42,666
139,877
3,012
106,494
145,472
32,462
120,854
1,421
294,793
162,878
28,850
33,994
128,426
3,057
100,993
91,326
25,363
102,525
1,196
292,002
169,290
37,462
36,093
124,682
2,911
99,524
98,661
25,528
101,098
1,616
292,226
170,492
38,036
36,079
124,090
2,991
99,620
98,615
25,727
102,194
1,608
297,841
169,237
38,194
37,110
123,974
2,928
104,274
98,217
25,890
101,146
f As from March 1991, the Hong Kong Standard Industrial Classification (HSJC) is adopted as classification of industries to replace the International Standard Industrial Classification (ISIC). To facilitate comparison, figures for July 1990 to December 1990 have been adjusted to conform to the HSIC. Figures of the past series in JSJC, unless adjusted to conform to HSIC, are not strictly comparable to those in HSJC.
10 Hong Kong Monthly Digest of Statistics October 1991
' I I
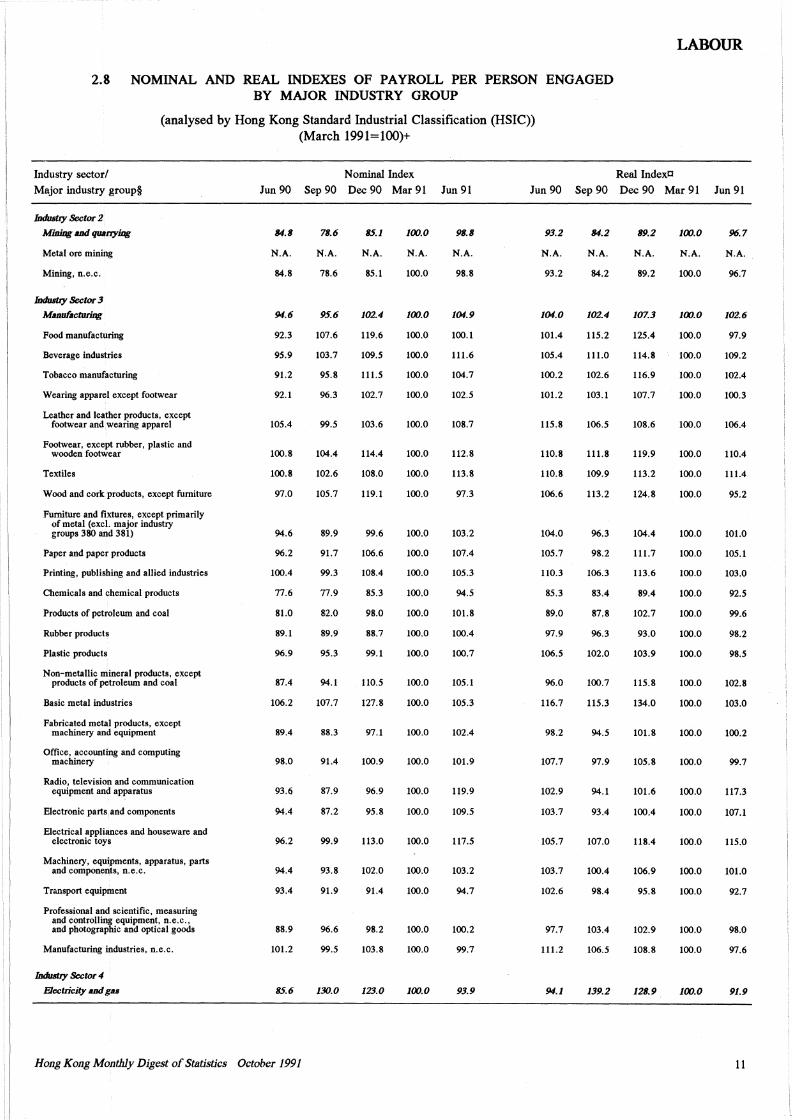
2.8 NOMINAL AND REAL INDEXES OF PAYROLL PER PERSON ENGAGED
Industry sector/
BY MAJOR INDUSTRY GROUP
(analysed by Hong Kong Standard Industrial Classification (HSIC)) (March 1991=100)+
Nominal Index
LABOUR
Real Indextl
Major industry group§ Jun 90 Sep 90 Dec 90 Mar 91 Jun 91 Jun 90 Sep 90 Dec 90 Mar 91 Jun 91
lDdustty Sector 2
Mining and quarrying
Metal ore mining
Mining, n.e.c.
lDdustty Sector 3
M1111uf11cturing
Food manufacturing
Beverage industries
Tobacco manufacturing
Wearing apparel except footwear
Leather and leather products, except footwear and wearing apparel
Footwear, except rubber, plastic and wooden footwear
Textiles
Wood and cork products, except furniture
Furniture and fixtures, except primarily of metal (excl. major industry groups 380 and 381)
Paper and paper products
Printing, publishing and allied industries
Chemicals and chemical products
Products of petroleum and coal
Rubber products
Plastic products
Non-metallic mineral products, except products of petroleum and coal
Basic metal industries
Fabricated metal products, except machinery and equipment
Office, accounting and computing machinery
Radio, television and communication equipment and apparatus
Electronic parts, and components
Electrical appliances and houseware and electronic toys
Machinery, equipments, apparatus, parts and components, n.e.c.
Transport equipment
Professional and scientific, measuring and controlling equipment, n.e.c., and photographic and optical goods
Manufacturing industries, n.e.c.
lDdustty Scctor4
Electricity and g1111
84.B
N.A.
84.8
94.6
92.3
95.9
91.2
92.1
105.4
100.8
100.8
97.0
94.6
96.2
100.4
77.6
81.0
89.1
96.9
87.4
106.2
89.4
98.0
93.6
94.4
96.2
94.4
93.4
88.9
101.2
B5.6
Hong Kong Monthly Digest of Statistics October 1991
7B.6
N.A.
78.6
95.6
107.6
103.7
95.8
96.3
99.5
104.4
102.6
105.7
89.9
91.7
99.3
77.9
82.0
89.9
95.3
94.1
107.7
88.3
91.4
87.9
87.2
99.9
93.8
91.9
96.6
99.5
130.0
B5.1
N.A.
85.1
102.4
119.6
109.5
111.5
102.7
103.6
114.4
108.0
119.1
99.6
106.6
108.4
85.3
98.0
88.7
99.1
110.5
127.8
97.1
100.9
96.9
95.8
113.0
102.0
91.4
98.2
103.8
123.0
100.0
N.A.
100.0
100.0
100.0
100.0
100.0
100.0
100.0
100.0
100.0
100.0
100.0
100.0
100.0
100.0
100.0
100.0
100.0
100.0
100.0
100.0
100.0
100.0
100.0
100.0
100.0
100.0
100.0
100.0
100.0
9B.B
N.A.
98.8
104.9
100.1
111.6
104.7
102.5
108.7
112.8
113.8
97.3
103.2
107.4
105.3
94.5
101.8
100.4
100.7
105.1
105.3
102.4
101.9
119.9
109.5
117.5
103.2
94.7
100.2
99.7
93.9
93.2
N.A.
93.2
104.0
101.4
105.4
100.2
101.2
115.8
110.8
110.8
106.6
104.0
105.7
110.3
85.3
89.0
97.9
106.5
96.0
116.7
98.2
107.7
102.9
103.7
105.7
103.7
102.6
97.7
111.2
94.1
84.2
N.A.
84.2
102.4
115.2
111.0
102.6
103.1
106.5
111.8
109.9
113.2
96.3
98.2
106.3
83.4
87.8
96.3
102.0
100.7
115.3
94.5
97.9
94.1
93.4
107.0
100.4
98.4
103.4
106.5
139.2
B9.2
N.A.
89.2
107.3
125.4
114.8
116.9
107.7
108.6
119.9
113.2
124.8
104.4
111.7
113.6
89.4
102.7
93.0
103.9
115.8
134.0
101.8
105.8
101.6
100.4
118.4
106.9
95.8
102.9
108.8
12B.9
100.0
N.A.
100.0
100.0
100.0
100.0
100.0
100.0
100.0
100.0
100.0
100.0
100.0
100.0
100.0
100.0
100.0
100.0
100.0
100.0
100.0
100.0
100.0
100.0
100.0
100.0
100.0
100.0
100.0
100.0
100.0
96.7
N.A.
96.7
102.6
97.9
109.2
102.4
100.3
106.4
110.4
111.4
95.2
101.0
105.1
103.0
92.5
99.6
98.2
98.5
102.8
103.0
100.2
99.7
117.3
107.1
115.0
101.0
92.7
98.0
97.6
91.9
11
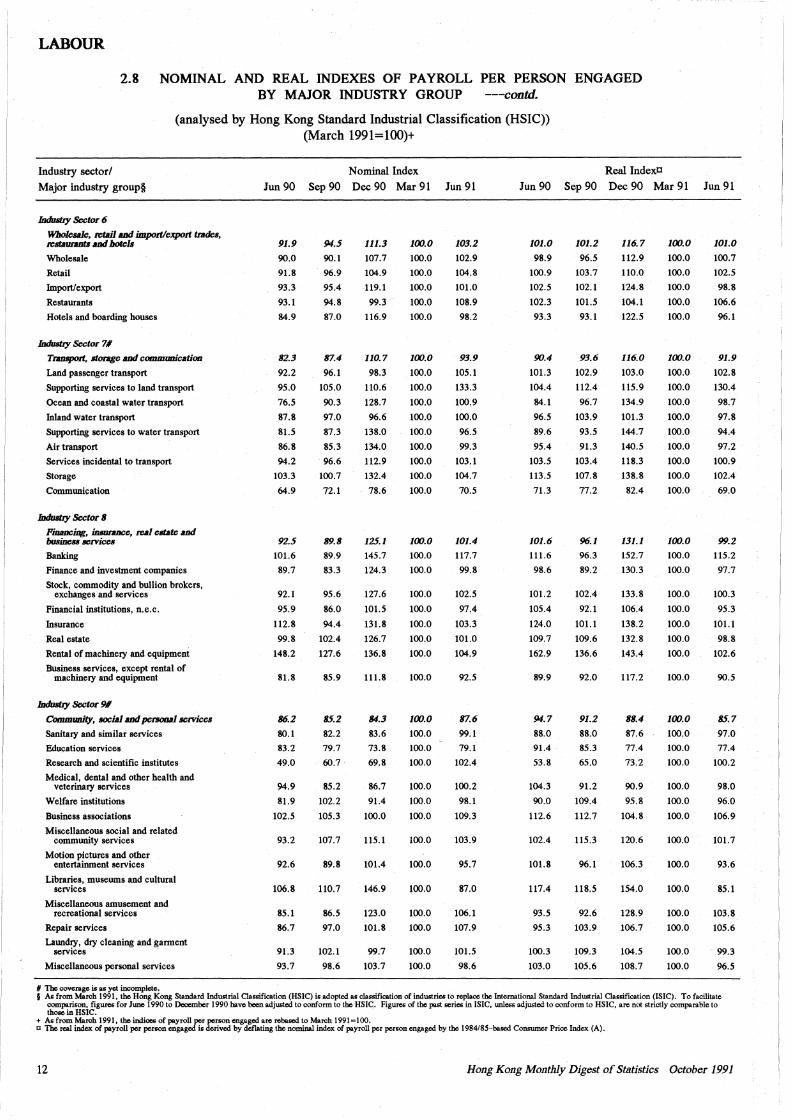
LABOUR
Industry sector/
2.8 NOMINAL AND REAL INDEXES OF PAYROLL PER PERSON ENGAGED BY MAJOR INDUSTRY GROUP ---contd.
(analysed by Hong Kong Standard Industrial Classification (HSIC)) (March 1991=100)+
Nominal Index Real lndextl
Major industry group§ Jun 90 Sep 90 Dec 90 Mar 91 Jun 91 Jun 90 Sep 90 Dec 90 Mar 91 Jun 91
Induatry Sector 6
Wboleaale, retail and import/export trades, restaurmta and hotels
Wholesale
Retail
Import/export
Restaurants
Hotels and boarding houses
Induatry Sector 7#
TnDJJpOrt, storage and comml111icatioa
Land passenger transport
Supporting services to land transport
Ocean and coastal water transport
Inland water transport
Supporting services to water transport
Air transport
Services incidental to transport
Storage
Communication
Induatry Sector 8
Fkumciog, kumnnce, real estate and busincss services
Banking
Finance and investment companies
Stock, commodity and bullion brokers, exchanges and services
Financial institutions, n.e.c.
Insurance
Real estate
Rental of machinery and equipment
Business services, except rental of machinery and equipment
Induatry Sector 9#
Comml111ity, socW and personal services
Sanitary and similar services
Education services
Research and scientific institutes
Medical, dental and other health and veterinary services
Welfare institutions
Business associations
Miscellaneous social and related community services
Motion pictures and other entertainment services
Libraries, museums and cultural services
Miscellaneous amusement and recreational services
Repair services
Laundry, dry cleaning and garment services ·
Miscellaneous personal services
# The coverage is as yet incomplete.
91.9
90.0
91.8
93.3
93.1
84.9
82.3
92.2
95.0
76.5
87.8
81.5
86.8
94.2
103.3
64.9
92.5
101.6
89.7
92.1
95.9
112.8
99.8
148.2
81.8
86.2
80.1
83.2
49.0
94.9
81.9
102.5
93.2
92.6
106.8
85.1
86.7
91.3
93.7
94.5
90.l
96.9
95.4
94.8
87.0
87.4
96.l
105.0
90.3
97.0
87.3
85.3
96.6
100.7
72.1
89.8
89.9
83.3
95.6
86.0
94.4
102.4
127.6
85.9
85.2
82.2
79.7
60.7
85.2
102.2
105.3
107.7
89.8
110.7
86.5
97.0
102.1
98.6
111.3
107.7
104.9
119.1
99.3
116.9
110.7
98.3
110.6
128.7
96.6
138.0
134.0
112.9
132.4
78.6
125.1
145.7
124.3
127.6
101.5
131.8
126.7
136.8
111.8
84.3
83.6
73.8
69.8
86.7
91.4
100.0
115.1
101.4
146.9
123.0
101.8
99.7
103.7
100.0
100.0
100.0
100.0
100.0
100.0
100.0
100.0
100.0
100.0
100.0
100.0
100.0
100.0
100.0
100.0
100.0
100.0
100.0
100.0
100.0
100.0
100.0
100.0
100.0
100.0
100.0
100.0
100.0
100.0
100.0
100.0
100.0
100.0
100.0
100.0
100.0
100.0
100.0
103.2
102.9
104.8
101.0
108.9
98.2
93.9
105.1
133.3
100.9
100.0
96.5
99.3
103.l
104.7
70.5
101.4
117.7
99.8
102.5
97.4
103.3
101.0
104.9
92.5
87.6
99.l
79.l
102.4
100.2
98.1
109.3
103.9
95.7
87.0
106.1
107.9
101.5
98.6
101.0
98.9
100.9
102.5
102.3
93.3
90.4
101.3
104.4
84.1
96.5
89.6
95.4
103.5
113.5
71.3
101.6
111.6
98.6
101.2
105.4
124.0
109.7
162.9
89.9
94.7
88.0
91.4
53.8
104.3
90.0
112.6
102.4
101.8
117.4
93.5
95.3
100.3
103.0
101.2
96.S
103.7
102.l
101.5
93.l
93.6
102.9
112.4
96.7
103.9
93.5
91.3
103.4
107.8
77.2
96.1
96.3
89.2
102.4
92.l
101.1
109.6
136.6
92.0
91.2
88.0
85.3
65.0
91.2
109.4
112.7
115.3
96.1
118.5
92.6
103.9
109.3
105.6
116.7
112.9
110.0
124.8
104.1
122.5
116.0
103.0
115.9
134.9
101.3
144.7
140.5
118.3
138.8
82.4
131.1
152.7
130.3
133.8
106.4
138.2
132.8
143.4
117.2
88.4
87.6
77.4
73.2
90.9
95.8
104.8
120.6
106.3
154.0
128.9
106.7
104.5
108.7
100.0
100.0
100.0
100.0
100.0
100.0
100.0
100.0
100.0
100.0
100.0
100.0
100.0
100.0
100.0
100.0
100.0
100.0
100.0
100.0
100.0
100.0
100.0
100.0
100.0
100.0
100.0
100.0
100.0
100.0
100.0
100.0
100.0
100.0
100.0
100.0
100.0
100.0
100.0
101.0
100.7
102.5
98.8
106.6
96.1
91.9
102.8
130.4
98.7
97.8
94.4
97.2
100.9
102.4
69.0
99.2
115.2
97.7
100.3
95.3
101.l
98.8
102.6
90.5
85.7
97.0
77.4
100.2
98.0
96.0
106.9
101.7
93.6
85.1
103.8
105.6
99.3
96.5
§ As from March 1991, the Hong Kong Standard Industrial Classification (HSIC) is adopted as classification of industries to replace the International Standard Industrial Classification (!SIC). To facilitate comparison, figures for June 1990 to December 1990 have been adjusted to conform to the HSIC. Figures of the past series in JSJC, unless adjusted to conform to HSIC, are not strictly comparable to those in HSIC.
+ As from March 1991, the indices of payroll per person engaged are rebased to March 1991=100. c The real index of payroll per person engaged is derived by deflating the nominal index of payroll per person engaged by the 1984185-based Consumer Price Index (A).
12 Hong Kong Monthly Digest of Statistics October 1991
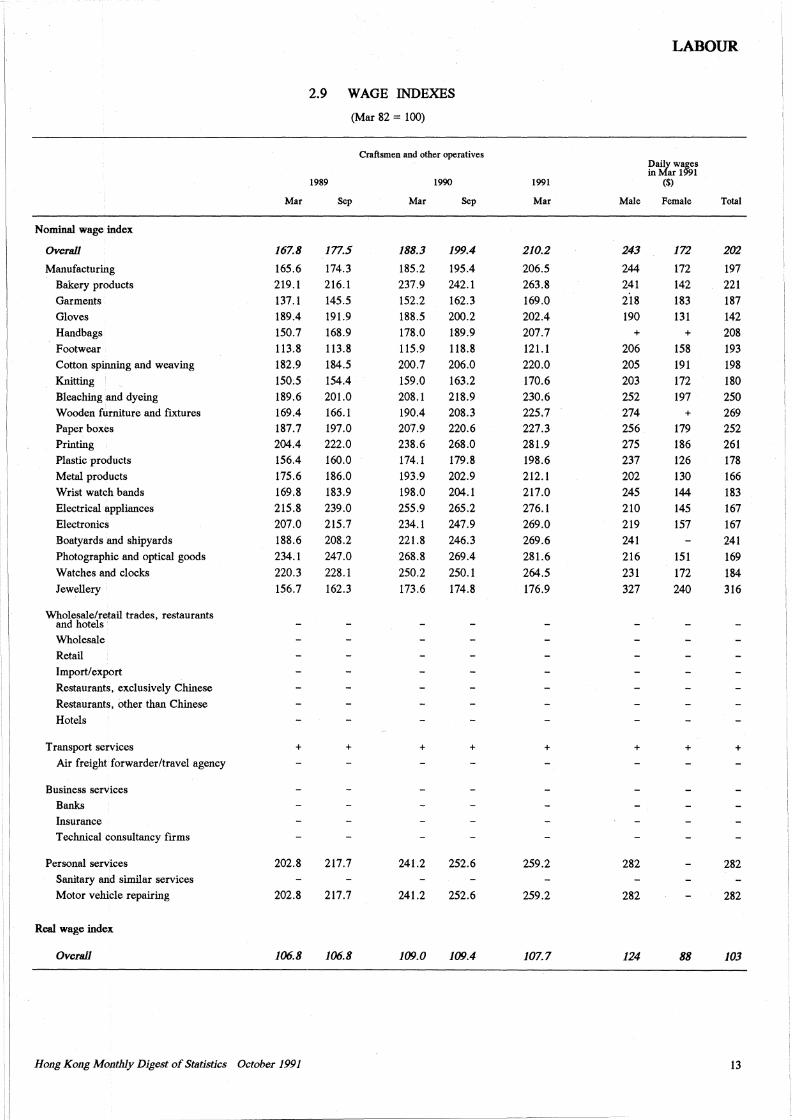
LABOUR
2.9 WAGE INDEXES
(Mar 82 = 100)
Craftsmen and other operatives Da:et; wa~s in arl 1
1989 1990 1991 ($)
Mar Sep Mar Sep Mar Male Female Total
Nominal wage index
Overall 167.8 177.5 188.3 199.4 210.2 243 172 202
Manufacturing 165.6 174.3 185.2 195.4 206.5 244 172 197
Bakery products 219.1 216.1 237.9 242.1 263.8 241 142 221 Garments 137.1 145.5 152.2 162.3 169.0 218 183 187 Gloves 189.4 191.9 188.5 200.2 202.4 190 131 142 Handbags 150.7 168.9 178.0 189.9 207.7 + + 208 Footwear 113.8 113.8 115.9 118.8 121.1 206 158 193
Cotton spinning and weaving 182.9 184.5 200.7 206.0 220.0 205 191 198
Knitting 150.5 154.4 159.0 163.2 170.6 203 172 180 Bleaching and dyeing 189.6 201.0 208.l 218.9 230.6 252 197 250 Wooden furniture and fixtures 169.4 166.l 190.4 208.3 225.7 274 + 269 Paper boxes 187.7 197.0 207.9 220.6 227.3 256 179 252 Printing 204.4 222.0 238.6 268.0 281.9 275 186 261
, I Plastic products 156.4 160.0 174.1 179.8 198.6 237 126 178 I
Metal products 175.6 186.0 193.9 202.9 212.1 202 130 166 I Wrist watch bands 169.8 183.9 198.0 204.1 217.0 245 144 183 I
'I Electrical appliances 215.8 239.0 255.9 265.2 276.1 210 145 167 Electronics 207.0 215.7 234.l 247.9 269.0 219 157 167 Boatyards and shipyards 188.6 208.2 221.8 246.3 269.6 241 241 Photographic and optical goods 234.l 247.0 268.8 269.4 281.6 216 151 169 Watches and clocks 220.3 228.1 250.2 250.l 264.5 231 172 184 Jewellery 156.7 162.3 173.6 174.8 176.9 327 240 316
Wholesale/retail trades, restaurants and hotels Wholesale
Retail
Import/ export
Restaurants, exclusively Chinese
Restaurants, other than Chinese
Hotels
Transport services + + + + + + + + Air freight forwarder/travel agency
'' Business services
I Banks
Insurance ! i
Technical consultancy firms , I
Personal services 202.8 217.7 241.2 252.6 259.2 282 282 Sanitary and similar services Motor vehicle repairing 202.8 217.7 241.2 252.6 259.2 282 282
Real wage index
Overall 106.8 106.8 109.0 109.4 107.7 124 88 103
Hong Kong Monthly Digest of Statistics October 1991 13
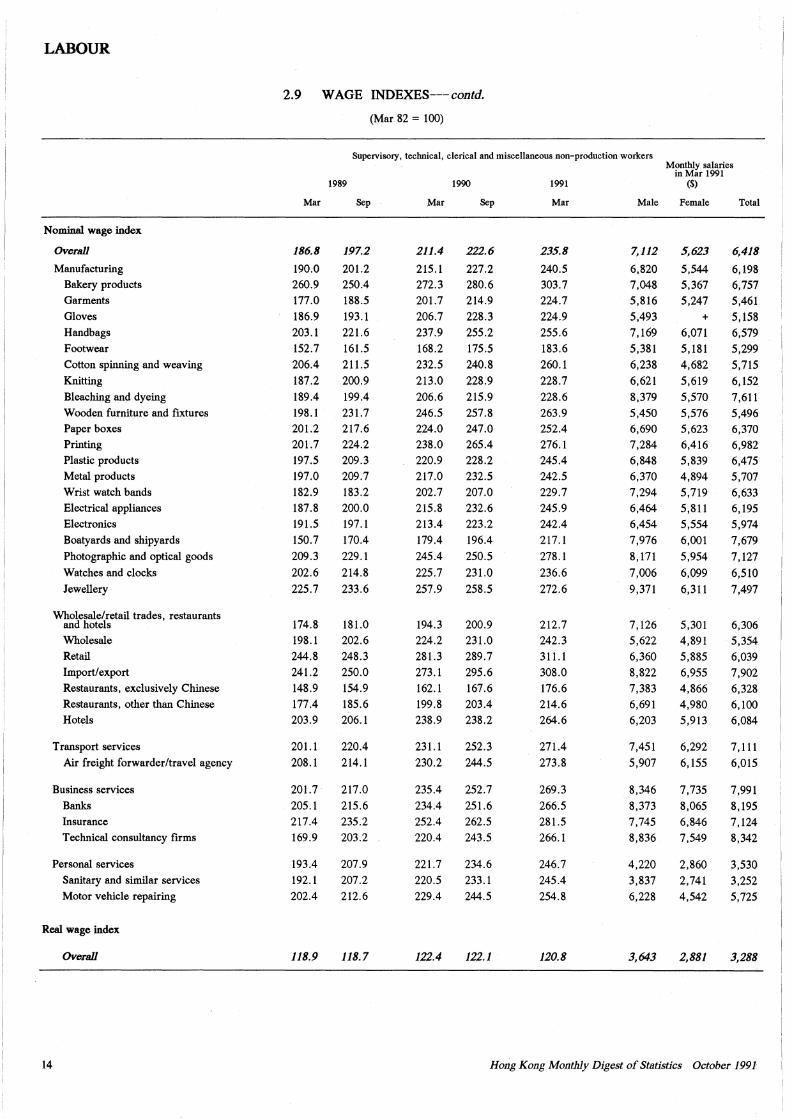
LABOUR
2.9 WAGE INDEXES--- contd.
(Mar 82 = 100)
Supervisoi:y, technical, clerical and miscellaneous non-production workers Monthly salaries
in Mar 1991 1989 1990 1991 ($)
Mar Sep Mar Sep Mar Male Female Total
Nominal wage index
Overall 186.8 197.2 211.4 222.6 235.8 7,112 5,623 6,418
Manufacturing 190.0 201.2 215.1 227.2 240.5 6,820 5,544 6,198 Bakery products 260.9 250.4 272.3 280.6 303.7 7,048 5,367 6,757 Garments 177.0 188.5 201.7 214.9 224.7 5,816 5,247 5,461 Gloves 186.9 193.1 206.7 228.3 224.9 5,493 + 5,158 Handbags 203.1 221.6 237.9 255.2 255.6 7,169 6,071 6,579 Footwear 152.7 161.5 168.2 175.5 183.6 5,381 5,181 5,299 Cotton spinning and weaving 206.4 211.5 232.5 240.8 260.1 6,238 4,682 5,715 Knitting 187.2 200.9 213.0 228.9 228.7 6,621 5,619 6,152 Bleaching and dyeing 189.4 199.4 206.6 215.9 228.6 8,379 5,570 7,611 Wooden furniture and fixtures 198.1 231.7 246.5 257.8 263.9 5,450 5,576 5,496 Paper boxes 201.2 217.6 224.0 247.0 252.4 6,690 5,623 6,370 Printing 201.7 224.2 238.0 265.4 276.1 7,284 6,416 6,982 Plastic products 197.5 209.3 220.9 228.2 245.4 6,848 5,839 6,475 Metal products 197.0 209.7 217.0 232.5 242.5 6,370 4,894 5,707 Wrist watch bands 182.9 183.2 202.7 207.0 229.7 7,294 5,719 6,633 Electrical appliances 187.8 200.0 215.8 232.6 245.9 6,464 5,811 6,195 Electronics 191.5 197.1 213.4 223.2 242.4 6,454 5,554 5,974 Boatyards and shipyards 150.7 170.4 179.4 196.4 217. l 7,976 6,001 7,679 Photographic and optical goods 209.3 229.1 245.4 250.5 278.l 8, 171 5,954 7,127 Watches and clocks 202.6 214.8 225.7 231.0 236.6 7,006 6,099 6,510 Jewellery 225.7 233.6 257.9 258.5 272.6 9,371 6,311 7,497
Wholesale/retail trades, restaurants and hotels 174.8 181.0 194.3 200.9 212.7 7,126 5,301 6,306 Wholesale 198.1 202.6 224.2 231.0 242.3 5,622 4,891 5,354 Retail 244.8 248.3 281.3 289.7 311.1 6,360 5,885 6,039 Import/ export 241.2 250.0 273.l 295.6 308.0 8,822 6,955 7,902 Restaurants, exclusively Chinese 148.9 154.9 162. l 167.6 176.6 7,383 4,866 6,328 Restaurants, other than Chinese 177.4 185.6 199.8 203.4 214.6 6,691 4,980 6,100 Hotels 203.9 206.l 238.9 238.2 264.6 6,203 5,913 6,084
Transport services 201.1 220.4 231.1 252.3 271.4 7,451 6,292 7, 111 Air freight forwarder/travel agency 208.1 214.1 230.2 244.5 273.8 5,907 6,155 6,015
Business services 201.7 217.0 235.4 252.7 269.3 8,346 7,735 7,991 Banks 205.1 215.6 234.4 251.6 266.5 8,373 8,065 8,195 Insurance 217.4 235.2 252.4 262.5 281.5 7,745 6,846 7,124 Technical consultancy firms 169.9 203.2 220.4 243.5 266.1 8,836 7,549 8,342
Personal services 193.4 207.9 221.7 234.6 246.7 4,220 2,860 3,530 Sanitary and similar services 192.1 207.2 220.5 233.1 245.4 3,837 2,741 3,252 Motor vehicle repairing 202.4 212.6 229.4 244.5 254.8 6,228 4,542 5,725
Real wage index
Overall 118.9 118.7 122.4 122.1 120.8 3,643 2,881 3,288
14 Hong Kong Monthly Digest of St11tistics October 1991
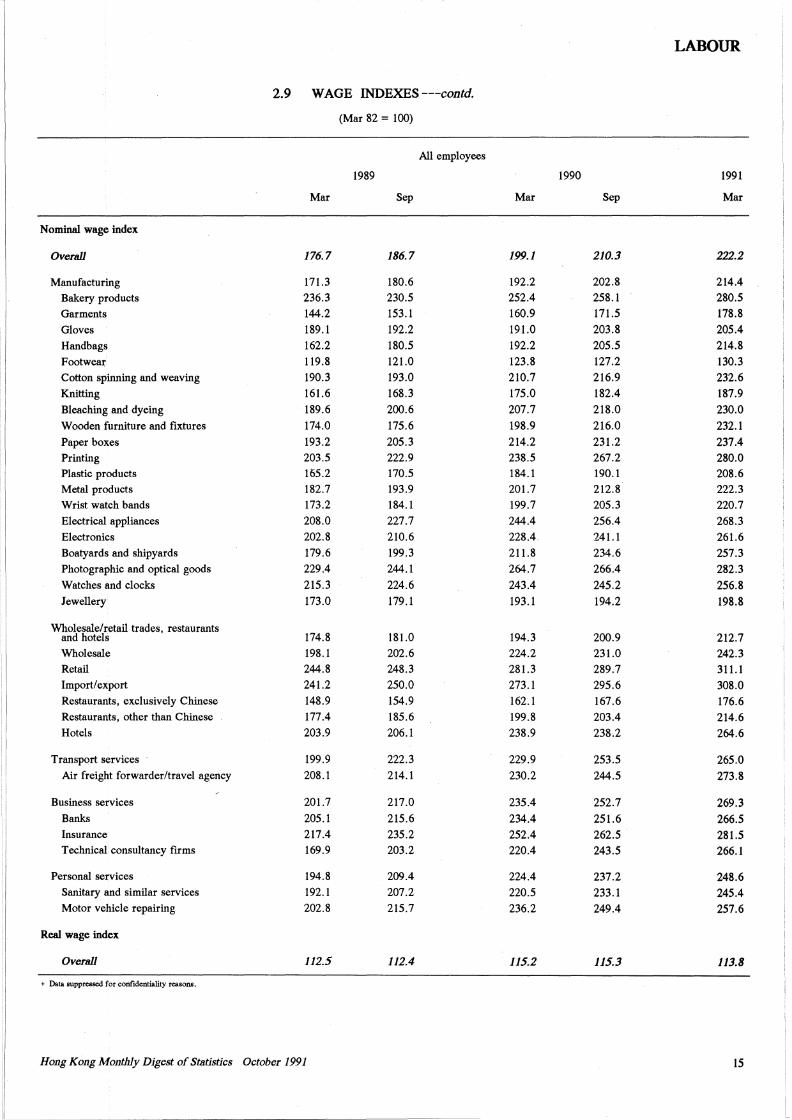
LABOUR
2.9 WAGE INDEXES ---contd.
(Mar 82 = 100)
All employees
1989 1990 1991
Mar Sep Mar Sep Mar
Nominal wage index
Overall 176.7 186.7 199.1 210.3 222.2
Manufacturing 171.3 180.6 192.2 202.8 214.4 Bakery products 236.3 230.5 252.4 258.1 280.5 Garments 144.2 153.1 160.9 171.5 178.8 Gloves 189.1 192.2 191.0 203.8 205.4 Handbags 162.2 180.5 192.2 205.5 214.8 Footwear 119.8 121.0 123.8 127.2 130.3 Cotton spinning and weaving 190.3 193.0 210.7 216.9 232.6 Knitting 161.6 168.3 175.0 182.4 187.9 Bleaching and dyeing 189.6 200.6 207.7 218.0 230.0 Wooden furniture and fixtures 174.0 175.6 198.9 216.0 232.1 Paper boxes 193.2 205.3 214.2 231.2 237.4 Printing 203.5 222.9 238.5 267.2 280.0 Plastic products 165.2 170.5 184.1 190.1 208.6 Metal products 182.7 193.9 201.7 212.8 222.3 Wrist watch bands 173.2 184.1 199.7 205.3 220.7 Electrical appliances 208.0 227.7 244.4 256.4 268.3 Electronics 202.8 210.6 228.4 241.1 261.6 Boatyards and shipyards 179.6 199.3 211.8 234.6 257.3 Photographic and optical goods 229.4 244.1 264.7 266.4 282.3 Watches and clocks 215.3 224.6 243.4 245.2 256.8 Jewellery 173.0 179.1 193.1 194.2 198.8
Wholesale/retail trades, restaurants and hotels 174.8 181.0 194.3 200.9 212.7 Wholesale 198.1 202.6 224.2 231.0 242.3 Retail 244.8 248.3 281.3 289.7 311.1 Import/ export 241.2 250.0 273.1 295.6 308.0 Restaurants, exclusively Chinese 148.9 154.9 162.1 167.6 176.6 Restaurants, other than Chinese 177.4 185.6 199.8 203.4 214.6 Hotels 203.9 206.1 238.9 238.2 264.6
Transport services 199.9 222.3 229.9 253.5 265.0 Air freight forwarder/travel agency 208.1 214.1 230.2 244.5 273.8
Business services 201.7 217.0 235.4 252.7 269.3 Banks 205.1 215.6 234.4 251.6 266.5 Insurance 217.4 235.2 252.4 262.5 281.5 Technical consultancy firms 169.9 203.2 220.4 243.5 266.1
Personal sezyices 194.8 209.4 224.4 237.2 248.6 Sanitary and similar services 192.1 207.2 220.5 233.1 245.4 Motor vehicle repairing 202.8 215.7 236.2 249.4 257.6
Real wage index
Overall 112.5 112.4 115.2 115.3 113.8
+ Data suppressed for confidentiality reasons.
Hong Kong Monthly Digest of Statistics October 1991 15
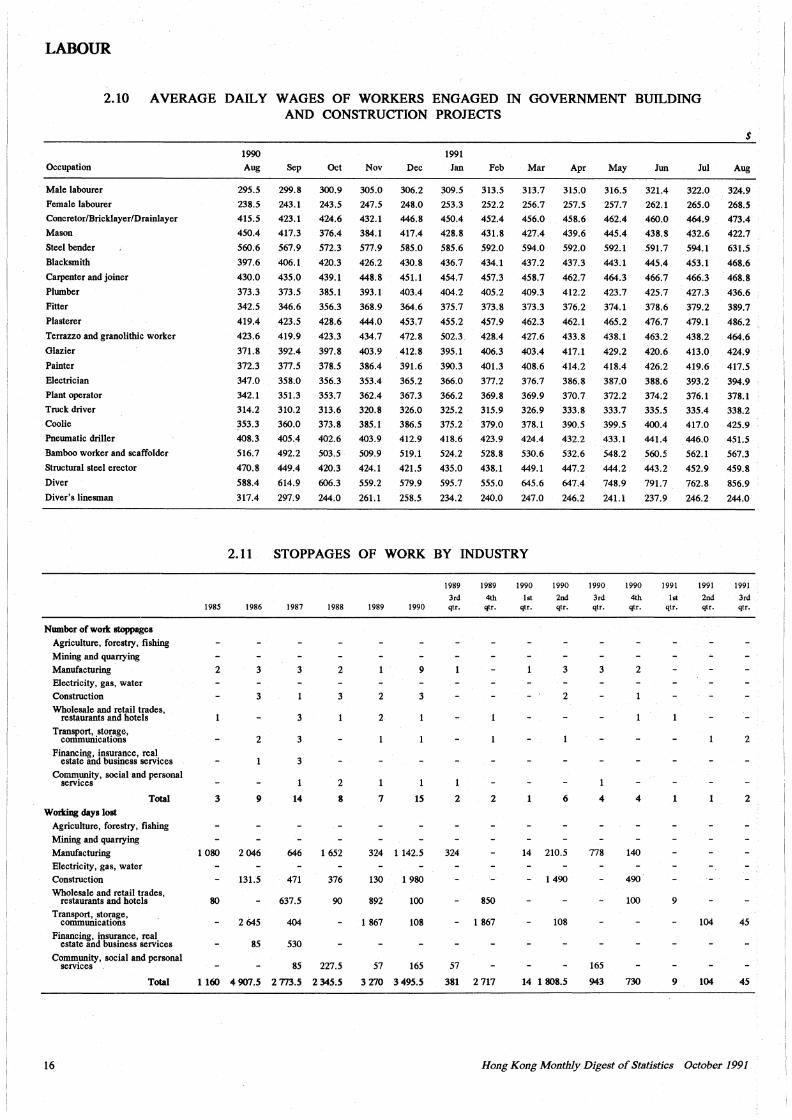
LABOUR
2.10 AVERAGE DAILY WAGES OF WORKERS ENGAGED IN GOVERNMENT BUILDING
Occupation
Male labourer
Female labourer
Concretor/Bricldayer/Drainlayer
Mason
Steel bender
Blacksmith
Carpenter and joiner
Plumber
Fitter
Plasterer
Terrazzo and granolithic worker
Glazier
Painter
Electrician
Plant operator
Truck driver
Coolie
Pneumatic driller
Bamboo worker and scaffolder
Structural steel erector
Diver
Diver's linesman
Number of work stoppages
Agriculture, forestry, fishing
Mining and quarrying
Manufacturing
Electricity, gas, water
Construction
Wholesale and retail trades, restaurants and hotels
Transport, .sto~age, commumcatlons
Financing, insurance, real estate and business services
Comm.unity, social and personal services
Total
Working days lost
Agriculture, forestry, fishing
Mining and quarrying
Manufacturing
Electricity, gas, water
Construction
Wholesale and retail trades, restaurants and hotels
Transport, storage, communications
Financing, insurance, real estate and business services
Comm.unity, social and personal services
Total
16
1990 Aug
295.5
238.5
415.5
450.4
560.6
397.6
430.0
373.3
342.5
419.4
423.6
371.8
372.3
347.0
342.l
314.2
~53.3
408.3
516.7
470.8
588.4
317.4
AND CONSTRUCTION PROJECTS
Sep
299.8
243.l
423.1
417.3
567.9
406.1
435.0
373.5
346.6
423.5
419.9
392.4
377.5
358.0
351.3
310.2
360.0
405.4
492.2
449.4
614.9
297.9
Oct Nov
300.9 305.0
243.S 247.5
424.6 432.1
376.4 384.l
572.3 577.9
420.3 426.2
439.1 448.8
385.1 393.1
356.3 368.9
428.6 444.0
423.3 434.7
397.8 403.9
378.5 386.4
356.3 353.4
353.7 362.4
313.6 320.8
373.8 385.1
402.6 403.9
503.5 509.9
420.3 424.1
606.3 559.2
244.0 261.1
Dec
306.2
248.0
446.8
417.4
585.0
430.8
451.l
403.4
364.6
453.7
472.8
412.8
391.6
365.2
367.3
326.0
386.5
412.9
519.1
421.5
579.9
258.5
1991 Jan
309.5
253.3
450.4
428.8
585.6
436.7
454.7
404.2
375.7
455.2
502.3
395.1
390.3
366.0
366.2
325.2
375.2
418.6
524.2
435.0
595.7
234.2
Feb
313.5
252.2
452.4
431.8
592.0
434.1
457.3
405.2
373.8
457.9
428.4
406.3
401.3
377.2
369.8
315.9
379.0
423.9
528.8
438.1
555.0
240.0
Mar
313.7
256.7
456.0
427.4
594.0
437.2
458.7
409.3
373.3
462.3
427.6
403.4
408.6
376.7
369.9
326.9
378.1
424.4
530.6
449.1
645.6
247.0
Apr
315.0
257.5
458.6
439.6
592.0
437.3
462.7
412.2
376.2
462.1
433.8
417.1
414.2
386.8
370.7
333.8
390.5
432.2
532.6
447.2
647.4
246.2
2.11 STOPPAGES OF WORK BY INDUSTRY
1985
2
3
1 080
80
1986 1987
3 3
3
3
2 3
3
9 14
2046 646
13L5 471
637.5
2 645 404
85 530
1988
2
3
2
8
1 652
376
90
85 227.5
1 160 4 907.5 2 773.5 2 345.5
1989 1990
9
2 3
2
7 15
324 1 142.5
130 1 980
892 100
1 867 108
57 165
3 270 3 495.5
1989
3rd qtr.
2
324
57
1989
4th qtr.
2
850
1 867
381 2 717
1990
lst qtr.
1990
2nd qtr.
3
2
6
14 210.5
1490
108
14 1 808.5
May
316.5
257.7
462.4
445.4
592.1
443.1
464.3
423.7
374.1
465.2
438.1
429.2
418.4
387.0
372.2
333.7
399.5
433.l
548.2
444.2
748.9
241.1
1990
3rd qtr.
1990
4th qtr.
3
4
778
165
943
2
4
140
490
100
730
Jun
321.4
262.1
460.0
438.8
591.7
445.4
466.7
425.7
378.6
476.7
463.2
420.6
426.2
388.6
374.2
335.5
400.4
441.4
560.5
443.2
791.7
237.9
1991
lst qtr.
9
9
Jui
322.0
265.0
464.9
432.6
594.1
453.l
466.3
427.3
379.2
479.1
438.2
413.0
419.6
393.2
376.1
335.4
417.0
446.0
562.1
452.9
762.8
246.2
1991
2nd qtr.
104
104
$
Aug
324.9
268.5
473.4
422.7
631.5
468.6
468.8
436.6
389.7
486.2
464.6
424.9
417.S
394.9
378.1
338.2
425.9
451.5
567.3
459.8
856.9
244.0
1991
3rd qtr.
2
2
45
45
Hong Kong Monthly Digest of Statistics October 1991
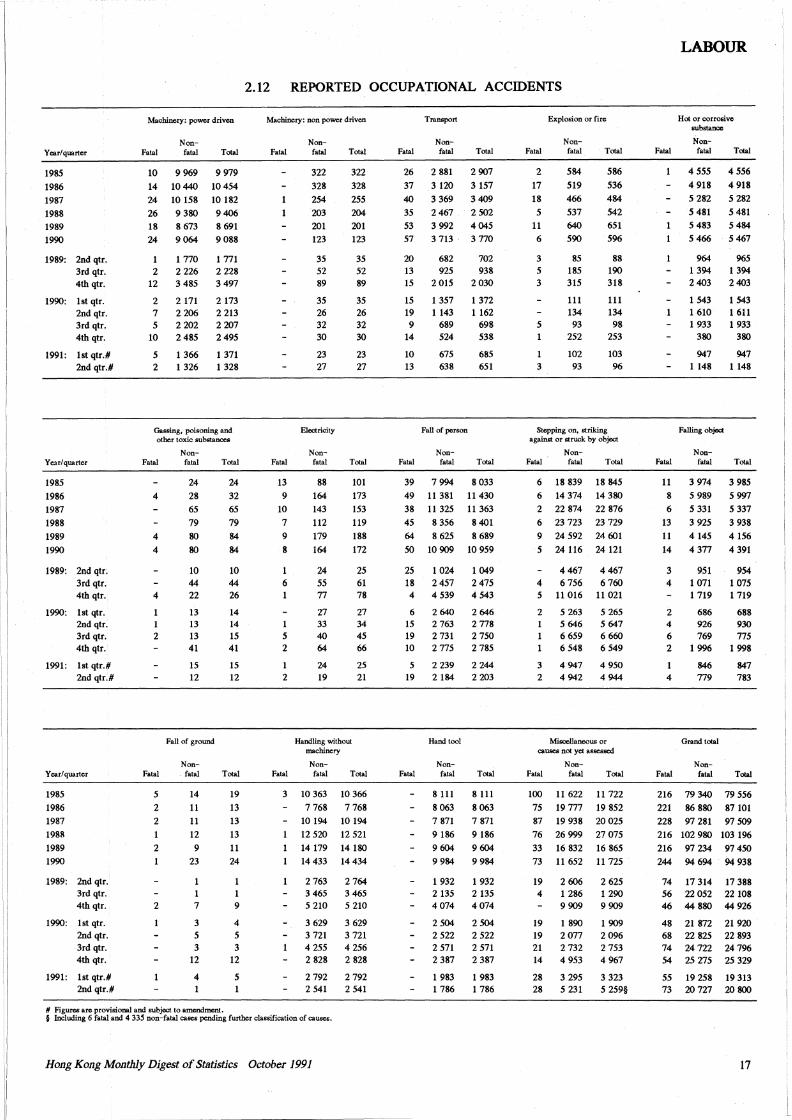
I I
2.12 REPORTED OCCUPATIONAL ACCIDENTS
Year/quarter
1985
1986
1987
1988 1989 1990
1989: 2nd qtr. 3rd qtr, 4th qtr.
1990: lst qtr. 2nd qtr. 3rd qtr. 4th qtr.
1991: lst qtr.# 2nd qtr.#
Year/quarter
1985
1986 1987
1988
1989
1990
1989: 2nd qtr. 3rd qtr. 4th qtr.
1990: lst qtr. 2nd qtr. 3rd qtr. 4th qtr.
1991: lst qtr.# 2nd qtr.#
Year/quarter
1985
1986
1987
1988
1989
1990
1989: 2nd qtr. 3rd qtr. 4th qtr.
1990: lst qtr. 2nd qtr. 3rd qtr. 4th qtr.
1991: lst qtr.# 2nd qtr.#
Machinery: power driven
Fatal Non
fatal Total
10 9 969 9 979
14 10 440 10 454
24 10 158 10 182
26 9 380 9 406 18 8 673 8 691
24 9 064 9 088
1 1770 1771 2 2 226 2 228
12 3 485 3 497
2 2 171 2 173 7 2 206 2 213 5 2202 2207
10 2 485 2 495
5
2 1 366 1 326
1 371 1 328
Gassing, poisoning and other toxic substances
Fatal
4
4
4
4
2
Fatal
5
2
2
1
2
2
Non-fatal
24
28
65
79
80
80
10 44 22
13 13 13 41
15 12
Fall of ground
Nonfatal
14
11
11
12
9
23
7
3 5 3
12
4
Total
24
32
65
79
84
84
10 44 26
14 14 15 41
15 12
Total
19
13
13
13
11
24
9
4 5 3
12
5
# Figures are provisional and subject to amendment.
Machinery: non power driven
Fatal
Fatal
13
9 10
7
9
8
6
5 2
2
Fatal
Nonfatal
322
328
254
203 201 123
35 52 89
35 26 32 30
23 27
Electricity
Nonfatal
88
164 143
112
179
164
24 55 77
27 33 40 64
24 19
Total
322
328
255
204 201 123
35 52 89
35 26 32 30
23 27
Total
101
173
153
119
188
172
25 61 78
27 34 45 66
25 21
Handling without machinery
Nonfatal Total
3 10 363 10 366
7 768 7 768
10 194 10 194
12 520 12 521
14 179 14 180
14 433 14 434
2 763 2 764 3 465 3 465 5 210 5 210
3 629 3 629 3 721 3 721 4 255 4 256 2 828 2 828
2 792 2 792 2 541 2 541
§ Including 6 fatal and 4 335 non-fatal cases pending further classification of causes.
Hong Kong Monthly Digest of Statistics October 1991
Fatal
Transport
Nonfatal Total
26 2 881 2 907
37 3 120 3 157
40 3 369 3 409
35 2 467 2 502 53 3 992 4 045
57 3 713 3 770
20 682 702 13 925 938 15 2 015 2 030
15 1 357 1 372 19 1 143 1 162 9 689 698
14 524 538
10 13
Fatal
39
49
38
45
64
50
25 18 4
675 638
685 651
Fall of person
Nonfatal
7 994
11 381
11 325
8 356
8 625
10 909
1024 2457 4 539
Total
8 033
11430 11 363
8 401
8 689
10 959
1049 2 475 4 543
6 2640 2646 15 2 763 2 778 19 2 731 2 750 10 2 775 2 785
5 2239 2244 19 2 184 2 203
Fatal
Hand tool
Nonfatal Total
8111 8111
8 063 8 063 7 871 7 871
9 186 9 186
9 604 9 604
9 984 9 984
1 932 1 932 2 135 2 135 4 074 4 074
2 504 2 504 2 522 2 522 2 571 2 571 2 387 2 387
1 983 1 983 1 786 1 786
Fatal
2 17
18
5
11
6
3 5 3
5
1 3
Explosion or fire
Nonfatal Total
584
519
466
537
640 590
85 185 315
111 134 93
252
102 93
586
536
484
542 651
596
88 190 318
111 134 98
253
103 96
Stepping on, striking against or struck by object
Fatal
6
6
2 6
9
5
4 5
Nonfatal
18 839
14 374
22 874
23 723
24 592
24 116
4 467 6756
11 016
Total
18 845
14 380 22 876
23 729
24 601
24 121
4467 6760
11 021
2 5263 5265 5 646 5 647 6 659 6 660 6 548 6 549
3 4 947 4 950 2 4 942 4 944
Miscellaneous or causes not yet assessed
Fatal Non
fatal Total
100 11 622 11 722
75 19 777 19 852
87 19 938 20 025
76 26 999 27 075
33 16 832 16 865
73 11 652 11 725
19 2 606 2 625 4 1 286 1 290
9 909 9 909
19 1 890 1 909 19 2077 2096 21 2 732 2 753 14 4 953 4 967
28 3 295 3 323 28 5 231 5 259§
Fatal
Fatal
11 8
6
13
11 14
3 4
LABOUR
Hot or corrosive substance
Non-fatal Total
4 555 4 556
4 918 4 918
5 282 5 282
5 481 5 481
5 483 5 484
5 466 5467
964 965 1 394 1 394 2 403 2 403
1 543 1 543 1 610 1 611 1 933 1 933
380 380
947 947 1 148 1 148
Falling object
Nonfatal
3 974
5 989 5 331
3 925
4145
4 377
951 1071 1 719
Total
3 985
5 997
5 337
3 938
4156
4 391
954 1075 1 719
2 686 688 4 926 930 6 769 775 2 1996 1998
4
Fatal
846 779
Grand total
Nonfatal
847 783
Total
216 79 340 79 556
221 86 880 87 101
228 97 281 97 509 216 102 980 103 196
216 97 234 97 450
244 94 694 94 938
74 17 314 17 388 56 22 052 22 108 46 44 880 44 926
48 21 872 21 920 68 22 825 22 893 74 24 722 24 796 54 25 275 25 329
55 19 258 19 313 73 20 727 20 800
17
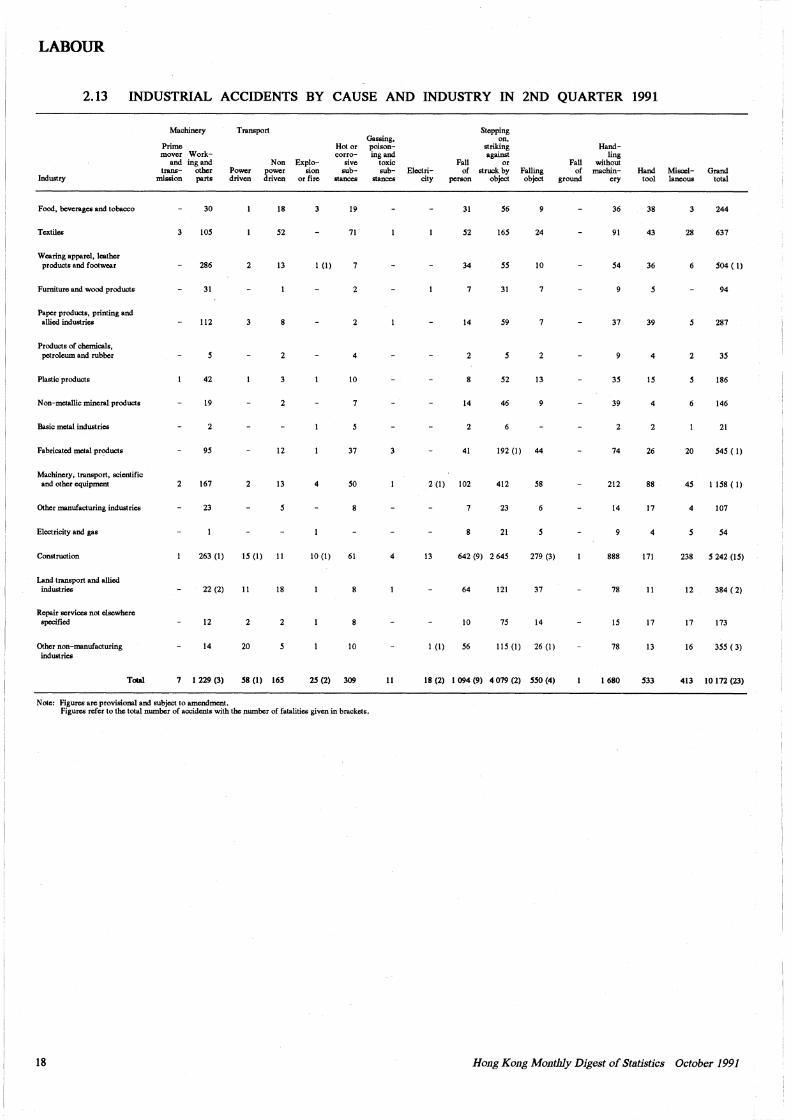
LABOUR
2.13 INDUSTRIAL ACCIDENTS BY CAUSE AND INDUSTRY IN 2ND QUARTER 1991
Machinery Transport Stepping Gassing, on,
Prime Hot or poison- striking Hand-mover Work- corro- ing and against ling
and ing and Non Explo- sive toxic Fall or Fall without trans- other Power power sion sub- sub- Electri- of struck by Falling of machin- Hand Miscel- Grand
Industry mission parts driven driven or fire stances stances city person object object ground ery tool laneous total
Food, beverages and tobacco 30 18 3 19 31 56 36 38 244
Textiles 105 52 71 52 165 24 91 43 28 637
Wearing apparel, leather products and footwear 286 2 13 I (I) 7 34 55 10 54 36 504 (I)
Furniture and wood products 31 2 7 31 7 5 94
Paper products, printing and allied industries 112 2 14 59 37 39 287
Products of chemicals, petroleum and rubber 4 2 2 9 4 2 35
Plastic products 42 10 52 13 35 15 5 186
Non-metallic mineral products 19 14 46 39 4 146
Basic metal industries 2 2 2 2 21
Fabricated molal products 95 12 37 41 192 (I) 44 74 26 20 545 (I)
Machinery, transport, scientific and other equipment 2 167 13 4 50 2 (1) 102 412 58 212 88 45 1 158 ( 1)
Other manufacturing industries 23 7 23 14 17 4 107
Electricity and gas 21 4 54
Construction 263 (I) 15 (I) II 10 (I) 61 13 642 (9) 2 645 279 (3) 888 171 238 5 242 (15)
Land transport and allied industries 22 (2) 11 18 64 121 37 78 11 12 384 ( 2)
Repair services not elsewhere specified 12 2 10 75 14 15 17 17 173
Other non-manufacturing 14 20 10 I (I) 56 115 (I) 26 (I) 78 13 16 355 ( 3) industries
Tolal 7 I 229 (3) 58 (I) 165 25 (2) 309 II 18 (2) I 094 (9) 4 079 (2) 550 (4) 1680 533 413 JO 172 (23)
Note: Figures are provisional and subject to amendment. Figures refer to the total number of accidents with the number of fatalities given in brackets.
18 Hong Kong Monthly Digest of Statistics October 1991
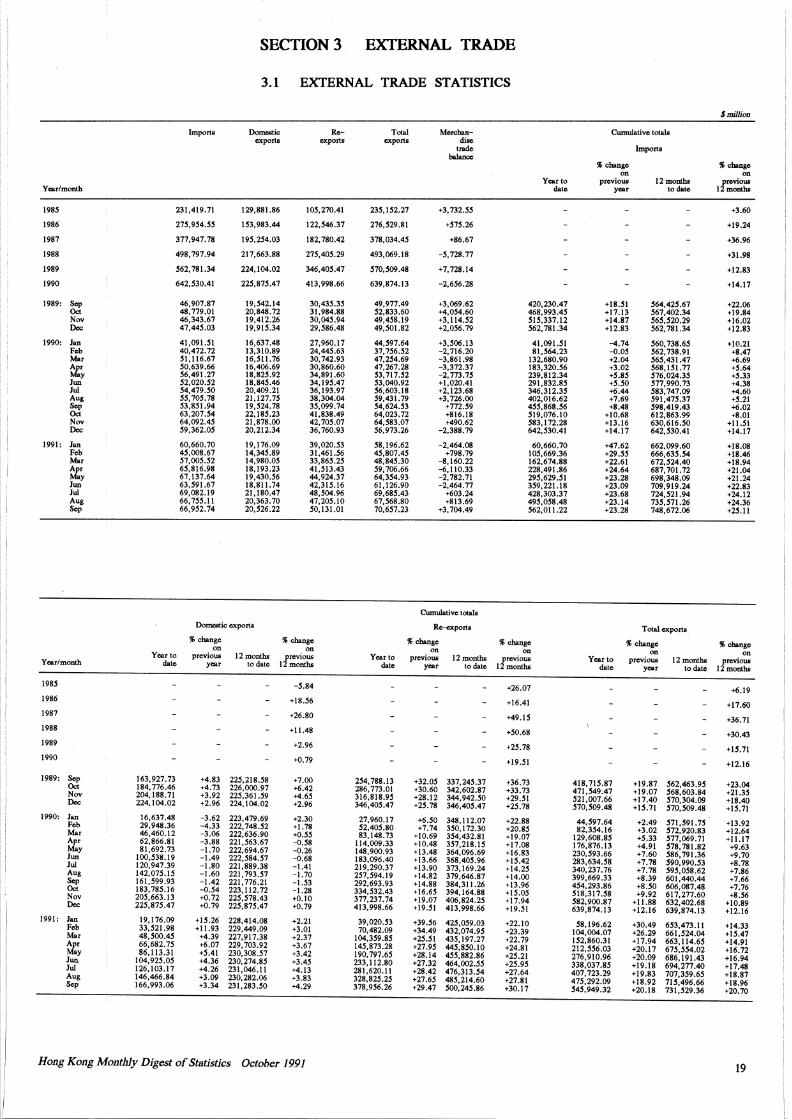
SECTION3 EXTERNAL TRADE
3.1 EXTERNAL TRADE STATISTICS
$mi1Hoa
Import• Domestic Re- Total Mcn:ban- Cumulative totals export& exports export• disc
trade Import& balance
% change % change on on
Year to previous 12 IDOlllhs proviOU& date year todato 12 IDOlllhs Ycar/moolh
198S 231,419.71 129,881.86 IOS,270.41 23S,IS2.21 +3,132.SS +3.60
1986 21S,9S4.SS IS3,983.44 122,S46.37 276,S29.81 +S1S.26 +19.24
1987 377,947.78 19S,2S4.03 182,780.42 378,034.4S +86.67 +36.96
1988 498,797.94 217,663.88 21S,40S.29 493,069.18 -S,128.11 +31.98
1989 S62,781.34 224,104.02 346,40S.47 S10,S09.48 +7,728.14 +12.83
1990 642,S30.41 22S,87S.47 413,998.66 639,874.13 -2,6S6.28 +14.17
1989: Sop 46,907.87 19,S42.14 30,43S.3S 49,977.49 +3,069.62 420,230.47 +18.SI S64,42S.67 +22.06 Oct 48,779.01 20,848.72 31,984.88 S2,833.60 +4,0S4.60 468,993.4S +17.13 S67,402.34 +19.84 Nov 46,343.67 19,412.26 30,04S.94 49,4S8.19 +3,114.S2 SIS,331.12 +14.87 S6S,S20.29 +16.02 Dec 47,44S.03 19,91S.34 29,S86.48 49,SOl.82 +2,0S6.19 S62,781.34 +12.83 S62,781.34 +12.83
1990: Jan 41,091.SI 16,637.48 27,960.17 44,S97.64 +3,S06.13 41,091.SI -4.74 S60,738.6S +10.21 Fob 40,472.72 13,310.89 24,44S.63 31,1S6.S2 -2,716.20 81,S64.23 -0.0S S62, 738.91 +8.47 Mar Sl,116.67 16,Sll.16 30,742.93 47,2S4.69 -3,861.98 132,680.90 +2.04 S6S,431.47 +6.69 Apr S0,639.66 16,406.69 30,860.60 47,267.28 -3,372.37 183,320.S6 +3.02 S68,ISl.77 +S.64
18,82S.92 34,891.60 S3,111.S2 -2,113.1S 239,812.34 +S.8S S76,024.3S +S.33 May S6,491.27 291,832.8S +S.SO S77,990.73 +4.38 Jun S2,020.S2 18,84S.46 34,19S.47 S3,040.92 +1,020.41
Jui S4,479.SO 20,409.21 36,193.97 S6,603.18 +2,123.68 346,312.3S +6.44 S83,747.09 +4.60 Aug SS,10S.18 21,121.1S 38,304.04 S9,431.79 +3,726.00 402,016.62 +7.69 S91,47S.37 +S.21 Sop S3,8Sl.94 19,S24.78 3S,099.14 S4,624.S3 +112.S9 4SS,868.S6 +8.48 S98,419.43 +6.02
63,207.S4 22,18S.23 41,838.49 64,023.72 +816.18 Sl9,076.IO +10.68 612,863.99 +8.01 Oct S83,172.28 +13.16 630,616.SO +II.SI Nov 64,092.4S 21,878.00 42,70S.07 64,S83.07 +490.62
Dec S9,362.0S 20,212.34 36,760.93 S6,913.26 -2,388.79 642,530.41 +14.17 642,S30.41 +14.17
1991: Jan 60,660.70 19,176.09 39,020.S3 S8,196.62 -2,464.08 60,660.70 +47.62 662,099.60 +18.08 Fob 4S,008.61 14,34S.89 31,461.56 4S,801.4S +798.79 IOS,669.36 +29.SS 666,63S.S4 +18.46 Mar S1,00S.S2 14,980.0S 33,86S.25 48,84S.30 -8,160.22 162,674.88 +22.61 612,S24.40 +18.94 Apr 6S,816.98 18,193.23 4l,S13.43 S9, 106.66 -6,110.33 228,491.86 +24.64 687,701.72 +21.04 May 67,137.64 19,430.S6 44,924.37 64,3S4.93 -2,782.71 29S,629.SI +23.28 698,348.09 +21.24 Jun 63,S91.67 18,811.74 42,31S.16 61,126.90 -2,464.77 3S9,221.18 +23.09 709,919.24 +22.83 Jui 69,082.19 21,180.47 48,S04.96 69,68S.43 +603.24 428,303.37 +23.68 724,S21.94 +24.12 Aug 66,1S5.ll 20,363.70 41,205.10 67,568.80 +813.69 495,058.48 +23.14 135,511.26 +24.36 Sop 66,952.74 20,526.22 50,131.01 70,657.23 +3,704.49 562,011.22 +23.28 748,672.06 +25.11
Cumulative total•
Domestic export& Ro-export& Total export• % change % change % change % change % change "cbango on on on on on on Year to previous 12moolho previous Year to previous 12moolho previous Year to previous 12moolho frcvious Year/month date yosr to date 12moolho date year to date 12moolho date year to date I moolho
1985 -5.84 +26.07 +6.19 1986 +18.56 +16.41 +17.60 1987 +26.80 +49.15 +36.71 1988 +11.48 +50.68 +30.43 1989 +2.96 +25.78 +15.71 1990 +0.79 +19.51 +12.16
1989: ~ 163,927.73 +4.83 22S,218.58 +1.00 254,788.13 +32.0S 337,245.37 +36.73 418,715.87 +19.87 S62,463.9S +23.04 184, 776.46 +4.73 226,000.97 +6.42 286,773.01 +30.60 342,602.87 +33.73 471,S49.47 +19.07 568,603.84 +21.35 Nov 204,188.71 +3.92 22S,361.59 +4.65 316,818.95 +28.12 344,942.50 +29.51 521,007.66 +17.40 570,304.09 +18.40 Doc 224,104.02 +2.96 224,104.02 +2.96 346,405.47 +25.78 346,405.47 +25.18 510,509.48 +15.71 510,509.48 +15.11 1990: Jan 16,637.48 -3.62 223,479.69 +2.30 27,960.17 +6.SO 348,112.07 +22.88 44,597.64 +2.49 511,591.15 +13.92 Fob 29,948.36 -4.33 222,748.52 +1.78 52,405.80 +7.74 350,172.30 +20.85 82,354.16 +3.02 572,920.83 +12.64 Mar 46,460.12 -3.06 222,636.90 +0.55 83,148.73 +10.69 354,432.81 +19.07 129,608.8S +5.33 577,069.71 +11.17 Apr 62,866.81 -3.88 221,563.67 -0.58 114,009.33 +10.48 357,218.15 +17.08 176,876.13 +4.91 578,781.82 +9.63 May 81,692.73 -1.70 222,694.67 -0.26 148,900.93 +13.48 364,096.69 +16.83 230,593.66 +1.60 586,791.36 +9.70 Jun 100,S38.19 -1.49 222,584.51 -0.68 183,096.40 +13.66 368,405.96 +15.42 283,634.58 +7.78 S90,990.S3 +8.78 Jui 120,947.39 -1.80 221,889.38 -1.41 219,290.37 +13.90 373,169.24 +14.25 340,237.76 +7.78 595,058.62 +7.86 Aug 142,075.15 -1.60 221,793.57 -1.70 257,594.19 +14.82 379,646.87 +14.00 399,669.33 +8.39 601,440.44 +7.66 Sop 161,599.93 -1.42 221, 776.21 -1.53 292,693.93 +14.88 384,311.26 +13.96 454,293.86 +8.SO 606,087.48 +1.16 Oct 183,785.16 -0.S4 223,112.72 -1.28 334,S32.43 +)6.6S 394,164.88 +JS.OS 518,317.S8 +9.92 617,277.60 +8.S6 Nov 20S,663.13 +0.72 225,S18.43 +0.JO 377,237.74 +19.07 406,824.2S +17.94 582,900.87 +11.88 632,402.68 +10.89 Doc 22S,87S.47 +0.79 225,87S.47 +0.79 413,998.66 +19.51 413,998.66 +19.51 639,874.13 +12.16 639,874.13 +12.16 1991: Jan 19,176.09 +IS.26 228,414.08 +2.21 39,020.53 +39.56 425,0S9.03 +22.10 58,196.62 +30.49 6S3,473.IJ +14.33 Fob 33,S21.98 +11.93 229,449.09 +3.01 70,482.09 +34.49 432,074.9S +23.39 104,004.07 +26.29 661,S24.04 +JS.47 Mar 48,S00.45 +4.39 227,917.38 +2.37 104,359.8S +2S.5J 43S,197.27 +22.79 152,860.31 +17.94 663,114.6S +14.91 Apr 66,682.1S +6.01 229,703,92 +3.67 145,873.28 +21.9S 44S,8SO.IO +24.81 212,S56.03 +20.17 61S,SS4.02 +16.72 May 86,113.31 +S.41 230,308.S7 +3.42 190,797.6S +28.14 4SS,882.86 +25.21 276,910.96 +20.09 686,191.43 +16.94 Jun. 104,925.0S +4.36 230,274.8S +3.4S 233,112.80 +27.32 464,002.SS +25.9S 338,037.8S +19.18 694,277.40 +17.48 Jui 126,103.17 +4.26 231,046.11 +4.13 281,620.11 +28.42 476,313.54 +27.64 407, 723.29 +19.83 101,3S9.6S +18.87 Aug 146,466.84 +3.09 230,282.06 +3.83 328,825.25 +21.6S 48S,214.60 +27.81 41S,292.09 +18.92 71S,496.66 +18.96 Sop 166,993.06 +3.34 231,283.SO +4.29 378,9S6.26 +29.47 S00,24S.86 +30.17 S4S,949.32 +20.18 731,S29.36 +20.70
Hong Kong Monthly Digest ofStatistics October 1991 19
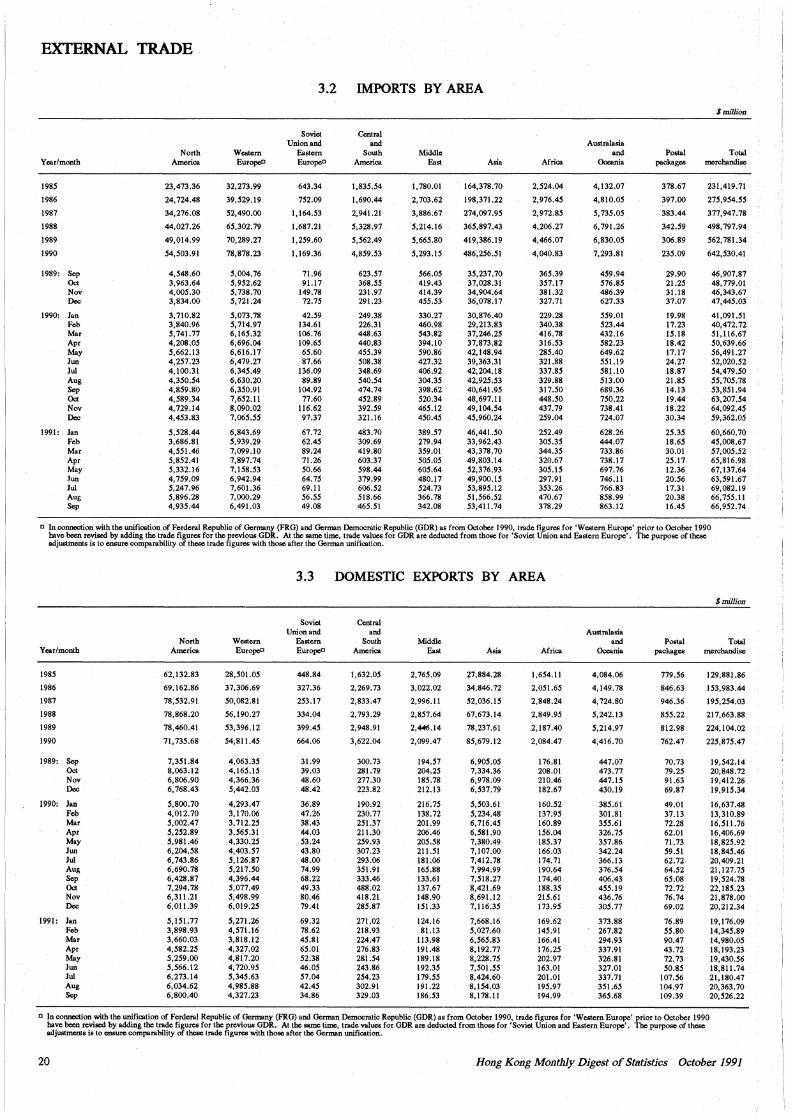
EXTERNAL TRADE
3.2 IMPORTS BY AREA
$million
Soviet Central Union and and Australasia
North Western Eastern South Middle and Postal Total Year/month America EuropeC EuropeC America East Asia Africa Oceania packages merchandise
1985 23,473.36 32,273.99 643.34 1,835.54 1,780.01 164,378.70 2,524.04 4, 132.07 378.67 231,419.71
1986 24,724.48 39,529.19 752.09 1,690.44 2, 703.62 198,371.22 2,976.45 4,810.05 397.00 275,954.55
1987 34,276.08 52,490.00 1,164.53 2,941.21 3,886.67 274,097.95 2,972.85 5,735.05 383.44 377,947.78
1988 44,027.26 65,302.79 1,687.21 5,328.97 5,214.16 365,897.43 4,206.27 6, 791.26 342.59 498, 797.94
1989 49,014.99 70,289.27 1,259.60 5,562.49 5,665.80 419,386.19 4,466.07 6,830.05 306.89 562, 781.34
1990 54,503.91 78,878.23 1,169.36 4,859.53 5,293.15 486,256.51 4,040.83 7,293.81 235.09 642,530.41
1989: Sep 4,548.60 5,004.76 71.96 623.57 566.05 35,237.70 365.39 459.94 29.90 46,907.87 Oct 3,963.64 5,952.62 91.17 368.55 419.43 37,028.31 357.17 576.85 21.25 48,779.01 Nov 4,005.30 5, 738.70 149.78 231.97 414.39 34,904.64 381.32 486.39 31.18 46,343.67 Dec 3,834.00 5,721.24 72.75 291.23 455.53 36,078.17 327.71 627.33 37.07 47,445.03
1990: Jan 3,710.82 5,073.78 42.59 249.38 330.27 30,876.40 229.28 559.01 19.98 41,091.51 Feb 3,840.96 5, 714.97 134.61 226.31 460.98 29,213.83 340.38 523.44 17.23 40,472.72 Mar 5, 741. 77 6,165.32 106.76 448.63 543.82 37,246.25 416.78 432.16 15.18 51,116.67 Apr 4,208.05 6,696.04 109.65 440.83 394.10 37,873.82 316.53 582.23 18.42 50,639.66 May 5,662.13 6,616.17 65.60 455.39 590.86 42,148.94 285.40 649.62 17.17 56,491.27 Jun 4,257.23 6,479.27 87.66 508.38 427.32 39,363.31 321.88 551.19 24.27 52,020.52 Jui 4,100.31 6,345.49 136.09 348.69 406.92 42,204.18 337.85 581.10 18.87 54,479.50 Aug 4,350.54 6,630.20 89.89 540.54 304.35 42,925.53 329.88 513.00 21.85 55,705.78 Sep 4,859.80 6,350.91 104.92 474.74 398.62 40,641.95 317.50 689.36 14.13 53,851.94 Oct 4,589.34 7,652.11 77.60 452.89 520.34 48,697.11 448.50 750.22 19.44 63,207.54 Nov 4, 729.14 8,090.02 116.62 392.59 465.12 49,104.54 437.79 738.41 18.22 64,092.45 Dec 4,453.83 1,065.55 97.37 321.16 450.45 45,960.24 259.04 724.07 30.34 59,362.05
1991: Jan 5,528.44 6,843.69 67.72 483.70 389.57 46,441.50 252.49 628.26 25.35 60,660.70 Feb 3,686.81 5,939.29 62.45 309.69 279.94 33,962.43 305.35 444.07 18.65 45,008.67 Mar 4,551.46 7,099.10 89.24 419.80 359.01 43,378.70 344.35 733.86 30.01 57,005.52 Apr 5,852.41 7,897.74 71.26 603.37 505.05 49,803.14 320.67 738.17 25.17 65,816.98 May 5,332.16 7,158.53 50.66 598.44 605.64 52,376.93 305.15 697.76 12.36 67,137.64 Jun 4, 759.09 6,942.94 64.75 379.99 480.17 49,900.15 297.91 746.11 20.56 63,591.67 Jui 5,247.96 7,601.36 69.11 606.52 524.73 53,895.12 353.26 766.83 17.31 69,082.19 Aug 5,896.28 7,000.29 56.55 518.66 366.78 51,566.52 470.67 858.99 20.38 66,755.11 Sep 4,935.44 6,491.03 49.08 465.51 342.08 53,411.74 378.29 863.12 16.45 66,952.74
a In connection with the unification of Ferderal Republic of Germany (FRG) and German Democratic Republic (GDR) as from October 1990, trade figures for 'Western EurQPC' prior to October 1990 have been revised by adding the trade figures for the previous GDR. At the same time, trade values for GDR are deducted from those for 'Soviet Union and Eastern Europe'. The purpose of these adjustments is to ensure comparability of these trade figures with those after the German unification.
3.3 DOMESTIC EXPORTS BY AREA
$million
Soviet Central Union and and Australasia
North Western Eastern South Middle and Postal Total Year/month America EuropeC EuropeC America East Asia Africa Oceania packages merchandise
1985 62,132.83 28,501.05 448.84 1,632.05 2,765.09 27,884.28 1,654.11 4,084.06 779.56 129,881.86
1986 69, 162.86 37,306.69 327.36 2,269.73 3,022.02 34,846.72 2,051.65 4,149.78 846.63 153,983.44
1987 78,532.91 50,082.81 253.17 2,833.47 2,996.11 52,036.15 2,848.24 4,724.80 946.36 195,254.03
1988 78,868.20 56,190.27 334.04 2,793.29 2,857.64 67,673.14 2,849.95 5,242.13 855.22 217,663.88
1989 78,460.41 53,396.12 399.45 2,948.91 2.~.14 78,237.61 2,187.40 5,214.97 812.98 224,104.02
1990 71, 735.68 54,811.45 664.06 3,622.04 2,099.47 85,679.12 2,084.47 4,416.70 762.47 225,875.47
1989: Sep 7,351.84 4,063.35 31.99 300.73 194.57 6,905.05 176.81 447.07 70.73 19,542.14 Oct 8,063.12 4,165.15 39.03 281.79 204.25 7,334.36 208.01 473.77 79.25 20,848.72 Nov 6,806.90 4,366.36 48.60 277.30 185.78 6,978.09 210.46 447.15 91.63 19,412.26 Dec 6,768.43 5,442.03 48.42 223.82 212.13 6,537.79 182.67 430.19 69.87 19,915.34
1990: Jan 5,800.70 4,293.47 36.89 190.92 216.75 5,503.61 160.52 385.61 49.01 16,637.48 Feb 4,012.70 3,170.06 47.26 230.77 138.72 5,234.48 137.95 301.81 37.13 13,310.89 Mar 5,002.47 3, 712.25 38.43 251.37 201.99 6,716.45 160.89 355.61 72.28 16,511.76 Apr 5,252.89 3,565.31 44.03 211.30 206.46 6,581.90 156.04 326.75 62.01 16,406.69 May 5,981.46 4,330.25 53.24 259.93 205.58 7,380.49 185.37 357.86 71.73 18,825.92 Jun 6,204.58 4,403.57 43.80 307.23 211.51 7,107.00 166.03 342.24 59.51 18,845.46 Jui 6, 743.86 5, 126.87 48.00 293.06 181.06 7,412.78 174.71 366.13 62.72 20,409.21 Aug 6,690.78 5,217.50 74.99 351.91 165.88 7,994.99 190.64 376.54 64.52 21,127.75 Sep 6,428.87 4,396.44 68.22 333.46 133.61 7,518.27 174.40 406.43 65.08 19,524.78 Oct 7,294.78 5,077.49 49.33 488.02 137.67 8,421.69 188.35 455.19 72.72 22.185.23 Nov 6,311.21 5,498.99 80.46 418.21 148.90 8,691.12 215.61 436.76 76.74 21,878.00 Dec 6,011.39 6,019.25 79.41 285.87 151.33 7,116.35 173.95 305.77 69.02 20,212.34
1991: Jan 5,151.77 5,271.26 69.32 271.02 124.16 7,668.16 169.62 373.88 76.89 19,176.09 Feb 3,898.93 4,571.16 78.62 218.93 81.13 5,027.60 145.91 267.82 55.80 14,345.89 Mar 3,660.03 3,818.12 45.81 224.47 113.98 6,565.83 166.41 294.93 90.47 14,980.05 Apr 4,582.25 4,327.02 65.01 276.83 191.48 8, 192.77 176.25 337.91 43.72 18,193.23 May 5,259.00 4,817.20 52.38 281.54 189.18 8,228.75 202.97 326.81 72.73 19,430.56 Jun 5,566.12 4,720.95 46.05 243.86 192.35 7,501.55 163.01 327.01 SO.SS 18,811.74 Jui 6,273.14 5,345.63 57.04 254.23 179.55 8,424.60 201.01 337.71 107.56 21, 180.47 Aug 6,034.62 4,985.88 42.45 302.91 191.22 8,154.03 195.97 351.65 104.97 20,363.70 Sep 6,800.40 4,327.23 34.86 329.03 186.53 8,178.11 194.99 365.68 109.39 20,526.22
c In connection with the unification of Ferderal Republic of Germany (FRG) and German Democratic Republic (GDR) as from October 1990, trade figures for 'Western Europe' prior to October 1990 have been revised by adding the trade figures for the previous GDR. At the same time, trade values for GDR arc deducted from those for 'Soviet Union and Eastern Europe'. The purpose of these adjustments is to ensure comparability of these trade figures with those after the German unification.
20 Hong Kong Monthly Digest of Statistics October 1991
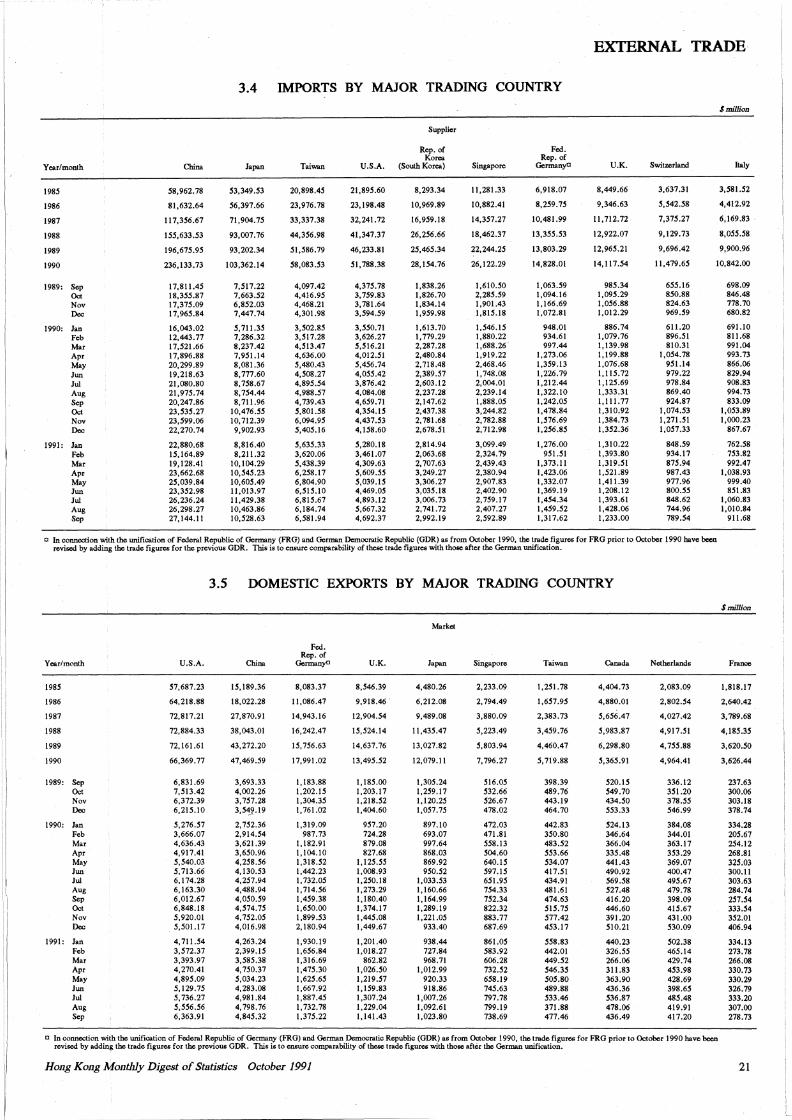
EXTERNAL TRADE
3.4 IMPORTS BY MAJOR TRADING COUNTRY $million
Supplier
Rep. of Fed. Korea Rep. of
Year/month China Japan Taiwan U.S.A. (South Korea) Singapore German yo U.K. Switzerland Italy
1985 58,962.78 53,349.53 20,898.45 21,895.60 8,293.34 11,281.33 6,918.07 8,449.66 3,637.31 3,581.52
1986 81,632.64 56,397.66 23,976.78 23,198.48 10,969.89 10,882.41 8,259.75 9,346.63 5,542.58 4,412.92
1987 117,356.67 71,904.75 33,337.38 32,241.72 16,959.18 14,357.27 10,481.99 11,712.72 7,375.27 6,169.83
1988 155,633.53 93,007.76 44,356.98 41,347.37 26,256.66 18,462.37 13,355.53 12,922.07 9,129.73 8,055.58
1989 196,675.95 93,202.34 51,586.79 46,233.81 25,465.34 22,244.25 13,803.29 12,965.21 9,696.42 9,900.96
1990 236,133.73 103,362.14 58,083.53 51, 788.38 28,154.76 26,122.29 14,828.01 14,117.54 11,479.65 10,842.00
! I 1989: Sep 17,811.45 7,517.22 4,097.42 4,375.78 1,838.26 1,610.50 1,063.59 985.34 655.16 698.09
Oct 18,355.87 7,663.52 4,416.95 3, 759.83 1,826.70 2,285.59 1,094.16 1,095.29 850.88 846.48 !
I Nov 17,375.09 6,852.03 4,468.21 3, 781.64 1,834.14 1,901.43 1,166.69 1,056.88 824.63 778.70 Dec 17,965.84 7,447.74 4,301.98 3,594.59 1,959.98 l,815.18 1,072.81 l,012.29 969.59 680.82
1990: Jan 16,043.02 5, 711.35 3,502.85 3,550.71 1,613.70 1,546.15 948.01 886.74 611.20 691.10 Feb 12,443.77 7,286.32 3,517.28 3,626.27 I, 779.29 1,880.22 934.61 1,079.76 896.51 811.68 Mar 17,521.66 8,237.42 4,513.47 5,516.21 2,287.28 1,688.26 997.44 1,139.98 810.31 991.04 Apr 17,896.88 7,951.14 4,636.00 4,012.51 2,480.84 1,919.22 1,273.06 1,199.88 1,054.78 993.73 May 20,299.89 8,081.36 5,480.43 5,456.74 2,718.48 2,468.46 1,359.13 1,076.68 951.14 866.06 Jun 19,218.63 8,777.60 4,508.27 4,055.42 2,389.57 1,748.08 1,226.79 1,115.72 979.22 829.94 Jui 21,080.80 8,758.67 4,895.54 3,876.42 2,603.12 2,004.01 1,212.44 1,125.69 978.84 908.83 Aug 21,975.74 8,754.44 4,988.57 4,084.08 2,237.28 2,239.14 1,322.10 1,333.31 869.40 994.73 Sep 20,247.86 8, 711.96 4,739.43 4,659. 71 2,147.62 1,888.05 1,242.05 I, 111.77 924.87 833.09 Oct 23,535.27 10,476.55 5,801.58 4,354.15 2,437.38 3,244.82 1,478.84 l,310.92 1,074.53 1,053.89 Nov 23,599.06 10,712.39 6,094.95 4,437.53 2, 781.68 2. 782.88 1,576.69 1,384.73 1,271.51 1,000.23 Dec 22,270.74 9,902.93 5,405.16 4,158.60 2,678.51 2, 712.98 l,256.85 1,352.36 1,057.33 867.67
1991: Jan 22,880.68 8,816.40 5,635.33 5,280.18 2,814.94 3,099.49 1,276.00 1,310.22 848.59 762.58 Feb 15,164.89 8,211.32 3,620.06 3,461.07 2,063.68 2,324.79 951.51 1,393.80 934.17 753.82 Mar 19,128.41 10,104.29 5,438.39 4,309.63 2. 707.63 2,439.43 1,373.11 1,319.51 875.94 992.47 Apr 23,662.68 10,545.23 6,258.17 5,609.55 3,249.27 2,380.94 1,423.06 1,521.89 987.43 1,038.93 May 25,039.84 10,605.49 6,804.90 5,039.15 3,306.27 2,907.83 1,332.07 1,411.39 977.96 999.40 Jun 23,352.98 11,013.97 6,515.10 4,469.05 3,035.18 2,402.90 1.369.19 1,208.12 800.55 851.83 Jui 26,236.24 11,429.38 6,815.67 4,893.12 3,006.73 2,759.17 L,454.34 1,393.61 848.62 1,060.83 Aug 26,298.27 10,463.86 6,184.74 5,667.32 2,741.72 2,407.27 1,459.52 1,428.06 744.96 1,010.84 Sep 27,144.11 10,528.63 6,581.94 4,692.37 2,992.19 2,592.89 1,317.62 1,233.00 789.54 911.68
! I o In connection with the unification of Federal Republic of Germany (FRG) and German Democratic Republic (GDR) as from October 1990, the trade figures for FRG prior to October 1990 have been
revised by adding the trade figures for the previous GDR. This is to ensure comparability of these trade figures with those after the German unification.
3.5 DOMESTIC EXPORTS BY MAJOR TRADING COUNTRY
$million
Market
Fed. Rep. of
Year/month U.S.A. China German yo U.K. Japan Singapore Taiwan Canada Netherlands France
1985 57,687.23 15,189.36 8,083.37 8,546.39 4,480.26 2,233.09 1,251.78 4,404.73 2,083.09 1,818.17
1986 64,218.88 18,022.28 11,086.47 9,918.46 6,212.08 2, 794.49 1,657.95 4,880.01 2,802.54 2,640.42
1987 72,817.21 27,870.91 14,943.16 12,904.54 9,489.08 3,880.09 2,383.73 5,656.47 4,027.42 3, 789.68
1988 72,884.33 38,043.01 16,242.47 15,524.14 11,435.47 5,223.49 3,459.76 5,983.87 4,917.51 4,185.35
1989 72,161.61 43,272.20 15, 756.63 14,637.76 13,027.82 5,803.94 4,460.47 6,298.80 4,755.88 3,620.50
1990 66,369.77 47,469.59 17,991.02 13,495.52 12,079.11 7,796.27 5,719.88 5,365.91 4,964.41 3,626.44
1989: Sep 6,831.69 3,693.33 1,183.88 1,185.00 1,305.24 516.05 398.39 520.15 336.12 237.63 Oct 7,513.42 4,002.26 1,202.15 1,203.17 1,259.17 532.66 489.76 549.70 351.20 300.06 Nov 6,372.39 3,757.28 1,304.35 1,218.52 1,120.25 526.67 443.19 434.50 378.55 303.18 Dec 6,215.10 3,549.19 1,761.02 1,404.60 1,057.75 478.02 464.70 553.33 546.99 378.74
1990: Jan 5,276.57 2,752.36 1,319.09 957.20 897.10 472.03 442.83 524.13 384.08 334.28 Feb 3,666.07 2,914.54 987. 73 724.28 693.07 471.81 350.80 346.64 344.01 205.67 Mar 4,636.43 3,621.39 1,182.91 879.08 997.64 558.13 483.52 366.04 363.17 254.12 Apr 4,917.41 3,650.96 1,104.10 827.68 868.03 504.60 553.66 335.48 353.29 268.81 May 5,540.03 4,258.56 1,318.52 1,125.55 869.92 640.15 534.07 441.43 369.07 325.03 Jun 5.713.66 4,130.53 1,442.23 1,008.93 950.52 597.15 417.51 490.92 400.47 300.11 Jui 6, 174.28 4,257.94 I, 732.05 1,250.18 1,033.53 651.95 434.91 569.58 495.67 303.63 Aug 6,163.30 4,488.94 1,714.56 1,273.29 1,160.66 754.33 481.61 527.48 479.78 284.74 Sep 6,012.67 4,050.59 1,459.38 1,180.40 1,164.99 752.34 474.63 416.20 398.09 257.54 Oct 6,848.18 4,574.75 1,650.00 1,374.17 1,289.19 822.32 515.75 446.60 415.67 333.54 Nov 5,920.01 4,752.05 1,899.53 1,445.08 1,221.05 883.77 577.42 391.20 431.00 352.01 Dec 5,501.17 4,016.98 2,180.94 1,449.67 933.40 687.69 453.17 510.21 530.09 406.94
1991: Jan 4,711.54 4,263.24 l,930.19 1,201.40 938.44 861.05 558.83 440.23 502.38 334.13 Feb 3,572.37 2,399.15 1,656.84 1,018.27 727.84 583.92 442.01 326.55 465.14 273.78 Mar 3,393.97 3,585.38 1,316.69 862.82 968.71 606.28 449.52 266.06 429.74 266.08 Apr 4,270.41 4, 750.37 1,475.30 1,026.50 1,012.99 732.52 546.35 311.83 453.98 330.73 May 4,895.09 5,034.23 1,625.65 1,219.57 920.33 658.19 505.80 363.90 428.69 330.29 Jun 5,129.75 4,283.08 1,667.92 1,159.83 918.86 745.63 489.88 436.36 398.65 326.79 Jui 5, 736.27 4,981.84 1,887.45 1,307.24 1,007.26 797.78 533.46 536.87 485.48 333.20 Aug 5,556.56 4, 798.76 1,732.78 1,229.04 1,092.61 799.19 371.88 478.06 419.91 307.00 Sep 6,363.91 4,845.32 1,375.22 1,141.43 1,023.80 738.69 477.46 436.49 417.20 278.73
o In connection with the unification of Federal Republic of Germany (FRG) and German Democratic Republic (GDR) as from October 1990, the trade figures for FRG prior to October 1990 have been revised by adding the trade figures for the previous GDR. This is to ensure comparability of these trade figures with those after the German unification.
Hong Kong Monthly Digest of St11tistics October 1991 21
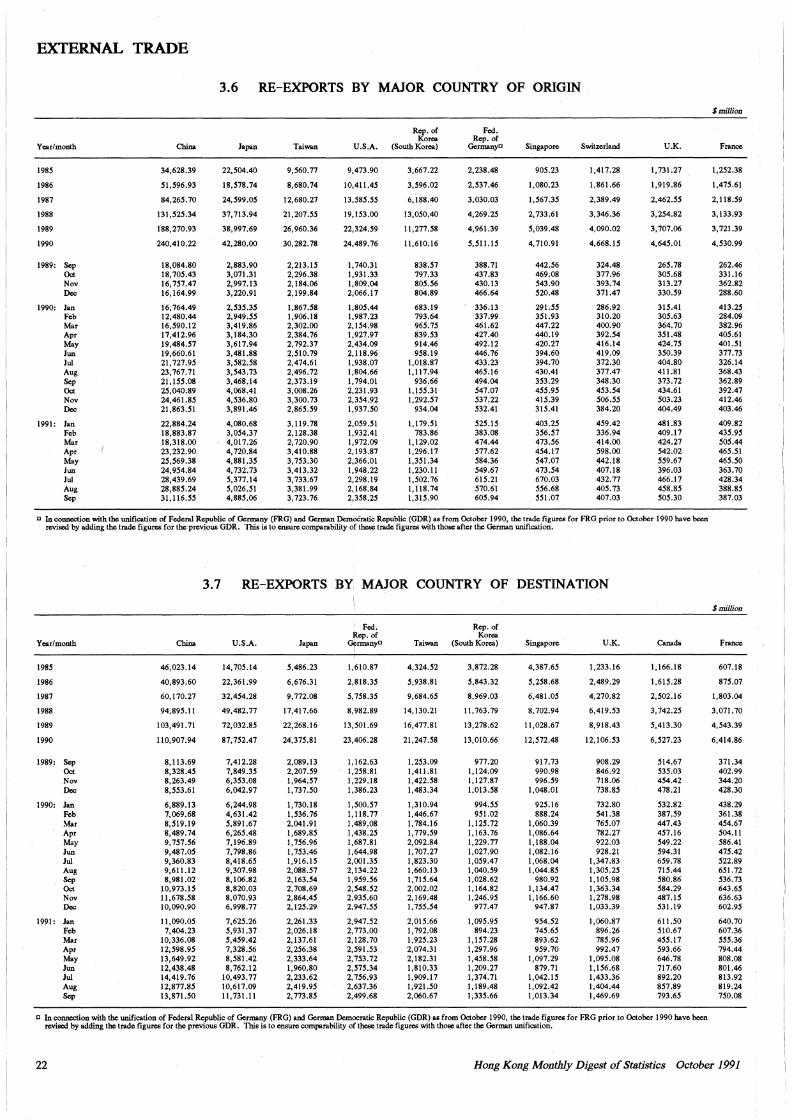
EXTERNAL TRADE
3.6 RE-EXPORTS BY MAJOR COUNTRY OF ORIGIN
$million
Rep. of Fed. Korea Rep. of
Year/month China Japan Taiwan U.S.A. (South Korea) Germanya Singapore Switzerland U.K. France
1985 34,628.39 22,504.40 9,560.77 9,473.90 3,667.22 2,238.48 905.23 1,417.28 I, 731.27 l,252.38
1986 51,S96.93 18,578.74 8,680.74 10,411.45 3,596.02 2,537.46 l,080.23 1,861.66 l,919.86 1,475.61
1987 84,265.70 24,599.05 12,680.27 13,585.55 6,188.40 3,030.03 1,567.35 2,389.49 2,462.55 2, 118.59
1988 131,525.34 37,713.94 21,207.55 19, 153.00 13,050.40 4,269.25 2, 733.61 3,346.36 3,254.82 3,133.93
1989 188,270.93 38,997.69 26,960.36 22,324.59 ll,277.58 4, 961.39 5,039.48 4,090.02 3,707.06 3, 721.39
1990 240,410.22 42,280.00 30,282.78 24,489.76 il,610.16 5,511.15 4,710.91 4,668.15 4,645.01 4,530.99
1989: Sep 18,084.80 2,883.90 2,213.15 l,740.31 838.57 388.71 442.56 324.48 265.78 262.46 Oct 18, 705.43 3,071.31 2,296.38 l,931.33 797.33 437.83 469.08 377.96 305.68 331.16 Nov 16, 757.47 2,997.13 2, 184.06 l,809.04 805.56 430.13 543.90 393.74 313.27 362.82 Dec 16, 164.99 3,220.91 2, 199.84 2,066.17 804.89 466.64 520.48 371.47 330.59 288.60
1990: Jan 16, 764.49 2,535.35 1,867.58 1,805.44 683.19 336.13 291.55 286.92 315.41 413.25 Feb 12,480.44 2,949.55 l,906.18 1,987.23 793.64 337.99 351.93 310.20 305.63 284.09 Mar 16,590.12 3,419.86 2,302.00 2,154.98 965. 15 461.62 447.22 400.90 364.70 382.96 Apr 17,412.96 3,184.30 2,384.76 1,927.97 839.53 427.40 440.19 392.54 351.48 405.61 May 19,484.57 3,617.94 2, 792.37 2,434.09 914.46 492.12 420.27 416.14 424.15 401.51 Jun 19,660.61 3,481.88 2,510.79 2, 118.96 958.19 446.76 394.60 419.09 350.39 377.73 Jui 21,727.95 3,582.58 2,474.61 l,938.07 l,018.87 433.23 394.70 372.30 404.80 326.14 Aug 23,767.71 3,543.73 2,496.72 1,804.66 1,117.94 465.16 430.41 377.47 41 l.81 368.43 Sep 21,155.08 3,468.14 2,373.19 l,794.01 936.66 494.04 353.29 348.30 373.72 362.89 Oct 25,040.89 4,068.41 3,008.26 2,231.93 l,155.31 547.07 455.95 453.54 434.61 392.47 Nov 24,461.85 4,536.80 3,300.73 2,354.92 1,292.57 537.22 415.39 506.55 503.23 412.46 Dec 21,863.51 3,891.46 2,865.59 1,937.50 934.04 532.41 315.41 384.20 404.49 403.46
1991: Jan 22,884.24 4,080.68 3,119.78 2,059.51 l,179.51 525.15 403.25 459.42 481.83 409.82 Feb 18,883.87 3,054.37 2,128.38 l,932.41 783.86 383.08 356.57 336.94 409.17 435.95 Mar 18,318.00 4,017.26 2,720.90 l,972.09 l,129.02 474.44 473.56 414.00 424.27 505.44 Apr 23,232.90 4,720.84 3,410.88 2,193.87 l,296.17 577.62 454.17 598.00 542.02 465.51 May 25,569.38 4,881.35 3, 753.30 2.~66.0l l,351.34 584.36 547.07 442.18 559.67 465.50 Jun 24,954.84 4,732.73 3,413.32 l,948.22 l,230.11 549.61 473.54 407.18 396.03 363.70 Jui 28,439.69 5,377.14 3, 733.67 2,298.19 1,502.16 615.21 670.03 432.77 466.17 428.34 Aug 28,885.24 5,026.51 3,381.99 2, 168.84 l,118.74 570.61 556.68 405.73 458.85 388.85 Sep 31,116.55 4,885.06 3, 723.76 2,358.25 l,315.90 605.94 551.01 407.03 505.30 387.03
D In connection with the unification of Federal Republic of Germany (FRG) and German DemoC-ratic Republic (GDR) as from October 1990, the trade figures for FRG prior to October 1990 have been revised by adding the trade figures for the previous GDR. This is to ensure comparability of these trade figures with those after the German unification.
3.7 RE-EXPORTS BY MAJOR COUNTRY OF DESTINATION
$million
Fed. Rep. of Rep. of Korea
Year/month China U.S.A. Japan <Jfrmanya Taiwan (South Korea) Singapore U.K. Canada France
1985 46,023.14 14, 705.14 5,486.23 1,610.87 4,324.52 3,872.28 4,387.65 1,233.16 1,166.18 607.18
1986 40,893.60 22,361.99 6,676.31 2,818.35 5,938.81 5,843.32 5,258.68 2,489.29 1,615.28 875.07
1987 60, 170.27 32,454.28 9,772.08 5,758.35 9,684.65 8,969.03 6,481.05 4,270.82 2,502.16 l,803.04
1988 94,895.l l 49,482.77 17,417.66 8, 982.89 14,130.21 ll.763.79 8,702.94 6,419.53 3, 742.25 3,071.70
1989 103,491.71 72,032.85 22,268.16 13,501.69 16,477.81 13,278.62 l l,028.67 8,918.43 5,413.30 4,543.39
1990 l 10,907.94 87,752.47 24,375.81 23,406.28 21,247.58 13,010.66 12,572.48 12, 106.53 6,527.23 6,414.86
1989: Sep 8,113.69 7,412.28 2,089.13 l,162.63 l,253.09 977.20 917.73 908.29 514.67 371.34 Oct 8,328.45 7,849.35 2,207.59 l,258.81 l,41 l.81 1,124.09 990.98 846.92 535.03 402.99 Nov 8,263.49 6,353.08 1,964.57 l,229.18 l,422.58 1,127.87 996.59 718.06 454.42 344.20 Dec 8,553.61 6,042.97 l, 737.50 1,386.23 1,483.34 1,013.58 l,048.01 738.85 478.21 428.30
1990: Jan 6,889.13 6,244.98 l,730.18 l,500.57 1,310.94 994.55 925.16 732.80 532.82 438.29 Feb 7,069.68 4,631.42 l,536.76 l,118.77 l,446.67 951.02 888.24 541.38 387.59 361.38 Mar 8,519.19 5,891.67 2,041.91 1,489.08 1,784.16 l,125.72 1,060.39 765.07 447.43 454.67 Apr 8,489.74 6,265.48 1,689.85 1,438.25 l,779.59 l,163.76 l,086.64 782.27 457.16 504.ll May 9,151.56 7,196.89 1,756.96 l,687 .81 2,092.84 1,229.77 1,188.04 922.03 549.22 586.41 Jun 9,487.05 7,798.86 l,753.46 1,644.98 l,707.27 l,027.90 l,082.16 928.21 594.31 475.42 Jui 9,360.83 8,418.65 l,916.15 2,001.35 1,823.30 l,059.47 1,068.04 1,347.83 659.78 522.89 Aug 9,611.12 9,307.98 2,088.57 2,134.22 1,660.13 1,040.59 1,044.85 1,305.25 715.44 651.72 Sep 8,981.02 8, 106.82 2,163.54 1,959.56 1,715.64 1,028.62 980.92 1,105.98 580.86 536.73 Oct 10,973.15 8,820.03 2,708.69 2,548.52 2,002.02 1,164.82 1,134.47 1,363.34 584.29 643.65 Nov 11,678.58 8,070.93 2,864.45 2,935.60 2,169.48 l,246.95 1,166.60 l,278.98 487.15 636.63 Dec 10,090.90 6,998.77 2,125.29 2,947.55 l, 755.54 977.47 947.87 1,033.39 531.19 602.95
1991: Jan 11,090.05 7,625.26 2,261.33 2,947.52 2,015.66 l,095.95 954.52 1,060.87 611.50 640.70 Feb 7,404.23 5, 931.37 2,026.18 2,773.00 1,792.08 894.23 745.65 896.26 510.67 607.36 Mar 10,336.08 5,459.42 2,137.61 2, 128.70 l,925.23 1,157.28 893.62 785.96 455.17 555.36 Apr 12,598.95 7,328.56 2,256.38 2,591.53 2,074.31 1,297.96 959.70 992.47 593.66 794.44 May 13,649.92 8,581.42 2,333.64 2, 753.72 2,182.31 l,458.58 l,097.29 l,095.08 646.78 808.08 Jun 12,438.48 8,762.12 l,960.80 2,575.34 1,810.33 l,209.27 879.71 1,156.68 717.60 801.46 Jui 14,419.76 10,493.77 2,233.62 2, 756.93 1,909.17 l,374.71 l,042.15 l,433.36 892.20 813.92 Aug 12,877.85 10,617.09 2,419.95 2,637.36 l,921.50 1,189.48 1,092.42 l,404.44 857.89 819.24 Sep 13,871.50 l l, 731.11 2, 773.85 2,499.68 2,060.67 1,335.66 l,013.34 l,469.69 793.65 750.08
a In connection with the unification of Federal Republic of Germany (FRG) and German Democratic Republic (GDR) as from October l 990, the trade figures for FRG prior to October 1990 have been revised by adding the trade figures for the previous GDR. This is to ensure comparability of these trade figures with those after the German unification.
22 Hong Kong Monthly Digest of Statistics October 1991
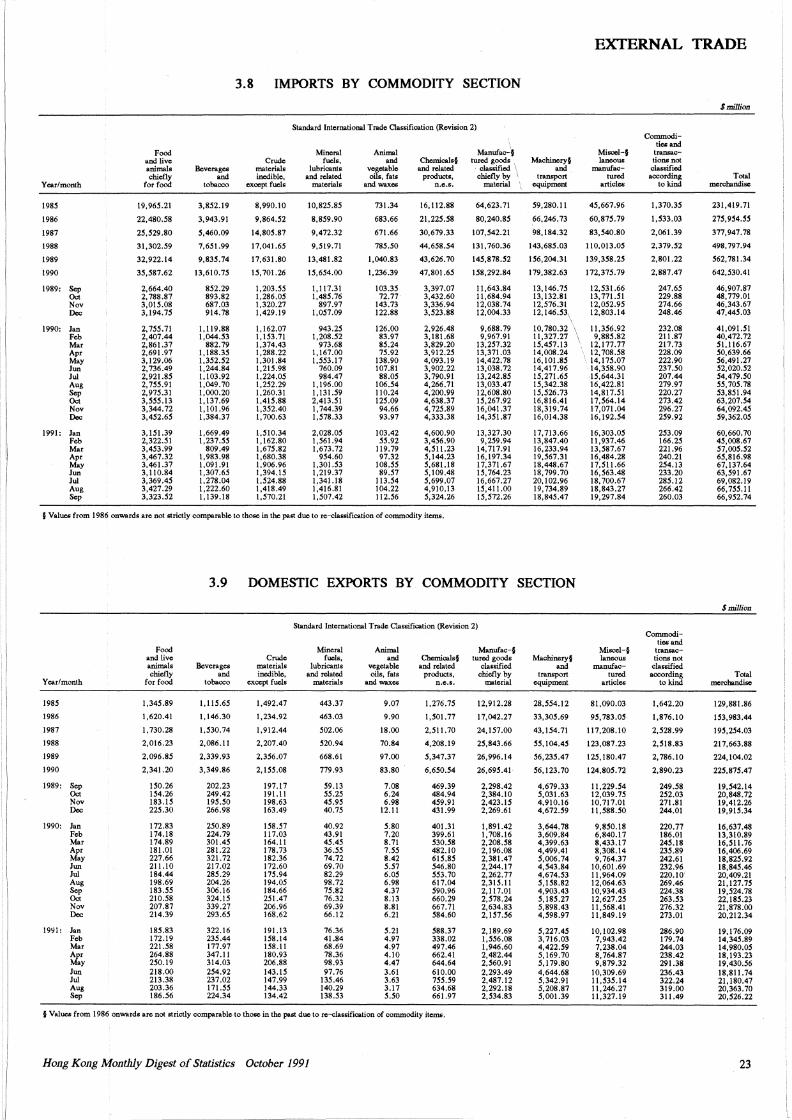
EXTERNAL TRADE
3.8 IMPORTS BY COMMODITY SECTION
$millfon
Standard International Trade Classification (Revision 2) Commodi-
ties and Food Mineral Animal Manufac-§ Miscel-§ transac-
and live Crude fuels, and Chemicals§ turcd goods Machinery§ laneous tions not animals Beverages materials lubricants vegetable and related classified \_ and manufac- classified chiefly and inedible, and related oils, fats products, chiefly by transport lured according Total
Year/month for food tobacco except fuels materials and wa.xcs n.c.s. material equipment articles to kind merchandise
1985 19,965.21 3,852.19 8,990.10 10,825.85 731.34 16,112.88 64,623.71 59,280.11 45,667.96 I.370.35 231,419.71
1986 22,480.58 3,943.91 9,864.52 8,859.90 683.66 21,225.58 80,240.85 66,246.73 60,875.79 1.533.03 275,954.55
1987 25,529.80 5,460.09 14,805.87 9,472.32 671.66 30,679.33 107,542.21 98, 184.32 83,540.80 2,061.39 377,947.78
1988 31,302.59 7,651.99 17,041.65 9,519.71 785.50 44,658.54 131,760.36 143,685.03 110,013.05 2,379.52 498,797.94
1989 32,922.14 9,835.74 17,631.80 13,481.82 1,040.83 43,626.70 145,878.52 156,204.31 139,358.25 2,801.22 562, 781.34
1990 35,587.62 13,610.75 15, 701.26 15,654.00 1,236.39 47,801.65 158,292.84 179,382.63 172,375.79 2,887.47 642,530.41
1989: Sep 2,664.40 852.29 1,203.55 1,117.31 103.35 3,397.07 11,643.84 13,146.75 12,531.66 247.65 46,907.87 Oct 2, 788.87 893.82 1,286.05 1,485.76 72.77 3,432.60 11,684.94 13,132.81 13,771.51 229.88 48, 779.01 Nov 3,015.08 687.03 1,320.27 897.97 143.73 3,336.94 12,038.74 12,576.31 12,052.95 274.66 46,343.67 Dec 3,194.75 914.78 1,429.19 1,057.09 122.88 3,523.88 12,004.33 12,146.53, 12,803.14 248.46 47,445.03
I 1990: Jan 2,755.71 1,119.88 1,162.07 943.25 126.00 2,926.48 9,688.79 10, 780.32 I 11,356.92 232.08 41,091.51
Feb 2,407.44 1,044.53 1,153.71 1,208.52 83.97 3,181.68 9,967.91 11,327.27 I 9,885.82 211.87 40,472.72 Mar 2,861.37 882.79 1,374.43 973.68 85.24 3,829.20 13,257.32 15,457.13 12,177.77 217.73 51,116.67 Apr 2,691.97 1.188.35 1,288.22 1,167.00 75.92 3,912.25 13,371.03 14,008.24 12, 708.58 228.09 50,639.66 May 3,129.06 I.352.52 1,301.84 1,553.17 138.90 4,093.19 14,422.78 16, 101.85 14, 175.07 222.90 56,491.27 Jun 2, 736.49 1,244.84 1,215.98 760.09 107.81 3,902.22 13,038.72 14,417.96 14,358.90 237.50 52,020.52 Jui 2, 921.85 1,103.92 1,224.05 984.47 88.05 3, 790.91 13,242.85 15,271.65 15,644.31 207.44 54,479.50 Aug 2, 755.91 1,049.70 1,252.29 1,196.00 106.54 4,266.71 13,033.47 15,342.38 16,422.81 279.97 55,705.78 Sep 2,975.31 1,000.20 1,260.31 1,131.59 110.24 4,200.99 12,608.80 15,526.73 14,817.51 220.27 53,851.94 Oct 3,555.13 1.137.69 1,415.88 2,413.51 125.09 4,638.37 15,267.92 16,816.41 17,564.14 273.42 63,207.54 Nov 3,344.72 1,101.96 1,352.40 l, 744.39 94.66 4, 725.89 16,041.37 18,319.74 17,071.04 296.27 64,092.45 Dec 3,452.65 1,384.37 1,700.63 1,578.33 93.97 4,333.38 14,351.87 16,014.38 16,192.54 259.92 59,362.05
1991: Jan 3, 151.39 l,669.49 1,510.34 2,028.05 103.42 4,600.90 13,327.30 17,713.66 16,303.05 253.09 60,660.70 Feb 2,322.51 1,237.55 1,162.80 1,561.94 55.92 3,456.90 9,259.94 13,847.40 11,937.46 166.25 45,008.67 Mar 3,453.99 809.49 1,675.82 1,673.72 119.79 4,511.23 14,717.91 16,233.94 13,587.67 221.96 57,005.52 Apr 3,467.32 1,983.98 1.680.38 954.60 97.32 5,144.23 16,197.34 19,567.31 16,484.28 240.21 65,816.98 May 3,461.37 1,091.91 1,906.96 1,301.53 108.55 5,681.18 17,371.67 18,448.67 17,511.66 254.13 67,137.64 Jun 3,110.84 1,307.65 1,394.15 1.219.37 89.57 5, 109.48 15,764.23 18,799.70 16,563.48 233.20 63,591.67 Jui 3,369.45 I.278.04 1.524.88 1,341.18 113.54 5,699.07 16,667.27 20,102.96 18,700.67 285.12 69,082.19 Aug 3,427.29 1,222.60 1,418.49 1,416.81 104.22 4,910.13 15,411.00 19, 734.89 18,843.27 266.42 66,755.11 Sep 3,323.52 l, 139.18 1,570.21 l,507.42 112.56 5,324.26 15,572.26 18,845.47 19,297.84 260.03 66,952.74
§ ValUC& from 1986 onwards are not strictly comparable to those in the past due to re-classification of commodity items.
3.9 DOMESTIC EXPORTS BY COMMODITY SECTION
$million
Standard International Trade Classification (Revision 2) Commodi-
tics and Food Mineral Animal Manufac-§ Misccl-§ transac-
and live Crude fuels, and Chemicals§ turcd goods Machinery§ laneous lions not animals Beverages materials lubricants vegetable and related classified and manufac- classified chiefly and inedible, and related oils, fats products, chiefly by transport turcd according Total
Year/month for food tobacco except fuels materials and waxes n.e.s. material equipment articles to kind merchandise
1985 1,345.89 1.115.65 1,492.47 443.37 9.07 1,276.75 12,912.28 28,554.12 81,090.03 1,642.20 129,881.86
1986 1,620.41 1,146.30 1,234.92 463.03 9.90 1,501. 77 17,042.27 33,305.69 95,783.05 1,876.10 153,983.44
1987 1, 730.28 1,530. 74 1,912.44 502.06 18.00 2,511.70 24.157.00 43,154.71 117,208.10 2,528.99 195,254.03
1988 2,016.23 2,086.11 2,207.40 520.94 70.84 4,208.19 25,843.66 55, 104.45 123,087.23 2,518.83 217,663.88
1989 2,096.85 2,339.93 2,356.07 668.61 97.00 5,347.37 26,996.14 56,235.47 125, 180.47 2, 786.10 224,104.02
1990 2,341.20 3,349.86 2, 155.08 779.93 83.80 6,650.54 26,695.41 56,123.70 124,805.72 2,890.23 225,875.47
1989: Sep 150.26 202.23 197.17 59.13 7.08 469.39 2,298.42 4,679.33 11,229.54 249.58 19,542.14 Oct 154.26 249.42 191.11 55.25 6.24 484.94 2,384.10 5,031.63 12,039.75 252.03 20,848.72 Nov 183.15 195.50 198.63 45.95 6.98 459.91 2,423.15 4,910.16 10,717.01 271.81 19,412.26 Dec 225.30 266.98 163.49 40.75 12.11 431.99 2,269.61 4,672.59 11,588.50 244.01 19,915.34
1990: Jan 172.83 250.89 158.57 40.92 5.80 401.31 1,891.42 3,644.78 9,850.18 220.77 16,637.48 Feb 174.18 224.79 117.03 43.91 7.20 399.61 1,708.16 3,609.84 6,840.17 186.01 13,310.89 Mar 174.89 301.45 164.11 45.45 8.71 530.58 2,208.58 4,399.63 8,433.17 245.18 16,511.76 Apr 181.01 281.22 178.73 36.55 7.55 482.10 2,196.08 4,499.41 8,308.14 235.89 16,406.69 May 227.66 321. 72 182.36 74.72 8.42 615.85 2,381.47 5,006.74 9,764.37 242.61 18,825.92 Jun 211.10 217.02 172.60 69.70 5.57 546.80 2,244.17 4,543.84 10,601.69 232.96 18,845.46 Jui 184.44 285.29 175.94 82.29 6.05 553.70 2,262.77 4,674.53 11,964.09 220.10' 20,409.21 Aug 198.69 204.26 194.05 98.72 6.98 617.04 2,315.11 5,158.82 12,064.63 269.46 21,127.75 Sep 183.55 306.16 184.66 75.82 4.37 590.96 2,117.01 4,903.43 10,934.43 224.38 19,524.78 Oct 210.58 324.15 251.47 76.32 8.13 660.29 2,578.24 5, 185.27 12,627.25 263.53 22, 185.23 Nov 207.87 339.27 206.96 69.39 8.81 667.71 2,634.83 5,898.43 11,568.41 276.32 21,878.00 Dec 214.39 293.65 168.62 66.12 6.21 584.60 2,157.56 4,598.97 11,849.19 273.01 20,212.34
1991: Jan 185.83 322.16 191.13 76.36 5.21 588.37 2, 189.69 5,227.45 10,102.98 286.90 19,176.09 Feb 172.19 235.44 158.14 41.84 4.97 338.02 1,556.08 3, 716.03 7,943.42 179.74 14,345.89 Mar 221.58 177.97 158.11 68.69 4.97 497.46 1,946.60 4,422.59 7,238.04 244.03 14,980.05 Apr 264.88 347.11 180.93 78.36 4.10 662.41 2,482.44 5, 169.70 8, 764.87 238.42 18,193.23 May 250.19 314.03 206.88 98.93 4.47 644.64 2,560.91 5, 179.80 9,879.32 291.38 19,430.56 Jun 218.00 254.92 143.15 97.76 3.61 610.00 2,293.49 4,644.68 10,309.69 236.43 18,811.74 Jui 213.38 237.02 147.99 135.46 3.63 755.59 2,487.12 5,342.91 11,535.14 322.24 21,180.47 Aug 203.36 171.55 144.33 140.29 3.17 634.68 2,292.18 5,208.87 11,246.27 319.00 20,363.70 Sep 186.56 224.34 134.42 138.53 5.50 661.97 2,534.83 5,001.39 11,327.19 311.49 20,526.22
§ Value& from 1986 onwards are not strictly comparable to those in the past due to re-classification of commodity items.
Hong Kong Monthly Digest of Statistics October 1991 23
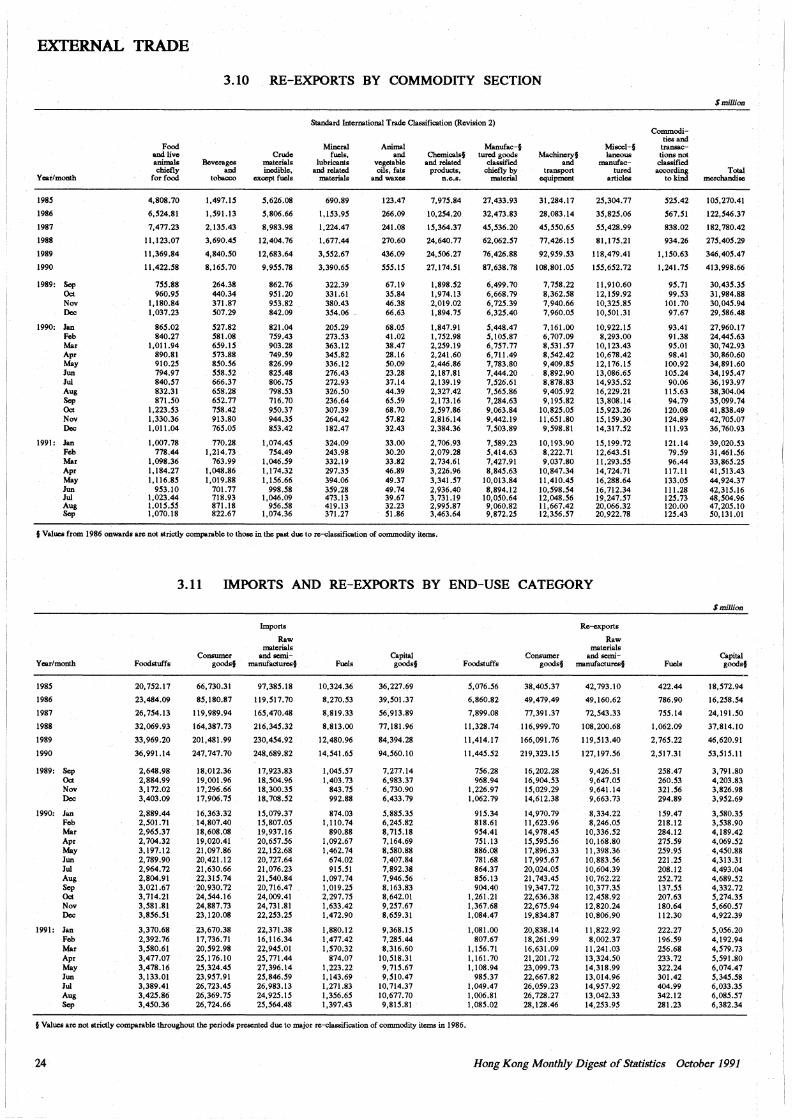
EXTERNAL TRADE
3.10 RE-EXPORTS BY COMMODITY SECTION
$millian
Standard International Trade Classification (Revision 2) Commodi-
ties and Food Mineral Animal Manufac-§ Misccl-§ transac-
and live Crude fuels, and Chemicals§ tured goods Machinery§ lanecus tions not animals Beverages materials lubricants vegetable and related classified and manufac- classified chiefly and inedible, and related oils, fats products. chiefly by transport tured according Total
Year/month for food tobacco except fuels materials and waxes n.e.s. material equipment articles to kind merchandise
l98S 4,808.70 1,497.!S S,626.08 690.89 123.47 7,975.84 27,433.93 31,284.17 25,304.77 525.42 !OS,270.41
1986 6,524.81 1,591.13 5,806.66 1,153.95 266.09 10,254.20 32,473.83 28,083.14 35,825.06 561.Sl 122,546.37
1987 7,477.23 2,135.43 8,983.98 1.224.47 241.08 lS,364.37 45,536.20 45,550.65 55,428.99 838.02 182,780.42
1988 ll, 123.07 3,690.45 12,404.76 1,677.44 270.60 24,640.77 62,062.51 77,426.!S 81,175.21 934.26 275,405.29
1989 11,369.84 4,840.50 12,683.64 3,552.61 436.09 24,506.27 76,426.88 92,959.53 118,479.41 1,150.63 346,405.47
1990 11,422.58 8,165.70 9,955.18 3,390.65 SSS.IS 27,174.51 87,638.78 108,801.0S 155,652.12 1,241.75 413,998.66
1989: Sep 155.88 264.38 862.76 322.39 67.19 l,898.52 6,499.70 7, 758.22 11,910.60 95.71 30,435.35 Oct 960.95 440.34 951.20 331.61 35.84 1,974.13 6,668.79 8,362.58 12,159.92 99.53 31,984.88 Nov 1,180.84 371.87 953.82 380.43 46.38 2,019.02 6,725.39 7,940.66 10,325.85 101.70 30,045.94 Dec l,037.23 507.29 842.09 354.06 . 66.63 1,894.75 6,325.40 7,960.0S 10,501.31 97.67 29,586.48
1990: Jan 865.02 527.82 821.04 205.29 68.05 1,847.91 5,448.47 7, 161.00 10,922.15 93.41 27,960.17 Feb 840.27 581.08 759.43 273.53 41.02 l, 752.98 S, 105.87 6,707.09 8,293.00 91.38 24,445.63 Mar 1,011.94 659.15 903.28 363.12 38.47 2,259.19 6, 757.77 8,531.57 10,123.43 95.01 30,742.93 Apr 890.81 573.88 149.59 345.82 28.16 2,241.60 6, 711.49 8,542.42 10,678.42 98.41 30,860.60 May 910.25 850.56 826.99 336.12 50.09 2,446.86 7, 783.80 9,409.85 12,176.15 100.92 34,891.60 Jun 794.97 558.52 825.48 276.43 23.28 2,187.81 7,444.20 8,892.90 13,086.65 105.24 34,195.47 Jui 840.57 666.37 806.75 272.93 37.14 2,139.19 7,526.61 8,878.83 14,935.52 90.06 36,193.97 Aug 832.31 658.28 798.53 326.50 44.39 2,327.42 1,565.86 9,405.92 16,229.21 115.63 38,304.04 Sep 871.50 652.77 716.70 236.64 65.59 2,173.16 7,284.63 9, 195.82 13,808.14 94.79 35,099.74 Oct l,223.53 758.42 950.37 307.39 68.70 2,597.86 9,063.84 10,825.0S lS,923.26 120.08 41,838.49 Nov 1,330.36 913.80 944.35 264.42 57.82 2,816.14 9,442.19 11,651.80 lS, 159.30 124.89 42,705.07 Dec 1,011.04 165.0S 853.42 182.47 32.43 2,384.36 7,503.89 9,598.81 14,317.52 111.93 36,760.93
1991: Jan 1,007.78 770.28 1,074.45 324.09 33.00 2,706.93 7,589.23 10,193.90 15,199.72 121.14 39,020.53 Feb 778.44 1,214.73 154.49 243.98 30.20 2,079.28 S,414.63 8,222.71 12,643.51 19.59 31,461.56 Mar 1,098.36 763.99 1,046.59 332.19 33.82 2,734.61 7,427.91 9,037.80 11,293.SS 96.44 33,865.25 Apr 1,184.27 l,048.86 1.174.32 297.35 46.89 3,226.96 8,845.63 10,847.34 14,724.71 117.11 41,513.43 May l,116.85 1,019.88 1,156.66 394.06 49.37 3,341.57 10,013.84 11,410.45 16,288.64 133.05 44,924.37 Jun 953.10 701.77 998.58 359.28 49.74 2,936.40 8,894.12 10,598.54 16, 712.34 111.28 42,315.16 Jui 1,023.44 718.93 1,046.09 473.13 39.67 3,731.19 10,050.64 12,048.56 19,247.57 125.73 48,504.96 Aug l,015.55 871.18 956.58 419.13 32.23 2,995.87 9,060.82 11,667.42 20,066.32 120.00 47,205.10 Sep 1,070.18 822.67 1,074.36 371.27 51.86 3,463.64 9,872.25 12,356.57 20,922.78 125.43 50,131.01
f Values from 1986 onwards are not strictly comparable to those in the past due to re-classification of commodity items.
3.11 IMPORTS AND RE-EXPORTS BY END-USE CATEGORY
$ millioo
Import• Re-exports
Raw Raw materials materials
Consumer and semi- Capital Consumer and semi- Capital Year/month Foodstuff& goods§ manufactures§ Fuels goods§ Foodstuffs goods§ manufactures§ Fuels goods§
1985 20,752.17 66,730.31 97,385.18 10,324.36 36,227.69 S,016.56 38,405.37 42, 793.10 422.44 18,572.94
1986 23,484.09 85,180.87 119,517.70 8,270.53 39,501.37 6,860.82 49,479.49 49, 160.62 786.90 16,258.54
1987 26, 754.13 119,989.94 165,470.48 8,819.33 56,913.89 7,899.08 77,391.37 72,543.33 155.14 24,191.50
1988 32,069.93 164,387.73 216,345.32 8,813.00 77, 181.96 11,328.74 116,999.70 108,200.68 1,062.09 37,814.10
1989 33,969.20 201,481.99 230,454.92 12,480.96 84,394.28 ll,414.17 166,091.76 119,513.40 2, 765.22 46,620.91
1990 36,991.14 247, 747.70 248,689.82 14,541.65 94,560.10 11,445.52 219,323.15 127,197.56 2,517.31 53,515.11
1989: Sep 2,648.98 18,012.36 17,923.83 l,045.57 7,277.14 756.28 16,202.28 9,426.51 258.47 3, 791.80 Oct 2,884.99 19,001.96 18,504.96 1,403.73 6,983.37 968.94 16,904.53 9,647.05 260.53 4,203.83 Nov 3,172.02 17,296.66 18,300.35 843.75 6,730.90 1,226.97 15,029.29 9,641.14 321.56 3,826.98 Dec 3,403.09 17,906.75 18, 708.52 992.88 6,433.79 1,062.79 14,612.38 9,663.73 294.89 3,952.69
1990: Jan 2,889.44 16,363.32 15,079.37 874.03 5,885.35 915.34 14,970.79 8,334.22 159.47 3,580.35 Feb 2,SOl.71 14,807.40 lS,807.05 1,110.74 6,245.82 818.61 11,623.96 8,246.05 218.12 3,538.90 Mar 2,965.37 18,608.08 19,937.16 890.88 8,715.18 954.41 14,978.45 10,336.52 284.12 4,189.42 Apr 2,704.32 19,020.41 20,657.56 i,092.67 7,164.69 751.13 15,595.56 10,168.80 215.59 4,069.52 May 3,197.12 21,097.86 22,152.68 1,462.74 8,580.88 886.08 17,896.33 11,398.36 259.95 4,450.88 Jun 2,789.90 20,421.12 20,727.64 674.02 7,407.84 781.68 17, 995.67 10,883.56 221.25 4,313.31 Jui 2,964.72 21,630.66 21,076.23 915.51 7,892.38 864.37 20,024.05 10,604.39 208.12 4,493.04 Aug 2,804.91 22,315.74 21,540.84 1,097.74 7,946.56 856.13 21,743.45 10,762.22 252.72 4,689.52 Sep 3,021.67 20,930.72 20,716.47 1,019.25 8,163.83 904.40 19,347.72 10,377.35 137.55 4,332.72 Oct 3,714.21 24,544.16 24,009.41 2,297.75 8,642.01 1,261.21 22,636.38 12,458.92 207.63 5,214.35 Nov 3,581.81 24,887.73 24, 731.81 1,633.42 9,257.67 1,367 .68 22,675.94 12,820.24 180.64 5,660.51 Dec 3,856.51 23,120.08 22,253.25 1,472.90 8,659.31 l,084.47 19,834.87 10,806.90 112.30 4,922.39
1991: Jan 3,370.68 23,670.38 22,371.38 1,880.12 9,368.15 1,081.00 20,838.14 11,822.92 222.27 5,056.20 Feb 2,392.76 17,736.71 16,116.34 1,477.42 7,285.44 807.67 18,261.99 8,002.37 196.59 4,192.94 Mar 3,580.61 20,592.98 22,945.01 1,570.32 8,316.60 1.156.71 16,631.09 11,241.03 256.68 4,579.73 Apr 3,477.07 25,176.10 25,771.44 874.07 10,518.31 1,161.70 21,201.72 13,324.50 233.72 5,591.80 May 3,478.16 25,324.45 27,396.14 1,223.22 9, 715.67 1,108.94 23,099.73 14,318.99 322.24 6,074.47 Jun 3,133.01 23,957.91 25,846.59 1,143.69 9,SI0.47 985.37 22,667.82 13,014.96 301.42 5,345.58 Jui 3,389.41 26,723.45 26,983.13 1,271.83 10,714.37 1,049.47 26,059.23 14,957.92 404.99 6,033.35 Aug 3,425.86 26,369.75 24,925.15 l ,356.65 10,677.70 1,006.81 26,728.27 13,042.33 342.12 6,085.51 Sep 3,450.36 26, 724.66 25,564.48 1,397.43 9,815.81 1,085.02 28, 128.46 14,253.95 281.23 6,382.34
f Values are not strictly comparable throughout the periods presented due to major re-classification of commodity items in 1986.
24 Hong Kong Monthly Digest of St11tistics October 1991
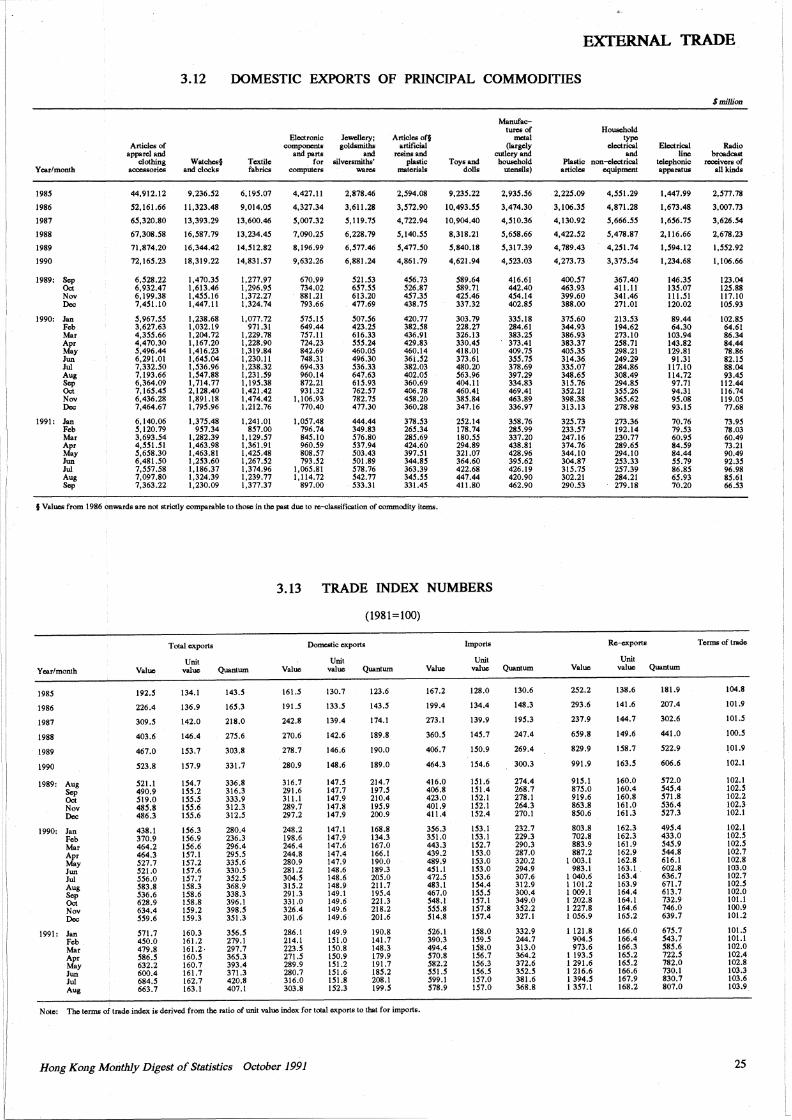
EXTERNAL TRADE
3.12 DOMESTIC EXPORTS OF PRINCIPAL COMMODITIES
Year/month
1985
1986
1987
1988
1989
1990
1989: Sep Oct Nov Dec
1990: Jan Feb Mar Apr May Jun Jui Aug Sep Oct Nov Dec
1991: Jan Feb Mar Apr May Jun Jui Aug Sep
Articles of apparel and
clothing accessories
44,912.12
52,161.66
65,320.80
67,308.58
71,874.20
72, 165.23
6,528.22 6,932.47 6, 199.38 7,451.10
5,967.55 3,627.63 4,355.66 4,470.30 5,496.44 6,291.01 7,332.50 7,193.66 6,364.09 7, 165.45 6,436.28 7,464.67
6, 140.06 5,120.79 3,693.54 4,551.51 5,658.30 6,481.50 7,557.58 7,097.80 7,363.22
Watches§ and clccks
9,236.52
11,323.48
13,393.29
16,587.79
16,344.42
18,319.22
1,470.35 1,613.46 1,455.16 1,447.11
1,238.68 1,032.19 1,204.72 1.167.20 1,416.23 1,645.04 1,536.96 1.547.88 1,714.77 2,128.40 1,891.18 1,795.96
1,375.48 957.34
1,282.39 1,463.98 1,463.81 1,253.60 1.186.37 1,324.39 1,230.09
Textile fabrics
6, 195.07
9,014.05
13,600.46
13,234.45
14,512.82
14,831.57
1.277.97 1,296.95 1,372.27 1,324.74
1,077.72 971.31
1,229.78 1,228.90 l,319.84 1.230.11 1,238.32 1.231.59 1,195.38 1,421.42 1,474.42 1,212.76
1,241.01 857.00
I, 129.57 1,361.91 1.425.48 l,267.52 1.374.96 1,239.77 1,377.37
Electronic components
and parts for
computers
4,427.11
4,327.34
5,007.32
7,090.25
8, 196.99
9,632.26
670.99 734.02 881.21 793.66
575.15 649.44 757.11 724.23 842.69 748.31 694.33 960.14 872.21 931.32
1.106.93 770.40
1,057.48 796.74 845.10 960.59 808.57 793.52
1,065.81 1,114.72
897.00
Jewellery: goldsmiths
and silversmiths'
ware<
2,878.46
3,611.28
5,119.75
6,228.79
6,577.46
6,881.24
521.53 657.55 613.20 477.69
501.56 423.25 616.33 555.24 460.05 496.30 536.33 647.63 615.93 762.57 782.75 477.30
444.44 349.83 576.80 537.94 503.43 501.89 578.76 542.77 533.31
Articles of§ artificial
resins and plastic
materials
2,594.08
3,572.90
4, 722.94
5,140.55
5,477.50
4,861. 79
456.73 526.87 457.35 438.75
420.77 382.58 436.91 429.83 460.14 361.52 382.03 402.05 360.69 406.78 458.20 360.28
378.53 265.34 285.69 424.60 397.51 344.85 363.39 345.55 331.45
Toys and dolls
9,235.22
10,493.55
10,904.40
8,318.21
5,840.18
4,621.94
589.64 589.71 425.46 337.32
303.79 228.27 326.13 330.45 418.01 373.61 480.20 563.96 404.11 460.41 385.84 347.16
252.14 178.74 180.55 294.89 321.07 364.60 422.68 447.44 411.80
§ Values from 1986 onwards are not strictly comparable to those in the past due to re-classification of commodity itcms.
3.13 TRADE INDEX NUMBERS
(1981=100)
Total exports Domestic exports Imports
Unit
Manufactures of
metal (largely
cutlery and household
utensils)
2,935.56
3,474.30
4,510.36
5,658.66
5,317.39
4,523.03
416.61 442.40 454.14 402.85
335.18 284.61 383.25 373.41 409.75 355.75 378.69 397.29 334.83 469.41 463.89 336.97
358.76 285.99 337.20 438.81 428.96 395.62 426.19 420.90 462.90
Year/month Value Unit
value Quantum Value Unit
value Quantum Value value Quantum
1985
1986
1987
1988
1989
1990
1989: Aug Sep Oct Nov Dec
1990: Jan Feb Mar Apr May Jun Jui Aug Sep Oct Nov Dec
1991: Jan Feb Mar Apr May Jun Jui Aug
192.5
226.4
309.5
403.6
467.0
523.8
521.1 490.9 519.0 485.8 486.3
438.1 370.9 464.2 464.3 527.7 521.0 556.0 583.8 536.6 628.9 634.4 559.6
571.7 450.0 479.8 586.5 632.2 600.4 684.5 663.7
134.t
136.9
142.0
146.4
153.7
157.9
154.7 155.2 155.5 155.6 155.6
156.3 156.9 156.6 157.1 157.2 157.6 157.7 158.3 158.6 158.8 159.2 159.3
160.3 161.2 161.2. 160.5 160.7 161.7 162.7 163.1
143.5
165.3
218.0
275.6
303.8
331.7
336.8 316.3 333.9 312.3 312.5
280.4 236.3 296.4 295.5 335.6 330.5 352.5 368.9 338.3 396.1 398.5 351.3
356.5 279.I 297.7 365.3 393.4 371.3 420.8 407.1
161.5
191.5
242.8
270.6
278.7
280.9
316.7 291.6 31 t.t 289.7 297.2
248.2 198.6 246.4 244.8 280.9 281.2 304.5 315.2 291.3 331.0 326.4 301.6
286.1 214.l 223.5 271.5 289.9 280.7 316.0 303.8
130.7
133.S
139.4
142.6
146.6
148.6
147.5 147.7 147.9 147.8 147.9
147.1 147.9 147.6 147.4 147.9 148.6 148.6 148.9 149.1 149.6 149.6 149.6
149.9 151.0 150.8 150.9 151.2 151.6 151.8 152.3
123.6
143.5
174.t
189.8
190.0
189.0
214.7 197.5 210.4 195.9 200.9
168.8 134.3 167.0 166.1 190.0 189.3 205.0 211.7 195.4 221.3 218.2 201.6
190.8 141.7 148.3 179.9 191.7 185.2 208.1 199.5
Note: The terms of trade index is derived from the ratio of unit value index for total exports to that for imports.
Hong Kong Monthly Digest of StJJtistics October 1991
167.2
199.4
273.1
360.5
406.7
464.3
416.0 406.8 423.0 401.9 411.4
356.3 351.0 443.3 439.2 489.9 451.1 472.5 483.1 467.0 548.1 555.8 514.8
526.1 390.3 494.4 570.8 582.2 551.5 599.1 578.9
128.0
134.4
139.9
145.7
150.9
154.6
151.6 151.4 152.I 152.1 152.4
153.1 153.1 152.7 153.0 153.0 153.0 153.6 154.4 155.5 157.1 157.8 157.4
158.0 159.5 158.0 156.7 156.3 156.5 157.0 157.0
130.6
148.3
195.3
247.4
269.4
300.3
274.4 268.7 278.1 264.3 270.1
232.7 229.3 290.3 287.0 320.2 294.9 307.6 312.9 300.4 349.0 352.2 327.1
332.9 244.7 313.0 364.2 372.6 352.5 381.6 368.8
Plastic articles
2,225.09
3,106.35
4,130.92
4,422.52
4,789.43
4,273.73
400.57 463.93 399.60 388.00
375.60 344.93 386.93 383.37 405.35 314.36 335.07 348.65 315.76 352.21 398.38 313.13
325.73 233.57 247.16 374.76 344.10 304.87 315.75 302.21 290.53
Household type
electrical and
non-electrical equipment
4,551.29
4,871.28
5,666.55
5,478.87
4,251.74
3,375.54
367.40 411.11 341.46 271.0t
213.53 194.62 273.10 258.71 298.21 249.29 284.86 308.49 294.85 355.26 365.62 278.98
273.36 192.14 230.77 289.65 294.IO 253.33 257.39 284.21 279.18
Re-exports
Unit
Electrical line
telephonic apparatus
1,447.99
1,673.48
1,656.75
2,116.66
1,594.12
1,234.68
146.35 135.07 111.51 120.02
89.44 64.30
103.94 143.82 129.81 91.31
117.10 114.72 97.71 94.31 95.08 93.15
70.76 79.53 60.95 84.59 84.44 55.79 86.85 65.93 70.20
Value value Quantum
252.2
293.6
237.9
659.8
829.9
991.9
915.1 875.0 919.6 863.8 850.6
803.8 702.8 883.9 887.2
I 003.1 983.l
I 040.6 I 101.2 I 009.1 I 202.8 I 227.8 I 056.9
I 121.8 904.5 973.6
I 193.5 I 291.6 I 216.6 I 394.S I 357.1
138.6
141.6
144.7
149.6
158.7
163.5
160.0 160.4 160.8 161.0 161.3
162.3 162.3 161.9 162.9 162.8 163.1 163.4 163.9 164.4 164.1 164.6 165.2
166.0 166.4 166.3 165.2 165.2 166.6 167.9 168.2
181.9
207.4
302.6
441.0
522.9
606.6
572.0 545.4 571.8 536.4 527.3
495.4 433.0 545.9 544.8 616.1 602.8 636.7 671.7 613.7 732.9 746.0 639.7
675.7 543.7 585.6 722.5 782.0 730.I 830.7 807.0
$million
Radio broadcast
receivers of all kinds
2,577.78
3,007.73
3,626.54
2,678.23
1,552.92
1,106.66
123.04 125.88 117.10 105.93
102.85 64.61 86.34 84.44 78.86 82.15 88.04 93.45
112.44 116.74 119.05 77.68
73.95 78.03 60.49 73.21 90.49 92.35 96.98 85.61 66.53
Terms of trade
104.8
101.9
101.5
100.5
101.9
102.1
102.1 102.5 102.2 102.3 102.1
102.1 102.5 102.5 102.7 102.8 103.0 102.7 102.5 102.0 IOI.I 100.9 101.2
101.5 IOI.I 102.0 102.4 102.8 103.3 103.6 103.9
25
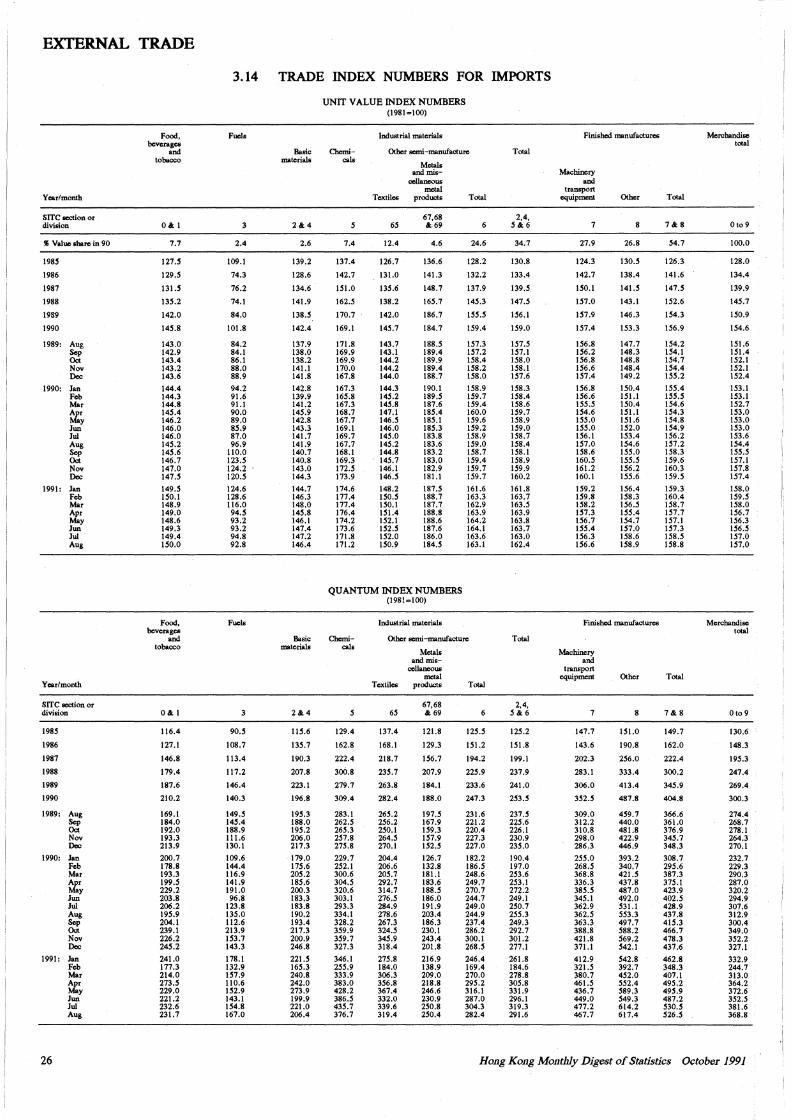
EXTERNAL TRADE
Year/month
srrc section or division
% Value share in 90
1985
1986
1987
1988
1989
1990
1989: Aug Sep Oct Nov Dec
1990: Jan Feb Mar Apr May Jun Jui Aug
~ Nov Dec
1991: Jan Feb Mar Apr May Jun Jui Aug
Year/month
SITC section or division
1985
1986
1987
1988
1989
1990
1989: Aug
~ Nov Dec
1990: Jan Feb Mar Apr May Jun Jui Aug
~ Nov Dec
1991: Jan
26
Feb Mar Apr May Jun Jui Aug
Food, beverages
and tobaoco
O&I
7.7
127.5
129.5
13!.S
135.2
142.0
145.8
143.0 142.9 143.4 143.2 143.6
144.4 144.3 144.8 145.4 146.2 146.0 146.0 145.2 145.6 146.7 147.0 147.5
149.5 ISO.I 148.9 149.0 148.6 149.3 149.4 ISO.O
Food, beverages
and tobaoco
O&I
116.4
127.1
146.8
179.4
187.6
210.2
169.I 184.0 192.0 193.3 213.9
200.7 178.8 193.3 199.5 229.2 203.8 206.2 195.9 204.1 239.1 226.2 245.2
241.0 177.3 214.0 273.5 229.0 221.2 232.6 231.7
3.14
Fuels
2.4
109.1
74.3
76.2
74.l
84.0
101.8
84.2 84.1 86.1 88.0 88.9
94.2 91.6 91.1 90.0 89.0 8S.9 87.0 96.9
110.0 123.S 124.2 120.S
124.6 128.6 116.0 94.S 93.2 93.2 94.8 92.8
Fuels
3
90.S
108.7
113.4
117.2
146.4
140.3
149.S 145.4 188.9 11 l.6 130.1
109.6 144.4 116.9 141.9 191.0 96.8
123.8 135.0 112.6 213.9 153.7 143.3
178.1 132.9 157.9 110.6 152.9 143.1 154.8 167.0
TRADE INDEX NUMBERS FOR IMPORTS
Basic materials
2&4
2.6
139.2
128.6
134.6
141.9
138.S
142.4
137.9 138.0 138.2 141.1 141.8
142.8 139.9 141.2 14S.9 142.8 143.3 141.7 141.9 140.7 140.8 143.0 144.3
144.7 146.3 148.0 14S.8 146.l 147.4 147.2 146.4
Basic materials
2&4
115.6
135.7
190.3
207.8
223.1
196.8
195.3 188.0 195.2 206.0 217.3
179.0 175.6 205.2 185.6 200.3 183.3 183.8 190.2 193.4 217.3 200.9 246.8
22!.S 165.3 240.8 242.0 273.9 199.9 221.0 206.4
UNIT VALUE INDEX NUMBERS (1981=100)
Chemicals
7.4
137.4
142.7
ISl.O
162.S
170.7
169.1
171.8 169.9 169.9 170.0 167.8
167.3 16S.8 167.3 168.7 167.7 169.l 169.7 167.7 168.1 169.3 172.S 173.9
174.6 177.4 177.4 176.4 174.2 173.6 171.8 171.2
Industrial materials
Other scmi-manufacturc
Metals and.mis
cellaneous metal
Textiles products Total
65
12.4
126.7
131.0
13S.6
138.2
142.0
14S.7
143.7 143.1 144.2 144.2 144.0
144.3 145.2 145.8 147.1 146.5 146.0 145.0 14S.2 144.8 145.7 146.I 146.5
148.2 IS0.5 ISO.I 151.4 152.l 152.S IS2.0 150.9
67,68 & 69
4.6
136.6
141.3
148.7
16S.7
186.7
184.7
188.S 189.4 189.9 189.4 188.7
190.l 189.5 187.6 185.4 18S.1 185.3 183.8 183.6 183.2 183.0 182.9 181.l
187.S 188.7 187.7 188.8 188.6 187.6 186.0 184.5
24.6
128.2
132.2
137.9
145.3
155.5
IS9.4
157.3 157.2 158.4 158.2 158.0
IS8.9 159.7 159.4 160.0 159.6 IS9.2 IS8.9 159.0 158.7 !S9.4 IS9.7 IS9.7
161.6 163.3 162.9 163.9 164.2 164.1 163.6 163.1
QUANTUM INDEX NUMBERS (1981=100)
Chemicals
129.4
162.8
222.4
300.8
279.7
309.4
283.l 262.5 265.3 257.8 275.8
229.7 2S2.l 300.6 304.5 320.6 303.1 293.3 334.1 328.2 3S9.9 359.7 327.3
346.1 2SS.9 333.9 383.0 428.2 386.5 435.7 376.7
Industrial materials
Other semi-manufacture
Metals and mis
cellaneous metal
T cxtilcs products Total
6S
137.4
168.1
218.7
235.7
263.8
282.4
265.2 256.2 250.I 264.5 270.1
204.4 206.6 205.7 292.7 314.7 276.S 284.9 278.6 267.3 324.5 345.9 318.4
275.8 184.0 306.3 356.8 367.4 332.0 339.6 319.4
67,68 & 69
121.8
129.3
IS6.7
207.9
184.1
188.0
197.5 167.9 159.3 IS7.9 152.5
126.7 132.8 181.l 183.6 188.5 186.0 191.9 203.4 186.3 230.1 243.4 201.8
216.9 138.9 209.0 218.8 246.6 230.9 2S0.8 250.4
6
12S.S
151.2
194.2
225.9
233.6
247.3
231.6 221.2 220.4 227.3 227.0
182.2 186.5 248.6 249.7 270.7 244.7 249.0 244.9 237.4 286.2 300.1 268.5
246.4 169.4 270.0 295.2 316.1 287.0 304.3 282.4
Total
2,4. 5&6
34.7
130.8
133.4
139.5
147.5
156.1
159.0
157.5 IS7.1 IS8.0 158.1 157.6
IS8.3 158.4 158.6 159.7 158.9 159.0 IS8.7 158.4 158.1 IS8.9 159.9 160.2
161.8 163.7 163.S 163.9 163.8 163.7 163.0 162.4
Total
2,4, 5&6
125.2
151.8
199.1
237.9
241.0
253.5
237.S 225.6 226.1 230.9 23S.O
190.4 197.0 253.6 253.1 272.2 249.1 250.7 255.3 249.3 292.7 301.2 277.1
261.8 184.6 278.8 30S.8 331.9 296.1 319.3 291.6
Finished manufactures
Machinery and
transport equipment Other
7
27.9
124.3
142.7
150.l
IS7.0
157.9
!S7.4
IS6.8 156.2 IS6.8 !S6.6 157.4
156.8 IS6.6 IS5.5 154.6 15S.O ISS.O 156.1 IS7.0 158.6 160.5 161.2 160.I
159.2 159.8 158.2 IS7.3 IS6.7 155.4 IS6.3 IS6.6
26.8
130.5
138.4
141.S
143.1
146.3
IS3.3
147.7 148.3 148.8 148.4 149.2
150.4 !SI.I 150.4 151.1 151.6 IS2.0 IS3.4 IS4.6 15S.O IS5.5 IS6.2 ISS.6
IS6.4 IS8.3 156.5 ISS.4 IS4.7 IS7.0 IS8.6 IS8.9
Finished manufactures
Machinery and
transport equipment Other
7
147.7
143.6
202.3
283.l
306.0
352.5
309.0 312.2 310.8 298.0 286.3
2S5.0 268.5 368.8 336.3 385.S 345.l 362.9 362.5 363.3 388.8 421.8 371.l
412.9 321.S 380.7 461.S 436.7 449.0 477.2 467.7
8
151.0
190.8
256.0
333.4
413.4
487.8
459.7 440.0 481.8 422.9 446.9
393.2 340.7 42!.S 437.8 487.0 492.0 531.1 553.3 497.7 588.2 S69.2 542.1
S42.8 392.7 4S2.0 S52.4 S89.3 549.3 614.2 617.4
Total
7&8
54.7
126.3
141.6
147.S
IS2.6
154.3
IS6.9
154.2 154.l 154.7 IS4.4 IS5.2
ISS.4 155.5 154.6 IS4.3 154.8 154.9 156.2 157.2 IS8.3 IS9.6 160.3 159.S
IS9.3 160.4 IS8.7 IS7.7 157.1 157.3 158.S IS8.8
Total
7&8
149.7
162.0
222.4
300.2
34S.9
404.8
366.6 361.0 376.9 345.7 348.3
308.7 295.6 387.3 375.1 423.9 402.5 428.9 437.8 415.3 466.7 478.3 437.6
462.8 348.3 407.l 495.2 49S.9 487.2 S30.5 526.5
Merchandise total
Oto9
100.0
128.0
134.4
139.9
14S.7
150.9
IS4.6
ISl.6 ISl.4 IS2.1 152.1 152.4
153.1 153.I 152.7 IS3.0 153.0 153.0 153.6 IS4.4 15S.S IS7.1 157.8 IS7.4
IS8.0 IS9.5 158.0 IS6.7 156.3 IS6.5 IS7.0 IS7.0
Merchandise total
Oto 9
130.6
148.3
19S.3
247.4
269.4
300.3
274.4 268.7 278.1 264.3 270.1
232.7 229.3 290.3 287.0 320.2 294.9 307.6 312.9 300.4 349.0 3S2.2 327.1
332.9 244.7 313.0 364.2 372.6 352.5 381.6 368.8
Hong Kong Monthly Digest of Statistics October 1991
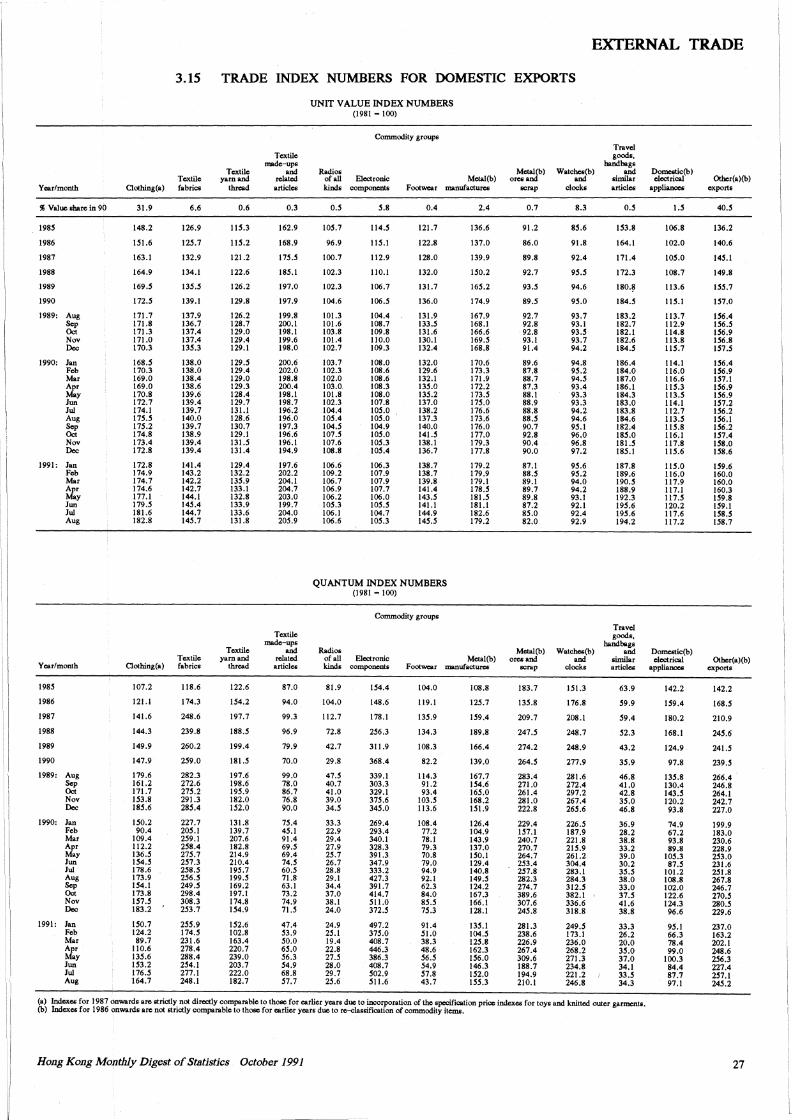
! I
j
ii
ii I
EXTERNAL TRADE
3.15 TRADE INDEX NUMBERS FOR DOMESTIC EXPORTS
Year/month
% Value share in 90
1985
1986
1987
1988
1989
1990
1989: Aug Sep Oct Nov Dec
1990: Jan Feb Mar Apr May Jun Jui Aug Sep Oct Nov Dec
1991: Jan Feb Mar Apr May Jun Jui Aug
Year/month
1985
1986
1987
1988
1989
1990
1989: Aug
~ Nov Dec
1990: Jan Feb Mar Apr May Jun Jui Aug Sep Oct Nov Dec
1991: Jan Feb Mar Apr May Jun Jui Aug
Textile Clothing(•) fabrics
31.9
148.2
151.6
163.1
164.9
169.5
172.5
171.7 171.8 171.3 171.0 170.3
168.5 170.3 169.0 169.0 170.8 172.7 174.l 175.5 175.2 174.8 173.4 172.8
172.8 174.9 174.7 174.6 177.l 179.5 181.6 182.8
Clothing(•)
107.2
121.1
141.6
144.3
149.9
147.9
179.6 161.2 171.7 153.8 185.6
150.2 90.4
109.4 112.2 136.5 154.5 178.6 173.9 154.l 173.8 157.5 183.2
150.7 124.2 89.7
110.6 135.6 153.2 176.5 164.7
6.6
126.9
125.1
132.9
134.1
135.5
139.l
137.9 136.7 137.4 137.4 135.3
138.0 138.0 138.4 138.6 139.6 139.4 139.7 140.0 139.7 138.9 139.4 139.4
141.4 143.2 142.2 142.7 144.l 145.4 144.7 145.7
Textile fabrics
118.6
174.3
248.6
239.8
260.2
259.0
282.3 272.6 275.2 291.3 285.4
227.7 205.1 259.1 258.4 275.7 257.3 258.5 256.5 249.5 298.4 308.3 253.7
255.9 174.5 231.6 278.4 288.4 254.l 277.1 248.1
Textile yam and
thread
0.6
115.3
115.2
121.2
122.6
126.2
129.8
126.2 128.7 129.0 129.4 129.1
129.5 129.4 129.0 129.3 128.4 129.7 131.l 128.6 130.7 129.l 131.5 131.4
129.4 132.2 135.9 133.l 132.8 133.9 133.6 131.8
Textile yam and
thread
122.6
154.2
197.7
188.5
199.4
181.5
197.6 198.6 195.9 182.0 152.0
131.8 139.7 207.6 182.8 214.9 210.4 195.7 199.5 169.2 197.1 174.8 154.9
152.6 102.8 163.4 220.7 239.0 203.7 222.0 182.7
Textile made-ups
and related articles
0.3
162.9
168.9
175.5
185.1
197.0
197.9
199.8 200.l 198.1 199.6 198.0
200.6 202.0 198.8 200.4 198.l 198.7 196.2 196.0 197.3 196.6 196.l 194.9
197.6 202.2 204.1 204.7 203.0 199.7 204.0 205.9
Textile made-ups
and related
articles
87.0
94.0
99.3
96.9
79.9
70.0
99.0 78.0 86.7 76.8 90.0
75.4 45.l 91.4 69.5 69.4 74.5 60.5 71.8 63.1 73.2 74.9 71.5
47.4 53.9 50.0 65.0 56.3 54.9 68.8 57.7
UNIT VALUE INDEX NUMBERS (1981=100)
Commodity groups
Radios of all Electronic kinds components
0.5
105.7
96.9
100.7
102.3
102.3
104.6
101.3 101.6 103.8 101.4 102.7
103.7 102.3 102.0 103.0 101.8 102.3 104.4 105.4 104.5 101.5 107.6 108.8
106.6 109.2 106.7 106.9 106.2 105.3 106.1 106.6
5.8
114.5
115.l
112.9
110.1
106.7
106.5
104.4 108.7 109.8 110.0 109.3
108.0 108.6 108.6 108.3 108.0 107.8 105.0 105.0 104.9 105.0 105.3 105.4
106.3 107.9 107.9 107.7 106.0 105.5 104.7 105.3
Metal(b) Footwear manufactures
0.4
121.7
122.8
128.0
132.0
131.7
136.0
131.9 133.S 131.6 130.1 132.4
132.0 129.6 132.l 135.0 135.2 137.0 138.2 137.3 140.0 141.5 138.l 136.7
138.7 138.7 139.8 141.4 143.5 141.1 144.9 145.5
2.4
136.6
137.0
139.9
150.2
165.2
174.9
167.9 168.l 166.6 169.5 168.8
170.6 173.3 171.9 172.2 173.5 175.0 176.6 173.6 176.0 177.0 179.3 177.8
179.2 179.9 179.1 178.5 181.5 181.l 182.6 179.2
QUANTUM INDEX NUMBERS (1981 = 100)
Commodity groups
Radios of all Electronic kinds components
81.9 154.4
104.0 148.6
112.7 178.1
72.8 256.3
42.7 311.9
29.8 368.4
47.5 40.7 41.0 39.0 34.5
33.3 22.9 29.4 27.9 25.7 26.7 28.8 29.l 34.4 37.0 38.l 24.0
24.9 25.l 19.4 22.8 27.5 28.0 29.7 25.6
339.1 303.3 329.1 375.6 345.0
269.4 293.4 340.1 328.3 391.3 347.9 333.2 427.3 391.7 414.7 511.0 372.5
497.2 375.0 408.7 446.3 386.3 408.7 502.9 511.6
Metal(b) Footwear manufacture&
104.0 108.8
119.1 125.7
135.9 159.4
134.3 189.8
108.3 166.4
82.2 139.0
114.3 91.2 93.4
103.5 113.6
108.4 77.2 78.1 79.3 70.8 79.0 94.9 92.1 62.3 84.0 85.5 75.3
91.4 51.0 38.3 48.6 56.5 54.9 57.8 43.7
167.7 154.6 165.0 168.2 151.9
126.4 104.9 143.9 137.0 150.l 129.4 140.8 149.5 124.2 167.3 166.l 128.1
135.1 104.5 125.8 162.3 156.0 146.3 152.0 155.3
Travel goods,
handbags Metal(b) Watches(b) and
ores and and similar scrap clocks articles
0.7
91.2
86.0
89.8
92.7
93.5
89.5
92.7 92.8 92.8 93.1 91.4
89.6 87.8 88.7 87.3 88.1 88.9 88.8 88.5 90.7 92.8 90.4 90.0
87.1 88.5 89.1 89.7 89.8 87.2 85.0 82.0
Metal(b) ores and
scrap
183.7
135.8
209.7
247.5
274.2
264.5
283.4 271.0 261.4 281.0 222.8
229.4 157.1 240.7 270.7 264.7 253.4 257.8 282.3 274.7 389.6 307.6 245.8
281.3 238.6 226.9 267.4 309.6 188.7 194.9 210.1
8.3
85.6
91.8
92.4
95.5
94.6
95.0
93.7 93.l 93.5 93.7 94.2
94.8 95.2 94.5 93.4 93.3 93.3 94.2 94.6 95.1 96.0 96.8 97.2
95.6 95.2 94.0 94.2 93.1 92.1 92.4 92.9
Watches(b) and
clcx:ks
151.3
176.8
208.l
248.7
248.9
277.9
281.6 272.4 297.2 267.4 265.6
226.5 187.9 221.8 215.9 261.2 304.4 283.1 284.3 312.5 382.1 336.6 318.8
249.5 173.1 236.0 268.2 271.3 234.8 221.2 246.8
0.5
153.8
164.l
171.4
172.3
180.~
184.5
183.2 182.7 182.1 182.6 184.5
186.4 184.0 187.0 186.1 184.3 183.0 183.8 184.6 182.4 185.0 181.5 185.l
187.8 189.6 190.5 188.9 192.3 195.6 195.6 194.2
Travel goods,
handbags and
similar articles
63.9
59.9
59.4
52.3
43.2
35.9
46.8 41.0 42.8 35.0 46.8
36.9 28.2 38.8 33.2 39.0 30.2 35.5 38.0 33.0 37.5 41.6 38.8
33.3 26.2 20.0 35.0 37.0 34.1 33.5 34.3
(a) Indexes for 1987 Onwards are strictly not directly comparable to those for earlier years due to incorporation of the specification price indexes for toys and knitted outer garments. (b) Indexes for 1986 onwards are not strictly comparable to those for earlier years due to re-classification of commodity items.
Hong Kong Monthly Digest of Statistics October 1991
Domestic(b) electrical
appliances
1.5
106.8
102.0
105.0
108.7
113.6
115.l
113.7 112.9 114.8 113.8 115.7
114.1 116.0 116.6 115.3 113.5 114.l 112.7 113.5 115.8 116.1 117.8 115.6
115.0 116.0 117.9 117.l 117.5 120.2 117.6 117.2
Domestic(b) electrical
appliances
142.2
159.4
180.2
168.l
124.9
97.8
135.8 130.4 143.5 120.2 93.8
74.9 67.2 93.8 89.8
105.3 87.5
101.2 108.8 102.0 122.6 124.3 96.6
95.1 66.3 78.4 99.0
100.3 84.4 87.7 97.1
Other(a)(b) exports
40.5
136.2
140.6
145.l
149.8
155.7
157.0
156.4 156.5 156.9 156.8 157.5
156.4 156.9 157.l 156.9 156.9 157.2 156.2 156.1 156.2 157.4 158.0 158.6
159.6 160.0 160.0 160.3 159.8 159.1 158.5 158.7
Other(a)(b) exports
142.2
168.5
210.9
245.6
241.5
239.5
266.4 246.8 264.1 242.7 227.0
199.9 183.0 230.6 228.9 253.0 231.6 251.8 267.8 246.7 270.5 280.5 229.6
237.0 163.2 202.l 248.6 256.3 227.4 257.1 245.2
27
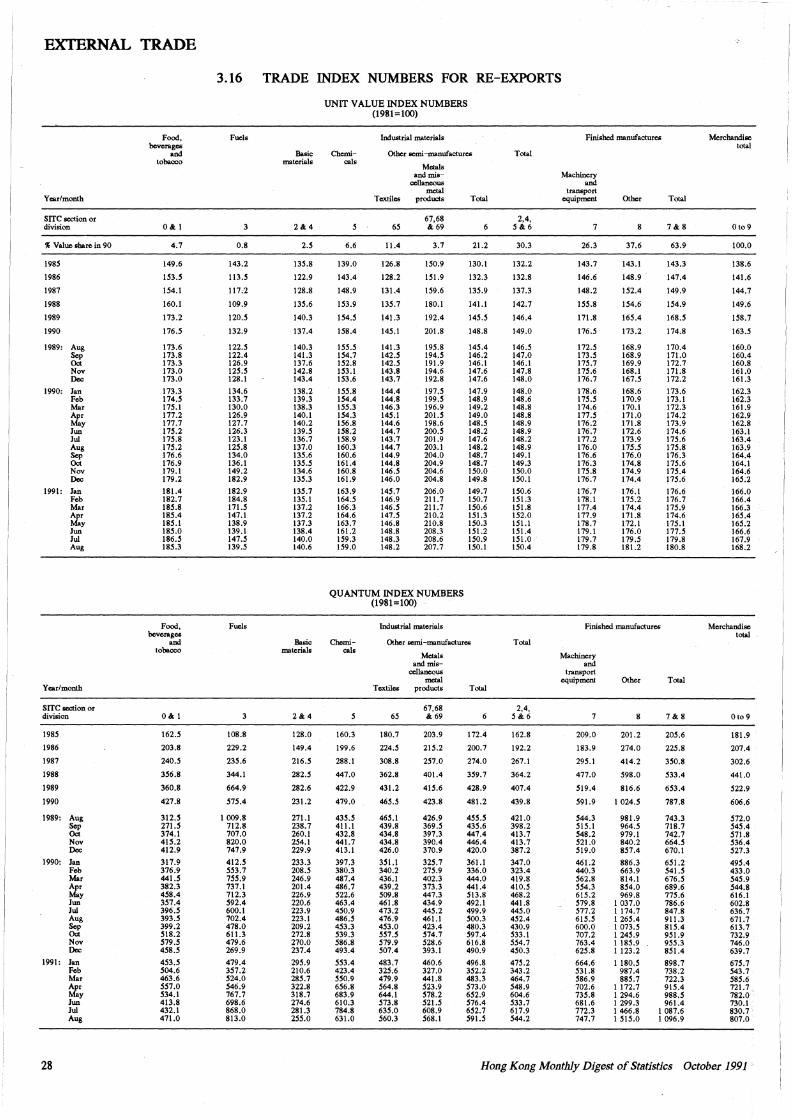
EXTERNAL TRADE
Year/month
SITC section or division
% Value share in 90
1985
1986
1987
1988
1989
1990
1989: Aug Sep Oct Nov Dec
1990: Jan Feb Mar Apr May Jun Jui Aug
~ Nov Dec
1991: Jan Feb Mar Apr May Jun Jui Aug
Year/month
SITC section or division
1985
1986
1987
1988
1989
1990
1989: Aug Sep Oct Nov Dec
1990: Jan Feb Mar Apr May Jun Jui Aug Sep Oct Nov Dec
1991: Jan
28
Feb Mar Apr May Jun Jui Aug
Food, beverages
and tobacco
O&l
4.7
149.6
153.5
154.l
160.1
173.2
176.5
173.6 173.8 173.3 173.0 173.0
173.3 174.5 175.1 177.2 177.7 175.2 175.8 175.2 176.6 176.9 179.1 179.2
181.4 182.7 185.8 185.4 185.1 185.0 186.5 185.3
Food, beverage.s
and tobacco
O&l
162.5
203.8
240.5
356.8
360.8
427.8
312.5 271.5 374.1 415.2 412.9
317.9 376.9 441.5 382.3 458.4 357.4 396.5 393.5 399.2 518.2 579.5 458.5
453.5 504.6 463.6 557.0 534.1 413.8 432.1 471.0
3.16
Fuels
0.8
143.2
113.5
117.2
109.9
120.5
132.9
122.5 122.4 126.9 125.5 128.1
134.6 133.7 130.0 126.9 127.7 126.3 123.1 125.8 134.0 136.i 149.2 182.9
182.9 184.8 171.5 147.1 138.9 139.1 147.5 139.5
Fuels
108.8
229.2
235.6
344.1
664.9
575.4
1 009.8 712.8 707.0 820.0 747.9
412.5 553.7 755.9 737.1 712.3 592.4 600.1 702.4 478.0 611.3 479.6 269.9
479.4 357.2 524.0 546.9 767.7 698.6 868.0 813.0
TRADE INDEX NUMBERS FOR RE-EXPORTS
Basic material&
2&4
2.5
135.8
122.9
128.8
135.6
140.3
137.4
140.3 141.3 137.6 142.8 143.4
138.2 139.3 138.3 140.1 140.2 139.5 136.7 137.0 135.6 135.5 134.6 135.3
135.7 135.1 137.2 137.2 137.3 138.4 140.0 140.6
Basic materials
2&4
128.0
149.4
216.5
282.5
282.6
231.2
271.1 238.7 260.1 254.1 229.9
233.3 208.5 246.9 201.4 226.9 220.6 223.9 223.1 209.2 272.8 270.0 237.4
295.9 210.6 285.7 322.8 318.7 274.6 281.3 255.0
UNIT VALUE INDEX NUMBERS (1981=100)
Chemicals
6.6
139.0
143.4
148.9
153.9
154.5
158.4
155.5 154.7 152.8 153.1 153.6
155.8 154.4 155.3 154.3 156.8 158.2 158.9 160.3 160.6 161.4 160.8 161.9
163.9 164.5 166.3 164.6 163.7 161.2 159.3 159.0
Industrial materials
Other semi-manufactures
Metal• and mis
cellaneous metal
Textiles product• Total
65
11.4
126.8
128.2
131.4
135.7
141.3
145.1
141.3 142.5 142.5 143.8 143.7
144.4 144.8 146.3 145.1 144.6 144.7 143.7 144.7 144.9 144.8 146.5 146.0
145.7 146.9 146.5 147.5 146.8 148.8 148.3 148.2
67,68 & 69
3.7
150.9
151.9
159.6
180.l
192.4
201.8
195.8 194.5 191.9 194.6 192.8
197.5 199.5 196.9 201.S 198.6 200.5 201.9 203.1 204.0 204.9 204.6 204.8
206.0 211.7 211.7 210.2 210.8 208.3 208.6 207.7
21.2
130.1
132.3
135.9
141.l
145.5
148.8
145.4 146.2 146.1 147.6 147.6
147.9 148.9 149.2 149.0 148.5 148.2 147.6 148.2 148.7 148.7 150.0 149.8
149.7 150.7 150.6 151.3 150.3 151.2 150.9 ISO.I
QUANTUM INDEX NUMBERS (1981=100)
Chemical•
160.3
199.6
288.1
447.0
422.9
479.0
435.S 411.1 432.8 441.7 413.1
397.3 380.3 487.4 486.7 522.6 463.4 450.9 486.5 453.3 539.3 586.8 493.4
553.4 423.4 550.9 656.8 683.9 610.3 784.8 631.0
Industrial materials
Other semi-manufacture..
Metals and mis
cellaneous metal
Textiles products Total
65
180.7
224.5
308.8
362.8
431.2
465.S
465.i 439.8 434.8 434.8 426.0
351.1 340.2 436.1 439.2 509.8 461.8 473.2 476.9 453.0 557.5 579.9 507.4
483.7 325.6 479.9 564.8 644.1 573.8 635.0 560.3
67,68 & 69
203.9
215.2
257.0
401.4
415.6
423.8
426.9 369.5 397.3 390.4 370.9
325.7 275.9 402.3 373.3 447.3 434.9 445.2 461.1 423.4 574.7 528.6 393.l
460.6 327.0 441.8 523.9 578.2 521.5 608.9 568.1
172.4
200.7
274.0
359.7
428.9
481.2
455.5 435.6 447.4 446.4 420.0
361.l 336.0 444.0 441.4 513.8 492.1 499.9 500.3 480.3 597.4 616.8 490.9
496.8 352.2 483.3 573.0 652.9 576.4 652.7 591.5
Total
2,4, 5&6
30.3
132.2
132.8
137.3
142.7
146.4
149.0
146.5 147.0 146.1 147.8 148.0
148.0 148.6 148.8 148.8 148.9 148.9 148.2 148.9 149.1 149.3 150.0 150.1
150.6 151.3 151.8 152.0 151.1 151.4 151.0 150.4
Total
2,4, 5&6
162.8
192.2
267.1
364.2
407.4
439.8
421.0 398.2 413.7 413.7 387.2
347.0 323.4 419.8 410.5 468.2 441.8 445.0 452.4 430.9 533.1 554.7 450.3
475.2 343.2 464.7 548.9 604.6 533.7 617.9 544.2
Finished manufactures
Machinery and
transport equipment Other
7
26.3
143.7
146.6
148.2
155.8
171.8
176.5
172.5 173.5 175.7 175.6 176.7
178.6 175.5 174.6 177.5 176.2 176.7 177.2 176.0 176.6 176.3 175.8 176.7
176.7 178.1 177.4 177.9 178.7 179.1 179.7 179.8
37.6
143.1
148.9
152.4
154.6
165.4
173.2
168.9 168.9 169.9 168.1 167.5
168.6 170.9 170.i 171.0 171.8 172.6 173.9 175.5 176.0 174.8 174.9 174.4
176.1 175.2 174.4 171.8 172.1 176.0 179.5 181.2
Total
7&8
63.9
143.3
147.4
149.9
154.9
168.5
174.8
170.4 171.0 172.7 171.8 172.2
173.6 173.1 172.3 174.2 173.9 174.6 175.6 175.8 176.3 175.6 175.4 175.6
176.6 176.7 175.9 174.6 175.1 177.5 179.8 180.8
Finished manufactures
Machinery and
transport equipment Other
7
209.0
183.9
295.1
477.0
519.4
591.9
544.3 515.1 548.2 521.0 519.0
461.2 440.3 562.8 554.3 615.2 579.8 577.2 615.5 600.0 707.2 763.4 625.8
664.6 531.8 586.9 702.6 735.8 681.6 772.3 747.7
201.2
274.0
414.2
598.0
816.6
1 024.5
981.9 964.5 979.1 840.2 857.4
886.3 663.9 814.1 854.0 969.8
I 037.0 1 174.7 I 265.4 I 073.5 1 245.9 1 185.9 1 123.2
1 180.5 987.4 885.7
1 172.7 1 294.6 1 299.3 I 466.8 1 515.0
Total
7&8
205.6
225.8
350.8
533.4
653.4
787.8
743.3 718.7 742.7 664.5 670.1
651.2 541.5 676.5 689.6 775.6 786.6 847.8 911.3 815.4 951.9 955.3 851.4
898.7 738.2 722.3 915.4 988.5 961.4
I 087.6 I 096.9
Merchandise total
Oto9
100.0
138.6
141.6
144.7
149.6
158.7
163.5
160.0 160.4 160.8 161.0 161.3
162.3 162.3 161.9 162.9 162.8 163.1 163.4 163.9 164.4 164.1 164.6 165.2
166.0 166.4 166.3 165.4 165.2 166.6 167.9 168.2
Merchandise total
Oto 9
181.9
207.4
302.6
441.0
522.9
606.6
572.0 545.4 571.8 536.4 527.3
495.4 433.0 545.9 544.8 616.1 602.8 636.7 671.7 613.7 732.9 746.0 639.7
675.7 543.7 585.6 721.7 782.0 730.1 830.7 807.0
Hong Kong Monthly Digest of Statistics October 1991
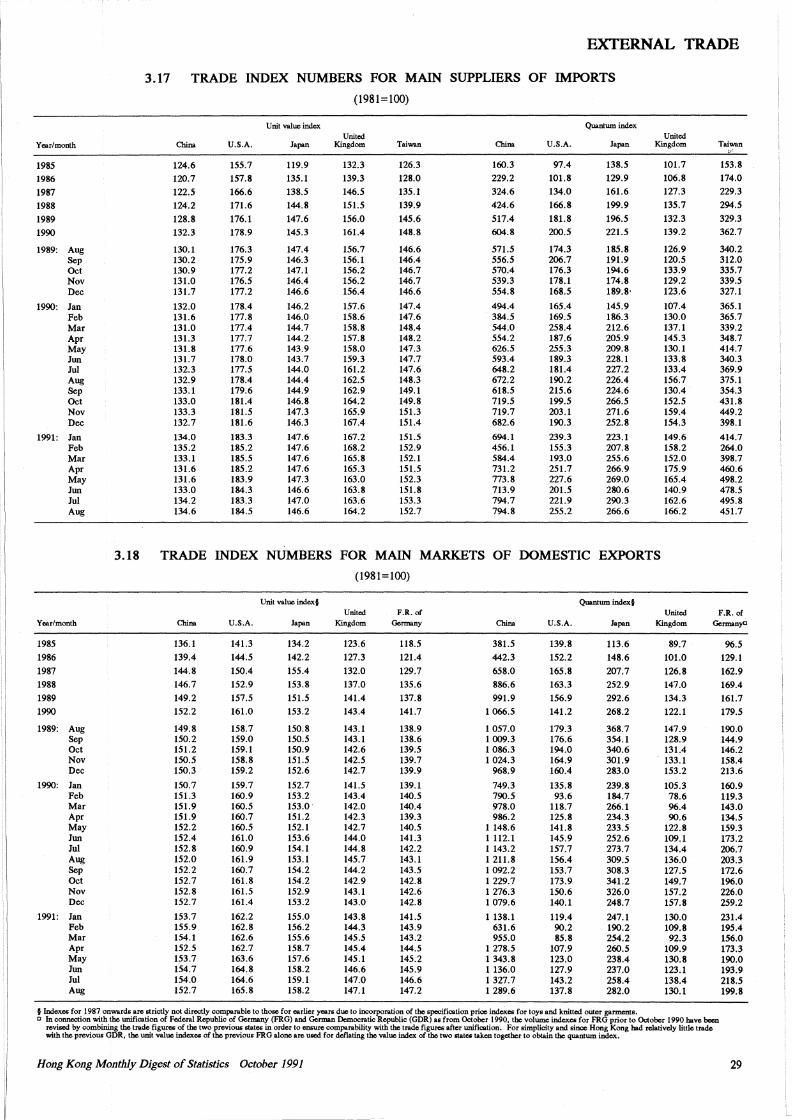
EXTERNAL TRADE
3.17 TRADE INDEX NUMBERS FOR MAIN SUPPLIERS OF IMPORTS
(1981=100)
Unit value index Quantum index
i United United
Year/month China U.S.A. Japan Kingdom Taiwan China U.S.A. Japan Kingdom Taiwan ._,,
I 1985 124.6 155.7 119.9 132.3 126.3 160.3 97.4 138.5 101.7 153.8
I 1986 120.7 157.8 135.1 139.3 128.0 229.2 101.8 129.9 106.8 174.0
I 1987 122.5 166.6 138.5 146.5 135.l 324.6 134.0 161.6 127.3 229.3
1988 124.2 171.6 144.8 151.5 139.9 424.6 166.8 199.9 135.7 294.5
1989 128.8 176.1 147.6 156.0 145.6 517.4 181.8 196.5 132.3 329.3
1990 132.3 178.9 145.3 161.4 148.8 604.8 200.5 221.5 139.2 362.7
1989: Aug 130.1 176.3 147.4 156.7 146.6 571.5 174.3 185.8 126.9 340.2 Sep 130.2 175.9 146.3 156.1 146.4 556.5 206.7 191.9 120.5 312.0 Oct 130.9 177.2 147.1 156.2 146.7 570.4 176.3 194.6 133.9 335.7 Nov 131.0 176.5 146.4 156.2 146.7 539.3 178.1 174.8 129.2 339.5 Dec 131.7 177.2 146.6 156.4 146.6 554.8 168.5 189.8· 123.6 327.1
1990: Jan 132.0 178.4 146.2 157.6 147.4 494.4 165.4 145.9 107.4 365.1 Feb 131.6 177.8 146.0 158.6 147.6 384.5 169.5 186.3 130.0 365.7 Mar 131.0 177.4 144.7 158.8 148.4 544.0 258.4 212.6 137.1 339.2 Apr 131.3 177.7 144.2 157.8 148.2 554.2 187.6 205.9 145.3 348.7 May 131.8 177.6 143.9 158.0 147.3 626.5 255.3 209.8 130.1 414.7 Jun 131.7 178.0 143.7 159.3 147.7 593.4 189.3 228.1 133.8 340.3
I Jui 132.3 177.5 144.0 161.2 147.6 648.2 181.4 227.2 133.4 369.9 Aug 132.9 178.4 144.4 162.5 148.3 672.2 190.2 226.4 156.7 375.1
i Sep 133.1 179.6 144.9 162.9 149.1 618.5 215.6 224.6 130.4 354.3 ! Oct 133.0 181.4 146.8 164.2 149.8 719.5 199.5 266.5 152.5 431.8
Nov 133.3 181.5 147.3 165.9 151.3 719.7 203.1 271.6 159.4 449.2 Dec 132.7 181.6 146.3 167.4 151.4 682.6 190.3 252.8 154.3 398.1
1991: Jan 134.0 183.3 147.6 167.2 151.5 694.1 239.3 223.1 149.6 414.7 Feb 135.2 185.2 147.6 168.2 152.9 456.1 155.3 207.8 158.2 264.0 Mar 133.1 185.5 147.6 165.8 152.1 584.4 193.0 255.6 152.0 398.7 Apr 131.6 185.2 147.6 165.3 151.5 731.2 251.7 266.9 175.9 460.6 May 131.6 183.9 147.3 163.0 152.3 773.8 227.6 269.0 165.4 498.2 Jun 133.0 184.3 146.6 163.8 151.8 713.9 201.5 280.6 140.9 478.5 Jui 134.2 183.3 147.0 163.6 153.3 794.7 221.9 290.3 162.6 495.8
: I Aug 134.6 184.5 146.6 164.2 152.7 794.8 255.2 266.6 166.2 451.7
I 'i
I 3.18 TRADE INDEX NUMBERS FOR MAIN MARKETS OF DOMESTIC EXPORTS
(1981=100)
Unit value index§ Quantum indexf United F.R. of United F.R. of
Year/month China U.S.A. Japan Kingdom Germany China U.S.A. Japan Kingdom German ye
1985 136.1 141.3 134.2 123.6 118.5 381.5 139.8 113.6 89.7 96.5 1986 139.4 144.5 142.2 127.3 121.4 442.3 152.2 148.6 101.0 129.1
1987 144.8 150.4 155.4 132.0 129.7 658.0 165.8 207.7 126.8 162.9 1988 146.7 152.9 153.8 137.0 135.6 886.6 163.3 252.9 147.0 169.4
1989 149.2 157.5 151.5 141.4 137.8 991.9 156.9 292.6 134.3 161.7 1990 152.2 161.0 153.2 143.4 141.7 1 066.5 141.2 268.2 122.1 179.5
1989: Aug 149.8 158.7 150.8 143.1 138.9 l 057.0 179.3 368.7 147.9 190.0 Sep 150.2 159.0 150.5 143.1 138.6 1 009.3 176.6 354.1 128.9 144.9 Oct 151.2 159.1 150.9 142.6 139.5 1 086.3 194.0 340.6 131.4 146.2 Nov 150.5 158.8 151.5 142.5 139.7 1 024.3 164.9 301.9 133.1 158.4 Dec 150.3 159.2 152.6 142.7 139.9 968.9 160.4 283.0 153.2 213.6
1990: Jan 150.7 159.7 152.7 141.5 139.1 749.3 135.8 239.8 105.3 160.9 Feb 151.3 160.9 153.2 143.4 140.5 790.5 93.6 184.7 78.6 119.3 Mar 151.9 160.5 153.0 142.0 140.4 978.0 118.7 266.1 96.4 143.0 Apr 151.9 160.7 151.2 142.3 139.3 986.2 125.8 234.3 90.6 134.5 May 152.2 160.5 152.1 142.7 140.5 1 148.6 141.8 233.5 122.8 159.3 Jun 152.4 161.0 153.6 144.0 141.3 1 112.1 145.9 252.6 109.1 173.2 Jui 152.8 160.9 154.1 144.8 142.2 l 143.2 157.7 273.7 134.4 206.7 Aug 152.0 161.9 153.1 145.7 143.1 1 211.8 156.4 309.5 136.0 203.3 Sep 152.2 160.7 154.2 144.2 143.5 1 092.2 153.7 308.3 127.5 172.6 Oct 152.7 161.8 154.2 142.9 142.8 1 229.7 173.9 341.2 149.7 196.0 Nov 152.8 161.5 152.9 143.1 142.6 1 276.3 150.6 326.0 157.2 226.0 Dec 152.7 161.4 153.2 143.0 142.8 1 079.6 140.1 248.7 157.8 259.2
1991: Jan 153.7 162.2 155.0 143.8 141.5 1 138.1 119.4 247.1 130.0 231.4 Feb 155.9 162.8 156.2 144.3 143.9 631.6 90.2 190.2 109.8 195.4 Mar 154.1 162.6 155.6 145.5 143.2 955.0 85.8 254.2 92.3 156.0 Apr 152.5 162.7 158.7 145.4 144.5 1 278.5 107.9 260.5 109.9 173.3 May 153.7 163.6 157.6 145.1 145.2 1 343.8 123.0 238.4 130.8 190.0 Jun 154.7 164.8 158.2 146.6 145.9 1136.0 127.9 237.0 123.1 193.9 Jui 154.0 164.6 159.1 147.0 146.6 1 327.7 143.2 258.4 138.4 218.5 Aug 152.7 165.8 158.2 147.1 147.2 1 289.6 137.8 282.0 130.1 199.8
§ Indexes for 1987 onwards are strictly not directly comparable to those for earlier years due to incorporation of the specification price indexes for toys and knitted outer garments. a In connection with the unification of Federal Republic of Germany (FRG) and German Democratic Republic (GDR) as from October 1990, the volume indexes for FRG prior to October 1990 have been
revised by combining the trade figures of the two previous states in order to ensure comparability with the trade figures after unification. For simplicity and since Hong Kong had relatively little trade with the previous GDR, the unit value index:e& of the previous FRG alone are used for deflating the value index of the two states taken together to obtain the quantum index.
Hong Kong Monthly Digest of Statistics October 1991 29
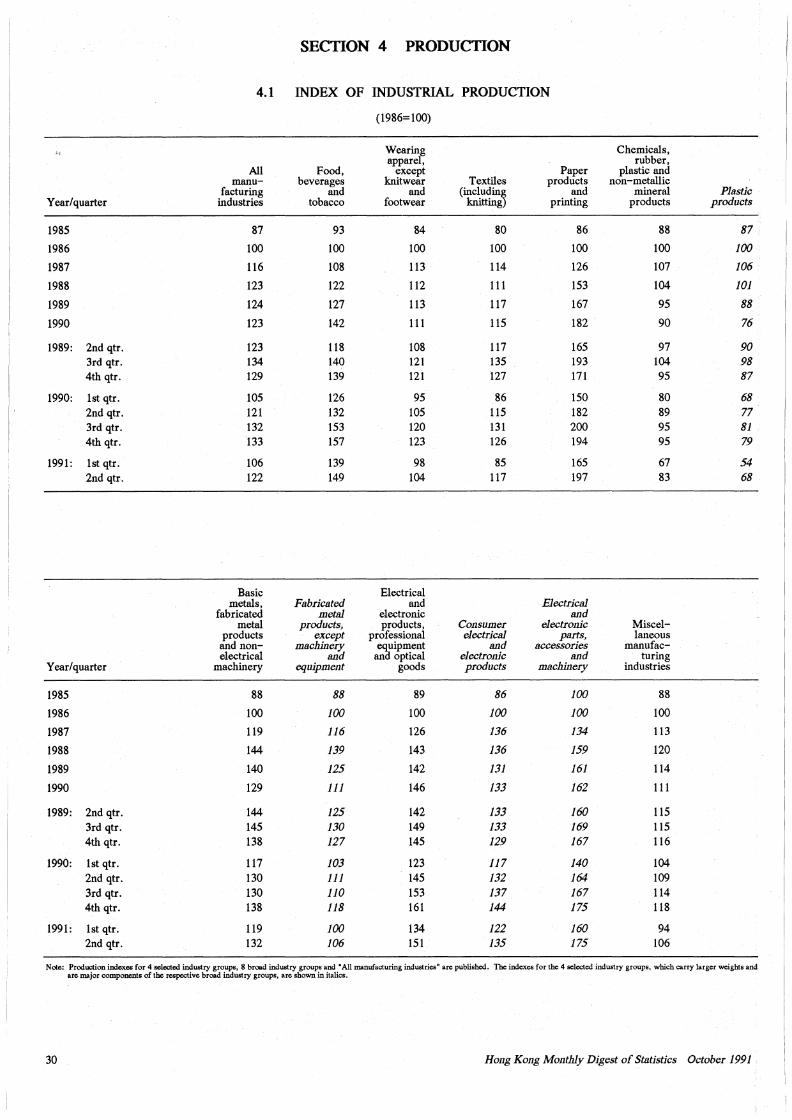
SECTION 4 PRODUCTION
4.1 INDEX OF INDUSTRIAL PRODUCTION
(1986=100)
Wearinf Chemicals, appare, rubber,
All Food, except Paper plastic and manu- beverages knitwear Textiles products non-metallic
facturing and and (includin~ and mineral Plastic Year/quarter industries tobacco footwear knitting printing products products
1985 87 93 84 80 86 88 87
1986 100 100 100 100 100 100 JOO
1987 116 108 113 114 126 107 106
1988 123 122 112 111 153 104 101
1989 124 127 113 117 167 95 88
1990 123 142 111 115 182 90 76
1989: 2nd qtr. 123 118 108 117 165 97 90 3rd qtr. 134 140 121 135 193 104 98 4th qtr. 129 139 121 127 171 95 87
1990: lst qtr. 105 126 95 86 150 80 68 2nd qtr. 121 132 105 115 182 89 77 3rd qtr. 132 153 120 131 200 95 81 4th qtr. 133 157 123 126 194 95 79
1991: lst qtr. 106 139 98 85 165 67 54 2nd qtr. 122 149 104 117 197 83 68
Basic Electrical metals, Fabricated and · Electrical
fabricated metal electronic and metal products, products, Consumer electronic Miscel-
products except professional electrical parts, laneous and non- machinery equipment and accessories manufac-electrical and and optical electronic and tu ring
Year/quarter machinery equipment goods products machinery industries
1985 88 88 89 86 100 88
1986 100 100 100 JOO JOO 100
1987 119 116 126 J36 134 113
1988 144 139 143 J36 159 120
1989 140 125 142 J3J J61 114
1990 129 JJJ 146 J33 162 111
1989: 2nd qtr. 144 J25 142 133 160 115 3rd qtr. 145 130 149 133 169 115 4th qtr. 138 127 145 129 167 116
1990: lst qtr. 117 J03 123 117 140 104 2nd qtr. 130 111 145 J32 164 109 3rd qtr. 130 110 153 137 167 114 4th qtr. 138 118 161 J44 175 118
1991: lst qtr. 119 JOO 134 122 J60 94 2nd qtr. 132 106 151 135 175 106
Note: Production indexes for 4 selected industry groups, 8 broad industry groups and "All manufacturing industries" are published. The indexes for the 4 selected industry groups, which carry larger weights and are major components of the respective broad industry groups, are shown in italics.
30 Ho11g Kong Monthly Digest of Statistics October 1991
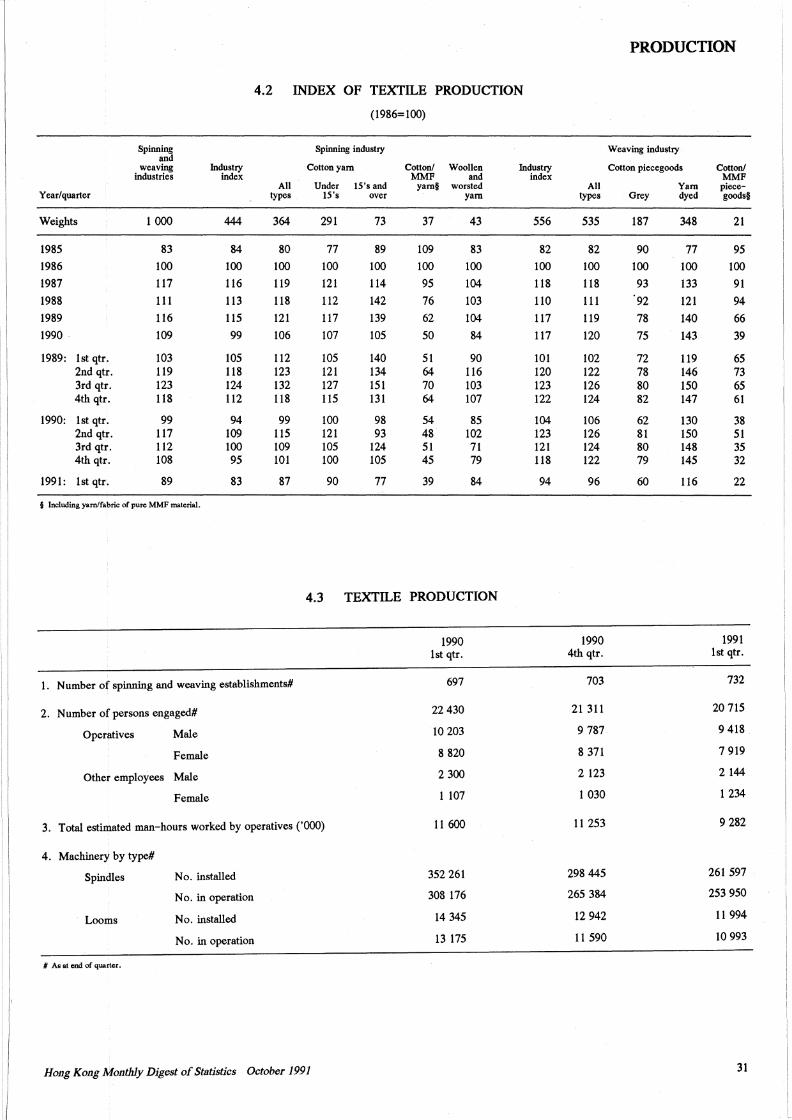
PRODUCTION
4.2 INDEX OF TEXTILE PRODUCTION
(1986=100)
Spinning and
Spinning industry Weaving industry
weaving Industry Cotton yam Cotton/ Woollen Industry Cotton piecegoods Cotton/ industries index MMF and index MMF
All Under 15's and yam§ worsted All Yam piece-Year/quarter types 15's over yam types Grey dyed goods§
Weights 1 OOO 444 364 291 73 37 43 556 535 187 348 21
1985 83 84 80 77 89 109 83 82 82 90 77 95
1986 100 100 100 100 100 100 100 100 100 100 100 100
1987 117 116 119 121 114 95 104 118 118 93 133 91
1988 111 113 118 112 142 76 103 110 111 92 121 94
1989 116 115 121 117 139 62 104 117 119 78 140 66
1990 109 99 106 107 105 50 84 117 120 75 143 39
1989: lst qtr. 103 105 112 105 140 51 90 101 102 72 119 65 2nd qtr. 119 118 123 121 134 64 116 120 122 78 146 73 3rd qtr. 123 124 132 127 151 70 103 123 126 80 150 65 4th qtr. 118 112 118 115 131 64 107 122 124 82 147 61
1990: lst qtr. 99 94 99 100 98 54 85 104 106 62 130 38 2nd qtr. 117 109 115 121 93 48 102 123 126 81 150 51 3rd qtr. 112 100 109 105 124 51 71 121 124 80 148 35 4th qtr. 108 95 101 100 105 45 79 118 122 79 145 32
1991: lst qtr. 89 83 87 90 77 39 84 94 96 60 116 22
§ Including yam/fabric of pure MMF material.
4.3 TEXTILE PRODUCTION
1990 1990 1991 lst qtr. 4th qtr. lst qtr.
I. Number of spinning and weaving establishments# 697 703 732
2. Number of persons engaged# 22 430 21 311 20 715
Operatives Male 10 203 9 787 9 418
Female 8 820 8 371 7 919
Other employees Male 2 300 2 123 2 144
Female 1 107 1 030 1 234
3. Total estimated man-hours worked by operatives ('OOO) 11 600 11 253 9 282
4. Machinery by type#
Spindles No. installed 352 261 298 445 261 597
No. in operation 308 176 265 384 253 950
Looms No. installed 14 345 12 942 11 994
No. in operation 13 175 11 590 10 993
# Ai at end of quarter.
Hong Kong Monthly Digest of Statistics October 1991 31
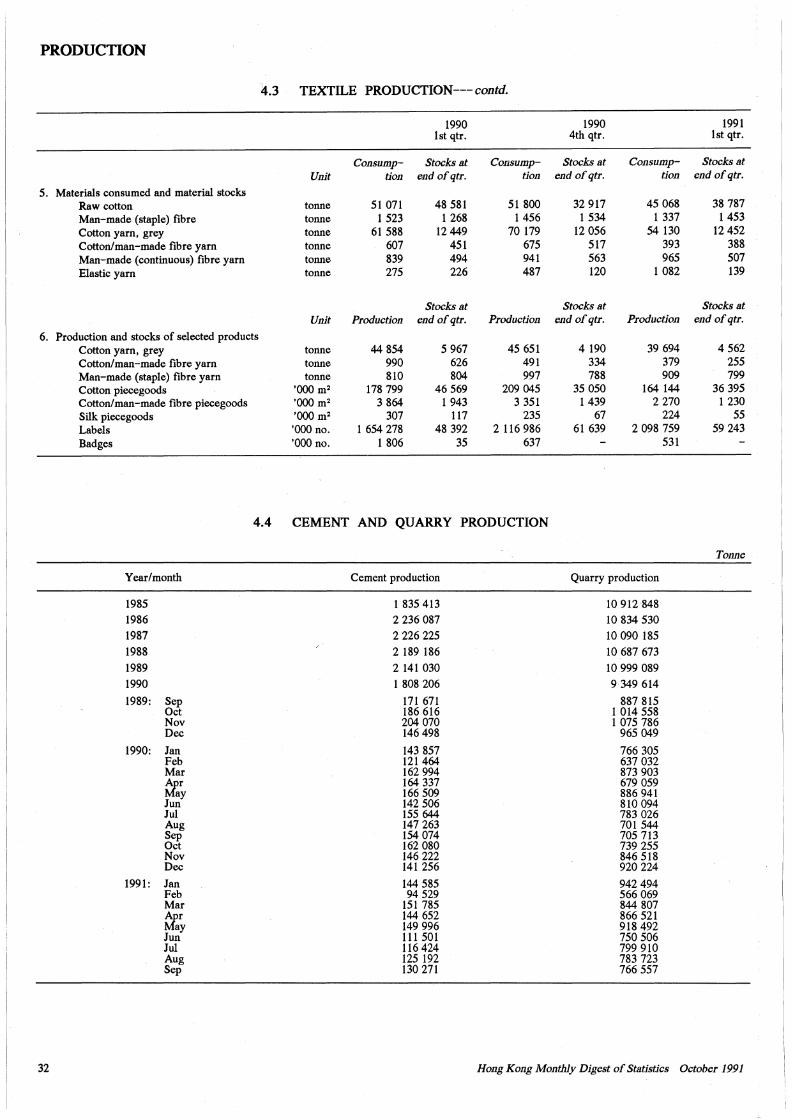
PRODUCTION
4.3 TEXTILE PRODUCTION--- contd.
1990 1990 1991 lst qtr. 4th qtr. lst qtr.
Consump- Stocks at Consump- Stocks at Consump- Stocks at Unit tion end ofqtr. tion end ofqtr. tion end ofqtr.
5. Materials consumed and material stocks Raw cotton tonne 51 071 48 581 51 800 32 917 45 068 38 787 Man-made (staple) fibre tonne 1 523 1 268 1 456 1 534 1 337 1 453 Cotton yarn, grey tonne 61 588 12 449 70 179 12 056 54 130 12 452 Cotton/man-made fibre yarn tonne 607 451 675 517 393 388 Man-made (continuous) fibre yarn tonne 839 494 941 563 965 507 Elastic yarn tonne 275 226 487 120 1 082 139
Stocks at Stocks at Stocks at Unit Production end ofqtr. Production end ofqtr. Production end ofqtr.
6. Production and stocks of selected products Cotton yarn, grey tonne 44 854 5 967 45 651 4 190 39 694 4 562 Cotton/man-made fibre yarn tonne 990 626 491 334 379 255 Man-made (staple) fibre yarn tonne 810 804 997 788 909 799 Cotton piecegoods 'OOO m2 178 799 46 569 209 045 35 050 164 144 36 395 Cotton/man-made fibre piecegoods 'OOO m2 3 864 1 943 3 351 1 439 2 270 l 230 Silk piecegoods 'OOO m2 307 117 235 67 224 55 Labels 'OOO no. 1654278 48 392 2 116 986 61 639 2 098 759 59 243 Badges 'OOO no. 1 806 35 637 531
4.4 CEMENT AND QUARRY PRODUCTION
Tonne
Year/month Cement production Quarry production
1985 1 835 413 10 912 848 1986 2 236 087 10 834 530 1987 2 226 225 10 090 185
1988 2 189 186 10 687 673
1989 2 141 030 10 999 089
1990 1 808 206 9 349 614
1989: Sep 171 671 887 815 Oct 186 616 1 014 558 Nov 204 070 1 075 786 Dec 146 498 965 049
1990: Jan 143 857 766 305 Feb 121 464 637 032 Mar 162 994 873 903 tfar 164 337 679 059
ay 166 509 886 941 Jun 142 506 810 094 Jui 155 644 783 026 Aug 147 263 701 544 Sep 154 074 705 713 Oct 162 080 739 255 Nov 146 222 846 518 Dec 141 256 920 224
1991: Jan 144 585 942 494 Feb 94 529 566 069 Mar 151 785 844 807
tfar 144 652 866 521 ay 149 996 918 492
Jun 111 501 750 506 Jui 116 424 799 910 Aug 125 192 783 723 Sep 130 271 766 557
32 Hong Kong Monthly Digest of Stlltistics October 1991
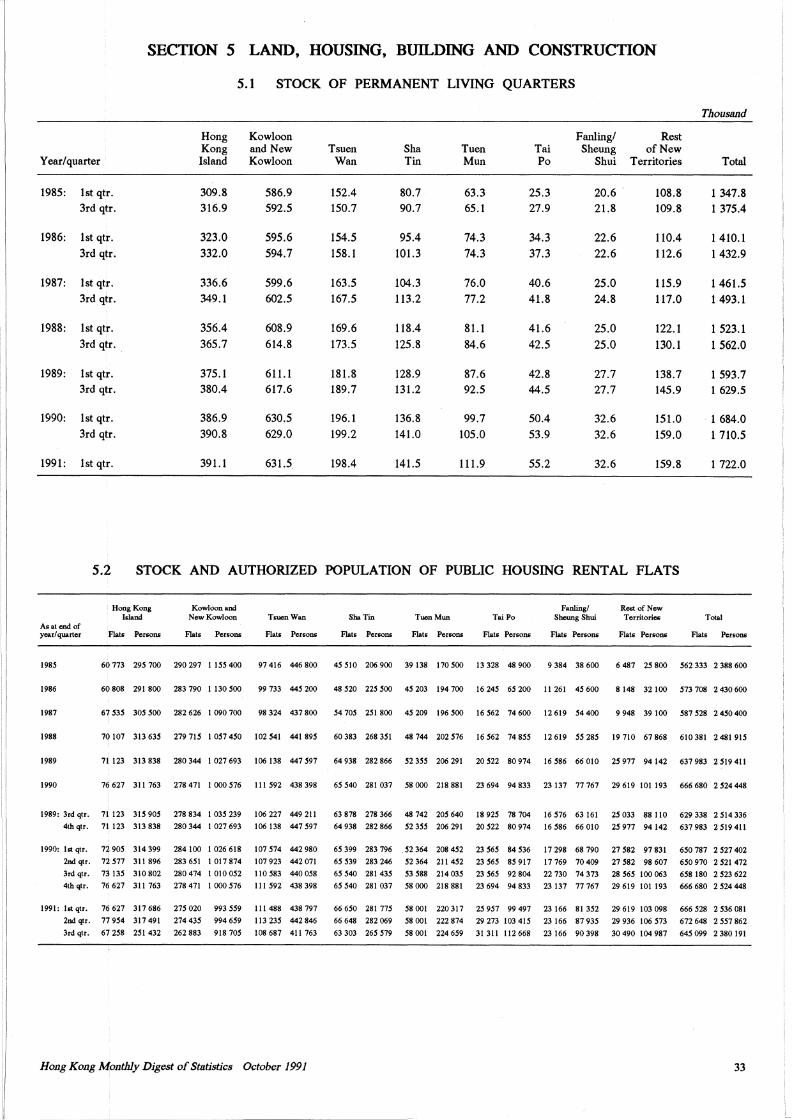
SECTION 5 LAND, HOUSING, BUILDING AND CONSTRUCTION
Year/quarter
1985: lst qtr. 3rd qtr.
1986: lst qtr. 3rd qtr.
1987: lst qtr. 3rd qtr.
1988: lst qtr.
3rd qtr.
1989: lst qtr. 3rd qtr.
1990: lstqtr.
3rd qtr.
1991: lst qtr.
Hong Kong Island
309.8 316.9
323.0 332.0
336.6 349.1
356.4 365.7
375.l 380.4
386.9 390.8
391.1
5.1 STOCK OF PERMANENT LIVING QUARTERS
Kowloon and New Kowloon
586.9 592.5
595.6 594.7
599.6 602.5
608.9 614.8
611.1 617.6
630.5
629.0
631.5
Tsuen Wan
152.4 150.7
154.5 158.1
163.5 167.5
169.6
173.5
181.8 189.7
196.1
199.2
198.4
Sha Tin
80.7 90.7
95.4 101.3
104.3 113.2
118.4
125.8
128.9 131.2
136.8 141.0
141.5
Tu en Mun
63.3 65.1
74.3 74.3
76.0 77.2
81.1 84.6
87.6 92.5
99.7
105.0
111.9
Tai Po
25.3 27.9
34.3 37.3
40.6 41.8
41.6 42.5
42.8 44.5
50.4
53.9
55.2
Fanling/ Sheung
Shui
20.6 21.8
22.6 22.6
25.0 24.8
25.0
25.0
27.7 27.7
32.6 32.6
32.6
Rest of New
Territories
108.8 109.8
110.4 112.6
115.9 117.0
122.1
130.1
138.7 145.9
151.0 159.0
159.8
5.2 STOCK AND AUTHORIZED POPULATION OF PUBLIC HOUSING RENTAL FLATS
As at end of year/ quarter
Hong Kong Joland
Flats Persom;:
Kowloon and New Kowloon
Flats Persons
Tsucn Wan Sha Tin
Flats Persons Flats Persons
TucnMun Tai Po
Flati; Persons Flats Persons
Fanling/ Shcung Shui
Flats Persons
Re.stofNew Territories
Flats Persons
Thousand
Total
1 347.8 1 375.4
1 410.1 1432.9
1 461.5 1 493.1
1 523.1
1 562.0
1 593.7 1 629.5
1 684.0
1 710.5
1 722.0
Total
Flats Persons
198S 60773 29S700 290297 l ISS400 97416 446800 4SSIO 206900 39138 170SOO 13328 48900 9384 38600 6487 2S800 S62333 2388600
1986 60 808 291 800 283 790 1130 SOO 99 733 44S 200 48 S20 22S SOO 4S 203 194 700 16 24S 6S 200 11 261 4S 600 8 148 32100 S73 708 2 430 600
1987 67S3S 30SSOO 282626 I 090700 98324 437800 S470S 2Sl 800 4S209 196SOO 16S62 74600 12619 S4400 9948 39100 S87S28 24S0400
1988 70107 31363S 27971S 10574SO 102S41 44189S 60383 2683Sl 48744 202S76 16S62 74855 12619 SS285 19710 67868 610381 248191S
1989 71 123 313 838 280 344 I 027 693 106 138 447 S97 64 938 282 866 52 35S 206 291 20 S22 80 974 16 S86 66 010 2S 977 94142 637 983 2 S19 411
1990 76627 311763 278471 I 000576 Ill 592 438398 65540 281037 58000 218881 23694 94833 23137 77767 29619 101193 666680 2S24448
1989: 3rdqtr. 71123 31590S 278834 103S239 106227 449211 63878 278366 48742 205640 1892S 78704 16576 63161 2S033 88110 629338 2Sl4336
4th qtr. 71 123 313 838 280 344 I 027 693 106 138 447 597 64 938 282 866 52 3S5 206 291 20 S22 80 974 16 S86 66 010 25 977 94 142 637 983 2 519 411
1990: htqtr. 72905 314399 284100 1026618 107574 442980 65399 283796 52364 208452 23S65 84S36 17298 68790 27582 97831 650787 2527402
2ndqtr. 72S77 311896 2836Sl I 017874 107923 442071 65539 283246 S2364 2114S2 23565 85917 17769 70409 27S82 98607 650970 2S21472
3rd qtr. 7J 13S 310 802 280 474 I 010 052 110 583 440 058 65 540 281 435 S3 588 214 03S 23 565 92 804 22 730 74 373 28 56S 100 063 658 180 2 S23 622
4th qtr. 76 627 311 763 278 471 I OOO 576 111 592 438 398 6S S40 281 037 58 OOO 218 881 23 694 94 833 23 137 77 767 29 619 101193 666 680 2 524 448
1991: lstqtr. 76627 317686 275020 9935S9 111488 438797 66650 281775 58001 220317 25957 99497 23166 81352 29619 103098 666528 2536081
2nd qtr. 77 954 317 491 274 435 994 659 113 235 442 846 66 648 282 069 58 001 222 874 29 273 103 415 23 166 87 935 29 936 106 573 672 648 2 557 862
3rd qtr. 67 258 251 432 262 883 918 705 108 687 411 763 63 303 265 519 58 001 224 659 31 311 112 668 23 166 90 398 30 490 104 987 645 099 2 380 191
Hong Kong Monthly Digest of St11tistics October 1991 33
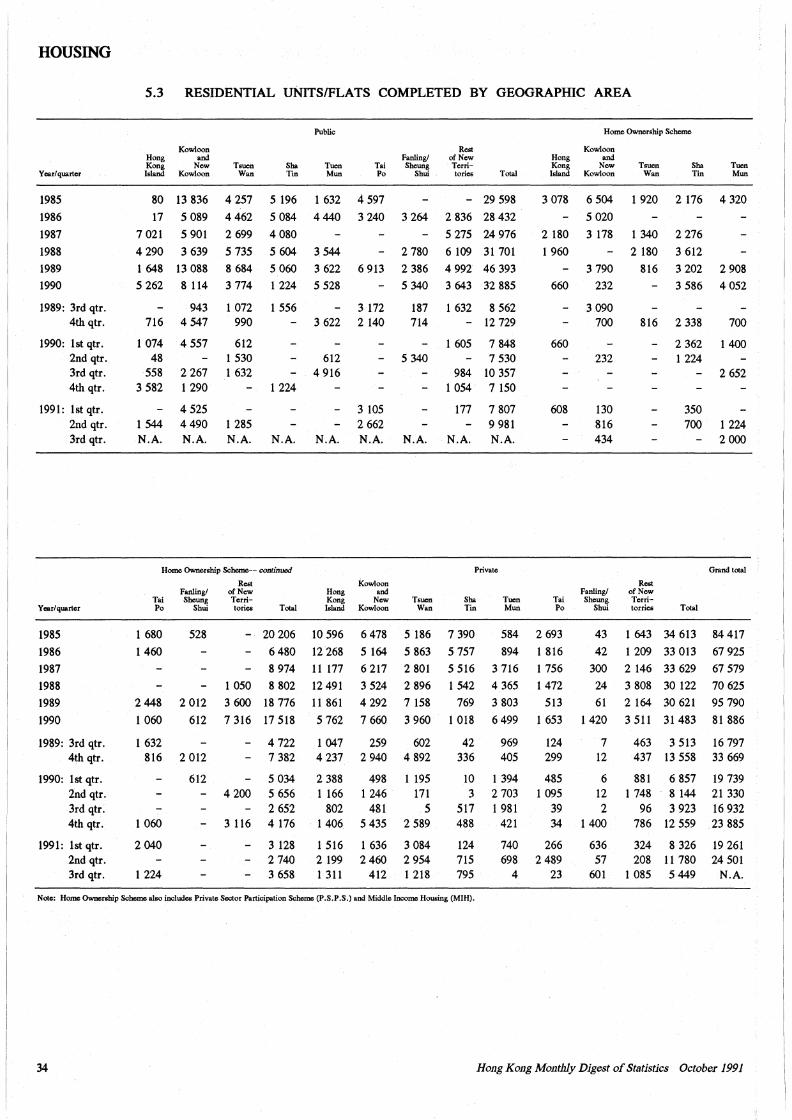
HOUSING
Year/ quarter
1985
1986
1987
1988
1989
1990
1989: 3rd qtr. 4th qtr.
1990: lst qtr. 2nd qtr. 3rd qtr. 4th qtr.
1991: lst qtr. 2nd qtr. 3rd qtr.
Year/ quarter
1985
1986
1987
1988
1989
1990
1989: 3rd qtr. 4th qtr.
1990: lst qtr. 2nd qtr. 3rd qtr. 4th qtr.
1991: lst qtr. 2nd qtr. 3rd qtr.
5.3 RESIDENTIAL UNITS/FLATS COMPLETED BY GEOGRAPHIC AREA
Public
Kowloon Rest Hong and Fanling/ of New Kong New Tsuen
Wan Sha Tin
Tuen Mun
Tai Sbeung Terri-Island Kowloon Po Shui tories Total
80 13 836
17 5 089
7 021 5 901
4 290 3 639
1 648 13 088
5 262 8 114
943 716 4 547
1 074 48
558 3 582
1 544 N.A.
4 557
2 267 1290
4 525 4 490 N.A.
4 257
4462
2 699
5 735
8 684
3 774
1 072 990
612 1 530 1 632
1 285 N.A.
5 196 l 632
5 084 4 440
4 080
5 604 3 544
5 060 3 622
1 224 5 528
4 597
3 240
6 913
1 556 3 172
1 224
N.A.
3 622 2 140
612 4 916
N.A.
3 105 2 662 N.A.
Home Ownership Scheme-- continued
Rest Kowloon Fanling/ of New Hong and
Tai Sheung Terri- Kong New Po Shui tories Total Island Kowloon
3 264
2 780
2 386
5 340
187 714
5 340
N.A.
Tsuen Wan
- 29 598
2 836 28 432
5 275 24 976
6 109 31 701
4 992 46 393
3 643 32 885
1 632 8 562 - 12 729
1 605
984 1 054
177
N.A.
7 848 7 530
10 357 7 150
7 807 9 981 N.A.
Private
Sha Tuen Tin Mun
Home Ownership Scheme
Kowloon Hong and Kong New Island Kowloon
3 078
2 180
1 960
660
660
608
6 504
5 020
3 178
3 790
232
3 090 700
232
130 816 434
Tsuen Wan
l 920
1 340
2 180
816
Sha Tin
2 176
2 276
3 612
3 202
3 586
816 2 338
2 362 1 224
Rest
350 700
Fanling/ of New Tai Sheung Terri-Po Shui lorries Total
Tuen Mun
4 320
2 908
4 052
700
1400
2 652
1 224 2 OOO
Grand total
1 680
1460
528 - 20 206 10 596 6 478 5 186 7 390 584 2 693 43 1 643 34 613 84 417
2448
1 060
1 632 816
1 060
2 040
1 224
2 012
612
2 012
612
1 050
6480
8 974
8 802
3 600 18 776
7 316 17 518
4 200
3 116
4 722 7 382
5 034 5 656 2 652 4 176
3 128 2 740 3 658
12 268
11 177
12 491
5 164
6 217
3 524
5 863
2 801
2 896
11 861 4 292 7 158
5 762 7 660 3 960
1 047 259 602 4 237 2 940 4 892
2 388 1 166
802 1 406
1 516 2 199 1 311
498 1 246
481 5 435
1 636 2460
412
1 195 171
5 2 589
3 084 2 954 1 218
5 757
5 516
1 542 769
l 018
42 336
10 3
517 488
124 715 795
894
3 716
4 365
3 803
6 499
969 405
l 394 2 703 l 981
421
740 698
4
l 816
1 756
1472
513
1 653
124 299
485 l 095
39 34
266 2 489
23
42
300
24
61
l 420
7 12
6 12 2
1400
636 57
601
1 209 33 013
2 146 33 629
3 808 30 122
67 925
67 579
70 625
2 164 30 621 95 790
3511 31483 81886
463 3 513 16 797 437 13 558 33 669
881 6 857 1 748 8 144
96 3 923 786 12 559
324 8 326 208 11 780
1 085 5 449
19 739 21 330 16 932 23 885
19 261 24 501
N.A.
Note: Home Ownership Scheme also includes Private Sector Participation Scheme (P.S.P.S.) and Middle Income Housing (MIH).
34 Hong Kong Montlzly Digest of Statistics October 1991
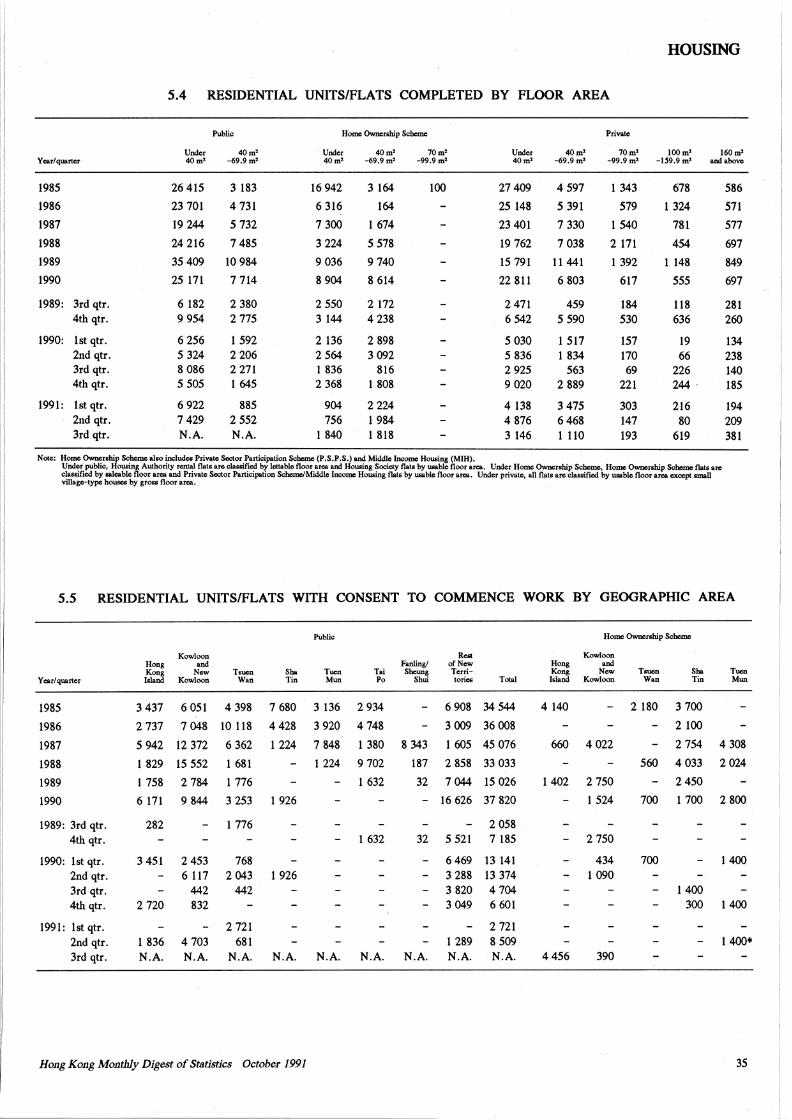
5.5 RESIDENTIAL UNITS/FLATS WITH CONSENT TO COMMENCE WORK BY GEOGRAPHIC AREA
Public Home Owncrobip Scheme
Kowloon Rat Kowloon Hong and Fanling/ of Now Hong and Kong Now T..- Sha Tucn Tai Shcung Torri- Kong New T..- Sha Tuen
Year/quarter Island Kowloon Wan Tin Mun Po Shui torie& Total Island Kowloon Wan Tin Mun
1985 3 437 6 051 4 398 7 680 3 136 2 934 6908 34544 4 140 2 180 3 700
1986 2 737 7 048 10 118 4428 3 920 4 748 3009 36008 2 100
1987 5 942 12 372 6 362 1 224 7 848 1380 8 343 1 605 45 076 660 4022 2 754 4 308
1988 1 829 15 552 1 681 1224 9 702 187 2 858 33 033 560 4033 2024
1989 1 758 2 784 1 776 1 632 32 7044 15 026 1402 2 750 2450
1990 6 171 9 844 3 253 1 926 - 16 626 37 820 1524 700 1 700 2 800
1989: 3rd qtr. 282 1 776 2 058 4th qtr. 1 632 32 5 521 7 185 2 750
1990: lst qtr. 3 451 2 453 768 6469 13 141 434 700 1400 2nd qtr. 6117 2043 1926 3 288 13 374 1 090 3rd qtr. 442 442 3 820 4 704 1400 4th qtr. 2 720 832 3 049 6 601 300 1400
1991: lst qtr. 2 721 2 721 2nd qtr. 1 836 4 703 681 1289 8 509 1400• 3rd qtr. N.A. N.A. N.A. N.A. N.A. N.A. N.A. N.A. N .. A. 4456 390
Hong Kong Monthly Digest of Statistics October 1991 35
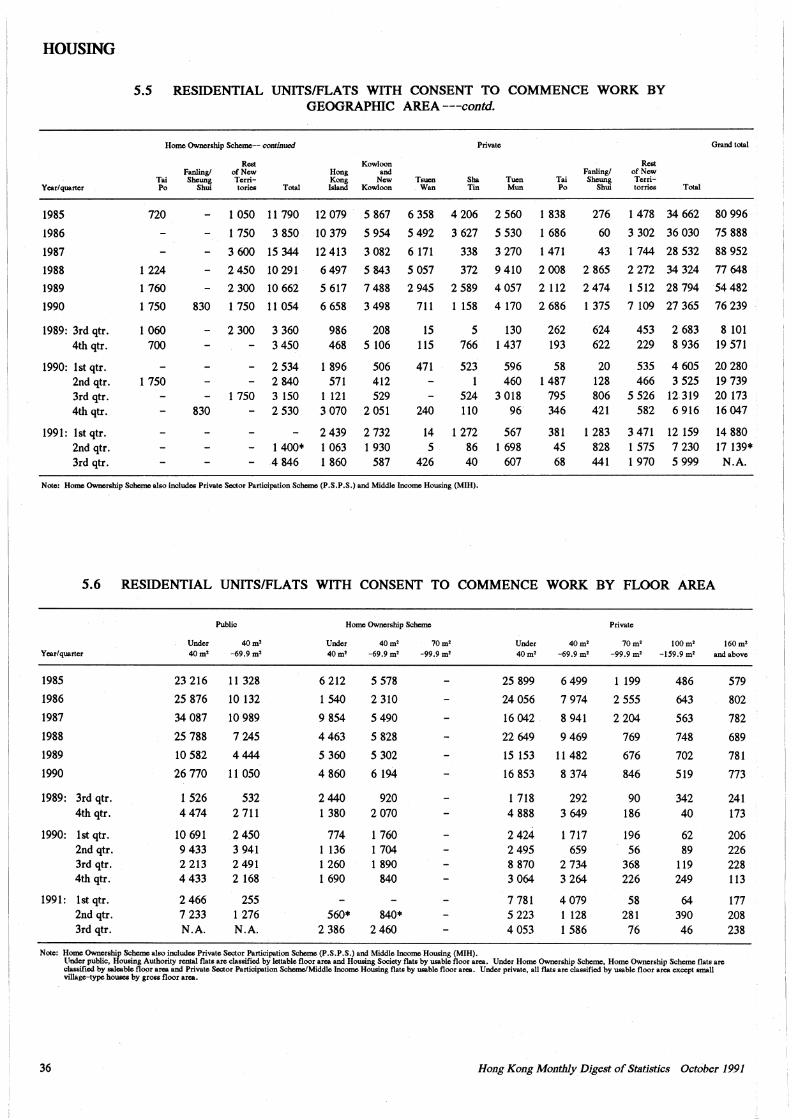
HOUSING
Year/quarter
1985
1986
1987
1988
1989
1990
1989: 3rd qtr. 4th qtr.
1990: lst qtr. 2nd qtr. 3rd qtr. 4th qtr.
1991: lst qtr. 2nd qtr. 3rd qtr.
S.S RESIDENTIAL UNITS/FLATS WITH CONSENT TO COMMENCE WORK BY
Home Owncrsbip Scheme- con1inuod
Reot Fanling/ of Now
Tai Shcung Tcrri-Po Shui torieo Total
GEOGRAPIDC AREA ---contd.
Kowloon Hong and Kong Now Island Kowloon
Tsuon Wan
Private
Sha Tin
Tucn Mun
Reot Fanling/ of Now
Tai Shcung Terri-Po Shui lorries
Grand total
Total
720 1 050 11 790 12 079 5 867 6 358 4 206 2 560 1 838 276 1 478 34 662 80 996
1224
1 760
1 750
1 060 700
1 750
830
830
1 750 3 850 10 379 5 954 5 492 3 627 5 530 1 686
3 600 15 344
2 450 10 291
2 300 10 662
1 750 11 054
2 300
1 750
3 360 3 450
2 534 2 840 3 150 2 530
1400• 4 846
12 413
6497
5 617
6 658
3 082
5 843
7 488
3 498
986 208 468 5 106
1 896 571
1 121 3 070
2439 1 063 1 860
506 412 529
2 051
2 732 1 930
587
6 171
5 051
2945
711
15 115
471
240
14 5
426
338
372
2 589
1 158
5 766
523 1
524 110
1272 86 40
3 270
9 410
4057
4 170
130 1437
596 460
3 018 96
567 1 698
607
1471
2 008
2 112
2 686
262 193
58 1487
795 346
381 45 68
60 3 302 36 030 75 888
43
2 865
2474
1 375
624 622
20 128 806 421
1 283 828 441
1 744 28 532 88 952
2 272 34 324 77 648
1 512 28 794 54 482
7 109 27 365 76 239
453 229
2 683 8 936
535 4 605 466 3 525
5 526 12-319 582 6 916
3 471 12 159 1 575 7 230 1 970 5 999
8 101 19 571
20280 19 739 20 173 16 047
14 880 17 139*
N.A.
Note: Home Ownership Scbemealso iDoludeo Private Sector ParticipotionScbomo (P.S.P.S.) and Middle Income Housing (MIH).
S.6 RESIDENTIAL UNITS/FLATS WITH CONSENT TO COMMENCE WORK BY FLOOR AREA
Public Home Ownership Scbomo Private
Under 40m2 Under 40 m2 70 m2 Under 40m' 70m' IOOm' 160m' Year/quarter 40 m2 -69.9 m' 40 m2 -69.9 m2 -99.9 m' 40 m' -69.9 m' -99.9 m' -159.9 m' and above
1985
1986
1987
1988
1989
1990
1989: 3rd qtr. 4th qtr.
1990: lst qtr. 2nd qtr. 3rd qtr. 4th qtr.
1991: lstqtr. 2nd qtr. 3rd qtr.
23 216
25 876
34087
25 788
10 582
26 770
1526 4474
10 691 9433 2 213 4433
2466 7 233 N.A.
11 328
10 132
10 989
7 245
4444
11 050
532 2 711
2450 3 941 2 491 2 168
255 1276 N.A.
6 212
1540
9 854
4463
5 360
4 860
2440 1 380
774 1 136 1260 1 690
560• 2 386
5 578
2 310
5 490
5 828
5 302
6194
920 2070
1 760 1 704 1 890
840
840• 2460
25 899
24056
16 042
22 649
15 153
16 853
1 718 4 888
2424 2495 8 870 3 064
7 781 5 223 4 053
6499
7 974
8 941
9 469
11482
8 374
292 3 649
1 717 659
2 734 3 264
4 079 1 128 1 586
1 199
2 555
2 204
769
676
846
90 186
196 56
368 226
58 281 76
486
643
563
748
702
519
342 40
62 89
119 249
64 390 46
Note: Homo Owncrsbip Scheme also iDoludeo Private Sector Participation Scbomo (P .S .P .S.) and Middle Income Housing (MIH). Under public, Housing Authority rental flat& arc clas&ified by lcttable floor area and Housing Society flats by JJAblc floor area. Under Home Ownership Scheme, Home Ownership Scheme flats arc clas.Uied by saleable floor area and Private Sector Participation Schomo/Middlc Income Housing flats by usable floor area. Under private, all flat• arc classified by usable floor area exCcpt small village-type houoo& by grou floor area.
579
802
782
689
781
773
241 173
206 226 228 113
177 208 238
36 Hong Kong Monthly Digest of Statistics October 1991
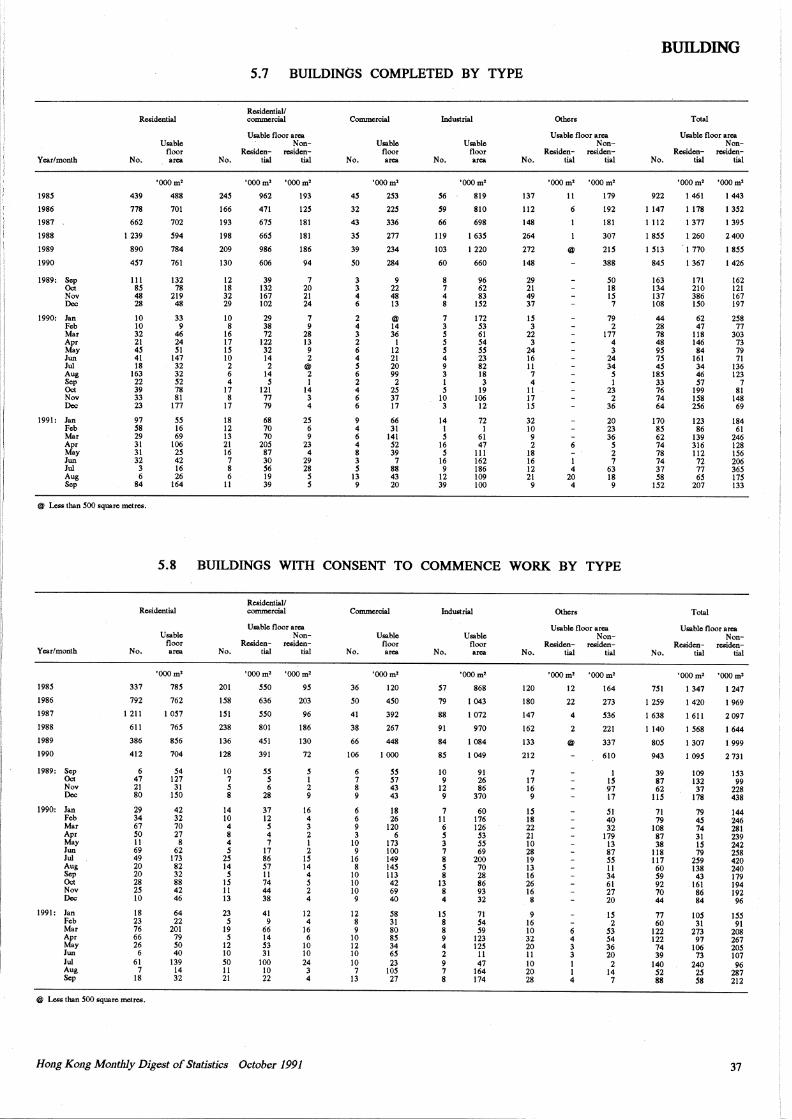
S.7 BUILDINGS COMPLETED BY TYPE
Year/monlh
198S
1986
1987
1988
1989
1990
1989: Sep Oct Nov Dec
1990: Jan Feb Mar Apr May Jun Jui Aug Sep Oct Nov Dec
1991: Jan Feb Mar Apr May Jun Jui Aug Sep
Re&idcmtial
No.
439
778
662
1239
S90
4S1
Ill SS 4S 28
10 10 32 21 4S 41 IS
163 22 39 33 23
91 SS 29 31 31 32
3 6
S4
Usable floor area
•ooom2
4SS
701
702
S94
784
761
132 7S
219 4S
33 9
46 24 SI
147 32 32 S2 7S SI
177
SS 16 69
106 25 42 16 26
164
@ Less than SOO square metres.
Usable floor area Non-
Residen- residen-No. tial tial
24S
166
193
19S
209
130
12 IS 32 29
10 s
16 17 IS 10 2 6 4
17 s
17
IS 12 13 21 16 1 s 6
II
'OOO m2 "OOO tn.2
962
471
61S
66S
9S6
606
39 132 167 102
29 3S 72
122 32 14 2
14 s
121 11 79
68 70 70
20S S7 30 S6 19 39
193
125
ISI
ISI
IS6
94
1 20 21 24
1 9
28 13 9 2
@ 2 I
14 3 4
25 6 9
23 4
29 2S s s
No.
45
32
43
3S
39
so 3 3 4 6
2 4 3 2 6 4 5 6 2 4 6 6
9 4 6 4 s 3 s
13 9
Usable floor area
•ooom2
2S3
22S
336
277
234
284
9 22 4S 13
@ 14 36
I 12 21 20 99
2 25 37 17
66 31
141 S2 39 1
SS 43 20
Industrial
Usable floor
No. area
56
S9
66
119
103
60
s 1 4 s 1 3 s 5 s 4 9 3 I s
10 3
14 I s
16 s
16 9
12 39
•ooom2
Sl9
SIO
69S
I 63S
1220
660
96 62 S3
IS2
172 S3 61 S4 SS 23 S2 IS 3
19 106
12
72 I
61 47
Ill 162 IS6 109 100
Others
Usable floor area Non-
Residen- residen-No. tial tial
137
112
148
264
272
14S
29 21 49 37
IS 3
22 3
24 16 II 1 4
II 17 IS
32 10 9 2
IS 16 12 21 9
'000m2 '000m2
II
6
I
@
6
I 4
20 4
179
192
ISI
307
21S
3SS
so IS IS 1
79 2
177 4 3
24 34
5 I
23 2
36
20 23 36 s 2 1
63 IS 9
5.8 BUILDINGS WITH CONSENT TO COMMENCE WORK BY TYPE
Year/mon1h
19SS
19S6
19S7
19SS
19S9
1990
1989: Sep Oct Nov Dec
1990: Jan Feb Mar Apr May Jun Jui Aug
~ Nov Dec
1991: Jan Feb Mar Apr May Jun Jui Aug Sep
Residcolial
No.
337
792
I 211
611
3S6
412
6 47 21 80
29 34 67 50 II 69 49 20 20 28 2S 10
18 23 16 66 26 6
61 1
18
Usable floor area
'000m2
18S
762
I OS7
16S
8S6
704
S4 127 31
ISO
42 32 70 27 8
62 173 82 32 S8 42 46
64 22
201 19 so 40
139 14 32
@ Less thaii SOO square metres.
Usable floor area Non-
Residen- residen-No. tial tia1
201
IS8
ISI
238
136
128
10 1 s 8
14 10 4 s 4 5
2S 14 s
IS II 13
23 s
19 s
12 10 so II 21
'000m2 '000m2
sso 636
sso SOI
4SI
391
S5 5 6
2S
37 12 s 4 1
17 86 51 II 74 44 3S
41 9
66 14 S3 31
100 10 22
9S
203
96
IS6
130
72
s I 2 9
16 4 3 2 I 2
15 14 4 s 2 4
12 4
16 6
10 10 24 3 4
Hong Kong Monthly Digest of Statistics October 1991
Commercial
Usable floor
No. area
36
so 41
3S
66
106
6 1 s 9
6 6 9 3
10 9
16 s
10 10 10 9
12 s 9
10 12 10 10 1
13
'000m2
120
4SO
392
267
448
I OOO
SS S1 43 43
IS 26
120 6
173 100 149 14S 113 42 69 40
SS 31 so SS 34 6S 23
IOS 27
Industrial
Usable floor
No. area
S1
19
8S
91
S4
SS
10 9
12 9
1 II 6 s 3 1 s 5 s
13 s 4
IS s s 9 4 2 9 1 s
•ooom2
S6S
I 043
I 072
970
I 084
I 049
91 26 S6
370
60 176 126 S3 SS 69
200 10 2S S6 93 32
71 S4 S9
123 125 II 47
164 174
Others
Usable floor area Non-
Residen- residen-No. tial tial
120
ISO
147
162
133
212
1 17 16 9
IS IS 22 21 10 28 19 13 16 26 16 s 9
16 10 32 20 II 10 20 28
'000m2 '000m2
12
22
4
2
@
6 4 3 3 I I 4
164
273
S36
221
337
610
I IS 91 17
51 40 32
179 13 S7 SS II 34 61 27 20
IS 2
S3 S4 36 20 2
14 1
BUILDING
Total
Usable floor area Non-
Residen- residen-No. tial tial
922
1147
I 112
I SSS
I Sl3
S4S
163 134 137 IOS
44 2S 7S 4S 9S 1S 4S
ISS 33 16 74 64
170 SS 62 74 78 14 37 SS
IS2
'OOO m2 'OOO m2
I 461
I 17S
1377
1260
I 770
1367
171 210 3S6 ISO
62 47
118 146 S4
161 34 46 S1
199 ISS 2S6
123 S6
139 316 112 72 11 6S
207
Total
1443
I 3S2
I 39S
2400
I SSS
1426
162 121 167 197
2SS 11
303 73 79 71
136 123
1 SI
148 69
IS4 61
246 12S IS6 206 365 11S 133
Usable floor area Non-
Residen- residen-No. tial tial
1SI
I 2S9
1638
1140
SOS
943
39 S7 62
llS
71 19
108 S7 3S
llS 117 60 S9 92 10 44
11 60
122 122 74 39
140 52 SS
'000m2 '000m1
1347
1420
I 611
I S6S
1307
I 09S
109 132 37
178
19 4S 74 31 IS 79
2S9 13S 43
161 S6 S4
IOS 31
273 97
106 73
240 25 5S
1247
1969
2097
1644
1999
2 731
IS3 99
228 43S
144 246 281 239 242 2ss 420 240 179 194 192 96
ISS 91
208 267 20S 107 96
287 212
37
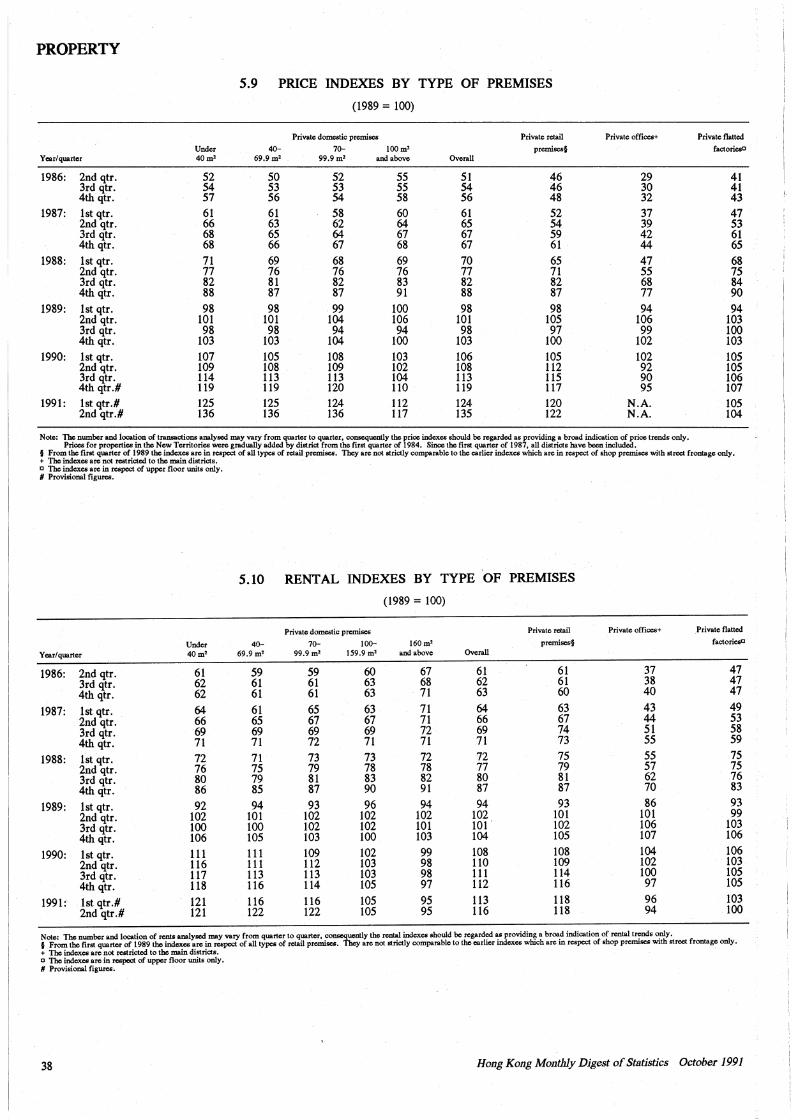
PROPERTY
5.9 PRICE INDEXES BY TYPE OF PREMISES
(1989 = 100)
Private domestic premiSC8 Private retail Private office&+ Private flatted
Under 40- 70- 100m2 premises§ facton-Year/quarter 40m2 69.9m2 99.9m2 and above Overall
1986: 2nd qtr. S2 so S2 SS Sl 46 29 41 3rd qtr. S4 S3 S3 SS 54 46 30 41 4th qtr. S7 S6 S4 S8 S6 48 32 43
1987: lst qtr. 61 61 S8 60 61 S2 37 47 2nd qtr. 66 63 62 64 6S 54 39 S3 3rd qtr. 68 6S 64 67 67 S9 42 61 4th qtr. 68 66 67 68 67 61 44 6S
1988: lst qtr. 71 69 68 69 70 6S 47 68 2nd qtr. 77 76 76 76 77 71 SS 7S 3rd qtr. 82 81 82 83 82 82 68 84 4th qtr. 88 87 87 91 88 87 77 90
1989: lst qtr. 98 98 99 100 98 98 94 94 2nd qtr. 101 101 104 106 101 lOS 106 103 3rd qtr. 98 98 94 94 98 97 99 100 4th qtr. 103 103 104 100 103 100 102 103
1990: lst qtr. 107 lOS 108 103 106 lOS 102 lOS 2nd qtr. 109 108 109 102 108 112 92 lOS 3rd qtr~ 114 113 113 104 113 llS 90 106 4th qtr.# 119 119 120 110 119 117 9S 107
1991: lst qtr.# 12S 12S 124 112 124 120 N.A. lOS 2nd qtr.# 136 136 136 117 13S 122 N.A. 104
Noic: The number and location of IIamactions analysed may vary from quarter to quarter. conscqucnlly the price indexes should be regarded as providing a broad indication of price trends only. Prices for properties in the New Territories were gradually added by diBtrict from thc fint quarter of 1984. Since the fint quarter of 1987, all diBtricts have been included. ! ~ ~~::';"~=t:.-them::: ~~~of all typos of retail premises. They arc not &trictly oompsrable to the earlier indexes which arc in respect of shop premises with &treet fronlage only.
a The indexes are in respect of upper floor units only. II Provisional figu..,..
5.10 RENT AL INDEXES BY TYPE OF PREMISES
(1989 = 100)
Private domestic premises Private retail Private offices+ Private flattod
Under 40- 70- 100- 160m' premisos§ facton-
Year/quarter 40m2 69.9m2 99.9m2 IS9.9m2 and above Overall
1986: 2nd qtr. 61 S9 S9 60 67 61 61 37 47 3rd qtr. 62 61 61 63 68 62 61 38 47 4th qtr. 62 61 61 63 71 63 60 40 47
1987: lst qtr. 64 61 6S 63 71 64 63 43 49 2nd qtr. 66 6S 67 67 71 66 67 44 S3 3rd qtr. 69 69 69 69 72 69 74 Sl S8 4th qtr. 71 71 72 71 71 71 73 SS S9
1988: lst qtr. 72 71 73 73 72 12 7S SS 7S 2nd qtr. 76 7S 79 78 78 77 79 S7 7S 3rd qtr. 80 79 81 83 82 80 81 62 76 4th qtr. 86 8S 87 90 91 87 87 70 83
1989: lst qtr. 92 94 93 96 94 94 93 86 93 2nd qtr. 102 101 102 102 102 102 101 101 99 3rd qtr. 100 100 102 102 101 101' 102 106 103 4th qtr. 106 lOS 103 100 103 104 lOS 107 106
1990: lst qtr. 111 111 109 102 99 108 108 104 106 2nd qtr. 116 111 112 103 98 110 109 102 103 3rd qtr. 117 113 113 103 98 111 114 100 lOS 4th qtr. 118 116 114 lOS 97 112 116 97 lOS
1991:' lst qtr.# 121 116 116 lOS 9S 113 118 96 103 2nd qtr.# 121 122 122 lOS 9S 116 118 94 100
Noto: The mimber and location of rents analysed may vary from quarter to quarter, conseq.-Jy the rental indexes should be regarded as providing a broad indication of rental trends only. f From the fint quarter of 1989 the indexes are in respect of all typos of retail premises. They arc not &trictly compsrable to the earlier indexes which are in respect of shop premises with &tree! frontage only. + The indexes arc not re&tricted to the main diBtricts. a The indexes are in respect of upper floor units only. II Provisional figu.....
38 Hong Kong Monthly Digest of Statistics October 1991
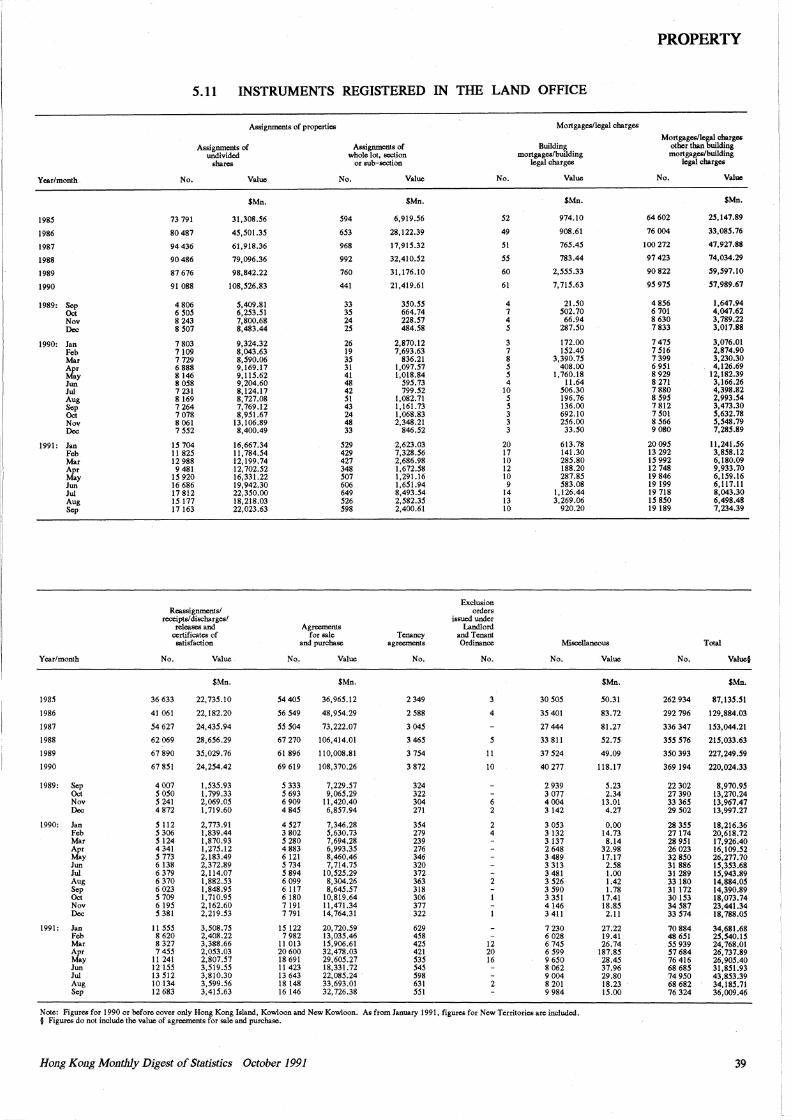
PROPERTY
5.11 INSTRUMENTS REGISTERED IN THE LAND OFFICE
Assignments of properties Mortgages/legal charges
Mortgages/legal charges Assignments of Assignments of Building other than building
undivided whole lot, section mortgages/building mortgages/building shares or sub-section legal charges legal charges
Year/month No. Value No. Value No. Value No. Value
$Mn. $Mn. $Mn. $Mn.
198S 73 791 31,308.S6 S94 6,919.S6 S2 974.10 64 602 2S,147.89
1986 80 487 4S,SOl.3S 6S3 28,122.39 49 908.61 76004 33,08S.76
1987 94 436 61,918.36 968 17,91S.32 SI 16S.4S 100 272 47,927.88
1988 90 486 79,096.36 992 32,410.S2 55 783.44 97 423 74,034.29
1989 87 676 98,842.22 760 31,176.10 60 2,SSS.33 90822 S9,S91.IO
1990 91 088 108,S26.83 441 21,419.61 61 7,71S.63 9S 915 57,989.67
1989: Sep 4806 5,409.81 33 3SO.SS 4 21.50 4 856 1,647.94 Oct 6 SOS 6,2S3.51 3S 664.74 7 S02.70 6 701 4,047.62 Nov 8 243 7,800.68 24 228.S? 4 66.94 8 630 3, 789.22 Dec 8 SO? 8,483.44 2S 484.S8 5 287.SO 7 833 3,017.88
1990: Jan 7 803 9,324.32 26 2,870.12 3 172.00 7 475 3,076.01 Feb 7 109 8,043.63 19 7,693.63 7 152.40 7 Sl6 2,874.90 Mar 7729 8,S90.06 35 836.21 8 3,390.?S 7 399 3,230.30 Apr 6 888 9,169.17 31 1,091.S? s 408.00 6 9SI 4,126.69 May 8 146 9, l15.62 41 1,018.84 s 1,760.18 8 929 12,182.39 Jun 8 OS8 9,204.60 48 S9S.13 4 11.64 8 271 3,166.26 Jui 7 231 8,124.17 42 799.S2 10 S06.30 7 880 4,398.82 Aug 8 169 8, 727.08 SI 1,082.71 s 196.76 8 59S 2,993.S4 Sep 7 264 7,769.12 43 l,161.73 s 136.00 7812 3,473.30 Oct 7 078 8,9Sl.67 24 1,068.83 3 692.10 7 SOI S,632.78 Nov 8 061 13,106.89 48 2,348.21 3 2S6.00 8 S66 S,S48.19 Dec 7 SS2 8,400.49 33 846.S2 3 33.50 9 080 7,28S.89
1991: Jan IS 704 16,667.34 S29 2,623.03 20 613.78 2009S 11,241.56 Feb ll 82S ll,784.S4 429 7,328.S6 17 141.30 13 292 3,8S8.l2 Mar 12 988 12,199.74 427 2,686.98 10 28S.80 IS 992 6,180.09 Apr 9 481 12, 702.S2 348 l,672.58 12 188.20 12 748 9,933.70 May 15 920 16,331.22 SO? 1,291.16 10 287.8S 19 846 6,lS9.16 Jun 16 686 19,942.30 606 l ,6Sl.94 9 S83.08 19 199 6,l17.ll Jui 17 812 22,3SO.OO 649 8,493.S4 14 1,126.44 19 718 8,043.30 Aug lS 177 18,218.03 S26 2,S82.35 13 3,269.06 IS 8SO 6,498.48 Sep 17 163 22,023.63 S98 2,400.61 10 920.20 19 189 7,234.39
Exclusion Reassignments/ orders
receipts/discharges/ issued under releases and Agreements Landlord
certificates of for sale Tenancy and Tenant satisfaction and purchase agreements Ordinance Miscellaneous Total
Year/month No. Value No. Value No. No. No. Value No. Value§
$Mn. $Mn. $Mn. $Mn.
1985 36 633 22, 73S.l0 S4 40S 36,96S.l2 2 349 30 SOS S0.31 262 934 87,135.51
1986 41 061 22.182.20 S6 S49 48,9S4.29 2 S88 4 3S 401 83.72 292 796 129,884.03
1987 S4 627 24,435.94 55 504 73,222.07 3 045 27 444 81.27 336 347 153,044.21
1988 62 069 28,656.29 67 270 106,414.01 3 465 33 811 52.15 3S5 516 21S,033.63
1989 67 890 35,029.76 61 896 110,008.81 3 754 II 37 S24 49.09 350 393 227,249.59
1990 67 851 24,254.42 69 619 108,370.26 3 872 10 40 277 118.17 369 194 220,024.33
1989: Sep 4 007 l,535.93 5 333 7,229.57 324 2 939 5.23 22 302 8,970.95 Oct 5 050 1,799.33 5 693 9,065.29 322 3 077 2.34 27 390 13,270.24 Nov 5 241 2,069.05 6 909 ll,420.40 304 4 004 13.01 33 365 13,967.47 Dec 4 872 1,719.60 4 84S 6,857.94 271 3 142 4.27 29 502 13,997.27
1990: Jan s 112 2. 773.91 4 527 7,346.28 3S4 2 3 053 0.00 28 3SS 18,216.36 Feb s 306 1,839.44 3 802 S,630.73 279 4 3 132 14.73 27 174 20,618.72 Mar s 124 1.870.93 s 280 7,694.28 239 3 137 8.14 28 9SI 17,926.40 Apr 4 341 1,275.12 4 883 6,993.3S 276 2 648 32.98 26023 16,l09.S2 May s 773 2, 183.49 6 121 8,460.46 346 3 489 17.17 32 8SO 26,277.70 Jun 6 138 2,372.89 s 734 7,714.7S 320 3 313 2.S8 31 886 lS,3S3.68 Jui 6 379 2,114.07 s 894 IO,S2S.29 372 3 481 1.00 31 289 15,943.89 Aug 6 370 l,882.S3 6 099 8,304.26 363 2 3 S26 1.42 33 180 14,884.0S Sep 6 023 l,848.9S 6 117 8,64S.S7 318 3 590 1.78 31172 14,390.89 Oct s 709 l,710.9S 6 180 10,819.64 306 3 351 17.41 30 IS3 18,073.74 Nov 6 19S 2, 162.60 7191 11,471.34 377 4146 18.8S 34 S87 23,441.34 Dec s 381 2,219.S3 7 791 14, 764.31 322 3 411 2.ll 33 S14 18,788.0S
1991: Jan 11 SSS 3,S08. 7S IS 122 20,720.S9 629 7 230 27.22 70 884 34,681.68 Feb 8 620 2,408.22 7 982 13,03S.46 4S8 6 028 19.41 48 6Sl 2S,S40.IS Mar 8 327 3,388.66 ll 013 IS,906.61 425 12 614S 26.74 SS 939 24,768.01 Apr 7 4SS 2,0S3.03 20 600 32,478.03 421 20 6 S99 187.8S S? 684 26,737.89 May II 241 2,807.57 18 691 29,605.27 S3S 16 9 650 28.4S 76 416 26,90S.40 Jun 12 lS5 3,519.5S II 423 18,331.72 S4S 8 062 37.96 68 68S 3l ,8Sl.93 Jui 13 Sl2 3,810.30 13 643 22,08S.24 S98 9 004 29.80 74 9SO 43,8S3.39 Aug 10 134 3,S99.56 18 148 33,693.01 631 2 8 201 18.23 68 682 34,ISS.71 Sep 12 683 3,415.63 16 146 32,726.38 551 9 984 15.00 76 324 36,009.46
Note: Figures for 1990 or before cover only Hong Kong Island, Kowloon and New Kowloon. As from January 1991, figures for New Territories are included. § Figures do not include the value of agreements for sale and purchase.
Hong Kong Monthly Digest of Statistics October 1991 39
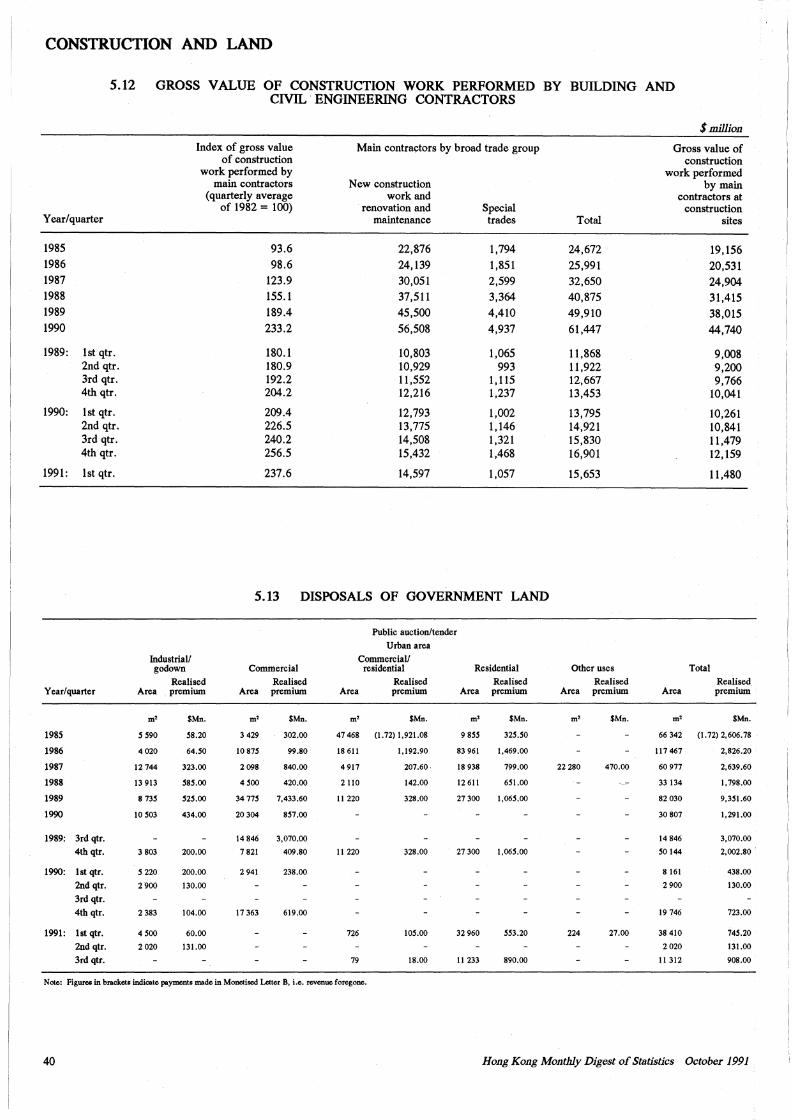
CONSTRUCTION AND LAND
5.12 GROSS VALUE OF CONSTRUCTION WORK PERFORMED BY BUILDING AND CIVIL ENGINEERING CONTRACTORS
$million
Index of gross value Main contractors by broad trade group Gross value of of construction construction
work performed by work performed main contractors New construction by main
(quarterly average work and contractors at of 1982 = 100) renovation and Special construction
Year/quarter maintenance trades Total sites
1985 93.6 22,876 1,794 24,672 19,156 1986 98.6 24,139 1,851 25,991 20,531 1987 123.9 30,051 2,599 32,650 24,904 1988 155.1 37,511 3,364 40,875 31,415 1989 189.4 45,500 4,410 49,910 38,015 1990 233.2 56,508 4,937 61,447 44,740
1989: lst qtr. 180.1 10,803 1,065 11,868 9,008 2nd qtr. 180.9 10,929 993 11,922 9,200 3rd qtr. 192.2 11,552 1,115 12,667 9,766 4th qtr. 204.2 12,216 1,237 13,453 10,041
1990: lst qtr. 209.4 12,793 1,002 13,795 10,261 2nd qtr. 226.5 13,775 1, 146 14,921 10,841 3rd qtr. 240.2 14,508 1,321 15,830 11,479 4th qtr. 256.5 15,432 1,468 16,901 12, 159
1991: lst qtr. 237.6 14,597 1,057 15,653 11,480
5.13 DISPOSALS OF GOVERNMENT LAND
Public auction/tender
Urban area
Industrial/ Commercial/ godown Commercial residential Residential Other uses Total
Realised Realised Realised Realised Realised Realised Year/quarter Area premium Area premium Area premium Area premium Area premium Area premium
m' $Mn. m' $Mn. m' $Mn. m' $Mn. m' $Mn. m' $Mn.
1985 s S90 SS.20 3 429 302.00 47 468 (1.72) 1,921.08 9 SSS 32S.SO 66 342 (1.72) 2,606.78
1986 4020 64.SO 10875 99.80 18 611 1,192.90 83 961 1,469.00 117 467 2,826.20
1987 12 744 323.00 2098 840.00 4 917 207.60. 18 938 799.00 22 280 470.00 60 977 2,639.60
1988 13 913 S8S.OO 4500 420.00 2 110 142.00 12 611 651.00 33 134 l,798.00
1989 8 735 525.00 34 775 7,433.60 11 220 328.00 27300 1,065.00 82030 9,351.60
1990 10503 434.00 20304 857.00 30 807 1,291.00
1989: 3rd qtr. 14 846 3,070.00 14 846 3,070.00
4th qtr. 3 803 200.00 7 821 409.80 11 220 328.00 27 300 1,065.00 so 144 2,002.80
1990: lst qtr. s 220 200.00 2941 238.00 8 161 438.00
2nd qtr. 2900 130.00 2 900 130.00
3rd qtr.
4th qtr. 2 383 104.00 17 363 619.00 19 746 723.00
1991: lst qtr. 4500 60.00 726 105.00 32 960 553.20 224 27.00 38 410 745.20
2nd qtr. 2020 131.00 2020 131.00
3rd qtr. 79 18.00 11 233 890.00 11 312 908.00
Note: Figures in brackets indicate payments made in Monetised Letter 8, i.e. revenue foregone.
40 Hong Kong Monthly Digest of Statistics October 1991
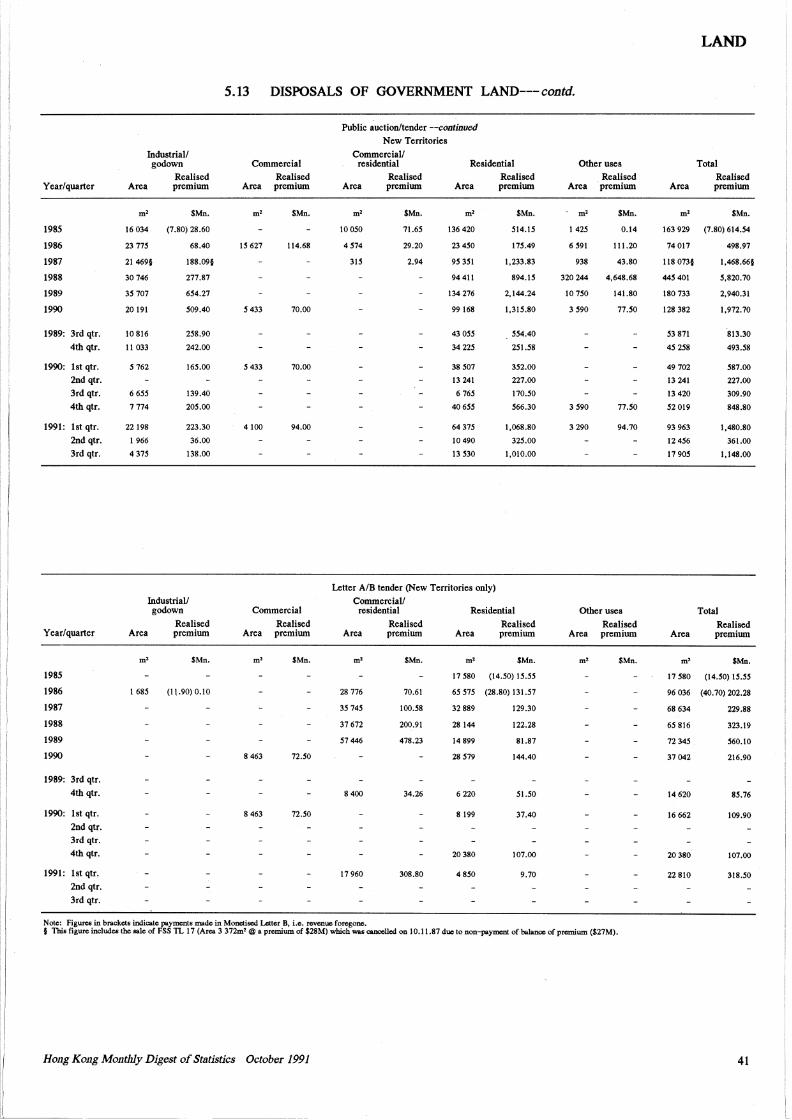
5.13 DISPOSALS OF GOVERNMENT LAND--- contd.
Year/quarter
1985
1986
1987
1988
1989
1990
1989: 3rd qtr.
4th qtr.
1990: lst qtr. 2nd qtr.
3rd qtr.
4th qtr.
1991: lst qtr.
2nd qtr.
3rd qtr.
Year/quarter
1985
1986
1987
1988
1989
1990
1989: 3rd qtr.
4th qtr.
1990: lst qtr.
2nd qtr. 3rd qtr.
4th qtr.
1991: lst qtr.
2nd qtr.
3rd qtr.
Industrial/ godown
Area
m'
16034
23 775
21 469§
30746
35 707
20191
10816
11 033
5 762
6 655
7774
22198
I 966
437S
Realised premium
$Mn.
(7.80) 28.60
68.40
188.09§
277.87
654.27
509.40
258.90
242.00
165.00
139.40
20S.OO
223.30
36.00
138.00
Industrial/ godown
Area
m'
I 68S
Realised premium
$Mn.
(11.90) 0.10
Commercial Realised
Area premium
m' $Mn.
15627 114.68
5 433 70.00
5 433 70.00
4100 94.00
Commercial
Realised Area premium
m' $Mn.
8463 72.SO
8 463 72.SO
Public auction/tender --'-continued New Territories
Commercial/ residential
Area
m'
10050
4574
315
Realised premium
$Mn.
71.65
29.20
2.94
Residential
Area
m'
136 420
23450
95 351
94 411
134 276
99168
43055
34225
38507
13 241
6 765
40655
64375
10490
13 530
Realised premium
$Mn.
514.15
175.49
1,233.83
894.15
2,144.24
1,315.80
. 554.40
251.58
352.00
227.00
170.50
566.30
1.068.80
325.00
1,010.00
Letter A/B tender (New Territories only)
Commercial/ residential
Area
m'
28 776
3S 74S
37672
57446
8 400
17 960
Realised premium
$Mn.
70.61
IOO.S8
200.91
478.23
34.26
308.80
Residential
Realised Area premium
m' $Mn.
17 S80 (14.SO) IS.SS
65 S75 (28.80) 131.57
32 889
28144
14899
28S79
6220
8199
20380
4850
129.30
122.28
81.87
144.40
SI.SO
37.40
107.00
9.70
Other uses Realised
Area premium
. m'
1425
6 591
938
$Mn.
0.14
111.20
43.80
320 244 4,648.68
10750
3 590
3S90
3 290
141.80
77.50
77.50
94.70
Other uses
Realised Area premium
m' $Mn.
N otc: Figure& in brackets indicate payments made in Monctiood Letter 8, i.e. revenue foregone. f This figure includes the sale of FSS 1L 17 (Area 3 372m2 @ a premium of $28M) which was cancelled on 10.11.87 due to non-payment of bslancc of premium ($27M).
Hong Kong Monthly Digest of Statistics October 1991
Area
m'
LAND
Total
Realised premium
$Mn.
163 929 (7.80) 614.54
74017
118 073§
445 401
180 733
128 382
53871
45258
49 702
13 241
13 420
52019
93 963
12 456
17905
Area
m'
498.97
1,468.66§
5,820.70
2,940.31
1,972.70
813.30
493.58
587.00
227.00
309.90
848.80
1,480.80
361.00
1,148.00
Total
Realised premium
$Mn.
17 S80 (14.SO) 15.SS
96 036 (40. 70) 202.28
68 634
6S816
7234S
37042
14620
16 662
20380
22810
229.88
323.19
560.10
216.90
8S.76
109.90
107.00
318.50
41
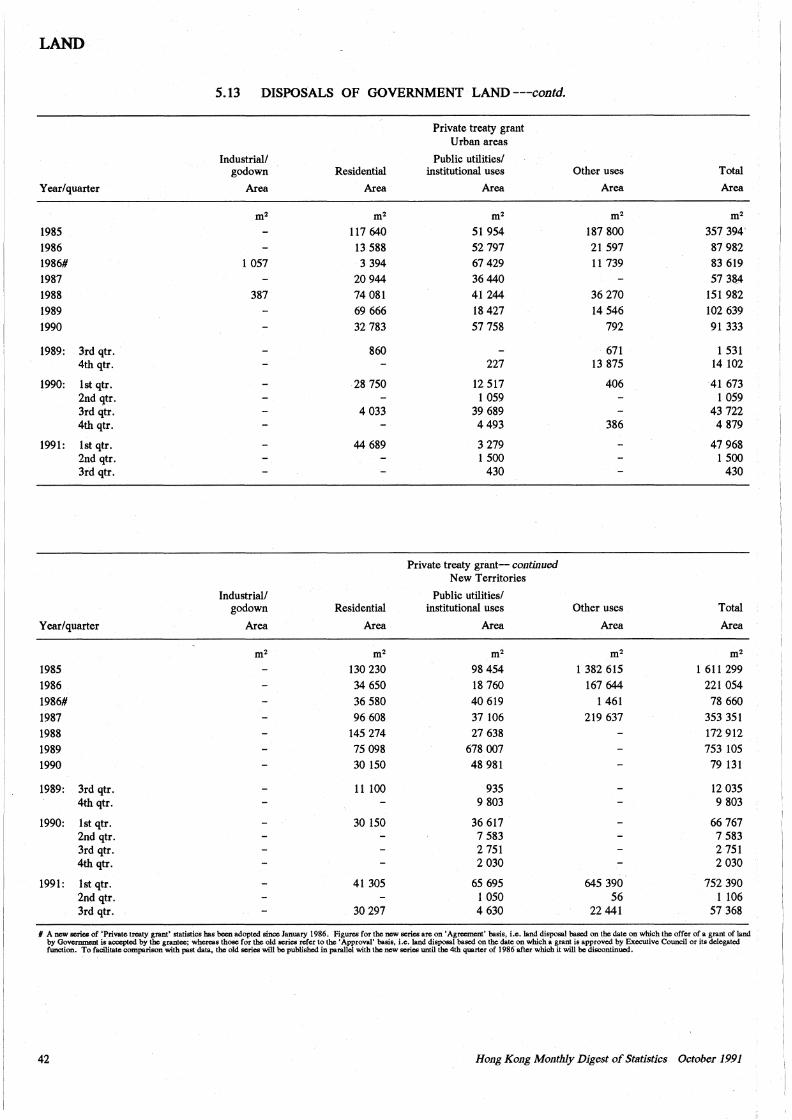
LAND
Year/quarter
1985 1986 1986#
1987
1988
1989
1990
1989: 3rd qtr. 4th qtr.
1990: lst qtr. 2nd qtr. 3rd qtr. 4th qtr.
1991: lst qtr. 2nd qtr. 3rd qtr.
Year/quarter
1985
1986 1986#
1987 1988 1989 1990
1989: 3rd qtr. 4th qtr.
1990: lst qtr. 2nd qtr. 3rd qtr. 4th qtr.
1991: lst qtr. 2nd qtr. 3rd qtr.
5.13 DISPOSALS OF GOVERNMENT LAND ---contd.
Industrial/ godown Residential
Area Area
m2 m2
117 640
13 588 1 057 3 394
20 944
387 74 081
69 666
32 783
860
28 750
4 033
44 689
Industrial/ godown Residential
Area Area
m2 m2
130 230
34 650
36 580
96 608 145 274
75 098 30 150
11 100
30 150
41 305
30 297
Private treaty grant Urban areas
Public utilities/ institutional uses
Area
m2
51 954 52 797 67 429
36 440
41 244 18 427
57 758
227
12 517 1 059
39 689 4493
3 279 1 500
430
Private treaty grant-- continued New Territories
Public utilities/ institutional uses
Area
m2
98 454
18 760
40 619
37 106
27 638
678 007 48 981
935 9 803
36 617 7 583 2 751 2 030
65 695 l 050 4 630
Other uses
Area
m2
187 800
21 597 11 739
36 270
14 546
792
671 13 875
406
386
Other uses
Area
m2
1 382 615
167 644 1 461
219 637
645 390 56
22 441
Total
Area
m2
357 394·
87 982 83 619
57 384
151 982 102 639
91 333
1 531 14 102
41 673 1 059
43 722 4 879
47 968 1 500
430
Total
Area
m2
1 611 299
221 054
78 660
353 351
172 912 753 105
79 131
12 035 9 803
66 767 7 583 2 751 2 030
752 390 1 106
57 368
# A new series of 'Private treaty grant' statistics has been adopted since January 1986. Figures for the new series are on' Agrccment' basis, i.e. land disposal based on the date on which the offer of a grant of land by Government is accepted by the grantee; whereas those for the old series refer to the' Approval' basis, i.e. land disposal based on the date on which a grant is approved by Executive Council or its delegated function. To facilitate comparison with past data, the old series will be published in parallel with the new series until the 4th quarter of 1986 after which it will be discontinued.
42 Hong Kong Monthly Digest of Statistics October 1991
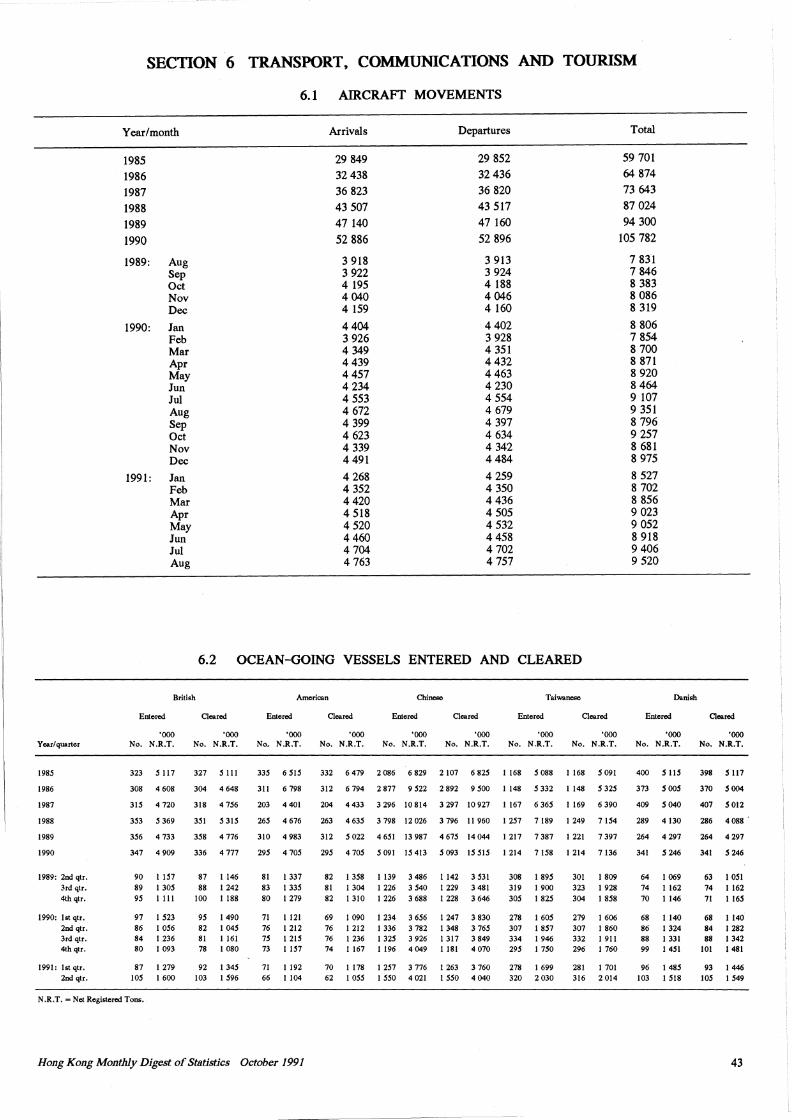
Year/ quarter
1985
1986
1987
1988
1989
1990
1989: 2nd qtr. 3rd qtr. 4th qtr.
1990: lst qtr. 2nd qtr. 3rd qtr. 4th qtr.
1991: lst qtr. 2nd qtr.
SECTION 6 TRANSPORT, COMMUNICATIONS AND TOURISM
Year/month
1985
1986
1987
1988
1989
1990
1989: Aug Sep Oct Nov Dec
1990: Jan Feb Mar Apr May Jun Jui Aug Sep Oct Nov Dec
1991: Jan
Entered
Feb Mar Apr May Jun Jul Aug
British
6.1 AIRCRAFT MOVEMENTS
Arrivals
29 849
32 438
36 823
43 507
47 140
52 886
3 918 3 922 4 195 4 040 4 159
4404 3 926 4 349 4 439 4457 4 234 4 553 4 672 4 399 4 623 4 339 4 491
4 268 4 352 4420 4 518 4 520 4460 4 704 4 763
Departures
29 852
32 436
36 820
43 517
47 160
52 896
3 913 3 924 4 188 4 046 4 160
4402 3 928 4 351 4432 4 463 4 230 4 554 4 679 4 397 4 634 4 342 4484
4 259 4 350 4 436 4 505 4 532 4 458 4 702 4 757
6.2 OCEAN-GOING VESSELS ENTERED AND CLEARED
American Taiwanese
Cleared Entered Cleared Entered Cleared Entered Cleared
Total
59 701
64 874
73 643
87 024
94 300
105 782
7 831 7 846 8 383 8 086 8 319
8 806 7 854 8 700 8 871 8 920 8 464 9 107 9 351 8 796 9 257 8 681 8 975
8 527 8 702 8 856 9 023 9 052 8 918 9 406 9 520
Entered
Danish
Cleared
·~ ·~ ·~ ·~ ·~ ·~ ·~ ~o ·~ ·~ No. N.R.T. No. N.R.T. N<>. N.R.T. No. N.R.T. No. N.R.T. No. N.R.T. No. N.R.T. No. N.R.T. No. N.R.T. No. N.R.T.
323 5 ll7 327 5 Ill 335 6 515 332 6 479 2 086 6 829 2 107 6 825 l 168 5 088 l 168 5 091 400 51l5 398 5117
308 4 608 304 4 648 311 6 798 312 6 794 2 877 9 522 2 892 9 500 l 148 5 332 l 148 5 325 373 5 005 370 5 004
315 4 720 318 4 756 203 4 401 204 4 433 3 296 10 814 3 297 10 927 I 167 6 365 l 169 6 390 409 5 040 407 5 012
353 5 369 351 5 315 265 4 676 263 4 635 3 798 12 026 3 796 11 960 I 257 7 189 I 249 7 154 289 4 130 286 4 088 .
356 4 733 358 4 776 310 4 983 312 5 022 4 651 13 987 4 675 14 044 l 217 7 387 I 221 7 397 264 4 297 264 4 297
347 4 909 336 4 777 295 4 705 295 4 705 5 091 15 413 5 093 15 515 I 214 7 158 I 214 7136 341 5 246 341 5 246
90 l 157 89 I 305 95 I Ill
97 I 523 86 l 056 84 l 236 80 I 093
87 I 279 105 I 600
87 I 146 88 I 242
100 1188
95 I 490 82 I 045 81 I 161 78 I 080
92 I 345 103 l 596
81 I 337 83 I 335 80 I 279
71 1121 76 I 212 75 l 215 73 I 157
71 I 192 66 l 104
82 I 358 I 139 3 486 l 142 3 531 308 I 895 301 l 809 64 I 069 63 l 051 81 1304 1226 3540 1229 3481 319 1900 323 1928 74 I 162 74 l 162 82 I 310 I 226 3 688 l 228 3 646 305 l 825 304 I 858 70 1146 71 I 165
69 I 090 I 234 3 656 I 247 3 830 278 I 605 279 l 606 68 1140 68 1140 76 I 212 l 336 3 782 I 348 3 765 307 l 857 307 I 860 86 I 324 84 I 282 76 l 236 1325 3 926 l 317 3 849 334 1946 332 1911 88 l 331 88 I 342 74 l 167 I 196 4 049 I 181 4 070 295 I 750 296 I 760 99 I 451 IOI 1481
70 I 178 I 257 3 776 l 263 3 760 278 l 699 281 I 701 96 l 485 93 I 446 62 I 055 l 550 4 021 l 550 4 040 320 2 030 316 2 014 103 l 518 105 I 549
N.R.T. =Net Registered Tons.
Hong Kong Monthly Digest of Statistics October 1991 43
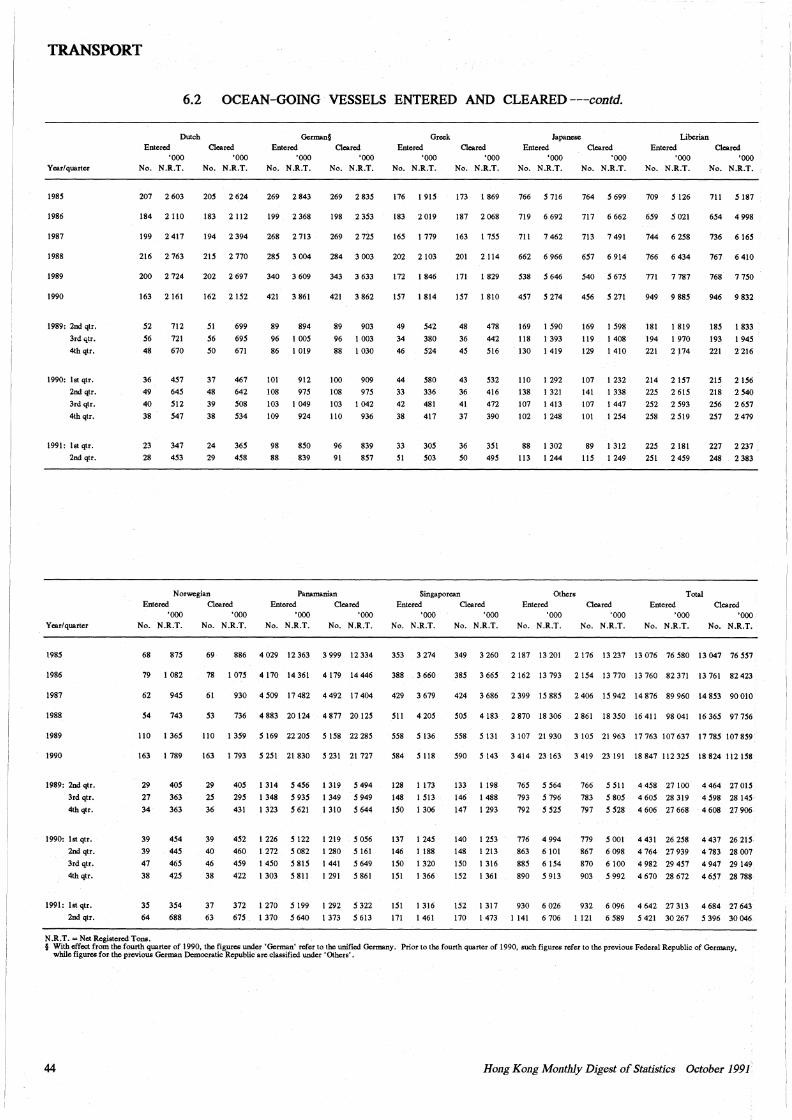
TRANSPORT
6.2 OCEAN-GOING VESSELS ENTERED AND CLEARED---contd.
Y r.ar/ quarter
198S
1986
1987
1988
1989
1990
1989: 2nd qtr.
3rd qtr.
4thqtr.
1990: lst qtr.
2nd qtr.
3rdqtr.
4thqtr.
1991: lst qtr.
2nd qtr.
Year/ quarter
198S
1986
1987
1988
1989
1990
1989: 2nd qtr.
3rd qtr.
4thqtr.
1990: lst qtr.
2nd qtr.
3rd qtr.
4th qtr.
1991: lst qtr.
2nd qtr.
Dutch Entered Cleared
'OOO 'OOO No. N.R.T. No. N.R.T.
207 2 603 20S 2 624
184 2 110 183 2 112
199 2417 194 2394
216 2 763 21S 2 770
200 2 724 202 2 697
163 2 161 162 2 1S2
52 712 SI 699
S6 721 S6 695
48 670 so 671
36 457 37 467
49 645 48 642
40 s12 39 508
38 S47 38 S34
23 347 24 36S
28 4S3 29 4S8
Norwegian Entered Cleared
'OOO 'OOO No. N.R.T. No. N.R.T.
German§
Entered 'OOO
No. N.R.T.
269 2 843
199 2368
268 2 713
28S 3 004
340 3 609
421 3 861
89 894
96 I OOS 86 I 019
101 912
108 97S
103 I 049
109 924
98 8SO
88 839
Cleared 'OOO
No. N.R.T.
269 2 83S
198 2353
269 2 7ZS
284 3 003
343 3 633
421 3 862
89 903
96 I 003
88 I 030
100 909
108 97S
103 I 042
110 936
96 839
91 8S7
Panamanian Entered Cleared
'OOO 'OOO No. N.R.T. No. N.R.T.
68 87S 69 886 4 029 12 363 3 999 12 334
79 1 082
62 945
54 743
110 I 365
163 I 789
29
27
34
39
39
47
38
35
64
405
363
363
4S4
44S
46S
425
354
688
78 107S 4170 14361 4179 14446
61 930 4 509 17 482 4 492 17 404
S3 736 4 883 20 124 4 877 20 125
110 l 359 5 169 22 20S s IS8 22 28S
163 1 793 S 2SI 21 830 5 231 21 727
29
25
36
39
40
46
38
37
63
405
29S
431
452
460
4S9
422
372
675
l 314
1 348
I 323
I 226
I 272
I 4SO
I 303
1270
I 370
5 456
5 935
5 621
5 122
s 082
s 815
5 811
s 199
5 640
I 319
I 349
I 310
I 219
l 280
1441
I 291
I 292
I 373
s 494
s 949
5 644
5 056
5 161
5649
s 861
5 322
5 613
N .R.T. ~Net Registered Tons.
Greek Japanese Liberian Entered Cleared Entered Cleared Entered Cleared
'OOO 'OOO 'OOO 'OOO 'OOO 'OOO No. N.R.T. No. N.R.T. No. N.R.T. No. N.R.T. No. N.R.T. No. N.R.T.
176 I 91S 173 I 869 766 5 716 764 s 699 709 5 126 711 s 187
183 2019 187 2068 719 6 692 717 6 662 6S9 5 021 6S4 4 998
16S I 779 163 I 7SS 711 7 462 713 7 491 744 6 258 736 6 16S
202 2 103 201 2 114 662 6 966 6S7 6 914 766 6 434 767 6 410
172 1846 171 I 829 S38 s 646 S40 s 67S 771 7 787 768 7 7SO
157 I 814 1S7 I 810 4S7 s 274 456 5 271 949 9 88S 946 9 832
49 S42 48 478 169 I 590 169 I S98 181 1 819 18S I 833
34 380 36 442 118 I 393 119 I 408 194 I 970 193 I 945 46 S24 45 Sl6 130 I 419 129 I 410 221 2174 221 2 216
44 S80 43 S32 110 I 292 107 I 232 214 2 IS7 215 2 IS6
33 336 36 416 138 I 321 141 I 338 22S 261S 218 2 540
42 481 41 472 107 I 413 107 I 447 2S2 2 593 256 2 657
38 417 37 390 102 I 248 101 I 2S4 2S8 2 Sl9 257 2 479
33 30S 36 3Sl 88 I 302 89 I 312 225 2 181 227 2 237 SI S03 so 49S 113 I 244 llS I 249 2Sl 2 4S9 248 2 383
Singaporean Others Total Entered Cleared Entered Cleared Entered Cleared
'OOO 'OOO 'OOO 'OOO 'OOO 'OOO No. N.R.T. No. N.R.T. No. N.R.T. No. N.R.T. No. N.R.T. No. N.R.T.
3S3 3 274 349 3260 2187 13201 2176 13237 13076 76580 13047 76SS7
388 3 660
429 3 679
51! 420S
558 s 136
584 5118
128
148
150
137
146
ISO
151
151
171
I 173
I 513
1 306
I 245
I 188
1320
I 366
I 316
I 461
385 3 665 2 162 13 793 2 154 13 770 13 760 82 371 13 761 82 423
424 3 686 2 399 15 885 2 406 15 942 14 876 89 960 14 8S3 90 010
SOS 4 183 2 870 18 306 2 861 18 3SO 16 411 98 041 16 36S 97 756
S58 5131 3107 21930 3105 21963 17763 107637 1778S 107859
S90 5 143 3 414 23 163 3 419 23 191 18 847 112 325 18 824 112158
133
146
147
140
148
ISO
152
152
170
I 198
I 488
I 293
I 253
I 213
I 316
I 361
I 317
I 473
765
793
792
776
863
88S
890
930
I 141
s 564
5 796
s S25
4 994
6 IOI
6 154
5 913
6 026
6 706
766
783
797
779
867
870
903
932
I 121
s Sll
5805
5 528
5 001
6 098
6 100
5 992
6 096
6 589
4 4S8 27 100
4 605 28 319
4 606 27 668
4 431 26 258
4 764 27 939
4 982 29 457
4 670 28 672
4 642 27 313
5 421 30 267
4464 27015
4 S98 28 145
4 608 27 906
4 437 26 21S
4 783 28 007
4 947 29 149
4 6S7 28 788
4 684 27 643
5 396 30 046
§ With effect from the fourth quarter of 1990, the figures under 'German' refer to the unified Gennany. Prior to the fourth quarter of 1990, such figures refer to the previous Federal Republic of Germany, while figures for the previous German Democratic Republic are classified under 'Others' .
44 Hong Kong Monthly Digest of Statistics October 1991
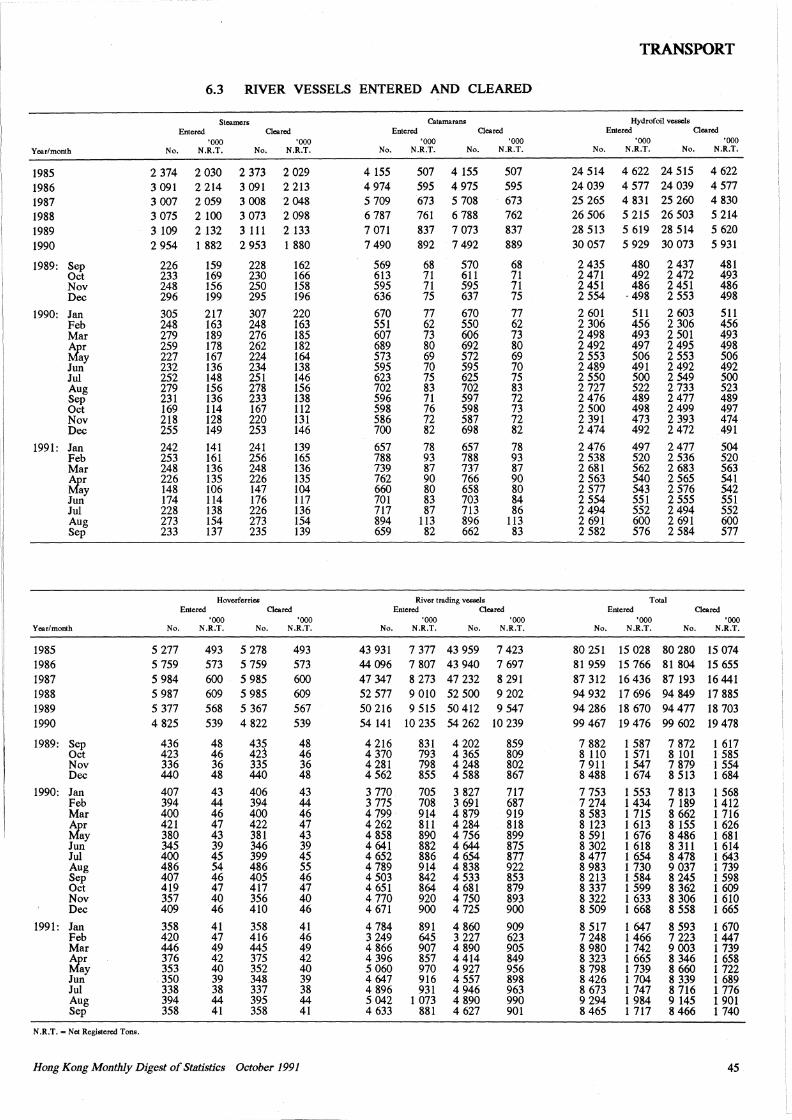
TRANSPORT
'! 6.3 RIVER VESSELS ENTERED AND CLEARED 11
Steamers Catamarans Hydrofoil vessels Entered Cleared Entered Cleared Entered Cleared
'OOO 'OOO 'OOO 'OOO 'OOO 'OOO Year/month No. N.R.T. No. N.R.T. No. N.R.T. No. N.R.T. No. N.R.T. No. N.R.T.
1985 2 374 2 030 2 373 2 029 4 155 507 4 155 507 24 514 4 622 24 515 4 622
1986 3 091 2 214 3 091 2 213 4 974 595 4 975 595 24 039 4 577 24 039 4577
1987 3 007 2 059 3 008 2 048 5 709 673 5 708 673 25 265 4 831 25 260 4 830
1988 3 075 2 100 3 073 2 098 6 787 761 6 788 762 26 506 5 215 26 503 5 214 !1 1989 3 109 2 132 3 111 2 133 7 071 837 7 073 837 28 513 5 619 28 514 5 620
1990 2 954 1 882 2 953 1 880 7 490 892 7 492 889 30 057 5 929 30 073 5 931 ii
1989: Sep 226 159 228 162 569 68 570 68 2 435 480 2 437 481
i'I Oct 233 169 230 166 613 71 611 71 2 471 492 2472 493 Nov 248 156 250 158 595 71 595 71 2 451 486 2 451 486 Dec 296 199 295 196 636 75 637 75 2 554 . 498 2 553 498
1990: Jan 305 217 307 220 670 77 670 77 2 601 511 2 603 511 Feb 248 163 248 163 551 62 550 62 2 306 456 2 306 456 Mar 279 189 276 185 607 73 606 73 2 498 493 2 501 493
~r 259 178 262 182 689 80 692 80 2492 497 2 495 498 ay 227 167 224 164 573 69 572 69 2 553 506 2 553 506
Jun 232 136 234 138 595 70 595 70 2 489 491 2492 492 Jul 252 148 251 146 623 75 625 75 2 550 500 2 549 500 Aug 279 156 278 156 702 83 702 83 2 727 522 2 733 523 Sep 231 136 233 138 596 71 597 72 2 476 489 2477 489 Oct 169 114 167 112 598 76 598 73 2 500 498 2 499 497 Nov 218 128 220 131 586 72 587 72 2 391 473 2 393 474 Dec 255 149 253 146 700 82 698 82 2 474 492 2472 491
1991: Jan 242 141 241 139 657 78 657 78 2476 497 2 477 504 Feb 253 161 256 165 788 93 788 93 2 538 520 2 536 520 Mar 248 136 248 136 739 87 737 87 2 681 562 2 683 563
~r 226 135 226 135 762 90 766 90 2 563 540 2 565 541 ay 148 106 147 104 660 80 658 80 2 577 543 2 576 542
Jun 174 114 176 117 701 83 703 84 2 554 551 2 555 551 Jul 228 138 226 136 717 87 713 86 2494 552 2 494 552 Aug 273 154 273 154 894 113 896 113 2 691 600 2 691 600 Sep 233 137 235 139 659 82 662 83 2 582 576 2 584 577
Hoverfcrrics River trading vessels Total Entered Cleared Entered Cleared Entered Cleared
'OOO 'OOO 'OOO 'OOO 'OOO 'OOO Year/month No. N.R.T. No. N.R.T. No. N.R.T. No. N.R.T. No. N.R.T. No. N.R.T.
1985 5 277 493 5 278 493 43 931 7 377 43 959 7 423 80 251 15 028 80 280 15 074 1986 5 759 573 5 759 573 44 096 7 807 43 940 7 697 81 959 15 766 81 804 15 655 1987 5 984 600 5 985 600 47 347 8 273 47 232 8 291 87 312 16 436 87 193 16 441 1988 5 987 609 5 985 609 52 577 9 010 52 500 9 202 94 932 17 696 94 849 17 885 1989 5 377 568 5 367 567 50 216 9 515 50 412 9 547 94 286 18 670 94477 18 703 1990 4 825 539 4 822 539 54 141 10 235 54 262 10 239 99 467 19 476 99 602 19 478
1989: Sep 436 48 435 48 4 216 831 4 202 859 7 882 1 587 7 872 1 617 Oct 423 46 423 46 4 370 793 4 365 809 8 110 1 571 8 101 1 585 Nov 336 36 335 36 4 281 798 4 248 802 7 911 1 547 7 879 1 554 Dec 440 48 440 48 4 562 855 4 588 867 8 488 1 674 8 513 1 684
1990: Jan 407 43 406 43 3 770 705 3 827 717 7 753 1 553 7 813 1 568 Feb 394 44 394 44 3 775 708 3 691 687 7 274 1434 7 189 1 412 Mar 400 46 400 46 4 799 914 4 879 919 8 583 1 715 8 662 1 716
~r 421 47 422 47 4 262 811 4 284 818 8 123 1 613 8 155 1 626 ay 380 43 381 43 4 858 890 4 756 899 8 591 1 676 8 486 1 681
Jun 345 39 346 39 4 641 882 4 644 875 8 302 1 618 8 311 l 614 Jul 400 45 399 45 4 652 886 4 654 877 8 477 1 654 8 478 1 643 Aug 486 54 486 55 4 789 914 4 838 922 8 983 l 730 9 037 1 739 Sep 407 46 405 46 4 503 842 4 533 853 8 213 1 584 8 245 1 598 Oct 419 47 417 47 4 651 864 4 681 879 8 337 1 599 8 362 1 609 Nov 357 40 356 40 4 770 920 4 750 893 8 322 1 633 8 306 1 610 Dec 409 46 410 46 4 671 900 4 725 900 8 509 1 668 8 558 1 665
1991: Jan 358 41 358 41 4 784 891 4 860 909 8 517 1 647 8 593 1 670 Feb 420 47 416 46 3 249 645 3 227 623 7 248 1466 7 223 1447 Mar 446 49 445 49 4 866 907 4 890 905 8 980 1 742 9 003 1 739 ~r 376 42 375 42 4 396 857 4 414 849 8 323 l 665 8 346 1 658
ay 353 40 352 40 5 060 970 4 927 956 8 798 1 739 8 660 1 722 Jun 350 39 348 39 4 647 916 4 557 898 8 426 1 704 8 339 1 689 Jul 338 38 337 38 4 896 931 4 946 963 8 673 1 747 8 716 1 776 Aug 394 44 395 44 5 042 1 073 4 890 990 9 294 1 984 9 145 1 901 Sep 358 41 358 41 4 633 881 4 627 901 8 465 1 717 8 466 1 740
N.R.T. =Net Registered Tons.
Hong Kong Monthly Digest of Statistics October 1991 45
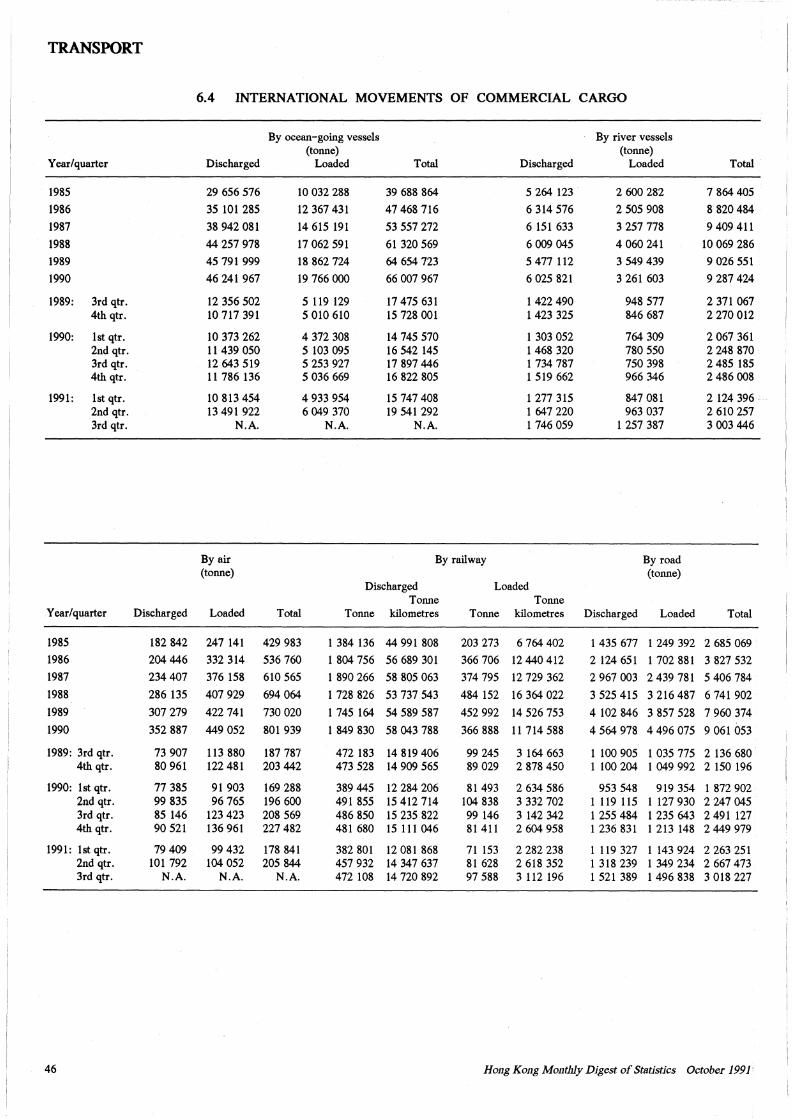
TRANSPORT
6.4 INTERNATIONAL MOVEMENTS OF COMMERCIAL CARGO
By ocean-going vessels By river vessels (tonne) (tonne)
Year/quarter Discharged Loaded Total Discharged Loaded Total
1985 29 656 576 10 032 288 39 688 864 5 264 123 2 600 282 7 864 405
1986 35 101 285 12 367 431 47 468 716 6 314 576 2 505 908 8 820 484
1987 38 942 081 14 615 191 53 557 272 6 151 633 3 257 778 9 409 411
1988 44 257 978 17 062 591 61320569 6 009 045 4 060 241 10 069 286
1989 45 791 999 18 862 724 64 654 723 5 477 112 3 549 439 9 026 551
1990 46 241 967 19 766 OOO 66 007 967 6 025 821 3 261 603 9 287 424
1989: 3rd qtr. 12 356 502 5 119 129 17 475 631 1422 490 948 577 2 371 067 4th qtr. 10 717 391 5 010 610 15 728 001 l 423 325 846 687 2 270 012
1990: lst qtr. 10 373 262 4 372 308 14 745 570 l 303 052 764 309 2 067 361 2nd qtr. 11 439 050 5 103 095 16 542 145 1468 320 780 550 2 248 870 3rd qtr. 12 643 519 5 253 927 17 897 446 1734787 750 398 2 485 185 4th qtr. 11 786 136 5 036 669 16 822 805 1 519 662 966 346 2 486 008
1991: lst qtr. 10 813 454 4 933 954 15 747 408 1 277 315 847 081 2 124 396 2nd qtr. 13 491 922 6 049 370 19 541 292 1 647 220 963 037 2 610 257 3rd qtr. N.A. N.A. N.A. 1746059 1 257 387 3 003 446
By air By railway By road (tonne) (tonne)
Discharged Loaded Tonne Tonne
Year/quarter Discharged Loaded Total Tonne kilometres Tonne kilometres Discharged Loaded Total
1985 182 842 247 141 429 983 1 384 136 44 991 808 203 273 6 764 402 1 435 677 1 249 392 2 685 069
1986 204 446 332 314 536 760 l 804 756 56 689 301 366 706 12 440 412 2 124 651 1 702 881 3 827 532
1987 234 407 376 158 610 565 1890266 58 805 063 374 795 12 729 362 2 967 003 2 439 781 5 406 784
1988 286 135 407 929 694 064 1 728 826 53 737 543 484 152 16 364 022 3 525 415 3 216 487 6 741 902
1989 307 279 422 741 730 020 1 745 164 54 589 587 452 992 14 526 753 4 102 846 3 857 528 7 960 374
1990 352 887 449 052 801 939 1 849 830 58 043 788 366 888 11714588 4 564 978 4 496 075 9 061 053
1989: 3rd qtr. 73 907 113 880 187 787 472 183 14 819 406 99 245 3 164 663 1 100 905 1 035 775 2 136 680 4th qtr. 80 961 122 481 203 442 473 528 14 909 565 89 029 2 878 450 1 100 204 1 049 992 2 150 196
1990: lst qtr. 77 385 91 903 169 288 389 445 12 284 206 81 493 2 634 586 953 548 919 354 1872902 2nd qtr. 99 835 96 765 196 600 491 855 15 412 714 104 838 3 332 702 1 119 115 1 127 930 2 247 045 3rd qtr. 85 146 123 423 208 569 486 850 15 235 822 99 146 3 142 342 l 255 484 1 235 643 2 491 127 4th qtr. 90 521 136 961 227 482 481 680 15 111 046 81 411 2 604 958 1 236 831 1 213 148 2 449 979
1991: lst qtr. 79 409 99 432 178 841 382 801 12 081 868 71 153 2 282 238 1119 327 1 143 924 2 263 251 2nd qtr. 101 792 104 052 205 844 457 932 14 347 637 81 628 2 618 352 1 318 239 1 349 234 2 667 473 3rd qtr. N.A. N.A. N.A. 472 108 14 720 892 97 588 3 112 196 1 521 389 1 496 838 3 018 227
46 Hong Kong Monthly Digest of Statistics October 1991
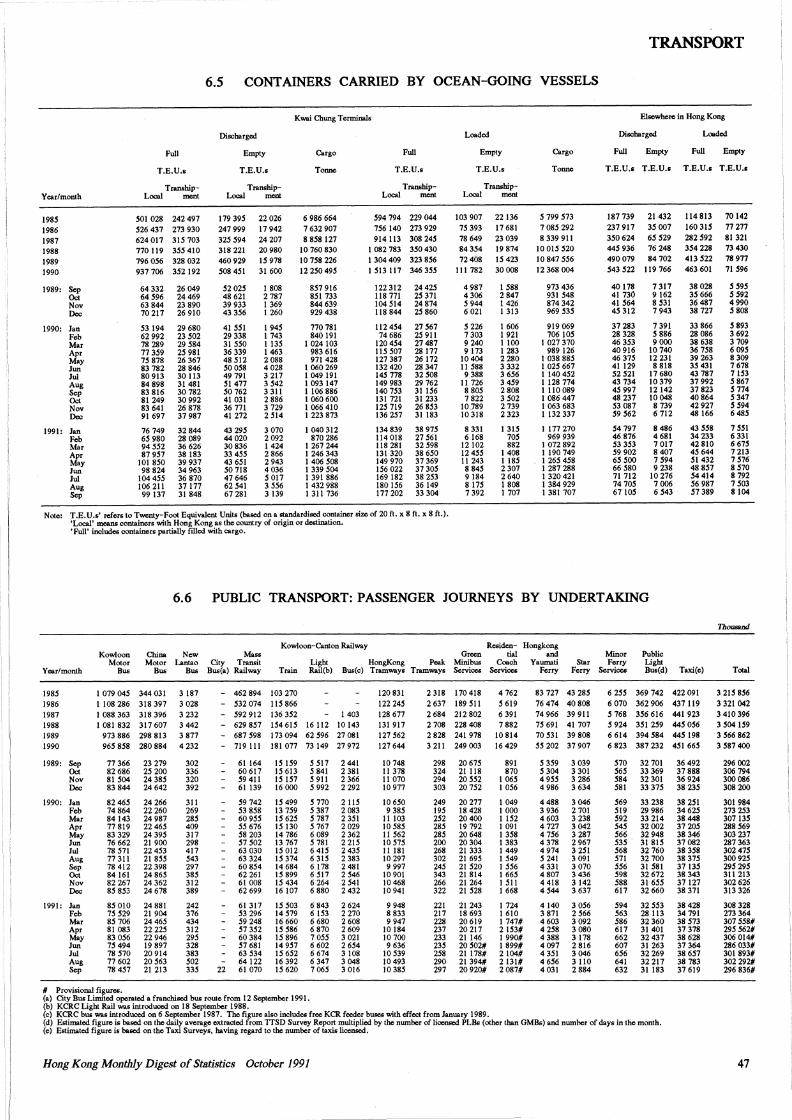
6.5 CONTAINERS CARRIED BY OCEAN-GOING VESSELS
Year/month
1985 1986 1987 1988 1989 1990
1989: Sep Oct Nov Dec
1990: Jan Feb Mar Apr May Jun Jui Aug Sep Oct Nov Dec
1991: Jan Feb Mar Apr May Jun Jui Aug Sep
Full
T.E.U.s
Tranship-Local ment
501 028 242 497 526 437 273 930 624 017 315 703 770 119 355 410 796 056 328 032 937 706 352 192
64 332 64 596 63 844 70217
53 194 62 992 78 289 77 359 15 878 83 782 80 913 84 898 83 816 81 249 83 641 91 697
76 749 65 980 94 552 87 951
101 850 98 824
104 455 106 211 99 137
26 049 24 469 23 890 26 910
29 680 23 502 29 584 25 981 26 367 28 846 30 113 31 481 30 782 30 992 26 878 37 987
32 844 28 089 36 626 38 183 39 937 34 963 36 870 37 177 31 848
Discharged
Empty
T.E.U.s
Tranship-Local men!
179 395 22 026 247 999 17 942 325 594 24 207 318 221 20 980 460 929 15 978 508 451 31 600
52 025 48621 39 933 43 356
41 551 29 338 31 550 36 339 48 512 50 058 49 791 51 477 50 762 41 031 36 771 41272
43 295 44020 30 836 33 4SS 43 651 50 718 47 646 62 541 67 281
I 808 2 787 I 369 I 260
I 945 I 743 I 135 I 463 2 088 4028 3 217 3 542 3 311 2 886 3 729 2 514
3 070 2092 1424 2 866 2 943 4 036 5 017 3 556 3 139
Kwai Chung Terminals
Cargo
Tonne
6 986 664 7 632 907 8858127
10 760 830 10 758 226 12 250 495
857 916 851 733 844 639 929 438
770 781 840 191
I 024 103 983 616 971 428
I 060 269 I 049 191 I 093 147 1106 886 I 060600 I 066410 I 223 873
I 040 312 870 286
I 267 244 I 246 343 I 406 508 I 339 504 I 391 886 I 432 988 I 311 736
Full
T.E.U.s
Tranship-Local ment
594 794 229 044 156 140 273 929 914 113 308 245
I 082 783 350 430 I 304 409 323 856 1513117 346355
122 312 118 771 104 514 118 844
112 454 74 686
120 454 115 507 127 387 132 420 145 778 149 983 140 753 131 721 125 719 136 257
134 839 114 018 118 281 131 320 149 970 156 022 169 182 180 156 177 202
24 425 25 371 24 874 25 860
27 567 25911 27 487 28 177 26172 28 347 32508 29 762 31156 31 233 26 853 31 183
38 975 27 561 32 598 38 650 37 369 37 305 38 253 36 149 33 304
Note: T.E.U.s' refers to Twenty-Foot Equivalent Units (based on a standardised container size of 20 ft. x 8 ft. x 8 ft.). 'Local' means containers with Hong Kong as the country of origin or destination. 'Full' includes containers partially filled with cargo.
Loaded
Empty
T.E.U.s
Tranship-Local ment
103 907 22 136 75 393 17 681 78 649 23 039 84 354 19 874 72 408 15 423
111 782 30 008
4 987 4306 5 944 6 021
5 226 7 303 9 240 9 173
10404 II 588 9 388
II 726 8 805 7 822
10789 10 318
8 331 6 168
12102 12 455 11 243 8 845 9 184 8 175 7 392
I 588 2 847 I 426 I 313
I 606 I 921 1100 I 283 2 280 3 332 3 656 3 459 2 808 3 502 2 739 2 323
I 315 705 882
I 408 I 185 2 307 2640 I 808 I 707
Cargo
Tonne
5 199 573 7 085 292 8 339 911
10 015 520 10 847 556 12 368 004
973 436 931 548 874 342 969 535
919 069 706 105
I 027 370 989 126
I 038 885 I 025 667 I 140 452 I 128 774 I 110 089 I 086 447 I 063 683 I 132 337
I 177 270 969 939
I 072 892 I 190 749 I 265 458 I 287 288 I 320 421 I 384 929 I 381 707
TRANSPORT
Elsewhere in Hong Kong
Discharged Loaded
Full Empty Full Empty
T.E.U.s T.E.U.s T.E.U.s T.E.U.s
187 739 21 432 114 813 70 142 237917 35007 160315 77277 350 624 65 529 282 592 81 321 445 936 76 248 354 228 73 430 490 079 84 702 413 522 78 977 543 522 119 766 463 601 71 596
40178 41 730 41564 45 312
37283 28 328 46 353 40916 46 315 41 129 52 521 43 734 45 991 48 237 53 087 59 562
54 797 46 876 53 353 59 902 65 SOO 66 580 71 712 74 705 67105
7317 9 162 8 531 7 943
7 391 5 886 9 OOO
10740 12 231 8 818
17 680 10 379 12142 10048 8 739 6 712
8 486 4 681 7017 8 407 7 594 9 238
10 276 7 006 6 543
38 028 35 666 36 487 38 727
33 866 28 086 38 638 36 758 39 263 35 431 43 787 37 992 37 823 40 864 42927 48 166
43 558 34 233 42 810 45 644 51 432 48857 54 414 56 987 51389
5 595 5 592 4 990 5 808
5 893 3 692 3 709 6 095 8 309 7 678 7153 s 867 5114 s 347 s 594 6 485
7 551 6 331 6 675 7 213 7 576 8 570 8 792 7 503 8104
6.6 PUBLIC TRANSPORT: PASSENGER JOURNEYS BY UNDERTAKING
Kowloon-Canton Railway Residen- Hongkong New Mass Green tial and Kowloon
Motor Bus
China Motor
Bus Lantao City Transit Light HongKong Peak Minibus Coach Yaumati Star
Ferry Year/month Bus Bus(a) Railway Train Rail(b) Bus(c) Tramways Tramways Services Services Ferry
1985 1986 1987 1988 1989 1990
1989: Sep Oct Nov Dec
1990: Jan Feb Mar Apr May Jun Jui Aug Sep Oct Nov Dec
1991: Jan Feb Mar Apr May Jun Jui Aug Sep
I 079 045 344 031 3 187 1108286 318397 3028 I 088363 318396 3232 I 081832 317607 3442
973886 298813 3877 965 858 280 884 4 232
77 366 82 686 81 504 83 844
82 465 74 864 84143 77 819 83 329 76 662 78 571 77 311 78 412 84 161 82 267 85 853
85 010 15 529 85 706 81 083 83 056 75 494 78 570 77 602 78 457
23 279 25 200 24 385 24 642
24 266 22 260 24 987 22 465 24 395 21 900 22 453 21 855 22 398 24 865 24 362 24 678
24 881 21 904 24 465 22 225 22 946 19 897 20 914 20 563 21 213
302 336 320 392
311 269 285 409 317 298 417 543 297 385 312 389
242 376 434 312 295 328 383 502 335
# Provisional figures.
- 462 894 I 03 270 - 532 074 115 866 - 592 912 136 352 I 403 - 629 857 154 615 16 112 10 143 - 687 598 173 094 62 596 27 081 - 719111 181077 73149 27972
22
61 164 60 617 59 411 61 139
59 742 53 858 60 955 55 616 58 203 57 502 63 030 63 324 60 854 62 261 61 008 62 699
61 317 53 296 59 248 57 352 60 384 51681 63 534 64 122 61 070
15 159 15 613 15 157 16 OOO
15 499 13 759 15 625 15 130 14 786 13 767 15 012 15 374 14 684 15 899 15 434 16 107
15 503 14 579 16 660 15 586 15 896 14 957 15 652 16 392 15 620
5 517 5 841 5 911 5 992
5110 5 387 5 787 5161 6 089 5 781 6 415 6 315 6 178 6 517 6 264 6 880
6 843 6 153 6 680 6 870 7 055 6 602 6 674 6 347 7 065
2 441 2 381 2 366 2 292
2 115 2 083 2 351 2 029 2 362 2 215 2 435 2 383 2 481 2 546 2 541 2 432
2 624 2270 2 608 2 609 3 021 2 654 3 108 3 048 3 016
(a) City Bus Limited operated a franchised bus route from 12 September 1991. (b) KCRC Light Rail was introduced on 18 September 1988.
120 831 122 245 128 677 131 917 127 562 127 644
10 748 II 378 II 070 10 977
10 650 9 385
11 103 10 585 11 562 10 575 11 181 10 297 9 997
10 901 10 468 10 941
9 948 8 833 9 947
10 184 10700 9 636
10 539 10 493 10 385
2 318 170 418 4 762 2637 189 511 5 619 2684 212802 6391 2 708 228 408 7 882 2 828 241 978 10 814 3211 249003 16429
298 324 294 303
249 195 252 285 285 200 268 302 245 343 266 322
221 217 228 237 233 235 258 290 297
20 675 21 118 20 552 20 752
20277 18 428 20400 19 792 20 648 20304 21 333 21 695 21 520 21 814 21 264 21 528
21 243 18 693 20 619 20 217 21 146 20502# 21 178# 21 394# 20 920#
891 870
I 065 I 056
I 049 I OOO I 152 I 091 I 358 I 383 I 449 I 549 l 556 I 665 1511 l 668
I 724 I 610 I 747# 2 153# I 990# 1899# 2104# 2 131# 2087#
(c) KCRC bus was introduced on 6 September 1987. The figure also includes free KCR feeder buses with effect from January 1989.
83 727 43 285 76 474 40 808 74 966 39 911 15 691 41 707 70 531 39 808 55 202 37 907
5 359 5 304 4 955 4 986
4 488 3 936 4 603 4 727 4 756 4 378 4 974 5 241 4 331 4 807 4 418 4 544
4140 3871 4603 4 258 4 388 4097 4 351 4 656 4031
3 039 3 301 3 286 3 634
3 046 2 701 3 238 3 042 3 287 2967 3 251 3 091 3 070 3 436 3 142 3 637
3 056 2 566 3 092 3 080 3 178 2 816 3 046 3 110 2 884
Minor Ferry
Services
Public Light Bus(d) Taxi(e)
6 255 369 742 422 091 6 070 362 906 437 119 5 768 356 616 441 923 5 924 351 259 445 056 6 614 394 584 445 198 6 823 387 232 451 665
510 565 584 581
569 519 592 545 566 535 568 571 556 598 588 617
594 563 586 617 662 607 656 641 632
32 701 33 369 32 301 33 375
33 238 29 986 33 214 32002 32 948 31 815 32 760 32 700 31 581 32 672 31 655 32 660
32 553 28 113 32 360 31 401 32 437 31 263 32 269 32 217 31 183
36 492 37 888 36 924 38 235
38 251 34 625 38 448 37 205 38 346 37 082 38 358 38 375 37 135 38 343 37127 38 371
38 428 34 791 38 573 37 378 38 628 37 364 38 657 38 783 37 619
(d) Estimated figure is based on the daily average extracted from TTSD Survey Report multiplied by the number of licensed PLBs (other than GMBs) and number of days in the month. (e) Estimated figure is based on the Taxi Surveys, having regard to the number of taxis licensed.
Hong Kong Monthly Digest of Statistics October 1991
Thousand
Total
3 215 856 3 321 042 3 410 396 3 504 159 3 566 862 3 587 400
296 002 306 794 300 086 308 200
301 984 273 253 307 135 288 569 303 237 287 363 302 475 300925 295 295 311 213 302 626 313 326
308 328 273 364 307 558# 295 562# 306 014# 286 033# 301 893# 302 292# 296 836#
47
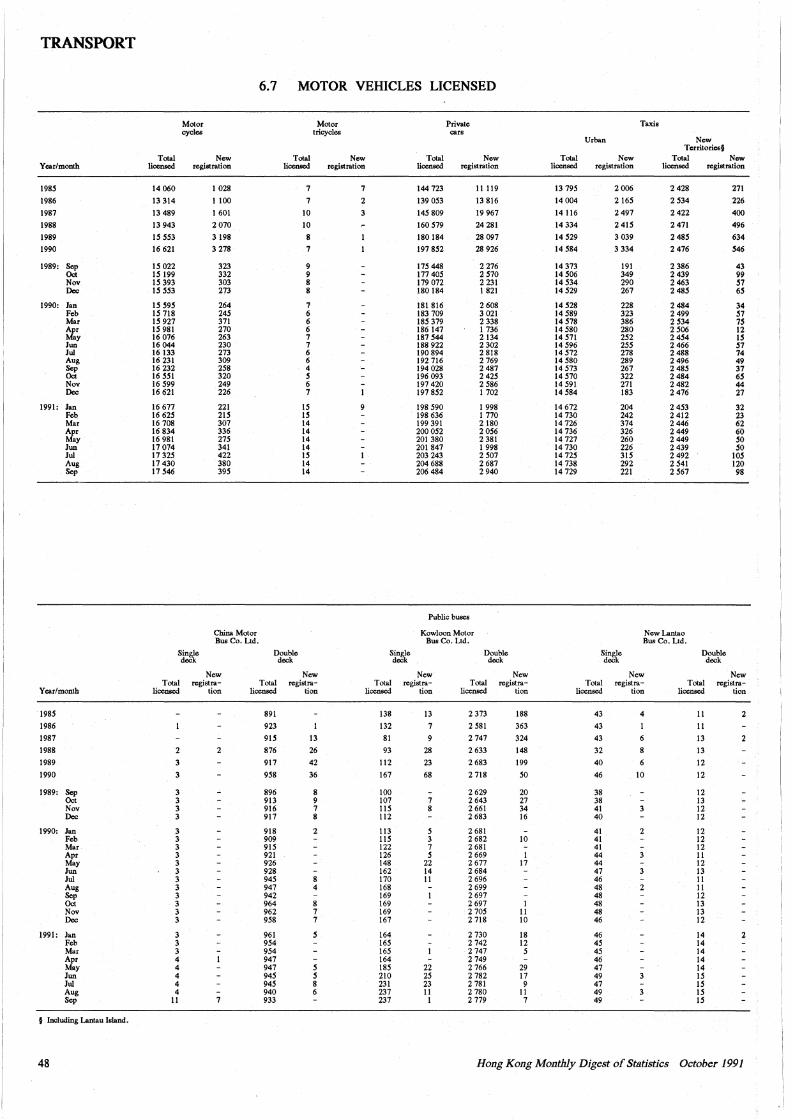
TRANSPORT
6.7 MOTOR VEHICLES LICENSED
Motor Motor Private Taxis cycles tricycles cars
Urban New Territories§
Total New Total New Total New Total New Total New Year/month licensed registration licensed registration licensed registration licensed registration licensed registration
1985 14060 I 028 7 7 144 723 11 119 13 795 2006 2 428 271
1986 13314 I 100 7 2 139 053 13 816 14 004 2165 2 534 226
1987 13 489 1601 10 145 809 19 967 14 116 2 497 2422 400
1988 13 943 2070 10 160 579 24 281 14 334 2 415 2471 496
1989 15 553 3 198 180 184 28 097 14 529 3 039 2 485 634
1990 16 621 3 278 7 197 852 28 926 14 584 3 334 2 476 546
1989: Sep 15 022 323 9 175 448 2 276 14 373 191 2 386 43 Oct 15 199 332 9 177 405 2 570 14 506 349 2 439 99 Nov 15 393 303 8 179 072 2 231 14 534 290 2 463 57 Dec 15 553 273 8 180 184 I 821 14 529 267 2 485 65
1990: Jan 15 595 264 7 181 816 2 608 14 528 228 2 484 34 Feb 15 718 245 6 183 709 3 021 14 589 323 2 499 57 Mar 15 927 371 6 185 379 2 338 14 578 386 2534 75 Apr 15 981 270 6 186 147 I 736 14 580 280 2 506 12 May 16 076 263 7 187 544 2134 14 571 252 2454 15 Jun 16 044 230 7 188 922 2 302 14 596 255 2 466 57 Jui 16 133 273 6 190 894 2818 14572 278 2488 74 Aug 16 231 309 6 192 716 2 769 14 580 289 2 496 49 Sep 16 232 258 4 194 028 2 487 14 573 267 2485 37 Oct 16 551 320 5 196 093 2 425 14 570 322 2 484 65 Nov 16 599 249 6 197 420 2 586 14 591 271 2 482 44 Dec 16 621 226 7 197 852 I 702 i4 584 183 2 476 27
1991: Jan 16 677 221 15 198 590 I 998 14 672 204 2 453 32 Feb 16 625 215 15 198 636 I 770 14 730 242 2 412 23 Mar 16 708 307 14 199 391 2180 14 726 374 2446 62 Apr 16 834 336 14 200 052 2 056 14 736 326 2449 60 May 16 981 275 14 201 380 2 381 14727 260 2449 50 Jun 17074 341 14 201 847 I 998 14 730 226 2 439 50 Jui 17 325 422 15 203 243 2 507 14725 315 2 492 105 Aug 17430 380 14 204 688 2 687 14 738 292 2 541 120 Sep 17 546 395 14 206 484 2 940 14 729 221 2 567 98
Public buses
China Motor Kowloon Motor NewLantao Bus Co. Ltd. Bus Co. Ltd. Bus Co. Ltd.
Sj~e Double Single Double Single Double deck deck deck deck deck
New New New New New New Total registra- Total registra- Total registra- Total registra- Total registra- Total registra-
Year/month licensed lion licensed lion licensed tion licensed tion licensed tion licensed lion
1985 891 138 13 2 373 188 43 II 2
1986 923 132 7 2 581 363 43 11
1987 915 13 81 9 2 747 324 43 13
1988 2 876 26 93 28 2 633 148 32 13
1989 917 42 112 23 2 683 199 40 12
1990 3 958 36 167 68 2 718 50 46 10 12
1989: Sep 3 896 8 100 2 629 20 38 12 Oct 3 913 9 107 7 2 643 27 38 13 Nov 3 916 7 115 8 2 661 34 41 12 Dec 3 917 8 112 2 683 16 40 12
1990: Jan 3 918 2 113 5 2 681 41 2 12 Feb 3 909 115 3 2 682 10 41 12 Mar 3 915 122 7 2 681 41 12 Apr 3 921 126 5 2 669 I 44 II May 3 926 148 22 2 677 17 44 12 Jun 3 928 162 14 2 684 47 13 Jui 3 945 170 II 2 696 46 II Aug 3 947 168 2 699 48 2 II Sep 3 942 169 2 697 48 12 Oct 3 964 8 169 2 697 I 48 13 Nov 3 962 7 169 2 705 11 48 13 Dec 3 958 7 167 2 718 10 46 12
1991: Jan 3 961 164 2 730 18 46 14 2 Feb 3 954 165 2 742 12 45 14 Mar 3 954 165 2 747 s 45 14 Apr 4 947 164 2 749 46 14 May 4 947 185 22 2 766 29 47 14 Jun 4 945 210 25 2 782 17 49 15 Jui 4 945 231 23 2 781 9 47 15 Aug 4 940 237 11 2 780 11 49 15 Sep II 7 933 237 I 2 779 7 49 15
§ Including Lantau Island.
48 Hong Kong Monthly Digest of St11tistics October 1991
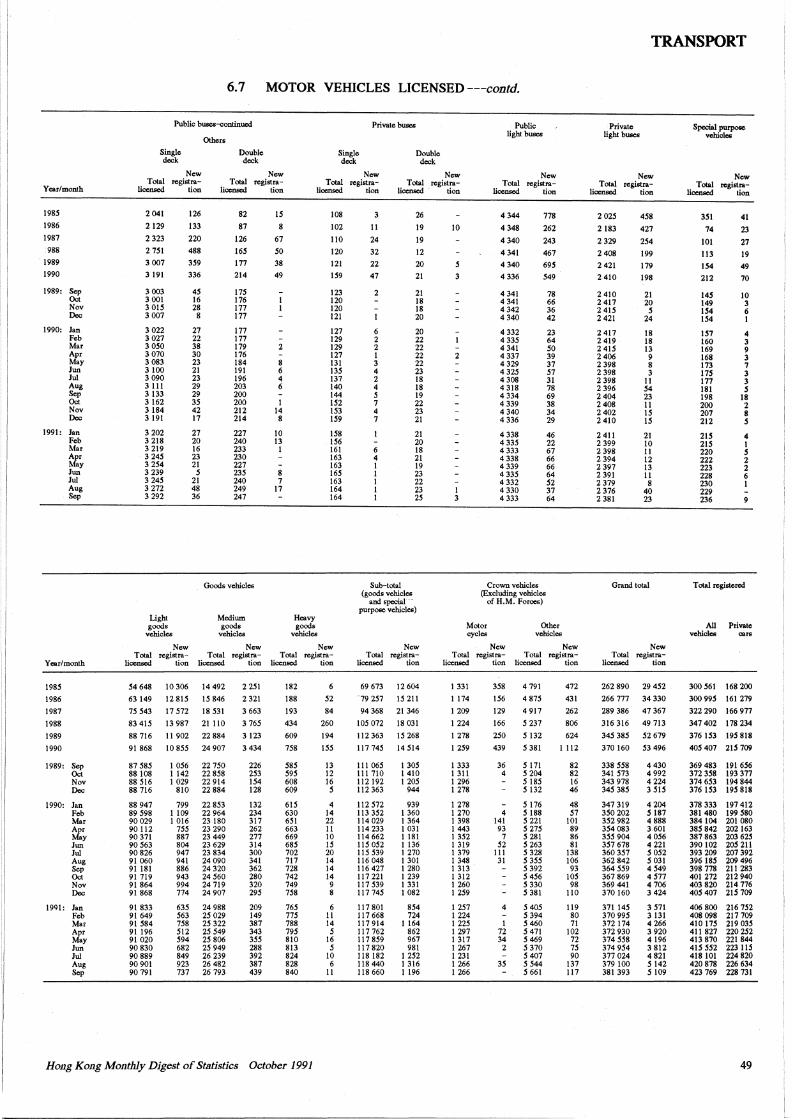
Year/month
1985
1986
1987
988
1989
1990
1989: Sep Oct Nov Dec
1990: Jan Feb Mar Apr May Jun Jui Aug Sep Oct. Nov Dec
1991: Jan Feb Mar Apr May Jun Jui Aug Sep
Year/month
1985
1986
1987
1988
1989
1990
1989: Sep Oct Nov Dec
1990: Jan Feb Mar Apr May Jun Jui Aug Sep Oct Nov Dec
19Ql: Jan Feb Mar Apr May Jun Jui Aug Sep
6. 7 MOTOR VEHICLES LICENSED ---contd.
Public buses-continued Private buses Public light buses
Single deck
New Total registra-
licensed lion
2041
2 129
2 323
2 751
3 007
3 191
3 003 3 001 3 015 3 007
3 022 3 027 3 050 3070 3 083 3100 3 090 3 111 3 133 3 162 3 184 3 191
3 202 3 218 3 219 3 245 3 254 3 239 3 245 3 272 3 292
Light goods
vehicles
New Total registra-
126
133
220
488
359
336
45 16 28
8
27 22 38 30 23 21 23 29 29 35 42 17
27 20 16 23 21 5
21 48 36
Others
Double deck
New Total registra-
licensed tion
82
87
126
165
177
214
175 176 177 177
177 177 179 176 184 191 196 203 200 200 212 214
227 240 233 230 227 235 240 249 247
Goods vehicles
Medium goods
vehicles
15
8
67
50
38
49
2
8 6 4 6
I 14 8
10 13 I
8 7
17
Single deck
New Total registra-
Double deck
New Total registra-
licensed tion licensed tion
Heavy goods
vehicles
108
102
110
120
121
159
123 120 120 121
127 129 129 127 131 135 137 140 144 152 153 159
158 156 161 163 163 165 163 164 164
II
24
32
22
47
2
6 2 2 I 3 4 2 4 5 7 4 7
6 4 I I I I I
26
19
19
12
20
21
21 18 18 20
20 22 22 22 22 23 18 18 19 22 23 21
21 20 18 21 19 23 22 23 25
Sub-total (goods vehicles
and special purpose vehicles)
10
5
2
New Total registra-
licensed tion
4 344
4 348
4 340
4 341
4 340
4 336
4 341 4 341 4 342 4 340
4 332 4 335 4 341 4 337 4 329 4 325 4 308 4 318 4 334 4 339 4 340 4 336
4 338 4 335 4 333 4 338 4 339 4 335 4 332 4 330 4 333
778
262
243
467
695
549
78 66 36 42
23 64 50 39 37 57 31 78 69 38 34 29
46 22 67 66 66 64 52 37 64
Crown vehicles (Excluding vehicles
of H.M. Forces)
Motor cycles
Other vehicles
New Total registra-
New Total registra-
New Total registra-
New Total registra-
New Total registra-
licensed tion licensed lion licenscd tion licensed tion licenscd tion licenscd tion
54648 10306 14492
63 149
75 543
83 415
88 716
91 868
87 585 88 108 88 516 88 716
88 947 89 598 90 029 90 112 90 371 90 563 90 826 91 060 91 181 91 719 91 864 91 868
91 833 91 649 91 584 91 196 91 020 90 830 90 889 90 901 90 791
12 815
17 572
13 987
11902
10 855
l 056 l 142 I 029
810
799 I 109 I 016
755 887 804 947 941 886 943 994 774
635 563 758 512 594 682 849 923 737
15 846
18 531
21110
22 884
24 907
22 750 22 858 22 914 22 884
22 853 22 964 23 180 23 290 23 449 23 629 23 834 24 090 24 320 24 560 24 719 24 907
24 988 25 029 25 322 25 549 25 806 25 949 26 239 26 482 26 793
2 251
2 321
3 663
3 765
3 123
3 434
226 253 154 128
132 234 317 262 277 314 300 341 362 280 320 295
209 149 387 343 355 288 392 387 439
182
188
193
434
609
758
585 595 608 609
615 630 651 663 669 685 702 717 728 742 749 758
765 775 788 795 810 813 824 828 840
52
84
260
194
155
13 12 16 5
4 14 22 11 10 15 20 14 14 14 9 8
6 11 14 5
16 5
10 6
11
69673 12604
-79 257
94 368
105 072
112 363
117 745
111 065 111 710 112 192 112 363
112572 113 352 114 029 114 233 114 662 115 052 115 539 116 048 116 427 117 221 117 539 117 745
117 801 117 668 117 914 117 762 117 859 117 820 118 182 118 440 118 660
15 211
21 346
18 031
15 268
14 514
I 305 1410 I 205
944
939 l 360 I 364 I 031 I 181 I 136 I 270 I 301 I 280 I 239 I 331 I 082
854 724
1164 862 967 981
I 252 I 316 I 196
l 331
l 174
I 209
I 224
I 278
I 259
I 333 I 311 I 296 I 278
I 278 1270 I 398 I 443 I 352 I 319 I 379 I 348 I 313 I 312 I 260 I 259
I 257 I 224 I 225 I 297 I 317 I 267 I 231 I 266 I 266
358
156
129
166
250
439
36 4
4 141 93
7 52
111 31
4
I 72 34 2
35
4 791
4 875
4 917
5 237
5 132
5 381
5 171 5 204 5 185 5 132
5 176 5 188 5 221 5 275 5 281 5 263 5 328 5 355 5 392 5 456 5 330 5 381
5 405 5 394 5 460 5 471 5 469 5 370 5 407 5 544 5 661
472
431
262
806
624
l 112
82 82 16 46
48 57
101 89 86 81
138 106 93
105 98
110
119 80 71
102 72 75 90
137 117
Hong Kong Monthly Digest of Statistics October 1991
TRANSPORT
Private light buses
New Total registra-
licensed tion
2 025
2 183
2 329
2408
2 421
2410
2410 2417 2415 2421
2417 2419 2 415 2 406 2 398 2 398 2 398 2 396 2404 2 408 2402 2410
2 411 2 399 2 398 2 394 2 397 2 391 2 379 2 376 2 381
458
427
254
199
179
198
21 20
5 24
18 18 13 9 8 3
11 54 23 11 15 15
21 10 11 12 13 11 8
40 23
Grand total
New Total registra-
licensed tion
262 890 29 452
266 777
289 386
316 316
345 385
370 160
338 558 341 573 343 978 345 385
347 319 350 202 352 982 354 083 355 904 357 678 360 357 362 842 364 559 367 869 369 441 370 160
371145 370 995 372 174 372 930 374 558 374 954 377 024 379 100 381 393
34 330
47 367
49 713
52 679
53 496
4430 4992 4 224 3 515
4 204 5 187 4 888 3 601 4 056 4 221 5 052 5 031 4 549 4 577 4 706 3 424
3 571 3 131 4 266 3 920 4196 3 812 4 821 5 142 5 109
Special purpose vchicleo
New Total registra-
licensed lion
351
74
101
113
154
212
145 149 154 154
157 160 169 168 173 175 177 181 198 200 207 212
215 215 220 222 223 228 230 229 236
41
23
27
19
49
70
10 3 6 I
4 3 9 3 7 3 3 5
18 2 8 5
4 I 5 2 2 6 I
Total registered
All Private vehicles cars
300 561 168 200
300 995 161 279
322 290 166 977
347 402 178 234
376 153 195 818
405 407 215 709
369 483 191 656 372358 193377 374653 194844 376 153 195 818
378 333 197 412 381 480 199 580 384 I 04 201 080 385 842 202 163 387 863 203 625 390 I 02 205 211 393 209 207 392 396 185 209 496 398 778 2ll 283 401 272 212 940 403 820 214 776 405 407 215 709
406 800 216 752 408 098 217 709 410175 219035 411 827 220 252 413 870 221 844 415 552 223 115 418 101 224 820 420 878 226 634 423 769 228 731
49
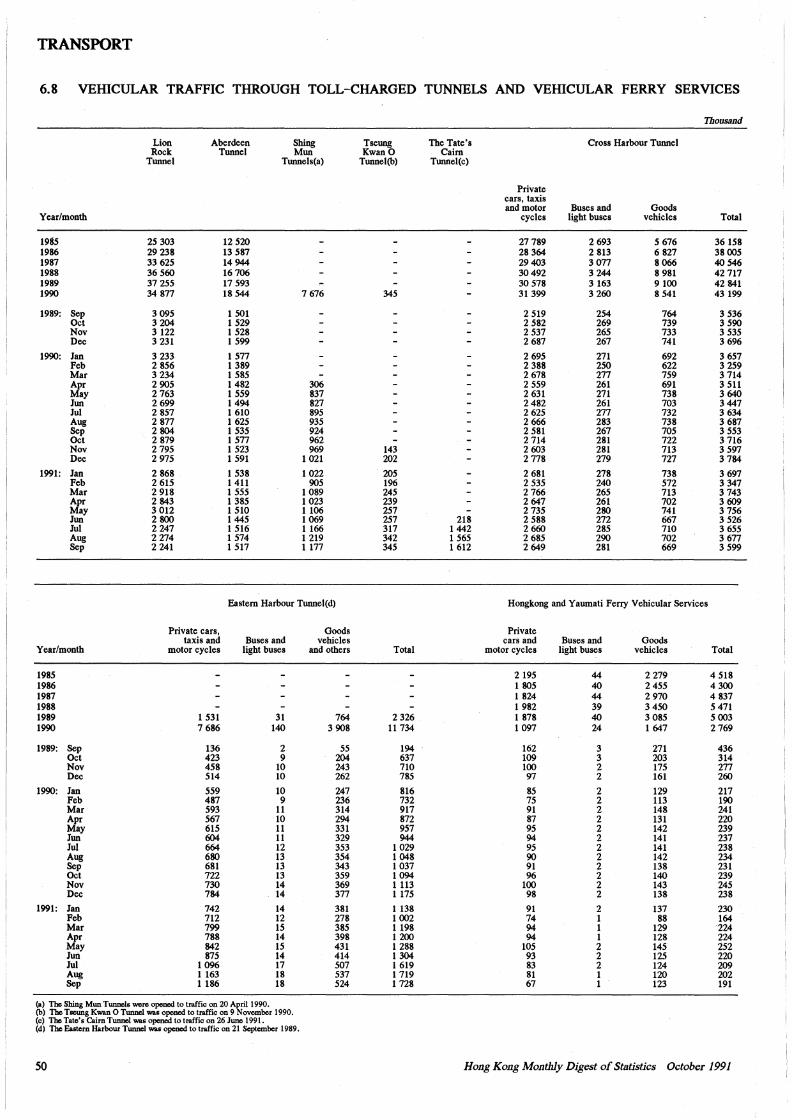
TRANSPORT
6.8 VEHICULAR TRAFFIC THROUGH TOLL-CHARGED TUNNELS AND VEHICULAR FERRY SERVICES
Thousand
Lion Aberdeen Shing Tseung The Tate's Cross Harbour Tunnel Rock Tunnel Mun KwanO Cairn
Tunnel Tunnels( a) Tunnel(b) Tunnel(c)
Private cars, taxis and motor Buses and Goods
Year/month cycles light buses vehicles Total
1985 25 303 12 520 27789 2 693 5 676 36 158 1986 29 238 13 587 28 364 2 813 6 827 38005 1987 33 625 14 944 29403 3077 8066 40546 1988 36 560 16706 30492 3 244 8 981 42 717 1989 37 255 17 593 30 578 3 163 9 100 42 841 1990 34 877 18 544 7 676 345 31 399 3 260 8 541 43 199
1989: Sep 3095 1 501 2 519 254 764 3 536 Oct 3 204 1 529 2 582 269 739 3 590 Nov 3 122 1 528 2 537 265 733 3 535 Dec 3 231 1 599 2 687 267 741 3 696
1990: Jan 3 233 1 577 2 695 271 692 3 657 Feb 2 856 1389 2 388 250 622 3 259 Mar 3 234 1585 2 678 277 759 3 714 Apr 2 905 1482 306 2 559 261 691 3 511 May 2 763 1 559 837 2 631 271 738 3 640 Jun 2 699 1494 827 2 482 261 703 3 447 Jui 2 857 1 610 895 2 625 277 732 3 634 Aug 2 877 1 625 935 2 666 283 738 3 687 Sep 2 804 1 535 924 2 581 267 705 3 553 Oct 2 879 1 577 962 2 714 281 722 3 716 Nov 2 795 1 523 969 143 2 603 281 713 3 597 Dec 2 975 1 591 1 021 202 2 778 279 727 3 784
1991: Jan 2 868 1 538 1 022 205 2 681 278 738 3 697 Feb 2 615 1411 905 196 2 535 240 572 3 347 Mar 2 918 1 555 1 089 245 2 766 265 713 3 743 Apr 2 843 1 385 1 023 239 2 647 261 702 3 609 May 3 012 1 510 1106 257 2 735 280 741 3756 Jun 2 800 1 445 1 069 257 218 2 588 272 667 3 526 Jui 2 247 1 516 1166 317 1442 2 660 285 710 3 655 Aug 2 274 1574 1 219 342 1 565 2 685 290 702 3 677 Sep 2 241 1 517 1 177 345 1 612 2 649 281 669 3 599
Eastern Harbour Tunnel(d) Hongkong and Yaumati Ferry Vehicular Services
Private cars, Goods Private taxis and Buses and vehicles cars and Buses and Goods
Year/month motor cycles light buses and others Total motor cycles light buses vehicles Total
1985 2 195 44 2 279 4 518 1986 1 805 40 2 455 4300 1987 1 824 44 2970 4 837 1988 1982 39 3450 5 471 1989 1 531 31 764 2 326 1 878 40 3 085 5 003 1990 7 686 140 3 908 11 734 1097 24 1 647 2 769
1989: Sep 136 2 55 194 162 3 271 436 Oct 423 9 204 637 109 3 203 314 Nov 458 10 243 710 100 2 175 277 Dec 514 10 262 785 97 2 161 260
1990: Jan 559 10 247 816 85 2 129 217 Feb 487 9 236 732 75 2 113 190 Mar 593 11 314 917 91 2 148 241 Apr 567 10 294 872 87 2 131 220 May 615 11 331 957 95 2 142 239 Jun 604 11 329 944 94 2 141 237 Jul 664 12 353 1029 95 2 141 238 Aug 680 13 354 1 048 90 2 142 234 Sep 681 13 343 1037 91 2 138 231 Oct 722 13 359 1094 96 2 140 239 Nov 730 14 369 1 113 100 2 143 245 Dec 784 14 377 1 175 98 2 138 238
1991: Jan 742 14 381 1 138 91 2 137 230 Feb 712 12 278 1002 74 1 88 164 Mar 799 15 385 1 198 94 1 129 224 Apr 788 14 398 1200 94 1 128 224 May 842 15 431 1 288 105 2 145 252 Jun 875 14 414 1 304 93 2 125 220 Jui 1096 17 507 1 619 83 2 124 209 Aug 1 163 18 537 1 719 81 1 120 202 Sep 1 186 18 524 1 728 67 1 123 191
(a) The Shing Mun Tunnels were opened to traffic on 20 April 1990. (b) The Tseung Kwan 0 Tunnel was opened to traffic on 9 November 1990. (c) The Tate's Cairn Tunnel was opened to traffic on 26 June 1991. (d) The Eastern Harbour Tunnel was opened to traffic on 21 September 1989.
50 Hong Kong Monthly Digest of Statistics October 1991
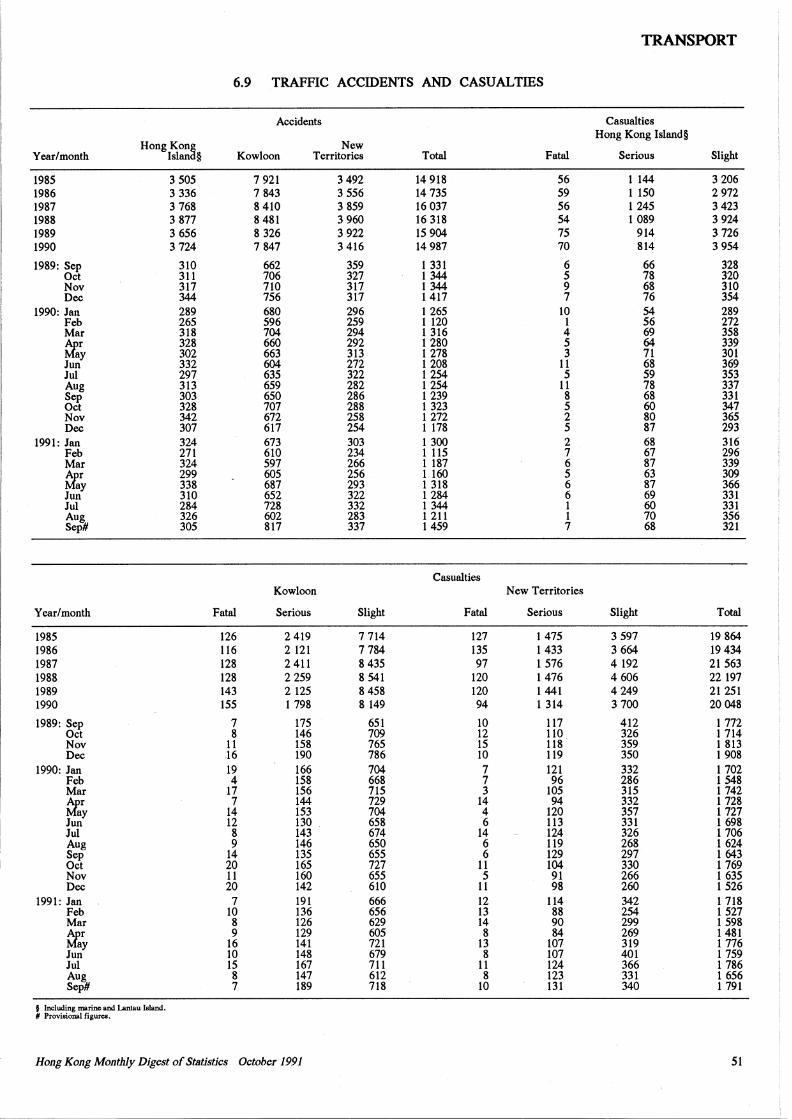
TRANSPORT
6.9 TRAFFIC ACCIDENTS AND CASUALTIES
Accidents Casualties
Hong Kon~ New Hong Kong Island§
Year/month Islan § Kowloon Territories Total Fatal Serious Slight
1985 3 505 7 921 3492 14 918 56 1144 3 206 1986 3 336 7 843 3 556 14 735 59 1 150 2972 1987 3 768 8 410 3 859 16 037 56 1245 3 423 1988 3 877 8 481 3 960 16 318 54 1 089 3 924 1989 3 656 8 326 3 922 15 904 75 914 3 726 1990 3 724 7 847 3 416 14 987 70 814 3 954
1989: Sep 310 662 359 1 331 6 66 328 Oct 311 706 327 1344 5 78 320 Nov 317 710 317 1 344 9 68 310 Dec 344 756 317 1417 7 76 354
1990: Jan 289 680 296 1265 10 54 289 Feb 265 596 259 1 120 1 56 272 Mar 318 704 294 1 316 4 69 358
~r 328 660 292 1280 5 64 339 ay 302 663 313 1278 3 71 301
Jun 332 604 272 1208 11 68 369 Jul 297 635 322 1254 5 59 353 Aug 313 659 282 1254 11 78 337 Sep 303 650 286 1 239 8 68 331 Oct 328 707 288 1 323 5 60 347 Nov 342 672 258 1 272 2 80 365 Dec 307 617 254 1 178 5 87 293
1991: Jan 324 673 303 1 300 2 68 316 Feb 271 610 234 1 115 7 67 296 Mar 324 597 266 1 187 6 87 339
~r 299 605 256 1 160 5 63 309 ay 338 687 293 1 318 6 87 366
Jun 310 652 322 1284 6 69 331 Jul 284 728 332 1 344 l 60 331 Aug 326 602 283 1 211 1 70 356 SeP# 305 817 337 1459 7 68 321
Casualties Kowloon New Territories
Year/month Fatal Serious Slight Fatal Serious Slight Total
1985 126 2 419 7714 127 1475 3 597 19 864 1986 116 2 121 7 784 135 1433 3 664 19 434 1987 128 2 411 8 435 97 1576 4 192 21563 1988 128 2 259 8 541 120 1476 4606 22197 1989 143 2 125 8 458 120 1441 4249 21 251 1990 155 1 798 8 149 94 1 314 3 700 20048
1989: Sep 7 175 651 10 117 412 1 772 Oct 8 146 709 12 110 326 1 714 Nov 11 158 165 15 118 359 1 813 Dec 16 190 786 10 119 350 1908
1990: Jan 19 166 704 7 121 332 1 702 Feb 4 158 668 7 96 286 1548 Mar 17 156 715 3 105 315 1 742
~~ 7 144 729 14 94 332 1 728 14 153 704 4 120 357 1 727
Jun 12 130 . 658 6 113 331 1 698 Jul 8 143 674 14 124 326 1 706 Aug 9 146 650 6 119 268 1624 Sep 14 135 655 6 129 297 1643 Oct 20 165 727 11 104 330 1 769 Nov 11 160 655 5 91 266 1 635 Dec 20 142 610 11 98 260 1 526
1991: Jan 7 191 666 12 114 342 1 718 Feb 10 136 656 13 88 254 1527 Mar 8 126 629 14 90 299 1 598
~~ 9 129 605 8 84 269 1481 16 141 721 13 107- 319 1 776
Jun 10 148 679 8 107 401 1 759 Jul 15 167 711 11 124 366 1 786 Aug 8 147 612 8 123 331 1656 Sep# 7 189 718 10 131 340 1 791
f Including marine and Lantau Island. II .Provisional figureo.
Hong Kong Monthly Digest of Statistics October 1991 51
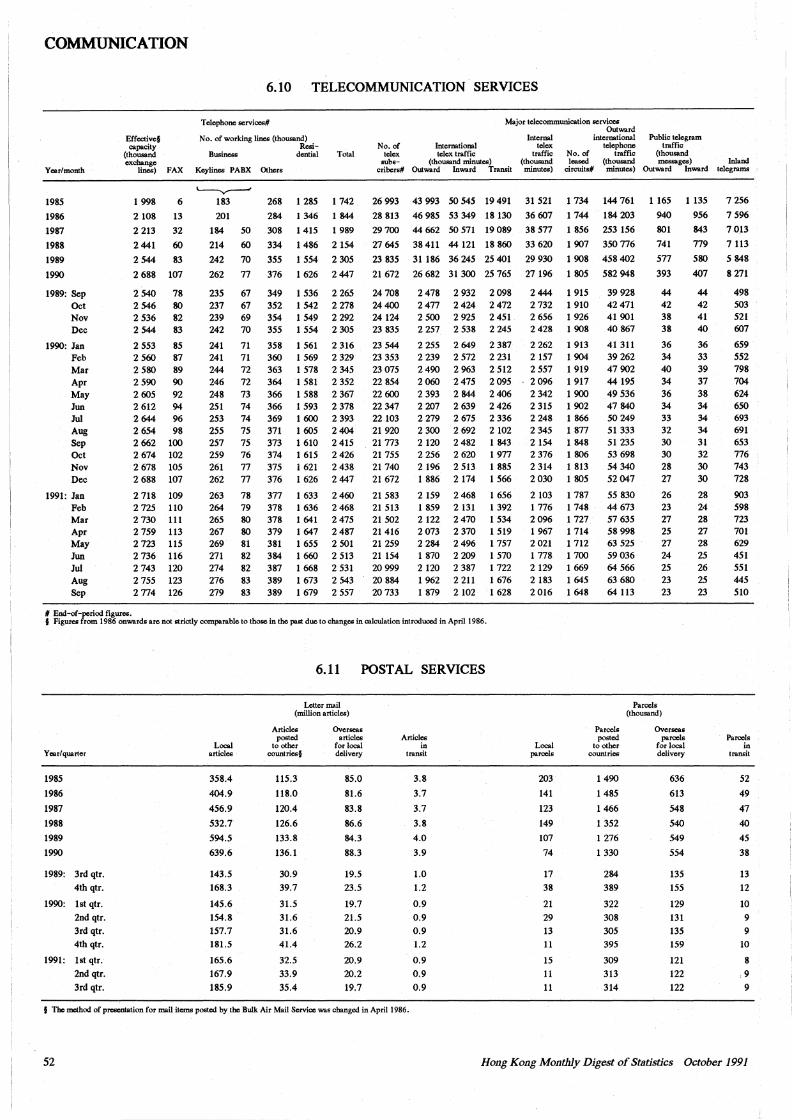
COMMUNICATION
Year/month
Effective§ capo.city
(thousand exchange
lines) FAX
6.10 TELECOMMUNICATION SERVICES
Telephone services#
No. of working lines (thousand) Resi-
Busincss dential
Keylines PABX Others
~
Total
Major telecommunication services
No. of International telex telex traffic
subs- (thousand minutes) cribers# Outwsrd lnwsrd Transit
Internal telex
traffic (thousand minutes)
Outwsrd international
telephone No. of traffic lessed (thousand
circuits# minutes)
Public telegram traffic
(thousand messages)
Outward Inward Inland
telegrams
1985 1 998 6 183 268 1 285 1 742 26 993 43 993 50 545 19 491 31 521 1 734 144 761 1 165 1 135 7 256
1986
1987
1988
1989
1990
1989: Sep Oct Nov Dec
1990: Jan Feb Mar Apr May Jun Jui Aug Sep Oct Nov Dec
1991: Jan Feb Mar Apr May Jun Jui Aug Sep
# End-of-period figure&.
2 108 13 201 284 1 346 1 844 28 813 46 985 53 349 18 130 36 607 l 744 184 203 940 956 7 596
2 213 32
2 441 60
2 544 83
2 688 107
2 540 78 2 546 80 2 536 82 2 544 83
2 553 85 2 560 87 2 580 89 2 590 90 2 605 92 2 612 94 2 644 96 2 654 98 2 662 100 2 674 102 2 678 105 2 688 107
2 718 109 2 725 110 2 730 111 2 759 113 2 723 115 2 736 116 2 743 120 2 755 123 2 774 126
184
214
242
262
235 237 239 242
241 241 244 246 248 251 253 255 257 259 261 262
263 264 265 267 269 271 274 276 279
50
60
70
77
67 67 69 70
71 71 72 72 73 74 74 75 75 76 77 77
78 79 80 80 81 82 82 83 83
308
334
355
376
349 352 354 355
358 360 363 364 366 366 369 371 373 374 375 376
377 378 378 379 381 384 387 389 389
1 415
1 486
1 554
1626
1536 1 542 1549 1554
1 561 1 569 I 578 1 581 I 588 l 593 1 600 1 605 1 610 1 615 1 621 1 626
1 633 1 636 1 641 1 647 1 655 1 660 1 668 1673 1679
1 989
2 154
2 305
2447
2 265 2 278 2 292 2305
2 316 2 329 2 345 2 352 2 367 2 378 2 393 2404 2 415 2426 2 438 2447
2460 2468 2475 2487 2 501 2 513 2 531 2 543 2 557
29700
27 645
23 835
21 672
24708 24400 24 124 23 835
23 544 23 353 23 075 22 854 22 600 22 347 22 103 21920 21 773 21 755 21 740 21 672
21 583 21 513 21 502 21416 21 259 21154 20 999 20 884 20 733
44 662 50 571 19 089
38 411 44 121 18 860
31 186 36 245 25 401
26 682 31 300 25 765
2478 2477 2 500 2 257
2 255 2 239 2490 2060 2 393 2 207 2 279 2 300 2 120 2 256 2196 1 886
2 159 1 859 2 122 2073 2 284 1 870 2 120 1 962 1 879
2 932 2424 2 925 2 538
2 649 2 572 2 963 2475 2 844 2 639 2 675 2 692 2 482 2 620 2 513 2174
2468 2 131 2470 2 370 2496 2 209 2 387 2 211 2 102
2 098 2472 2 451 2 245
2 387 2 231 2 512 2095 2406 2426 2 336 2 102 1 843 1977 1 885 1566
1 656 1 392 1 534 1 519 1 757 1 570 1 722 1676 1 628
38 577
33 620
29 930
27196
2444 2 732 2 656 2 428
2 262 2 157 2 557 2096 2 342 2 315 2 248 2 345 2154 2 376 2 314 2030
2103 1 776 2096 1 967 2 021 1 778 2 129 2183 2 016
1 856
1 907
1 908
1 805
1 915 1 910 1 926 l 908
1 913 1904 1919 1 917 1900 1 902 1 866 1 877 1 848 l 806 1 813 1 805
1 787 1 748 1 727 1 714 1 712 1 700 1 669 1 645 1 648
253 156
350 776
458 402
582 948
39 928 42471 41 901 40 867
41 311 39262 47 902 44195 49 536 47 840 50 249 51 333 51 235 53 698 54 340 52047
55 830 44 673 57 635 58 998 63 525 59036 64 566 63 680 64 113
801
741
577
393
44 42 38 38
36 34 40 34 36 34 33 32 30 30 28 27
26 23 27 25 27 24 25 23 23
843
779
580
407
44 42 41 40
36 33 39 37 38 34 34 34 31 32 30 30
28 24 28 27 28 25 26 25 23
7013
7113
5 848
8 271
498 503 521 607
659 552 798 704 624 650 693 691 653 776 743 728
903 598 723 701 629 451 551 445 510
§ Figures from 1986 onwards are not strictly comparable to those in the past due to changes in calculation introduced in April 1986.
Y car/ quarter
1985
1986
1987
1988
1989
1990
1989: 3rd qtr.
4th qtr.
1990: lst qtr.
2nd qtr.
3rd qtr.
4th qtr.
1991: lst qtr.
2nd qtr.
3rd qtr.
Local articles
358.4
404.9
456.9
532.7
594.5
639.6
143.5
168.3
145.6
154.8
157.7
181.5
165.6
167.9
185.9
6.11 POSTAL SERVICES
Letter mail Parcels (million articles) (thousand)
Articles posted
to other countries§
115.3
118.0
120.4
126.6
133.8
136.1
30.9
39.7
31.5
31.6
31.6
41.4
32.5
33.9
35.4
Overseas articles
for local delivery
85.0
81.6
83.8
86.6
84.3
88.3
19.5
23.5
19.7
21.5 20.9
26.2
20.9
20.2
19.7
Articles in
transit
3.8
3.7
3.7
3.8
4.0
3.9
1.0
1.2
0.9
0.9
0.9
1.2
0.9
0.9
0.9
Local po.reels
203
141
123
149
107
74
17
38
21
29
13
11
15
11
11
Parcels posted
to other countries
1490
1 485
l 466
1 352
1 276
1 330
284
389
322
308
305
395
309
313
314
Overseas po.reels
for local delivery
636
613
548
540
549
554
135
155
129
131
135
159
121
122
122
Parcels in
transit
52
49
47
40
45
38
13
12
10
9
9
10
8
,9
9
f The method of presentation for mail items posted by the Bulk Air Mail Service wss changed in April 1986.
52 Hong Kong Monthly Digest of St11tistics October 1991
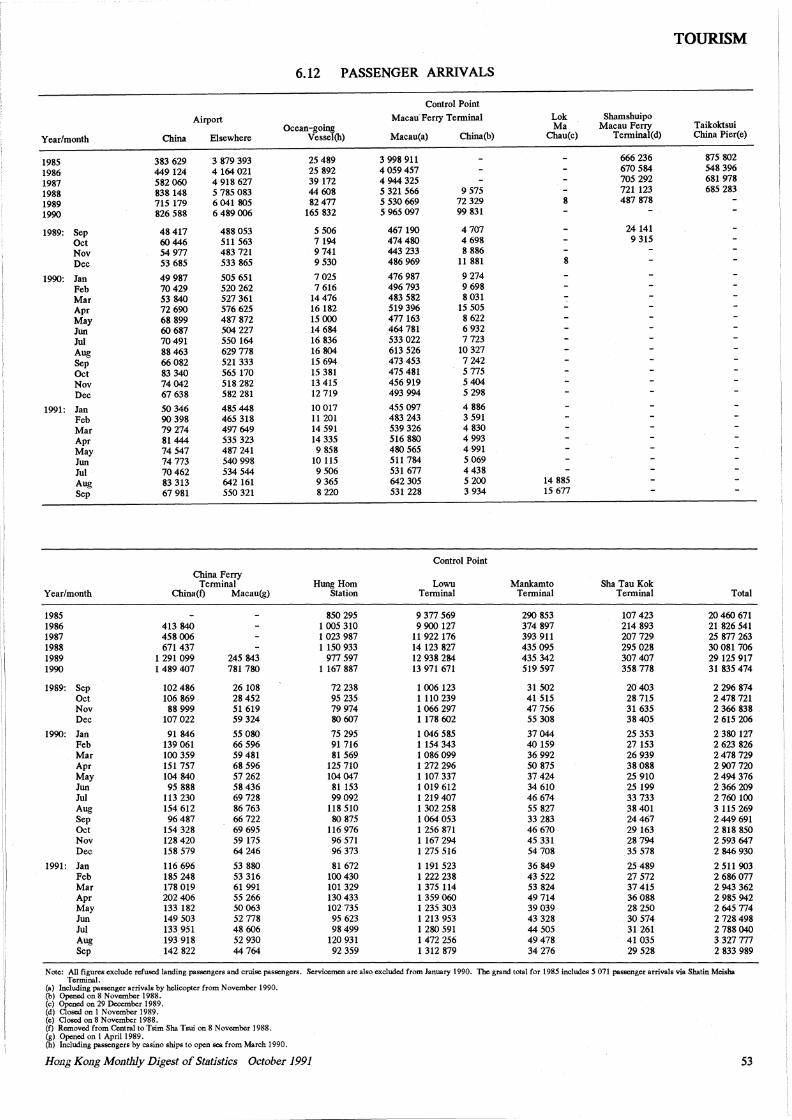
TOURISM
6.12 PASSENGER ARRIVALS
Control Point
Airport Macau Ferry Terminal Lok Shamshuipo Ocean-going Ma Macau Ferry Taikoktsui
Year/month China Elsewhere Vessel(h) Macau( a) China(b) Chau(c) Terminal(d) China Pier(e)
1985 383 629 3 879 393 25 489 3 998 911 666 236 875 802
1986 449 124 4 164 021 25 892 4 059 457 670 584 548 396
1987 582 060 4 918 627 39172 4 944 325 705 292 681 978
1988 838 148 5 785 083 44 608 5 321 566 9 575 721 123 685 283
1989 715 179 6 041 805 82477 5 530 669 72 329 8 487 878
1990 826 588 6 489 006 165 832 5 965 097 99 831
1989: Sep 48 417 488 053 5 506 467 190 4 707 24 141
Oct 60446 511 563 7 194 474 480 4 698 9 315
Nov 54 977 483 721 9 741 443 233 8 886
i Dec 53 685 533 865 9 530 486 969 11 881 8 ! I
49 987 505 651 7025 476 987 9 274 1990: Jan Feb 70429 520 262 7 616 496 793 9 698
Mar 53 840 527 361 14 476 483 582 8 031
'i Apr 72 690 576 625 16 182 519 396 15 505
May 68 899 487 872 15 OOO 477 163 8 622
Jun 60 687 504 227 14 684 464 781 6 932 '' ! Jui 70 491 550 164 16 836 533 022 7723
Aug 88 463 629 778 16 804 613 526 10 327
Sep 66082 521 333 15 694 473 453 7 242
Oct 83 340 565 170 15 381 475 481 5 775
Nov 74042 518 282 13 415 456 919 5 404
I Dec 67 638 582 281 12 719 493 994 5 298 I,
1991: Jan 50 346 485 448 10 017 455 097 4 886
Feb 90 398 465 318 11 201 483 243 3 591
Mar 79 274 497 649 14 591 539 326 4 830 '' Apr 81444 535 323 14 335 516 880 4 993 I'
May 74 547 487 241 9 858 480 565 4 991
Jun 74 773 540 998 10 115 511 784 5 069
Jui 70462 534 544 9 506 531 677 4 438
Aug 83 313 642 161 9 365 642 305 5 200 14 885
Sep 67 981 550 321 8 220 531 228 3 934 15 677
ii
Control Point
China Ferry Terminal Hung Hom Lowu Mankamto Sha Tau Kok
Year/month China(f) Macau(g) Station Terminal Terminal Terminal Total
1985 850 295 9 377 569 290 853 107 423 20 460 671
" 1986 413 840 1 005 310 9 900 127 374 897 214 893 21826541 :1 1987 458 006 1 023 987 11922176 393 911 207729 25 877 263
1988 671 437 1150 933 14 123 827 435 095 295 028 30 081 706
11 1989 1 291 099 245 843 977 597 12 938 284 435 342 307 407 29 125 917 :i 1990 1489407 781 780 1 167 887 13 971 671 519 597 358 778 31835474
I ,, 1989: Sep 102 486 26 108 72 238 1006123 31 502 20 403 2 296 874 ! Oct 106 869 28 452 95 235 1 110 239 41 515 28 715 2 478 721
Nov 88 999 51 619 79 974 1 066 297 47 756 31 635 2 366 838 Dec 107 022 59 324 80607 1 178 602 55 308 38 405 2 615 206
1990: Jan 91 846 55 080 75 295 1 046 585 37044 25 353 2 380 127 Feb 139 061 66 596 91 716 1 154 343 40 159 27 153 2 623 826 Mar 100 359 59 481 81 569 1086099 36 992 26 939 2 478 729 Apr 151 757 68 596 125 710 1 272 296 50 875 38 088 2 907 720 May 104 840 57 262 104 047 1 107 337 37 424 25 910 2 494 376 Jun 95 888 58 436 81153 l 019 612 34 610 25 199 2 366 209 Jui 113 230 69 728 99092 1219407 46 674 33 733 2 760 100 Aug 154 612 86 763 118 510 1302258 55 827 38 401 3 115 269 Sep 96 487 66 722 80 875 1064053 33 283 24 467 2 449 691 Oct 154 328 69 695 116 976 1 256 871 46 670 29 163 2 818 850 Nov 128 420 59 175 96 571 1167 294 45 331 28 794 2 593 647 Dec 158 579 64 246 96 373 1 275 516 54 708 35 578 2 846 930
1991: Jan 116 696 53 880 81 672 1 191 523 36 849 25 489 2 511 903 Feb 185 248 53 316 100 430 1 222 238 43 522 27 572 2 686 077 Mar 178 019 61 991 101 329 1 375 114 53 824 37 415 2 943 362 Apr 202 406 55 266 130 433 1 359 060 49714 36 088 2 985 942 May 133 182 50 063 102 735 1 235 303 39 039 28 250 2 645 774 Jun 149 503 52 778 95 623 1 213 953 43 328 30 574 2 728 498 Jui 133 951 48 606 98499 1 280 591 44 505 31 261 2 788 040 Aug 193 918 52 930 120 931 1 472 256 49478 41 035 3 327 777 Sep 142 822 44 764 92 359 1 312 879 34 276 29 528 2 833 989
Note: All figures exclude refused landing passengers and cruise passengers. Servicemen are also excluded from January 1990. The grand total for 1985 includes 5 071 passenger arrivals via Shatin Meisha Terminal.
(a) Including passenger arrivals by helicopter from November 1990. (b) Opened on 8 November 1988. (c) Opened on 29 December 1989. (d) Closed on l November 1989. (e) Closed on 8 November 1988. (f) Removed from Centralto Tsim Sha Tsui on 8 November 1988. {g) Opened on 1 April 1989. (h) Including passengers by casino ships to open sea from March 1990.
Hong Kong Monthly Digest of Statistics October 1991 53
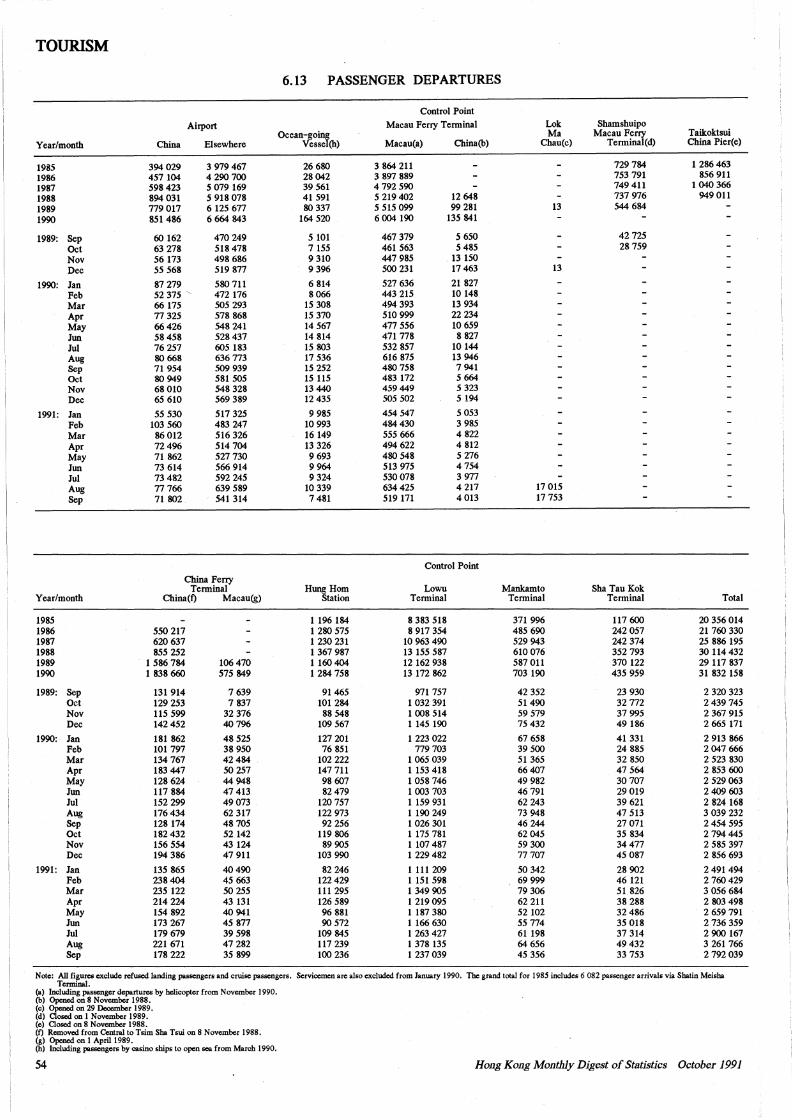
TOURISM
6.13 PASSENGER DEPARTURES
Control Point
Airport Macau Feny Terminal Lok Shamshuipo Ocean-going Ma Macau Feny Taikoktsui
Year/month China Elsewhere Vessel(h) Macau( a) China(b) Chau(c) Terminal(d) China Pier(e)
1985 394 029 3 979 467 26 680 3 864 211 729 784 1286463
1986 457 104 4 290 700 28042 3 897 889 753 791 856 911
1987 598 423 5 079 169 39 561 4 792 590 749 411 1040366
1988 894 031 5 918 078 41591 5 219 402 12 648 737 976 949 011
1989 779 017 6 125 677 80 337 5 515 099 99 281 13 544 684
1990 851 486 6 664 843 164 520 6 004 190 135 841
1989: Sep 60 162 470 249 5 101 467 379 5 650 42 725
Oct 63 278 518 478 7 155 461 563 5 485 28 759 Nov 56173 498 686 9 310 447 985 13 150 Dec 55 568 519 877 9 396 500 231 17 463 13
1990: Jan 87 279 580 711 6 814 527 636 21 827 Feb 52 375 472 176 8066 443 215 10 148 Mar 66 175 505 293 15 308 494 393 13 934 Apr 77 325 578 868 15 370 510 999 22 234 May 66426 548 241 14 567 477 556 10 659 Jun 58 458 528 437 14 814 471 778 8 827 Jui 76 257 605 183 15 803 532 857 10 144 Aug 80 668 636 773 17 536 616 875 13 946 Sep 71954 509 939 15 252 480 758 7 941 Oct 80 949 581 505 15 115 483 172 5 664 Nov 68 010 548 328 13 440 459 449 5 323 Dec 65 610 569 389 12 435 505 502 5 194
1991: Jan 55 530 517 325 9 985 454 547 5 053 Feb 103 560 483 247 10 993 484 430 3 985 Mar 86 012 516 326 16 149 555 666 4 822 Apr 72496 514 704 13 326 494 622 4 812 May 71 862 527 730 9 693 480 548 5 276 Jun 73 614 566 914 9 964 513 975 4754 Jui 73 482 592 245 9 324 530 078 3 977 Aug 77 766 639 589 10 339 634 425 4 217 17 015 Sep 71 802 541 314 7 481 519 171 4013 17 753
Control Point
China Feny Terminal Hung Hom Lowu Mankamto Sha Tau Kok
Year/month China(t) Macau(g) Station Terminal Terminal Terminal Total
1985 1 196 184 8 383 518 371 996 117 600 20 356 014 1986 550 217 1 280 575 8 917 354 485 690 242 057 21 760 330 1987 620 637 1 230 231 10 963 490 529 943 242 374 25 886 195 1988 855 252 1 367 987 13 155 587 610 076 352 793 30 114 432 1989 1586784 106 470 1 160 404 12 162 938 587 011 370 122 29 117 837 1990 1 838 660 575 849 1284758 13 172 862 703 190 435 959 31832158
1989: Sep 131 914 7 639 91465 971 757 42 352 23 930 2 320 323 Oct 129 253 7 837 101 284 1032391 51490 32 772 2 439 745 Nov 115 599 32 376 88 548 1 008 514 59 579 37 995 2 367 915 Dec 142 452 40796 109 567 1 145 190 75 432 49 186 2 665 171
1990: Jan 181 862 48 525 127 201 1 223 022 67 658 41 331 2 913 866 Feb 101 797 38 950 76 851 779 703 39 500 24 885 2 047 666 Mar 134 767 42484 102 222 1065039 51 365 32 850 2 523 830 Apr 183 447 50 257 147 711 1 153 418 66 407 47 564 2 853 600 May 128 624 44 948 98 607 1 058 746 49 982 30707 2 529 063 Jun 117 884 47413 82 479 1 003 703 46 791 29 019 2 409 603 Jui 152 299 49073 120 757 1 159 931 62 243 39 621 2 824 168 Aug 176 434 62 317 122 973 1 190 249 73 948 47 513 3 039 232 Sep 128 174 48705 92 256 1 026 301 46 244 27 071 2 454 595 Oct 182 432 52142 119 806 1 175 781 62045 35 834 2 794 445 Nov 156 554 43 124 89 905 1 107 487 59 300 34477 2 585 397 Dec 194 386 47 911 103 990 1229482 77707 45 087 2 856 693
1991: Jan 135 865 40490 82 246 1 111 209 50 342 28 902 2 491494 Feb 238 404 45 663 122 429 1 151 598 69 999 46 121 2 760 429 Mar 235 122 50 255 111 295 1 349 905 79 306 51826 3 056 684 Apr 214 224 43 131 126 589 1219095 62 211 38 288 2 803 498 May 154 892 40 941 96 881 1 187 380 52 102 32 486 2 659 791 Jun 173 267 45 877 90572 1 166 630 55 774 35 018 2 736 359 Jui 179 679 39 598 109 845 1 263 427 61198 37 314 2 900 167 Aug 221 671 47 282 117 239 1378135 64 656 49432 3 261 766 Sep 178 222 35 899 100 236 1237039 45 356 33 753 2 792 039
Note: All figures exclude refused landing passengers and cruise passengers. Servicemen are also excluded from January 1990. The grand total for 1985 includes 6 082 passenger arrivals via Shatin Meisha Terminal.
(a) Including passenger departures by helicopter from November 1990. (b) Opened on 8 November 1988. (c) Opened on 29 December 1989. (d) Closed on I November 1989. (e) Closed on 8 November 1988. (f) Removed from Central to Tsim Sha Tsui on 8 November 1988. (g) Opened on I April 1989. (h) Including passengers by casino ships to open sea from March 1990.
54 Hong Kong Monthly Digest of Statistics October 1991
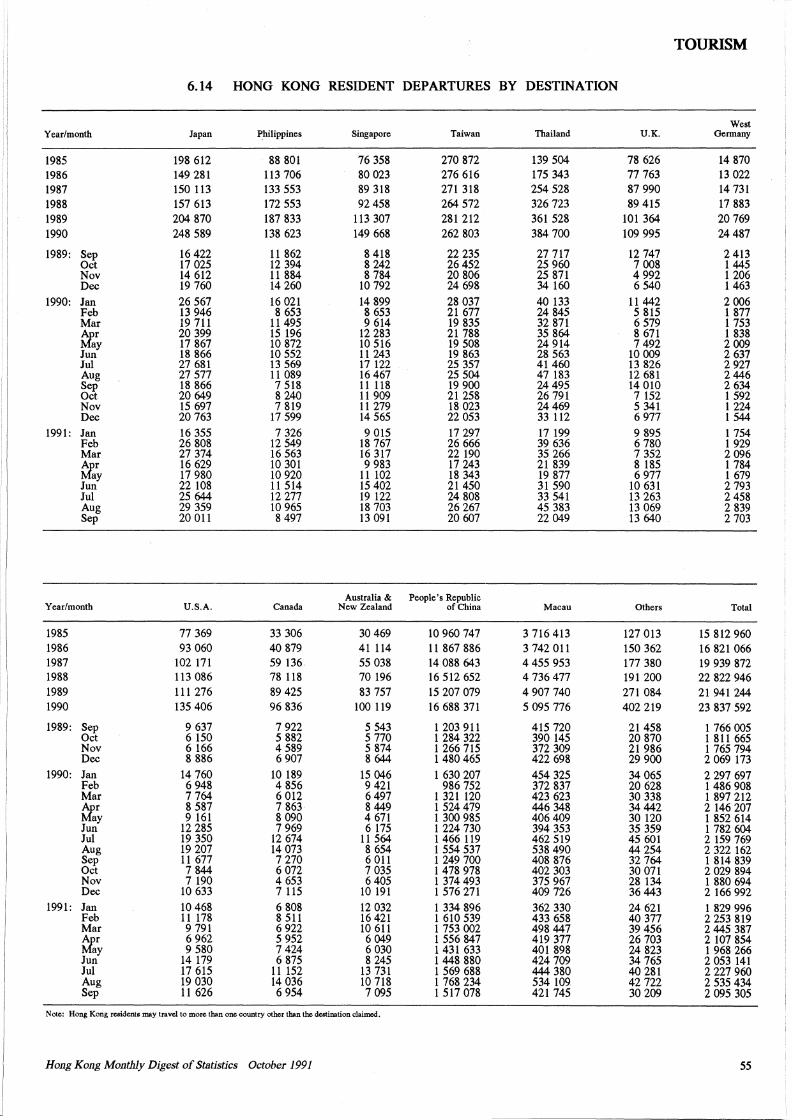
TOURISM
6.14 HONG KONG RESIDENT DEPARTURES BY DESTINATION
West Year/month Japan Philippines Singapore Taiwan Thailand U.K. Germany
1985 198 612 88 801 76 358 270 872 139 504 78 626 14 870 1986 149 281 113 706 80 023 276 616 175 343 77 763 13 022 1987 150 113 133 553 89 318 271 318 254 528 87 990 14 731 1988 157 613 172 553 92 458 264 572 326 723 89 415 17 883 1989 204 870 187 833 113 307 281 212 361 528 101 364 20 769
1990 248 589 138 623 149 668 262 803 384 700 109 995 24 487
1989: Sep 16 422 11 862 8 418 22 235 27 717 12 747 2 413 Oct 17 025 12 394 8 242 26 452 25 960 7 008 1445 Nov 14 612 11 884 8 784 20 806 25 871 4 992 1 206 Dec 19 760 14 260 10 792 24 698 34 160 6 540 1 463
1990: Jan 26 567 16 021 14 899 28 037 40 133 11 442 2 006 Feb 13 946 8 653 8 653 21 677 24 845 5 815 1 877 Mar 19 711 11 495 9 614 19 835 32 871 6 579 1 753
tier 20 399 15 196 12 283 21 788 35 864 8 671 1 838 ay 17 867 10 872 10 516 19 508 24 914 7 492 2 009
Jun 18 866 10 552 11 243 19 863 28 563 10 009 2 637 Jul 27 681 13 569 17 122 25 357 41460 13 826 2 927 Aug 27 577 11 089 16 467 25 504 47 183 12 681 2446 Sep 18 866 7 518 11 118 19 900 24 495 14 010 2 634 Oct 20 649 8 240 11 909 21 258 26 791 7 152 1 592 Nov 15 697 7 819 11 279 18 023 24469 5 341 1 224 Dec 20 763 17 599 14 565 22 053 33 112 6 977 1 544
1991: Jan 16 355 7 326 9 015 17 297 17 199 9 895 1 754 Feb 26 808 12 549 18 767 26 666 39 636 6 780 1 929 Mar 27 374 16 563 16 317 22 190 35 266 7 352 2 096
~r 16 629 10 301 9 983 17 243 21 839 8 185 1 784 ay 17 980 10 920 11 102 18 343 19 877 6 977 1 679
Jun 22 108 11 514 15 402 21450 31 590 10 631 2 793 Jul 25 644 12 277 19 122 24 808 33 541 13 263 2 458 Aug 29 359 10 965 18 703 26 267 45 383 13 069 2 839 Sep 20 011 8 497 13 091 20 607 22 049 13 640 2 703
Australia & People's Republic Year/month U.S.A. Canada New Zealand of China Macau Others Total
1985 77 369 33 306 30 469 10 960 747 3 716 413 127 013 15 812 960 1986 93 060 40 879 41 114 11 867 886 3 742 011 150 362 16 821 066 1987 102 171 59 136 55 038 14 088 643 4 455 953 177 380 19 939 872 1988 113 086 78 118 70 196 16 512 652 4 736 477 191 200 22 822 946 1989 111 276 89 425 83 757 15 207 079 4 907 740 271 084 21 941 244 1990 135 406 96 836 100 119 16 688 371 5 095 776 402 219 23 837 592
1989: Sep 9 637 7 922 5 543 l 203 911 415 720 21458 l 766 005 Oct 6 150 5 882 5 770 1284322 390 145 20 870 1 811 665 Nov 6 166 4 589 5 874 l 266 715 372 309 21 986 1 765 794 Dec 8 886 6 907 8 644 l 480 465 422 698 29 900 2 069 173
1990: Jan 14 760 10 189 15 046 l 630 207 454 325 34 065 2 297 697 Feb 6 948 4 856 9 421 986 752 372 837 20 628 1486908 Mar 7 764 6 012 6 497 1 321 120 423 623 30 338 1 897 212 tier 8 587 7 863 8 449 l 524 479 446 348 34442 2 146 207
ay 9 161 8 090 4 671 1300985 406 409 30 120 1 852 614 Jun 12 285 7 969 6 175 l 224 730 394 353 35 359 1 782 604 Jul 19 350 12 674 11 564 1466 119 462 519 45 601 2 159 769 Aug 19 207 14 073 8 654 1554537 538 490 44 254 2 322 162 Sep 11 677 7 270 6 011 1 249 700 408 876 32 764 1 814 839 Oct 7 844 6 072 7 035 1 478 978 402 303 30 071 2 029 894 Nov 7 190 4 653 6 405 1 374 493 375 967 28 134 1 880 694 Dec 10 633 7 115 10 191 1 576 271 409 726 36 443 2 166 992
1991: Jan 10 468 6 808 12 032 l 334 896 362 330 24 621 1 829 996 Feb 11 178 8 511 16 421 1 610 539 433 658 40 377 2 253 819 Mar 9 791 6 922 10 611 l 753 002 498 447 39 456 2 445 387 ~r 6 962 5 952 6 049 l 556 847 419 377 26 703 2 107 854
ay 9 580 7 424 6 030 l 431 633 401 898 24 823 1 968 266 Jun 14 179 6 875 8 245 l 448 880 424 709 34 765 2 053 141 Jul 17 615 11 152 13 731 1 569 688 444 380 40 281 2 227 960 Aug 19 030 14 036 10 718 1 768 234 534 109 42 722 2 535 434 Sep 11 626 6 954 7 095 1 517 078 421 745 30 209 2 095 305
Note: Hong Kong residents may travel to more than one country other than the destination claimed.
Hong Kong Monthly Digest of Statistics October 1991 55
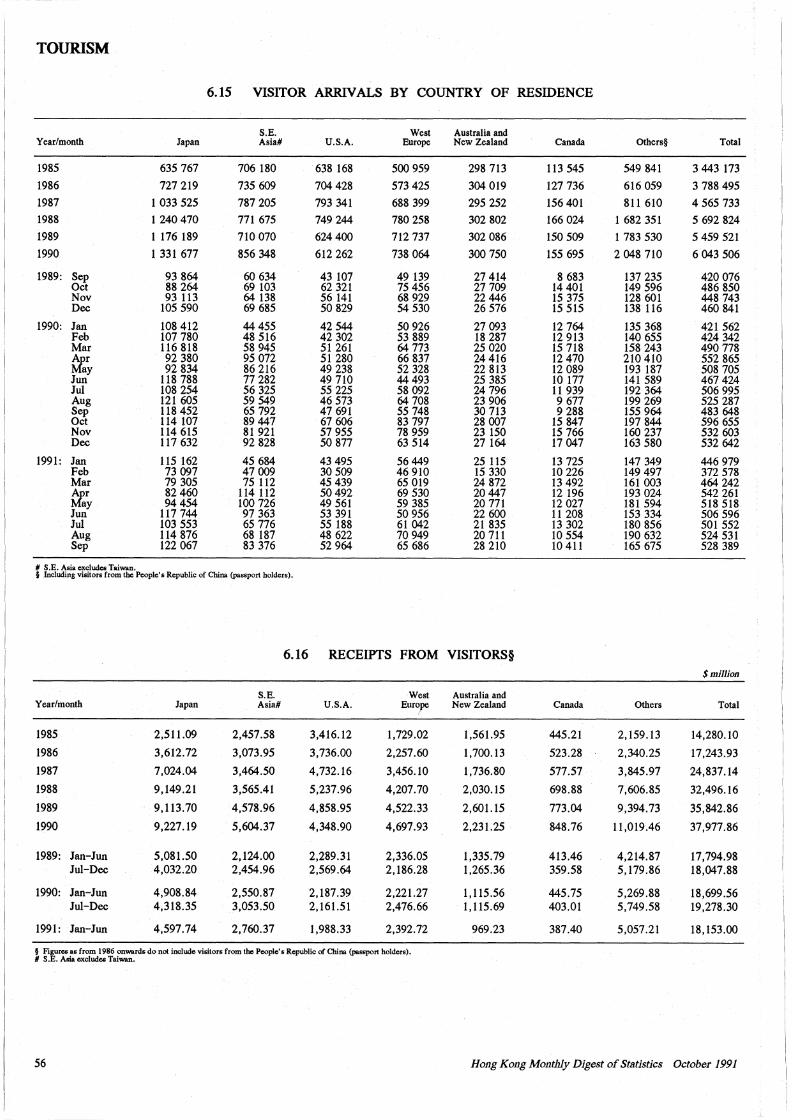
TOURISM
6.15 VISITOR ARRN ALS BY COUNTRY OF RESIDENCE
S.E. West Australia and Year/month Japan Asia# U.S.A. Europe New Zealand Canada Others§ Total
1985 635 767 706 180 638 168 500 959 298 713 113 545 549 841 3443173
1986 727 219 735 609 704 428 573 425 304 019 127 736 616 059 3 788 495
1987 I 033 525 787 205 793 341 688 399 295 252 156 401 811 610 4 565 733
1988 1240470 771 675 749 244 780 258 302 802 166 024 1 682 351 5 692 824
1989 1 176 189 710 070 624400 712 737 302 086 150 509 1 783 530 5 459 521
1990 I 331 677 856 348 612 262 738 064 300 750 155 695 2 048 710 6 043 506
1989: Sep 93 864 60 634 43 107 49 139 27 414 8 683 137 235 420 076 Oct 88 264 69 103 62 321 75 456 27 709 14 401 149 596 486 850 Nov 93 113 64 138 56 141 68 929 22446 15 375 128 601 448 743 Dec 105 590 69 685 50 829 54 530 26 576 15 515 138 116 460 841
1990: Jan 108 412 44455 42 544 50 926 27 093 12 764 135 368 421 562 Feb 107 780 48 516 42 302 53 889 18 287 12 913 140 655 424 342 Mar 116 818 58 945 51 261 64 773 25 020 15 718 158 243 490 778 tfsr 92 380 95 072 51280 66 837 24 416 12 470 210 410 552 865
ay 92 834 86 216 49 238 52 328 22 813 12 089 193 187 508 705 Jun 118 788 77 282 49 710 44 493 25 385 10 177 141 589 467 424 Jul 108 254 56 325 55 225 58 092 24 796 11 939 192 364 506 995 Aug 121 605 59 549 46 573 64 708 23 906 9 677 199 269 525 287 Sep 118 452 65 792 47 691 55 748 30 713 9 288 155 964 483 648 Oct 114 107 89 447 67 606 83 797 28 007 15 847 197 844 596 655 Nov 114 615 81 921 57 955 78 959 23 150 15 766 160 237 532 603 Dec 117 632 92 828 50 877 63 514 27 164 17 047 163 580 532 642
1991: Jan 115 162 45 684 43 495 56449 25 115 13 725 147 349 446 979 Feb 73 097 47 009 30 509 46 910 15 330 10 226 149 497 372 578 Mar 79 305 75 112 45 439 65 019 24 872 13 492 161 003 464 242 tfsr 82 460 114 112 50 492 69 530 20447 12 196 193 024 542 261
ay 94454 100 726 49 561 59 385 20 771 12 027 181 594 518 518 Jun 117 744 97 363 53 391 50 956 22 600 11 208 153 334 506 596 Jul 103 553 65 776 55 188 61 042 21 835 13 302 180 856 501 552 Aug 114 876 68 187 48 622 70 949 20 711 10 554 190 632 524 531 Sep 122 067 83 376 52 964 65 686 28 210 10 411 165 675 528 389
# S.E. Asia excludes Taiwan. § Including visitors from the People's Republic of China (passport holders).
6.16 RECEIPTS FROM VISITORS§ $million
S.E. West Australia and Year/month Japan Asia# U.S.A. Europe New Zealand Canada Others Total
1985 2,511.09 2,457.58 3,416.12 1,729.02 1,561.95 445.21 2,159.13 14,280. 10
1986 3,612.72 3,073.95 3,736.00 2,257.60 1,700.13 523.28 2,340.25 17,243.93
1987 7,024.04 3,464.50 4,732.16 3,456.10 1,736.80 577.57 3,845.97 24,837.14
1988 9,149.21 3,565.41 5,237.96 4,207.70 2,030.15 698.88 7,606.85 32,496.16
1989 9,113.70 4,578.96 4,858.95 4,522.33 2,601.15 773.04 9,394.73 35,842.86
1990 9,227.19 5,604.37 4,348.90 4,697.93 2,231.25 848.76 11,019.46 37,977.86
1989: Jan-Jun 5,081.50 2,124.00 2,289.31 2,336.05 1,335.79 413.46 4,214.87 17,794.98 Jui-Dec 4,032.20 2,454.96 2,569.64 2,186.28 1,265.36 359.58 5, 179.86 18,047.88
1990: Jan-Jun 4,908.84 2,550.87 2, 187.39 2,221.27 1,115.56 445.75 5,269.88 18,699.56 Jui-Dec 4,318.35 3,053.50 2,161.51 2,476.66 1,115.69 403.01 5,749.58 19,278.30
1991: Jan-Jun 4,597.74 2,760.37 1,988.33 2,392.72 969.23 387.40 5,057.21 18, 153.00
§ Figures as from 1986 onwards do not include visitors from the People's Republic of China (passport holders). # S.E. Asia excludes Taiwan.
56 Ho11g Kong Monthly Digest of St11tistics October 1991
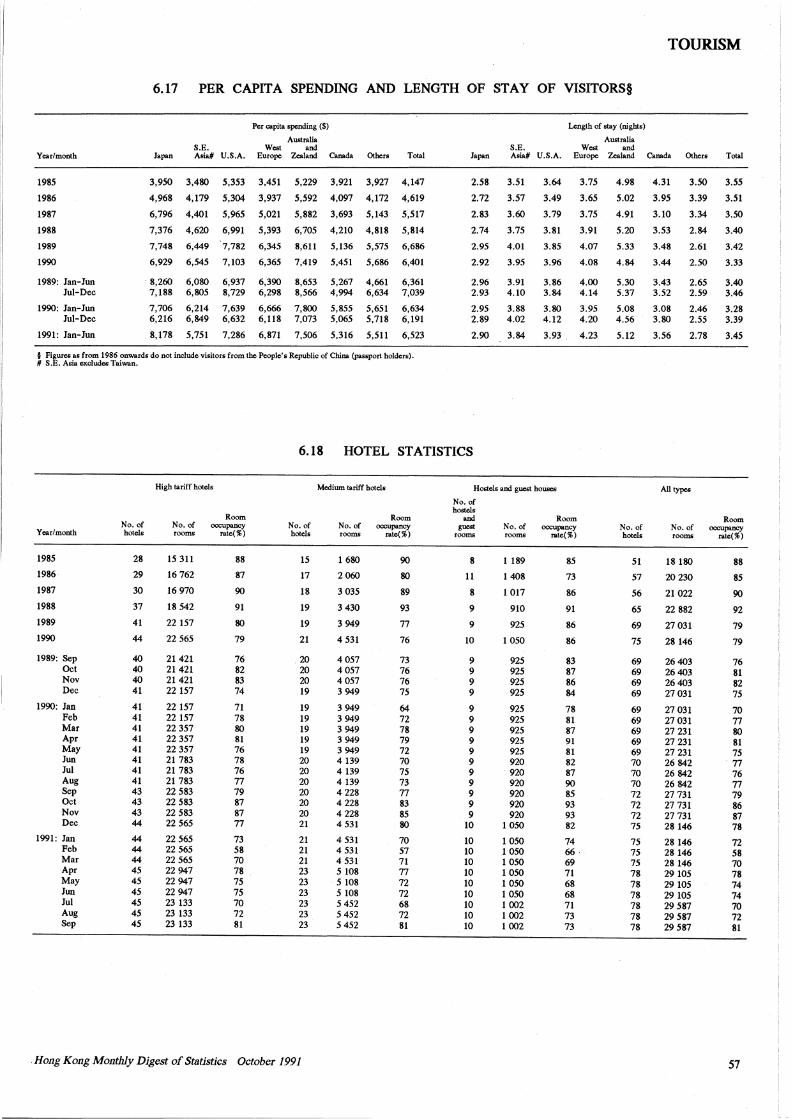
TOURISM
6.17 PER CAPITA SPENDING AND LENGTH OF STAY OF VISITORS§
Year/month
1985
1986
1987
1988
1989
1990
1989: Jan-Jun Jui-Dec
1990: Jan-Jun Jui-Dec
1991: Jan-Jun
Per capita spending($)
Australia S.E. West and
Japan Asia# U.S.A. Europe Zealand Canada Others Total
3,950 3,480 5,353 3,451 5,229 3,921 3,927 4, 147
4,968 4,179 5,304 3,937 5,592 4,097 4,172 4,619
6,796 4,401 5,965 5,021 5,882 3,693 5, 143 5,517
7,376 4,620 6,991 5,393 6,705 4,210 4,818 5,814
7,748 6,449 ·7,782
6,929 6,545 7,103
. 8,260 7,188
7,706 6,216
8,178
6,080 6,805
6,214 6,849
5,751
6,937 8,729
7,639 6,632
7,286
6,345
6,365
6,390 6,298
6,666 6,118
6,871
8,611
7,419
5,136
5,451
8,653 5,267 8,566 4,994
7,800 5,855 7,073 5,065
7,506 5,316
5,575
5,686
4,661 6,634
5,651 5,718
5,511
6,686
6,401
6,361 7,039
6,634 6,191
6,523
§ Figures as from 1986 onwards do not include visitors from the People's Republic of China (passport holders). # S.E. Asia excludes Taiwan.
Length of stay (nights)
Australia S.E. West and
Japan Asia# U.S.A. Europe Zealand Canada Others Total
2.58 3.51 3.64 3.75
2.72 3.57 3.49 3.65
2.83 3.60 3.79 3.75
2.74 3.75 3.81 3.91
2.95
2.92
2.96 2.93
2.95 2.89
2.90
4.01
3.95
3.91 4.10
3.88 4.02
3.84
3.85
3.96
3.86 3.84
3.80 4.12
3.93
4.07
4.08
4.00 4.14
3.95 4.20
4.23
4.98 4.31 3.50 3.55
5.02 3.95 3.39 3.51
4.91 3.10 3.34 3.50
5.20 3.53 2.84 3.40
5.33
4.84
5.30 5.37
5.08 4.56
5.12
3.48
3.44
3.43 3.52
3.08 3.80
3.56
2.61
2.50
2.65 2.59
2.46 2.55
2.78
3.42
3.33
3.40 3.46
3.28 3.39
3.45
6.18 HOTEL STATISTICS
Year/month
1985
1986
1987
1988
1989
1990
1989: Sep Oct Nov Dec
1990: Jan Feb Mar Apr May Jun Jui Aug Sep Oct Nov Dec
1991: Jan Feb Mar Apr May Jun Jui Aug Sep
No. of hotels
28
29
30
37
41
44
40 40 40 41
41 41 41 41 41 41 41 41 43 43 43 44
44 44 44 45 45 45 45 45 45
High tariff hotels
Room No. of occupancy rooms rate(%)
15 311 88
16 762 87
16 970 90
18 542 91
22 157 80
22 565 79
21 421 76 21 421 82 21 421 83 22 157 74
22 157 71 22 157 78 22 357 80 22 357 81 22 357 76 21 783 78 21 783 76 21 783 77 22 583 79 22 583 87 22 583 87 22 565 77
22 565 73 22 565 58 22 565 70 22 947 78 22 947 75 22 947 75 23 133 70 23 133 72 23 133 81
No. of hotels
15
17
18
19
19
21
20 20 20 19
19 19 19 19 19 20 20 20 20 20 20 21
21 21 21 23 23 23 23 23 23
Hong Kong Monthly Digest of StJJtistics October 1991
Medium tariff hotels
Room No. of occupancy rooms rate(%)
1 680 90
2 060 80
3 035 89
3 430 93
3 949 77
4 531 76
4 057 73 4 057 76 4 057 76 3 949 75
3 949 64 3 949 72 3 949 78 3 949 79 3 949 72 4 139 70 4 139 75 4 139 73 4 228 77 4 228 83 4 228 85 4 531 80
4 531 70 4 531 57 4 531 71 5 108 77 5 108 72 5 108 72 5 452 68 5 452 72 5 452 81
Hostels and guest houses
No. of hostels
and guest
rooms
8
11
8
9
9
10
9 9 9 9
9 9 9 9 9 9 9 9 9 9 9
10
10 10 10 10 10 10 10 10 10
Room No. of occupancy rooms rate(%)
l 189 85
l 408 73
1 017 86
910 91
925 86
l 050 86
925 83 925 87 925 86 925 84
925 78 925 81 925 87 925 91 925 81 920 82 920 87 920 90 920 85 920 93 920 93
l 050 82
1 050 74 1 050 66 1 050 69 1 050 71 1 050 68 1 050 68 1 002 71 1 002 73 1 002 73
No. of hotels
51
57
56
65
69
75
69 69 69 69
69 69 69 69 69 70 70 70 72 72 72 75
75 75 75 78 78 78 78 78 78
All types
Room No. of occupancy rooms rate(%)
18 180 88
20 230 85
21 022 90
22 882 92
27 031 79
28 146 79
26 403 76 26 403 81 26 403 82 27 031 75
27 031 70 27 031 77 27 231 80 27 231 81 27 231 75 26 842 77 26 842 76 26 842 77 27 731 79 27 731 86 27 731 87 28 146 78
28 146 72 28 146 58 28 146 70 29 105 78 29 105 74 29105 74 29 587 70 29 587 72 29 587 81
57
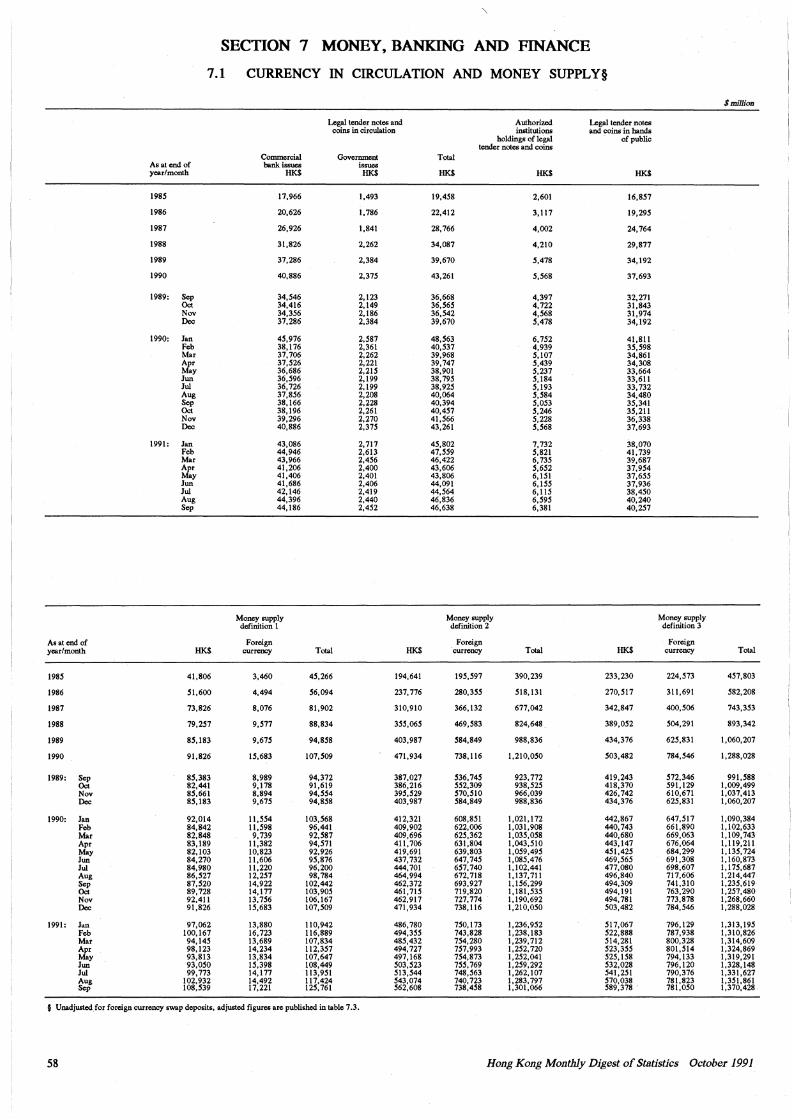
SECTION 7 MONEY, BANKING AND FINANCE
7.1 CURRENCY IN CIRCULATION AND MONEY SUPPLY§
$million
Legal tender notes and Authorized Legal tender notes coins in circulation institutions and coins in hands
holdings of legal tender notes and coins
of public
Commercial Government Total As at end of bank issues issues year/month HK$ HK$ HK$ HK$ HK$
1985 17,966 l,493 19,458 2,601 16,857
1986 20,626 1,786 22,412 3,117 19,295
1987 26,926 l,841 28,766 4,002 24,764
1988 31,826 2,262 34,087 4,210 29,877
1989 37,286 2,384 39,670 5,478 34,192
1990 40,886 2,375 43,261 5,568 37,693
1989: Sep 34,546 2,123 36,668 4,397 32,271 Oct 34,416 2.149 36,565 4,722 31,843 Nov 34,356 2,186 36,542 4,568 31,974 Dec 37,286 2,384 39,670 5,478 34,192
1990: Jan 45,976 2,587 48,563 6,752 41,811 Feb 38,176 2,361 40,537 4,939 35,598 Mar 37,706 2,262 39,968 5,107 34,861 Apr 37,526 2,221 39,747 5,439 34,308 May 36,686 2,215 38,901 5,237 33,664 Jun 36,596 2,199 38,795 5,184 33,611 Jui 36,726 2,199 38,925 5,193 33,732 Aug 37,856 2,208 40,064 5,584 34,480 Sep 38,166 2,228 40,394 5,053 35,341 Oct 38,196 2,261 40,457 5,246 35,211 Nov 39,296 2,270 41,566 5,228 36,338 Dec 40,886 2,375 43,261 5,568 37,693
1991: Jan 43,086 2.717 45,802 7, 732 38,070 Feb 44,946 2,613 47,559 5,821 41,739 Mar 43,966 2,456 46,422 6,735 39,687 Apr 41,206 2,400 43,606 5,652 37,954 May 41,406 2,401 43,806 6,151 37,655 Jun 41,686 2,406 44,091 6,155 37,936 Jui 42,146 2,419 44,564 6,115 38,450 Aug 44,396 2,440 46,836 6,595 40,240 Sep 44,186 2,452 46,638 6,381 40,257
Money supply Money supply Money supply definition 1 definition 2 definition 3
As at end of Foreign Foreign Foreign year/month HK$ currency Total HK$ currency Total HK$ currency Total
1985 41,806 3,460 45,266 194,641 195,597 390,239 233,230 224,573 457,803
1986 51,600 4,494 56,094 237, 776 280,355 518,131 270,517 311.691 582,208
1987 73,826 8,076 81,902 310,910 366,132 677,042 342,847 400,506 743,353
1988 79,257 9,577 88,834 355,065 469,583 824,648 389,052 504,291 893,342
1989 85,183 9,675 94,858 403,987 584,849 988,836 434,376 625,831 1,060,207
1990 91,826 15,683 107,509 471,934 738,116 1,210,050 503,482 784,546 l,288,028
1989: Sep 85,383 8,989 94,372 387,027 536,745 923,772 419,243 572,346 991,588 Oct 82,441 9,178 91,619 386,216 552,309 938,525 418,370 591,129 1,009,499 Nov 85,661 8,894 94,554 395,529 570,510 966,039 426,742 610,671 1,037,413 Dec 85,183 9,675 94,858 403,987 584,849 988,836 434,376 625,831 1,060,207
1990: Jan 92,014 11,554 103,568 412,321 608,851 1,021,172 442,867 647,517 1,090,384 Feb 84,842 11,598 96,441 409,902 622,006 l.031,908 440, 743 661,890 1,102,633 Mar 82,848 9,739 92,587 409,696 625,362 1,035,058 440,680 669,063 1,109,743 Apr 83,189 11,382 94,571 411,706 631,804 1,043,510 443,147 676,064 I, 119,211 May 82,103 10,823 92,926 419,691 639,803 1,059,495 451,425 684,299 l.135,724 Jun 84,270 11,606 95,876 437,732 647,745 l,085,476 469,565 691,308 1,160,873 Jui 84,980 ll,220 96,200 444,701 657,740 l,102,441 477,080 698,607 1,175,687 Aug 86,527 12,257 98,784 464,994 672, 718 l,137,711 496,840 717,606 1,214,447 Sep 87,520 14,922 102,442 462,372 693,927 l,156,299 494,309 741,310 1,235,619 Oct 89,728 14,177 103,905 461,715 719,820 l,181,535 494,191 763,290 1,257,480 Nov 92,411 13,756 106,167 462,917 727,774 l,190,692 494,781 773,878 l,268,660 Dec 91,826 15,683 107,509 471,934 738, 116 l,210,050 503,482 784,546 l,288,028
1991: J;m 97,062 13,880 110,942 486,780 750, 173 l,236,952 517,067 796,129 l,313,195 Feb 100,167 16,723 116,889 494,355 743,828 1,238,183 522,888 787,938 1,310,826 Mar 94,145 13,689 107,834 485,432 754,280 l,239, 712 514,281 800,328 l,314,609 Apr 98,123 14,234 112,357 494,727 757,993 l,252,720 523,355 801,514 l,324,869 May 93,813 13,834 107,647 497,168 754,873 l,252,041 525, 158 794,133 1,319,291 Jun 93,050 15,398 108,449 503,523 755,769 1,259,292 532,028 796,120 1,328,148 Jui 99,773 14,177 113,951 513,544 748,563 l,262,107 541,251 790,376 t.331,627 Aug 102,932 14,492 117,424 543,074 740,723 1,283,797 570,038 781,823 1,351,861 Sep 108,539 17,221 125,761 562,608 738,458 l,301,066 589,378 . 781,050 1,370,428
f Unadjusted for foreign currency swap deposits, adjusted figures are published in table 7 .3.
58 Hong Kong Monthly Digest of Statistics October 1991
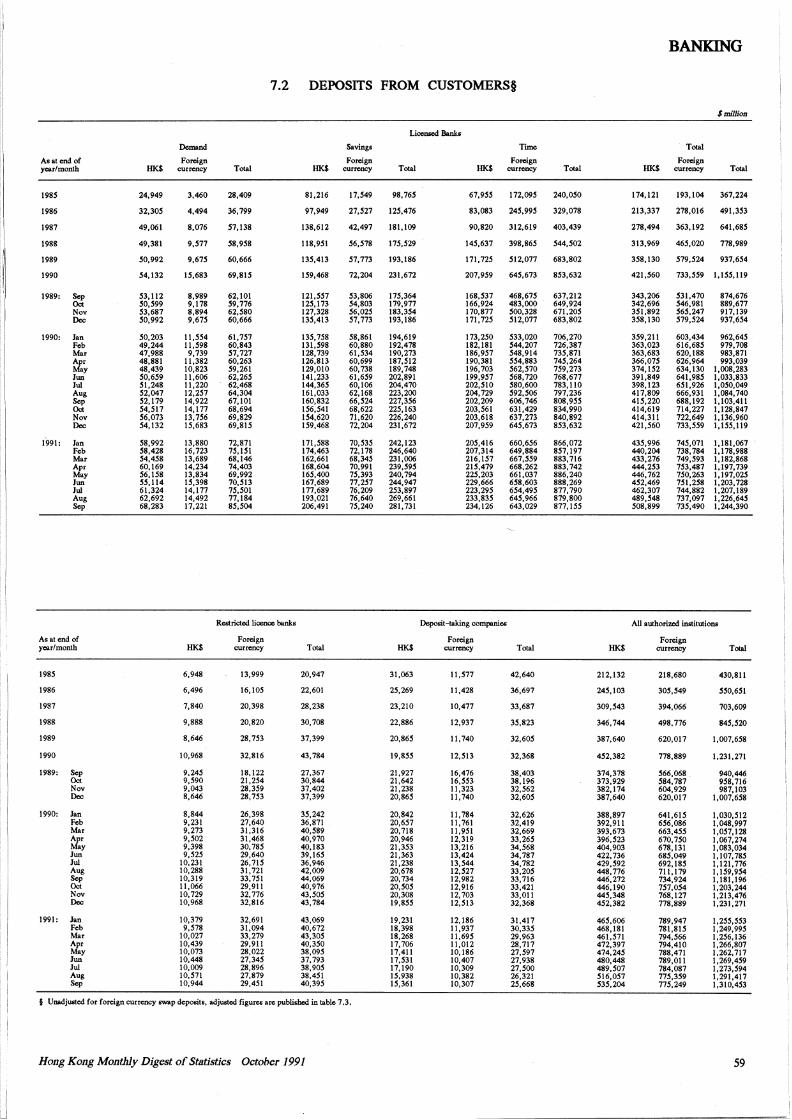
i
I I
BANKING
7.2 DEPOSITS FROM CUSTOMERS§
SmDlion
Liccm&ed Banks
Demand Savings Time Total
Asatondof Foreign Foreign Foreign Foreign year/month HK$ cur=cy Total HK$ - Total HK$ - Total HK$ cur=cy Total
1985 24,949 3,460 28,409 81,216 17,549 98,765 61,955 172,095 240,050 174,121 193,104 367,224
1986 32,305 4,494 36,799 97,949 27,527 125,476 83,083 245,995 329,078 213,337 278,016 491,353
1987 49,061 8,076 57,138 138,612 42,497 181,109 90,820 312,619 403,439 278,494 363,192 641,685
1988 49,3.81 9,577 58,958 118,951 56,518 175,529 145,637 398,865 544,502 313,969 465,020 778,989
1989 50,992 9,615 60,666 135,413 57,773 193,186 171,725 512,077 683,802 358,130 579,524 937,654
1990 54,132 15,683 69,815 159,468 72,204 231,672 207,959 645,673 853,632 421,560 733,559 l,155,119
1989: Sep 53,112 8,989 62,101 121,557 53,806 175,364 168,537 468,675 637,212 343,206 531,470 874,676 Oct 50,599 9,178 59,116 125,173 54,803 179,977 166,924 483,000 649,924 342,696 546,981 889,677 Nov 53,687 8,894 62,580 127,328 56,025 183,354 170,877 500,328 671,205 351,892 565,241 917,139 Dec 50,992 9,615 60,666 135,413 57,773 193,186 171,725 512,077 683,802 358,130 579,524 937,654
1990: Jan 50,203 11,554 61,757 135,758 58,861 194,619 173,250 533,020 706,270 359,211 603,434 962,645 Feb 49,244 11,598 60,843 131,598 60,880 192,478 182,181 544,207 726,387 363,023 616,685 979,708 Mar 47,988 9,739 57,727 128,739 61,534 190,273 186,957 548,914 735,871 363,683 620,188 983,871 Apr 48,881 11,382 60,263 126,813 60,699 187,512 190,381 554,883 745,264 366,075 626,964 993,039 May 48,439 10,823 59,261 129,010 60,738 189,748 196,703 562,510 759,273 374,152 634,130 1,008,283 Jun 50,659 11,606 62,265 141,233 61,659 202,891 199,957 568,720 768,677 391,849 641,985 1,033,833 Jui 51,248 11,220 62,468 144,365 60,106 204,470 202,510 580,600 783,110 398,123 651,926 1,050,049 Aug 52,047 12,257 64,304 161,033 62,168 223,200 204,729 592,506 797,236 417,809 666,931 1,084,740 Sep 52,179 14,922 67,101 160,832 66,524 227,356 202,209 606,746 808,955 415,220 688,192 1,103,411 Oct 54,511 14,177 68,694 156,541 68,622 225,163 203,561 631,429 834,990 414,619 714,227 1,128,847 Nov 56,073 13,756 69,829 154,620 71,620 226,240 203,618 637,273 840,892 414,311 722,649 1,136,960 Dec 54,132 15,683 69,815 159,468 72,204 231,672 207,959 645,673 853,632 421,560 733,559 1,155,119
1991: Jan 58,992 13,880 72,871 171,588 10,535 242,123 205,416 660,656 866,072 435,996 745,071 l,181,067 Feb 58,428 16,723 75,151 174,463 72,178 246,640 207,314 649,884 857,197 440,204 738,784 1,178,988 Mar 54,458 13,689 68,146 162,661 68,345 231,006 216,157 661,559 883,716 433,276 749,593 1,182,868 Apr 60,169 14,234 74,403 168,604 70,991 239,595 215,479 668,262 883,742 444,253 753,487 1,197,739 May 56,158 13,834 69,992 165,400 75,393 240,794 225,203 661,037 886,240 446,762 750,263 1,197,025 Jun 55,114 15,398 70,513 167,689 77,257 244,947 229,666 658,603 888,269 452,469 751,258 1,203,728 Jui 61,324 14,177 15,501 177,689 76,209 253,897 223,295 654,495 877,790 462,307 744,882 1,207,189 Aug 62,692 14,492 77,184 193,021 76,640 269,661 233,835 645,966 879,800 489,548 737,097 1,226,645 Sep 68,283 17,221 85,504 206,491 75,240 281,731 234,126 643,029 811,155 508,899 735,490 1,244,390
Restricted licence banks Deposit-taking companies All authon....J imtitutiOtJS
Asatond of Foreign Foreign Foreign year/month HK$ currency Total HK$ currency Total HK$ currency Total
1985 6,948 13,999 20,947 31,063 11,577 42,640 212,132 218,680 430,811
1986 6,496 16,105 22,601 25,269 11,428 36,697 245,103 305,549 550,651
1987 7,840 20,398 28,238 23,210 10,477 33,687 309,543 394,066 703,609
1988 9,888 20,820 30,708 22,886 12,937 35,823 346,744 498, 776 845,520
1989 8,646 28,753 37,399 20,865 11,740 32,605 387,640 620,017 1,007,658
1990 10,968 32,816 43,784 19,855 12,513 32,368 452,382 778,889 1,231,271
1989: Sep 9,245 18,122 27,367 21,927 16,476 38,403 374,378 566,068 940,446 Oct 9,590 21,254 30,844 21,642 16,553 38,196 373,929 584,787 958,716 Nov 9,043 28,359 37,402 21,238 11,323 32,562 382,174 604,929 987,103 Dec 8,646 28, 753 37,399 20,865 11,740 32,605 387,640 620,017 1,007,658
1990: Jan 8,844 26,398 35,242 20,842 11,784 32,626 388,897 641,615 1,030,512 Feb 9,231 27,640 36,871 20,657 11,761 32,419 392,911 656,086 1,048,997 Mar 9,273 31,316 40,589 20,718 11,951 32,669 393,673 663,455 1,057,128 Apr 9,502 31,468 40,970 20,946 12,319 33,265 396,523 670,750 1,067,274 May 9,398 30,785 40.183 21,353 13,216 34,568 404,903 678,131 1,083,034 Jun 9,525 29,640 39,165 21,363 13,424 34,787 422,736 685,049 l,107,785 Jui 10,231 26,715 36,946 21,238 13,544 34,782 429,592 692,185 1,121,776 Aug 10,288 31,721 42,009 20,678 12,527 33,205 448,776 711,179 1,159,954 Sep 10,319 33,751 44,069 20,734 12,982 33,716 446,272 734,924 1,181,196 Oct 11,066 29,911 40,976 20,505 12,916 33,421 446,190 151,054 1,203,244 Nov 10,729 32,776 43,505 20,308 12,703 33,011 445,348 768,127 1,213,476 Dec 10,968 32,816 43,784 19,855 12,513 32,368 452,382 778,889 1,231,271
1991: Jan 10,379 32,691 43,069 19,231 12,186 31,417 465,606 789,947 1,255,553 Feb 9,578 31,094 40,672 18,398 11,937 30,335 468,181 781,815 1,249,995 Mar 10,027 33,279 43,305 18,268 11,695 29,963 461,571 194,566 1,256,136 Apr 10,439 29,911 40,350 17,706 11,012 28,717 472,397 794,410 1,266,807 May 10,073 28,022 38,095 17,411 10,186 27,597 474,245 788,471 1,262,717 Jun 10,448 27,345 37,793 17,531 10,407 27,938 480,448 789,011 1,269,459 Jui 10,009 28,896 38,905 17,190 10,309 27,500 489,507 784,087 1,273,594 Aug 10,571 27,879 38,451 15,938 10,382 26,321 516,051 115,359 1,291,417 Sep 10,944 29,451 40,395 15,361 10,307 25,668 535,204 775,249 1,310,453
§ Unadjusted for foreign cur=cy swap deposits, adjusted figures are published in table 7.3.
Hong Kong Monthly Digest of Statistics October 1991 59
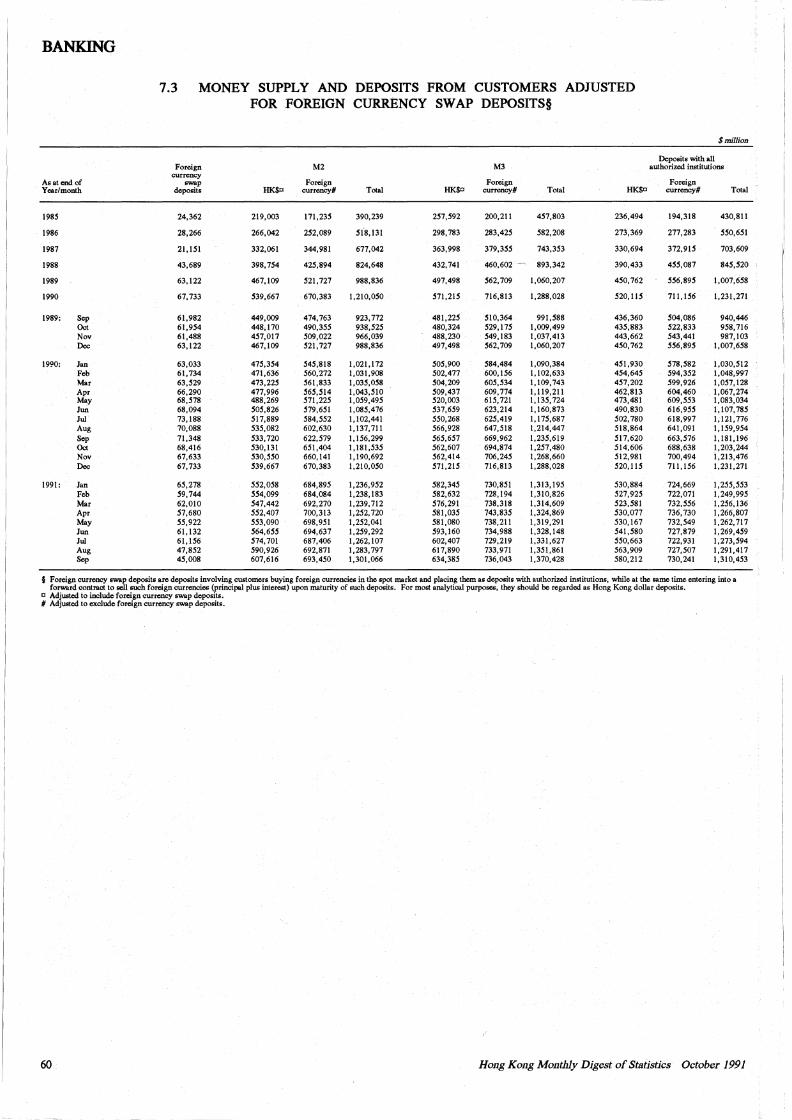
BANKING
7.3 MONEY SUPPLY AND DEPOSITS FROM CUSTOMERS ADJUSTED FOR FOREIGN CURRENCY SWAP DEPOSITS§
$million
Deposits with all Foreign M2 M3 authorized institutions
currency Foreign Foreign As at end of swap Foreign
Year/month deposits HK$0 currency# Total HK$O currency# Total HK$0 currency# Total
1985 24,362 219,003 171,235 390,239 257,592 200,211 457,803 236,494 194,318 430,811
1986 28,266 266,042 252,089 518,131 298, 783 283,425 582,208 273,369 277,283 550,651
1987 21,151 332,061 344,981 677,042 363,998 379,355 743,353 330,694 372,915 703,609
1988 43,689 398, 754 425,894 824,648 432,741 460,602 - 893,342 390,433 455,087 845,520
1989 63,122 467,109 521,727 988,836 497,498 562,709 1,060,207 450, 762 556,895 1,007,658
1990 67, 733 539,667 670,383 1,210,050 571,215 716,813 l,288,028 520,115 71t, 156 1,231,271
1989: Sep 61,982 449,009 474,763 923,772 481,225 510,364 991,588 436,360 504,086 940,446 Oct 61,954 448,170 490,355 938,525 480,324 529,175 1,009,499 435,883 522,833 958,716 Nov 61,488 457,017 509,022 966,039 488,230 549,183 1,037,413 443,662 543,441 987,103 Dec 63,122 467,109 521,727 988,836 497,498 562,709 1,060,207 450,762 556,895 1,007,658
1990: Jan 63,033 475,354 545,818 1,021, l 72 505,900 584,484 1,090,384 451,930 578,582 l,030,512 Feb 61,734 471,636 560,272 1,031,908 502,477 600,156 1,102,633 454,645 594,352 1,048,997 Mar 63,529 473,225 561,833 1,035,058 504,209 605,534 1,109,743 457,202 599,926 1,057,128 Apr 66,290 477,996 565,514 1,043,510 509,437 609,774 1,119,211 462,813 604,460 1,067,274 May 68,578 488,269 571,225 l,059,495 520,003 615, 721 l, 135, 724 473,481 609,553 1,083,034 Jun 68,094 505,826 579,651 1,085,476 537,659 623,214 1,160,873 490,830 616,955 1,107,785 Jui 73,188 517,889 584,552 1,102,441 550,268 625,419 1,175,687 502,780 618,997 1,121,776 Aug 70,088 535,082 602,630 1,137, 711 566,928 647,518 1,214,447 518,864 641,091 1,159,954 Sep 71,348 533,720 622,579 l, 156,299 565,651 669, 962 1,235,619 517,620 663,576 l, 181, 196 Oct 68,416 530,131 651,404 1,181,535 562,607 694,874 1,257,480 514,606 688,638 1,203,244 Nov 67,633 530,550 660,141 1,190,692 562,414 706,245 1,268,660 512,981 700,494 1,213,476 Dec 67, 733 539,667 670,383 1,210,050 571,215 716,813 1,288,028 520,115 711,156 1.231,271
1991: Jan 65,278 552,058 684,895 1,236,952 582,345 730,851 l,313,195 530,884 724,669 1,255,553 Feb 59, 744 554,099 684,084 1,238,183 582,632 728, 194 1.310,826 527,925 722,071 1,249,995 Mar 62,010 547,442 692,270 1,239,712 576,291 738,318 1,314,609 523,581 732,556 1,256, 136 Apr 57,680 552,401 700,313 1,252,720 581,035 743,835 1,324,869 530,077 736, 730 1,266,807 May 55,922 553,090 698,951 1,252,041 581,080 738,211 1,319,291 530, 167 732,549 1,262,717 Jun 61,132 564,655 694,637 1,259,292 593, 160 734,988 1,328, 148 541,580 727,879 1,269,459 Jui 61,156 574,701 687,406 1,262,107 602,407 729,219 1,331,627 550,663 722,931 1,273,594 Aug 47,852 590,926 692,871 1,283,797 617,890 733,971 1,351,861 563,909 727,507 1,291,417 Sep 45,008 607,616 693,450 1,301,066 634,385 736,043 1,370,428 580,212 730,241 1,310,453
§ Foreign currency swap deposits are deposits involving customers buying foreign currencies in the spot market and placing them as deposits with authorized institutions, while at the same time entering into a forward contract to sell such foreign currencies (principal plus interest) upon maturity of such deposits. For most anslytical purposes, they should be regarded as Hong Kong dollar deposits.
a Adjusted to include foreign currency swap deposits. # Adjusted to exclude foreign currency swap deposits.
60 Hong Kong Monthly Digest of Statistics October 1991
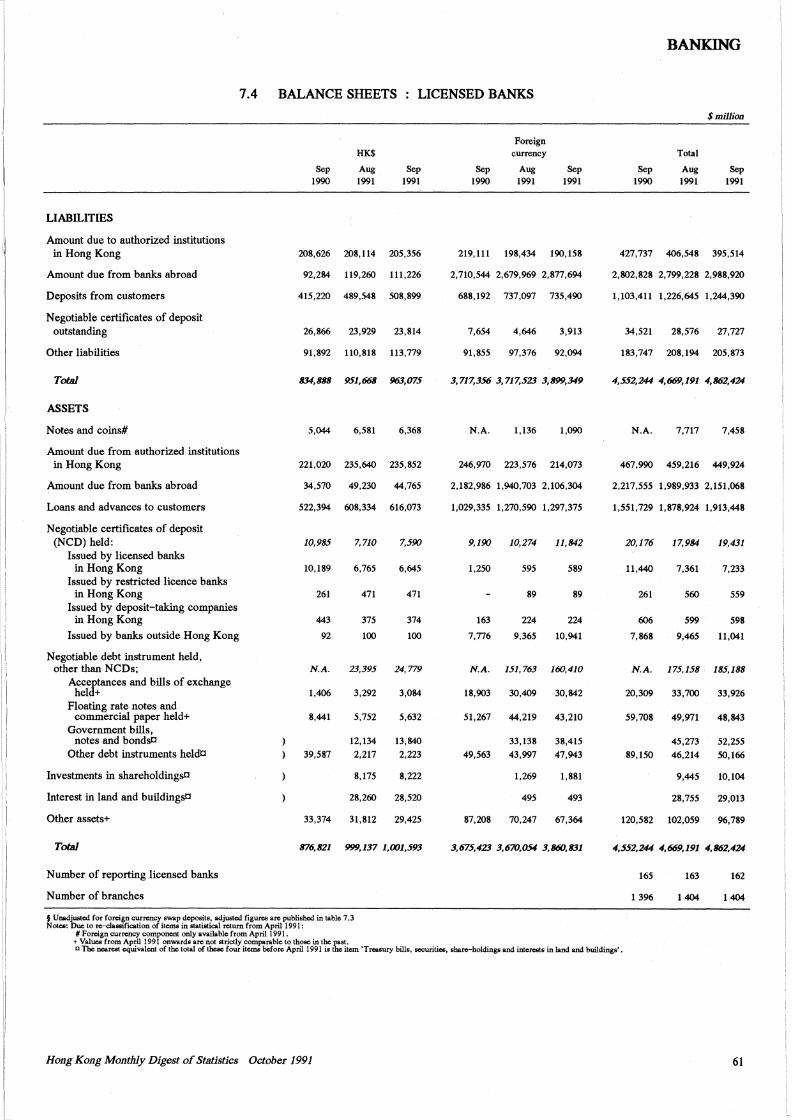
BANIQNG
7.4 BALANCE SHEETS LICENSED BANKS
$million
Foreign HK$ currency Total
Sep Aug Sep Sep Aug Sep Sep Aug Sep 1990 1991 1991 1990 1991 1991 1990 1991 1991
LIABILITIES
Amount due to authorized institutions in Hong Kong 208,626 208,114 205,356 219,111 198,434 190, 158 427,737 406,548 395,514
Amount due from banks abroad 92,284 119,260 111,226 2,710,544 2,679,969 2,877,694 2,802,828 2,799,228 2,988,920
Deposits from customers 415,220 489,548 508,899 688,192 737,097 735,490 1,103,411 1,226,645 1,244,390
Negotiable certificates of deposit outstanding 26,866 23,929 23,814 7,654 4,646 3,913 34,521 28,576 27,727
Other liabilities 91,892 110,818 113,779 91,855 97,376 92,094 183,747 208,194 205,873
Tot.aJ 834,888 951,668 963,075 3, 717,356 3, 717,523 3,899,349 4,552,244 4,669,191 4,862,424
ASSETS
Notes and coins# 5,044 6,581 6,368 N.A. 1,136 1,090 N.A. 7,717 7,458
Amount due from authorized institutions in Hong Kong 221,020 235,640 235,852 246,970 223,576 214,073 467,990 459,216 449,924
Amount due from banks abroad 34,570 49,230 44,765 2,182,986 1,940,703 2,106,304 2,217,555 1,989,933 2,151,068
Loans and advances to customers 522,394 608,334 616,073 1,029,335 1,270,590 1,297,375 1,551,729 1,878,924 1,913,448
Negotiable certificates of deposit (NCD) held: 10,985 7,710 7,590 9,190 10,274 11,842 20,176 17,984 19,431
Issued by licensed banks in Hong Kong 10,189 6,765 6,645 1,250 595 589 11,440 7,361 7,233
Issued by restricted licence banks in Hong Kong 261 471 471 89 89 261 560 559
Issued by deposit-taking companies in Hong Kong 443 375 374 163 224 224 606 599 598
Issued by banks outside Hong Kong 92 100 100 7,776 9,365 10,941 7,868 9,465 11,041
Negotiable debt instrument held, other than NCDs; N.A. 23,395 24,779 N.A. 151, 763 160,410 N.A. 175,158 185,188
Acced-tances and bills of exchange hel + 1,406 3,292 3,084 18,903 30,409 30,842 20,309 33,700 33,926
Floating rate notes and commercial paper held+ 8,441 5,752 5,632 51,267 44,219 43,210 59,708 49,971 48,843
Government bills, notes and bondsC 12, 134 13,840 33,138 38,415 45,273 52,255
Other debt instruments helda 39,587 2,217 2,223 49,563 43,997 47,943 89,150 46,214 50,166
Investments in shareholdingsC 8,175 8,222 1,269 1,881 9,445 10,104
Interest in land and buildingsC 28,260 28,520 495 493 28,755 29,013
Other assets+ 33,374 31,812 29,425 87,208 70,247 67,364 120,582 102,059 96,789
Tot.aJ 876,821 999, 137 1,001,593 3,675,423 3,670,054 3,860,831 4,552,244 4,669,191 4,862,424
Number of reporting licensed banks 165 163 162
Number of branches 1 396 1404 1 404
§ Unadjusted for foreign currency swap deposits, adjusted figures arc published in table 7 .3 Notes: Due to re-classification of items in statistical return from April 1991 :
#Foreign currency component only available from April 1991. +Values from April 1991 onwards arc not strictly comparable to those in the 'lhest. D The nearest equivalent of the total of these four items before April 1991 is item 'Treasury bills, securities, share-holdings and interests in land and buildings',
Hong Kong Monthly Digest of Statistics October 1991 61
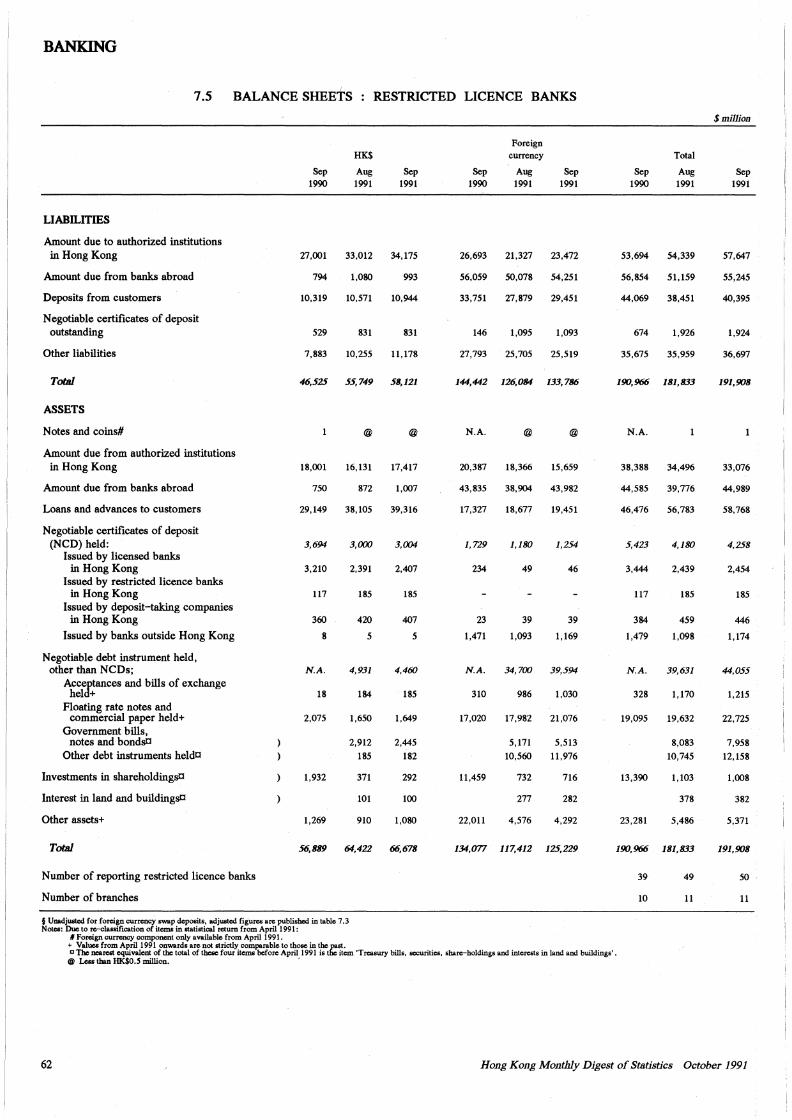
BANKING
7.5 BALANCE SHEETS RESTRICTED LICENCE BANKS
$million
Foreign HK$ currency Total
Sep Aug Sep Sep Aug Sep Sep Aug Sep 1990 1991 1991 1990 1991 1991 1990 1991 1991
LIABILITIES
Amount due to authorized institutions in Hong Kong 27,001 33,012 34,175 26,693 21,327 23,472 53,694 54,339 57,647
Amount due from banks abroad 794 1,080 993 56,059 50,078 54,251 56,854 51,159 55,245
Deposits from customers 10,319 10,571 10,944 33,751 27,879 29,451 44,069 38,451 40,395
Negotiable certificates of deposit outstanding 529 831 831 146 1,095 1,093 674 1,926 1,924
Other liabilities 7,883 10,255 11,178 27,793 25,705 25,519 35,675 35,959 36,697
TotJJl 46,525 55,749 58,121 144,442 126,084 133,786 190,966 181,833 191,908
ASSETS
Notes and coins# @ @ N.A. @ @ N.A.
Amount due from authorized institutions in Hong Kong 18,001 16,131 17,417 20,387 18,366 15,659 38,388 34,496 33,076
Amount due from banks abroad 750 872 1,007 43,835 38,904 43,982 44,585 39,776 44,989
Loans and advances to customers 29,149 38,105 39,316 17,327 18,677 19,451 46,476 56,783 58,768
Negotiable certificates of deposit (NCD) held: 3,694 3,000 3,004 1,729 1,180 1,254 5,423 4,180 4,258
Issued by licensed banks in Hong Kong 3,210 2,391 2,407 234 49 46 3,444 2,439 2,454
Issued by restricted licence banks in Hong Kong 117 185 185 117 185 185
Issued by deposit-taking companies in Hong Kong 360 420 407 23 39 39 384 459 446
Issued by banks outside Hong Kong 8 5 5 1,471 1,093 1,169 1,479 1,098 1,174
Negotiable debt instrument held, other than NCDs; N.A. 4,931 4,460 N.A. 34,700 39,594 N.A. 39,631 44,055
Acc[;f,tances and bills of exchange hel + 18 184 185 310 986 l,o30 328 1,170 1,215
Floating rate notes and commercial paper held+ 2,075 1,650 1,649 17,020 17,982 21,076 19,095 19,632 22,725
Government bills, notes and bondsil 2,912 2,445 5,171 5,513 8,083 7,958
Other debt instruments helda 185 182 10,560 11,976 10,745 12,158
Investments in shareholdingsil 1,932 371 292 11,459 732 716 13,390 1,103 1,008
Interest in land and buildingsC 101 100 277 282 378 382
Other assets+ 1,269 910 1,080 22,011 4,576 4,292 23,281 5,486 5,371
TotJJl 56,889 64,422 66,678 134,077 117,412 125,229 190,966 181,833 191,908
Number of reporting restricted licence banks 39 49 50
Number of branches 10 11 11
§ Unadjusted for foreign currency swap deposits, adjusted figures are published in table 7. 3 Notes: Due to re-classification of items in statistical return from April 1991:
#Foreign currency component only available from April 1991. + Values from April 1991 onwards arc not strictly comparable to those in the f:st. c The nearest equivalent of the total of these four items before April 1991 is t item 'Treasury bills, securities, .share-holdings and interests in land and buildings'.
@ Less than HK$0.5 million.
62 Hong Kong Monthly Digest of Statistics October 1991
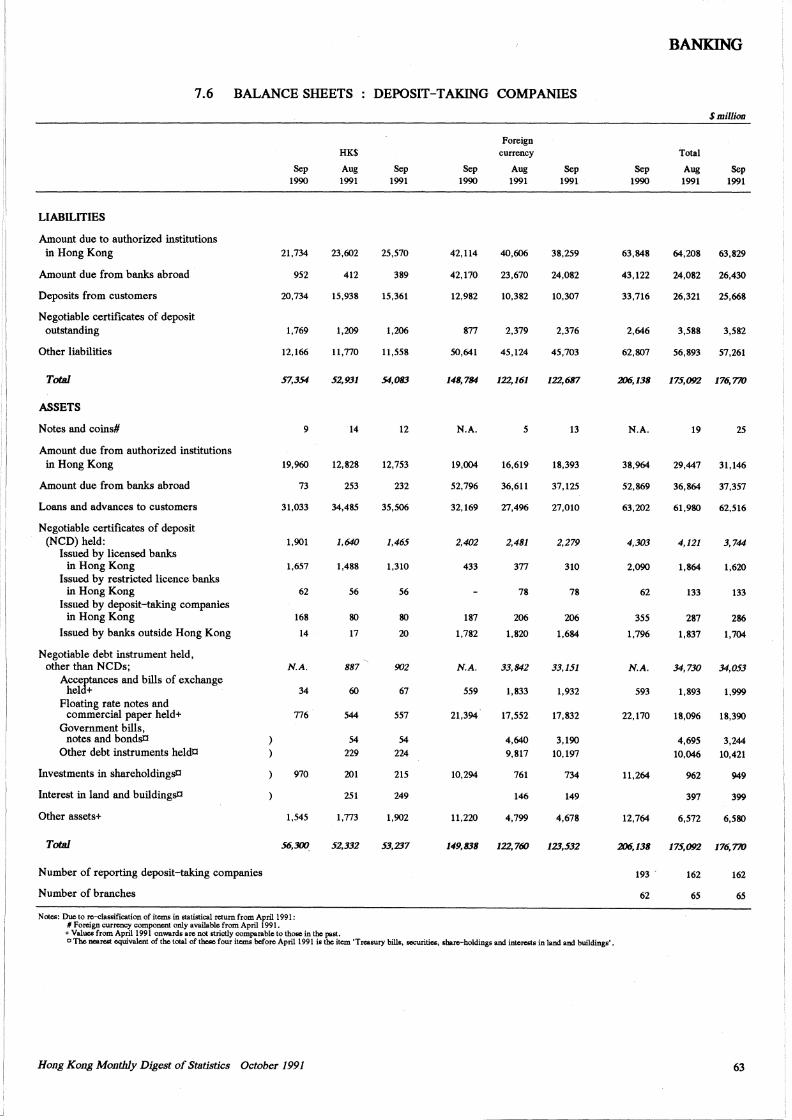
BANKING
7.6 BALANCE SHEETS DEPOSIT-TAKING COMPANIES
$ mil/ion
Foreign HK$ currency Total
Sep Aug Sep Sep Aug Sep Sep Aug Sep 1990 1991 1991 1990 1991 1991 1990 1991 1991
LIABILITIES
Amount due to authorized institutions in Hong Kong 21,734 23,602 25,570 42,114 40,606 38,259 63,848 64,208 63,829
Amount due from banks abroad 952 412 389 42,170 23,670 24,082 43,122 24,082 26,430
Deposits from customers 20,734 15,938 15,361 12,982 10,382 10,307 33,716 26,321 25,668
Negotiable certificates of deposit outstanding 1,769 1,209 1,206 877 2,379 2,376 2,646 3,588 3,582
Other liabilities 12,166 11,770 11,558 50,641 45,124 45,703 62,807 56,893 57,261
Total 57,354 52,931 54,083 148,784 122,161 122,687 206,138 175,092 176,710
ASSETS
Notes and coins# 9 14 12 N.A. 5 13 N.A. 19 25
Amount due from authorized institutions in Hong Kong 19,960 12,828 12,753 19,004 16,619 18,393 38,964 29,447 31,146
Amount due from banks abroad 73 253 232 52,796 36,611 37, 125 52,869 36,864 37,357
Loans and advances to customers 31,033 34,485 35,506 32,169 27,496 27,010 63,202 61,980 62,516
Negotiable certificates of deposit (NCD) held: 1,901 1,640 1,465 2,402 2,481 2,279 4,303 4,121 3,744
Issued by licensed banks in Hong Kong 1,657 1,488 1,310 433 377 310 2,090 1,864 1,620
Issued by restricted licence banks in Hong Kong 62 56 56 78 78 62 133 133
Issued by deposit-taking companies in Hong Kong 168 80 80 187 206 206 355 287 286
Issued by banks outside Hong Kong 14 17 20 1,782 1,820 1,684 1,796 1,837 1,704
Negotiable debt instrument held, other than NCDs; N.A. 887 902 N.A. 33,842 33,151 N.A. 34,730 34,053
Accecf.tances and bills of exchange hel + 34 60 67 559 1,833 1,932 593 1,893 1,999
Floating rate notes and commercial paper held+ 776 544 557 21,394 17,552 17,832 22,170 18,096 18,390
Government bills, notes and bondsO 54 54 4,640 3,190 4,695 3,244
Other debt instruments heldr:l 229 224 9,817 10,197 10,046 10,421
Investments in shareholdingsO 970 201 215 10,294 761 734 11,264 962 949
Interest in land and buildingsr:l 251 249 146 149 397 399
Other assets+ 1,545 1,773 1,902 11,220 4,799 4,678 12,764 6,572 6,580
Total 56,300 52,332 53,237 149,838 122,760 123,532 206,138 175,092 176,710
Number of reporting deposit-taking companies 193 . 162 162
Number of branches 62 65 65
Notes: Due to re-classification of items in statistical return from April 1991: # Foreign currency component only available from April 1991.
+Values from April 1991 onwards are not strictly comparable to those in the past. a The nearest equivalent of the total of these four items before April 1991 is the item 'Treasury bills, securitics, share-holdings and interests in land and buildings'.
Hong Kong Monthly Digest of St.atistics October 1991 63
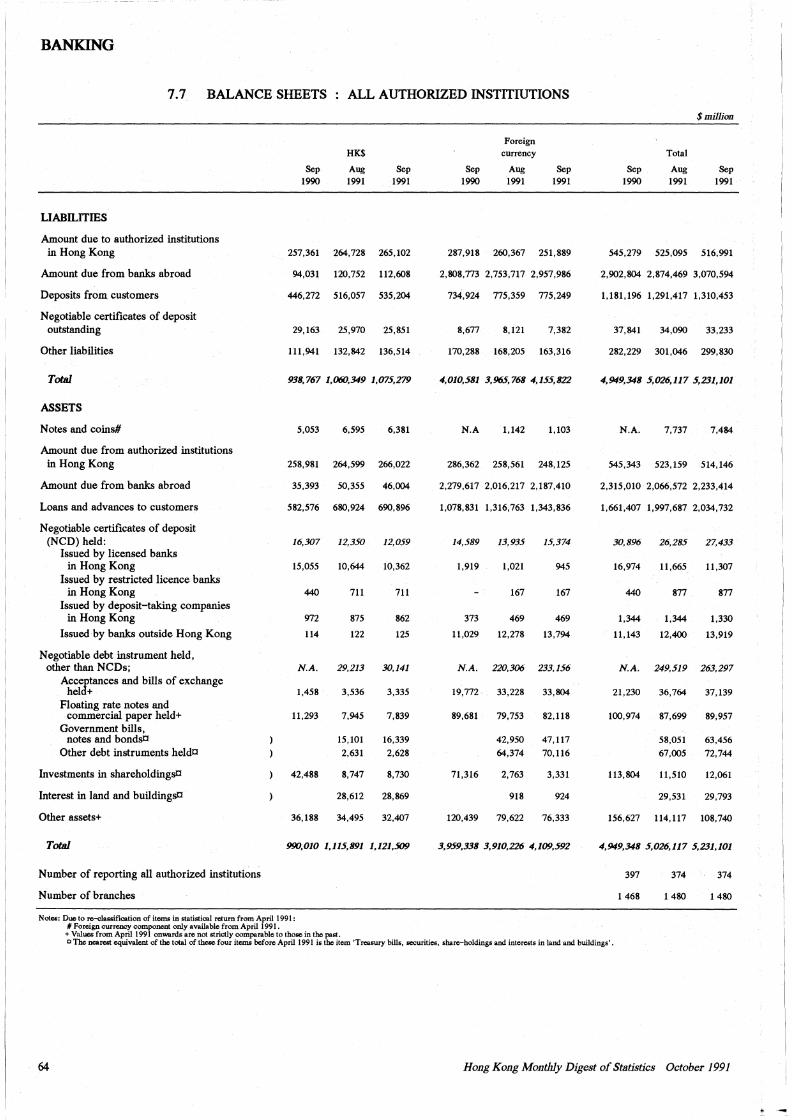
BANKING
7.7 BALANCE SHEETS ALL AUTHORIZED INSTITIUTIONS
$million
Foreign HK$ currency Total
Sep Aug Sep Sep Aug Sep Sep Aug Sep 1990 1991 1991 1990 1991 1991 1990 1991 1991
LIABILITIES
Amount due to authorized institutions in Hong Kong 257,361 264,728 265,102 287,918 260,367 251,889 545,279 525,095 516,991
Amount due from banks abroad 94,031 120,752 112,608 2,808,773 2,753,717 2,957,986 2,902,804 2,874,469 3,070,594
Deposits from customers 446,272 516,057 535,204 734,924 775,359 775,249 1,181,196 1,291,417 1,310,453
Negotiable certificates of deposit outstanding 29,163 25,970 25,851 8,677 8,121 7,382 37,841 34,090 33,233
Other liabilities 111,941 132,842 136,514 170,288 168,205 163,316 282,229 301,046 299,830
Total 938, 767 1,060,349 1,075,279 4,010,581 3,965,768 4,155,822 4,949,348 5,026,117 5,231,101
ASSETS
Notes and coins# 5,053 6,595 6,381 N.A 1,142 1,103 N.A. 7,737 7,484
Amount due from authorized institutions in Hong Kong 258,981 264,599 266,022 286,362 258,561 248, 125 545,343 523,159 514, 146
Amount due from banks abroad 35,393 50,355 46,004 2,279,617 2,016,217 2,187,410 2,315,010 2,066,572 2,233,414
Loans and advances to customers 582,576 680,924 690,896 1,078,831 1,316,763 1,343,836 1,661,407 1,997,687 2,034,732
Negotiable certificates of deposit (NCO) held: 16,307 12,350 12,059 14,589 13,935 15,374 30,896 26,285 27,433
Issued by licensed banks in Hong Kong 15,055 10,644 10,362 1,919 1,021 945 16,974 11,665 11,307
Issued by restricted licence banks in Hong Kong 440 711 711 167 167 440 877 877
Issued by deposit-taking companies in Hong Kong 972 875 862 373 469 469 1,344 1,344 1,330
Issued by banks outside Hong Kong 114 122 125 11,029 12,278 13,794 11, 143 12,400 13,919
Negotiable debt instrument held, other than NCDs; N.A. 29,213 30,141 N.A. 220,306 233,156 N.A. 249,519 263,297
Accef-tances and bills of exchange hel + 1,458 3,536 3,335 19,772 33,228 33,804 21,230 36,764 37,139
Floating rate notes and commercial paper held+ 11,293 7,945 7,839 89,681 79,753 82,118 100,974 87,699 89,957
Government bills, notes and bondsO 15,101 16,339 42,950 47,117 58,051 63,456
Other debt instruments heldC 2,631 2,628 64,374 70,116 67,005 72,744
Investments in shareholdingsO 42,488 8,747 8,730 71,316 2,763 3,331 113,804 11,510 12,061
Interest in land and buildingsO 28,612 28,869 918 924 29,531 29,793
Other assets+ 36,188 34,495 32,407 120,439 79,622 76,333 156,627 114,117 108,740
Total 990,010 1,115,891 1,121,509 3,959,338 3,910,226 4,109,592 4,949,348 5,026,117 5,231,101
Number of reporting all authorized institutions 397 374 374
Number of branches 1 468 1 480 1480
Notes: Due to re-classification of items in statistical return from April 1991 : # Foreign currency component only available from April 1991 .
+ Values from April 1991 onwards are not strictly comparable to those in the past. D The nearest equivalent of the total of these four items before April 1991 is the item 'Treasury bills, securities, share-holdings and interests in land and buildings'.
64 Hong Kong Monthly Digest of Statistics October 1991
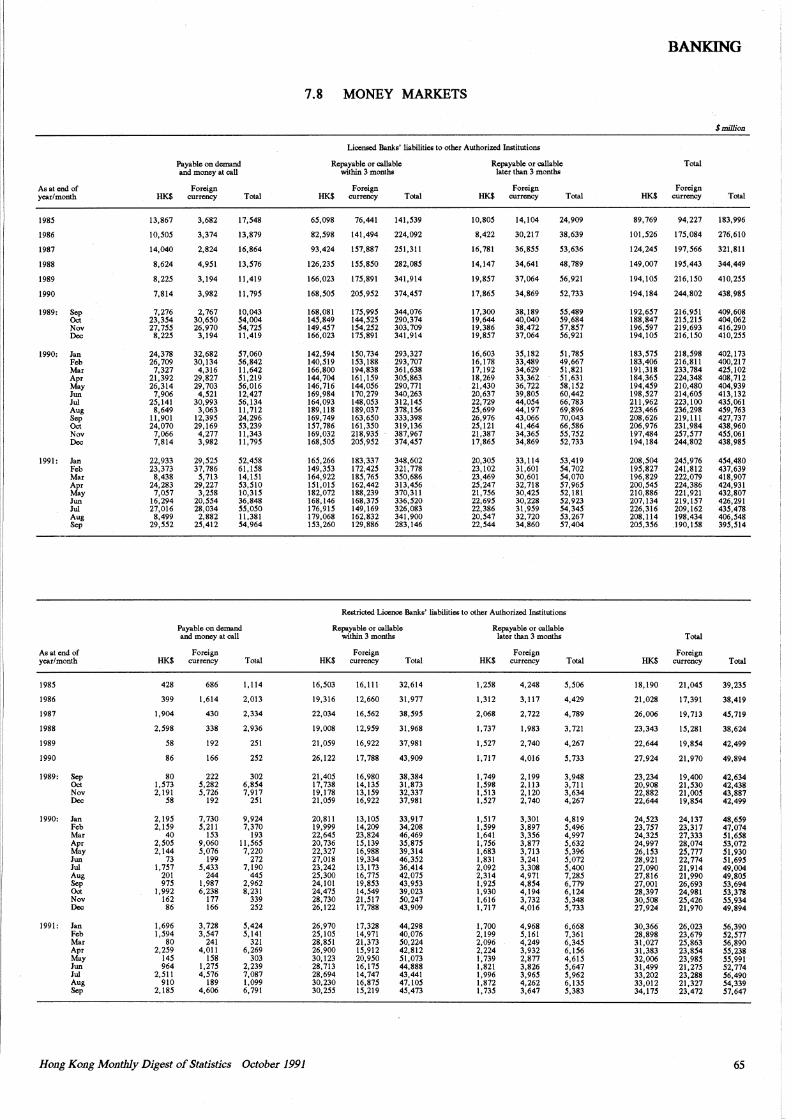
BANKING
7.8 MONEY MARKETS
$milli.on
Licensed Banks' liabilities to O!Mr Authorir.ed Institutions
Payable on demand Repayable or callable Repayable or callable Total and money at call within 3 months later than 3 months
As at end of Foreign Foreign Foreign Foreign year/month HK$ currency Total HK$ currency Total HK$ currency Total HK$ currency Total
19SS 13,S67 3,6S2 17,S4S 6S,09S 76,441 141,S39 10,SOS 14,104 24,909 S9,769 94,227 IS3,996
19S6 10,SOS 3,374 13,S79 S2,S9S 141,494 224,092 S,422 30,217 3S,639 101,S26 17S,084 276,610
19S7 14,040 2,S24 16,S64 93,424 IS7,SS7 2Sl,311 16,781 36,SSS S3,636 124,24S 197,S66 321,Sll
19SS S,624 4,9SI 13,S76 126,23S ISS,SSO 2S2,08S 14,147 34,641 48,789 149,007 19S,443 344,449
1989 8,22S 3,194 11,419 166,023 17S,891 341,914 19,8S7 37,064 S6,921 194,IOS 216,ISO 410,2SS
1990 7,814 3,982 11, 79S 16S,SOS 20S,9S2 374,4S7 17,86S 34,869 S2,733 194,184 244,802 438,98S
1989: Sep 7,276 2,767 10,043 16S,OSI 17S,99S 344,076 17,300 3S,IS9 SS,489 192,6S7 216,9Sl 409,608 Oct 23,354 30,650 S4,004 14S,849 144,S2S 290,374 19,644 40,040 S9,684 188,847 21S,21S 404,062 Nov 27,75S 26,970 S4,72S 149,4S7 !S4,2S2 303,709 19,3S6 3S,472 S7,S57 196,S97 219,693 416,290 Dec S,22S 3,194 11,419 166,023 175,S91 341,914 19,8S7 37,064 S6,921 194,IOS 216,ISO 410,2SS
1990: Jan 24,37S 32,682 S7,060 142,S94 ISO, 734 293,327 16,603 3S,182 Sl,785 183,S75 218,598 402,173 Feb 26,709 30,134 S6,842 140,Sl9 IS3,ISS 293, 707 16,17S 33,489 49,667 IS3,406 216,Sll 400,217 Mar 7,327 4,316 11,642 166,SOO 194,S3S 361,63S 17,192 34,629 Sl,S21 191,31S 233,7S4 42S,102 Apr 21,392 29,S27 Sl,219 144, 704 161,IS9 30S,S63 IS,269 33,362 Sl,631 IS4,36S 224,34S 408,712 May 26,314 29,703 S6,016 146, 716 l44,0S6 290,771 21,430 36,722 SS,IS2 194,4S9 210,4SO 404,939 Jun 7,906 4,S21 12,427 169,9S4 170,279 340,263 20,637 39,S05 60,442 19S,527 214,60S 413,132 Jui 2S,141 30,993 S6,134 164,093 14S,053 312,14S 22,729 44,054 66, 7S3 211,962 223,100 43S,061 Aug S,649 3,063 11,712 IS9, 11S IS9,037 37S,156 2S,699 44,197 69,S96 223,466 236,29S 4S9,763 Sep 11,901 12,395 24,296 169,749 163,650 333,39S 26,976 43,066 70,043 20S,626 219,111 427,737 Oct 24,070 29,169 S3,239 157,7S6 161,350 319,136 2S,121 41,464 66,5S6 206,976 231,9S4 43S,960 Nov 7,066 4,277 11,343 169,032 218,93S 387,967 21,3S7 34,36S S5,752 197,4S4 257,577 4SS,061 Dec 7,S14 3,9S2 11, 79S 16S,505 205,952 374,457 17,S65 34,S69 S2,733 194,IS4 244,S02 43S,9SS
1991: Jan 22,933 29,525 52,45S 165,266 IS3,337 34S,602 20,305 33,114 53,419 208,504 245,976 454,480 Feb 23,373 37,7S6 61,15S 149,353 172,425 321,77S 23,102 31,601 54,702 195,S27 241,Sl2 437,639 Mar S,43S S,713 14,151 164,922 IS5,165 350,6S6 23,469 30,601 54,070 196,S29 222,079 41S,907 Apr 24,2S3 29,227 53,510 ISl,015 162,442 313,456 25,247 32,71S S1,96S 200,S4S 224,3S6 424,931 May 7,057 3,25S 10,315 IS2,072 ISS,239 370,311 21,7S6 30,42S 52,ISI 210,SS6 221,921 432,S07 Jun 16,294 20,SS4 36,S4S 16S,146 16S,37S 336,S20 22,69S 30,228 S2,923 207,134 219,IS7 426,291 Jui 27,016 2S,034 55,050 176,91S 149,169 326,083 22,3S6 31,9S9 54,345 226,316 209,162 435,478 Aug S,499 2,SS2 ll,3Sl 179,06S 162,S32 341,900 20,547 32,720 53,267 20S,114 19S,434 406,S48 Sep 29,SS2 2S,412 S4,964 !S3,260 129,SS6 283,146 22,S44 34,S60 S?,404 205,356 .190,ISS 395,Sl4
Restricted Licence Banks' liabilities to O!Mr Authorir.ed Institutions
Payable on demand Repayable or callable Repayable or callable and money at call within 3 months later than 3 months Total
As at end of Foreign Foreign Foreign Foreign yearlmOnth HK$ currency Total HK$ currency Total HK$ currency Total HK$ currency Total
19S5 42S 686 1,114 16,503 16,111 32,614 l,25S 4,24S S,506 IS,190 21,045 39,235
1986 399 1,614 2,013 19,316 12,660 31,977 1,312 3,117 4,429 21,028 17,391 3S,419
19S7 1,904 430 2,334 22,034 16,S62 3S,S9S 2,06S 2,722 4,789 26,006 19,713 45,719
19SS 2,S9S 338 2,936 19,008 12,959 31,96S 1,737 l,9S3 3,721 23,343 15,281 3S,624
19S9 SS 192 2Sl 21,0S9 16,922 37,9Sl 1,527 2,740 4,267 22,644 19,S54 42,499
1990 S6 166 2S2 26,122 17,788 43,909 l,717 4,016 5,733 27,924 21,970 49,S94
19S9: Sep so 222 302 21,405 16,9SO 3S,3S4 1,749 2,199 3,94S 23,234 19,400 42,634 Oct l,S73 5,2S2 6,854 17,73S 14,13S 31,S73 l,S98 2,113 3,711 20,90S 21,S30 42,43S Nov 2,191 5,726 7,917 19,178 13,159 32,337 l,Sl3 2,120 3,634 22,882 21,00S 43,SS7 Dec SS 192 2Sl 21,059 16,922 37,9Sl l,S21 2,740 4,267 22,644 19,SS4 42,499
1990: Jan 2,19S 7,730 9,924 20,Sll 13,105 33,917 l,Sl7 3,301 4,Sl9 24,523 24,137 48,659 Feb 2,IS9 5,211 7,370 19,999 14,209 34,208 l,S99 3,S97 5,496 23,7S7 23,317 47,074 Mar 40 IS3 193 22,645 23,S24 46,469 l,641 3,3S6 4,997 24,32S 27,333 51,65S Apr 2,50S 9,060 11,565 20,736 !S,139 3S,S75 1,756 3,877 S,632 24,997 28,074 53,072 May 2,144 5,016 7,220 22,327 16,988 39,314 1,683 3,713 5,396 26,153 25,777 51,930 Jun 73 199 272 27,018 19,334 46,352 1,831 3,241 5,072 28,921 22,774 51,695 Jui 1,757 5,433 7,190 23,242 13,173 36,414 2,092 3,308 5,400 27,090 21,914 49,004 Aug 201 244 445 25,300 16,115 42,075 2,314 4,971 7,285 27,816 21,990 49,805 Sep 975 l,987 2,962 24,101 19,853 43,953 l,92S 4,854 6,779 27,001 26,693 53,694 Oct 1,992 6,23S 8,231 24,47S 14,549 39,023 1,930 4,194 6,124 2S,397 24,981 S3,378 Nov 162 177 339 28,730 21,517 50,247 1,616 3,732 5,348 30,508 2S,426 55,934 Dec S6 166 2S2 26,122 17,7S8 43,909 l,717 4,016 5,733 27,924 21,970 49,S94
1991: Jan 1,696 3,728 S,424 26,970 17,328 44,298 1,700 4,968 6,668 30,366 26,023 56,390 Feb 1,594 3,547 5,141 25,105 14,971 40,076 2,199 5,161 7,361 28,898 23,679 52,571 Mar 80 241 321 28,851 21,373 50,224 2,096 4,249 6,345 31,027 25,863 56,890 Apr 2,259 4,011 6,269 26,900 15,912 42,812 2,224 3,932 6,156 31,383 23,854 55,238 May 145 158 303 30,123 20,950 51,073 1,739 2,877 4,615 32,006 23,985 55,991 Jun 964 l,21S 2,239 28,713 16,115 44,8S8 1,821 3,826 5,647 31,499 21,275 S2,774 Jui 2,Sll 4,S16 7,087 28,694 14,747 43,441 1,996 3,96S S,962 33,202 23,288 56,490 Aug 910 189 1,099 30,230 16,S75 47,IOS 1,872 4,262 6,135 33,012 21,327 54,339 Sep 2,185 4,606 6,791 30,255 !S,219 4S,473 1,735 3,647 S,383 34,175 23,472 57,647
Hong Kong Mont.hly Digest of Statistics October 1991 65
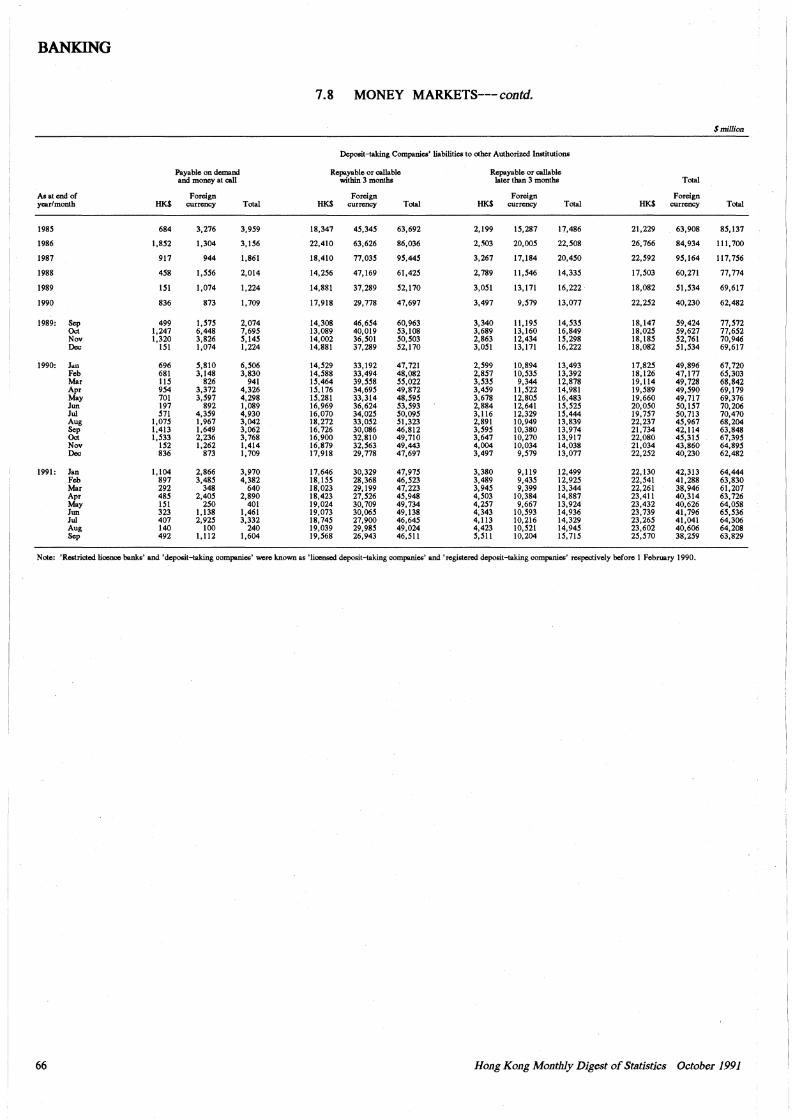
--------------
BANKING
7.8 MONEY MARKETS--- contd.
$million
Deposit-taking Companies' liabilities to other Authorized institutions
Payable on demand Repayable or callable Repayable or callable and money at call within 3 months later than 3 months Total
As at end of Foreign Foreign Foreign Foreign year/month HK$ currency Total HK$ currency Total HK$ currency Total HK$ currency Total
1985 684 3,276 3,959 18,347 45,345 63,692 2,199 15,287 17,486 21,229 63,908 85,137
1986 1,852 1,304 3,156 22,410 63,626 86,036 2,503 20,005 22,508 26, 766 84,934 111,700
1987 917 944 1,861 18,410 77,035 95,445 3,267 17,184 20,450 22,592 95,164 117,756
1988 458 1,556 2,014 14,256 47,169 61,425 2,789 11,546 14,335 17,503 60,271 77,774
1989 151 1,074 1,224 14,881 37,289 52,170 3,051 13, 171 16,222 18,082 51,534 69,617
1990 836 873 1,709 17,918 29,778 47,697 3,497 9,579 13,077 22,252 40,230 62,482
1989: Sep 499 1,575 2,074 14,308 46,654 60,963 3,340 11,195 14,535 18,147 59,424 77,572 Oct 1,247 6,448 7,695 13,089 40,019 53,108 3,689 13,160 16,849 18,025 59,627 77,652 Nov 1,320 3,826 5,145 14,002 36,501 50,503 2,863 12,434 15,298 18,185 52,761 70,946 Dec 151 1,074 1,224 14,881 37,289 52,170 3,051 13,171 16,222 18,082 51,534 69,617
1990: Jan 696 5,810 6,506 14,529 33,192 47,721 2,599 10,894 13,493 17,825 49,896 67,720 Feb 681 3,148 3,830 14,588 33,494 48,082 2,857 10,535 13,392 18,126 47,177 65,303 Mar 115 826 941 15,464 39,558 55,022 3,535 9,344 12,878 19,114 49, 728 68,842 Apr 954 3,372 4,326 15,176 34,695 49,872 3,459 11,522 14,981 19,589 49,590 69,179 May 701 3,597 4,298 15,281 33,314 48,595 3,678 12,805 16,483 19,660 49,717 69,376 Jun 197 892 1,089 16,969 36,624 53,593 2,884 12,641 15,525 20,050 50,151 70,206 Jn[ 571 4,359 4,930 16,070 34,025 50,095 3,116 12,329 15,444 19,757 50,713 70,470 Aug 1,075 1,967 3,042 18,272 33,052 51,323 2,891 10,949 13,839 22,237 45,967 68,204 Sep 1,413 1,649 3,062 16,726 30,086 46,812 3,595 10,380 13,974 21, 734 42,114 63,848 Oct 1,533 2,236 3,768 16,900 32,810 49,710 3,647 10,270 13,917 22,080 45,315 67,395 Nov 152 1,262 1,414 16,879 32,563 49,443 4,004 10,034 14,038 21,034 43,860 64,895 Dec 836 873 1,709 17,918 29,778 47,697 3,497 9,579 13,077 22,252 40,230 62,482
1991: Jan 1,104 2,866 3,970 17,646 30,329 47,975 3,380 9,119 12,499 22,130 42,313 64,444 Feb 897 3,485 4,382 18,155 28,368 46,523 3,489 9,435 12,925 22,541 41,288 63,830 Mar 292 348 640 18,023 29,199 47,223 3,945 9,399 13,344 22,261 38,946 61,207 Apr 485 2,405 2,890 18,423 27,526 45,948 4,503 10,384 14,887 23,411 40,314 63,726 May 151 250 401 19,024 30,709 49,734 4,257 9,667 13,924 23,432 40,626 64,058 Jun 323 1,138 1,461 19,073 30,065 49,138 4,343 10,593 14,936 23,739 41,796 65,536 Jn[ 407 2,925 3,332 18,745 27,900 46,645 4,113 10,216 14,329 23,265 41,041 64,306 Aug 140 100 240 19,039 29,985 49,024 4,423 10,521 14,945 23,602 40,606 64,208 Sep 492 1,112 1,604 19,568 26,943 46,51 I 5,511 10,204 15,715 25,570 38,259 63,829
Note: 'Restricted licence banks' and 'deposit-taking companies' were known as 'licensed deposit-taking companies' and 'registered deposit-taking companies' respectively before 1 February 1990.
66 Hong Ko11g Monthly Digest of Statistics October 1991
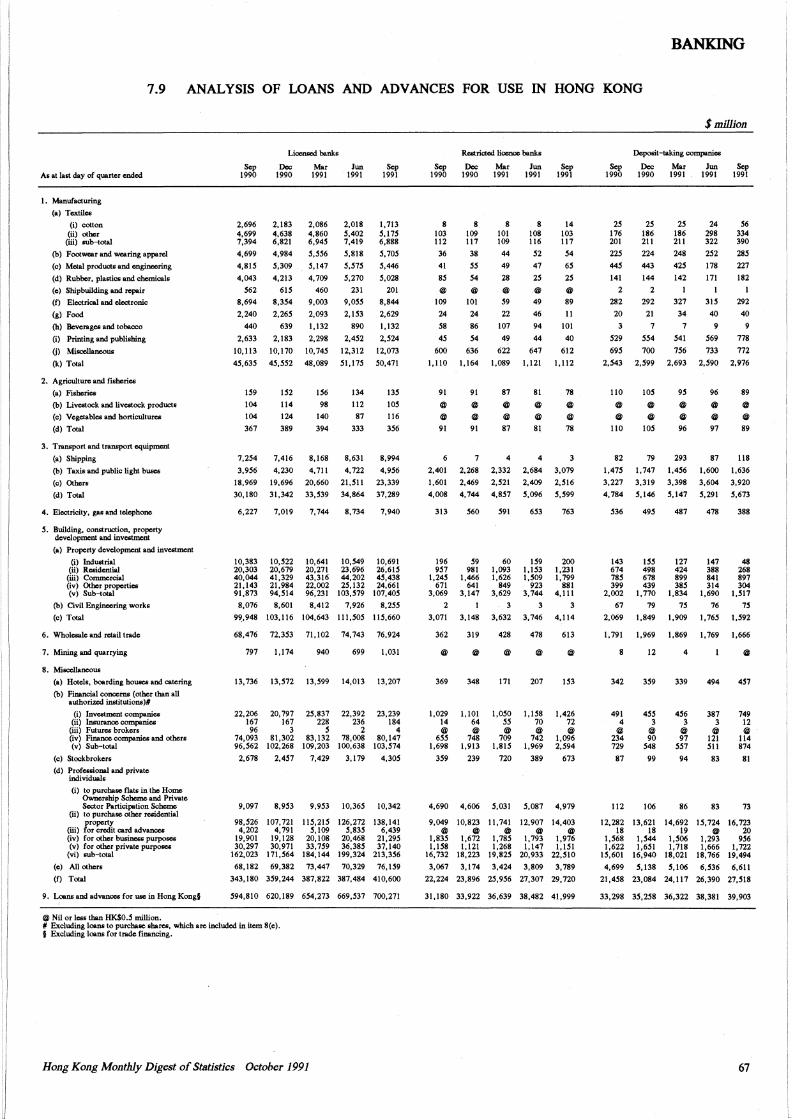
BANKING
7 .9 ANALYSIS OF LOANS AND ADVANCES FOR USE IN HONG KONG
A• at last day of quarter ended
l . Manufacturing
(a) Textiles
(i) cotton (ii) other
(iii) sub-total
(b) Footwear and wearing apparel
(c) Metal product• and engineering
(d) Rubber, plastics and chemicals
(e) Shipbuilding and repair
(f) Electrical and electronic
(g) Food
(h) Beverages and tobacco
(i) Printing and publishing
(j) Miscellaneous
(k) Total
2. Agriculture and fisheries
(a) Fisheries
(b) Livestock and livestock products
(c) Vegetables and horticultures
(d) Total
3. Transport and transport equipment
(a) Shipping
(b) Taxis and public light buses
(c) Others
(d) Total
4. Electricity, gas and telephone
S. Building, construction, property development and investment
(a) Property development and inve&tment
(i) Industrial (ii) Residential
(iii) Commercial (iv) Other properties (v) Sub-total
(b) Civil Engineering work•
(c) Total
6. Wholesale and retail trade
7. Mining and quarrying
8. Miscellaneous
(a) Hotels, boarding houses and catering
(b) Financial concerns (other than all authorized institutions)#
(i) lnve6lment companies (ii) Inrurance companies
(iii) Futures brokers (iv) Finance companies and others (v) Sub-total
(c) Stockbrokers
(d) Profemonal and private individuals
(i) to purchase flats in the Home Ownership Scheme and Private Sector Participation Scheme
(ii) to purchase other residential property
(iii) for credit card advanoes (iv) for other business purposes (v) for other private purposes
(vi) sub-total
(e) All others
(f) Total
9. Loans and advances for use in Hong Kong§
@ Nil or less than HK$0.S million.
Licensed bank•
Sep 1990
Dec Mar Jun 1991
Sep 1991 1990 1991
2,696 4,699 7,394
4,699
4,81S
4,043
S62
8,694
2,240
440
2,633
10,113
4S,63S
2,183 4,638 6,821
4,984
S,309
4,213
61S
8,3S4
2,26S
639
2,183
10,170
4S,SS2
IS9 IS2
104 114
104 124
367 389
7,2S4 7,416
3,9S6 4,230
18,969 19,696
30,180 31,342
6,227 7,019
10,383 20,303 40,044 21.143 91,873
l0,S22 20,679 41,329 21,984 94,Sl4
2,086 4,860 6,94S
S,SS6
5,141
4,709
460
9,003
2,093
1,132
2,298
I0,74S
48,089
2,018 S,402 7,419
S,818
S,S1S
S,270
231
9,0SS
2,lS3
890
2,4S2
12,312
Sl,l7S
I.713 S,11S 6,888
S,10S
S,446
S,028
201 8,844
2,629
1,132
2,S24
12,073
S0,471
1S6 134 13S
98 112 lOS
140 87 116
394 333 3S6
8, 168 8,631 8,994
4, 71 l 4, 722 4, 9S6
20,660 21.Sl l 23,339
33,S39 34,864 37,289
7,744 8,734 7,940
10,641 20,271 43,316 22,002 96,231
l0,S49 23,696 44,202 2S,l32
103,S79
10,691 26,61S 4S,438 24,661
107,40S
8,076 8,601 8,412 7,926 8,2SS
99,948 103,116 104,643 111,SOS llS,660
68,476 72,3S3 71,102 74,743 76,924
797
13,736
22,206 167 96
74,093 96,S62
2,678
9,097
98,S26 4,202
19,901 30,297
162,023
l,174
13,S72
20,797 167
3 81,302
102,268
2,4S7
8,953
107,721 4,791
19,128 30,971
17l,S64
940
13,599
2S,837 228
5 83,132
109,203
7,429
9,9S3
llS,21S 5,109
20,108 33,7S9
184,144
699
14,013
22,392 236
2 78,008
100,638
3,179
10,36S
126,272 S,83S
20,468 36,385
199,324
l,031
13,207
23,239 184
4 80,147
103,574
4,30S
10,342
138,141 6,439
21,295 37,140
213,3S6
68,182 69,382 73,447 70,329 76,lS9
343,180 3S9,244 387,822 387,484 410,600
S94,810 620,189 6S4,273 669,S37 700,271
II Excluding loans to purchase shares, which are included in item 8(e). § Excluding loans for trade financing.
Hong Kong Monthly Digest of Statistics October 1991
Sep 1990
8 103 112
36
41
8S
@
109
24
S8
4S
600
1,110
91
@
@
91
2,401
1,601
4,008
313
196 9S7
l,24S 671
3,069
2
3,071
362
@
369
l,029 14 @
6SS l,698
359
4,690
9,049 @
1,835 l,lS8
16,732
3,067
Restricted licence bank•
Dec Mar Jun 1990 1991 1991
8 109 117
38
SS
S4
@
101
24
86
S4
636
l,164
8 101 109
44
49
28 @
S9
22
107
49
622
l,089
91 87
@ @ @ @ 91 87
7 4 2,268 2,332
2,469 2.s21
4,744 4,8S7
S60 S91
S9 981
l,466 641
3,147
3,148
319
@
348
l,101 64 @
748 l,913
239
4,606
10,823 @
1,672 1,121
18,223
3,174
60 1,093 1,626
849 3,629
3,632
428
@
171
t,OSO SS @
709 l,81S
720
S,031
11,741 @
l,78S 1,268
19,825
3,424
8 108 116
S2
47
2S
@
49
46
94
44
647
l.121
81
@
@
81
4
2,684
2,409
S,096
653
159 l,153 l,509
923 3,744
3,746
478
@
207
l,158 70 @
742 l,969
389
5,087
12,907 @
l,793 1,147
20,933
3,809
l~
14 103 117
S4
6S
2S
@
89
It
101
40
612
1,112
78
@
@
78
3,079
2,Sl6
5,S99
763
200 l,231 l,799
881 4,111
3 4,114
613
@
153
l,426 72 @
l,096 2,594
673
4,979
14,403 @
1,976 1,151
22,510
3,789
22,224 23,896 25,956 27,307 29,720
31,180 33,922 36,639 38,482 41,999
Sep 1990
25 176 201
225
445
141
2 282
20
529
69S
2,543
110
@
@
110
82
l,475
3,227
4,784
536
143 674 785 399
2,002
67
2,069
$million
Deposit-taking companie.i
Dec Mar Jun 1990 1991 1991
25 186 211
224
443
144
2
292
21
7
SS4
700
2,599
105
@
@
105
79
l,747
3,319
5,146
495
ISS 498 678 439
l,770
79
l,849
25 186 211
248
425
142
327
34
7
S4t
756
2,693
9S
@
@
96
293
1,456
3,398
S,147
487
127 424 899 385
l,834
75
l,909
24 298 322
252
178
171
I 315
40
9
569
733
2,S90
96
@
@
97
87
1,600
3,604
5,291
478
147 388 841 314
1,690
76
l,765
Sep 1991
S6 334 390
285
227
182
292
40
9
778
772
2,976
89
@
@
89
118
l,636
3,920
5,673
388
48 268 897 304
l,Sl7
7S
1,592
1,791 l,969 l,869 1,769 1,666
342
491 4
@ 234 729
87
112
12
3S9
4SS 3
@ 90
548
99
106
4
339
456 3
@ 97
557
94
86
494
387 3
@ 121 Sil
83
83
@
4S7
749 12 @
114 874
81
73
12,282 13,621 14,692 15,724 16,723 18 18 19 @ 20
1,568 1,544 l,S06 1,293 956 l,622 1,6Sl l,718 1,666 1,722
lS,601 16,940 18,021 18, 766 19,494
4,699 5,138 5,106 6,536 6,611
21,458 23,084 24, ll 7 26,390 27,518
33,298 35,2S8 36,322 38,381 39,903
67
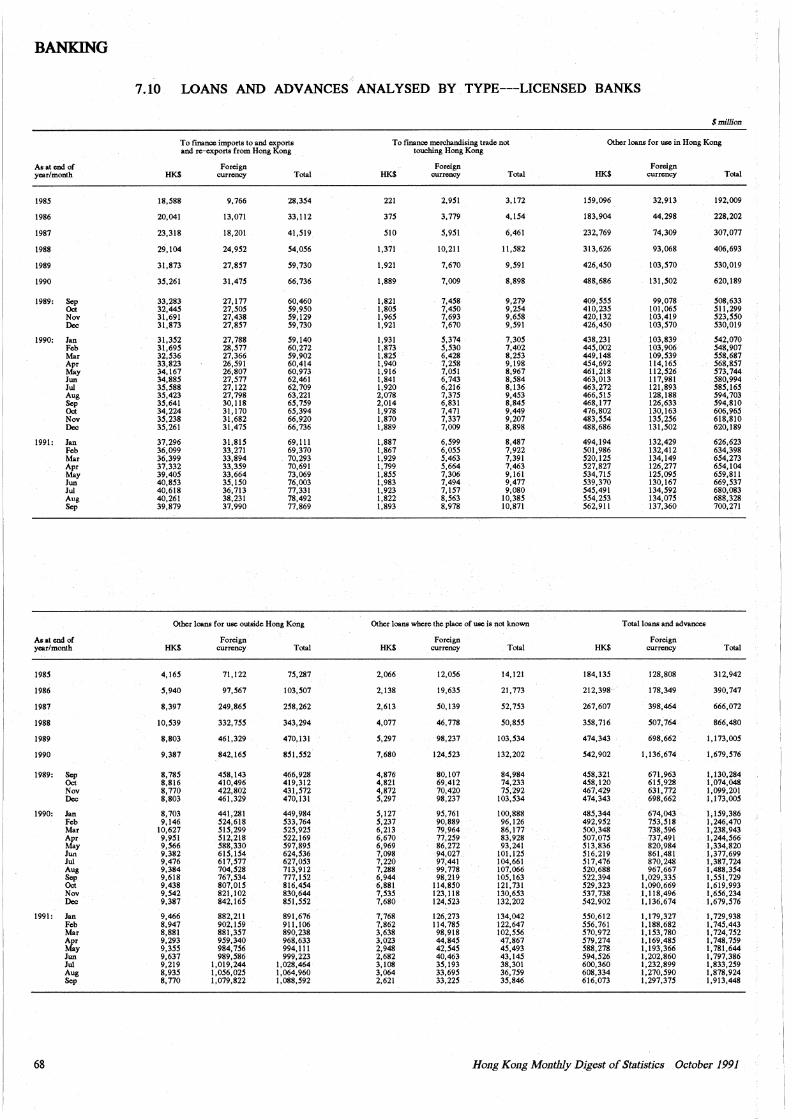
BANKING
-~
7.10 LOANS AND ADVANCES ANALYSED BY TYPE---LICENSED BANKS
$million
To rmancc imports to and exports To finance merchandising trade not Otbor Joans for use in Hong Kong and ie-eo:ports from Hoag Kong touching Hoag Kong
As at end of Foreign Foreign Foreign year/month HK$ currency Tolal HK$ currency Total HK$ currency Tolal
J985 18,S88 9,766 28,3S4 221 2,9SI 3,172 IS9,096 32,913 192,009
1986 20,041 13,071 33,112 31S 3,779 4,IS4 183,904 44,298 228,202
1987 23,318 18,201 41,SJ9 SIO 5,951 6,461 232,769 74,309 307,077
1988 29.104 24,952 54,056 1,371 10.211 11,582 313,626 93,068 406,693
1989 31,873 27,857 S9, 730 1,921 7,670 9,591 426,4SO l03,S70 S30,019
1990 35,261 31,47S 66,736 l,889 7,009 8,898 488,686 131,S02 620,189
1989: Sep 33,283 27,177 60,460 l,821 7,4S8 9,279 409,5SS 99,078 S08,633 Oct 32,44S 21,SOS S9,9SO l,80S 7,450 9,2S4 410,23S IOl,06S Sll,299 Nov 31,691 27,438 S9,129 1,965 7,693 9,6S8 420,132 103,419 523,SSO Dec 31,873 27,8S7 S9,130 1,921 .7,670 9,S91 426,4SO 103,S70 S30,019
1990: Jan 31,3S2 27,788 S9,140 1,931 S,374 1,30S 438,231 103,839 S42,070 Feb 31,69S 28,S77 60,272 1,873 S,S30 7,402 44S,002 103,906 S48,907 Mar 32,S36 27,366 S9,902 l,82S 6,428 8,2S3 449,148 109,S39 S58,687 Apr 33,823 26,S91 60,414 J,940 7,258 9,198 454,692 114,165 568,851 May 34,167 26,807 60,973 1,916 1,051 8,967 461,218 112,S26 S73,744 Jun 34,885 21,S11 62,461 1,841 6,743 8,584 463,013 117,981 S80,994 Jui 35,S88 27,122 62,709 1,920 6,216 8,136 463,272 121,893 S8S,16S Aug 35,423 27, 798 63,221 2,078 1,31S 9,4S3 466,SIS 128,188 S94,703 Sep 3S,641 30,118 65,1S9 2,014 6,831 8,845 468,177 126,633 S94,810 Oct 34,224 31,170 65,394 1,978 7,471 9,449 476,802 130,163 606,96S Nov 35,238 31,682 66,920 1,870 7,337 9,207 483,554 13S,2S6 618,810 Dec 3S,261 3J,47S 66,736 1,889 7,009 8,898 488,686 131,S02 620,189
1991: Jan 37,296 31,815 69,111 1,887 6,599 8,487 494,194 132,429 626,623 Feb 36,099 33,271 69,370 1,867 6,055 7,922 501,986 132,412 634,398 Mar 36,399 33,894 70,293 1,929 5,463 7,391 520,J25 134,149 654,273 Apr 37,332 33,359 70,691 J,799 5,664 7,463 S21,821 J26,277 654,104 May 39,405 33,664 73;069 l,8S5 7,306 9,161 534,71S 125,095 6S9,811 Jun 40,8S3 3S,150 76,003 1.983 7,494 9,477 S39,370 130,167 669,537 Jui 40,618 36,713 77,331 l,923 1,IS1 9,080 S4S,491 134,S92 680,083 Aug 40,261 38,231 78,492 1,822 8,S63 I0,38S SS4,253 134,07S 688,328 Sep 39,879 37,990 77,869 1,893 8,978 10,871 S62,911 137,360 700,27J
Otbor Joans for use outside Hoag Kong Other Joans where the place of use is not known Total loans and advances
As at end of Foreign Foreign Foreign year/month HK$ currency Tolal HK$ currency Total HK$ currency Tolal
J98S 4,J65 71,J22 1S,281 2,066 12,0S6 14,121 184,13S 128,808 3J2,942
1986 5,940 91,S61 l03,S07 2,138 19,63S 21,773 212,398-· J78,349 390,747
1987 8,397 249,86S 2S8,262 2,613 SO,J39 S2, 7S3 267,607 398,464 666,072
1988 J0,539 332,1SS 343,294 4,077 46,778 SO, SSS 3S8, 716 S07,764 866,480
1989 8,803 461,329 470,131 S,291 98,237 103,534 474,343 698,662 l,173,00S
1990 9,387 842,165 851,552 7,680 J24,523 J32,202 542,902 l,J36,674 1,619,516
1989: Sep 8,785 458,143 466,928 4,876 80,J07 84,984 458,321 671,963 1,130,284 Oct 8,816 4J0,496 419,312 4,821 69,412 74,233 458,J20 615,928 1,074,048 Nov 8,770 422,802 431,572 4,872 70,420 75,292 467,429 631, 772 l,099,20J Dec 8,803 461,329 470,131 5,291 98,237 J03,534 474,343 698,662 1,173,005
J990: Jan 8,703 44J,281 449,984 5,127 95,761 100,888 485,344 674,043 1,159,386 Feb 9,J46 524,618 S33, 764 5,237 90,889 96,126 492,952 153,Sl8 1,246,470 Mar 10,627 51S,299 525,925 6,213 79,964 86,177 500,348 738,S96 J;238,943 Apr 9,9SI Sl2,218 S22,169 6,670 77,259 83;928 S01,01S 737,491 J,244,566 May 9,S66 S88,330 S97,895 6,969 86,272 93,241 Sl3,836 820,984 1,334,820 Jun 9,382 61S,IS4 624,S36 7,098 94,027. 101.12s Sl6,219 861,481 1,377,699 Jui 9,476 617,577 627,053 7,220 97,441 104,661 517,476 870,248 1,387,724 Aug 9,384 704,528 713,912 7,288 99, 778 107,066 520,688. 967,667 l,488,3S4 Sep 9,618 767,S34 777,152 6,944 98,219 IOS,163 S22,394 l,029,33S l,S51,129 Oct 9,438 807,0IS 816,4S4 6,881 114,8SO 121,731 S29,323 1,090,669 1,619,993 Nov 9,542 821,102 830,644 1,535 123,118 130,653 537,738 1,118,496 1,656,234 Dec 9,387 842,165 851,552 7,680 124,523 132,202 542,902 1,136,674 1,619,S16
1991: Jan 9,466 882,211 891,676 7,768 126;273 134,042 550,612 1,179,327 1,729,938 Feb 8,947 902,159 911.106 7,862 114, 78S 122,647 556,761 l,J88,682 1.745,443 Mar 8,881 881,357 890,238 3,638 98,918 102,5S6 S70,972 l,J53,780. 1.124,152 Apr 9,293 9S9,340 968,633 3,023 44,84S 47,867 S79,274 l,169,48S 1,748, 159 May 9,355 984,756 994,111 2,948 42,545 45,493 588,278 1,193,366 1,781,644 Jun 9,637 989,S86 999,223 2,682 40,463 43,14S 594,S26 1,202,860 1,797,386 Jui 9,219 1,019,244 1,028,464· 3,108 3S,193 38,301 600,360 1,232,899 1,833,259 Aug 8,93S 1,056,025 1,064,960 3,064 33,69S 36, 1S9 608,334 1,270,590 1,878,924 Sep 8,770 1,079,822 1,088,592 2,621 33,225 3S,846 616,073 l,297,37S 1,913,448
68 Hong Kong Monthly Digest of Statistics October 1991
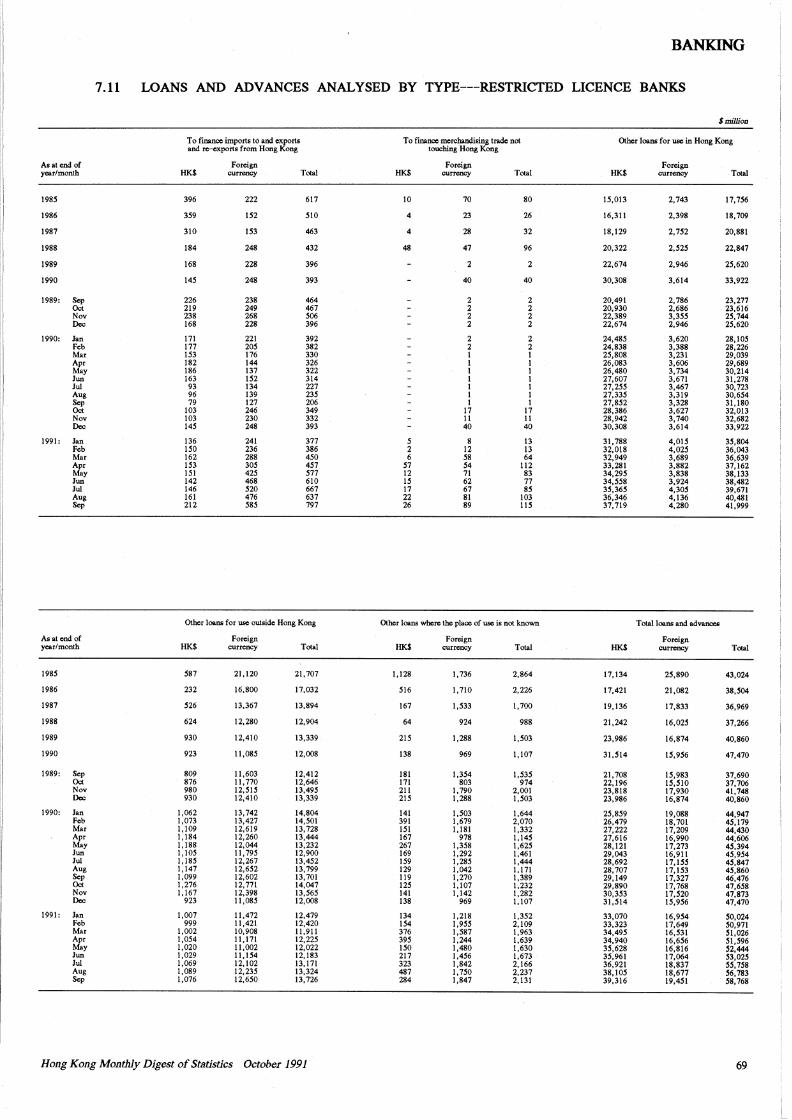
BANKING
7.11 LOANS AND ADVANCES ANALYSED BY TYPE---RESTRICTED LICENCE BANKS
$million
To finance imports t6 and exports To finance merchandising trade not Other loans for use in Hong Kong and re-exports from Hong Kong touching Hong Kong
As at end of Foreign Foreign Foreign year/month HK$ currency Total HK$ currency Total HK$ currency Total
1985 396 222 617 10 70 80 15,013 2,743 17,7S6
1986 3S9 IS2 SlO 4 23 26 16,311 2,398 18,709
1987 310 IS3 463 4 28 32 18,129 2,752 20,881
1988 184 248 432 48 47 96 20,322 2,52S 22,847
1989 168 228 396 2 2 22,674 2,946 25,620
1990 14S 248 393 40 40 30,308 3,614 33,922
1989: Sep 226 238 464 2 2 20,491 2,786 23,277 Oct 219 249 467 2 2 20,930 2,686 23,616 Nov 238 268 S06 2 2 22,389 3,35S 25,744 Dec 168 228 396 2 2 22,674 2,946 2S,620
1990: Jan 171 221 392 2 2 24,48S 3,620 28,IOS Feb 177 20S 382 2 2 24,838 3,388 28,226 Mar IS3 176 330 I I 2S,808 3,231 29,039 Apr 182 144 326 I I 26,083 3,606 29,689 May 186 137 322 I I 26,480 3,734 30,214 Jun 163 IS2 314 I I 27,607 3,671 31,278 Jui 93 134 227 I I 27,2SS 3,467 30,723 Aug 96 139 23S I I 27,33S 3,319 30,6S4 Sep 79 127 206 I I 27,8S2 3,328 31,180 Oct 103 246 349 17 17 28,386 3,627 32,013 Nov 103 230 332 11 11 28,942 3,740 32,682 Dec 14S 248 393 40 40 30,308 3,614 33,922
1991: Jan 136 241 377 s 8 13 31,788 4,0IS 3S,804 Feb ISO 236 386 2 12 13 32,018 4,02S 36,043 Mar 162 288 4SO 6 SS 64 32,949 3,689 36,639 Apr JS3 305 4S1 S1 S4 112 33,281 3,882 37,162 May ISI 425 S77 12 71 83 34,29S 3,838 38,133 Jun 142 468 610 IS 62 77 34,SSS 3,924 38,482 Jui 146 S20 667 17 67 SS 3S,36S 4,30S 39,671 Aug 161 476 637 22 81 103 36,346 4,136 40,481 Sep 212 SSS 797 26 89 llS 37,719 4,280 41,999
Other loans for use outside Hong Kong Other loans where the place of use is not known Total loans and adV8IJCCS
As at end of Foreign Foreign Foreign year/month HK$ currency Total HK$ currency Total HK$ currency Total
198S S87 21,120 21,707 1,128 1,736 2,864 17,134 25,890 43,024
1986 232 16,800 17,032 Sl6 1,710 2,226 17,421 21,082 38,S04
1987 S26 13,367 13,894 167 l,S33 1,700 19,136 17,833 36,969
1988 624 12,280 12,904 64 924 988 21,242 16,025 37,266
1989 930 12,410 13,339 21S 1,288 1,503 23,986 16,874 40,860
1990 923 ll,08S 12,008 138 969 1,107 31,Sl4 15,956 47,470
1989: Sep 809 11,603 12,412 181 1,354 l,S3S 21,708 15,983 37,690 Oct 876 11,770 12,646 171 803 974 22,196 15,510 37,706 Nov 980 12,515 13,49S 211 l,790 2,001 23,818 17,930 41,748 Dec 930 12,410 13,339 215 1,288 1,503 23,986 16,874 40,860
1990: Jan 1,062 13,742 14,804 141 l,S03 1,644 25,859 19,088 44,947 Feb 1,073 13,427 14,501 391 1,679 2,070 26,479 18,701 4S,179 Mar 1,109 12,619 13,728 151 1,181 1,332 27,222 17,209 44,430 Apr 1,184 12,260 13,444 167 978 l,145 27,616 16,990 44,606 May 1,188 12,044 13,232 267 1,358 l,62S 28,121 17,273 4S,394 Jun 1,105 11,795 12,900 169 1,292 1,461 29,043 16,911 4S,9S4 Jui l,18S 12,267 13,4S2 IS9 l,28S 1,444 28,692 11,ISS 4S,841 Aug 1,147 12,6S2 13,799 129 1,042 1,171 28,707 17,IS3 45,860 Sep 1,099 12,602 13,701 119 1,270 1,389 29,149 17,327 46,476 Oct 1,276 12,771 14,047 12S 1,107 1,232 29,890 17,768 47,6S8 Nov 1,167 12,398 13,565 141 1,142 1,282 30,353 17,520 47,873 Dec 923 11,0SS 12,008 138 969 J,107 31,St4 15,956 47,470
1991: Jan 1,007 11,472 12,479 134 l,218 1,352 33,070 16,9S4 S0,024 Feb 999 11,421 12,420 154 l,95S 2,109 33,323 17,649 S0,911 Mar 1,002 10,908 11,911 376 1,587 1,963 34,495 16,531 Sl,026 Apr l,OS4 11,171 12,225 395 1,244 1,639 34,940 16,656 Sl,596 May 1,020 11,002 12,022 150 1,480 1,630 35,628 16,816 S2,444 Jun l,029 ll,154 12,183 217 1,456 1,673 3S,961 17,064 S3,02S Jui 1,069 12,102 13,171 323 1,842 2,166 36,921 18,837 55,1S8 Aug 1,089 12,235 13,324 487 l,1SO 2,237 38,IOS 18,677 56,783 Sep 1,076 12,6SO 13,726 284 1,847 2,131 39,316 19,4SI 58,768
Hong Kong Monthly Digest of Statistics October 1991 69
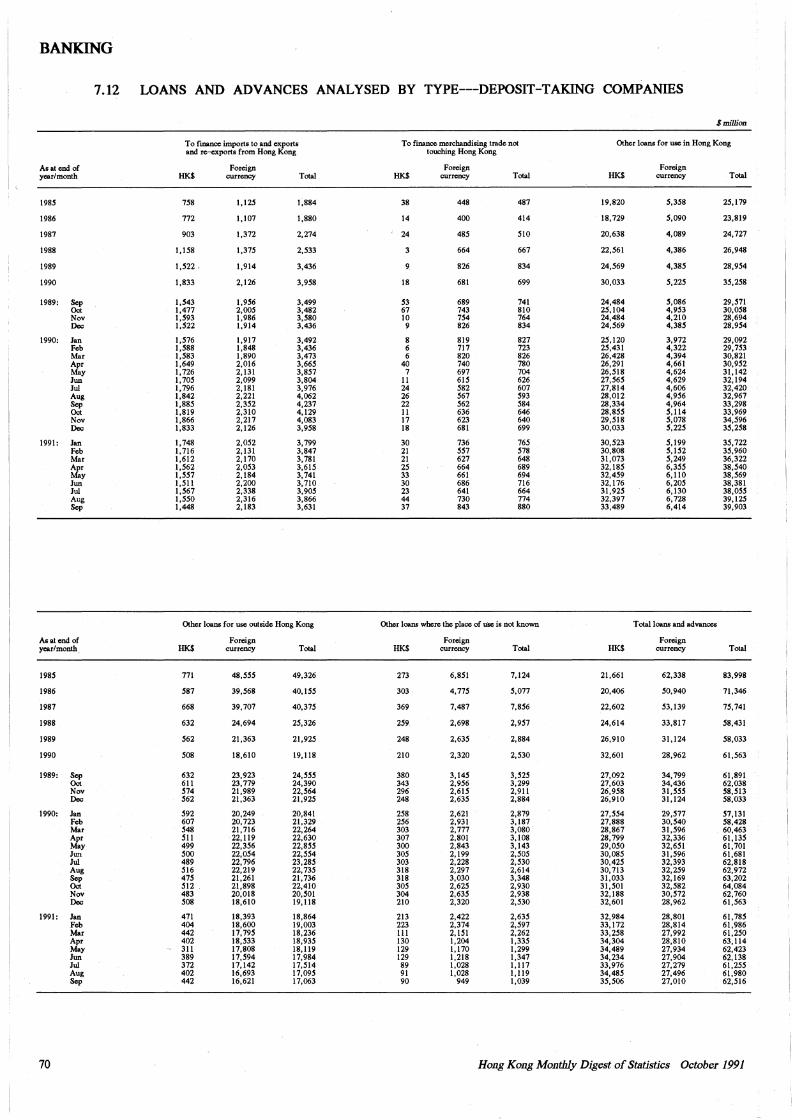
BANIGNG
7.12 LOANS AND ADVANCES ANALYSED BY TYPE---DEPOSIT-T AKING COMPANIES
$million
To finance imports to and exports To finance merchandising trade not Other loans for use in Hong Kong and re-exports from Hong Kong touching Hong Kong
As at end of Foreign Foreign Foreign year/month HK$ currency Total HK$ currency Total HK$ currency Total
1985 758 1,125 1,884 38 448 487 19,820 5,358 25,119
1986 772 1,107 1,880 14 400 414 18,729 S,090 23,819
1987 903 1,372 2,274 24 485 510 20,638 4,089 24,727
1988 1,158 1,375 2,533 664 667 22,561 4,386 26,948
1989 1,522' 1,914 3,436 826 834 24,569 4,385 28,954
1990 1,833 2,126 3,958 18 681 699 30,033 5,225 35,258
1989: Sep 1,543 1,956 3,499 53 689 741 24,484 5,086 29,511 Oct 1,477 2,005 3,482 67 743 810 25,104 4,953 30,058 Nov 1,593 1,986 3,580 10 754 764 24,484 4,210 28,694 Dec 1,522 1,914 3,436 9 826 834 24,569 4,385 28,954
1990: Jan 1,516 1,917 3,492 8 819 827 25,120 3,972 29,092 Feb 1,588 1,848 3,436 6 717 723 25,431 4,322 29,753 Mar 1,583 1,890 3,473 6 820 826 26,428 4,394 30,821 Apr 1,649 2,016 3,665 40 740 780 26,291 4,661 30,952 May 1,726 2,131 3,857 7 697 704 26,518 4,624 31,142 Jun 1,705 2,099 3,804 II 615 626 21,565 4,629 32,194 Jui 1,796 2,181 3,976 24 582 607 27,814 4,606 32,420 Aug 1,842 2,221 4,062 26 567 593 28,012 4,956 32,967 Sep 1,885 2,352 4,237 22 562 584 28,334 4,964 33,298 Oct 1,819 2,310 4,129 11 636 646 28,855 5,114 33,969 Nov 1,866 2,217 4,083 17 623 640 29,518 5,078 34,596 Dec 1,833 2,126 3,958 18 681 699 30,033 5,225 35,258
1991: Jan 1,748 2,052 3,799 30 736 765 30,523 5,199 35,722 Feb 1,716 2,131 3,847 21 557 578 30,808 5,152 35,960 Mar 1,612 2,170 3,781 21 627 648 31,073 5,249 36,322 Apr 1,562 2,053 3,615 25 664 689 32,185 6,355 38,540 May 1,557 2,184 3,741 33 661 694 32,459 6,110 38,569 Jun 1,511 2,200 3,710 30 686 716 32,176 6,205 38,381 Jui 1,567 2,338 3,905 23 641 664 31,925 6,130 38,055 Allg 1,550 2,316 3,866 44 730 774 32,397 6,728 39,125 Sep 1,448 2,183 3,631 37 843 880 33,489 6,414 39,903
Other loans for use outside Hong Kong Other loans where the place of use is not known Total loans and advances
As at end of Foreign Foreign Foreign year/month. HK$ currency Total HK$ currency Total HK$ currency Total
1985 771 48,555 49,326 273 6,851 7,124 21,661 62,338 83,998
1986 587 39,568 40,155 303 4,775 5,077 20,406 50,940 71,346
1987 668 39, 707 40,375 369 7,487 7,856 22,602 53,139 75,741
1988 632 24,694 25,326 259 2,698 2,957 24,614 33,817 58,431
1989 562 21,363 21,925 248 2,635 2,884 26,910 31,124 58,033
1990 508 18,610 19,118 210 2,320 2,530 32,601 28,962 61,563
1989: Sep 632 23,923 24,555 380 3,145 3,525 27,092 34, 799 61,891 Oct 611 23,779 24,390 343 2,956 3,299 27,603 34,436 62,038 Nov 514 21,989 22,564 296 2,615 2,911 26,958 31,555 58,513 Dec 562 21,363 21,925 248 2,635 2,884 26,910 31,124 58,033
1990: Jan 592 20,249 20,841 258 2,621 2,879 27,554 29,577 57,131 Feb 607 20,723 21.329 256 2,931 3,187 27,888 30,540 58,428 Mar 548 21,716 22,264 303 2,777 3,080 28,867 31,596 60,463 Apr 511 22,119 22,630 307 2,801 3,108 28,799 32,336 61,135 May 499 22,356 22,855 300 2,843 3,143 29,050 32,651 61,701 Jwt 500 22,054 22,554 305 2,199 2,505 30,085 31,596 61,681 Jui 489 22, 796 23,285 303 2,228 2,530 30,425 32,393 62,818 Aug 516 22,219 22, 735 318 2,297 2,614 30,713 32,259 62,972 Sep 475 21,261 21,736 318 3,030 3,348 31,033 32,169 63,202 Oct 512 21,898 22,410 305 2,625 2,930 31,501 32,582 64,084 Nov 483 20,018 20,501 304 2,635 2,938 32,188 30,572 62,760 Dec 508 18,610 19,118 210 2,320 2,530 32,601 28,962 61,563
1991: Jan 471 18,393 18,864 213 2,422 2,635 32,984 28,801 61,785 Feb 404 18,600 19,003 223 2,374 2,597 33,172 28,814 61,986 Mar 442 17,795 18,236 111 2,151 2,262 33,258 27,992 61,250 Apr 402 18,533 18,935 130 1,204 1,335 34,304 28,810 63,114 May 311 17,808 18,119 129 1,170 1,299 34,489 27,934 62,423 Jun 389 17,594 17,984 129 1,218 1,347 34,234 27,904 62,138 Jui 372 17,142 17,514 89 1,028 1,117 33,976 27,279 61,255 Aug 402 16,693 17,095 91 1,028 1,119 34,485 27,496 61,980 Sep 442 16,621 17,063 90 949 1,039 35,506 27,010 62,516
70 Hong Kong Monthly Digest of Statistics October 1991
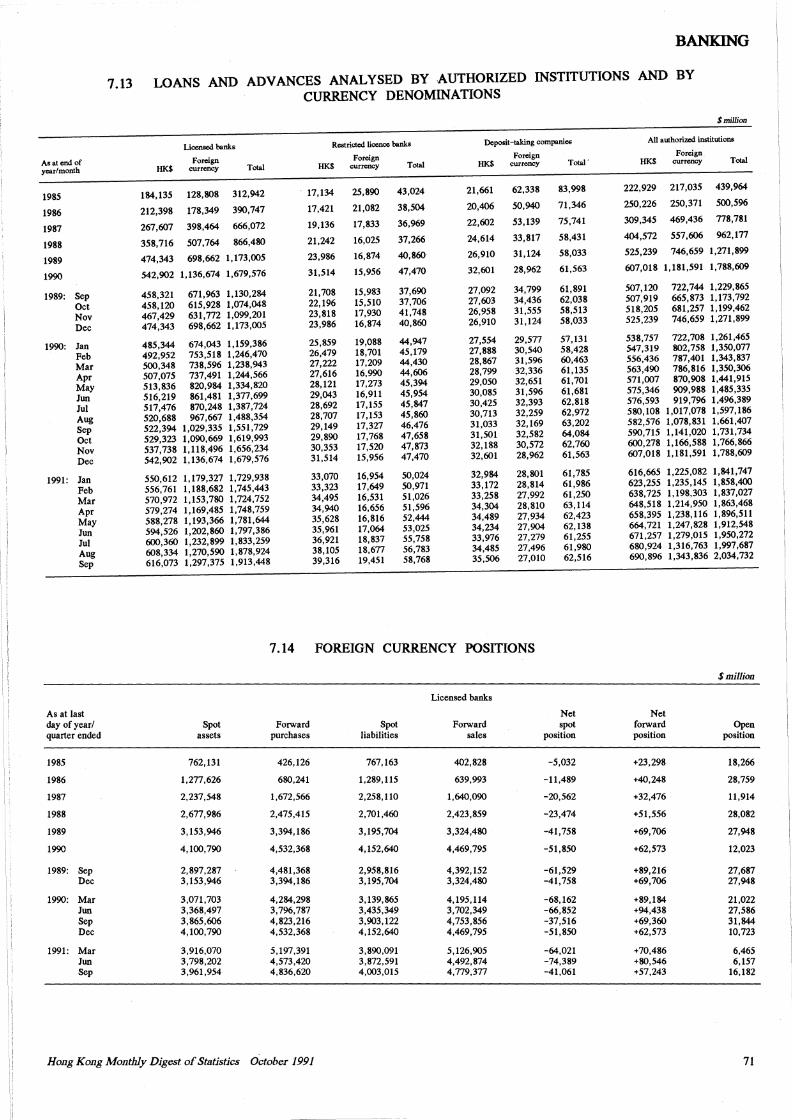
BANKING
7.13 LOANS AND ADVANCES ANALYSED BY AUTHORIZED INSTITUTIONS AND BY
CURRENCY DENOMINATIONS
$million
Licensed banks Restricted licence banks Deposit-taking companies All authorized institutions
As at end of Foreign Foreign Foreign Foreign
year/month HK$ currency Total HK$ currency Total HK$ currency Total' HK$ currency Total
1985 184,135 128,808 312,942 17,134 25,890 43,024 21,661 62,338 83,998 222,929 217,035 439,964
1986 212,398 178,349 390,747 17,421 21,082 38,504 20,406 50,940 71,346 250,226 250,371 500,596
1987 267,607 398,464 666,072 19,136 17,833 36,969 22,602 53,139 75,741 309,345 469,436 778,781
1988 358,716 507,764 866,480 21,242 16,025 37,266 24,614 33,817 58,431 404,572 557,606 962,177
1989 474,343 698,662 1,173,005 23,986 16,874 40,860 26,910 31,124 58,033 525,239 746,659 1,271,899
1990 542,902 1,136,674 1,679,576 31,514 15,956 47,470 32,601 28,962 61,563 607,018 1,181,591 1,788,609
1989: Sep 458,321 671,963 1,130,284 21,708 15,983 37,690 27,092 34,799 61,891 507,120 722,744 1,229,865
Oct 458,120 615,928 1,074,048 22,196 15,510 37,706 27,603 34,436 62,038 507,919 665,873 1,173,792
Nov 467,429 631,772 1,099,201 23,818 17,930 41.748 26,958 31,555 58,513 518,205 681,257 1,199,462
Dec 474,343 698,662 1,173,005 23,986 16,874 40,860 26,910 31,124 58,033 525,239 746,659 1,271,899
1990: Jan 485,344 674,043 1,159,386 25,859 19,088 44,947 27,554 29,577 57,131 538,757 722,708 1,261,465
Feb 492,952 753,518 1,246,470 26,479 18,701 45,179 27,888 30,540 58,428 547,319 802,758 1,350,077
Mar 500,348 738,596 1,238,943 27,222 17,209 44,430 28,867 31,596 60,463 556,436 787,401 1,343,837
Apr 507,075 737,491 1,244,566 27,616 16,990 44,606 28,799 32,336 61, 135 563,490 786,816 1,350,306
May 513,836 820,984 1,334,820 28,121 17,273 45,394 29,050 32,651 61,701 571,007 870,908 1,441,915
Jun 516,219 861,481 1,377,699 29,043 16,911 45,954 30,085 31,596 61,681 575,346 909,988 1,485,335
Jui 517,476 870,248 1,387,724 28,692 17,155 45,847 30,425 32,393 62,818 576,593 919,796 1,496,389
Aug 520,688 967 ,667 1,488,354 28,707 17,153 45,860 30,713 32,259 62,972 580,108 1,017,078 1,597,186
Sep 522,394 1,029,335 1,551,729 29,149 17,327 46,476 31,033 32,169 63,202 582,576 1,078,831 1,661,407
Oct 529,323 1,090,669 1,619,993 29,890 17,768 47,658 31,501 32,582 64,084 590,715 1,141,020 1,731,734
Nov 537,738 1,118,496 1,656,234 30,353 17,520 47,873 32,188 30,572 62,760 600,278 1,166,588 1,766,866
Dec 542,902 1,136,674 1,679,576 31,514 15,956 47,470 32,601 28,962 61,563 607,018 1,181,591 1,788,609
1991: Jan 550,612 1,179,327 1,729,938 33,070 16,954 50,024 32,984 28,801 61,785 616,665 1,225,082 1,841,747
Feb 556,761 1,188,682 1,745,443 33,323 17,649 50,971 33,172 28,814 61,986 623,255 1,235,145 1,858,400
Mar 570,972 1,153,780 1,724,752 34,495 16,531 51,026 33,258 27,992 61,250 638,725 1,198,303 1,837,027
Apr 579,274 1,169,485 1,748,759 34,940 16,656 51,596 34,304 28,810 63,114 648,518 1,214,950 1,863,468
May 588,278 1,193,366 1,781,644 35,628 16,816 52,444 34,489 27,934 62,423 658,395 1,238,116 1,896,511
Jun 594,526 1,202,860 1,797,386 35,961 17,064 53,025 34,234 27,904 62,138 664,721 1,247,828 1,912,548
Jui 600,360 1,232,899 1,833,259 36,921 18,837 55,758 33,976 27,279 61,255 671,257 1,279,015 1,950,272
Aug 608,334 1,270,590 1,878,924 38,105 18,677 56,783 34,485 27,496 61,980 680,924 1,316,763 1,997,687
Sep 616,073 1,297,375 1,913,448 39,316 19,451 58,768 35,506 27,010 62,516 690,896 1,343,836 2,034,732
7.14 FOREIGN CURRENCY POSITIONS
$million
Licensed banks
As at last Net Net day of year/ Spot Forward Spot Forward spot forward Open quarter ended assets purchases liabilities sales position position position
1985 762,131 426,126 767,163 402,828 -5,032 +23,298 18,266
1986 1,277,626 680,241 1,289,115 639,993 -11,489 +40,248 28,759
1987 2,237,548 1,672,566 2,258,110 1,640,090 -20,562 +32,476 11,914
1988 2,677,986 2,475,415 2,701,460 2,423,859 -23,474 +51,556 28,082
1989 3,153,946 3,394,186 3,195,704 3,324,480 -41,758 +69,706 27,948
1990 4,100,790 4,532,368 4,152,640 4,469,795 -51,850 +62,573 12,023
1989: Sep 2,897,287 4,481,368 2,958,816 4,392,152 -61,529 +89,216 27,687 Dec 3,153,946 3,394,186 3,195,704 3,324,480 -41,758 +69,706 27,948
1990: Mar 3,071,703 4,284,298 3,139,865 4,195,114 -68, 162 +89,184 21,022 Jun 3,368,497 3,796,787 3,435,349 3,702,349 -66,852 +94,438 27,586 Sep 3,865,606 4,823,216 3,903, 122 4,753,856 -37,516 +69,360 31,844 Dec 4,100,790 4,532,368 4,152,640 4,469,795 -51,850 +62,573 10,723
1991: Mar 3,916,070 5,197,391 3,890,091 5,126,905 -64,021 +70,486 6,465 Jun 3,798,202 4,573,420 3,872,591 4,492,874 -74,389 +80,546 6,157 Sep 3,961,954 4,836,620 4,003,015 4,779,377 -41,061 +57,243 16,182
Hong Kong Monthly Digest of Statistics October 1991 71
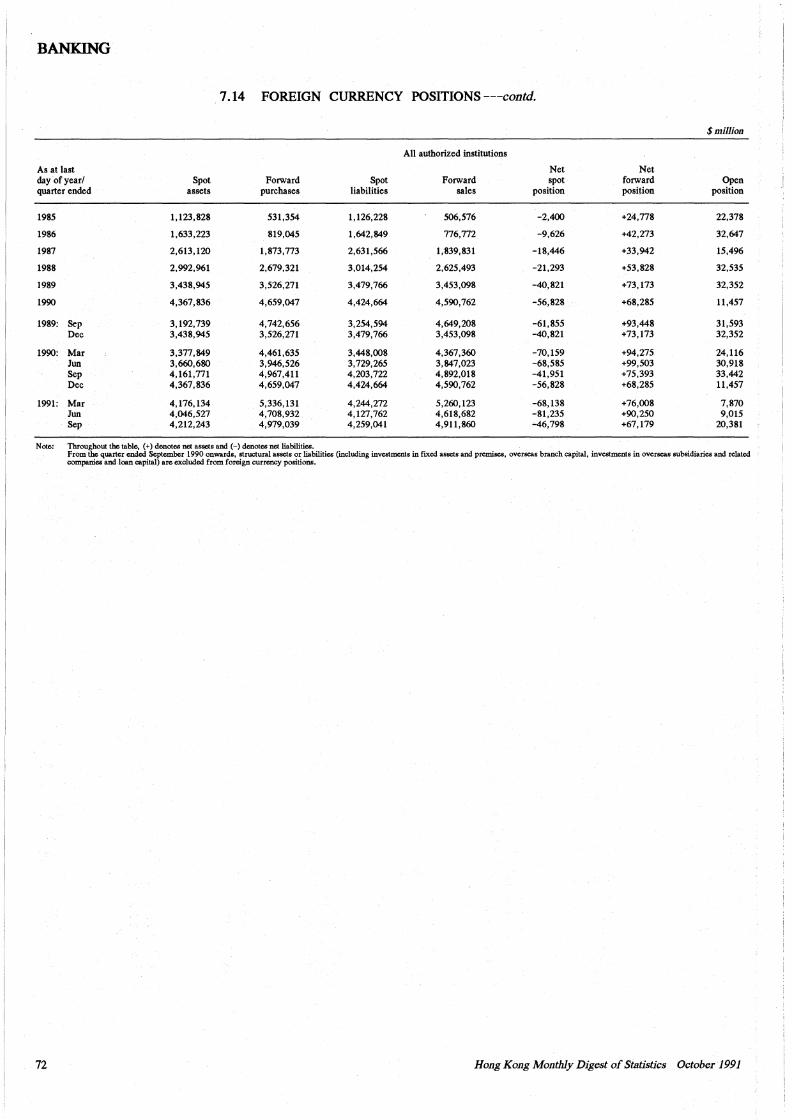
BANKING
7.14 FOREIGN CURRENCY POSITIONS ---contd.
$million
All authorized institutions
As at last Net Net day of year/ Spot Forward Spot Forward spot forward Open quarter ended assets purchases liabilities sales position position position
1985 1,123,828 531,354 1,126,228 506,576 -2,400 +24,778 22,378
1986 1,633,223 819,045 1,642,849 776,772 -9,626 +42,273 32,647
1987 2,613,120 1,873,773 2,631,566 1,839,831 -18,446 +33,942 15,496
1988 2,992,961 2,679,321 3,014,254 2,625,493 -21,293 +53,828 32,535
1989 3,438,945 3,526,271 3,479,766 3,453,098 -40,821 +73,173 32,352
1990 4,367,836 4,659,047 4,424,664 4,590,762 -56,828 +68,285 11,457
1989: Sep 3,192,739 4,742,656 3,254,594 4,649,208 -61,855 +93,448 31,593 Dec 3,438,945 3,526,271 3,479,766 3,453,098 -40,821 +73,173 32,352
1990: Mar 3,377,849 4,461,635 3,448,008 4,367,360 -70,159 +94,275 24,116 Jun 3,660,680 3,946,526 3,729,265 3,847,023 -68,585 +99,503 30,918 Sep 4,161,771 4,967,411 4,203,722 4,892,018 -41,951 +75,393 33,442 Dec 4,367,836 4,659,047 4,424,664 4,590,762 -56,828 +68,285 11,457
1991: Mar 4,176,134 5,336,131 4,244,272 5,260,123 -68,138 +76,008 7,870 Jun 4,046,527 4,708,932 4,127,762 4,618,682 -81,235 +90,250 9,015 Sep 4,212,243 4,979,039 4,259,041 4,911,860 ~46,798 +67,179 20,381
Note: Throughout the table, ( +) denotes net assets and (-) denotes net liabilities. From the quarter ended September 1990 onwards, structural assets or liabilities (including investments in fixed assets and premises, overseas branch capital, investments in overseas subsidiaries and related companies and-loan capital) arc excluded from foreign currency positions.
72 Hong Kong Monthly Digest of Statistics October1991
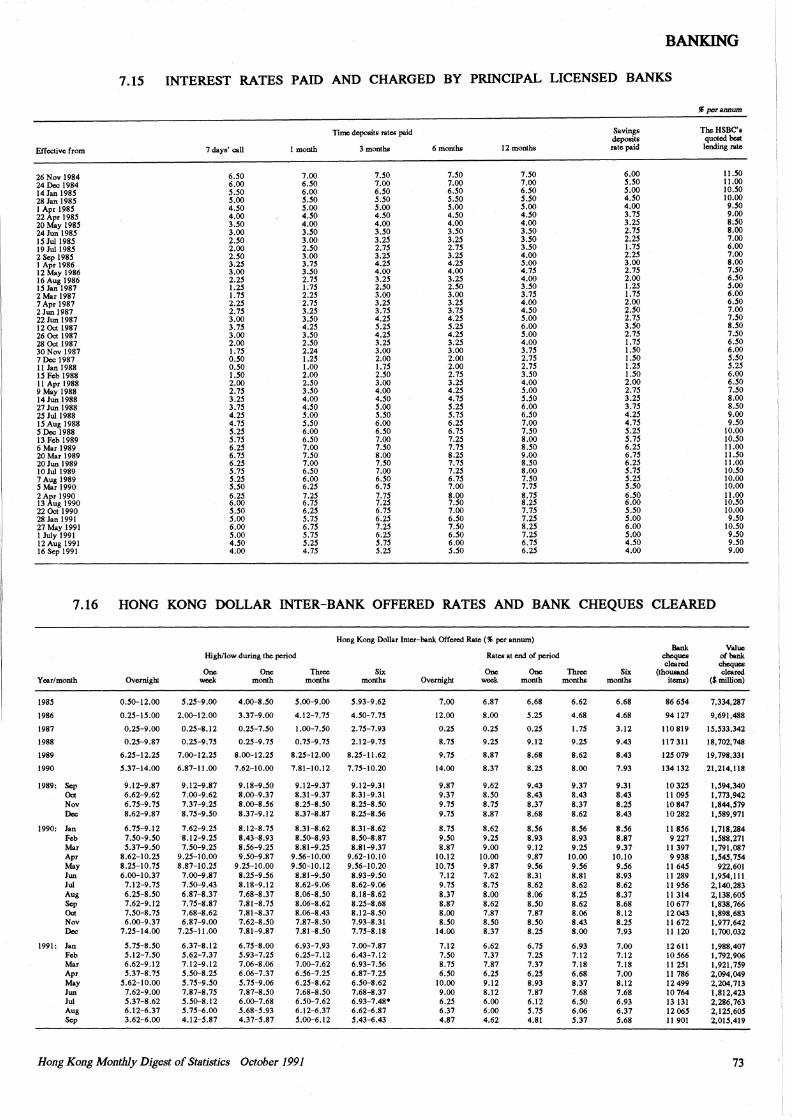
;I BANKING I
7.15 INTEREST RATES PAID AND CHARGED BY PRINCIPAL LICENSED BANKS
11 per annum
Time deposits rates paid Savingi;: TheHSBC's deposits quoted best
Effective from 7 days' call l month 3 months 6 months 12 months rate paid lending rate
26 Nov 1984 6.50 7.00 1.50 1.50 1.50 6.00 II.SO
24 Dec 1984 6.00 6.50 7.00 7.00 7.00 S.50 11.00 14Jan 1985 s.so 6.00 6.SO 6.SO 6.SO S.00 10.SO 28 Jan 198S s.oo s.so s.so S.50 s.so 4.SO 10.00 I Apr 1985 4.50 5.00 5.00 5.00 S.00 4.00 9.SO
22Apr 198S 4.00 4.SO 4.SO 4.SO 4.SO 3.7S 9.00 20 May 198S 3.SO 4.00 4.00 4.00 4.00 3.2S 8.SO 24 Jun 198S 3.00 3.SO 3.SO 3.SO 3.SO 2.7S 8.00 IS Jui I 98S 2.SO 3.00 3.25 3.2S 3.SO 2.2S 7.00 19 Jui 198S 2.00 2.50 2.75 2.75 3.50 1.15 6.00 2 Sep 1985 2.50 3.00 3.25 3.25 4.00 2.25 7.00 I Apr 1986 3.25 3.15 4.25 4.25 5.00 3.00 8.00 12 May 1986 3.00 3.50 4.00 4.00 4.15 2.75 1.so 16Aug1986 2.25 2.75 3.25 3.25 4.00 2.00 6.50 IS Jan 1987 1.25 1.15 2.50 2.50 3.50 1.25 5.00 2 Mar 1987 1.15 2.25 3.00 3.00 3.75 1.1S 6.00 7 Apr 1987 2.2S 2.75 3.2S 3.25 4.00 2.00 6.SO 2 Jun 1987 2.15 3.2S 3.7S 3.75 4.50 2.SO 7.00 22 Jun 1987 3.00 3.50 4.25 4.2S S.00 2.7S 1.SO 12 Oct 1987 3.7S 4.2S S.25 S.25 6.00 3.50 8.50 26 Oct 1987 3.00 3.SO 4.25 4.25 s.oo 2.75 1.50 28 Oct 1987 2.00 2.SO 3.2S 3.25 4.00 1.15 6.50 30 Nov 1987 1.75 2.24 3.00 3.00 3.15 I.SO 6.00 7 Dec 1987 o.so 1.2S 2.00 2.00 2.7S l.50 5.SO 11 Jan 1988 o.so 1.00 1.1S 2.00 2.7S l.2S S.2S ISFebl988 I.SO 2.00 2.SO 2.7S 3.SO l.50 6.00 11Apr1988 2.00 2.50 3.00 3.2S 4.00 2.00 6.50 9 May 1988 2.7S 3.50 4.00 4.2S S.00 2.7S 1.SO 14 Jun 1988 3.2S 4.00 4.SO 4.1S s.so 3.2S 8.00 27 Jun 1988 3.1S 4.SO S.oo S.2S 6.00 3.7S 8.SO 2S Jui 1988 4.2S S.00 S.50 S.1S 6.SO 4.2S 9.00 IS Aug 1988 4.1S S.50 6.00 6.25 7.00 4.75 9.SO s Dec 1988 S.2S 6.00 6.SO 6.1S 1.SO S.2S 10.00 13 Feb 1989 5.1S 6.50 7.00 7.25 8.00 S.15 10.SO 6 Mar 1989 6.2S 7.00 1.50 1.1S 8.SO 6.25 11.00 20 Mar 1989 6.1S 1.50 8.00 8.25 9.00 6.1S II .SO 20 Jun 1989 6.2S 7.00 1.SO 1.1S 8.SO 6.2S 11.00 10 Jui 1989 S.1S 6.50 7.00 7.2S 8.00 S.15 10.SO 7 Aug 1989 S.25 6.00 6.SO 6.1S 1.50 S.2S 10.00 S Mar 1990 s.so 6.25 6.15 7.00 1.1S S.50 10.00
rN.~i~iio 6.2S 7.25 1.15 8.00 8.7S 6.SO 11.00 6.00 6.1S 1.2S 1.SO 8.2S 6.00 10.50
22 Oct 1990 S.50 6.25 6.1S 7.00 1.1S 5.50 10.00 28 Jan 1991 5.00 S.1S 6.2S 6.50 7.2S 5.00 9.SO 27 May 1991 6.00 6.1S 7.25 7.50 8.25 6.00 10.50 l July 1991 S.00 5.15 6.25 6.50 7.2S 5.00 9.SO 12 Aug 1991 4.50 S.25 5.1S 6.00 6.75 4.SO 9.50 16 Sep 1991 4.00 4.15 5.2S 5.50 6.25 4.00 9.00
7.16 HONG KONG DOLLAR INTER-BANK OFFERED RATES AND BANK CHEQUES CLEARED
Hong Kong Dollar Inter-bank Offered Rate ( % per annum) Bank Value
High/low during the period Rates at end of period cheques of bank cleared cheques
One One Three Six One One Three Six (thousand cleared Year/month Overnight week month months months Overnight week month months months items) ($million)
198S O.S0-12.00 S.25-9.00 4.00-8.SO S.00-9.00 S.93-9.62 7.00 6.87 6.68 6.62 6.68 86 6S4 7,334,287
1986 0.25-15.00 2.00-12.00 3.37-9.00 4.12-7.75 4.50-1.15 12.00 8.00 S.25 4.68 4.68 94127 9,691.4,88
1987 0.2S-9.00 0.25-8.12 0.25-1.50 1.00-1.50 2.75-7.93 0.25 0.25 0.25 1.15 3.12 110 819 15,533,342
1988 0.25-9.87 0.25-9.15 0.25-9.15 0.15-9.15 2.12-9.75 8.75 9.2S 9.12 9.25 9.43 117 311 18, 702,748
1989 6.25-12.25 7.00-12.2S 8.00-12.2S 8.2S-12.00 8.25-11.62 9.15 8.87 8.68 8.62 8.43 125 079 19,798,331
1990 5.37-14.00 6.87-11.00 7.62-10.00 7.81-10.12 7.75-10.20 14.00 8.37 8.2S 8.00 7.93 134 132 21,214,118
1989: Sep 9.12-9.87 9.12-9.87 9.18-9.SO 9.12-9.37 9.12-9.31 9.87 9.62 9.43 9.37 9.31 10 32S l,S94,340 Oct 6.62-9.62 7.00-9.62 8.00-9.37 8.31-9.37 8.31-9.31 9.37 8.50 8.43 8.43 8.43 II 09S 1,773,942 Nov 6.1S-9.15 7.37-9.25 8.00-8.S6 8.2S-8.SO 8.2S-8.SO 9.1S 8.75 8.37 8.37 8.2S 10847 l,844,S79 Dec 8.62-9.87 8.1S-9.SO 8.37-9.12 8.37-8.87 8.25-8.S6 9.75 8.87 8.68 8.62 8.43 10282 l,S89,971
1990: Jan 6.7S-9.12 7.62-9.25 8.12-8.7S 8.31-8.62 8.31-8.62 8.7S 8.62 8.S6 8.S6 8.S6 11 8S6 1,718,284 Feb 1.S0-9.SO 8.12-9.2S 8.43-8.93 8.S0-8.93 8.50-8.87 9.SO 9.2S 8.93 8.93 8.87 9 227 l,S88,271 Mar S.31-9.SO 1.S0-9.2S 8.56-9.25 8.81-9.2S 8.81-9.37 8.87 9.00 9.12 9.2S 9.37 11 397 l, 791,087 Apr 8.62-10.25 9.25-10.00 9.50-9.87 9.S6-l0.00 9.62-10.10 10.12 10.00 9.87 10.00 10.10 9 938 l,S4S, 1S4 May 8.2S-10.7S 8.87-10.25 9.2S-10.00 9.S0-10.12 9.S6-10.20 10.7S 9.87 9.S6 9.S6 9.S6 11 64S 922,601 Jun 6.00-10.37 7.00-9.87 8.25-9.S6 8.81-9.SO 8.93-9.SO 7.12 7.62 8.31 8.81 8.93 11 289 I ,9S4, ll l Jui 7.12-9.7S 7.50-9.43 8.18-9.12 8.62-9.06 8.62-9.06 9.1S 8.75 8.62 8.62 8.62 11 9S6 2,140,283 Aug 6.2S-8.SO 6.87-8.37 7.68-8.37 8.06-8.50 8.18-8.62 8.37 8.00 8.06 8.25 8.37 11 314 2,138,605 Sep 7.62-9.12 7.75-8.87 7.81-8.7S 8.06-8.62 8.25-8.68 8.87 8.62 8.SO 8.62 8.68 10 677 1,838,766 Oct 1.S0-8.1S 7.68-8.62 7.81-8.37 8.06-8.43 8.12-8.50 8.00 7.87 7.87 8.06 8.12 12043 1,898,683 Nov 6.00-9.37 6.87-9.00 7.62-8.50 7.87-8.50 7.93-8.31 8.SO 8.50 8.SO 8.43 8.25 11 672 l,977,642 Dec 7.2S-14.00 7.2S-l 1.00 7.81-9.87 7.81-8.SO 7.7S-8.18 14.00 8.37 8.2S 8.00 7.93 11 120 l,700,032
1991: Jan 5.15-8.SO 6.37-8.12 6.7S-8.00 6.93-7.93 7.00-7.87 7.12 6.62 6.1S 6.93 7.00 12611 1,988,407 Feb S.12-1.SO 5.62-7.37 S.93-7.25 6.2S-7.12 6.43-7.12 7.50 7.37 7.2S 7.12 7.12 10 566 I, 792,906 Mar 6.62-9.12 7.12-9.12 7.06-8.06 7.00-7.62 6.93-1.56 8.7S 7.87 7.37 7.18 7.18 11 2Sl l,921,759 Apr S.31-8.1S S.50-8.2S 6.06-7.37 6.S6-1.25 6.87-7.25 6.SO 6.25 6.2S 6.68 7.00 11 786 2,094,049 May S.62-10.00 S.1S-9.SO 5.15-9.06 6.2S-8.62 6.50-8.62 10.00 9.12 8.93 8.37 8.12 12499 2,204,713 Jun 7.62-9.00 7.87-8.75 7.87-8.SO 7.68-8.50 7.68-8.37 9.00 8.12 7.87 7.68 7.68 10764 l,812,423 Jui S.37-8.62 S.S0-8.12 6.00-7.68 6.S0-7.62 6.93-7.48• 6.2S 6.00 6.12 6.50 6.93 13 131 2,286, 763 Aug 6.12-6.37 5.15-6.00 5.68-5.93 6.12-6.37 6.62-6.87 6.37 6.00 5.15 6.06 6.37 12 06S 2,12S,60S Sep 3.62-6.00 4.12-5.87 4.37-5.87 S.00-6.12 S.43-6.43 4.87 4.62 4.81 S.31 S.68 11 901 2,0lS,419
Hong Kong Monthly Digest of Statistics October 1991 73
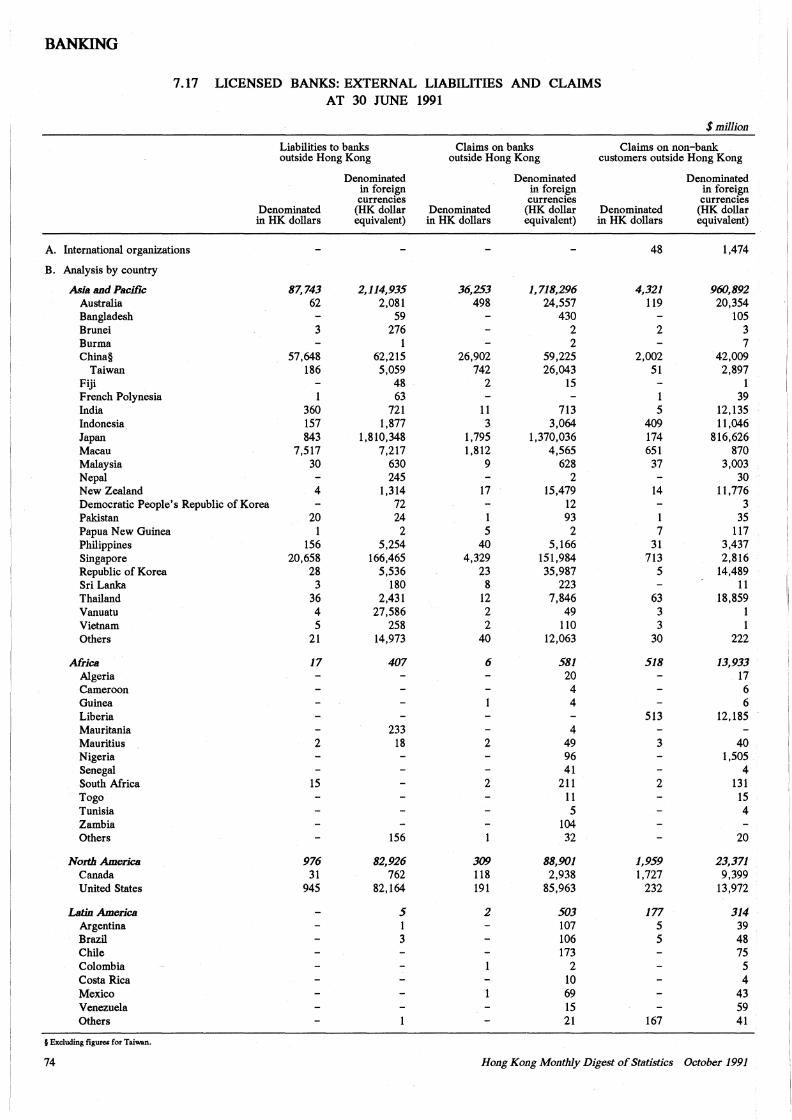
---
BANKING
7.17 LICENSED BANKS: EXTERNAL LIABILITIES AND CLAIMS AT 30 JUNE 1991
$million
Liabilities to banks Claims on banks Claims on non-bank outside Hong Kong outside Hong Kong customers outside Hong Kong
Denominated Denominated Denominated in foreign in forei,gn in foreign currencies currencies currencies
Denominated (HK dollar Denominated (HK dollar Denominated (HK dollar in HK dollars equivalent) in HK dollars equivalent) in HK dollars equivalent)
A. International organizations 48 1,474
B. Analysis by country
Asia and Pacific 87,743 2,114,935 36,253 1,718,296 4,321 960,892 Australia 62 2,081 498 24,557 119 20,354 Bangladesh 59 430 105 Brunei 3 276 2 2 3 Burma l 2 7 China§ 57,648 62,215 26,902 59,225 2,002 42,009
Taiwan 186 5,059 742 26,043 51 2,897 Fiji 48 2 15 1 French Polynesia 1 63 1 39 India 360 721 11 713 5 12, 135 Indonesia 157 1,877 3 3,064 409 11,046 Japan 843 1,810,348 1,795 1,370,036 174 816,626 Macau 7,517 7,217 1,812 4,565 651 870 Malaysia 30 630 9 628 37 3,003 Nepal 245 2 30 New Zealand 4 1,314 17 15,479 14 11,776 Democratic People's Republic of Korea 72 12 3 Pakistan 20 24 1 93 1 35 Papua New Guinea 1 2 5 2 7 117 Philippines 156 5,254 40 5,166 31 3,437 Singapore 20,658 166,465 4,329 151,984 713 2,816 Republic of Korea 28 5,536 23 35,987 5 14,489 Sri Lanka 3 180 8 223 11 Thailand 36 2,431 12 7,846 63 18,859 Vanuatu 4 27,586 2 49 3 1 Vietnam 5 258 2 110 3 1 Others 21 14,973 40 12,063 30 222
Africa 17 407 6 581 518 13,933 Algeria 20 17 Cameroon 4 6 Guinea 4 6 Liberia 513 12, 185 Mauritania 233 4 Mauritius 2 18 2 49 3 40 Nigeria 96 1,505 Senegal 41 4 South Africa 15 2 211 2 131 Togo 11 15 Tunisia 5 4 Zambia 104 Others 156 32 20
North America 976 82,926 309 88,901 1,959 23,371 Canada 31 762 118 2,938 1,727 9,399 United States 945 82,164 191 85,963 232 13,972
Latin America 5 2 503 177 314 Argentina 1 107 5 39 Brazil 3 106 5 48 Chile 173 75 Colombia 2 5 Costa Rica 10 4 Mexico 69 43 Venezuela 15 59 Others 21 167 41
§ Excluding figures for Taiwan.
74 Hong Kong Monthly Digest of Statistics October 1991
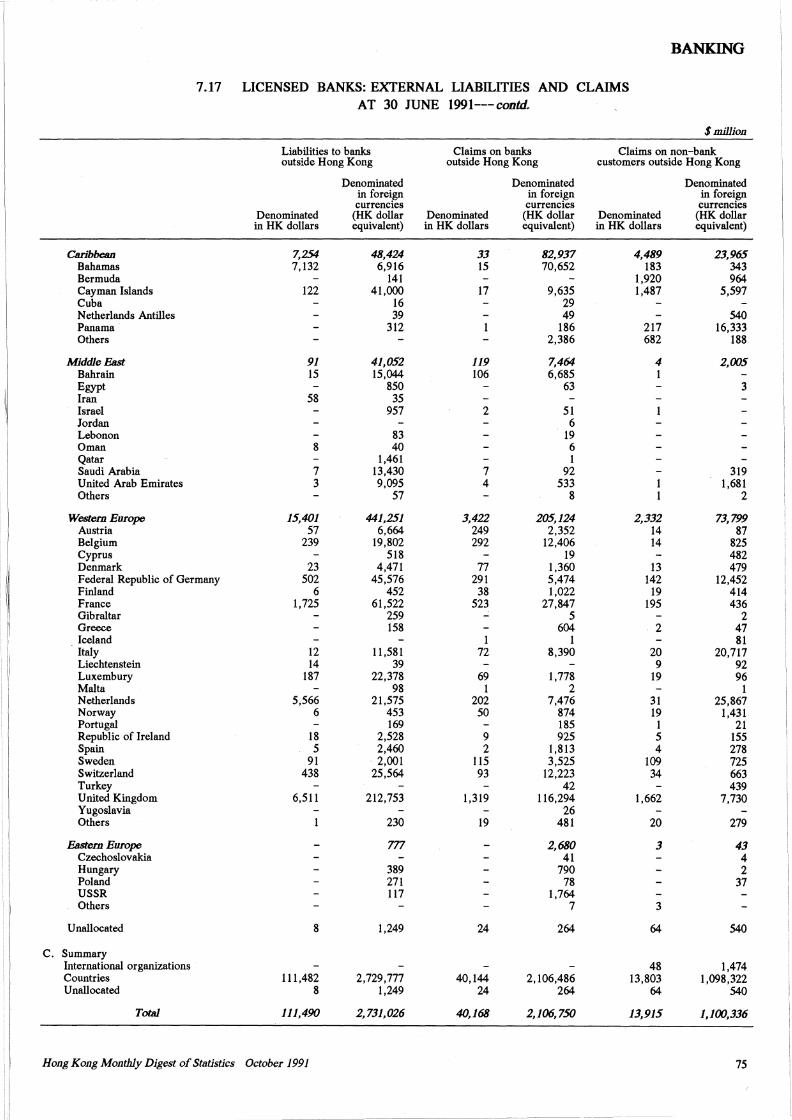
BANiaNG
7.17 LICENSED BANKS: EXTERNAL LIABILITIES AND CLAIMS AT 30 JUNE 1991---contd.
$million
Liabilities to banks Claims on banks Claims on non-bank outside Hong Kong outside Hong Kong customers outside Hong Kong
Denominated Denominated Denominated in forei.gn in forei,gn in forei,gn currencies currencies currencies
Denominated (HK dollar Denominated (HK dollar Denominated (HK dollar in HK dollars equivalent) in HK dollars equivalent) in HK dollars equivalent)
, I Caribbean 7,254 48,424 33 82,937 4,489 23,965 Bahamas 7,132 6,916 15 70,652 183 343 Bermuda 141 1,920 964 Cayman Islands 122 41,000 17 9,635 1,487 5,597 Cuba 16 29 Netherlands Antilles 39 49 540 Panama 312 186 217 16,333 Others 2,386 682 188
Middle East 91 41,052 119 7,464 4 2,005 Bahrain 15 15,044 106 6,685 1 Egypt 850 63 3 Iran 58 35 Israel 957 2 51 Jordan 6 Lebonon 83 19 Oman 8 40 6 Qatar 1,461 1 Saudi Arabia 7 13,430 7 92 319 United Arab Emirates 3 9,095 4 533 1,681 Others 57 8 2
Western Europe 15,401 441,251 3,422 205,124 2,332 73,799 Austria 57 6,664 249 2,352 14 87 Belgium 239 19,802 292 12,406 14 825 Cyprus 518 19 482 Denmark 23 4,471 77 1,360 13 479 Federal Republic of Germany 502 45,576 291 5,474 142 12,452 Finland 6 452 38 1,022 19 414 France 1,725 61,522 523 27,847 195 436 Gibraltar 259 5 2 Greece 158 604 2 47 Iceland 1 1 81 Italy 12 11,581 72 8,390 20 20,717 Liechtenstein 14 39 9 92 Luxembury 187 22,378 69 1,778 19 96 Malta 98 1 2 1 Netherlands 5,566 21,575 202 7,476 31 25,867 Norway 6 453 50 874 19 1,431 Portugal 169 185 1 21 Republic of Ireland 18 2,528 9 925 5 155 Spain 5 2,460 2 1,813 4 278 Sweden 91 2,001 115 3,525 109 725 Switzerland 438 25,564 93 12,223 34 663 Turkey 42 439 United Kingdom 6,511 212,753 1,319 116,294 1,662 7,730 Yugoslavia 26 Others 230 19 481 20 279
Eastcm Europe m 2,680 3 43 Czechoslovakia 41 4 Hungary 389 790 2 Poland 271 78 37 USSR 117 1,764 Others 7 3
Unallocated 8 1,249 24 264 64 540
c. Summary International organizations 48 1,474 Countries 111,482 2,729,777 40,144 2,106,486 13,803 1,098,322 Unallocated 8 1,249 24 264 64 540
T<Xal 111,490 2,731,026 40,168 2,106,750 13,915 1,100,336
Hong Kong Monthly Digest of St11tistics October 1991 75
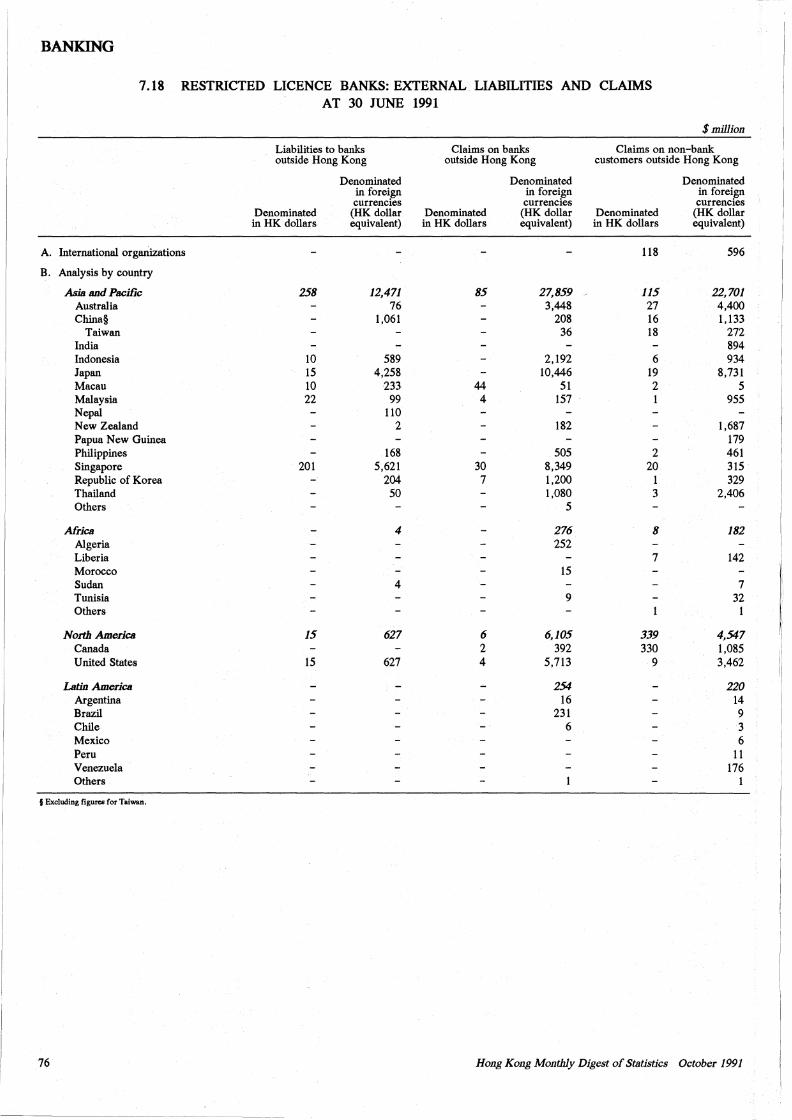
BANKING
7.18 RESTRICTED LICENCE BANKS: EXTERNAL LIABILITIES AND CLAIMS AT 30 JUNE 1991
A. International organizations
B. Analysis by country
Asia and Pacific Australia China§
Taiwan India Indonesia Japan Macau Malaysia Nepal New Zealand Papua New Guinea Philippines Singapore Republic of Korea Thailand Others
Africa Algeria Liberia Morocco Sudan Tunisia Others
North America Canada United States
Latin America Argentina Brazil Chile Mexico Peru Venezuela Others
§ Excluding figures for Taiwan.
76
----------~-
Liabilities to banks outside Hong Kong
Denominated in foreign currencies
Claims on banks outside Hong Kong
Denominated in foreign
Denominated in HK dollars
(HK dollar Denominated equivalent) in HK dollars
currencies (HK dollar equivalent)
258
10 15 10 22
201
15
15
12,471 76
1,061
589 4,258
233 99
110 2
168 5,621
204 50
4
4
627
627
85
44 4
30 7
6 2 4
27,859 3,448
208 36
2,192 10,446
51 157
182
505 8,349 1,200 1,080
5
276 252
15
9
6,105 392
5,713
254 16
231 6
$million
Claims on non-bank customers outside Hong Kong
Denominated in HK dollars
118
115 27 16 18
6 19 2 1
2 20
1 3
8
7
339 330
9
Denominated in foreign currencies
(HK dollar equivalent)
596
22,701 4,400 1, 133
272 894 934
8,731 5
955
1,687 179 461 315 329
2,406
182
142
7 32
1
4,547 1,085 3,462
220 14 9 3 6
11 176
1
Hong Kong Monthly Digest of Statistics October 1991
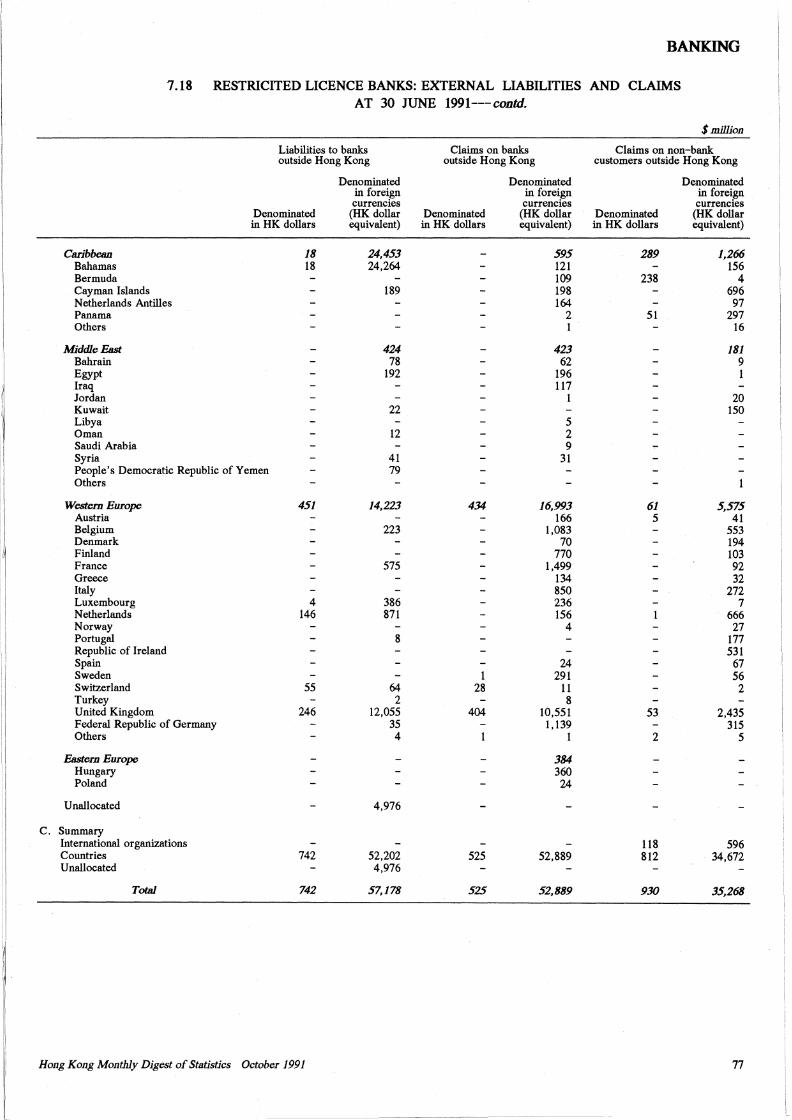
BANKING
7.18 RESTRICITED LICENCE BANKS: EXTERNAL LIABILITIES AND CLAIMS AT 30 JUNE 1991--- contd.
$million
Liabilities to banks Claims on banks Claims on non-bank outside Hong Kong outside Hong Kong customers outside Hong Kong
Denominated Denominated Denominated in foreign in forei$fi in forei$fi currencies currencies currencies
Denominated (HK dollar Denominated (HK dollar Denominated (HK dollar in HK dollars equivalent) in HK dollars equivalent) in HK dollars equivalent)
Caribbean 18 24,453 595 289 1,266 Baltamas 18 24,264 121 156 Bermuda 109 238 4 Cayman Islands 189 198 696 Netherlands Antilles 164 97 Panama 2 51 297 Others 1 16
Middle East 424 423 181 Balrrain 78 62 9 Egypt 192 196 1 Iraq 117 Jordan l 20 Kuwait 22 150 Libya 5 Oman 12 2 Saudi Arabia 9 Syria 41 31 People's Democratic Republic of Yemen 79 Others
Western Europe 451 14,223 434 16,993 61 5,575 Austria 166 5 41 Belgium 223 1,083 553 Denmark 70 194 Finland 770 103 France 575 1,499 92 Greece 134 32 Italy 850 272 Luxembourg 4 386 236 7 Netherlands 146 871 156 666 Norway 4 27 Portugal 8 177 Republic of Ireland 531 Spain 24 67 Sweden 1 291 56 Switzerland 55 64 28 11 2 Turkey 2 8 United Kingdom 246 12,055 404 10,551 53 2,435 Federal Republic of Germany 35 1, 139 315 Others 4 1 2 5
Eastern Europe 384 Hungary 360 Poland 24
Unallocated 4,976
c. Summary International organizations 118 596 Countries 742 52,202 525 52,889 812 34,672 Unallocated 4,976
Total 742 57,178 525 52,889 930 35,268
Hong Kong Monthly Digest of Statistics October 1991 77
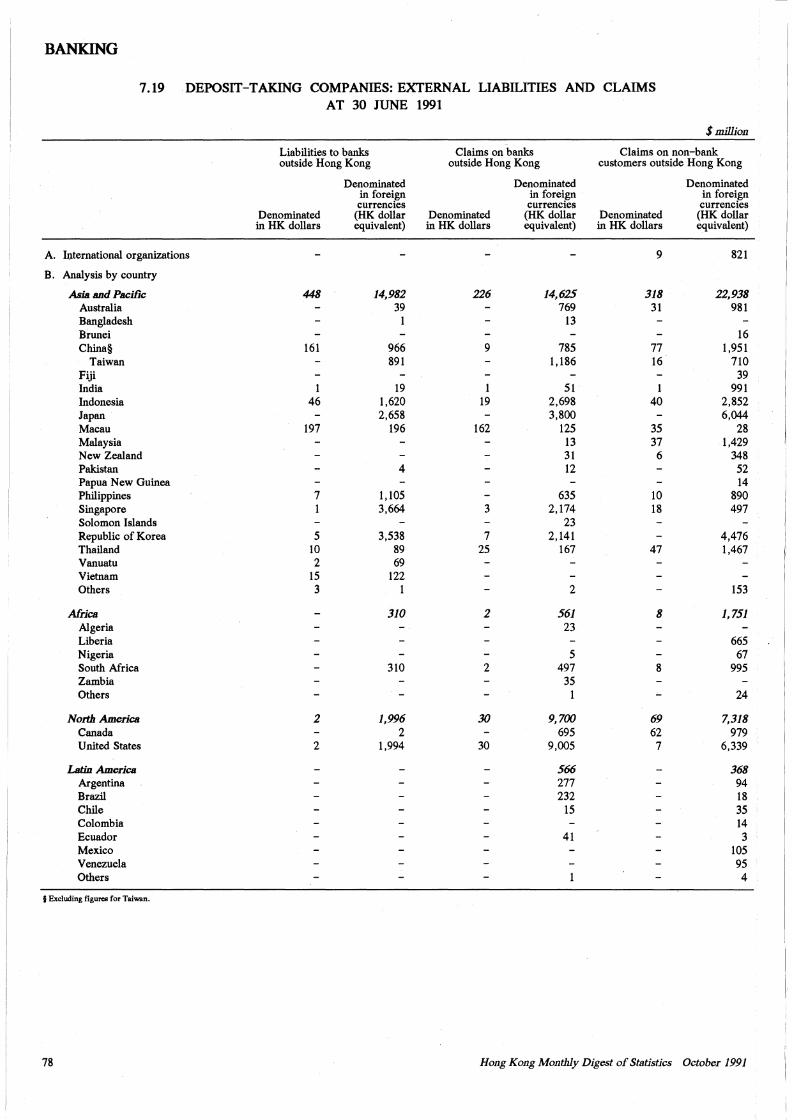
BANKING
7.19 DEPOSIT-TAKING COMPANIES: EXTERNAL LIABILITIES AND CLAIMS AT 30 JUNE 1991
$million
Liabilities to banks Claims on banks Claims on non-bank outside Hong Kong outside Hong Kong customers outside Hong Kong
Denominated Denominated Denominated in foreiwi in foreign in foreign currencies currencies currencies
Denominated (HK dollar Denominated (HK dollar Denominated (HK dollar in HK dollars equivalent) in HK dollars equivalent) in HK dollars equivalent)
A. International organizations 9 821
B. Analysis by country
Asia and Pacific 448 14,982 226 14,625 318 22,938 Australia 39 769 31 981 Bangladesh 1 13 Brunei 16 China§ 161 966 9 785 77 1,951
Taiwan 891 1,186 16 710 Fiji 39 India 1 19 1 51 1 991 Indonesia 46 1,620 19 2,698 40 2,852 Japan 2,658 3,800 6,044 Macau 197 196 162 125 35 28 Malaysia 13 37 1,429 New Zealand 31 6 348 Pakistan 4 12 52 Papua New Guinea 14 Philippines 7 1,105 635 10 890 Singapore 1 3,664 3 2,174 18 497 Solomon Islands 23 Republic of Korea 5 3,538 7 2, 141 4,476 Thailand 10 89 25 167 47 1,467 Vanuatu 2 69 Vietnam 15 122 Others 3 1 2 153
Africa 310 2 561 8 1,751 Algeria 23 Liberia 665 Nigeria 5 67 South Africa 310 2 497 8 995 Zambia 35 Others 1 24
North America 2 1,996 30 9, 700 69 7,318 Canada 2 695 62 979 United States 2 1,994 30 9,005 7 6,339
Latin America 566 368 Argentina 277 94 Brazil 232 18 Chile 15 35 Colombia 14 Ecuador 41 3 Mexico 105 Venezuela 95 Others 4
§ Excluding figures for Taiwan.
78 Hong Kong Monthly Digest of Statistics October 1991
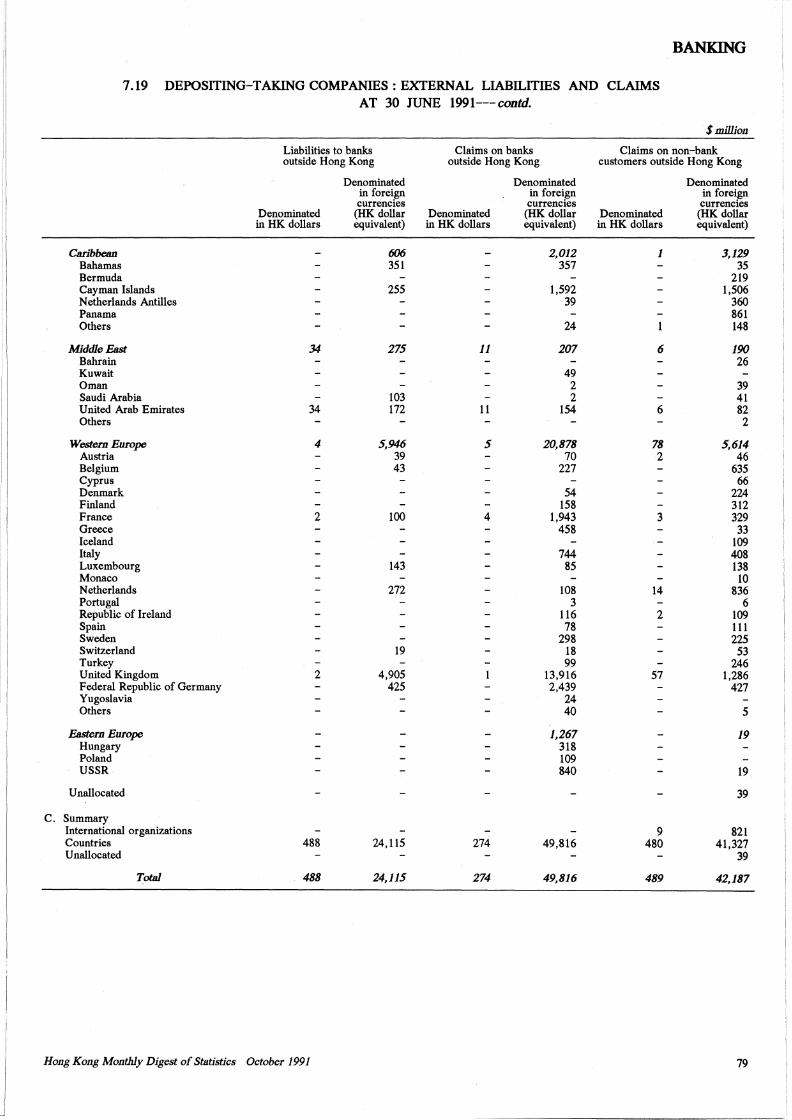
BANKING
7.19 DEPOSITING-TAKING COMPANIES: EXTERNAL LIABILITIES AND CLAIMS AT 30 JUNE 1991---contd.
$million
Liabilities to banks Claims on banks Claims on non-bank outside Hong Kong outside Hong Kong customers outside Hong Kong
Denominated Denominated Denominated in foreign in foreign in forei~ currencies currencies currencies
Denominated (HK dollar Denominated (HK dollar Denominated (HK dollar in HK dollars equivalent) in HK dollars equivalent) in HK dollars equivalent)
Caribbean 606 2,012 1 3,129 Baliamas 351 357 35 Bermuda 219 Cayman Islands 255 1,592 1,506 Netherlands Antilles 39 360 Panama 861 Others 24 148
Middle East 34 275 11 207 6 190 Balrrain 26 Kuwait 49 Oman 2 39 Saudi Arabia 103 2 41 United Arab Emirates 34 172 11 154 6 82 Others 2
Westem Europe 4 5,946 5 20,878 78 5,614 Austria 39 70 2 46 Belgium 43 227 635 Cyprus 66 Denmark 54 224 Finland 158 312 France 2 100 4 1,943 3 329 Greece 458 33 Iceland 109 Italy 744 408 Luxembourg 143 85 138 Monaco 10 Netherlands 272 108 14 836 Portugal 3 6 Republic of Ireland 116 2 109 Spain 78 111 Sweden 298 225 Switzerland 19 18 53 Turkey 99 246 United Kingdom 2 4,905 13,916 57 1,286 Federal Republic of Germany 425 2,439 427 Yugoslavia 24 Others 40 5
Eastem Europe 1,267 19 Hungary 318 Poland 109 USSR 840 19
Unallocated 39
c. Summary International organizations 9 821 Countries 488 24,115 274 49,816 480 41,327 Unallocated 39
Total 488 24,115 274 49,816 489 42,187
Hong Kong Monthly Digest of Statistics October 1991 79
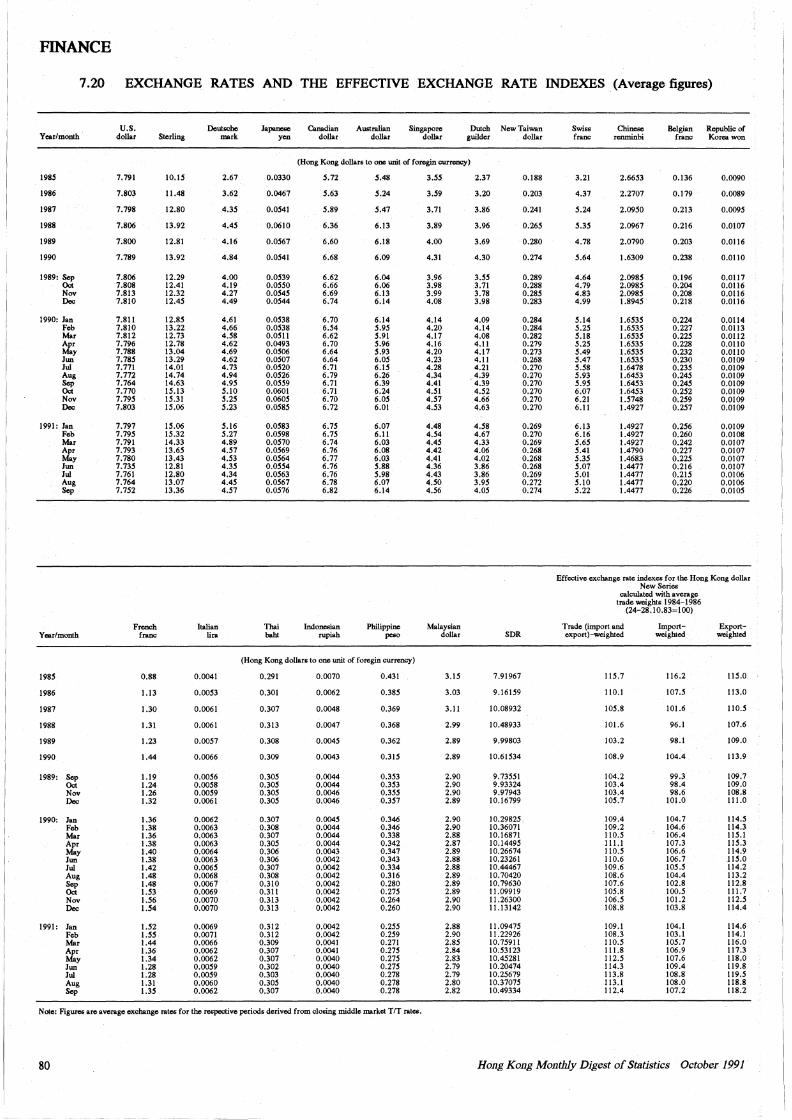
FINANCE
Year/month
1985
1986
1987
1988
1989
1990
1989: Sep Oct Nov Dec
1990: Jan Feb Mar Apr May Jun Jui Aug Sep Oct Nov Dec
1991: Jan Feb Mar Apr May Jun Jut Aug Sep
Year/month
1985
1986
1987
1988
1989
1990
1989: Sep
7.20
Oct Nov Dec
1990: Jan Feb Mar Apr May Jun Jui Aug
~ Nov Dec
1991: Jan Feb Mar Apr May Jun Jui Aug Sep
EXCHANGE RATES AND THE EFFECTIVE EXCHANGE RATE INDEXES (Average figures)
U.S. dollar
7.791
7.803
7.798
7.806
7.800
7.789
7.806 7.808 7.813 7.810
7.811 7.810 7.812 7.796 7.788 7.785 7.771 7.772 7.764 7.770 7.795 7.803
7.797 7.795 7.791 7.793 7.780 7.735 7.761 7.764 7.752
French franc
0.88
1.13
1.30
1.31
1.23
1.44
1.19 1.24 1.26 1.32
1.36 1.38 1.36 1.38 1.40 1.38 1.42 1.48 1.48 1.53 1.56 1.54
1.52 1.55 1.44 1.36 1.34 1.28 1.28 1.31 1.35
Sterling
10.15
11.48
12.80
13.92
12.81
13.92
12.29 12.41 12.32 12.45
12.85 13.22 12.73 12.78 13.04 13.29 14.01 14.74 14.63 15.13 15.31 15.06
15.06 15.32 14.33 13.65 13.43 12.81 12.80 13.07 13.36
Deutsche mark
Italian lira
0.0041
0.0053
0.0061
0.0061
0.0057
0.0066
0.0056 0.0058 0.0059 0.0061
0.0062 0.0063 0.0063 0.0063 0.0064 0.0063 0.0065 0.0068 0.0067 0.0069 0.0070 0.0070
0.0069 0.0071 0.0066 0.0062 0.0062 0.0059 0.0059 0.0060 0.0062
2.67
3.62
4.35
4.45
4.16
4.84
4.00 4.19 4.27 4.49
4.61 4.66 4.58 4.62 4.69 4.62 4.73 4.94 4.95 5.10 5.25 5.23
5.16 5.27 4.89 4.57 4.53 4.35 4.34 4.45 4.57
Japanese yen
Canadian dollar
Australian dollar
Singapore dollar
Dutch New Taiwan guilder dollar
(Hong Kong dollars to one unit of foregin currency)
0.0330
0.0467
0.0541
0.0610
0.0567
0.0541
0.0539 0.0550 0.0545 0.0544
0.0538 0.0538 0.0511 0.0493 0.0506 0.0507 0.0520 0.0526 0.0559 0.0601 0.0605 0.0585
0.0583 0.0598 0.0570 0.0569 0.0564 0.0554 0.0563 0.0567 0.0516
Thai baht
5.12
5.63
5.89
6.36
6.60
6.68
6.62 6.66 6.69 6.74
6.70 6.54 6.62 6.70 6.64 6.64 6.71 6.79 6.71 6.71 6.70 6.72
6.75 6.75 6.74 6.76 6.77 6.76 6.76 6.78 6.82
Indonesian rupiah
5.48
5.24
5.47
6.13
6.18
6.09
6.04 6.06 6.13 6.14
6.14 5.95 5.91 5.96 5.93 6.05 6.15 6.26 6.39 6.24 6.05 6.01
6.07 6.11 6.03 6.08 6.03 5.88 5.98 6.07 6.14
Philippine peso
(Hong Kong dollars to one unit of foregin currency)
0.291
0.301
0.307
0.313
0.308
0.309
0.305 0.305 0.305 0.305
0.307 0.308 0.307 0.305 0.306 0.306 0.307 0.308 0.310 0.311 0.313 0.313
0.312 0.312 0.309 0.307 0.307 0.302 0.303 0.305 0.307
0.0070
0.0062
0.0048
0.0047
0.0045
0.0043
0.0044 0.0044 0.0046 0.0046
0.0045 0.0044 0.0044 0.0044 0.0043 0.0042 0.0042 0.0042 0.0042 0.0042 0.0042 0.0042
0.0042 0.0042 0.0041 0.0041 0.0040 0.0040 0.0040 0.0040 0.0040
0.431
0.385
0.369
0.368
0.362
0.315
0.353 0.353 0.355 0.357
0.346 0.346 0.338 0.342 0.347 0.343 0.334 0.316 0.280 0.275 0.264 0.260
0.255 0.259 0.271 0.275 0.275 0.275 0.278 0.278 0.278
3.55
3.59
3.71
3.89
4.00
4.31
3.96 3.98 3.99 4.08
4.14 4.20 4.17 4.16 4.20 4.23 4.28 4.34 4.41 4.51 4.57 4.53
4.48 4.54 4.45 4.42 4.41 4.36 4.43 4.50 4.56
Malaysian dollar
3.15
3.03
3.11
2.99
2.89
2.89
2.90 2.90 2.90 2.89
2.90 2.90 2.88 2.87 2.89 2.88 2.88 2.89 2.89 2.89 2.90 2.90
2.88 2.90 2.85 2.84 2.83 2.79 2.79 2.80 2.82
2.37
3.20
3.86
3.96
3.69
4.30
3.55 3.71 3.78 3.98
4.09 4.14 4.08 4.11 4.17 4.11 4.21 4.39
. 4.39 4.52 4.66 4.63
4.58 4.67 4.33 4.06 4.02 3.86 3.86 3.95 4.05
SDR
7.91967
9.16159
10.08932
10.48933
9.99803
10.61534
9.73551 9.93324 9.97943
10.16799
10.29825 10.36071 10.16871 10.14495 10.26674 10.23261 10.44467 10.70420 10.79630 11.09919 11.26300 11.13142
11.09475 11.22926 10.75911 10.53123 10.45281 10.20474 10.25679 10.37075 10.49334
0.188
0.203
0.241
0.265
0.280
0.274
0.289 0.288 0.285 0.283
0.284 0.284 0.282 0.279 0.273 0.268 0.270 0.270 0.270 0.270 0.270 0.270
0.269 0.270 0.269 0.268 0.268 0.268 0.269 0.272 0.274
Swiss franc
Chinese renminbi
Belgian Republic of franc Korea won
3.21
4.37
5.24
5.35
4.78
5.64
4.64 4.79 4.83 4.99
5.14 5.25 5.18 5.25 5.49 5.47 5.58 5.93 5.95 6.07 6.21 6.11
6.13 6.16 5.65 5.41 5.35 5.07 5.01 5.10 5.22
2.6653
2.2707
2.0950
2.0967
2.0790
1.6309
2.0985 2.0985 2.0985 1.8945
1.6535 1.6535 1.6535 1.6535 1.6535 1.6535 1.6478 1.6453 1.6453 1.6453 1.5748 1.4927
1.4927 1.4927 1.4927 1.4790 1.4683 1.4477 1.4477 1.4477 1.4477
0.136
0.179
0.213
0.216
0.203
0.238
0.196 0.204 0.208 0.218
0.224 0.227 0.225 0.228 0.232 0.230 0.235 0.245 0.245 0.252 0;259 0.257
0.256 0.260 0.242 0.227 0.225 0.216 0.215 0.220 0.226
0.0090
0.0089
0.0095
0.0107
0.0116
0.0110
0.0117 0.0116 0.0116 0.0116
0.0114 0.0113 0.0112 0.0110 0.0110 0.0109 0.0109 0.0109 0.0109 0.0109 0.0109 0.0109
0.0109 0.0108 0.0107 0.0107 0.0107 0.0107 0.0106 0.0106 0.0105
Effective exchange rate indexes for the Hong Kong dollar New Series
calculated with average trade weights 1984-1986
(24-28.10.83=100)
Trade (import and export)-weighled
115.7
110.1
105.8
101.6
103.2
108.9
104.2 103.4 103.4 105.7
109.4 109.2 110.5 111.1 110.5 110.6 109.6 108.6 107.6 105.8 106.5 108.8
109.1 108.3 110.5 11 l.8 112.5 114.3 113.8 113.1 112.4
Importweighted
116.2
107.5
101.6
96.l
98.1
104.4
99.3 98.4 98.6
101.0
104.7 104.6 106.4 107.3 106.6 106.7 105.5 104.4 102.8 100.5 101.2 103.8
104.l 103.1 105.7 106.9 107.6 109.4 108.8 108.0 107.2
Exportweighled
115.0
113.0
110.5
107.6
109.0
113.9
109.7 109.0 108.8 111.0
114.5 114.3 115.1 115.3 114.9 115.0 114.2 113.2 112.8 111.7 112.5 114.4
114.6 114.1 116.0 117.3 118.0 119.8 119.5 118.8 118.2
Note: Figures are average exchange rates for the reepective periods derived from closing middle market TIT rates.
80 Hong Kong Monthly Digest of Statistics October 1991
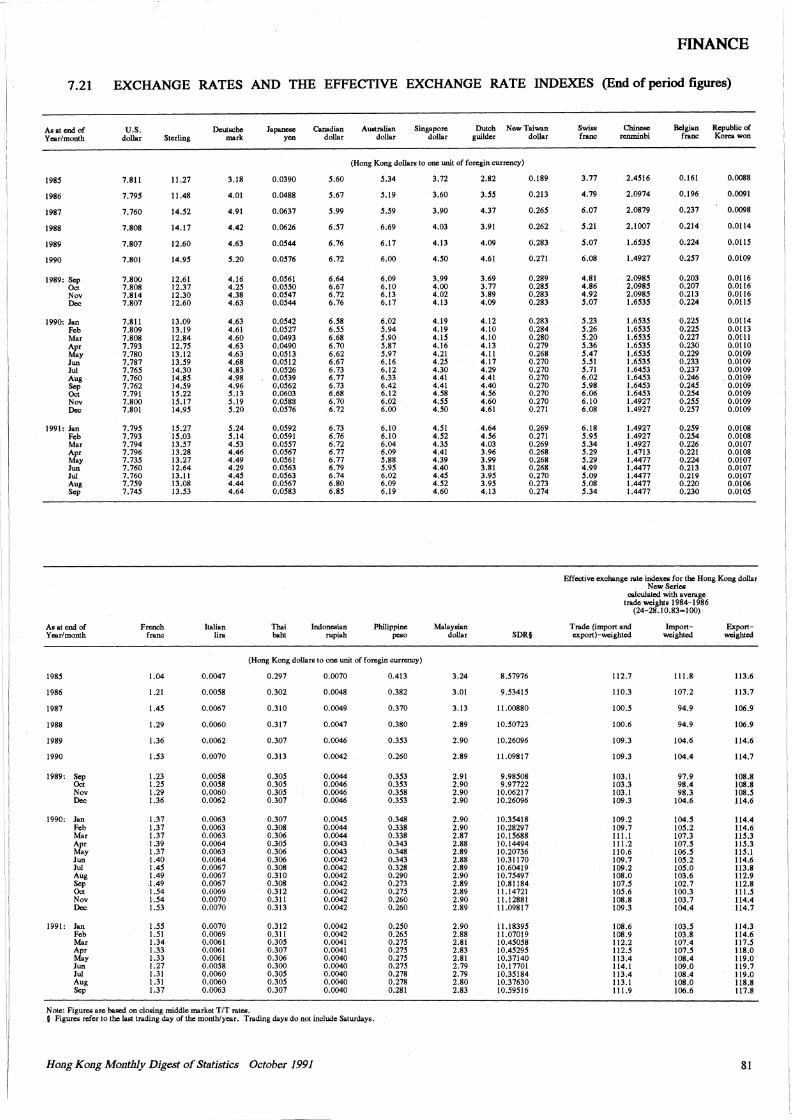
: I
: I
FINANCE
7.21 EXCHANGE RATES AND THE EFFECTIVE EXCHANGE RATE INDEXES (End of period figures)
As at end of Year/month
U.S. dollar Sterling
Deutsche mark
Japanese yen
Canadian dollar
Australian dollar
Singapore dollar
Dutch New Taiwan guilder dollar
(Hong Kong dollars to one unit of foregin currency)
1985
1986
1987
1988
1989
1990
1989: Sep Oct Nov Dec
1990: Jan Feb Mar Apr May Jun Jui Aug Sep Oct Nov Dec
1991: Jan Feb Mar Apr May Jun Jui Aug Sep
As at end of Year/month
7.811
7.795
7.760
7.808
7.807
7.801
7.800 7.808 7.814 7.807
7.811 7.809 7.808 7.793 7.780 7.787 7.765 7.760 7.762 7.791 7.800 7.801
7.795 7.793 7.794 7.796 7.735 7.760 7.760 7.759 7.745
French franc
11.27
11.48
14.52
14.17
12.60
14.95
12.61 12.37 12.30 12.60
13.09 13.19 12.84 12.75 13.12 13.59 14.30 14.85 14.59 15.22 15.17 14.95
15.27 15.03 13.57 13.28 13.27 12.64 13.11 13.08 13.53
Italian lira
3.18
4.01
4.91
4.42
4.63
5.20
4.16 4.25 4.38 4.63
4.63 4.61 4.60 4.63 4.63 4.68 4.83 4.98 4.96 5.13 5.19 5.20
5.24 5.14 4.53 4.46 4.49 4.29 4.45 4.44 4.64
0.0390
0.0488
0.0637
0.0626
0.0544
0.0576
0.0561 0.0550 0.0547 0.0544
0.0542 0.0527 0.0493 0.0490 0.0513 0.0512 0.0526 0.0539 0.0562 0.0603 0.0588 0.0576
0.0592 0.0591 0.0557 0.0567 0.0561 0.0563 0.0563 0.0567 0.0583
Thai baht
5.60
5.67
5.99
6.57
6.76
6.72
6.64 6.67 6.72 6.76
6.58 6.55 6.68 6.70 6.62 6.67 6.73 6.77 6.73 6.68 6.70 6.72
6.73 6.76 6.72 6.77 6.77 6.79 6.74 6.80 6.85
Indonesian rupiah
5.34
5.19
5.59
6.69
6.17
6.00
6.09 6.10 6.13 6.17
6.02 5.94 5.90 5.87 5.97 6.16 6.12 6.33 6.42 6.12 6.02 6.00
6.10 6.10 6.04 6.09 5.88 5.95 6.02 6.09 6.19
Philippine peso
(Hong Kong dollars to one unit of foregin currency)
1985
1986
1987
1988
1989
1990
1989: Sep Oct Nov Dec
1990: Jan Feb Mar Apr May Jun Jui Aug Sep Oct Nov Dec
1991: Jan Feb Mar Apr May Jun Jui Aug Sep
1.04
1.21
1.45
1.29
1.36
1.53
1.23 1.25 1.29 1.36
1.37 1.37 1.37 1.39 1.37 1.40 1.45 1.49 .1.49 1.54 1.54 1.53
1.55 I.SI 1.34 1.33 1.33 1.27 1.31 1.31 1.37
0.0047
0.0058
0.0067
0.0060
0.0062
0.0070
0.0058 0.0058 0.0060 0.0062
0.0063 0.0063 0.0063 0.0064 0.0063 0.0064 0.0067 0.0067 0.0067 0.0069 0.0070 0.0070
0.0070 0.0069 0.0061 0.0061 0.0061 0.0058 0.0060 0.0060 0.0063
Note: Figures are based on closing middle market T/T rates.
0.297
0.302
0.310
0.317
0.307
0.313
0.305 0.305 0.305 0.307
0.307 0.308 0.306 0.305 0.306 0.306 0.308 0.310 0.308 0.312 0.311 0.313
0.312 0.311 0.305 0.307 0.306 0.300 0.305 0.305 0.307
0.0070
0.0048
0.0049
0.0047
0.0046
0.0042
0.0044 0.0046 0.0046 0.0046
0.0045 0.0044 0.0044 0.0043 0.0043 0.0042 0.0042 0.0042 0.0042 0.0042 0.0042 0.0042
0.0042 0.0042 0.0041 0.0041 0.0040 0.0040 0.0040 0.0040 0.0040
§ Figures refer to the last trading day of the month/year. Trading days do not include Saturdays.
Hong Kong Monthly Digest of St11tistics October 1991
0.413
0.382
0.370
0.380
0.353
0.260
0.353 0.353 0.358 0.353
0.348 0.338 0.338 0.343 0.348 0.343 0.328 0.290 0.273 0.275 0.260 0.260
0.250 0.265 0.275 0.275 0.275 0.275 0.278 0.278 0.281
3.72
3.60
3.90
4.03
4.13
4.50
3.99 4.00 4.02 4.13
4.19 4.19 4.15 4.16 4.21 4.25 4.30 4.41 4.41 4.58 4.55 4.50
4.51 4.52 4.35 4.41 4.39 4.40 4.45 4.52 4.60
Malaysian dollar
3.24
3.01
3.13
2.89
2.90
2.89
2.91 2.90 2.90 2.90
2.90 2.90 2.87 2.88 2.89 2.88 2.89 2.90 2.89 2.89 2.90 2.89
2.90 2.88 2.81 2.83 2.81 2.79 2.79 2.80 2.83
2.82
3.55
4.37
3.91
4.09
4.61
3.69 3.77 3.89 4.09
4.12 4.10 4.10 4.13 4.11 4.17 4.29 4.41 4.40 4.56 4.60 4.61
4.64 4.56 4.03 3.96 3.99 3.81 3.95 3.95 4.13
0.189
0.213
0.265
0.262
0.283
0.271
0.289 0.285 0.283 0.283
0.283 0.284 0.280 0.279 0.268 0.270 0.270 0.270 0.270 0.270 0.270 0.271
0.269 0.271 0.269 0.268 0.268 0.268 0.270 0.273 0.274
SDR§
8.57976
9.53415
11.00880
10.50723
10.26096
11.09817
9.98508 9.97722
10.06217 10.26096
10.35418 10.28297 10.15688 10.14494 10.20736 10.31170 10.60419 10.75497 10.81184 11.14721 11.12881 11.09817
11.18395 11.07019 10.45058 10.45295 10.37140 10.17701 10.35184 10.37630 10.59516
Swiss franc
Chinese rcruninbi
Belgian Republic of franc Korea won
3.77
4.79
6.07
5.21
5.07
6.08
4.81 4.86 4.92 5.07
5.23 5.26 5.20 5.36 5.47 5.51 5.71 6.02 5.98 6.06 6.10 6.08
6.18 5.95 5.34 5.29 5.29 4.99 5.09 5.08 5.34
2.4516
2.0974
2.0879
2.1007
1.6535
1.4927
2.0985 2.0985 2.0985 1.6535
1.6535 1.6535 1.6535 1.6535 1.6535 1.6535 1.6453 1.6453 1.6453 1.6453 1.4927 1.4927
1.4927 1.4927 1.4927 1.4713 1.4477 1.4477 1.4477 1.4477 1.4477
0.161
0.196
0.237
0.214
0.224
0.257
0.203 0.207 0.213 0.224
0.225 0.225 0.227 0.230 0.229 0.233 0.237 0.246 0.245 0.254 0.255 0.257
0.259 0.254 0.226 0.221 0.224 0.213 0.219 0.220 0.230
0.0088
0.0091
0.0098
0.0114
0.0115
0.0109
0.0116 0.0116 0.0116 0.0115
0.0114 0.0113 0.0111 0.0110 0.0109 0.0109 0.0109 0.0109 0.0109 0.0109 0.0109 0.0109
0.0108 0.0108 0.0107 0.0108 0.0107 0.0107 0.0107 0.0106 0.0105
Effective exchange rate indexes for the Hong Kong dollar New Series
calculated with average trade weights 1984-1986
(24-28.10.83~100)
Trade (import and export)-weighted
112.7
110.3
100.5
100.6
109.3
109.3
103.1 103.3 103.1 109.3
109.2 109.7 111.1 111.2 110.6 109.7 109.2 108.0 107.5 105.6 108.8 109.3
108.6 108.9 112.2 112.5 113.4 114.1 113.4 113.1 111.9
Importweighted
111.8
107.2
94.9
94.9
104.6
104.4
97.9 98.4 98.3
104.6
104.5 105.2 107.3 107.5 106.5 105.2 105.0 103.6 102.7 100.3 103.7 104.4
103.5 103.8 107.4 107.5 108.4 109.0 108.4 108.0 106.6
Exportweighted
113.6
113.7
106.9
106.9
114.6
114.7
108.8 108.8 108.5 114.6
114.4 114.6 115.3 115.3 115.1 114.6 113.8 112.9 112.8 111.5 114.4 114.7
114.3 114.6 117.5 118.0 119.0 119.7 119.0 118.8 117.8
81
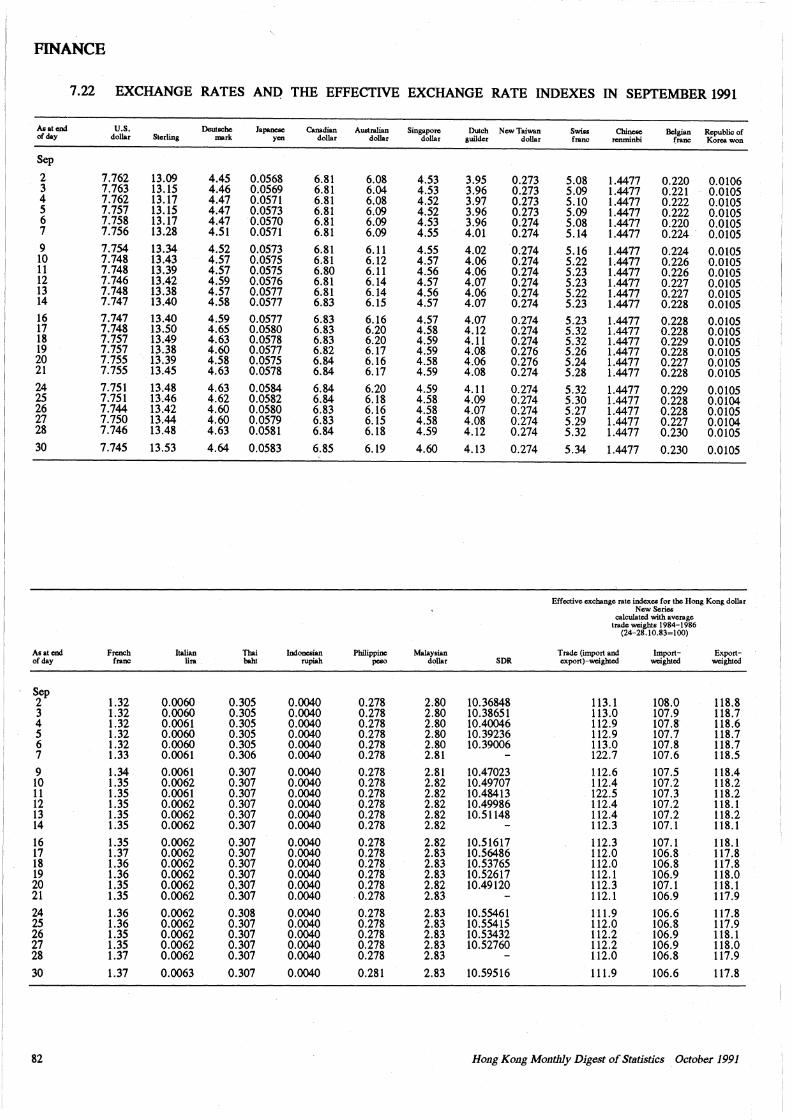
FINANCE
7.22 EXCHANGE RATES ANQ THE EFFECTIVE EXCHANGE RATE INDEXES IN SEPTEMBER 1991
Asal end U.S. Deutsche Japanese Canadian Australian Singapore Dutch New Taiwan Swiss Chinese Belgian Republic of of day dollar Sterling mark yen dollar dollar dollar guilder dollar franc renminbi franc Korea won
Sep
2 7.762 13.09 4.45 0.0568 6.81 6.08 4.53 3.95 0.273 5.08 1.4477 0.220 0.0106 3 7.763 13.15 4.46 0.0569 6.81 6.04 4.53 3.96 0.273 5.09 1.4477 0.221 0.0105 4 7.762 13.17 4.47 0.0571 6.81 6.08 4.52 3.97 0.273 5.10 1.4477 0.222 0.0105 5 7.757 13.15 4.47 0.0573 6.81 6.09 4.52 3.96 0.273 5.09 1.4477 0.222 0.0105 6 7.758 13.17 4.47 0.0570 6.81 6.09 4.53 3.96 0.274 5.08 1.4477 0.220 0.0105 7 7.756 13.28 4.51 0.0571 6.81 6.09 4.55 4.01 0.274 5.14 1.4477 0.224 0.0105 9 7.754 13.34 4.52 0.0573 6.81 6.11 4.55 4.02 0.274 5.16 1.4477 0.224 0.0105 10 7.748 13.43 4.57 0.0575 6.81 6.12 4.57 4.06 0.274 5.22 1.4477 0.226 0.0105 11 7.748 13.39 4.57 0.0575 6.80 6.11 4.56 4.06 0.274 5.23 1.4477 0.226 0.0105 12 7.746 13.42 4.59 0.0576 6.81 6.14 4.57 4.07 0.274 5.23 1.4477 0.227 0.0105 13 7.748 13.38 4.57 0.0577 6.81 6.14 4.56 4.06 0.274 5.22 1.4477 0.227 0.0105 14 7.747 13.40 4.58 0.0577 6.83 6.15 4.57 4.07 0.274 5.23 1.4477 0.228 0.0105 16 7.747 13.40 4.59 0.0577 6.83 6.16 4.57 4.07 0.274 5.23 1.4477 0.228 0.0105 17 7.748 13.50 4.65 0.0580 6.83 6.20 4.58 4.12 0.274 5.32 1.4477 0.228 0.0105 18 7.757 13.49 4.63 0.0578 6.83 6.20 4.59 4.11 0.274 5.32 1.4477 0.229 0.0105 19 7.757 13.38 4.60 0.0577 6.82 6.17 4.59 4.08 0.276 5.26 1.4477 0.228 0.0105 20 7.755 13.39 4.58 0.0575 6.84 6.16 4.58 4.06 0.276 5.24 1.4477 0.227 0.0105 21 7.755 13.45 4.63 0.0578 6.84 6.17 4.59 4.08 0.274 5.28 1.4477 0.228 0.0105 24 7.751 13.48 4.63 0.0584 6.84 6.20 4.59 4.11 0.274 5.32 1.4477 0.229 0.0105 25 7.751 13.46 4.62 0.0582 6.84 6.18 4.58 4.09 0.274 5.30 1.4477 0.228 0.0104 26 7.744 13.42 4.60 0.0580 6.83 6.16 4.58 4.07 0.274 5.27 1.4477 0.228 0.0105 27 7.750 13.44 4.60 0.0579 6.83 6.15 4.58 4.08 0.274 5.29 1.4477 0.227 0.0104 28 7.746 13.48 4.63 0.0581 6.84 6.18 4.59 4.12 0.274 5.32 1.4477 0.230 0.0105 30 7.745 13.53 4.64 0.0583 6.85 6.19 4.60 4.13 0.274 5.34 1.4477 0.230 0.0105
Effective exchange rate indexes for the Hong Kong dollar New Series
calculated with average trade weights 1984-1986
(24-28.10.83=100)
As at end French Italian Thai Indonesian Philippine Malaysian Trade (import and Import- Export-of day franc lira baht rupiah peso dollar SOR export)-weighted weighted weighted
Sep 2 1.32 0.0060 0.305 0.0040 0.278 2.80 10.36848 113.1 108.0 118.8 3 1.32 0.0060 0.305 0.0040 0.278 2.80 10.38651 113.0 107.9 118.7 4 1.32 0.0061 0.305 0.0040 0.278 2.80 10.40046 112.9 107.8 118.6 5 1.32 0.0060 0.305 0.0040 0.278 2.80 10.39236 112.9 107.7 118.7 6 1.32 0.0060 0.305 0.0040 0.278 2.80 10.39006 113.0 107.8 118.7 7 1.33 0.0061 0.306 0.0040 0.278 2.81 122.7 107.6 118.5
9 1.34 0.0061 0.307 0.0040 0.278 2.81 10.47023 112.6 107.5 118.4 10 1.35 0.0062 0.307 0.0040 0.278 2.82 10.49707 112.4 107.2 118.2 11 1.35 0.0061 0.307 0.0040 0.278 2.82 10.48413 122.5 107.3 118.2 12 1.35 0.0062 0.307 0.0040 0.278 2.82 10.49986 112.4 107.2 118. l 13 l.35 0.0062 0.307 0.0040 0.278 2.82 10.51148 112.4 107.2 118.2 14 1.35 0.0062 0.307 0.0040 0.278 2.82 112.3 107.1 118.1
16 1.35 0.0062 0.307 0.0040 0.278 2.82 10.51617 112.3 107.1 118.1 17 1.37 0.0062 0.307 0.0040 0.278 2.83 10.56486 112.0 106.8 117.8 18 1.36 0.0062 0.307 0.0040 0.278 2.83 10.53765 112.0 106.8 117.8 19 1.36 0.0062 0.307 0.0040 0.278 2.83 10.52617 112.1 106.9 118.0 20 1.35 0.0062 0.307 0.0040 0.278 2.82 10.49120 112.3 107.l 118.1 21 1.35 0.0062 0.307 0.0040 0.278 2.83 112.1 106.9 117.9
24 1.36 0.0062 0.308 0.0040 0.278 2.83 10.55461 111.9 106.6 117.8 25 1.36 0.0062 0.307 0.0040 0.278 2.83 10.55415 112.0 106.8 117.9 26 1.35 0.0062 0.307 0.0040 0.278 2.83 10.53432 112.2 106.9 118.1 27 1.35 0.0062 0.307 0.0040 0.278 2.83 10.52760 112.2 106.9 118.0 28 1.37 0.0062 0.307 0.0040 0.278 2.83 112.0 106.8 117.9
30 1.37 0.0063 0.307 0.0040 0.281 2.83 10.59516 111.9 106.6 117.8
82 Hong Kong Monthly Digest of Statistics October 1991
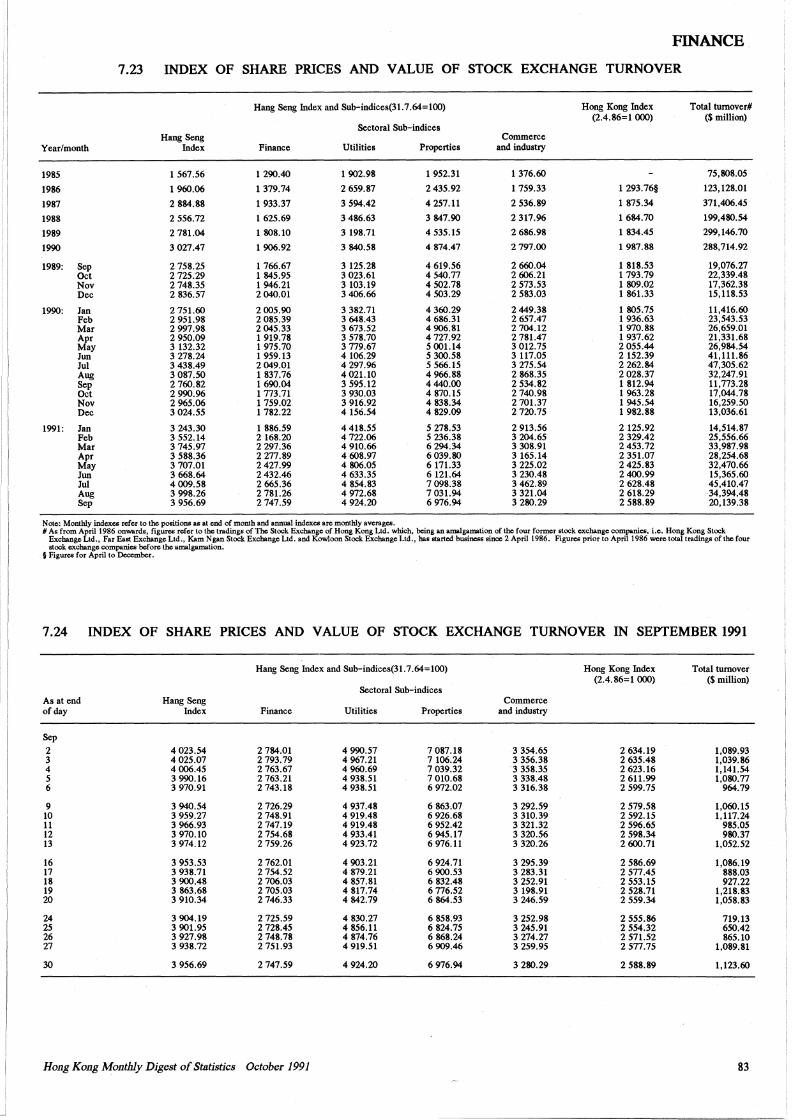
FINANCE
7 .23 INDEX OF SHARE PRICES AND VALUE OF STOCK EXCHANGE TURNOVER
Hang Seng Index and Sub-indices(31.7.64=100) Hong Kong Index Total turnover# (2.4.86=1 OOO) ($million)
Sectoral Sub-indices Hang Seng Commerce
Year/month Index Finance Utilities Properties and industry
1985 1 567.56 1 290.40 1 902.98 1 952.31 1 376.60 75,808.05
1986 1960.06 1 379.74 2 659.87 2 435.92 1 759.33 1 293.76§ 123, 128.01
1987 2 884.88 1 933.37 3 594.42 4 257.11 2 536.89 1 875.34 371,406.45
1988 2 556.72 1 625.69 3 486.63 3 847.90 2 317.96 1 684.70 199,480.54
1989 2 781.04 1 808.10 3 198.71 4 535.15 2 686.98 1 834.45 299,146.70
1990 3 027.47 1 906.92 3 840.58 4 874.47 2 797.00 1 987.88 288,714.92
1989: Sep 2 758.25 1 766.67 3 125.28 4 619.56 2 660.04 1 818.53 19,076.27 Oct 2 725.29 1 845.95 3 023.61 4 540.77 2 606.21 1 793.79 22,339.48 Nov 2 748.35 1 946.21 3 103.19 4 502.78 2 573.53 1 809.02 17,362.38 Dec 2 836.57 2 040.01 3 406.66 4 503.29 2 583.03 1 861.33 15,118.53
1990: Jan 2 751.60 2 005.90 3 382.71 4 360.29 2 449.38 1 805.75 11,416.60 Feb 2 951.98 2 085.39 3 648.43 4 686.31 2 657.47 1 936.63 23,543.53 Mar 2 997.98 2 045.33 3 673.52 4 906.81 2 704.12 1 970.88 26,659.01 Apr 2 950.09 1 919.78 3 578.70 4 727.92 2 781.47 1 937.62 21,331.68 May 3 132.32 1 975.70 3 779.67 5 001.14 3 012.75 2 055.44 26,984.54 Jun 3 278.24 1 959.13 4 106.29 5 300.58 3 117.05 2 152.39 41,111.86 Jui 3 438.49 2 049.01 4 297.96 5 566.15 3 275.54 2 262.84 47,305.62 Aug 3 087.50 1 837.76 4 021.10 4 966.88 2 868.35 2 028.37 32,247.91 Sep 2 760.82 1 690.04 3 595.12 4 440.00 2 534.82 1 812.94 11,773.28 Oct 2 990.96 1 773.71 3 930.03 4 870.15 2 740.98 1 963.28 17,044.78 Nov 2 965.06 1 759.02 3 916.92 4 838.34 2 701.37 1 945.54 16,259.50 Dec 3 024.55 1 782.22 4 156.54 4 829.09 2 720.75 1 982.88 13,036.61
1991: Jan 3 243.30 1 886.59 4 418.55 5 278.53 2 913.56 2 125.92 14,514.87 Feb 3 552.14 2 168.20 4 722.06 5 236.38 3 204 .. 65 2 329.42 25,556.66 Mar 3 745.97 2 297.36 4 910.66 6 294.34 3 308.91 2 453.72 33,987.98 Apr 3 588.36 2 277.89 4 608.97 6 039.80 3 165.14 2 351.07 28,254.68 May 3 707.01 2 427.99 4 806.05 6 171.33 3 225.02 2 425.83 32,470.66 Jun 3 668.64 2 432.46 4 633.35 6 121.64 3 230.48 2 400.99 15,365.60 Jui 4 009.58 2 665.36 4 854.83 7 098.38 3 462.89 2 628.48 45,410.47 Aug 3 998.26 2 781.26 4 972.68 7 031.94 3 321.04 2 618.29 34,394.48 Sep 3 956.69 2 747.59 4 924.20 6 976.94 3 280.29 2 588.89 20,139.38
Note: Monthly indexes refer to the positions as at end of month and annual indexes are monthly averages. #As from April 1986 onwards, figures refer to the tradings of The Stock Exchange of Hong Kong Ltd. which, being an amalgamation of the four former stock exchange companies, i.e. Hong Kong Stock
Exchange Ltd., Far East Exchange Ltd., Kam Ngan Stock Exchange Ltd. and Kowloon Stock Exchange Ltd., ha• started business since 2 April 1986. Figures prior to April 1986 were total trading• of the four stock exchange companies before the amalgamation.
§ Figures for April to December.
7.24 INDEX OF SHARE PRICES AND VALUE OF STOCK EXCHANGE TURNOVER IN SEPTEMBER 1991
Hang Seng Index and Sub-indices(31.7.64=100) Hong Kong Index Total turnover (2.4.86=1 OOO) ($million)
Sectoral Sub-indices As at end Hang Seng Commerce of day Index Finance Utilities Properties and industry
Sep
2 4 023.54 2 784.01 4 990.57 7 087.18 3 354.65 2 634.19 1,089.93 3 4 025.07 2 793.79 4 967.21 7 106.24 3 356.38 2 635.48 1,039.86 4 4 006.45 2 763.67 4 960.69 7 039.32 3 358.35 2 623.16 1,141.54 5 3 990.16 2 763.21 4 938.51 7 010.68 3 338.48 2 611.99 1,080.77 6 3 970.91 2 743.18 4 938.51 6 972.02 3 316.38 2 599.75 964.79
9 3 940.54 2 726.29 4 937.48 6 863,07 3 292.59 2 579.58 1,060.15 10 3 959.27 2 748.91 4 919.48 6 926.68 3 310.39 2 592.15 1,117.24 11 3 966.93 2 747.19 4 919.48 6 952.42 3 321.32 2 596.65 985.05 12 3 970.10 2 754.68 4 933.41 6 945.17 3 320.56 2 598.34 980.37 13 3 974.12 2 759.26 4 923.72 6 976.11 3 320.26 2 600.71 1,052.52
16 3 953.53 2 762.01 4 903.21 6 924.71 3 295.39 2 586.69 1,086.19 17 3 938.71 2 754.52 4 879.21 6 900.53 3 283.31 2 577.45 888.03 18 3 900.48 2 706.03 4 857.81 6 832.48 3 252.91 2 553.15 927.22 19 3 863.68 2 705.03 4 817.74 6 776.52 3 198.91 2 528.71 1,218.83 20 3 910.34 2 746.33 4 842.79 6 864.53 3 246.59 2 559.34 1,058.83
24 3 904.19 2 725.59 4 830.27 6 858.93 3 252.98 2 555.86 719.13 25 3 901.95 2 728.45 4 856.11 6 824.75 3 245.91 2 554.32 650.42 26 3 927.98 2 748.78 4 874.76 6 868.24 3 274.27 2 571.52 865.10 27 3 938.72 2 751.93 4 919.51 6 909.46 3 259.95 2 577.75 1,089.81
30 3 956.69 2 747.59 4 924.20 6 976.94 3 280.29 2 588.89 1,123.60
Hong Kong Monthly Digest of Statistics October 1991 83
_J
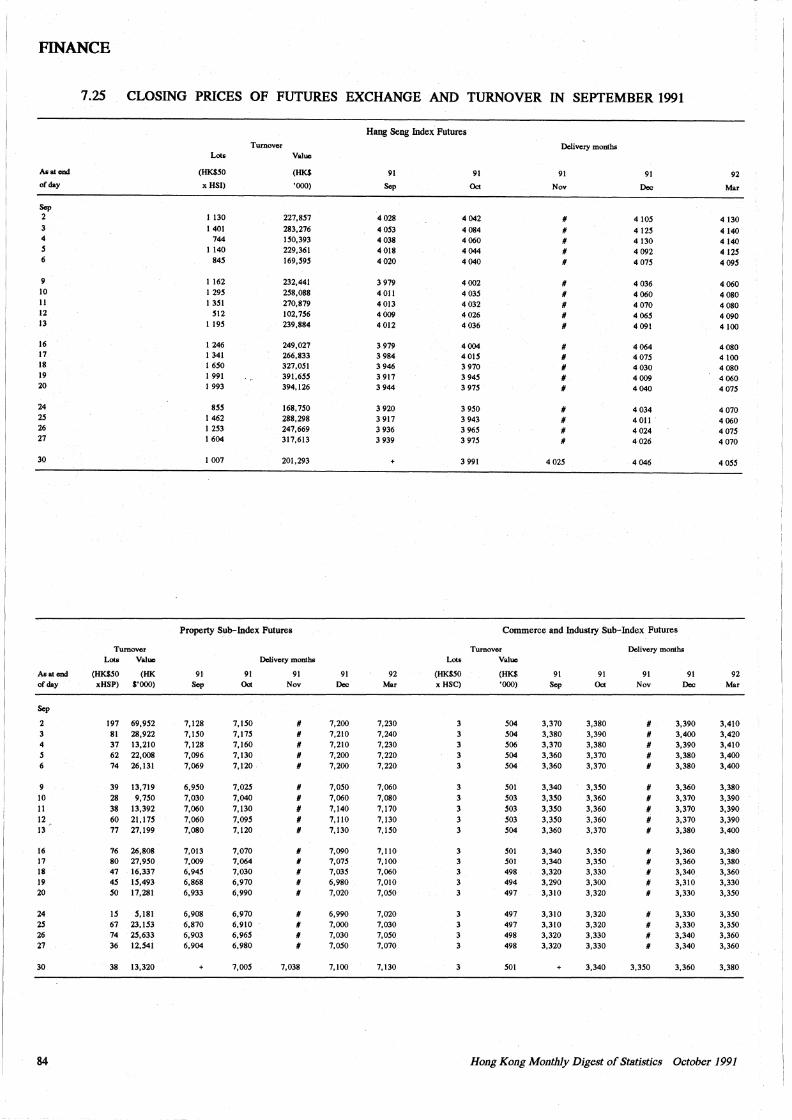
FINANCE
7.25 CLOSING PRICES OF FUTURES EXCHANGE AND TURNOVER IN SEPTEMBER 1991
As at end
of day
Sep 2
4 5 6
9 10 11 12 13
16 17 18 19 20
24 25 26 27
30
As at end of day
Sep
2
4 s
10 II 12 13
16 17 18 19 20
24 25 26 27
30
84
Turnover Lots Value
(HK$50 (HK xHSP) $'000)
197 69,9S2 81 28,922 37 13,210 62 22,008 74 26,131
39 13, 719 28 9,7SO 38 13,392 60 21,175 77 27,199
76 26,808 80 27,950 47 16,337 45 IS,493 so 17,281
IS S,181 67 23,153 74 25,633 36 12,541
38 13,320
Hang Seng Index Futures
Turnover Delivery months Lots Value
(HK$50
x HSI)
1130 1401
744 I 140
84S
I 162 1295 I 351
Sl2 1195
1246 I 341 1650 1991 I 993
855 I 462 I 253 1604
I 007
(HK$
'OOO)
227,857 283,276 150,393 229,361 169,595
232,441 258,088 270,879 102, 756 239,884
249,027 266,833 327,051 391,655 394,126
168,750 288,298 247,669 317,613
201.293
Property Sub-Index Futures
91 Sep
7,128 7,150 7,128 7,096 7,069
6,950 7,030 7,060 7,060 7,080
7,013 7,009 6,94S 6,868 6,933
6,908 6,870 6,903 6,904
91 Oct
7,150 7,17S 7,160 7,130 7,120
7,02S 7,040 7,130 7,095 7,120
7,070 7,064 7,030 6,970 6,990
6,970 6,910 6,96S 6,980
7,005
Delivery months
91 Nov
# II II II II
# # # II #
II II II # #
II II II II
7,038
91 Dec
7,200 7,210 7,210 7,200 7,200
7,050 7,060 7,140 7,110 7,130
7,090 7,07S 7,035 6,980 7,020
6,990 7,000 7,030 7,0SO
7,100
91
Sep
4028 4 053 4 038 4 018 4020
3 979 4011 4 013 4009 4012
3 979 3 984 3946 3 917 3 944
3 920 3 917 3 936 3 939
92 Mar
7,230 7,240 7,230 7,220 7,220
7,060 7,080 7,170 7,130 7,150
7,110 7,100 7,060 7,010 7,050
7,020 7,030 7,0SO 7,070
7,130
91
Oct
4042 4 084 4060 4044 4040
4002 4 035 4032 4 026 4 036
4004 4015 3 970 3 945 3 975
3 950 3 943 3 965 3 975
3 991
91
Nov
II II # # #
# # # # #
# II # II #
# II # #
4 025
91
Dec
4105 4125 4 130 4092 4075
4036 4060 4 070 4065 4091
4064 4075 4030 4009 4040
4 034 4011 4024 4026
4046
Commerce and Industry Sub-Index Futures
Turnover Lots Value
(HK$50 x HSC)
3
(HK$ 'OOO)
S04 S04 S06 504 504
SOI 503 503 503 504
SOI SOI 498 494 497
497 497 498 498
501
91 Sep
3,370 3,380 3,370 3,360 3,360
3,340 3,3SO 3,350 3,350 3,360
3,340 3,340 3,320 3,290 3,310
3,310 3,310 3,320 3,320
91 Oct
3,380 3,390 3,380 3,370 3,370
3,3SO 3,360 3,360 3,360 3,370
3,350 3,350 3,330 3,300 3,320
3,320 3,320 3,330 3,330
3,340
Delivery monthi:
91 Nov
# II # II II
# II II # #
II II # # II
II # # II
3,3SO
91 Dec
3,390 3,400 3,390 3,380 3,380
3,360 3,370 3,370 3,370 3,380
3,360 3,360 3,340 3,310 3,330
3,330 3,330 3,340 3,340
3,360
92
Mar
4130 4140 4140 4125 4095
4060 4 080 4080 4090 4100
4 080 4100 4080 4060 4 075
4070 4060 4 075 4070
4055
92 Mar
3,410 3,420 3,410 3,400 3,400
3,380 3,390 3,390 3,390 3,400
3,380 3,380 3,360 3,330 3,350
3,350 3,350 3,360 3,360
3,380
Hong Kong Monthly Digest of Statistics October 1991
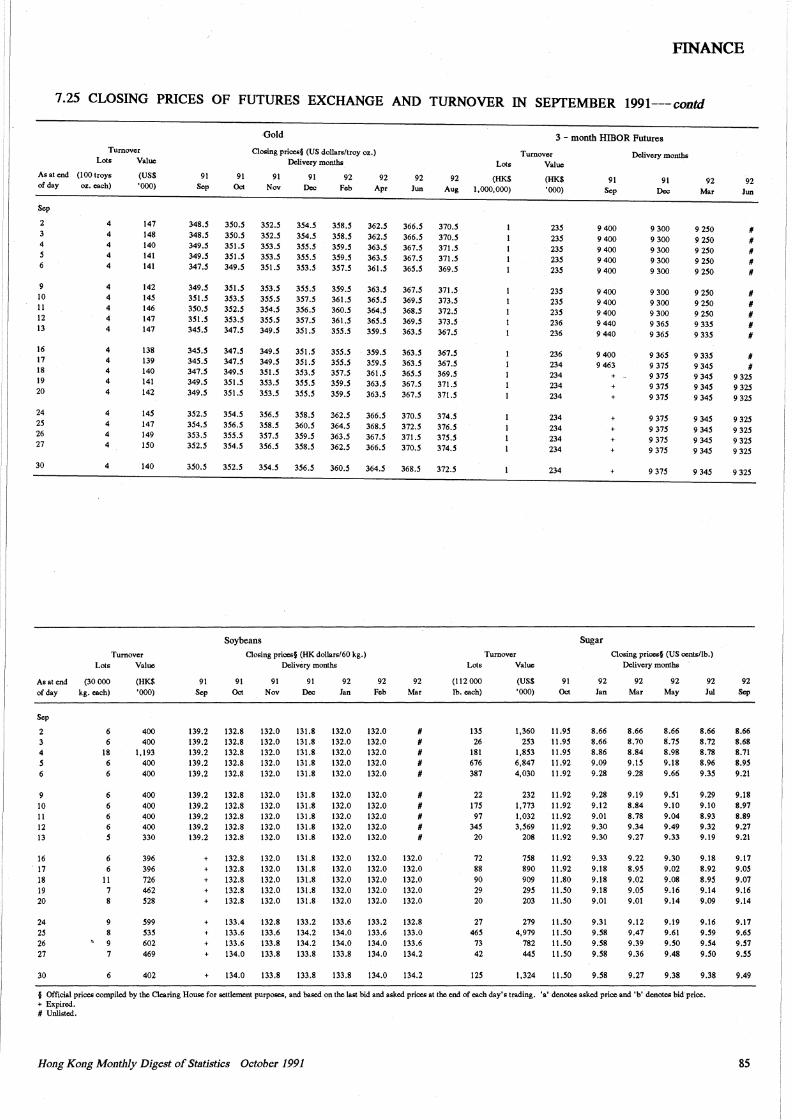
FINANCE
7.25 CLOSING PRICES OF FUTURES EXCHANGE AND TURNOVER IN SEPTEMBER 1991---contd
Gold 3 - month HIBOR Futures Turnover
Lots Value
As at end (I 00 troys of day oz. each)
Sep
2
10 11 12 13
16 17 18 19 20
24 25 26 27
30
4 4 4 4 4
4 4 4 4 4
4 4 4 4 4
4 4 4 4
4
(US$ 'OOO)
147 148 140 141 141
142 145 146 147 147
138 139 140 141 142
145 147 149 ISO
140
Turnover
Lots Value
As at end (30 OOO of day kg. each)
Sep
2
4 18 s 6
9 10 11 12 6 13 s
16 17 18 19 20
24 25 26 27
30
6
11 7
8 9 7
(HK$ 'OOO)
400 400
1,193 400 400
400 400 400 400 330
396 396 726 462 528
599 535 602 469
402
Closing prioes§ (US dollars/troy oz.) Delivery months
Turnover Lots Value
91 Sep
348.S 348.S 349.S 349.S 347.S
349.5 351.S 350.5 351.5 345.S
345.S 345.S 341.S 349.S 349.S
91 Oct
91 Nov
350.S 352.S 350.S 352.S 351.S 353.S 351.S 353.S 349.S 351.S
351.S 353.S 353.5 355.S 352.S 354.5 353.5 355.5 347.S 349.S
347.S 349.S 341.S 349.S 349.S 351.S 351 .5 353.S 351.S 353.S
91 Dec
354.S 354.S 3SS.S 3SS.S 353.S
355.5 351.5 356.5 357.5 351.5
351.S 351.5 353.S 355.5 355.S
92 Feb
358.S 358.S 359.5 359.S 351.S
359.S 361.S 360.5 361.S 355.5
355.5 355.5 357.5 359.5 359.5
92 Apr
362.5 362.S 363.5 363.S 361.S
363.S 365.S 364.S 365.S 359.S
359.5 359.5 361.S 363.5 363.5
92 Jun
366.5 366.5 367.5 367.S 365.5
367.5 369.S 368.5 369.5 363.S
363.S 363.S 365.5 367.S 367.5
92 (HK$ Aug 1,000,000)
370.5 370.S 371.S 371.S 369.5
311.S 373.5 312.S 373.S 367.S
367.S 367.S 369.S 371.S 371.S
352.5 354.5 356.5 358.S 362.S 366.5 370.S 374.S 354.S 356.S 358.S 360.S 364.5 368.S 372.5 376.S 353.S 355.5 357.5 359.5 363.5 367.5 371.S 375.5 352.5 354.5 356.5 358.5 362.5 366.5 370.5 374.5
350.S 352.5 354.S 356.S 360.5 364.5 368.5 372.S
Soy beans Closing prioes§ (HK dollars/60 kg.)
Delivery months
Turnover
91 Sep
139.2 139.2 139.2 139.2 139.2
139.2 139.2 139.2 139.2 139.2
+
+
+
91 Oct
132.8 132.8 132.8 132.8 132.8
132.8 132.8 132.8 132.8 132.8
132.8 132.8 132.8 132.8 132.8
133.4 133.6 133.6 134.0
134.0
91 91 92 92 Nov Dec Jan Feb
132.0 131.8 132.0 132.0 132.0 131.8 132.0 132.0 132.0 131.8 132.0 132.0 132.0 131.8 132.0 132.0 132.0 131.8 132.0 132.0
132.0 131.8 132.0 132.0 132.0 131.8 132.0 132.0 132.0 131.8 132.0 132.0 132.0 131.8 132.0 132.0 132.0 131.8 132.0 132.0
92 Mar
# # # # #
# # # # #
132.0 131.8 132.0 132.0 132.0 132.0 131.8 132.0 132.0 132.0 132.0 131.8 132.0 132.0 132.0 132.0 131.8 132.0 132.0 132.0 132.0 131.8 132.0 132.0 132.0
132.8 133.2 133.6 133.2 132.8 133.6 133.8 133.8
133.8
134.2 134.2 133.8
133.8
134.0 133.6 133.0 134.0 134.0 133.6 133.8 134.0 134.2
133.8 134.0 134.2
Lots Value
(112000 lb. each)
135 26
181 676 387
22 175 97
345 20
72 88 90 29 20
27 465
73 42
125
(US$ 'OOO)
1,360 253
1,853 6,847 4,030
232 1,773 l,032 3,569
208
158 890 909 295 203
279 4,979
782 445
1,324
(HK$ 'OOO)
235 235 235 235 235
235 235 235 236 236
236 234 234 234 234
234 234 234 234
234
91 Oct
11.95 11.95 11.95 11.92 11.92
11.92 11.92 11.92 11.92 11.92
11.92 11.92 11.80 11.50 11.50
I I.SO 11.50 I I.SO 11.50
11.50
91 Sep
9 400 9 400 9 400 9 400 9 400
9 400 9 400 9 400 9 440 9 440
9 400 9 463
+
+
Sugar
Delivery months
91 Dec
9 300 9 300 9 300 9 300 9 300
9 300 9 300 9 300 9 365 9 365
9 365 9 315 9 315 9 315 9 375
9 375 9 375 9 375 9 375
9 315
92 Mar
9 250 9 250 9 250 9 250 9 250
9 250 9 250 9 250 9 335 9 335
9 335 9 345 9 345 9 345 9 345
9 345 9 345 9 345 9 345
9 345
Closing prices§ (US cents/lb.) Delivery months
92 Jan
8.66 8.66 8.86 9.09 9.28
9.28 9.12 9.01 9.30 9.30
9.33 9.18 9.18 9.18 9.01
9.31 9.58 9.58 9.58
9.58
92 Mar
8.66 8.70 8.84 9.15 9.28
9.19 8.84 8.78 9.34 9.27
9.22 8.95 9.02 9.05 9.01
9.12 9.47 9.39 9.36
9.27
92 May
8.66 8.75 8.98 9.18 9.66
9.51 9.10 9.04 9.49 9.33
9.30 9.02 9.08 9.16 9.14
9.19 9.61 9.50 9.48
9.38
92 Jui
8.66 8.72 8.78 8.96 9.35
9.29 9.10 8.93 9.32 9.19
9.18 8.92 8.95 9.14 9.09
9.16 9.59 9.54 9.50
9.38
§ Official prices compiled by the Clearing House for settlement purposes, and based on the last bid and asked prices at the end of each day's trading. 'a' denotes asked price and 'b' denotes bid price. + Expired. # Unlisted.
Hong Kong Monthly Digest of Statistics October 1991
92 Jun
# # # # #
# # # # #
# #
9 325 9 325 9 325
9 325 9 325 9 325 9 325
9 325
92 Sep
8.66 8.68 8.71 8.95 9.21
9.18 8.97 8.89 9.27 9.21
9.17 9.0S 9.07 9.16 9.14
9.17 9.65 9.51 9.55
9.49
85
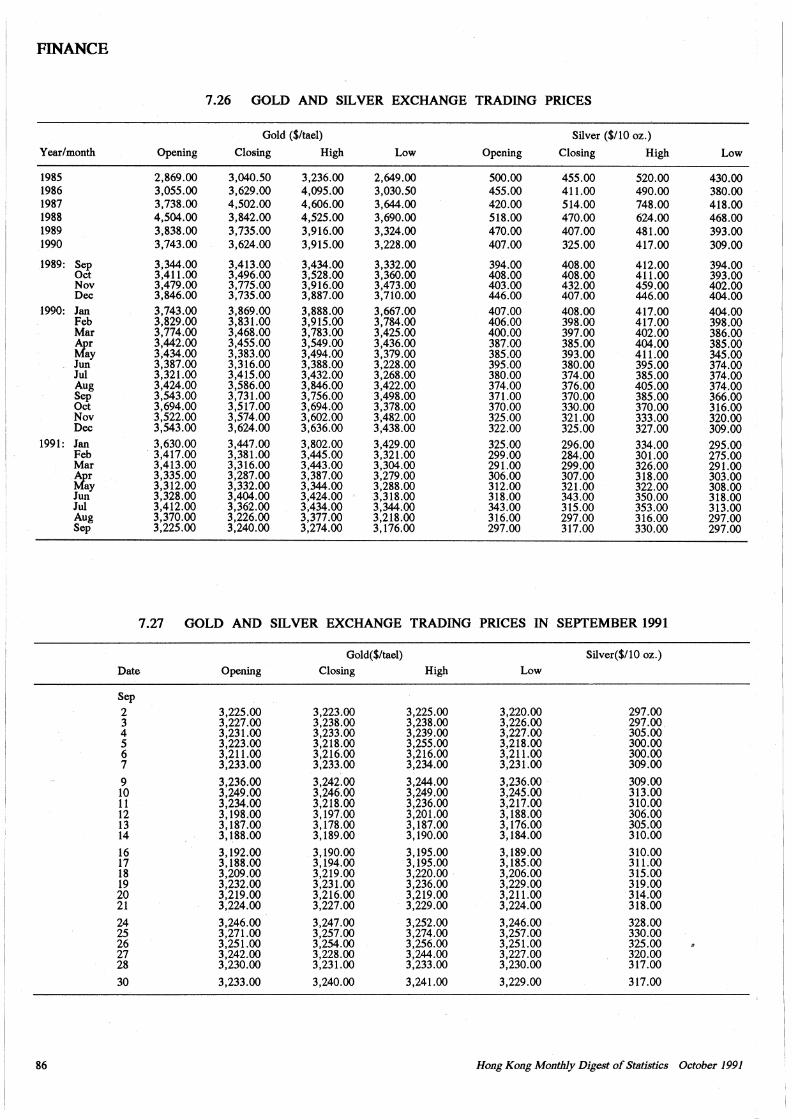
FINANCE
7.26 GOLD AND SILVER EXCHANGE TRADING PRICES
Gold ($/tael) Silver ($/10 oz.)
Year/month Opening Closing High Low Opening Closing High Low
1985 2,869.00 3,040.50 3,236.00 2,649.00 500.00 455.00 520.00 430.00 1986 3,055.00 3,629.00 4,095.00 3,030.50 455.00 411.00 490.00 380.00 1987 3,738.00 4,502.00 4,606.00 3,644.00 420.00 514.00 748.00 418.00 1988 4,504.00 3,842.00 4,525.00 3,690.00 518.00 470.00 624.00 468.00 1989 3,838.00 3,735.00 3,916.00 3,324.00 470.00 407.00 481.00 393.00 1990 3,743.00 3,624.00 3,915.00 3,228.00 407.00 325.00 417.00 309.00
1989: Sep 3;344.00 3,413.00 3,434.00 3,332.00 394.00 408.00 412.00 394.00 Oct 3,411.00 3,496.00 3,528.00 3,360.00 408.00 408.00 411.00 393.00 Nov 3,479.00 3,775.00 3,916.00 3,473.00 403.00 432.00 459.00 402.00 Dec 3,846.00 3,735.00 3,887.00 3,710.00 446.00 407.00 446.00 404.00
1990: Jan 3,743.00 3,869.00 3,888.00 3,667.00 407.00 408.00 417.00 404.00 Feb 3,829.00 3,831.00 3,915.00 3,784.00 406.00 398.00 417.00 398.00 Mar 3,774.00 3,468.00 3,783.00 3,425.00 400.00 397.00 402.00 386.00 tfer 3,442.00 3,455.00 3,549.00 3,436.00 387.00 385.00 404.00 385.00
ay 3,434.00 3,383.00 3,494.00 3,379.00 385.00 393.00 411.00 345.00 Jun 3,387.00 3,316.00 3,388.00 3,228.00 395.00 380.00 395.00 374.00 Jul 3,321.00 3,415.00 3,432.00 3,268.00 380.00 374.00 385.00 374.00 Aug 3,424.00 3,586.00 3,846.00 3,422.00 374.00 376.00 405.00 374.00 Sep 3,543.00 3,731.00 3,756.00 3,498.00 371.00 370.00 385.00 366.00 Oct 3,694.00 3,517.00 3,694.00 3,378.00 370.00 330.00 370.00 316.00 Nov 3,522.00 3,574.00 3,602.00 3,482.00 325.00 321.00 333.00 320.00 Dec 3,543.00 3,624.00 3,636.00 3,438.00 322.00 325.00 327.00 309.00
1991: Jan 3,630.00 3,447.00 3,802.00 3,429.00 325.00 296.00 334.00 295.00 Feb . 3,417.00 3,381.00 3,445.00 3,321.00 299.00 284.00 301.00 275.00 Mar 3,413.00 3,316.00 3,443.00 3,304.00 291.00 299.00 326.00 291.00 tfer 3,335.00 3,287.00 3,387.00 3,279.00 306.00 307.00 318.00 303.00
ay 3,312.00 3,332.00 3,344.00 3,288.00 312.00 321.00 322.00 308.00 Jun 3,328.00 3,404.00 3,424.00 ' 3,318.00 318.00 343.00 350.00 318.00 Jul 3,412.00 3,362.00 3,434.00 3,344.00 343.00 315.00 353.00 313.00 Aug 3,370.00 3,226.00 3,377.00 3,218.00 316.00 297.00 316.00 297.00 Sep 3,225.00 3,240.00 3,274.00 3,176.00 297.00 317.00 330.00 297.00
7.27 GOLD AND SILVER EXCHANGE TRADING PRICES IN SEPTEMBER 1991
Gold($/tael) Silver($/10 oz.)
Date Opening Closing High Low
Sep
2 3,225.00 3,223.00 3,225.00 3,220.00 297.00 3 3,227.00 3,238.00 3,238.00 3,226.00 297.00. 4 3,231.00 3,233.00 3,239.00 3,227.00 305.00 5 3,223.00 3,218.00 3,255.00 3,218.00 300.00 6 3,211.00 3,216.00 3,216.00 3,211.00 300.00 7 3,233.00 3,233.00 3,234.00 3,231.00 309.00
9 3,236.00 3,242.00 3,244.00 3,236.00 309.00 10 3,249.00 3,246.00 3,249.00 3,245.00 313.00 11 3,234.00 3,218.00 3,236.00 3,217.00 310.00 12 3,198.00 3,197.00 3,201.00 3,188.00 306.00 13 3,187.00 3,178.00 3,187.00 3,176.00 305.00 14 3,188.00 3,189.00 3,190.00 3,184.00 310.00
16 3,192.00 . 3,190.00 3,195.00 3,189.00 310.00 17 3,188.00 3,194.00 3,195.00 3,185.00 311.00 18 3,209.00 3,219.00 3,220.00 3,206.00 315.00 19 3,232.00 3,231.00 3,236.00 3,229.00 319.00 20 3,219.00 3,216,00 3,219.00 3,211.00 314.00 21 3,224.00 3,227.00 3,229.00 3,224.00 318.00
24 3,246.00 3,247.00 3,252.00 3,246.00 328.00 25 3,271.00 3,257.00 3,274.00 3,257.00 330.00 26 3,251.00 3,254.00 3,256.00 3,251.00 325.00 27 3,242.00 3,228.00 3,244.00 3,227.00 320.00 28 3,230.00 3,231.00 3,233.00 3,230.00 317.00
30 3,233.00 3,240.00 3,241.00 3,229.00 317.00
86 Hong Kong Monthly Digest of Statistics October 1991
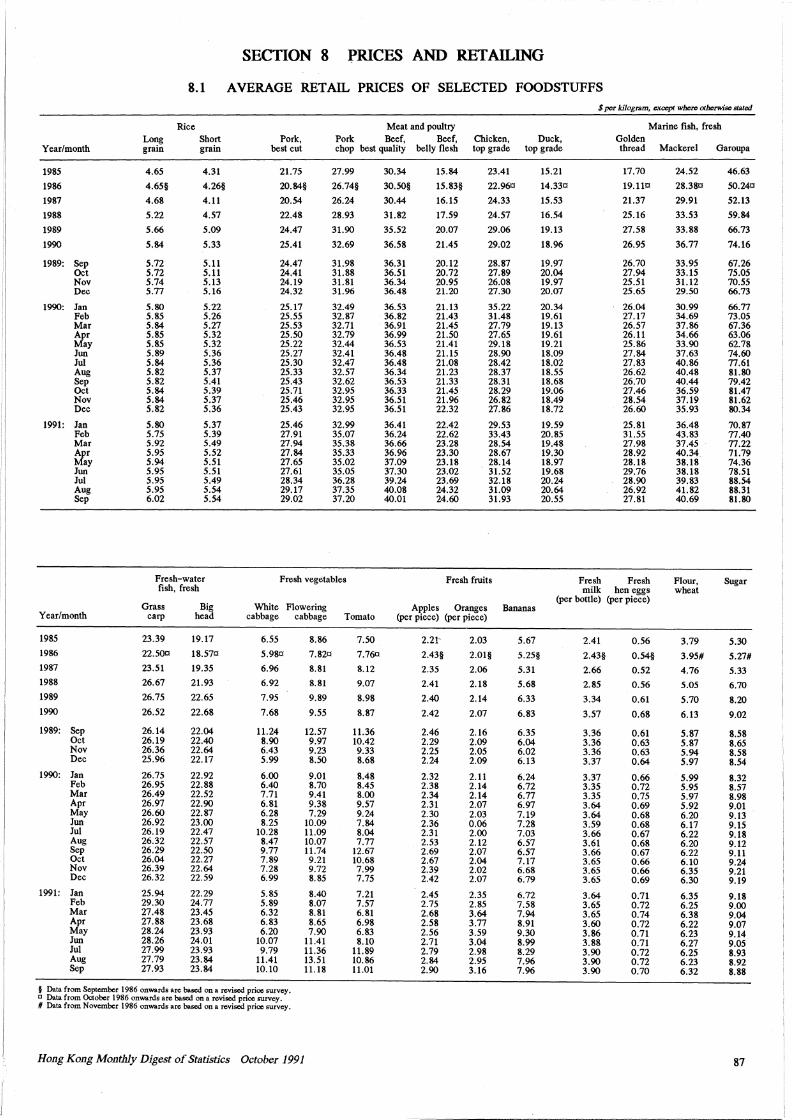
SECTION 8 ]?RICES AND RETAILING
8.1 AVERAGE RETAIL PRICES OF SELECTED FOODSTUFFS
$per kilogram, c-<cept where otherwise stated
Rice Meat and poultry Marine fish, fresh Long Short Pork, Pork Beef, Beef, Chicken, Duck, Golden
Year/month grain grain best cnt chop best qnality belly flesh top grade top grade thread Mackerel Garo up a
1985 4.65 4.31 21.75 27.99 30.34 15.84 23.41 15.21 17.70 24.52 46.63
1986 4.65§ 4.26§ 20.84§ 26.74§ 30.50§ 15.83§ 22.960 14.330 19.110 28.380 50.240
1987 4.68 4.11 20.54 26.24 30.44 16.15 24.33 15.53 21.37 29.91 52.13
1988 5.22 4.57 22.48 28.93 31.82 17.59 24.57 16.54 25.16 33.53 59.84
1989 5.66 5.09 24.47 31.90 35.52 20.07 29.06 19.13 27.58 33.88 66.73
1990 5.84 5.33 25.41 32.69 36.58 21.45 29.02 18.96 26.95 36.77 74.16
1989: Sep 5.72 5.11 24.47 31.98 36.31 20.12 28.87 19.97 26.70 33.95 67.26 Oct 5.72 5.11 24.41 31.88 36.51 20.72 27.89 20.04 27.94 33.15 75.05 Nov 5.74 5.13 24.19 31.81 36.34 20.95 26.08 19.97 25.51 31.12 70.55 Dec 5.77 5.16 24.32 31.96 36.48 21.20 27.30 20.07 25.65 29.50 66.73
1990: Jan 5.80 5.22 25.17 32.49 36.53 21.13 35.22 20.34 26.04 30.99 66.77 Feb 5.85 5.26 25.55 32.87 36.82 21.43 31.48 19.61 27.17 34.69 73.05 Mar 5.84 5.27 25.53 32.71 36.91 21.45 27.79 19.13 26.57 37.86 67.36 Apr 5.85 5.32 25.50 32.79 36.99 21.50 27.65 19.61 26.11 34.66 63.06 May 5.85 5.32 25.22 32.44 36.53 21.41 29.18 19.21 25.86 33.90 62.78 Jun 5.89 5.36 25.27 32.41 36.48 21.15 28.90 18.09 27.84 37.63 74.60 Jui 5.84 5.36 25.30 32.47 36.48 21.08 28.42 18.02 27.83 40.86 77.61 Aug 5.82 5.37 25.33 32.57 .36.34 21.23 28.37 18.55 26.62 40.48 81.80
.1 Sep 5.82 5.41 25.43 32.62 36.53 21.33 28.31 18.68 26.70 40.44 79.42 Oct 5.84 5.39 25.71 32.95 36.33 21.45 28.29 19.06 27.46 36.59 81.47
i/ Nov 5.84 5.37 25.46 32.95 36.51 21.96 26.82 18.49 28.54 37.19 81.62 I Dec 5.82 5.36 25.43 32.95 36.51 22.32 27.86 18.72 26.60 35.93 80.34
'[ 1991: Jan 5.80 5.37 25.46 32.99 36.41 22.42 29.53 19.59 25.81 36.48 70.87 Feb 5.75 5.39 27.91 35.07 36.24 22.62 33.43 20.85 31.55 43.83 77.40 Mar 5.92 5.49 27.94 35.38 36.66 23.28 28.54 19.48 27.98 37.45 77.22 Apr 5.95 5.52 27.84 35.33 36.96 23.30 28.67 19.30 28.92 40.34 71.79 May 5.94 5.51 27.65 35.02 37.09 23.18 28.14 18.97 28.18 38.18 74.36 Jun 5.95 5.51 27.61 35.05 37.30 23.02 31.52 19.68 29.76 38.18 78.51 Jui 5.95 5.49 28.34 36.28 39.24 23.69 32.18 20.24 28.90 39.83 88.54 Aug 5.95 5.54 29.17 37.35 40.08 24.32 31.09 20.64 26.92 41.82 88.31 Sep 6.02 5.54 29.02 37.20 40.01 24.60 31.93 20.55 27.81 40.69 81.80
Fresh-water Fresh vegetables Fresh fruits Fresh Fresh Flour, Sugar fish, fresh milk hen eggs wheat
Grass Big White Flowering Apples (per bottle) (per piece)
Oranges Bananas Year/month carp head cabbage cabbage Tomato (per piece) (per piece)
1985 23.39 19.17 6.55 8.86 7.50 2.21· 2.03 5.67 2.41 0.56 3.79 5.30 1986 22.500 18.570 5.980 7.820 7.760 2.43§ 2.01§ 5.25§ 2.43§ 0.54§ 3.95# 5.27# 1987 23.51 19.35 6.96 8.81 8.12 2.35 2.06 5.31 2.66 0.52 4.76 5.33 1988 26.67 21.93 6.92 8.81 9.07 2.41 2.18 5.68 2.85 0.56 5.05 6.70 1989 26.75 22.65 7.95 9.89 8.98 2.40 2.14 6.33 3.34 0.61 5.70 8.20
I 1990 26.52 22.68 7.68 9.55 8.87 2.42 2.07 6.83 3.57 0.68 6.13 9.02 , I 1989: Sep 26.14 22.04 11.24 12.57 11.36 2.46 2.16 6.35 3.36 0.61 5.87 8.58
Oct 26.19 22.40 8.90 9.97 10.42 2.29 2.09 6.04 3.36 0.63 5.87 8.65 Nov 26.36 22.64 6.43 9.23 9.33 2.25 2.05 6.02 3.36 0.63 5.94 8.58 Dec 25.96 22.17 5.99 8.50 8.68 2.24 2.09 6.13 3.37 0.64 5.97 8.54
1990: Jan 26.75 22.92 6.00 9.01 8.48 2.32 2.11 6.24 3.37 0.66 5.99 8.32 Feb 26.95 22.88 6.40 8.70 8.45 2.38 2.14 6.72 3.35 0.72 5.95 8.57 Mar 26.49 22.52 7.71 9.41 8.00 2.34 2.14 6.77 3.35 0.75 5.97 8.98
. I Apr 26.97 22.90 6.81 9.38 9.57 2.31 2.07 6.97 3.64 0.69 5.92 9.01 May 26.60 22.87 6.28 7.29 9.24 2.30 2.03 7.19 3.64 0.68 6.20 9.13 Jun 26.92 23.00 8.25 10.09 7.84 2.36 0.06 7.28 3.59 0.68 6.17 9.15 Jui 26.19 22.47 10.28 11.09 8.04 2.31 2.00 7.03 3.66 0.67 6.22 9.18 Aug 26.32 22.57 8.47 10.Q7 7.77 2.53 2.12 6.57 3.61 0.68 6.20 9.12 Sep 26.29 22.50 9.77 11.74 12.67 2.69 2.07 6.57 3.66 0.67 6.22 9.11 Oct 26.04 22.27 7.89 9.21 10.68 2.67 2.04 7.17 3.65 0.66 6.10 9.24 Nov 26.39 22.64 7.28 9.72 7.99 2.39 2.02 6.68 3.65 0.66 6.35 9.21 Dec 26.32 22.59 6.99 8.85 7.75 2.42 2.07 6.79 3.65 0.69 6.30 9.19
1991: Jan 25.94 22.29 5.85 8.40 7.21 2.45 2.35 6.72 3.64 0.71 6.35 9.18 Feb 29.30 24.77 5.89 8.07 7.57 2.75 2.85 7.58 3.65 0.72 6.25 9.00 Mar 27.48 23.45 6.32 8.81 6.81 2.68 3.64 7.94 3.65 0.74 6.38 9.04 Apr 27.88 23.68 6.83 8.65 6.98 2.58 3.77 8.91 3.60 0.72 6.22 9.07 May 28.24 23.93 6.20 7.90 6.83 2.56 3.59 9.30 3.86 0.71 6.23 9.14 Jun 28.26 24.01 10.Q7 11.41 8.10 2.71 3.04 8.99 3.88 0.71 6.27 9.05 Jui 27.99 23.93 9.79 11.36 11.89 2.79 2.98 8.29 3.90 0.72 6.25 8.93 Aug 27.79 23.84 11.41 13.51 10.86 2.84 2.95 7.96 3.90 0.72 6.23 8.92 Sep 27.93 23.84 10.10 11.18 11.01 2.90 3.16 7.96 3.90 0.70 6.32 8.88
§ Data from September 1986 onwards are based on a revised price survey, o Data from October 1986 onwards are based on a revised price survey. # Data from November 1986 onwards are based on a revised price survey,
Hong Kong Monthly Digest of St11tistics October 1991 87
I I
I LJ
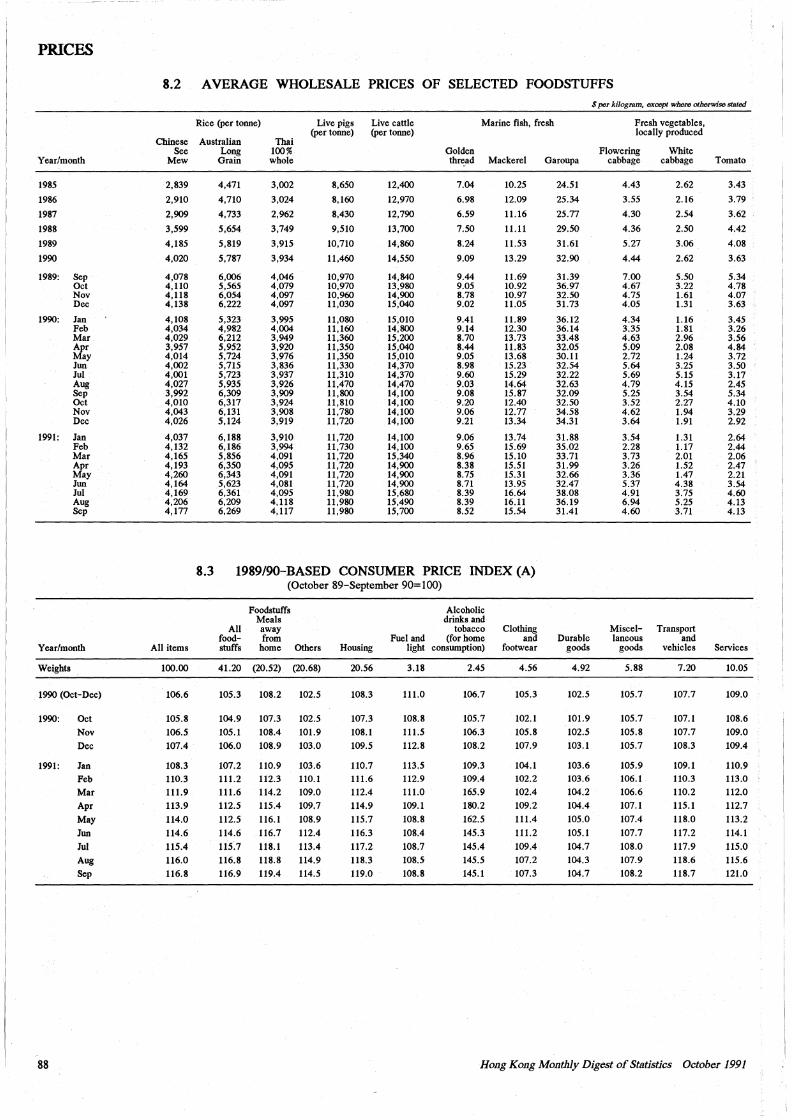
PRICES
Year/month
1985
1986
1987
1988
1989
1990
1989: Sep Oct Nov Dec
1990: Jan Feb Mar Apr May Jun Jui Aug Sep Oct Nov Dec
1991: Jan Feb Mar Apr May Jun Jui Aug Sep
Year/month
Weights
1990 (Oct-Dec)
1990: Oct
Nov
Dec
1991: Jan
88
Feb
Mar
Apr
May
Jun
Jui
Aug
Sep
8.2 AVERAGE WHOLESALE PRICES OF SELECTED FOODSTUFFS
Chinese See
Mew
2,839
2,910
2,909
3,599
4,185
4,020
4,078 4,110 4,118 4,138
4,108 4,034 4,029 3,957 4,014 4,002 4,001 4,027 3,992 4,010 4,043 4,026
4,037 4,132 4,165 4,193 4,260 4,164 4,169 4,206 4,177
All items
100.00
106.6
105.8
106.5
107.4
108.3
110.3
111.9
113.9
114.0
114.6
115.4
116.0
116.8
Live pigs (per tonne)
Live cattle (per tonne)
Marine fish, fresh
Golden
Rice (per tonne)
Australian Long
Grain
Thai 100% whole thread Mackerel Garoupa
4,471
4,710
4,733
5,654
5,819
5,787
6,006 5,565 6,054 6,222
5,323 4,982 6,212 5,952 5,724 5,715 5,723 5,935 6,309 6,317 6,131 5,124
6,188 6,186 5,856 6,350 6,343 5,623 6,361 6,209 6,269
3,002
3,024
2,962
3,749
3,915
3,934
4,046 4,079 4,097 4,097
3,995 4,004 3,949 3,920 3,976 3,836 3,937 3,926 3,909 3,924 3,908 3,919
3,910 3,994 4,091 4,095 4,091 4,081 4,095 4,118 4,117
8,650
8,160
8,430
9,510
10,710
11,460
10,970 10,970 10,960 11,030
11,080 11,160 11,360 11,350 11,350 11,330 11,310 11,470 11,800 11,810 11,780 11,720
11,720 11,730 11,720 11,720 11,720 11,720 11,980 11,980 11,980
12,400
12,970
12,790
13,700
14,860
14,550
14,840 13,980 14,900 15,040
15,010 14,800 15,200 15,040 15,010 14,370 14,370 14,470 14,100 14,100 14,100 14,100
14,100 14,100 15,340 14,900 14,900 14,900 15,680 15,490 15,700
7.04
6.98
6.59
7.50
8.24
9.09
9.44 9.05 8.78 9.02
9.41 9.14 8.70 8.44 9.05 8.98 9.60 9.03 9.08 9.20 9.06 9.21
9.06 9.65 8.96 8.38 8.75 8.71 8.39 8.39 8.52
10.25
12.09
11.16
11.11
11.53
13.29
11.69 10.92 10.97 11.05
11.89 12.30 13.73 11.83 13.68 15.23 15.29 14.64 15.87 12.40 12.77 13.34
13.74 15.69 15.10 15.51 15.31 13.95 16.64 16.11 15.54
8.3 1989/90-BASED CONSUMER PRICE INDEX (A) (October 89-September 90=100)
All foodstuffs
Foodstuffs Meals away from
home Others
41.20 (20.52) (20.68)
105.3 108.2 102.5
104.9 107.3 102.5
105.1 108.4 101.9
106.0 108.9 103.0
107.2 110.9 103.6
111.2 112.3 110.1
111.6 114.2 109.0
112.5 115.4 109. 7
112.5 116.1 108.9
114.6
115.7
116.8
116.9
116.7
118.1
118.8
119.4
112.4
113.4
114.9
114.5
Housing
20.56
108.3
107.3
108.1
109.5
110.7
111.6
112.4
114.9
115.7
116.3
117.2
118.3
119.0
Alcoholic drinks and
tobacco Fuel and (for home
light consumption)
3.18
111.0
108.8
111.5
112.8
113.5
112.9
111.0
109.1
108.8
108.4
108.7
108.5
108.8
2.45
106.7
105.7
106.3
108.2
109.3
109.4
165.9
180.2
162.5
145.3
145.4
145.5
145.1
Clothing and
footwear
4.56
105.3
102.1
105.8
107.9
104.1
102.2
102.4
109.2
111.4
111.2
109.4
107.2
107.3
24.51
25.34
25.77
29.50
31.61
32.90
31.39 36.97 32.50 31.73
36.12 36.14 33.48 32.05 30.11 32.54 32.22 32.63 32.09 32.50 34.58 34.31
31.88 35.02 33.71 31.99 32.66 32.47 38.08 36.19 31.41
Durable goods
4.92
102.5
101.9
102.5
103.1
103.6
103.6
104.2
104.4
105.0
105.1
104.7
104.3
104.7
$per kilogram, except where otherwise stated
Fresh vegetables, locally produced
Flowering cabbage
4.43
3.55
4.30
4.36
5.27
4.44
7.00 4.67 4.75 4.05
4.34 3.35 4.63 5.09 2.72 5.64 5.69 4.79 5.25 3.52 4.62 3.64
3.54 2.28 3.73 3.26 3.36 5.37 4.91 6.94 4.60
Miscellaneous
goods
5.88
105.7
105.7
105.8
105.7
105.9
106.1
106.6
107.1
107.4
107.7
108.0
107.9
108.2
White cabbage
2.62
2.16
2.54
2.50
3.06
2.62
5.50 3.22 1.61 1.31
1.16 1.81 2.96 2.08 1.24 3.25 5.15 4.15 3.54 2.27 1.94 1.91
1.31 1.17 2.01 1.52 1.47 4.38 3.75 5.25 3.71
Transport and
vehicles
7.20
107.7
107.1
107.7
108.3
109.1
110.3
110.2
115.1
118.0
117.2
117.9
118.6
118.7
Tomato
3.43
3.79
3.62
4.42
4.08
3.63
5.34 4.78 4.07 3.63
3.45 3.26 3.56 4.84 3.72 3.50 3.17 2.45 5.34 4.10 3.29 2.92
2.64 2.44 2.06 2.47 2.21 3.54 4.60 4.13 4.13
Services
10.05
109.0
108.6
109.0
109.4
110.9
113.0
112.0
112.7
113.2
114.1
115.0
115.6
121.0
Hong Kong Monthly Digest of Statistics October 1991
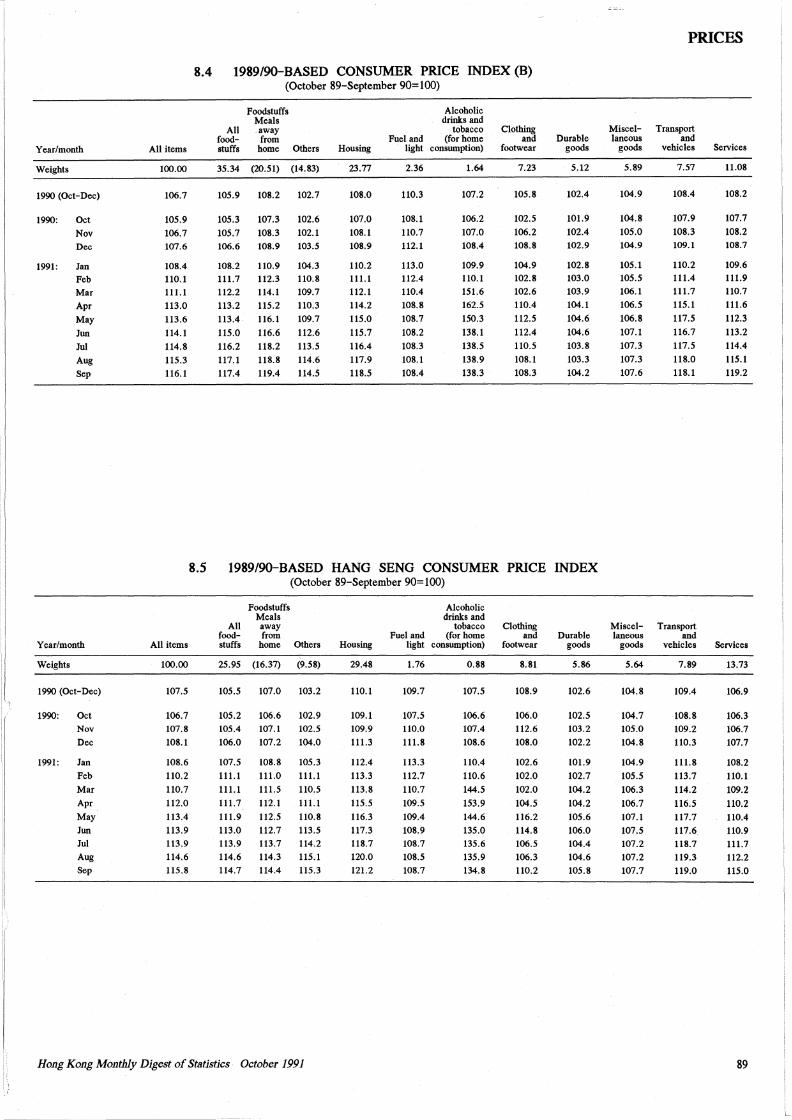
Year/month
Weights
1990 (Oct-Dec)
1990: Oct
Nov
Dec
1991: Jan Feb Mar
Apr
May
Jun
Jui
Aug
Sep
Year/month
Weights
1990 (Oct-Dec)
1990: Oct
Nov
Dec
1991: Jan
Feb
Mar
Apr
May
Jun
Jui
Aug
Sep
All items
100.00
106.7
105.9
106.7
107.6
108.4 110.1
111.1 113.0
113.6
114.1
114.8
115.3
116.l
All items
100.00
107.5
106.7
107.8
108.1
108.6
110.2
110.7
112.0
113.4
113.9 113.9
114.6
115.8
8.4 1989/90-BASED CONSUMER PRICE INDEX (B) (October 89-September 90=100)
All foodstuffs
Foodstuffs Meals .away
from home Others
35.34 (20.51) (14.83)
105.9 108.2 102.7
105.3 107.3 102.6
105.7 108.3 102.1
106.6 108. 9 103.5
108.2 111.7 112.2
113.2
110.9 112.3
114.1
115.2
104.3 110.8 109.7
110.3
113.4 116.1 109. 7
115.0 116.6 112.6
116.2 118.2 113.5
117.1 118.8 114.6
117.4 119.4 114.5
Housing
23.77
108.0
107.0
108.l
108.9
110.2 111.1 112.l
114.2
115.0
115.7
116.4
117.9
118.5
Alcoholic drinks and
tobacco Fuel and (for home
light consumption)
2.36
110.3
108.l
110.7
112.1
113.0 112.4 110.4
108.8
108.7
108.2
108.3
108.1
108.4
1.64
107.2
106.2
107.0
108.4
109.9 110.l 151.6
162.5
150.3
138.l
138.5
138.9
138.3
Clothing and
footwear
7.23
105.8
102.5
106.2 108.8
104.9 102.8
102.6
110.4
112.5
112.4
110.5
108.l
108.3
Durable goods
5.12
102.4
101.9
102.4
102.9
102.8 103.0 103.9
104.1
104.6
104.6
103.8
103.3
104.2
8.5 1989/90-BASED HANG SENG CONSUMER PRICE INDEX (October 89-September 90=100)
Foodstuffs Meals away from
All foodstuffs home Others
25. 95 (16.37) (9.58)
105.5 107.0 103.2
105.2 106.6 102.9
105.4 107.1 102.5
106.0 107.2 104.0
107.5
111.1
108.8 105.3
111.0 111.1
111.1 111.5
111.7 112.1
111.9 112.5
113.0 112.7 113.9 113.7
114.6 114.3
114.7 114.4
110.5
111.1
110.8
113.5 114.2
115.l
115.3
Housing
29.48
110.l
109.l
109.9
111.3
112.4
113.3
113.8
115.5
116.3 117.3
118.7
120.0
121.2
Alcoholic drinks and
tobacco Fuel and (for home
light consumption)
1.76
109.7
107.5
110.0
111.8
113.3
112.7
110.7
109.5
109.4
108.9 108.7
108.5
108.7
0.88
107.5
106.6
107.4
108.6
110.4
110.6
144.5
153.9
144.6
135.0
135.6 135.9
134.8
Clothing and
footwear
8.81
108.9
106.0
112.6
108.0
102.6
102.0
102.0
104.5
116.2
114.8
106.5 106.3
110.2
Durable goods
5.86
102.6
102.5
103.2
102.2
101.9
102.7
104.2
104.2
105.6
106.0
104.4
104.6
105.8
Hong Kong Monthly Digest of St11tistics October 1991
Miscellaneous
goods
5.89
104.9
104.8
105.0
104.9
105.l 105.5 106.1
106.5
106.8
107.1
107.3
107.3
107.6
Miscellaneous
goods
5.64
104.8
104.7
105.0
104.8
104.9
105.5
106.3
106.7
107.1
107.5
107.2
107.2
107.7
PRICES
Transport and
vehicles
7.57
108.4
107.9
108.3 109.1
110.2
111.4 111.7
115.l
117.5
116.7
117.5
118.0
118.l
Transport and
vehicles
7.89
109.4
108.8 109.2
110.3
111.8
113.7
114.2
116.5
117.7
117.6 118.7
119.3
119.0
Services
11.08
108.2
107.7
108.2 108.7
109.6 111.9
110.7
111.6
112.3
113.2
114.4
115.1
119.2
Services
106.9
106.3
106.7
107.7
108.2
110.l
109.2
110.2
110.4
110.9
111.7
112.2
115.0
89
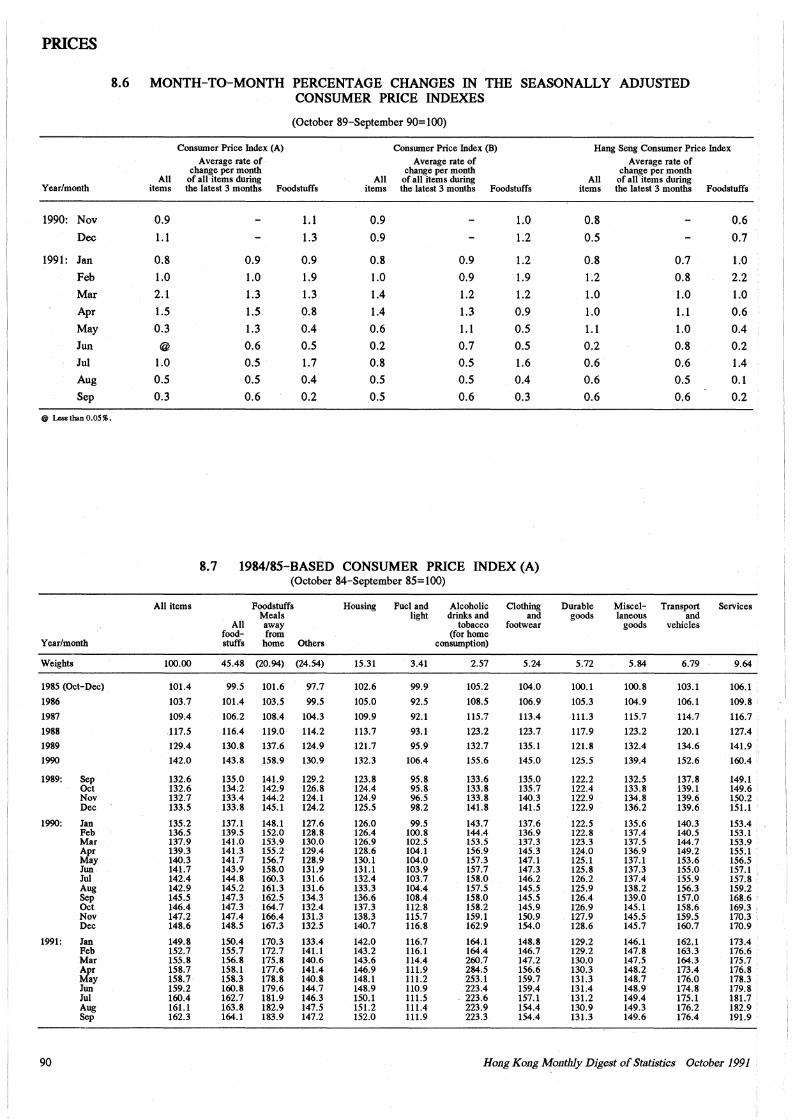
PRICES
8.6 MONTH-TO-MONTH PERCENTAGE CHANGES IN THE SEASONALLY ADJUSTED CONSUMER PRICE INDEXES
(October 89-September 90=100)
Conswner Price Index (A) Conswner Price Index (B) Hang Seng Conswner Price Index Average rate of Average rate of Average rate of
change per month change per month change per month All of all items during All of all items during All of all items during
Year/month items the latest 3 months Foodstuffs items the latest 3 months Foodstuffs items the latest 3 months Foodstuffs
1990: Nov 0.9 1.1 0.9 1.0 0.8 0.6
Dec 1.1 1.3 0.9 1.2 0.5 0.7
1991: Jan 0.8 0.9 0.9 0.8 0.9 1.2 0.8 0.7 1.0
Feb 1.0 1.0 1.9 1.0 0.9 1.9 1.2 0.8 2.2
Mar 2.1 1.3 1.3 1.4 1.2 1.2 1.0 1.0 1.0
Apr 1.5 1.5 0.8 1.4 1.3 0.9 1.0 1.1 0.6
May 0.3 1.3 0.4 0.6 1.1 0.5 1.1 1.0 0.4
Jun @ 0.6 0.5 0.2 0.7 0.5 0.2 0.8 0.2
Jul 1.0 0.5 1.7 0.8 0.5 1.6 0.6 0.6 1.4 Aug 0.5 0.5 0.4 0.5 0.5 0.4 0.6 0.5 0.1
Sep 0.3 0.6 0.2 0.5 0.6 0.3 0.6 0.6 0.2
® Les• than O.OS % •
8.7 1984/85-BASED CONSUMER PRICE INDEX (A) (October 84-September 85=100)
All items Foodstuffs Housing Fuel and Alcoholic Clothing Durable Miscel- Transport Services Meals light drinks and and goods laneous and
All away tobacco footwear goods vehicles food- from (for home
Year/month stuffs home Others conswnption)
Weights 100.00 45.48 (20.94) (24.54) 15.31 3.41 2.57 5.24 5.72 5.84 6.79 9.64
1985 (Oct-Dec) 101.4 99.5 101.6 97 .. 7 102.6 99.9 105.2 104.0 100.1 100.8 103.1 106.1
1986 103.7 101.4 103.5 99.5 105.0 92.5 108.5 106.9 105.3 104.9 106.1 109.8
1987 109.4 106.2 108.4 104.3 109.9 92.1 115.7 113.4 111.3 115.7 114.7 116.7
1988 117.5 116.4 119.0 114.2 113.7 93.1 123.2 123.7 117.9 123.2 120.1 127.4
1989 129.4 130.8 137.6 124.9 121.7 95.9 132.7 135.l 121.8 132.4 134.6 141.9
1990 142.0 143.8 158.9 130.9 132.3 106.4 155.6 145.0 125.5 139.4 152.6 160.4
1989: Sep 132.6 135.0 141.9 129.2 123.8 95.8 133.6 135.0 122.2 132.5 137.8 149.1 Oct 132.6 134.2 142.9 126.8 124.4 95.8 133.8 135.7 122.4 133.8 139.1 149.6 Nov 132.7 133.4 144.2 124.1 124.9 96.5 133.8 140.3 122.9 134.8 139.6 150.2 Dec 133.5 133.8 145.1 124.2 125.5 98.2 141.8 141.5 122.9 136.2 139.6 151.1
1990: Jan 135.2 137.l 148.1 127.6 126.0 99.5 143.7 137.6 122.5 135.6 140.3 153.4 Feb 136.5 139.5 152.0 128.8 126.4 100.8 144.4 136.9 122.8 137.4 140.5 153.1 Mar 137.9 14LO 153.9 130.0 126.9 102.5 153.5 137.3 123.3 137.5 144.7 153.9 Apr 139.3 141.3 155.2 129.4 128.6 104.1 156.9 145.3 124.0 136.9 149.2 155.1 May 140.3 141.7 156.7 128.9 130.1 104.0 157.3 147.1 125.l 137.1 153.6 156.5 Jun 141.7 143.9 158.0 131.9 131.1 103.9 157.7 147.3 125.8 137.3 155.0 157.1 Jui 142.4 144.8 160.3 131.6 132.4 103.7 158.0 146.2 126.2 137.4 155.9 157.8 Aug 142.9 145.2 161.3 131.6 133.3 104.4 157.5 145.5 125.9 138.2 156.3 159.2 Sep 145.5 147.3 162.5 134.3 136.6 108.4 158.0 145.5 126.4 139.0 157.0 168.6 Oct 146.4 147.3 164.7 132.4 137.3 112.8 158.2 145.9 126.9 145.1 158.6 169.3 Nov 147.2 147.4 166.4 131.3 138.3 115.7 159.l 150.9 127.9 145.5 159.5 170.3 Dec 148.6 148.5 167.3 132.5 140.7 116.8 162.9 154.0 128.6 145.7 160.7 170.9
1991: Jan 149.8 150.4 170.3 133.4 142.0 116.7 164.1 148.8 129.2 146.1 162.l 173.4 Feb 152.7 155.7 172.7 141.1 143.2 116.l 164.4 146.7 129.2 147.8 163.3 176.6 Mar 155.8 156.8 175.8 140.6 143.6 114.4 260.7 147.2 130.0 147.5 164.3 175.7 Apr 158.7 158.l 177.6 141.4 146.9 111.9 284.5 156.6 130.3 148.2 173.4 176.8 May 158.7 158.3 178.8 140.8 148.1 111.2 253.l 159.7 131.3 148.7 176.0 178.3 Jun 159.2 160.8 179.6 144.7 148.9 110.9 223.4 159.4 131.4 148.9 174.8 179.8 Jui 160.4 162.7 181.9 146.3 150.1 111.5 223.6 157.l 131.2 149.4 175.1 181.7 Aug 161.1 163.8 182.9 147.5 151.2 111.4 223.9 154.4 130.9 149.3 176.2 182.9 Sep 162.3 164.l 183.9 147.2 152.0 111.9 223.3 154.4 131.3 149.6 176.4 191.9
90 Hong Kong Monthly Digest of StJJtistics October 1991
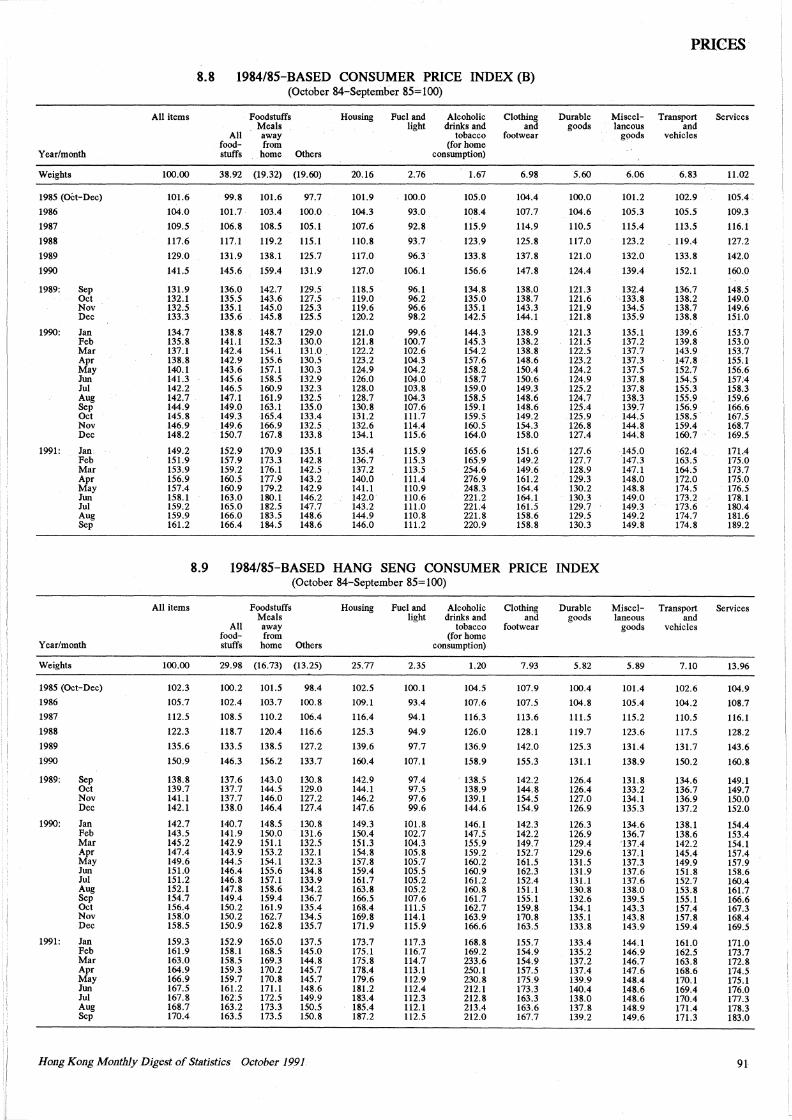
Year/month
Weights
1985 (OCt-Dec)
1986
1987
1988
1989
1990
1989:
1990:
1991:
Sep Oct Nov Dec
Jan Feb Mar Apr May Jun Jui Aug Sep Oct Nov Dec
Jan Feb Mar Apr May Jun Jui Aug Sep
Year/month
Weights
1985 (Oct-Dec)
1986
1987
1988
1989
1990
1989:
1990:
1991:
Sep Oct Nov Dec
Jan Feb Mar Apr May Jun Jui Aug Sep Oct Nov Dec
Jan Feb Mar Apr May Jun Jui Aug Sep
All items
100.00
101.6
104.0
109.5
117.6
129.0
141.5
131.9 132.1 132.5 133.3
134.7 135.8 137.1 138.8 140.l 141.3 142.2 142.7 144.9 145.8 146.9 148.2
149.2 151.9 153.9 156.9 157.4 158.1 159.2 159.9 161.2
All items
100.00
102.3
105.7
112.5
122.3
135.6
150.9
138.8 139.7 141.1 142.1
142.7 143.5 145.2 147.4 149.6 151.0 151.2 152.1 154.7 156.4 158.0 158.5
159.3 161.9 163.0 164.9 166.9 167.5 167.8 168.7 170.4
8.8 1984/85-BASED CONSUMER PRICE INDEX (B) (October 84-September 85=100)
All foodstuffs
Foodstuffs Meals away from
home Others
38.92 (19.32) (19.60)
99.8
101.7
106.8
117.1
131.9
145.6
136.0 135.5 135.1 135 .. 6
138.8 141.1 142.4 142.9 143.6 145.6 146.5 147.1 149.0 149.3 149.6 150.7
152.9 157.9 159.2 160.5 160.9 163.0 165.0 166.0 166.4
101.6
103.4
108.5
119.2
138.l
159.4
142.7 143.6 145.0 145.8
148.7 152.3 154.1 155.6 157.1 158.5 160.9 161.9 163.1 165.4 166.9 167.8
170.9 173.3 176.1 177.9 179.2 180.1 182.5 183.5 184.5
97.7
100.0
105.1
115.1
125.7
131.9
129.5 127.5 125.3 125.5
129.0 130.0 131.0 130.5 130.3 132.9 132.3 132.5 135.0 133.4 132.5 133.8
135.l 142.8 142.5 143.2 142.9 146.2 147.7 148.6 148.6
Housing
20.16
101.9
104.3
107.6
110.8
117.0
127.0
118.5 119.0 119.6 120.2
121.0 121.8 122.2 123.2 124.9 126.0 128.0 128.7 130.8 131.2 132.6 134.1
135.4 136.7 137.2 140.0 141.1 142.0 143.2 144.9 146.0
Fuel and Alcoholic light drinks and
2.76
100.0
93.0
92.8
93.7
96.3
106.1
96.1 96.2 96.6 98.2
99.6 100.7 102.6 104.3 104.2 104.0 103.8 104.3 107.6 111.7 114.4 115.6
115.9 115.3 113.5 111.4 110.9 110.6 111.0 110.8 111.2
tobacco (for home
consumption)
1.67
105.0
108.4
115.9
123.9
133.8
156.6
134.8 135.0 135.1 142.5
144.3 145.3 154.2 157.6 158.2 158.7 159.0 158.5 159.1 159.5 160.5 164.0
165.6 165.9 254.6 276.9 248.3 221.2 221.4 221.8 220.9
Clothing and
footwear
6.98
104.4
107.7
114.9
125.8
137.8
147.8
138.0 138.7 143.3 144.1
138.9 138.2 138.8 148.6 150.4 150.6 149.3 148.6 148.6 149.2 154.3 158.0
151.6 149.2 149.6 161.2 164.4 164.1 161.5 158.6 158.8
Durable goods
5.60
100.0
104.6
110.5
117.0
121.0
124.4
121.3 121.6 121.9 121.8
121.3 121.5 122.5 123.2 124.2 124.9 125.2 124.7 125.4 125.9 126.8 127.4
127.6 127.7 128.9 129.3 130.2 130.3 129.7 129.5 130.3
8.9 1984/85-BASED HANG SENG CONSUMER PRICE INDEX (October 84-September 85=100)
All foodstuffs
Foodstuffs Meals away from
home Others
29.98 (16.73) (13.25)
100.2
102.4
108.5
118.7
133.5
146.3
137.6 137.7 137.7 138.0
140.7 141.9 142.9 143.9 144.5 146.4 146.8 147.8 149.4 150.2 150.2 150.9
152.9 158.1 158.5 159.3 159.7 161.2 162:5 163.2 163.5
101.5
103.7
110.2
120.4
138.5
156.2
143.0 144.5 146.0 146.4
148.5 150.0 151.1 153.2 154.1 155.6 157.l 158.6 159.4 161.9 162.7 162.8
165.0 168.5 169.3 170.2 170.8 171.1 172.5 173.3 173.5
98.4
100.8
106.4
116.6
127.2
133.7
130.8 129.0 127.2 127.4
130.8 131.6 132.5 132.1 132.3 134.8 133.9 134.2 136.7 135.4 134.5 135.7
137.5 145.0 144.8 145.7 145.7 148.6 149.9 150.5 150.8
Housing
25.77
102.5
109.1
116.4
125.3
139.6
160.4
142.9 144.1 146.2 147.6
149.3 150.4 151.3 154.8 157.8 159.4 161.7 163.8 166.5 168.4 169.8 171.9
173.7 175.1 175.8 178.4 179.6 181.2 183.4 185.4 187.2
Fuel and Alcoholic light drinks and
2.35
100.1
93.4
94.l
94.9
97.7
107.1
97.4 97.5 97.6 99.6
101.8 102.7 104.3 105.8 105.7 105.5 105.2 105.2 107.6 111.5 114.1 115.9
117.3 116.7 114.7 113.1 112.9 112.4 112.3 112. l 112.5
tobacco (for home
consumption)
1.20
104.5
107.6
116.3
126.0
136.9
158.9
138.5 138.9 139.1 144.6
146.1 147.5 155.9 159.2 160.2 160.9 161.2 160.8 161.7 162.7 163.9 166.6
168.8 169.2 233.6 250.1 230.8 212.1 212.8 213.4 212.0
Clothing and
footwear
7.93
107.9
107.5
113.6
128.l
142.0
155.3
142.2 144.8 154.5 154.9
142.3 142.2 149.7 152.7 161.5 162.3 152.4 151.1 155.1 159.8 170.8 163.5
155.7 154.9 154.9 157.5 175.9 173.3 163.3 163.6 167.7
Durable goods
5.82
100.4
104.8
111.5
119.7
125.3
131.1
126.4 126.4 127.0 126.9
126.3 126.9 129.4 129.6 131.5 131.9 131.1 130.8 132.6 134.1 135.1 133.8
133.4 135.2 137.2 137.4 139.9 140.4 138.0 137.8 139.2
Hong Kong Monthly Digest of Statistics October 1991
Miscellaneous
g!)ods
6.06
101.2
105.3
115.4
123.2
132.0
139.4
132.4 133.8 134.5 135.9
135.1 137.2 137.7 137.3 137.5 137.8 137.8 138.3 139.7 144.5 144.8 144.8
145.0 147.3 147.l 148.0 148.8 149.0 149.3 149.2 149.8
Miscellaneous
goods
5.89
101.4
105.4
115.2
123.6
131.4
138.9
131.8 133.2 134.1 135.3
134.6 136.7 '137.4 137.1 137.3 137.6 137.6 138.0 139.5 143.3 143.8 143.9
144.1 146.9 146.7 147.6 148.4 148.6 148.6 148.9 149.6
PRICES
Transport and
vehicles
6.83
102.9
105.5
113.5
119.4
133.8
152.1
136.7 138.2 138.7 138.8
139.6 139.8 143.9 147.8 152.7 154.5 155.3 155.9 156.9 158.5 159.4 160.7
162.4 163.5 164.5 172.0 174.5 173.2 173.6 174.7 174.8
Transport and
vehicles
7.10
102.6
104.2
110.5
117.5
131.7
150.2
134.6 136.7 136.9 137.2
138.1 138.6 142.2 145.4 149.9 151.8 152.7 153.8 155.1 157.4 157.8 159.4
161.0 162.5 163.8 168.6 170.1 169.4 170.4 171.4 171.3
Services
11.02
105.4
109.3
116.1
127.2
142.0
160.0
148.5 149;0 149.6 151.0
153.7 153.0 153.7 155.1 156.6 157.4 158.3 159.6 166.6 167.5 168.7 169.5
171.4 175.0 173.7 175.0 176.5 178.1 180.4 181.6 189.2
Services
13.96
104.9
108.7
116.1
128.2
143.6
160.8
149.1 149.7 150.0 152.0
154.4 153.4 154.1 157.4 157.9 158.6 160.4 161.7 166.6 167.3 168.4 169.5
171.0 173.7 172.8 174.5 175.1 176.0 177.3 178.3 183.0
91
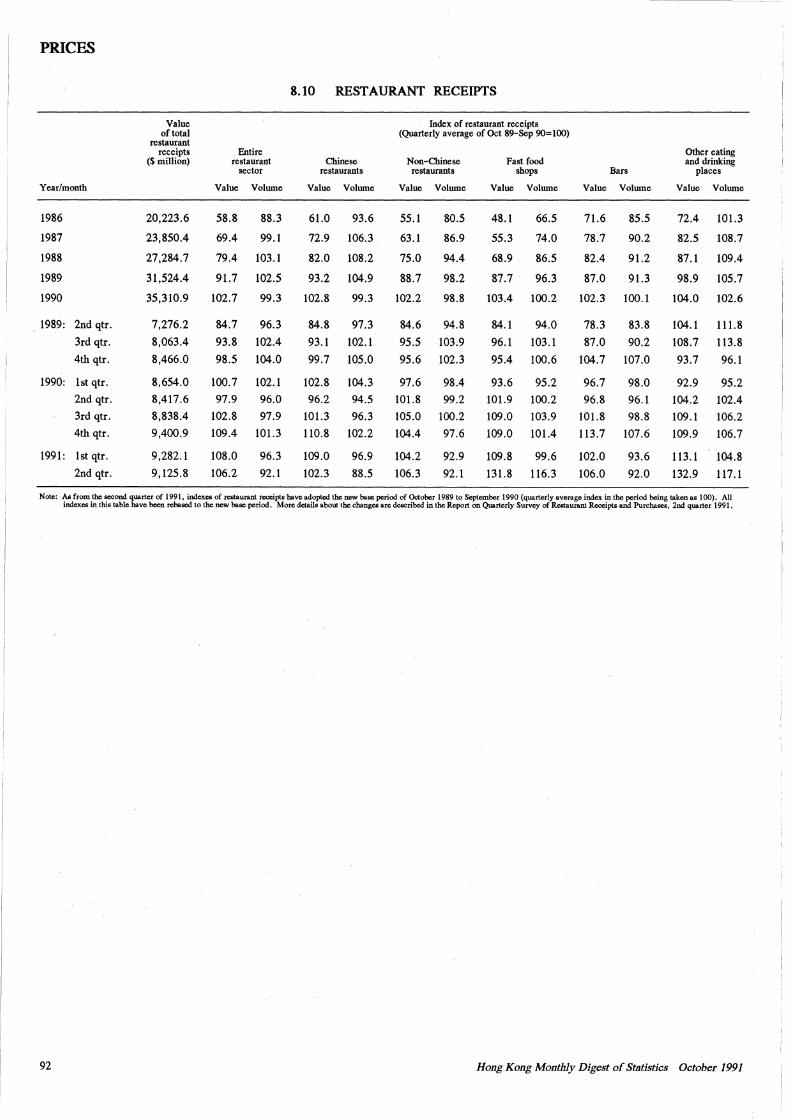
PRICES
8.10 RESTAURANT RECEIPTS
Value Index of restaurant receipts of total (Quarterly average of Oct 89-Sep 90=100)
restaurant receipts Entire Other eating
($million) restaurant Chinese Non-Chinese Fast food and drinking sector restaurants restaurants shops Bars places
Year/month Value Volume Value Volume Value Volume Value Volume Value Volume Value Volume
1986 20,223.6 58.8 88.3 61.0 93.6 55.1 80.5 48.1 66.5 71.6 85.5 72.4 101.3
1987 23,850.4 69.4 99.1 72.9 106.3 63.1 86.9 55.3 74.0 78.7 90.2 82.5 108.7
1988 27,284.7 79.4 103.1 82.0 108.2 75.0 94.4 68.9 86.5 82.4 91.2 87.1 109.4
1989 31,524.4 91.7 102.5 93.2 104.9 88.7 98.2 87.7 96.3 87.0 91.3 98.9 105.7
1990 35,310.9 102.7 99.3 102.8 99.3 102.2 98.8 103.4 100.2 102.3 100.1 104.0 102.6
1989: 2nd qtr. 7,276.2 84.7 96.3 84.8 97.3 84.6 94.8 84.1 94.0 78.3 83.8 104.1 111.8
3rd qtr. 8,063.4 93.8 102.4 93.1 102.1 95.5 103.9 96.1 103.1 87.0 90.2 108.7 113.8 4th qtr. 8,466.0 98.5 104.0 99.7 105.0 95.6 102.3 95.4 100.6 104.7 107.0 93.7 96.1
1990: lst qtr. 8,654.0 100.7 102. l 102.8 104.3 97.6 98.4 93.6 95.2 96.7 98.0 92.9 95.2 2nd qtr. 8,417.6 97.9 96.0 96.2 94.5 101.8 99.2 101.9 100.2 96.8 96.l 104.2 102.4 3rd qtr. 8,838.4 102.8 97.9 101.3 96.3 105.0 100.2 109.0 103.9 101.8 98.8 109.1 106.2 4th qtr. 9,400.9 109.4 101.3 110.8 102.2 104.4 97.6 109.0 101.4 113.7 107.6 109.9 106.7
1991: lst qtr. 9,282.1 108.0 96.3 109.0 96.9 104.2 92.9 109.8 99.6 102.0 93.6 113.1 104.8 2nd qtr. 9, 125.8 106.2 92.1 102.3 88.5 106.3 92.1 131.8 116.3 106.0 92.0 132.9 117.1
Note: As from the second quarter of 1991. indexes of restaurant receipts have adopted the new base period of October 1989 to September 1990 (quarterly average index in the period being taken as 100). All indexes in this table have been rebased to the new base period. More details about the changes are described in the Report on Quarterly Survey of Restaurant Receipts and Purchases. 2nd quarter 1991.
92 Hong Kong Monthly Digest of Statistics October 1991
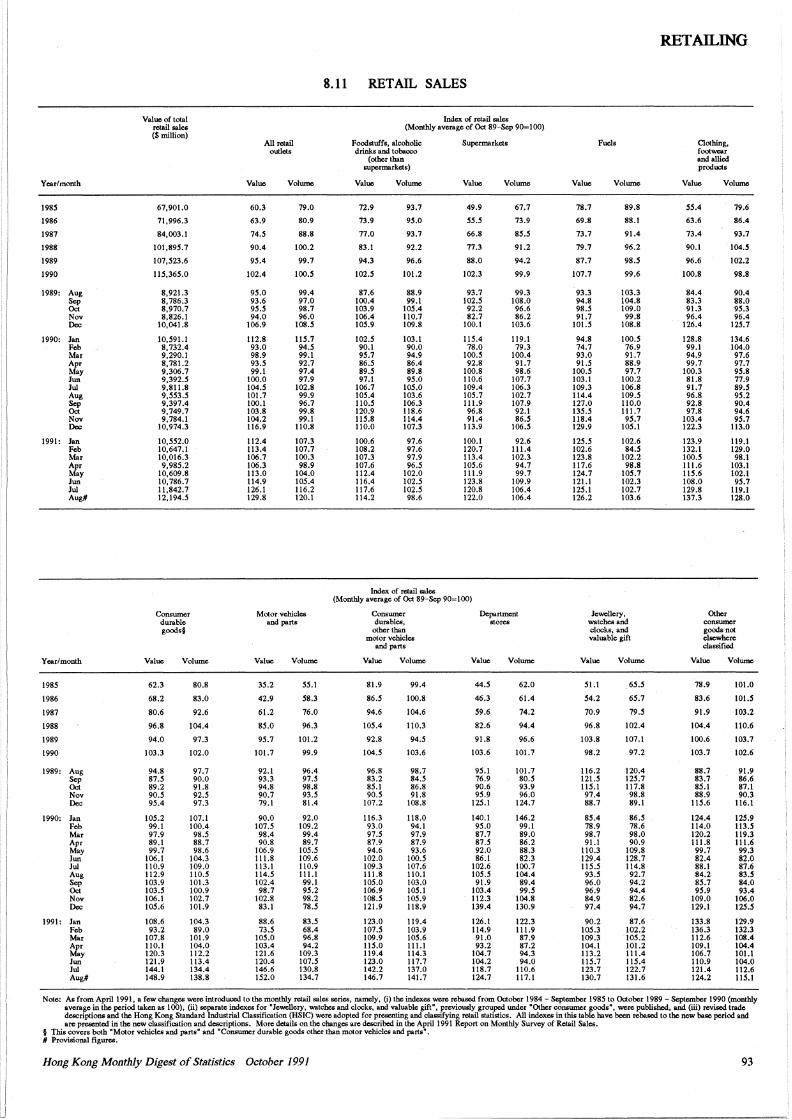
Year/month
1985
1986
1987
1988
1989
1990
1989: Aug Sep Oct Nov Dec
1990: Jan Feb Mar Apr May Jun Jui Aug Sep Oct Nov Dec
1991: Jan Feb Mar Apr May Jun Jui Aug#
Year/month
1985
1986
1987
1988
1989
1990
1989: Aug Sep Oct Nov Dec
1990: Jan Feb Mar Apr May Jun Jui Aug Sep Oct Nov Dec
1991: Jan Feb Mar Apr May Jun Jui Aug#
Value of total retail sales ($million)
67,901.0
71,996.3
84,003.1
101,895.7
107,523.6
115,365.0
8,921.3 8, 786.3 8,970.7 8,826.1
10,041.8
10,591.1 8, 732.4 9,290.1 8, 781.2 9,306.7 9,392.5 9,811.8 9,553.S 9,397.4 9,749.7 9,784.l
10,974.3
10,552.0 10,647.1 10,016.3 9,985.2
10,609.8 10, 786.7 11,842.7 12,194.5
Consumer durable goods§
Value
62.3
68.2
80.6
96.8
94.0
103.3
94.8 87.5 89.2 90.S 95.4
IOS.2 99.1 97.9 89.1 99.7
106.1 110.9 112.9 103.9 103.5 106.1 105.6
108.6 93.2
107.8 110.1 120.3 121.9 144.l 148.9
Volume
80.8
83.0
92.6
104.4
97.3
102.0
97.7 90.0 91.8 92.S 97.3
107.1 100.4 98.S 88.7 98.6
104.3 109.0 110.S 101.3 100.9 102.7 101.9
104.3 89.0
101.9 104.0 112.2 113.4 134.4 138.8
All retail outlets
Value
60.3
63.9
74.5
90.4
95.4
102.4
95.0 93.6 95.5 94.0
106.9
112.8 93.0 98.9 93.5 99.1
100.0 104.S 101.7 100.1 103.8 104.2 116.9
112.4 113.4 106.7 106.3 113.0 114.9 126.1 129.8
Volume
79.0
80.9
88.8
100.2
99.7
100.5
99.4 97.0 98.7 96.0
108.5
115.1 94.5 99.l 92.7 97.4 97.9
102.8 99.9 96.7 99.8 99.1
110.8
107.3 107.7 100.3 98.9
104.0 105.4 116.2 120.1
Motor vehicles and parts
Value
3S.2
42.9
61.2
8S.O
9S.1
101.7
92.1 93.3 94.8 90.7 79.1
90.0 107.S 98.4 90.8
106.9 111.8 113.l 114.5 102.4 98.7
102.8 83.1
88.6 73.S
105.0 103.4 121.6 120.4 146.6 152.0
Volume
SS.I
S8.3
76.0
96.3
101.2
99.9
96.4 97.5 98.8 93.S 81.4
92.0 109.2 99.4 89.7
105.S 109.6 110.9 11 I.I 99.1 95.2 98.2 78.S
83.5 68.4 96.8 94.2
109.3 101.S 130.8 134.7
8.11 RETAIL SALES
Index of retail sales (Monthly average of Oct 89-Sep 90=100)
Foodstuffs, alcoholic drinks and tobacco
(other than supermarkets)
Value
72.9
73.9
77.0
83.1
94.3
102.5
87.6 100.4 103.9 106.4 105.9
102.5 90.1 95.1 86.S 89.5 97.1
106.7 105.4 110.5 120.9 115.8 110.0
100.6 108.2 107.3 107.6 112.4 116.4 117.6 114.2
Volume
93.7
95.0
93.7
92.2
96.6
101.2
88.9 99.1
105.4 110.7 109.8
103.1 90.0 94.9 86.4 89.8 95.0
105.0 103.6 106.3 118.6 114.4 107.3
97.6 97.6 97.9 96.5
102.0 102.5 102.5 98.6
Index of retail sales
Supermarkets
Value
49.9
55.5
66.8
77.3
88.0
102.3
93.7 102.5 92.2 82.7
100.1
115.4 78.0
100.5 92.8
100.8 110.6 109.4 105.7 II t.9 96.8 91.4
113.9
100.1 120.7 113.4 105.6 111.9 123.8 120.8 122.0
Volume
67.7
73.9
85.5
91.2
94.2
99.9
99.3 108.0 96.6 86.2
103.6
119.1 79.3
100.4 91.7 98.6
107.7 106.3 102.7 107.9 92.1 86.5
106.5
92.6 111.4 102.3 94.7 99.7
109.9 106.4 106.4
{Monthly average of Oct 89-Sep 90=100)
Consumer durables,
other than motor vehicles
and parts
Value
81.9
86.5
94.6
IOS.4
92.8
104.S
96.8 83.2 8S.t 90.S
107.2
116.3 93.0 91.S 87.9 94.6
102.0 109.3 111.8 105.0 106.9 108.S 121.9
123.0 107.5 109.9 115.0 119.4 123.0 142.2 146.7
Volume
99.4
100.8
104.6
110.3
94.5
103.6
98.7 84.5 86.8 91.8
108.8
118.0 94.l 97.9 87.9 93.6
100.S 107.6 110.I 103.0 !OS.I 105.9 118.9
119.4 103.9 105.6 111.1 114.3 117.7 137.0 141.7
Department stores
Value
44.S
46.3
59.6
82.6
91.8
103.6
95.t 76.9 90.6 95.9
125.1
140.1 95.0 87.7 87.S 92.0 86.t
102.6 105.5 91.9
103.4 112.3 139.4
126.1 114.9 91.0 93.2
104.7 104.2 118.7 124.7
Volume
62.0
61.4
74.2
94.4
96.6
101.7
101.7 80.5 93.9 96.0
124.7
146.2 99.1 89.0 86.2 88.3 82.3
100.7 104.4 89.4 99.S
104.8 130.9
122.3 111.9 87.9 87.2 94.3 94.0
110.6 117.1
Fuels
Value
78.7
69.8
73.7
79.7
87.7
107.7
93.3 94.8 98.5 91.7
101.5
94.8 74.7 93.0 91.5
100.5 103.1 109.3 114.4 127.0 135.5 118.4 129.9
125.5 102.6 123.8 117.6 124.7 121.1 125.t 126.2
Volume
89.8
88.1
91.4
96.2
98.5
99.6
103.3 104.8 109.0 99.8
108.8
100.5 76.9 91.7 88.9 97.7
100.2 106.8 109.5 110.0 II t.7 95.7
105.1
102.6 84.5
102.2 98.8
105.7 102.3 102.7 103.6
Jewellery, watches and clocks, and valuable gilt
Value
51.l
S4.2
70.9
96.8
103.8
98.2
116.2 121.5 115.1 97.4 88.7
85.4 78.9 98.7 91.1
110.3 129.4 1 lS.5 93.S 96.0 96.9 84.9 97.4
90.2 105.3 109.3 104.1 113.2 llS.1 123.7 130.7
Volume
6S.S
6S.1
19.S
102.4
107.1
97.2
120.4 12S.7 117.8 98.8 89.1
86.S 78.6 98.0 90.9
109.8 128.7 114.8 92.7 94.2 94.4 82.6 94.7
87.6 102.2 105.2 101.2 111.4 ttS.4 122.7 131.6
RETAILING
Clothing, footwear and allied products
Value Volume
55.4
63.6
73.4
90.1
96.6
100.8
84.4 83.3 91.3 96.4
126.4
128.8 99.1 94.9 99.7
100.3 81.8 91.7 96.8 92.8 97.8
103.4 122.3
123.9 132.1 100.5 111.6 115.6 108.0 129.8 137.3
79.6
86.4
93.7
104.5
102.2
98.8
90.4 88.0 95.3 96.4
125.7
134.6 104.0 97.6 97.7 95.8 77.9 89.5 95.2 90.4 94.6 95.7
113.0
119.1 129.0 98.1
103.1 102.1 95.7
119.1 128.0
Other COllS\llJlef good.snot eloewhere classified
Value
78.9
83.6
91.9
104.4
100.6
103.7
88.7 83.7 8S.t 88.9
115.6
124.4 114.0 120.2 111.8 99.7 82.4 88.1 84.2 85.7 9S.9
109.0 129.1
133.8 136.3 112.6 109.1 106.7 110.9 121.4 124.2
Volume
101.0
101.5
103.2
110.6
103.7
102.6
91.9 86.6 87.1 90.3
116.1
12S.9 113.S 119.3 111.6 99.3 82.0 87.6 83.S 84.0 93.4
106.0 125.5
129.9 132.3 108.4 104.4 101.1 104.0 112.6 115.1
Note: As from April 1991, a few changes were introduced to the monthly retail sales series, namely, (i) the indexes were rebased from October 1984 - September l 98S to October 1989 - September 1990 (monthly average in the period taken as I 00), (ii) separate indexes for "Jewellery, watches and clocks, and valuable gift", previously grouped under "Other consumer goods", were published, and (iii) revised trade descriptions and the Hong Kong Standard Industrial Classification (HSIC) were adopted for preoenting and classifying retail statistics. AJt indexes in this table have been rebased to the new base period and are presented in the new classification and descriptions. More details on the changes are described in the April 1991 Report on Monthly Survey of Retail Sales.
§ This covers both "Motor vehicles and parts" and *Consumer durable goods other than motor vehicles and parts". # Provisional figures.
Hong Kong Monthly Digest of Statistics October 1991 93
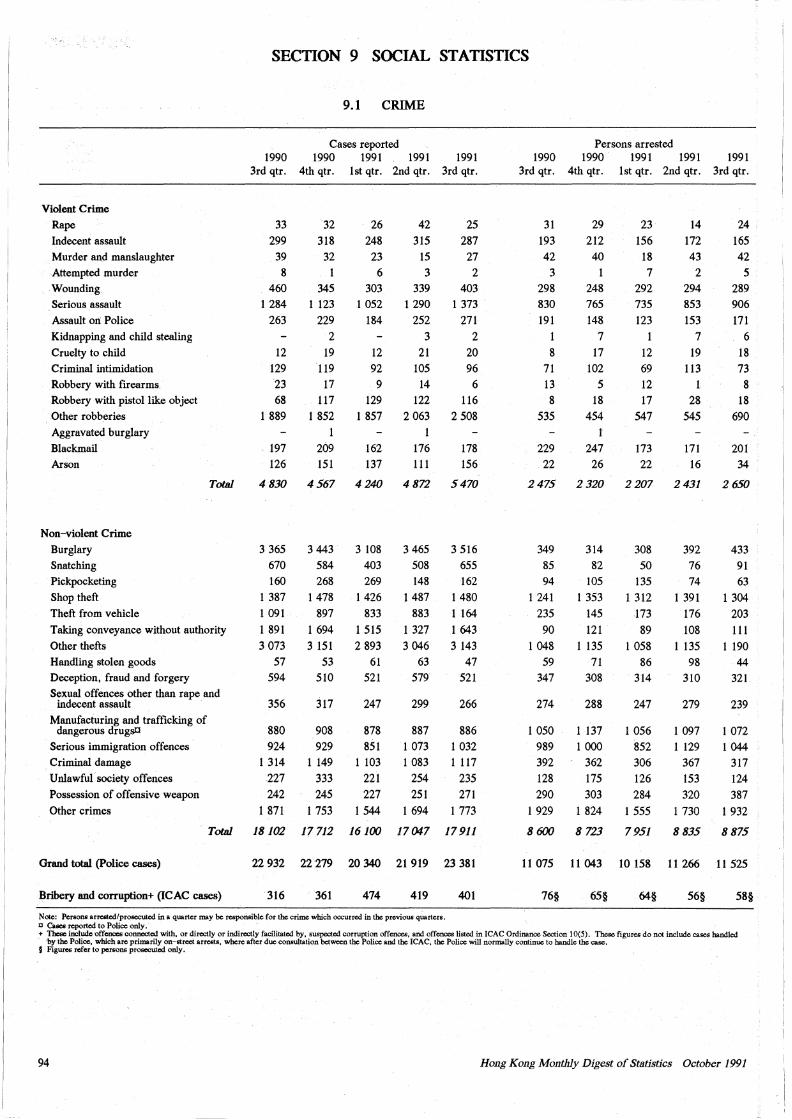
SECTION 9 SOCIAL STATISTICS
Violent Crime
Rape
Indecent assault
Murder an.d manslaughter
.AtteIIlpted IIlurder
Wounding
Serious assault
Assault on Police
Kidnapping and child stealing
Cruelty to child
C rilllinal intilllidation
Robbery with firearIIls
Robbery with pistol like object
Other robberies
Aggravated burglary
Blackm.ail
Arson
Non-violent Crime
Burglary
Snatching
Pickpocketing
Shop theft
Theft froIIl vehicle
Total
Taking conveyance without authority
Other thefts
Handling stolen goods
Deception, fraud and forgery
Sexual offences other than rape and indecent assault
Manufacturing and trafficking of dangerous drugsC
Serious iIIlIIligration offences
C rilllinal daIIlage
Unlawful society offences
Possession of offensive weapon
Other crillles
Grand total (Police cases)
Total
Bribery and corruption+ (ICAC cases)
9.1 CRIME
Cases reported 1990 1990 1991 1991 1991
3rd qtr. 4th qtr. lst qtr. 2nd qtr. 3rd qtr.
33
299
39
8 460
1 284
263
12
129
23
68
1 889
197
126
4830
3 365
670
160
l 387
1 091 1 891
3 073
57
594
356
880
924 1 314
227
242 1 871
18102
22 932
316
32
318
32
345
1 123
229
2 19
119 17
117
1 852
1 209 151
4567
3 443
584
268
1478
897
1 694
3 151
53
510
317
908
929
1 149
333
245
1 753
17712
22279
361
26
248
23
6
303
1 052
184
12
92
9
129
1 857
162
137
4240
3 108 403
269 1426
833
1 515
2 893
61
521
247
878
851
1 103
221 227
1544
16 100
20 340
474
42
315
15
3 339
1 290
252
3 21
105 14
122
2 063
176
111
4 872
3 465
508
148
1487
883
l 327
3 046
63 579
299
887
1 073
1 083
254
251 1 694
17047
21 919
419
25
287
27
2 403
1 373
271
2 20
96
6
116 2 508
178
156
5470
3 516
655
162
1 480
1 164
1 643
3 143
47
521
266
886
1 032
1 117
235
271
1 773
17911
23 381
401
Note: Persons arre5lcd/prosecuted in a quarter may be respollsible for the crime which occurred in the previous quarters. a Cases reported to Police only.
Persons arrested 1990 1990 1991 1991 1991
3rd qtr. 4th qtr. lst qtr. 2nd qtr. 3rd qtr.
31
193
42
3 298
830
191
8 71
13
8 535
229
22
2475
349
85
94
1 241 235
90
1 048
59
347
274
1 050
989
392
128 290
1 929
8600
11 075
76§
29
212
40
1
248
765
148
7 17
102
5 18
454
247
26
2320
314
82
105 1 353
145
121 1 135
71
308
288
1 137
1 OOO 362
175
303
1 824
8723
11 043
65§
23
156
18
7 292
735
123
1
12
69
12
17
547
173
22
2207
308
50
135
1 312
173
89
1 058
86
314
247
1 056
852
306
126
284
1 555
7951
10 158
64§
14
172
43
2
294
853
153
7 19
113
28
545
171
16
2431
392
76
74
1 391
176
108 1 135
98
310
279
1 097
1 129 367
153 320
1 730
8835
11 266
56§
24
165
42
5 289
906
171
6
18
73
8 18
690
201
34
2650
433
91
63
1 304
203
111
1 190
44
321
239
1 072
1 044
317
124
387
1 932
8875
11 525
58§
+ These include offences connected with, or directly or indirectly facilitated by, suspected corruption offences, and offences listed in ICAC Ordinance Section 10(5). These figures do not include cases handled by the Police, which are primarily on-street arrests, where after due consultation between the Police and the ICAC, the Police will normally continue to handle the case.
§ Figures refer to persons prosecuted only.
94 Hong Kong Monthly Digest of St.atistics October 1991
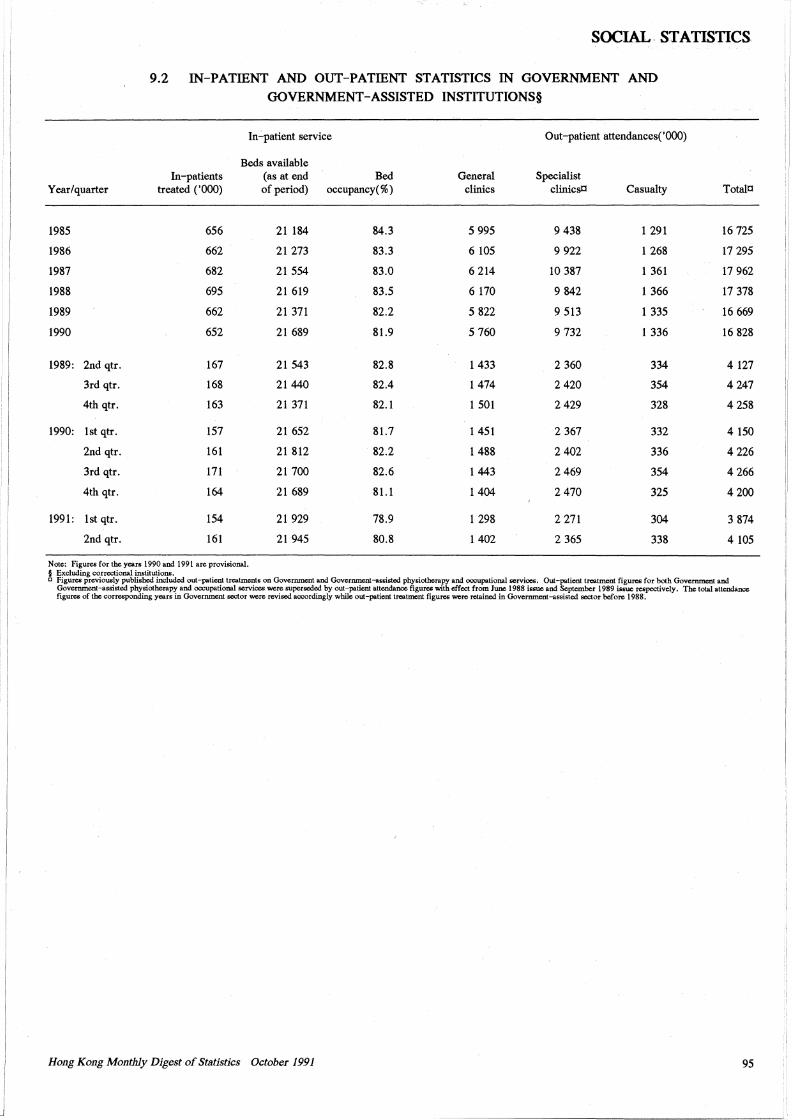
SOCIAL' STATISTICS ! I
9.2 IN-PATIENT AND OUT-PATIENT STATISTICS IN GOVERNMENT AND GOVERNMENT-ASSISTED INSTITUTIONS§
In.:.patient service Out-patient attendances('OOO)
,I Beds available In-patients (as at end Bed General Specialist
Year/quarter treated ('OOO) of period) occupancy(%) clinics clinicsC Casualty Totala I I
I
!
1985 656 21 184 84.3 5 995 9 438 1 291 16 725
1986 662 21 273 83.3 6 105 9 922 1 268 17 295
1987 682 21 554 83.0 6 214 10 387 1 361 17 962
1988 695 21 619 83.5 6 170 9 842 1 366 17 378
1989 662 21 371 82.2 5 822 9 513 1 335 16 669
1990 652 21 689 81.9 5 760 9 732 l 336 16 828
1989: 2nd qtr. 167 21 543 82.8 1 433 2 360 334 4 127
3rd qtr. 168 21440 82.4 1 474 2420 354 4 247
4th qtr. 163 21 371 82.1 1 501 2429 328 4 258
1990: lst qtr. 157 21 652 81.7 1 451 2 367 332 4 150
2nd qtr. 161 21 812 82.2 1488 2 402 336 4 226
3rd qtr. 171 21 700 82.6 1443 2 469 354 4 266
4th qtr. 164 21 689 81.1 1404 2470 325 4200
1991: lst qtr. 154 21 929 78.9 1 298 2 271 304 3 874
2nd qtr. 161 21 945 80.8 l 402 2 365 338 4 105
Note: Figures for the years 1990 and 1991 are provisional. § Excluding correctional institutions. o Figures previously published included out-patient treatments on Government and Government-assisted phyitlotberapy and occupational services. Out-patient treatment figures for both Government and
Government-assisted physiotherapy and occupational services were superseded by out-patient attendance figures with effect from June 1988 issue and September 1989 issue respectively. The total attendance figures of the corresponding years in Government sector were revised accordingly while out-patient treatment figures were retained in Government-assisted sector before 1988.
Hong Kong Monthly Digest of St11tistics October 1991 95
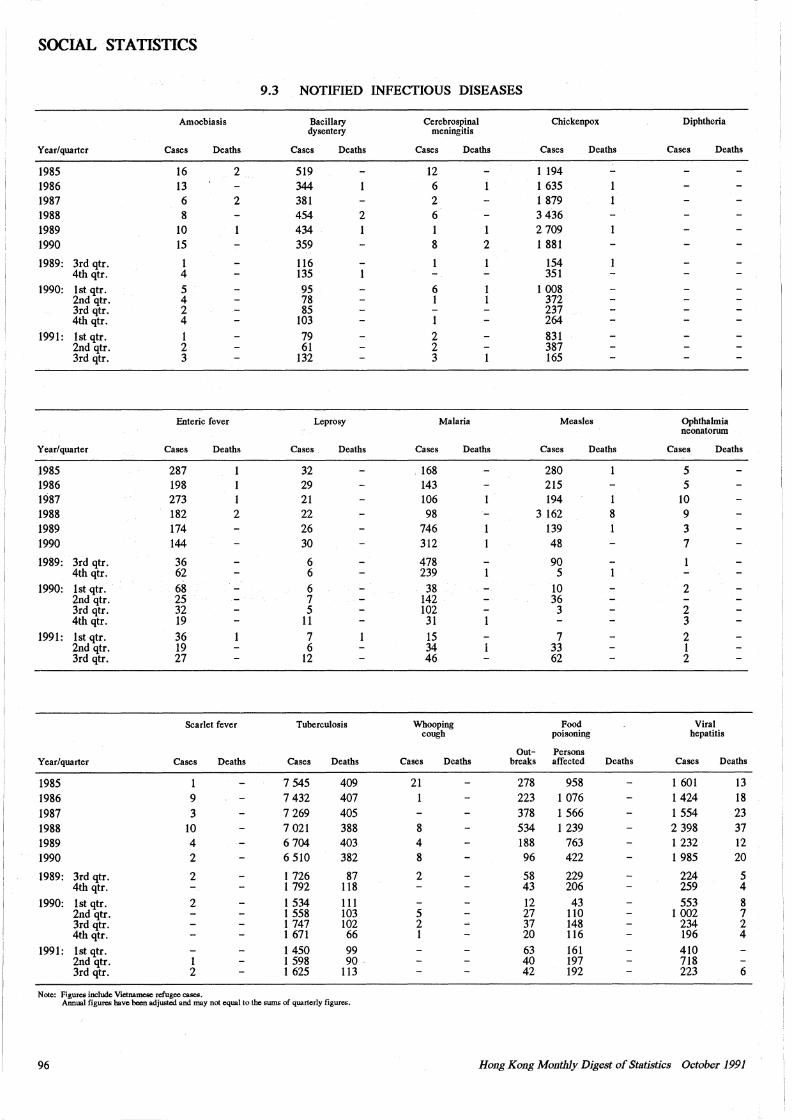
SOCIAL STATISTICS
9.3 NOTIFIED INFECTIOUS DISEASES
Amoebiasis Bacillary Cerebrospinal Chickenpox Diphtheria dysentery meningitis
Year/quarter Cases Deaths Cases Deaths Cases Deaths Cases Deaths Cases Deaths
1985 16 2 519 12 1 194 1986 13 344 6 1 635 1987 6 2 381 2 1 879 1988 8 454 2 6 3 436 1989 10 434 2 709 1990 15 359 8 2 1 881
1989: 3rd qtr. 1 116 1 154 4th qtr. 4 135 351
1990: lst qtr. 5 95 6 1 008 2nd qtr. 4 78 1 372 3rd qtr. 2 85 237 4th qtr. 4 103 l 264
1991: lst qtr. 1 79 2 831 2nd qtr. 2 61 2 387 3rd qtr. 3 132 3 165
Enteric fever Leprosy Malaria Measles Ophthalmia neonatorum
Year/quarter Cases Deaths Cases Deaths Cases Deaths Cases Deaths Cases Deaths
1985 287 32 168 280 5 1986 198 1 29 143 215 5 1987 273 1 21 106 194 l 10 1988 182 2 22 98 3 162 8 9 1989 174 26 746 139 3 1990 144 30 312 48 7
1989: 3rd qtr. 36 6 478 90 4th qtr. 62 6 239 5
1990: lst qtr. 68 6 38 10 2 2nd qtr. 25 7 142 36 3rd qtr. 32 5 102 3 2 4th qtr. 19 11 31 3
1991: lst qtr. 36 7 15 7 2 2nd qtr. 19 6 34 33 1 3rd qtr. 27 12 46 62 2
Scarlet fever Tuberculosis Whooping Food Viral cough poisoning hepatitis
Out- Persons Year/quarter Cases Deaths Cases Deaths Cases Deaths breaks affected Deaths Cases Deaths
1985 7 545 409 21 278 958 l 601 13 1986 9 7 432 407 223 1 076 1 424 18 1987 3 7 269 405 378 l 566 1554 23 1988 10 7 021 388 8 534 1 239 2 398 37 1989 4 6 704 403 4 188 763 1 232 12 1990 2 6 510 382 8 96 422 1 985 20
1989: 3rd qtr. 2 l 726 87 2 58 229 224 5 4th qtr. 1 792 118 43 206 259 4
1990: lst qtr. 2 1 534 111 12 43 553 8 2nd qtr. 1 558 103 5 27 110 1 002 7 3rd qtr. 1 747 102 2 37 148 234 2 4th qtr. 1 671 66 1 20 116 196 4
1991: lst qtr. 1450 99 63 161 410 2nd qtr. 1 1 598 90 . 40 197 718 3rd qtr. 2 1 625 113 42 192 223 6
Note: Figures include Vietnamese refugee cases. Annual figures have been adjusted and may not equal to the sums of quarterly figures.
96 Hong Kong Monthly Digest of Statistics October 1991
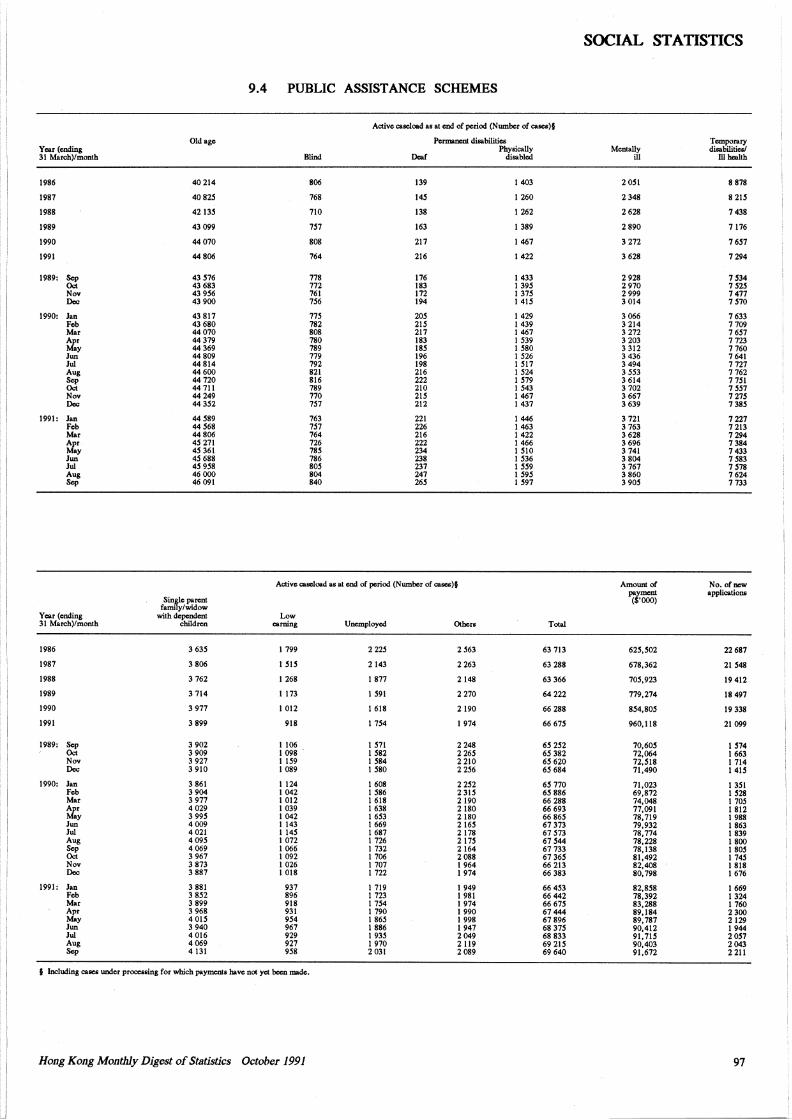
SOCIAL STATISTICS
9.4 PUBLIC ASSISTANCE SCHEMES
Active cascload as at end of period (Number of ea ... )§
Old ago Pcrmanen1 disabilities Temporary Year (coding Physically Mentally disabilitie&/ 31 Maroh)/month Blind Deaf disabled ill Whcalth
1986 40214 806 139 1403 2051 8 878
1987 40825 768 145 1260 2348 8215
1988 42135 710 138 I 262 2628 7438
1989 43099 151 163 I 389 2890 7176
1990 44070 808 217 1467 3272 1651
1991 44806 764 216 1422 3628 7294
1989: ~ 43516 778 116 I 433 2928 7534 43683 772 183 I 395 2970 7 525
Nov 43956 761 172 I 375 2999 7477 Dec 43900 156 194 1415 3 014 1510
1990: Jan 43817 115 205 1429 3 066 7633 Feb 43680 782 215 I 439 3 214 1109 Mar 44070 808 217 I 467 3 272 1651 Apr 44379 780 183 I 539 3203 7 723 May 44369 789 185 I 580 3 312 7760 Jun 44809 779 196 I 526 3 436 7641 Jui 44814 792 198 I 511 3 494 7727 Aug 44600 821 216 I 524 3 553 7762 Sep 44720 816 222 I 519 3 614 1151 Oct 44711 789 210 I 543 3702 1551 Nov 44249 770 215 I 467 3667 1215 Dec 44352 151 212 I 437 3639 7385
1991: Jan 44589 763 221 1446 3 721 7227 Feb 44568 151 226 I 463 3 763 7213 Mar 44806 764 216 1422 3628 7294 Apr 45271 726 222 I 466 3696 7384 May 45361 785 234 1510 3741 7433 Jun 45688 786 238 I 536 3804 7583 Jui 45 958 805 237 I 559 3767 7 578 Aug 46000 804 247 I 595 3860 7624 Sep 46091 840 265 I S91 390S 7 733
Active c:ascload as at end of period (Number of ea ... )§ Amount of No. of new
'(/.OOO) applications s:r,epamtt
fa y/widow Year (ending with dependco1 Low 31 Maroh)/month children earning Unemployed Others Total
1986 3 63S I 199 2 22S 2 S63 63 713 625,S02 22687
1987 3806 I SIS 2143 2 263 63 288 678,362 21548
1988 3 762 I 268 1877 2148 63366 105,923 19412
1989 3 714 I 173 1591 2270 64222 779,274 18497
1990 3977 I 012 1618 2190 66 288 854,805 19 338
1991 3899 918 I 1S4 1974 66 615 960,118 21099
1989: ~ 3 902 1106 I 511 2248 65 252 10,605 I 514 3909 I 098 ' I 582 2265 65382 72,064 1663
Nov 3927 1159 I 584 2210 65620 72,518 I 714 Dec 3910 I 089 I 580 2256 65684 71,490 1415
1990: Jan 3861 1124 I 608 2252 65 770 71,023 1351 Feb 3904 I 042 1586 2315 65886 69,872 I 528 Mar 3977 I 012 I 618 2190 66 288 74,048 I 105 Apr 4029 I 039 I 638 2180 66 693 77,091 1812 May 3 99S I 042 I 6S3 2180 66 865 78,719 1988 Jun 4009 I 143 1669 2165 67373 79,932 1863 Jui 4021 I 145 1687 2178 67 513 78,774 1839 Aug 4095 I 072 I 726 2115 67 544 78,228 1800 Sep 4069 I 066 I 732 2164 67 733 78,138 1805 Oct 3967 I 092 I 706 2088 67 365 81,492 I 145 Nov 3 873 I 026 I 707 1964 66 213 82,408 1818 Dec 3887 I 018 I 722 1974 66383 80,798 1676
1991: Jan 3881 937 I 719 1949 66 453 82,858 1669 Feb 3852 896 I 723 1981 66442 78,392 1324 Mar 3899 918 I 154 1974 66 61S 83,288 1760 Apr 3968 931 I 790 1990 67444 89,184 2300 May 4015 954 1865 I 998 67896 89,787 2129 Jun 3940 967 1886 1947 68 375 90,412 1944 Jui 4016 929 1935 2049 68 833 91,715 2057 Aug 4069 927 1970 2119 69 215 90,403 2043 Sep 4131 958 2031 2089 69640 91,672 2 211
I Including ea ... W1der prooe&sing for which payincnto have not yet been made.
Hong Kong Monthly Digest of Statistics October 1991 97
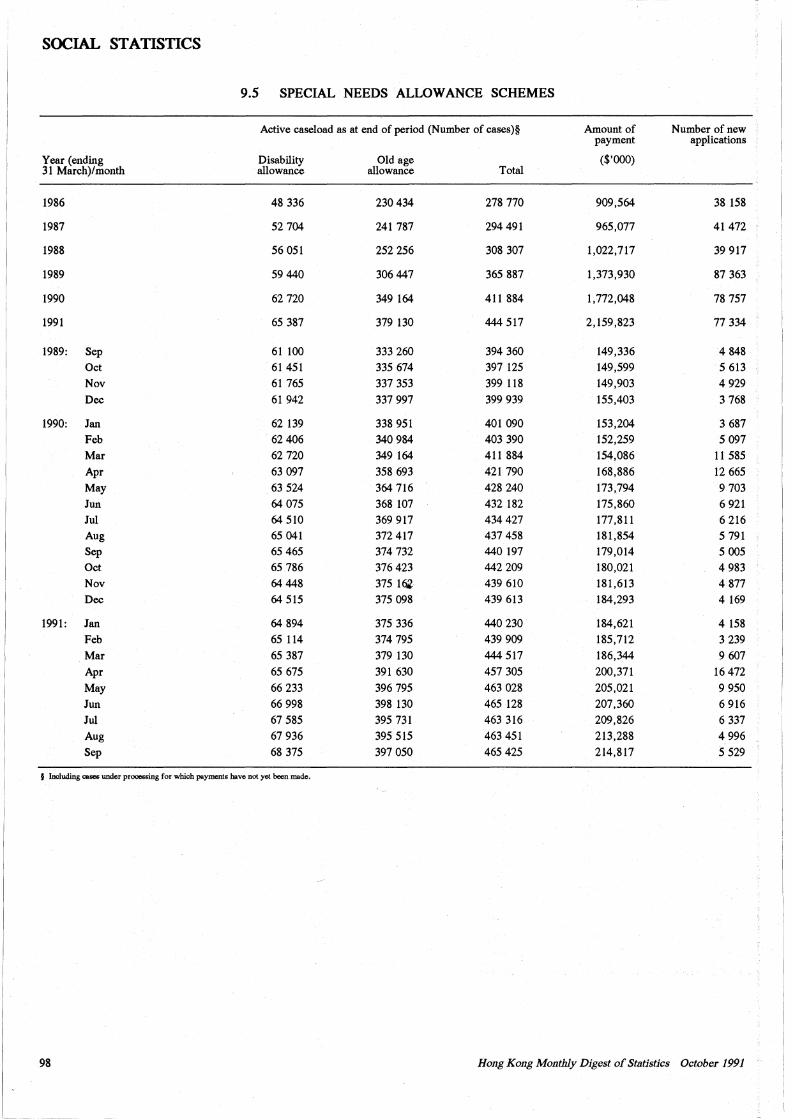
--------- ------ - --- --- -------- - ---
SOCIAL STATISTICS
9.5 SPECIAL NEEDS ALLOWANCE SCHEMES
Active caseload as at end of period (Number of cases)§ Amount of Number of new payment applications
Year (ending 31 March)/month
Disability allowance
Old age allowance Total
($'000)
1986 48 336 230 434 278 770 909,564 38 158
1987 52 704 241 787 294 491 965,077 41472
1988 56 051 252 256 308 307 1,022,717 39 917
1989 59 440 306 447 365 887 1,373,930 87 363
1990 62 720 349 164 411 884 1,772,048 78 757
1991 65 387 379 130 444 517 2,159,823 77 334
1989: Sep 61 100 333 260 394 360 149,336 4 848
Oct 61 451 335 674 397 125 149,599 5 613
Nov 61 765 337 353 399 118 149,903 4 929
Dec 61 942 337 997 399 939 155,403 3 768
1990: Jan 62 139 338 951 401 090 153,204 3 687
Feb 62 406 340 984 403 390 152,259 5 097
Mar 62 720 349 164 411 884 154,086 11 585
Apr 63 097 358 693 421 790 168,886 12 665
May 63 524 364 716 428 240 173,794 9 703
Jun 64 075 368 107 432 182 175,860 6 921
Jui 64 510 369 917 434 427 177,811 6 216 Aug 65 041 372 417 437 458 181,854 5 791 Sep 65 465 374 732 440 197 179,014 5 005
Oct 65 786 376 423 442 209 180,021 4 983 Nov 64 448 375 1~ 439 610 181,613 4 877
Dec 64 515 375 098 439 613 184,293 4 169
1991: Jan 64 894 375 336 440 230 184,621 4 158 Feb 65 114 374 795 439 909 185,712 3 239
Mar 65 387 379 130 444 517 186,344 9 607
Apr 65 675 391 630 457 305 200,371 16 472
May 66 233 396 795 463 028 205,021 9 950
Jun 66 998 398 130 465 128 207,360 6 916
Jui 67 585 395 731 463 316 209,826 6 337
Aug 67 936 395 515 463 451 213,288 4 996
Sep 68 375 397 050 465 425 214,817 5 529
§ Including cases under processing for which payments have not yet be.en made.
98 Hong Kong Monthly Digest of St11tistics October 1991
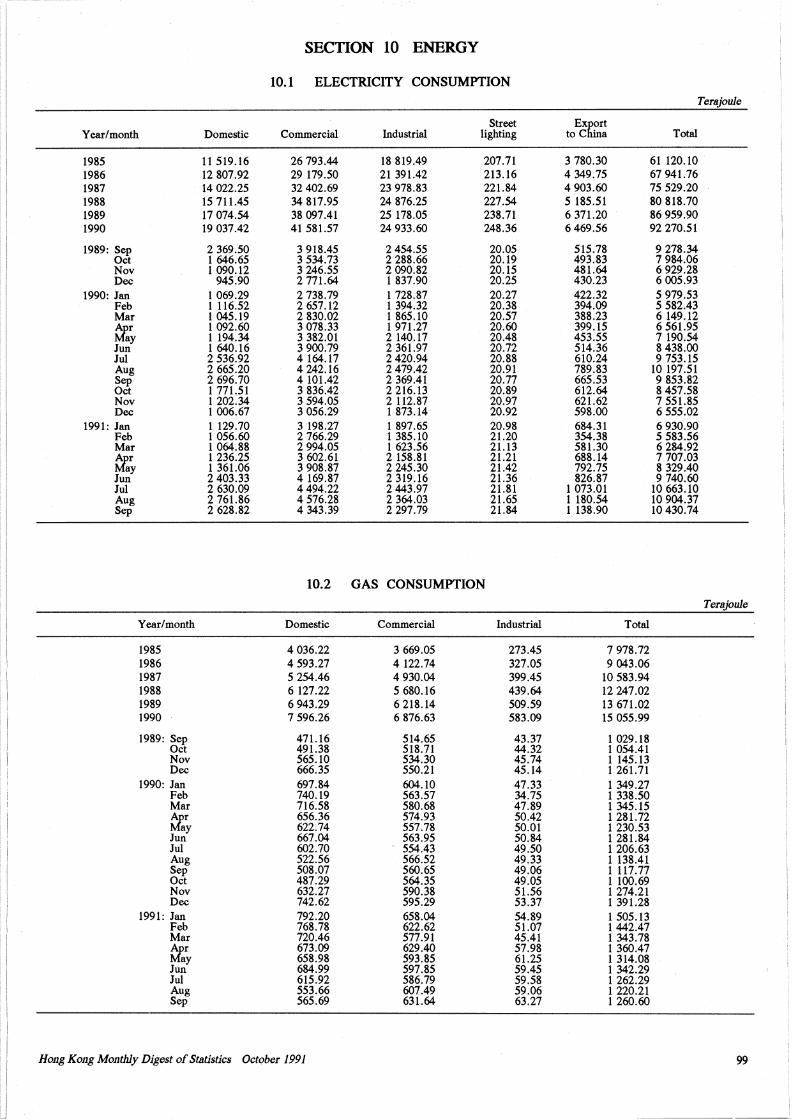
-- -- - --- - - - -~-~o- ---~~~---~~~-~--
SECTION 10 ENERGY
10.1 ELECTRICITY CONSUMPTION Terajoule
Street Ex~ Year/month Domestic Commercial Industrial lighting to C · Total
1985 11 519.16 26 793.44 18 819.49 207.71 3 780.30 61 120.10 1986 12 807.92 29 179.50 21 391.42 213.16 4 349.75 67 941.76 1987 14 022.25 32 402.69 23 978.83 221.84 4 903.60 75 529.20 1988 15 711.45 34 817.95 24 876.25 227.54 5 185.51 80 818.70 1989 17 074.54 38 097.41 25 178.05 238.71 6 371.20 86 959.90 1990 19 037.42 41 581.57 24 933.60 248.36 6469.56 92 270.51
1989: Sep 2 369.50 3 918.45 2 454.55 20.05 515.78 9 278.34 Oct 1 646.65 3 534.73 2 288.66 20.19 493.83 7 984.06 Nov 1 090.12 3 246.55 2 090.82 20.15 481.64 6 929.28 Dec 945.90 2 771.64 1 837.90 20.25 430.23 6 005.93
1990: Jan 1 069.29 2 738.79 1 728.87 20.27 422.32 5 979.53 Feb 1 116.52 2 657.12 1 394.32 20.38 394.09 5 582.43 Mar 1 045.19 2 830.02 1 865.10 20.57 388.23 6 149.12 tfer 1 092.60 3 078.33 1 971.27 20.60 399.15 6 561.95
ay 1 194.34 3 382.01 2 140.17 20.48 453.55 7 190.54 Jun 1 640.16 3 900.79 2 361.97 20.72 514.36 8 438.00 Jui 2 536.92 4 164.17 2 420.94 20.88 610.24 9 753.15 Aug 2 665.20 4 242.16 2 479.42 20.91 789.83 10 197.51 Sep 2 696.70 4 101.42 2 369.41 20.77 665.53 9 853.82 Oct 1 771.51 3 836.42 2 216.13 20.89 612.64 8 457.58 Nov 1 202.34 3 594.05 2 112.87 20.97 621.62 7 551.85 Dec 1 006.67 3 056.29 1 873.14 20.92 598.00 6 555.02
1991: Jan 1 129.70 3 198.27 1 897.65 20.98 684.31 6 930.90 Feb 1 056.60 2 766.29 1 385.10 21.20 354.38 5 583.56 Mar 1 064.88 2 994.05 1 623.56 21.13 581.30 6 284.92 tfer 1 236.25 3 602.61 2 158.81 21.21 688.14 7 707.03
ay 1 361.06 3 908.87 2 245.30 21.42 792.75 8 329.40 Jun 2 403.33 4 169.87 2 319.16 21.36 826.87 9 740.60 Jui 2 630.09 4 494.22 2 443.97 21.81 1 073.01 10 663.10 Aug 2 761.86 4 576.28 2 364.03 21.65 1 180.54 10 904.37 Sep 2 628.82 4 343.39 2 297.79 21.84 1 138.90 10 430.74
10.2 GAS CONSUMPTION
Tera joule
Year/month Domestic Commercial Industrial Total
1985 4 036.22 3 669.05 273.45 7 978.72 1986 4 593.27 4 122.74 327.05 9 043.06 1987 5 254.46 4 930.04 399.45 10 583.94 1988 6 127.22 5 680.16 439.64 12 247.02 1989 6 943.29 6 218.14 509.59 13 671.02 1990 7 596.26 6 876.63 583.09 15 055.99
1989: Sep 471.16 514.65 43.37 1 029.18 Oct 491.38 518.71 44.32 1 054.41 Nov 565.10 534.30 45.74 1 145.13 Dec 666.35 550.21 45.14 1 261.71
1990: Jan 697.84 604.10 47.33 1 349.27 Feb 740.19 563.57 34.75 1 338.50 Mar 716.58 580.68 47.89 1 345.15 tfer 656.36 574.93 50.42 1 281.72
ay 622.74 557.78 50.01 1 230.53 Jun 667.04 563.95 50.84 1 281.84 Jui 602.70 554.43 49.50 1 206.63 Aug 522.56 566.52 49.33 1 138.41 Sep 508.07 560.65 49.06 1 117.77 Oct 487.29 564.35 49.05 1 100.69 Nov 632.27 590.38 51.56 1 274.21 Dec 742.62 595.29 53.37 1 391.28
1991: Jan 792.20 658.04 54.89 1 505.13 Feb 768.78 622.62 51.07 1442.47 Mar 720.46 577.91 45.41 1 343.78 tfer 673.09 629.40 57.98 1 360.47
ay 658.98 593.85 61.25 1 314.08 Jun 684.99 597.85 59.45 1 342.29 Jui 615.92 586.79 59.58 1 262.29 Aug 553.66 607.49 59.06 1 220.21 Sep 565.69 631.64 63.27 1 260.60
Hong Kong Monthly Digest of Statistics October 1991 99
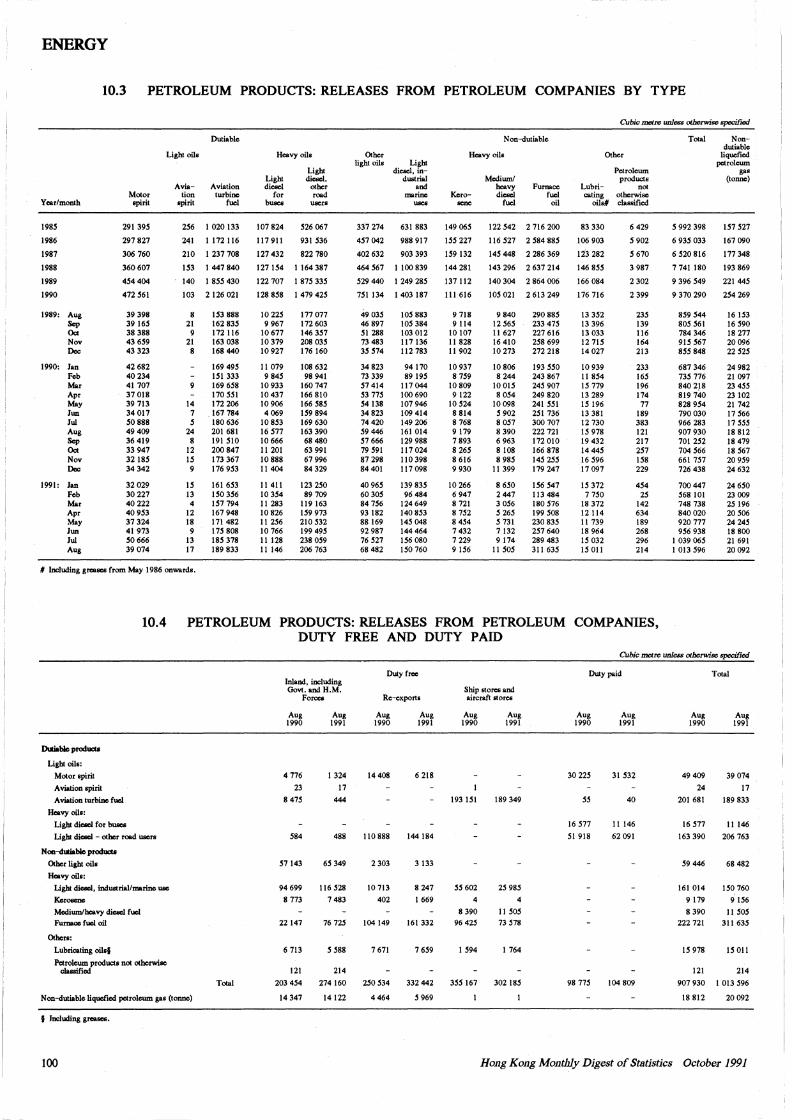
ENERGY
10.3 PETROLEUM PRODUCTS: RELEASES FROM PETROLEUM COMPANIES BY TYPE
Year/month
198S
1986
1987
1988
1989
1990
1989: Aug Sep Oct Nov Dec
1990: Jan Feb Mar Apr May Jun Jui Aug Sep Oct Nov Dec
1991: Jan Feb Mar Apr May Jun Jui Aug
Motor spirit
291 39S
297 827
306 760
360607
4S4 404
472 S61
39 398 39 16S 38 388 43 6S9 43 323
42682 40234 41 707 37 018 39 713 34017 so 888 49 409 36 419 33 947 32 ISS 34 342
32 029 30227 40222 40 9S3 37 324 41 973 so 666 39 074
Light oils
Aviation
spirit
Dutiable
Aviation turbine
fuel
2S6 l 020 133
241 I 172116
210 I 237 708
1S3 I 447 840
140 l 8SS 430
103 2 126 021
8 1S3 888 21 16283S
9 172 116 21 163 038
8 168 440
169 49S ISI 333 169 6S8 170 SSI
14 172206 7 _167784 s 180 636
24 201 681 8 191 SlO
12 200847 IS 173367 9 176 9S3
IS 13 4
12 18 9
13 17
161 6S3 lSO 3S6 IS7 794 167 948 171 482 17S 808 18S 378 189 833
II Including greases from May 1986 onwards.
Heavy oils
Light Light diesel, diesel other
for rood buses users
I 07 824 S26 067
117911 931 S36
127 432 822 780
127 IS4 I 164 387
122 707 I 87S 33S
128 8S8 I 479 42S
10 22S 9 967
10677 10379 10 927
11 079 9 84S
10 933 10 437 10 906 4069
10 8S3 16 S77 10666 11 201 10888 11404
11 411 103S4 11 283 10 826 11 2S6 10 766 11 128 11 146
177 077 172 603 146 3S7 208 03S 176 160
108 632 98 941
160 747 166 810 166 SSS IS9 894 169 630 163 390 68480 63 991 67 996 84 329
123 2SO 89 709
119 163 IS9 973 210 S32 199 49S 238 OS9 206 763
Other light oils Light
diesel, industrial
and marine
uses
337 274 631 883
4S7 042 988 917
402 632 903 393
464 S67 I I 00 839
S29 440 I 249 28S
7Sl 134 I 403 187
49 03S 46 897 SI 288 73 483 3S S74
34 823 73 339 S7414 S3 77S S4138 34 823 74420 S9 446 S7 666 79 S91 87 298 84 401
40 96S 60 30S 84 7S6 93 182 88 169 92 987 76 S27 68 482
IOS 883 IOS 384 103 012 117136 112 783
94170 89 19S
117044 100 690 107 946 109414 149 206 161 014 129 988 117 024 110 398 117098
139 83S 96 484
124 649 140 8S3 14S 048 144 464 IS6 080 ISO 760
Non-dutiable
Heavy oils
Medium/ heavy
Kero- diesel Furoaoc
fuel oil scne fuel
149 06S
ISS 227
1S9 132
144 281
137 112
111 616
9 718 9 114
10107 11 828 11 902
10 937 8 7S9
10809 9 122
IOS24 8 814 8 768 9 179 7 893 8 26S 8 616 9 930
10 266 6 947 8 721 8 7S2 8 4S4 7 432 7 229 9 IS6
122 S42 2 716 200
116 S27 2 S84 88S
l 4S 448 2 286 369
143 296 2 637 214
140 304 2 864 006
IOS 021 2 613 249
9 840 12 S6S 11 627 16 410 10 273
10 806 8 244
lOOIS 8 OS4
10 098 s 902 8 OS7 8 390 6 963 8 108 8 98S
11 399
8 6SO 2447 3 OS6 S 26S s 731 7 132 9 174
11 SOS
290 88S 233 47S 227 616 2S8 699 272 218
193 sso 243 867 24S 907 249 820 241 SSI 2S1 736 300 707 222 721 172010 166 878 14S 2SS 179 247
1S6 S47 113 484 180 S76 199 SOS 230 83S 2S7 640 289 483 311 63S
Cubic metre unless otherwise specified
Other
Lubricating
oils#
83 330
106 903
123 282
146 SSS
166 084
176 716
13 352 13 396 13 033 12 71S 14027
10 939 11 8S4 IS 779 13 289 IS 196 13 381 12 730 IS 978 19 432 14 44S 16 S96 17097
IS 372 7 7SO
18 372 12114 11 739 18 964 lS 032 IS Oil
Petrolewn products
not otherwise classified
6 429
s 902
s 670
3 987
2 302
2 399
23S 139 116 164 213
233 16S 196 174 77
189 383 121 217 2S7 IS8 229
4S4 2S
142 634 189 268 296 214
Total Non-
s 992 398
6 93S 033
6 S20 816
7 741 180
9 396 S49
9 370 290
8S9 S44 SOS S61 784 346 91S S67 SSS 848
687 346 73S 776 840 218 819 740 828 9S4 790 030 966 283 907 930 701 252 704 S66 661 7S7 726 438
700 447 S68 101 748 738 840 020 920 777 9S6 938
I 039 06S I 013 S96
dutiable liquefied
petroleum gas
(tonne)
IS7 S27
167 090
177 348
193 869
221 44S
254 269
16 IS3 16 S90 18 277 20096 22 S2S
24 982 21 097 23 4SS 23102 21 742 17 S66 17 SSS 18 812 18 479 18 S67 209S9 24 632
24 6SO 23 009 25 196 20S06 24 245 18 800 21 691 20092
10.4 PETROLEUM PRODUCTS: RELEASES FROM PETROLEUM COMPANIES, DUTY FREE AND DUTY PAID
DWablo produots
Light oils:
Motor spirit
Aviation spirit
Aviation turbine fuel
Heavy oils:
Light diesel for buses
Light diesel - other road users
Non-dmiablo produots Other light oils
Heavy oils:
Light diesel, industrial/marine use
Kerosene
Medium/heavy diesel fuel
Fumaoe fuel oil
Others:
Lubricating oils§
Petroleum products not otherwise classified
Non-dutiable liquefied petroleum gas (tonne)
f Including greases.
100
Total
Inland, including Govt. and H.M.
Forocs
Aug 1990
4 776
23
8 47S
S84
S7143
94 699
8 773
22147
6 713
Aug 1991
I 324
17
444
488
6S 349
116 S28
7 483
76 72S
s S88
214
Duty free
Re-exports
Aug 1990
14 408
110 888
2 303
10 713
402
104149
7 671
Aug 1991
6 218
144184
3 133
8 247
I 669
161 332
7 6S9
121
203 4S4
14 347
274 160 2SO S34 332 442
5969 14 122 4 464
Ship stores and aircraft &lores
Aug 1990
193 IS!
SS 602
4
8 390
96 42S
I S94
3SS 167
Aug 1991
189 349
25 98S
4
11 SOS 73 S78
I 764
302 !SS
Cubic metre unless otherwise specified
Duty paid
Aug 1990
30 22S
SS
16 S77
SI 918
98 77S
Aug 1991
31 S32
40
II 146
62 091
104 809
Aug 1990
49 409
24
201 681
16 S77
163 390
S9 446
161 014
9 179
8 390
222 721
IS 978
121
Total
Aug 1991
39 074
17
189 833
II 146
206 763
68 482
ISO 760
9 IS6
II SOS 311 63S
!SOil
214
907 930 I 013 S96
18 812 20092
Hong Kong Monthly Digest of Statistics October 1991
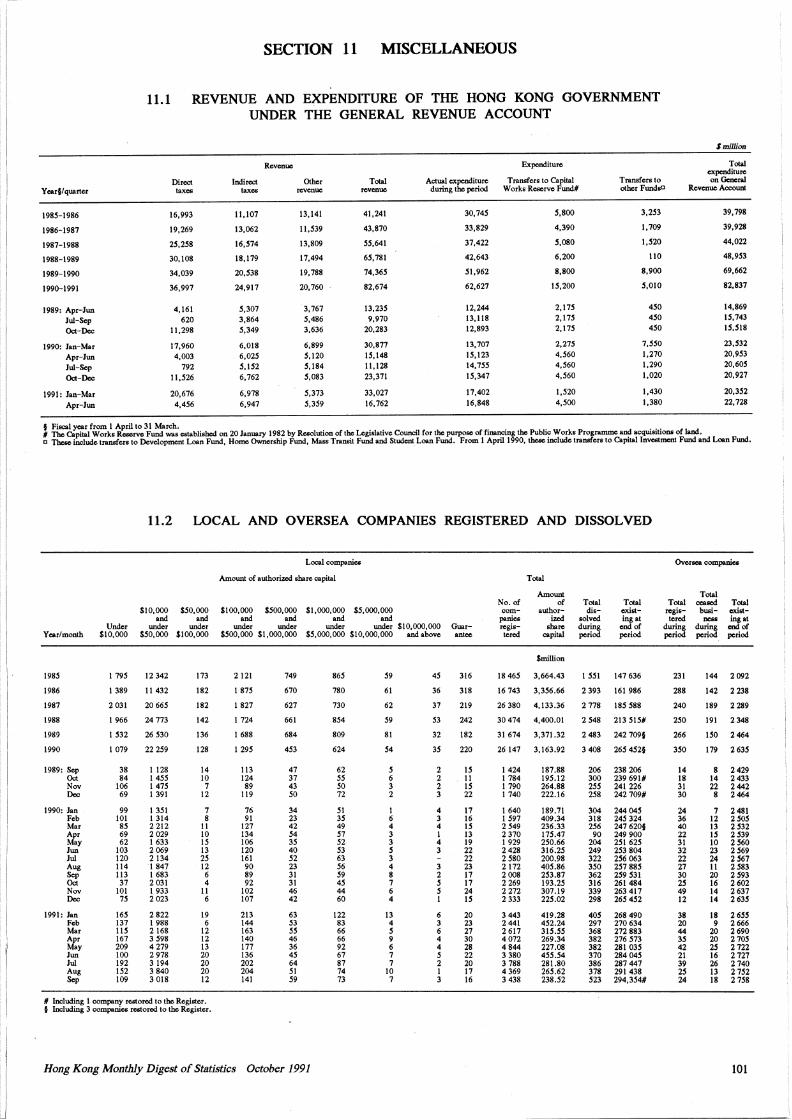
SECTION 11 MISCELLANEOUS
11.1 REVENUE AND EXPENDITURE OF THE HONG KONG GOVERNMENT UNDER THE GENERAL REVENUE ACCOUNT
$million
Revenue Expenditure
Ycarf/quarter Direct
taxe& Indirect Other
taxe& revenue Total
revenue Actual expenditure Transfers to Capital
during the period Works Reserve Fund# Transfers to other FundsD
Total expenditure onGcncral
Revenue Accoun1
1985-1986
1986-1987
1987-1988
1988-1989
1989-1990
1990-1991
1989: Apr-Jun Jui-Sep Oct-Dec
1990: Jan-Mar Apr-Jun Jui-Sep Oct-Dec
1991: Jan-Mar Apr~Jun
16,993
19,269
25,258
30,108
34,039
36,997
4,161 620
11,298
17,960 4,003
792 11,526
20,676 4,4S6
11,107
13,062
16,S74
18,179
20,S38
24,917
5,307 3,S64 S,349
6,0IS 6,02S S,IS2 6,762
6,978 6,947
13,141
11,S39
13,S09
17,494
19,78S
20,760
3,767 S,4S6 3,636
6,S99 S,120 5,184 S,083
S,373 S,3S9
41,241
43,S70
SS,641
6S,781
74,36S
S2,674
13,235 9,970
20,283
30,S77 IS,148 11,128 23,371
33,027 16,762
30,745
33,S29
37,422
42,643
St,962
62,627
12,244 13,11S 12,893
13,707 IS,123 14,7SS IS,347
17,402 16,S48
S,SOO
4,390
S,080
6,200
S,SOO
15,200
2,17S 2,17S 2,17S
2,27S 4,S60 4,S60 4,S60
l,S20 4,SOO
3,2S3
1,709
l,S20
110
S,900
S,010
4SO 4SO 4SO
1,SSO l,270 1,290 1,020
1,430 l,3SO
39,79S
39,928
44,022
4S,9S3
69,662
S2,S37
14,S69 IS,743 IS.SIS
23,S32 20,9S3 20,60S 20,927
20,3S2 22,728
f Fiscal ycsr from I April to 31 March. • .. # The Capital Works Reserve Fund was established on 20 January I 9S2 by Resolution of the Legislative Council for the pwposc of ficancing the Public Works Programme and acqwntions of land. c Tbcsc include transfers to Development Loan Fund, Hom<> Ownership Fund, Mass Trsnsit Fund and Student. Loan Fund. From I April 1990, those include transfers to Capital lnve&tmcll1 Fund and Loan Fund.
11.2 WCAL AND OVERSEA COMPANIES REGISTERED AND DISSOLVED
Year/month
19SS
19S6
19S7
19SS
1989
1990
19S9: Sep Oct Nov Dec
1990: Jan Feb Mar Apr May Jun Jui Aug Sep Oct Nov Dec
1991: Jan Feb Mar Apr May Jun Jui Aug Sep
Under $10,000
I 79S
I 3S9
2031
I 966
I S32
I 079
3S S4
106 69
99 IOI SS 69 62
103 120 114 113 37
101 1S
16S 137 llS 167 209 100 192 IS2 109
$10,000 SS0,000 and and
under under $SO.OOO $100,000
12342
11 432
2066S
24773
26 S30
22 2S9
I 12S I 4SS I 47S I 391
I 3SI 1314 2212 2029 I 633 2 069 2134 I S47 I 6S3 2031 I 933 2023
2 S22 I 9SS 216S 3 S9S 4279 297S 3194 3S40 301S
173
IS2
IS2
142
136
12S
14 10 7
12
7 s
11 10 IS 13 2S 12 6 4
11 6
19 6
12 12 13 20 20 20 12
# Including I company restored to the Register. § Including 3 companies ieatored to the Register.
Local companies
Amount of authorized share capital
$100,000 $500,000 $1,000,000 $5,000,000 and and and and
under under under under $10,000,000 $SOO, OOO $1,000,000 SS,000,000 $10,000,000 and above
2121
I S7S
I S27
I 724
I 6SS
I 29S
113 124 S9
119
76 91
127 134 106 120 161 90 S9 92
102 107
213 144 163 140 177 136 202 204 141
749
670
627
661
6S4
4S3
47 37 43 so 34 23 42 S4 3S 40 S2 23 31 31 46 42
63 S3 SS 46 36 4S 64 SI S9
S6S
7SO
730
SS4
S09
624
62 SS so 72
SI 3S 49 S1 S2 S3 63 S6 S9 4S 44 60
122 S3 66 66 92 67 87 74 73
S9
61
62
S9
SI
S4
s 6 3 2
I 6 4 3 3 s 3 4 s 7 6 4
13 4 s 9 6 7 7
10 7
4S
36
37
S3
32
3S
2 2 2 3
4 3 4 I 4 3
3 2 s s I
6 3 6 4 4 s 2 I 3
Hong Kong Monthly Digest of Statistics October 1991
Guarantee
316
31S
219
242
IS2
220
IS 11 IS 22
17 16 IS 13 19 22 22 23 17 17 24 IS
20 23 27 30 2S 22 20 17 16
No. of com
panies registered
IS46S
16 743
263SO
30474
31 674
26 147
1424 I 7S4 I 790 I 740
1640 I S97 2S49 2370 1929 242S 2SSO 2172 200S 2 269 2272 2 333
3 443 2441 2 617 4072 4S44 33SO 3 7SS 4369 343S
Total
Amount of
authorized
share capital
$million
3,664.43
3,3S6.66
4,133.36
4,400.01
3,371.32
3,163.92
IS7.SS 19S.12 264.SS 222.16
IS9.71 409.34 236.33 17S.47 2S0.66 316.25 200.9S 40S.S6 2S3.S7 193.25 307.19 225.02
419.28 4S2.24 3lS.SS 269.34 227.0S 4SS.S4 281.SO 26S.62 238.S2
Total dis
solved during period
Total existing at
end of period
I SSI 147 636
2 393 161 9S6
2 778 ISS SSS
2 S4S 213 SIS#
2 4S3 242 709§
3 408 26S 4S2§
206 23S 206 300 239 691# 25S 241 226 25S 242 709#
304 244 04S 31S 24S 324 256 247620§
90 249 900 204 2SI 62S 249 2S3 S04 322 2S6 063 3SO 2S7 SSS 362 2S9 S31 316 261 484 339 263 417 29S 26S 4S2
40S 26S 490 297 270 634 36S 272 SS3 3S2 276 S73 3S2 281 03S 370 2S404S 3S6 2S7 447 378 291 43S S23 294,3S4#
Overscs companies
Total Total """"°" Total
cxiaingat
end of period
rcgis- busi-tcred ,,...
during during period period
231
2SS
240
250
266
3SO
14 IS 31 30
24 36 40 22 31 32 22 27 30 25 49 12
3S 20 44 3S 42 21 39 2S 24
144 2 092
142 2 23S
IS9 2 2S9
191 2 34S
ISO 2 464
179 263S
s 2429 14 2 433 22 2 442 s 2464
7 24SI 12 2 SOS 13 2 S32 IS 2 S39 10 2 S60 23 2S69 24 2S67 11 2 SS3 20 2 S93 16 2 602 14 2 637 14 2 63S
IS 2 65' 9 2 666
20 2690 20 2 70S 2S 2 722 16 2 727 26 2 740 13 2 7S2 IS 2 7S8
101
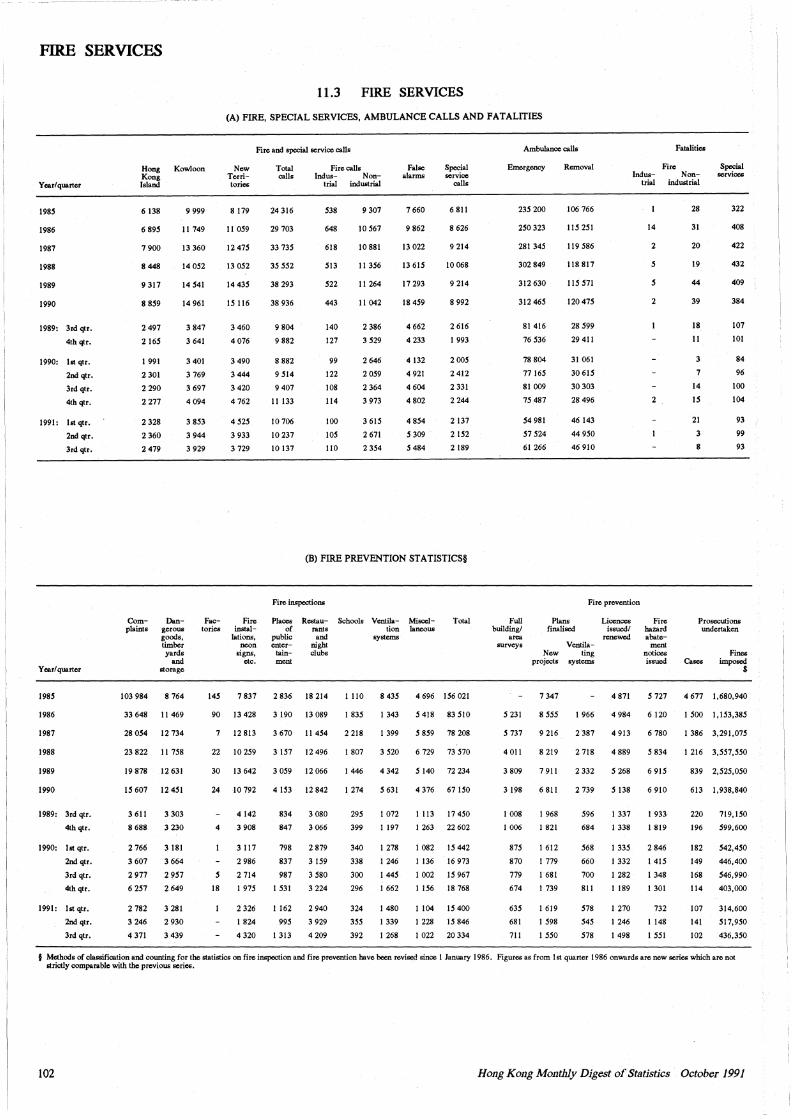
FIRE SERVICES
11.3 FIRE SERVICES
(A) FIRE, SPECIAL SERVICES, AMBULANCE CALLS AND FATALITIES
Y car/ quarter
1985
J986
J987
J988
J989
J990
J989: 3rd qtr.
4thqtr.
J 990: ht qtr.
2nd qtr.
3rd qtr.
4th qtr.
J99J: lst qtr.
2nd qtr.
3rd qtr.
Year/quarter
1985
1986
1987
1988
1989
J990
J 989: 3rd qtr.
4thqtr.
1990: lstqtr.
2nd qtr.
3rd qtr.
4thqtr.
J99J: Jst qtr.
2nd qtr.
3rd qtr.
Fire and special service calls
Hong Kowloon Kong Island
6 138
6 895
7 900
8 448
9 317
8 859
2 497
2 165
J 991
2 301
2 290
2 277
2 328
2 360
2 479
9 999
II 749
13 360
14052
14 541
14 961
3 847
3 641
3 401
3 769
3 697
4 094
3 853
3 944
3 929
New Territories
8 179
II 059
12 47S
13 052
14 43S
IS 116
3 460
4 076
3 490
3 444
3 420
4 762
4 525
3 933
3 729
Complaints
Dangerous goods, timber yards
Factories
Fire instal
lations, neon
itlgns. etc.
J03 984
and storage
8 764
33 648 11 469
28 054 12 734
23 822 II 7S8
19 878 12 631
15 607 12 451
3 611
8 688
2 766
3 607
2 977
6 2S7
2 782
3 246
4 371
3 303
3 230
3 181
3 664
2 9S7
2 649
3 281
2 930
3 439
145 7 837
90 13 428
12 813
22 102S9
30 13 642
24 10792
4
5
18
4142
3 908
3 117
2 986
2 714
J 97S
2 326
J 824
4 320
Total calls
24 316
29 703
33 735
3S 552
38 293
38 936
9 804
9 882
8 882
9 514
9 407
11 133
10 706
10 237
10 137
Fire calls lndw;- Non-
trial industrial
S38
648
618
513
S22
443
140
127
99
J22
108
114
100
105
110
9 307
JO S67
10 881
11 3S6
II 264
II 042
2 386
3 529
2 646
2 059
2 364
3 973
3 615
2 671
2 3S4
False alarms
7 660
9 862
13 022
13 61S
17 293
18 4S9
4 662
4 233
4132
4 921
4 604
4 802
4 8S4
5 309
5 484
Special service
calls
6 811
8 626
9 2J4
10 068
9 214
8 992
2 616
J 993
2 oos 2412
2 331
2 244
2137
2 IS2
2189
(B) FIRE PREVENTION STATISTICS§
Fire inspections
Places of
public enter
tainment
Restaurants
and night clubs
2 836 18 214
3 J90 J3 089
3 670 J J 454
3 157 12 496
30S9 J2066
4 JS3 J2 842
834
847
798
837
987
I S31
I 162
995
I 313
3 080
3 066
2 879
3 IS9
3 S80
3 224
2 940
3 929
4 209
Schools Ventilation
systems
J JJO
J 83S
2 218
I 807
I 446
I 274
29S
399
340
338
300
296
324
3SS
392
8 43S
I 343
I 399
3 S20
4 342
s 631
I 072
I 197
I 278
I 246
I 445
I 662
I 480
I 339
I 268
Miscellaneous
Total
4 696 IS6 021
5 418 83 SIO
s 8S9 78 208
6 729 73 570
s 140 72 234
4 376 67 ISO
1113 174SO
l 263 22 602
I 082 IS 442
l 136 16 973
1 002 15 967
I IS6 18 768
I 104 15400
I 228 IS 846
I 022 20 334
Ambulance calls
Emergency
23S 200
250 323
281 34S
302 849
312 630
312 46S
81 416
76 S36
78 804
77 16S
81 009
7S 487
S4 981
S7 S24
6J 266
Removal
106 766
llS 2SJ
IJ9 S86
JJ8 8J7
llS S7J
J20 47S
28 S99
29 411
3J 06J
30 6J5
30 303
28 496
46 143
44 950
46 910
Fatalities
Fire Ind.us- Non-
trial industrial
14
2
5
2
28
31
20
19
44
39
18
II
3
7
14
J5
21
3
8
Special services
322
408
422
432
409
384
107
IOI
84
96
JOO
J04
93
99
93
Fire prevention
Full building/
area surveys
5 231
5 737
4011
3 809
3 198
I 008
I 006
87S
870
779
674
63S
681
711
Plans Licences finalised issued/
Ventila-New ting
projects systems
7 347
8 SSS
9 216
8 219
7 911
6 811
I 968
I 821
I 612
I 779
I 681
I 739
I 619
I S98
I SSO
I 966
2 387
2 718
2 332
2 739
596
684
S68
660
700
811
S78
S45
S78
renewed
4 871
4 984
4 9J3
4 889
5 268
5 138
l 337
I 338
I 33S
I 332
I 282
I 189
I 270
I 246
I 498
Fire hazard abate
ment notices issued
s 727
6 120
6 780
s 834
6 915
6 910
I 933
I 819
2 846
I 415
I 348
I 301
732
I 148
I 5SI
Prosecutions undertaken
Fines Cases imposed
$
4677 1,680,940
I SOO l, 153,385
I 386 3,291,075
I 216 3,557,550
839 2, S25, oso
613 1,938,840
220
196
182
149
168
114
107
141
102
719,ISO
599,600
542,450
446,400
546,990
403,000
314,600
S17,9SO
436,3SO
§ Methods of classification and counting for the statistics on fire inspection and fire prevention have been revised since 1 January 1986. Figures as from lst quarter 1986 omvards are new series which are not strictly comparable with the previous serieo.
102 Hong Kong Monthly Digest of Statistics October 1991
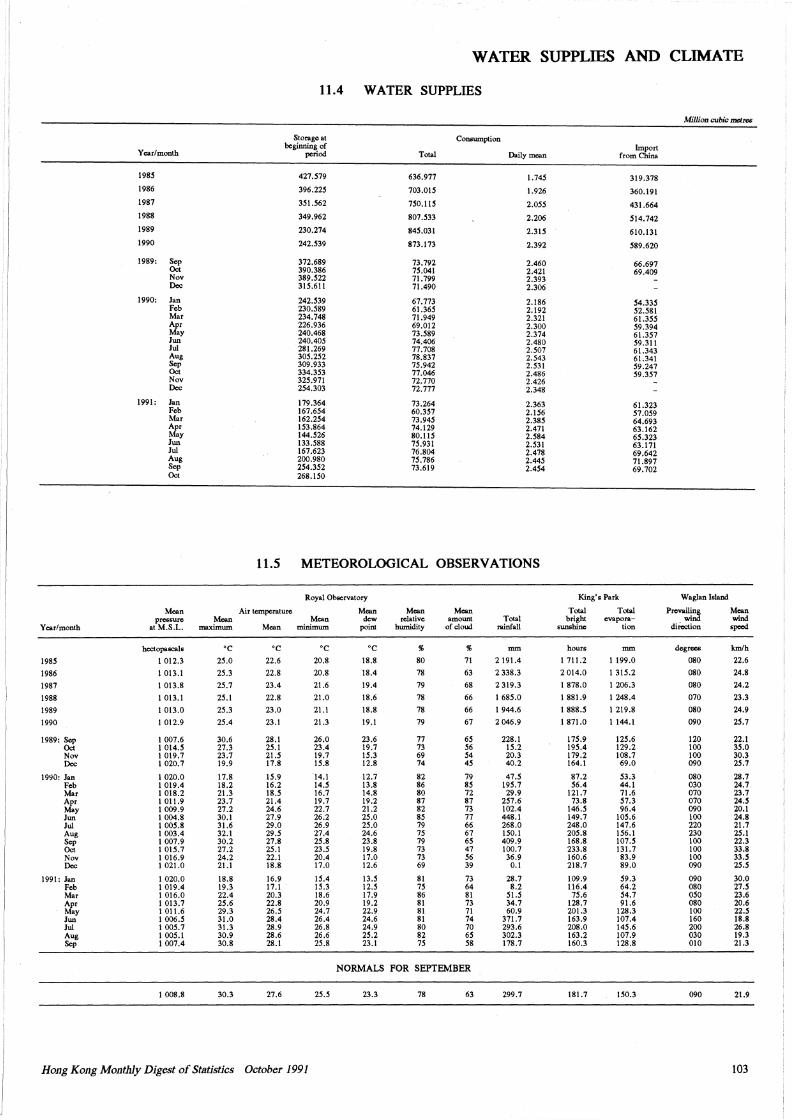
WATER SUPPLIES AND CLIMATE
11.4 WATER SUPPLIES
Million cubic metres
Storage at Consumption
Year/month beginning of Import
period Total Daily mean from China
1985 421.519 636.977 l.745 319.378 1986 396.225 703.015 l.926 360.191 1987 351.562 750.115 2.055 431.664 1988 349.962 807.533 2.206 514.142 1989 230.274 845.031 2.315 610.131 1990 242.539 873.173 2.392 589.620
1989: Sep 372.689 73.792 2.460 66.697 Oct 390.386 75.041 2.421 69.409 Nov 389.522 71. 799 2.393 Dec 315.611 71.490 2.306
1990: Jan 242.539 67.773 2.186 54.335 Feb 230.589 61.365 2.192 52.581 Mar 234.748 71.949 2.321 61.355 Apr 226.936 69.012 2.300 59.394 May 240.468 73.589 2.374 61.357 Jun 240.405 74.406 2.480 59.311 Jui 281.269 77.708 2.507 61.343 Aug 305.252 78.837 2.543 61.341 Sep 309.933 75.942 2.531 59.247 Oct 334.353 77.046 2.486 59.357 Nov 325.971 72.770 2.426 Dec 254.303 72.777 2.348
1991: Jan 179.364 73.264 2.363 61.323 Feb 167.654 60.357 2.156 51.059 Mar 162.254 73.945 2.385 64.693 Apr 153.864 74.129 2.471 63.162 May 144.526 80.115 2.584 65.323 Jun 133.588 75.931 2.531 63.171 Jui 167.623 76.804 2.478 69.642 Aug 200.980 75. 786 2.445 71.897 Sep 254.352 73.619 2.454 69.702 Oct 268.150
11.5 METEOROLOGICAL OBSERVATIONS
Royal Observatory King's Park Waglan Island
Mean Air temperature Mean Mean Mean Total Total Prevailing Mean pressure Mean Mean dew relative amount Total bright evapora- wind wind
Year/month at M.S.L. maximum Mean minimum point humidity of cloud rainfall sunshine tion difcction speed
hc:ctopascals oc oc oc oc % % mm hours mm degrees km/h
1985 l 012.3 25.0 22.6 20.8 18.8 80 71 2 191.4 l 711.2 l 199.0 080 22.6
1986 l 013.l 25.3 22.8 20.8 18.4 78 63 2 338.3 2014.0 I 315.2 080 24.8
1987 l 013.8 25.7 23.4 21.6 19.4 79 68 2 319.3 l 878.0 I 206.3 080 24.2
1988 l 013.l 25.l 22.8 21.0 18.6 78 66 l 685.0 l 881.9 I 248.4 070 23.3
1989 I 013.0 25.3 23.0 21.l 18.8 78 66 I 944.6 I 888.5 I 219.8 080 24.9
1990 l 012.9 25.4 23.l 21.3 19.l 79 67 2 046.9 I 871.0 1144.l 090 25.7
1989: Sep l 007.6 30.6 28.l 26.0 23.6 77 65 228.l 175.9 125.6 120 22.l Oct I 014.5 27.3 25.l 23.4 19.7 73 56 15.2 195.4 129.2 100 35.0 Nov I 019.7 23.7 21.S 19.7 15.3 69 54 20.3 179.2 108.7 100 30.3 Dec l 020.7 19.9 17.8 15.8 12.8 74 45 40.2 164.l 69.0 090 25.7
1990: Jan l 020.0 17.8 15.9 14.l 12.7 82 79 47.5 87.2 53.3 080 28.7 Feb l 019.4 18.2 16.2 14.5 13.8 86 85 195.7 56.4 44.l 030 24.7 Mar l 018.2 21.3 18.5 16.7 14.8 80 72 29.9 121.7 71.6 070 23.7 Apr l 01 l.9 23.7 21.4 19.7 19.2 87 87 257.6 73.8 57.3 070 24.5 May l 009.9 27.2 24.6 22.7 21.2 82 73 102.4 146.5 96.4 090 20.1 Jun l 004.8 30.l 27.9 26.2 25.0 85 77 448.l 149.7 105.6 100 24.8 Jui l 005.8 31.6 29.0 26.9 25.0 79 66 268.0 248.0 147.6 220 21.7 Aug l 003.4 32.1 29.5 27.4 24.6 15 67 150.l 205.8 156.l 230 25.l Sep l 007.9 30.2 27.8 25.8 23.8 79 65 409.9 168.8 107.5 100 22.3 Oct 1 015.7 27.2 25.1 23.5 19.8 73 47 100.7 233.8 131.7 100 33.8 Nov l 016.9 24.2 22.l 20.4 17.0 73 56 36.9 160.6 83.9 100 33.5 Dec l 021.0 21.l 18.8 17.0 12.6 69 39 0.1 218.7 89.0 090 25.5
1991: Jan l 020.0 18.8 16.9 15.4 13.5 81 73 28.7 109.9 59.3 090 30.0 Feb l 019.4 19.3 17.l 15.3 12.5 75 64 8.2 116.4 64.2 080 27.5 Mar l 016.0 22.4 20.3 18.6 17.9 86 81 51.5 75.6 54.7 050 23.6 Apr I 013.7 25.6 22.8 20.9 19.2 81 73 34.7 128.7 91.6 080 20.6 May I 011.6 29.3 26.5 24.7 22.9 81 71 60.9 201.3 128.3 100 22.5 Jun l 006.5 31.0 28.4 26.4 24.6 81 74 371.7 163.9 107.4 160 18.8 Jui I 005.7 31.3 28.9 26.8 24.9 80 70 293.6 208.0 145.6 200 26.8 Aug l 005.l 30.9 28.6 26.6 25.2 82 65 302.3 163.2 107.9 030 19.3 Sep I 007.4 30.8 28.l 25.8 23.1 75 58 178.7 160.3 128.8 010 21.3
NORMALS FOR SEPTElviBER
l 008.8 30.3 27.6 25.5 23.3 78 63 299.7 181.7 150.3 090 21.9
Hong Kong Monthly Digest of Statistics October 1991 103
EXPLANATORY NOTES
PART I REGULAR TABLES
Section I POPULATION AND VITAL STATISTICS
The mid-year and end-year population figures are estimated by adjusting Population Census/ByCensus results for total births, deaths and balance of migration whether legal or illegal, over a period.
These estimates include local residents, permanent and temporary foreign ~esidents, military personnel, visitors from foreign countries and Vietnamese refugees in Hong Kong at a point of time, i.e. 30 June or31 December each year.
While the birth rate, death rate and rate of natural increase are calculated by relating the known births, the known deaths and their difference in a year to their corresponding mid-year population, the infant mortality rate is obtained by relating the known infant deaths in a year to the known births in the same year. Births and deaths of Vietnamese refugees are excluded. All rates refer to a calendar year except the population growth rate which refers to a period from 1 July of a year to 30 June of the following year.
Statistics relating to births, deaths and marriages refer to such events as were registered with the Director of Immigration during the period covered, and do not necessarily equate exactly to the number of events which occurred during that period. The marriage figures include marriages performed at the official registries and at licensed places of public worship; they include also marriages other than first marriages.
Section 2 LABOUR
Labour force statistics refer to the land civilian non-institutional population aged 15 and above. The figures for 1981 are averages of the 1981 Population Census and the August to October 1981 General Household Survey. Annual figures for 1982 onwards are averages of the quarterly General Household Surveys. For the quarterly estimates, figures for any two consecutive moving quarters do not reflect the quarterly movements as two months are overlapping in the quarters. To measure quarter-to-quarter changes, comparison should be made of the reference quarter and the quarter three months ago. As the proportion of first-time job-seekers (e.g. people who have just left school) varies from month to month, unemployment rates which have been seasonally adjusted for the variation in first-time job-seekers are given for making comparisons over time. Underemployed is the number of employed persons who work short hours and are seeking more work. Underemployment rate refers to the proportion oflabour force who are underemployed.
Prior to April 1980, statistics of employment and vacancies were compiled quarterly from separate employment surveys in various sectors.
Starting from April 1980, statistics of employment, vacancies and payroll were collected quarterly by an integrated survey of employment, vacancies and payroll. The survey covers the following industry sectors:
Industry Sector Description
2 Mining and Quarrying 3" Manufacturing 4 Electricity and Gas 6 Wholesale, Retail and Import/Export Trades, Restaurants and Hotels 7 Transport, Storage and Communication 8 Financing, Insurance, Real Estate and Business Services 9 Community. Social and Personal Services
For Industry Sectors 7 and 9, the coverage is incomplete. Major expansions of industry coverage in these two major divisions took place in 1970, 1976 and 1977. As for Industry Sector 8, there was also a major expansion of industry coverage in 1973. Complete coverage of industry was attained in 1975. Economic activities not yet covered by the survey are:
Economic Activities Industry Sector Not Covered
1 Agriculture, hunting, forestry and fishing (whole sector) 6 Hawkers; street vendors; retail pitches (other than market stalls) 7 Taxis, public light buses, marine cargo handling services and tow boats 9 Veterinary services, religious organizations, authors and other independent
artists, domestic servants, and miscellaneous recreational and personal services
For the construction block, statistics covers all private sector sites registered in the Buildings Ordinance Office of Buildings and Lands Department, sites reported by the Eastern Harbour Crossing and Tate's Cairn Tunnel, all public sector sites under the charge of the Architectural Services Department, Civil Engineering Services Department, Drainage Services Department, Highways Department, Territory Development Department, Water Supplies Department and Housing Department, and sites under the control of the Mass Transit Railway Corporation (MTRC), the Kowloon--(:anton Railway Corporation (KCRC) and \he Provisional Airport Authority (PAA). However, construction projects for village-type houses in the New Territories and minor alterations, repairs, maintenance and interior decoration of existing buildings are not included.
In the Quarterly Report of Employment, Vacancies and Payroll Statistics, sites under the control of government departments or the MTRC, KCRC and the PAA are classified as public sector sites, whereas those registered with the Buildings Ordinance Office, including superstructure on sites above the MTRC stations or KCRC stations, and sites reported by the Eastern Harbour Crossing and Tate's Cairn Tunnel are classified as private sector sites.
As from the second quarter of 1985, employment figures in the public sector are compiled from the returns submitted by individual Government departments to the Civil Service Branch. Persons engaged include all direct employees paid under the personal emolument vote on the reference date which, since this quarter, falls on the first of January, April, July, October of each year. This change in definition and reference date has negligible effect on the continuity of the employment series in the public sector. Classification of Government departments and sections by purpose is based on the System of National Accounts Classification for Government expenditure with some modifications.
An 'establishment' is defined as ari economic unit which engages, under a single ownership or control, in one (or predominantly one) kind of economic activity at a single physical location.
'Persons engaged' refer to working proprietors, active business partners, unpaid family workers and all employees of the establishment who are either at work for pay or profit, or are temporarily absent from work, i.e. on short-term leave such as sick leave, casual leave or paid vacation. Excluded are outworkers, and persons on indefinite leave and on pension. Part-time and casual employees and unpaid family workers who worked for less than 3 hours of the normal working time on the reference date are also not included.
'Reported Vacancies' refer to those unfilled, immediately available job openings for which the establishment is actively trying to recruit personnel.
'Payroll' refers to wages and salaries, bonuses and gratuities, commissions and allowances and cash payment in other forms paid directly to all employees. Profits earned by proprietors and business partners, pensions, and payment to outworkers are however excluded.
The 'nominal index of payroll per person engaged' is derived from the employment and total payroll figures. The 'real index of payroll per person engaged' is obtained by dividing the nominal index by the Consumer Price Index (A) to adjust for changes in purchasing power.
'Payroll per person engaged' should not be interpreted as average income of employees. Firstly, the time period covered by employment figures is not the same as that covered by monthly payroll figures. Employment figures refer to a reference date, while monthly payroll is obtained by aggregating cash payments made over the whole month. Secondly, 'payroll' refers to payments to employees, whereas 'persons engaged' includes more than just employees. It also includes working proprietors, business partners and unpaid family members who normally are not on the payroll. Finally, as far as income is concerned, employees' income usually is not just limited to cash payments for work as reflected in payroll figures. Furthermore, because of the fact that 'persons engaged' includes some who are not on the payroll and the magnitude of such persons varies between sectors, comparison of absolute values of payroll per person engaged between sectors is not meaningful.
Hong Kong Monthly Digest of Statistics October 1991
However, movements in the nominal and real indexes of payroll per person engaged can be used as indicators of changes in average earnings of employees provided that the employment structure remains stable over time.
Prior to the first quarter of 1991, breakdowns of employment and vacancy statistics by industry were published under !SIC (International Standard Industrial Classification). Starting from the first quarter of 1991, these statistics will be published at HSIC (Hong Kong Standard Industrial Classification). The HSIC is a new standard industry classification system which will be adopted by all surveys conducted by the Census & Statistics Department. It should be noted that in some occasions, detailed breakdowns of employment and vacancy statistics under ISIC are not directly comparable to those under HSIC. To facilitate comparison with the previous year, statistics for the relevant quarters in 1990 are re-compiled using the HSIC and presented in this report.
As from the March 1991, the indexes of 'Payroll per Person Engaged' have been rebased with March 1991=100. To facilitate comparison with previous year, indexes for the relevant quarters in 1990 have been re-compiled.
Starting from March 1991, distributors of LP Gas through a system of main previously classified under industry sector 6 (Wholesale, Retail and Import/Export Trades, Restaurants and Hotels) have been reclassified into industry sector 4 (Electricity, Gas and Water). Figures for March 1990 to December 1990 have been adjusted to conform to the new classification.
As from March 1991, some establishments previously classified under 'electrical repair shops' of industry sector 9 (Community, Social and Personal Services) have been reclassified into 'electrical fitting with water plumbing' of industry sector 5 which is an economic activity not covered in this report. Figures for March 1990 to December 1990 have been adjusted to conform to the new classification.
Concurrent with the Survey of Employment, Vacancies and Payroll (SEVP), an industry updating survey (IUS) has been undertaken to collect up-to-date information on business activities of each establishment starting from the September 1982 round ofSEVP. The third round of the !US for the services block (i.e. Industry Sector 7, 8 and 9) was conducted concurrently with the March 1988 round of the SEVP whereas the fourth round for the industrial block (i.e. Industry Sector 2, 3 and 4) and the distributive trade block (i.e. Industry Sector 6) were conducted concurrently with the September 1988 round and June 1989 round of SEVP respectively. Results of an !US conducted before 1990 have been used to compile statistics at a time lag of one year. Statistics before incorporating the results of an IUS are not strictly comparable with those which have incorporated the results. As from the second quarter of 1988, the statistics before incorporating the results of the !US wjll no longer be published. On the other hand, the indexes have been spliced in such a way that comparison of changes over time can directly be made. As from the June 1991 round of SEVP, results of industry updating are updated to the sampling frame on a continuous manner and statistics are compiled based on the most updated information in the sampling frame.
Figures of establishments, employment and vacancies refer to March, June, September and December of the year. But prior to the second quarter of 1980, figures for Industry Sectors 7 and 8 referred to February, May, August and November of each year; and those for Civil Service referred to January, April, July and October of each year as from the second quarter 1985.
The Census and Statistics Department had, since 1964, compiled and published wage indexe8 to measure the changes in wage rates, both including and excluding fringe benefits, of manual workers in selected industries mainly in the manufacturing sector, based on the findings of a half-yearly Wage Survey.
In March 1982, a new quarterly Survey of Wages, Salaries and Employee Benefits was introduced to replace the half-yearly Wage Survey. A number of improvements were made, including the collection of statistics on wage rates at more frequent intervals, the use of a larger sample (about 2 OOO establishments) to achieve a higher degree of precision in the estimates for each industry covered, and an extension in coverage to include the non-manufacturing sectors and non-manual workers so as to make the statistics more representative (employees at the administrative and professional levels are, however, still excluded). The details of the differences between the old and the new survey are given in the "Quarterly Report of Wages, Salaries and Employees Benefits Statistics for March, June and September 1982, Volume!". After the September 1989 survey, the frequency of the survey has been changed to half-yearly.
Based on the findings of the new survey, a Nominal Wage Index and a Real Wage Index are compiled. These wage indexes measure the "pure" changes in wage rates by holding the structural pattern of the labour force with respect to industry, occupation, sex and mode of payment the same as that of March 1982, which is the based period of the Wage Indexes. While the Nominal Wage Index measures the changes in wage rates in money terms, the Real Wage Index, which is obtained by deflating the Nominal Wage Index by the Consumer Price Index (A), measures the changes in the purchasing power of the amount of money earned. Apart from basic wages and salaries, wage rate is defined to include also cost-of-living allowance, meal benefits, commission and tips, good attendance bonus, night shift allowance, year-end bonus and other guaranteed and regular bonuses and allowances. There is no distinction made between wage rates with and without fringe benefits in compiling the New Wage Indexes. Since all the wage elemerits mentioned above are included in compiling the New Wage Indexes, they are roughly equal to the definition of the wage rate including fringe benefits in the old survey.
In reading the wage statistics, users are reminded to note that the change in the wage index for a particular industry between any two months may be different from the change derived by comparing the published wage rate figures for that industry of the corresponding months. As the wage index is designed to measure the "pure" change in wage rates by holding constant the structure of the labour force with respect to industry, occupation, sex and mode of payment, the movement as indicated by the wage indexes should always be used to measure changes in wage rates.
There are differences in the interpretation of wage and payroll indexes. Essentially, the wage indexes, which measure the changes in the price of labour, are concerned with the movements of wage rates which indicate the amount of remuneration for normal time of work. On the other hand, per-capita payroll indexes reflect the changes in the amount of cash earnings workers receive during a particular period. The movements of the per-capita payroll indexes are affected by changes in wage rates, as well as changes in such other factors as the amount of time actually worked, the composition of the labour force and the incidence of the payment of bonuses and back-pay. As a result, the movements ofthe·wage indexes do not necessarily agree with those for per-capita payroll.
The average daily wages statistics in Table 2.10 are compiled based on the statistical returns obtained from contractors engaged in Government building and construction projects. The wage rate is defined to include basic wage, meal allowance, transportation allowance, 10-days statutory holidays and 7-days public holidays for daily-rated workers whilst sick leave and year-end bonuses are also included for monthly-rated workers.
Statistics on reported occupational accidents, industrial accidents and industrial work stoppages are supplied by the Labour Department.
Statistics on industrial work stoppages refer to number of work stoppages and the corresponding number of working days (or man-days) classified by International Standard Industrial Classification major divisions. These figures cover stoppages of work arising from disputes connected with terms and conditions of employment. Stoppages involving fewer than ten workers or lasting less than one day are excluded, unless the aggregate of working days lost exceeds 100. The number of workers involved is the number who actually cease work at the establishments where the disputes occur.
Reported occupational accidents refer to all accidents reported to the Labour Department which have resulted in the death of an employee or the total or partial incapacity of an employee for more than three days.
Industrial accidents refer to accidents occurred in industrial undertakings and arising out of industrial activities.
Section 3 EXTERNAL TRADE
External trade statistics comprise movements of cargo between Hong· Kong and other trading partners, by land, air and water and to a limited extent by post, with the exception of the following classes of goods: I. Transbipment cargo under through bill oflading or through air waybill; 2. Transit cargo; 3. Articles imported or exported by the armed forces of the Crown; 4. Ships~ stores, including bunker fuel; aircraft stores, including aviation fuel; 5. Personal baggage and possessions of travellers, not including motor vehicles; 6. Advertising materials supplied free of charge and samples of no commercial value or valued at
less than one thousand dollars;
7. Marine fish arriving direct from fishing grounds on fishing craft registered or licensed in Hong Kong;
8. Gifts of a personal nature where no payment has been made by the receiver; 9. Articles temporarily imported and exported sol~ly for exhibition and subsequent return; 10. Articles imported or exported under and in acc6rdance with an A.T.A. carnet for the temporary
admission of goods; 11. Circulatory used freight containers and the like; 12. Banknotes after issue into circulation, being legal tender in any country.
The trade accounts relate to movements of merchandise only, and do _not include those of bullion and specie.
Imports are c.i.f. values, exports and re-exports are f.o.b. values.
Due to the adoption of Standard International Trade Classification (Revision 2) as from January 1978, figures for earlier years are not strictly comparable with those for 1978 onwards.
The monthly figures are subject to adjustment of errors which may arise from various sources, such as mis-classification of commodity or country of consignment, wrong reporting of values or quaritities, a_nd lodgement of more than one declaration for the same consignment. As from 1978, adjustme·nts to these errors for consignments relating to earlier months are made to the cumulative totals only. It follows that the sums of the monthly figures may differ from the cumulative totals.
The Federal Republic of Germany (FRG) and German Democratic Republic (GDR) came into unification on 3 October 1990. The unified new state is known as FRG. As from October 1990, statistics on Hong Kong's trade with the FRG refer to those with the unified Germany. Where past data are presented, they are the total figures of the previous FRG and GDR in order to ensure comparability with the figures after unification. For separate statistics on Hong Kong's trade with the two independent states prior to October 1990, reference should be made to earlier publications.
As from October 1990, statistics on Hong Kong's trade with "Soviet Union and Eastern Europe" no longer include GDR. The statistics of the unified Germany are include in those of "Western Europe". Where past data are presented, the trade values for GDR have been deducted from those for "Soviet Union and Eastern Europe" and added to those for "Western Europe" in order to ensure comparability with the figures after German unification. For trade statistics of these regions prior to October 1990 without making any adjustment for German unification, reference should be made to earlier publications.
Similar approach is also adopted for presenting the quantum index for FRG. For simplicity and since Hong Kong had relatively little trade with the previous GDR, the unit value indexes of previous FRO alone are used for deflating the value index of the two states taken together to obtain the quantum index.
The trade index numbers are compiled from value and quantity data as published in the Hong Kong Trade Statistics. The unit values for domestic exports and re-exports are on an f.o.b. (free-on-board) basis while those for imports are on a c.i.f. (cost, insurance and freight) basis.
The unit value for each commodity classification item is the quotient of the value over its corresponding quantity. As such, the unit value series (as opposed to market prices) are not free of the effect of change, especially improvements, in quality or of change in product mix and markets or sources included within a commodity classification.
Quantum index numbers are derived by dividing the value index numbers by corresponding unit value index numbers; and as a result are derived as a residual and subject to the limitations mentioned above. The· unit value index numbers are base-weighted while the quantum index numbers are current-weighted. The monthly value and quantum indexes are derived by comparing trade figures in the current month with the average monthly data of the base year 1981.
As from March 1983, prices of selected imports (c.i.f.) and exports (f.o.b.) were collected and used to compile price indexes. These price indexes which are based on product specifications, are intended to substitute the unit value indexes where problems exist of changes in quality, product mix, markets and sources, etc.
The terms of trade index, which was up to December 1982 the ratio of the unit value index for domestic exports to that for imports, has been re-defined as the ratio of the unit value index for total exports (i.e. domestic exports and re-exports) to that for imports.
For inclusion in the compilation of the trade index numbers, 737 items out of a total of 1 874 items for domestic exports, 1 518 out of 3 162 for imports and l 039 out of 2 638 for re-exports are selected. In terms of value, the selected items accounted for 69 per cent, 71 per cent and 71 per cent for domestic exports, imports and re-exports respectively in the base year 1981.
Section 4 PRODUCTION
The Indexes of Industrial Production, the purpose of which is to reflect the changes over time of net output at constant prices, are based on results of the Quarterly Survey of Industrial Production. This survey is conducted by the Census and Statistics Department and covers all manufacturing establishments engaging 500 or more persons as well as a sample of the smaller establishments. The production index for an industry is compiled by aggregating the production quantity relatives or deflated value relatives of the primary products or industrial services in respect of the industry, using the values of sales of goods, industrial work and industrial services as weights. Deflated value relatives are adopted for those products that are too heterogeneous for quantity measurement. The production indexes of different industries are then aggregated to form indexes of industry groups, broad industry groups and 'All manufacturing industries', using the value added of different industries as weights which are updated annually based on the results of the latest round of the Annual Survey of Industrial Production.
The Indexes of Industrial Production in Table 4.1 cover the whole manufacturing industry, including the spinning and weaving industries. Statistics for the latter two industries, obtained by enumerating all spinning and weaving establishments engaging 20 or more persons and a random sample of the smaller establishments, are also shown separately in greater detail in the series of Index of Textile Production and Textile Production Statistics in Tables 4.2 and 4.3.
Items 4 to 6 in Table 4.3 exclude contributions from establishments engaged mainly in providing supporting services (e.g. yam winding, yam doubling, texturizing and miscellaneous weaving activities) to the spinning and weaving industries. However, figures for items l to 3 cover these establishments as well.
Statistics of cement production are supplied by the cement manufacturing companies, while statistics of quarry production are supplied by the Geotechnical Control Office of .the Civil Engineering Services Department.
Section 5 LAND, HOUSING, BUILDING AND CONSTRUCTION
Permanent living quarters statistics are compiled by the Census and Statistics Department. Before 1985 these statistics were compiled from a manual register of quarters. Since 1985 they are obtained from the computerized frame of quarters. A permanent living quarter is an enclosed space in a building built of permanent materials. And for such a space to be counted as a living quarter it must (i) be internally connected so that the occupants can move between rooms/cubicles or from one corner to another without going outside onto a public corridor, a landing or staircase; (ii) have direct access to a street, a corridor or landing without going through someone else' unit; and (iii) be built or used for the purpose of living.
Public housing comprises Housing Authority estate blocks and Housing Society buildings. Home Ownership Scheme also includes living quarters built under the Private Sector Participation Scheme and Middle Income Housing. Statistics on ·Housing Authority blocks and Home Ownership buildings are supplied by the Housing Department; statistics on Housing Society buildings are obtained from the Hong Kong Housing Society and details contained in the monthly returns of the Buildings Ordinance Office of the Buildings and Lands Department. This department also supplies data for the small village-type houses. With regard to all other private building projects as well as Private Sector Participation Scheme and Middle Income Housing, data are compiled from the above mentioned monthly returns.
A building is said to be 'completed' upon the issuance of an Occupation Permit by the Buildings Ordinance Office. of the Buildings and Lands Department in the case of a Housing Society building or a private building (except small village-type houses); and in the case of a small village-type house, a compliance certificate issued by that department; a Housing Authority block is 'completed' when it has been certified as substantially completed by the Chief Architects of the Housing Department.
'Consents' to commence work are issued by the Buildings Ordinance Office of the Buildings and Lands Department for Housing Society buildings and private buildings except small village-type houses where 'consents' are not necessary. In the case of Housing Authority blocks, 'consents' are not required and the date of award of contracts by the Housing Authority is taken as the consent date.
II
The 'usable floor area' of a flat is defined as the total floor area within the fiat excluding any staircases, lavatories, water closets, kitchens and other common areas of the building.
The 'lettable floor area' and 'saleable floor area' of a fiat refer to the total floor area inside the flat measured to the outside of the external walls and to the centre lines of the party walls, including the balcony, kitchen and water closet inside the flat. All common areas of the building are excluded.
The 'gross floor area' of a building is defined as 'the aggregate of the areas of the floor(s) in a building'.
Building statistics in Tables 5. 7 and 5.8 include only building activities in the private sector and those for Private Sector Participation Scheme and Middle Income Housing but exclude small village-type houses. 'Commercial buildings' refer to office buildings and mutli-purpose commercial premises. 'Industrial buildings' refer to flatted factories, specialised factory buildings and storage premises. 'Other buildings' refer to hotels and boarding houses, and premises for education, medical and health, social welfare, religion, culture, recreation, etc.
Statistics on price indexes in Table 5.9 are based on an analysis of all transactions scrutinized by the Rating and Valuation Department for stamp duty purposes with an agreement date within the quarter. The rental indexes in Table 5.10 are based on rental information recorded in the Rating and Valuation Department for new and fresh lettings effective in the quarter. For non-domestic premises, rentals negotiated on renewal are also included. Although all rentals are analysed on a net basis, i.e. exclusive of rates, management and other charges, no attempt is made to adjust for other contractual terms.
Information on instruments registered is supplied by the Registrar General. The figures in Table 5.11 up to December 1990 cover only Hong Kong Island, Kowloon and New Kowloon. As from January 1991, figures for New Territories are included. The terms used in Table 5.11 are explained as follows:
'Assignment': a deed transferring property from one part to another.
'Lot': a piece of Government land originally granted by the Government by auction, tender or private treaty grant.
'Section' and 'Sub-section': a lot can be carved into a number of smaller parts called sections. The sections may be of varying size and the area of each is clearly defined and labelled accordingly. A section can similarly be further carved into a number of smaller parts called sub-sections.
'Undivided share': a lot, section or sub-section can be shared jointly by two or more persons, the entitlement of each is called a share of lot or section or sub-section. Unlike a 'section' or 'sub-section', a share is just a percentage value with no explicit boundary defined as in a 'section' or 'sub-section'. Assignments or discrete flats are included here if the relevant building is located in an undivided lot and/or a particular section or sub-section of a lot.
'Building mortgages/building legal charges' (previously known as Building mortgages): mortgages secured for the purpose of financing building construction.
'Mortgages/legal charges other than building mortgages/building legal charges' (previously known as Mortgages other than building mortgages): highly varied and the mortgagee is not obliged to state the purpose of the mortgage. Many of these relate to mortgage arrangements for the purchase of residential flats and other building premises.
'Reassignments/receipts/discharges/releases and certificates of satisfaction' (previously known as Reassignments and certificates of satisfaction): when a loan is fully repaid and the mortgage redeemed, a 'reassignment/receipt/discharge/release' or 'certificate of satisfaction' will be prepared and registered at the Land Office.
'Agreements for sale and purchase': an agreement for future sale or purchase of property. The property may be a building under construction or a completed building.
'Tenancy agreements': agreement between a lessor and lessee concerning property letting.
'Exclusion orders issued under the Landlord and Tenant Ordinance':_ landlords of pre-war buildings who wanted to re-develop the property have to apply for an Exclusion Order with respect to Part One of the Landlord and Tenant Ordinance which mainly protects the interests of the existing tenants.
'Miscellaneous': all other types of transaction.
Statistics on the gross value of construction work (GVCW) performed by contractors are based on results obtained from the Quarterly Survey of Construction Output conducted by the Census and Statistics Department since 1983, for the purpose of providing prompt indications on the current output levels and trends in the construction sector. The register of construction establishments, which is maintained by the Census and Statistics Department based on information from the Business Registration Office of the Inland Revenue Department, provided the frame for selecting the sample of the Survey. All main contractors at construction sites, irrespective of their employment sizes, and other construction establishments engaging 100 persons or more are fully enumerated in the Survey. As regards the other establishments in the frame, a random sample stratified by trade and employment size is selected for enumeration. New construction works and renovation and maintenance include the erection of new buildings and structures and installation of service facilities such as utility fittings and ventilation systems; major alteration and conversion works on existing structures; demolition, site formation, piling and other sub-structure work preceding the actual erection of structures; and the restoration of existing buildings and structures to normal condition. Special trades refer to those contractors that specialize in delineated job areas such as concreting, scaffolding, carpentry, plumbing and gas work. A main contractor is one who enters into a contract directly with a property developer or the client party of a project, as distinct from a sub-contractor who obtains the job from another contractor. Due to the widespread sub-contracting practice in the construction sector, a construction establishment can be a main contractor for one contract but a sub-contractor for another contract simultaneously. The GVCW performed by main contractors refers to the output of those coristruction establishments in the projects in which they take the role of a main contractor, and does not include the construction output of projects where they play the role of sub-contractors. However, sub-contractors' contribution to projects should have been included in the GVCW performed by the main contractors for whom they worked. Hence statistics on the GVCW performed by main contractors are preferred to those on the total GVCW performed by all contractors in assessing the level of construction activity, as the former are free from the effect of double-counting the construction output of sub-contractors. All figures on the GVCW performed are measured at current prices. The Index of GVCW performed by main contractors is also computed on the basis of current price level with no adjustment for price changes.
Statistics on disposals of Government land are supplied by the Buildings and Lands Department.
Letter 'A' and 'B' tender system in the New Territories: when it is necessary for Government to acquire land for public purposes the Government exercises its power under the Crown Lands Resumption Ordinance. Where land is required within an area embraced by an approved layout plan, the policy is to give the lessee of private land the opportunity of surrendering his land voluntarily in exchange for the right to be granted Government land at some future date. This right is contained in a Letter called Letter 'A' or Letter 'B'.
The realised premium of land acquired by a land exchange entitlement is calculated by deducting the Government's value of the resumed land from the value of the land to be granted prevailing at the time when the exchange entitlement letter was issued. The realised premium of land acquired through auction or public tender is the auctioned/tendered price of the land.
Land for special low cost housing projects, Home Ownership Schemes, for public utilities, schools, churches, temples, clinics welfare and certain charitable purposes is usually granted by private treaty, and in such cases, the premium charged varies from nothing for non-profit-making purposes up to the full market value for public utilities.
Section 6 TRANSPORT, COMMUNICATIONS AND TOURISM
Statistics on aircraft movements are taken from the reports of the Civil Aviation Department.
Statistics on river vessels and containers are supplied by the Marine Department while those on ocean-going vessels are derived from the Hong Kong Shipping Statistics System set up by the Census and Statistics Department. Ocean-going vessels are classified according to nationality. 'Vessels entered' refers to vessels arriving at Hong Kong whereas 'vessels cleared' refers to vessels leaving Hong Kong.
Statistics on cargoes carried by ocean-going vessels are based on the Shipping Statistics System set up by the Census and Statistics Department and are estimated from a sample of consignments on ocean cargo manifests. Statistics on cargoes carried by river vessels are supplied by the Marine Department, on airborne cargoes are supplied by the Civil Aviation Department, on cargoes carried by railway by the Kowloon-Canton Railway Corporation and on cargoes transported by road by the Customs and Excise Department. Starting with the February 1986 issue, statistics on international movements of commercial cargo by railway in Table 6,4 refer to the actual tonnage of cargo
Hong Kong Monthly Digest of Statistics October 1991
conveyed whereas those published in previous issues represent the loading capacity of wagons used for conveyance.
The total cargo discharged include inward direct shipment (or imports) and inward tranShipment, and total cargo loaded include outward direct shipment (or exports, including domestic exports and re-exports) and outward transhipment.
Statistics of passenger journeys on public transport, of motor vehicles registered and of vehicular traffic through toll-charged tunnels and vehicular ferry services are compiled by the Transport Department. The passenger journey figures include estimated passengers in vehicles carried by the Hong Kong & Yaumati Ferry Co.'s vehicular ferry services. A minor ferry service is any ferry service (other than Hongkong & Yaumati Ferry and Star Ferry) operated under a licence granted under the Ferries Ordinance, Cap. 104. Statistics on passenger journeys by 'Cross Harbour Tunnel' include passengers carried by Mass Transit Railway and Harbour tunnel buses.
Statistics on motor vehicles licensed shown in Table 6. 7 do not include the 162 tram cars of the Hongkong Tramways Ltd. and the 3 tramcars of the Peak Tram Co. Ltd.
Statistics on traffic accidents and casualties are supplied by the Royal Hong Kong Police Force. The traffic accident figures exclude accidents involving damages only.
Statistics on telephone services are supplied by the Hong Kong Telephone Company Ltd. and those on telecommunication and postal services by the Post Office.
Statistics on passenger arrivals and departures as well as Hong Kong resident departures are supplied by the Immigration Department. They refer exclusively to international movements of passengers or Hong Kong residents. Particulars on incoming visitors and hotels are supplied by the Hong Kong Tourist Association. From January 1986 onwards figures in Table 6.15 on visitor arrivals by country of residence differ from the 'Visitor Arrival Statistics' published by the Hong Kong Tourist Association since the former include visitors from the People's Republic of China but the latter do not.
Statistics of hotels and number of rooms are obtained from surveys conducted in June and December each year among Hong Kong Tourist Association members. These statistics are revised from time to time as information on current situation of hotel industry becomes available. Room occupa~cy rate is based on surveys conducted monthly among HKTA members.
Section 7 MONEY, BANKING AND FINANCE
Statistics on the money supply and on licensed banks, restricted licence banks and deposit-taking companies, in Tables 7.1 to 7.14 and 7.17 to 7.19, are based on data collected by the Commissioner of Banking on behalf of the Secretary for Monetary Affairs.
The definitions of money supply (Table 7.1 and 7.3) are:
Money supply definition 1 (Total): Notes and coins with the public, plus customers' demand deposits with licensed banks.
Money supply definition 2 (Total): Ml plus customers' savings and time deposits with licensed banks, plus negotiable certificates of deposit issued by licensed banks and held outside the monetary sector.
Money supply definition 3 (Total): M2 plus customers' deposits with restricted licence banks and deposit-taking companies plus negotiable certificates of deposit issued by restricted licence banks and deposit-taking companies held outside the monetary sector.
HK$M 1, HK$M2 and HK$M3 are the Hong Kong dollar components of these definitions.
All authorized institutions are defined here to include licensed banks, restricted licence banks and deposit-taking companies.
'Restricted licence banks' and 'deposit taking companies' were known as 'licensed deposit-taking companies' and 'registered deposit-taking companies' respectively before I February 1990.
The banking statistics (Table 7.3) exclude certificates of indebtedness issued by the Exchange Fund, and the equivalent note issue.
Licensed bank's quoted best lending rate, which refers to The Hongkong & Shanghai Banking Corporation Limited and Standard Chartered Bank's quoted best lending rate for general guidance of other licensed banks, as well as interest rates paid to depositors are supplied by the Secretary for Monetary Affairs. Interest rates for deposits over 12 months are determined by agreement between individual depositors and the licensed banks.
The closing Hong Kong Dollar Inter-bank Offered Rates (HIBOR) on or before December 1985 in Table 7 .16 are quoted from The Hongkong and Shanghai Banking Corpor_ation Limited and those from January 1986 onwards are quoted from Standard Chartered Bank. Figures of bank cheques cleared are supplied by the Clearing House of The Hong Kong Association of Banks.
Liabilities to and claims on banks outside Hong Kong are analysed by the country of the branch making or accepting the deposit, and not by the country of that branch's head office- e.g. a claim on the London branch of a US bank is shown against the United Kingdom, arid not against the United States.
Claims on non-bank customers incorporated outside Hong Kong are analysed by the country of incorporation, while claims on unincorporated customers are analysed by their recorded address. Columns 1 to 4 of Table 7.17-7.18 include liabilities to and claims on the head office (if any) overseas, and on any other branches overseas of the reporting institution in Hong Kong.
The figures for liabilities to banks outside Hong Kong, for claims on banks outside Hong Kong, and for claims on non-bank customers outside Hong Kong in Tables 7.17 to 7.18 do not exactly correspond with the appropriate items in Tables 7.4 to 7.6 respectively. This results from differences in classification of some accounts.
Statistics of exchange rates between the Hong Kong dollar (HKD) and currencies of selected countries are compiled by the Census and Statistics Department from quotations supplied mainly by the Hang Seng Bank Limited. Figures in Tables 7.19 to 7.21 refer to average closing middle-market telegraphic transfer rates. The currencies are selected for those countries which are major trading partners of Hong Kong. The exchange rates of the SDR are derived by multiplying the U.S. dollar (USD) value of the SDR as published by the !MF by the appropriate exchange rates of HKD against USD as published in the tables. The effective exchange rate indexes (EERI) measure movements in the weighted average of nominal exchange rates of HKD against the currencies of 15 principal trading partners. The principal trading partners are selected on the basis of their merchandise trade with Hong Kong and their relative importance in world trade. A new series of EERI has been released since 28 September 1987.
The new and the old EERI series have the following differences:
(a) Base period (b) Trade weights
(c) Averaging method (d) Frequencies of
indices
(i) (ii) (iii)
New
24-28 Oct. 1983 1975-1980, 1972 weights 1981-Sep. 1983, 1981 weights Oct. 1983 onwards, average of 1984-1986
weights Geometric
1975-1980, annual indexes
1981-1986, monthly and annual indexes
Jan. 1987 onwards, daily and monthly indexes
Old
18 Dec. 1971
} 1981
Arithmetic 1975-1980 annual indexes 1981-1982, monthly and annual indexes 1983-1987, daily, monthly and annual indexes
For more details in the new EERI, see the Special Review in the November 1987 issue of this Digest.
The following table shows the weights attached to the new EERI series:
Hong Kong Monthly Digest of Statistics October 1991
Weights attached(%)
Trade (import and
Selected export)- Import- Export-trading weighted weighted weighted partners Currrencies index Index index
Australia Dollar 2.29 2.13 2.46 Belgium Franc 0.77 0.98 0.55 Canada Dollar 1.78 0.78 2.84 China Renminbi 27.06 28.16 25.90 Fran:ce Franc 1.47 1.57 1.36 Germany, F.R. Deutsche Mark 4.08 2.74 5.49 Italy Lira 1.32 1.68 0.93 Japan Yen 15.09 24.35 5.30 Netherlands Guilder 1.04 0.63 1.48 Singapore Dollar 4.43 5.28 3.54 South Korea Won 4.01 5.57 2.37 Switzerland Franc 1.62 1.89 1.33 Taiwan Dollar 6.20 9.03 3.19 U.K. Sterling 5.01 4.58 5.46 U.S.A. Dollar 23.83 10.63 37.78
The Hong Kong Index on share prices and value of stock exchange turnover are supplied by The Stock Exchange of Hong Kong Ltd. The Hang Seng Index and Sectoral Sub-indices are compiled by the Hang Seng Bank Ltd. Sectoral sub-indices of the Hang Seng Index have been introduced since 13 January 1984, and closing share prices on that day are used as the basis for calculation. The base value of the sub-indices is 975.47 i.e. the closing Hang Seng Index for that day.
Statistics on futures trading and gold and silver exchange trading are supplied by the Hong Kong Futures Exchange Ltd. and The Chinese Gold and Silver Exchange Society respectively.
Section 8 PRICES AND RETAILING
The average retail prices of the principal foodstuffs are obtained by price investigators from market stalls and shops throughout Hong Kong during the periods specified.
The average wholesale prices of rice are supplied by the Trade Department, while those of live pigs, live cittle, fresh marine fish and fresh vegetables are supplied by the Agriculture and Fisheries Department.
The expenditure Weights of the 1989/90-based Consumer Price Indexes (CPis) shown in Tables 8.3-8.6 and the 1984/85-based CPls shown in Tables 8.7-8.9 were derived from the results of the Household Expenditure Survey conducted in 1989-90 and 1984-85 respectively. The expenditure brackets of the three CP!s, i.e. CPl(A), CPI(B) and Hang Seng CPI and the corresponding percentage of households covered by the indexes are given as follows:
Index
CPl(A) CPI (B) Hang Seng CPI
Approximate percent of households covered
50 30 lO
Monthly household expenditure in
1984/85
$ 2,000--$ 6,499 $ 6,500--$ 9,999 $10,000--$24,999
1989/90
$ 2,500--$ 9,999 $10,000--$17,499 $17,500--$37,499
The remaining 10 percent of households_ - at top and bottom of the household expenditure scale -are excluded.
Readers interested in information on household expenditure may refer to the report on the 1984/85 Household Expenditure Survey or to the report on the 1989/90 Household Expenditure Survey which will be released some time in July 1991.
A special review article introducing the seasonally adjusted consumer price indexes was published in the May 1983 issue of this Digest. Information on the objectives, method and interpretation of the figures can be found in the article.
Statistics on retail sales are compiled by the Census and Statistics Department based on data collected from a monthly survey of retail sales. The survey covers some I 200 establishments drawn from all the retail establishments registered with the Business Registration Office (BRO) of the Inland Revenue Department (IRD), and market stalls registered with the Urban Services Department (USD) and the Housing Department (HD), Excluded from the survey are hawkers, street vendors and retail pitches.
Statistics on restaurant receipts are compiled by the Census and Statistics Department based on data collected from a quarterly survey of restaurant receipts and purchases. The survey covers some 750 establishments drawn from all the catering establishments registered with the BRO of the IRD, the USD and the HD. Excluded from the survey are cooked food stalls operated outside the main structure of buildings, canteens attached to organizations open to members only, and catering outlets operated by and situated within hotels.
The value indexes measure the changes in value terms, while the volume indexes obtained by deflating the value indexes by specially constructed price indexes measure the changes in real terms.
Section 9 SOCIAL STATISTICS
Statistics of reported crime are supplied by the Royal Hong Kong Police Force and the Independent Commission Against Corruption. If a person is arrested/prosecuted on two or more occasions he is recorded once on each occasion; and when a person is arrested/prosecuted on the same occasion for two or more offences, one offence is selected for tabulation.
Statistics on notified infectious diseases and the number of in-patients treated and out-patient attendances in government ;ind government-assisted institutions are supplied by the Department of Health.
Statistics on public assistance schemes and special needs allowance schemes are supplied by the Social Welfare Department.
Section 10 ENERGY
Statistics on electricity and gas are supplied by the public utilities companies and those on petroleum products are obtained from the monthly returns submitted by the leading petroleum companies.
Section 11 MISCELLANEOUS
Government revenue and expenditure statistics are supplied by the Treasury. The analysis of revenue and expenditure by the broad groups as given in Table 11. l is made by the Census and Statistics Department. 'Direct taxes' include earnings and profit tax and estate duty; 'Indirect taxes' include duties, general rates, motor vehicle taxes, taxi concessions, royalties and concessions, taxes on bets and sweeps, entertainment and hotel accommodation, stamp duties and airport departure tax (introduced in 1983/84 only). 'Transfers to other funds' include transfers to Development Loan Fund, Home Ownership Fund, Mass Transit Fund and Student Loan Fund; 'Actual expenditure during the period' refers to expenditure other than transfers to funds.
Information on companies registered and dissolved is supplied by the Registrar General.
The fire services statistics are supplied by the Fire Services Department and refer to operational and preventive work.
Statistics on water supplies are supplied by the Water Supplies Department and refer to fresh water supply only (while salt water for flushing purposes is excluded). The maximum capacity of the existing 18 storage reservoirs is 577 .896 million cubic metres; before storage at the High Island Reservoir (since August 1977) began the maximum capacity was 305.396 million cubic metres. Figures for water imported from China are slightly different from those published in Hong Kong Trade Statistics. They refer to the quantity of water received from 09:00 hours on the first day of the month up to 09:00 hours on the first day of the following month whereas those published in the Hong Kong Trade Statistics represent the quantity of water paid for from the morning on the last day of the previous month to the morning on the last day of the month.
III
Statistics of meteorological observations are taken from the records of the Royal Observatory, King's Park and Waglan Island stations. The monthly normals for the various meteorological elements (except for the total evaporation, prevailing wind direction and mean wind speed) refer to the 30-year period 1951-1980. Due to the lack of data within the same period, normals for the prevailing wind direction and mean wind speed are the averages during the 30-year period 1953-1982. The normal for the total evaporation is obtained from the average for the period 1958-1984 and will be updated every year because the covering period is less than 30 years.
PART II PERIODIC TABLES Section 12 POPULATION AND MORTALITY STATISTICS See explanatory notes in Section 1 for mid-year population estimates in Table 12.1.
Statistics of deaths by cause are supplied by the Department of Health whereas those of life expectancy are compiled by the Census and Statistics Department.
Section 13 EDUCATION Statistics of schools and enrolment are supplied by the Education Department except those for the Universities and Polytechnics, and Technical Institutes which are supplied by the University and Polytechnic Grants Committee and Vocational Training Council respectively. The figures for institutes and enrolment by type of education refer to both day and evening classes. Enrolment for the Universities include undergraduates and postgraduates but exclude participants of extra-mural courses.
Section 14 WAGES AND EMPLOYEE BENEFITS A new annual Survey of Salaries and Employee Benefits {Managerial & Professional EmployeesExcluding Top Management) was conducted for the first time in September 1984. It collects information on salaries and fringe benefits of managerial and professional staff who are not covered by the Quarterly Survey of Wages, Salaries and Employee Benefits. The survey covers about 200 large and medium-sized companies in five economic sectors, namely the manufacturing/electricity; gas and steam sector; the building and construction and related trades sector; the wholesale/retail and import/export trades sector; the transport, storage and communication sector; and the financial institutions and insurance sector. Details of the survey methodology are given in "Report of Salary and Employee Benefits Statistics (Managerial and Professional Employees-Excluding Top Management)" published by the Census and Statistics Department.
Based on the findings of the new survey, a Nominal Salary Index (A) and Nominal Salary Index (B) are compiled. These salary indexes are designed to measure changes in salary rates using the occupational and industrial structures of June 1983, which is also taken as the base period of the indexes. Apart from basic salaries, the salary rate is defined to include also cost-of-living allowance, guaranteed year-end bonus, commission and tips and other guaranteed and regular bonuses and allowances. Other items which may contribute significantly to the total pay package of employees at this level such as profit-sharing bonus and housing allowance are not included in the definition of salary rate. However, statistics on these fringe benefits items are separately compiled and are expressed in terms of percentages of employees included in the survey entitled to such benefits in Table 14.2.
The Salary Index (A) is compiled by comparing the average of the salary levels of managerial and professional employees in June of the reference year with that in June 1983. It is a comprehensive measure of change in salary levels and it takes into account changes in salary level resulting from movements across companies and in and out of occupations as well as changes in salaries for those who remain in the same occupation and the same company in both years. While the Nominal Salary Index (A) measures the changes in salary rates in money terms, the Real Salary Index (A), which is obtained by deflating the Nominal Salary Index {A) by the Hang Seng Consumer Price Index, measures the changes in salary rates in real terms.
On the other hand, the Salary Index (B) measures the changes in salary levels only for those who remain in the same occupation and in the same company in two consecutive years. It therefore accounts only for changes due to a general increment, meritorious increases and gains in seniority, and should be useful to personnel managers in making salary adjustments. A Real Salary Index (B) is also compiled using the method adopted in deriving the Real Salary Index {A).
Large and medium-sized companies are defined as below:
Selected major economic sectors
Manufacturing/electricity, gas & steam Building & construction and related trades Wholesale/retail and import/export trades Transport, storage and communication Financial institutions and insurance (excluding holding
and investment companies) Holding and investment companies
Section 15 NATIONAL ACCOUNTS
No. of persons engaged
Large Medium-sized companies companies
~ 2000 200-1 999
~ 500 50- 499
~ 500 100- 499
~ 500 100- 499
~ 1 OOO 100- 999
~ 500 20- 499
Gross domestic product (GDP) is an aggregate measure of the total value of net output produced within the domestic boundary of a country or a territory in a specified period, say a calendar year, before provision for the consumption of fixed capital.
For Hong Kong, the Census and Statistics Department compiles expenditure-based estimates and the production-based estimates of the GDP.
Expenditure-based estimates for Hong Kong are compiled at both current market prices and at constant (1980) market prices. Current price estimates are valued at current period transaction prices. Constant price estimates are obtained by deflating the current price estimates of different categories of goods and services by the appropriate price indexes or by revaluing current period quantities at base year prices.
Production-based estimates for Hong Kong are compiled at current prices only.
I. Expenditure-based estimates The expenditure-based GDP estimate is the sum of private consumption expenditure, government
consumption expenditure, gross domestic fixed capital formation, change in stocks, and exports of goods and services, less imports of goods and services.
( 1) Private consumption expenditure:
This covers all expenditure by the household sector, including private non-profit bodies, on goods and services for current use. It is the sum of the estimates of consumption expenditure on goods and services in the domestic market and the expenditure of Hong Kong residents abroad less the expenditure of non-residents in the domestic market.
IV
Data sources for compiling the estimates include trade statistics, administrative statistics from government departments and various organizations, data collected from economic surveys, household surveys and other expenditure surveys conducted by the Census and Statistics Department.
( 2) Government consumption expenditure:
Government consumption expenditure refers to the current expenditure on goods and services by non-trading government departments and quasi-government non-profit bodies. Trading departments are distinguished from non-trading departments in that the former are engaged mainly in the production of goods and services for sale to the public.
Current expenditure on goods and services by non-trading departments and quasi-government bodies is the sum of compensation of employees and purchases of goods and services less receipts from sales of goods and services. The estimates in respect of non-trading departments are compiled based on an analysis of government accounts and other supplementary information supplied by government departments. Those for the quasi-government bodies are obtained from special enquiries on the income and expenditure of these bodies. Disbursements which are transfer payments are not included.
( 3) Gross domestic fixed capital formation:
Gross domestic fixed capital formation covers the gross value (i.e. without deducting allowances for consumption of fixed capital) of investment on buildings and construction as well as plant, machinery and equipment; real estate developers' margin; and transfer costs of land and buildings.
Estimates of investment on buildings and construction, real estate developers' margin, and transfer costs of land and buildings are compiled using data collected from quarterly and annual surveys of construction, the Housing Authority, various other government departments, the Mass Transit Railway Corporation and the Kowloon-Canton Railway Corporation.
Estimates of investment on plant, machinery and equipment are compiled on the basis of the commodity-flow method using data obtained from external trade statistics, government accounts, quarterly and annual surveys on local production, the Mass Transit Railway Corporation and the Kowloon-Canton Railway Corporation. -
( 4) Change in stocks:
The estimates refer to the value of physical change in the stocks of work-in-progress and stocks of goods held by manufacturers and distributors. The information is based on the opening and closing book values of stocks reported by the establishments in surveys. Change in stocks reflects changes in the physical quantities of stocks. Adjustments have been made for stock appreciation (i.e. the increase/decrease in value of stocks attributed to price changes) by revaluing the opening and closing stocks at the average current prices of the period.
( 5) Exports of goods:
Exports of goods include domestic exports and re-exports of merchandise recorded on an f.o.b. basis, exclusive of monetary gold.
(6) Exports of services:
These are transactions in services provided by Hong Kong residents to the rest of the world. Data are obtained from the Hong Kong Tourist Association, various sources of administrative statistics, and the Annual Survey of Imports and Exports of Services.
(7) Imports of goods and imports of services:
In the expenditure approach, the items private consumption expenditure, government consumption expenditure, gross domestic fixed capital formation, change in stocks and exports of goods and of services are added together and the values of imports of goods and of services are subtracted from the total. Such deduction has to be made so that the import contents associated with those items are eliminated to leave only the domestic contents. This is done at the aggregate level as it is impracticable to eliminate such import contents individually from each commodity or service.
Imports of goods are valued at c.i.f., covering all merchandise imports and a proportion of retained imports of gold which is taken for industrial use. Imports of services are estimated based on data obtained from various sources of administrative statistics, the Annual Survey of Imports and Exports of Services and the General Household Survey.
II. Production-based estimates
The production-based GDP estimate is the sum of the net output or 'value added' of productive units, e.g. factories, shops, service organizations. Value added is derived as gross output less intermediate consumption, i.e. the value of production less the value of non-durable goods and services used in production. From an alternative angle, value added can be equated with the sum of factor incomes, Le. compensation of employees {wages, salaries, bonuses, employee benefits, etc.) and gross operating surplus (the value attributed to non-labour factors of production inclusive of the provision for consumption of fixed capital). Data sources for compiling the estimates are economic surveys conducted by the Census and Statistics Department, government accounts and other administrative records.
Economic activities covered by the production-based estimates are classified broadly into the following: agriculture and fishing; mining and quarrying; manufacturing; electricity, gas and water; construction; wholesale, retail and import/export trades, restaurants and hotels; transport, storage and communication; financing, insurance, real estate and business services; community, social and personal services, and ownership of premises.
Ownership of premises is treated as an economic activity in the national accounts. This activity covers (i) rental services which households/persons as owners of premises provide to tenants, the value of which corresponds to rents received, and (ii) rental services which households/persons, government and private non-profit bodies as owners of premises provide to themselves, the value of which is imputed. However, rental services which commercial establishments as owners of premises provide to themselves are not included, since any imputed rent will simultaneously be an expense (intermediate consumption) and a receipt (gross output) for them, thus rendering the value-added unaffected. On the other hand, rental services which commercial establishments provide to tenants have been included in the gross output of the respective activities in which they are engaged.
Imputed bank service charge is an adjustment item relating to the financial services provided by the financial intermediaries to economic units in various economic activities, as the value of such financial services have not been fully included in the intermediate consumption estimates of those units. In accordance with the United Nations System of National Accounts, imputed bank service charge is calculated as the net interest receipt (i.e. interest received minus interest paid) of the financial intermediaries.
Further details on the compilation of GDP estimates are contained in the publication 'Estimates of Gross Domestic Product, 1966 to 1990'. Descriptions specific to quarterly GDP estimates are contained in the publication 'Gross Domestic Product: Quarterly Estimates and Revised Annual Estimates' published in August 1991.
Hong Kong Monthly Digest of Statistics October 1991
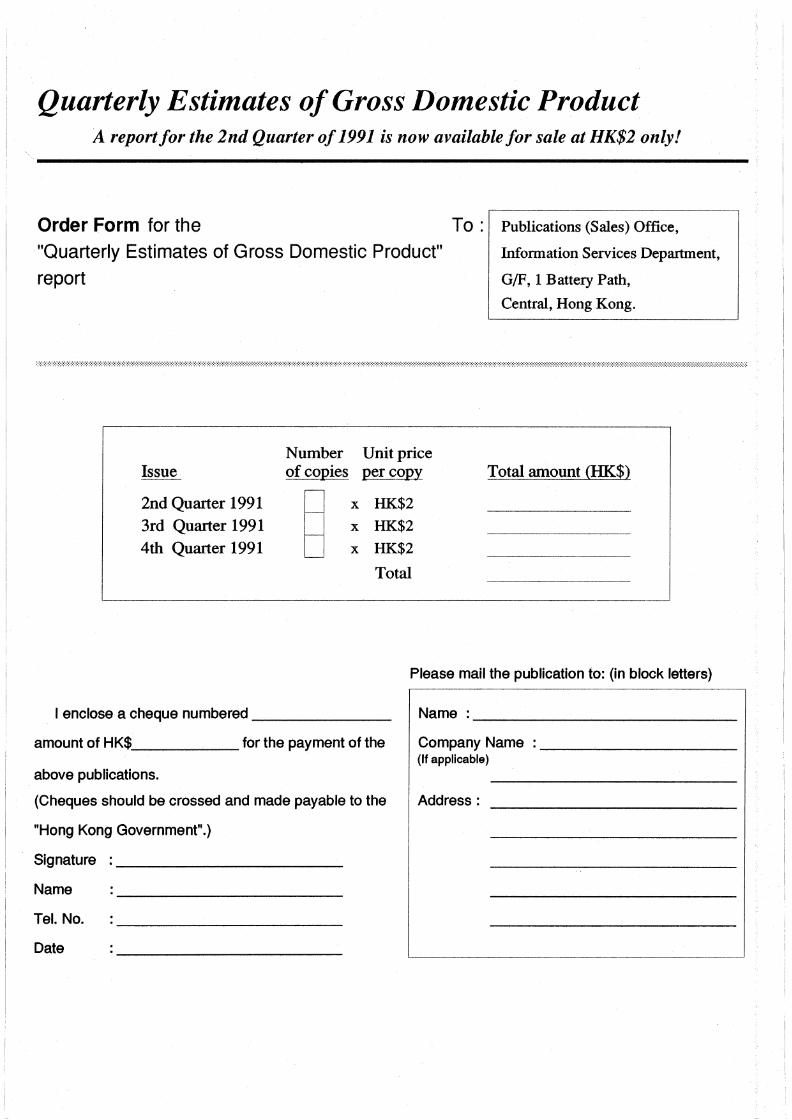
',
Quarterly Estimates of Gross Domestic Product A report for the 2nd Quarter of 1991 is now available for sale at HK$2 only!
--------------------------------------------------------------------
Order Form for the To : Publications (Sales) Office,
"Quarterly Estimates of Gross Domestic Product" Information Services Department,
report G/F, 1 Battery Path,
Central, Hong Kong.
2nd Quarter 1991 3rd Quarter 1991 4th Quarter 1991
Number Unit price of copies per copy
x HK$2
x HK$2
x HK$2
Total
Total amount (HK$)
Please mall the publication to: (In block letters)
I enclose a cheque numbered ______ _ Name: -------------amount of HK$_, _____ for the payment of the
above publications.
(Cheques should be crossed and made payable to the
"Hong Kong Government".)
Signature
Name
Tel. No.
Date
Company Name : ----'------(If applicable)
Address:
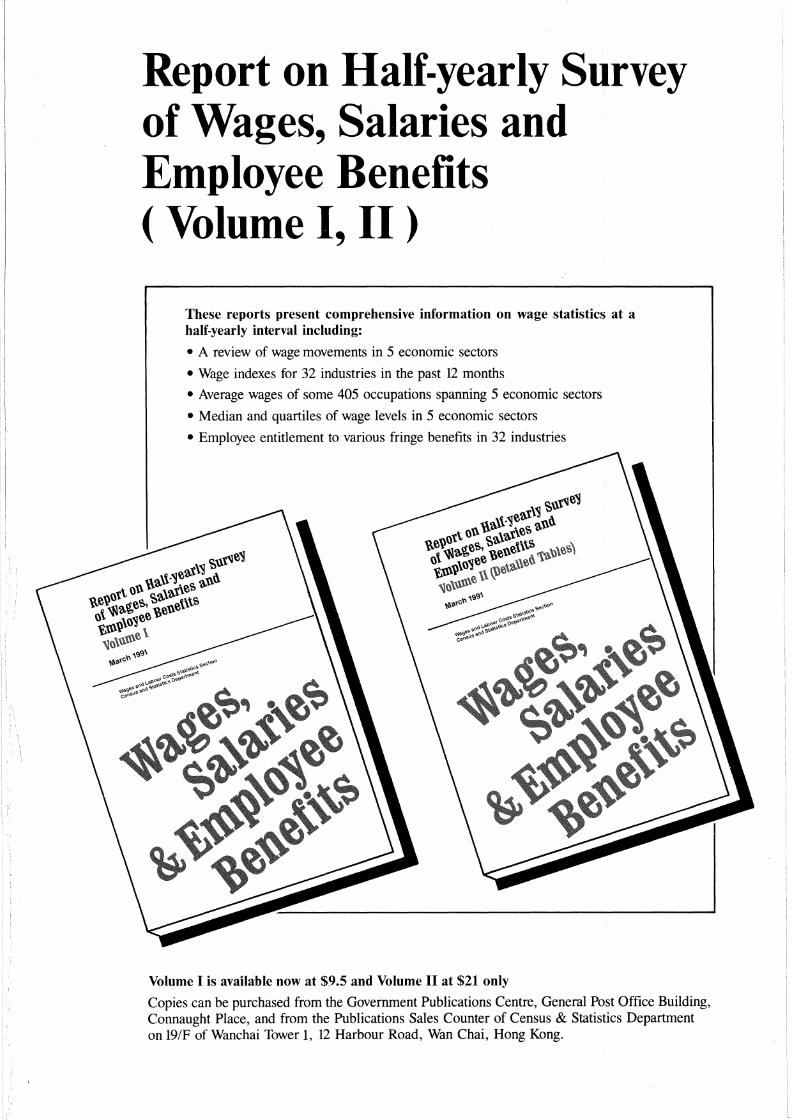
Report on Half-yearly Survey of Wages, Salaries and Employee Benefits ( Volume I, II )
These reports present comprehensive information on wage statistics at a half-yearly interval including:
• A review of wage movements in 5 economic sectors
• Wage indexes for 32 industries in the past 12 months
• Average wages of some 405 occupations spanning 5 economic sectors
• Median and quartiles of wage levels in 5 economic sectors
• Employee entitlement to various fringe benefits in 32 industries
Volume I is available now at $9.5 and Volume II at $21 only
Copies can be purchased from the Government Publications Centre, General Post Office Building, Connaught Place, and from the Publications Sales Counter of Census & Statistics Department on 19/F of Wanchai Tower 1, 12 Harbour Road, Wan Chai, Hong Kong.
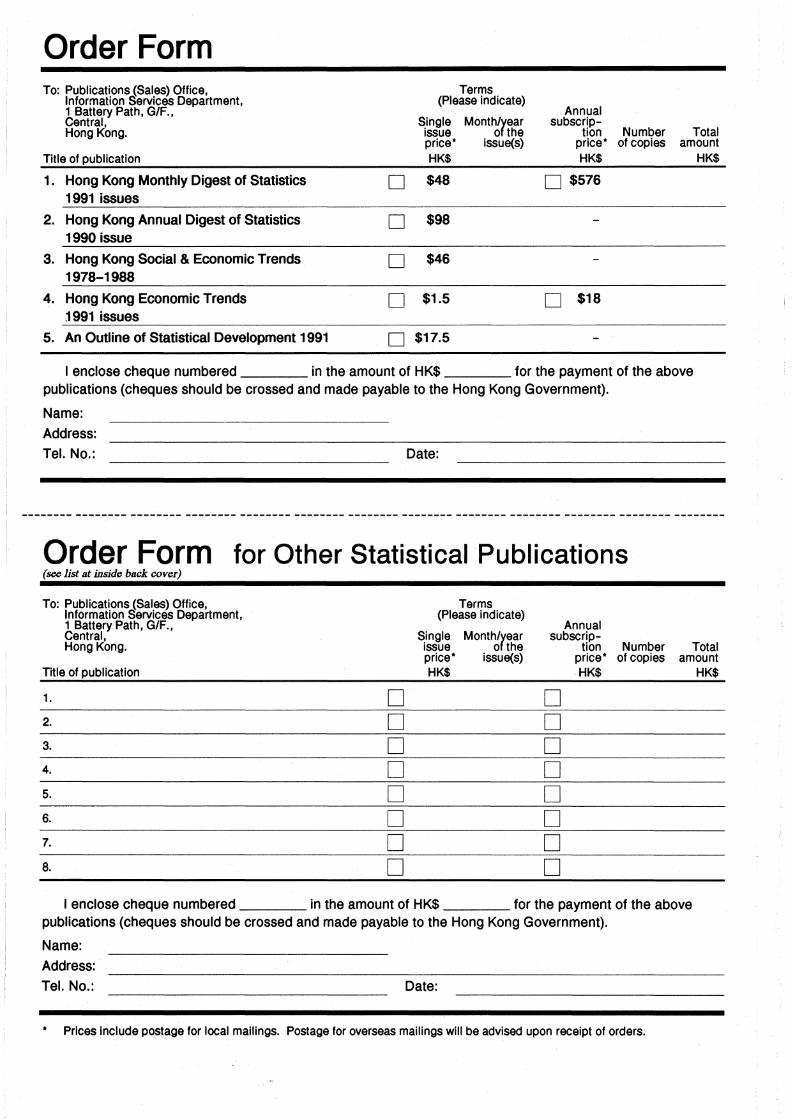
Order Form To: Publications (Sales) Office,
Information Services Department, 1 Battery Path, G/F., Central, Hong Kong.
Title of publication
1. Hong Kong Monthly Digest of Statistics 1991 issues
2. Hong Kong Annual Digest of Statistics 1990 issue
3. Hong Kong Social & Economic Trends 1978-1988
4. Hong Kong Economic Trends ,1991 issues
5. An Outline of Statistical Development 1991
D
D
D
D
D
Terms (Please indicate)
Single issue
Month/rear o the
price• issue(s) HK$
$48
$98
$46
$1.5
$17.5
Annual subscrip-
tion Number Total price• of copies amount HK$ HK$
D $576
D $18
I enclose cheque numbered in the amount of HK$ for the payment of the above publications (cheques should be crossed and made payable to the Hong Kong Government).
Name:
Address:
Tel. No.: Date:
Order Form for Other Statistical Publications (see list at inside back cover)
To: Publications (Sales) Office, Information Services Department, 1 Battery Path, G/F., Central, Hong Kong.
Title of publication
1.
2.
3.
4.
5.
6.
7.
8.
D D D D D D D D
Terms (Please indicate)
Single Month/year issue of the price• issue(s) HK$
Annual subscrip-
tion Number price• of copies HK$
D D D D D D D D
Total amount
HK$
I enclose cheque numbered in the amount of HK$ for the payment of the above publications (cheques should be crossed and made payable to the Hong Kong Government).
Name:
Address:
Tel. No.: Date:
Prices include postage for local mailings. Postage for overseas mailings will be advised upon receipt of orders.
t "l ... t I
' ' "'
,; --
i '1
r • .. .
..
i
j i , ..
PUBLICATIONS Produced by Census and Statistics Department
Title of Publication
Price in HK$ (excluding
postage)
Regular: Hong Kong Economic Trends (monthly) ... ...... ..... ... ....... .. ... .. . Hong Kong Monthly Digest of Statistics (monthly) ........... .. . Hong Kong External Trade (monthly) ..................................... . Hong Kong Trade Index Numbers (monthly) Hong Kong Trade Statistics 1991:
Imports (monthly) .. ... .. . Domestic Exports & Re-exports (.monthly)
Hong Kong Trade Statistics 1990: Annual Supplement, Country by Commodity
Imports ... ...................................... . Exports & Re-exports .. .... ...... . ........... .......... .......... .......... . .
Consumer Price Index Report (monthly) ......... ............ ... . Monthly Survey of Employment, Payroll and Orders-
on-Hand (monthly) .... ..... ..... ........ . ...................... ................ . Report on Monthly Survey of Retail Sales (monthly) ........... . Report on Quarterly Survey of Restaurant Receipts and
Purchases (quarterly) ................................ . ............ ..... ... . Report on Quarterly Business Survey (quarterly) ..... ... ....... .. . Report on the Quarterly Index of Industrial Production
(quarterly) ...... .... ......................................... ........... ......... ........ . Report on Texti le Product ion Statistics (quarterly) .. .... ... ... ... . Report on the Quarterly Survey of Construction Output
(quarterly) .. ............. ..... . ...... .......... . ....................................... . Quarterly Report of Employment and Vacancies at
Construct ion Sites (quarterly) .... .. .... ................... ..... ........ ... . Report of Employment, Vacancies and Payroll Statistics
(quarterly) ..... ....... ... ..... ... ... ........ ... .... ....... ... ..... ..... .... ...... .... ... . Genera l Household Survey Labour Force Characteristics
(quarterly) ... .. ...... .... ..... ..... ... ...... .... ..... ..... ..... ... . ..... ............. ... . Report on the Half-yearly Survey of Wages, Salaries and
Employee Benefits (half-yearly): Volume I .................................................... ..... ................... .. . (Detailed Tables) Volume 11 ...•..•.•.......•....•....•....•....•..•.•..•.•
Hong Kong Energy Statistics (Quarterly Supplement) ........ . Hong Kong Shipping Statistics (quarterly) ............................ . Hong Kong Shipping Statistics (yearly) .. ..... ..... ..... ... ....... ... .. . Employment & Vacancies Statistics (Detailed Tables) in
Manufacturing, Mining & Quarrying, Electricity & Gas 1990 (yearly) .. ... . . .......................................... .
Employment & Vacancies Statistics (Detailed Tables) in Transport, Storage & Communication, Financing, Insurance, Rea l Estate & Business Services, Community, Social & Personal Services 1990 (yearly) .............. ..... .
Employment & Vacancies Statistics (Detailed Tables) in Wholesale, Retai l, Import & Export Trades, Restaurants & Hotels 1990 (yearly) .............................................................. .
Hong Kong Annual Digest of Statistics 1990 Edition (yearly) ........................................................................... ........ .
Report of Salaries and Employee Benefits StatisticsManagerial and Professional Employees (Excluding Top Management) 1990 (yearly) ................................................ .
Annual Report on the Consumer Price Index 1990 (yearly) Hong Kong Review of Overseas Trade in 1990 (yearly) Hong Kong Energy Statistics 1980-1990 (yearly) ... ..... ..... ... . 1989 Survey of Industrial Production (yearly) ..... ..... ..... ..... ... . 1989 Survey of Wholesale, Retail and Import/Export
Trades, Restaurants and Hotels (yearly) ...... ..... ..... .. . 1989 Survey of Storage, Communications, Financing,
Insurance and Business Services (yearly) ... ... ....... ..... ... . 1989 Survey of Transport and Related Services (yearly) 1989 Survey of Building, Construction and Real Estate
Sectors (yearly) .. . .... ... ..... ..... .... ...... ..... ..... ..... . An Outline of Statistical Development 1991 (yearly) Estimates of Gross Domestic Product 1966 to 1990 (yearly) ;;jl::lfil!tii!.\11.lffi1iim·- fL/\7\0f~-.1LfLO"P ( 1f:f.&) ... .. . .
1.50 48.00 33.50
4.00
100.00 100.00
95.00 95.00
7.00
4.50 1.50
1.50 8.00
3.00 2.00
3.00
8.50
13.50
13.50
9.50 21.00
6.50 34.50 50.00
71.00
152.00
54.00
98.00
25.00 27.00 25.00 23.00 26.00
24.00
25.00 22.00
26.00 17.50 61.00 61.00
Title of Publication
Price in HK$ (excluding
postage)
Quarterly Estimates of Gross Domestic Product (Quarterly) Hong Kong Social and Economic Trends 1978-1988
(Biennial) ...... ..... ..... ..... ..... ... ...... .... ........................................ .
Irregular: Hong Kong 1991 Population Census:
Summary Results ...... ... ........ .. ...... ..... .. ...... ..... ...... ...... ..... ..... . . Tertiary Planning Units: Population by Age and Sex ........ . Tertiary Planning Units: Living Quarters, Households and
Population by Type of Living Quarters ............................ . District Board Districts and Constituency Areas:
Population by Age and Sex ... ..... ..... ..... ..... .... ..... ..... ..... .... . District Board Districts and Constituency Areas: Living
Quarters, Households and Population by Type of Living Quarters ................................................................... .
Boundary Maps Complementary to Tabulations for Tertiary Planning Units .... ..... .... ....... ... ...... .... .... .... ....... ... .. .
Boundary Maps Complementary to Tabulations for District Board Districts and Constituency Areas ....
Hong Kong 1986 By-Census: Summary Results .. .... ..... .... .... ...... ..... ...... .... ..... ..... ..... .. . Tertiary Planning Unit: Population by Age ... ....... ... ..... ..... .. . Tertiary Planning Unit: Living Quarters, Households and
Population by Type of Living Quarters ...... ..... ..... ..... ..... .. . District Board Constituency Area: Population by Age District Board Constituency Area: Living Quarters,
Households and Population by Type of Living Quarters District Board: Constituency Area Summary Tables ..... ... .. . District Board: District Summary Tables ............................. . District Board District Tabulations: (in 19 volumes)
Tertiary Planning Unit Summary Tables: Hong Kong Island .. ..... .... ........... ... ..... ..... ..... ....... .. .. . Kowloon and New Kowloon ......... .......... .................... ..... . New Territories ......................................................... ... ..... .. .
Main Report: Volume 1 ....... ....... ... ............... ............................................. . Volume 2 ... .... ...... .... ...... .... ..... ..... ..... ... .... ... ... ...................... .
Social Atlas U±ir.i!!ff:>f:lfilll"J!I!*) ............................................. . Graphic Guide (- .1LJ\..7\'f'i!i'nl:<PWll5 IJ fo.l/Cf.-!-l.'Jtf.tllil!Wf) .... .. . Hong Kong Population A 20-Year Projection ... ..... .... ..... ..... .. . Hong Kong Life Tables (1971 - 2006) ..... ..... ..... .......... ..... ..... .. . Demographic Trends in Hong Kong 1971 - 82 ................ ..... .. . Hong Kong Trade Statistics Classification (S.l.T.C., Rev. 2)
1988 ................. .......... ..... ..... ..... ..... ..... .... ..... ..... ...... ... ....... .... ... . Hong Kong Imports & Exports Classification List
(Harmonized System) 1992 Edition .... ....... ... .......... ....... ... .. . wnl::il.!l:±J IJ~!J&J5Hi'!*(1Jlh• ';b'!JJl) <P:t~;;jl:R~IUJ~~~:f'-f
- fL;lt.= 'fJ\& ............ .......... ..... ..... ..... ..... ..... ..... ..... ..... .... ..... ... . Hong Kong Harmonized Commodity Description and
Coding System Handbook 1992 Edition ............................ . 'i!i'nl:~!J&Ji;fil}Rmi!Jt't1Jlhi\1!.!ffi!Jil-¥1!lt-;l1:tL="PJI& ... ..... ..... ..... .. . Summary of Changes in the Hong Kong Imports and
Exports Classification List (Harmonized System) from the 1988 Edition to the 1992 Edition .... ..... ..... ..... ..... .... ..... .. .... .. .
1989/ 90 Household Expenditure Survey and the Rebasing of the Consumer Price Indexes ... ..... ..... ..... .... ...... ..... ..... ..... .. .
-:tLA:tL~:tLo1f:ttl5~~•ttt-••»-•nmn!J&Jmma¥ WI .............................................................................. .. .
Social Data Collected by the General Household Survey: Special Topics Report VI ..... ....... ........ ..... .............................. . Special Topics Report VII .................... ... .... .... ....... .. ......... .... .
Crime And Its Victims in Hong Kong 1989 ............................. . -:tL;\..;lt.1¥1:E'i!i'nl:~!tlY~W~R!t3ti!j::11t .. ..... ... ...... ...... ..... .... . . Gross Domestic Product: Quarterly Estimates and Revised
Annual Estimates (Published in August 1991) ... .... ...... ..... . ;;jl: :lfil !t.9ffi=~*~F.tR•M~1f:~f.t( - fLfL-"PA~
:±Jfi&l .. .. ............................................ ......... ..... .... ...... ....... ..... .. .
Free: Average Daily Wages of Workers Engaged in Government
Building and Construction Projects (monthly) Hong Kong in Figures, 1991 Edition
2.00
46.00
20.00 22.00
22.00
31.00
24.00
72.00
48.00
6.00 10.00
10.00 12.00
10.00 144.00
37.00 20.00-25.00
90.00 95.00
150.00
80.00 200.00
25.00 10.00 15.00 16.00 26.00
60.00
43.00
43.00
10.00 10.00
44.00
56.00
60.00
28.00 46.00 54.00 54.00
12.00
12.00
Enquiries concerning the above publications or their back issues should be addressed to the Publications Officer, Census and Statistics Department, Wanchai Tower 1, 12 Harbour Road, Wan Chai, Hong Kong. Telephone No. 582 5073 .
Saleable copies are purchasable from the Government Publications Centre, General Post Office Building, Ground Floor, Connaught Place, Hong Kong and from the Publications Sa les Counter of Census and Statistics Department on 19/F, Wanchai Tower 1, 12 Harbour Road, Wan Chai, Hong Kong .
Order for local and overseas mailings please contact the Director of Information Services, Information Services Department, 1 Battery Path, G/F, Central, Hong Kong.
213021-36L- 11 / 91 S48-J47009110EO