Embed Size (px)
Citation preview
Hong Kong Monthly Digest of Statistics ~ff!Mf~tJJfU
January 1993 _.fLfL~1F_. ~
Census & Statistics Department, Hong Kong
~ ~ ®: 1# *le ~t ~
這份刊物的 PDF 版本的文字是從印刷版掃描而成,再利用光學字符識別軟
件轉換成電子格式。由於原印刷版本已印製並保存多年,光學字符識別技
術未必能準確地識別某些文字或數字。因此,搜索或複製此 PDF 檔案內的
文字時應加以注意。 The text of this PDF publication was scanned from its printed version and then converted to electronic text using Optical Character Recognition (OCR) software. Because of the age and condition of the original printed copy, the OCR may not recognise certain characters or figures accurately. Caution should therefore be taken when searching or copying text from this PDF publication.
Dm-------------~------~-
I
I'
Hong Kong
Monthly Digest of Statistics
January 1993 ~JLJL=~~JJ
Census & Statistics Department, Hong Kong
~ ~ i.{ Jf.f *1t ~t ~

PR!NTFD AND PUBLISHED BY THE GOVERNMENT PRINTER, HONG KONG
-----
INTRODUCTION
The Hong Kong Monthly Digest of Statistics is prepared by the Census and Statistics Department. It is designed to provide up-to-date statistical information about the social and economic characteristics of Hong Kong.
Statistical data are, wherever possible, presented in the form of monthly figures for the past twenty-five months together with annual figures for the latest complete six years. Detailed description of the scope and nature of the data and definitions of the terms used in the publication are provided in the Explanatory Notes.
Most of the statistics have been compiled by the Census and Statistics Department. Where other Government departments and organizations have contributed data, references are made in the Explanatory Notes. The Census and Statistics Department gratefully acknowledges such contributions.
Symbols
The following symbols are used throughout the Digest:
nil or not applicable N.A. not available
* revised figures
Units of Measurement
1 terajoule (TJ) 277 778 kilowatt hours
9 478.17 therms
1 tonne (t) 2 204.62 pounds
0.984 207 ton
1 kilogram (kg) 2.204 62 pounds
1.653 47 catties
1 square metre (sq.m.) = 10.763 9 square feet
1 cubic metre (cu.m.) 219.969 imperial gallons
1 hectopascal millibar
1 km/h 0.54 knot
Values
All figures quoted are in Hong Kong dollars unless otherwise specified.
Exchange Rate
The Official rate for conversion to US dollars was HK~5.085 = US$1.00 until 25 Novermber 1974. The Hong Kong dollar floated on 26 November 1974. As from 17 October 1983 the Hong Kong dollar was linked to US dollar, through a new arrangement in the note-issue mechanism, at a fixed exchange rate ofHK$7.80= US$1.00.
Rounding of Figures
Some figures have been rounded off to the nearest final digit. This may result in a slight discrepancy between the sum of the individual items and the total as shown in the tables.
Hong Kong Monthly Digest of Statistics January 1993 iii
51 ~
~M~ITT~~~~m~ITT~~·~ft~~~~wm*~tt~~~~~~~·~~ITT~~ 0
~ ff J:ilfrarf'l~J~t~J®.-* = + 1i 11M ~ 1JH8 rti: ~ ~ITT-~ ~·Jli/, 11M 7t~ 1Fffi' 1¥1 rti:1F~ITTlt¥ 0 ~~ fB II ;fll ·11:1{ 1¥1~*111~ im , tt ~~ ff J pg tm1 '.11¥1ff •:t5)JJ&1iY ttff _J pg 0
~f1Jpg:kif!S?t~ITT-~f5)El::!~ITT~~~ '~fftEl::!;l'tit!!~m:imr~;fllt;!!HfUl!~i¥J~t-I-' Jttlfrrttff_Jpg;IJ1112-t~im 0 ~ITT~fi f/fql~ab~*if~ 0
~~
~ flJpg*f-tJJ!l¥l*~:t!ur =
r 1!!L~r/F~JIL
N.A. *~-~ * {~tfT-~
Mfl¥1:it
1 ~!S.~£1= 277 778 9478.17
10Pl 2 204.62 = 0.984 207
10ff 2.204 62 = 1.653 47
1 Jjl-::lJ* 10.763 9 1 -J[_::lJ* = 219.969 1 a$6WT-F 1
4ij1j\lf.f 1 0 !!! 0.54
~fil
Jll$
f p[1j\lf.f
-~ 1i?J Ill 1i?J ff Jjl-jJJ!R ~;/Jllilf ~E.
?m
~~-JL-tirn1F+-~ =+1i s ff.311: , '§'::lJ?ll-$~ 5.085m7G~ 1 ~7G 0 m-JL-tirn1F+-~ =+ /, s ® , m7G~:Ml r¥f!b 0 §-JLA-=:.1F+ ~ +-t s ~Mt , -m7G~~7GiiJ®.~tJ>;fltiJl¥1~~~ITff•tt®* , 12-t 1 .8 m7G~ 1 ~7Gff.3ImJ:Et11 $0
•*-~i1t-OZ
~flJpgif!S:Jtlt~BJig{ft~·~-11Mltm' ~.tltflJf'l~~~ITT*pg1IM~1J~§ffi;/JO®*~--~~tl:IA 0
iv Hong Kong Monthly Digest of Statistics January 1993.
TABLE OF CONTENTS 目
INTRODUCTIONPART I REGULAR TABLES
Section 1: Population and Vital Statistics1.1 Estimated population, birth rate and death rate1.2 Registered births, deaths and marriages
Section 2: Labour2.1 Labour force, unemployment and underemployment .2.2 Establishments and persons engaged in the private sector by industry
sector - "2.3 Establishments and persons engaged in the private sector by major
industry group . " *2.4 Reported vacancies in the private sector by major industry group2.5 Establishments and persons engaged in selected industry sectors by
employment size -2.6 Employment in Civil Service2.7 Total monthly payroll by major industry group2.8 Nominal and real indices of payroll per person engaged by major
industry group " * *'2.9 Wage indices
*2.10 Average daily wages of workers engaged in Government building and construction projects
2.11 Stoppages of work by industry2.12 Reported occupational accidents2.13 Industrial accidents by cause and industry in 3rd quarter 1992
Section 5: External Trade3.1 External trade statistics3.2 Imports by area3.3 Domestic exports by area3.4 Imports by major trading country3.5 Domestic exports by major trading country3.6 Re-exports by major country of origin3.7 Re-exports by major country of destination3.8 Imports by commodity section3.9 Domestic exports by commodity section3.10 Re-exports by commodity section3.11 Imports and re-exports by end-use category3.12 Domestic exports of principal commodities3.13 Trade with China of outward processing nature3.14 Trade index numbers3.15 Trade index numbers for imports3.16 Trade index numbers for domestic exports3.17 Trade index numbers for re-exports3.18 Trade index numbers for main suppliers of imports3.19 Trade index numbers for main markets of domestic exports
Section 4: Production4.1 Index of industrial production4.2 Index of textile production4.3 Textile production4.4 Quarry production
Section 5: Land, Housing, Building and Construction5.1 Stock of permanent living quarters5.2 Stock and authorized population of public housing rental flats5.3 Residential units/flats completed by geographic area5.4 Residential units/flats completed by floor area 、5.5 Residential units/flats with consent to commence work by geographic
area 。5.6 Residential units/flats with consent to commence work by floor area5.7 Buildings completed by type5.8 Buildings with consent to commence work by type5.9 Price indices by type of premises5.10 Rental indices by type of premises5.11 Average prices by type of premises5.12 Average rentals by type of premises5.13 Instruments registered in the Land Office5.14 Gross value of construction work performed by building and civil
engineering contractors *5.15 Disposals of Government land
Section 6: Transport, Communications and Tourism6.1 Aircraft movements6.2 Ocean-going vessels entered and cleared6.3 River vessels entered and cleared6.4 International movements of commercial cargo6.5 Containers carried by ocean-going vessels6.6 Public transport: passenger journeys by undertaking6.7 Motor vehicles licensed6.8 Vehicular traffic through tott-charged tunnels and vehicular ferry
services6.9 Traffic accidents and casualties
Sections 丨 tables,
緒巨 iii第一部 經常刊出之統計表
第一節 :人口及生命統計 •人口總數統計、出生率、死亡率 1出生、死亡及婚姻註冊數字 1
第二節:勞工
勞動人口、失業及就業不足統計 2私營機構之機構單位數目及就業人數(按主要行業分類) 2
私營機構之機構單位數目及就業人數(按行業組別分類) 4
私營機構之呈報職位空缺(按行業組別分類) 6選定主要行業之機構單位數目及就業人數(按就業人數分類) 7
公務員人數 8每月薪金總額(按行業組別分類) 9就業者平均名義及實質薪金指數(按行業組別分類) 11
工資指數 13僱用於政府建築工程之工人平均日薪 16
僱員停工事件(按行業分類) 16呈報之職業意外事件 17一九九二年第三季工業意外事件(按原因及行業分類) 18
第三節:對外貿易
對外貿易統計 19進口(按地區分類) 20港產品出口(按地區分類) 20進口 (按主要貿易國家分類) * 21港產品出口 (按主要貿易國家分類) 21轉口 (按主要原產國家分類) 22轉口(按主要目的地國家分類) 22進口 (按商品組別分類) • 23港產品出口 (按商品組別分類) 23轉口 (按商品組別分類) 24進口及轉口 (按最後用途分類) 24本港主要產品出口 25外發中國加工貿易 25貿易指數 26進口貿易指數 27港產品出口貿易指數。 28轉口貿易指數 29進口主要來源貿易指數 30港產品出口主要市場貿易指數 30
第四節:生產
工業生產指數 31纺織業生產指數 32妨織業生產 32石礦生產 33
第五節:土地、房屋、建造
永久性住所總數 34租住公屋單位總數及認可居民人數 34落成之住宅單位/ 分層樓宇數目(按地區分類) 35落成之住宅單位/ 分層樓宇數目(按樓面面積分類丨 36批准動工之住宅單位/ 分層樓宇數目(按地區分類) 36
批准動工之住宅單位/ 分層樓宇數目(按樓面面積分類) 37落成樓宇(按樓宇種類分類) 38批准動工樓宇(按樓宇種類分類) 38樓價指數(按物業種類分類) 39租金指數(按物業種類分類) 39平均售價(按樓宇種類分類) • 40平均租金(按樓宇種類分類) ’ 42已在田土註冊處登記之文據 44承建商所建工程總值 45
政府土地拍賣及批租 45
第六節:運输、通訊、旅遊
抵港及離港飛機數字 48抵港及離港遠洋輪數字 48抵港及離港內河船數字 ' 50商業貨品進出口噸數 51遠洋輪運載貨櫃數字 52公共交通:乘搭各種公共交通工具人次 52持牌車輛數目 53使用收費隧道及汽車渡海小輪車次 55
節 /表 P a g e頁數
交通意外及傷亡數字 56
Hong Kong Monthly Digest o f Statistics January 1993V
Sections/tables
6.10 Telecommunication sen'ices 6.11 Postal services 6.12 Passenger arrivals • 6.13 . Passenger departures 6.14 Hong Kong resident departures by destination 6.15 Visitor arrivals by country of residence 6.16 Receipts from visitors 6.17 Per capita spendin,g and length of stay of visitors 6.18 Hotel statistics
Section 7: Money, Banking and Finance 7 .1 Currency in circulation and money supply 7.2 Deposits from customers 7.3 Money supply and deposits from customers adjusted for foreign
currency swap deposits 7.4 Balance sheets: licensed banks 7.5 Balance sheets: restricted licence banks 7.6 Balance sheets: deposit-taking companies 7.7 Balance sheets: all authorized institutions 7.8 Money markets 7.9 Analysis ofloans and advances for use in Hong Kong 7.10 Loans and advances analysed by type~licensed banks 7 .11 Loans and advances anaJysed by type-restricted licence banks 7.12 Loans and advances analysed by type--deposit-taking companies 7.13 Loans and advances analysed by authorized institutions and by
currency denominatipns 7.14 Foreign currency p\,lsitions · 7 .15 Interest rates paidµnd charged by principal licensed banks 7.16 Hong Kong dollar inter-bank offered rates and bank cheques cleared 7.17 Licensed banks: external liabilities and claims at 31 December 1992 7.18 Restricted licence banks: external liabilities and claims at
31 December ];992 7.19 Deposit-takifg companies: external liabilities and claims at
31Decembo/1992 7.20 Exchange J1ltes and the effective exchange rate indices (average figures) 7.21' Exchange rates and the effective exchange rate indices (end of period
figures) 7.22 Exchange rates and the effective exchange rate indices in
December 1992 7 .23 Index of share prices and value of stock exchange turnover 7 .24 Index of share prices and value of stock exchange turnover in_
December 1992 7.25 Closing prices offutures exchange and turnover in December 1992 7 .26 Gold and silver exchange trading prices 7 .27 Gold and silver exchange trading prices in December 1992
Section 8: Prices and Retailing 8.1 Average retail prices of selected foodstuffs 8.2 Average wholesale prices of selected foodstuffs 8.3 Consumer Price Index (A) 8.4 Consumer Price Index (B) 8.5 Hang Seng Consumer Price Index 8.6 Month-to-month percentage changes in the seasonally adjusted
consumer price indices 8. 7 Restaurant receipts 8.8 Retail sales
Section 9: Social Statistics 9.1 Crime 9.2 In-patient and out-patient statistics in Government and Hospital
Authority institutions 9.3 Notified infectious diseases 9 .4 Public assistance scheme 9.5 Special needs allowance schemes 9.6 Usage rate of major cultural venues by location 9. 7 Usage rate of recreation facilities by type 9.8 Municipal services licences and permits in force by type
Section 10: Energy 10.1 Electricity consumption 10.2 Gas consumption 10.3 Petroleum products: releases from petroleum companies by type 10.4 Petroleum products: releases from petroleum companies, duty free
and duty paid
Section 11: Miscellaneous 11.1 Revenue and expenditure of the Hong Kong Government under the
General Revenue Account 11.2 Local and oversea companies registered and dissolved 11.3 Fire services 11.4 Water supplies 11.5 Meteorological observations
PART II PERIODIC TABLES
Section 12: Population and Mortality Statistics
·~Jf\Bflf1} filll:ifktBflf1} m;mMr~AiX llill1*~AIX 2Fill1J@l'\\llll!1A1)((J'!(§f8:1!!!.:5t~l 1itiill1*~A!X(J'!(J@fi:~:$:5t~l 1itiill1*~11'lJi'f.lll®: 1itiill1*~'1ll'A 'ff01MfR !¥iill111ifl!ll JW!JliulU!l'tl!flJL
~{;fi'j : Jtm: • ~fi . ~~ lm:im~'IW R~'!Wf;l!;ff11i ·~!51¥~ miifflJ~Jr'!WWJ!Jlt¥~Z~'!Wf;!!;ffl1iR~Fff~
M' AA! ~lHr 'll1!i J1! fli'< :ff~ i!itJ AA! J!lHlHr'l £ Jr! fl* ti5¥:1¥~0jjjj1f£Jr!fli'< 1£<g PT 'fim • 11!iJ1! fli'< ~m:w~ f;l!;'f'fill11!Effl Z~~R~~5t>tfi M'AA!~IH'r$l:~R~~ ( J'!(ffl:@i~)lrJ5t>tff) :ff~i!itJAA!P.!!@fi~~R~~( J'!(ffl:@i~jjrJ)t>tff) :m5¥:t¥~0jjj$l:~R~~( J'!(ffl:@i~jjrJ)t>tff) ~~R~~( ilNPJ'fimR~'IW¥11l5t>tff)
1£N PJ 'flm)'r 'IW'l111iJ1! fJ!RJ!J!JlJ( JUf~lJL ±~t'i'AA!@fif£f:J!;Zf¥~R$l:~;frJ$ @fil"l~1Jl:.\j!,JSt@fi:st~x~
Page &lll
57 57 58 59 60 61 61 62
.62
63 64 65
66 67 68 69 70 72 73 74 75 76
M'AA!@fi : J'f,:-JL1L=-¥+=Jl :::::+- s :ti"JrJ1!1lRfl1l1'lll®: :ff~i!itJAA!,~!!@fi : J'f,:-1L1L=-¥+=Jl :::::+--· S :ti"JrJrlilR11i'1l1'lll®:
76 78 78 79 81
:m5¥:1¥~0jjj : J'f,:-JLJC-¥-t-;::Jl :C:-t--S:ti"JrJrliJ!Rfl;fl.i;W.tJi
Jr'!W .ll~$.Rill1'1Wll$.:Ji1llz( 'ff0llzl Jr'!W.ll~$.Rll!1'!Wlll[$.:Ji1llz(,~J!Jlllz)
-1L1L=-¥+=Jl f5tJr'IW .ll~$.Rill1Wll$.:Ji1lll
JN:~flmmUli!l3l'x~ .llltxt!l -1L:tL=-¥+=JJffiJN:~flt1rmll<Rli!l3l'x~.llltxt!l
-1L:tL=-¥+=JJffiJ!Jl~x~~mflR.llltxt!l ~@Ji'.JO!lfl -1L1L=-¥ + =Jl f5t~@J\JHIH!!I
~Af!'i: !IWJJI·~§
:E'Cf~!lo/J'ff0~!ff!!ltlr :E'Cf~!lo/J'f !0=1tt¥fltlr f!l~rl'll'.!lo/Jfl:Ji(lf{ z.~rl'll'.!lo/Jf!!l:Jiillz tll:'t.rl'll'.!lo/Jfl:Ji(lf{ *ii!.>Ji;fi'i'f'iiiffll~IH!lo/Jfl:JiillzZJ'!(Jl s 5t t~~ilJ
i!c~~~!f ~'!!f~~'!!f
~1Lfi'i : tt1ilf~"ITT !jjl~
JJ;l(Wf RifllfGff:l!l!.Jl\iif1*'fimz f±llfGRF,~frl:iAlll'.'f'.
Bffl!~Zillt!,l!!frl:i 0*~J!IJlrtflJ !M')ll]~~l'l!~lilitflJ ±~>cft~:l!!!.~ffl$(J'i(:l!!!.l!i/i5t~) '*l!l!lil!-:!~ilEffl$(J'i(ffl!~5t~) :ff!&mJ5cAA!P.!!RtltPJli!l(J'!(ff1!~5t~l
~+fil: lmll! '<ll'.iJll'l1'£ :1;!1Ji!\ll'l1'£ :U-¥ilJ0jjj tlt~tZ:U-¥11!11!iilli ( J'i(l1!iilli~llrJ)t~) :U-¥i1J0jjj tllitZ:U-¥11!£,ll, ( J'!(:!R.fll.RB~fil)f~)
~+-fil : -:ijt~"ITT JJ;l(Wf-M'!IJO._lj!R §I Z~AR!m3t
2F:l!!!.RJr~0jjj1l'liCRM~ rl'lllJJBflf1} ffl Jj( f;j!;ffl1i ~~UC.i!fe
~=mi '.lEJUlfiJtlJZ.~"ITT*
m+=fi'i : ADllUEt:~"ITT
83
85 86
87
88 88
89 91 91
92 93 93 94 94 95
95 96
97 98
99 100 101 102 103 104
107 107 108 108
109
109 110 111 111
12.1 Estimated population by age group at midci993 August issue
appearing in -JLJL:C: '¥'¥9" Allzfil"ITT( J'!(iplfttt..ll.)l1J)t~ )-;\.Jl ffif!J tll
12.2 Deaths by cause ... appearing in June issue
vi Hong Kong Monthly Digest of Statistics January 1993
Sections/tables
Section 13: Education ... appearing in February issue
13.l Schools and enrolment
Section.14: Wages and Employee Benefits• ... appearing in December issue
14. l Salary indexes for managerial and professional employees 14.2 Percentage of managerial and professional employees entitled to
various fringe benefits for June 1993
Section 15: National Accounts ... appearing in February, March, May, August and November issues
15.l Expenditure-based Gross Domestic Product (GDP) estimates at current market prices by main expenditure components
15.2 Expenditure-based Gross Domestic Product (GDP) estimates at constant (1980) market prices by main expenditure components
15.3 Production-based Gross Domestic Product (GDP) estimates at current prices by economic activity
Section 16: Summary Statistics from Annual Economic Surveys .... appearing once annually
March 1993: Summary statistics from the Survey of Banks, Deposit-taking Companies, Restricted Licence Banks and Representative Offices of Foreign · Banks for 1990 and 1991
April 1993: Summary Statistics from the 1991 Survey of Building, Construction and Real Estate Sectors
May 1993: Summary Statistics from the 1991 Survey.of Transport and Related Services
June 1993: (i) Summary Statistics from the 1991 Survey oflndustrial Production .
(ii) Summary Statistics from the 1991 Survey of Wholesale, Retail and Import/Export Trades, Restaurants and Hotels
(iii) Summary Statistics from the 1991 Survey of Storage, Communications, Financing, Insurance and Business Services
PART III SPECIAL REVIEW ARTICLES ... appearing in January, March, May, July, September and November issues January 1993: Salary Statistics of Middle-Level Managerial and
Professional Employees
EXPLANATORY NOTES
Hong Kong Monthly Digest of Statistics January 1993
fti I* Page J{jt
m+:=:fli.: ~~-=.JH?tf!Jtf:l JJ\t'ttl§lit"'1'.A.tt
m+imfli: I11f~i1UUl~J-+=.Jlfilf!Jtf:l ~lll!ll!llitlJ~iUtzih'fif.illc -fLfL:=:'¥7'Jl ffi~lll!~litlJ~lJU~ $;fl' 4H!Rl!f;J-1/ll''li>f!JZ. l"f ffi$
*~~m•ITT•~*~1'.~~m~x~ITT*±~~xm~$fil%~
*~i£<-fLAO'¥lm•mrn*~1'.~1t1m~x~ITT*±~~xm ~${%%~
N~~-~ITT~~*~1'~•m*~~m~%~
-1LfL:=:'¥119Jl=-fLfL-'¥~~~~-~~lit~~~~ITT~*~~
-fLfL:=:'¥liJl=-fLfL-'¥~•&;fl'~fi~~ITT~*~~
-fLJL:=:'¥7'Jl:-fLfL-'¥I~1'.~~ITT~*m~
-fLfL-'¥~1!Hlt~litJ!!itf:l JJ~ • ti:~Jililit!Wlili~ITT~ *~~
-fLfL-'¥~*-~m-Mm·~~&~~~mfi~~ ITT~*~~
113
vii
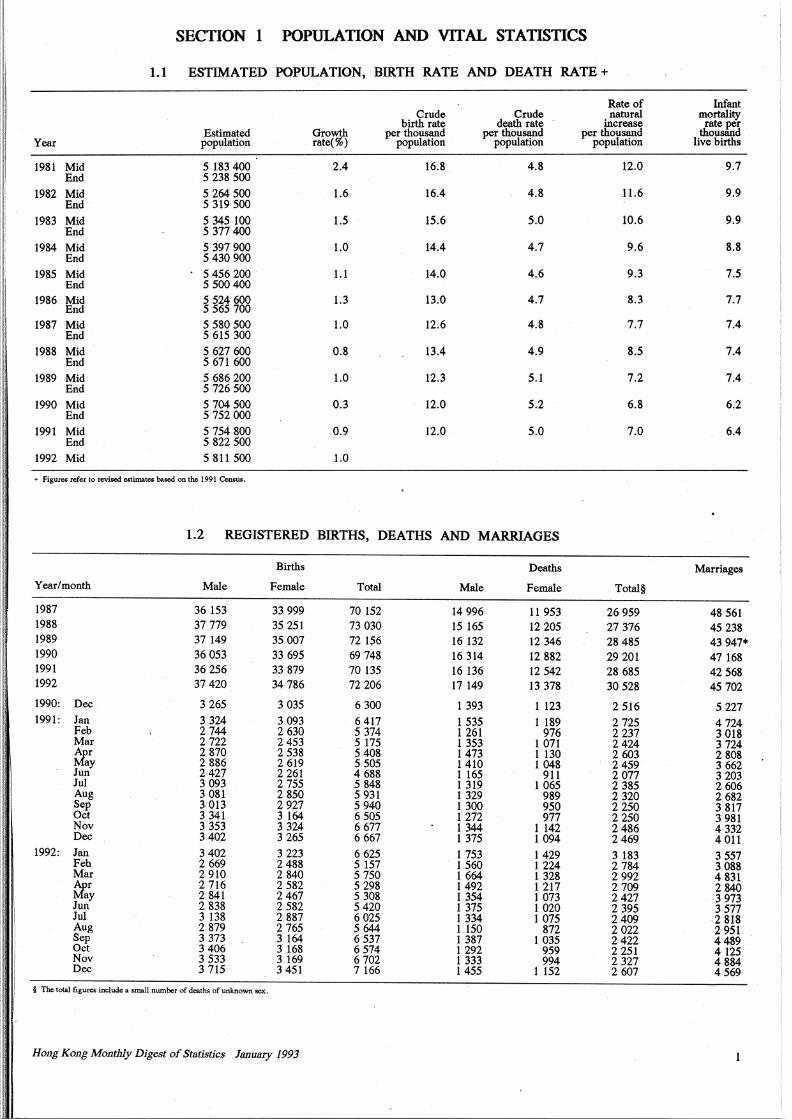
SECTION 1 POPULATION AND VITAL STATISTICS
1.1 ESTIMATED POPULATION, BIRTH RATE AND DEATH RATE+
Rate of Infant Crude Crude _ 114tural mortality
birth rate death rate mcrease rate per Estimated Growth per thousand per thousand per thousand thousand
Year population rate(%) population population population live births
1981 Mid 5 183 400 2.4 16.8 4.8 12.0 9.7 End 5 238 500
1982 Mid 5 264 500 1.6 16.4 4.8 11.6 9.9 End 5 319 500
1983 Mid 5 345 100 1.5 15.6 5.0 10.6 9.9 End 5 377 400
1984 Mid 5 397 900 1.0 14.4 4.7 9.6 8.8 End 5 430 900
1985 Mid 5 456 200 1.1 14.0 4.6 9.3 7.5 End 5 500400
1986 Mid ~~~~ 1.3 13.0 4.7 8.3 7.7 End
1987 Mid 5 580 500 1.0 12.6 4.8 7.7 7.4 End 5 615 300
1988 Mid 5 627 600 0.8 13.4 4.9 8.5 7.4 End 5 671 600
1989 Mid 5 686 200 1.0 12.3 5.1 7.2 7.4 End 5 726 500
1990 Mid 5 704 500 0.3 12.0 5.2 . 6.8 6.2 End 5 752 OOO
1991 Mid 5 754 800 0.9 12.0 5.0 7.0 6.4 End 5 822 500
1992 Mid 5 811 500 1.0
+ Figures refer to revised estimates based on the 1991 Census.
1.2 REGISTERED BIRTHS, DEATHS AND MARRIAGES
Births Deaths Marriages
Year/month Male Female Total Male Female Total§
1987 36 153 33 999 70 152 14 996 11 953 26 959 48 561 1988 37 779 35 251 73 030 15 165 12 205 27 376 45 238 1989 37 149 35 007 72 156 16 132 12 346 28485 43 947• 1990 36 053 33 695 69 748 16 314 12 882 29 201 47 168 1991 36 256 33 879 70 135 16 13.6 12 542 28 685 42 568 1992 37 420 34786 72 206 17 149 13 378 30 528 45 702
1990: Dec 3 265 3 035 6 300 1 393 1 123 2 516 5 227 1991: Jan 3 324 3 093 6417 1 535 1 189 2 725 4724
Feb 2 744 2 630 5 374 1 261 976 2 237 3 018 Mar 2 722 2453 5 175 1 353 1 011 · 2424 3 724 tfer 2 870 2 538 5 408 1473 1 130 2 603 2 808
ay 2 886 2 619 5 505 1410 1 048 2459 3 662 Jun 2427 2 261 4 688 1 165 911 2 077 3 203 Jui 3 093 2 755 5 848 1 319 1 065 2 385 2 606 Aug 3 081 2 850 5 931 1329 989 2 320 2 682 Sep 3 013 2 927 5 940 1 300 950 2 250 3 817 Oct 3 341 3 164 6 505 1272 977 2 250 3 981 Nov 3 353 3 324 6 677 1 344 1 142 2486 4 332 Dec 3 402 3 265 6 667 1 375 1 094 2469 4 011
1992: Jan 3402 3 223 6 625 1 753 1429 3 183 3 557 Feb 2 669 2 488 5 157 l 560 1 224 2 784 3 088 Mar 2 910 2 840 5 750 1 664 1 328 2 992 4 831 tfer 2 716 2 582 5 298 1492 1 217 2 709 2 840
ay 2 841 2467 5 308 1 354 1 073 2427 3 973 Jun 2 838 2 582 5 420 1 375 l 020 2 395 3 577 Jui 3 138 2 887 6 025 1 334 1 075 2409 ·2 818 Aug 2 879 2 765 5 644 1 150 872 2 022 2 951 Sep 3 373 3 164 6 537 1 387 1 035 2422 4489 Oct 3 406 3 168 6574 1 292 959 2 251 4 125 Nov 3 533 3 169 6702 1 333 994 2 327 4 884 Dec 3 715 3 451 7166 1455 1 152 2 607 4569
§ The.total figures include a small number of deaths of unknown sex.
Hong Ko11g Monthly Digest of Statistics January 1993
Period
1986
1987
1988
1989
1990
1991
Sep 1990 - Nov 1990
Oct 1990 - Dec 1990
Nov 1990 - Jan 1991
Dec 1990 - Feb 1991
Jan 1991 - Mar 1991
. Feb 1991 - Apr 1991
Mar 1991 - May 1991
Apr 1991 - Jun 1991
May 1991 - Jul 1991
Jun 1991 - Aug 1991
Jul . 1991 - Sep 1991
Aug 1991 - Oct 1991
Sep 1991 - Nov 1991
Oct 1991 - ·Dec 1991
Nov 1991 - Jan 1992
Dec 1991 - Feb 1992
Jan 1992 - Mar 1992
Feb 1992 - Apr 1992
Mar 1992 - May 1992
Apr 1992 - Jun 1992
May 1992 - Jui 1992
Jun 1992 - Aug 1992
Jui 1992 - Sep 1992
Aug 1992 - Oct 1992
Sep 1992 - Nov 1992
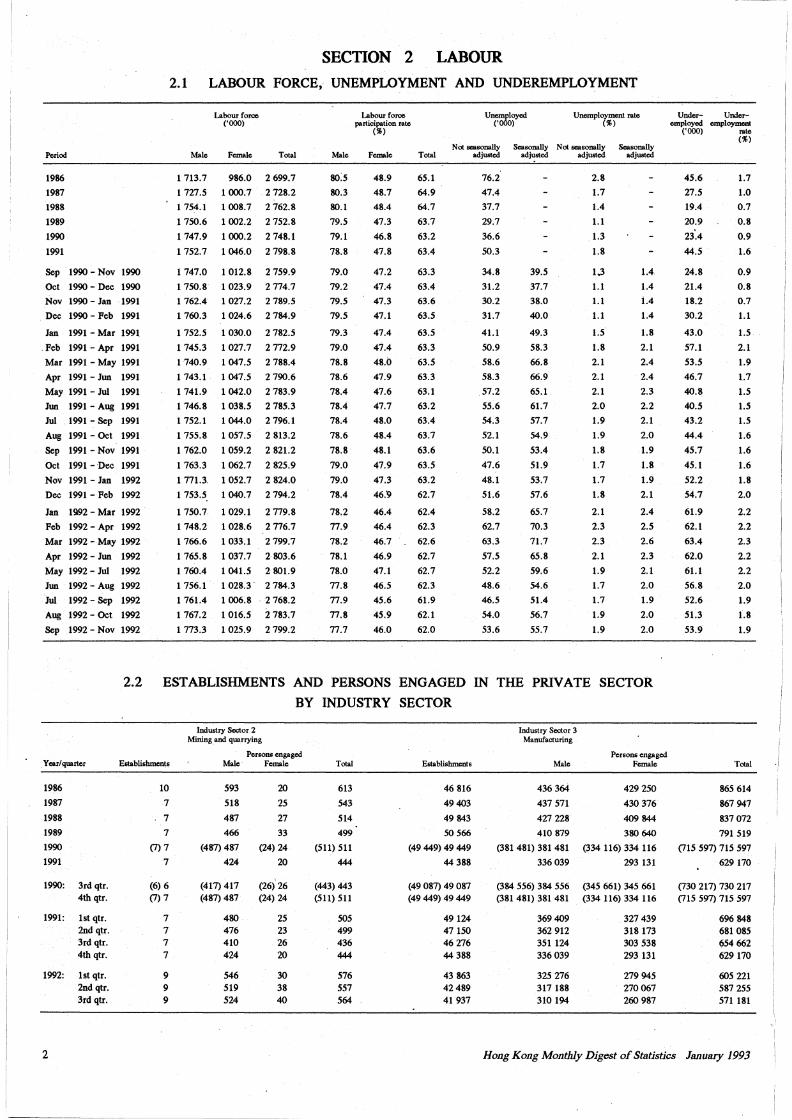
SECTION 2 LABOUR
2.1 LABOUR FORCE, UNEMPLOYMENT AND UNDEREMPLOYMENT
Male
1 713.7
1 727.5
1 754.1
1 750.6
1 747.9
1 752.7
1 747.0
1 750.8
1 762.4
1 760.3
1 752.5
1 745.3
1740.9
1 743.1
1 741.9
1 746.8
1 752.1
1 755.8
1 762.0
1 763.3
1 771.3.
1 753.5
Labour force ('OOO)
Female
986.0
1 000.7
1 008.7
1 002.2
1 000.2
1046.0
1 012.8
1 023.9
1 027.2
1 024.6
1 030.0
1 027.7
1 047.5
1 047.5
1 042.0
1 038.5
1044.0
1 057.5
1 059.2
1 062.7
1 052.7
1 040.7
Total
2 699.7
2 728.2
2 762.8
2 752.8
2 748.1
2 798.8
2 759.9
2 774.7
2 789.5
2 784.9
2 782.5
2 772.9
2 788.4
2 790.6
2 783.9
2 785.3
2 796.1
2 813.2
2 821.2
2 825 .. 9
2 824.0
2 794.2
1 750.7 1 029.1 2 779.8
1 748.2 1 028.6 2 776. 7
1 766.6 1 033.1 2 799.7
1 765.8 1 037.7 2 803.6
1 760.4 1 041.5 2 801.9
1 756.1 1 028.3. 2 784.3
1 761.4
1 767.2
1 773.3
1 006.8
1 016.5
1 025.9
2 768.2
2 783.7
2 799.2
Labour force participation rate
(%)
Male Female
80.5
80.3
80.1
79.5
79.1
78.8
79.0
79.2
79.5
79.5
79.3
79.0
78.8
78.6
78.4
78.4
78.4
78.6
78.8
79.0
79.0
78.4
78.2
77.9
78.2
78.1
78.0
77.8
77.9
77.8
77.7
48.9
48.7
48.4
47.3
46.8
47.8
47.2
47.4
47.3
47.1
47.4
47.4
48.0
47.9
47.6
47.7
48.0
48.4
48.1
47.9
47.3
46."9
46.4
46.4
46.7
46.9
47.1
46.5
45.6
45.9
46.0
Unemployed ('000)
Unemployment rate (%)
Not seasonally Seasonally Not reasonally Seasonally Total adjusted adjusted adjusted adjusted
65.1
64.9
64.7
63.7
63.2
63.4
63.3
63.4
63.6
63.5
63.5
63.3
63.5
63.3
63.1
63.2
63.4
63.7
63.6
63.5
63.2
62.7
62.4
62.3
62.6
62.7
62.7
62.3
61.9
62.1
62.0
76.2
47.4
37.7
29.7
36.6
50.3
34.8
31.2
30.2
31.7
41.1
50.9
58.6
58.3
57.2
55.6
54.3
52.I
SO.I
47.6
48.I
51.6
58.2
62.7
63.3
51.5
52.2
48.6
46.5
54.0
53.6
39.5
37.7
38.0
40.0
49.3
58.3
66.8
66.9
65.1
61.7
57.7
54.9
53.4
51.9
53.7
57.6
65.7
70.3
71.7
65.8
59.6
54.6
51.4
56.7
55.1
2.8
1.7
1.4
1.1
1.3
1.8
1.3
1.1
1.1
1.1
1.5
1.8
2.1
2.1
2.1
2.0
1.9
1.9
1.8
1.7
1.7
1.8
2.1
2.3
2.3
2.1
1.9
1.7
1.7
1.9
1.9
1.4
1.4
1.4
1.4
1.8
2.1
2.4
2.4
2.3
2.2
2.1
2.0
1.9
1.8
1.9
2.1
2.4
2.5
2.6
2.3
2.1
2.0
1.9
2.0
2.0
Under- Under-employed employment
('OOO) rate
45.6
27.5
19.4
20.9
23:4
44.5
24.8
21.4
18.2
30.2
43.0
57.1
53.5
46.7
40.8
40.5
43.2
44.4
45.7
45.1
52.2
54.7
61.9
62.1
63.4
62.0
61.1
56.8
52.6
51.3
53.9
(%)
1.7
1.0
0.7
0.8
0.9
1.6
0.9
0.8
0.7
1.1
1.5
2.1
1.9
1.7
1.5
1.5
1.5
1.6
1.6
1.6
1.8
2.0
2.2
2.2
2.3
2.2
2.2
2.0
1.9
1.8
1.9
2.2 ESTABLISHMENTS AND PERSONS ENGAGED IN THE PRIVATE SECTOR
Year/ quarter
1986
1987
1988
1989
1990
1991
1990: 3rd qtr. 4th qtr.
1991: lst qtr. 2nd qtr. 3rd qtr. 4th qtr.
1992: lst qtr. 2nd qtr. 3rd qtr.
2
Establishments
10
7
7
7
\!) 7
7
(6) 6 \!) 7
7 7 7 7
9 9 9
BY INDUSTRY SECTOR
Industry Sector 2 Mining and quarrying
Male
593
518
487
466
(487) 487
424
(417) 417 (487) 487
480 476 410 424
546 519 524
Persons engaged Female
20
25
27
33
(24) 24
20
(26) 26 (24) 24
25 23 26 20
30 38 40
Total
613
543
514
499
(511) 511
444
(443) 443 (511) 511
505 499 436 444
576 551 564
Establishments
46 816
49403
49 843
50566
(49 449) 49 449
44 388
(49 087) 49 087 (49 449) 49 449
49124 47150 46 276 44 388
43 863 42489 41 937
Industry Sector 3 Manufacturing
Male
436 364
437 571
427 228
410 879
(381 481) 381 481
336 039
(384 556) 384 556 (381 481) 381 481
369 409 362 912 351124 336 039
325 276 317 188 310 194
Persons engaged Female
429 250
430 376
409 844
380 640
(334 116) 334 116
293 131
(345 661) 345 661 (334 116) 334 116
327 439 318 173 303 538 293 131
279 945 270 067 260 987
Total
865 614
867 947
837 072
791 519
(115 597) 715 597
629 170
(130 217) 730 217 (115 597) 715 597
696 848 681 085 654 662 629 170
605 221 587 255 571181
Hong Kong Monthly Digest of Statistics January 1993
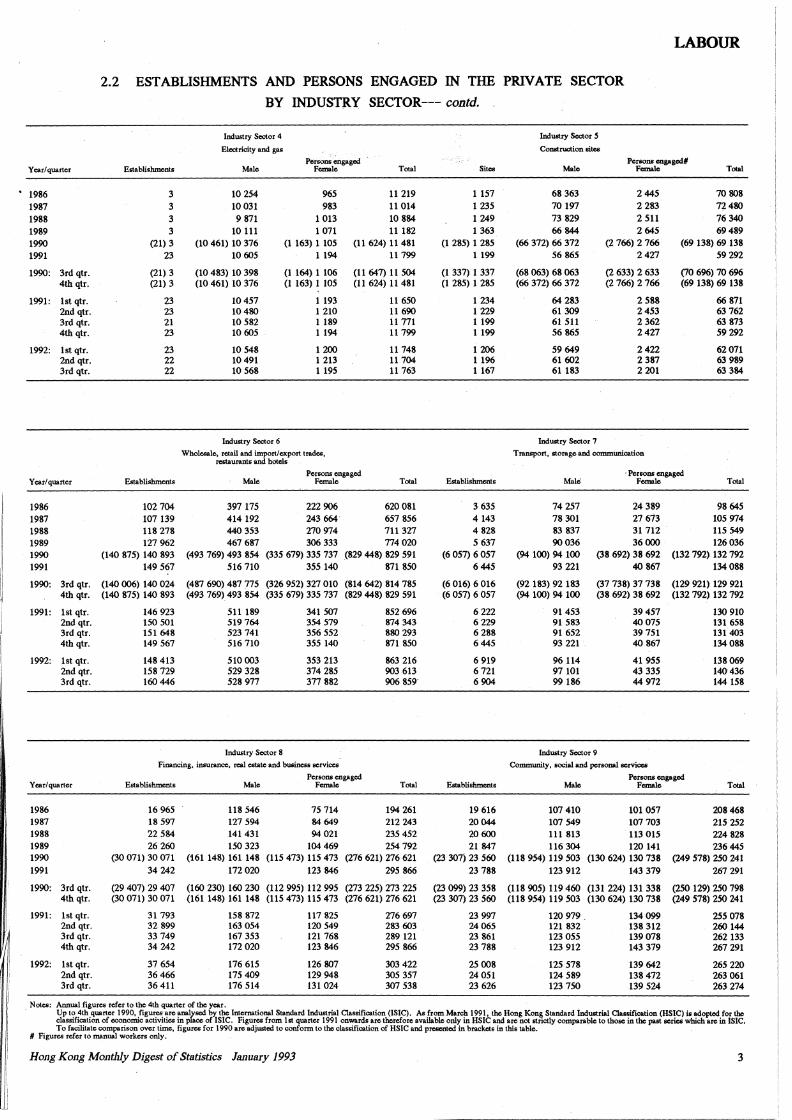
LABOUR
2.2 ESTABLISHMENTS AND PERSONS ENGAGED IN THE PRIVATE SECTOR
BY INDUSTRY SECTOR--- contd.
Industry Sector 4 Industry Sector 5
Electricity and gas Comtructlon &ilel
Por~.;.,gaged Pont0118 engaged# Year/quarter Establishments Male Female Total Sitca Male Femalo Tola!
1986 3 10254 965 11219 1157 68363 2445 70 808
1987 3 10031 983 11014 1235 70197 2 283 72480 1988 3 9 871 1013 10 884 1249 73 829 2 511 76340 1989 3 10 111 1 071 11182 1363 66844 2 645 69489 1990 (21) 3 (10 461) 10 376 (1 163) 1105 (11 624) 11 481 (1285)1285 (66 372) 66 372 (2 766) 2 766 (69 138) 69 138 1991 23 10605 1194 11799 1199 56 865 2427 59292
1990: 3rd qtr. (21) 3 (10 483) 10 398 (1164) 1106 (11 647) 11 504 (1337)1 337 (68 063) 68 063 (2 633) 2 633 (70 696) 70 696 4th qtr. (21) 3 (10 461) 10 376 (1163) 1 105 (11 624) 11 481 (1285)1 285 (66 372) 66 372 (2 766) 2 766 (69 138) 69 138
1991: lst qtr. 23 10457 1193 11650 1234 64283 2 588 66 871 2nd qtr. 23 10480 1 210 11690 1229 61309 2453 63762 3rd qtr. 21 10582 1189 11771 1199 61511 2362 63 873 4th qtr. 23 10 605 1194 11 799 1199 56 865 2427 59292
1992: lst qtr. 23 10548 1200 11748 1206 59 649 2422 62071 2ndqtr. 22 10 491 1 213 11704 1196 61602. 2 387 63 989 3rd qtr. 22 10 568 1195 11 763 1167 61183 2 201 63 384
Industry Sector 6 Industry Sector 1
Wholcsalo, retail and import/eotport trades, Transport, storage and communication restaurant• and hotels
Y car/ quarter Establishments Male Persons engaged
Female Tola! Establishments Male . Pont0118 engaged
Fomalo Tola!
1986 102 704 397 175 222 906 620081 3 635 74257 24389 98645 1987 107 139 414 192 243 664• 651856 4143 78 301 27 673 105 974 1988 118 278 440 353 270974 711 327 4 828 83 837 31 712 115 549 1989 127 962 467687 306 333 774020 5 637 90036 36000 126036 1990 (140 875) 140 893 (493 769) 493 854 (335 679) 335 737 .(829 448) 829 591 (6 057) 6 057 (94 100) 94 100 (38 692) 38 692 (132 792) 132 792 1991 149 567 516 710 355 140 871 850 6445 93 221 40867 134 088
1990: 3rd qtr. (140 006) 140 024 (487 690) 487 775 (326 952) 327 010 (814 642) 814 785 (6 016) 6 016 (92 183) 92 183 (37 738) 37 738 (129 921) 129 921 4th qtr. (140 875) 140 893 (493 769) 493 854 (335 679) 335 737 (829 448) 829 591 (6 057) 6 051 (94 100) 94 100 (38 692) 38 692 (132 792) 132 792
1991: lst qtr. 146 923 511189 341 507 852 696 6222 91453 39457 130 910 2nd qtr. 150 501 519 764 354 579 874 343 6229 91 583 40075 131658 3rd qtr. 151 648 523 741 356 552 880 293 6288 91652 39 751 131403 4th qtr. 149 567 516 710 355 140 871 850 6445 93 221 40 867 134 088
1992: lst qtr. 148 413 510003 353 213 863 216 6 919 96114 41955 138 069 2nd qtr. 158 729 529 328 374 285 903 613 6721 97 101 43 335 140436 3rd qtr. 160 446 528 977 377 882 906 859" 6904 99186 44972 144158
Industry Sector 8 Industry Sector 9
Financing, insurance, real c:otate and busii1C0• serviceo Community, social and personal service&
Porsons engaged Persons engaged Year/quarter Establishments Malo Fcmalo Total Establishments Male Female Total
1986 16 965 118 546 75714 194 261 19 616 107 410 101051 208468 1987 18 597 127 594 84 649 212 243 20044 107 549 107 703 215 252 1988 22 584 141 431 94 021 235 452 20 600 111 813 113 015 224 828 1989 26 260 150 323 104 469 254 792 21 847 116 304 120 141 236445 1990 (30 071) 30 071 (161 148) 161 148 (115 473) 115 473 (276 621) 276 621 (23 307) 23 560 (118 954) 119 503 (130 624) 130 738 (249 578) 250 241 1991 34242 172020 123 846 295 866 23788 123 912 143 379 267 291
1990: 3rd qtr. (29 407) 29 407 (160 230) 160 230 (112 995) 112 995 (273 225) 273 225 (23 099) 23 358 (118 905) 119 460 (131 224) 131 338 (250 129) 250 798 4th qtr. (30 071) 30 071 (161 148) 161 148 (115 473) 115 473 (276 621) 276 621 (23 307) 23 560 (118 954) 119 503 (130 624) 130 738 (249 578) 250 241
1991: lst qtr. 31 793 158 872 117 825 276 697 23 997 120 979 134 099 255 078 2nd qtr. 32 899 163 054 120 549 283 603 24065 121 832 138 312 260 144 3rd qtr. 33 749 167 353 121 768 289 121 23 861 123 055 139078 262133 4th qtr. 34 242 172 020 123 846 295 866 23 788 123 912 143 379 267 291
1992: lst qtr. 37 654 176 615 126 807 303 422 25008 125 578 139642 265 220 2nd qtr. 36466 175 409 129 948 305 357 24051 124 589 138 472 263 061 3rd qtr. 36 411 176 514 131 024 307 538 23 626 123 750 139 524 263 274
Notes: Annual figures refer to the 4th quarter of the year. · Up to 4th quart10r 1990, figurenM analysed b)' the lntlOmational Standard Industrial Classification (JSIC). As from March 1991, the Hong ~ Standard Industrial Classification (HSIC) is adopted for the
classification of economic activiticos in place of !SIC. Figuf!OS from !&t quarter 1991 onwards aflO theref oflO availablo only in HSIC and ""° not stnctly comparablo to those in the past soricos which ""° in !SIC. To facilitatlO comparison OVIOr time, figUflOS for 1990 are adjusted to conform to th!O classification of HSIC and pf!O&entocl in brackets in this tabl10.
# Figur10S refer to manual worbrs only.
Hong Kong Monthly Digest of Statistics January 1993 3
LABOUR
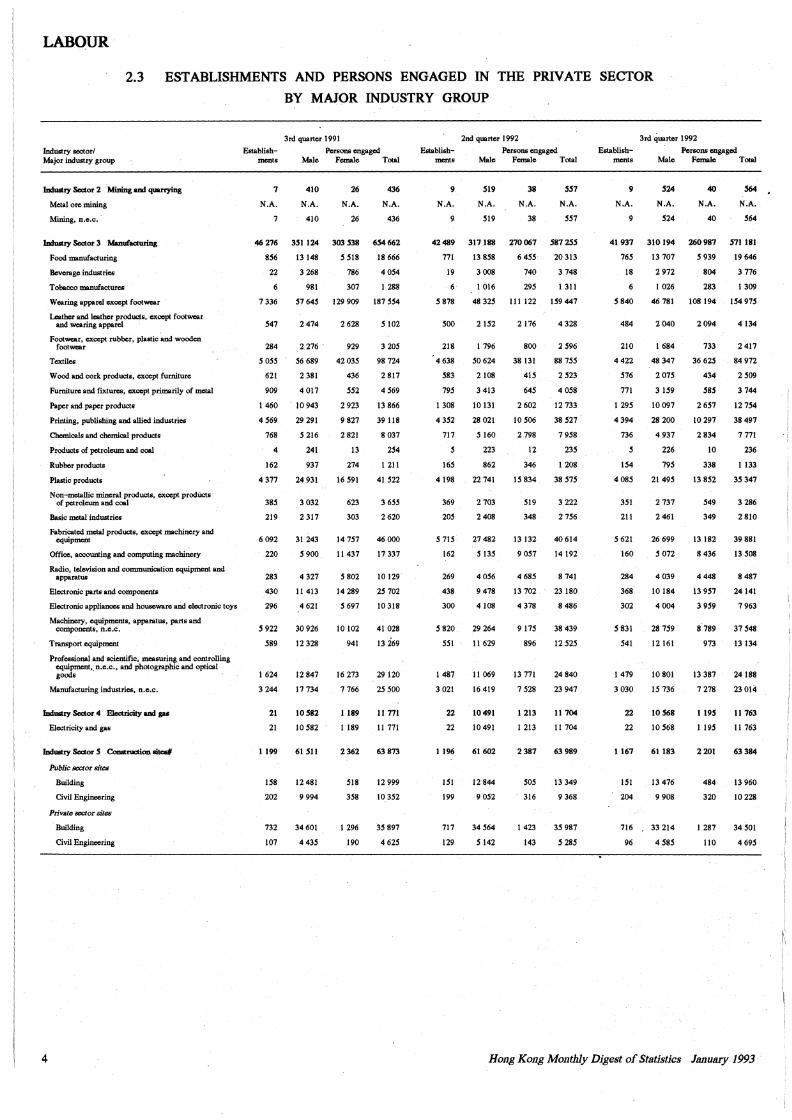
2.3 ESTABLISHMENTS AND PERSONS ENGAGED IN THE PRIVATE SECTOR
Industry =tor/ Major industry group
lndustiy Sector 2 Mining and quarrying
Metal ore mining
Mining, n.e.c.
lndustiy Sector 3 Manufacturing
Food manufacturing
Beverage industries
Tobacco manufactures
Wearing apparel except footwear
Leather and leather product•. except footwear and wearing apparel
Footwear, except rubber, plastic and wooden footwear
Textiles
Wood and cork products, except furniture
Furniture and fixtures, except primarily of metal
Paper and paper products
Printing, publishing and allied industries
Chemicals and chemical products
Products of petroleum and coal
Rubber products
Plastic products
Non-metallic mineral products, except prodlicts of petroleum and coal
Basic metal industries
Fabricated metal products, except machinery and equipment
Office, accounting and computing machinery
Radio, television and communication equipment and apparatus
Electronic parts and components
Electronic appliances and house.ware and electronic toys
Macbinel)', equipments, apparatus, parts and components, n.e.c.
Transport equipment
Professional and scientific, measuring and controlling equipment •. n.e.c., and photographic and optical goods
Manufacturing industries, n.e.c.
Industry Sector 4 Electricity and gu
Electricity and gas
Industry Sector S Comtruclion sites#
Public EK:Ctor sites
Building
Civil Engineering
Private sector sites
Building
Civil Engineering
4
BY MAJOR INDUSTRY GROUP
Establishments
7
N.A.
7
3rd quarter 1991 Persons engaged
Male Female Total
410
N.A.
410
26
N.A.
26
436
N.A.
436
46 276 JS! 124 303 S38 6S4 662
8S6 13 148 s Sl8 18 666
22 3 268 786 4 054
6 981 307 l 288
7336 S164S 129909 187SS4
541 2 474 2 628 s 102
284 2 276 . 929 3 20S
s 05S 56 689 42 03S 98 724
621 2381 436 2817
909 4 017 5S2 4 S69
l 460 . 10 943 2 923 13 866
4S69 29291 9827 39118
%8 5~6 28~ son 4 241 13 2S4
162 937 274 l 211
4 377 24 931 16 591 41 522
385 3 032 623 3 6SS
219 2317 303 2620
6 092 31 243 14 7S7 46 OOO
220 5900 11 437 17 337
283 4 327 s 802 10 129
430 11 413 14 289 2S 702
296 4621 5697 10318
s 922 30 926 10 102 41 028
589 12 328 941 13 :i69
l 624 12 847 16 273 29 120
3 244 17 734 7 766 2S SOO
21 10 S82 I 189 11 771
21 10582 1189 11771
1199 61 Sll 2 362 63 873
1S8
202
732
107
12481
9 994
34 601
4 435
SIS
3S8
l 296
190
12 999
10 3S2
35 897
4 62S
Establishments
9
N.A.
9
2nd quarter 1992 Persons engaged
Male Female Total
Sl9
N.A.
Sl9
38
N.A.
38
5S7
N.A.
SS1
42 489 317 188 270 067 S87 2SS
771 13 8S8 6 4SS 20 313
19 3 008 740 3 748
S878
500
218
4 638
583
795
l 308
4 352
717
5
165
4198
369
20S
s 71S
162
269
438
300
5820
S51
1487
3 021
22
22
1196
!SI
199
717
129
l 016 295 l 311
48325 111122 159447
2152 2176 4328
l 796 800 2 S96
so 624 38 131 88 7SS
2 108 415 2 S23
3 413 645 4 OS8
10 131 2 602 12 733
28 021 l 0 506 38 S27
5 160 2 798 7 958
223 12 235
862 346 l 208
22741 1S834 38S7S
2 703 Sl9 3 222
2 408 348 27S6
27 482 13 132 40 614
s 13S 9 OS7 14 192
4 OS6 4 685 8 741
9 478 13 702 23 180
4108 4378 8486
29 264 9 175 38 439
11 629 896 12 525
11 069 13 771 24 840
16 419 7 528 23 947
10 491 I 213 11 704
10491 1213 11 704
61 602 2 387 63 989
12 844
9052
34 S64
s 142
SOS
316
l 423
143
13 349
9 368
35 987
s 285
Establishments
9
N.A.
3rd quarter 1992
Persons engaged Male Female Total
S24
N.A.
524
4o
N.A.
40
564
N.A.
S64
41 937 310 194 260 987 S71 181
765 13 707 s 939 19 646
18 2 972 804 3 776
S840
484
210
4422
S76
771
l 295
4 394
736
s 154
4 085
3SI
211
s 621
160
284
368
302
s 831
541
l 479
3030
22
22
I 167
151
204
716
96
l 026 283 1309
46781 108194 IS4915
2040 2094 4134
I 684 733 2 417
48 347 36 62S 84 972
2 07S 434 2 509
3 159 S85 3 744
10 097 2 6S7 12 754
28 200 l 0 297 38 497
4937 2834 1n1
226 10 236
79S 338 I 133
21 49S 13 8S2 3S 347
2 737 S49 3 2S6
2 461 349 2 810
26 699 13 182 39 881
5012 8436 13508
4 039 4 448 8 487
10 184 13 9S7 24 141
4 004 3 9S9 7 963
28 759 8 789 37 S48
12 161 973 13 134
10 801 13 387 24 188
IS 736 7 278 23 014
10 S68 I 19S II 763
10568 l 19S 11763
61 183 2 201 63 384
13 476
9 908
33 214
4 585
484
320
1287
110
13 960
10 228
34 501
469S
Hong Kong Mo11thly Digest of Statistics lBIIuary 1993
I
I
I
I'
1, !
I
1.
r-,
I
LABOUR
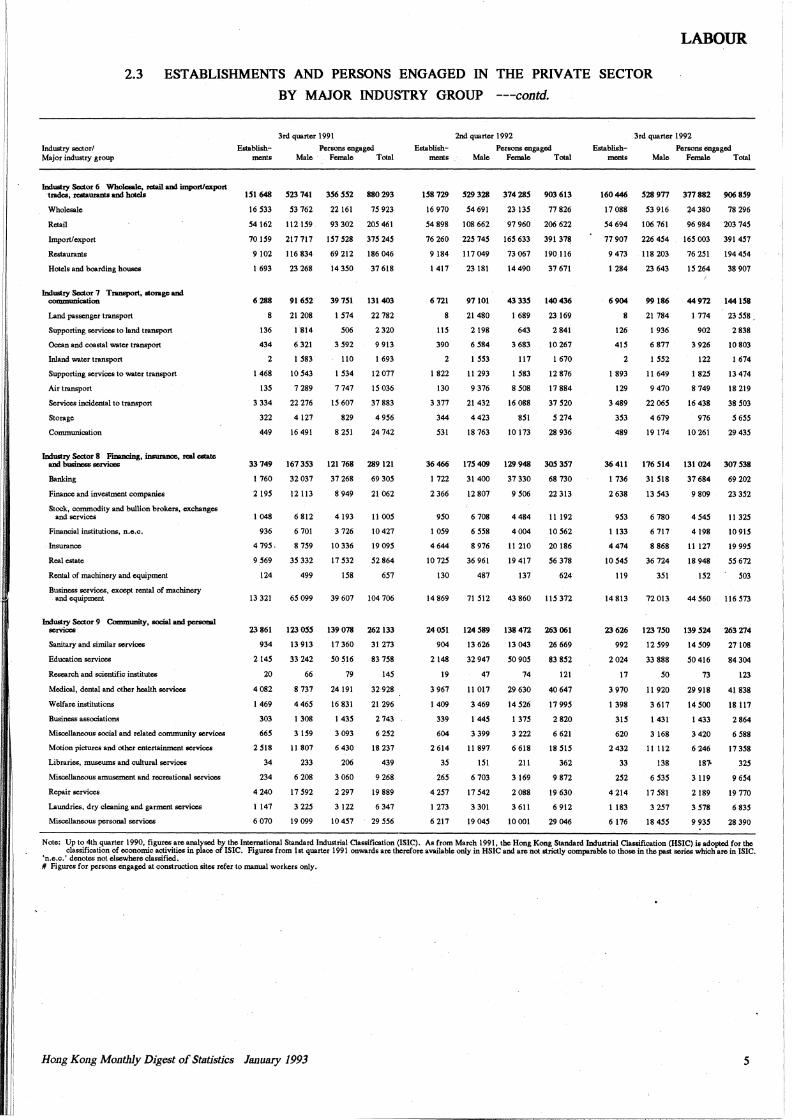
2.3 ESTABLISHMENTS AND PERSONS ENGAGED IN THE PRIVATE SECTOR
Industry sector/ Major industry group
l.udustey Sector 6 Wholeoale. n:lail and import/apart trades, restaurants and bclcls
Wholesale
Retail
Import/export
Restaurants
Hotels and boarding houses
l.udustty Sector 7 Tnmsport, ltoragc and communication
Land passenger transport
Supporting services to land transport
Ocean and coastal water transport
Inland "Water transport
Supporting services to water transport
Air transport
Services incidental to transport
Storage
Communication
l.udustey Sector 8 Financing, inswancc, -1 e&tate and business seniocs
Banking
Finance and investment companies
Stock, commodity and bullion brokers, exchanges and services
Financial institutions, n.e.c.
Insurance
Real estate
Rental of machinery and equipment
Business services, except rental of machinery and equipment
l.udustry Sector 9 Community, oocial and personal serviocs
Sanitary and similar services
Education services
Research and scientific institutes
Medical, dental and other health services
Welfare institutions
Business associations
Miscellaneous social and related community services
Motion pictures and other entertainment services
Libraries, museums and cultural services
Miscellaneous amusement and recreational services
Repair services
Laundries, dry cleaning and garment services
Miscellaneous personal services
BY MAJOR INDUSTRY GROUP ---contd.
Establishments
3rd quarter 1991
Persons engaged Male Female Total
151 648 523 741 356 552 880 293
16 533 53 762 22 161 75 923
54 162 112 159 93 302 205 461
70159 217717 157528 375245
9 102 116 834 69 212 186 046
1 693 23 268 14 350 37 618
6 288
8
136
434
91652
21 208
1814
6 321
39 751 131 403
1 574 22 782
506 2 320
3 592 9 913
1 583 110 1 693
1 468 10 543 1 534 12 077
135 7 289 7 747 15 036
3 334 22 276 1 s 601 37 883
322 4 127 829 4 956
449 16 491 8 251 24 742
33 749 167 353 121 768 289 121
1 760 32 037 37 268 69 305
2 19S 12113 8 949 21 062
1 048 6 812 4 193 11 005
936 6 701 3 726 10 427
4 795,
9 569
124
8 759
35 332
499
10 336
17 532
158
19 095
52 864
657
13 321 65 099 39 607 104 706
23 861 123 055 139 078 262 133
934
2 145
20
4 082
1 469
303
665
2 518
34
234
4240
1147
6 070
13 913
33 242
66
8 737
4 465
1 308
3 1S9
11 807
233
6 208
17 592
3 225
19 099
17 360
so 516
79
24191
16 831
1 435
3 093
6 430
206
3060
2 297
3 122
10 457
31 273
83 758
145
32 928
21296
2 743
6 252
18 237
439
9 268
19 889
6 347
29 556
Establishments
2nd quarter 1992
Persons engaged Male Female Total
158 729 529 328 374 285 903 613
16 970 54 691 23 135 77 826
54 898 108 662 97 960 206 622
76 260 225 745 165 633 391 378
9184 117049 73067 190116
1 417 23 181 14 490 37 671
6721
8
115
390
97101
21 480
2198
6 584
43 335 I 40 436
1 689 23 169
643 2 841
3 683 10 267
2 1553 117 1670
1 822 11 293 1 583 12 876
130 9 376 8 508 17884
3 377 21 432 16 088 37 520
344 4 423 851 s 274
531 18 763 10 173 28 936
36 466 175 409 129 948 305 357
1 722 31 400 37 330 68 730
2 366 12 807 9 506 22 313
9SO 6 708 4 484 11192
1 059 6 558 4 004 10 562
4 644
10 725
130
8 976
36 961
487
11 210
19 417
137
20 186
56 378
624
14869 71512 43860 115372
24 OSl 124 589 138 472 263 061
904
2148
19
3 967
1409
339
604
2 614
35
265
4 257
1 273
6 217
13 626
32 947
47
11 017
3 469
1 445
3 399
11 897
151
6 703
17 542
3 301
19 045
13043
50905
74
29 630
14 526
1 375
3 222
6 618
211
3 169
2 088
3 611
10001
26 669
83 852
121
40 647
17 99S
2820
6 621
18 515
362
9 872
19 630
6 912
29 046
Establishments
3rd quarter 1992
Persons engaged Male Female Total
160 446 528 911 377 882 906 859
17 088 53 916 24 380 78 296
54 694 106 761 96 984 203 745
77 907 226 454 165 003 391 457
9473 118203 76251 194454
1 284 23 643 15 264 38 907
6904
8
126
415
99186
21 784
1 936
6 877
44 972 144 158
1 774 23 558.
902 2 838
3 926 10803
2 1 SS2 122 1 674
1 893 11 649 1 825 13 474
129 9 470 8 749 18 219
3 489 22 06S 16 438 38 503
353 4 679 976 5 655
489 19174 10261 29435
36 411 176 514 131 024 307 538
1 736 31 518 37 684 69 202
2 638 13 543 9 809 23 352
9S3 6 780 4 545 11 325
1133 6 717 4198 10915
4474
10 54S
119
8 868
36 724
351
11127
18 948
1S2
19 995
SS 612
S03
14 813 72 013 44 560 116 S73
23 626 123 750 139 524 263 274
992
2024
17
3 970
1 398
31S
620
2 432
33
2S2
4214
1 183
6176
12 599
33 888
so 11 920
3 617
1431
3 168
11 112
138
6 S3S
17 581
3 257
18 455
14 509
so 416
73
29918
14500
1 433
3420
6246
187'
3 119
2 189
3 578
9 935
27108
84 304
123
41838
18 117
2 864
6 588
17 358
325
9 654
19 770
6 835
28 390
Note: Up to 4th quarter 1990, figures are analysed by the International Standard Industrial Classification (!SIC). As from March 1991, the Hong Kong Standard l.udustrial Classification (HSIC) is adopted for the classification of economic activities in place of ISIC. Figures from 1st quarter 1991 onwards are therefore available only in HSIC and are not strictly comparable to those in the past series which are in ISIC.
'n.e.c.' denotes not elsewhere classified. # Figures for persons engaged at construction sites refer to manual workers only.
Hong Kong Monthly Digest of Statistics Jaiwary 1993 5
LABOUR
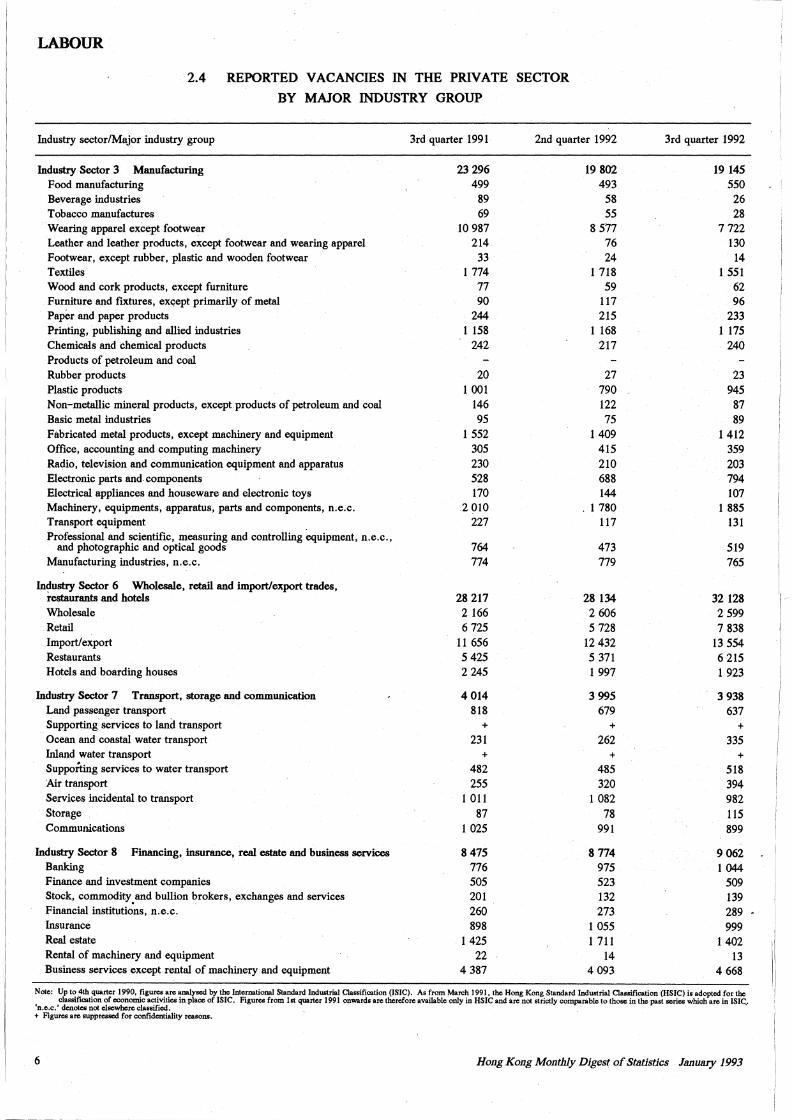
2.4 REPORTED VACANCIES IN THE PRIVATE SECTOR
BY MAJOR INDUSTRY GROUP
Industry sector/Major industry group 3rd quarter 1991 2nd quarter 1992 3rd quarter 1992
Industry Sector 3 Manufacturing 23 296 19 802 19 145 Food manufacturing 499 493 550 Beverage industries 89 58 26 Tobacco manufactures 69 55 28 Wearing apparel except footwear 10 987 8 577 7 722 Leather and leather products, except footwear and wearing apparel 214 76 130 Footwear, except rubber, plastic and wooden footwear 33 24 14 Textiles 1 774 l 718 1 551 Wood and cork products, except furniture 77 59 62 Furniture and fixtures, except primarily of metal 90 117 96 Paper and paper products 244 215 233 Printing, publishing and allied industries 1 158 l 168 1 175 Chemicals and chemical products 242 217 240 Products of petroleum and coal Rubber products 20 27 23 Plastic products 1 001 790 945 Non-metallic mineral products, except products of petroleum and coal 146 122 87 Basic metal industries 95 75 89 Fabricated metal products, except machinery and equipment 1 552 1409 1 412 Office, accounting and computing machinery 305 415 359 Radio, television and communication equipment and apparatus 230 210 203 Electronic parts and components 528 688 794 Electrical appliances and houseware and electronic toys 170 144 107 Machinery, equipments, apparatus, parts and components, n.e.c. 2 010 1 780 1 885 Transport equipment 227 117 131 Professional and scientific, measuring and controlling equipment, n.e.c.,
and photographic and optical goods 764 473 519 Manufacturing industries, n.e.c. 774 779 765
In~ustry Sector 6 Wholesale, retail and import/export trades, restaurants and hotels 28 217 28 134 32 128 Wholesale 2 166 2 606 2 599 Retail 6 725 5 728 7 838 Import/ export 11 656 12 432 13 554 Restaurants 5 425 5 371 6 215 Hotels and boarding houses 2 245 l 997 l 923
Industry Sector 7 Transport, storage and communication 4 014 3 995 3 938 Land passenger transport 818 679 637 Supporting services to land transport + + + Ocean and coastal water transport 231 262 335 Inland water transport + + + Supporting services to water transport 482 485 518 Air transport 255 320 394 Services incidental to transport l 011 1 082 982 Storage 87 78 115 Communications 1 025 991 899
Industry Sector 8 Financing, insurance, real estate and business services 8475 8 774 9 062 Banking 776 975 l 044 Finance and investment companies 505 523 509 Stock, commodity.and bullion brokers, exchanges and services 201 132 139 Financial institutions, n.e.c. 260 273 289 Insurance 898 l 055 999 Real estate 1425 1 711 1402 Rental of machinery and equipment 22 14 13 Business services except rental of machinery and equipment 4 387 4 093 4 668
N otc: Up to 4th quarter 1990, figures arc analysed by the International Standard Industrial Classification (ISIC). As from March 1991, the Hong Kong Standard Industrial Classification (HSJC) is adopted for the classification of economic activities in place of ISIC. Figures from lst quarter 1991 onwards are therefore available only in HSIC and arc not strictly comparable to those in the past series which are in ISIC.
'n.e.c.' denotes not elsewhere clai;sified. · + Figures are suppressed for confidentiality reasons.
6 Ho11g Kong Monthly Digest of St.atistics January 1993
I
I
I
I
I
i,
I
LABOUR
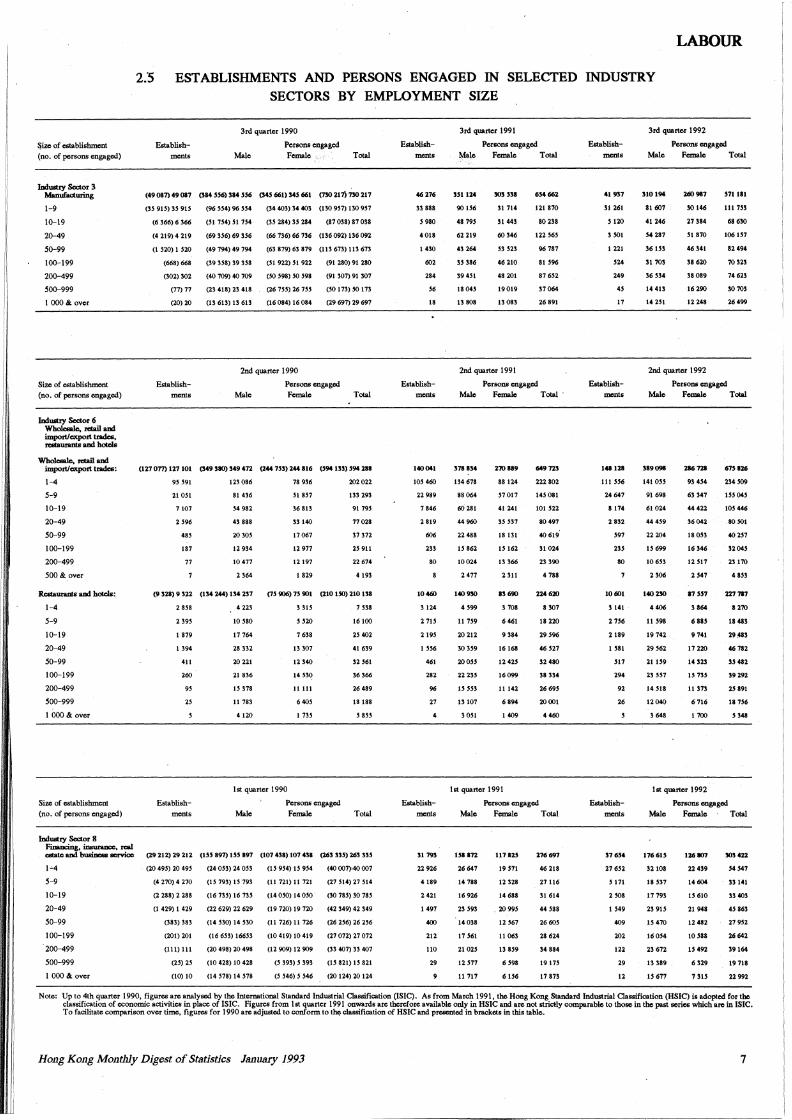
2.5 ESTABLISHMENTS AND PERSONS ENGAGED IN SELECTED INDUSTRY SECTORS BY EMPLOYMENT SIZE
Siz.e of establishment (no. of persons engaged)
Industry Sector 3 Manufacturing
1-9
10-19
20-49
50-99
100-199
200-499
500-999
1 OOO & over
Size of establishment (no. of persons engaged)
Industry Sector 6 Wholesslc. retail and import/export trades, n:&taurauts and hotels
Whoiesslc. retail and import/export trades:
1-4
5-9
10-19
20-49
50-99
100-199
200-499
500 & over
Restaurants and holds:
1-4
5-9
10-19
20-49
50-99
100-199
200-499
500-999
I OOO & over
Siz.e of establishment {no. of persons engaged)
Industry Sector 8 Financing, insurau:e, ""1
Establishments
3rd quarter 1990
Persons engaged Male Femsle Total
(49 037) 49 037 (334 556) 334 556 (345 661) 345 661 (730 217) 730 217
(35 915) 35 915 (96 554) 96 ll4 (34 403) 34 403 (130 957) 130 957
(6 366) 6 366 (SI 754) 51 754 (35 234) 35 234 (37 033) 37 033
(4 219) 4 219 (69 356) 69 356 (66 736) 66 736 (136 092) 136 092
(1 520) I 520 (49 794) 49 794 (63 379) 63 379 (113 673) 113 673
(663) 663 (39 353) 39 353 (SI 922) 51 922 (91 230) 91 230
(302) 302 (40 709) 40 709 (50 S93) so 593 (91 307) 91 307
(77) 77 (23 413) 23 413 (26 7ll) 26 7ll (30 173) 30 173
(20) 20 (13 613) 13 613 (16 084) 16 034 (29 697) 29 697
Establishments
2nd quarter 1990
Persons engaged Male Femsle Total
(127 077) 127101 Cl49 330) 349 472 (244 7S3) 244 816 (394 133) S94 233
9S 591
21 OSI
7 107
2 596
435
137
77
123 036
81 436
S4 932
43 333
20 305
12 934
10 477
2 364
73 936
51 357
36 313
33 140
17067
12 977
12197
1329
202 022
133 293
9119S
77028
37 372
25 911
22 674
4 193
(9 323) 9 322 (134 244) 134 237 (1S 906) 7S 901 (210 ISO) 210 133
2 353
2 39S
I 379
I 394
411
260
95
2S
Establishments
4 223
10 530
17 764
23 332
20 221
21 836
15 378
11 733
4 120
1 st quarter 1990
3 315 7 S38
s S20 16100
7 633 25 402
13 307
12 340
14 530
11 111
6 405
1 735
41 639
32 561
36 366
26 439
18 188
S SSS
Persons engaged
Male Female Total
estate and busincos service (29 212) 29 212 (155 397) ISS 197 (107 433) 107 431 (263 335) 263 335
lc4
5-9
10-19
20-49
50-99
100-199
200-499
500-999
1 OOO & over
(20 495) 20 49l (24 053) 24 053 (IS 954) IS 954 (40 007)>40 007
(4 270) 4 270 (15 793) 15 793 (11721)11 721 (27 514) 27 514
(2 288) 2 233 (16 735) 16 735 (14 OSO) 14 050 (30 73S) 30 78S
(I 429) I 429 (22 629) 22 629 (19 720) 19 720 (42 349) 42 349
(333) 333 (14 530) 14530 (11 726) 11 726 (26 256) 26 256
(201) 201 (16 653) 166S3 (10 419) 10 419 (27 072) 27 072
(Ill) 111 (20 493) 20 493 (12 909) 12 909 (33 407) 33 407
(2S) 2S (10 423) 10 423 (5 393) s 393 (15 821) IS 321
(10) 10 (14573) 14573 (5 l46) 5 546 (20 124) 20 124
Establishments
~276
33 338
5 930
4013
1 430
602
234
56
13
Establishments
140041
105460
22989
7 346
2 819
606
233
30
10~
3 124
2 715
2 19S
15S6
~l
232
96
27
Establishments
31 793
22 926
4 139
2421
I 497
400
212
110
29
3rd quarter 1991
Persons engaged Male Femsle Total
351124
90 156
43 795
62 219
43 264
35336
39 451
18045
13 303
303 '33
31 714
31 443
60 346
53 S23
46 210
43 201
19019
13033
6S4662
121 370
30233
122 S6S
96 737
31 596
37 6S2
37064
26 891
2nd quarter 1991
Persons engaged Male Femsle Total ·
373 334
134 678
88 064
60 281
44 960
22 488
15 862
10024
2 477
140930
4599
11 7S9
20 212
30 359
200ll
22 23S
15 553
13 107
3 OSI
210 839
88 124
57017
41 241
3.S 537
18131
1.S 162
13 366
2 311
33 690
3 708
6 461
9 334
16163
12 425
16099
11142
6 394
I 409
649723
222 802
145 031
101 522
80 497
40619.
ll 024
23 390
4 788
224620
3 307
18 220
29 596
46 S27
32 430
33 334
26695
20001
4460
lst quarter 1991
Persons engaged
Male Femsle Total
ISI 372
26647
14 783
16 926
23 593
14033
17 S61
21 02S
12 577
II 717
117125
19 S71
12 323
14 688
20 995
12 S67
11 063
13 359
6 593
6156
276697
46 213
27116
31 614
44 538
26 60S
23 624
34 834
1917S
17 373
Establishments
41937
31 261
5120
3 301
I 221
524
249
45
17
Establish-ments
148123
Ill 556
24647
3 174
2 832
591
235
30
10601
3141
2 756
2189
I 531
517
294
92
26
Establishments
376l4
27 6S2
5 171
2 503
1549
409
202
122
29
12
3rd quarter 1992
Persons engaged Male Femsle Total
310194
31607
41 246
54 237
36153
31 703
36 S34
14 413
14 251
260 937
30146
27 334
51 370
46 341
33 620
33 039
16 290
12 243
S71 lll
111 753
63 630
106157
32494
70323
74623
30 703
26499
2nd quarter 1992
Persons engaged Male Female Total
389098
141055
9·1 693
61 024
44 459
22 204
15 699
10 653
2 306
140230
4 406
II 598
19 742
29 562
21 159
23 551
14 513
12 040
3 643
236 728
93 454
63 347
44 422
36042
18 053
16 346
12 517
2 547
17 557
3364
6335
9 741
17 220
14 323
15135
11 373
6 716
I 700
675126
234 309
155 04S
!OS 446
30 301
40 257
32045
23170
4 353
227737
8 270
18 433
29.433
46 732
35 482
39 292
2S 391
13 756
5343
lst quarter 1992
Persons engaged Male Female Total
176 615
32 103
18 537
17 793
23 91S
15 470
16054
23 672
13 389
15677
126807
22 439
14 604
ll 610
21 943
12432
10 533
IS 492
6 329
7315
303 422
S4 547
33 141
33 403
45 363
27 952
26642
39164
19718
22 992
Note: Up to 4th quarter 1990, figures are analysed by the International Standard Industrial Classification (!SIC). As from March 1991, the Hong Kong Standard Industrial Classification (HSIC) is adopted for the classification of economic activities in place of ISIC. Figures from 1 st quarter 1991 onwards are therefore available only in HSIC and are not strictly comparable to those in the past series which arc in ISIC. To facilitate comparison over time, figures for 1990 are adjusted to conform to the! classification of HSIC and presented in brackets in this table.
Hong Ko11g Mo11thly Digest of Statistics January 1993 7
LABOUR
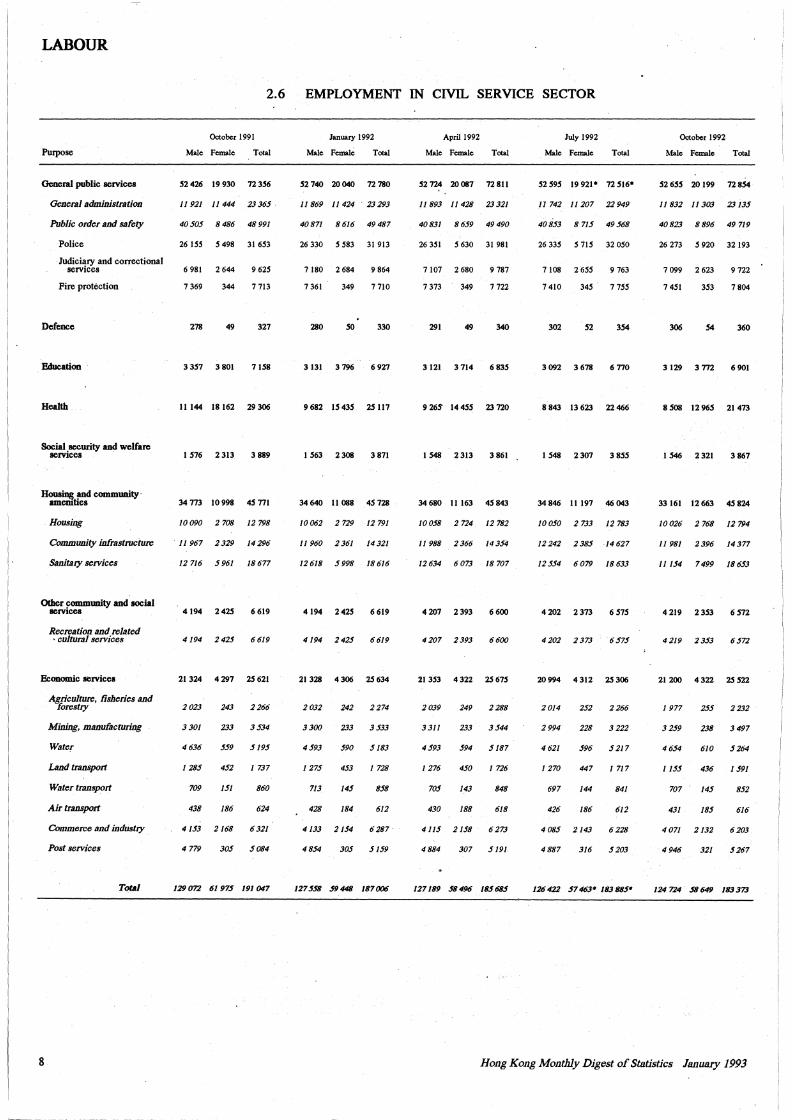
2.6 EMPLOYMENT IN CIVIL SERVICE SECTOR
October 1991
Purpose Male Female Total
General public services 52 426 19 930 72 356
General administration 11 921 11 444 23 365 ,
Public order and safety 40 505 8 486 48 991
Police 26 155 5 498 31 653
Judiciary and correctional services 6 981 2 644 9 625
Fire protection 7 369 344 7 713
Defence 278 49 327
Education 3 357 3 801 7 1511
Health
Social security and welfare services
Housing !IJld community· amenities
Housing
Community infrastructure
Sanitary services
Other ~ommunity and social services
Recreation and related • cultural services
Economic services
8
Agriculture, fisheries and forestry
Mining, manufacturing
Water
Land transport
Water transport
Air transport
Commerce and industry
Post services
Total
11 144 18 162 29 306
1516 2313 3889
34 773 10 998 45 771
JO 090 2 708 12 798
II 967 2 329 14 296
12 716 5 961 18 677
4 194 2 425 6 619
4194 2425 6619
21 324 4 297 25 621
2 023 243 2 266
3 301 233 3 534
4 636 559 5195
I 285 452 I 737
709 151 860
438 186 624
4153 2168 6321
4 779 305 5 084
129 072 61 975 191 047
January 1992
Male Female Total
52 740 20 040 72 780
11 869 11 424 , 23 293
40871 8616 49487
26 330 5 583 31 913
7180 2684 9864
7 361 349 7 710
280 so 330
3 131 3 796 6 927
9 682 15 435 25 117
I 563 2 308 3 871
34 640 11 088 4S 728
JO 062 2 729 12 791
11 960 2 361 14 321
12618 5998 18616
4194 2425 6619
4194 2425 6619
21 328 4 306 25 634
2 032 242 2 274
3 300 233 3 533
4 593 590 5183
I 275 453 I 728
713 145 858
428 184 612
4133 2154 6287
4 854 305 5159
127558 59448 187006
April 1992
Male Female Total
52724 20087 72811
11 893 11 428 23 321
40 831 8 659 49 490
26 351 5 630 31 981
7 107 2 680 9 787
7 373 349 7 722
291 49 340
3 121 3 714 6 835
9 265" 14 455 23 720
I 548 2 313 3861
34 680 II 163 45 843
10058 2 724 12 782
11 988 2 366 N 354
12 634 6 073 18 707
4 207 2 393 6 600
4207 2393 6600
21 353 4 322 25 675
2 039 249 2 288
3 311 233 3 544
4 593 594 5187
I 276 450 I 726
705 143 848
430 188 618
4 115 2 158 6 273
4 884 307 5191
127189 58496 185685
July 1992
Male Female TolJll
52595 19921* 72516*
11 742 11 207 22 949
40 853 8 715 49 568
26 335 5 715 32 050
7108 2655 9763
7 410 345 7 155
302 52 354
3 092 3 678 6 770
8 843 13 623 22 466
I 548 2 307 3 855
34 846 II 197 46 043
JO 050 2 733 12 783
12 242 2 385 14 627
12 554 6 079 18 633
4 202 2 373 6 515
4202 2373 6575
20 994 4 312 25 306
2 014 252 2 266
2 994 228 3 222
4 621 596 5 217
I 270 447 I 717
697 144 841
426 186 612
4085 2143 6228
4 887 316 5 203
126 422 57 463• 183 885•
October 1992
Male Female Total
52 655 20 199 72 854
11 832 11 303 23 135
40 823 8 896 49 719
26 273 5 920 32193
7 099 2 623 9 722
7 451 353 7 804
306 54 360
3129 3772 6901
8 508 12 965 21 473
1546 2321 3867
33 161 12 663 4S 824
10026 2 768 12 794
11 981 2 396 14 377
11154 7499 18653
4219 2353 6572
4219 2353 6572
21 200 4 322 2S 522
I 977 255 2 232
3 259 238 3 497
4 654 610 5 264
I 155 436 I 591
707 145 852
431 185 616
4071 2132 6203
4 946 321 5 267
124 724 58649 183373
Hong Kong Monthly Digest of Statistics January 1993
LABOUR·
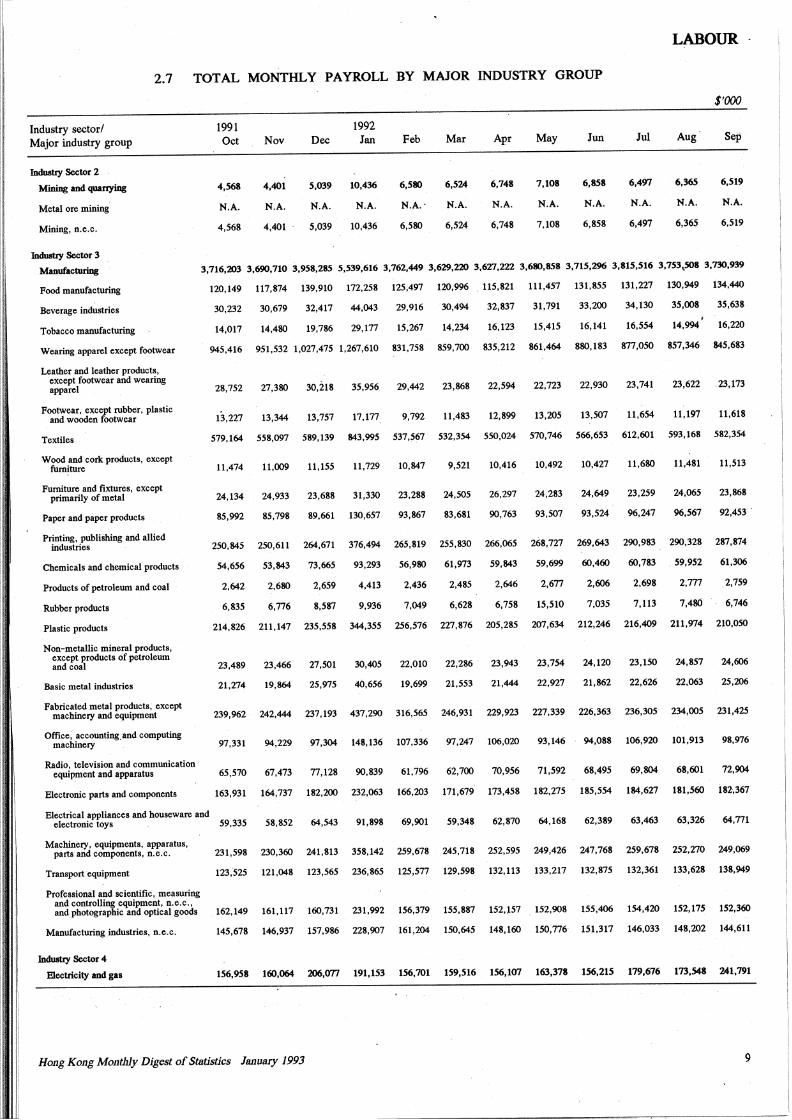
2.7 TOTAL MONTHLY PAYROLL BY MAJOR INDUSTRY GROUP
Industry sector/ Major industry group
Jnduatry Sector 2
Mining and quanyiDg
Metal ore mining
Mining, n.e.c.
Jnduatry Sector 3
Manufacturing
Food manufacturing
Beverage industries
Tobacco manufacturing
Wearing apparel except footwear
Leather and leather products, except footwear and wearing apparel
Footwear, .except rubber, plastic and wooden footwear
Textiles
Wood and cork products, except furniture
Furniture and fixtures, except primarily of metal
Paper and paper products
Printing, publishing and allied industries
Chemicals and chemical products
Products of petroleum and coal
Rubber products
Plastic products
Non-metallic mineral products, except products of petroleum and coal
Basic metal industries
Fabricated metal products; except machinery and equipment
1991 Oct
4,S68
N.A.
4,S68
Nov
4,401
N.A.
4,401
1992 Dec Jan
S,039 10,436
N.A. N.A.
S,039 10,436
Feb Mar
6,580 6,S24
N.A.· N.A.
6,S80 6,S24
Apr
6,748
N.A.
6,748
May
7,108
N.A.
7,108
Jun
6,8S8
N.A.
6,8S8
Jul
6,497
N.A.
6,497
Aug
6,365
N.A.
6,36S
$'000
Sep
6,S19
N.A.
6,Sl9
3,716,203 3,690,710 3,9S8,28S S,S39,616 3,762,449 3,629,220 3,627,222 3,680,SSB 3,71S,296 3,81S,Sl6 3,7S3,S08 3,730,939
120,149 117,874 139,910 172,2S8 12S,497 120,996 _ llS,821 ll1,4S7 131,SSS 131,227 130,949 134,440
30,232 30,679 32,417 44,043 29,916 30,494 32,837 31,791 33,200 34,130 3S,008 35,638
14,017 14,480 19,786 29,177 15,267 14,234 16,123 15,415 16,141 16,554 14,994. 16,220
945,416 951,532 1,027,475 1,267,610 831,758 859,700 835,212 861,464 880,183 877,050 857,346 845,683
28,752 27,380 30,218 35,956 29,442 23,868 22,594 22,723 22,930 23,741 23,622 .23,173
13,227 13,344 13,757 17,177_ 9,792 11,483 12,899 13,205 13,507 11,654 11,197 11,618
579,164 558,097 589,139 843,995 537,567 532,354 550,024 570,746 566,653 612,601 593,168 582,354
11,474 11,009 11,155 11,729 10,847 9,521 10,416 10,492 10,427 11,680 11,481 11,513
24,134 24,933 23,688 31,330 23,288 24,505 26,297 24,283 24,649 23,259 24,065 23,868
85,992 85,798 89,661 130,657 93,867 83,681 90,763 93,507 93,524 96,247 96,567 92,453 -
250,845 250,611 264,671 376,494 265,819 2S5,830 266,065 268,727 269,643 290,983 290,328 287,874
54,656 53,843 73,665 93,293 56,980 61,973 59,843 59,699 60,460 60,783 . 59,952 61,306
2,642 2,680 2,659 4,413 2,436 2,485 2,646 2,677 2,606 2,698 2,777 2,759
6,835 6,776 8,587 9,936 7,049 6,628 6,758 15,510 7,035 7,113 7,480 6,746
214,826 211,147 235,558 344,35S 256,576 227,876 205,285 207,634 212,246 216,409 211,974 210,050
23,489 23,466 27,501 30,405 22,010 22,286 - 23,943 23,754 24,120 23,150 24,857 24,606
21,274 19,864 25,975 40,656 19,699 21,553 21,444 22,927 21,862 22,626 22,063 2S,206
239,962 242,444 237,193 437,290 316,565 246,931 229,923 227,339 226,363 236,305 234,005 231,425
Office; accounting_ and computing machinery 97,331 94,229 97,304 148,136 107,336 97,247 106,020 93,146 94,088 106,920 101,913 98,976
Radio, television and communication equipment and apparatus 65,570 67,473 77,128 90,839 61,796 62,700 70,956 71,592 68,495 69,804 68,601 72,904
Electronic parts and components 163,931 164,737 182,200 232,063 166,203 171,679 173,458 182,275 185,554 184,627 181,560 i82·,367
Electrical appliances and houseware and electronic toys _ 59,335 58,852 64,543 91,898 69,901 59,348 62,870 64,168 62,389 63,463 63,326 64,771
Machinery, equipments, apparatus, parts and components, n.e.c. 231,598 230,360 241,813 358,142 259,678 245,718 2S2,S95 249,426 247,768 259,678 252,270 249,069
Transport equipment 123,52S 121,048 123,565 236,865 12S,577 129,598 132,113 133,217 132,875 132,361 133,628 138,949
Professional and scientific, measuring and controlling equipment, n. e. c., and photographic and optical goods 162,149 161,117 160,731 231,992 156,379 155,887 152,.157 . 152,908 155,406 154,420 152,175 152,360
Manufacturing industries, n.e.c.
Jnduatry Sector 4
Electricity. and gas
145,678 146,937 157,986 228,907 161,204 150,645 148,160 150,776 151,317 146,033 148,202 144,611
156,958 160,064 206,077 191,153 1S6,701 159,516 1S6,107 163,378 1S6,215 179,676 173,548 241,791
Hong Kong Monthly Digest of SfJltistics January 1993 9
·LABOUR
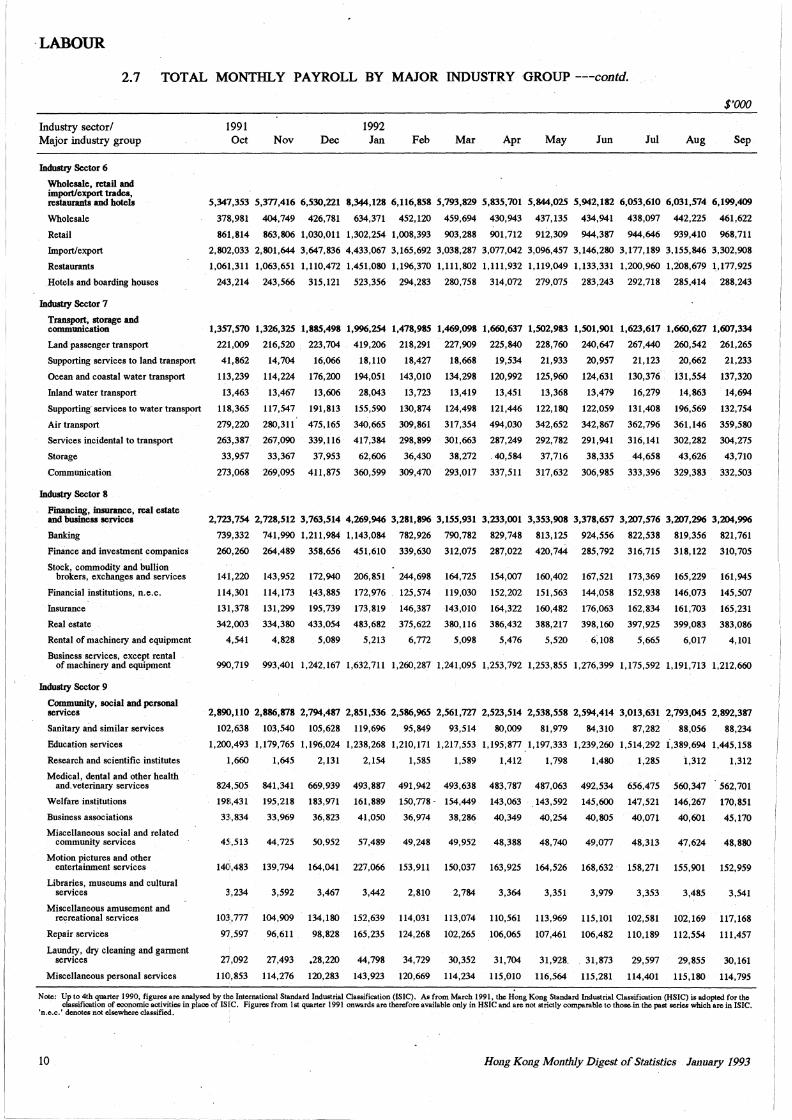
2.7 TOTAL MONTHLY PAYROLL BY MAJOR INDUSTRY GROUP ---contd.
Industry sector/ Major industry group
Industry Sector 6
Wholesale, retail and import/export trades, restaurants and hotels
Wholesale
Retail
Import/export
Restaurants
Hotels and boarding houses
Industry Sector 7
Transport, storage and communication
Land passenger transport
Supporting services to land transport
Ocean and coastal water transport
Inland water transport
Supporting· services to water transport
Air transport
Services incidental to transport
Storage
Communication
Industry Sector 8
Financing, insurance, real estate and business services
Banking
Finance and investment companies
Stock, commodity and bullion brokers, exchanges and services
Financial institutions, n.e.c.
Insurance
Real estate
Rental of machinezy and equipment
Business services, except rental of machinezy and equipment
Industry Sector 9
Community, social and personal services
Sanitazy and similar services
Education services
Research and scientific institutes
Medical, dental and other health and.veterinazy services
Welfare institutions
Business associations
Miscellaneous social and related community services
Motion pictures and other entertainment services
Libraries, museums and cultural services
Miscellaneous amusement and recreational services
Repair services
Laundzy, dzy cleaning and garment services
Miscellaneous personal services
1991 Oct Nov Dec
1992 Jan Feb Mar Apr
$'000
May Jun Jut Aug Sep
5,347,353 5,377,416 6,530,221 8,344,128 6,116,858 5,793,829 5,835,701 5,844,025 5,942,182 6,053,610 6,031,574 6,199,409
378,981 404,749 426,781 634,371 452,120 459,694 430,943 437,135 434,941 438,097 442,225 461,622
861,814 863,806 1,030,011 1,302,254 1,008,393 903,288 901,712 912,309 944,387 944,646 939,410 968,711
2,802,033 2,801,644 3,647,836 4,433,067 3,165,692 3,038,287 3,077,042 3,096,457 3,146,280 3,177,189 3,155,846 3,302,908
1,061,311 1,063,651 1,110,472 1,451,080 1,196,370 1,111,802 1,111,932 1,119,049 1,133,331 1,200,960 1,208,679 1,177,925
243,214 243,566 315,121 523,356 294,283 280,758 314,072 279,075 283,243 292,718 285,414 288,243
1,357,570 1,326,325 1,885,498 1,996,254 1,478,985 1,469,098 1,660,637 1,502,983 1,501,901 1,623,617 1,660,627 1,607,334
221,009 216,520 223,704 419,206 218,291 227,909 225,840 228,760 240,647 267,440 260,542 261,265
41,862
113,239
13,463
118,365
279,220
263,387
33,957
273,068
14,704 16,066
114,224 176,200
13,467 13,606
117,547 191,813
280,311 475, 165
267,090 339, 116
33,367 37,953
269,095 411,875
18,110
194,051
28,043
155,590
340,665
417,384
62,606
360,599
18,427
143,010
13,723
130,874
309,861
298,899
36,430
309,470
18,668
134,298
13,419
124,498
317,354
301,663
38,272
293,017
19,534
120,992
13,451
121,446
494,030
287,249
. 40,584
337,511
21,933
125,960
13,368
122,18()
342,652
292,782
37,716
317,632
20,957
124,631
13,479
122,059
342,867
291,941
38,335
306,985
21,123
130,376
16,279
131,408
362,796
316,141
44,658
333,396
20,662
131,554
14,863
196,569
361,146
302,282
43,626
329,383
21,233
137,320
14,694
132,754
359,580
304,275
43,710
332,503
2,723,754 2,728,512 3,763,514 4,269,946 3,281,896 3,155,931 3,233,001 3,353,908 3,378,657 3,'l!J/,576 3,'l!J/,296 3,204,996
739,332 741,990 1,211,984 1,143,084 782,926 790,782 829,748 813,125 924,556 822,538 819,356 821,761
260,260
141,220
114,301
131,378
342,003
4,541
264,489 358,656
143,952 172,940
114, 173 143,885
131,299 195,739
334,380 433,054
4,828 5,089
451,610
206,851
172,976
173,819
483,682
5,213
339,630
244,698
125,574
146,387
375,622
6,772
312,075
164,725
119,030
143,010
380,116
5,098
287,022
154,007
152,202
164,322
386,432
5,476
420,744
160,402
151,563
160,482
388,217
5,520
285,792
167,521
144,058
176,063
398,160
6:108
316,715
173,369
152,938
162,834
397,925
5,665
318,122
165,229
146,073
161,703
399,083
6,017
310,705
161,945
145,507
165,231
383,086
4,101
990,719 993,401 1,242,167 1,632,711 1,260,287 1,241,095 1,253,792 1,253,855 1,276,399 1,175,592 1,191,713 1,212,660
2,890,110 2,886,878 2,794,487 2,851,536 2,586,965 2,561,727 2,523,514 2,538,558 2,594,414 3,013,631 2,793,045 2,892,387
102,638 103,540 105,628 119,696 95,849 93,514 80,009 81,979 84,310 87,282 88,056 88,234
1,200,493 1,179,765 1,196,024 1,238,268 1,210,171 1,217,553 1,195;877 1,197,333 1,239,260 1,514,292 l,389,694 1,445,158
1,660 1,645 2,131 2,154 1,585 1,589 1,412 1,798 1,480 1,285 1,312 1,312
824,505 841,341 669,939 493,887 491,942 493,638 483,787 487,063 492,534 656,475 560,347 562,701
19fl,431
33,,834
195,218
33,969
183,971
36,823
161,889 150,778. 154,449
41,050 36,974 38,286
143,063
40,349
143,592
40,254
145,600
40,805
147,521
40,071
146,267
40,601
170,851
45,170
45,513 44,725 50,952 57,489 49,248 49,952 48,388 48,740 49,077 48,313 47,624 48,880
14<Ji,483 139,794 164,041 227,066 153,911 150,037 163,925 164,526 168,632 158,271 155,901 152,959
3,234 3,592 3,467 3,442 2,810 2,784 3,364 3,351 3,979 3,353 3,485 3,541
103,777 104,909 134,180 152,639 114,031 113,074 110,561 113,969 115,101 102,581 102,169 117,168
97,597 96,611 98,828 165,235 124,268 102,265 106,065 107,461 106,482 110,189 112,554 111,457
27,092 27,493 ,28,220 44,798 34,729 30,352 31,704 31,928. 31,873 29,597 29,855 30,161
lW,853 114,276 120,283 143,923 120,669 114,234 115,010 116,564 115,281 114,401 115,180 114,795
Note: Up to 4th quarter I 990, figures are analysed by the International Standard Industrial Classification (!SIC). As from March 1991, the Hong Kong Standard Industrial Classification (HSIC) is adopted for the classification of economic activities in place of ISJC. Figures from lst quarter 1991 onwards are therefore available only in HSIC and are not strictly comparable to those.in the past series which are in ISIC.
'n.e.c.' denotes not elsewhere classified.
10 Ho11g Ko11g Montlily Digest of Statistics January 1993
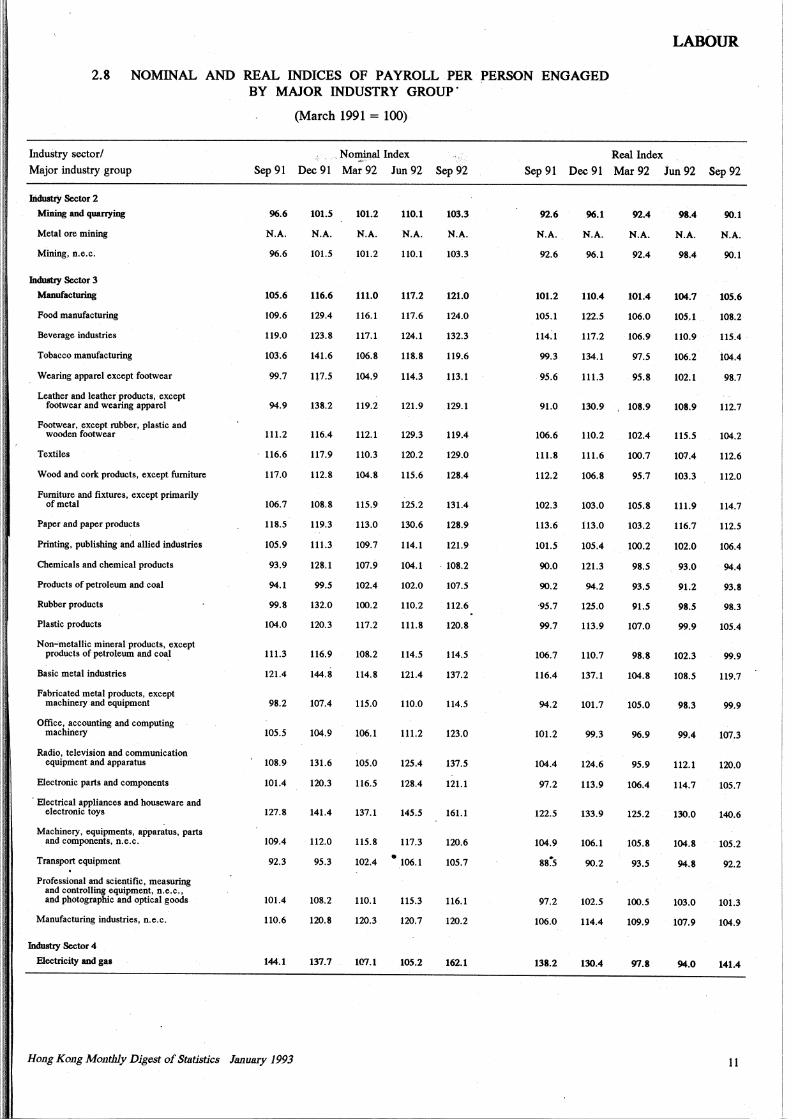
2.8 NOMINAL AND REAL INDICES OF PAYROLL PER PERSON ENGAGED BY MAJOR INDUSTRY GROUP.
(March 1991 = 100)
, .. No~Index
LABOUR
Real Index Industry sector/ Major industry group Sep 91 Dec 91 Mar 92 Jun 92 Sep 92 Sep 91 Dec 91 Mar 92 Jun 92 Sep 92
lliduatzy Sector 2
MiDiDg and quanying
Metal ore mining
Mining, n.e.c;
Industzy Sector 3
Manufacturing
Food manufacturing
Beverage industries
Tobacco manufacturing
Wearing apparel except footwear
Leather and leather products, except footwear and wearing apparel
Footwear, except rubber, plastic and wooden footwear
Textiles
Wood and cork products, except furniture
Furniture and fixtures, except primarily of metal
Paper and paper products
Printing, publishing and allied industries
Chemicals and chemical products
Products of petroleum and coal
Rubber products
Plastic products
Non-metallic mineral products, except products of petroleum and coal
Basic metal industries
Fabricated metal products, except machinery and equipment
Office, accounting and computing machinery
Radio, television and communication equipment and apparatus
Electronic parts and components
· Electrical appliances and houseware and electronic toys
Machinery, equipments, awaratus, parts and components, n.e.c.
Transport equipment
Professional and scientific, measuring and controlling equipment, n.e.c., and photographic and optical goods
Manufacturing industries, n.e.c.
Industzy Sector 4
Electricity and gas
96.6
N.A.
96.6
lOS.6
109.6
119.0
103.6
99.7
94.9
111.2
116.6
117.0
106.7
118.S
lOS.9
93.9
94.1
99.8
104.0
111.3
121.4
98.2
lOS.S
108.9
101.4
127.8
109.4
92.3
101.4
110.6
144.1
Hong Kong Monthly Dige8t of Statistics January 1993
101.S
N.A.
101.S
116.6
129.4
123.8
141.6
U7.S
138.2
116.4
117.9
112.8
108.8
119.3
111.3
128.1
99.S
132.0
120.3
116.9
144.8
107.4
104.9
131.6
120.3
141.4
112.0
9S.3
108.2
120.8
137.7
101.2
N.A.
101.2
110.1
N.A.
110.1
103.3
N.A.
103.3
111.0 117.2 121.0
116.1 117.6 124.0
117.1 124.1 132.3
106.8 118.8 119.6
104.9 114.3 113.1
119.2 121.9 129.1
112.1 129.3 119.4
110.3 120.2 129.0
104. 8 11S.6 128.4
115.9 125.2 131.4
113.0 130.6 128.9
109. 7 114.1 121. 9
107.9 104.1 . 108.2
102.4 102.0 107 .5
100.2 110.2 112.6
117.2 111.8 120.8
108.2 114.5 114.5
114.8 121.4 137.2
115.0 110.0 114.5
106.1 111.2 123.0
105.0 125.4 137.5
116.5 128.4 121.1
137.1 145.5 161.1
115.8 117.3 120.6
102.4 • 106.1 105.7
110.1 115.3 116.1
120.3 120.7 120.2
107.1 105.2 162.1
92.6
N.A.
92.6
101.2
lOS.1
114:1
99.3
95.6
91.0
106.6
111.8
112.2
102.3
113.6
101.5
90.0
90.2
·9S.7
99.7
106.7
116.4
94.2
101.2
104.4
97.2
122.5
104.9 . 88.5
97.2
106.0
138.2
96.1
N.A.
96.1
110.4
122.5
117.2
134.1
111.3
130.9
110.2
111.6
106.8
103.0
113.0
105.4
121.3
94.2
125.0
113.9
110.7
137.1
101.7
99.3
124.6
113.9
133.9
106.1
90.2
102.5
114.4
130.4
92.4
N.A.
92.4
101.4
106.0
106.9
91.5
95.8
108.9
102.4
100.7
95.7
105.8
103.2
100.2
98.5
93.5
91.5
107.0
98.8
104.8
105.0
96.9
95.9
106.4
125.2
105.8
93.5
100.5
109.9
97.8
98.4
N.A.
98.4
104;7
105.1
110.9
106.2
102.1
108.9
115.5
107.4
103.3
111.9
116.7
102.0
93.0
91.2
98.5
99.9
102.3
108.5
98.3
99.4
112.1
114.7
130.0
104.8
94.8
103.0
107.9
94.0
90.1
N.A.
90.1
lOS.6
108.2
115.4
104.4
98.7
112.7
104.2
112.6
112.0
114.7
112.5
106.4
94.4
93.8
98.3
105.4
99.9
119.7
99.9
107.3
120.0
105.7
140.6
105.2
92.2
101.3
104.9
141.4
11
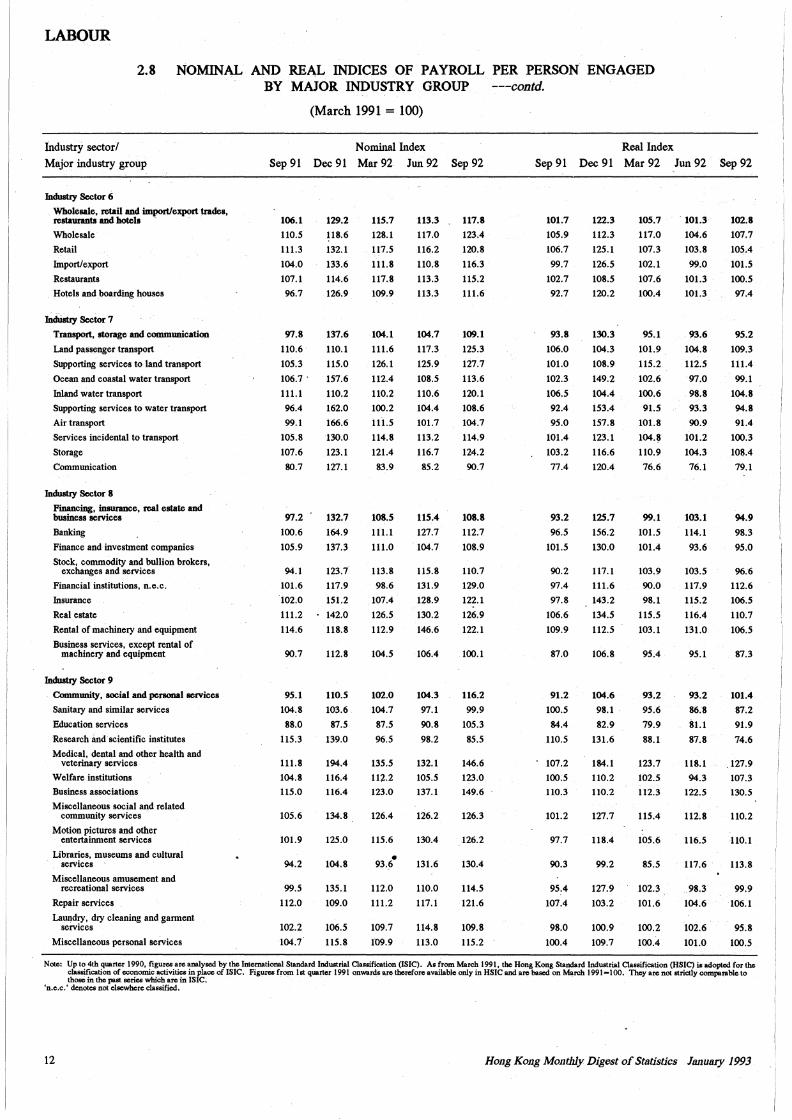
LABOUR
2.8 NOMINAL AND REA,L INDICES OF PAYROLL PER PERSON ENGAGED
Industry sec.tor/ Major industry group
Industry Sector 6
Wholesale, retail and import/export trades, restaurants and hotels
Wholesale
Retail
Import/ export
Restaurants
Hotels and boarding houses
IndUstiy Sector 7
Transport, storage and communication
Land passenger transport
Supporting services to land transport
Ocean and coastal water transport
Inland water transport
Supporting services to water transport
Air transport
Services incidental to transport
Storage
Communication
Industry Sector 8
Financing, insurance, real estate and business services
Banking
Finance and investment companies
Stock, commodity and bullion brokers, exchanges and services
Financial institutions, n.e.c.
Insurance
Real estate
Rental of machineiy and equipment
Business services, except rental of machineiy and equipment
IndUstiy Sector 9
Community, social and penonal services
Sanitaiy and similar services
Education services
Research and scientific institutes
Medical, dental and other health and veterinaiy services
Welfare institutions
Business associations
Miscellaneous social and related community services
Motion pictures and other entertainment services
Libraries, museums and cultural services
Miscellaneous amusement and recreational services
Repair services
Laundiy, diy cleaning and garment services
Miscellaneous personal services
BY MAJOR INDUSTRY GROUP ---contd.
(March 1991 = 100)
Nominal Index Sep 91 Dec. 91 Mar 92 Jun 92 Sep 92
106.1
110.5
111.3
104.0
107.1
96.7
97.8
110.6
105.3
106.7.
111.1
96.4
99.1
105.8
107.6
80.7
97.2
100.6
105.9
94.1
101.6
102.0
111.2
114.6
90.7
95.1
104.8
88.0
115.3
111.8
104.8
115.0
105.6
101.9
94.2
99.5
112.0
102.2
104.7
129.2
118.6
132.1
133.6
114.6
126.9
137.6
110.1
115.0
157.6
110.2
162.0
166.6
130.0
123.1
127.1
132.7
164.9
137.3
123.7
117.9
151.2
142.0
118.8
112.8
110.5
103.6
87.5
139.0
194.4
116.4
116.4
134.8
125.0
104.8
135.1
109.0
106.5
115.8
115.7
128.1
117.5
111.8
117.8
109.9
104.1
111.6
126.1
112.4
110.2
100.2
111.5
114.8
121.4
83.9
108.5
111.1
111.0
113.8
98.6
107.4
126.5
112.9
104.5
102.0
104.7
87.5
96.5
135.5
112.2
123.0
126.4
115.6
• 93.6
112.0
111.2
109.7
f09.9
113.3
117.0
116.2
110.8
113.3
113.3
104.7
117.3
125.9
108.5
110.6
104.4
101.7
113.2
116.7
85.2
115.4
127.7
104.7
115.8
131.9
128.9
130.2
146.6
106.4
104.3
97.1
90.8
98.2
132.1
105.5
137.1
126.2
130.4
131.6
110.0
117.1
114.8
113.0
117.8
123.4
120.8
116.3
115.2
111.6
109.1
125.3
127.7
113.6
120.1
108.6
104.7
114.9
124.2
90.7
108.8
112.7
108.9
110.7
129.0
122.1
126.9
122.1
100.1
116.2
99.9
105.3
85.5
146.6
123.0
149.6
126.3
126.2
130.4
114.5
121.6
109.8
115.2
Real Index Sep 91 Dec. 91 Mar 92 Jun 92 Sep 92
101.7
105.9
106.7
99.7
102.7
92.7
93.8
106.0
101.0
102.3
106.5
92.4
95.0
101.4
103.2
77.4
93.2
96.5
101.5
90.2
97.4
97.8
106.6
109.9
87.0
91.2
100.5
84.4
110.5
107.2
100;5
110.3
101.2
97.7
90.3
95.4
107.4
98.0
100.4
122.3
112.3
125.1
126.5
108.5
120.2
130.3
104.3
108.9
149.2
104.4
153.4
157.8
123.1
116.6
120.4
125.7
156.2
130.0
117.1
111.6
143.2
134.5
112.5
106.8
104.6
98.1
82.9
131.6
184.1
110.2
110.2
127.7
118.4
99.2
127.9
103.2
100.9
109.7
105.7
117.0
107.3
102.1
107.6
100.4
95.1
101.9
115.2
102.6
100.6
91.5
101.8
104.8
110.9
76.6
99.1
101.5
101.4
103.9
90.0
98.1
115.5
103.1
95.4
93.2
95.6
79.9
88.1
123.7
102.5
112.3
115.4
105.6
85.5
102.3
101.6
100.2
100.4
. 101.3
104.6
103.8
99.0
101.3
101.3
93.6
104.8
112.5
97.0
98.8
93.3
90.9
101.2
104.3
76.1
103.1
114.1
93.6
103.5
117.9
115.2
116.4
131.0
95.1
93.2
86.8
81.l
87.8
118.1
94.3
122.5
112.8
116.5
117.6
98.3
104.6
102.6
101.0
102;8
107.7
105.4
101.5
100.5
97.4
95.2
109.3
111.4
99.1
104.8
94.8
91.4
100.3
108.4
79.1
94.9
98.3
95.0
96.6
112.6
106.5
110.7
106.5
87.3
101.4
87.2
91.9
74.6
.127.9
107.3
130.5
110.2
110.1
113.8
99.9
106.1
95.8
100.5
N otc: Up to 4th quarter 1990, figures are analysed by the International Standard Industrial Classification (ISIC). As from March 1991, the Hong Kong Standard Industrial Classification (HSIC) is adopted for the classification of economic activities in placc of ISIC. Figures from lst quarter 1991 onwards are therefore available only in HSIC and are based on March 1991=100. They are not strictly comparable to those in the pest series which arc in ISIC.
'n.c.c.' denotes not elsewhere classified.
12 Hong Kong Monthly Digest of Statistics January 1993
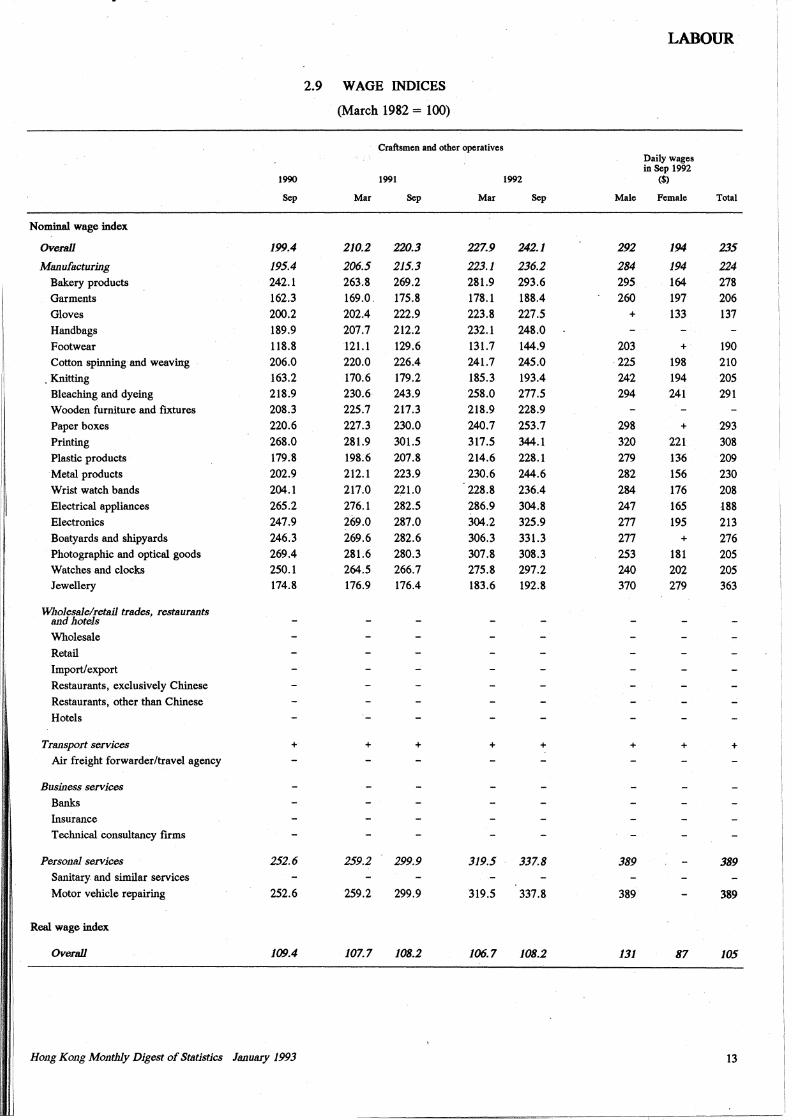
.---
LABOUR
2.9 WAGE INDICES
(March 1982 = 100)
Craftsmen and other operatives Daily wages in Sep 1992
1990 1991 1992 ($)
Sep Mar Sep Mar Sep Male Female Total
Nominal wage index
Overall 199.4 210.2 220.3 227.9 242.1 292 194 235
Manufacturing 195.4 206.5 215.3 223.1 236.2 284 194 224
Bakery products 242.1 263.8 269.2 281.9 293.6 295 164 278
Garments 162.3 169.0. 175.8 178.1 188.4 260 197 206
Gloves 200.2 202.4 222.9 223.8 227.5 + 133 137
Handbags 189.9 207.7 212.2 232.1 248.0
Footwear 118.8 121.l 129.6 131.7 144.9 203 + 190 Cotton spinning and weaving 206.0 220.0 226.4 241.7 245.0 225 198 210
. Knitting 163.2 170.6 179.2 185.3 193.4 242 194 205 Bleaching and dyeing 218.9 230.6 243.9 258.0 277.5 294 241 291 Wooden furniture and fixtures 208.3 225.7 217.3 218.9 228.9
Paper boxes 220.6 227.3 230.0 240.7 253.7 298 + 293
Printing 268.0 281.9 301.5 317.5 344.1 320 221 308 Plastic products 179.8 198.6 207.8 214.6 228.1 279 136 209
I Metal products 202.9 212.l 223.9 230.6 244.6 282 156 230 !
Wrist watch bands 204.1 217.0 221.0 228.8 236.4 284 176 208 Electrical appliances 265.2 276.1 282.5 286.9 304.8 247 165 188 Electronics 247.9 269.0 287.0 304.2 325.9 277 195 213 Boatyards and shipyards 246.3 269.6 282.6 306.3 331.3 277 + 276 Photographic and optical goods 269.4 281.6 280.3 307.8 308.3 253 181 205 Watches and clocks 250.1 264.5 266.7 275.8 297.2 240 202 205 Jewellery 174.8 176.9 176.4 183.6 192.8 370 279 363
Wholesale/retail trades, restaurants and hotels
Wholesale
Retail
Import/export
Restaurants, exclusively Chinese
Restaurants, other than Chinese
Hotels
I' Trm1sport services + + + + + + + + Air freight forwarder/travel agency
Business services
Banks
Insurance
I'
Technical consultancy firms
Perso11al services 252.6 259.2 299.9 319.5 337.8 389 389 Sanitary and similar services
Motor vehicle repairing 252.6 259.2 299.9 319.5 337.8 389 389
Real wage index
I Overall 109.4 107.7 108.2 106.7 108.2 131 87 105
I
11
I
Hong Ko11g Monthly Digest of Statistics January 1993 13
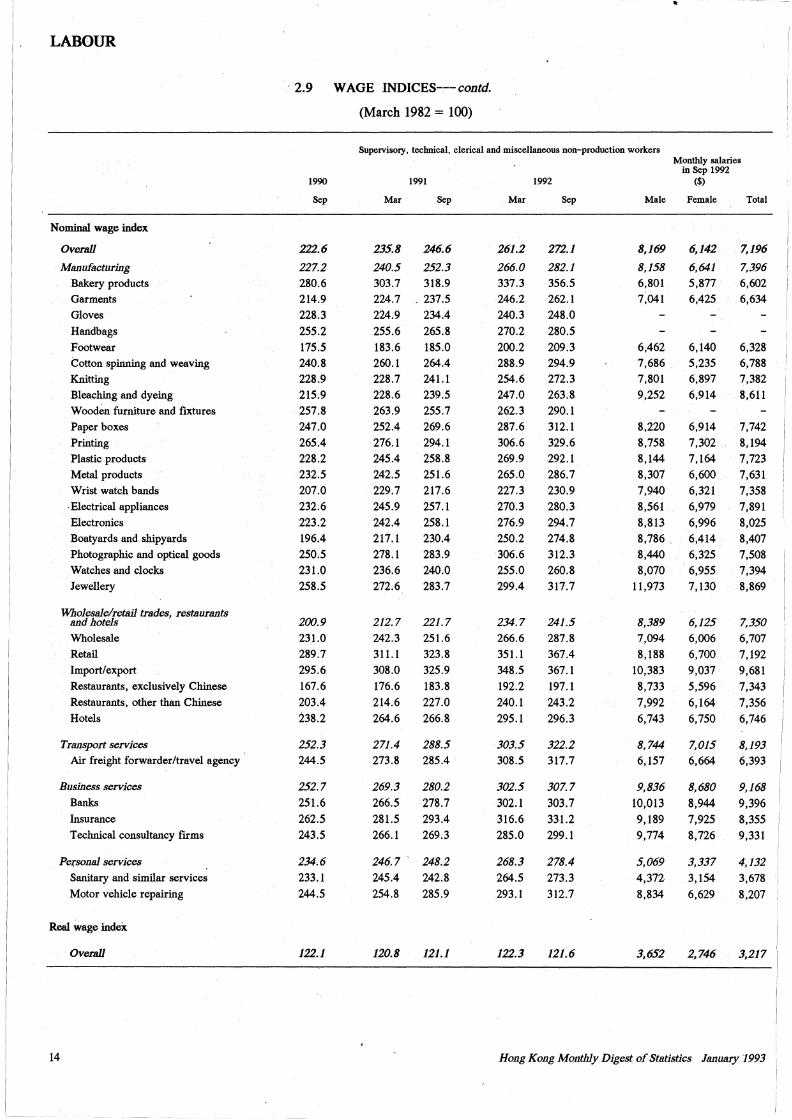
LAB0UR
Nominal wage index
Overall
Manufacturing Bakery products Garments
Gloves
Handbags
Footwear Cotton spinning and weaving
Knitting
Bleaching and dyeing Wood~h furniture and fixtures
Paper boxes
Printing Plastic products
Metal products
Wrist watch bands
· Electricill appliances
Electronics
Boatyards and shipyards
Photographic and opticill goods
Watches and clocks
Jewellery
Wholesale/retail trades, restaurants and hotels Wholesille
Retail
Import/export
Restaurants, exclusively Chinese
Restaurants, other than Chinese
Hotels
Transport services Air freight forwarder/travel agency
Business services Banks Insurance
Technicill consultancy firms
Pe.i;sonal services , Sanitary and similar services Motor vehicle repairing
Reill wage index
Overall
14
..
· 2.9 WAGE INDICES---contd.
(March 1982 = 100)
Supervisory, technical, clerical and miscellaneous non-production workers
1990
Sep
222.6
227.2 280.6 214.9 228.3 255.2 175.5 240.8 228.9 215.9 257.8 247.0 265.4 228.2 232.5 207.0 232.6 223.2 196.4 250.5 231.0 258.5
200.9 231.0 289.7 295.6 167.6 203.4 238.2
252.3 244.5
252.7 251.6 262.5 243.5
234.6 233.1 244.5
122.1
1991
Mar Sep
235.8 246.6
240.5 252.3 303.7 318.9 224.7 . 237.5 224.9 234.4 255.6 265.8 183.6 185.0 260.1 264.4 228.7 241.1 228.6 239.5 263.9 252.4 276.1 245.4 242.5 229.7 245.9 242.4 217,1 278.1 236.6 272.6
212.7 242.3 311.1 308.0 176.6 214.6 264.6
271.4 273.8
269.3 266.5 281.5 266.1
255.7 269.6 294.1 258.8 251.6 217.6 257.1 258.1 230.4 283.9 240.0 283.7
221.7 251.6 323.8 325.9 183.8 227.0 266.8
288.5 285.4
280.2 278.7 293.4 269.3
246. 7 ' 248.2
245.4 242.8 254.8 285.9
120.8 121.1
Mar
261.2
266.0 337.3 246.2 240.3 270.2 200.2 288.9 254.6 247.0 262.3 287.6 306.6 269.9 265.0 227.3 270.3 276.9 250.2 306.6 255.0 299.4
234.7 266.6 351.1 348.5 192.2 240.1 295.1
303.5 308.5
302.5 302.1 316.6 285.0
268.3 264.5 293.1
122.3
1992
Sep
272.1
282.1 356.5 262.1 248.0 280.5 209.3 294.9 272.3 263.8 290.1 312.l 329.6 292.1 286.7 230.9 280.3 294.7 274.8 312.3 260.8 317.7
241.5 287.8 367.4 367.1 197.l 243.2 296.3
322.2 317.7
307.7 303.7 331.2 299.l
278.4 273.3 312.7
121.6
Monthly salaries in Sep 1992
($)
Male Female Total
8,169
8,158 6,801 7,041
6,462 7,686 7,801 9,252
8,220 8,758 8,144 8,307 7,940 8,561 8,813 8,786. 8,440 8,070
11,973
8,389 7,094 8,188
10,383 8,733 7,992 6,743
8,744 6,157
9,836 10,013 9,189 9,774
5,069 4,372 8,834
3,652
6,142
6,64-1 5,877 6,425
6,140 5,235 6,897 6,914
6,914 7,302 7,164 6,600 6,321 6,979 6,996 6,414 6,325 6,955 7,130
6,125 6,006 6,700 9,037 5,596 6,164 6,750
7,015 6,664
8,680 8,944 7,925 8,726
7,196
7,396 6,602 6,634
6,328 6,788 7,382 8,611
7,742 8,194 7,723 7,631 7,358 7,891 8,025 8,407 7,508 7,394 8,869
7,350 6,707 7,192 9,681
. 7,343 7,356 6,746
8,193 6,393
9,168 9,396 8,355 9,331
3,337 4,132 3,154 3,678 6,629 8,207
2,746 3,217
Hong Kong Monthly Digest of Statistics January 1993
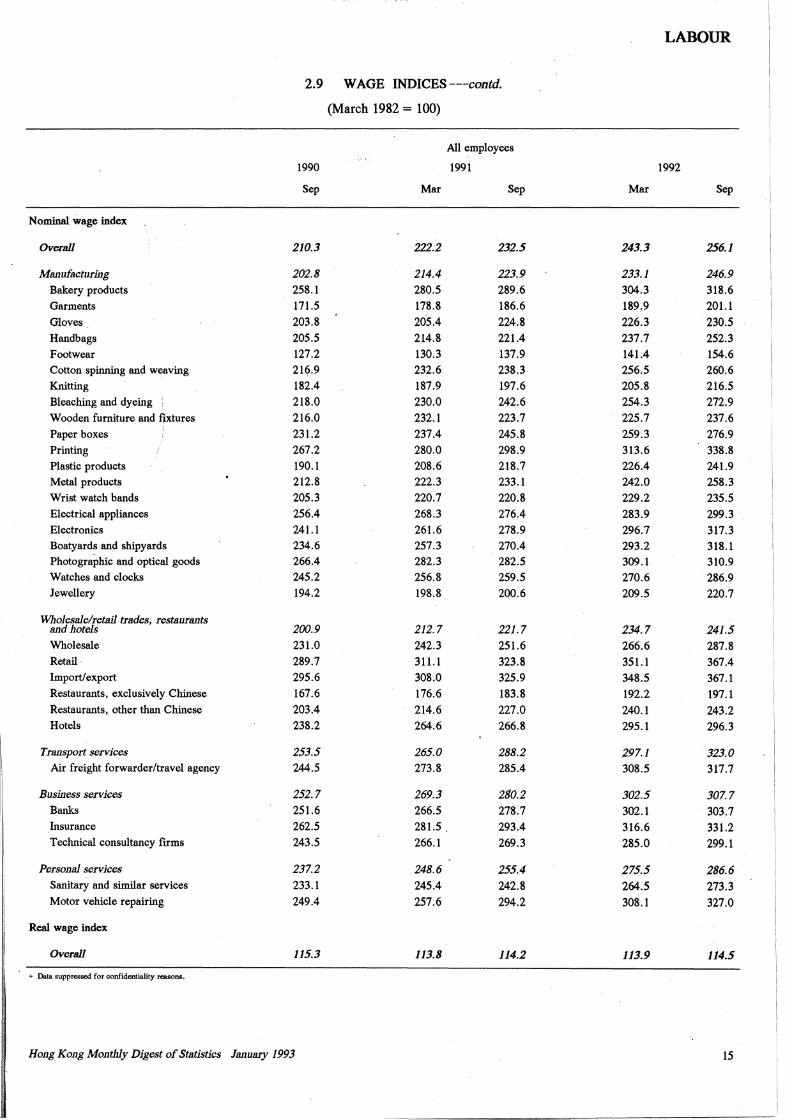
---- ---- -
LABOUR
2.9 WAGE INDICES ---contd.
(March 1982 = 100)
All employees
1990 1991 1992
Sep Mar Sep Mar Sep
Nominal wage index
Overall 210.3 222.2 232.5 243.3 256.1
Manufacturing 202.8 214.4 223.9 233.1 246.9 Bakery products 258.1 280.5 289.6 304.3 318.6 Garments 171.5 178.8 186.6 189.9 201.1 Gloves 203.8 205.4 224.8 226.3 230.5 Handbags 205.5 214.8 221.4 237.7 252.3 Footwear 127.2 130.3 137.9 141.4 154.6 Cotton spinning and wt'.aving 216.9 232.6 238.3 256.5 260.6 Knitting 182.4 187.9 197.6 205.8 216.5 Bleaching and dyeing 218.0 230.0 242.6 254.3 272.9 Wooden furniture and tlxtures 216.0 232.l 223.7 225.7 237.6 Paper boxes 231.2 237.4 245.8 259.3 276.9 Printing 267.2 280.0 298.9 313.6 338.8 Plastic products 190. l 208.6 218.7 226.4 241.9 Metal products 212.8 222.3 233.l 242.0 258.3 Wrist watch bands 205.3 220.7 220.8 229.2 235.5 Electrical appliances 256.4 268.3 276.4 283.9 299.3 Electronics 241.1 261.6 278.9 296.7 317.3 Boatyards and shipyards 234.6 257.3 270.4 293.2 318.l Photographic and optical goods 266.4 282.3 282.5 309.l 310.9 Watches and clocks 245.2 256.8 259.5 270.6 286.9 Jewellery 194.2 198.8 200.6 209.5 220.7
Wholesale/retail trades, rest8urants and hotels 200.9 212.7 221.7 234.7 241.5 Wholesale 231.0 242.3 251.6 266.6 287.8 Retail· 289.7 311.1 323.8 351.1 367.4 Import/ export 295.6 308.0 325.9 348.5 367.1 Restaurants, exclusively Chinese 167.6 176.6 183.8 192.2 197.1 Restaurants, other than Chinese 203.4 214.6 227.0 240.l 243.2 Hotels 238.2 264.6 266.8 295.1 296.3
Transport services 253.5 265.0 288.2 297.1 323.0 Air freight forwarder/travel agency 244.5 273.8 285.4 308.5 317.7
Business services 252.7 269.3 2$0.2 302.5 307.7 Banks 251.6 266.5 278.7 302.1 303.7 Insurance 262.5 281.5 293.4 316.6 331.2 Technical consultancy firms 243.5 266.l 269.3 285.0 299.1
Personal services 237.2 248.6 255.4 275.5 286.6 Sanitary and similar services 233.1 245.4 242.8 264.5 273.3 Motor vehicle repairing 249.4 257.6 294.2 308.1 327.0
Real wage index
Overall 115.3 113.8 114.2 113.9 114.5
+ Data suppressed for confidentiality reasons.
I: I'
Hong Ko11g Monthly Digest of St8tistics January 1993 15
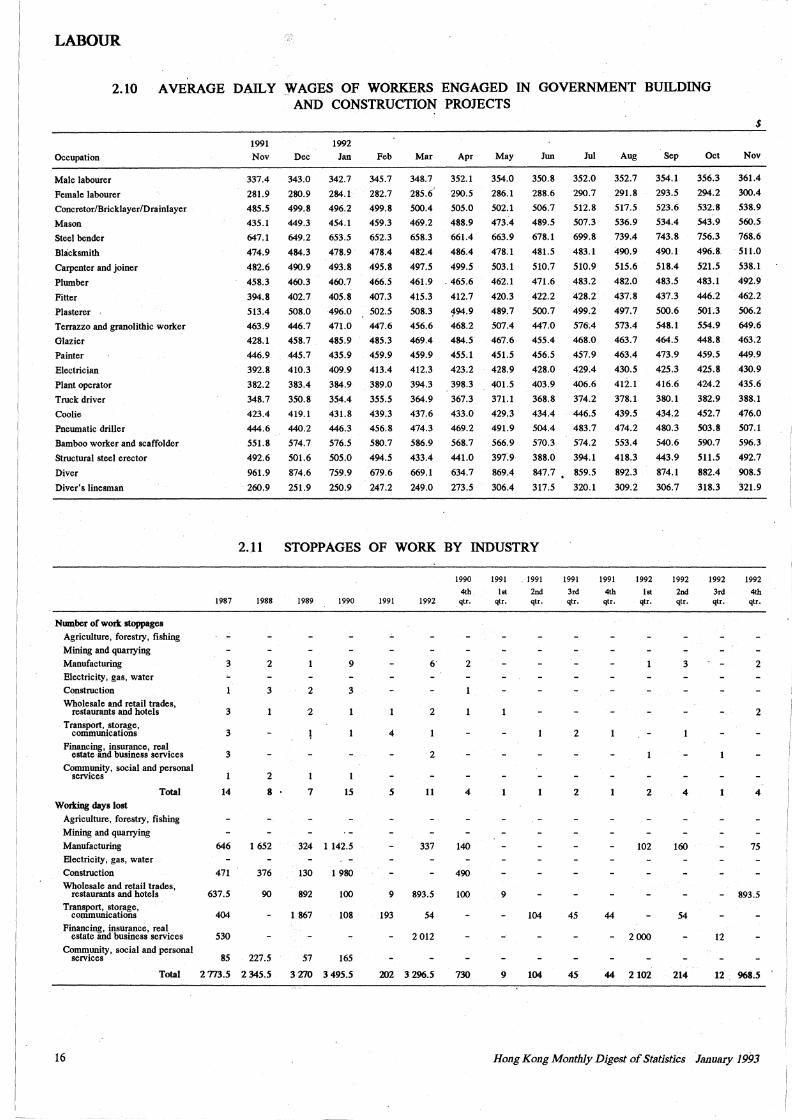
LABOUR
2.10 AVERAGE DAILY WAGES OF WORKERS ENGAGED IN GOVERNMENT BUILDING
Occupation
Male labourer
Female labourer
Concretor/Bricklayer/Drainlayer
Mason
Steel bender
Blacksmith
Carpenter and joiner
Plumber
Fitter
Plasterer
Terrazzo and granolithic worker
Glazier
Painter
Electrician
Plant operator
Truck driver
Coolie
Pneumatic driller
Bamboo worker and scaffolder
Structural steel erector
Diver
Diver's linesman
Number of work stoppages
Agriculture, forestry, fishing
Mining and quarrying
Manufacturing
Electricity, gas, water
Construction
Wholesale and retail trades, restaurants and hotels
Transport, storage, communications
Financing, insurance, real estate and business services
Comm.unity, social and personal services
Total
Working days lost
Agriculture, forestzy, fishing
Mining and quarzying
Manufacturing
Electricity, gas, water
Construction
Wholesale and retail trades, restaurants and hotels
Transport, storage, communications
Financing, insurance, real estate and business services
Comm.unity, social and personal services
Total
16
1991 Nov
337.4
281.9
485.5
435.l
647.1
474.9
482.6
458.3
394.8
513.4
463.9
428.1
446.9
392.8
382.2
348.7
423.4
444.6
551.8
492.6
961.9
260.9
AND CONSTRUCTION PROJECTS
Dec
343.0
280.9
499.8
449.3
649.2
484.3
490.9
460.3
402.7
508.0
446.7
458.7
445.7
410.3
383.4
350.8
419.1
440.2
574.7
501.6
874.6
251.9
1992 Jan
342.7
284.1
496.2
454.1
653.5
478.9
493.8
460.7
405.8
496.0
471.0
485.9
435.9
409.9
384.9
354.4
431.8
446.3
576.5
505.0
759.9
250.9
Feb
345.7
282.7
499.8
459.3
652.3
478.4
495.8
466.5
407.3
502.5
447.6
485.3
459.9
413.4
389.0
355.5
439.3
456.8
580.7
494.5
679.6
247.2
Mar
348.7
285.6'
500.4
469.2
658.3
482.4
497.5
461.9
415.3
508.3
456.6
469.4
459.9
412.3
394.3
364.9
437.6
474.3
586.9
433.4
669.1
249.0
Apr
352.1
290.5
505.0
488.9
661.4
486.4
499.5
. 465.6
412.7
194.9
468.2
484.5
455.1
423.2
398.3
367.3
433.0
469.2
568.7
441.0
634.7
273.5
May
354.0
286.1
502.1
473.4
663.9
478.1
503.1
462.1
420.3
489.7
507.4
467.6
451.5
428.9
401.5
371.1
429.3
491.9
566.9
397.9
869.4
306.4
Jun
350.8
288.6
506.7
489.5
678.l
481.5
510.7
471.6
. 422.2
500.7
447.0
455.4
456.5
428.0
403.9
368.8
434.4
504.4
570.3
388.0
847.7
317.5
2.11 STOPPAGES OF WORK BY INDUSTRY
1987
3
3
3
3
14
646
471
637.5
404
530
1988
2
3
2
8
1 652
376
90
85 227.5
2m.5 2345.5
1989 1990
9
2 3
2
7 15
324 1142.5
130 1 980
892 100
1 867 108
57 165
3 270 3 495.5
1991 1992
6
2
4
2
5 11
337
9 893.5
193 54
2 012
202 3 296.5
1990
4th qtr.
2
4
140
490
100
730
1991
lst qtr.
9
9
1991
2nd qtr.
104
104
Jui
352.0
290.7
512.8
507.3
699.8
483.1
510.9
483.2
428.2
499.2
576.4
468.0
457.9
429.4
406.6
374.2
446.5
483.7
574.2
394.1
859.5
320.1
1991
3rd qtr.
2
2
45
45
Aug
352.7
291.8
517.5
536.9
739.4
490.9
515.6
482.0
437.8
497.7
573.4
463.7
463.4
430.5
412.1
378.l
439.5
474.2
553.4
418.3
892.3
309.2
1991
4th qtr.
1992
lst qtr.
2
102
44
2000
44 2102
Sep
354.1
293.5
523.6
534.4
743.8
490.1
518.4
483.5
437.3
500.6
548.1
464.5
473.9
425.3
416.6
380.1
434.2
480.3
540.6
443.9
874.1
306.7
1992
2nd qtr.
3
4
160
54
214
Oct
356.3
294.2
532.8
543.9
756.3
496.8.
521.5
483.1
446.2
501.3
554.9
448.8
459.5
425.8
424.2
382.9
452.7
503.8
590.7
511.5
882.4
318.3
1992
3rd qtr.
12
12
$
Nov
361.4
300.4
538.9
560.5
768.6
511.0
538.1
492.9
462.2
506.2
649.6
463.2
449.9
430.9
435.6
388.1
476.0
507.1
596.3
492.7
908.5
321.9
1992
4th qtr.
2
2
4
75
893.5
968.5
Hong Kong Monthly Digest of Statistics January 1993
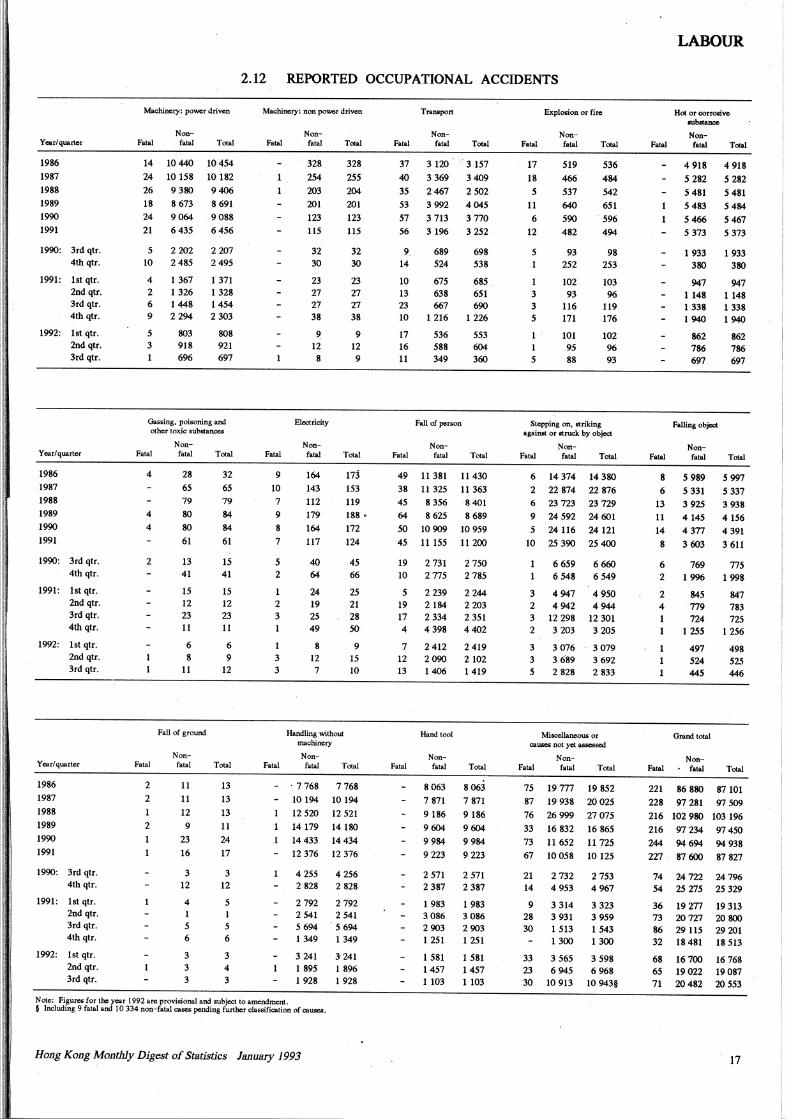
2.12 REPORTED OCCUPATIONAL ACCIDENTS
Year/quarter
1986
1987 1988 1989 1990 1991
1990: 3rd qtr. 4th qtr.
1991: lst qtr. 2nd qtr. 3rd qtr. 4th qtr.
1992: lst qtr. 2nd qtr. 3rd qtr.
Year/quarter
1986 1987 1988 1989 1990 1991
1990: 3rd qtr. 4th qtr.
1991: lst qtr. 2nd qtr. 3rd qtr. 4th qtr.
1992: lst qtr. 2nd qtr. 3rd qtr.
Year/quarter
1986 1987 1988 1989 1990 1991
1990: 3rd qtr. 4th qtr.
1991: lst qtr. 2nd qtr. 3rd qtr. 4th qtr.
1992: lst qtr. 2nd qtr. 3rd qtr.
Machinery: power driven
Fatal Nonfatal
14 10 440 24 10 158 26 9 380 18 8 673 24 9 064
21 6 435
5 2 202 10 2 485
4 1367 2 1 326 6 1448 9 2 294
5 3 1
803 918 696
Total
10 454 10 182 9406 8 691 9088 6456
2 207 2495
1371 1328 1454 2 303
808 921 697
Gassing, poisoning and other toxic substances
Fatal
4
4 4
2
Non-fatal
28 65
79 80 80
61
13 41
15 12 23 11
6 8
11
Fall of ground
Non-
Total
32 65
79 84 84 61
15 41
15 12 23 11
6 9
12
Fatal fatal Total
2
2
1
2
11 11
12 9
23 16
3 12
4 1 5 6
3 3 3
13 13
13 11 24 17
3 12
5 1 5 6
3 4 3
Machinery: non power driven
Fatal Nonfatal
328 254 203 201 123 115
32 30
23 27 27 38
9 12 8
Eloctrlcity
Non-
Total
328 255 204 201 123 115
32 30
23 27 27 38
9 12 9
Fatal fatal Total
9 10 7 9
8 7
5 2
1 2 3 1
1 3 3
164
143 112 179
164
117
40 64
24 19 25 49
8 12 7
Handling without machinery
Non-
173 153 119 188.
172 124
45 66
25 21 28 50
9 15 10
Fatal fatal Total
- . 7 768 7 768
1
.1
10 194
12 520 14 179 14 433 12 376
10 194 12 521 14 180 14 434 12 376
4 255 4 256 2 828 2 828
2 792 2 541 5 694 1 349
3 241 1 895 1928
2 792 2 541 5 694 1349
3-241 1 896 1 928
Note: Figures for the year 199~ are provisional and subject to amendment. § Including 9 fatal and I 0 334 non-fatal cases pending further classification of causes.
Hong Kong Monthly Digest of Statistics January 1993
Fatal
37 40 35 53 57 56
9. 14
10 13 23 10
17 16 11
Transport
Nonfatal Total
3 120 '3 157
3 369 3 409 2 467 2 502 3 992 4045 3 713 3 770 3 196 3 252
689 698 524 538
675 638 667
1 216
536 588 349
Fall of person
Non-
685 651 690
1226
553 604 360
Fatal fatal Total
49 38 45 64 so 45
19 10
5 19 17 4
11 381 11 325 8 356 8625
10909
11155
2 731 2 775
2 239 2184 2 334 4 398
11430 11363 ,3401
8 689 10 959
11200
2 750 2785
2 244 2 203 2 351 4402
7 2 412 2 419 12 2090 2102 13 1 406 1 419
Hand tocl
Non-Fatal fatal Total
8 063 8063 7 871 9186 9604
9 984 9 223
7 871
9186 9604
9984 9223
2 571 2 571 2 387 2 387
1 983 3.086 2 903 1 251
1 581 1457 1103
1 983 3086 2 903 1 251
1 581 1457 1103
Explosion or fire
Fatal
17
18 5
11 6
12
5
1 3 3 5
1 '
1 5
Nonfatal
519 466
537 640
590 482
93 252
102 93
116 171
101 95 88
Total
536
484 542 651 596 494
98 253
103 96
119 176
102 96 93
Stepping on, striking against or struck by object
Non-Fatal fatal Total
6 14 374 2 22 874 6 23 723 9 24 592 5 24116
10 25 390
6659 6 548
3 4 947 2 4 942 3 12 298 2 3 203
14 380 22 876 23 729 24601 24121 25 400
6 660 6 549
4 950 4944
12 301 3 205
3 3 076 3 079 3 3689 3692 5 2 828 2 833
Miscellaneous or causes not yet assessed
Non-Fatal fatal Total
75 19 777 19 852 87 19 938 76 26 999
33 16 832 73 11 652 67 10058
20025 27075 16 865 11725 10 125
21 2 732 2 753 14 4 953 4 967
9 28 30
33 23 30
3 314 3 931 1 513 1300
3 565 6 945
10 913
3 323 3 959 1543 1300
3 598 6 968
10 943§
LABOUR
Hot or corrosive &Ubllanoe
Fatal Non-fatal
4 918 5 282 5 481 5483 5466
5 373
1933 380
947 1148 1 338 1940
862 786 697
Total
4 918 5 282 5 481 5484 5467 5 373
1933 380
947 1148 1338 1940
862 786 697
Falling object
Non-Fatal fatal Total
8
6 13 11
14 8
6 2
2 4 1
5989 5 331 3 925 4 145 4 377
3 603
769 1996
845 779 724
1255
497 524 445
Grand total
Non-
5 997 5337 3 938 4156 4 391 3 611
775 1998
847 783 725
1256
498 525 446
Fatal • fatal Total
221 86 880 87 101 228 97 281 97 509
216 102 980 103 196 216 97 234 97 450 244 94 694 94 938 227 87 600 87 827
74 24 722 24 796 54 25 275 25 329
36 19 277 73 20727 86 29 115 32 18 481
68 65 71
16700 19022 20482
19 313 20 800 29 201 18 513
16 768 19087 20553
17
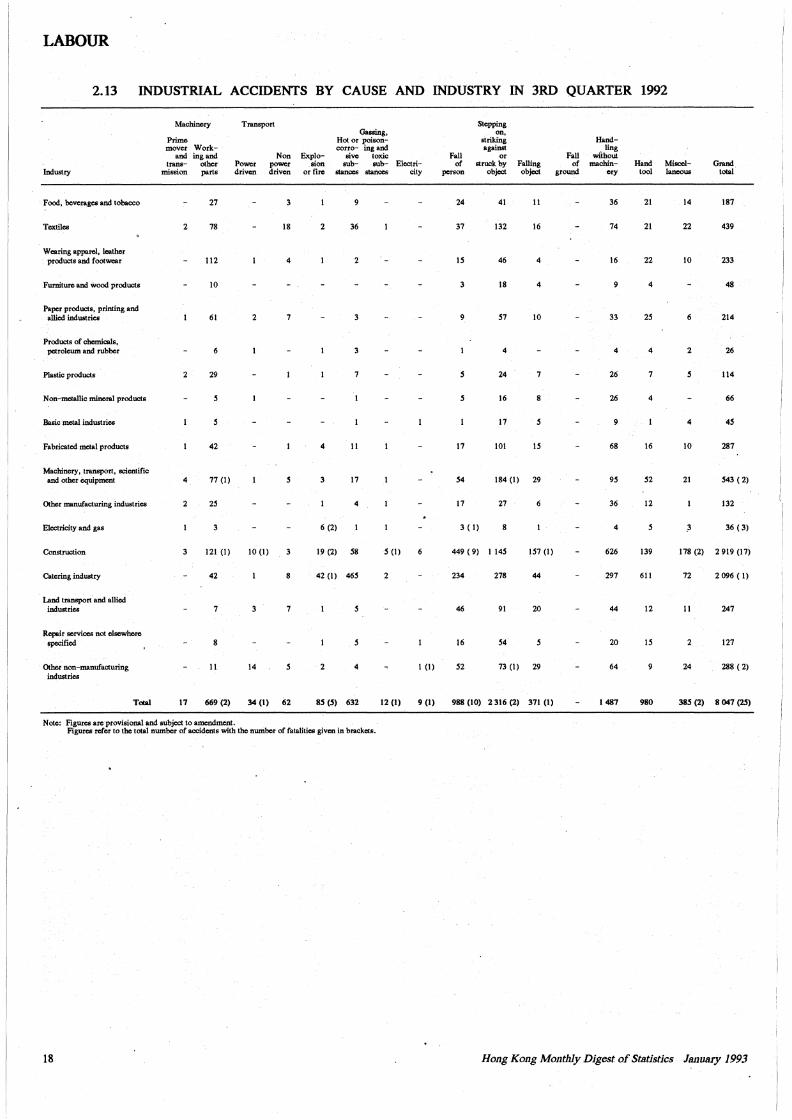
LABOUR
2.13 INDUSTRIAL ACCIDENTS BY CAUSE AND INDUSTRY IN 3RD QUARTER 1992
Machinery Transport Stepping Gassing, on,
Prime Hot or poison- striking Hand-mover Work- corro- ing and against ling
and ingand Non Exp lo- sivc toxic Fall or Fall wiihout trans- other Power power sion sub- sub- Electri- of struck by Falling of machin- Hand Misccl- Grand
Industry mission parts driven driven or fire stances stances city person object object ground ery tool laneous total
Food, beverages and tobacco 27 3 24 41 11 36 21 14 187
Textiles 2 78 18 2 36 37 132 16 74 21 22 439
Wearing apparel, leather products and footwear 112 4 2 15 46 4 16 22 10 233
Furniture and wood products 10 18 4 4 48
Paper products, printing and I allied industries 61 2 7 9 51 10 33 25 6 214
Products of chemicals, petroleum and rubber 4 4 4 2 26
Plastic products 29 7 24 26 7 114
Non-metallic mineral products 5 16 8 26 4 66
Basic metal industries 17 5 4 45
Fabricated metal products 42 4 11 17 101 15 68 16 10 287
Mac_hinery, transport, scientific and other equipment 4 77 (1) 3 17 54 184 (1) 29 95 52 21 543 ( 2)
Other manufacturing industries 2 25 4 17 27 36 12 132
Electricity and gas 6 (2) 3 ( 1) 8 4 5 ) 36 (3)
Construction 3 121 (l) 10 (l) 1.9 (2) 58 5 (l) 449 ( 9) l 145 157 (l) 626 139 178 (2) 2919 (17)
Catering industry 42 8 42 (I) 465 234 278 44 297 611 72 2 096 ( 1)
Land transport and allied industries 7 3 7 46 91 20 44 12 11 247
Repair services not elsewhere specified 8 16 54 20 15 2 127
Other non-manufacturing 11 14 5 2 4 1 (l) 52 73 (I) 29 64 24 288 ( 2) industries
Total 17 669 (2) 34 (I) 62 85 (5) 632 12 (I) 9 (I) 988 (10) 2 316 (2) 371 (I) 1487 980 385 (2) 8 047 (25)
Note: Figures are provisional and subjoct to amendment. Figures refer to the total number of accidents with the number of fatalities given in brackets.
18 Hong Kong Mo11thly Digest of St.atistics January 1993
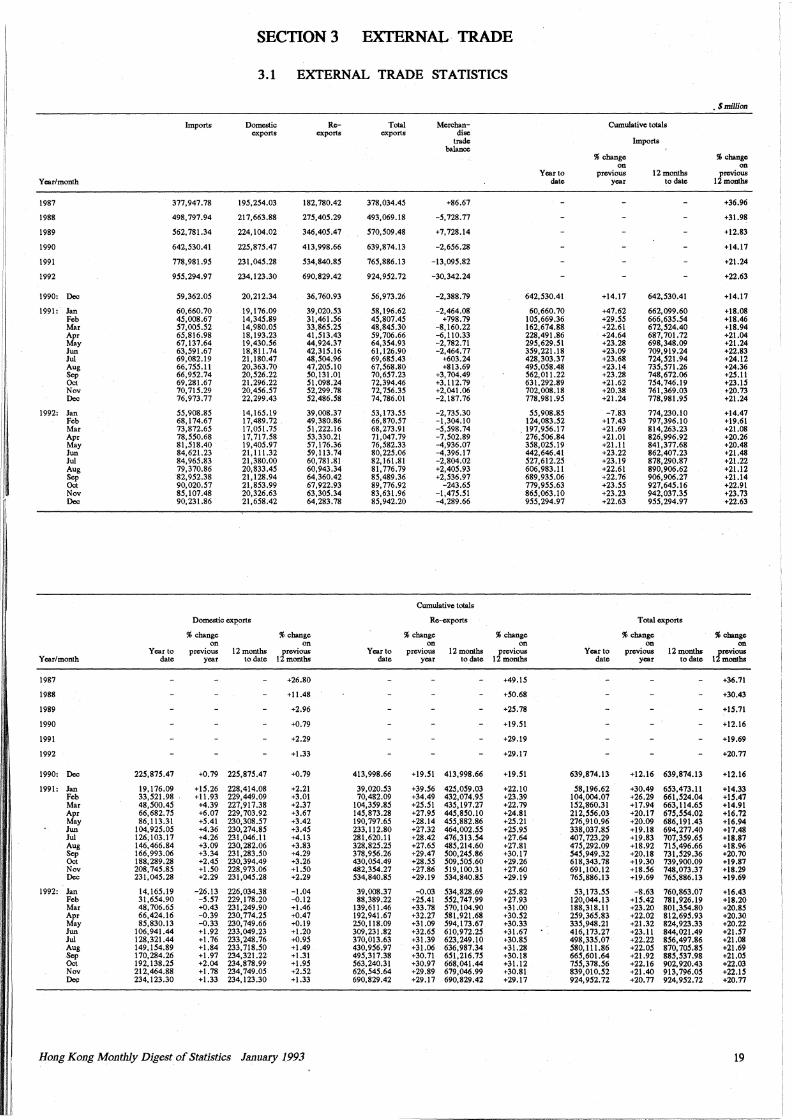
SECTION3 EXTERNAL TRADE
3.1 EXTERNAL TRADE STATISTICS
• $million
Imports Domestic Re- Total Merchan- Cumulative totals exports exports exports dise
trade Imports balance
% change % change on on
Year to previous 12 months previous Year/month date year to date 12months
1987 377,947.78 195,254.03 182,780.42 378,034.45 +86.67 +36.96
1988 498,797.94 217,663.88 275,405.29 493,069.18 -5,728.77 +31.98
1989 562,781.34 224,104.02 346,405.47 570,509.48 +7,728.14 +12.83
1990 642,530.41 225,875.47 413,998.66 639,874.13 -2,656.28 +14.17
1991 778,981.95 231,045.28 534,840.85 765,886.13 -13,095.82 +21.24
1992 955,294.97 234,123.30 690,829.42 924,952.72 -30,342.24 +22.63
1990: Dec 59,362.05 20,212.34 36,760.93 56,973.26 -2,388.79 642,530.41 +14.17 642,530.41 +14.17
1991: Jan 60,660.70 19,176.09 39,020.53 58, 196.62 -2,464.08 60,660.70 +47.62 662,099.60 +18.08 Feb 45,008.67 14,345.89 31,461.56 45,807.45 +798.79 105,669.36 +29.55 666,635.54 +18.46 Mar 57,005.52 14,980.05 33,865.25 48,845.30 -8,160.22 162,674.88 +22.61 672,524.40 +18.94 Apr 65,816.98 18,193.23 41,513.43 59,706.66 -6,110.33 228,491.86 +24.64 687, 701.72 +21.04 May 67,137.64 19,430.56 44,924.37 64,354.93 -2,782.71 295,629.51 +23.28 698,348.09 +21.24 Jun 63,591.67 18,811.74 42,315.16 61,126.90 -2,464.77 359,221.18 +23.09 709,919.24 +22.83 Jui 69,082.19 21,180.47 48,504.96 69,685.43 +603.24 428,303.37 +23.68 724,521.94 +24.12 Aug 66, 755.11 20,363.70 47,205.10 67,568.80 +813.69 495,058.48 +23.14 735,571.26 +24.36 Sep 66,952.74 20,526.22 50,131.01 70,657.23 +3, 704.49 562,011.22 +23.28 748,672.06 +25.11 Oct 69,281.67 21,296.22 51,098.24 72,394.46 +3, 112.79 631,292.89 +21.62 754,746.19 +23.15 Nov 70,715.29 20,456.57 52,299.78 72,756.35 +2,041.06 702,008.18 +20.38 761,369.03 +20.73 Dec 76,973.77 22,299.43 52,486.58 74,786.01 -2, 187.76 778,981.95 +21.24 778,981.95 +21.24
1992: Jan 55,908.85 14,165.19 39,008.37 53, 173.55 -2,735.30 55,908.85 -7.83 774,230.10 +14.47 Feb 68, 174.67 17,489.72 49,380.86 66,870.57 -1.304.10 124,083.52 +17.43 797,396.10 +19.61 Mar 73,872.65 17,051.75 51,222.16 68,273.91 -5,598.74 . 197,956.17 +21.69 814,263.23 +21.08 Apr 78,550.68 17,717.58 53,330.21 71,047.79 -7,502.89 276,506.84 +21.01 826,996.92 +20.26 May 81,518.40 19,405.97 57,176.36 76,582.33 -4,936.07 358,025.19 +21.11 841,377.68 +20.48
I; Jun 84,621.23 21, 111.32 59,113.74 80,225.06 -4,396.17 442,646.41 +23.22 862,407.23 +21.48 Jui 84,965.83 21,380.00 60, 781.81 82,161.81 -2,804.02 527,612.25 +23.19 878,290.87 +21.22 Aug 79,370.86 20,833.45 60,943.34 81,776.79 +2,405.93 606,983.11 +22.61 890,906.62 +21.12 Sep 82,952.38 21, 128.94 64,360.42 85,489.36 +2,536.97 689,935.06 +22.76 906,906.27 +21.14
I. Oct 90,020.57 21,853.99 67,922.93 89,776.92 -243.65 779,955.63 +23.55 927,645.16 +22.91 Nov 85,107.48 20,326.63 63,305.34 83,631.96 -1,475.51 865,063.10 +23.23 942,037.35 +23.73 Dec 90,231.86 21,658.42 64,283.78 85,942.20 -4,289.66 955,294.97 +22.63 955,294.97 +22.63
Cumulative totals
I Domestic exports Re-exports Total exports I
% change % change % change % change % change % change on on on on on on
I Year to previous 12 months previous Year to previous 12months previous Year to previous 12 months previous
Year/month date year to date 12 months date year to date 12 months date year to date 12months
1987 +26.80 +49.15 +36.71
I 1988 +11.48 +50.68 +30.43
I, 1989 +2.96 +25.78 +15.71
I: 1990 +0.79 +19.51 +12.16
1991 +2.29 +29.19 +19.69
I 1992 +1.33 +29.17 +20.77
1990: Dec 225,875.47 +0.79 225,875.47 +0.79 413,998.66 +19.51 413,998.66 +19.51 639,874.13 +12.16 639,874.13 +12.16
I 1991: Jan 19, 176.09 +15.26 228,414.08 +2.21 39,020.53 +39.56 425,059.03 +22.10 58,196.62 +30.49 653,473.11 +14.33 I Feb 33,521.98 +11.93 229,449.09 +3.01 70,482.09 +34.49 432,074.95 +23.39 104,004.07 +26.29 661,524.04 +15.41
Mar 48,500.45 +4.39 227,917.38 +2.37 104,359.85 +25.51 435,197.27 +22.79 152,860.31 +17.94 663,114.65 +14.91
I' Apr 66,682.75 +6.07 229,703.92 +3.67 145,873.28 +27.95 445,850.10 +24.81 212,556.03 +20.17 615,554.02 +16.72
1· May 86, 113.31 +5.41 230,308.57 +3.42 190,797.65 +28.14 455,882.86 +25.21 276,910.96 +20.09 686,191.43 +16.94 Jun 104,925.05 +4.36 230,274.85 +3.45 233, l !2.80 +27.32 464,002.55 +25.95 338,037.85 +19.18 694,277.40 +17.48 Jui 126,103.17 +4.26 231,046.11 +4.13 281,620.ll +28.42 476,313.54 +27.64 407,723.29 +19.83 707,359.65 +18.87
1: Aug 146,466.84 +3.09 230,282.06 +3.83 328,825.25 +27.65 485,214.60 +27.81 475,292.09 +18.92 715,496.66 +18.96 Sep 166,993.06 +3.34 231,283.50 +4.29 378,956.26 +29.47 500,245.86 +30.17 545,949.32 +20.18 731,529.36 +20.70 Oct 188,289.28 +2.45 230,394.49 +3.26 430,054.49 +28.55 509,505.60 +29.26 618,343.78 +19.30 739,900.09 +19.87 Nov 208, 745.85 +1.50 228,973.06 +1.50 482,354.27 +27.86 519,100.31 +27.60 691,100.12 +18.56 748,073.37 +18.29
I Dec 231,045.28 +2.29 231,045.28 +2.29 534,840.85 +29.19 534,840.85 +29.19 765,886.13 +19.69 765,886.13 +19.69
Ii 1992: Jan 14,165.19 -26.13 226,034.38 -1.04 39,008.37 -0.03 534,828.6.9 +25.82 53,173.55 -8.63 760,863.07 +16.43 Feb 31,654.90 -5.51 229,178.20 -0.12 88,389.22 +25.41 552,747.99 +27.93 120,044.13 +15.42 781,926.19 +18.20
Ii Mar 48,706.65 +0.43 231,249.90 +1.46 139,611.46 +33.78 570,104.90 +31.00 188,318.11 +23.20 801,354.80 +20.85 Apr 66,424.16 -0.39 230,774.25 +0.47 192,941.67 +32.27 581,921.68 +30.52 259,365.83 +22.02 812,695.93 +20.30 May 85,830.13 -0.33 230,749.66 +0.19 250,118.09 +31.09 594,173.67 +30.33 335,948.21 +21.32 824,923.33 +20.22 Jun 106,941.44 +1.92 233,049.23 +1.20 309,231.82 +32.65 610,972.25 +31.67 416, 173.27 +23.11 844,021.49 +21.S7
I
Jui 128,321.44 +1.76 233,248.76 +0.95 370,013.63 +31.39 623,249.10 +30.85 498,335.07 +22.22 856,497.86 +21.08 Aug 149,154.89 +1.84 233,718.50 +1.49 430,956.97 +31.06 636,987.34 +31.28 580, 111.86 +22.05 870, 705.85 +21.69 Sep 170,284.26 +1.97 234,321.22 +1.31 495,317.38 +30.71 651,216.75 +30.18 665,601.64 +21.92 885,537.98 +21.05 Oct 192,138.25 +2.04 234,878.99 +1.95 563,240.31 +30.97 668,041.44 +31.12 755,378.56 +22.16 902,920.43 +22.03 Nov 212,464.88 +1.78 234,749.05 +2.52 626,545.64 +29.89 679,046.99 +30.81 839,010.52 +21.40 913,796.05 +22.15
I Dec 234,123.30 +1.33 234, 123.30 +1.33 690,829.42 +29.17 690,829.42 +29.17 924,952.72 +20.77 924,952.72 +20.77 I.
Hong Ko11g Mo11thly Digest of StJJtistics January 1993 19
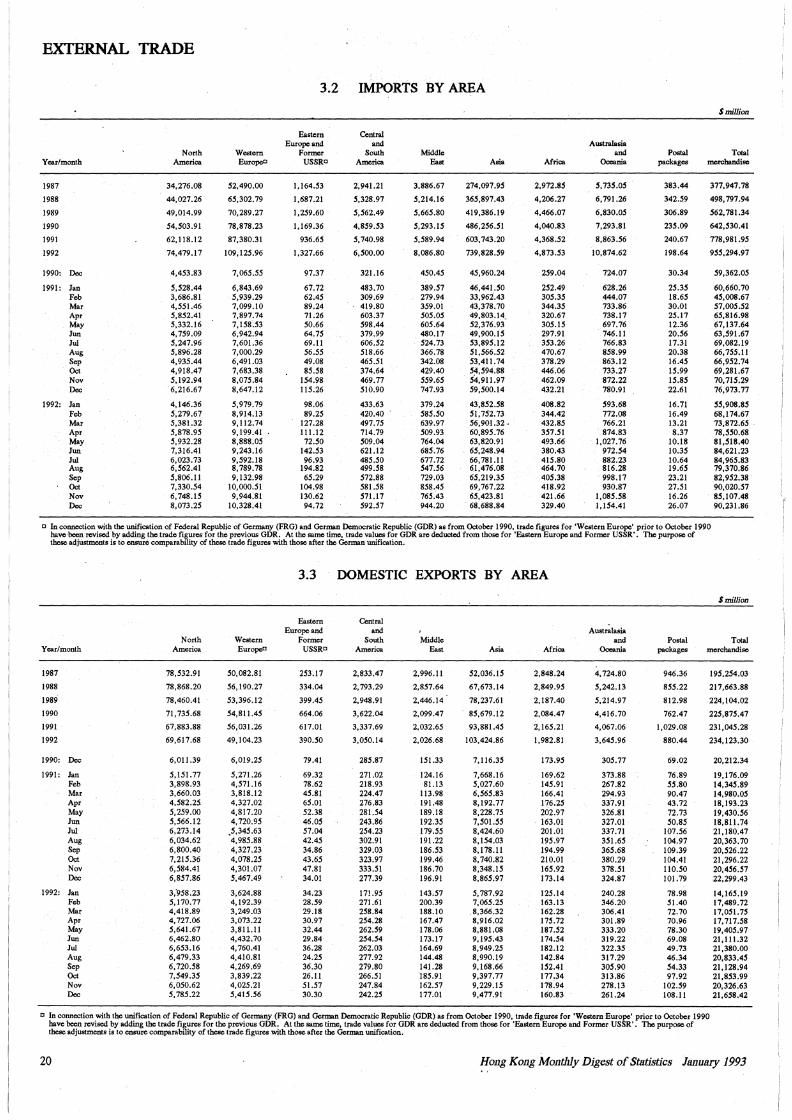
EXTERNAL TRADE
3.2 IMPORTS BY AREA
$million
Eastern Central Europe and and Australasia
North Western Former South Middle and Postal Total Year/month America EuropeO USSR a America East Asia Africa Oceania packages merchandise
1987 34,276.08 52,490.00 1,164.53 2,941.21 3,886.67 274,097.95 2,972.85 5,735.05 383.44 377,947.78
1988 44,027.26 65,302.79 1,687.21 5,328.97 5,214.16 365,897.43 4,206.27 6, 791.26 342.59 498,797.94
1989 49,014.99 70,289.27 l,259.60 5,562.49 5,665.80 419,386.19 4,466.07 6,830.05 306.89 562, 781.34
1990 54,503.91 78,878.23 1,169.36 4,859.53 5,293.15 486,256.51 4,040.83 7,293.81 235.09 642,530.41
1991 62,118.12 87,380.31 936.65 5, 740.98 5,589.94 603,743.20 4,368.52 8,863.56 240.67 778,981.95
1992 74,479.17 109,125.96 1,327.66 6,500.00 8,086.80 739,828.59 4,873.53 10,874.62 198.64 955,294.91
1990: Dec 4,453.83 1,065.55 97.37 321.16 450.45 45,960.24 259.04 724.07 30.34 59,362.05
1991: Jan 5,528.44 6,843.69 67.72 483.70 389.57 46,441.50 252.49 628.26 25.35 60,660.70 Feb 3,686.81 5,939.29 62.45 309.69 279.94 33,962.43 305.35 444.07 18.65 45,008.67 Mar 4,551.46 7,099.10 89.24 419.80 359.01 43,378.70 344.35 733.86 30.01 57,005.52 Apr 5,852.41 7,897.74 71.26 603.37 505.05 49,803.14. 320.67 738.17 25.17 65,816.98 May 5,332.16 7,158.53 50.66 598.44 605.64 52,376.93 305.15 697.76 12.36 67,137.64 Jun 4, 759.09 6,942.94 64.75 379.99 480.17 49,900.15 297.91 746.11 20.56 63,591.67 Jui 5,247.96 7,601.36 69.11 606.52 524.73 53,895.12 353.26 766.83 17.31 69,082.19 Aug 5,896.28 7,000.29 56.55 518.66 366.78 51,566.52 470.67 858.99 20.38 66,755.11 Sep 4,935.44 6,491.03 49.08 465.51 342.08 53,411.74 378.29 863.12 16.45 66,952.74 Oct 4,918.47 7,683.38 85.58 374.64 429.40 5_4,594.88 446.06 733.27 15.99 69,281.67 Nov 5,192.94 8,075.84 154.98 469.77 559.65 54,911.97 462.09 872.22 15.85 70,715.29 Dec 6,216.67 8,647.12 115.26 510.90 747.93 59,500.14 432.21 780.91 22.61 76,973.77
1992: Jan 4,146.36 5,979.79 98.06 433.63 379.24 43,852.58 408.82 593.68 16.71 55,908.85 Feb 5,279.67 8,914.13 89.25 420.40 585.50 51, 752.73 344.42 772.08 16.49 68,174.67 Mar 5,381.32 9,112.74 127.28 497.75 639.97 56,901.32. 432.85 766.21 13.21 73,872.65 Apr 5,878.95 9,199.41 . 111.12 714.79 509.93 60,895.76 357.51 874.83 8.37 78,550.68 May 5,932.28 8,888.05 72.50 509.04 764.04 63,820.91 493.66 1,027.76 10.18 81,518.40 Jun 7,316.41 9,243.16 142.53 621.12 685.76 65,248.94 380.43 972.54 10.35 84,621.23 Jui 6,023.73 9,592.18 96.93 485.50 677.72 66, 781.11 415.80 882.23 10.64 84,965.83 Aug 6,562.41 8,789.78 194.82 499.58 541.56 61,476.08 464.70 816.28 19.65 79,370.86 Sep 5,806.11 9,132.98 65.29 572.88 729.03 65,219.35 405.38 998.17 23.21 82,952.38 Oct 7,330.54 10,000.51 104.98 581.58 858.45 69,767.22 418.92 930.87 27.51 90,020.57 Nov 6,748.15 9,944.81 130.62 571.17 765.43 65,423.81 421.66 1,085.58 16.26 85,107.48 Dec 8,073.25 10,328.41 94.72 592.57 944.20 68,688.84 329.40 1,154.41 26.07 90,231.86
a In connection with the unification of Federal Republic of Germany (FRG) and German Democratic Republic (GDR) as from October 1990, trade figures for 'Western Europe' prior to October 1990 havc·been revised by adding the trade figures for the previous GDR. At the same time, trade values for GDR are deducted from those for 'Eastern Europe and Former USSR'. The purpose of these adjustments is to ensure comparability of these trade figures with those after the German unification.
3.3 DOMESTIC EXPORTS BY AREA
$million
Eastern Central Europe and and Australasia
North Western Former South Middle and Postal Total Year/month America Europe" USSR a America East Asia Africa Oceania packages merchandise
1987 78,532.91 50,082.81 253.17 2,833.47 2,996.11 52,036.15 2,848.24 4,724.80 946.36 195,254.03
1988 78,868.20 56, 190.27 334.04 2, 793.29 2,857.64 67,673.14 2,849.95 5,242.13 855.22 217,663.88
1989 78,460.41 53,396.12 399.45 2,948.91 2,446.14 78,237.61 2, 187.40 5,214.97 812.98 224,104.02
1990 71,735.68 54,811.45 664.06 3,622.04 2,099.47 85,679.12 2,084.47 4,416.70 762.47 225,875.47
1991 67,883.88 56,031.26 617.01 3,337.69 2,032.65 93,881.45 2,165.21 4,067.06 1,029.08 231,045.28
1992 69,617.68 49,104.23 390.50 3,050.14 2,026.68 103,424.86 1,982.81 3,645.96 880.44 234,123.30
1990: Dec 6,011.39 6,019.25 79.41 285.87 151.33 7,116.35 173.95 305.77 69.02 20,212.34
1991: Jan 5,151.77 5,271.26 69.32 271.02 124.16 7,668.16 169.62 373.88 76.89 19,176.09 Feb 3,898.93 4,571.16 78.62 218.93 81.13 5,027.60 145.91 267.82 55.80 14,345.89 Mar 3,660.03 3,818.12 45.81 224.47 113.98 6,565.83 166.41 294.93 90.47 14,980.05 Apr 4,582.25 4,327.02 65.01 276.83 191.48 8,192.77 176.25 337.91 43.72 18, 193.23 May 5,259.00 4,817.20 52.38 281.54 189.18 8,228.75 202.97 326.81 72.73 19,430.56 Jun 5,566.12 4,720.95 46.05 243.86 192.35 7,501.55 163.01 327.01 50.85 18,811. 74 Jui 6,273.14 ,5,345.63 57.04 254.23 179.55 8,424.60 201.01 337.71 107.56 21,180.47 Aug 6,034.62 4,985.88 42.45 302.91 191.22 8,154.03 195.97 351.65 104.97 20,363.70 Sep 6,800.40 4,327.23 34.86 329.03 186.53 8,178.11 194.99 365.68 109.39 20,526.22 Oct 7,215.36 4,078.25 43.65 323.97 199.46 8, 740.82 210.01 380.29 104.41 21.296.22 Nov 6,584.41 4,301.07 47.81 333.51 186.70 8,348.15 165.92 378.51 110.50 20,456.57 Dec 6,857.86 5,467.49 34.01 277.39 196.91 8,865.97 173.14 324.87 101.79 22,299.43
1992: Jan 3;958.23 3,624.88 34.23 17!.95 143.57 5,787.92 125.14 240.28 78.98 14,165.19 Feb 5,170.77 4, 192.39 28.59 271.61 200.39 7,065.25 163.13 346.20 51.40 17,489.72 Mar 4,418.89 3,249.03 29.18 258.84 188.10 8,366.32 162.28 306.41 72.70 17,051. 75 Apr 4,727.06 3,073.22 30.97 254.28 167.47 8,916.02 175.72 301.89 70.96 17,717.58 May 5,641.67 3,811.11 32.44 262.59 178.06 8,881.08 187.52 333.20 78.30 19,405.97 Jun 6,462.80 4,432.70 29.84 254.54 173.17 9,195.43 174.54 319.22 69.08 21,111.32 Jui 6,653.16 4, 760.41 36.28 262.03 164.69 8,949.25 182.12 322.35 49.73 21,380.00 Aug 6,479.33 4,410.81 24.25 277.92 144.48 8,990.19 142.84 317.29 46.34 20,833.45 Sep 6,720.58 4,269.69 36.30 279.80 141.28 9, 168.66 152.41 305.90 54.33 21,128.94 Oct 7,549.35 3,839.22 26.11 266.51 185.91 9,397.77 177.34 313.86 97.92 21,853.99 Nov 6,050.62 4,025.21 51.57 247.84 162.57 9,229.15 178.94 278.13 102.59 20,326.63 Dec 5,785.22 5,415.56 30.30 242.25 177.01 9,477.91 160.83 261.24 108.11 21,658.42
" In connection with the unification of Federal Republic of Germany (FRG) and German Democratic Republic (GDR) as from October 1990, trade figures for 'Western Europe' prior to October 1990 have been revised by adding the trade figures for the previous GDR. At the same time, trade values for GDR are deducted from those for 'Eastern Europe and Former USSR'. The purpose of these adjustments is to ensure comparability of these trade figures with those after the German unification.
20 Hong Kong Monthly Digest of Statistics January 1993
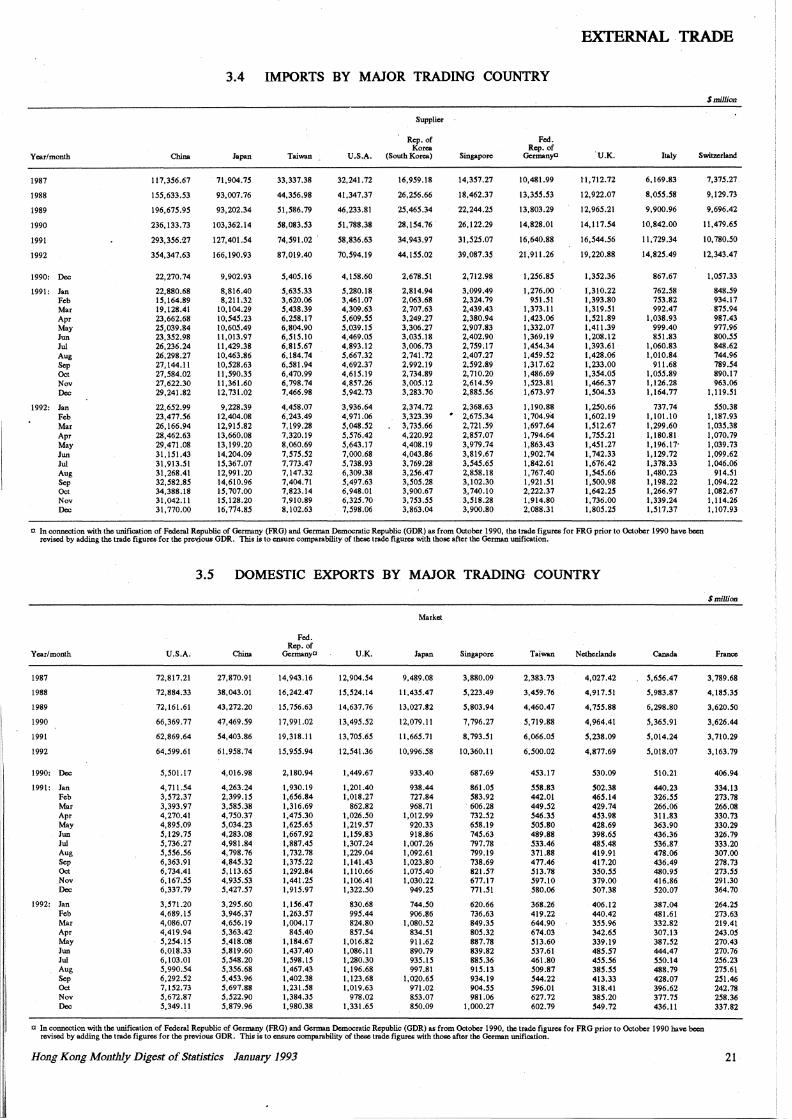
EXTERNAL TRADE
3.4 IMPORTS BY MAJOR TRADING COUNTRY
Smillicm
Supplier
Rep. of Fed. Korea Rep. of
Year/month China Japan Taiwan U.S.;\. (South Korea) Singapore Germanyo ·u.K. Italy Switzerland
1987 117,356.67 71,904.75 33,337.38 32,241.72 16,959.18 14,357.27 10,481.99 l"l,712.72 6,169.83 7,375.27
1988 155,633.53 93,007.76 44,356.98 41,347.37 26,256.66 18,462.37 13,355.53 12,922.07 8,055.58 9,129.73
1989 196,615.95 93,202.34 51,586.79 46,233.81 25,465.34 22,244.25 13,803.29 12,965.21 9,900.96 9,696.42
1990 236,133.73 103,362.14 58,083.53 51, 788.38 28,154.76 26,122.29 14,828.01 14,117.54 10,842.00 11,479.65
1991 293,356.27 127,401.54 74,591.02 58,836.63 34,943.97 31.525.07 16,640.88 16,544.56 II, 729.34 10,780.50
1992 354,347.63 166,190.93 87,019.40 70,594.19 44,155.02 39,087.35 21,911.26 19,220.88 14,825.49 12,343.47
1990: Dec 22,270.74 9,902.93 5,405.16 4,158.60 2,678.51 2, 712.98 1,256.85 1,352.36 867.67 1,057.33
1991: Jan 22,880.68 8,816.40 5,635.33 5,280.18 2,814.94 3,099.49 1.276.00 l.310.22 762.58 848.59 Feb 15,164.89 8,211.32 3,620.06 3,461.07 2,063.68 2,324.79 951.51 1,393.80 753.82 934.17 Mar 19,128.41 10,104.29 5,438.39 4,309.63 2,707.63 2,439.43 l,373.11 l,319.51 992.47 875.94 Apr 23,662.68 10,545.23 6,258.17 5,609.55 3,249.27 2,380.94 1,423.06 1,521.89 1,038.93 987.43 May 25,039.84 10,605.49 6,804.90 5,039.15 3,306.27 2,907.83 l,332.07 1,411.39 999.40 977.96 Jun 23,352.98 11,013.97 6,515.10 4,469.05 3,035.18 2,402.90 1,369.19 l,208.12 851.83 800.55 Jui 26,236.24 11,429.38 6,815.67 4,893.12 3,006.73 2, 759.17 l,454.34 1,393.61 1,060.83 848.62 Aug 26,298.27 10,463.86 6, 184.74 5,667.32 2,741.72 2,407.27 1,459.52 l,428.06 1,010.84 744.96 Sep 27,144.11 10,528.63 6,581.94 4,692.37 2,992.19 2,592.89 1,317.62 1,233.00 911.68 789.54 Oct 27,584.02 11,590.35 6,470.99 4,615.19 2,734.89 2,710.20 1,486.69 1,354.05 1,055.89 890.17 Nov 27,622.30 11,361.60 6, 798.74 4,857.26 3,005.12 2,614.59 1,523.81 1,466.37 1,126.28 963.06 Dec 29,241.82 12, 731.02 7,466.98 5,942.73 3,283.70 2,885.56 1,673.97 1,504.53 1,164.77 1,119.51
1992: Jan 22,652.99 9,228.39 4,458.07 3,936.64 2,374.72 2,368.63 1,190.88 1,250.66 737.74 550.38 Feb 23,477.56 12,404.08 6,243.49 4,971.06 3,323.39 . 2,675.34 1,704.9'4 1,602.19 1,101.10 1,187.93 Mar 26,166.94 12,915.82 7,199.28 5,048.52 3,735.66 2,721.59 1,697.64 1,512.67 1,299.60 l,035.38 Apr 28,462.63 13,660.08 7,320.19 5,576.42 4,220.92 2,857.07 1,794.64 1,755.21 1,180.81 1,070.79 May 29,471.08 13,199.20 8,060.69 5,643.17 4,408.19 3,979.74 1,863.43 1,451.27 1,196.17• 1,039.73 Jun 31,151.43 14,204.09 7,575.52 7,000.68 4,043.86 3,819.67 1,902.74 1,742.33 1,129.72 1,099.62 Jui 31,913.51 15,367.07 7,773.47 5, 738.93 3,769.28 3,545.65 1,842.61 l,676.42 1,378.33 1,046.06 Aug 31,268.41 12,991.20 7, 147.32 6,309.38 3,256.47 2,858.18 1,767.40 1,545.66 l,480.23 914.51 Sep 32,582.85 14,610.96 7,404.71 5,497.63 3,505.28 3,102.30 1,921.51 1,500.98 1,198.22 1,094.22 Oct 34,388.18 15,707.00 7,823.14 6,948.01 3,900.67 3, 740.10 2,222.37 1,642.25 1,266.97 1,082.67 Nov 31,042.11 15,128.20 7,910.89 6,325.70 3, 153.55 3,518.28 1,914.80 1,736.00 1,339.24 1,114.26 Dec 31, 770.00 16,114.85 8, 102.63 7,598.06 3,863.04 3,900.80 2,088.31 1,805.25 1,517.37 1,107.93
a In connection with the unification of Federal Republic of Germany (FRG) and German Democratic Republic (GDR) as from October 1990, the trade figures for FRG prior to October 1990 have been revised by adding the trade figures for the prexious GDR. This is to ensure comparability of these trade figures with those after the German unification.
3.5 DOMESTIC EXPORTS BY MAJOR TRADING COUNTRY
$million
Market
Fed. Rep. of
Year/month U.S.A. China German yo U.K. Japan Singapore Taiwan Netherlands Canada France
1987 72,817.21 27,870.91 14,943.16 12,904.54 9,489.08 3,880.09 2,383.73 4,027.42 5,656.41 3,789.68
1988 72,884.33 38,043.01 16,242.47 15,524.14 11,435.47 5,223.49 3,459.76 4,917.51 5,983.87 4, 185.35
1989 72, 161.61 43,272.20 15,756.63 14,637.76 13,027.82 5,803.94 4,460.47 4,755.88 6,298.80 3,620.50
1990 66,369.77 47,469.59 17,991.02 13,495.52 12,079.ll 7,796.27 5,719.88 4,964.41 5,365.91 3,626.44
1991 62,869.64 54,403.86 19,318.11 13,705.65 11,665.71 8,793.51 6,066.05 5,238.09 5,014.24 3,710.29
1992 64,599.61 61,958.74 15,955.94 12,541.36 10,996.58 10,360.11 6,500.02 4,877.69 5,018.07 3,163.79
1990: Dec 5,501.11 4,016.98 2, 180.94 1,449.67 933.40 687.69 453.17 530.09 510.21 406.94
1991: Jan 4, 711.54 4,263.24 1,930.19 1,201.40 938.44 861.05 558.83 502.38 440.23 334.13 Feb 3,572.37 2,399.15 1,656.84 1,018.27 727.84 583.92 442.01 465.14 326.55 273.78 Mar 3,393.97 3,585.38 1,316.69 862.82 968.71 606.28 449.52 429.74 266.06 266.08 Apr 4,270.41 4,750.37 1,475.30 1,026.50 1,012.99 732.52 546.35 453.98 311.83 330.73 May 4,895.09 5,034.23 1,625.65 1,219.57 920.33 658.19 505.80 428.69 363.90 330.29 Jun 5, 129.75 4,283.08 1,667.92 1,159.83 918.86 745.63 489.88 398.65 436.36 326.79 Jui 5,736.27 4, 981.84 1,887.45 1,307.24 1,007.26 797.78 533.46 485.48 536.87 333.20 Aug 5,556.56 4, 798.76 I, 732.78 1,229.04 1,092.61 799.19 371.88 419.91 478.06 307.00 Sep 6,363.91 4,845.32 1,375.22 1,141.43 1,023.80 738.69 477.46 417.20 436.49 278.73 Oct 6,734.41 5,113.65 1,292.84 1,110.66 1,075.40 821.57 513.78 350.55 480.95 273.55 Nov 6,167.55 4,935.53 1,441.25 1,106.41 1,030.22 677.17 597.10 379.00 416.86 291.30 Dec 6,337.79 5,427.57 1,915.97 1,322.50 949.25 771.51 580.06 507.38 520.07 364.70
1992: Jan 3,571.20 3,295.60 1,156.47 830.68 744.50 620.66 368.26 406.12 387.04 264.25 Feb 4,689.15 3,946.37 1,263.57 995.44 906.86 736.63 419.22 440.42 481.61 273.63 Mar 4,086.07 4,656.19 1,004.17 824.80 1,080.52 849.35 644.90 355.96 332.82 219.41 Apr 4,419.94 5,363.42 845.40 857.54 834.51 805.32 674.03 342.65 307.13 243.05 May 5,254.15 5,418.08 1,184.67 1,016.82 911.62 887.78 513.60 339.19 387.52 270.43 Jun 6,018.33 5,819.60 1,437.40 l,086.11 890.79 839.82 537.61 485.57 444.47 270.76 Jui 6,103.01 5,548.20 1,598.15 l,280.30 935.15 885.36 461.80 455.56 550.14 256.23 Aug 5,990.54 5,356.68 1,467.43 1,196.68 997.81 915.13 509.87 385.55 488.79 275.61 Sep 6,292.52 5,453.96 1,402.38 1,123.68 1,020.65 934.19 544.22 413.33 428.07 251.46 Oct 7, 152.73 5,697.88 1,231.58 1,019.63 971.02 904.55 596.01 318.41 396.62 242.78 Nov 5,672.87 5,522.90 1,384.35 978.02 853.07 981.06 627.72 385.20 377.75 258.36 Dec 5,349.p 5,879.96 1,980.38 1,331.65 850.09 l,000.27 602.79 549.72 436.11 337.82
a In connection with the unification of Federal Republic of Germany (FRG) and German Democratic Republic (GDR) as from October 1990, the trade figures for FRG prior to October 1990 have been revised by adding the trade figures for the previous GDR. This is to ensure comparability of these trade figure6 with those after the German unification.
Hong Kong Mo11thly Digest of Statistics January 1993 21
I.
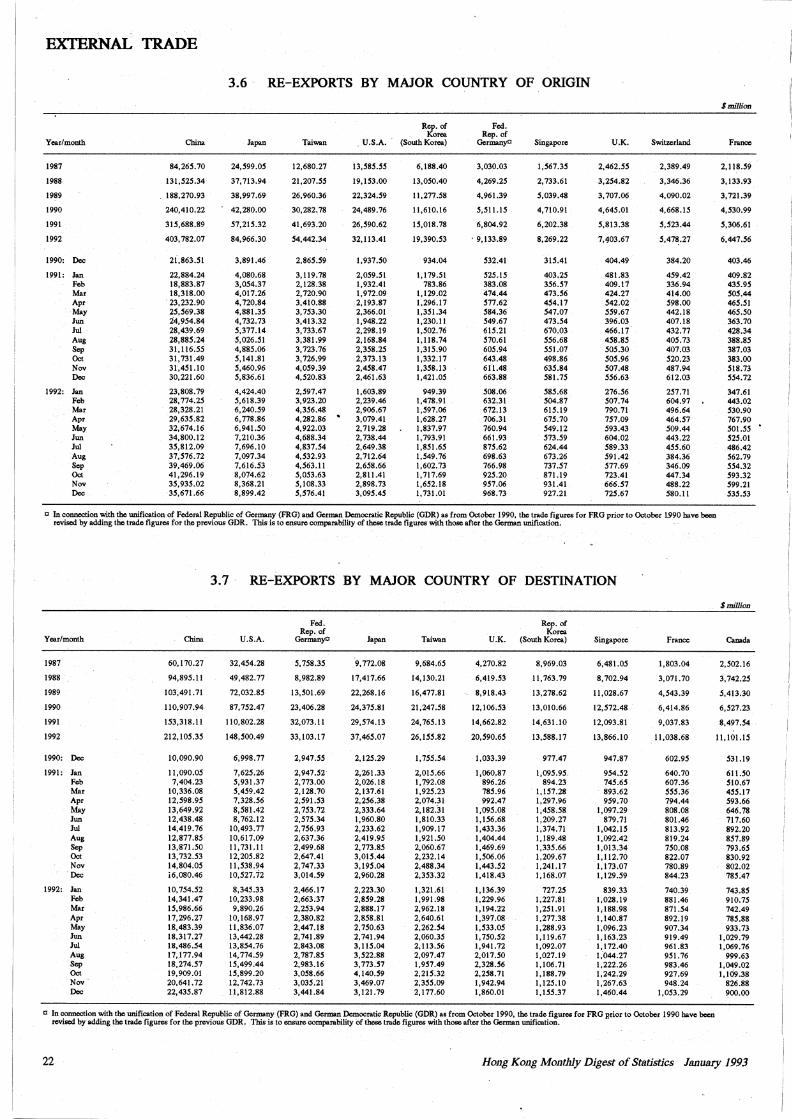
--------
. '
EXTERNAL TRADE
3.6 RE-EXPORTS BY MAJOR COUNTRY OF ORIGIN
$ milHoa
Rep. of Fed. Ko .... Rep.of
YearlmOnlh Chim Japan Taiwan U.S.A. (SouthKotea) Germanyc Singapore U.K. Swit7.erland France
1987 84,26S.70 24,S99.0S 12,680.27 13,S8S.SS 6,188.40 3,030.03 l,S61.3S 2,462.SS 2,389.49 2,ll8.S9
1988 131,S2S.34· 37, 713.94 21,201.SS 19,IS3.00 13,0S0.40 4,269.2S 2,733.61 3,2S4.82 3,346.36 3,133.93
1989 . 188,270.93 38,997.69 26,960.36 22,324.S9 ll,277.S8 4,961.39 S,039.48 3,707.06 4,090.02 3,721.39
1990 240,410.22 42,280.00 30,282.78 24,489.76 11,610.16 S,SI l.IS 4,710.91 4,64S.OI 4,668.IS 4,530.99
1991 315,688.89 S7,21S.32 41,693.20 26,S90.62 IS,018.78 6,804.92 6,202.38 S,813.38 S,S23.44 S,306.61
1992 403,782.07 84,966.30 S4,442.34 32,ll3.41 19,390.S3 • 9,133.89 8,269.22 7,403.67 S,4~.27 6,447.56
1990: Dec 2i,863.Sl 3,891.46 2,86S.S9 1,937.SO 934.04 532.41 315.41 404.49 384.20 403.46
1991: Jan 22,884.24 4,080.68 3,119.78 2,0S9.SI l,179.Sl 525.15 403.25 481.83 4S9.42 409.82 Feb 18,883.87 3,0S4.37 2,128.38 1,932.41 783.86 383.08 3S6.S1 409.17 336.94 43S.9S Mar 18,318.00 4,017.26 2,720.90 l,972.09 l,129.02 474.44 473.S6 424.27 414.00 505.44 Apr 23,232.90 4,720.84 3,410.88 2,193.87 1.296.17 S77.62 4S4.17 S42.02 S98.00 46S.SI May 25,S69.38 4,881.3S 3,7S3.30 2,366.01 1,351.34 S84.36 S47.07 S59.61 442.18 46S.SO Jun 24,9S4.84 4,732.73 3,413.32 1,948.22 1,230.ll S49.61 473.S4 396.03 407.18 363.70 Jui 28,439.69 S,377.14 3,733.67 2,298.19 l,S02.76 61S.21 670.03 466.17 432.77 428.34 Aug 28,88S.24 S,026.SI 3,381.99 2,168.84 l,ll8.74 S70.6l SS6.68 4S8.8S 40S.73 388.8S Sep 31,116.SS 4,88S.06 3,723.76 2,3S8.25 1,313.90 60S.94 SSl.01 SOS.30 407.03 387.03 Oct 31,731.49 S,141.81 3,726.99 2,373.13 1,332.17 643.48 498.86 S05.96 S20.23 383.00 Nov 31,451.10 5,460.96 4,059.39 2,458.47 l,358.13 611.48 635.84 507.48 487.94 518.73 Dec 30,221.60 S,836.61 4,520.83 2,461.63 1,421.05 663.88 581. 75 SS6.63 612.03 554.72
1992: Jan 23,808.79 4,424.40 2,S97.47 1,603.89 949.39 508.06 S8S.68 276.S6 257.71 347.61 Feb 28,774.25 S,618.39 3,923.20 2,239.46 1,478.91 632.31 504.87 S07.74 604.97 443.02 Mar 28,328.21 6,240.S9 4,3S6.48 2,906.67 1.597.06 672.13 61S.19 790.71 496.64 S30.90 Apr 29,63S.82 6, 778.86 4,282.86 3,079.41 1,628.27 706.31 67S.70 757.09 464.S1 767.90 May 32,674.16 6,941.SO 4,922.03 2,719.28 1,837.97 760.94 S49.12 S93.43 509.44 SOI.SS Jun 34,800.12 7,210.36 4,688.34 2,738.44 1,793.91 661.93 S13.S9 604.02 443.22 S25.0I Jui 3S,812.09 7,696.10 4,837.54 2,649.38 l,8Sl.6S 87S.62 624.44 589.33 4SS.60 486.42 Aug 37,S76.72 7,097.34 4,S32.93 2,712.64 1,S49.76 698.63 673.26 S91.42 384.36 S62.19 Sep 39,469.06 7,616.53 4,S63.ll 2,6S8.66 1,602.73 766.98 737.57 S77.69 346.09 SS4.32 Oct 41,296.19 8,074.62 S,OS3.63 2,8ll.41 1,717.69 92S.20 871.19 723.41 447.34 S93.32 Nov 3S,935.02 8,368.21 S,108.33 2,898.73 1,6S2.18 957.06 931.41 666.S1 488.22 599.21 Dec 35,671.66 8,899.42 S,S16.41 3,09S.4S 1,731.01 968.73 927.21 72S.67 S80.ll 53S.S3
c In COlUllOC!ion with the unification of Federal Republic of Germany (FRG) and German Democratic Republic (GDR) as from October I 990, tho trade figures for FRG prior to October 1.990 have been revised by adding the trade figures for the previous GDR. This is to ensure comparability of these trade figures with those after the German unification.
3.7 RE-EXPORTS BY MAJOR COUNTRY OF DESTINATION
$ milHoa
Fed. Rep. of Rep. of Korea
Year/mOnlh Chim U.S.A. Germanyc Japan Taiwan U.K. (South Korea) Singapore France Canada
1987 60,170.27 32,4S4.28 S,758.35 09,772.08 9,684.6S 4,270.82 8,969.03 6,481.05 1,803.04 2,502.16
1988 94,89S.ll 49,482.77 8,982.89 17,417.66 14,130.21 6,419.S3 ll,763.79 8,702.94 3,071.70 3,742.25
1989 103,491.71 72,032.8S 13,501.69 22,268.16 16,477.81 8,918.43 13,278.62 11,028.67 4,543.39 5,413.30
1990 110,907.94 87,7S2.47 23,406.28 24,375.81 21,247.58 12,106.S3 13,010.66 12,572.48 6,414.86 6,527.23
1991 IS3,318.11 110,802.28 32,073.11 29,S74.13 24,76S.13 14,662.82 14,631.10 12,093.81 9,037.83 8,497.S4
1992 212,IOS.35 148,S00.49 33,103.17 37,46S-.07 26,IS5.82 20,S90.6S 13,588.17 13,866.10 ll,038.68 11,101.IS
1990: Dec 10,090.90 6,998.77 2,947.55 2,12S.29 l,1S5.S4 i,033.39 977.47 947.87 602.9S S31.19
1991: Jan 11,090.0S 7,625.26 2,947.52 2,261.33 2,015.66 1,060,87 l,09S.9S. 954.52 640.70 611.50 Feb 7,404.23 5,931.37 2,773.00 2,026.18 l,792.08 896.26 894.23 145.6S 607.36 510.67 Mar 10,336.08 S,4S9.42 2,128.70 2,137.61 1,92S.23 78S.96 1,157.28 893.62 555.36 455.11 Apr 12,S98.9S 7,328.S6 2,S91.S3 2,256.38 2,074:31 992.47 1,297.96 959.70 794.44 S93.66 May 13,649.92 8,581.42 2,753.72 2,333.64 2,182.31 1,095.08 1,458.58 1,097.29 808.08 646.78 Jun 12,438.48 8,762.12 2,575.34 1,960.80 1,810.33 1,156.68 1,209.27 879.71 801.46 717.60 Jui 14,419.76 10,493.77 2,756.93 2,233.62 1,909.17 1,433.36 1,374.71 1,042.IS 813.92 892.20 Aug 12,877.85 10,617.09 2,637.36 2,419.9S 1,921.SO 1,404.44 J,189.48 1,092.42 819.24 8S7.89 Sep 13,871.SO lt,731.11 2,499.68 2,773.8S 2,060.67 1,469.69 t,33S.66 1,013.34 750.08 793.65 Oct 13,732.S3 12,205.82 2,647.41 3,015.44 2,232.14 J,506.06 1.209.67 1,112.70 822.07 830.92 Nov 14,804.05 ll,538.94 2,747.33 3,195.04 2,488.34 1,443.52 1,241.17 1,173.07 780.89 802.02
'Dec i6,080.46 10;521.72 3,014.S9 2,960.28 2,3S3.32 J,418.43 1,168.07 1,129.59 844.23 78S:47
1992: Jan to,754.S2 8,345.33 2,466.17 2,223.30 1,321.61 1.136.39 727.2S 839.33 740.39 743.8S Feb 14,341.47 10,233.98 2,663.37 2,8S9.28 1,991.98 1,229.96 1,227.81 1,028.19 881.46 910.75 Mar IS,986.66 9,890.26 2,2S3.94 2,888.17 2,962.18 1,194.22 l,2Sl.91 1,188.98 871.S4 742.49 Apr 17,296.27 10,168.97 2,380.82 2,8S8.81 2,640.61 1,397.08 1,277.38 l,140.87 892.19 78S.88 May 18,483.39 ll,836.07 2,447.18 2,7S0.63 2,262.54 l,S33.0S 1,288.93 1,096.23 907.34 933.73 Jun 18,317.27 13,442.28 2,741.89 2,741.94 2,060.3S l,1SO.S2 1,119.67 l,163.23 919.49 1,029.79 Jui 18,486.54 13,8S4.76 2,843.08 3,llS.04 2,ll3.56 1,941.72 1,092.07 1,172.40 961.83 1,069.76 Aug 17,177.94 14,774.S9 2,787.8S 3,S22.88 2,097.47 2,017.SO l,027.19 1;044;27 951.16 999.63 Sep 18,.274.S7 IS,499:44 2,983.16 3,773.S7 l,9S7.49 2,328.S6 1,106.71 1,222.26 983.46 1;049.02 Oct 19,909.01 IS,899.20 3,058.66 4,14o.S9 2,21S.32 2,2S8.71 1,188.79 1,242.29 927.69 1,169.38 Nov 20,641.72 12,742.73 3,03S.21 3,469.07 2,3SS.09 1,942.94 l,12S.10 1,267.63 948.24 826.88 Dec 22,43S.87 11,812.88 3,441.84 3,121.79 2,111:60 1,860.01 l,IS5.37 l,460.44 1,053.29 900.00
c In COlUllOC!ion with the unification of Federal Republic of Germany (FRG) and German Democratic Republic (GDR) as from October 1990, tho trade figures for FRG l!rior to October I 990 have been revised by adding the trade figures for the previous GDR; This is to ensiJre comparability of these trade figures with those after the German unification.
22 Hong Ko11g Monthly Digest of Statistics January 1993
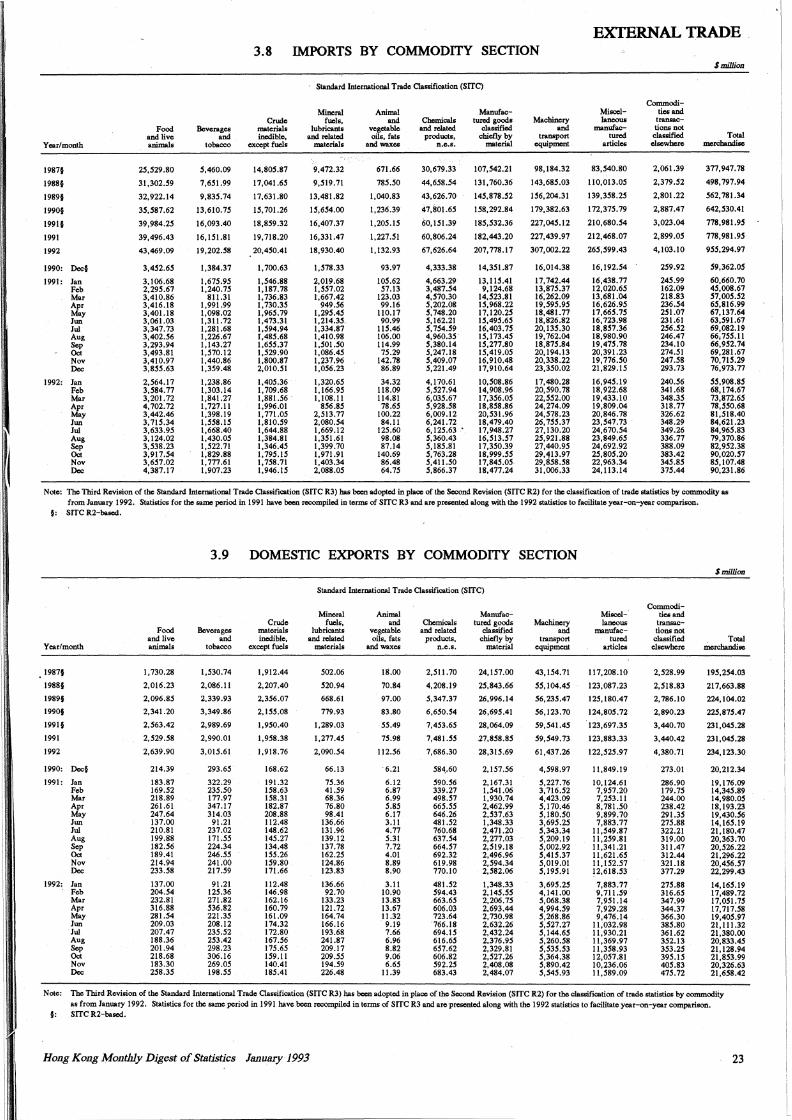
I II
I I I
I ~
I
I
I ,,
11
I
I:
I
Ii
I
I
I
I
I
1:
Year/month
1987§
1988§
1989§
1990§
1991§
1991
1992
1990: Dec§
1991: Jan Feb Mar Apr May Jun Jui Aug Sep Oct Nov Dec
1992: Jan Feb Mar Apr May Jun Jui Aug Sep Oct Nov Dec
Food and live animals
25,529.80
31,302.59
32,922.14
35,587.62
39,984.25
39,496.43
43,469.09
3,452.65
3,106.68 2,295.67 3,410.86 3,416.18 3,401.18 3,061.03 3,347.73 3,402.56 3,293.94 3,493.81 3,410.97 3,855.63
2,564.17 3,584.77 3,201.72 4,702.72 3,442.46 3,715.34 3,633.95 3,124.02 3,538.23 3,917.54 3,657.02 4,387.17
Beverages. and
tobacco
5,460.09
7,651.99
9,835.74
13,610.75
16,093.40
16,151.81
19,202.58
1.384.37
1,675.95 1,240.75
811.31 1.991.99 1,098.02 1,311.72 1,281.68 1,226.67 1,143.27 1,570.12 1,440.86 1,359.48
1,238.86 1,303.14 1,841.27 1,727.11 1,398.19 1,558.15 1,668.40 1.430.05 1,522.71 1,829.88 I, 777.61 1,907.23
3.8
Crude materials inedible,
except fuels
14,805.87
17,041.65
17,631.80
15, 701.26
18,859.32
19,718.20
20,450.41
1,700.63
1,546.88 1,187.78 1.736.83 1,730.35 1,965.79 1.473.31 1,594.94 !,485.68 1,655.37 1,529.90 1,800.87 2,010.51
1.405.36 l, 709.68 1,881.56 l,996.01 1.771.05 1,810.59 1,644.88 1,384.81 1,346.45 1,195.IS 1,758.71 l,946.15
IMPORTS BY COMMODITY SECTION
Standard International Trade Classification (SITC)
Mineral fuels,
lubricants and related
materials
9,472.32
9,519.71
13,481.82
15,654.00
16,407.37
16,331.47
18,930.40
1,578.33
2,019.68 1,557.02 1,667.42
949.56 1,295.45 1,214.35. 1,334.87 1,410.98 I.SOI.SO l,086.45 1,237.96 1,056.23
1,320.65 1,166.95 1,108.11
856.85 2,513.77 2,080.54 1,669.12 1,351.61 1,399.70 1,971.91 1,403.34 2,088.05
Animal and
vegetable oils, fats
and waxes
671.66
785.50
1,040.83
1,236.39
1,205.15
1,227.51
1,132.93
93.97
105.62 57.13
123.03 99.16
110.17 90.99
115.46 106.00 114.99 75.29
142.78 86.89
34.32 118.09 114.81 78.65
100.22 84.11
125.60 98.08 87.14
140.69 86.48 64.75
Chemicals and related
products, n.e.s.
30,679.33
44,658.54
43,626.70
47,801.65
60, 151.39
60,806.24
67,626.64
4,333.38
4,663.29 3,487.54 4,570.30 5,202.08 5,748.20 5,162.21 s. 154.59 4,960.35 5,380.14 5,247.18 S,409.01 5,221.49
4,170.61 5,527.94 6,035.67 5,928.58 6,009.12 6,241.72 6,125.63 . 5,360.43 5,185.81 5,763.28 S,411.SO 5,866.37
Manufactured goods
classified chiefly by
material
107,542.21
131,760.36
145,878.52
158,292.84
185,532.36
182,443.20
207,778.17
14,351.87
13.115.41 9,124.68
14,523.81 15,968.22 17,120.25 15,495.65 16,403.75 15,173.45 15,277.80 15,419.05 16,910.48 17,910.64
10,508.86 14,908.96 17,356.05 18,858.86 20,531.96 18,479.40 17,948.27 16,513.57 17,350.39 18,999.55 17,845.05 18,477.24
Machinery and
transport equipment
98, 184.32
143,685.03
156,204.31
179,382.63
227,045.12
227,439.97
307,002.22
16,014.38
17,742.44 13,875.37 16,262.09 19,595.95 18,481.77 18,826.82 20,135.30 19,762.04 18,875.84 20,194.13 20,338.22 23,350.02
17,480.28 20,590.78 22,552.00 24,274.09 24,578.23. 26, 755.37 27,130.20 25,921.88 27,440.95 29,413.97 29,858.58 31,006.33
EXTERNAL TRADE
Miscellaneous
manufactured
articles
83,540.80
110,013.05
139,358.25
172,375.79
210,680.54
212,468.07
265,599.43
16,192.54
16,438.77 12,020.65 13,681.04 16,626.95 17,665.75 16,723.98 18,857.36 18,980.90 19,475.78 20,391.23 19,776.50 21,829.15
16,945.19 18,922.68 19,433.10 19,809.04 20,846.78 23,547.73 24,670.54 23,849.65 24,692.92 25,805.20 22,963.34 24,113.14
Commodities and transactions not classified elsewhere
2,061.39
2,379.52
2,801.22
2,887.47
3,023.04
2,899.05
4,103.10
259.92
245.99 162.09 218.83 236.54 251.07 231.61 256.52 246.47 234.10 274.51 247.58 293.73
240.56 341.68 348.35 318.77 326.62 348.29 349.26 336.77 388.09 383.42 345.85 375.44
$million
Total merchandise
377,947.78
498,797.94
562, 781.34
642,530.41
778,981.95
778,981.95
955,294.97
59,362.0S
60,660.70 45,008.67 51,00S.52 65,816.99 67,137.64 63,591.67 69,082.19 66, 755.11 66,952.74 69,281.67 70,715.29 76,973.77
55,908.85 68, 174.67 73,872.65 78,550.68 81,518.40 84,621.23 84,965.83 79,370.86 82,952.38 90,020.57 85,107.48 90,231.86
Note: The Third Revision of the Standard International Trade Qassification (SITC R3) has been adopted in place of the Second Revision (SITC R2) for the classification of trade statistics by commodity as from January 1992. Statistics for the same period in 1991 have been recompiled. in terms of SITC R3 and are p~ along with the 1992 statistics to facilitate year-on-year comparison.
§: SITC R2-hascd.
Year/month
1987§
1988§
1989§
1990§
1991§
1991
1992
1990: Dec§
1991: Jan Feb Mar Apr May Jwi Jui Aug Sep Oct Nov Dec
1992: Jan Feb Mar Apr May Jun Jui Aug Sep Oct Nov Dec
Food and live animals
1,730.28
2,016.23
2,096.85
2,341.20
2,563.42
2,529.58
2,639.90
214.39
183.87 169.52 218.89 261.61 247.64 137.00 210.81 199.88 182.56 189.41 214.94 233.58
137.00 204.54 232.81 316.88 281.54 209.03 207.47 188.36 201.94 218.68 183.30 258.35
3.9
Beverages and
tobacco
1,530.74
2,086.11
2.339.93
3,349.86
2,989.69
2,990.01
3,015.61
293.65
322.29 235.SO 177.97 347.17 314.03
91.21 237.02 171.55 224.34 246.55 241.00 217.59
91.21 125.36 271.82 536.82 221.35 208.12 235.52 253.42 298.23 306.16 269.0S 198.55
DOMESTIC EXPORTS BY COMMODITY SECTION
Crude materials inedible,
except fuels
l,912.44
2,207.40
2,356.07
2,155.08
1,950.40
l,958.38
1,918.76
168.62
191.32 158.63 158.31 182.87 208.88 112.48 148.62 145.27 134.48 155.26 159.80 171.66
112.48 146.98 162.16 160.79 161.09 174.32 172.80 167.56 175.65 159.11 140.41 185.41
Standard International Trade Classification (SITC)
Mineral fuels,
lubricants and related
materials
502.06
520.94
668.61
779.93
1,289.03
1,277.45
2,090.54
66.13
75.36 41.59 68.36 76.80 98.41
136.66 131.96 139.12 137.78 162.25 124.86 123.83
136.66 92.70
133.23 121. 72 164.74 166.16 193.68 241.87 209.17 209.55 194.59 226.48
Animal and
vegetable oils, fats
and waxes
18.00
70.84
97.00
83.80
55.49
75.98
112.56
6.21
6.12 6.87 6.99 5.85 6.17 3.11 4.77 5.31 7.72 4.01 8.89 8.90
3.11 10.90 13.83 13.67 11.32 9.19 7.66 6.96 8.82 9.06 6.65
11.39
Chemicals and related
products, n.e.s.
2,511.70
4,208.19
5,347.37
6,650.54
7,453.65
7,481.SS
7,686.30
584 .. 60
590.56 339.27 498.57 665.55 646.26 481.52 760.68 637.54 664.57 692.32 619.98 770.10
481.52 594.43 663.65 606.03 723.64 766.18 694.15 616.65 657.62 606.82 592.25 683.43
Manufac..:. tured goods
classified chiefly by
material
24,157.00
25,843.66
26,996.14
26,695.41
28,064.09
.27,858.85
28,315.69
2,157.56
2,167.31 1.541.06 1.930.74 2,462.99 2,537.63 l,348.33 2,471.20 2,277.03 2,519.18 2,496.96 2,594.34 2,582.06
1.348.33 2,145.55 2,206.75 2,693.44 2,730.98 2,632.26 2,432.24 2.376.95 2,329.81 2,527.26 2,408.08 2,484.07
Machinery and
transport equipment
43,154.71
55, 104.45
56,235.47
56,123.70
59,541.45
59,549.73
61,437.26
4,598.97
5,227.76 3, 716.52 4,423.09 5,170.46 5,180.50 3,695.25 5,343.34 5,209.19 5,002.92 5,415.37 5,019.01 5,195.91
3,695.25 4,141.00 5,068.38 4,994.59 5,268.86 5,527.27 5, 144.65 S,260.58 5,535.53 5,364.38 5,890.42 S,545.93
Miscellaneous
manufactured
articles
117,208.10
123,087.23
125, 180.47
124,805.72
123,697.35
123,883.33
122,525.97
11,849.19
10,124.61 7,957.20 7,253.11 8, 781.SO 9,899.70 7,883.77
11,549.87 11,259.81 11,341.21 11,621.65 11,152.57 12,618.53
7,883.77 9, 711.59 7,951.14 7,929.28 9,476.14
11,032.98 11,930.21 11,369.97 11,358.93 12,057.81 10,236.06 11,589.09
Commodities and
transactions not
classified elsewhere
2,528.99
2,518.83
2,786.10
2,890.23
3,440.70
3,440.42
4,380.71
273.01
286.90 179.75 244.00 238.42 291.35 275.88 322.21 319.00 311.47 312.44 321.18 377.29
275.88 316.65 347.99 344.37 366.30 385.80 361.62 352.13 353.25 395.15 405.83 475.72
$million
Total merchandise
195,254.03
217,663.88
224,104.02
225,875.47
231,045.28
231,045.28
234, 123.30
20,212.34
19,176.09 14,345.89 14,980.05 18,193.23 19,430.56 14,165.19 21,180.47 20,363.70 20,526.22 21,296.22 20,456.57 22,299.43
14,165~19 17,489.72 17,051.75 17,717.58 19,405.97 21,111.32 21,380.00 20,833.45 21,128.94 21,853.99 20,326.63 21,658.42
Note: The Third Revision of the Standard International Trade Classification (SITC R3) has been adopted in place of the Second Revision (SITC R2) for the classification of trade statistics by commodity as from January 1992. Statistics for the same period in 1991 have been recompiled in terms of SITC R3 and arc presented along with the 1992 statistics to facilitate year-on-year comparison.
§: SITC R2-hascd.
Hong Kong Monthly Digest of StJJtistics January 1993 23
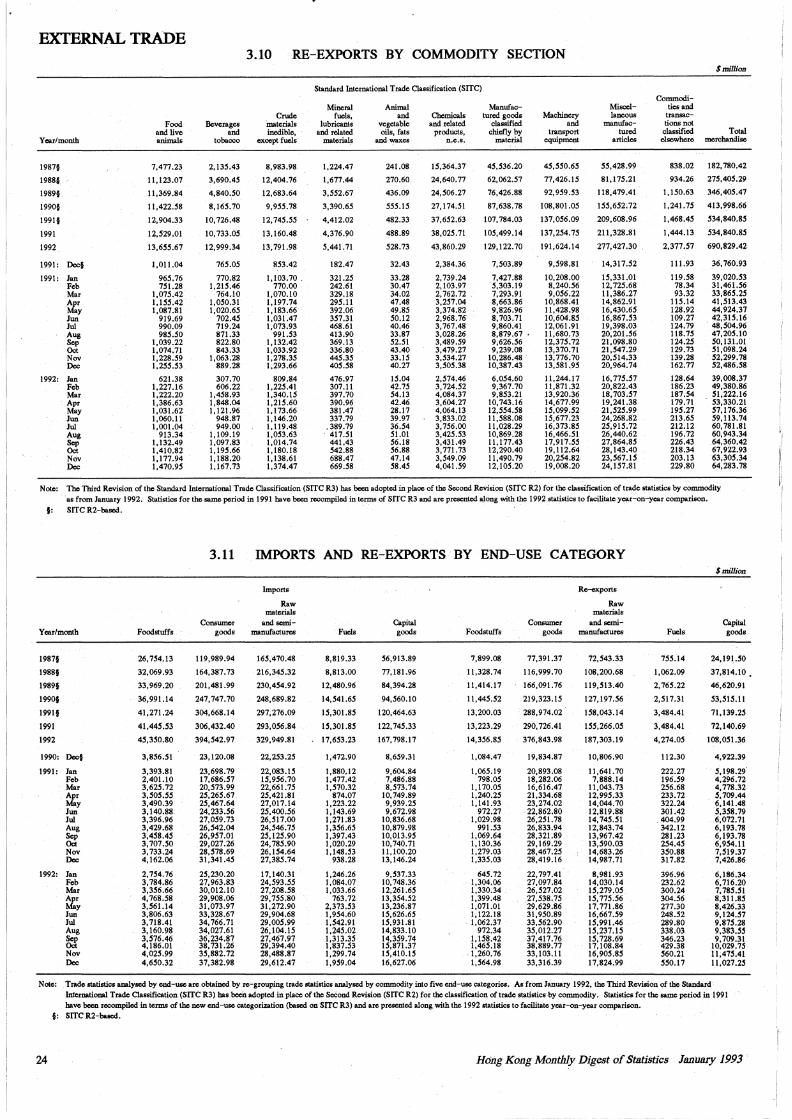
EXTERNAL TRADE 3.10 RE-EXPORTS BY COMMODITY SECTION
$million
Standard International Trade Classification (SITC) Commocli-
Mineral Animal Ma.nufac- Miscel- ties and Crude fuels, and Chemicals tured goods Machinery Ianeous transac-
Food Beverages inaterials lubricants vegetable and related classified and manufac- tions not and live and inedible, and related oils. fats products, chiefly by transport tured classified Total
Year/month animals tobacco except fuels materials and waxes n.e.s. material equipment articles elsewhere merchandise
1987§ 7,477.23 2, 135.43 8,983.98 1,224.47 241.08 15,364.37 45,536.20 45,550.65 55,428.99 838.02 182,780.42
1988§ 11,123.07 3,690.45 12,404.76 l,677.44 270.60 24,640.77 62,062.57 77,426.15 81,175.21 934.26 275,405.29
1989§ 11,369.84 4,840.50 12,683.64 3,552.67 436.09 24,506.27 76,426.88 92,959.53 118,479.41 1,150.63 346,405.47
1990§ 11,422.58 8,165.70 9,955.78 3,390.65 555.15 27, 174.51 87,638.78 108,801.05 155,652;72 1,241. 75 413,998.66
1991§ 12,904.33 10,726.48 12,745.55 4,412.02 482.33 37,652.63 107,784.03 137,056.09 209,608.96 1,468.45 534,840.85
1991 12,529.01 10, 733.05 13,160.48 4,376.90 488.89 38,025.71 105,499.14 137,254.75 211,328.81 1,444.13 534,840.85
1992 13,655.67 12,999.34 13, 791.98 5,441.71 528.73 43,860.29 129,122.70 191,624.14 277,427.30 2,377.57 690,829.42
1991: Dec§ l,011.04 765.05 853.42 182.47 32.43 2,384.36 7,503.89 9,598.81 14,317.52 111.93 36,760.93
1991: Jan 965.76 770.82 1,103.70 . 321.25 33.28 2,739.24 7,427.88 10,208.00 15,331.01 119.58 39,020.53 Feb 751.28 1,215.46 770.00 242.61 30.47 2,103.97 5,303.19 8,240.56 12, 725.68 78.34 31,461.56 Mar 1,075.42 764.10 1,070.10 329.18 34.02 2,762.72 7,293.91 9,056.22 11,386.27 93.32 33,865.25 Apr 1,155.42 1,050.31 1,197.74 295.11 47.48 3,257.04 8,663.86 10,868.41 14,862.91 115.14 41,513.43 May 1,087.81 1,020.65 1,183.66 392.06 49.85 3,374.82 9,826.96 11,428.98 16,430.65 128.92 44,924.37 Jun 919.69 702.45 l,031.47 357.31 50.12 2,968.76 8,703.71 10,604.85 16,867.53 109.27 42,315.16 Jui 990.09 719.24 1,073.93 468.61 40.46 3,767.48 9,860.41 12,061.91 19,398.03 124.79 48,504.96 Aug 985.50 871.33 991.53 413.90 33.87 3,028.26 8,879.67 • 11,680.73 20,201.56 118.75 47,205.10 Sep 1,039.22 822.80 1,132.42 369.13 52.51 3,489.59 9,626.56 12,375.72 21,098.80 124.25 50, 131.01 Oct 1,074.71 843.33 1,033.92 336.80 43.40 3,479.27 9,239.08 13,370.71 21,547.29 129.73 51,098.24 Nov 1,228.59 1,063.28 1,278.35 445.35 33.15 3,534.27 10,286.48 13,776.70 20,514,33 139.28 52,299.78 Dec 1,255.53 889.28 1,293.66 405.58 40.27 3,505.38 10,387.43 13,581.95 20,964.74 162.77 52,486.58
1992: Jan 621.38 307.70 809.84 476.97 15.04 2,574.46 6,054.60 11,244.17 16, 775.57 128.64 39,008.37 Feb 1,227.16 606.22 1.225.41 307.11 42.75 3, 724.52 9,367.70 11,871.32 20,822.43 186.23 49,380.86 Mar 1,222.20 1,458.93 1,340.15 397.70 54.13 4,084.37 9,853.21 13,920.36 18, 703.57 187.54 51,222.16 Apr l.386.63 1,848.04 1,215.60 390.96 42.46 3,604.27 10,743.16 14,677.99 19,241.38 179.71 53,330.21 May 1,031.62 I, 121.96 1,173.66 381.47 28.17 4,064.13 12,554.58 15,099.52 21,525.99 195.27 57,176.36 Jun 1,060.11 948.87 1,146.20 337.79 39.97 3,833.02 11,588.08 15,677.23 24,268.82 213.65 59,113.74 Jui 1,001.04 949.00 l, 119.48 . 389.79 36.54 3,756.00 11,028.29 16,373.85 25,915.72 212.12 60, 781.81 Aug 913.34 1,109.19 1,053.63 417.51 51.01 3,425.53 10,869.28 16,466.51 26,440.62 196.72 60,943.34 Sep 1,132.49 1,097.83 1,014.74 441.43 56.18 3,431.49 11,177.43 17,917.55 27,864.85 226.43 64,360.42 Oct 1,410.82 1,195.66 1,180.18 542.88 56.88 3,771.73 12,290.40 19,112.64 28,143.40 218.34 67,922.93 Nov 1,177.94 1,188.20 1,138.61 688.47 47.14 3,549.09 11,490.79 20,254.82 23,567.15 203.13 63,305.34 Dec 1,470.95 1,167.73 1,374.47 669.58 58.45 4,041.59 12, 105.20 19,008.20 24,157.81 229.80 64,283.78
Note: The Third Revision of the Standard International Trade Classification (SITC R3) has been adopted in plaoe of the Second Revision (SITC R2) for the classification of trade statistics by commodity as from January 1992. Statistics for the same period in 1991 have been recompiled in terms of SITC R3 and are presented along with the 1992 .sU!.tistics to facilitate y~r-on-year comparison.
§: SITC R2-based.
3.11 IMPORTS AND RE:--EXPORTS BY END-USE CATEGORY $million
Imports Re-exports
Raw Raw materials materials
Consumer and semi- Capital Consumer and semi- Capital Year/month Foodstuffs goods manufactures Fuels goods Foodstuffs goods manufactures Fuels goods
1987§ 26, 754.13 119,989.94 165,470.48 8,819.33 56,913.89 7,899.08 77,391.37 72,543.33 755.14 24,191.50
1988§ 32,069.93 164,387.73 216,345.32 8,813.00 77.181.96 11,328.74 116,999.70 108,200.68 1,062.09 37,814.IO •
1989§ 33,969.20 201,481.99 230,454.92 12,480.96 84,394.28 11,414.17 166,091.76 119,513.40 2,765.22 46,620.91
1990§ 36,991.14 247,747.70 248,689.82 14,541.65 94,560.10 11,445.52 219,323.15 127,197.56 2,517.31 53,515.11
1991§ 41,271.24 304,668.14 297,276.09 15,301.85 120,464.63 13,200.03 288,974.02 158,043.14 3,484.41 71,139.25
1991 41,445.53 306,432.40 293,056.84 15,301.85 122, 745.33 13,223.29 290, 726.41 155,266.05 3,484.41 72,140.69
1992 45,350.80 394,542.97 329,949.81 17,653.23 167,798.17 14,356.85 376,843.98 187,303.19 4,274.05 108,051.36
1990: Dec§ 3,856.51 23,120.08 22,253.25 1,472.90 8,659.31 1,084.47 19,834.87 10,806.90 112.30 4,922.39
1991: Jan 3,393.81 23,698.79 22,083.15 1,880,12 9,604.84 1,065.19 20,893.08 11,641.70 222.27 5,198.29 Feb 2,401.10 17,686.57 15,956.70 l,477.42 7,486.88 798.05 18,282.06 7,888.14 196.59 4,296.72 Mar 3,625.72 20,573.99 22,661.75 l,570.32 8,573.74 1,170.05 16,616.47 11,043.73 256.68 4,778.32 Apr 3,505.55 25,265.67 25,421.81 874.07 10,749.89 1.240.25 21.334.68 12,995.33 233.72 5,709.44 May 3,490.39 25,467.64 27,017.14 1,223.22 9,939.25 1,141.93 23,274.02 14,044.70 322.24 6, 141.48 Jun 3,140.88 24,233.56 25,400.56 l,143.69 9,672.98 972.27 22,862.80 12,819.88 301.42 5,358.79 Jui 3,396.96 27,059.73 26,517.00 I ,271.83 10,836.68 1,029.98 26,251.78 14, 745.51 404.99 6,072.71 Aug 3,429.68 26,542.04 24,546.75 1.356.65 10,879.98 991.53 26,833.94 12,843.74 342.12 6,193.78 Sep 3,458.45 26,957.01 25,125.90 1,397.43 10,013.95 1,069.64 28,321.89 13,967.42 281.23 6,193.78 Oct 3,707.50 29,027.26 24,785.90 1,020.29 10,740.71 1,130.36 29,169.29 13,590.03 254.45 6,954.11 Nov 3,733.24 28,578.69 26,154.64 1,148.53 11,100.20 1,279.03 28,467.25 14,683.26 350.88 7,519.37 Dec 4,162.06 31,341.45 27,385.74 938.28 13,146.24 1,335.03 28,419.16 14,987.71 317.82 7,426.86
1992: Jan 2,754.76 25,230.20 17,140.31 1,246.26 9,537.33 645.72 22,797.41 8,981.93 396.96 6,186.34 Feb 3,784.86 27,963.83 24,593.55 1.084.07 10, 748.36 1,304.06 27,097.84 14,030.14 232.62 6,716.20 Mar 3,356.66 30,012.10 27,208.58 1,033.66 12,261.65 1,330.34 26,527.02 15,279.05 300.24 7,785.51 Apr 4,768.58 29,908.06 29,755.80 763.72 13,354.52 1,399.48 27,538.75 15,775.56 304.56 8,311.85 May 3,561.14 31,073.97 31,272.90 2,373.53 13,236.87 1,071.01 29,629.86 17,771.86 277.30 8,426.33 Jun 3,806.63 33,328.67 29,904.68 1,954.60 15,626.65 l,122.18 31,950.89 16,667.59 248.52 9, 124.57 Jui 3,718.41 34,766.71 29,005.99 1,542.91 15,931.81 1,062.37 33,562.90 15,991.46 289.80 9,875.28 Aug 3,160.98 34,027.61 26,104.15 1,245.02 14,833.10 972.34 35,012.27 15,237.15 338.03 9,383.55
~ 3,576.46 36,234.87 27,467.97 1,313.35 14,359.74 1,158.42 37,417.76 15,728.69 346.23 9, 709.31 4,186.01 38,731.26 29,394.40 1,837.53 15,871.37 1,465.18 38,889.77 17,108.84 429.38 10,029.75
Nov 4,025.99 35,882.72 28,488.87 l,299.74 15,410.15 .1,260.76 33,103.11 16,905.85 560.21 11,475.41 Dec 4,650.32 37,382.98 29,612.47 1,959.04 16,627.06 1,564.98 33,316.39 17,824.99 550.17 11,027.25
Note: Trade statistics analysed by end-use ue obtained by re-grouping trade statistics analysed by commodity into five end-use categories. As from January 1992. the Third Revision of the Standard International Trade Classification (SITC R3) has been adopted in place of the Second Revision (SITC R2) for the classification of trade statistics by commodity. Statistics for the same period in 1991 have been recompiled in terms of the new end-use categorization (based on SITC R3) and are presented along with the 1992 statistics to facilitate year-on-year comparison.
§: SITC R2-based.
24 Hdng Kong Monthly Digest of Statistics January 1993
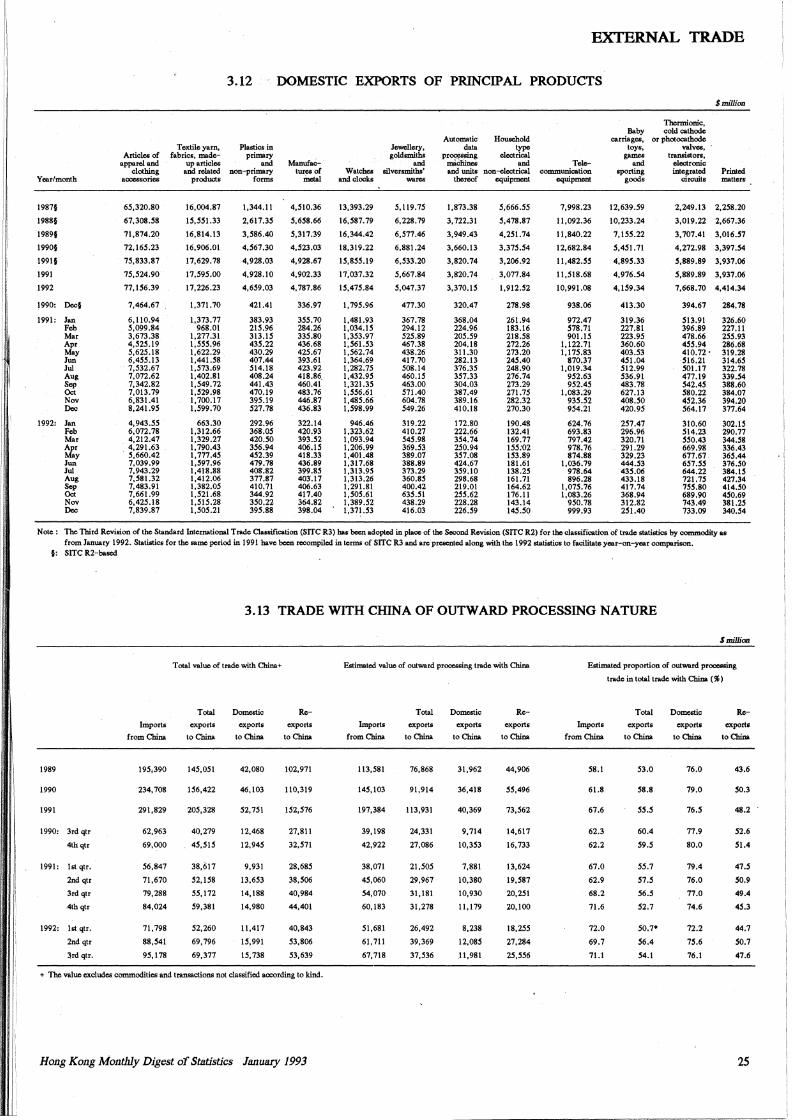
r
I
I I' I I'
EXTERNAL TRADE
3.12 DOMESTIC EXPORTS OF PRINCIPAL PRODUCTS
Year/month
1987§
1988§
1989§
1990§
1991§
1991
1992
1990: Dec§
1991: Jan Feb Mar Apr May Jun Jui Aug Sep Oct Nov Dec
1992: Jan Feb Mar Apr May Jun Jui Aug Sep Oct Nov Dec
Articles of apparel and
clothing accessories
65,320.80
67,308.58
71,874.20
72,165.23
75,833.87
75,524.90
77,156.39
7,464.67
6,110.94 5,099.84 3,673.38 4,525.19 5,625.18 6,455.13 7,532.67 7,072.62 7,342.82 7,013.79 6,831.41 8,241.95
4,943.55 6,072.78 4,212.47 4,291.63 5,660.42 7,039.99 7,943.29 7,581.32 7,483.91 7,661.99 6,425.18 7,839.87
Textile yam, faPrics, made
up articles and related
products
16,004.87
15,551.33
16,814.13
16,906.01
17,629.78
17,595.00
17,226.23
1,371.70
1,373.77 968.01
1,277.31 1,555.96 1,622.29 1,441.58 1,573.69 1,402.81 1,549.72 1,529.98 1,700.17 1,599.70
663.30 1,312.66 1,329.27 1,790.43 1,777.45 1,597.96 1,418.88 1,412.06 1,382.05 1,521.68 1,515.28 1,505.21
Plastics in primary
and non-primary
forms
1,344.11
2,617.35
3,586.40
4,567.30
4,928.03
4,928.10
4,659.03
421.41
383.93 215.96 313.15 435.22 430.29 407.44 514.18 408.24 441.43 470.19 395.19 527.78
292.96 368.05 420.50 356.94 452.39 479.78 408.82 377.87 410.71 344.92 350.22 395.88
Manufactures of
inctal
4,510.36
5,658.66
5,317.39
4,523.03
4,928.67
4,902.33
4,787.86
336.97
355.70 284.26 335.80 436.68 425.67 393.61 423.92 418.86. 460.41 483.76 446.87 436.83
322.14 420.93 393.52 406.15 418.33 436.89 399.85 403".17 406.63 417.40 364.82 398.04
Watches and clocks
13,393.29
16,587.79
16,344.42
18,319.22
15,855.19
17,037.32
15,475.84
1,795.96
1,481.93 1,034.15 1,353.97 1,561.53 l,562.74 l,364.69 1,282.75 1,432.95 1,321.35 1,556.61 1,485.66 1,598.99
946.46 1,323.62 1,093.94 1.206.99 1,401.48 1,317.68 1,313.95 1,313.26 1,291.81 1,505.61 1,389.52 1,371.53
Jewellery, goldsmiths
and silversmiths'
wares
5,119.15
6,228.79
6,577.46
6,881.24
6,533.20
5,667.84
5,047.37
477.30
367.78 294.12 525.89 467.38 438.26 417.70 508.14 460.15 463.00 571.40 604.78 549.26
319.22 410.27 545.98 369.53 389.07 388.89 373.29 360.85 400.42 635.51 438.29 416.03
Automatic data
pr~sing machines and units
thereof
1,873.38
3, 722.31
3,949.43
3,660.13
3,820.74
3,820.74
3,370.15
320.47
368.04 224.96 205.59 204.18 311.30 282.13 376.35 357.33 304.03 387.49 389.16 410.18
172.80 222.66 354.74 250.94 357.08 424.67 359.10 298.68 219.01 255.62 228.28 226.59
Household type
electrical and
non-electrical equipment
5,666.55
5,478.87
4,251.74
3,375.54
3,206.92
3,077.84
1,912.52
278.98
261.94 183.16 218.58 272.26 273.20 245.40 248.90 276.74 273.29 271.75 282.32 270.30
190.48 132.41 169.77 155:02 153.89 181.61 138.25 161.71 164.62 176.11 143.14 145.50
Telecommunication
equipment
7,998.23
11,092.36
11,840.22
12,682.84
11,482.55
11,518.68
10,991.08
938.06
972.47 578.71 901.15
1,122.71 1,175.83
870.37 1,019.34
952.63 952.45
1,083.29 935.52 954.21
624.76 693.83 797.42 978.76 874.88
1,036.79 978.64 896.28
1,075.76 l,083.26
950.78 999.93
Baby carriages,
toys, games
and sporting
goods
12,639.59
10,233.24
7,155.22
5,451. 71
4,895.33
4,916.54
4,159.34
413.30
319.36 227.81 223.95 360.60 403.53 451.04 512.99 536.91 483.78 627.13 408.50 420.95
257.47 296.96 320.71 291.29 329.23 444.53 435.06 433.18 417.74 368.94 312.82 251.40
Thermionic, cold cathode
or photocathode valves,
transistors, electronic integrated
circuits
$million
Printed matters
2,249.13 2,258.20
3,019.22 2,667.36
3, 707.41 3,016.57
4,272.98 3,397.54
5,889.89 3,937.06
5,889.89 3,937.06
7,668. 70 4,414.34
394.67 284. 78
513.91 396.89 478.66 455.94 410.72. 516.21 501.17 477.19 542.45 580.22 452.36 564.17
310.60 514.23 550.43 669.98 677.67 651.55 644.22 721.75 755.80 689.90 743.49 733.09
326.60 227.11 255.93 286.68 319.28 314.65 322.78 339.54 388.60 384.07 394.20 377.64
302.15 290.77 344.58 336.43 365.44 376.50 384.15 427.34 414.50 450.69 381.25 340.54
Note: The Third Revision of the Standard International Trade Classification (SITC R3) has been adopted in place of the Second Revision (SITC R2) for the classification of trade statistics by commodity as from January 1992. Statistics for the same period in 1991 have been recompiled in terms of SITC R3 and are presented along with the 1992 statistics to facilitate year-on-year comparison.
§: SJTC R2-based
3.13 TRADE WITH CHINA OF OUTWARD PROCESSING NATURE
1989
1990
1991
1990: 3rd qtr
4thqtr
1991: lot qtr.
2nd qtr
3rd qtr
.4thqtr
1992: lstqtr.
2nd qtr
3rd qtr.
Imports
from China
234,708
291,829
62,963
69,000
56,847
71,670
79,288
84,024
71,798
88,541
9S,178
Total value of trade with China+
Total
exports
to China
145,051
1S6,422
205,328
40,279
45,515
38,617
52,158
55,172
59,381
S2,260
69,796
69,377
Domestic
exports
to China
42,080
46,103
52,751
12,468
12,945
9,931
13,653
14,188
14,980
11,417
15,991
15,738
Re-
exports
to China
102,971
110,319
1S2,S76
27,811
32,S?l
28,68S
38,S06
40,984
44,401
40,843
53,806
S3,639
+ The value excludes commodities and transactions not classified according to kind.
Hong Kong Monthly Digest of Statistics January 1993
Estimated value of outward processing trade with China
Import•
from China
113,581
145,103
197,384
39,198
42,922
38,071
45,060
54,070
60,183
51,681
61,711
67,718
Total
exports
to China
76,868
91,914
113,931
24,331
27,086
21,505
29,967
31,181
31,278
26,492
39,369
37,536
Domestic
exports
to China
31,962
36,418
40,369
9,714
10,353
7,881
10,380
10,930
11,179
8,238
12,085
11,981
Re-
exports
to China
44,906
55,496
73,S62
14,617
16,733
13,624
19,587
20,251
20,100
18,255
27,284
25,556
$ mil/ioa
Estimated proportion of outward processing
trade in total trade with China ( % )
Imports
from China
58.1
61.8
67.6
62.3
62.2
67.0
62.9
68.2
71.6
72.0
69.7
71.1
Total
exports
to China
53.0
58.8
55.5
60.4
59.5
SS.?
57.5
56.S
52.7
50.1•
S6.4
54.1
Domestic
exports
to China
76.0
79.0
16.5
77.9
80.0
79.4
76.0
77.0
74.6
72.2
15.6
76.1
Re
exports
to China
43.6
50.3
48.2
52.6
51.4
41.S
S0.9
49.4
4S.3
44.7
SO.?
47.6
25
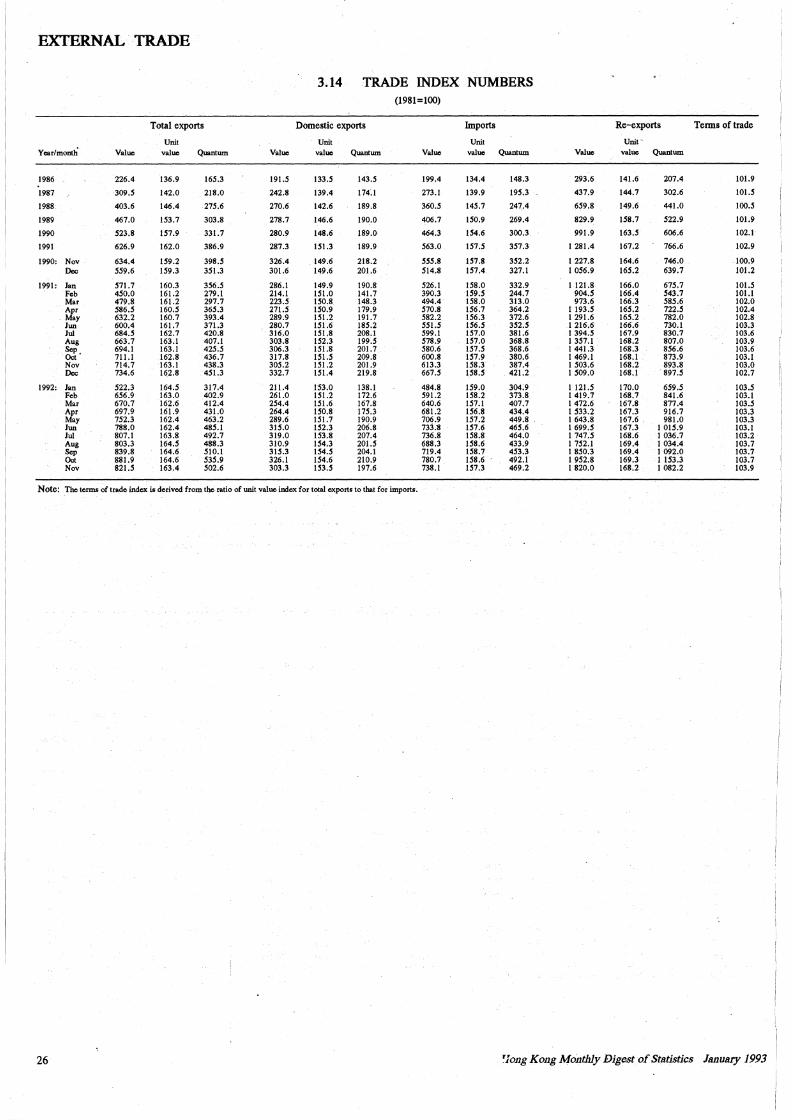
---·-
EXTERNAL TRADE
3.14 TRADE INDEX NUMBERS (1981=100)
Total exports Domestic exports Imports Re-exports Terms of trade
Unit Unit Unit Unit' Year/month Value value Quantum Value value Quantum Value value Quantum Value value Quantum
1986 226.4 136.9 165.3 191.5 133.5 143.5 199.4 134.4 148.3 293.6 141.6 207.4 101.9
1987 309.5 142.0 218.0 242.8 139.4 174.1 273.1 139.9 195.3 437.9 144.7 302.6 101.S
1988 403.6 146.4 275.6 270.6 142.6 189.8 360.5 145.7 247.4 659.8 149.6 441.0 100.5
1989 467.0 153.7 303.8 278.7 146.6 190.0 406.7 150.9 269.4 829.9 158.7 522.9 101.9
1990 523.8 157.9 331.7 280.9 148.6 189.0 464.3 154.6 300.3 991.9 163.5 606.6 102.1
1991 626.9 162.0 386.9 287.3 151.3 189.9 563.0 157.5 357.3 1 281.4 167.2 766.6 102.9
1990: Nov 634.4 159.2 398.5 326.4 149.6 218.2 555.8 157.8 352.2 I 227.8 164.6 746.0 100.9 Dec 559.6 159.3 351.3 301.6 149.6 201.6 514.8 157.4 327.1 1 056.9 165.2 639.7 101.2
1991: Jan 571.7 160.3 356.S 286.1 149.9 190.8 526.1 158.0 332.9 1 121.8 166.0 615.7 101.S Feb 450.0 161.2 279.1 214.1 151.0 141.7 390.3 159.5 244.7 904.5 166.4 543.7 101.1 Mar 479.8 161.2 297.7 223.5 150.8 148.3 494.4 158.0 313.0 973.6 166.3 585.6 102.0 Apr 586.5 160.5 365.3 271.S 150.9 179.9 570.8 156.7 364.2 I 193.5 165.2 722.5 102.4 May 632.2 160.7 393.4 289.9 151.2 191.7 582.2 156.3 372.6 I 291.6 165.2 782.0 102.8 Jun 600.4 161.7 371.3 280.7 151.6 185.2 551.5 156.5 352.5 I 216.6 166.6 730.l 103.3 Jui 684.5 162.7 420.8 316.0 151.8 208.1 599.l 157.0 381.6 I 394.5 167.9 830.7 103.6 Aug 663.7 163.l 407.1 303.8 152.3 199.5 578.9 157.0 368.8 I 357.1 168.2 807.0 103.9
~- 694.l 163.l 425.5 306.3 151.8 201.7 580.6 157.5 368.6 1 441.3 168.3 856.6 103.6 711.1 162.8 436.7 317.8 151.S 209.8 600.8 157.9 380.6 I 469.1 168.1 873.9 103.1
Nov 714.7 163.1 438.3 305.2 151.2 201.9 613.3 158.3 387.4 I 503.6 168.2 893.8 103.0 Dec 734.6 162.8 451.3 332.7 151.4 219.8 667.5 158.5 421.2 1509.0 168.1 897.5 102.7
1992: Jan 522.3 164.5 317.4 211.4 153.0 138.1 484.8 159.0 304;9 I 121.5 170.0 659.5 103.5 Feb 656.9 163.0 402.9 261.0 151.2 172.6 591.2 158.2 373.8 I 419.7 168.7 841.6 103.1 Mar 670.7 162.6 412.4 254.4 151.6 167.8 640.6 157.1 407.7 1472.6 167.8 877.4 103.5 Apr 697.9 161.9 431.0 264.4 150.8 175.3 681.2 156.8 434.4 1 533.2 167.3 916.7 103.3 May 752.3 162.4 463.2 289.6 151.7 190.9 706.9 157.2 449.8 I 643.8 167.6 981.0 103.3 Jun 788.0 162.4 485.1 315.0 152.3 206.8 733:8 157.6 465.6 1 699.5 167.3 I 015.9 103.1 Jui 807.1 163.8 492.7 319.0 153.8 207.4 736.8 158.8 464.0 I 747.5 168.6 I 036.7 103.2 Aug 803.3 164.5 488.3 310.9 154.3 201.5 688.3 158.6 433.9 I 752.1 169.4 I 034.4 103.7 Sep 839.8 164.6 510.1 315.3 154.5 204.1 719.4 158.7 453.3 I 850.3 169.4 I 092.0 103.7 Oct 881.9 164.6 535.9 326.1 154.6 210.9 780.7 158.6 492.1 I 952.8 169.3 I 153.3 103.7 Nov 821.5 163.4 502.6 303.3 153.5 197.6 738.1 157.3 469.2 1820.0 168.2 I 082.2 103.9
Note: The terms of trade index is derived from thC ratio of unit value index for total exports to that for imports.
26 'Jong Kong Monthly Digest of Statistics January 1993
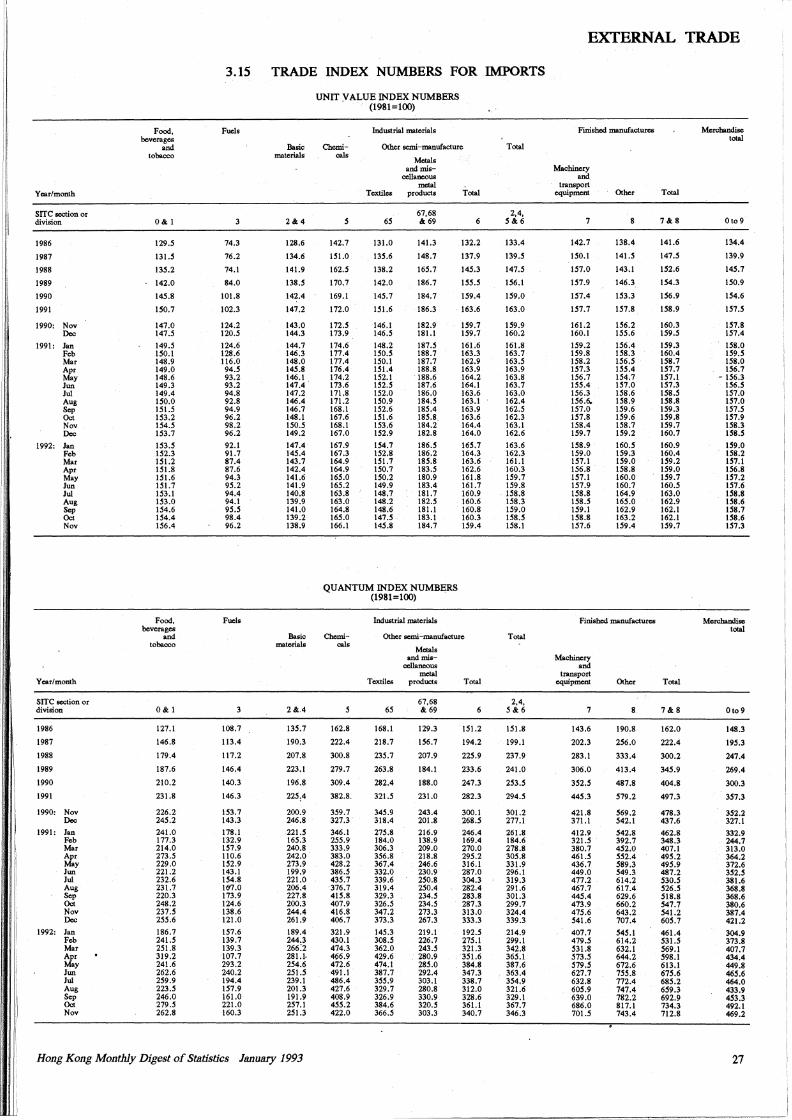
I
I
I
I:
I
11
3.15 TRADE INDEX NUMBERS FOR IMPORTS
Year/month
SITC section or division
1986
1987
1988
1989
1990
1991
1990: Nov Dec
1991: Jan Feb Mar Apr May Jun Jui Aug Sep Oct Nov Dec
1992: Jan Feb Mar Apr May Jun Jui Aug Sep Oct Nov
Year/month
SITC section or division
1986
1987
1988
1989
1990
1991
1990: Nov Dec
1991: Jan Feb Mar Apr May Jun Jui Aug Sep Oct Nov Dec
1992: Jan Feb Mar Apr May Jun Jui Aug Sep Oct Nov
Food, beverages
and tobacco
O&l
129.5
131.5
135.2
142.0
145.8
150.7
147.0 147.5
149.5 150.1 148.9 149.0 148.6 149.3 149.4 150.0 151.5 153.2 154.5 153.7
153.5 152.3 151.2 151.8 151.6 151.7 153.1 153.0 154.6 154.4 156.4
Food, beverages
and tobacco
O&l
127.1
146.8
179.4
187.6
210.2
231.8
226.2 245.2
241.0 177.3 214.0 273.5 229.0 221.2 232.6 231.7 220.3 248.2 237.5 255.6
186.7 241.5 251.8 319.2 241.6 262.6 259.9 223.5 246.0 279.5 262.8
Fuels
74.3
76.2
74.1
84.0
101.8
102.3
124.2 120.5
124.6 128.6 116.0 94.5 93.2 93.2 94.8 92.8 94.9 96.2 98.2 96.2
92.l 91.7 87.4 87.6 94.3 95.2 94.4 94.l 95.5 98.4 96.2
Fuels
108.7
113.4
117.2
146.4
140.3
146.3
153.7 143.3
178.l 132.9 157.9 110.6 152.9 143.1 154.8 1117.0 173.9 124.6 138.6 121.0
157.6 139.7 139.3 107.7 293.2 240.2 194.4 157.9 161.0 221.0 160.3
Basic materials
2&4
128.6
134.6
141.9
138.5
142.4
147.2
143.0 144.3
144.7 146.3 148.0 145.8 146.1 147.4 147.2 146.4 146.7 148.1 150.5 149.2
147.4 145.4 143.7 142.4 141.6 141.9 140.8 139.9 141.0 139.2 138.9
Basic materials
2&.4
135.7
190.3
207.8
223.1
196.8
225.4
200.9 246.8
221.5 165.3 240.8 242.0 273.9 199.9 221.0 206.4 227.8 200.3 244.4 261.9
189.4 244.3 266:2 281.1-254.6 251.5 239.1 201.3 191.9 257.1 251.3
Hong Ko11g Monthly Digest of Statistics January 1993
UNIT VALUE INDEX NUMBERS . (1981=100)
Chemicals
142.7
151.0
162.S
170.7
169.1
172.0
172.5 173.9
174.6 177.4 177.4 176.4 174.2 173.6 171.8 171.2 168.1 167.6 168.1 167.0
167.9 167.3 164.9 164.9 165.0 165.2 163.8 163.0 164.8 165.0 166.1
Industrial materials
Other semi-manufacture
Metals and mis
cellaneous metal
Textiles products Total
65
131.0
135.6
138.2
142.0
145.7
151.6
146.1 146.5
148.2 150.5 150.1 151.4 152.1 152.5 152.0 150.9 152.6 151.6 153.6 152.9
154.7 152.8 151.7 150.7 150.2 149.9 148.7 148.2 148.6 147.5 145.8
67,68 & 69
141.3
148.7
165.7
186.7
184.7
186.3
182.9 181.1
187.5 188.7 187.7 188.8 188.6 187.6 186.0 184.5 185.4 185.8. 184.2 182.8
186.5 186.2 185.8 183.5 180.9 183.4 181.7 182.5 181.1 183.1 184.7
132.2
137.9
145.3
155.5
159.4
163.6
159.7 159.7
161.6 163.3 162.9 163.9 164.2 164.l 163.6 163.l 163.9 163.6 164.4 164.0
165.7 164.3 163.6 162.6 161.8 161.7 160.9 160.6 160.8 160.3 159.4
QUANTUM INDEX NUMBERS (1981=100)
Chemicals
162.8
222.4
300.8
279.7
309.4
382.8.
359.7 327.3
346.1 255.9 333.9 383.0 428.2 386.5 435.7 376.7 415.8 407.9 416.8 406.7
321.9 430.1 474.3 466.9 472.6 491.1 486.4 427.6 408.9 455.2 422.0
Industrial materials
Other semi-manufacture
Metals and.mis
cellaneous metal
Textiles products Total
65
168.1
218.7
235.7
263.8
282.4
321.5
345.9 318.4
275.8 184.0 306.3 356.8 367.4 332.0 339.6 319.4 329.3 326.5 347.2 373.3
145.3 308.5 362.0 429.6 474.l 387.7 355.9 329.7 326.9 384.6 366.5
67,68 & 69
129.3
156.7
207.9
184.1
188.0
231.0
243.4 201.8
216.9 138.9 209.0 218.8 246.6 230.9 250.8 250.4 234.5 234.5 273.3 267.3
219.1 226.7 243.5 280.9 285.0 292.4 303.1 280.8 330.9 320.5 303.3
6
151.2
194.2
225.9
233.6
247.3
282.3
300.1 268.5
246.4 169.4 270.0 295.2 316.1 287.0 304.3 282.4 283.8 287.3 313.0 333.3
192.5 275.1 321.3 351.6 384.8 347.3 338.7 312.0 328.6 361.1 340.7
Total
2,4, 5&6
133.4
139.5
147.5
156.1
159.0
163.0
159.9 160.2
161.8 163.7 163.5 163.9 163.8 163.7 163.0 162.4 162.5 162.3 163.1 162.6
163.6 162.3 161.1 160.3 159.7 159.8
. 158.8 158.3 159.0 158.5 158.1
Total
2,4, 5&6
151.8
199.1
237.9
241.0
253.5
294.5
301.2 277.1
261.8 184.6 278.8 305.8 331.9 296.1 319.3 291.6 301.3 299.7 324.4 339.3
214.9 299.1 342.8 365.1 387.6 363.4 354.9 321.6 329.1 367.7 346.3
EXTERNAL TRADE
Finished manufactures
Machinery and
transport equipment Other
7
142.7
150.1
157.0
157.9
157.4
157.7
161.2 160.1
159.2 159.8 158.2 157.3 156.7 155.4 156.3 156.6. 157.0 157.8 158.4 159.7
158.9 159.0 157.1 156.8 157.1 157.9 158.8 158.5 159.1 158.8 157.6
138.4
141.5
143.1
146.3
153.3
157.8
156.2 155.6
156.4 158.3 156.5 155.4 154.7 157.0 158.6 158.9 159.6 159.6 158.7 159.2
160.5 159.3 159.0 158.8 160.0 160.7 164.9 165.0 162.9 163.2 159.4
Finished manufactures
Machinery and
transport equipment Other
7
143.6
202.3
283.1
306.0
352.5
445.3
421.8 371.1
412.9 321.5 380.7 461.5 436.7 449.0 477.2 467.7 445.4 473.9 475.6 541.6
407.7 479.5 531.8 573.5 579.5 627.7 632.8 605.9 639.0 686.0 701.5
190.8
256.0
333.4
413.4
487.8
579.2
569.2 542.1
542.8 392.7 452.0 552.4 589.3 549.3 614.2 617.4 629.6 660.2 643.2 707.4
545.1 614.2 632.1 644.2 672.6 755.8 772.4 747.4 782.2 817.1 743.4
Total
7&8
141.6
147.5
152.6
154.3
156.9
158.9
160.3 159.5
159.3 160.4 158.7 157.7 157.1 157.3 158.5 158.8 159.3 159.8 159.7 160.7
160.9 160.4 159.2 159.0 159.7 160.5 163.0 162.9 162.1 162.1 159.7
Total
7&8
162.0
222.4
300.2
345.9
404.8
497.3
478.3 437.6
462.8 348.3 407.1 495.2 495.9 487.2 530.5 526.5 518.8 547.7 541.2 605.7
461.4 531.S 569.1 598.1 613.1 675.6 685.2 659.3 692.9 734.3 712.8
Merchandise total
Oto9
134.4
139.9
145.7
150.9
154.6
157.5
157.8 157.4
158.0 159.5 158.0 156.7
" 156.3 156.5 157.0 157.0 157.5 157.9 158.3 158.5
159.0 158.2 157.1 156.8 157.2 157.6 158.8 158.6 158.7 158.6 157.3
Merchandise total
Oto9
148.3
195.3
247.4
269.4
300.3
357.3
352.2 327.1
332.9 244.7 313.0 364.2 372.6 352.5 381.6 368.8 368.6 380.6 387.4 421.2
304.9 373.8 407.7 434.4 449.8 465.6 464.0 433.9 453.3 492.1 469.2
27
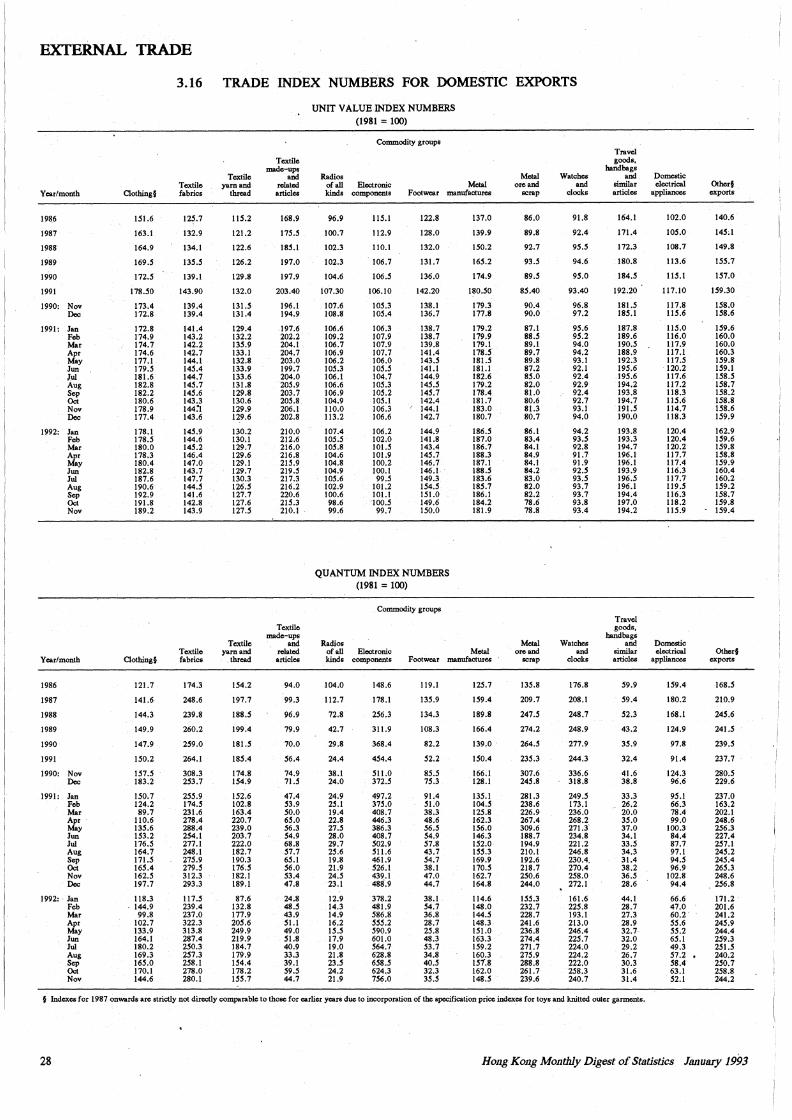
EXTERNAL TRADE
Year/month
1986
1987
1988
1989
1990
1991
1990: Nov Dec
1991: Jan Feb Mar Apr May Jun Jui Aug Sep Oct Nov Dec
1992: Jan Feb Mar Apr May Jun Jui Aug Sep Oct Nov
Year/month
1986
1987
1988
1989
1990
1991
1990: Nov Dec
1991: Jan Feb Mar Apr May Jun Jui Aug Sep Oct Nov Dec
1992: Jan Feb Mar Apr May Jun Jui Aug Sep Oct Nov
Clothing§
151.6
163.1
164.9
169.5
172.5
178.50
173.4 172.8
172.8 174.9 174.7 174.6 177.1 179.5 181.6 182.8 182.2 180.6 178.9 177.4
178.1 178.5 180.0 178.3 180.4 182.8 187.6 190.6 192.9 191.8 189.2
Clothing§
121.7
141.6
144.3
149.9
147.9
150.2
157.5 183.2
150.7 124.2 89.7
110.6 135.6 153.2 176.5 164.7 171.5 165.4 162.5 197.7
118.3 . 144.9
99.8 102.7 133.9 164.1 180.2 169.3 165.0 170.1 144.6
3.16
Textile fabrics
125.7
132.9
134.1
135.5
139.1
143.90
139.4 139.4
141.4 143.2 142.2 142.7 144.1 145.4 144.7 145.7 145.6 143.3 144:1 143.6
145.9 144.6 145.2 146.4 147.0 143.7 147.7 144.5 141.6 142.8 143.9
Textile fabrics
174.3
248.6
239.8
260.2
259.0
264.1
308.3 253.7
255.9 174.5 231.6 278.4 288.4 254.I 277.1 248.1 275.9 279.5 312.3 293.3
117.5 239.4 237.0 322.3 313.8 287.4 250.3 257.3 258.1 278.0 280.1
TRADE INDEX NUMBERS FOR DOMESTIC EXPORTS
Textile yam and
thread
115.2
121.2
122.6
126.2
129.8
132.0
131.S 131.4
129.4 132.2 135.9 133.1 132.8 133.9 133.6 131.8 129.8 130.6 129.9 129.6
130.2 130.1 129.7 129.6 129.1 129.7 130.3 126.5 127.7 127.6 127.5
Textile yam and
thread
154.2
197.7
188.5
199.4
181.5
185.4
174.8 154.9
152.6 102.8 163.4 220.7 239.0 203.7 222.0 182.7 190.3 176.5 182.1 189.1
87.6 132.8 177.9 205.6 249.9 219.9 184.7 179.9 154.4 178.2 155.7
Textile made-ups
and related articles
168.9
175.5
185.1
197.0
197.9
203.40
196.1 194.9
197.6 202.2 204.1 204.7 203.0 199.7 204.0 205.9 203.7 205.8 206.1 202.8
210.0 212.6 216.0 216.8 215.9 219.5 217.3 216.2 220.6 215.3 210.1
Textile made-ups
and related articles
94.0
99.3
96.9
79.9
70.0
56.4
74.9 71.5
47.4 53.9 50.0 65.0 56.3 54.9 68.8 57.7 65.1 56.0 53.4 47.8
24.8 48.5 43.9 51.l 49.0 51.8 40.9 33.3 39.1 59.5 44.7
UNIT VALUE INDEX NUMBERS (1981=100)
Commodity groups
Radios of all Eloctronic kinds components
Metal Footwear manufactures
96.9
100.7
102.3
102.3
104.6
107.30
107.6 108.8
106.6 109.2 106.7 106.9 106.2 105.3 106.1 106.6 106.9 104.9 110.0 113.2
107.4 105.5 105.8 104.6 104.8 104.9 105.6 102.9 100.6 98.6 99.6
115.1
112.9
110.1
106.7
106.5
106.10
105.3 105.4
106.3 107.9 107.9 107.7 106.0 105.5 104.7 105.3 105.2 105.1 106.3 106.6
106.2 102.0 101.5 101.9 100.2 100.1 99.5
101.2 101.l 100.5 99.7
122.8
128.0
132.0
131.7
136.0
142.20
138.1 136.7
138.7 138.7 139.8 141.4 143.5 141.l 144.9 145.5 145.7 142.4 144.1 142.7
144.9 141.8 143.4 145.7 146.7 146.1 149.3 154.5 151.0 149.6 150.0
QUANTUM INDEX NUMBERS (1981=100)
Commodity groups
Radios
137.0
139.9
150.2
165.2
174.9
180.50
179.3 177.8
179.2 179.9 179.l 178.5 181.5 181.l 182.6 179.2 178.4 181.7 183.0 180.7
186.5 187.0 186.7 188.3 187.1 188.5 183.6 185.7 186.1 184.2 181.9
of all Electronic kinds components
Metal Footwear manufactures
104.0
112.7
72.8
42.7
29.8
24.4
38.1 24.0
24.9 25.1 19.4 22.8 27.5 28.0 29.7 25.6 19.8 21.9 24.5 23.1
12.9 14.3 14.9 16.2 15.5 17.9 19.0 21.8 23.5 24.2 21.9
148.6
178.1
256.3
311.9
368.4
454.4
511.0 372.5
497.2 375.0 408.7 446.3 386.3 408.7 502.9 511.6 461.9 526.l 439.1 488.9
378.2 481.9 586.8 555.2 590.9 601.0 564.7 628.8 658.5 624.3 756.0
119.l
135.9
134.3
108.3
82.2
52.2
85.5 75.3
91.4 51.0 38.3 48.6 56.5 54.9 57.8 43.7 54.7 38.l 47.0 44.7
38.1 54.7 36.8 28.7 25.8 48.3 53.7 34.8 40.5 32.3 35.5
125.7
159.4
189.8
166.4
139.0
150.4
166.l 128.l
135.1 104.5 125.8 162.3 156.0 146.3 152.0 155.3 169.9 170.5 162.7 164.8
114.6 148.0 144.5 148.3 151.0 163.3 159.2 160.3 151.8 162.0 148.5
Metal ore and
scrap
86.0
89.8
92.7
93.5
89.5
85.40
90.4 90.0
87.1 88.5 89.l 89.7 89.8 87.2 85.0 82.0 81.0 80.6 81.3 80.7
86.1 83.4 84.1 84.9 84.1 84.2 83.0 82.0 82.2 78.6 78.8
Metal ore and
scrap
135.8
209.7
247.5
274.2
264.5
235.3
307.6 245.8
281.3 238.6 226.9 267.4 309.6 188.7 194.9 210.1 192.6 218.7 250.6 244.0
155.3 232.7 228.7 241.6 236.8 274.4 271.7 275.9 288.8 261.7 239.6
Watches and
clocks
91.8
92.4
95.5
94.6
95.0
93.40
96.8 97.2
95.6 95.2 94.0 94.2 93.1 92.1 92.4 92.9 92.4 92.7 93.1 94.0
94.2 93.5 92.8 91.7 91.9 92.5 93.5 93.7 93.7 93.8 93.4
Watches and
clocks
176.8
208.1
248.7
248.9
277.9
244.3
336.6 318.8
249.S 173.1 236.0 268.2 271.3 234.8 221.2 246.8 230.4. 270.4 258.0 272.1
161.6 225.8 193.1 213.0 246.4 225.7 224.0 224.2 222.0 258.3 240.7
Travel goods,
handbags and
similar articles
164.1
171.4
172.3
180.8
184.5
192.20
181.S 185.1
187.8 189.6 190.5 188.9 192.3 195.6 195.6 194.2 193.8 194.7 191.5 190.0
193.8 193.3 194.7 196.1 196.1 193.9 196.5 196.1 194.4 197.0 194.2
Travel goods,
handbags and
similar articles
59.9
59.4
52.3
43.2
35.9
32.4
41.6 38.8
33.3 26.2 20.0 35.0 37.0 34.1 33.5 34.3 31.4 38.2 36.5 28.6
44.1 28.7 27.3 28.9 32.7 32.0 29.2 26.7 30.3 31.6 31.4
Domestic electrical
appliances
102.0
105.0
108.7
113.6
115.1
117.10
117.8 115.6
115.0 116.0 117.9 117.1 117.5 120.2 117.6 117.2 118.3 115.6 114.7 118.3
120.4 120.4 120.2 117.7 117.4 116.3 117.7 119.5 116.3 118.2 115.9
Domestic electrical
appliances
159.4
180.2
168.l
124.9
97.8
91.4
124.3 96.6
95.1 66.3 78.4 99.0
100.3 84.4 87.7 97.1 94.5 96.9
102.8 94.4
66.6 47.0 60.2 55.6 55.2 65.1 49.3 57.2 • 58.4 63.1 52.1
Other§ exports
140.6
145.1
149.8
155.7
157.0
159.30
158.0 158.6
159.6 160.0 160.0 160.3 159.8 159.1 158.5 158.7 158.2 158.8 158.6 159.9
162.9 159.6 159.8 158.8 159.9 160.4 160.2 159.2 158.7 159.8 159.4
Other§ exports
168.5
210.9
245.6
241.5
239.5
237.7
280.5 229.6
237.0 163.2 202.1 248.6 256.3 227.4 257.1 245.2 245.4 265.3 248.6
. 256.8
171.2 201.6 241.2 245.9 244.4 259.3 251.S 240.2 250.7 258.8 244.2
§ Indexes for 1987 onwards are strictly not directly comparable to those for earlier years due to incorporation of the specification-price indexes for toys and knitted outer garments.
28 Hong Kong Monthly Digest of Statistics January 1993
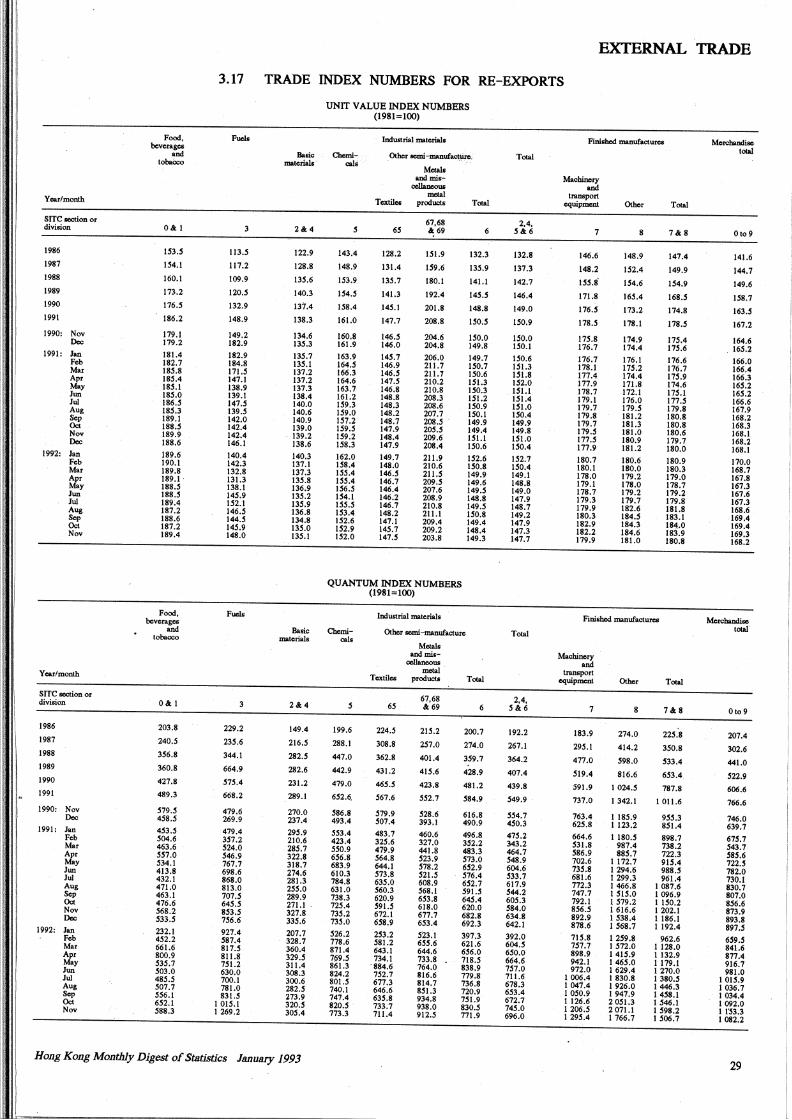
EXTERNAL TRADE
3.17 TRADE INDEX NUMBERS FOR RE-EXPORTS
Year/month
srrc oection or di viol on
1986
1987
1988
1989
1990
1991
1990: Nov Dec
1991: Jan Feb Mar Apr May Jun Jui Aug Sep Oct Nov Dec
1992: Jan Feb Mar Apr May Jun Jui Aug
~ Nov
Year/month
srrc oection or division
1986
1987
1988
1989
1990
1991
1990: Nov Dec
1991: Jan Feb Mar Apr May Jun Jui Aug
~ Nov Dec
1992: Jan Feb Mar Apr May Jun Jui Aug
~ Nov
Food, beverage&
and tobaCco
O&I
153.S
IS4.I
160.1
173.2
116.S
186.2
179.1 179.2
181.4 182.7 18S.8 185.4 18S.I 18S.O 186.S 18S.3 189.1 188.S _189.9 188.6
189.6 190.1 189.8 189.1-188.S 188.S 189~4 187.2 188.6 187.2 189.4
Food, beverages
and tobacco
O&I
203.8
240.S
3S6.8
360.8
427.8
489.3
.519.S 458.S
4S3.S .504.6 463.6 SS1.0 .534.I 413.8 432.1 471.0 463.1 476.6 .568.2 .533.S
232.1 452.2 661.6 800.9 S35.1 503.0 48S.S S01.1 556.1 652.1 S88.3
3
113.S
117.2
109.9
120.S
132.9
148.9
149.2 182.9
182.9 184.8 111.S 147.1 138.9 139.1 141.S 139.S 142.0 142.4 142.4 146.1
140.4 142.3 132.8 131.3 138.1 145.9 IS2.I 146.S 144.S 145.9 148.0
Fuels
229.2
235.6
344.1
664.9
515.4
668.2
479.6 269.9
479.4 _357.2 .524.0 S46.9 767.7 698.6 868.0 813.0 101.5 645.S 8.53.S 1S6.6
927.4 S87.4 817.S 811.8 7Sl.2 630.0 700.I 781.0 831.S
I 015.1 1269.2
Buie materials·
2&4
122.9
128.8
135.6
140.3
13'7.4
138.3
134.6 13S.3
135.1 135.1 137.2 137.2 137.3 138.4 140.0 140.6 140.9 139.0
- 139.2 138.6
140.3 137.1 137.3 135.8 136.9 135.2 135.9 136.8 134.8 135.0 135.1
Basic materials
2&4
149.4
216.5
282.S
282.6
231.2
289.1
270.0 237.4
295.9 210.6 28S.7 322.8 318.7 274.6 281.3 25S.O 289.9 271.1 -327.8 33.5.6
207.7 328.7 360.4 329.S 311.4 308.3 300.6 282.S 273.9 320.S 30S.4
Hong Kong Monthly Digest of St.atistics January 1993
UNIT VALUE INDEX NUMBERS (1981=100)
Chemicalii
s
143.4
148.9
153.9
154.S
158.4
161.0
160.8 161.9
163.9 164.5 166.3 164.6 163.7-161.2 159.3 159.0 151.2 IS9.5 159.2 158.3
162.0 IS8.4 15S.4 ISS;4 IS6.S 154.1 155.S 153.4 152.6 152.9 152.0
Industrial material•
Other scmi-manuf~
Mctall andmio
cellanoouo lllda!
Textiles produCt.s Toial
65
128.2
131.4
135.1
141.3
145.1
147.7
146.5 146.0
145.1 146.9 146.S 141.S 146.8 148.8 148.3 148.2 148.7 147.9 148.4 147.9
149.7 148.0 146.S 146.7 146.4 146.2 146.7 148.2 147.1 145.1 141.S
67,68 & 69
ISl.9
159.6
180.1
192.4
201.8
208.8
204.6 204.8
206.0 211.7 211.7 210.2 210.8 208.3 208.6 207.7 208.S 205.S 209.6 208.4
211.9 210.6 211.S 209.S 207.6 208.9 210.8 211.1 209.4 209.2 203.8
6
132.3
13S.9
141.1
14S.S
148.8
ISO.S
ISO.O 149.8
149.7 IS0.1 IS0.6 ISl.3 IS0.3 ISl.2 IS0.9 ISO.I 149.9 149.4 !SI.I 150.6
IS2.6 IS0.8 149.9 149.6 149.5 148.8 149.S IS0.8 149.4 148.4 149.3
QUANTUM INDEX NUMBERS (1981=100)
Chemicals
s
199.6
288.1
447.0
442.9
479.0
6S2.6.
S86.8 493.4
SS3.4 423.4 SS0.9 6S6.8 683.9 610.3 784.8 631.0 738.3 125.4 73S.2 73S.O
S26.2 778.6 871.4 1§9.S 861.3 824.2 801.S 740.1 747.4 820.S 773.3
Industrial materials
Other semi-manufacture
Metals and mis
cellaneous mdal -
Textiles products Total
6S
224.5
308.8
362.8
431.2
465.5
561.6
519.9 S01.4
483.7 325.6 479.9 S64.8 644.1 573.8 63S.O 560.3 620.9 S91.5 672.1 658.9
2S3.2 581.2 643.1 734.1
'884.6 152.1 677.3 646.6 635.8 733.7 711.4
67,68 &69
215.2
257.0
401.4
415.6
423.8
5_S2.1
S28.6 393.1
460.6 327.0 441.8 S23.9 S78.2 S21.5 608.9 S68.I 653.8 618.0 677.7 6S3.4
S23.I 6S.5.6 644.6 733.8 764.0 816.6" 814.7 8Sl.3 934.8 938.0 912.S
6
200.7
274.0
3S9.1
428.9
481.2
S84.9
616.8 490.9
496.8 3S2.2 483.3 573.0 6S2.9 516.4 652.1 S91.S 64S.4 620.0 682.8 692.3
397.3 621.6 656.0 718.5 838.9 779.8 736.8 720.9 151.9 830.5 771.9
Total
2,4, S&6
132.8
137.3
142.7
146.4
149.0
IS0.9
ISO.O ISO.I
IS0.6 ISl.3 ISl.8 152.0 ISl.I
- ISl.4 151.0 IS0.4 149.9 149.8 ISl.O IS0.4
152.7 150.4 149.1 148.8 149.0 147.9 148.7 149.2 147.9 147.3 147.7
Total
2,4, 5&6
192.2
267.1
364.2
407.4
439.8
S49.9
554.1 450.3
415.2 343.2 464.7 548.9 604.6 533.7 617.9 S44.2 605.3 584.0 634.8 642.1
392.0 604.5 6SO.O 664.6 1S1.0 711.6 678.3 653.4 672.7 145.0 696.0
Finilhod manufactures
Machinery and
tronsport equipment Otbcr
7
146.6
148.2
15S.8'
171.8
116.5
178.5
175.8 176.7
176.7 178.1 177.4 177.9 178.7 179.1 179.7 179.8 179.7 119.S 111.S 177.9
180.7 180.! 178.0 179.1 178.7 179.3 179.9 18P.3 182.9 182.2 179.9
8
148.9
IS2.4
154.6
165.4
173.2
178.1
174.9 174.4
176.1 11S.2 174.4 171.8 172.1 176.0 119.S 181.2 181.3 181.0 180.9 181.2
180.6 180.0 179.2 178.0 179.2 179.7 182.6 184.5 184.3 184.6 181.0
Toial
7&8
147.4
149.9
154.9
168.S
174.8
118.5
17S.4 11S.6
176.6 176.7 11S.9 174.6 l7S.1 111.S 179.8 180.8 180.8 180.6 179.7 180.0
180.9 180.3 179.0 178.7 179.2 179.8 181.8 183.1 184.0 183.9 180.8
Finiohccl manufactures
Machinery and
transport equipment Other
7
183.9
295.1
477.0
Sl9.4
591.9
737.0
763.4 625.8
664.6 S31.8 586.9 702.6 735.8 681.6 772.3 747.7 792.1 856.S 892.9 878.6
7U.8 7S7.7 898.9 942.1 972.0
I 006_.4 I 047.4 I OS0.9 1126.6 1206.S I 29S.4
8
274.0
414.2
S98.0
816.6
I 024.S
1342.1
1185.9 1123.2
1180.S 987.4 885.7
1172.7 1294.6 1299.3 1466.8 I '15.0 I S19.2 I 616.6 I S38.4 I S68.7
1259.8 1572.0 1415.9 I 46S.O I 629.4 1830.8 1926.0 1947.9 2 OSl.3 2071.J I 766.7
Total
7&8
225.8
3S0.8
533.4
653.4
787.8
I 011.6
955.3 851.4
898.7 738.2 722.3 915.4 988.5 961.4
I 087.6 I 096.9 J IS0.2 1202.1 1186.1 1192.4
962.6 1128.0 1132.9 1179.1 1270.0 1380.5 1446.3 1458.1 I S46.I I 598.2 I 506.1
Mo!cbandi ... total
Oto9
141.6
144.7
149.6
158.7
163 • .5
167.2
164.6 16S.2
166.0 166.4 166.3 165.2 16.5.2 166.6 167.9 168.2 168.3 168.1 168.2 168.1
170.0 168.7 167.8 167.3 167.6 167.3 168.6 169.4 169.4 169.3 168.2
Mo!cbandise total
Oto9
207.4
302.6
441.0
.522.9
606.6
766.6
746.0 639.7
615.1 543.7 SSS.6 722 . .5 782.0 730.1 830.7 807.0 856.6 873.9 893.8 891.5
659 • .5 841.6 877.4 916.7 981.0
I 015.9 I 036.7 I 034.4 I 092.0 I l'S3.3 I 082.2
29
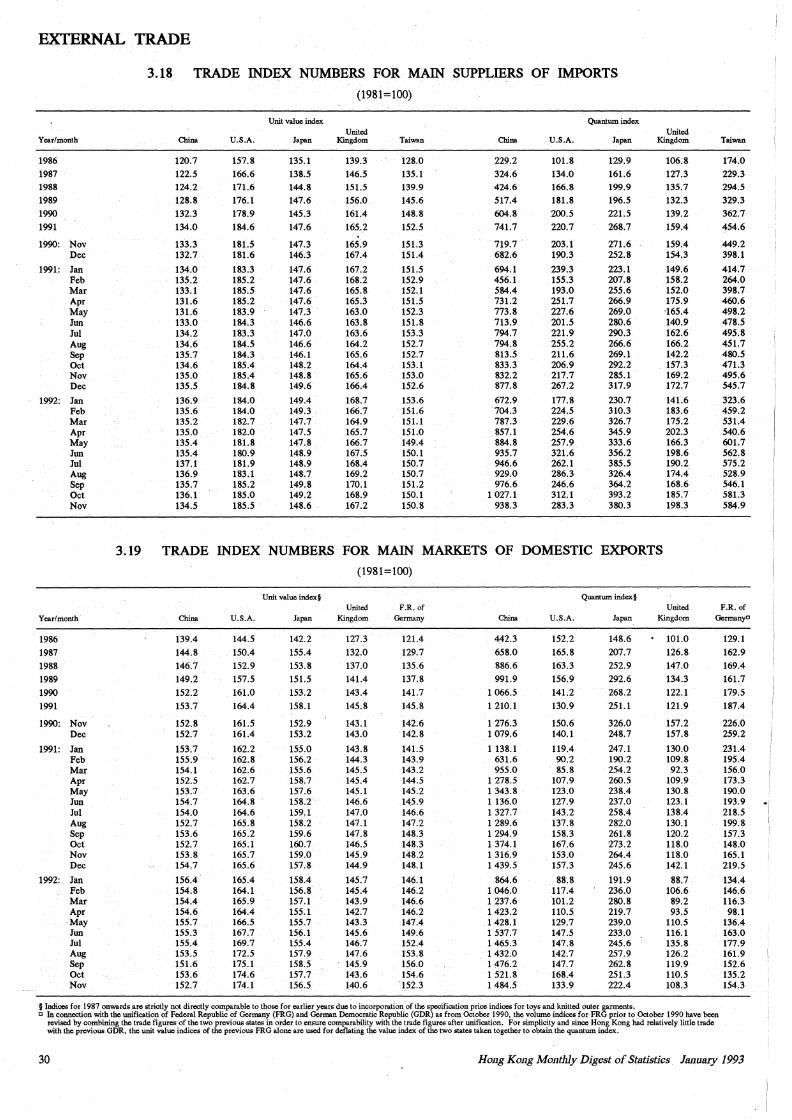
EXTERNAL TRADE
3.18 TRADE INDEX NUMBERS FOR MAIN SUPPLIERS OF IMPORTS
(1981=100)
Unit value index Quantum index
United United Year/month China U.S.A. Japon Kingdom Taiwan China U.S.A. Japon Kingdom Taiwan
1986 120.7 157.8 135.1 139.3 128.0 229.2 101.8 129.9 106.8 174.0 1987 122.5 166.6 138.5 146.5 135.1 324.6 134.0 161.6 127.3 229.3
1988 124.2 171.6 144.8 151.5 139.9 424.6 166.8 199.9 135.7 294.5 1989 128.8 176.1 147.6 156.0 145.6 517.4 181.8 196.5 132.3 329.3
1990 132.3 178.9 145.3 161.4 148.8 604.8 200.5 221.5 139.2 362.7
1991 134.0 184.6 147.6 165.2 152.5 741.7 220.7 268.7 159.4 454.6
1990: Nov 133.3 181.5 147.3 165.9 151.3 719.7 203.1 271.6 159.4 449.2 Dec 132.7 181.6 146,3 167.4 151.4 682.6 190.3 252.8 154.3 398.1
1991: Jan 134.0 183.3 147.6 167.2 151.5 694.1 239.3 223.1 149.6 414.7 Feb 135.2 185.2 147.6 168.2 152.9 456.1 155.3 207.8 158.2 264.0 Mar 133.1 185.5 147.6 165.8 152.1 584.4 193.0 255.6 152.0 398.7 Apr 131.6 185.2 147.6 165.3 151.5 731.2 251.7 266.9 175.9 460.6 May 131.6 183.9 147.3 163.0 152.3 773.8 227.6 269.0 ·165.4 498.2 Jun 133.0 184.3 146.6 163.8 151.8 713.9 201.5 280.6 140.9 478.5 Jui 134.2 183.3 147.0 163.6 153.3 794.7 221.9 290.3 162.6 495.8 Aug 134.6 184.5 146.6 164.2 152.7 794.8 255.2 266.6 166.2 451.7 Sep 135.7 184.3 146.1 165.6 152.7 813.5 211.6 269.1 142.2 480.5 Oct 134.6 185.4 148.2 164.4 153.1 833.3 206.9 292.2 157.3 471.3 Nov 135.0 185.4 148.8 165.6 153.0 832.2 217.7 285.1 169.2 495.6 Dec 135.5 184.8 149.6 166.4 152.6 877.8 267.2 317.9 172.7 545.7
1992: Jan 136.9 184.0 149.4 168.7 153.6 672.9 177.8 230.7 141.6 323.6 Feb 135.6 184.0 149.3 166.7 151.6 704.3 224.5 310.3 183.6 459.2 Mar 135.2 182.7 147.7 164.9 151.1 787.3 229.6 326.7 175.2 531.4 Apr 135.0 182.0 147.5 165.7 151.0 857.1 254.6 345.9 202.3 540.6 May 135.4 181.8 147.8 166.7 149.4 884.8 257.9 333.6 166.3 601.7 Jun 135.4 180.9 148.9 167.5 150.1 935.7 321.6 356.2 198.6 562.8 Jui 137.1 181.9 148.9 168.4 150.7 946.6 262.1 385.5 190.2 515:2 Aug 136.9 183.1 148.7 169.2 150.7 929.0 286.3 326.4 174.4 528.9 Sep 135.7 185.2 149.8 170.1 151.2 976.6 246.6 364.2 168.6 546.1 Oct 136.1 185.0 149.2 168.9 150.1 1 027.1 3.12.1 393.2 185.7 581.3 Nov 134.5 185.5 148.6 167.2 150.8 938.3 283.3 380.3 198.3 584.9
3.19 TRADE INDEX NUMBERS FOR MAIN MARKETS OF DOMESTIC EXPORTS
(1981=100)
Unit value index§ Quantum index§
United F.R. of United F.R. of
Year/month China U.S.A. Japon Kingdom Germany China U.S.A. Japan Kingdom Germanyc
1986 139.4 144.5 142.2 127.3 121.4 4;42.3 152.2 148.6 101.0 129.1
1987 144.8 150.4 155.4 132.0 129.7 658.0 165.8 207.7 126.8 162.9
1988 146.7 152.9 153.8 137.0 135.6 886.6 163.3 252.9 147.0 169.4
1989 149.2 157.5 151.5 141.4 137.8 991.9 156.9 292.6 134.3 161.7
1990 152:2 161.0 153.2 143.4 141.7 1 066.5 141.2 268.2 122.1 179.5
1991 153.7 164.4 158.1 145.8 145.8 1 210.1 130.9 251.l 121.9 187.4
1990: Nov 152.8 161.5 152.9 143.1 142.6 1 276.3 150.6 326.0 157.2 226.0 Dec 152.7 161.4 153.2 143.0 142.8 1 079.6 140.1 248.7 157.8 259.2
1991: Jan 153.7 162.2 155.0 143.8 141.5 1 138.1 119.4 247.1 130.0 231.4 Feb 155.9 162.8 156.2 144.3 143.9 631.6 90.2 190.2 109.8 195.4 Mar 154.1 162.6 155.6 145.5 143.2 955.0 85.8 254.2 92.3 156.0 Apr 152.5 162.7 158.7 145.4 144.5 1 278.5 107.9 260.5 109.9 173.3 May 153.7 163.6 157.6 145.1 145.2 1 343.8 123.0 238.4 130.8 190.0 Jun 154.7 164.8 158.2 146.6 145.9 1 136.0 127.9 237.0 123.1 193.9 ·1 Jui 154.0 164.6 159.1 147.0 146.6 1 327.7 143.2 258.4 138.4 218.5 Aug 152.7 165.8 158.2 147.1 147.2 1 289.6 137.8 282.0 130.1 199.8 Sep 153.6 165.2 159.6 147.8 148.3 1 294.9 158.3 261.8 120.2 157.3 Oct 152.7 165.1 160.7 146.5 148.3 1 374.1 167.6 273.2 118.0 148.0 Nov 153.8 165.7 159.0 145.9 148.2 1 316.9 153.0 264.4 118.0 165.1 Dec 154.7 165.6 157.8 144.9 148.1 1 439.5 157.3 245.6 142.1 219.5
1992: Jan 156.4 165.4 158.4 145.7 146.1 864.6 88.8 191.9 88.7 134.4 Feb 154.8 164.1 156.8 145.4 146.2 1 046.0 117.4 236.0 106.6 146.6 Mar 154.4 165.9 157.1 143.9 146.6 1 237.6 101.2 280.8 89.2 116.3 Apr 154.6 164.4 155.1 142.7 146.2 1 423.2 110.5 219.7 93.5 98.1
·May 155.7 166.5 155.7 143.3 147.4 1 428.1 129.7 239.0 110,5 136.4 Jun 155.3 167.7 156.1 145.6 149.6 1 537.7 147.5 233.0 116.1 163.0 Jui 155.4 169.7 155.4 146.7 152.4 1 465.3 147.8 245.6 135.8 177.9 Aug 153.5 172.5 157.9 147.6 153.8 1 432.0 142.7 257.9 126.2 161.9 Sep 151.6 175.1 158.5 145.9 156.0 1476.2 147.7 262.8 119.9 152.6 Oct 153.6 174.6 157.7 143.6 154.6 1 521.8 168.4 251.3 110.5 135.2 Nov 152.7 174.1 156.5 140.6 152.3 1 484.5 133.9 222.4 108.3 154.3
§ Indices for 1987 onwards are strictly not directly comparable to those for earlier years due to incorporation of the specification price indices for toys and knitted outer garments. c ln connection with the unification of Federal Republic of Germany (FRG) and German Democratic Republic (GDR) as from October 1990, the volume indices for FRG prior to October 1990 have been
revised by combining the trade figures of the two previous .states in order to ensure comparability with the trade figures after unification. For simplicity and since Hong Kong had relatively little trade with the previous GDR, the unit value indices of the previous FRG alone are used for deflating the value index of the two states taken together to obtain the quantum index.
30 Hong Kong Mo11tlzly Digest of Statistics January 1993
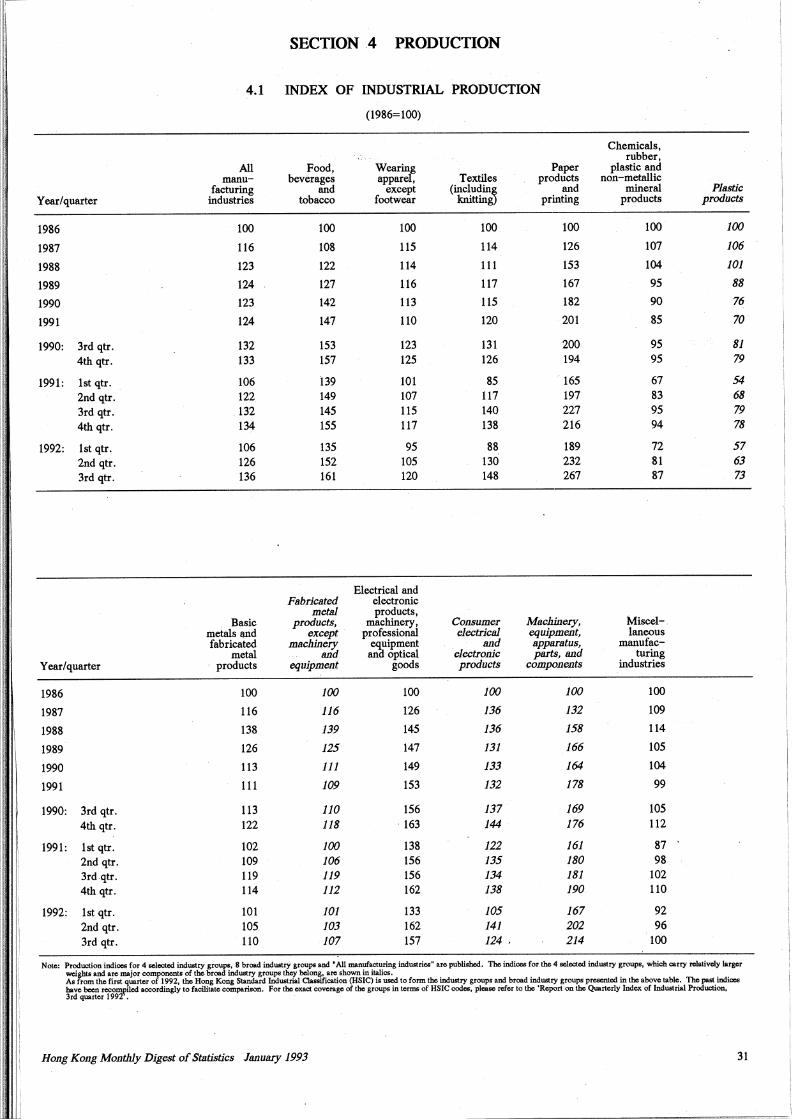
SECTION .4 PRODUCTION
4.1 INDEX OF INDUSTRIAL PRODUCTION
(1986=100)
Chemicals, ,~ rubber,
All Food, Wear~f Paper plastic and manu- beverages appare, Textiles products non-metallic
facturing and except (includin~ and mineral Plastic Year/quarter industries tobacco footwear knittin printing products products
1986 100 100 100 100 100 100 100
1987 116 108 115 114 126 107 106
1988 123 122 114 111 153 104 101
1989 124 127 116 117 167 95 88
1990 123 142 113 115 182 90 76
1991 124 147 110 120 201 85 70
1990: 3rd qtr. 132 153 123 131 200 95 81
4th qtr. 133 157 125 126 194 95 79
1991: lst qtr. 106 139 101 85 .• 165 67 54. 2nd qtr. 122 149 107 117 197 83 68 3rd qtr. . 132 145 115 140 227 95 79
4th qtr. 134 155 117 138 216 94 78
1992: lst qtr. 106 135 95 88 189 72 57
2nd qtr. 126 152 105 130 232 81 63 3rd qtr. 136 161 120 148 267 87 73
Electrical and Fabricated electronic
meW products, . Basic products, machinery, Consumer Machinery, Miscel-.
metals and except professiorial electrical equipment, laneous fabricated machinery_ equipment and apparatus, manufac-
metal and ana optical electronic parts, and turing Year/quarter · products equipmen~ goods products components industries
1986 100 100 100 100 100 100
1987 116 116 126 136 132 109
1988 138 139 145 136 158 114
1989 126 125 147 131 166 105
1990 113 111 149 133 164 104
1991 111 109 153 132 178 99
1990: 3rd qtr. 113 110 156 137 169 105
4th qtr. 122 118 163 144 176 112
1991: lst qtr. 102 100 138 122 161 87
2nd qtr. 109 106 156 135 180 98
3rd.qtr. 119 119 156 134 181 102
4th qtr. 114 112 162 138 190 110
1992: lst qtr. 101 101 133 105 167 92
2nd qtr. 105 103 162 141 202 96
3rd qtr. 110 107 157 124 . 214 100
Note: Production indiceo for 4 selected industry groups, 8 broad industry groups and •All manufacturing industries" aro published. The indices for the 4 selected industry groups, which carry relatively larger weights and aro major componmls of tho broad industry groups they belong, aro shown in italics. As from the first quarter of 1992, the Hong Kong Slandard Industrial Classification (HSIC) is used to form the industry groups and brood industry groups presented in the above table. The post Indices baV<> been reco"F'.1ed accordingly to facilitato comparison. For the oxact COV<>rage of the groups in terms of HSIC codes, please rofer to the 'Report on tho Quarterly Index of Industrial Production, 3rd quartor 199 •
Hong Kong Monthly Digest of Statistics January 1993 31
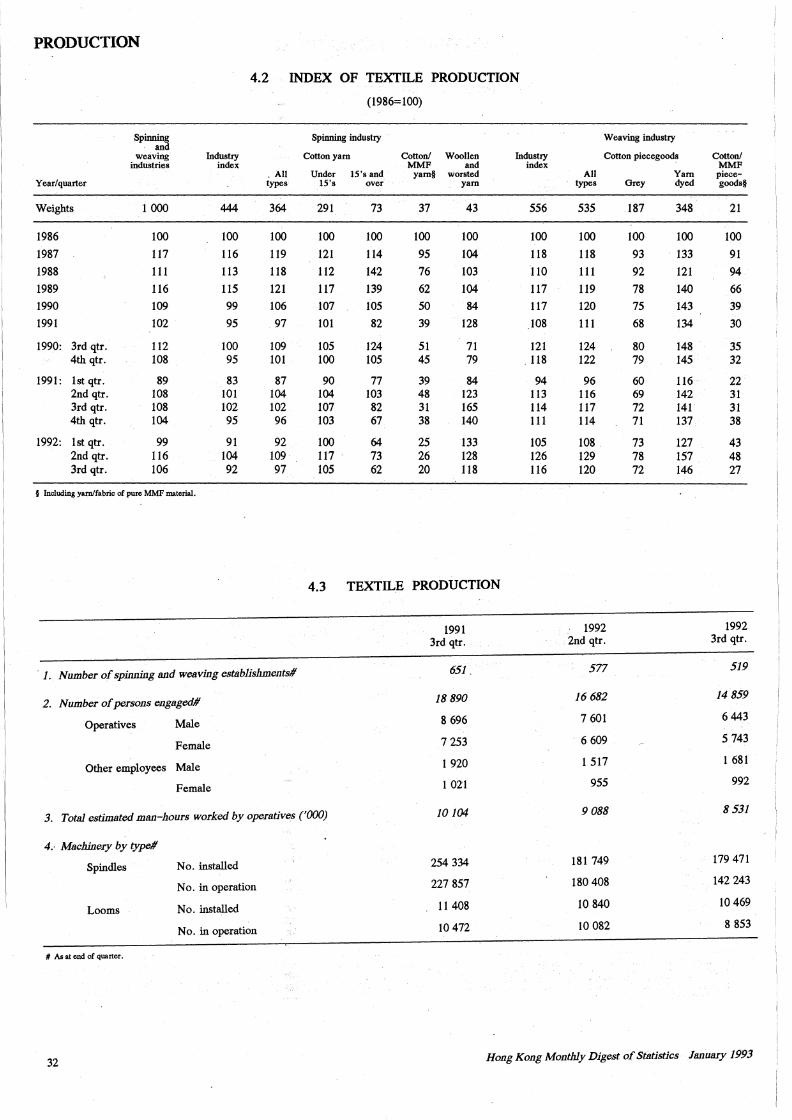
------
PRODUCTION
4.2 INDEX OF TEXTILE PRODUCTION
(1986=100)
Spinning and
Spinning industry Weaving industry
weaving htdustry Cotton yam Cotton/ Woollen htdustry Cotton piecegoods Cotton/ industries index MMF and index MMF
. All Under 15's and yam§ worsted All Yam piece-Year/ quarter types 15's over yam types Grey dyed goods§
Weights 1 OOO 444 364 291 73 37 43 556 535 187 348 21
1986 100 100 100 100 100 100 100 100 100 100 100 100
1987 117 116 119 121 114 95 104 118 118 93 133 91
1988 111 113 118 112 142 76 103 110 111 92 121 94
1989 116 115 121 117 139 62 104 117 119 78 140 66
1990 109 99 106 107 105 50 84 117 120 75 143 39
1991 102 95 97 101 82 39 128 108 111 68 134 30
1990: 3rd qtr. 112 100 109 105 124 51 71 121 124 80 148 35 4th qtr. 108 95 101 100 105 45 79 ' 118 122 79 145 32
1991: lst qtr. 89 83 87 90 77 39 84 94 96 60 116 22 2nd qtr. 108 101 104 104 103 48 123 113 116 69 142 31 3rd qtr. 108 102 102 107 82 31 165 114 117 72 141 31 4th qtr. 104 95 96 103 67 38 140 111 114 71 137 38
1992: lst qtr. 99 91 92 100 64 25 133 105 108 73 127 43 2nd qtr. 116 104 109 117 73 26 128 126 129 78 157 48 3rd qtr. 106 92 97 105 62 20 118 116 120 72 146 27
§ Including yam/fabric of pure MMF material.
4.3 TEXTILE PRODUCTION
1991 1992 1992
3rd qtr. 2nd qtr. 3rd qtr.
Number of spinning 811d weaving establishments# 651 . 577 519 1.
Number of persons engaged# 18 890 16 682 14859 2.
Operatives Male 8 696 7 601 6 443
Female 7 253 ' 6 609 5 743
Other employees Male 1 920 1 517 1 681
Female 1 021 955 992
3. Total estimated mt111-hours worked by operatives ('OOO) 10104 9088 8531
4.· Machinery by type#
Spindles No. installed 254 334 181 749 179 471
No. in operation 227 857 180 408 142 243
Looms No. installed 11 408 10 840 10 469
No. in operation 10 472 10 082 8 853
# As at end of quarter.
32 Hong Kong Monthly Digest of St.atistics l811uary 1993
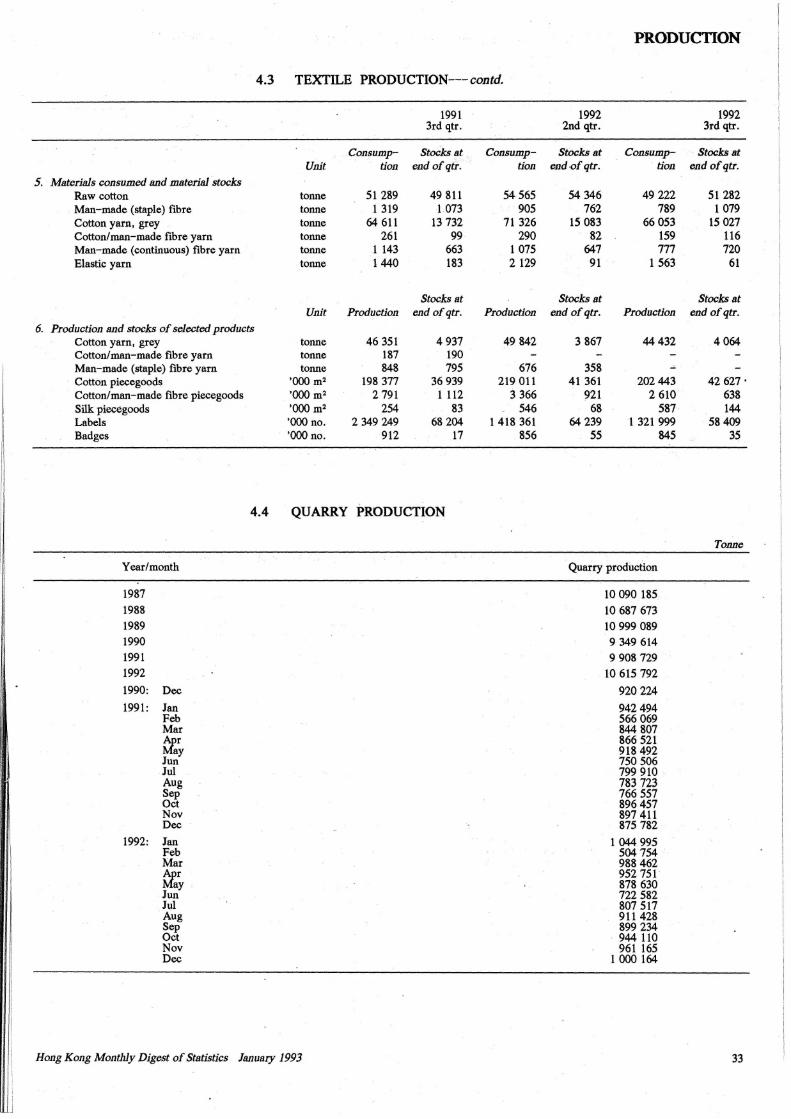
PRODUCTION
4.3 TEXTILE PRODUCTION— contd.
1991 3rd qtr.
1992 2nd qtr.
1992 3rd qtr.
Consump- Stocks at Consump- Stocks at Consump- Stocks atUnit don end o f qtr. tion end o f qtr. tion end o f qtr.
5. Materials consumed and material stocksRaw cotton tonne 51289 49 811 54 565 54 346 49 222 51 282Man-made (staple) fibre tonne 1 319 1 073 905 762 789 1079Cotton yarn, grey tonne 64 611 13 732 71 326 15 083 66 053 15 027Cotton/man-made fibre yarn tonne 261 99 290 82 159 116Man-made (continuous) fibre yarn tonne 1 143 663 1 075 647 111 720Elastic yarn tonne 1440 183 2 129 91 1 563 61
Unit ProductionStocks at
end o f qtr. ProductionStocks at
end o f qtr. ProductionStocks at
end o f qtr.6. Production and stocks o f selected products
Cotton yarn, grey tonne 46 351 4 937 49 842 3 867 44 432 4 064Cotton/man-made fibre yarn tonne 187 190 - - - -Man-made (staple) fibre yarn tonne 848 795 676 358 - -Cotton piecegoods ’000 m2 198 377 36 939 219 011 41 361 202 443 42 627 •Cotton/man-made fibre piecegoods ’000 m2 2 791 1 112 3 366 921 2 610 638Silk piecegoods ’000 m2 254 83 546 68 587 144Labels ’000 no. 2 349 249 68 204 1 418 361 64 239 1 321 999 58 409Badges ’000 no. 912 17 856 55 845 35
4.4 QUARRY PRODUCTION
Tonne
Year/month Quarry production
1987 10 090 1851988 10 687 6731989 10 999 0891990 9 349 6141991 9 908 7291992 10 615 7921990: Dec 920 2241991: Jan 942 494
Feb 566 069Mar 844 807Apr 866 521May 918 492Jun 750 506Jul 799 910Aug 783 723Sep 766 557Oct 896 457Nov 897 411Dec 875 782
1992: Jan 1 044 995Feb 504 754Mar 988 462Apr 952 751May 878 630Jun 722 582Jul 807 517Aug 911 428Sep 899 234 .Oct 944 110Nov 961 165Dec 1 000 164
Hong Kong M onthly Digest o f Statistics January 1993 33
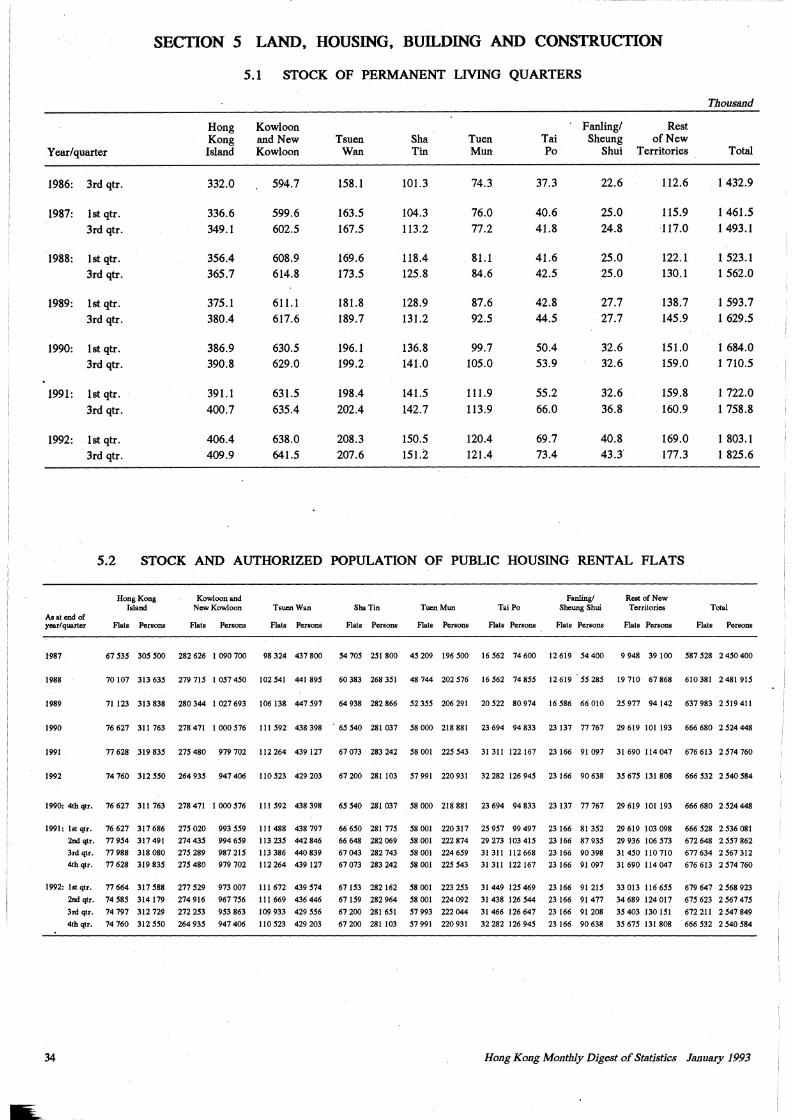
I
I
I
I
SECTION 5 LAND, HOUSING, BUILDING AND CONSTRUCTION
5.1 STOCK OF PERMANENT LIVING QUARTERS
Year/quarter
1986: 3rd qtr.
1987: lst qtr.
3rd qtr ..
1988: lst qtr. 3rd qtr.
1989: lst qtr.
3rd qtr.
1990: lst qtr. 3rd qtr.
1991: lst qtr.
3rd qtr.
1992: lst qtr.
3rd qtr.
Hong Kong Island
332.0
336.6
349.1
356.4
365.7
375.1
380.4
386.9 390.8
391.1
400.7
406.4 409.9
Kowloon and New Kowloon
594.7
599.6
602.5
608.9 614.8
611.1 617.6
630.5 629.0
631.5
635.4
638.0
641.5
Tsuen Wan
158.1
163.5
167.5
169.6 173.5
181.8
189.7
196.1
199.2
198.4
202.4
208.3 207.6
Sha Tin
101.3
104.3
113.2
118.4 125.8
128.9
131.2
136.8 141.0
141.5
142.7
150.5
151.2
Tu en Mun
74.3
76.0
77.2
81.1 84.6
87.6 92.5
99.7 105.0
111.9
113.9
120.4 121.4
Tai Po
37.3
40.6
41.8
41.6 42.5
42.8
44.5
50.4 53.9
55.2
66.0
69.7 73.4
Fanling/ Sheung
Shui
22.6
25.0
24.8
25.0 25.0
27.7
27.7
32.6
32.6
32.6
36.8
40.8 43.3
Rest of New
Territories
112.6
115.9
117.0
122.1
130.1
138.7 145.9
151.0 159.0
159.8
160.9
169.0 177.3
Thousand
Total
1 432.9
1 461.5
1 493.1
1 523.1 1 562.0
1 593.7 1 629.5
1 684.0 1 710.5
1 722.0
1 758.8
1 803.1 1 825.6
5.2 STOCK AND AUTHORIZED POPULATION OF PUBLIC HOUSING RENTAL FLATS
As at end of year/ quarter
Hong Kong Island
Flats Persons
Kowloon and New Kowloon
Flats Persons
Tsucn Wan
Flats Persons
Sha Tin TucnMun Tai Po
Flats Persons Flats Persons Flats Persons
Fanling/ Sheung Shui
Flats Persons
Rest of New Territories
Flats Persons
Total
Flats Persons
1987 67 535 305 500 282 626 I 090 700 98 324 437 800 54 105 251 800 45 209 196 500 16 562 74 600 12 619 54 400 9 948 39 100 587 528 2 450 400
1988 70 107 313 635 279 715 I 057 450 102 541 441 895 60 383 268 351 48 744 202 576 16 562 74 855 12 619 55 285 19 710 67 868 610 381 2 481 915
1989 71 123 313 838 280 344 I 027 693 106 138 447 597 64 938 282 866 52 355 206 291 20 522 80 974 16 586 66 010 25977 94 142 637 983 2 519 411
1990 76627 311763 278471 1000576 111592 438398 . 65540 281037 58000 218881 23694 94833 23137 77767 29619 101193 666680 2524448
1991 77 628 319 835 215 480 979 702 112 264 439 127 67 073 283 242 58 001 225 543 31 311 122 167 23 166 91 097 31 690 114 047 676 613 2 574 760
1992 74 760 312 550 264 935 947 406 110 523 429 203 67 200 281 103 57 991 220 931 32 282 126 945 23 166 90 638 35675 131 808 666 532 2 540 584
1990: 4thqtr. 76627 311763 278471 1000576 111592 438398 65540 281037 58000 218881 23694 94833 23137 77767 29619 101193 666680 2524448
1991: lstqtr. 76627 317686 275020 993559 111488 438797 66650 281775 58001 220317 25957 99497 23166 81352 29619 103098 666528 2536081
2nd qtr. 77 954 317 491 274 435 994 659 113 235 442 846 66 648 282 069 58 001 222 874 29 273 103 415 23 166 87 935 29 936 106 573 672 648 2 557 862
3rd qtr. 77 988 318 080 275 289 987 215 113 386 440 839 67 043 282 743 58 001 224 659 31 311 112 668 23 166 90 398 31 450 110 710 677 634 2 567 312
4th qtr. 77 628 319 835 215 480 979 702 112 264 439 127 67 073 283 242 58 001 225 543 31 311 122 167 23 166 91 097 31 690 114 047 676 613 2 574 760
1992: lst qtr. 77 664 317 588 277 529 973 007 111 672 439 514 67 153 282 162 58 001 223 253 31 449 125 469 23 166 91 215 33 013 116 655 679 647 2 568 923
2nd qtr. 74 585 314 179 274 916 967 756 111 669 436 446 67 159 282 964 58 001 224 092 31 438 126 544 23 166 91 477 34 689 124 017 675 623 2 567 475
3rd qtr. 74 797 312 729 272 253 953 863 109 933 429 556 67 200 281 651 57 993 222 044 31 466 126 647 23 166 91 208 35 403 130 151 672 211 2 547 849
4th qtr. 74 760 312 550 264 935 947 406 110 523 429 203 67200 281103 57991 220931 32282 126945 23166 90638 35675 131808 666532 2540584
34 Hong Kong Monthly Digest of Statistics January 1993
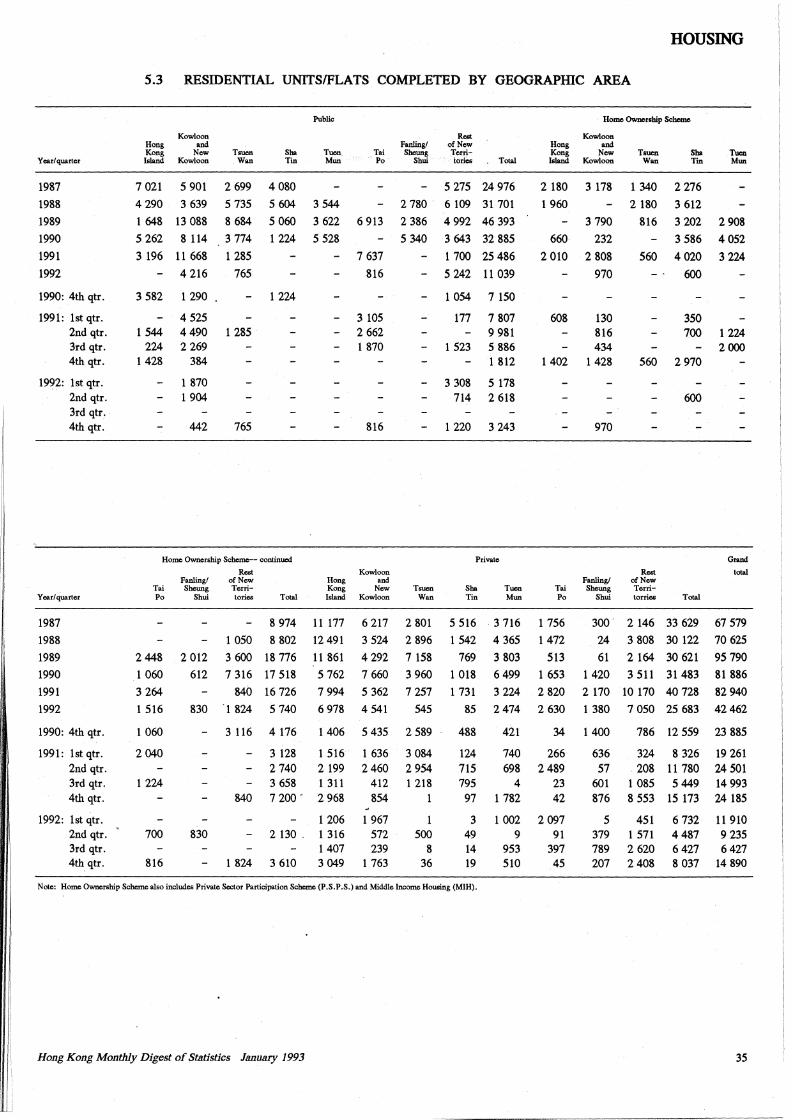
I
I
I
Yau/ quarter
1987
1988
1989
1990
1991
1992
1990: 4th qtr.
1991: lstqtr. 2nd qtr. 3rd qtr. 4th qtr.
1992: lst qtr. 2nd qtr. 3rd qtr. 4th qtr.
Year/ qUarter
1987
1988
1989
1990
1991
1992
1990: 4th qtr.
1991: lst qtr. 2nd qtr. 3rd qtr. 4th qtr.
1992: lst qtr. 2nd qtr. 3rd qtr. 4th qtr.
HOUSING
5.3 RESIDENTIAL UNITS/FLATS COMPLETED BY GEOGRAPHIC AREA
Public
Kowloon Rest Hong and Fanling/ of New Kong New Tsucn
Wan Sba Tin
Tuen Mun
Tai Sbeung Terri-Island Kowloon Po Shui iories . Total
7 021 5 901 2 699 4 080
4 290 3 639 5 735 5 604 3 544
1 648 13 088
5 262 8 114
3 196 11 668
8 684 5 060 3 622 6 913
3 774 1 224 5 528
1 285 7 637
4 216
3 582 1 290
1 544 224
1428
4 525 4490 2 269
384
1 870 1 904
442
765
1 224
1 285
765
Home Ownership Scheme-- continued
Rest Fanling/ of New
Tai Sheung Terri-Po Shui tories Total
2 012
612
8 974
1 050 8 802
3 600 18 776
7 316 17 518
816
3 105 2 662 1 870
816
Kowloon Hong and Kong New Island Kowloon
11 177
12 491
11 861
5 762
6 217
3 524
4292
7 660
5 275 24 976
2 780 6 109 31 701
2 386 4 992 46 393
5 340 3 643 32 885
Tsuen Wan
2 801
2 896
7 158
3 960
1 700 25 486
5 242 11 039
1 054 7 150
177
1 523
3 308 714
1 220
7 807 9 981 5 886 1 812
5 178 2 618
3 243
Private
Sba Tucn Tin Mun
5 516
1542
769
1 018
3 716
4 365
3 803
6499
Home Ownership Scheme
Kowloon Hong and Kong New Island Kowloon
2180 3178
1 960
Tsuen Wan
Sba Tin
1 340 2 276
2 180 3 612
Tucn Mun
3 790 816 3 202 2 908
660 232 3 586 4 052
2 010 2 808 560 4 020 3 224
608
1402
970
130 816 434
1428
970
560
Rest Fanling/ of New
600
350 700
2 970
600
1224 2000
Grand
total
Tai Sheung Terri-Po Shui lorries Total
1 756
1472
513
1 653
300. 2 146 33 629 67 579
24 3 808 30 122 70 625
61 2 164 30 621 95 790
1420 3 511 31483 81 886
2448
1 060
3 264
1 516
840 16 726 7 994 5 362 7 257 1 731 3 224 2 820 2 170 10 170 40 728 82 940
1 060
2 040
1 224
700
816
830 · 1 824 5 740 6 978 4 541 545
830
3 116 4 176 1 406 5 435 2 589
840
1 824
3 128 2 740 3 658 7 200 -
1 516 2 199 1 311 2 968
1 206 2 130 . 1 316
1 407 3 610 3 049
1 636 2460
412 854
1 967 572 239
1 763
3 084 2 954 1 218
500 8
36
85 2 474 2 630 1 380 7 050 25 683 42 462
488 421 34 1 400 786 12 559 23 885
124 715 795 97
3 49 14 19
740 698
4 1 782
1 002 9
953 510
266 2 489
23 42
2 097 91
397 45
636 57
601 876
5 379 789 207
324 208
1 085 8 553
451 1 571 2 620 2408
8 326 11 780 5449
15 173
6 732 4487 6427 8 037
19 261 24 501 14 993 24 185
11910 9 235 6 427
14 890
Note: Home Ownership Scheme also includes Private Sector Participation Scheme (P. S. P .S.) and Middle Income Housing (MIH).
Hong Kong Monthly Digest of Statistics January 1993 35
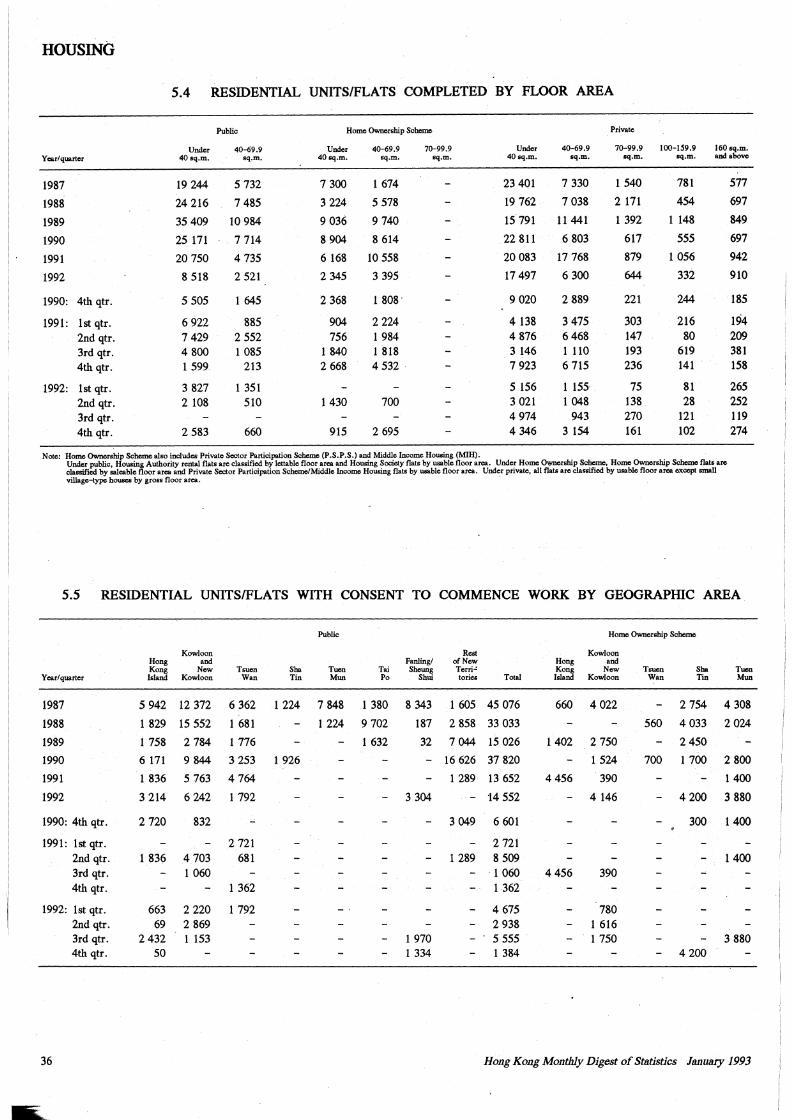
--·-- ----------- - - -~----~·----- -----
HOUSING
5.4 RESIDENTIAL UNITS/FLATS COMPLETED BY FLOOR AREA
Public Home Ownmship Schcmo Priva~
Under 40-69.9 Under 40-69.9 70-99.9 Under 4()-69.9 70-99.9 100-IS9.9 160sq.m. Year/ quarter 40sq.m. sq.m. 40sq.m. sq.m. sq.m. 40sq.m. sq.m. sq.m. sq.m. andabow
1987 19 244 5 732 7 300 1 674 23 401 7 330 1 540 781 577
1988 24 216 7 485 3 224 5 578 19 762 7038 2 171 454 697
1989 35409 10 984 9 036 9740 15791 11441 1392 1 148 849
1990 25 171 . 7 714 8 904 8 614 22 811 6 803 617 555 697
1991 20 750 4 735 6 168 10 558 20083 17 768 879 1 056 942
1992 8 518 2 521 2 345 3 395 17 497 6 300 644 332. 910
1990: 4th qtr. 5 505 1 645 2 368 1 808' 9020 2889 221 244 185
1991: lst qtr. 6922 885 904 2 224 4138 3 475 303 216 194 2nd qtr. 7429 2 552 756 1984 4 876 6468 147 80 209 3rd qtr. 4800 1 085 1 840 1 818 3 146 1 110 193 619 381 4th qtr. 1599 213 2 668 4532. 7923 6 715 236 141 158
1992: lst qtr. 3 827 1 351 5 156 1 155 75 81 265 2nd qtr. 2 108 510 1430 700 3 021 1 048 138 28 252 3rd qtr. 4974 943 270 121 119 4th qtr. 2 583 660 915 2 695 4 346 3 154 161 102 274
Note: Homo OwnmshiJ: Sc~also includes Priva~ Sector Participation Scheme (P.S.P.S.) and Middle m:<>me Housing (MIH). Under public, ousing Authority rental flats are classified by lettable floor area and Housing Socidy flats by usable floor area. Under Homo Ownership Scbemo, Homo Ownership Scheme flats are classified by saleable floor area and Priva~ Sector Participation Schc:mc/Middle Income Housing flats by usable floor area. Under priva~. all flats are classified by usable floor area except small village-type house& by gross floor area.
5.5 RESIDENTIAL UNITS/FLATS WITH CONSENT TO COMMENCE WORK BY GEOGRAPHIC AREA
Public Home Ownership Scheme
Kowloon Rest Kowloon Hong and Fanling/ of New Hong and Kong New Tsucn Sha Tuen Tai Sheung Terri~ Kong New Tsuen Sha Tuen
Year/quamr Island Kowloon Wan Tin Mun Po Shui tories Total Island Kowloon Wan Tin Mun
1987 5 942 12 372 6 362 1224 7 848 1 380 8 343 1 605 45 076 660 4022 2 754 4 308
1988 1 829 15 552 1 681 1224 9 702 187 2 858 33 033 560 4033 2024
1989 1 758 2 784 1 776 1 632 32 7044 15 026 1402 2 750 2450
1990 6 171 9 844 3 253 1 926 - 16 626 37 820 1 524 700 1 700 2 800
1991 1 836 5 763 4 764 1 289 13 652 4456 390 1400
1992 3 214 6242 1 792 3 304 - 14 552 4 146 4200 3 880
1990: 4th qtr. 2 720 832 3 049 6 601 300 1400
1991: lst qtr. 2 721 2 721 2nd ~tr. 1 836 4703 681 1 289 8 509 1400 3rd qtr. 1 060 1 060 4456 390 4th qtr. 1 362 1362
1992: lst qtr. 663 2 220 1 792 4 675 780 2nd qtr. 69 2 869 2 938 1 616 3rd qtr. 2432 1 153 1 970 5 555 1 750 3 880 4th qtr. 50 1 334 1 384 4200
36 Hong Kong Monthly Digest of Statistics January 1993
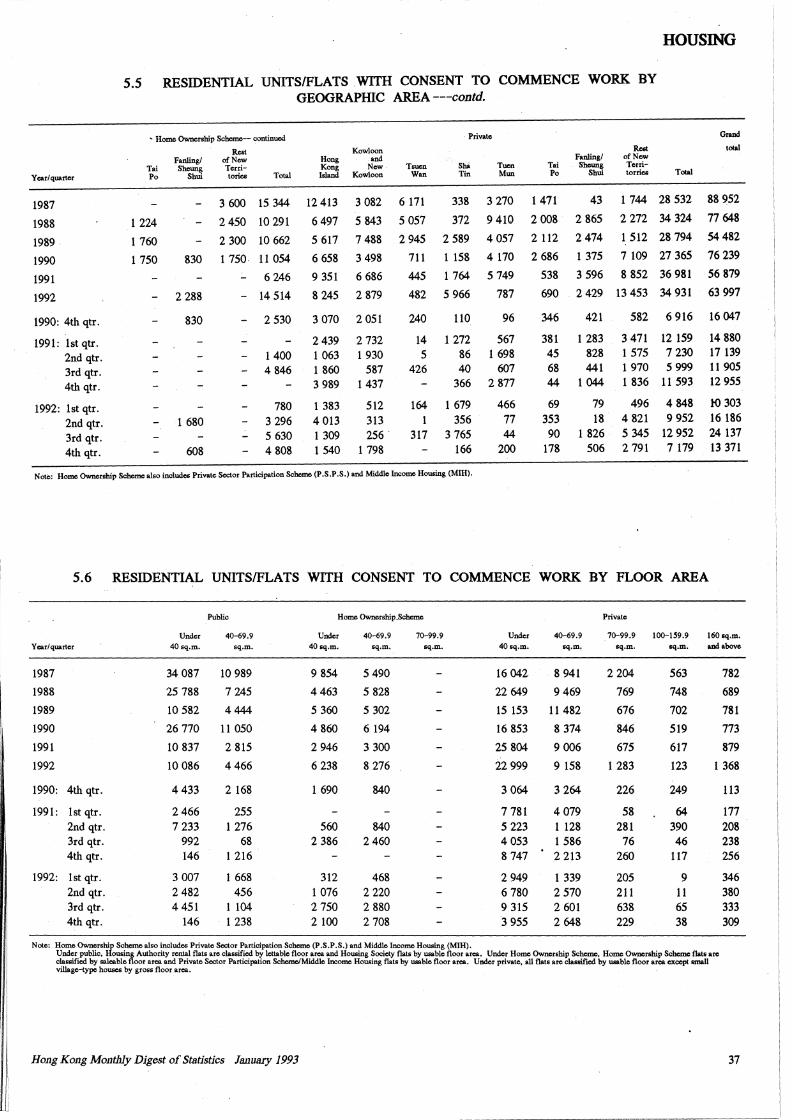
I
I. 11
JIJL_··~---·-
Year/ quarter
1987
1988
1989
1990
1991
1992
1990: 4th qtr.
1991: lst qtr. 2nd qtr. 3rd qtr. 4th qtr.
1992: lst qtr. 2nd qtr. 3rd qtr. 4th qtr.
HOUSING
5.5 RESIDENTIAL UNITS/FLATS .WITH CONSENT TO COMMENCE WORK BY
- Home Ownership Scheme-- continued
Rest Fanling/ of New
Tai Sheung Terri-Po Shui tories Total
1224
1 760
1 750 830
2 288
830
1 680
608
3 600 15 344
2 450 10 291
2 300 10 662
1 750 11 054
6 246
- 14 514
2 530
1400 4 846
780 3 296 5 630 4 808
GEOGRAPHIC AREA ---contd.
Kowloon Hong and Kong New Island Kowloon
12 413
6 497
5 617
6 658
9 351
8 245
3 082
5 843
7 488
3 498
6 686
2 879
3 070 2 051
2439 1 063 1 860 3 989
1 383 4 013 1 309 1540
2 732 1 930
587 1 437
512 313 256
1 798
Tsuen Wan
6 171
5 057
2945
711
445
482
240
14 5
426
164 1
317
Private
Sha Tucn Tin Mun
338
372
2 589
1 158
1 764
5 966
110
1 272 86 40
366
1 679 356
3 765 166
3 270
9 410
4057
4 170
5 749
787
96
567 1 698
607 2 877
466 77 44
200
Rest Fanlingl of New
Grand
total
Tai Sheung Tcrri-Total Po Shui lorries
1 471
2 008
2 112
2 686
538
690
346
381 45 68 44
69 353 90
178
43 1 744 28 532 88 952
2 865 2 272 34 324 77 648
2 474 1 512 28 794 54 482
1 375 7 109 27 365 76 239
3 596 8 852 36 981 56 879
2 429 13 453 34 931 63 997
421
1 283 828 441
1 044
79 18
1 826 506
582 6 916 16 047
3 471 1575 1 970 1 836
12 159 7 230 5 999
11 593
496 4 848 4 821 9 952 5 345 12 952 2 791 7 179
14 880 17 139 11 905 12 955
to 303 16 186 24 137 13 371
Note: Home Ownership Scheme also includes Private Sector Participation Scheme (P .S. P .S.) and Middle Income Housing (MIH).
5.6 RESIDENTIAL UNITS/FLATS WITH CONSENT TO COMMENCE WORK BY FLOOR AREA
Public Home Ownership .Scheme Private
Under 40sq.m.
40-69.9 Under 40 sq.m.
40-69.9 sq.m.
70-99.9 sq.m.
Under 40 sq.m.
40-69.9 sq.m,
70-99.9 100-159.9 160 sq.m. Yearfquarter sq.m. sq.m. sq.m. and above
10 989
7 245
4444
16 042
22 649
8 941
9 469
15 153 11 482
16 853 8 374
25 804 9 006
2 204
769
676
846
675
782
689
781
773
879
1987
1988
1989
1990
1991
1992
34 087
25 788
10 582
26 770
10 837
10 086
11 050
2 815
4466
9 854
4 463
5 360
4 860
2 946
6 238
5 490
5 828
5 302
6 194
3 300
8 276 22 999 9 158 1 283
563
748
702
519
617
123 1 368
1990: 4th qtr.
1991: lst qtr. 2nd qtr. 3rd qtr. 4th qtr.
1992: lstqtr. 2nd qtr. 3rd qtr. 4th qtr.
4433
2466 7 233
992 146
3 007 2 482 4 451
146
2 168
255 1 276
68 1 216
1 668 456
1 104 1 238
1 690
560 2 386
312 1 076 2 750 2 100
840
840 2 460
468 2 220 2 880 2 708
Note: Home Ownership Scheme also includes Private Sector Participation Scheme (P.S.P.S.) and Middle Income Housing (MIH).
3 064 3 264
7 781 5 223 4 053 8 747
2 949 6 780 9 315 3 955
4079 1 128 1 586 2 213
1 339 2 570 2 601 2 648
226
58 281
76 260
205 211 638 229
249
64 390 46
117
9 11 65 38
Under public, Housing Authority rental flats arc classified by lcttablc floor area and Housing Society flats by usable floor area. Under Home Ownership Scheme, Home Ownership Scheme flats arc classified by saleable floor area and Private Sector Participation Scheme/Middle Income Housing flats by usable floor area. Under private, all flats are classified by usable floor area except small village-type houses by gross floor area. .
Hong Kong Mo11thly Digest of Statistics Jruwary 1993
113
177 208 238 256
346 380 333 309
37
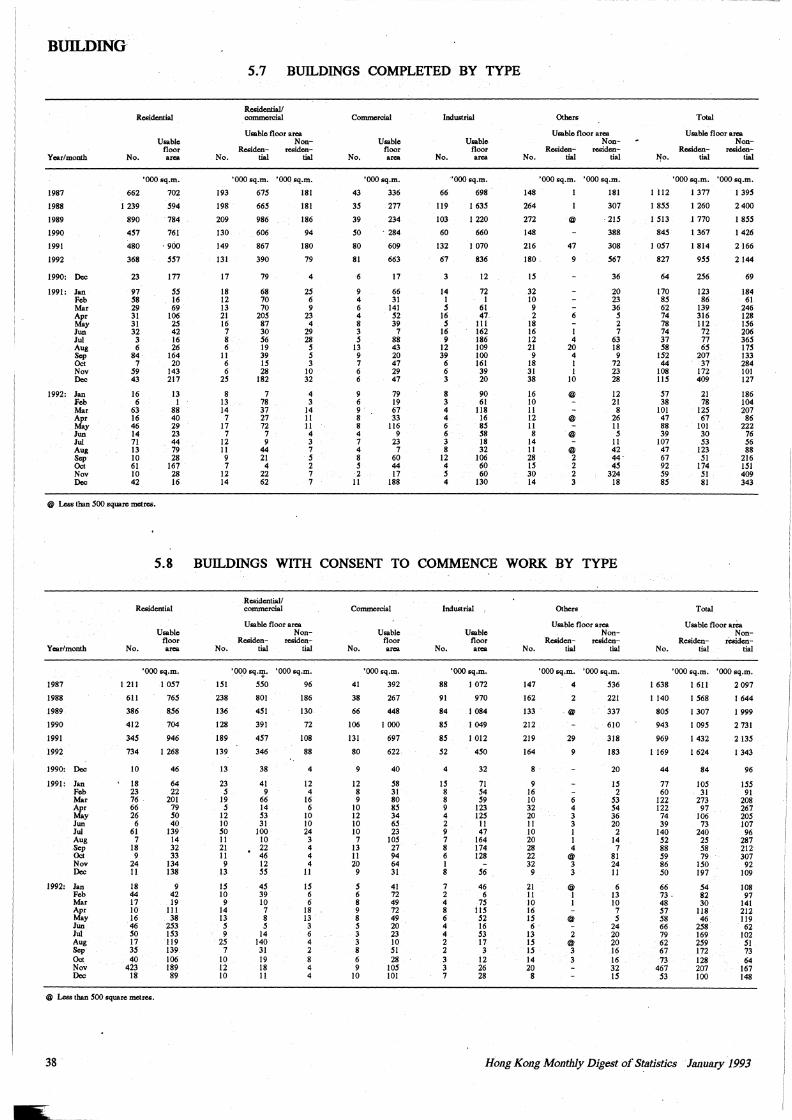
BUILDING.
Year/month
1987
1988
1989
1990
1991
1992
1990: Doc
1991: Jan Feb Mar Apr May Jun Jui Aug
~ Nov Doc
1992: Jan Feb Mar Apr May Jun Jui Aug Sep Oct Nov Doc
No.
U&able floor area
'0005q.m.
662 702
I 239 S94
890 784
4S1
480
368
23
97 58 29 31 31 32 3 6
84 7
59 43
16 6
63 16 46 14 71 13 10 61 10 42
761
. 900
SS1
177
SS 16 69
106 25 42 16 26
164 20
143 217
13 I
88 40 29 23 44 79 28
167 28 16
@ Leos than 500 square metres.
5.7 BUILDINGS COMPLETED BY TYPE
Uaablc floor area Nan-
Rooidcn- residcn-No. tial tial
'OOO sq.m. 'OOO sq.m.
193 61S 181
198 665 181
209
130
149
131
17
18 12 13 21 16 7 8 6
11 6 6
25
8 13 ... 14 7
17 7
12 11 9 7
12 14
986
606
867
390
79
68 70 70
20S 87 30 S6 19 39 IS 28
182
7 78 37 27 72
7 9
44 21 4
22 62
186
94
180
79
4
2S 6 9
23 4
29 28 s s 3
10 32
4 3
14 11 11 4 3 7 s 2 7 7
Commercial
Uaable floor
No, area
'OOOsq.m.
43 336
3S 277
39 234
so 80
81
6
9 4 6 4 8 3 s
13 9 7 6 6
9 6 9 8 8 4 7 4 8 5
·2 11
. 284
609
663
17
66 31
141 52 39 7
88 43 20 47 29 47
79 19 67 33
116 9
23 7
60 44 17
188
lndllllrial
No.
Uaable floor area
''CK>Osq.m.
66 698
119 I 63S
103 I 220
60
132
67
3
14 I s
16 s
16 9
12 39 6 6 3
8 3 4 4 6 6 3 8
12 4 5 4
660
I 070
836
12
72 I
61 47. lll 162 186 109 100 161 39 20
90 61
118 16 8S S8 18 32
106 60 60
130
Usablo floor area Non-
R..Wcn- r..wcn-No. tial tial
'OOO sq.m. 'OOO sq.m.
148. I 181
264 I 307
272 @ . 21S
148
216
180.
IS
32 10 9 2
18 16 12 21 9
18 31 38
16 10 11 12 11 8
14 11 28 IS 30 14
47
9
6
I 4
20 4 I I
10
@
@
@
@ 2 2 2 3
388
308
561
36
20 23 36 s 2 7
63 18 9
72 23 28
12 21
8 26 11 5
11 42 44· 4S
324 18
Total
Usable floor area Non-
R..wcn- residcn-Jl!o. tial tial
'OOO sq.m. 'OOO sq.m.
1112 1377 139S
I 8SS 1260 2400
1 Sl3
84S
1 OS7
827
64
170 8S 62 74 78 74 37 58
152 44
108 115
51 38
101 47 88 39
107 .47 67 92 59 85
l 770
1367
1814
9SS
256
123 86
139 316 112 72 77 65
207 37
172 409
21 78
125 67
101 30 S3
123 SI
174 51 81
I SSS
1426
2166
2144
69
184 61
246 128 IS6 206 36S 17S 133 284 101 127
186 104 207
86 222
76 S6 88
216 ISI 409 343
5.8 BUILDINGS WITH CONSENT TO COMMENCE WORK BY TYPE
Year/month
1987
1988
1989.
1990
1991
1992
1990: Doc
1991: Jan Feb Mar Apr May Jun Jui Aug Sep Oct Nov Doc
1992: Jan Feb Mar Apr May Jun Jui Aug Sep Oct Nov Doc
No.
Uaable floor area
'0001q.m.
I 211 I 057
611 76S
386 8,S6
412 704
345 946
734
10
18 23 76 66 26 6
61 7
18 9
24 11
18 44 17 10 16 46 so 17 3S 40
423 IS
1268
46
64 22
201 79 so 40
139 14 32 33
134 138
9 42 19
111 38
2S3 IS3 119 139. 106 189 89
@ Lea than SOO square metres.
38
R..Wential/ commercial
U&able floor area Noc-
Re&idc:n- ...Wen-No. tial tial
151
238
136
128
189
139
13
23 5
19 s
12 10 so 11 21 11 9
13
IS 10 9
14 13 s 9
2S 7
10 12 10
801
4SI
391
4S7
346
38
41 9
66 14 S3 31
100 10 22 46 12 55
45 39 10 7 8 5
14 140 31 19 18 11
'OOO sq.m.
96
186
130
72
108
88
4
12 4
16 6
10 10 24 3 4 4 4
11
IS 6 6
18 13 3 6 4 2 8 4 4
Commercial
No.
U&able floor area
'OOOsq.m.
41 392
3.8 267
66 448
106 I OOO
131 697
80
9
12 8 9
10 12 10 10 7
13 11 20
9
s 6 8 9 8 5 3 3 8 6 9
10
622
40
S8 31 80 8S 34 6S 23
IOS 27 94 64 31
41 72 49 72 49 20 23 10 SI 2ll
IOS 101
lndllllrial
No.
Uaable floor area
'OOOsq.m.
88 I 072
91 970
84 I 084
8S I 049
8S I 012
S2
4
IS 8 8 9 4 2 9 7 8 6 I 8
7 2 4 8 6 4 4 2 2 3 3 7
4SO
32
71 S4 S9
123 12S
11 47
164 174 128
S6
46 6
.1S llS 52 1.6 S3 17 3
12 26 28
Others
Usable floor area Noc-
R..wcn- ...Wen-No. tial tial
'OOO 1q.m.
147 4
162 2
133 '@
212
219 29
164
8·
9 16 10 32 20 11 10 20 28 22 32 9
21 11 10 16 15 6
13 IS IS 14 20 8
9
6 4 3 3 I I 4
@ 3 3
@ I I
@
2 @ 3 3
'OOOsq.m.
S36
221
'337
610
318
183
20
IS 2
S3 S4 36 20 2
14 7
81 24 11
6 13 10 7 s
24 20 20 16 16 32 IS
Total
Usable floor aM. Non-
Reaiden- rCaidc:n-No. tial tial
'OOO sq.m. 'OOO 1q.m.
I 638
1140
805
943
969
I 169
44
77 60
122 122 74 39
140 S2 88 59 86 50
66 73. 48 S7 S8 66 79 62 67 73
467 S3
1611 2097
1568 I 644
I 307 I 999
I 09S 2 731
I 432 213S
1624
84
105 31
273 91
106 73
240 25 58 79
ISO 197
54 82 30
118 46.
2S8 169 2S9 172 128 207 JOO
I 343
96
ISS 91
208 267 :iOS 107 96
287 212' 307
92 109
108 97
141 212 119 62
102 SI 73 64
167 148
Hong Kong Monthly Digest of Sf:Btistics January 1993
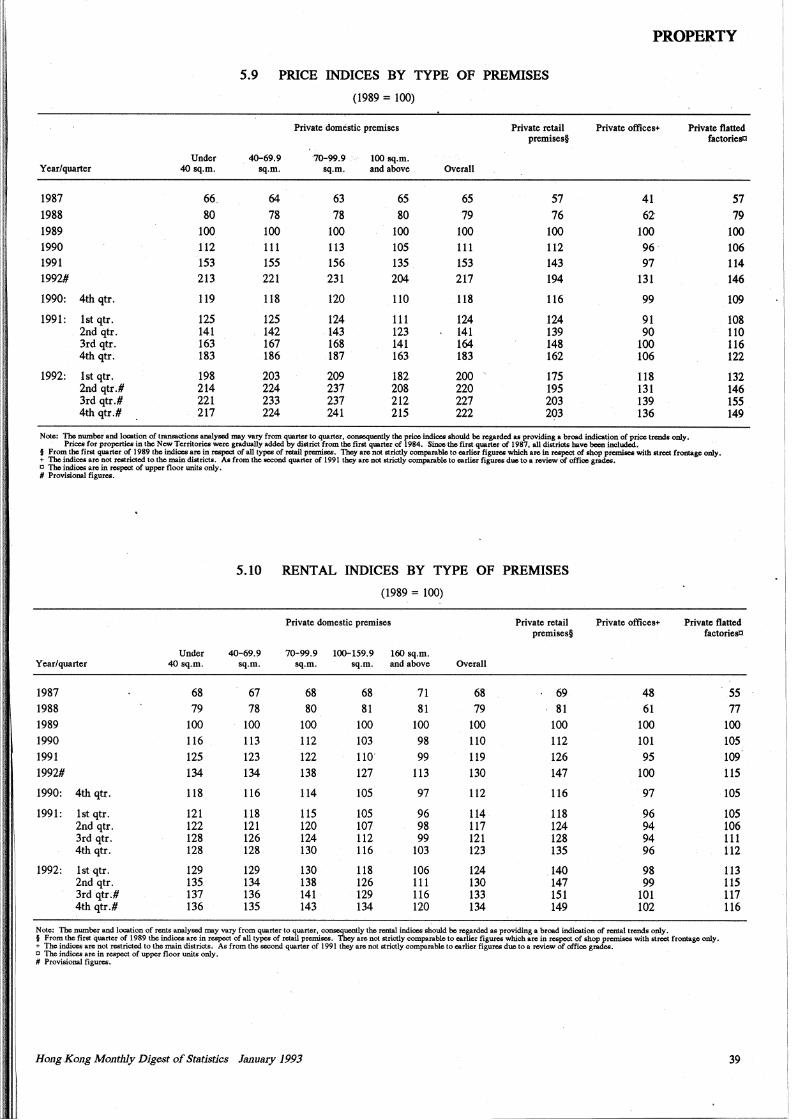
PROPERTY
Under Year/quarter 40 sq.m.
1987 66. 1988 80 1989 100 1990 112 1991 153 1992# 213
1990: 4th qtr. 119
1991: lst qtr. 125 . 2nd qtr. 141
3rd qtr. 163 4th qtr. 183
1992: lst qtr. 198 2nd qtr.# 214 3rd qtr.# 221 4th qtr.# 217
5.9 PRICE INDICES BY TYPE OF PREMISES
(1989 = 100)
Private domestic premises Private retail premises§
40-69.9 70-99.9 100 sq.m. sq.m. sq.m. and above overall
64 63 65 65 57 78 78 80 79 76
100 100 100 100 100 111 113 105 111 112 155 156 135 153 143 221 231 204 217 194
118 120 110 118 116
125 124 111 124 124 142 143 123 141 139 167 168 141 164 148 186 187 163 183 162
203 209 182 200 175 224 237 208 220 195 233 237 212 227 203 224 241 215 222 203
Private offices+ Private flatted factoriesCI
41 57 62 79
100 100 96 106 97 114
131 146
99 109
91 108 90 110
100 116 106 122
118 132 131 146 139 155 136 149
Note: The num\,or and location of transactions analysed 1my vary from quarter to quarter. consequcolly the price indices should be i:egarded as providing a bread indication of price tiendo only. Prices for properties in the New Territories were gradually added by district from the first quarter of 1984. Since the first quarter of 1987, all districts bavo been included.
f From the first quarter of 1989 the indices arc in respcct of all types of retail premilOI. They arc not strictly comporablo to earlier figures which arc in respcct of shop premi008 with street fronlagc only. + The indices arc not rcstrictcd to the Jmin districtB. Ao from the occond quarter of 1991 they arc not strictly comporable to earlier figures due to a review of offioc grades. c The indices arc in respcct of upper floor units only. # Provisional figmm.
5.10 RENTAL INDICES BY TYPE OF PREMISES
(1989 = 100)
Private dome.stic premises Private retail Private offices+ Private flatted premises§ factoriesa
Under 40-69.9 70-99.9 100-159.9 160 sq.m. Year/quarter 40 sq.m. sq.m. sq.m. sq.m. and above overall
1987 68 67 68 68 71 68 69 48 55 1988 79 78 80 81 81 79 81 61 77 1989 100 100 100 100 100 100 100 100 100 1990 116 113 112 103 98 110 112 101 105 1991 125 123 122 110· 99 119 126 95 109 1992# 134 134 138 127 113 130 147 100 115
1990: 4th qtr. 118 116 114 105 97 112 116 97 105
1991: lst qtr. 121 118 115 105 96 114 118 96 105 2nd qtr. 122 121 120 107 98 117 124 94 106 3rd qtr. 128 126 124 112 99 121 128 94 111 4th qtr. 128 128 130 116 103 123 135 96 112
1992: lst qtr. 129 129 130 118 106 124 140 98 113 2nd qtr. 135 134 138 126 111 130 147 99 115 3rd qtr.# 137 136 141 129 116 133 151 101 117 4th qtr.# 136 135 143 134 120 134 149 102 116
Note: The number and location of rents analysed may vary from quarter to quarter, conscqucntly the reDlal indiocs should be regarded as·providing a broad indication of reDlal trends only. § From the first quarter of 1989 the indiocs arc in respcct of all types of retail premises. They arc not strictly comporablc to earlier figures which arc in respcct of shop prcmiseo with llrect fronlage only, + The indices arc not rcstricted to the Jmindistricts. As from the occond quarter of 1991 they arc not strictly comporable to earlier figures due to a review of office grades. c The indices are in respect of upper floor units only. # Provisional figures.
Hong Kong Monthly Digest of Statistics January 1993 39
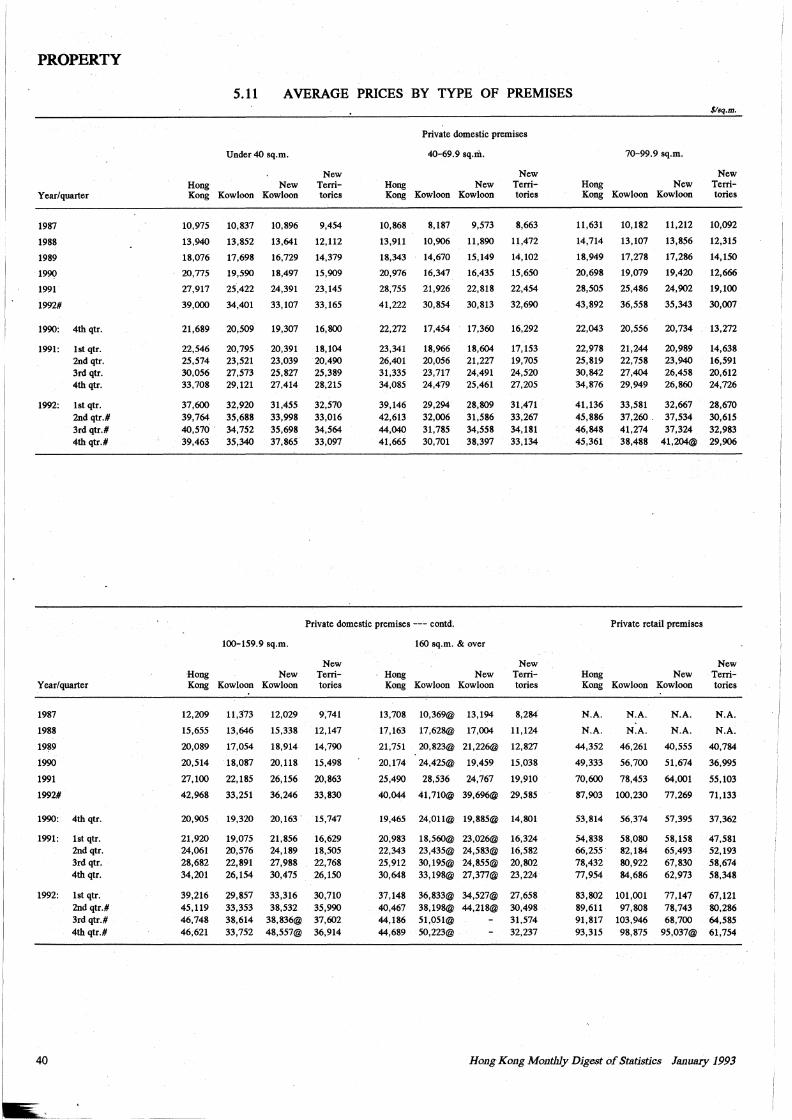
PROPERTY
Year/quarter
1987
1988
1989
1990
1991
1992#
1990:
1991:
1992:
4th qtr.
lst qtr. 2nd qtr. 3rd qtr. 4th qtr.
lst qtr. 2nd qtr.# 3rd qtr.# 4th qtr.#
Year/quarter
1987
1988
1989
1990
1991
1992#
1990: 4th qtr.
1991:
1992:
40
lst qtr. 2nd qtr. 3rd qtr. 4th qtr.
lst qtr. 2nd qtr.# 3rd qtr.# 4th qtr.#
5.11 AVERAGE PRICES BY TYPE OF PREMISES
Under 40 sq.m.
New Hong New Terri-Kong Kowloon Kowloon tories
10,975
13,940
18,076
20,775
27,917
39,000
21,689
22,546 25,574 30,056 33,708
37,600 39,764 40,570. 39,463
10,837 10,896 9,454
13,852 13,641 12,112
17,698 16,729 14,379
19,590 18,497 15, 909
25,422 24,391 23, 145
34,401 33, 107 33, 165
20,509
20,795 23,521 27,573 29,121
32,920 35,688 34,752 35,340
19,307
20,391 23,039 25,827 27,414
31,455 33,998 35,698 37,865
16,800
18,104 20,490 25,389 28,215
32,570 33,016 34,564 33,097
Private domestic premises
40-69.9 sq.rit.
New Hong New Terri-Kong Kowloon Kowloon tories
10,868 8,187 9,573
13,911 10,906 11,890
18,343 14,670 15, 149
20,976 16,347 16,435
28,755 21,926 22,818
41,222 30,854 30,813
22,272
23,341 26,401 31,335 34,085
39,146 42,613 44,040 41,665
17,454
18,966 20,056 23,717 24,479
29,294 32,006 31,785 30,701
17,360
18,604 21,227 24,491 25,461
28,809 31,586 34,558 38,397
8,663
11,472
14,102
15,650
22,454
32,690
16,292
17,153 19,705 24,520 27,205
31,471 33,267 34,181 33,134
Private domestic premises --- contd.
100-159.9 sq.m.
New Hong New Terri-Kong Kowloon Kowloon tories
12,209 11,j73 12,029
15,655 13,646 15,338
20,089 17,054 18,914
20,514 18,087 20, 118
27,100 22,185 26,156
42, 968 33,251 36,246
9;741
12,147
14,790
15,498
20,863
33,830
20,905 19,320 20,163. 15,747
21,920 24,061 28,682 34,201
39,216 45,119 46,748 46,621
19,075 20,576 22,891 26,154
29,857 33,353 38,614 33,752
21,856 24,189 27,988 30,475
33,316 38,532
38,836@ 48,557@
16,629 18,505 22,768 26,150
30,710 35,990 37,602 36,914
160 sq.m. & over
New Hong New Terri-Kong Kowloon Kowloon tories
13,708 10,369@ 13,194 8,284
17,163 17,628@ 17,004 11,124
21,751 20,823@ 21,226@ 12,827
20, 174 24,425@ 19,459 15,038
25,490 28,536 24,767 19,910
40,044 41,710@ 39,696@ 29,585
19,465 24,011@ 19,885@ 14,801
20,983 22,343 25,912 30,648
37,148 40,467 44,186 44,689
18,560@ 23,026@ 23,435@ 24,583@ 30,195@ 24,855@ 33,198@ 27,377@
36,833@ 34,527@ 38,198@ 44,218@ 51,051@ 50,223@
16,324 16,582 20,802 23,224
27,658 30,498 31,574 32,237
$/sq.m.
70-99.9 sq.m.
New Hong New Terri-Kong Kowloon Kowloon tories
11,631
14,714
18,949
20,698
28,505
43,892
22,043
22,978 25,819 30,842 34,876
41,136 45,886 46,848 45,361
10,182
13,107
17,278
19,079
25,486
36,558
20,556
21,244 22,758 27,404 29,949
33,581 37,260. 41,274 38,488
11,212
13,856
17,286
19,420
24,902
35,343
20,734
20,989 23,940 26,458 26,860
32,667 37,534 37,324
41,204@
Private retail premises
10,092
12,315
14,150
12,666
19,100
30,007
13,272
14,638 16,591 20,612 24,726
28,670 30,615 32,983 29,906
New Hong New Terri'-Kong Kowloon Kowloon tories
N.A. N.A.
N.A. N.A.
44,352 46,261
49,333 56,700
70,600 78,453
87,903 100,230
N.A.
N.A.
40,555
51,674
64,001
77,269
N.A.
N.A.
40,784
36,995
55,103
71,133
53,814 56,374 57,395 37,362
54,838 66,255 78,432 77,954
83,802 89,611 91,817 93,315
58,080 82,184 80,922 84,686
101,001 97,808
103,946 98,875
58,158. 65,493 67,830 62,973
77,147 78,743 68,700
95,037@
47,581 52,193 58,674 58,348
67,121 80,286 64,585 61,754
Hong Kong Monthly Digest of Statistics January 1993

[lllIL~
PROPERTY
5.11 AVERAGE PRICES BY TYPE OF PREMISES --- contd. $/sq.II/..
Private offices+
Grade A Grade B
Wan Chai/ Tsim Yau Wan Chai/ Tsim Yau Sheuog Causeway Sha Ma Tei/ She1111g Causeway Sha Ma Tei/
Year/quarter Wan Central Bay Tsui Mong Kok Wan Central Bay Tsui Mong Kok
1987 17,696@ 26;950 23,732@ 26,399 16,572 13,695 23,296 14,902 19,766 13,661
1988 26,823@ 57,744@ 30,714@ ,42,942 26,430 20,032 44,482 25,163 28,250 21,104
1989 54,912@ 76,150 59,340@ 56,186 41,178 38,434 67,523 43,906 45,408 31,898
1990 53,661@ 86,837 58,580@ 53,158 37,943@ 37,127, 64,314. 41,276 43,372 31,628
1991 38,027@ 68,076 63,167 51,677 43,651@ 36,242 59,721 43,119 51,031 34,868
1992# 86,729 76,975 63,699 62,956@ 51,556 71,931 57;353 60,395@ 46,865
1990: 4th qtr. 53,563@ 92,982@ 54,013@ 53,307@ 37,194@ 35,270@ 63,880@ 30,750@ 42,809@ 32,480@
1991: lst qtr. 75,495@ 60,005@ 48,928@ 40,359@ 31,250@ 61,243@ 38,369@ 45,531@ 31,887
2ndqtr. 38,027@ 63,061@ 63,695@ 50,005 56,702@ 33,263 53,493@ 39,245 46,952@ 32,927 3rd qtr. 69,639@ 65,481@ 51,654 48,807@ 41,040 58,443@ 44,870 52,836@ 35,840
4th qtr. 71,890@ 61,445@ 54,031 38,609@ 39,101 67,701@ 48,262 56,010@ 38,152
1992: lst qtr. 78,446@ 68,521@ 59,732 66,667@ 45,246 71,554@ 55,050 58,317@ 41,482@
2nd qtr.# 84,849 71,909@ 65,056 48,872@ 50,616@ 66,147@ 56,771 62,570@ 48,061 3rd qtr.# 91,765 87,529@ 73,584@ 64,955@ 62,216@ 95,030@ 59,462 47,201 4th qtr.# 93,056@ 102,794@ 73,210@ 71,329@ 65,297@ 53,430@ 58,219@ 59,807@ 70,786@
Private offices+ --- contd. Private flatted factoriesl:l
GradeC
Wan Chai/ Tsim Yau New Sheuog Causeway Sha Ma Tei/ Hong New Terri-
Year/quarter Wan Central Bay Tsui Mong Kok Kong Kowloon Kowloon tories
1987 10,501 13,967 13,530 15,692 13,148 5,426 6,343 5,576 4,273
1988 17,954 24,005 22,612 22,667 20,787 7,892 9,255 8,302 6,238
1989 29,595 40,537 35,929 35,989 30,111 10,409 12,041 10,798 7,665
1990 29,160 40,410 33,871 32,991 30,651 11,739 12,931 11,995 8,140
1991 31,217 44,241 38,443 38,040 37,524 12,922 14,180 13,380 8,925
1992# 41,942 47,660 51,130 47,482 49,769 17,343 17,745 17,653 11,251
1990: 4th qtr. : 30,418 37,860@ 31,964 33,998 30,456 12,961 12,573 12,775 8,281
1991: lst qtr. 29,279 43,220@ 34,915@ 35,511 31,405 12,020 12,635 12,391 8,324 2nd qtr. 30,490 42,893@ 36,583 35,594 32,992 12,835 13,818 12,742 8,551 3rd qtr. 30,981 45,021@ 37,585 38,043 36,915 13,250 14,421 13,347 9,186 4th qtr. 33,408 45,444@ 41,978 41,384 40,860 13,309 15,135 14,503 9,416
1992: lstqtr. 36,638 54,767@ 47,189 44,903 46,059 15,678 17,257 15,067 10,431 2nd qtr.# 44,152 42,608 51,397 49,718 50,140 17,838 18,315 18,562 11,090 3rd qtr.# 46,131 59,379@ 56,566 53,428@ 53,180 18,589 17,306 20,723 12,425 4th qtr.# 43,728@ 50,534@ 61,911@ . 50,334@ 57,284@ 16,873 20,267@ 20,907 12,256
Note: The number aad location of transactions analysed may vary from quarter to quarter, consequently tbo average price& should bo regarded as providing a broad indication of price trends only. Prices fo,r properties in tbo Now Tcrritorlco were gradually added by district from tbo first quarter of 1984. Since tbo first quarter of 1987, all district& havo boon included.
+ Since tbo llOCODd quarter of 1991 avorago price& havo boon compiled in respect of UDits gradod according to revised grading criteria. They arc not otrictly comparable to earlier figures. a Average prices arc in respect of upper floor UDits only. @ Indicates fowor than 20 transactions. # Provisional figures.
Hong Kong Monthly Digest of Statistics January 1993 41
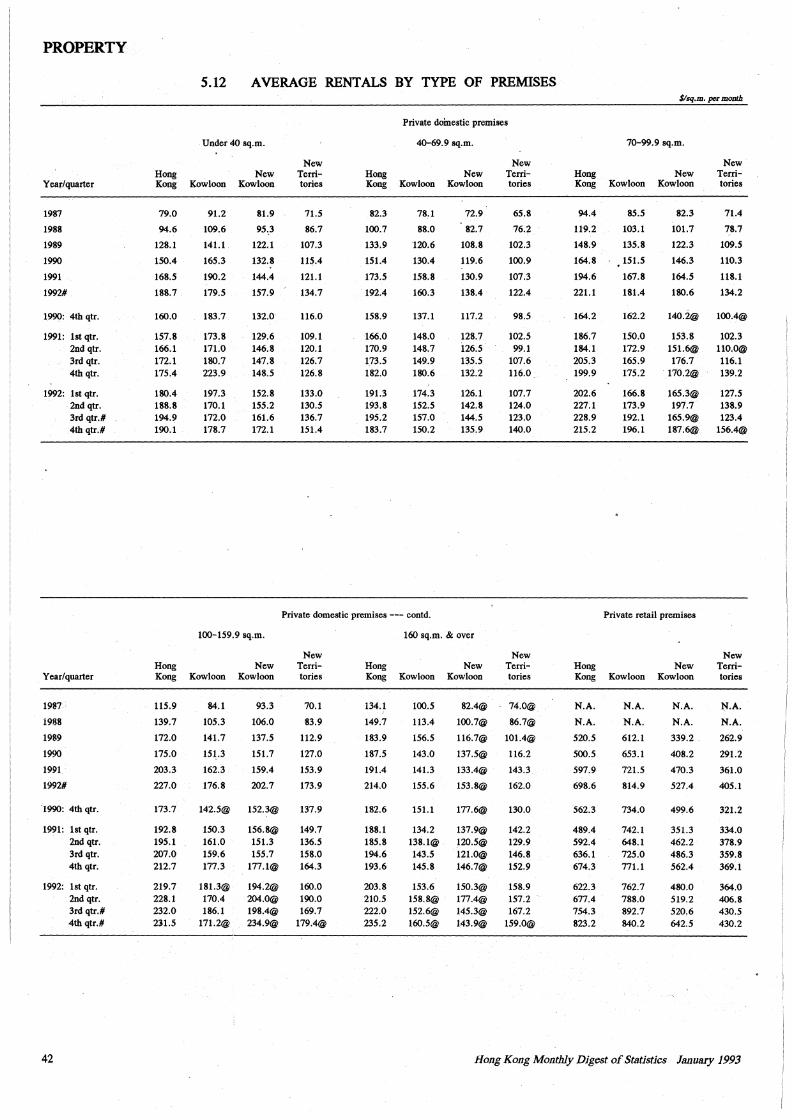
PROPERTY
Y i:ar/quarter
1987
1988
1989
1990
1991
1992#
1.990: 4th qtr.
1991: lst qtr. 2nd qtr. 3rd qtr. 4th qtr.
1992: lst qtr. 2nd qtr. 3rd qtr.# 4th qtr.#
Yi:ar/quarter
198/
1988
1989
1990
1991
1992#
1990: 4th qtr.
1991: lst qtr. 2nd qtr. 3rd qtr. 4th qtr.
1992: lst qtr. 2nd qtr. 3rd qtr.# ·4th qtr.#
42
Hong Kong
79.0
94.6
128.1
150.4
168.5
188.7
160.0
157.8 166.1 172.1 175.4
180.4 188.8 194.9 190.1
Hong Kong
115.9
139.7
172.0
175.0
203.3
227.0
173.7
192.8 195.1 207.0 212.7
219.7 228.1 232.0 2ll.5
S.12 AVERAGE RENTALS BY TYPE OF PREMISES
Under 40 sq.m.
Kowloon
91.2
109.6
141.1
1~.3
190.2
179.5
183.7
173.8 171.0 180.7 223.9
197.3 170.1 172.0 178.7
New Kowloon
81.9
95.,3
122.1
132.8
144.4
157.9
132.0
129.6 146.8 147.8 148.5
152.8 155.2 161.6 172.1
100-159.9 sq.m.
Kowloon
84.1
105.3
141.7
151.3
162.3
176.8
142.5@
150.3 161.0 159.6 177.3
181.3@ 170.4 186.1
171.2@
New Kowloon
93.3
106.0
137.5
151.7
159.4
202.7
152.3@
156.8@ 151.3 155.7
177.l@
194.2@ 204.0@ 198.4@ 234.9@
New Territories
71.S
86.7
107.3
115.4
121.1
134.7
116.0
109.1 120.1 126.7 126.8
133.0 130.5 136.7 151.4
Hong Kong
82.3
100.7
133.9
151.4
173.5
192.4
158.9
166.0 170.9 173.5 182.0
191.3 193.8 195.2 183.7
Private doinestic premises
40-69.9 sq.m.
Kowloon
78.1
88.0
120.6
130.4
158.8
160.3
137.1
148.0 148.7 149 .. 9 180.6
174.3 152.5 157.0 150.2
New Kowloon
72.9
82.7
108.8
119.6
130.9
138.4
117.2
128.7 l26.5.
13.5.5 132.2
126.1 142.8 144.5 135.9
New Territories
65.8
76.2
102.3
100.9
107.3
122.4
98.5
102.5 99.1
107.6 116.0'
107.7 124.0 123.0 140.0
Private domestic premises --- contd.
New Territories
70.1
83.9
112.9
127.0
153.9
173.9
137.9
149.7 136.5 158.0 164.3
160.0 190.0 169.7
179.4@
Hong Kong
134.1
149.7
183.9
187.5
191.4
214.0
182.6
188.1 185.8 194.6 193.6
203.8 210.5 222.0 235.2
160 sq.m. & over
Kowloon
100.5
113.4
156.5
143.0
141.3
155.6
151.1
134.2 138.1@ 143.5 145.8
153.6 158.8@ 152.6@ 160.5@
New Kowloon
82.4@
100.7@
116.7@
137.5@
133.4@
153.8@
177.6@
137.9@ 120.5@ 121.0@ 146.7@
150.3@ 177.4@ 145.3@ 143.9@
New Territories
74.0@
86.7@
101.4@
116.2
143.3
162.0
130.0
142.2 129.9 146.8 152.9
158.9 157.2 ' 167.2
159.0@
Hong Kong
94.4
119.2
148.9
164.8
194.6
221.1
164.2
186.7 184.1 205.3 199.9
202.6 227.1 228.9 215.2
Hong Kong
N.A. N.A. 520.5
500.5
591.9
698.6
562.3
489.4 592.4 636.1 674.3
622.3 677.4 754.3 823.2
$/Bq.m. por moatb
70-99.9 sq.m.
Kowloon
85.5
103.1
135.8
151.5
167.8
181.4
162.2
150.0 172.9 165.9 175.2
166.8 173.9 192.1 196.1
New Kowloon
82.3
101.7
122.3
146.3
164.5
180.6
140.2@
153.8 151.6@ 176.7
.170.2@
165.3@ 197.7
165.9@ 187.6@
Private retail premises
Kowloon
N.A. N.A. 612.1
653.1
721.5
814.9
734.0
742.1 648.1 725.0 771.1
762.7 788.0 892.7 840.2
New Kowloon
N.A. N.A. 339.2.
408.2
470.3
527.4
499.6
351.3 462.2 486.3 562.4
480.0 519.2 520,6 642;5
New Territories
71.4
78.7
109.5
110.3
118.1
134.2
100.4@
102.3 110.0@ 116.1 139.2
127.5 138.9 123.4
156.4@
New Territories
J'.'{.A.
N.A. 262.9
291.2
361.0
405.1
321.2
334.0 378;9 359.8 369.1
364.0 406.8 430.5 430.2
Hong Kong Monthly Digest of Statistics January 1993
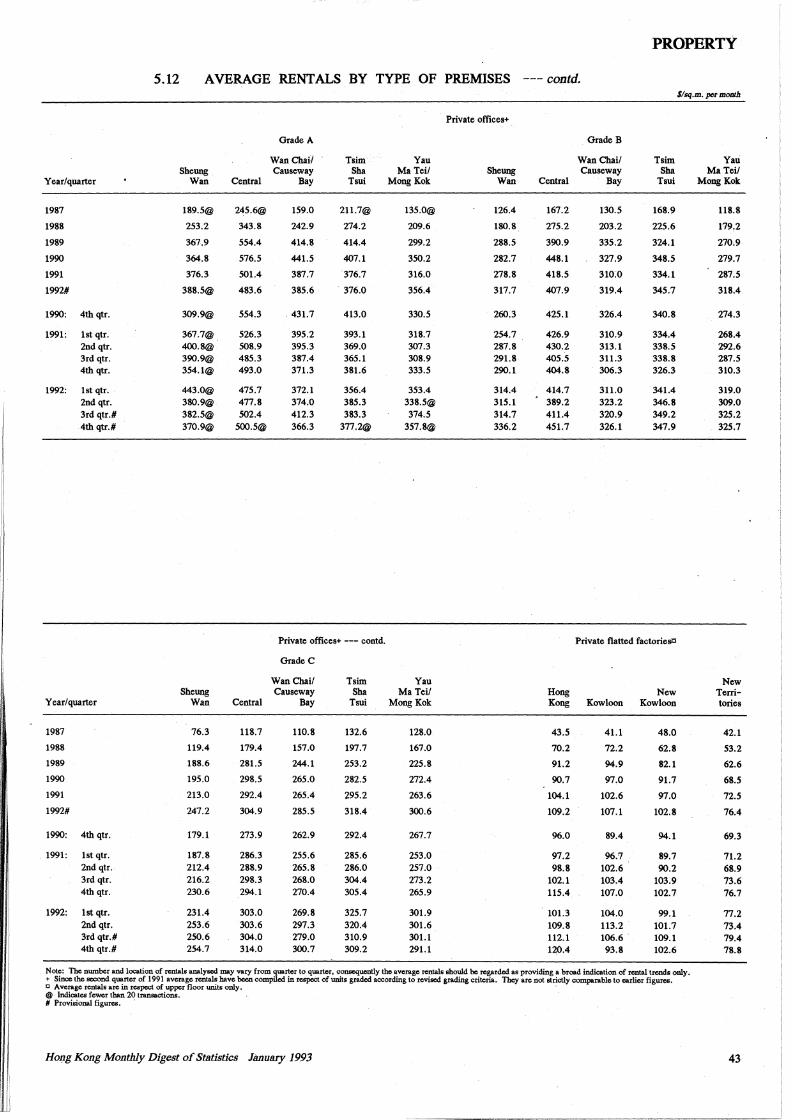
i I 1
Ii I• ,, I I;
I'
I
I'
!
I
I' I
JlllL ____________ -----------------
PROPERTY
5.12 AVERAGE RENTALS BY TYPE OF PREMISES --- contd. $/sq.m. per moDlh
Year/quarter
1987
1988
1989
1990
1991
1992#
1990: 4th qtr.
1991: lst qtr. 2nd qtr. 3rd qtr. 4th qtr.
1992: lst qtr. 2nd qtr. 3rd qtr.# 4th qtr.#
Year/quarter
1987
1988
1989
1990
1991
1992#
1990: 4th qtr.
1991: lst qtr. 2nd qtr. 3rd qtr. 4th qtr.
1992: lst qtr. 2nd qtr. 3rd qtr.# 4th qtr.#
Sheung Wan
189.5@
253.2
367.9
364.8
376.3
388.5@
309.9@
367.7@ 400.8@ 390.9@ 354.l@
443.0@ 380.9@ 382.5@ 370.9@
Sheung Wan
76.3
119.4
188.6
195.0
213.0
247.2
179.1
187.8 212.4 216.2 230.6
231.4 253.6 250.6 254.7
Grade A
Wan Chai/ Causeway
Central Bay
245.6@ 159.0
343.8 242.9
554.4 414.8
576.5 441.5
501.4 387.7
483.6 385.6
554.3
526.3 508.9 485.3 493.0
475.7 477.8 502.4
500.5@
- 431.7
395.2 395.3 387.4 371.3
372.1 374.0 412.3 366.3
Tsim Sha
Tsui
211.7@
274.2
414.4
407.1
376.7
376.0
413.0
393.1 369.0 365.1 381.6
356.4 385.3 383.3
377.2@
Private offices+ --- contd.
Grade C
Wan Chai/ Causeway
Central Bay
118.7
179.4
281.5
298.5
292.4
304.9
273.9
286.3 288.9 298.3 294.1
303.0 303.6 304.0 314.0
110.8
157.0
244.1
265.0
265.4
285.5
262.9
255.6 265.8 268.0 270.4
269.8 297.3 279.0 300.7
Tsim Sha
Tsui
132.6
197.7
253.2
282.5
295.2
318.4
292.4
285.6 286.0 304.4 305.4
325.7 320.4 310.9 309.2
Yau Ma Tei/
Mong Kok
135.0@
209.6
299.2
350.2
316.0
356.4
330.5
318.7 307.3 308.9 333.5
353.4 338.5@ 374.5
357.8@
Yau Ma Tei/
Mong Kok
128.0
167.0
225.8
272.4
263.6
300.6
267.7
253.0 257.0 273.2 265.9
301.9 301.6 301.1 291.1
Private offices+
Sheung Wan
126.4
180.8
288.5
282.7
278.8
317.7
260.3
254.7 287.8 291.8 290.1
314.4 315.1 314.7 336.2
Central
167.2
275.2
390.9
448.1
418.5
407.9
425.1
426.9 430.2 405.5 404.8
414.7 389.2 411.4 451.7
Grade B
Wan Chai/ Causeway
Bay
130.5
203.2
335.2
327.9
310:0
319.4
326.4
310.9 313.1 311.3 306.3
311.0 323.2 320.9 326.1
Tsim Sha
Tsui
168.9
225.6
324.1
348.5
334.1
345.7
340.8
334.4 338.5 338.8 326.3
341.4 346.8 349.2 347.9
Private flatted factoriesD
Hong New Kong Kowloon Kowloon
43.5
70.2
91.2
90.7
104.1
109.2
96.0
97.2 98.8
102.1 115.4
101.3 109.8 112.1 120.4
41.1
72.2
94.9
97.0
102.6
107.1
89.4
96.7 102.6 103.4 107.0
104.0 113.2 106.6 93.8
48.0
62.8
82.1
91.7
97.0
102.8
94.1
89.7 90.2
103.9 102.7
99.1 101.7 109.1 102.6
N otc: The number and location of rentals analysed may vary from quarter to quarter, consequently the average rentals should be regarded as providing a broad indication of rental trends only. + Since the second quarter of 1991 average rentals have been compiled in rcspc:ct of units graded according to revised grading criteria. They are not strictly comparable to earlier figures. o Average rentals are in respect of upper floor units only. · @ Indicates fewer than 20 transactions. # Provisional figures.
HolJ-g Kong Monthly Digest of Statistics January 1993
Yau Ma Tei/
Mong Kok
118.8
179.2
270.9
279.7
287.5
318.4
274.3
268.4 292.6 287.5 310.3
319.0 309.0 325.2 325.7
New Territories
42.1
53.2
62.6
68.5
72.5
76.4
69.3
71.2 68.9 73.6 76.7
77.2 73.4 79.4 78.8
43
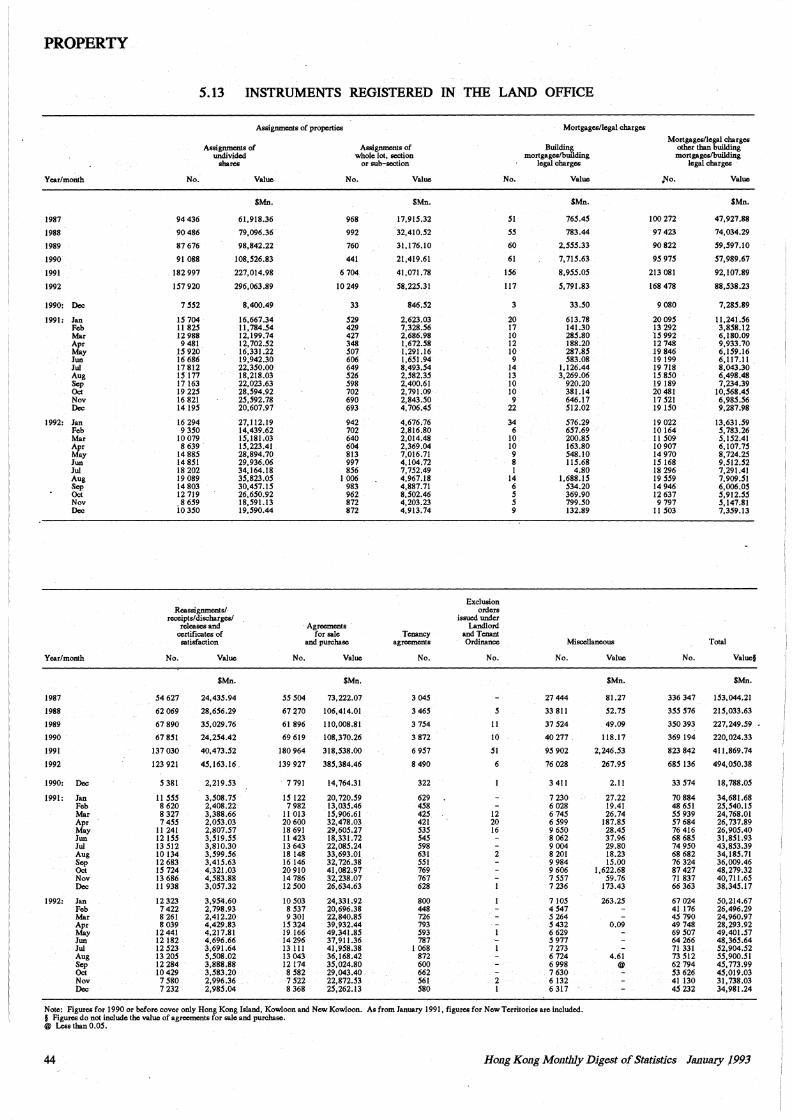
PROPERTY
5.13 INSTRUMENTS REGISTERED IN THE LAND OFFICE
Assignmeots of properties Mortgages/legal charges
Mortgages/legal charges Assignmeots of Assignments of Building other than building
undivided whole lot, section mortgages/building mortgages/building shares or sub-section legal charges legal charges
Year/month No. Value No. Value No. Value J<o. Value
$Mn. $Mn. $Mn. $Mn.
1987 94 436 61,918.36 968 17,91S.32 SI 16S.4S 100 272 47,927.88
1988 90 486 79,096.36 992 32,410.S2 SS 783.44 97 423 74,034.29
1989 87676 98,842.22 760 31,176.10 60 2,SSS.33 90822 59,S91.l0
1990 91 088 I08,S26.83 441 21,419.61 61 7, 715.63 9S 97S S7,989.67
1991 182 997 227,014.98 6 704 41,071.78 156 8,955.0S 213 081 92,107.89
1992 IS7 920 296,063.89 10249 S8,22S.31 117 5, 791.83 168 478 88,538.23
1990: Dec 7 552 8,400.49 33 846.S2 3 33.SO 9 080 7,28S.89
1991: Jan IS 704 16,667.34 529 2,623.03 20 613.78 20 09S l l,241.S6 Feb II 82S 11, 784.S4 429 7,328.S6 17 141.30 13 292 3,8S8.12 Mar 12 988 12,199.74 427 2,686.98 10 28S.80 15 992 6,180.09 Apr 9481 12,702.S2 348 l,672.S8 12 188.20 12 748 9,933.70 May IS920 16,331.22 S07 1,291.16 JO 287.8S 19 846 6,IS9.16 Jun 16 686 19,942.30 606 l,6Sl.94 9 S83.08 19 199 6,117.11 ' Jui 17812 22,3SO.OO 649 8,493.S4 14 l,126.44 19 718 8,043.30 Aug IS 177 18,218.03 S26 2,S82.3S 13 3,269.06 IS 8SO 6,498.48 Sep 17163 22,023.63 S98 2,400.61 10 920.20 19 189 7,234.39 Oct 19 22S 28,S94.92 702 2,791.09 10 381.14 20481 IO,S68.4S Nov 16 821 25,392.78 690 2,843.50 9 646.17 17 521 6,98S.S6 Dec 1419S 20,607.97 693 4, 706.4S 22 512.02 19150 9,287.98
1992: Jan 16 294 27,112.19 942 4,676.76 34 576.29 19022 13,631.S9 Feb 9350 14,439.62 702 2,816.80 6 657.69 10164 5,783.26 Mar 10079 15,181.03 640 2,014.48 10 200.85 II 509 S,IS2.41 Apr 8 639 IS,223.41 604 2,369.04 10 163.80 10907 6,107.7S May 14 885 28,894.70 813 7,016.71 9 S48.10 14970 8,724.2S Jun 14851 29,936.06 997 4,104.72 8 llS.68 IS 168 9,512.S2 Jui 18 202 34,164.18 8S6 7,7S2.49 1 4.80 18 296 7,291.41 Aug 19 089 3S,823.0S 1 006 4,967.18 14 1,688.15 19 SS9 7,909.SI Sep 14803 30,4S1.IS 983 4,887.71 6 S34.20 14 946 6,006.0S Oct 12 719 26,6S0.92 962 8,502.46 s 369.90 12 637 S,912.SS Nov '8 6S9 18,S91.13 872 4,203.23 s 799.50 9 797 S,147.81 Dec 103SO 19,S90.44 872 4,913.74 9 132.89 II S03 7,359.13
Exclusion Reassignments/. orders
receipts/discharges/ issued under releases· and Agreements Landlord
certificates of for sale Tenancy and Tenant satisfaction and purchase agreements Ordinance Misocllancous Total
Year/month No. Value No. Value No. No. No. Value No. Value§
$Mn. $Mn. $Mn. $Mn.
1987 S4627 24,43S.94 SS S04 73,222.07 304S 27444 81.27 336 347 !S3,044.21
1988 62069 28,656.29 67 270 106,414.01 3 46S s 33 811 S2.7S 3SS S76 21S,033.63
1989 67890 3S,029.76 61 896 110,008.81 3 7S4 11 37 S24 49.09 3SO 393 227,249.S9
1990 67 8SI 24,2S4.42 69 619 108,370.26 3872 10 40 277' 118.17 369 194 220,024.33
1991 137 030 40,473.52 180 964 318,S38.00 6 957 51 9S 902 2,246.S3 823 842 411,869.74
1992 123 921 45,163.16' 139 927 38S,384.46 8 490 6 76 028 267.95 68S 136 494,050.38
1990: Dec s 381 2,219.S3 7 791 14,764.31 322 3 411 2.11 33 574 18,788.0S
1991: Jan 11 SSS 3,S08.7S IS 122 20,720.S9 629 7 230 27.22 70884 34,681.68 Feb 8 620 2,408.22 7 982 13,03S.46 458 6 028 19.41 48 651 2S,S40.IS Mar 8 327 3,388.66 11 013 IS,906.61 425 12 6 745 26.74 SS 939 24,768.01 Apr 7 4SS 2,053.03 20600 32,478.03 421 20 6 599 187.85 S7 684 26, 737.89 May 11 241 2,807.S7 18 691 29,60S.27 S35 16 9 6SO 28.4S 76 416 26,90S.40 Jun 12 ISS 3,Sl9.SS 11 423 18,331.72 S4S 8 062 37.96 68 685 31,851.93 Jui 13 Sl2 3,810.30 13 643 22,08S.24 S98 9 004 29.80 74 9SO 43,8S3.39 Aug 10 134 3,599.56 18 148 33,693.01 631 2 8 201 18.23 68 682 34,18S.71 Sep 12 683 3,415.63 16 146 32, 726.38 SSI 9 984 IS.00 76 324 36,009.46 Oct IS 724 4,321.03 20910 41,082.97 769 9 606 1,622.68 87427 48,279.32 Nov 13 686 4,S83.88 14 786 32,238.07 767 7 SS7 S9.76 71837 40,7ll.6S Dec II 938 3,057.32 12SOO 26,634.63 628 7 236 173.43 66 363 38,34S.17
1992: Jan 12 323 3,9S4.60 10 S03 24,331.92 800 7 IOS 263.2S 67024 S0,214.67 Feb 7422 2, 798.93 8 S37 20,696.38 448 4 S47 41 176 26,496.29 Mar 8 261 2,412.20 9 301 22,840.8S 726 s 264 4S 790 24,960.97 Apr 8039 4,429.83 15 324 39,932.44 793 s 432 0.09 49 748 28,293.92 May 12441 4,217.81 19 166 49,341.85 S93 6 629 69 S07 49,401.S7 Jun 12182 4,696.66 14 296 37, 911.36 787 s 977 64 266 48,36S.64 Jui 12 S23 3,691.64 13 Ill 41,9S8.38 I 068 7 273 71 331 S2,904.S2 Aug 13 205 S,S08.02 13043 36,168.42 872 6 724 4.61 73 Sl2 SS,900.SI Sep 12284 3,888.88 12174 3S,024.80 600 6 998 @ 62 794 4S, 773.99 Oct 10429 3,S83.20 8 S82 29,043.40 662 7 630 53 626 4S,019.03 NoV 7 580 2,996.36 7 522 22,872.53 561 2 6 132 41130 31, 738.03 Dec 7 232 2,98S.04 8 368 2S,262.13 S80 I 6 317 4S 232 34,981.24
Note: Figures for 1990 or before cover only Hong Kong Island, Kowloon and New Kowloon. As from January 1991, figures for New Territories are included. § Figures do not include the value of agreements for sale and purchase. @ Less than O.OS.
44 Hong Kong Monthly Digest of Statistics January .1993
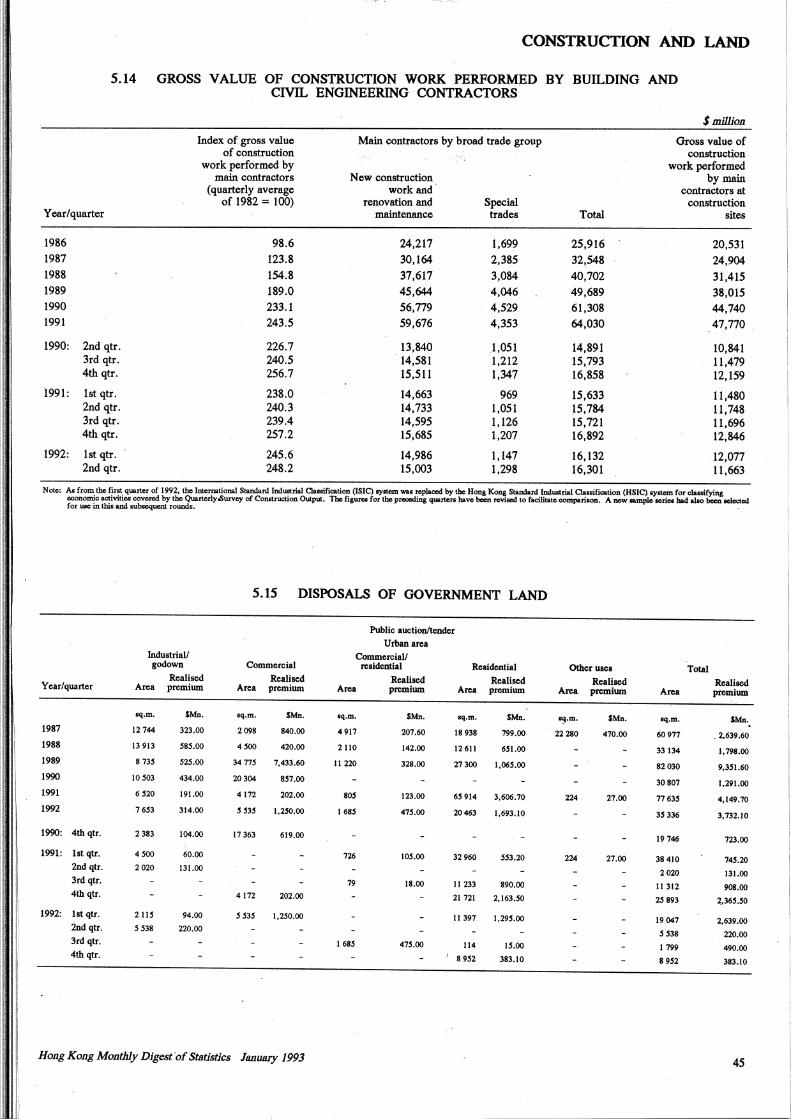
CONSTRUCTION AND LAND
5.14 GROSS VALUE OF CONSTRUCTION WORK PERFORMED BY BUILDING AND
Year/quarter
1986
1987
1988
1989
1990 1991
1990: 2nd qtr. 3rd qtr. 4th qtr.
1991: lst qtr. 2nd qtr. 3rd qtr. 4th qtr.
1992: lst qtr. 2nd qtr.
CIVIL ENGINEERING CONTRACTORS.
Index of gross value of construction
Main contractors by broad trade group
work performed by main contractors New construction
(quarterly average work and of 1982 = 100) renovation and Special
maintenance trades
98.6 24,217 1,699 123.8 30,164 2,385 154.8 37,617 3,084 189.0 45,644 4,046 233.1 56,779 4,529 243.5 59,676 4,353
226.7 13,840 1,051 240.5 14,581 1,212 256.7 15,511 1,347
238.0 14,663 969 240.3 14,733 1,051 239.4 14,595 1,126 257.2 15,685 1,207
245.6 14,986 1,147 248.2 15,003 1,298
$million
Gross value of construction
work performed by main
contractors at construction
Total sites
25,916 20,531 32,548 24,904 40,702 31,415 49,689 38,015 61,308 44,740 64,030 47,770
14,891 10,841 15,793 11,479 16,858 12,159
15,633 11,480 15,784 11,748 15,721 11,696 16,892 12,846
16, 132 ·12,077 16,301 11,663
Note: As from the first quarter of 1992. the IDlemational Standard lndU&trial Classification (ISIC) ~was rcpia-1 by the Hong Kong Standard Industrial Claullication (HSIC} l)'otem for c:laAifying economic activities covered by the Quarterly.&urvey of Construction °"1put. Tho figures for the preceding quarters have been revised to facilitate .,.,_n.on. A new sample series bad a1ao been oolected for use in this and subsequent rounds.
5.15 DISPOSALS OF GOVERNMENT LAND
Public auction/tender
Urban area Industrial/ Commercial/ godown Commercial residential Residential Other uses Total
Realised Realised Realised Realised Realised RcAlised Y car/quarter Area premium Area premium Arca premium Arca premium Arca premium Arca premium
sq.m. $Mn. sq.m. $Mn. sq.m. $Mn. oq.m. $Mn. "!l·m· $Mn. sq.m. $Mn. 1987 12744 323.00 2098 840.00 4917 207.60 18938 799.00 22280 470.00 60977 . 2,639.60 1988 13913 SSS.00 4500 420.00 2110 142.00 12611 6Sl.OO 33134 1,798.00 1989 813S S2S.OO 34775 7,433.60 11 220 328.00 27300 l,06S.OO 82030 9,3Sl.60 1990 10503 434.00 20304 857.00 30807 1,291.00 1991 6S20 191.00 4172 202.00 SOS 123.00 65914 3,606.70 224 27.00 77635 4,149.70 1992 7653 314.00 5 S35 l,2SO.OO 1685 475.00 20463 1,693.10 35 336 3,732.10
1990: 4th qtr. 2383 104.00 17363 619.00 19746 723.00
1991: lst qtr. 4SOO 60.00 726 IOS.00 32960 SS3.20 224 27.00 38410 745.20 2nd qtr. 2020 131.00
2020 131.00 3rd qtr; 79 18.00 11 233 890.00 11 312 908.00 4th qtr. 4172 202.00 21 721 2,163.SO 25893 ~.36S.SO
1992: lst qtr. 2115 94.00 SS3S l,2SO.OO 11 397 1,295.00 19047 2,639.00 2nd qtr. S S38 220.00
S S38 220.00 3rd qtr. I 68S 475.00 114 15.00 I 799 490.00 4th qtr. 8952 383.10 8952 383.10
Hong Kong Monthly Digesfof Statistics January 1993 45
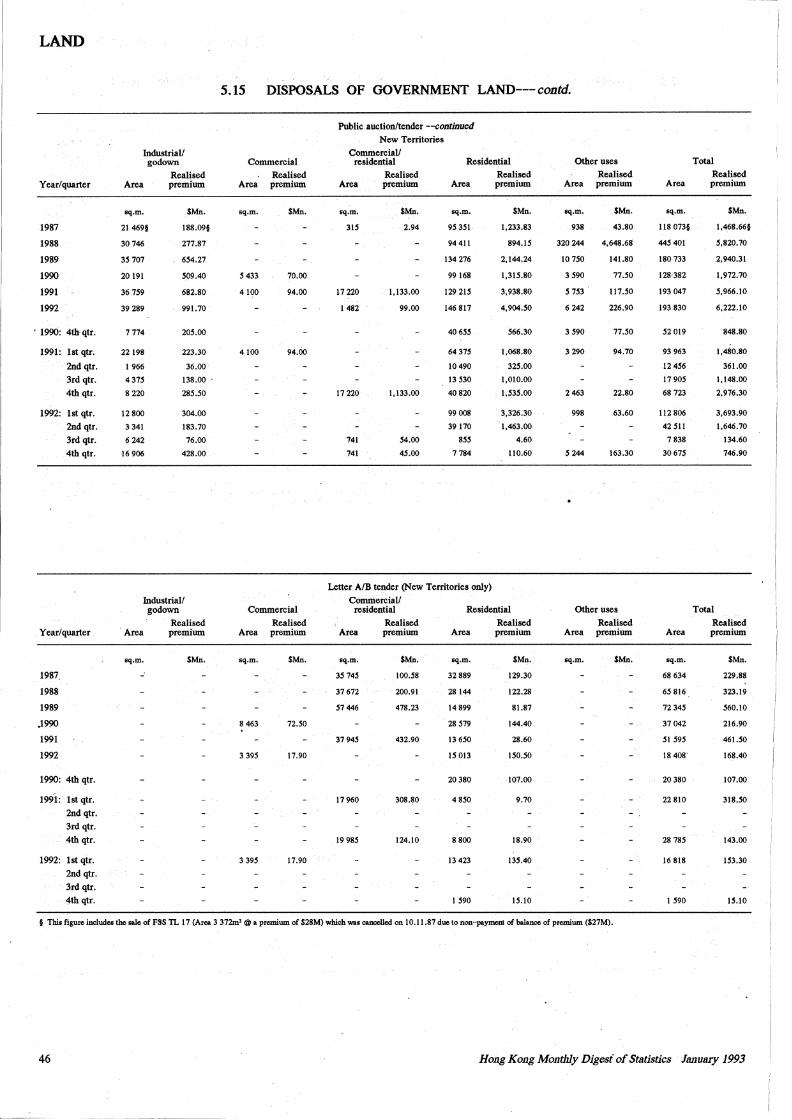
LAND
Year/quarter
1987
1988
1989
1990
1991
1992
• 1990: 4th· qtr.
1991: lst qtr.
2nd qtr. 3rd qtr. 4th qtr.
1992: lst qtr. 2tid qtr. 3td qtr. 4th qtr.
Year/quarter
1987.
1988
1989
J990
1991
1992
1990: 4th qtr.
1991: lst qtr. 2nd qtr. 3rd qtr.
4th qtr.
1992: lst qtr.
2nd qtr.
3rd qtr.
4th qtr.
Industrial/ godown
Area
sq.m.
21 469§
30746
3S707
20191
367S9
39 289
7774
22198
I 966
4375
8220
12800
3341
6242
16906
Realised premium
$Mn.
188.09§
277.87
654.27
509.40
682.80
991.70
205.00
223.30
36.00
138.00 .
285.50
304.00
183.70
76.00
428.00
Industrial/ godown
·Area
sq.m.
..:
Realised premium
$Mn.
5~15 DISPOSALS OF GOVERNMENT. LAND--- contd.
Commercial
Realised Area premium
sq.m.
S433
4100
4100
$Mn.
70.00
94.00
94.00
Commercial
Realised Area premium
sq.m. $Mn.
8463 12.SO
3 395 17.90
3395 17.90
Public auction/tender --continued New Territories
Commercial/ residential
Area
sq.m.
315
17220
1482
17220
·741
741
Realised premium
$Mn.
2.94
1,133.00
99.00
1,133.00
54.00
45.00
Residential
Realised Area
sq.m.
9S3SI
94411
134 276
99168
12921S
146817
40655
6437S
10490
13 530
40820
99008
39170
85S
7784
premium
$Mn.
1,233.83
894.IS
2,144.24
l,31S.80
3,938.80
4,904.SO
S66.30
l,068.80
32S.OO
1.010.00
.1;535.00
3,326.30
1,463.00
4.60
110.60
Letter A/B tender (New Territories only)
Commercial/ residential
Area
sq.m.
3S14S
37672
S1446
37945
17960
1998S
Realised premium
$Mn.
IOO.S8
200.91
478.23
432.90
308.80
124.10
Residential
Realised premium Area
sq.m.
32889
28144
14899
28519
13650
1S013
20380
48SO
8800
13 423
I S90
$Mn.
129.30
122.28
81.87
144.40
28.60
ISO.SO
107.00
9.70
18.90
13S.40
15.10
Other uses
Realised Area premium
sq.m.
938
$Mn.
43.80
320 244 4,648.68
101SO 141.80
3S90
s 1S3.
6 242
3S90
3 290
2463
998
s 244
11.50
111.50
226.90
11.SO
94.70
22.80
63.60
163.30
Other uses
Realised Area premium
sq.m. $Mn.
Area
sq.m.
118 073§
445 401
180733
128·382
193 047
193830
52019
93963
12456
1190S
68723
112 806
42Sll
7838
30675
Area
sq.m.
68634
65816
72345
37042
51 595
18 408'
20380
22810
2818S
16 818
1 590
Total
Realised premium
SMn.
1,468.66§
S,820.70
2,940.31
1,972.70
S,966,10
6,222.10
848.80
l,480.80
361.00
1,148.00
2,976.30
3,693.90
1,646.70
134.60
746.90
Total
Realised premium
$Mn.
229.88
323.19
560.10
216.90
461.50
168.40
107.00
318.SO
143.00
IS3.30
IS.JO
§ This figweinclude& tbo sal~ of FSS TI. 17 (An:a 3 372m'@ a premium of $28M) which was canccllcd on 10.11.87 clue to non-paymmt of balanc1oof premium ($27M).
46 Hong Kong Monthly Digest of Smtistics J1H1uary 1993
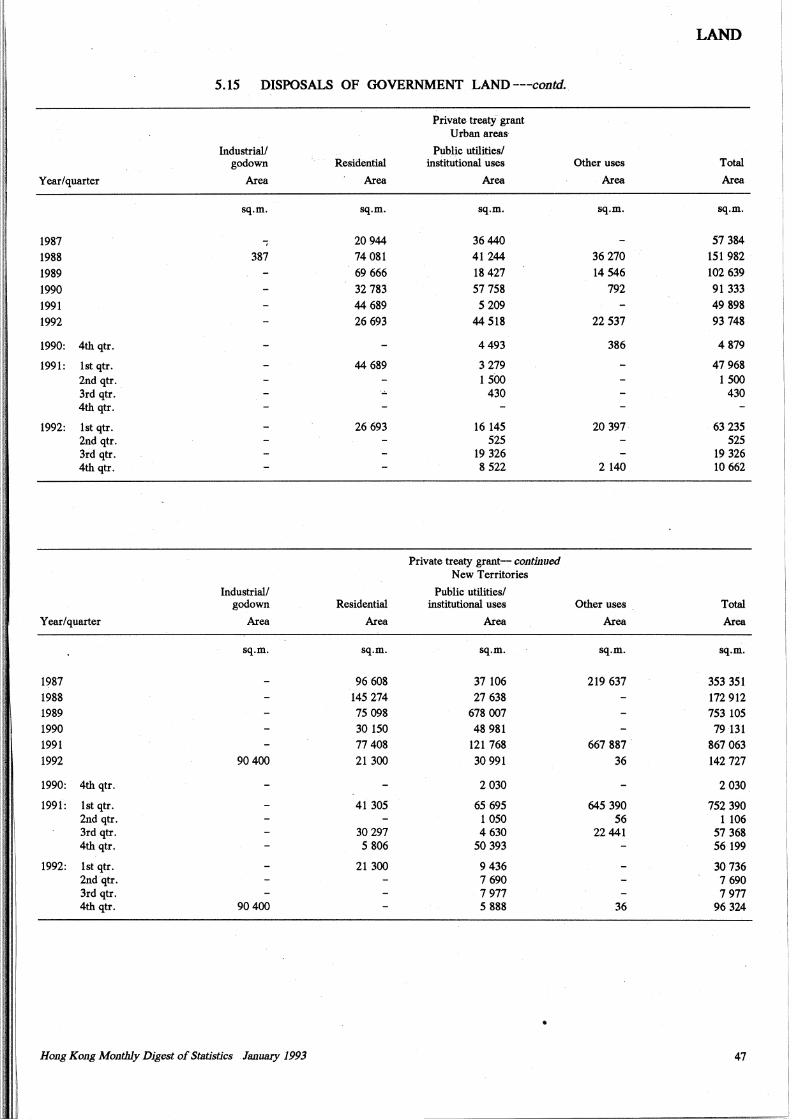
LAND
5.15 DISPOSALS OF GOVERNMENT .LAND ---contd.
Private treatf grant Urban areas
Industrial/ Public utilities/ god own Residential institUtional uses Other uses Total
Year/quarter Area Area Area Area Area
sq.m. sq.m. sq.m. sq.m. sq.m.
1987 -; 20944 36440 57 384
1988 387 74 081 41244 36 270 151 982
1989 69 666 18 427 14546 102 639
1990 32 783 57 758 792 91333
1991 44 689 5 209 49 898
1992 26 693 44 518 22537 93 748
1990: 4th qtr. 4493 386 4879
1991: lst qtr. 44 689 3 279 47968 2nd qtr. 1500 1500 3rd qtr. 430 430 4th qtr.
1992: lst qtr. 26 693 16 145 20 397 63 235 2nd qtr. 525 525 3rd qtr. 19 326 19 326 4th qtr. 8 522 2 140 10 662
Private treaty grant- continued New Territories
Industrial/ Public utilities/ godown Residential institutional uses Other uses Total
Year/quarter Area Area Area Area Area
sq.m. sq.m. sq.m. sq.m. sq.m.
1~87 96 608 37106 219 637 353 351 1988 145 274 27 638 172 912 1989 75 098 678 007 753 105 1990 30 150 48 981 79 131 1991 77408 121 768 667 887. 867 063 1992 90400 21300 30 991 36 142 727
1990: 4th qtr. 2030 2030
1991: lst qtr. 41305 65 695 645 390 752 390 2nd qtr. 1 050 56 1106 3rd qtr. 30297 4 630 22441 57 368 4th qtr. s 806 so 393 56199
1992: lst qtr. 21 300 9436 30 736 2nd qtr. 7 690 7 690 3rd qtr. 7977 7977 4th qtr. 90400 5 888 36 96 324
•
Hong Kong Monthly Digest of Statistics . January 1993 47
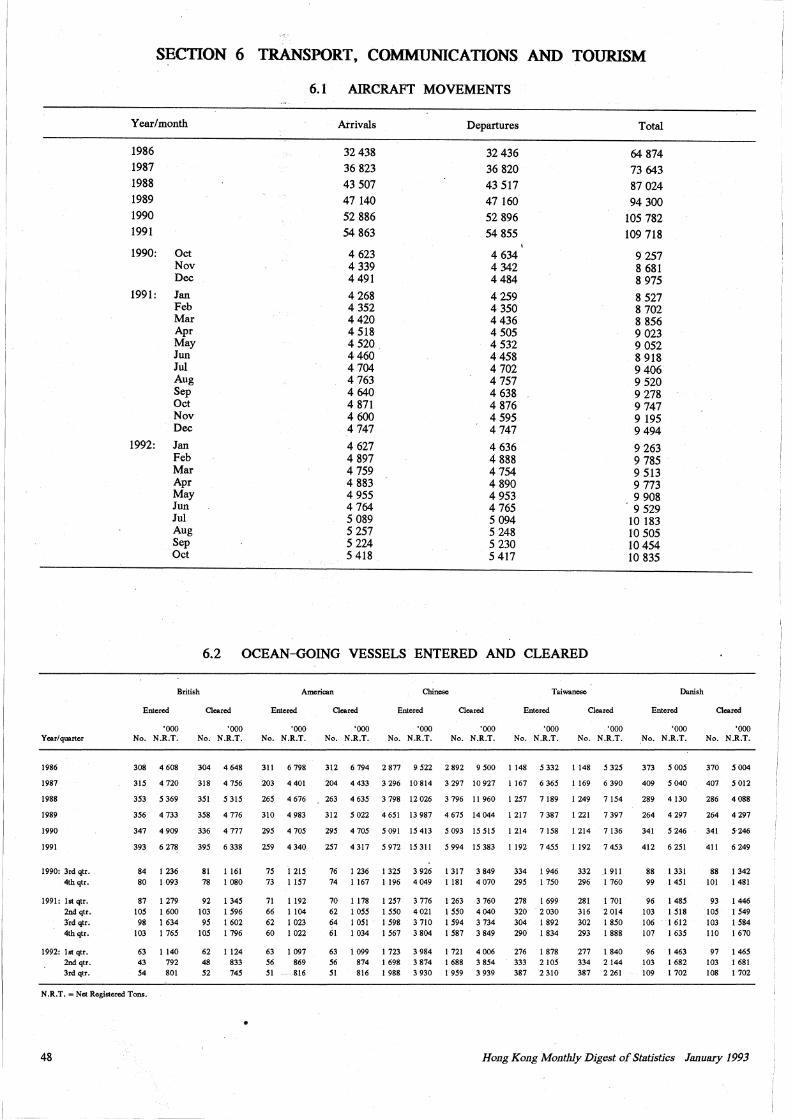
Year/ quarter
1986
1987
1988
1989
1990
1991
1990: 3rd qtr. 4th qtr.
1991: lstqtr. 2nd qtr. 3rd qtr. 4th qtr.
1992: lstqtr. 2nd qtr. 3rd qtr.
SECTION 6 TRANSPORT, COMMUNICATIONS AND TOURISM
Year/month
1986
1987
1988
1989
1990
1991
1990: Oct Nov Dec
1991: Jan Feb Mar Apr May Jun Jul Aug Sep Oct Nov Dec
1992: Jan
Entered
Feb Mar Apr May Jun Jul Aug Sep Oct
British
6.1 AIRCRAFT MOVEMENTS
Arrivals
32 438
36 823
43 507
47 140
52 886
54 863
4 623 4 339 4 491
4 268 4 352 4420 4 518 4 520 4460 4 704 4 763 4 640 4 871 4 600 4 747
4 627 4 897 4 759 4 883 4 955 4 764 5 089 5 257 5 224 5 418
Departures
32 436
36 820
43 517
47 160
52 896
54 855
4 634 4 342 4484
4259 4 350 4 436 4 505 4 532 4 458 4 702 4 757 4 638 4 876 4 595 4 747
4 636 4 888 4 754 4 890 4 953 4 765 5 094 5 248 5 230 5 417
6.2 OCEAN-GOING VESSELS ENTERED AND CLEARED
American Chinese Taiwanese
Cleared Entered Cleared Entered Cleared Entered Cleared
Total
64 874
73 643
87 024
94 300
105 782
109 718
9 257 8 681 8 975
8 527 8 702 8 856 9 023 9 052 8 918 9 406 9 520 9 278 9 747 9 195 9 494
9 263 9 785 9 513 9 773 9 908 9 529
10 183 10 505 10 454 10 835
Entered
Danish
Cleared
'OOO WO 'OOO ·~ 'OOO 'OOO WO 'OOO 'OOO ~00
No. N.R.T. No. N.R.T. No. N.R.T. No. N.R.T. No. N.R.T. No. N.R.T. No. N.R.T. No. N.R.T. No. N.R.T. No. N.R.T.
308 4 608 304 4 648 311 6 798 312 6 794 2 877 9 522 2 892 9 SOO I 148 5 332 I 148 5 325 373 5 005 370 s 004
315 4 720 318 4 156 203 4 401 204 4 433 3 296 10 814 3 297 10 927 I 167 6 365 I 169 6 390 409 5 040 407 5 012
353 5 369 351 5 315 265 4 676 263 4 635 3 798 12 026 3 796 11 960 I 257 7 189 I 249 7 154 289 4 130 286 4 088
356 4 733 358 4 776 310 4983 312 5022 4651 13987 4675 14044 1217 7387 1221 7397 264 4297 264 4297
347 4 909 336 4 777 295 4 705 295 4 105 5 091 15 413 5 093 15 515 I 214 7 158 I 214 7 136
393 6278 395 6338 259 4340 257 4317 5972 15311 5994 15383 1192 7455 1192 7453
84 I 236 80 I 093
87 I 279 105 I 600 98 1 634
103 1 765
63 1140 43 792 54 801
81 1161 78 I 080
92 I 345 103 I 596 95 I 602
105 1 796
62 I 124 48 833 52 745
75 I 215 73 I 157
71 1192 66 1104 62 I 023 60 I 022
63 I 097 56 869 51 816
76 I 236 I 325 3 926 1317 3 849 334 1946 332 I 911 74 I 167 I 196 4 049 1 181 4 070 295 1 750 296 1 760
70 I 178 1 257 3 776 I 263 3 760 278 I 699 281 1 701 62 I 055 1 550 4 021 I 550 4 040 320 2 030 316 2 014 64 I 051 1 598 3 710 1 594 3 734 304 1 892 302 1 850 61 1 034 I 567 3 804 I 587 3 849 290 I 834 293 I 888
63 1 099 I 723 3 984 1 721 4 006 276 I 878 277 1 840 56 874 I 698 3 874 I 688 3 854 333 2 105 334 2 144 SI 816 I 988 3 930 1 959 3 939 387 2 310 387 2 261
341 5 246
412 6 251
88 1 331 99 I 451
96 I 485 103 I 518 106 1612 107 I 635
96 1 463 103 I 682 109 I 702
341 s 246
411 6 249
88 1 342 IOI I 481
93 I 446 105 I 549 103 I 584 110 I 670
97 I 465 103 I 681 108 I 702
N.R.T. =Net Registered Tons.
•
48 Hong Ko11g Monthly Digest of Statistics January 1993
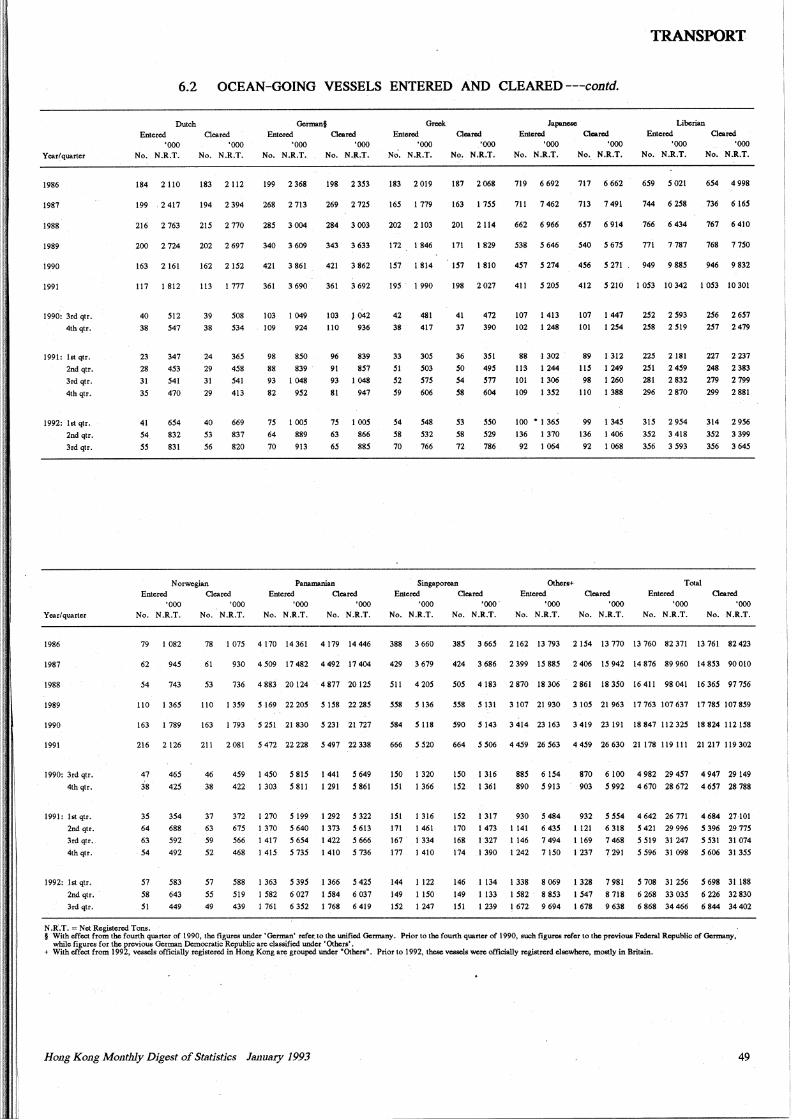
TRANSPORT
6.2 OCEAN-GOING VESSELS ENTERED AND CLEARED ---contd.
Year/quart.er
1986
1987
1988
1989
1990
1991
1990: 3rd qtr. 4th qtr.
1991: lst qtr.
2nd qtr.
3rd qtr.
4th qtr.
1992: lst qtr.
2nd qtr.
3rd qtr.
Year/ quarter
1986
1987
1988
1989
1990
1991
1990: 3rd qtr.
4th qtr.
1991: lst qtr. 2nd qtr.
3rd qtr.
4thqtr.
1992: Jst qtr.
2nd qtr. 3rd qtr.
Dutch Entered Cleared
'OOO 'OOO No. N.R.T. No. N.R.T.
184 2 110
199 . 2417
216 2 763
200 2 724
163 2161
117 1 812
40
38
23
28
31
35
41
S4,
SS
Sl2 S47
347
4S3 S41
470
6S4
832
831
183 2 112
194 2 394
21S 2 770
202 2697
162 21S2
113 I 777
39 38
24
29
31
29
40
S3
S6
S08 534
365
4S8
S41
413
669
837
820
Norwegian Entered Cleared
'OOO 'OOO No. N.R.T. No. N.R.T.
German§ Entered Cleared
'OOO 'OOO No. N.R.T. No. N.R.T.
199 2 368 198 2 3S3
268 2 713 269 2 72S
28S 3 004 284 3 003
340 3 609 343 3 633
421 3 861 421 3 862
361 3 690 361 3 692
103 I 049 103 J 042
109 924 110 936
98 850 96 839
88 839 91 8S7
93 I 048 93 1 048
82 952 81 947
7S I 005 75 1 OOS
64 889 63 866
70 913 6S 885
Panamanian Entered Cleared
'OOO 'OOO No. N.R.T. No. N.R.T.
79 I 082 78 I 07S 4170 14 361 4179 14 446
62 94S
54 743
110 I 36S
163 I 789
216 2 126
47 jg
35 64
63 . S4
57
58 SI
46S
42S
3S4
688
S92 492
S83
643
449
61 930 4S09 17482 4492 17404
53 736 4 883 20 124 4 877 20 125
110 I 359 5 169 22 205 5 158 22 285
163 I 793 5 251 21 830 S 231 21 727
211 2 081 s 472 22 228 5 497 22 338
46
38
37
63
S9
S2
S1
SS
49
4S9
422
372 67S
S66
468
S88
Sl9
439
I 4SO 5 815
I 303. S 811
I 270 S 199
I 370 S 640
1417 S6S4 I 41S S 73S
I 363 S 39S
I S82 6 027
I 761 6 3S2
I 441 5 649
I 291 S 861
I 292 5 322
I 373 5 613
I 422 5 666
1410 5 736
I 366 5 425
I 584 6 037
1768 6419
N.R.T. =Net Registered Tons.
Greek Japaneee> Liberian
Entered Cleared Entered Cleared Entered Cleared 'OOO 'OOO 'OOO 'OOO 'OOO 'OOO
No. N.R.T. No. N.R.T. No. N.R.T. No. N.R.T. No. N.R.T. No. N.R.T.
183 2019 187 2 068 719 6 692 717 6 662 659 5 021 654 4 998
165 I 779 163 I 155 711 7 462 713 7 491 744 6 258 736 6 165
202 2103 201 2 114 662 6 966 657 6 914 766 6 434 767 6 410
172 I 846 171 1829 S38 5 646 540 5 615 771 7 787 768 7750
IS? 1814 157 1810 457 5 274 456 5 271 949 9 885 946 9 832
19S . I 990 198 2 027 411 5 205 412 5 210 I OS3 10 342 I 053 10 301
42
38
33
SI
S2
S9
S4
SS
70
481
417
30S
S03
S75
606
S48
S32
766
41 37
36
so 54 S8
S3
58
72
472 390
3SI
49S
S77
604
sso 529
786
107 1413
102 I 248
88 I 302
113 I 244
101 1306
109 I 3S2
100 • I 365
136 I 370
92 I 064
107 I 447 252 2 593 256 2 6S7
101 I 2S4 258 2 519 2S7 2479
89 1312 225 2181 227 2 237
115 I 249 251 2 4S9 248 2383
98 I 260 281 2 832 279 2 799
110 I 388 296 2870 299 2 881
99 I 345 315 2 954 314 29S6
136 I 406 352 3 418 352 3 399
92 I 068 356 3 S93 3S6 3 645
Singaporean Others+ Total Entered Cleared Entered Cleared Entered Cleared
'OOO 'OOO. 'OOO 'OOO 'OOO 'OOO No. N.R.T. No. N.R.T. No. N.R.T. No. N.R.T. No. N.R.T. No. N.R.T.
388 3 660
429 3 679
Sil 4 205
558 5 136
584 5 118
666 5 520
ISO I 320
!SI I 366
ISI I 316
171 1461
167 I 334
177 1410
144 1122
149 I ISO
152 I 247
385 3 665 2 162 13 793 2 154 13 770 13 760 82 371 13 761 82 423
424 3 686 2 399 IS 88S 2 406 IS 942 14 876 89 960 14 8S3 90 010
SOS 4 183 2 870 18 306 2 861 18350 16 411 98 041 16 365 97 756
SSS 5 131 3 107 21 930 3 105 21 963 17 763 107 637 17 785 107 859
590 5 143 3 414 23 163 3 419 23 191 18 847 112 325 18 824 112158
664 5506 4459 26563 44S9 26630 21178 119111 21217 119302
ISO
IS2
152
170
168
174
146
149
!SI
1316
1361
I 317
1473
1327
1390
1134
1133
I 239
885 6 IS4
890 5 913
930 s 484
I 141 6 435
I 146 7 494
I 242 7 ISO
I 338 8 069
I S82 8 8S3
I 672 9 694
870 6 100
903 5 992
932 5 554 1121 6 318
I 169 7 468
I 237 7 291
I 328 7 981
I 547 8 718
I 678 9 638
4 982 29 457
4 670 28 672
4 642 26 771
5 421 29 996
5 519 31 247
5 596 31 098
s 708 31 2S6
6 268 33 03S
6 868 34 466
4 947 29 149
4 657 28 788
4684 2HOI
s 396 29 77S
s S31 31 074
s 606 31 3SS
s 698 31188
6 226 32 830
6 844 34402
§ With effect from the fourth quarter of 1990, the figures under "German" rcfotto the unified Germany. Prior to the fourth quarter of 1990, moh figures refer to the previous Fodoral Republic of Germany, while figures for the previous German Demccratic Republic arc classified under 'Others'. ·
+ With effect from 1992, ve&sels officially registered in Hong Kong arc grouped under "Others". Prior to 1992. these vessels were officially rcgistrcrd elsewbero, mostly in Britain.
Hong Kong Monthly Digest of Statistics January 1993 49
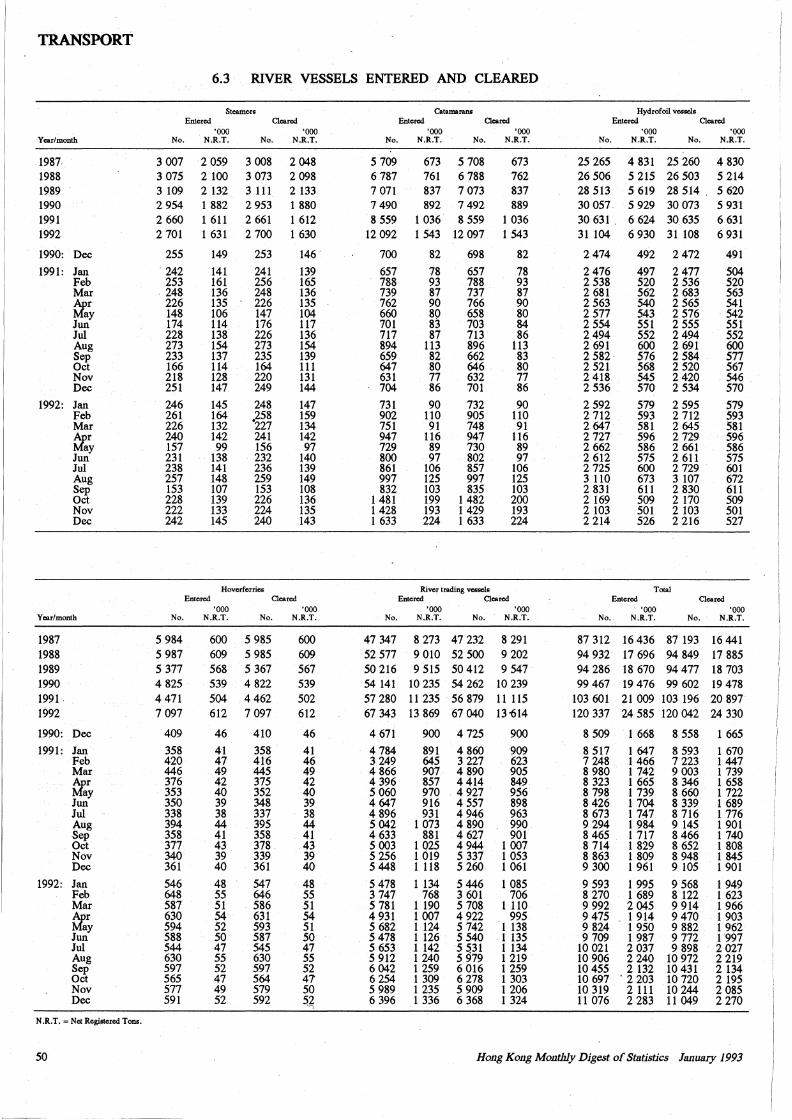
----
TRANSPORT
6.3 RIVER VESSELS ENTERED AND CLEARED
Steamers Catamarans Hydrofoil vessels Entered Cleared Entered Cleared Entered Cleared
'OOO 'OOO 'OOO 'OOO 'OOO 'OOO Year/month No. N.R.T. No. N.R.T. No. N.R.T. No. N.R.T. No. N.R.T. No. N.R.T.
1987 3 007 2 059 3 008 2048 5109 673 5 708 673 25 265 4 831 25 260 4 830 1988 3 075 2 JOO 3 073 2 098 6 787 761 6 788 762 26 506 5 215 26 503 5 214 1989 3 109 2 132 3 111 2 133 7 071 837 7 073 837 28 513 5 619 28 514 . 5 620 1990 2 954 1 882 2 953 1 880 7 490 892 7 492 889 30 057 5 929 30 073 5 931 1991 2 660 1 611 2 661 1 612 8 559 1 036 8 559 1 036 30 631 . 6 624 30_ 635 6 631 1992 2 701 1 631 2 700 1 630 12 092 1 543 12 097 1 543 31 104 6 930 31 108 6 931
1990: Dec 255 149 253 146. 700 82 698 82 2474 492 2472 491
1991: Jan 242 141 241 139 657 78 657 78 2476 497 2477 504 Feb 253 161 256 165 788 93 788 93 2 538 520 2 536 520 Mar 248 136 248 136 739 87 737 87 2 681 562 2 683 563 tlr 226 135 226 135 762 90 766 90 2 563 540 2 565 541
ay 148 106 147 104 660 ~~ 658 80 2 577 543 2 576 542 Jun 174 114 176 117 701 703 84 2 554 551 2 555 551 Jul 228 138 226 136 717 87 713 86 2494 552 2494 552 Aug 273 154 273 154 894 113 896 113 2 691 600 2 691 600 Sep 233 137 235 139 659 82 662 83 2 582. 576 2 584 577 Oct 166 114 164 111 647 80 646 80 2 521 568 2 520 567 Nov 218 128 220 131 631 77 632 77 2 418 545 2420 546 Dec 251 147 249 144 704 86 701 86 2 536 570 2 534 570
1992: Jan 246 145 248 147 731 90 732 90 2 592 579 2 595 579 Feb 261 164 .258 159 902 110 905 110 2 712 593 2 712 593 Mar 226 132 227 134 751 91 748 91 2 647 581 2 645 581 tlr 240 142 241 142 947 116 947 116 2 727 596 2 729 596
ay 157 99 156 97 729 89 730 89 2 662 586 2 661 586 Jun 231 138 232 140 800 97 802 97 2 612 515 2 611 575 Jul 238 141 236 139 861 106 857 106 2 725 600 2 729 601 Aug 257 148 259 149 997 125 997 125 3 110 673 3 107 672 Sep 153 107 153 108 832 103 835 103 2 831 611 2 830 611 Oct 228 139 226 136 1 481 199 1482 200 2 169 509 2 170 509 Nov 222 133 224 135 1 428 193 1429 193 2 103 501 2 103 501 Dec 242 145 240 143 1 633 224 1 633 224 2 214 526 2 216 527
Hoverferries River trading vessels Total Entered Cleared Entered Cleared Entered Cleared
'OOO 'OOO 'OOO 'OOO 'OOO 'OOO Year/month No. N.R.T. No. N.R.T. No. N.R.T. No. N.R.T. No. N.R.T. No. N.R.T.
1987 5 984 600 5 985 600 47 347 8 273 47 232 8 291 87 312 16 436 87 193 16 441 1988 5 987 609 5 985 609 52 577 9 010 52 500 9 202 94 932 17 696 94 849 17 885 1989 5 377 568 5 367 567 50 216 9 515 50 412 9 547 94 286 18 670 94477 18 703 1990 4 825 539 4 822 539 54 141 10 235 54 262 10 239 99 467 19 476 99 602 19 478 1991. 4 471 504 4462 502 57 280 11 235 56 879 11 115 103 601 21 009 103 196 20 897 1992 7 097 612 7 097 612 67 343 13 869 67 040 13-614 120 337 24 585 120 042 24 330
1990: Dec 409 46 410 46 4 671 900 4 725 900 8 509 1 668 8 558 1 665
1991: Jan 358 41 358 41 4 784 891 4 860 909 8 517 1 647 8 593 1 670 Feb 420 47 416 46 3 249 645 3 227 623 7 248 1 466 7 223 1447 Mar 446 49 445 49 4 866 907 4 890 905 8 980 1 742 9 003 1 739 tlr 376 42 375 42 4 396 857 4 414 849 8 323 1 665 8 346 1 658
ay 353 40 352 40 5 060 970 4 927 956 8 798 1 739 8 660 1 722 Jun 350 39 348 39 4 647 916 4 557 898 8426 1704 8 339 1 689 Jul 338 38 337 38 4 896 931 4 946 963 8 673 1 747 8 716 1 776 Aug 394 44 395 44 5 042 1 073 4 890 990 9 294 1 984 9 145 1 901 Sep 358 41 358 41 4 633 881 4 627 901 8 465 1 717 8 466 1 740 Oct 377 43 378 43 5 003 1 025 4 944 1 007 8 714 1 829 8 652 1 808 Nov 340 39 339 39 5 256 1 019 5 337 1 053 8 863 1 809 8 948 1 845 Dec 361 40 361 40 5 448 1 118 5 260 1 061 9 300 1 961 9 105 1 901
1992: Jan 546 48 547 48 5 478 1 134 5 446 1 085 9 593 1 995 9 568 1949 Feb 648 55 646 55 3 747 768 3 601 706 8 270 1 689 8 122 1 623 Mar 587 51 586 51 5 781 1 190 5 708 1 110 9 992 2 045 9 914 1 966 tlr 630 54 631 54 4 931 1 007 4 922 995 9475 1 914 9 470 1 903
ay 594 52 593 51 5 682 1 124 5 742 1 138 9 824 1 950 9 882 1962 Jun 588 50 587 50 5 478 1 126 5 540 1 135 9 709 1 987 9 772 1 997 Jul 544 47 545 47 5 653 1 142 5 531 1 134 10 021 2 037 9 898 2027 Aug 630 55 630 55 5 912 1 240 5 979 1 219 10 906 2 240 10 972 2 219 Sep 597 52 597 52 6042 1 259 6 016 1 259 10 455 2 132 10 431 2 134 Oct 565 47 564 41 6 254 1 309 6 278 1 303 10 697 . 2 203 10 720 2 195 Nov 577 49 579 50 5 989 1 235 5 909 1 206 10 319 2 111 10 244 2 085 Dec 591 52 592 5], 6 396 1 336 6 368 1 324 11 076 2 283 11 049 2 270
N.R.T. ~Net Registered Tons.
50 Hong Kong Monthly Digest of St11tistics January 1993
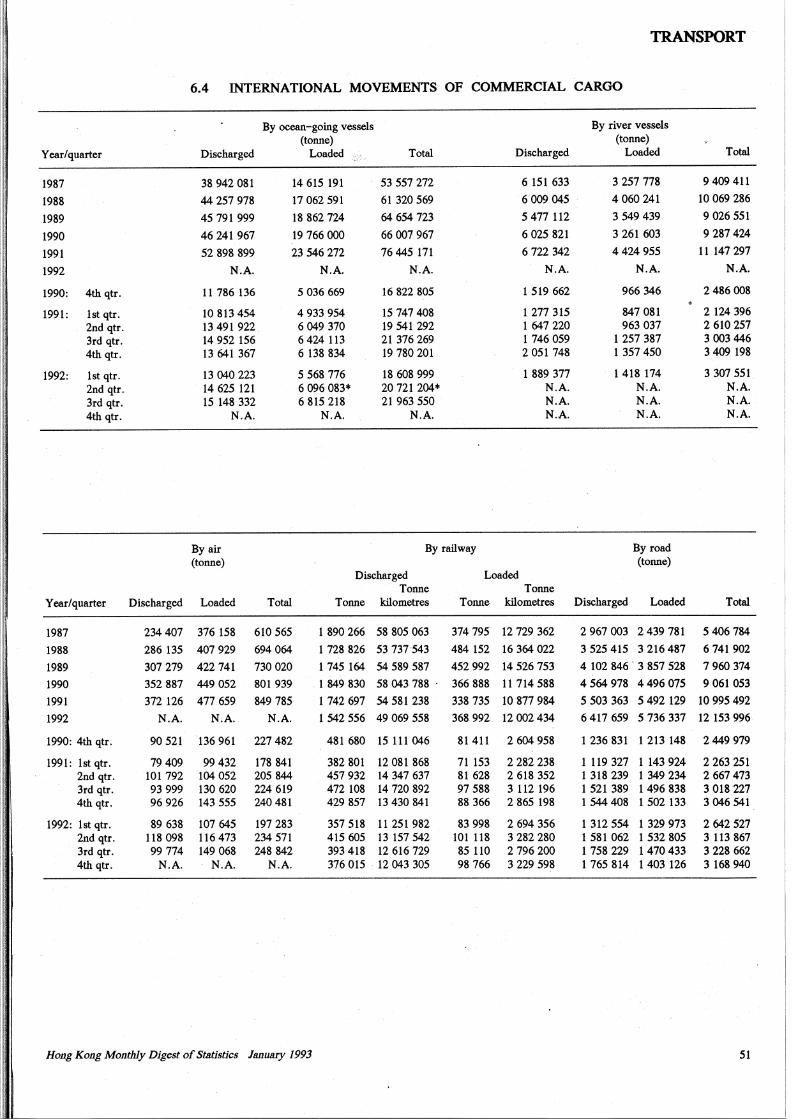
TRANSPORT
6.4 INTERNATIONAL MOVEMENTS OF COMMERCIAL CARGO
By ocean-going vessels By river vessels (tonne) (tonne)
Year/quarter Discharged Loaded -.~;:::~ - Total Discharged Loaded Total
1987 38 942 081 14 615 191 53 557 272 6 151 633 3 257 778 9409 411
1988 44 257 978 17 062 591 61320569 6 009 045 4 060 241 10 069 286
1989 45 791 999 18 862 724 64 654 723 5 477 112 3 549 439 9 026 551
1990 46 241 967 19 766 OOO 66 007 967 6 025 821 3 261 603 9 287 424
1991 52 898 899 23 546 272 76 445 171 6 722 342 4424 955 11147 297
1992 N.A. N.A. N.A. N.A. N.A. N.A.
1990: 4th qtr. 11786136 5 036 669 16 822 805 1 519 662 966 346 2486 008
199i: lst qtr. 10 813 454 4 933 954 15 747 408 1 277 315 847 081 2 124 396 2nd qtr. 13 491 922 6 049 370 19 541 292 1647220 963 037 2 610 257 3rd qtr. 14 952 156 6 424 113 21376269 1746 059 1 257 387 3 003 446 4th qtr. 13 641 367 6 138 834 19 780 201 2 051 748 1357450 3 409 198
1992: lst qtr. 13 040 223 5 568 776 18 608 999 1 889 377 1 418 174 3 307 551 2nd qtr. 14 625 121 6 096 083• 20 721 204• N.A. N.A. N.A. 3rd qtr. 15 148 332 6 815 218 21963550 N.A. N.A. N.A. 4th qtr. N.A. N.A. N.A. N.A. N.A. N.A.
By air By railway By road (tonne) (tonne)
Discharged Loaded Tonne Tonne
Year/quarter Discharged Loaded Total Tonne kilometres Tonne kilometres Discharged Loaded Total
1987 234407 376 158 610 565 1890266 58 805 063 374 795 12 729 362 2 967 003 2 439 781 5 406784
1988 286 135 407 929 694 064 1 728 826 53 737-543 484 152 16 364 022 3 525 415 3 216 487 6 741 902
1989 307 279 422 741 730 020 1745164 54 589 587 452 992 14 526 753 4 102 846 . 3 857 528 7 960 374
1990 352 887 449 052 801 939 1849830 58 043 788 . 366 888 11714588 4 564 978 4 496 075 9 061 053
1991 372 126 477 659 849 785 1742697 54 581 238 338 735 10 877 984 5 503 363 5 492 129 10 995 492
1992 N.A. N.A. N.A. 1542556 49 069 558 368 992 12 002 434 6 417 659 5 736 337 12 153 996
1990: 4th qtr. 90 521 136 961 227 482 481 680 15 111 046 81411 2 604 958 1 236 831 1 213 148 2449 979
1991: lst qtr. 79 409 99 432 178 841 382 801 12 081 868 71 153 2 282 238 1119 327 1 143 924 2 263 251 2nd qtr. 101 792 104 052 205 844 457 932 14 347 637 81 628 2 618 352 1 318 239 1349234 2 667 473 3rd qtr. 93 999 130 620 224 619 472 108 14 720 892 97 588 3 112 196 1 521 389 1496 838 3 018 227 4th qtr. 96 926 143 555 240 481 429 857 13 430 841 88 366 2 865 198 1544408 1502133 3 046 541
1992: lst qtr. 89 638 107 645 197 283 357 518 11 251982 83 998 2 694 356 1312554 1329973 2 642 527 2nd qtr. 118 098 116 473 234 571 415 605 13 157 542 101 118 3 282 280 1 581 062 1 532 805 3 113 867 3rd qtr. 99 774 149 068 248 842 393 418 12 616 729 85 110 2 796 200 1 758 229 1470 433 3 228 662 4th qtr. N.A. N.A. N.A. 376 015 12 043 305 98 766 3 229 598 1 765 814 1403 126 3 168 940
Hong Kong Monthly Digest of Statistics January 1993 51
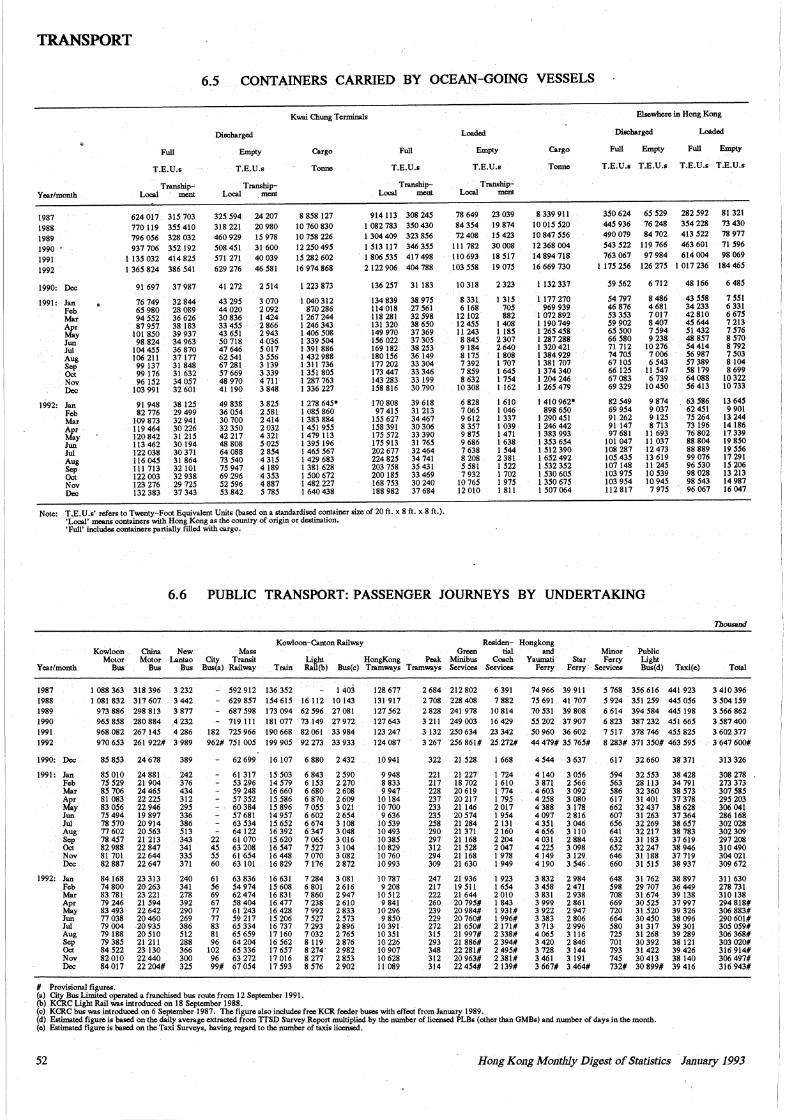
TRANSPORT
6.5 CONTAINERS CARRIED BY OCEAN-GOING VESSELS
Year/month
1987 1988 1989 1990 1991 1992
1990: Dec
1991: Jan Feb Mar Apr May Jun Jui Aug Sep Oct Nov Dec
1992: Jan Feb Mar Apr May Jun Jui Aug Sep Oct Nov Dec
Full
T.E.U.s
Transbip-Local ment
624 017 31S 703 770119 3SS410 796 OS6 328 032 937 706 3S2 192
I 135 032 414 825 I 365 824 386 S41
91 697 37 987
76 749 6S 980 94 S52 87 957
101850 98 824
104 455 106 211 99 137 99 176 96 152
103 991
91 948 82 776
109 873 119 464 120 842 113 462 122 038 116 045 111 713 122 003 123 276 132 383
32 844 28 089 36 626 38 183 39 937 34 963 36 870 37177 31 848 31 632 34 057 32 601
38 125 29 499 32 941 30 226 31 21S 30 194 30371 31 864 32101 32 938 29 725 37 343
Discharged
Empty
T.E.U.s
Transbip-Local ,ment
325 594 24 207 318 221 20 980 460 929 IS 978 508 451 31 600 S11 271 40 039 629 276 46 S81
41 272
43 295 44 020 30 836 33 4SS 43 6SI so 718 47646 62 S41 67 281 S1669 48 970 41190
49 838 36 OS4 30700 32 350 42 217 48 808 64 088 73 S40 75 947 69 296 S2 596 53 842
2 St4
3 070 2 092 1424 2 866 2 943 4 036 5 017 3 SS6 3 139 3 339 4 711 3 848
3 825 2 S81 2 414 2 032 4321 5 025 2 854 4 31S 4189 4 3S3 4 887 5 785
Kwai Chung Terminals
Cargo
Tonne
8858127 10 760 830 10 758 226 12 2SO 49S IS 282 602 16 974 868
I 223 873
I 040 312 87D 286
I 267 244 I 246 343 I 406 508 I 339 504 I 391 886 I 432 988 I 311 736 I 351 805 I 287 763 I 336 227
I 278 64S* I 085 860 I 383 884 I 451 955 1 479 113 1395196 I 46S S61 I 429 683 I 381 628 I SOO 672 I 482 227 I 640 438
Full
T.E.U.s
Transbip-Local ment
914 113 308 245 I 082 783 350 430 I 304 409 323 856 I 513 117 346 3SS I 806 535 417 498 2 122 906 404 788
136 257 31 183
134 839 114 018 118 281 131 320 149 970 156 022 169182 180 156 177 202 173 447 143 283 158 816
170 808 97 415
155 627 158 391 175 572 175 913 202 677 224 825 203 758 200 185 168 753 188 982
38 975 27 561 32 598 38 650 37 369 37 30S 38 253 36 149 33 304 33 346 33199 30 790
39 618 31 213 34 467 30 306 33 390 31 765 32 464 34 741 3S 431 33 469 30 240 37 684
Note: T .E. U .s' refers to Twenty-Foot Equivalent Units (based on a standardised container size of 20 ft. x 8 ft. x 8 ft.). 'Local' means containers with Hong Kong as the country of origin or destination. 'Full' includes containers partially filled with cargo. ·
Loaded
Empty
T.E.U.s
Transhipc Local ment
78 649 23 039 84 354 19 874 72 408 15 423
111 782 30 008 110693 18517 103 SSS 19 07S
10 318
8 331 6 168
12102 12 455 11 243 8 84S 9 184 8 175 7 392 7 8S9 8 632
10308
6 828 7 065 9 612 8 3S7 9 875 9 686 7 638 8 208 5 581 7 932
10 76S 12010
2 323
I 31S 705 882
I 408 I 18S 2 307 2 640 I 808 I 707 I 645 I 1S4 1162
1 610 I 046 I 337 I 039 I 471 I 638 I S44 2 381 I 522 I 702 I 91S I 811
Cargo
Tonne
8339911 10 OlS S20 10 847 SS6 12 368 004 14 894 718 16 669 730
I 132 337
I 177 270 969 939
I 072 892 I 190 749 I 26S 4S8 I 287 288 I 320 421 I 384 929 I 381 707 I 374 340 I 204 246 I 26S 479
I 410962* 898 6SO
I 290 4SI I 246 442 I 383 993 I 353 654 1512390 I 6S2 492 I S32 352 I 530 60S I 350 61S I S01064
Elsewhere in Hong Kong
· Discharged Looded
Full Empty Full Empty
T.E.U.s T.E.U.s T.E.U.s T.E.U.s
350 624 6S S29 282 S92 81 321
44S 936 76 248 3S4 228 73 430 490 079 84 702 413 S22 78 977 S43 522 119 766 463 601 71 S96 763 067 97 984 614 004 98 069
I 175 256 126 275 I 017 236 184 46S
S9 S62
S4797 46 876 S3 3S3 S9 902 6S SOO 66 S80 71 712 74705 67 !OS 66 125 67083 69 329
82 S49 69 954 91 262 91 147 97 681
IOI 047 108 287 IOS 435 107148 103 97S 103 9S4 112 817
6 712
8 486 4681 7017 8 407 7 594 9 238
10276 7006 6 543
11 S47 6 739
10450
9 874 9 037 9 125 8 713
11 693 11 037 12 473 13 619 II 245 10 S39 1094S 7 97S
48 166
43 558 34 233 42810 4S644 51432 48 8S7 54414 S6 987 S1389 S8 179 64 088 S6 413
' 63 S86 62 4SI 1S 264 73 196 76 802 88 804 88 889 99 076 96 530 98 028 98 543 96 067
6 48S
7 SSI 6 331 6 61S 7 213 7 576 8 S10 8 792 7 S03 8 104 8 699
10322 10 733
13 64S 9901
13 244 14186 17 339 198SO 19 SS6 17 291 IS 206 13 213 14 987 16047
6.6 PUBLIC TRANSPORT: PASSENGER JOURNEYS BY UNDERTAKING
Thousand
Kowloon-Canton Raihvay Residen- Hongkong Minor· Green tial and Kowloon
Motor Bus
China Motor
Biis
New Lantao
Bus
Mass City Transit
Bus(a) Railway Light JtongKong Peak Minibus Coach Y aumati Star Ferry
Public Light Bus(d) Year/month Train Rail(b) Bus(c) Tramways Tramways Services Services Ferry Ferry Services Taxi(e)
1987 1988 1989 1990 1991 1992
1990: Dec
1991: Jan Feb Mar Apr May Jun Jui Aug Sep Oct Nov Dec
1992: Jan Feb Mar Apr May Jun Jui Aug Sep Oct Nov Dec
I 088 363 318 396 3 232 I 081 832 317 607 3 442
973886 298813 3877 965 8S8 280 884 4 232 968 082 267 14S 4 286 970 6S3 261 922# 3 989
85 853 24 678
85010 75 529 8S 706 81 083 83 OS6 75 494 78 S70 77 602 78 457 82 988 81 701 82 887
84 168 74800 83 781 79 246 83 493 77 038 79 004 79 188 79 38S 84 522 82010 84 017
24 881 21 904 24 46S 2222S 22 946 19 897 20914 20 563 21 213 22847 22 644 22647
23 313 20263 23 221 21 594 22642 20460 20 935 20510 21211 23 130 22440 22 204#
389
242 376 434 312 29S 336 386 513 343 341 33S 371
240 341 278 392 290 269 386 512 288 366 300 325
# Provisional figures.
- S92 912 136 3S2 I 403 - 629 857 154 615 16 112 10 143 - 687 598 173 094 62 596 27 081 - 719 111 181 077 73 149 27 972
182 725 966 190 668 82 061 33 984 962# 751 005 199 905 92 273 33 933
22 45 55 60
61 56 69 67 77 77 83 81 96
102 96 99#
62 699 16 107 6 880 2 432
61 317 53 296 S9 248 57 352 60 384 57 681 63 534 64122 61 070 63 208 61 654 63 101
63 836 54 974 62 474 58 404 61 243 59 217 65 334 65 659 64 204 65 336 63 272 67 OS4
IS 503 14 579 16 660 IS 586 IS 896 14 957 15 652 16 392 IS 620 16 547 16 448 16 829
16 631 15 608 16 831 16477 16 428 15 206 16 737 17160 16 562 17 657 17 016 17 593
6 843 6 153 6 680 6 870 7 oss 6 602 6 674 6 347 7 065 7 527 7070 7176
7 284 6 801 7 860 7 238 7 992 7 527 7 293 7 032 8 119 8 274' 8 277 8 576
2 590 2270 2 608 2 609 3 021 2 654 3 108 3 048 3 016 3 104 3 082 2872
3081 2 616 2 947 2610 2 833 2 573 2 896 2 765 2 876 2 982 2 8S3 2 902
(a) City Bus Limited operated a franchised bus route from 12 September 1991. (b) KCRC Light Rail was introduced on 18 September 1988.
128 677 131 917 127 562 127 643 123 247 124 087
10941
9 948 8 833 9 947
10 184 10700 9 636
10 S39 10 493 10 38S 10 829 10 760 10 993
10 787 9 208
10 512 9 841
10 296 9 850
10 391 10 351 10 226 10 907 10 628 11 089
2 684 212 802 2 708 228 408
6 391 7 882
2 828 241 978 10 814 3 211 249 003 16 429 3 132 250 634 23 342 3267 2S6861# 2S272#
322 21 528
221 217 228 237 233 235 258 290 297 312 294 309
247 217 222 260 239 229 272 315 293 348 312 314
21 227 18 702 20 619 20 217 21146 20 574 21 284 21 371 21168 21 S28 21 168 21 630
21 936 19 511 21 644 20195# 20 984# 20 760# 21 650# 21 997# 21 886# 22 281# 20 963# 22 454#
I 668
I 724 1 610 I 774 I 19S 2017 I 954 2 131 2 160 2204 2047 1 978 I 949
I 923 I 6S4 2010 1 843 I 931# I 996# 2171# 2 338# 2 394# 2 495# 2 381# 2139#
(c) KCRC bus was introduced on 6 September 1987. The figure also includes free KCR feeder buses with effect from January 1989.
74 966 39 911 15 691 41 707
5 768 356 616 441 923 5 924 3S 1 2S9 445 056
70531 39808 6614 394584 445198 55 202 37 907 6 823 387 232 451 66S SO 960 36 602 7 SI 7 378 746 45S 825 44 479# 35 765# 8 283# 371 3SO# 463 59S
4 544 3 637
4140 3 871 4 603 4 258 4 388 4097 4 351 4 656 4031 4 225 4 149 4190
3 832 3 458 3 831 3 999 3 922 3 383 3 713 406S 3 420 3 728 3 461 3 667#
3 056 2 566 3 092 3 080 3 178 2 816 3 046 3 110 2884 3 098 3 129 3 546'
2 984 2 471 2 938 2 861 2 947 2806 2 996 3 116 2 846 3 144 3 191 3 464#
617 32 660 38 371
S94 S63 586 617 662 607 656 641 632 652 646 660
648 598 708 669 720 664 580 725 701 793 14S 732#
32 553 28 113 32 360 31 401 32 437 31 263 32 269 32 217 31 183 32 247 31188 31 51S
31 762 29 707 31 674 30 525 31 S20 30 4SO 31 317 31 268 30 392 31 422 30 413 30 899#
38 428 34791 38 S73 37 378 38 628 37 364 38 657 38 783 37 619 38 946 37 719 38 937
38 897 36 449 39 138 37 997 39 326 38 096 39 301 39 289 38 121 39 426 38 140 39 416
(d) Estimated figure is based on the daily average extracted.from TTSD Survey Report multiplied by the number of licensed PLBs (other than GMBs) and number of days in the month. (e) Estimated figure is based on the Taxi Surveys, having regard to the number of taxis licensed.
Total
3 410 396 3 S04 IS9 3 566 862 3 S87 400 3 602 377 3 647 600#
313 326
308 278 273 373 307 SSS 295 203 306 041 286 168 302 028 302309 297 208 310 490 304021 309 672
311 630 278 731 310 138 294 818# 306883# 290601# 30S OS9# 306 368# 303 020# 316 914# 306 497# 316 943#
52 Hong Kong Monthly Digest of Statistics January 1993
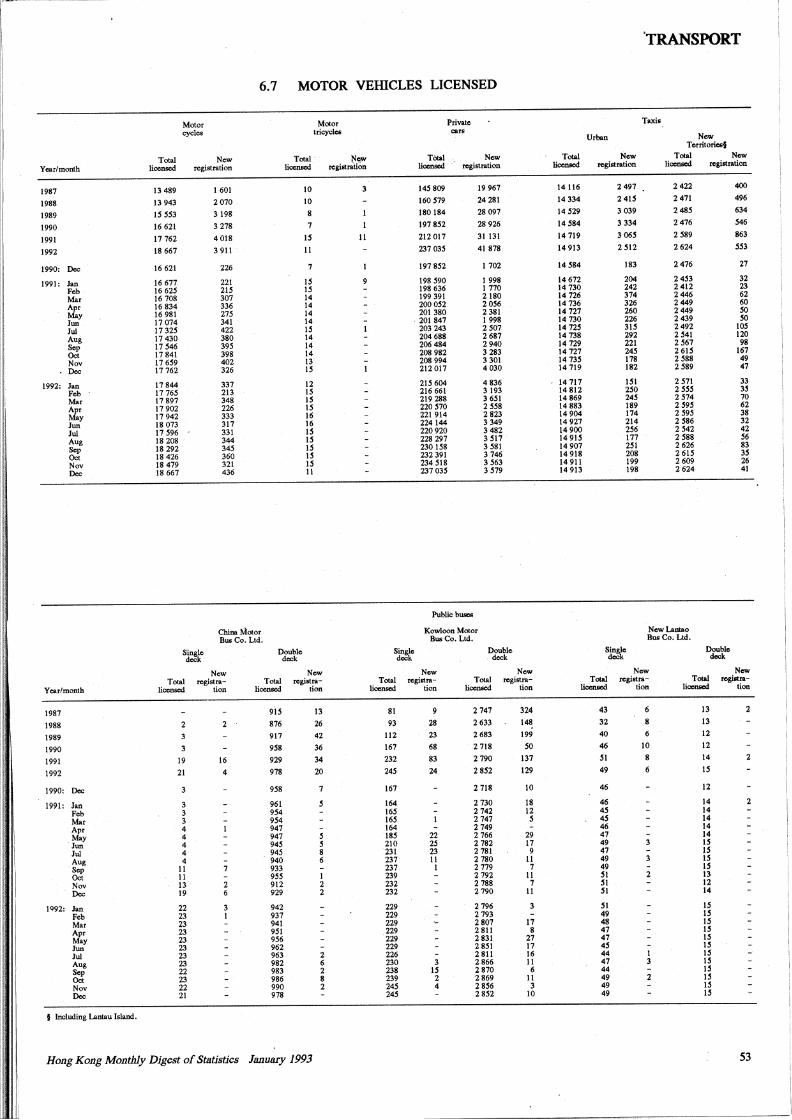
'TRANSPORT
6.7 MOTOR VEHICLES LICENSED
Motor Motor Private Taxis
cycles tricycle& cars-Urban New
Territories§
Total New Total . ?<cw Total New Total New Total Now
Year/month licensed registration licensed registraiiO.. licensed. registration licensod registration licensod registration
1987 13 489 1601 10 3 14S 809 19967 14116 2497 2422 400
1988 13 943 2070 10 160 S79 24281 14334 241S 2471 496
1989 IS S53 3198 8 180184 28097 14S29 3 039 248S 634
1990 16621 3 278 7 1978S2 28926 !4S84 3 334 2476 S46
1991 17762 4018 IS II 212017 31131 14719 306S 2 S89 863
1992 18 667 3 911 II 237 03S 41878 14913 2Sl2 2624 SS3
1990: Dec 16621 226 7 197 8S2 1702 14S84 183 2476 27
1991: Jan 16 677 221 IS 9 198 S90 1998 14672 204 2 4S3 32
Feb 1662S 215 IS 198 636 I 770 14730 242 2412 23
Mar 16708 307 14 199 391 2180 14726 374 2446 62
Apr 16 834 336 14 2000S2 20S6 14736 326 2449 60
May 16 981 27S 14 201 380 2381 14727 260 2449 so Jun 17074 341 14 ' 201847 1998 14730 226 2439 so Jui 1732S 422 IS 203 243 2S07 14725 31S 2492 IOS
Aug 17430 380 14 204 688 2687 14738 292 2S41 120
Sep 17 546 39S 14 206 484 2 940 14729 221 2S67 98
Oct 17841 398 14 208 982 3283 14727 24S 261S 167
Nov 176S9 402 13 208 994 3301 1473S 178 2S88 49
Dec 17762 326 IS 212017 4030 14 719 182 2S89 47
1992: Jan 17844 337 12 21S 604 4 836 14717 ISI 2S71 33
Feb 1776S 213 IS 216 661 3193 14812 250 2 SSS 3S
Mar 17897 348 IS 219 288 3651 14869 24S 2 S74 70
Apr 17902 226 IS 220S70 2SS8 14883 189 2S9S 62
May 17942 333 16 221914 2 823 14904 174 2S9S 38
Jun 18 073 317 16 224144 3349 14927 214 2 S86 32
Jui 17 S96 331 IS 220920 3482 14900 256 2 S42 42
Aug 18208 344 IS 228 297 3 Sl7 l49IS 177 2S88 56
Sep 18 292 34S IS 230158 3 S81 14907 2SI 2626 83
Oct 18 426 360 IS 232 391 3 746 14918 208 261S 3S
Nov 18 479 321 IS 234 518 3S63 14911 199 2609 26
Dec 18 667 436 11 237 03S 3579 14913 198 2624 41
Public buses
China Motor Kowloon Motor Ncwl.anlaO Bus Co. Ltd. Bus Co. Ltd. Bus Co. Ltd.
s~ Double S~e Double s~ Double deck deck deck
New Now New Now New New
Total rcgistra- Total registra- Total rcgistra- Total rcgistra- Total regi&tra- Total rcgi&tra-
Year/month licensod tion licensod lion licensod lion licensed lion licensod lion licensod lion
1987 9lS 13 81 9 2 747 324 43 6 13 2
1988 2 2 876 26 93 28 2633 148 32 8 13
1989 3 917 42 112 23 2683 199 40 6 12
1990 3 9S8 36 167 68 2 718 so 46 10 12
1991 19 16 929 34 232 83 2 790 137 SI 8 14 2
1992 21 4 978 20 245 24 2 852 129 49 6 IS
1990: Dec 3 9S8 7 167 2 718 10 46 12
1991: Jan 3 961 164 2 730 18 46 14 2
Feb 3 9S4 16S 2 742 12 4S 14
Mar 3 9S4 165 2 747 s 4S 14
Apr 4 947 164 2 749 46 14
May 4 947 s 18S 22 2766 29 47 14
Jwt 4 94S s 210 25 2 782 17 49 3 IS
Jui 4 94S 8 231 23 2 781 9 47 IS Aug 4 . 940 6 237 II 2 780 11 49 IS Sep 11 7 933 237 I 2779 7 49 IS Oct II 955 I 239 2792 11 SI 2 13
Nov 13 2 912 2 232 2 788 7 SI 12
Dec 19 6 929 2 232 2 790 II SI 14
IQ92: Jan 22 942 229 2 796 3 SI IS
Feb 23 937 229 2793 49 IS Mar 23 941 229 2807 17 48 IS Apr 23 9SI 229 2 811 8 47 IS May 23 956 229 2831 27 47 IS Jun 23 962 229 2 8SI 17 4S IS
Jui 23 963 2 226 2811 16 44 I 15 Aug 23 982 6 230 3 2866 II 47 3 IS Sep 22 983 2 238 IS 2870 6 44 IS Oct 23 986 8 239 2 2 869 II 49 2 IS Nov 22 990 2 24S 4 2 8S6 3 49 IS Dec 21 978 245 2 8S2 10 49 IS
§ Including Lanlau Island.
Hong Kong Monthly Digest of Statistics January 1993 53
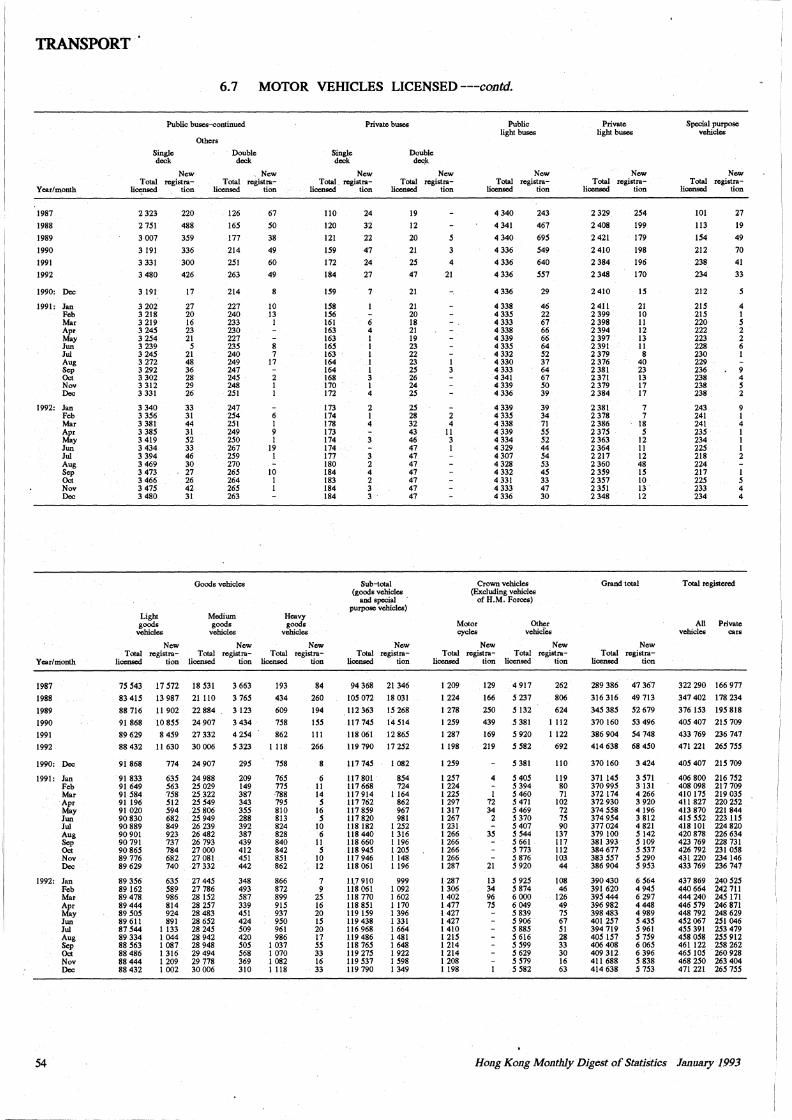
TRANSPORT.
Year/month
1987
1988
1989
1990
1991
1992
1990: Dec
1991: Jan Feb Mar Apr May Jun Jui Aug Sep Oct Nov Dec
1992: Jan Feb Mar Apr May Jun Jui Aug Sep Oct Nov Dec
Year/month
1987
1988
1989
1990
1991
1992
1990: Dec
1991: Jan Feb Mar Apr May Jun Jui Aug Sep Oct Nov Dec
1992: Jan Feb Mar Apr May Jun Jui Aug Sep Oct Nov Dec
6. 7 MOTOR VEHICLES LICENSED ---contd.
Public buses-continued
Single deck
Others
Double deck
Single deck
Private buses
Double dee)<
Public light buses
New Total registra-
New Total registra-
New Total. rcgistra-
New Total rcgistra-
New Total registra-
li~ tion licenscd tion licenscd tion liocnscd tion licenscd lion
2 323
2 751
3 007
3 191
3331
3 480
3 191
3 202 3 218 3 219 3 245 3 254 3 239 3 245 3 272 3 292 3 302 3 312 3 331
3 340 3 356 3 381 3 385 3 419 3 434 3 394 3 469 3 473 3 466 3 475 3 480
Light goods
vehicles
220
488
359
336
300
426
17
27 20 16 23 21 5
21 48 36 28 29 26
33 31 44 31 52 33 46 30 27 26 42 31
126
165
177
214
251
263
214
227 240 233 230 227 235 240 249 247 245 248 251
247 254 251 249 250 267 259 270 265 264 265 263
Goods vehicles
Medium goods
vehicles
67
50
38
49
60
49
8
10 13 I
8 7
17
2 1 1
6 1 9 1
19 1
10 1 1
Heavy goods
vehicles
New Total rcgistra-
New New Total rcgistra- Total rcgistra-
liccnsed tion !iocnscd tion liocnscd lion
15 543 17 572 18 531
83 415 13 987 21 110
88 716 11 902 22 884
91 868 10 855 24 907
89 629 8 459 27 332
88 432 11 630 30 006
91 868
91 833 91 649 91 584 91 196 91 020 90830 90 889 90 901 90791 90 865 89 776 89 629
89 356 89 162 89478 89 444 89 505 89 611 87 544 89 334 88 563 88 486 88444 88 432
774 24 907
635 563 758 512 594 682 849 923 737 784 682 740
635 589 986 814 924 891
1 133 1 044 1 087 I 316 1 209 1 002
24 988 25 029 25.322 25 549 25 806 25 949 26 239 26 482 26 793 27 OOO 27 081 27 332
27 445 27 786 28 152 28 257 28 483 28 652 28 245 28 942 28 948 29494 29 778 30006
3 663
3 765
3 123
3 434
4254
5 323
295
209 149 387 343 355 288 392 387 439 412 451 442
348 493 587 339 451 424 509 420 505 568 369 310
193
434
609
758
862
1 118
758
165 775 788 195 810 813 824 828 840 842 851 862
866 872 899 915 937 950 961 986
I 037 1 070 1 082 1 118
84
260
194
155
111
266
6 11 14 5
16 5
10 6
11 5
10 12
7 9
25 16 20 15 20 17 55 33 16 33
110
120
121
159
172
184
159
158 156 161 163 163 165 163 164 164 168 170 172
173 174 178 173 174 174 177 180 184 183 184 184
24
32
22
47
24
27
6 4 I 1 I 1 1 3 1 4
2 I 4
3
3 2 4 2 3 3
19
12
20
21
25
47
21
21 20 18 21 19 23 22 23 25 26 24 25
25 28 32 43 46 47 47 47 47 47 47 47
Sub-total (goods vehicles
and special · purpose vehicles)
New Total rcgistra-
licensed tion
94 368 21 346
105072 18031
112363 15268
117745 14514
118061 12865
119 790 17 252
117 745
117 801 117 668 117 914 117 762 117 859 117 820 118 182 118 440 118 660 118 945 117 946 118 061
11.7 910 118 061 118 770 118 851 119 159 119 438 116 968 119 486 118 765 119 275 119 537 119 790
1 082
854 724
1 164 862 967 981
1 252 1 316 1 196 1 205 1 148 1 196
999 1 092 1 602 1 170 1 396 1 331 1 664 1 481 1 648 1922 1 598 1 349
4
21
2 4
11 3 I
4 340
4341
4 340
4 336
4 336
4336
4 336
4 338 4335 4 333 4 338 4 339 4 335 4 332 4 330 4 333 4 341 4 339 4 336
4 339 4 335 4 338 4 339 4 334 4 329 4 307 4 328 4332 4 331 4 333 4336
Crown vehicles (Excluding vehicles
of H.M. Forces)
243
467
695
549
640
557
29
46 22 67 66 66 64 52 37 64 67 50 39
39 34 71 55 52 44 54 53 45 33 47 30
Motor cycles
Other vehicfe.
New Total rcgistra-
licensed tion
1 209
1224
1 278
1 259
1 287
1 198
1 259
1 257 1224 1 225 1 297 1 317 1 267 1 231 1 266 1 266 1 266 1 266 1 287
1 287 1 306 1402 1 477 1427 1427 1410 1 215 1214 1 214 1 208 1 198
129
166
250
439
169
219
4
1 72 34
2
35
21
13 34 96 75
New Total rcgistra-
liocnscd tion
4 917
5 237
5 132
5 381
5 920
5 582
5 381
5405 5 394 5 460 5 471 5 469 5 370 5 407 5 544 5 661 5 773 s 876 5 920
5 925 5 874 6 OOO 6049 5 839 5906 5 885 5 616 5 599 5629 5 519 5 582
262
806
624
1 112
1122
692
110
119 80 71
102 72 75 90
137 117 112 103 44
108 46
126 49 15 67 51 28 33 30 16 63
Private light buses
New Total registra-
liccnsed tion
2 329
2408
2421
2410
2384
2 348
2410
2 411 2 399 2 398 2 394 2 397 2 391 2379 2 376 2381 2 371 2 379 2 384
2 381 2 378 2 386 2 375 2 363 2364 2 217 2360 2 359 2 357 2351 2 348
254
199
179
198
196
170
15
21 10 11 12 13 11 8
40 23 13 17 17
7 7
18 5
12 11 12 48 15 10 13 12
Grand total
New Total registra-
liocnscd tion
289 386 47 367
316 316 49 713
345 385 52 679
370 160 53 496
386 904 54 748
414 638 68 450
370 160
371 145 370 995 372 174 372 930 374 558 374 954 377 024 379 100 381 393 384 677 383 551 386 904
390430 391 620 395 444 396 982 398 483 401 257 394 719 405 157 406 408 409 312 411 688 414 638
3 424
3 571 3 131 4 266 3 920 4196 3 812 4 821 5 142 5 109 5 531 5 290 5 953
6 564 4 945 6 297 4 448 4 989 5 435 5961 5 759 6 065 6 396 5 838 5153
Special purpose vehicles
New Total rcgistra-
licensed tion
JOI
113
154
212
238
234
212
215 215 220 222 223 228 230 229 236 238 238 238
243 241 241 235 234 225 218 224 217 225 233 234
27
19
49
70
41
33
4 I 5 2 2 6 1
9 4 5 2
9 1 4 1 1 1 2
1 5 4 4
Total registered
All Private vehicles cars
322 290 166 977
347 402 178 234
376 153 195 818
405 407 215 709
433 769 236 747
471 221 265 155
405 407 215 709
406 800 216 752 408 098 217 709 410175 219035 411 827 220 252 413 870 221 844 415 552 223 115 418 101 224 820 420 878 226 634 423 769 228 731 426 792 231 058 431 220 234 146 433 769 236 747
437 869 240 525 440 664 242 711 444 240 245 171 446 519 246 871 448 792 248 629 452 067 251 046 455 391 253 479 458 058 255 912 461 122 258 262 465 I 05 260 928 468 250 263 404 471 221 265 155
54 Hong Kong Monthly Digest of Statistics January 1993
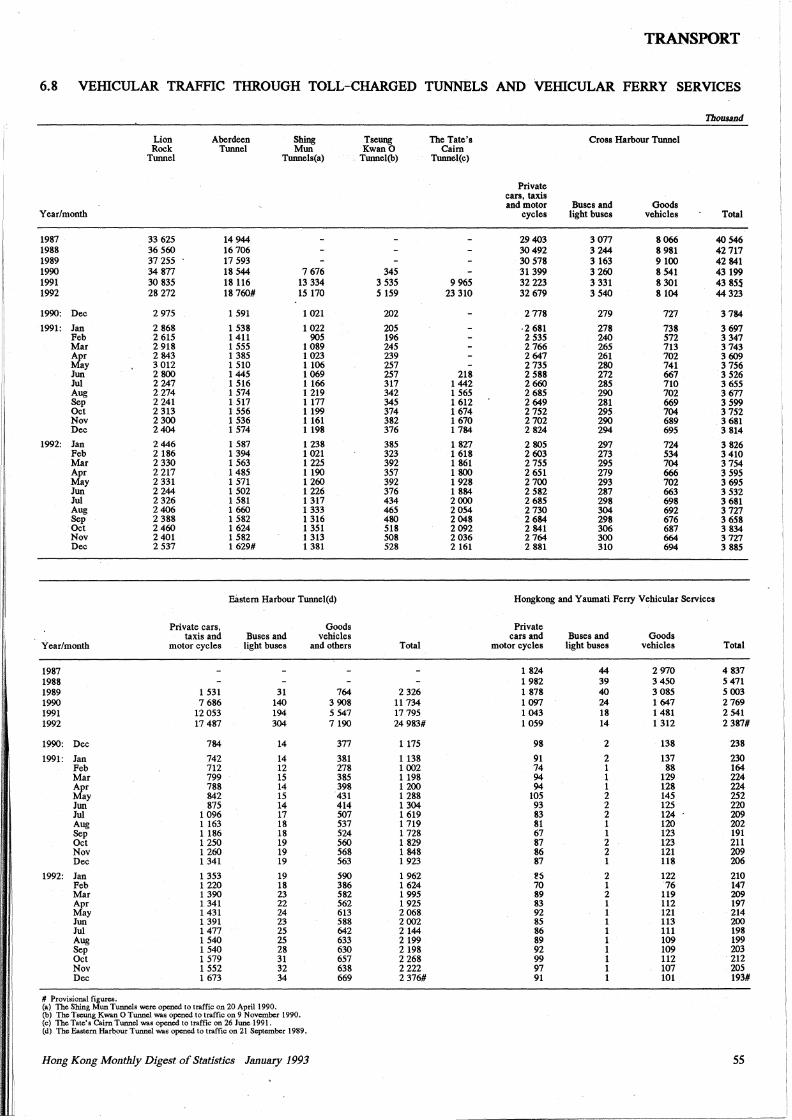
rnn::::L ---------- -- ·------ ----
TRANSPORT
6.8 VEHICULAR TRAFFIC THROUGH TOLL-CHARGED TUNNELS AND VEHICULAR FERRY SERVICES
Thousand
Lion Aberdeen Shing Tseung The Tate's Cross Harbour Tunnel Rock Tunnel Mun KwanO Cairn
Tunnel Tunnels( a) Tunnel(b) Tunnel(c)
Private cars, taxis and motor Buses and Goods
Year/month cycles light buses vehicles Total
1987 33 625 14 944 29403 3077 8066 40546 1988 36 560 16 706 30492 3 244 8 981 42 717 1989 37 255 17 593 30 578 3 163 9100 42 841 1990 34 877 18 544 7 676 345 31 399 3 260 8 541 43199 1991 30 835 18116 13 334 3 535 9965 32 223 3 331 8 301 43 855 1992 28 272 18 760# 15 170 5 159 23 310 32 679 3 540 8104 44323
1990: Dec 2 975 1 591 1021 202 2 778 279 727 3784
1991: Jan 2 868 1538 1 022 205 ·2 681 278 738 3 697 Feb 2 615 1411 905 196 2 535 240 572 3 347 Mar 2 918 1 555 1 089 245 2 766 265 713 3 743 Apr 2 843 1 385 1 023 239 2 647 261 702 3 609 May 3 012 1 510 1106 257 2 735 280 741 3 756 Jun 2 800 1445 1 069 257 218 2 588 272 667 3 526 Jui 2 247 1 516 1 166 317 1442 2 660 285 710 3 655 Aug 2 274 1574 1 219 342 1565 2 685 290 702 3 677 Sep 2 241 1 517 1177 345 1612 2 649 281 669 3 599 Oct 2 313 1 556 1199 374 1674 2 752 295 704 3 752 Nov 2 300 1 536 1161 382 1 670 2702 290 689 3 681 Dec 2404 1 574 1 198 376 1 784 2 824 294 695 3 814
1992: Jan 2446 1 587 1 238 385 1 827 2 805 297 724 3 826 Feb 2 186 1 394 1021 323 1 618 2 603 273 534 3 410 Mar 2 330 1 563 1 225 392 1 861 2 755 295 704 3 754 Apr 2 217 1485 1190 357 1 800 2 651 279 666 3 595 May 2 331 1571 1 260 392 1928 2700 293 702 3 695
I
Jun 2 244 1 502 1 226 376 1 884 2 582 287 663 3 532 Jui 2 326 1 581 1 317 434 2000 2 685 298 698 3 681 Aug 2406 1 660 1 333 465 2054 2730 304 692 3 727 Sep 2 388 1 582 1 316 480 2048 2 684 298 676 3 658 Oct 2460 1 624 1 351 518 2092 2 841 306 687 3 834 Nov 2 401 1 582 1 313 508 2036 2 764 300 664 3 727 Dec 2 537 1 629# 1 381 528 2 161 2 881 310 694 3 885
Eastern Harbour Tunnel(d) Hongkong and Yaumati Ferry Vehicular Services
I. Private cars, Goods Private taxis and Buses and vehicles cars and Buses and Goods
Year/month motor cycles light buses and others Total motor cycles light buses vehicles Total
1987 1 824 44 2 970 4 837 1988 1 982 39 3 450 5471
1. 1989 1 531 31 764 2 326 1 878 40 3 085 5 003 1990 7 686 140 3 908 11 734 1097 24 1647 2 769 1991 12 053 194 5 547 17 795 1 043 18 1481 2 541 1992 17 487 304 7 190 24 983# 1 059 14 1 312 2 387#
[, 1990: Dec 784 14 377 1175 98 2 138 238
1991: Jan 742 14 381 1138 91 2 137 230 Feb 712 12 278 1 002 74 1 88 164
1: Mar 799 15 385 1198 94 1 129 224 1: Apr 788 14 398 1 200 94 1 128 224
May 842 15 431 1 288 105 2 145 252 Jun 875 14 414 1304 93 2 125 220 Jui 1 096 17 507 1 619 83 2 124 209 Aug 1 163 18 537 1 719 81 1 120 202 Sep 1 186 18 524 1 728 67 1 123 191 Oct 1 250 19 560 1 829 87 2 123 211
I
Nov 1 260 19 568 1 848 86 2 121 209 Dec 1 341 19 563 1 923 87 1 118 206
1992: Jan 1 353 19 590 1 962 ~s 2 122 210 Feb 1 220 18 386 1 624 70 1 76 147
I, Mar 1 390 23 582 1 995 89 2 119 209 Apr 1 341 22 562 1 925 83 1 112 197 May 1 431 24 613 2068 92 1 121 214 Jun 1 391 23 588 2002 85 1 113 200 Jui 1477 25 642 2 144 86 1 111 198 Aug 1 540 25 633 2 199 89 1 109 199 Sep 1 540 28 630 2 198 92 1 109 203 Oct 1 579 31 657 2 268 99 1 112 212 Nov 1 552 32 638 2 222 97 1 107 205
1: Dec 1 673 34 669 2 376# 91 1 101 193#
# Provisional figures. (a) The Sbing Mun Tunnels were opened to traffic on 20 April 1990.
I
(b) The Tseung Kwan 0 Tunnel was opened to traffic on 9 November 1990. (c) The Tate's Cairn Tunnel was opened to traffic on 26 June 1991. (d) The Eastern Harbour Tunnel was opened to traffic on 21 September 1989.
Hong Kong Monthly Digest of Statistics January 1993 55
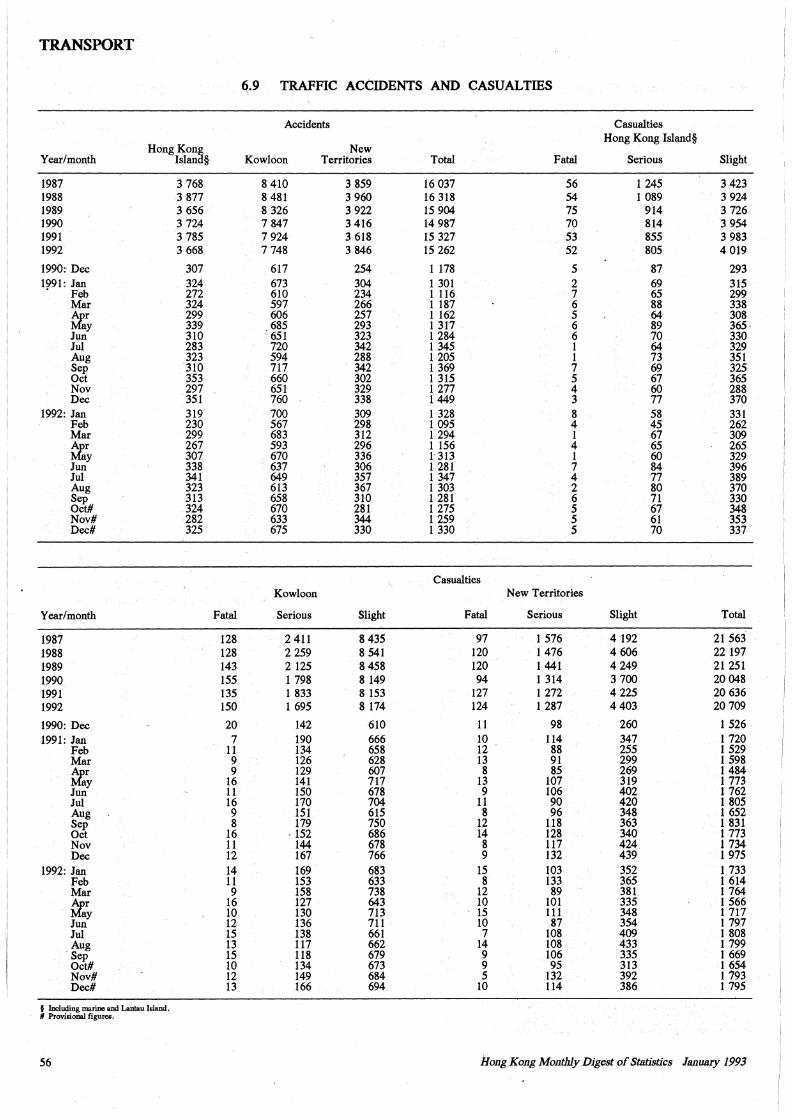
TRANSPORT
~-9 TRAFFIC ACCIDENTS AND CASUALTIES
Accidents Casualties
Hong Kon~ Hong Kong Island§
New Year/month Islan § Kowloon Territories Total Fatal Serious Slight
1987 3 768 8410 3 859 16 037 56 l 245 3 423 1988 3 877 8 481 3 960 16 318 54 l 089 3 924 1989 3 656 8 326 3 922 15 904 75 914 3 726 1990 3 724 7 847 3 416 14 987 70 814 3 954 1991 3 785 7 924 3 618 15 327 53 855 3 983 1992 3 668 7 748 3 846 15 262 52 805 4 019
1990: Dec 307 617 254 l 178 5 87 293 1991: Jan 324 673 304 l 301 2 69 315
Feb 272 610 234 1 116. 7 65 299 Mar 324 597 266 l 187 6 88 338 ~r 299 606 257 l 162 5 64 308
ay 339 685 293 1 317 6 89 365· Jun 310 651 323 l 284 6 70 330 Jul 283 720 342 l 345 l 64 329 Aug 323 594 288 1 205 l 73 351 Sep 310 717 . 342 1.369 7 69 325 Oct 353 660 302 l 315 5 67 365 Nov 297 651 329 l 277 4 60 288 Dec 351 760 338 1449 3 77 370
1992: Jan 319 700 309 l 328 8 58 331 Feb 230 567 298 l 095 4 45 262 Mar 299 683 312 1 294 1 67 309 ~r 267 593 296 l 156 4 65 265
ay 307 670 336 1· 313 l 60 329 Jun 338 637 306 l 281 7 84 396 Jul 341 649 357 1 347 4 77 389 Aug 323 613 367 l 303 2 80 370 Sep 313 658 310 l 281 6 71 330 Oct# 324 670 281 l 275 5 67 348 Nov# 282 633 344 l 259 5 61 353 Dec# 325 675 330 1 330 5 70 337
Casualties Kowloon New Territories
Year/month Fatal Serious Slight Fatal Serious Slight Total
1987 128 2 411 8 435 97 1 576 4 192 21563 1988 128 2 259 8 541 120 l 476 4 606 22197 1989 143 2 125 8 458 120 l 441 4 249 21 251 1990 155 l 798 8 149 94 l 314 3 700 20048 1991 135 1 833 8 153 127 1 272 4 225 20 636 1992 150 l 695 8 174 124 1 287 4403 20 709
1990: Dec 20 142 610 11 98 260 l 526 1991: Jan 7 190 666 10 114 347 l 720
Feb 11 134 658 12 88 255 1 529 Mar ·9 126 628 13 91 299 l 598
~r 9 129 607 8 85 269 1484 ay 16 141 717 13 107 319 1 773
Jun 11 150 678 9 106 402 l 762 Jul 16 170 704 11 90 420 l 805 Aug 9 151 615 8 96 348 1 652 Sep 8 179 750 12 118 363 l 831 Oct 16 . 152 686 14 128 340 l 773 Nov 11 144 678 8 117 424 l 734 Dec 12 167 766 9 132 439 l 975
1992: Jan 14 169 683 15 103 352 l 733 Feb 11 153 633 8 133 365 l 614 Mar 9 158 738 12 89 381 1 764
~r 16 127 643 10 101 335 1 566 ay 10 130 713 15 111 348 l 717
Jun 12 136 711 10 87 354 1 797 Jul 15 138 661 7 108 409 1 808 Aug 13 117 662 14 108 433 1 799 Sep 15 118 679 9 106 335 1 669 Oct# 10 134 673 9 95 313 l 654 Nov# 12 149 684 5 132 392 l 793 Dec# 13 166 694 10 114 386 1 795
§ Including marine and Lantau Island. # Provisional figures.
56 Hong Kong Monthly Digest of Statistics January 1993
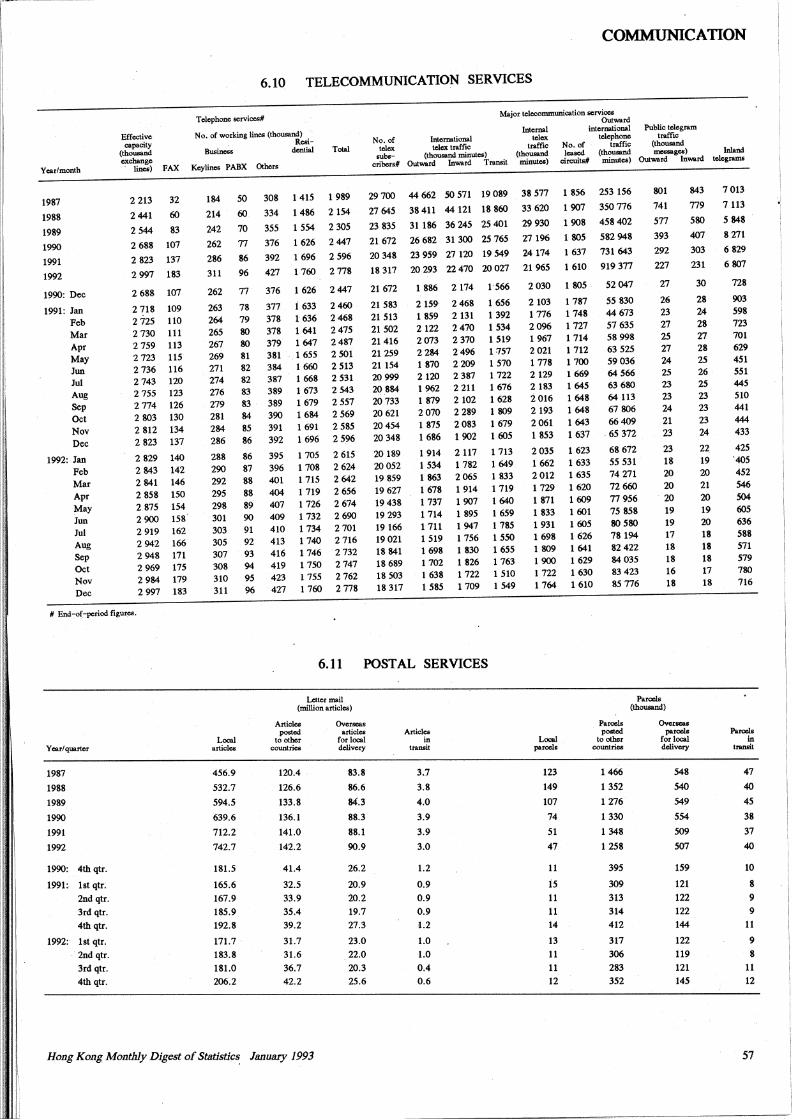
COMMUNICATION
6.10 TELECOMMUNICATION SERVICES
Telephone servi~ Major telecommunication services
Outward inlemational
telephone
Year/month
1987
1988
1989
1990
1991
1992
1990: Dec
1991: Jan Feb Mar Apr May Jun Jui Aug Sep Oct Nov Dec
1992: Jan Feb Mar Apr May Jun Jui Aug Sep Oct Nov Dec
Effective capacity
(thousand exchange · lines) FAX
2 213 32
2 441 60
2 544 83
2 688 107
2 823 137
2 997 183
2 688 107
2 718 109 2 725 110 2 730 111 2 759 113 2 723 115 2 736 116 2 743 120 2 7SS 123 2 774 126 2 803 130 2 812 134 2 823 137
2 829 140 2 843 142 2 841 146 2 858 lSO 2 875 154 2 900 158° 2 919 162 2 942 166 2 948 171 2 969 17S 2 984 179 2 997 183
# End~of-period figures.
Y car/ quarter
1987
1988
1989
1990
1991 1992
1990: 4th qtr.
1991: lst qtr:
2nd qtr. 3rd qtr. 4th qtr.
1992: lst qtr. · 2nd qtr.
3rd qtr. 4th qtr.
No. of working line& (thousand) Rosi.-
Business clentlal
Koylincs PABJC Others
184
214
242
262
286
311
262
263 264 265 267 269 271 274 276 279 281 284 286
288 290 292 295 298 301 303 305 307 308 310 311
so 60.
70
77
86
96
77
78 79 80 80 81 82 82 83 83 84 SS 86
86 87 88 88 89 90 91 92 93 94 95 96
308
334
355
376
392
427
141S
1486
1554
1626
1696
1760
376 1 626
377 i 633 378 1 636 378 1641 379 1647 381 .1 655 384 1 660 387 1 668 389 1 673 389 1679 390 1684 391 1691 392 1696
395 396 401 404 407 409 410 413 416 419 423 427
1 705 1 708 1 715 1 719 1 726 1 732 1 734 1 740 1 746 1 7SO 1 755 1760
Total
1989
2154
2305
2447
2596
2778
2447
2460 2468 2475 2487 2S01 2 513 2 S31 2 543 2557 2S69 2 SSS 2 S96
2 615 2624 2 642 2 6S6 2674 2690 2 701 2 716 2732 2747 2762 2 778
No. of Intomational telex telex traffic
subs- (thOU&and minutes) cribors# Outward Inward Trsnsit
29 700 44 662 so 571 19 089
TT 645 38 411 44 121 18 860
23 835 31 186 36 245 25 401
21 672 26 682 31 300 25 765
20 348 23 959 TT 120 19 549
18 317 20 293 22 470 20 OTT
21672
21 583 21 513 21 S02 21416 21259 21154 20999 20.884 20733 20 621 20454 20348
20 189 20052 19 859 19 67:1 19438 19 293 19166 19021 18 841 18 689 18 S03 18 317
1 886
2159 1859 2122 2073 2284 1 870 2 120 1 962 1 879 2070 1875 1686
1914 1534 1 863 1678 1 737 1 714 1 711 1519 1698 1702 1 638 1585
2 174
2468 2 131 2470 2370 2496 2 209 2387 2 211 2102 2 289 2083 1902
2 117 1 782 2065 1914 1907 1895 1947 1 756 1830 1826 1 722 1709
1'566
1656 1392 1534 1 519 i:1s1 1570 1 722 1 676 1628 1809 1679 1605
1 713 1649 1 833 1 719 1640 1 659 1 785 1 sso 1655 1 763 1 510 1549
6.11 POST AL SERVICES
Local articles
456.9
532.7
594.5
639.6
712.2
742.7
181.S
165.6 167.9
185.9 192.8
171.7
183.8 181.0 206.2
Letter mail (million article&)
Articlos posted
to other countries
120.4 .
126.6
133.8
136.1
141.0
142.2
41.4
32.5 33.9 35.4 39.2
31.7 31.6
36.7 42.2
Overseas articles
for local delivery
83.8
86.6
84.3
88.3
88.1
90.9
26.2
20.9 20.2 19.7 TT.3
23.0
22.0
20.3 25.6
Articles in
transit
3.7
3.8
4.0
3.9
3.9
3.0
1.2
0.9 0.9 0.9 11.2
1.0
1.0 0.4 0.6
Hong Kong Monthly Digest of Statistics January 1993
Intomal telex
traffic (thousand minule8)
38 577
33 620
29930
27196
24174
21965
2030
2 103 1 776 2096 1967 2021 1 778 2129 2 183 2 016 2 193 2061 1853
2035 1662 2 012 1 729 1871 1 833 1 931 1698 1 809 1900 1 722 1764
Local parcels
123
149
107
74
51
47
11
is 11 11 14
13 11 11 12
No. of traffic lc:ascd (thousand
Public telogrsm traffic
(thOU&and -gosl Inland
Outward Inward telogrsms circuits# minutos)
1 856
1907
1908
1805
1637
1610
1 805.
1 787 1 748 1727 1 714 1 712 1 700 1669 1 645 1648 1648 1643 1637
1623 1633 1635 1620 1609 1601 1 605 1626 1641 1629 1630 1610
253 156
350 776
458402
582 948
731 643
919 377
52047
55 830 44 673 57 635 58 998 63 525 59036 64 566 63 680 64113 67 806 66409 65 372
68672 55 531 74TT1 72660 77956 75 858 80580 78 194 82422 84035 83423 85 776
801
741
577
393
292
227
TT
26 23 TT 25 27 24 25 23 23 24 21 23
23 18 20 20 20 19 19 17 18 18 16 18
843
779
580
407
303
231
30
28 24 28 TT 28 25 26 25 23 23 23 24
22. 19 20 21 20 19 20 18 18 18 17 18
Paroels (thousand)
Parcels posted
to other countries
1466
1352
1 TT6
1330
1348
1258
395
309
313 314 412
317 306 283 352
Overseas parcels
for local dolivery
548
540
549
554
509
507
159
121 122
122 144
122
119 121 145
7 013
7113
5 848
8 TTl
6 829
6 807
728
903 598 723 701 629 451 551 44S 510 441 444 433
42S ·40s 452 546 504 605 636 588 571 579 780 716
Paroels in
transit
47
40
45
38
37
40
10
8 9 9
11
9 8
11 12
57
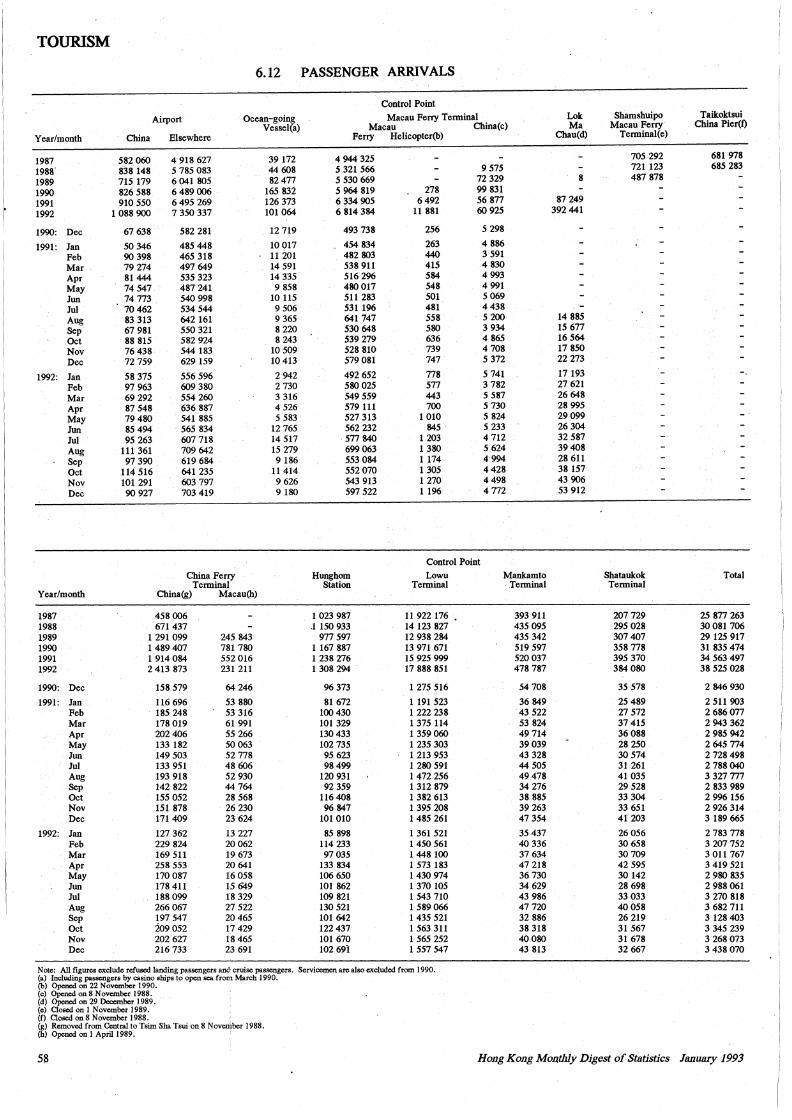
TOURISM
6.12 PASSENGER ARRIVALS
Control Point
Airport Ocean-going Macau Ferry Terminal Lok Shamshuipo Taikoktsui Vessel(a) Macau China(c) Ma Macau Ferry China Pier(t)
Year/month China Elsewhere Ferry Helicopter(b) Chau(d) Terminai(e)
1987 582 060 4 918 627 39 172 4 944 325 705 292 681 978
1988" 838 148 5 785 083 44 608 5 321 566 9 575 721 123 685 283
1989 715 179 6 041 805 82477 5 530 669 72 329 8 487 878
1990 826 588 6 489 006 165 832 5 964 819 278 99 831
1991 910 550 6 495 269 126 373 6 334 905 6492 56 877 87 249
1992 1 088 900 7 350 337 101 064 6 814 384 11 881 60925 392 441
1990: Dec 67 638 582 281 12 719 493 738 256 5 298
1991: Jan 50 346 485 448 10 017 454 834 263 4 886
Feb 90 398 465 318 11 201 482 803 440 3 591
Mar 79 274 497 649 14 591 538 911 415 4 830
Apr 81444 535 323 14 335 516 296 584 4 993
May 74 547 487 241 9 858 480 017 548 4 991
Jun 74 773 540 998 10 115 511 283 501 5 069
Jui 70462 534 544 9 506 531 196 481 4438
Aug 83 313 642 161 9 365 641 747 558 5 200 14 885
Sep 67 981 550 321 8 220 530 648 580 3 934 15 677
Oct 88 815 582 924 8 243 539 279 636 4 865 16 564
Nov 76438 544 183 10 509 528 810 739 4 708 17 850
Dec 72 759 629 159 10 413 579 081 747 5 372 22 273
1992: Jan 58 375 556 596 2942 492 652 778 5 741 17 193
Feb 97 963 609 380 2 730 580 025 577 3 782 27 621
Mar 69 292 554 260 3 316 549 559 443 5 587 26 648
Apr 87 548 636 887 4 526 579 111 700 5 730 28 995
May 79480 541 885 5 583 527 313 1 010 5 824 29099
Jun 85 494 565 834 12 765 562 232 845 5 233 26 304
Jui 95 263 607 718 14 517 577 840 1 203 4 712 32 587
Aug 111 361 709 642 15 279 699 063 1 380 5 624 39408
Sep 97 390 619 684 9 186 553 084 1 174 4994 28 611
Oct 114 516 641 235 11414 552 070 1 305 4428 38 157
Nov 101 291 603 797 9 626 543 913 1 270 4498 43 906
Dec 90 927 703 419 9 180 597 522 1 196 4 772 53 912
Control Point
China Ferry Hunghom Lowu Mankamto Shataukok Total Terminal Station Terminal Terminal Terminal
Year/month China(g) Macau(h)
1987 458 006 1 023 987 11 922 176 393 911 207 729 25 877 263 1988 671 437 .1 150 933 14 123 827 435 095 295 028 30081 706 1989 1 291 099 245 843 977 597 12 938 284 435 342 307 407 29 125 917 1990 1489407 781 780 1 167 887 13 971 671 519 597 358 778 31835474 1991 1 914 084 552 016 1 238 276 15 925 999 520037 395 370 34 563 497 1992 2 413 873 231 211 1 308 294 17 888 851 478 787 384 080 38 525 028
1990: Dec 158 579 64 246 96 373 1 275 516 54 708 35 578 2 846 930
1991: Jan 116 696 53 880 81 672 1 191 523 36 849 25 489 2 511 903 Feb 185 248 53 316 100 430 1 222 238 43 522 27 572 2 686077 Mar 178 019 61 991 101 329 1375114 53 824 37 415 2 943 362 Apr 202 406 55 266 130 433 1359060 49 714 36 088 2 985 942 May 133 182 50063 102 735 1 235 303 39 039 28 250 2 645 774 Jun 149 503 52 778 95 623 1 213 953 43 328 30 574 2 728 498 Jui 133 951 48 6o6 98499 1 280 591 44 505 31 261 2 788040 Aug 193 918 52 930 120 931 1 472 256 49478 41 035 3 327 777 Sep 142 822 44 764 92 359 1 312 879 34 276 29 528 2 833 989 Oct 155 052 28 568 116 408 1 382 613 38 885 33 304 2 996 156 Nov 151 878 26 230 96 847 1 395 208 39 263 33 651 2 926 314 Dec 171 409 23 624 101 010 1 485 261 47 354 41 203 3 189 665
1992: Jan 127 362 13 227 85 898 1 361 521 35 437 26056 2 783 778 Feb 229 824 20062 114 233 1450561 40 336 30 658 3 207 752 Mar 169 511 19 673 97 035 1448100 37 634 30 709 3 011 767 Apr 258 553 20 641 133 834 1573183 47 218 42 595 3 419 521 May 170 087 16 058 106 650 1430974 36730 30 142 2 980 835 Jun 178 411 15 649 101 862 1370105 34 629 28 698 2 988 061 Jui 188 099 18 329 109 821 1 543 710 43 986 33 033 3 270 818 Aug 266 067 27 522 130 521 1589066 47 720 40058 3 682 711 Sep 197 547 20465 101 642 1 435 521 32 886 26 219 3 128 403 Oct :209 052 17 429 122 437 1 563 311 38 318 31 567 3 345 239 Nov 202 627 18 465 101 670 1 565 252 40080 31 678 3 268 073 Dec 216 733 23 691 102 691 1 557 547 43 813 32 667 3 438 070
Note: All figures exclude refused landing passengers and: cruise passengers. Servicemen are also excluded from 1990. (a) Including passengers by casino ships to open sea from March 1990. (b) Opened on 22 November 1990. (c) Opened on 8 November 1988. (d) Opened on 29 December 1989. (e) Closed on I November 1989. (f) Closed on 8 November 1988. (g) Removed from Central to Tsim Sha Tsui on 8 Noventber 1988. (h) Opened on I April 1989.
58 Hong Kong MonJhly Digest of Statistics January 1993
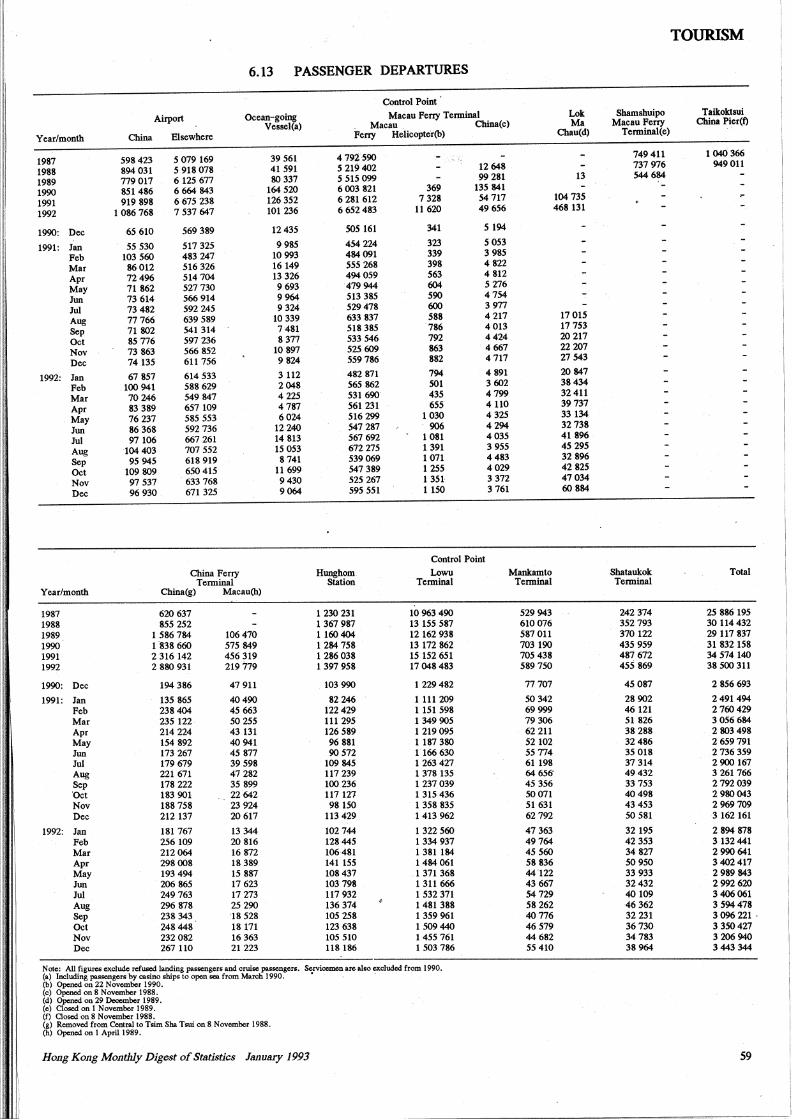
TOURISM
6.13 PASSENGER DEPARTURES
Control Point
Airport Ocean-going Macau Ferry Terminal Lok Shamshuipo Taikoktsui
Vessel(a) Macau . China(c) Ma Macau Ferry China Pier(f)
Year/month China Elsewhere Ferry Hellcopter(b) Chau(d) Terminal(e)
1987 S98423 s CJl9 169 39 S61 479i5.90 749411 1040 366
1988 894 031 s 918 CJl8 41 S91 s 219 402 12 648 737 976 949011
1989 779 017 6 12S 677 80337 s SlS 099 99281 13 S44 684
1990 8Sl 486 6 664 843 164 S20 6 003 821 369 13S 841
1991 919 898 6 67S 238 126 3S2 6 281 612 7328 54 717 104 73S
1992 1086 768 7 S37 647 101 236 6 6S2483 11 620 49656 468 131
1990: Dec 6S 610 S69 389 1243S SOS 161 341 S 194
1991: Jan SS S30 S17 325 9 98S 454224 323 s 053
Feb 103 S60 483 247 10993 484091 339 3 985
Mar 86012 S16 326 16149 SSS 268 398 4822
Apr 72496 S14 704 13 326 494 059 563 4 812
May 71862 527 730 9693 479944 604 s 276
Jun 73 614 S66 914 9964 S13 385 S90 4754
Jul 73 482 592 245 9 324 529478 600 3 977
Aug 77766 639 589 10 339 633 837 588 4 217 17015
Sep 71 802 541314 7481 518 385 786 4013 17 753
Oct 85 776 597 236 8 377 533 546 792 4424 20217
Nov 73 863 566 852 10 897 525 609 863 4667 22 2CJl
Dec 74135 611 756 9 824 559 786 882 4717 27543
1992: Jan 67857 614 533 3 112 482 871 794 4 891 20 847
Feb 100 941 588629 2048 565 862 SOl 3 602 38434
Mar 70246 549 847 4225 S31 690 43S 4799 32411
Apr 83 389 657109 4787 561 231 655 4110 39737
May 76237 S85 553 6024 516299 1030 4 325 33 134
Jun 86 368 592 736 12 240 547 287 . 906 4294 32 738
Jul 97106 667 261 14 813 567 692 1081 4035 41896
Aug 104403 1CJI 552 15 053 672 275 1 391 3 955 45 29S
Sep 95 945 618 919 8 741 539069 1 CJ!l 4483 32 896
Oct 109 809 650 415 11699 547 389 1255 4029 42 82S
Nov 97 537 633 768 9430 525 267 1 351- 3 372 47034
Dec 96930 671325 9064 595 551 1 lSO 3 761 60 884
Control Point
China Ferry Hunghom Lowu Mankamto Shataukok Total Terminal Station Terminal Terminal Terminal
Year/month China(g) Macau(h)
1987 620 637 1230231 10 963 490 529 943 242 374 25 886195 1988 8S5 252 1367987 13 155 587 610 CJl6 3S2 793 30114432 1989 1S86784 106 470 1160 404 12 162 938 587011 370 122 29117 837 1990 1838 660 S15 849 1284758 13 172 862 703 190 435 959 31 832158 1991 2 316 142 456 319 1286038 15 152 651 70S 438 487672 34 S74140 1992 2 880 931 219 779 1397 958 17 048 483 S89 750 455 869 38 500 311
1990: Dec 194 386 47911 103 990 1229482 77 7CJI 45 087 2 856 693
1991: Jan 135 865 40490 82 246 1111 209 S0342 28 902 2491494 Feb 238404 45 663 122 429 1151 598 69999 46121 2760429 Mar 235 122 50255 111 295 1349905 79306 51 826 3 056 684 Apr 214 224 43.131 126 589 1219095 62 211 38288 2 803 498 May 154 892 40941 96 881 1187 380 52102 32486 2 659 791 Jun 173 267 45 877 90S72 1166630 55774 3S 018 2 736 359 Ju1 179 679 39 598 109 845 1263427 61198 37 314 2900167 Aug 22i 671 47 282 117 239 1378 135 64 656" 49432 3 261 766 Sep 178 222 35 899 100 236 1237039 45 356 337S3 2 792039 "Oct 183 901 22642 117 127 1315436 50 CJ!l 40498 2 980043 Nov 188 758 23 924 98 lSO 1 358 835 51631 43453 2969709 Dec 212 137 20 617 113 429 1413 962 62792 so 581 3 162161
1992: Jan 181 767 13 344 102 744 1322 560 47363 32195 2 894 878 Feb 256 109 20 816 128 445 1334937 49764 42 3S3 3 132 441 Mar 212064 16 872 106481 1 381184 45 560 34 827 2 990 641 Apr 298 008 18 389 141 155 1484061 58836 50950 3 402 417 May 193 494 15 887 108437 .1371 368 44122 33 933 2 989 843 Jun 206 865 17 623 103 798 1 311 666 43 667 32432 2 992 620 Jui 249 763 17273 117 932 1532 371 54729 40109 3 406061 Aug 296.878 25 290 136 374 1481 388 58262 46362 3 594478 Sep 238 343 18 528 105 258 1359961 40776 32 231 3 096221. Oct 248448. 18171 123 638 1S09440 46 579 36730 3 3S0427 Nov 232082 16 363 105 510 1455 761 44 682 34783 3 206 940 Dec 267 110 21223 118 186 1 503 786 5S 410 38964 3 443 344
Note: All figures exclude refused landing passengers and cruise passengers. Servicemen are also excluded from 1990. (a) Including passengers by cssino ships to open sea from March 1990. • · · (b) Opened on 22 November 1990. (c) Opened on 8 November 1988. (d) Opened on 29 December 1989. (e) Closed on I November 1989. (f) Closed on 8 November 1988. (g) Removed from Central to Tsim Sha Tsui on 8.November 1988. (h) Opened on I April 1989.
Hong Kong Monthly Digest of Statistics January 1993 59
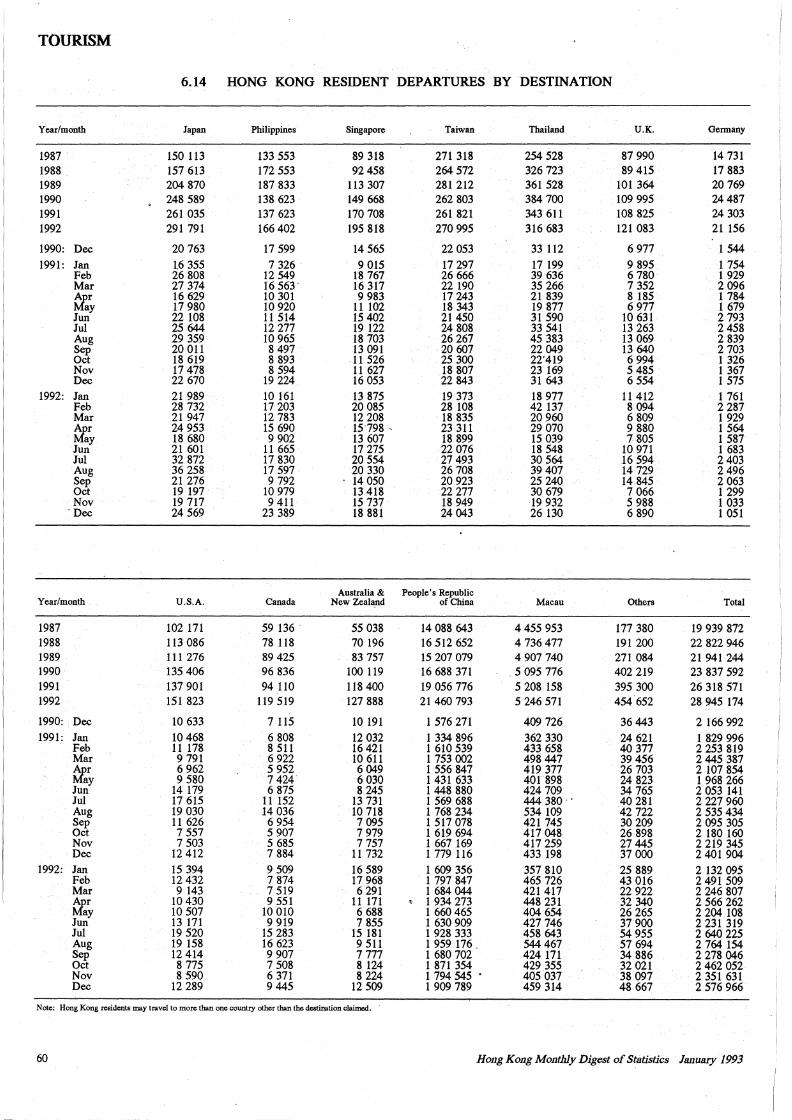
TOURISM
6.14 HONG KONG RESIDENT DEPARTURES BY DESTINATION
Year/month Japan Philippines Singapore Taiwan Thailand U.K. Germany
1987 150 113 133 553 89 318 271 318 254 528 87 990 14 731 1988 157 613 172 553 92458 264 572 326 723 89 415 17 883 1989 204 870 187 833 113 307 281 212 361 528 101 364 20 769 1990 248 589 138 623 149 668 262 803 384 700 109 995 24487 1991 261 035 137 623 170 708 261 821 343 611 108 825 24 303 1992 291 791 166 402 195 818 270 995 316 683 121 083 21156
1990: Dec 20 763 17 599 14 565 22 053 33 112 6 977 1 544
1991: Jan 1.6 355 7 326 9 015 17 297 17 199 9 895 1 754 Feb 26 808 12 549 18 767 26 666 39 636 6 780 1 929 Mar 27 374 16 563 - 16 317 22 190 35 266 7 352 2 096 tfar 16 629 10 301 9 983 17 243 21 839 8 185 1 784
ay 17 980 10 920 11 102 18 343 19 877 6 977 1 679 Jun 22 108 11 514 15 402 21450 31 590 10 631 2 793 Jui 25 644 12 277 19 122 24 808 33 541 13 263 2 458 Aug 29 359 10 965 18 703 26 267 45 383 13 069 2 839 Sep 20 011 8 497 13 091 20 607 22 049 13 640 2 703 Oct 18 619 8 893 11 526 25 300 22'419 6 994 1 326 Nov 17 478 8 594 11 627 18 807 23 169 5 485 1 367 Dec 22 670 19 224 16 053 22 843 31 643 6 554 1 575
1992: Jan 21 989 10 161 13 875 19 373 18 977 11 412 1 761 Feb 28 732 17 203 20 085 28 108 42 137 8 094 2 287 Mar 21 947 12 783 12 208 18 835 20 960 6 809 1 929 tfar 24 953 15 690 15"798 - 23 311 29 070 9 880 1 564
ay 18 680 9 902 13 607 18 899 15 039 7 805 1 587 Jun 21 601 11 665 17 275 22 076 18 548 10 971 1 683 Jui 32 872 17 830 20 554 27 493 30 564 16 594 2 403 Aug 36 258 17 597 20 330 26 708 39 407 14 729 2 496 Sep 21 276 9 792 14 050 20 923 25 240 14 845 2 063 Oct 19 197 10 979 13 418 22 277 30 679 7 066 1 299 Nov 19 717 9 411 15 737 18 949 19 932 5 988 1 033
"Dec 24 569 23 389 18 881 24 043 26 130 6 890 1 051
Australia & People's Republic Year/month U.S.A. Canada New Zealand of China Macau Others Total
1987 102 171 59 136 55 038 14 088 643 4 455 953 177 380 19 939 872 1988 113 086 78 118 70 196 16 512 652 4 736 477 191 200 22 822 946 1989 111 276 89 425 83 757 15 207 079 4 907 740 271 084 21 941 244 1990 135 406 96 836 100 119 16 688 371 5 095 776 402 219 23 837 592 1991 137 901 94 110 118 400 19 056 776 5 208 158 395 300 26 318 571 1992 151 823 119 519 127 888 21460793 5 246 571 454 652 28 945 174
1990: Dec 10 633 7 115 10 191 1 576 271 409 726 36 443 2 166 992 1991: Jan 10 468 6 808 12 032 1334896 362 330 24 621 1 829 996
Feb 11 178 8 511 16 421 1 610 539 433 658 40 377 2 253 819 Mar 9 791 6 922 10 611 1753002 498 447 39 456 2 445 387 tfar 6 962 5 952 6 049 1 556 847 419 377 26 703 2 107 854
ay 9 580 7 424 6 030 1 431 633 401 898 24 823 1968266 Jun 14 179 6 875 8 245 1 448 880 424 709 34 765 2 053 141 Jui 17 615 11 152 13 731 1 569 688 444 380 ·. 40 281 2 227 960 Aug 19 030 14 036 10 718 1 768 234 534 109 42 722 2 535 434 Sep 11 626 6 954 7 095 1517078 421 745 30 209 2 095 305 Oct 7 557 5 907 7 979 1 619 694 417 048 26 898 2 180 160 Nov 7 503 5 685 7 757 1 667 169 417 259 27 445 2 219 345 Dec 12 412 7 884 11 732 1779116 433 198 37 OOO 2 401 904
1992: Jan 15 394 9 509 16 589 l 609 356 357 810 25 889 2 132 095 Feb 12 432 7 874 17 968 1 797 847 465 726 43 016 2 491 509 Mar 9 143 7 519 6 291 1684044 421 417 22 922 2 246 807 tfar 10 430 9 551 11 171 • 1934273 448 231 32 340 2 566 262
ay 10 507 10 010 6 688 1660465 404 654 26 265 2 204 108 Jun 13 171 9 919 7 855 1630909 427 746 37 900 2 231 319 Jul 19 520 15 283 15 181 1 928 333 458 643 54 955 2 640 225 Aug 19 158 16 623 9 511 1 959 176 544 467 57 694 2 764 154 Sep 12 414 9 907 7 777 1680702 424 171 34 886 2 278 046 Oct 8 775 7 508 8 124 1 871 354 429 355 32 021 2 462 052 Nov 8 590 6 371 8 224 1794545 • 405 037 38 097 2 351 631 Dec 12 289 9 445 12 509 1909789 459 314 48 667 2 576 966
Note: Hong Kong residents may travel to more than one country other than the destination claimed.
60 Hong Kong Monthly Digest of Statistics January 1993
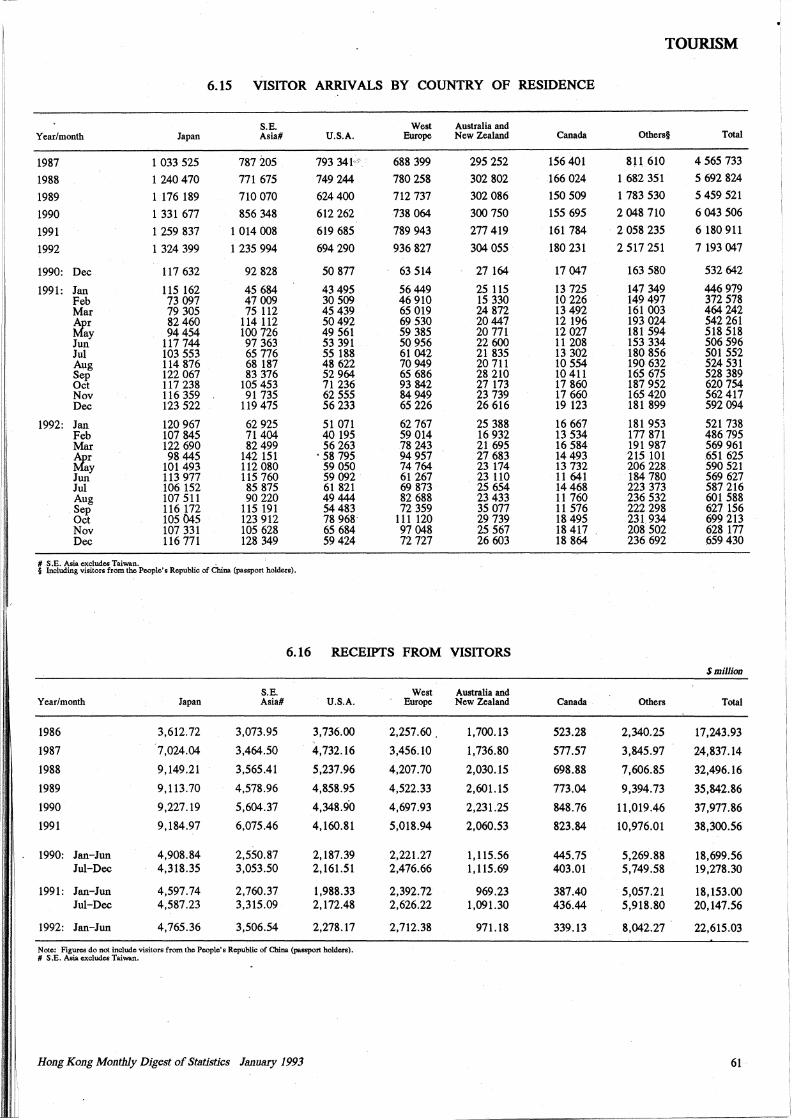
--
TOURISM
6.15 VISITOR ARRIVALS BY COUNTRY OF RESIDENCE
S.E. West Australia and Year/month Japan Asia# U.S.A. Europe New Zealand Canada Others§ Total
1987 1 033 525 787 205 793 341- 688 399 295 252 156 401 811 610 4 565 733
1988 1240470 771 675 749 244 780 258 302 802 166 024 1 682 351 5 692 824
1989 1 176 189 710 070 624 400 712 737 302 086 150 509 1 783 530 5 459 521
1990 1 331 677 856 348 612 262 738 064 300 750 155 695 2 048 710 6 043 506
1991 1 259 837 1014008 619 685 789 943 277 419 161 784 2 058 235 6 180 911
1992 1324399 1 235 994 694 290 936 827 304 055 180 231 2 517 251 7 193 047
1990: Dec 117 632 92 828 50 877 63 514 27 164 17 047 163 580 532 642
1991: Jan 115 162 45 684 43 495 56 449 25 115 13 725 147 349 446 979 Feb 73 097 47 009 30 509 46 910 15 330 10 226 149 497 372 578 Mar 79 305 75 112 45 439 65 019 24 872 13 492 161 003 464 242
~r 82460 114 112 50 492 69 530 20447 12 196 193 024 542 261 ay 94454 100 726 49 561 59 385 20 771 12 027 181 594 518 518
Jun 117 744 97 363 53 391 50 956 22 600 11 208 153 334 506 596 Jul 103 553 65 776 55 188 61 042 21 835 13 302 180 856 501 552 Aug 114 876 68 187 48 622 70949 20 711 10 554 190 632 524 531 Sep 122 067 83 376 52 964 65 686 28 210 10 411 165 675 528 389 Oct 117 238 105 453 71 236 93 842 27 173 17 860 187 952 620 754 Nov 116 359 91 735 62 555 84949 23 739 17 660 165 420 562 417 Dec 123 522 119 475 56 233 65 226 26 616 19 123 181 899 592 094
1992: Jan 120 967 62 925 51 071 62 767 25 388 16 667 181 953 521 738 Feb 107 845 71404 40 195 59 014 16 932 13 534 177 871 486 795 Mar 122 690 82 499 56 263 78 243 21 695 16 584 191 987 569 961
ttr 98445 142 151 • 58 795 94 957 27 683 14 493 215 101 651 625 ay 101 493 112 080 59 050 74 764 23 174 13 732 206 228 590 521
Jun 113 977 115 760 59 092 61 267 23 110 11 641 184 780 569 627 Jul 106 152 85 875 61 821 69 873 25 654 14 468 223 373 587 216 Aug 107 511 90 220 49 444 82 688 23 433 11 760 236 532 601 588 Sep 116 172 115 191 54 483 72 359 35 077 11 576 222 298 627 156 Oct 105 045 123 912 78 968 111 120 29 739 18 495 231934 699 213 Nov 107 331 105 628 65 684 97 048 25 567 18 417 208 502 628 177 Dec 116 771 128 349 59 424 72 727 26 603 18 864 236 692 659 430
# S.E. Asia excludes Taiwan. § Including visitors from the People's Republic of China (passport holders).
6.16 RECEIPTS FROM VISITORS $million
S.E. West Australia and
1: Year/month Japan Asia# U.S.A. Europe New Zealand Canada Others Total
I: 1986 3,612.72 3,073.95 3,736.00 2,257.60. 1,700.13 523.28 2,340.25 17,243.93
1987 7,024.04 3,464.50 4,732.16 3,456.10 1,736.80 577.57 3,845.97 24,837.14
1988 9, 149.21 3,565.41 5,237.96 4,207.70 2,030.15 698.88 7,606.85 32,496.16
1989 9,113.70 4,578.96 4,858.95 4,522.33 2,601.15 773.04 9,394.73 35,842.86
1990 9,227.19 5,604.37 4,348.90 4,697.93 2,231.25 848.76 11,019.46 37,977.86
1991 9,184.97 6,075.46 4, 160.81 5,018.94 2,060.53 823.84 10,976.01 38,300.56
1990: Jan-Jun 4,908.84 2,550.87 2,187.39 2,221.27 1,115.56 445.75 5,269.88 18,699.56 Jul-Dec 4,318.35 3,053.50 2, 161.51 2,476.66 1,115.69 403.01 5,749.58 19,278.30
1991: Jan-Jun 4,597.74 2,760.37 1,988.33 2,392.72 969.23 387.40 5,057.21 18,153.00 Jul-Dec 4,587.23 3,315.09 2,172.48 2,626.22 1,091.30 436.44 5,918.80 20,147.56
1992: Jan-Jun 4,765.36 3,506.54 2,278.17 2,712.38 971.18 339.13 8,042.27 22,615.03
Note: Figures do not include visitors from the People's Republic of China (passport holders). # S.E. Asia excludes Taiwan.
i-
Hong Kong Monthly Digest of Statistics January 1993 61
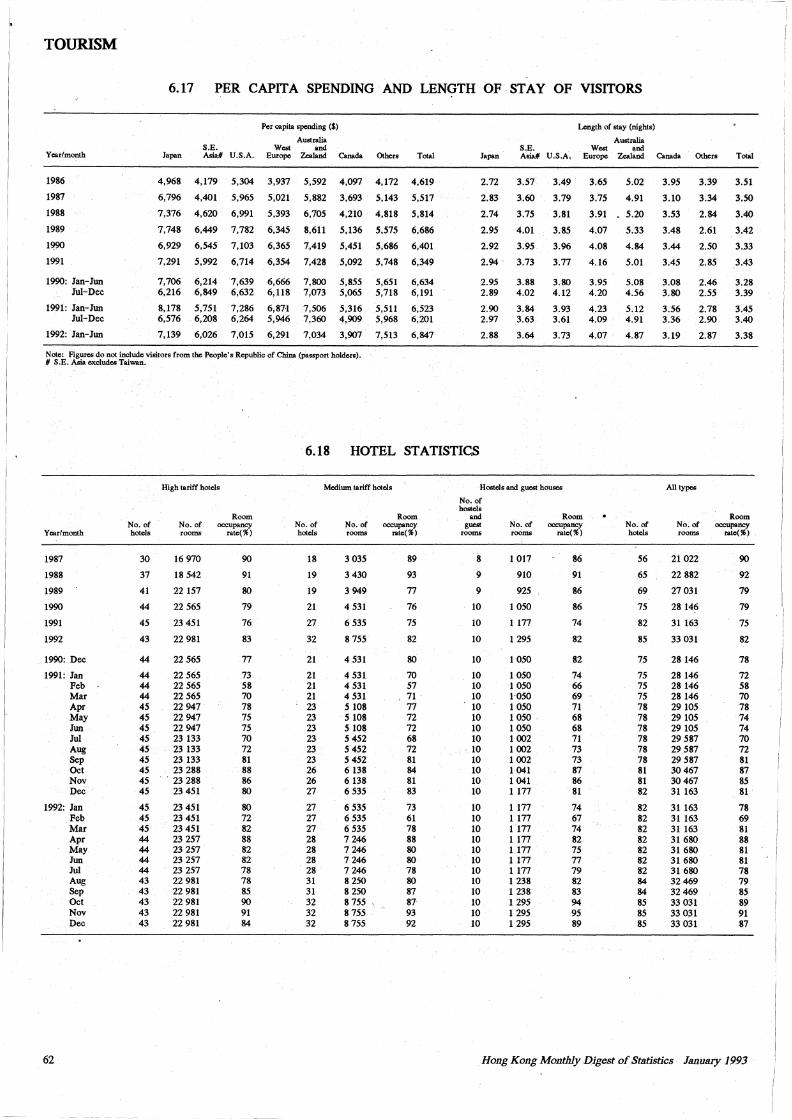
TOURISM
6.17 PER CAPITA SPENDING AND LENGTH OF STAY OF VISITORS
Yci.rlmonth
1986
1987
1988
1989
1!}90
1991
1990: Jan-Jun Jui-Dec
1991: Jan-Jun Jui-Dec
1992: Jan-Jun
Per capita spending ($)
Australia S.E. West and
Japan Asia# U.S.A. Europe Zealand Canada Others Total
4,968 4,179
6,796 4,401
7,376 4,620
7,748 6,449
6,929 6,545
7,291 5,992
5,304
5,965
6,991
7,782
7,103
6,714
3,937
5,021
5,393
6,345
6,365
6,354
5,592
5,882
6,705
8,611
7,419
7,428
4,097 4,172
3,693 5,143
4,210 4,818
5,136 5,575
5,451 5,686
5,092 5,748
4,619
5,517
5,814
6,686
6,401
6,349
7,706 6,214 7,639 6,666 7,800 5,855 5,651 6,634 6,216 6,849 6,632 6,118 7,073 5,065 5,718 6,191
8,178 5,751 7,286 6,87-1 7,506 5,316 5,511 6,523 6,576 6,208 6,264 5,946 7,360 4,909 5,968 6,201
7, 139 6,026 7,015 6,291 7,034 3,907 7,513 6,847
Note: Figures do not include visitors from the People's Republic of China (passport holders). # S.E. Asia excludes Taiwan.
Lengl)i of stay (nights)
Australia S.E. West and
Japan Asia# U.S.A, Europe Zealand Canada Others Total
2.72 3.57
2.83 3.60
2.74 3.75
2.95 4.01
2.92 3.95
2.94. 3.73
3.49
3.79
3.81
3.85
3.96
3.77
3.65
3.75
3.91
4.07
4.08
4.16
5.02
4.91
5.20
5.33
4.84
5.01
2.95 3.88 3.80 3.95 5.08 2.89 4.02 4.12 4.20 4.56
2.90 3.84 3.93 4.23 5.12 2.97 3.63 3.61 4.09 4.91
2.88 3.64 3.73 4.07 4.87
3.95
3.10
3.53
3.48
3.44
3.45
3.08 3.80
3.56 3.36
3.19
3.39
3.34
2.84
2.61
2.50
2.85
3.51
3.50
3.40
3.42
3 .. 33
3.43
2.46 3.28 2.55 3.39
2.78 3.45 2.90 3.40
2.87 3.38
6.18 HOTEL STATISTICS
Year/month
1987
1988
1989
1990
1991
1992
1990: Dec
1991: Jl!Jl Feb Mar Apr May Jun Jul Aug Sep Oct Nov Dec
1992: Jan Feb Mar Apr May Jun Jul Aug Sep Oct Nov Dec
62
High tariff hotels
Room No. of No. of occupancy hotels rooms rate(%)
30 16 970 90
37 18 542 91
41 22 157 80
44 22 565 79
45 23 451 76
43 22 981 83
44 22 565 77
44 22 565 73 44 22 565 58 44 22 565 70 45 22 947 78 45 22 947 75 45 22 947 75 45 23 133 70 45 23 133 72 45 23 133 81 45 23 288 88 45 . 23 288 86 45 23 451 80
45 23 451 80 45 23 451 72 45 23 451 82 44 23 257 88 44 23 257 82 44 23 257 82 44 23 257 78 43 22 981 78 43 22 981 85 43 22 981 90 43 22 981 91 43 22 981 84
No. of hotels
18
19
19
21
27
32
21
21 21 21 23 23 23 23 23 23 26 26 27
27 27 27 28 28 28
. 28 31 31 32 32 32
Medium tariff hotels
Room No. of occupancy rooms rate(%)
3 035 89
3 430 93
3 949 77
4 531 76
6 535 75
8 755 82
4 531 80
4 531 70 4 531 57 4 531 71 5 108 77 5 108 72 5 108 72 5 452 68 5 452 72 5 452 81 6 138 84 6 138 81 6 535 83
6 535 73 6 535 61 6 535 78 7 246 88 7 246 80 7 246 80 7 246 78 8 250 80 8 250 87 8 755 87 8 755 93 8 755 92
Hostels and guest houses
No. of hostels
and guest
rooms
8
9
9
10
10
10
10
10 10 10 10 10 10 10 10 10 10 10 10
10 10 10 10 10 10 10 10 10 10 10 10
Room No. of occupancy rooms rate(%)
1 017 86
910 91
925 86
1 050 86
1 177 74
1 295 82
1 050 82
1 050 74 1 050 66 1·050 69 1 050 71 1 050 . 68 1 050 68 1 002 71 1 002 73 1 002 73 1 041 87 1 041 86 1 177 81
1177 74 1 177 67 1 177 74 1 177 82 1 177 75 1 177 77 1 177 79 1 238 82 1 238 83 1 295 94 1 295 95 1 295 89
No. of hotels
56
65
69
75
82
85
75
75 75 75 78 78 78 78 78 78 81 81 82
82 82 82 82 82 82 82 84 84 85 85 85
All types
Room No. of occupancy rooms rate(%)
21 022 90
22 882 92
27 031 79
28 146 79
31 163 75
33 031 82
28 146 78
28 146 72 28 146 58 28 146 70 29 105 78 29 105 74 29 105 74 29 587 70 29 587 72 29 587 81 30 467 87 30 467 85 31 163 81
31 163 78 31 163 69 31 163 81 31 680 88 31 680 81 31 680 81 31 680 78 32 469 79 32 469 85 33 031 89 33 031 91 33 031 87
Hong Kong Monthly Digest of Statistics January 1993
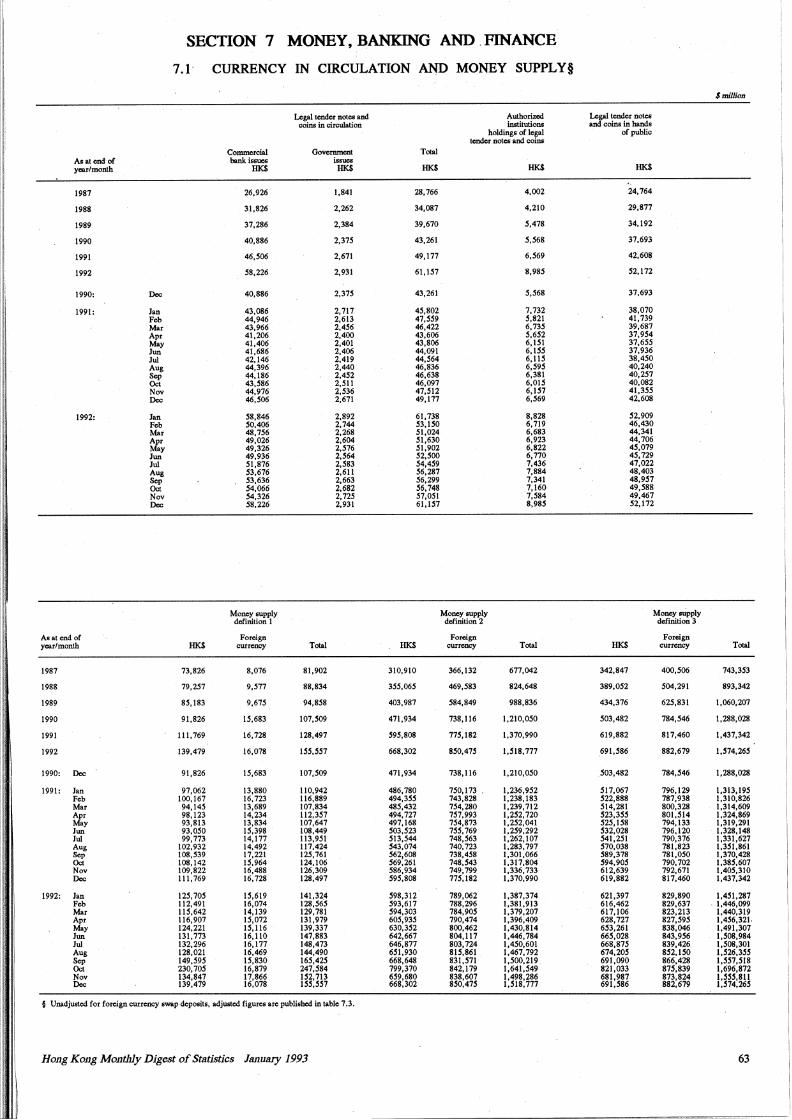
SECTION 7 MONEY, BANKING AND . FINANCE
7.1' CURRENCY IN CIRCULATION MiD MONEY SUPPLY§
$ millim
Legal tcnckr note& and Authorized Legal tender notes coins in circulation instltutlcns and coins in hands
holdings of legal tender note& and coins
of public
Commercial Govemmeat Total Asateml of bsnk issues issucs year/month JIK$ JIK$ JIK$ JIK$ JIK$
1987 26,926 1,841 28,766 4,002 24,764
1988 31,826 2,262 34,087 4,210 29,877
1989 37,286 2,384 39,670 5,478 34,192
1990 40,886 2,375 43,261 5,568 37,693
1991 46,506 2,671 49,177 6,569 42,601!
1992 58,226 2,931 61,151 8,985 52,172
1990: Dec 40,886 2,375 43,261 5,568 37,693
1991: Jan 43,086 2,717 45,802 7,732 38,070 Feb 44,946 2,613 41,559 5,821 41,739 Mar 43,966 2,456 46,422 6,135 39,687
z 41,206 2,400 43,606 5,652 37,954 41,406 2,401 43,806 6,151 31,655
Jun 41,686 2,406 44,091 6,155 37,936 Jui 42,146 2,419 44,564 6,115 38,450 Aug 44,396 2,440 46,836 6,595 40,240 Sep 44,186 2,452 46,638 6,381 40,257 Oct 43,586 2,511 46,097 6,015 40,082 Nov 44,976 2,536 47,512 6,151 41,355 Dec 46,506 2,671 49,177 6,569 42,608
1992: Jan 58,846 2,892 61,738 8,828 52,909 Feb 50,406 2,744 53,150 6,719 46,430 Mar 48,756 2,268 51,024 6,683 44,341 Apr 49,026 2,604 51,630 6;923 44,706 May 49,326 2,576 51,902 6,822 45,079 Jun 49,936 2,564 52,500 6,770 45,729 Jui 51,876 2,583 54,459 7,436 47,022 Aug 53,676 2,611 56,287 7,884 48,403 Sep 53,636 2,663 56,299 7,341 48,957 Oct 54,066 2,682 56,748 7,160 49,588 Nov 54,326 2,725 57,051 7,584 49,467 Dec 58,226 2,931 61,157 8,985 52,172
Money supply Money SUPPiy Money s.ipply def'mition 1 definition 2 definition 3
As at end of Foreign Foreign Foieign year/month JIK$ currency Total JIK$ currency Total JIK$ currency Total
1987 73,826 8,076 81,902 310,910 366,132 677,042 342,847 400,506 743,353
1988 79,257 9,577 88,834 355,065 469,583 824,648 389,052 504,291 893,342
1989 85,183 9,675 94,858 403,987 584,849 988,836 434,376 625,831 1,060,207
1990 91,826 15,683 107,509 471,934 738,116 1,210,050 503,482 784,546 1,288,028
1991 111,769 16,728 128,497 595,808 775,182 1,370,990 619,882 817,460 1,437,342
1992 139,479 16,078 155,551 668,302 850,415 1,518,777 691,586 882,679 1,574,265
1990: Dec 91,826 15,683 107,509 471,934 738,116 1,210,050 .503,482 784,546 1,288,028
1991: Jan 97,062 13,880 110,942 486,780 750,173 . 1,236,952 517,067 796,129 1,313,.195 Feb 100,167 16,723 116,889 494,355 743,828 1,238,183 522,888 787,938 1,310,826 Mar 94,145 13,689 107,834 485,432 754,280 1,239,712 514,281 800,328 1,314,609 Apr 98,123 14,234 112,357 494,727 757,993 1,252,720 523,355 801,514 1,324,869 May 93,813 13,834 107,647 497,168 754,873 1,252,041 525,158 794,133 1,319,291 Jun 93,050 15,398 108,449 503,523 755,769 1,259,292 532,028 796,120 l,328,148 Jui 99, 773 14,177 113,951 513,544 748,563 1,262,107 541,251 790,376 1,331,627 Aug 102,932 14,492 117,424 543,074 740,723 1,283,797 570,038 781,823 1,351,861 Sep 108,539 17,221 125,761 562,608 738,458 1,301,066 589,378 781,050 1,370,428 Oct 108,142 15,964 124,106 569,261 748,543 1,317,804 594,905 790,702 1,385,607 Nov 109,822 16,488 126,309 586,934 749,799 1,336,733 612,639 792,671 1,405,310 Dec 111,769 16,728 128,497 595,808 775,182 1,370,990 619,882 817,460 1,437,342
1992: Jan 125,705 15,619 141,32.4 598,312 789,062 1,387,374 621,397 829,890 1,451,287 Feb 112,491 16,074 128,565 593,617 788,296 1,381.913 616,462 829,637 . 1,446,099 Mar 115,642 14,139 129,781 594,303 784,905 1,379,207 617,106 823,213 1,440,319 Apr 116,907 15,072 131,979 605,935 790,474 1,396,409 628,727 827,595 1,456,321. May 124,221 15,116 139,337 630,352 800,462 1,430,814 653,261 838,046 1,491,307 Jun 131,773 16,110 147,883 642,667 804,117 1,446,784 665,028 843,956 1,508,984 Jui 132,296 16,177 148,473 646,877 803,724 1,450,601 668,875 839,426 1,508,301 Aug 128,021 16,469 144,490 651,930 815,861 1,467;792 674,205 852,150 1,526,355 Sep 149,595 15,830 165,425 668,648 831,571 1,500,219 691,090 866,428 1,557,518 Oct 230,705 16,879 247,584 799,370 842,179 1,641,549 821,033 875,839 1,696,872 Nov 134,847 17,866 152,713 659,680 838,607 1,498,286 681,987 873,824 1,555,811 Dec 139,479 16,078 155,551 668,302 850,415 1,518,777 691,586 882,679 1,574,265
§ Unadjusted for foreign currency swap deposits, adjusted figures are published in table 7 .3.
Hong Kong Monthly Digest of Statistics January 1993 63
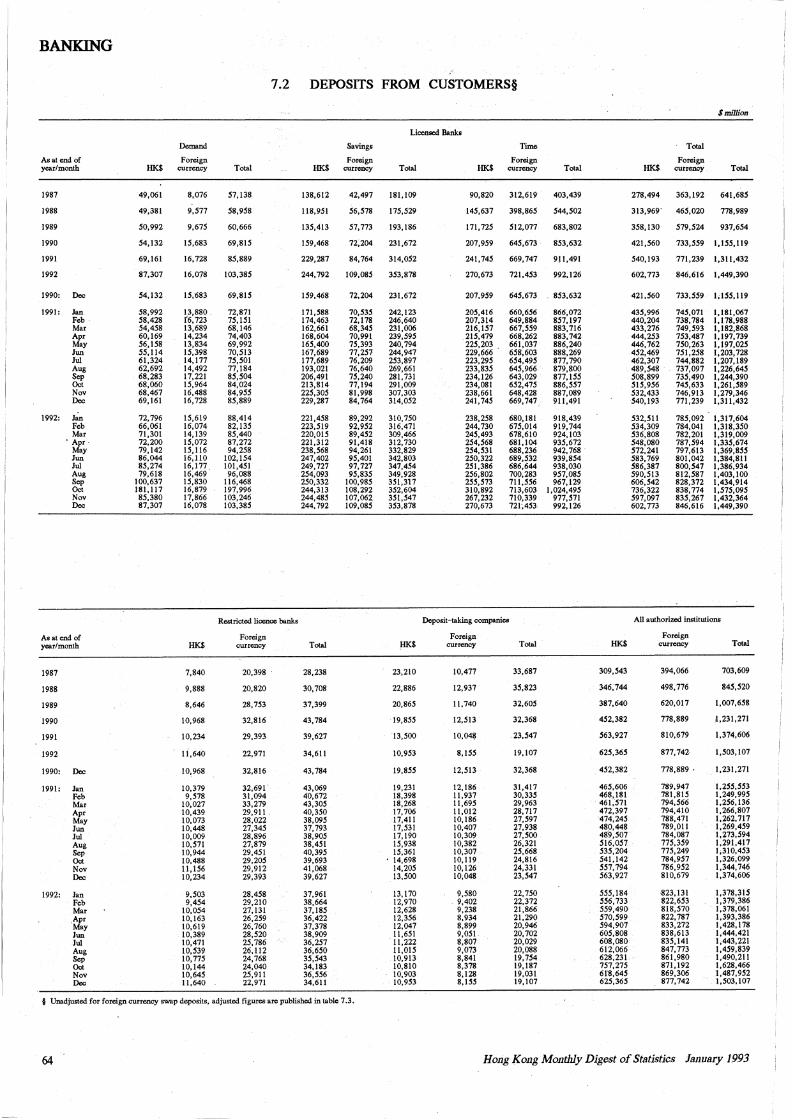
BANKING
7.2 DEPOSITS FROM CUSTOMERS§
$million
Licensed Banks
Demand Savings Time Total
As at end of Foreign Foreign Foreign Foreign year/month HK$ currency Total HK$ currency Total HK$ currency Total HK$ currency Total
1987 49,061 8,076 57,138 138,612 42,497 181,109 90,820 312,619 403,439 278,494 363,192 641,685
1988 49,381 9,577 58,958 118,951 56,518 175,529 145,637 398,865 544,502 313,969' 465,020 778,989
1989 50,992 9,675 60,666 135,413 57,773 193, 186 171,725 512,077 683,802 358, 130 579,524 937,654
1990 54,132 15,683 69,815 159,468 72,204 231,672 207,959 645,673 853,632 421,560 733,559 l,155,119
1991 69,161 16,728 85,889 229,287 84,764 314,052 241,745 669,747 911,491 540,193 771,239 l,311,432
1992 87,307 16,078 103,385 244, 792 109,085 353,878 270,673 721,453 992, 126 602, 773 846,616 l,449,390
1990: Dec 54,132 15,683 69,815 159,468 72,204 231,672 207,959 645,673 . 853,632 421,560 733,559 1;155,119
1991: Jan 58,992 13,880 72,871 171,588 70,535 242,123 205,416 660,656 866,072 435,996 745,071 1,181,067 Feb 58,428 f6, 723 75,151 174,463 72,178 246,640 207,314 649,884 857,197 440,204 738,784 l, 178,988 Mar 54,458 13,689 68,146 162,661 68,345 231,006 216,157 661,559 883,716 433,276 749,593 1,182,868 Apr 60,169 14,234 74,403 168,604 70,991 239,595 215,479 668,262 883,742 444,253 753,487 1,197,739 May 56,158 13,834 69,992 165,400 75,393 240,794 225,203 . 661,037 886,240 446,762 750,263 1,197,025 Jun 55,114 15,398 70,513 167,689 77,257 244,947 229,666 658,603 888,269 452,469 751,258 1,203,728 Jui 61,324 14,177 75,501 177,689 76,209 253,897 223,295 654,495 877, 790 462,307 744,882 1,207,189 Aug 62,692 14,492 77,184 193,021 76,640 269,661 233,835 645,966 879,800 489,548 737,097 1,226,645 Sep 68,283 17,221 85,504 206,491 75,240 281,731 234,126 643,029 877,155 508,899 735,490 1,244,390 Oct 68,060 15,964 84,024 213,814 77,194 291,009 234,081 652,475 886,557 515,956 745,633 1,261,589 Nov 68,467 16,488 84,955 225,305 81,998 307,303 238,661 648,428 887,089 532,433 746,913 1,279,346 Dec 69,161 16,728 85,889 229,287 84,764 314,052 241,745 669,747 911,491 540,193 771,239 1,311,432
1992: J.;,, 72,796 15,619 88,414 221,458 89,292 310,750 238,258 680,181 918,439 532,511 785,092 l,317,604 Feb 66,061 16,074 82,135 223,519 92,952 316,471 244, 730 675,014 919,744 534,309 784,041 1,318,350 Mar 71,301 14,139 85,440 220,015 89,452 309,466 245,493 678,610 924,103 536,808 782,201 1,319,009
'Apr 72,200 15,072 87,272 221,312 91,418 312,730 254,568 681,104 935,672 548,080 787,594 1,335,674 May 79,142 15,116 94,258 238,568 94,261 332,829 254,531 688,236 942,768 572,241 797,613 1,369,855 Jun 86,044 16,110 102,154 247,402 95,401 342,803 250,322 689,532 939,854 583, 769 801,042 1,384,811 Jui 85,274 16,177. 101,451 249, 727 97,727 347,454 251,386 686,644 938,030 586,387 800,547 1,386,934 Aug 79,618 16,469 96,088 254,093 95,835 349,928 256,802 700,283 957,085 590,513 812,587 1,403,100 Sep 100,637 15,830 116,468 250,332 100,985 351,317 255,573 711,556 967,129 606,542 828,372 l,434,914 Oct 181,117 16,879 197,996 244,313 108,292 352,604 310,892 713,603 1,024,495 736,322 838,774 1,515,095 Nov 85,380 17,866 103,246 244,485 107,062 351,547 267,232 710,339 977,571 597,097 835,267 1,432,364 Dec 87,307 16,078 103,385 244,792 109,085 353,878 270,673 721,453 992,126 602, 773 846,616 1,449,390
Restricted licence banks Deposit-taking companies All authorized institutions
As at end of Foreign Foreign Foreign year/month HK$ currency Total HK$ currency Total HK$ currency Total
1987 7,840 20,398 28,238 23,210 10,477 33,687 309,543 394,066 703,609
1988 9,888 20,820 30,708 22,886 12,937 35,823 346,744 498,776 845,520
1989 8,646 28,753 37,399 20,865 11, 740 32,605 387,640 620,017 1,007,658
1990 10,968 32,816 43,784 19,855 12,513 32,368 452,382 778,889 1,231,271
1991 10,234 29,393 39,627 13,500 10,048 23,547 563,927 810,679 l,374,606
1992 ll,640 22,971 34,611 10,953 8, 155 19,107 625,365 877,742· 1,503,107
1990: Dec 10,968 32,816 43,784 19,855 12,513 32,368 452,382 778,889 . 1,231,271
1991: Jan 10,379 32,691' 43,069 19,231 12,186 31,417 465,606 789,947 l,255,553 Feb 9,578 31,094 40,672 18,398 11,937 30,335 468,181 781,815 1,249,995 Mar 10,027 33,279 43,305 18,268 ll,695 29,963 461,571 794,566 l,256,136 Apr 10,439 29,911. 40,350 17,706 11,012 28,717 472,397 794,410 1,266,807 May 10,073 28,022 38,095 17,411 10,186 27,597 474,245 788,471 1,262,717 Jun 10,448 27,345 37,793 17,531 10,407 27,938 480,448 789,011 1,269,459 Jui 10,009 28,896 38,905 17,190 10,309 27,500 48'9,507 784,087 l,273,594 Aug 10,571 27,879 38,451 15,938 10,382 26,321 516,057 775,359 l,291,417 Sep 10,944 29,451 40,395 15,361 10,307 25,668 535,204 775,249 1;310,453 Oct 10,488 29,205 39,693 . 14,698 10,119 24,816 541,142 784,957 l,326,099 Nov 11,156 29,912 41,068 14,205 10,126 24,331 551, 794 786,952 1,344, 746 Dec 10,234 29,393 39,627 13,500 10,048 23,547 563,927 810,679 1,374,606
1992: Jan 9,503 28,458 37,961 13,170 9,580 22, 750 555, 184 823,131 1,378,315 Feb 9,454 29,210 38,664 12,970 9,402 22,372 556,733 822,653 1,379,386 Mar 10,054 27,131 37,185 12,628 9,238 21,866 559,490 818,570 l,378,061 .Apr 10,163 26,259 36,422 12,356 8,934 21,290 510,599 822, 787 1,393,386 May 10,619 26,760 37,378 12,047 8,899 20,946 594,907 833,272 l,428,178 Jun 10,389 28,520 38,909 11,651 9,051 20,702 605,808 838,613 l,444,421 Jui 10,471 25,786 36,257 11,222 8,807 20,029 608,080 835,141 1,443,221 Aug 10,539 26, 112 36,650 11,015 9,073 20,088 612,066 847, 773 1,459,839 Sep 10,775 24, 768 35,543 10,913 8,841 19,754 628,231 861,980 l,490,211 Oct 10,144 24,040 34,183 10,810 8,378 19,187 757,275 871,192 l,628,466 Nov 10,645 25,911 36,556 10,903 8,128 19,031 61'8,645 869,306 l,487,952 Dec 11,640 22,971 34,611 10,953 8,155 19,107 625,365 877,742 1,503, 107
§ Unadjusted for foreign currency swap deposits, adjusted figures are published in table 7 .3.
64 Hong Ko11g Monthly Digest of Statistics Jmwary 1993
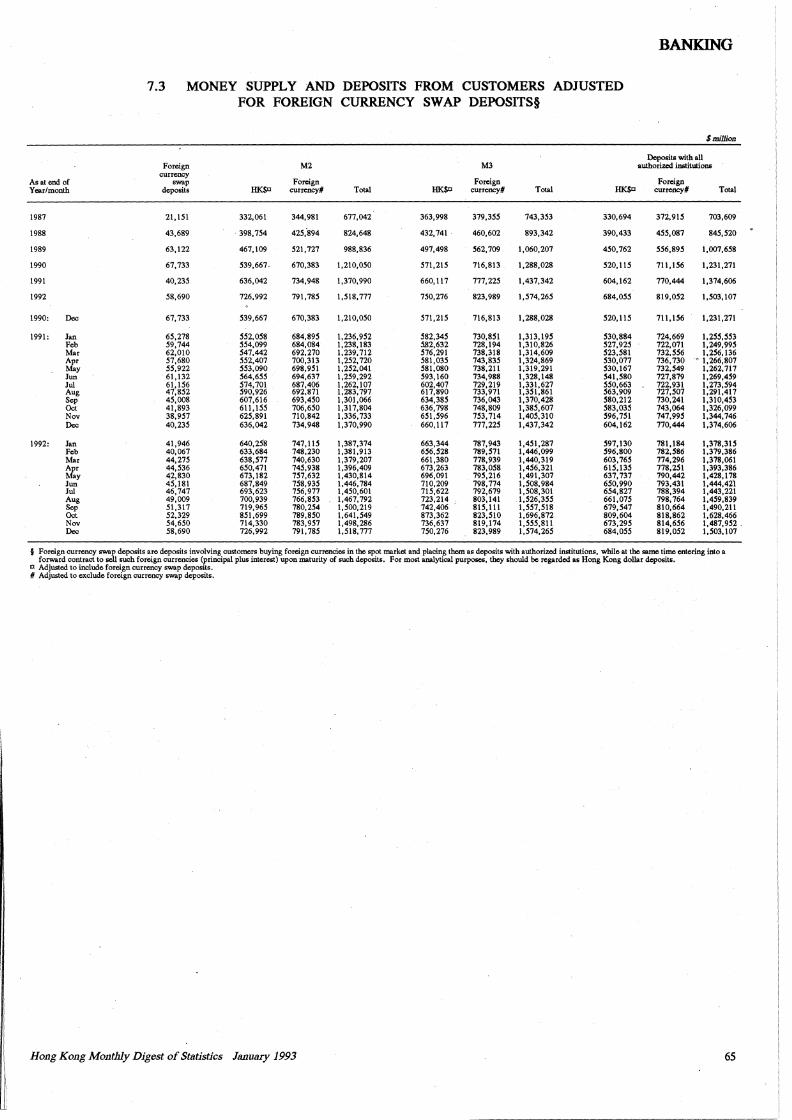
BANKING
7.3 MONEY SUPPLY AND DEPOSITS FROM CUSTOMERS ADJUSTED FOR FOREIGN CURRENCY SWAP DEPOSITS§
Smillioo
Foreign M2 M3 Deposits with all
authori7.ed institutions cunency
Foreign Foreign Foreign As at end of """'P Year/month deposits HK$D currency# Total HK$D currency# Total HKSa currency# Total
1987 21,151 332,061 344,981 677,042 363,998 379,355 743,353 330,694 372,915 703,609
1988 43,689 . 398,754 425,'894 824,648 432,741 460,602 893,342 390,433 455,087 845,520
1989 63,122 467,109 521,727 988,836 497,498 562,709 1,060,207 450,762 556,895 1,007,658
1990 67, 733 539,667. 670,383 1,210,050 571,215 716,813 1,288,028 520,115 711,156 1,231,271
1991 40,235 636,042 734,948 1,370,990 660,117 777,225 1,437,342 604,162 770,444 l,374,606
1992 58,690 726,992 791,785 l,518,777 750,276 823,989 1,574,265 684,055 819,052 l,503,107
1990: Dec 67, 733 539,667 670,383 1,210,050 571,215 716,813 1,288,028 520,115 711,156 1,231,271
1991: Jan 65,278 552,058 684,895 1,236,952 582,345 730,851 1,313,195 530,884 724,669 1,255,553 Feb 59,744 554,099 684,084 l,238,183 5.82,632 728,194 1,310,826 521,925 722,071 1,249,995 Mar 62,010 547,442 692,270 1,239,712 576,291 738,318 1,314,609 523,581 732,556 1,256,136 Apr 57,680 552,401 700,313 l,252,720 581,035 743,835 1,324,869 530,077 736,730 .• 1,266,807 May 55,922 553,090 698,951 1,252,041 581,080 738,211 1,319,291 530,167 732,549 l,262,717 Jun 61,132 564,655 694,637 1,259,292 593,160 734,988 1,328,148 541,580 727,879 1,269,459 Jul 61,156 574,701 687,406 1,262,107 602,407 729,219 1,331,627 550,663 722,931 1,273,594 Aug 47,852 590,926 692,871 1,283,797 617,890 733,971 1,351,861 563,909 727,507 1,291,417 Sep 45,008 607,616 693,450 1,301,066 634,385 736,043 1,370,428 580,212 730,241 1,310,453 Oct 41,893 611,155 706,650 1,317,804 636,798 748,809 1,385,607 583,035 743,064 1,326,099 Nov 38,957 625,891 710,842 1,336,733 651,596 753,714 1,405,310 596, 751 747,995 1,344,746 Dec 40,235 636,042 734,948 1,370,990 660,117 777,225 1,437,342 604,162 770,444 1,374,606
1992: Jan 41,946 640,258 747,115 1,387,374 663,344 787,943 1,451,2&7 597,130 781,184 1,378,315 Feb 40,067 633,684 748,230 1,381,913 656,528 789,571 1,446,099 596,800 782,586 1,379,386 Mar 44,275 638,577 740,630 l,379,207 661,380 778,939 1,440,319 603,765 774,296 1,378,061
~~ 44,536 650,471 745,938 1,396,409 673,263 783,058 1,456,321 615,135 778,251 1,393,386 42,830 673,182 757,632 1,430,814 696,091 795,216 1,491,307 637,737 790,442 1,428,178
Jun 45,181 687,849 758,935 1,446,784 710,209 798,774 1,508,984 650,990 793,431 1,444,421 Jul 46,747 693,623 756,977 1,450,601 715,622 792,679 1,508,301 654,827 788,394 1,443,221 Aug 49,009 700,939 766,853 1,467,792 723,214 803,141 1,526,355 661,075 798;764 1,459,839 Sep 51,317 719,965 780,254 1,500,219 742,406 815,111 1,557,518 679,547 810,664 1,490,211 Oct. 52,329 851,699 789,850 1,641,549 873,362 823,510 1,696,872 809,604 818,862 1,628,466 Nov 54,650 714,330 783,957 1,498,286 736,637 819,174 1,555,811 673,295 814,656 1,487,952 . Dec 58,690 726,992 791,785 l,518,777 750,276 823,989 1,574,265 684,055 819,052 1,503,107
§ Foreign currency swap deposits are deposits involving customers buying foreign currencies in the spot market and placing them as deposits with authori7.ed institutions, ~bile at the same time entering inlo a forward contract to sell such foreign currencies (principal plus interest) upon maturity of such deposits. For most analyticsl purposes, they should be regarded as Hong Kong dollar deposits.
a Adjusted to include foreign currency swap deposits. # Adjusted to exclude foreign currency swap deposits.
Hong Kong Monthly Digest of Statistics January 1993 65
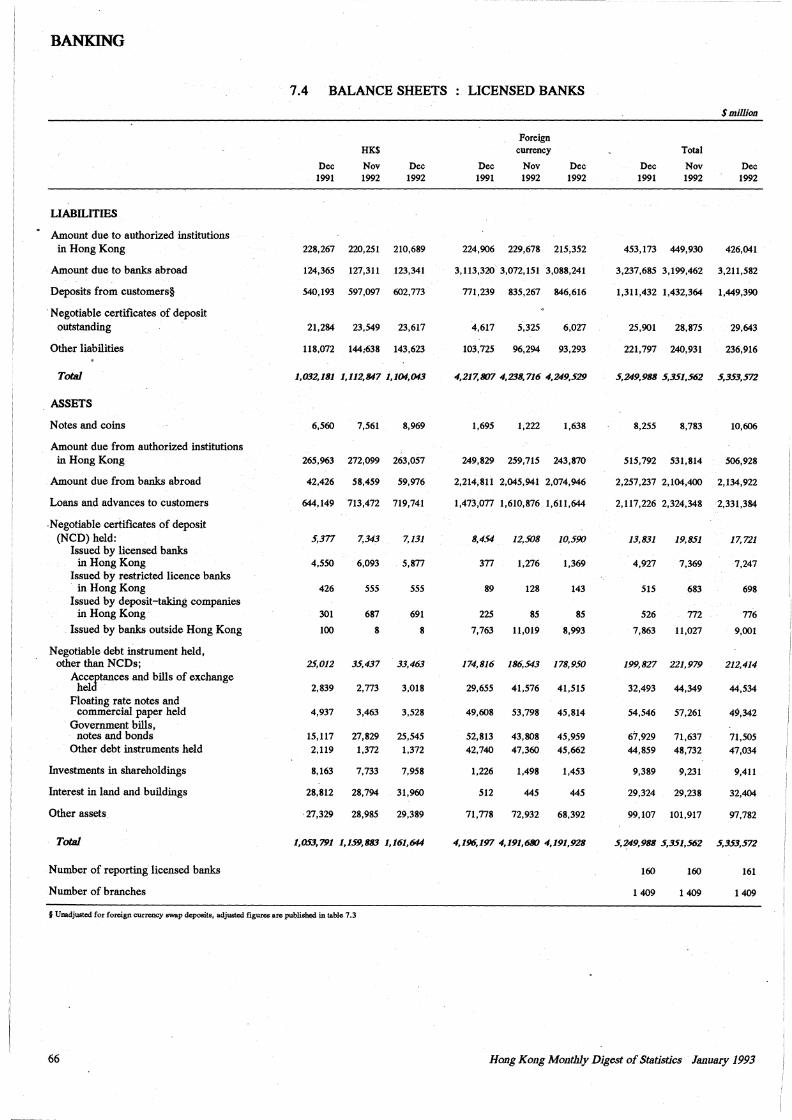
BANKING
7.4 BALANCE SHEETS LICENSED BANKS
$million
Foreign HK$ currency Total
Dec Nov Dec Dec Nov Dec Dec Nov Dec 1991 1992 1992 1991 1992 1992 1991 1992 1992
LIABILITIES
Amount due to authorized institutions in Hong Kong 228,267 220,251 210,689 224,906 229,678 215,352 453,173 449,930 426,041
Amount due to banks abroad 124,365 127,311 123,341 3, 113,320 3,072, 151 3,088,241 3,237,685 3,199,462 3,211,582
Deposits from customers§ 540,193 597,097 602,773 771,239 835,267 846,616 1,311,432 1,432,364 1,449,390
·Negotiable certificates of deposit outstanding 21,284 23,549 23,617 4,617 5,325 6,027 25,901 28,875 29,643
Other liabilities 118,072 144;638 143,623 103,725 96,294 93,293 221,797 240,931 236,916
Total 1,032,181 1,112,847 1,104,043 4,217,807 4,238, 716 4,249,529 5,249,988 5,351,562 5,353,572
ASSETS
Notes and coins 6,560 7,561 8,969 1,695 1,222 1,638 8,255 8,783 10,606
Amount due from authorized institutions in Hong Kong 265,963 272,099 263,057 249,829 259,715 243,870 515,792 531,814 506,928
Amount due from banks abroad 42,426 58,459 59,976 2,214,811 2,045,941 2,074,946 2,257,237 2,104,400 2,134,922
Loans and advances to customers 644,149 713,472 719,741 1,473,077 1,610,876 1,611,644 2,117,226 2,324,348 2,331,384
-Negotiable certificates of deposit (NCD) held: 5,377 7,343 7,131 8,454 12,508 10,590 13,831 19,851 17, 721
Issued by .licensed banks in Hong Kong 4,550 6,093 5,877 377 1,276 1,369 4,927 7,369 7,247
Issued by restricted licence banks in Hong Kong 426 555 555 89 128 143 515 683 698
Issued by deposit-taking companies in Hong Kong 301 687 691 225 85 85 526 772 776
Issued by banks outside Hong Kong 100 8 8 7,763 11,019 8,993 7,863 11,027 9,001
Negotiable debt instrument held, other than NCDs; 25,012 35,437 33,463 174,816 186,543 178,950 199,827 221,979 212,414
Accjtances and bills of exchange hel 2,839 2,773 3,018 29,655 41,576 41,515 32,493 44,349 44,534
Floating rate notes and commercial paper held 4,937 3,463 3,528 49,608 53,798 45,814 54,546 57,261 49,342
Government bills, notes and bonds 15,117 27,829 25,545 52,813 43,808 45,959 67,929 71,637 71,505
Other debt instruments held 2,119 1,372 1,372 42,740 47,360 45,662 44,859 48,732 47,034
Investments in shareholdings 8,163 7,733 7,958 1,226 1,498 1,453 9,389 9,231 9,411
Interest in land and buildings 28,812 28,794 31,960 512 445 445 29,324 29,238 32,404
Other assets 27,329 28,985 29,389 71,778 72,932 68,392 99,107 101,917 97,782
Total 1,053,791 1,159,883 1,161,644 4,196,197 4,191,680 4,191,928 5,~9,988 5,351,562 5,353,572
Number of reporting licensed banks 160 160 161
Number of branches 1409 1409 1409
§Unadjusted for foreign currency swap deposits, adjusted figures arc published in table 7.3
66 Hong Kong Monthly Digest of Statistics JanullrJ' 1993
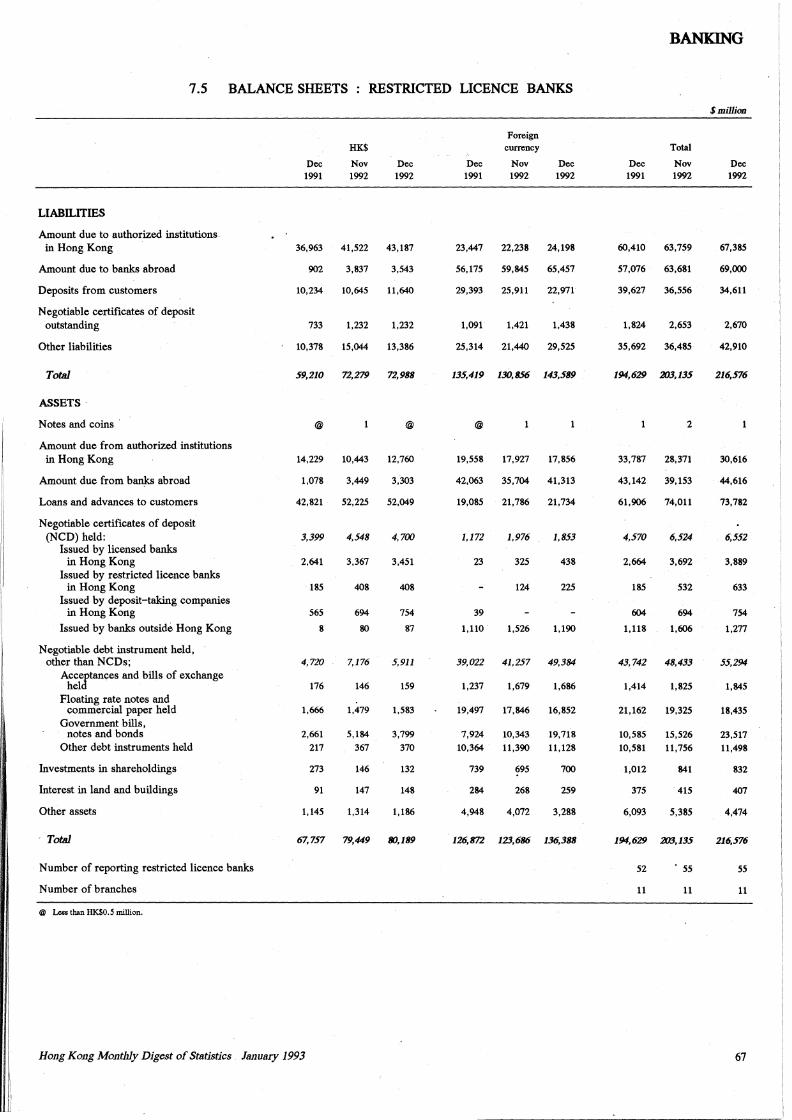
I
!'
I
I"
I
r;
Jill__ - ------~ ----
7.5 BALANCE SHEETS RESTRICTED LICENCE BANKS
LIABILITIES
Amount due to authorized institutions in Hong Kong
Amount due to banks abroad
Deposits from customers
Negotiable certificates of deposit outstanding
Other liabilities
ToW
ASSETS -
Notes and coins ·
Amount due from authorized institutions in Hong Kong
Amount due from banks abroad
Loans and advances to customers
Negotiable certificates of deposit (NCO) held:
Issued by licensed banks in Hong Kong
Issued by restricted licence banks in Hong Kong
Issued by deposit-taking companies in Hong Kong
Issued by banks outside Hong Kong
Negotiable debt instrument held, other than NCDs;
Acceptances and bills of exchange held
Floating rate notes and commercial paper held
Government bills, notes and bonds
Other debt instruments held
Investments in shareholdings
Interest in land and buildings
Other assets
ToW
Number of reporting restricted licence banks
Number of branches
® Less than HK$0.5 million.
Dec 1991
HK$
Nov 1992
Dec 1992
36,963 41,522 43,187
902 3,837 3,543
10,234 10,645 11,640
733 1,232 1,232
10,378 15,044 13,386
59,210 72,279 72,988
@ @
14,229 10,443 12,760
1,078 3,449 3,303
42,821 52,225 52,049
3,399 4,548 4, 700
2,641 3,367 3,451
185 408 408
565 694 754
8 80 87
4, 720 7, 176 5,911
176 146 159
1,666 1,479 1,583
2,661 5,184 3,799 217 367 370
273 146 132
91 147 148
1,145 1,314 1,186
67,757 79,449 MJ,189
Hong Kong Mo11thly Digest of St11tistics January 1993
Dec 1991
Foreign currency
Nov 1992
Dec 1992
23,447 22,238 24,198
56,175 59,845 65,457
29,393 25,911 22,971
1,091 1,421 1,438
25,314 21,440 29,525
135,419 130,856 143,589
@
19,558 17,927 17,856
42,063 35,704 41,313
19,085 21,786 21,734
1,172 1,976 1,853
23 325 438
124 225
39
1,110 - 1,526 1,190
39,022 41,257 49,384
1,237 1,679 1,686
19,497 17,846 16,852
7,924 10,343 19,718 10,364 11,390 11,128
739 695 700
284 268 259
4,948 4,072 3,288
126,872 123,686 136,388
BANKING
Dec 1991
Total
Nov 1992
60,410 63,759
57,076 63,681
39,627 36,556
1,824 2,653
35,692 36,485
194,629 203,135
2
33,787 28,371
43, 142 39, 153
61,906 74,011
4,570 6,524
2,664 3,692
185 532
604 694
l, 118 1,606
43, 742 48,433
1,414 1,825
21,162 19,325
10,585 15,526 10,581 11,756
1,012 841
375 415
6,093 5,385
194,629 203,135
52 . 55
11 11
$million
Dec 1992
67,385
69,000
34,611
2,670
42,910
216,576
30,616
44,616
73,782
6,552
3,889
633
754
1,277
55,294
1,845
18,435
23,517 11,498
832
407
4,474
216,576
55
11
67
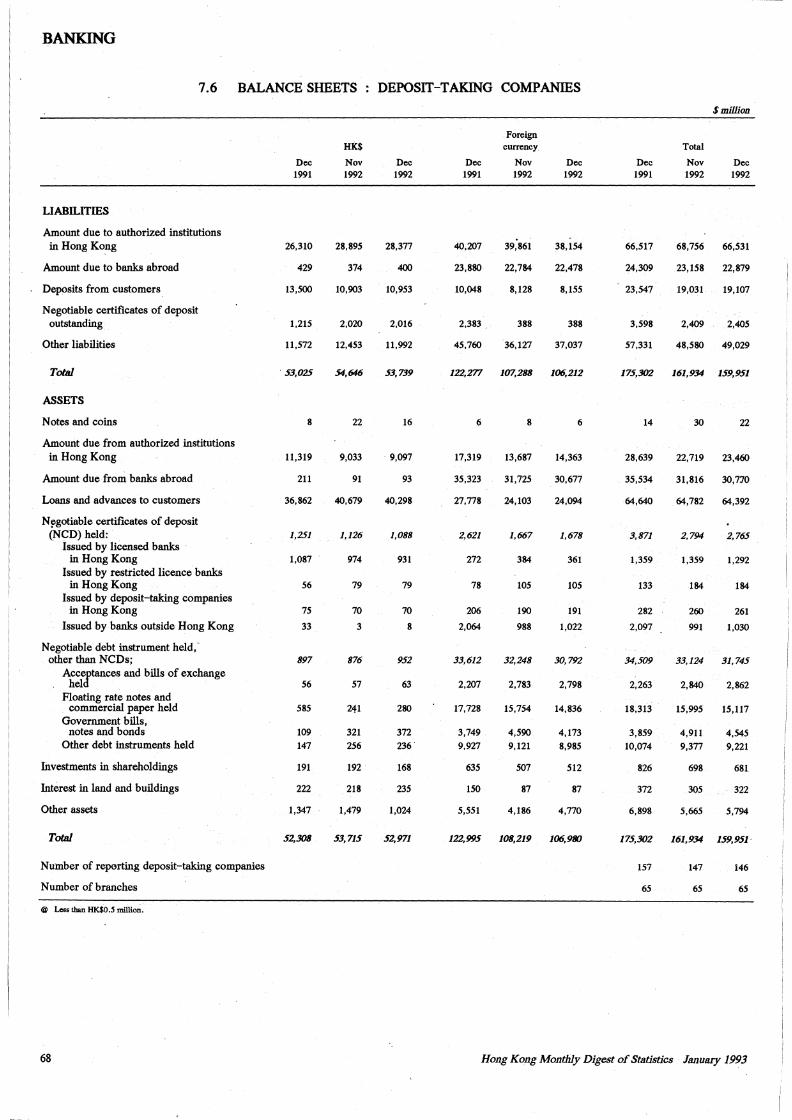
BANKING
7.6 BALANCE SHEETS DEPOSIT-TAKING COMPANIES
LIABILITIES
Amount due to authorized institutions in Hong Kong
Amount due to banks abroad
Deposits from customers
Negotiable certificates of deposit outstanding
Other liabilities
Total
ASSETS
Notes and coins
Amount due from authorized institutions in Hong Kong
Amount due·from banks abroad
Loans and advances to customers
N~gotiable certificates of deposit (NCD) held:
Issued by licensed banks in Hong Kong
Issued by restricted licence banks in Hong Kong
Issued by deposit-taking companies in Hong Kong
Issued by banks outside Hong Kong
Negotiable debt instrument held,· other than NCDs;
Acceptances and bills of exchange held
Floating rate notes and commercial paper held
Government bills, notes and bonds
Other debt instruments held
Investments in shareholdings
Interest in land and buildings
Other assets
Total
Number of reperting deposit-taking companies
Number of branches
® Less than HK$0.S million.
68
Dec 1991
26,310
429
13,500
1,215
11,572
. 53,025
8
11,319
211
36,862
1,251
1,087
56
75
33
897
56
585
109 147
191
222
1,347
52,308
HK$
Nov 1992
28,895
374
10,903
2,020
12,453
54,646
Dec 1992
28,3n
400
10,953
2,016
11,992
53,739
22 16
9,033 9,097
91 93
40,679 40,298
1,126 1,088
974 931
79 79
70 70
3 8
876 952
57 63
241 280
321 372 256 236'
192 . 168
218 235
1,479 1,024
53,715 52,971
Dec 1991
Foreign currency
Nov 1992
Dec 1992
40,207 39,861 38, 154
23,880 22,784 22,478
l0,048 8, 128 8, 155
2,383 - 388 388
45,760 36,127 37,037
122,277 107,288 106,212
6 8 6
17,319 13,687 14,363
35,323 31,725 30,677
27,n8 24,103 24,094
2,621 1,667 1,678
272 384 361
78 105 105
206 190 191
2,064 988 1,022
33,612 32,248 30, 792
2,207 2,783 2,798
17,728 15,754 14,836
3,749 4,590 4,173 9, 927 9, 121 8,985
635 507 512
150 87 87
5,551 4,186 4,770
122,995 108,219 106,980
Dec 1991
Total
Nov 1992
$million
Dec 1992
66,517 68,756 66,531
24,309 23,158 22,879
23,547 19,031 19,107
3,598 2,409 2,405
57,331 48,580 49,029
175,302 161,934 159,951
14 30 22
28,639 22,719 23,460
35,534 31,816 30,7'.70
64,640 64,782 64,392
3, 871 2, 794 2, 765
1,359 1,359 1,292
133 184 184
282 260 261
2,097 991 1,030
34,509 33, 124 31, 745
2,263 2,840 2,862
18,313 15,995 15,117
3,859 4,911 4,545
10,074 9,377 9,221
826 698 681
372 305 322
6,898 5,665 5,794
175,302 161,934 159,951
157 147 146
65 65 65
Hong Kong Monthly Digest of Statistics January 1993
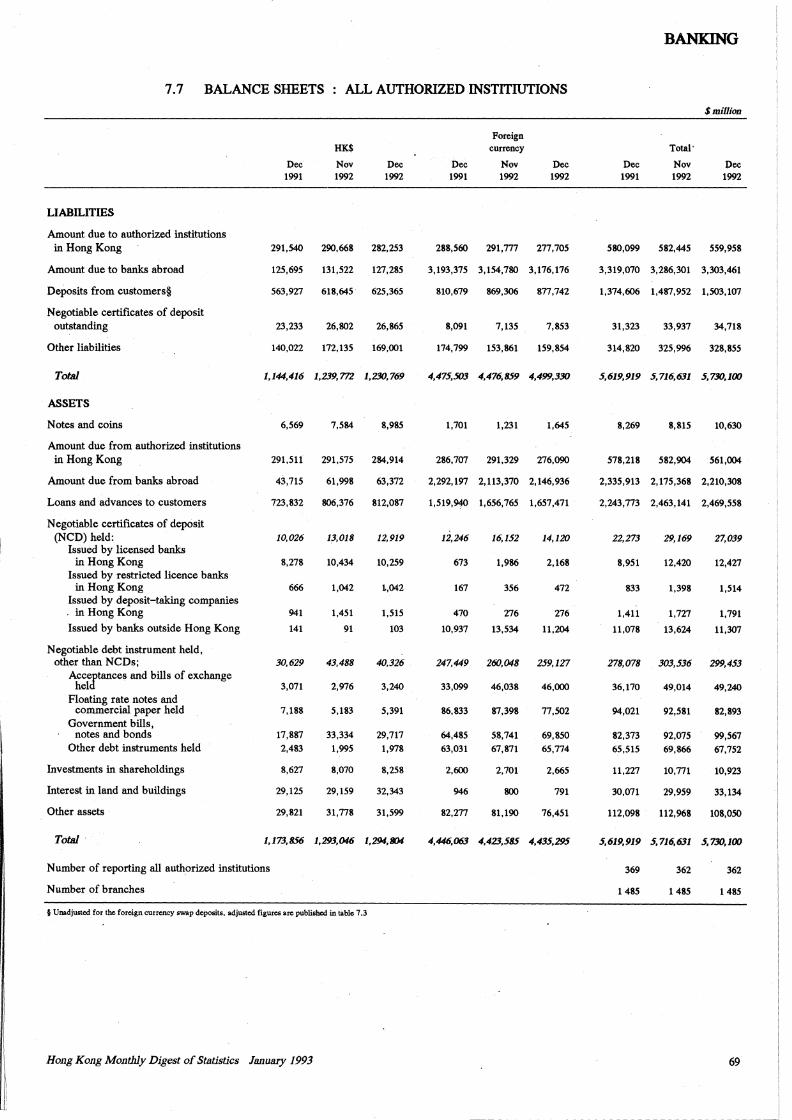
[]II]__: ____ ~----------
BANKING
7.7 BALANCE SHEETS ALL AUTHORIZED INSTITIUTIONS
$millioa
Foreign HK$ currency Total·
Dec Nov Dec Dec Nov Dec Dec Nov l>ec 1991 1992 1992 1991 1992 1992 1991 1992 1992
LIABILITIES
Amount due to authorized institutions in Hong Kong 291,540 290,668 282,253 288,560 291,777 m,105 580,099 582,445 559,958
Amount due to banks abroad 125,695 131,522 127,285 3,193,375 3,154,780 3,176,176 3,319,070 3,286,301 3,303,461
Deposits from customers§ 563,927 618,645 625,365 810,679 869,306 rn,742 1,374,606 1,487,952 1,503,107
Negotiable certificates of deposit outstanding 23,233 26,802 26,865 8,091 7,135 7,853 31,323 33,937 34,718
Other liabilities 140,022 172,135 169,001 174,799 153,861 159,854 314,820 325,996 328,855
Total 1,144,416 1,239,772 1,230,769 4,475,503 4,476,859 4,499,330 5,619,919 5,716,631 5,730,100
ASSETS
Notes and coins 6,569 7,584 8,985 1,701 1,231 1,645 8,269 8,815 10,630
Amount due from authorized institutions in Hong Kong 291,511 291,575 284,914 286,707 291,329 276,090 578,218 582,904 561,004
Amount due from banks abroad 43,715 61,998 63,372 2,292,197 2,113,370 2,146,936 2,335,913 2,175;368 2,210,308
Loans and advances to customers 723,832 806,376 812,087 1,519,940 1,656,765 1,657,471 2,243,773 2,463,141 2,469,558
Negotiable certificates of deposit (NCD) held: 10,026 13,018 12,919 12,246 16,152 14,120 22,273 29,169 27,039
Issued by licensed banks in Hong Kong 8,278 10,434 10,259 673 1,986 2,168 8,951 12,420 12,427
Issued by restricted licence banks in Hong Kong 666 1,042 L,042 167 356 472 833 1,398 1,514
Issued by deposit-taking companies . in Hong Kong 941 1,451 1,515 470 276 276 1,411 1,727 1,791
Issued by banks outside Hong Kong 141 91 103 10,937 13,534 11,204 11,078 13,624 11,307
Negotiable debt instrument held, other than NCDs; 30,629 43,488 40,326 247,449 260,048 259,127 278,078 303,536 299,453
AcceJ'tances and bills of exchange hel 3,071 2,976 3,240 33,099 46,038 46,000 36,170 49,014 49,240
Floating rate notes and commercial paper held 7,188 5,183 5,391 86,833 87,398 77,502 94,021 92,581 82,893
Government bills, note& and bonds 17,887 33,334 29,717 64,485 58,741 69,850 82,373 92,075 99,567
Other debt instruments held 2,483 1,995 1,978 63,031 67,871 65,774 65,515 69,866 67,752
Investments in shareholdings 8,627 8,070 8,258 2,600 2,701 2,665 11,227 10,771 10,923
Interest in land and buildings 29,125 29,159 32,343 946 800 791 30,071 29,959 33,134
Other assets 29,821 31,778 31,599 82,277 81,190 76,451 112,098 112,968 108,050
Total. . 1,173,856 1,293,046 1,294,804 4,446,063 4,423,585 4,435,295 5,619,919 5,716,631 5, 730,100
Number of reporting all authorized institutions 369 362 362
Number of branches 1485 1485 1485
§ Unadjusted for the foreign currency swap deposits, adjusted figures arc publi&hcd in table 7 .3
Hong Kong Monthly Digest of Statistics January 1993 69
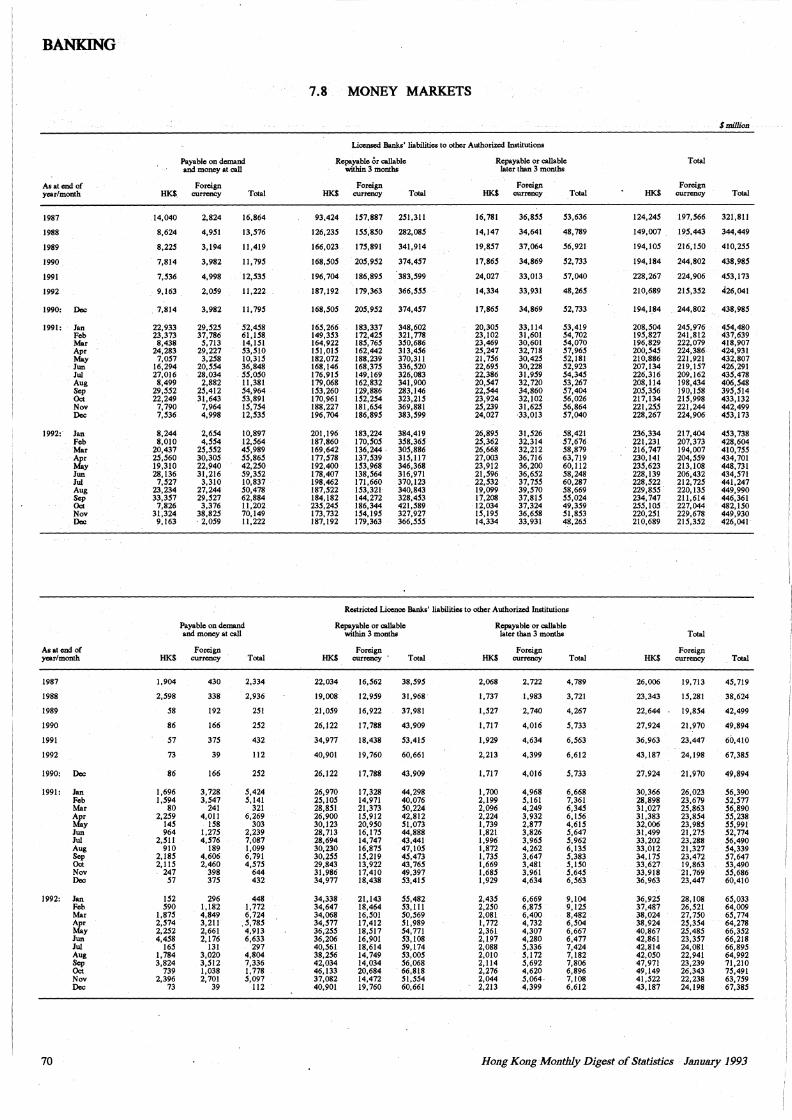
BANKING··
As at end of yearlmoDth
1987
1988
1989
1990
1991
1992
1990: Dec
1991: Jan Fob Mar Apr May Jun Jui Aug Sep Oct Nov Dec
1992:· Jan Feb Mar Apr May Jun Jui Aug
~ Nov
. Dec
As at end of yearlmoD!h
1987
1988
1989
1990
1991
1992
1990: Dec
1991: Jan Fob Mar Apr May Jun Jui Aug
~ Nov Dec
1992: Jan Feb Mar Apr May Jun Jui Aug
~ Nov Dec
.14,040
8,624
8,225
7,814
7,536
9,163
. 7,814
22,933 23,373 8,438
24,283 7,057
16,294 27,016 8,499
29,552 22,249
7,790 7,536
8,244 8,010
20,437 25,560 19,310 28,136 7,527
23,234 33,357
7,826 31,324 9,163
HK$
1,904
2,598
58
86
57
73
86
1,696 l,594
80 2,259
145 964
2,511 910
2,185 2,115
247 57
152 590
1,875 2,574 2,252 4,458
165 1,784 3,824
739 2,396
73
Payable on demand and money at call
Foreign currency
2,824
4,951
3,194
3,982
4,998
2,059
3,982
29,525 37,786 5,713
29,227 3,258
20,554 28,034 2,882
25,412 31,643
7,964 4,998
2,654 4,554
25,552 30,305 22,940 31,216 3,310
27,244 29,527 3,376
38,825 . 2,059
Total
16,864
13,576
11,419
11, 795
12,535
.11,222
II, 795
52,458 61,158 14,151 53,510 10,315 36,848
. 55,050 11,381 54,964 53,891 15,754 12,535
10,897 12,564 45,989 55,865 42,250 59,352 10,837 50,478 62,884 11,202 70,149 11,222
Payable on demand and money at call
Foreign currency
430
338
192
166
375
39
166
3,728 3,547
241 4,011
158 1,275 4,576
189 4,606 2,460
398 375
296 1,182 4,849 3,211 2,661 2,176
131 3,020 3,512 1,038 2,701
39
Total
2,334
2,936
251
252
432
112
252
5,424 5,141
321 6,269
303 2,239 7,087 1,099 6,791 4,575
644 432
448 1,772 6,724
,5,785 4,913 6,633
297 4,804 7,336 1,778 5,097
112
7.8 MONEY MARKETS
Llcemed Banks' liabilities to other Authorized Institutions
Replyable or callable within 3 moDths
HK$
93,424
126,235
166,023
168,505
196,704
187,192
168,505
165,266 149,353 164,922 151,015 182,072 168,146 176,915 179,068 153,260 170,961 188,227 196,704
201,196 187,860 169,642 177,578 192,400 178,407 198,462 187,522 184,182 235,245 173,732 187,192
Foreign currency Total
157,887 251,311
155,850 282,085
175,891 341,914
205,952 374,457
186,895 . 383,599
179,363 366,355
205,952
183,337 172,425 185, 765 162,442 188,239 168,375 149,169 162,832 129,886 152,254 181,654 186,895
183,224 170,505 136,244. 137,539 153,968 138,564 171,660 153,321 144,272 186,344 154,195 179,363
374,457
348,602 321, 778 350,686 313,456 370,311 336,520 326,083 341,900 283,146 323,215 369,881 383,599
384,419 358,365 305,886 315,117 346,368 316,971 370,123 340,843 328,453 421,589 327,927 366,555
Repayable or callable later than 3 moDths
HK$
16,781
14,147
19,857
17,865
24,027
14,334
17,865
20,305 23,102 23,469 25,247 21,756 22,695 22,386 20,547 22,544 23,924 25,239 24,027
26,895 25,362 26,668 27,0Q3 23,912 21,596 22,532 19,099 17,208 12,034 15,195 14,334
Foreign currency
36,855
34,641
37,064
34,869
33,013
33,931
34,869
33,114 31,601 30,601 32,718 30,425 30,228 31,959 32,720 34,860 32,102 31,625 ·33,013
31,526 32,314 32,212 36,716 36,200 36,652 37,755 39,570 37,815 37,324 36,658 33,931
Total
53,636
48,789
56,921
52,733
57,040
48,265
52,733
53,419 54,702 54,070 57,965 52,181 52,923 54,345 53,267 57,404 56,026 56,864 57,040
58,421 57,676 58,879 63,719 60,112 58,248 60,287 58,669 55,024 49,359 51,853 48,265
Re.llricted Licence Banks' liabilities to other Authorized Institutions
Repayable or callable within 3 moDths
HK$
22,034
19,008
21,059
26,122
34,977
40,901
26,122
26,970 25,105 28,851 26,900 30,123 28,713 28,694 30,230 30,255 29,843 31,986 34,977
34,338 34,647 34,068 34,577 36,255 36,206 40,561 38,256 42,034 46,133 37,082 40,901
Foreign currency ,
16,562
12,959
16,922
17,788
18,438
19,760
17,788
17,328 14,971 21,373 15,912 20,950 16,175 14,747 16,875 15,219 13,922 17,410 18,438
21,143 18,464 16,501 17,412 18,517
l~:~~~ 14,749 14,034 20,684 14,472 19,760
Total
38,595
31,968
37,981
43,909
53,415
60,661
43,909
44,298 40,076 50,224 42,812 51,073 44,888 43,441 47,105 45,473 43,765 49,397 53,415
55,482 53,111 50,569 51,989 54,771 53,108 59,174 53,005 56,068 66,818 51,554 60,661
Repayable or callable later than 3 months
HK$
2,068
1,737
l,527
1,717
1,929
2,213
1,717
1,700 2,199 2,096 2,224 1,739 1,821 1,996 1,872 1,735 1,669 1,685 1,929
2,435 2,250 2,081 1,772 2,361 2,197 2,088 2,010 2,114 2,276 2,044 2,213
Foreign currency
2,722
l,983
2,740
4,016
4,634
4,399
4,016
4,968 5,161 4,249 3,932 2,877 3,826 3,965 4,262 3,647 3,481 3,961 4,634
6,669 6,875 6,400 4,732 4,307 4,280 5,336 5,172 5,692 4,620 5,064· 4,399
Total
4,789
3,721
4,267
5,733
6,563
6,612
5,733
6,668 7,361 6,345 6,156 4,615 5,647 5,962 6,135 5,383 5,150 5,645 6,563
9,104 9,125 8,482 6,504 6,667 6,477 7,424 7,182 7,806 6,896 7,108 6,612
124,245
149,007
194,105
194,184
228,267
210,689
194,184
208,504 195,827 196,829 200,545 210,886 207,134 226,316 208,114 205,356 217,134 221,25,S 228,267
236,334 221,231 216,747 230,141 235,623 228,139 228,522 229,855 234,747 255,105. 220,251 210,689
HK$
26,006
23,343
22,644
27,924
36,963
43,187
27,924
30,366 28,898 31,027 31,383 32,006 31,499 33,202 33,012 34,175 33,627 33,918 36,963
36,925 37,487 38,024 38,924 40,867 42,861 42,814 42,050 47,971 49,149 41,522 43,187
Total
Foreign currency
H7,566
195,443
216,150
244,802
224,906
215,352
244,802
245,976 241,812 222,079 224,386 221,921 219,157 209,162 198,434 190,158 215,998 221,244 224,906
217,404 207,373 194,007 204,559 213,108 206,432 212,725 220,135 211,614 227,044 229,678 215,352
Total
Foreign currency
19,713
15,281
19,854
21,970
23,447
24,198
21,970
26,023 23,679 25,863 23,854 23,985 21,275 23,288 21,327 23,472 19,863 21,769 23,447
28,108 26,521 27,750 ~.354 25,485 23,357 24,081 22,941 23,239 26,343 22,238 24,198
SmiDion
Total
321,811
344,449
410,255
438,985
453,173
426,041
438,985
454,480 437,639 418,907 424,931 432,807 426,291 435,478 406,548 395,514 433,132 442,499 453,173
453,738 428,604 410,755 434,701 448,731 434,571 441,247 449,990 446,361 482,150 449,930 426,041"
. Total
45,719
38,624
42,499
49,894
60,410
67,385
49,894
56,390 52,577 56,890 55,238 55,991 52;114 56,490 54,339 57,647 53,490 55,686 60,410
65,033 64,009 65,774 64,278 66,352 66,218 66,895 64,992 71,210 75,491 63,759 67,385
70 Hong Ko11g Monthly Digest of Statistics · lanl11lrJ' J 993
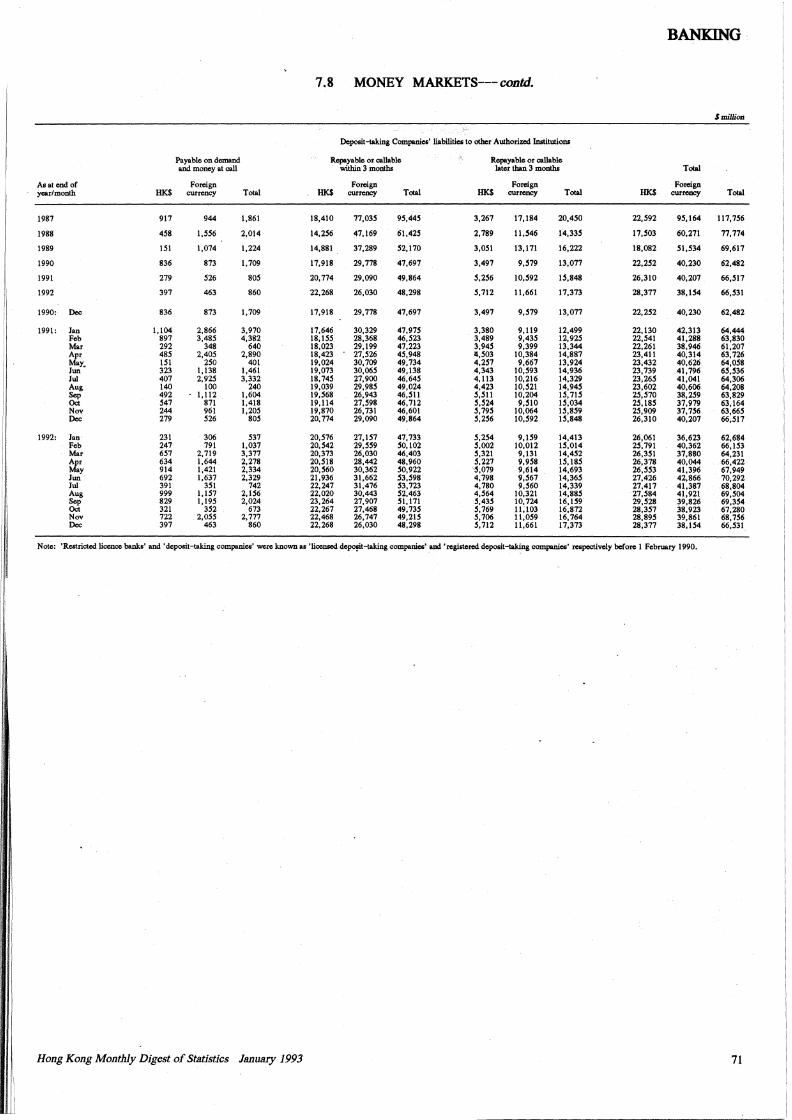
I
I
1;
1:
I
I: I'
I
I:
I
1·
1.
I
1.
I
I
I.
I'
IJ'lllI.
1J
---------- =---~---
BANKING
7.8 MONEY MARKETS--- cont.cl.
$million
Deposit-taking Companies' liabilities to other Authorized Institutions
Payable on demand Repayable or callable Repayable or callable and money at call within 3 months later than 3 months Total
As at end of Foreign Foreign Foreign Foreign year/month HK$ currency Total HK$ currency Total HK$ currency Total HK$ currency Total
1987 917 944 1,861 18,410 77,03S 9S,44S 3,267 17,184 20,4SO 22,S92 9S,164 117, 7S6
1988 4S8 l,SS6 2,014 14,2S6 47,169 61,42S 2,789 11,S46 14,33S 17,S03 60,271 77, 774
1989 IS! 1,074 1,224 14,881 37,289 S2,170 3,0SI 13,171 16,222 18,082 Sl,S34 69,617
1990 836 873 1,709 17,918 29,778 47,697 3,497 9,S79 13,077 22,2S2 40,230 62,482
1991 279 S26 80S 20,774 29,090 49,864 S,2S6 10,S92 !S,848 26,310 40,207 66,Sl7
1992 397 463 860 22,268 26,030 48,298 S,712 11,661 17,373 28,377 38,IS4 66,S31
1990: Dec 836 873 1,709 17,918 29,778 47,697 3,497 9,S79 13,077 22,2S2 40,230 62,482
1991: Jan 1,104 2,866 3,970 17,646 30,329 47,97S 3,380 9,119 12,499 22,130 42,313 64,444 Feb 897 3,48S 4,382 18,!SS 28,368 46,S23 3,489 9,43S 12,92S 22,S41 41,288 63,830 Mar 292 348 640 18,023 29,199 47,223 3,94S 9,399 13,344 22,261 38,946 61,207 Apr 48S 2,405 2,890 18,423 27,S26 4S,948 ll,S03 10,384 14,887 23,411 40,314 63,726 May. !SI 250 401 19,024 30,709 49,734 4,2S7 9,667 13,924 23,432 40,626 64,0S8 Jun 323 1,138 1,461 19,073 30,06S 49,138 4,343 10,S93 14,936 23,739 41,796 6S,536 Jui 407 2,92S 3,332 18,74S 27,900 46,64S 4,113 10,216 14,329 23,26S 41,041 64,306 Aug 140 100 240 19,039 29,98S 49,024 4,423 10,S21 14,94S 23,602 40,606 64,208 Sep 492 1,112 l,604 19,S68 26,943 46,S11 S,Sll 10,204 IS,71S 2S,S70 38,2S9 63,829 Oct S47 871 1,418 19,114 27,S98 46,712 S,S24 9,SIO !S,034 2S,18S 37,979 63,164 Nov 244 961 l,20S 19,870 26,731 46,601 S,79S 10,064 IS,8S9 2S,909 37,7S6 63,66S Dec 279 S26 SOS 20,774 29,090 49,864 S,2S6 10,S92 !S,848 26,310 40,207 66,517
1992: Jan 231 306 S37 20,S76 27,157 47,733 S,2S4 9,IS9 14,413 26,061 36,623 62,684 Feb 247 791 1,037 20,S42 29,S59 S0,102 S,002 10,012 !S,014 2S,791 40,362 66,IS3 Mar 6S7 2,719 3,377 20,373 26,030 46,403 S,321 9,131 14,4S2 26,3Sl 37,880 64,231 Apr 634 1,644 2,278 20,S!S 28,442 48,960 S,227 9,9S8 !S,!8S 26,378 40,044 66,422 May 914 1,421 2,334 20,S60 30,362 S0,922 '5,079 9,614 14,693 26,SS3 41,396 67,949 Jun 692 1,637 2,329 21,936 31,662 .S3,S98 4,798 9,S67 14,36S 27,426 42,866 70,292 Jui 391 351 742 22,247 31,476 S3,723 4,780 9,560 14,339 27,417 41,387 68,804 Aug 999 l,IS7 2,IS6 22,020 30,443 S2,463 4,S64 10,321 14,88S 27,S84 41,921 69,S04 Sep 829 l,19S 2,024 23,264 27,907 Sl,171 5,43S 10,724 16,!S9 29,S28 39,826 69,3S4 Oct 321 3S2 673 22,267 27,468 49,73S S,769 11,103 16,872 28,357 38,923 67,280 Nov 722 2,055 2,777 22,468 26,747 49,21S S,706 11,059 16,764 28,89S 39,861 68, 756 Dec 397 463 860 22,268 26,030 48,298 S,712 11,661 17,373 28,377 38,IS4 66,531
Note: 'Restricted licence banks' and 'deposit-taking companies' were known as 'liocnsed depo~t-taking companies' and 'registered deposit-taking companies' respectively before I February 1990.
Hong Kong Monthly Digest of Statistics January 1993 71
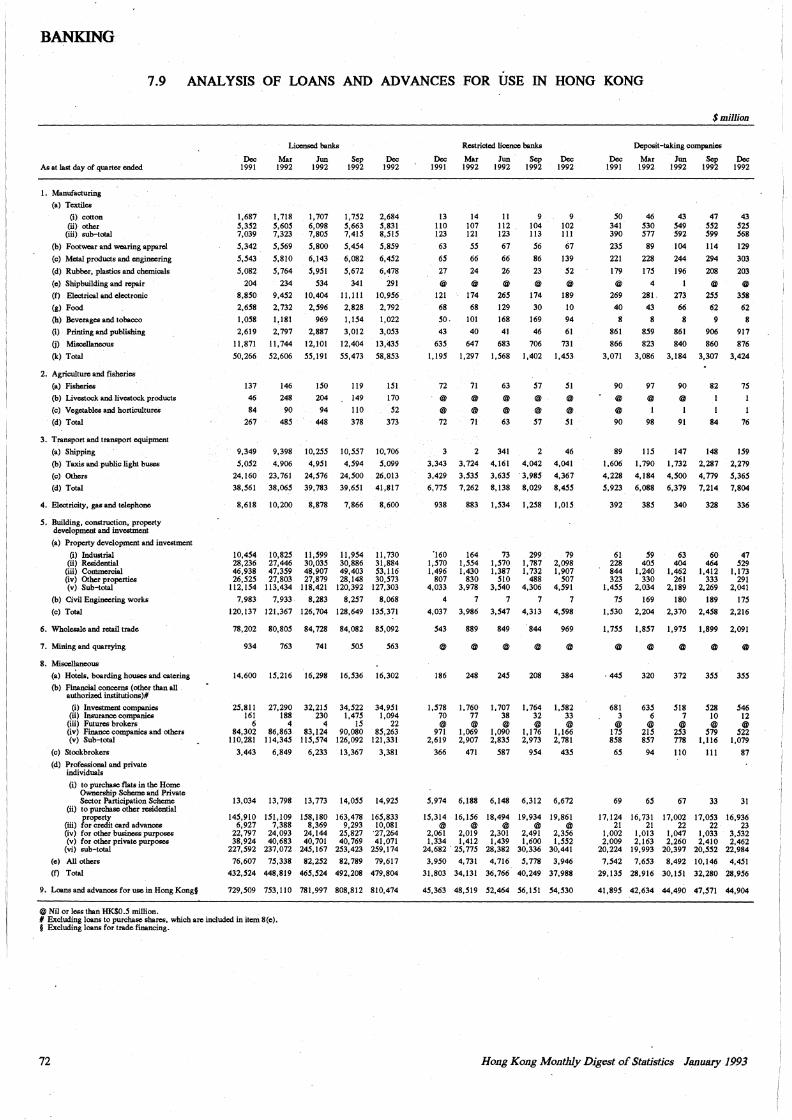
BANKING
7 .9 ANALYSIS OF LOANS AND ADVANCES FOR USE IN HONG KONG
As at last day of quarter ended
1. Manufacturing
(a) Textiles
(i) cotton (ii) other
(iii) sub-total
(b) Footwear and wearing apparel
(c) Metal products and engineering
(d) Rubber, plastics and chemicals
(e) Shipbuilding and repair
(f) Electrical and electronic
(g) Food
(h) Beverages and tobacco
(i) Printing and publishing
(j) Misce11aneous
(k) Total
2. Agriculture and fisheries
(a) Fisheries
(b) Livestock and livestock products
(c) Vegetables and horticultures
(d) Total
3. Transport and transport equipment
(a) Shipping
(b) Taxis and public light buses
(c) Others
(d) Total
4. Electricity, gas and telephone
5. Building, construction, property development and investment
(a) Property development and investment
(i) Industrial (ii) Residential
(iii) Commercial (iv) Other properties (v) Sub-total
(b) Civil Engineering works
(c) Total
6. Wholesale and retail trade
7. Mining and quarrying
8. Miscellaneous (a) Hoiels, boarding houses and catering
(b) Financial concerns (other than all authorized institutions)#
(i) Investment companies (ii) Insurance companies
(iii) Futures brokers (iv) Finance companies and others (v) Sub-total
(c) Stockbrokers
(d) Professional and private individuals
(i) to purchase flats in the Home Ownership Scheme and Private Sector Participation Scheme
(ii) to purchase other residential property
(iii) for credit card advances (iv) for other business purposes (v) for other private purposes
(vi) sub-total
(e) All others
(f) Total
9. Loans and advances for use in Hong Kong§
@Nil or less than HK$0.5 million.
Dec 1991
1,687 5,352 7,039
5,342
5,543
5,082
204
8,850
2,658
1,058
2.619
11,871
50.266
137
46
84
267
Lloensed banks
Mar Jun 1992 1992
1,718 5,605 7,323
5,569
5,810
5,764
234
9,452
2.732
1,181
2,797
11,744
52,606
146
248
90
485
1,707 6,098 7,805
5,800
6,143
5,951
534
10,404
2,596
969
2,887
12,101
55.191
150
204
94
448
Sep 1992
1,752 5,663 7,415
5,454
6,082
5,612
341
11.111
2,828
1,154
3,012
12,404
55,473
119
149
110
378
Dec 1992
2,684 5,831 8,515
5,859
6,452
6,478
291 10,956
2,792
1.022
3.053
13,435
58.853
151
170
52
373
9,349 9,398 10,255 10,557 10,706
5,052 4.906
24,160 23.761
38,561 38,065
4,951
24,576
39,783
4,594
24,500
39,651
5,099
26,013
41,817
8,618 10.200 8,878 7,866 8,600
10,454 28,236 46,938 26,525
112,154
7,983
10,825 27,446 47,359 27,803
113,434
7,933
11,599 30,035 48,907 27,879
118,421
8,283
11,954 30,886 49,403 28,148
120,392
8,257
11,730 31,884 53,116 30,573
127,303
8,068
120,137 121,367 126,704 128,649 135,371
78,202 80,805 84, 728 84,082 85,092
934 763 741 505 563
14.600 15,216 16.298 16,536 16.302
25,811 161
6 84,302
110,281
3.443
27,290 188
4 86,863
114,345
6,849
32,215 230
4 83,124
115,574
6,233
34,522 l,475
15 90,080
126,092
13,367
34.951 1,094
22 85,263
121,331
3,381
13,034 13,798 13,773 14,055 14,925
145,910 151,109 158,180 163,478 165,833 6,927 7,388 8,369 9,293 10,081
22, 797 24,093 24, 144 25,827 '27,264 38,924 40,683 40,701 40,769 41,071
227,592 237,072 245, 167 253,423 259, 174
76,607 75,338 82,252 82, 789 79,617
432,524 448,819 465,524 492,208 479,804
129,509 753,110 781,997 808,812 810,474
# Excluding loans to purchase shares, which are included in item 8(e). § Excluding loans for trade financing.
72
Restricted licence banks
Dec 1991
Mar Jun Sep 1992 1992 1992
13 14 110 107 123 121
63 55
65 66
27 24
@ @ 121 174
68 68
50. IOI
43 40
635 647
1,195 1,297
72
@
@
72
3,343
3,429
6,775
71
@
@
71
2 3,724
3,535
7,262
11 112 123
67
66
26
@
265
129
168
41
683
l,568
63
@
@
63
341
9 104 113
56
86
23
@
174
30
169
46
706
1,402
57 @
@
51
2
4,161 4.042
3,635 . 3,985
8,138 8,029
Dec 1992
9 102 111
67
139
52
@
189
10
94
61
731
1,453
51
@
® 51
46
4,041
4,367
8,455
938 883 1,534 1,258 1,015
"160 l,570 1,496
807 4,033
4
4,037
543
@
186
1,578 70 @
971 2,619
366
164 1,554 l,430
830 3,978
7 3,986
889
@
248
1,760 77 @
1,069 2,907
471
73 l,570 1,387
510 3,540
7
3,547
299 1,787 1.732
488 4,306
7
4,313
849 . 844
@ @
245
1,707 38 ®
1,090 2,835
587
208
1,764 32 @
1,176 2,973
954
79 2,098 1,907
507 4,591
7 4,598
969
@
384
1,582 33 @
1,166 2,781
435
5,974 6,188 6,148 6,312 6,672
15,314 16,156 18,494 19,934 19,861 @ @ @ ® ®
2,061 2,019 2,301 2,491 2.356 l,334 l,412 1,439 1,600 1.552
24,682 . 25, 775 28,382 30,336 30,441
3.950 4, 731 4, 716 5, 778 3,946
31,803 34,131 36,766 40,249 37,988
45,363 48,519 52,464 56,151 54,530
Dec 1991
50 341 390
235
221
179
@
269
40
8
861
866
3,071
90
@
® 90
89
1,606
4,228
5,923
392
61 228 844 323
1,455
15
1,530
$million
Deposit-taking companies
Mar Jun Sep 1992 1992 1992
46 530 511
89
228
115
4
281
43
859
823
3,086
97
@
98
115
1,790
4,184
6,088
385
59 405
1,240 330
2,034
169
2,204
43 549 592
104
244
196
I 273
66
8
861
840
3,184
90
@
I
91
147
1,732
4,500
6,379
340
63 404
1,462 261
2,189
180
2,370
47 552 599
114
294
208
@
255
62
9
906
860
3,307
82
84
148
2,287
4,779
7,214
328
60 464
1,412 333
2,269
189
2,458
Dec 1992
43 525 568
129
303
203
@
358
62
8
917
876
3,424
15
76
159
2,279
5,365
7,804
336
47 529
1,173 291
2,041
115
2,216
1,155 1,851 1,975 l,899 2,091
@ @ @ @ @
681 3
@ 175 858
65
69
320
635 6
® 215 857
94
65
372
518 7
® 253 778
110
67
355
528 10 ®
519 1,116
111
33
355
546 12 ®
522 1,079
87
31
17,124 16,731 17,002 17,053 16,936 21 21 22 22 23
1,002 1,013 1,047 1,033 3,532 2,009 2,163 2,260 2,410 2,462
20,224 19,993 20,397 20,552 22,984
1,542 7,653 8,492 10,146 4,451
29,135 28,916 30,151 32,280 28,956
41,895 42,634 44,490 41,511 44,904
Hong Kong Monthly Digest of Statistics l811ua.ry 1993
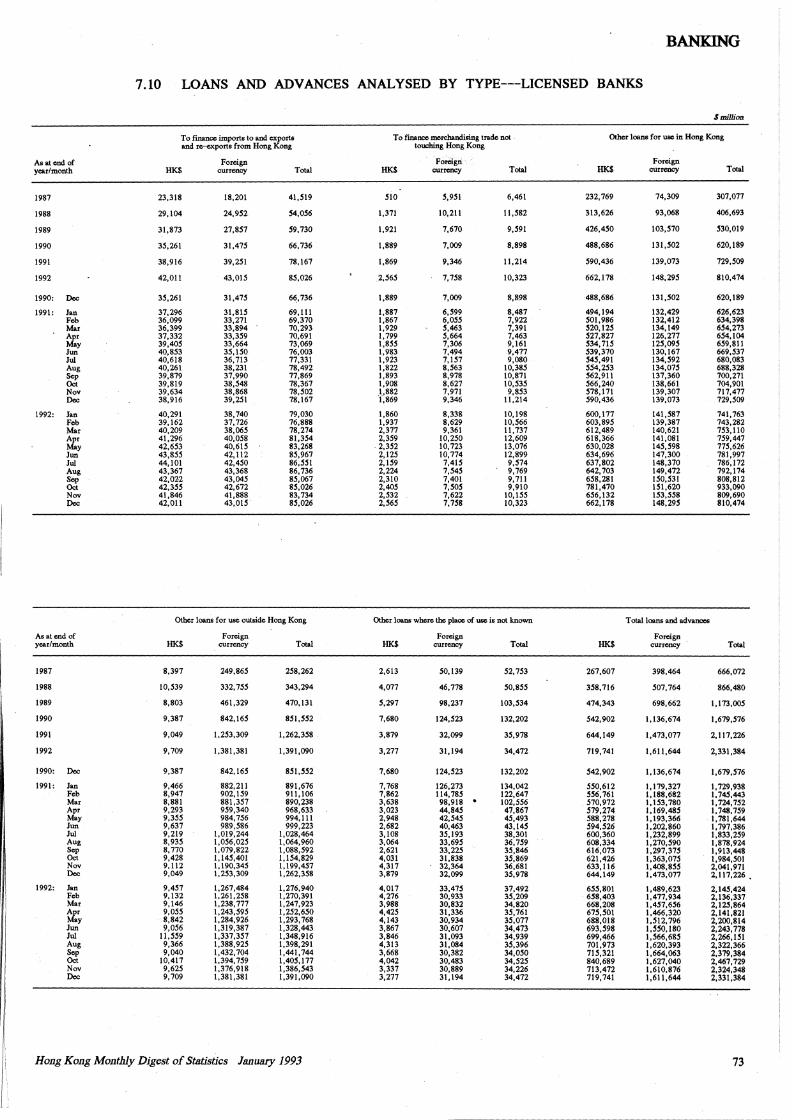
JllL
BANKING
7.10 LOANS AND ADVANCES ANALYSED BY TYPE---LICENSED BANKS
$million
To finance imports to and exports To finance merchandising trade not Other loons for use in Hong Kong and re-exports from Hong Kong touching Hong Kong
As at end of Foreign Foreign Foreign year/month HK$ currency Total HK$ currency Total HK$ currency Total
1987 23,318 18,201 41,519 510 5,951 6,461 232,769 74,309 307,077
1988 29,104 24,952 54,056 l,371 10,211 11,582 313,626 93,068 406,693
1989 31,873 27,857 59, 730 t,921 7,670 9,591 426,450 103,570 530,019
1990 35,261 31,475 66,736 1,889 7,009 8,898 488,686 131,502 620,189
1991 38,916 39,251 78,167 1,869 9,346 11,214 590,436 139,073 729,509
1992 42,011 43,015 85,026 2,565 7,758 10,323 662,178 148,295 810,474
1990: Dec 35,261 31,475 66,736 1,889 7,009 8,898 488,686 131,502 620,189
1991: Jan 37,296 31,815 69,111 1,887 6,599 8,487 494,194 132,429 626,623 Feb 36,099 33,271 69,370 1,867 6,055 7,922 501,986 132,412 634,398 Mar 36,399 33,894 70,293 1,929 5,463 7,391 520,125 134,149 654,273 Apr 37,332 33,359 70,691 1,799 5,664 7,463 527,827 126,277 654,104 May 39,405 33,664 73,069 1,855 7,306 9,161 534, 715 125,095 659,811 Jun 40,853 35,150 76,003 1,983 7,494 9,477 539,370 130,167 669,537 Jui 40,618 36,713 77,331 1,923 7,157 9,080 545,491 134,592 680,083 Aug 40,261 38,231 78,492 1,822 8,563 10,385 554,253 134,075 688,328 Sep 39,879 37,990 77,869 1,893 8,978 10,871 562,911 137,360 700,271 Oct 39,819 38,548 78,367 1,908 8,627 10,535 566,240 138,661 704,901 Nov 39,634 38,868 78,502 1,882 7,971 9,853 578,171 139,307 717,477 Dec 38,916 39,251 78,167 l,869 9,346 11,214 590,436 139,073 729,509
1992: Jan 40,291 38,740 79,030 1,860 8,338 10,198 600,177 141,587 741,763 Feb 39,162 37,726 76,888 1,937 8,629 10,566 603,895 139,387 743,282 Mar 40,209 38,065 78,274 2,377 9,361 11,737 612,489 140,621 753,110 Apr 41,296 40,058 81,354 2,359 10,250 12,609 618,366 141,081 759,447 May 42,653 40,615 83,268 2,352 10,723 13,076 630,028 145,598 775,626 Jun 43,855 42,112 85,967 2,125 10,774 12,899 634,696 147,300 781,997 Jui 44,101 42,450 86,551 2,159 7,415 9,574 637,802 148,370 786,172 Aug 43,367 43,368 86,736 2,224 7,545 9,769 642, 703 149,472 792,174 Sep 42,022 43,045 85,067 2,310 7,401 9,711 658,281 150,531 808,812 Oct 42,355 42,672 85,026 2,405 7,505 9,910 781,470 151,620 933,090 Nov 41,846 41,888 83, 734 2,532 7,622 10,155 656,132 153,558 809,690 Dec 42,011 43,015 85,026 2,565 7,758 10,323 662,178 148,295 810,474
Other loans for use outside Hong Kong Other loons where the place of use is not known Total loans and advances
As at end of Foreign Foreign Foreign year/month HK$ currency Total HK$ currency Total HK$ currency Total
1987 8,397 249,865 258,262 2,613 50,139 52, 753 267,607 398,464 666,072
1988 10,539 332, 755 343,294 4,077 46,778 50,855 358,716 507,764 866,480
1989 8,803 461,329 470,131 5,297 98,237 103,534 474,343 698,662 1,173,005
1990 9,387 842, 165 851,552 7,680 124,523 132,202 542,902 1,136,674 1,679,576
1991 9,049 1,253,309 1,262,358 3,879 32,099 35,978 644,149 1,473,077 2,117,226
1992 9,709 1,381,381 1,391,090 3,277 31,194 34,472 719,741 1,611,644 2,331,384
1' 1990: Dec 9,387 842,165 851,S52 7,680 124,523 132,202 542,902 1,136,674 1,679,576
1991: Jan 9,466 882,211 891,676 7,768 126,273 134,042 550,612 1,179,327 t,729,938 Feb 8,947 902,159 911, 106 7,862 114, 785 122,647 556,761 t,188,682 1, 745,443
I Mar 8,881 881,357 890,238 3,638 98,918 . 102,556 570,972 1,153,780 1,724,752 I Apr 9,293 959,340 968,633 3,023 44,845 47,867 579,274 1,169,485 t, 748,759
May 9,355 984,756 994, 111 2,948 42,545 45,493 588,278 l, 193,366 1, 781,644 Jun 9,637 989,586 999,223 2,682 40,463 43,145 594,526 1,202,860 1,797,386
I Jui 9,219 l,019,244 1,028,464 3,108 35,193 38,301 600,360 1,232,899 t,833,259
1f Aug 8,935 1,056,025 1,064,960 3,064 33,695 36, 759 608,334 1,270,590 t,878,924 Sep 8,770 1,079,822 1,088,592 2,621 33,225 35,846 616,073 1,297,375 t,913,448 Oct 9,428 1,145,401 1,154,829 4,031 31,838 35,869 621,426 1,363,075 t,984,501
ii Nov 9, 112 1,190,345 1,199,457 4,317 32,364 36,681 633,tl6 1,408,855 2,041,971 Dec 9,049 1,253,309 1,262,358 3,879 32,099 35,978 644,149 1,473,077 2,ll7,226 •
1992: Jan 9,457 1,267,484 1,276,940 4,017 33,475 37,492 655,801 1,489,623 2,145,424 I Feb 9,132 1,261,258 t,270,391 4,276 30,933 35,209 658,403 1,477,934 2,136,337 I Mar 9,146 1,238,777 t,247,923 3,988 30,832 34,820 668,208 1,457,656 2,125,864
Apr 9,055 1,243,595 1,252,650 4,425 31,336 35,761 675,501 1,466,320 2,141,821 May 8,842 1,284,926 1,293,768 4,143 30,934 35,077 688,018 1,512,796 2,200,814
I, Jun 9,056 1,319,387 1,328,443 3,867 30,607 34,473 693,598 1,550, 180 2,243,778
I' Jui 11,559 1,337,357 t,348,916 3,846 31,093 34,939 699,466 1,566,685 2,266,151 Aug 9,366 t,388,925 l,398,291 4,313 31,084 35,396 701,973 1,620,393 2,322,366 Sep 9,040 1,432,704 1,441, 744 3,668 30,382 34,050 715,321 1,664,063 2,379,384 Oct 10,417 l,394,759 l,405,177 4,042 30,483 34,525 840,689 1.627,040 2,467,729 Nov 9,625 t,376,918 1,386,543 3,337 30,889 34,226 713,472 1,610,876 2,324,348 Dec 9,709 1,381,381 1,391,090 3,277 31,194 34,472 719,741 1,611,644 2,331,384
Hong Kong Monthly Digest of Statistics January 1993 73
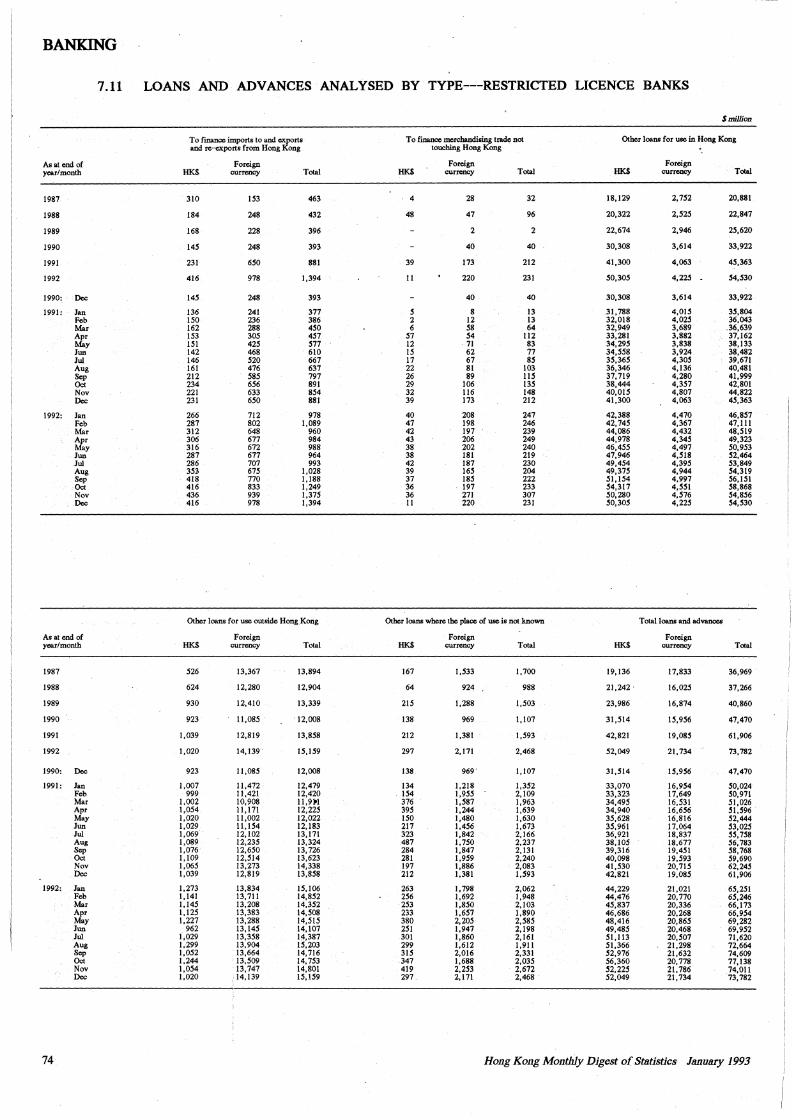
BANKING
7.11 LOANS AND ADVANCES ANALYSED BY TYPE---RESTRICTED LICENCE BANKS
$million
To finance imports to and exports To finance merchandising trade not Other loans for use in Hong Kong and re-exports from Hong Kong touching Hong Kong
As at end of Foreign Foreign Foreign year/month HK$ currency Total HK$ currency Total HK$ currency Total
1987 310 153 463 4 28 32 18,129 2,752 20,881
1988 184 248 432 48 47 96 20,322 2,525 22,847
1989 168 228 396 2 2 22,674 2,946 25,620
1990 145 248 393 40 40 30,308 3,614 33,922
1991 231 650 881 39 173 212 41,300 4,063 45,363
1992 416 978 1,394 11 220 231 50,305 4,225 54,530
1990: Dec 145 248 393 40 40 30,308 3,614 33,922
1991: Jan 136 241 377 5 8 13 31,788 4,015 35,804 Feb 150 236 386 2 12 13 32,018 4,025 36,043 Mar 162 288 450 6 58 64 32,949 3,689 ,36,639 Apr 153 305 451 57 54 112 33,281 3,882 37,162 May 151 425 577 12 71 83 34,295 3,838 38,133 Jun 142 468 610 15 62 77 34,558 3,924 38,482 Jui 146 520 667 17 67 85 35,365 4,305 39,671 Aug 161 476 637 22 81 103 36,346 4,136 40,481 Sep 212 585 797 26 89 115 37,719 4,280 41,999 Oct 234 656 891 29 106 135 38,444 4,357 42,801 Nov 221 633 854 32 116 148 40,015 4,807 44,822 Dec 231 650 881 39 173 212 41,300 4,063 45,363
1992: Jan 266 712 978 40 208 247 42,388 4,470 46,857 Feb 287 802 l,089 47 198 246 42,745 4,367 47,111 Mar 312 648 960 42 197 239 44,086 4,432 48,519 Apr 306 677 984 43 206 249 44,978 4,345 49,323 May 316 672 988 38 202 240 46,455 4,497 50,953 Jun 287 677 964 38 181 219 47,946 4,518 52,464 Jui 286 707 993 42 187 230 49,454 4,395 53,849 Aug 353 675 1,028 39 165 204 49,375 4,944 54,319 Sep 418 770 1.188 37 185 222 51,154 4,997 56,151 Oct 416 833 1,249 36 197 233 54,317 4,551 58,868 Nov 436 939 1,375 36 271 307 50,280 4,576 54,856 Dec 416 978 1,394 11 220 231 50,305 4,225 54,530
Other loans for use outside Hong Kong Other loans where the place of use is not known Total loans and advances
As at end of Foreign Foreign Foreign year/month HK$ currency Total HK$ currency Total HK$ currency Total
1987 526 13,367 13,894 167 1,533 1,700 19,136 17,833 36,969
1988 624 12,280 12,904 64 924 988 21,242' 16,025 37,266
1989 930 12,410 13,339 215 1,288 1,503 23,986 16,874 40,860
1990 923 11,085 12,008 138 969 1,107 31,514 15,956 47,470
1991 1,039 12,819 13,858 212 1,381 1,593 42,821 19,085 61,906
1992 1,020 14,139 15,159 297 2,171 2,468 52,049 21,734 73,782
1990: Dec 923 11,085 12,008 138 969' 1,107 31,514 15,956 47,470
1991: Jan 1,007 11,472 12,479 134 1,218 1,352 33,070 16,954 50,024 Feb 999 11,421 12,420 154 1,955 2,109 33,323 17,649 50,971 Mar 1,002 10,908 11,91.t! 376 1,587 1,963 34,495 16,531 51,026 Apr 1,054 11,171 12,225 395 1,244 1,639 34,940 16,656 51,596 May 1,020 11,002 12,022 150 1,480 1,630 35,628 16,816 52,444 Jun 1,029 11,154 12,183 217 1,456 1,673 35,961 17,064 53,025 Jui 1,069 12,102 13,171 323 1,842 2,166 36,921 18,837 55,758 Aug 1,089 12,235 13,324 487 I, 750 2,237 38,105 18,677 56,783 Sep 1,076 12,650 13,726 284 1,847 2,131 39,316 19,451 58,768 Oct 1,109 12,514 13,623 281 l,959 2,240 40,098 19,593 59,690 Nov 1,065 13,273 14,338 197 l,886 2,083 41,530 20,715 62,245 Dec 1,039 12,819 13,858 212 l,381 1,593 42,821 19,085 61,906
1992: Jan 1,273 13,834 15,106 263 1,798 2,062 44,229 21,021 65,251 Feb 1,141 13,711 14,852 256 1,692 1,948 44,476 20,770 65,246 Mar 1,145 13,208 14,352 253 1,850 2,103 45,837 20,336 66,173 Apr 1,125 13,383 14,508 233 1,657 1,890 46,686 20,268 66,954 May 1,227 13,288 14,515 380 2,205 2,585 48,416 20,865 69,282 Jun 962 13,145 14,107 251 1,947 2,198 49,485 20,468 69,952 Jui 1,029 13,358 14,387 301 1,860 2,161 51,113 20,507 71,620 Aug 1,,299 13,904 15,203 299 1,612 1,911 51,366 21,298 72,664 Sep 1,052 13,664 14,716 315 2,016 2,331 52,976 21,632 74,609 Oct 1,244 13,509 14,753 347 1,688 2,035 56,360 20, 778 77,138 Nov 1,054 13,747 14,801 419 2,253 2,672 52,225 21,786 74,011 Dec 1,020 14,139 15,!59 297 2,171 2,468 52,049 21,734 73,782
74 Ho11g Ko11g Monthly Digest of Statistics January 1993
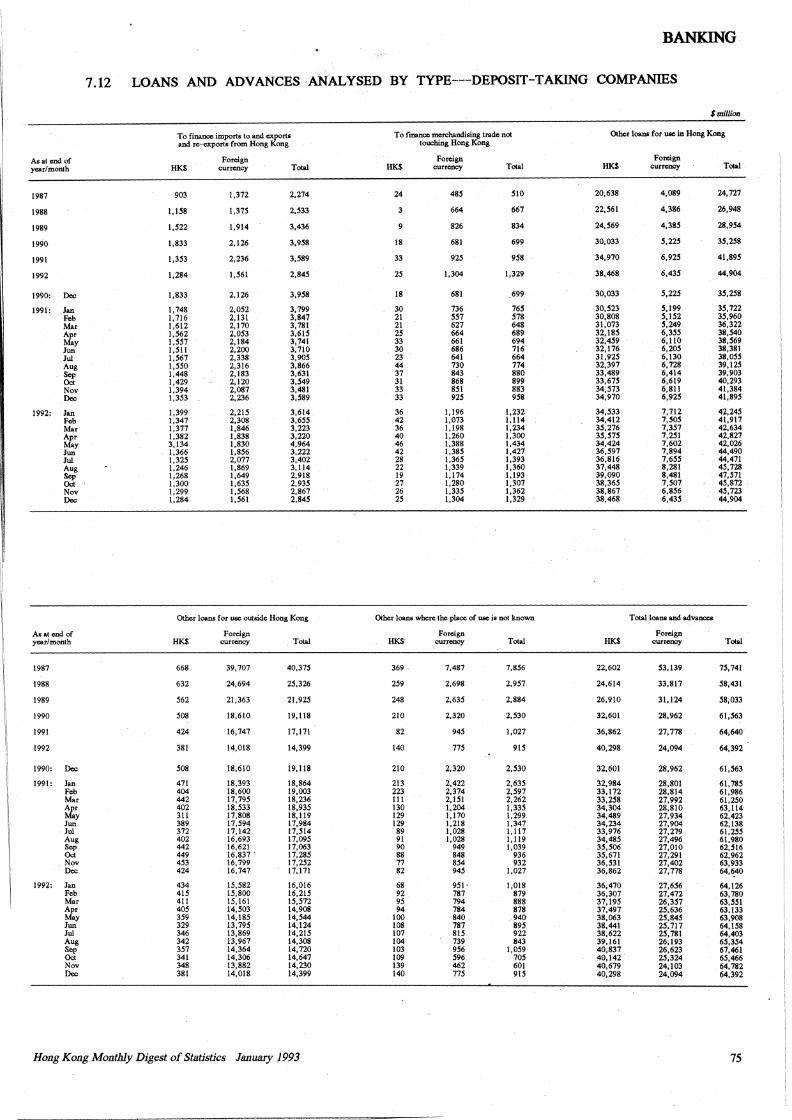
--------= ----- ______ , ___ . _________ -----
BANKING
1. 7.12 LOANS AND ADVANCES ANALYSED BY TYPE-~-DEPOSIT-TAKING COMPANIES I
$million
I· To finance imports to and exports To finance merchandising trade not Other loans for use in Hong Kong 1· and re-exports from Hong Kong touching Hong Kong
As at end of Foreign Foreign HK$
Foreign year/month HK$ currency Total HK$ currency Total currency Total
1987 903 1,372 2,274 24 485 510 20,638 4,089 24,727
I 1988
I 1.158 l,375 2,533 3 664 667 22,561 4,386 26,948
1989 1,522 1,914 3,436 826 834 24,569 4,385 28,954
1990 1.833 2,126 3,958 18 681 699 30,033 5,225 35,258
1991 1,353 2,236 3,589 33 925 958 34,970 6,925 41,895 I
I 1992 1,284 1,561 2,845 25 1,304 1,329 38,468 6,435 44,904
I.
I 1990: Dec 1,833 2,126 3,958 18 681 .699 30,033 5,225 35,258
1991: Jan 1.748 2,052 3,799 30 736 165 30,523 5,199 35,722 I Feb 1,716 2,131 3,847 21 551 578 30,808 5,152 35,960
1' Mar 1.612 2,170 3,781 21 627 648 31,073 5,249 36,322 Apr 1,562 2,053 3,615 25 664 689 32,185 6,355 38,540
I May 1,557 2,184 3,741 33 661 694 32,459 6,110 38,569 I Jun 1,511 2,200 3,710 30 686 716 32,176 6,205 38,381
Jui 1,567 2,338 3,905 23 641 664 31,925 6,130 38,055 Aug 1,550 2,316 3,866 44 730 774 32,397 6,728 39,125 Sep 1,448 2,183 3,631 37 843 880 33,489 6,414 39,903 Oct 1,429 2.120 3,549 31 868 899 33,675 6,619 40,293
I' Nov 1,394 2,087 3,481 33 851 883 34,573 6,811 41,384 1· Dec 1,353 2,236 3,589 33 925 958 34,970 6,925 41,895
1992: Jan 1,399 2,215 3,614 36 1,196 1,232 34,533 7,712 42,245 I Feb 1,347 2,308 3,655 42 1,073 1.114 34,412 7,505 41,917
I: Mar 1.377 1,846 3,223 36 1,198 1.234 35,276 7,357 42,634 Apr 1,382 1,838 3,220 40 1,260 1.300 35,575 7,251 42,827
l,t May 3,134 1.830 4,964 46 1.388 1,434 34,424 7,602 42,026 1 • Jun 1,366 1,856 3,222 42 1.385 1,427 36,597 7,894 44,490
I; Jui 1.325 2,077 3,402 28 1,365 1,393 36,816 1,655 44,471 Aug 1,246 1,869 3,114 22 1,339 1.360 37,448 8,281 45,728 Sep 1,268 1,649 2,918 19 1,174 1,193 39,090 8,481 47,571 Oct 1,300 1,635 2,935 27 1,280 1,307 38,365 7,507 45,872 ' Nov 1.299 1,568 2,867 26 1,335 1,362 38,867 6,856 45,723 Dec 1,284 1,561 2,845 25 1,304 1,329 38,468 6,435 44,904
Other loans for use outside Hong Kong Other loans where the place of use is not known Total loans and advances
As at end of Foreign Foreign Foreign year/month HK$ curre'ncy Total HK$ currency Total HK$ currency Total
1987 668 39,707 40,375 369' 7,487 7,856 22,602 53,139 75,741
1988 632 24,694 25,326 259 2,698 2,957 24,614 33,817 58,431
1989 562 21.363 21.925 248 2,635 2,884 26,910 31,124 58,033
1990 508 18,610 19,118 210 2,320 2,530 32,601 28,962 61,563
1991 424 16,747 17.171 82 945 1,027 36,862 27,778 64,640
1992 381 14,018 14,399 140 775 915 40,298 24,094 64,392
1990: Dec 508 18,610 19,118 210 2,320 2,530 32,601 28,962 61,563
1991: Jan 471 18,393 18,864 213 2,422 2,635 32,984 28,801 61,785 Feb 404 18,600 19,003 223 2,374 2,597 33,172 28,814 61,986 Mar 442 17,795 18,236 111 2,151 2,262 33,258 27,992 61.250 Apr 402 18,533 18,935 130 1,204 1.335 34,304 28,810 63,114 May 311 17,808 18,119 129 1,170 l,299 34,489 27,934 62,423 Jun 389 17,594 17,984 129 1,218 1,347 34,234 27,904 62,138 Jui 372 17,142 17,514 89 1,028 1,117 33,976 27,279 61,255 Aug 402 16,693 17,095 91 1,028 1,119 34,485 27,496 61,980 Sep 442 16,621 17,063 90 949 1,039 35,506 27,010 62,516 Oct 449 16,837' 17,285 88 848 936 35,671 27,291 62,962 Nov 453 16,799 17,252 77 854 932 36,531 27,402 63,933 Dec 424 16,747 17.171 82 945 1,027 36,862 27,778 64.~40
1992: Jan 434 15,582 16,016 68 951. 1,018 36,470 27,656 64,126 Feb 415 15,800 16,215 92 787 879 36,307 27,472 63, 780 Mar 411 15,161 15,512 95 794 888 37,195 26,357 63,551 Apr 405 14,503 14,908 94 784 878 37,497 25,636 63,133 May 359 14,185 14,544 100 840 940 38,063 25,845 63,908 Jun 329 13,795 14,124 108 787 895 38,441 25,717 64,158 Jui 346 13,869 14,215 107 815 922 38;622 25,781 64,403 Aug 342 13,967 14,308 104 739 843 39,161 26,193 65,354 Sep 357 14,364 14,720 103 956 1.059 40,837 26,623 67,461 Oct 341 14,306 14,647 109 596 705 40,142 25,324 65,466 Nov 348 13,882 14,230 139 462 601 40,679 24.103 64,782 Dec 381 14,018 14,399 140 775 915 40,298 24,094 64,392
Ho11g Kong Monthly Digest of Statistics January .1993 75
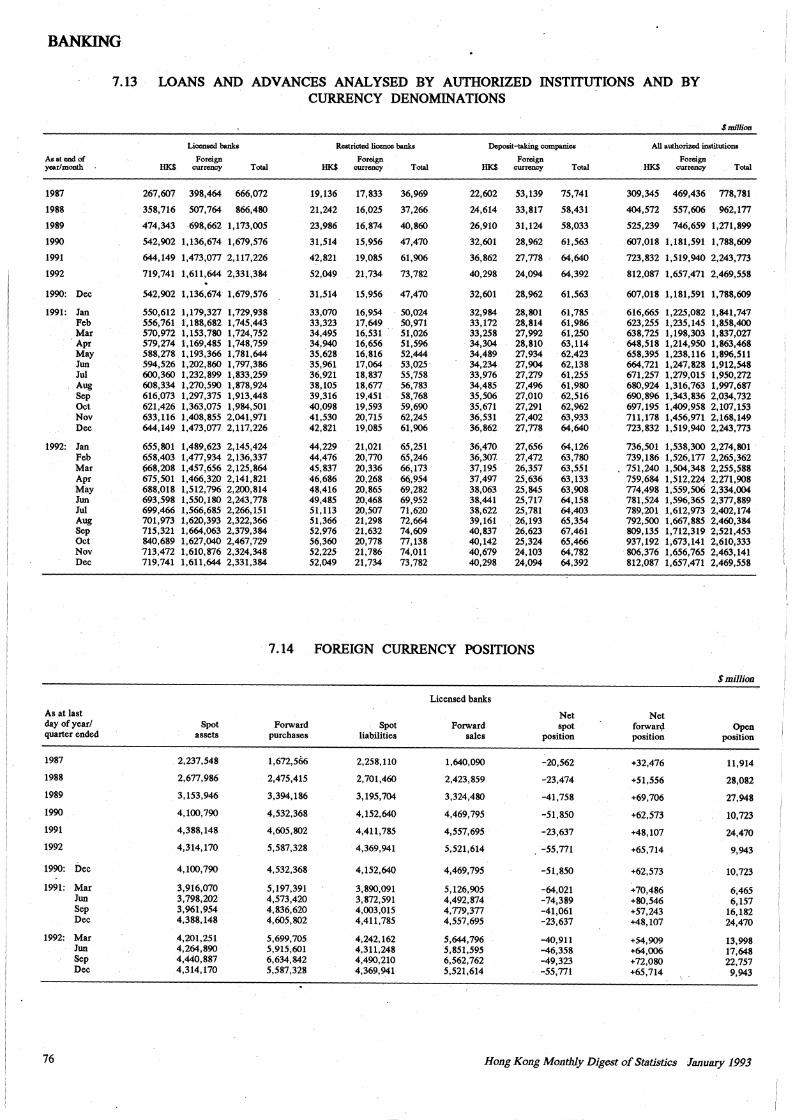
BANKING
7.13 LOANS AND ADVANCES ANALYSED BY AUTHORIZED INSTITUTIONS AND BY CURRENCY DENOMINATIONS
$million
Licensed banks Restricted liccnoe banks Deposit-taking companies All authorized institutions
As at ond of Foreign Foreign Foreign Foreign year/month HK$ CU?rency Total HK$ currency Total HK$ currency Total HK$ currency Total
1987 267,607 398,464 666,072 19, 136 17,833 36,969 22,602 53,139 75,741 309,345 469,436 778,781
1988 358,716 507,764 866,480 21,242 16,025 37,266 24,614 33,817 58,431 404,572 557,606 962,177
1989 474,343 698,662 1,173,005 23,986 16,874 40,860 26,910 31,124 58,033 525,239 746,659 1,271,899
1990 542,902 1,136,674 l,679,576 31,514 15,956 47,470 32,601 28,962 61,563 607,018 1,181,591 1,788,609
1991 644,149 1,473,077 2,117,226 42,821 19,085 61,906 36,862 27,778 64,640 723,832 1,519,940 2,243,773
1992 719,741 1,611,644 2,331,384 52,049 21,734 73,782 40,298 24,094 64,392 812,087 1,657,471 2,469,558
1990: Dec 542,902 1,136,674 l,679,576 31,514 15,956 47,470 32,601 28,962 61,563 607,018 1,181,591 1,788,609
1991: Jan 550,612 1,179,327 1,729,938 33,070 16,954 50,024 32,984 28,801 61,785 616,665 1,225,082 1,841,747 Feb 556,761 1,188,682 l,745,443 33,323 17,649 50,971 33,172 28,814 61,986 623,255 1,235,145 1,858,400 Mar 570,972 1,153,780 1,724,752 34,495 16,531 51,026 33,258 27,992 61,250 638,725 1,198,303 1,837,027 Apr 579,274 1,169,485 1,748,759 34,940 16,656 51,596 34,304 28,810 63,114 648,518 1,214,950 1,863,468 May 588,278 1,193,366 l,781,644 35,628 16,816 52,444 34,489 27,934 62,423 658,395 1,238,116 1,896,511 Jun 594,526 1,202,860 l,797,386 35,961 17,064 53,025 34,234 27,904 62,138 664,721 1,247,828 1,912,548 Jui 600,360 1,232,899 1,833,259 36,921 18,837 55,758 33,976 27,279 61,255 671,257 1,279,015 1,950,272 Aug 608,334 1,270,590 1,878,924 38,105 18,677 56,783 34,485 27,496 61,980 680,924 1,316,763 1,997,687 Sep 616,073 1,297,375 1,913,448 39,316 19,451 58,768 35,506 27,010 62,516 690,896 1,343,836 2,034, 732 Oct 621,426 1,363,075 1,984,501 40,098 19,593 59,690 35,671 27,291 62,962 697,195 1,409,958 2,107,153 Nov 633,116 1,408,855 2,041,971 41,530 20,715 62,245 36,531 27,402 63,933 711,178 1,456,971 2,168,149 Dec 644,149 1,473,077 2,117,226 42,821 19,085 61,906 36,862 27,778 64,640 723,832 1,519,940 2,243,773
1992: Jan 655,801 1,489,623 2,145,424 44,229 21,021 65,251 36,470 27,656 64,126 736,501 1,538,300 2,274,801 Feb 658,403 1,477,934 2,136,337 44,476 20,770 65,246 36,307 27,472 63,780 739,186 1,526,177 2,265,362 Mar 668,208 1,457,656 2,125,864 45,837 20,336 66,173 37,195 26,357 63,551 751,240 1,504,348 2,255,588 Apr 675,501 1,466,320 2,141,821 46,686 20,268 66,954 37,497 25,636 63,133 759,684 1,512,224 2,271,908 May 688,018 1,512,796 2,200,814 48,416 20,865 69,282 38,063 25,845 63,908 774,498 1,559,506 2,334,004 Jun 693,598 1,550,180 2,243,778 49,485 20,468 69,952 38,441 25,717 64,158 781,524 1,596,365 2,377,889 Jui 699,466 1,566,685 2,266, 151 51,113 20,507 71,620 38,622 25,781 64,403 789,201 1,612,973 2,402,174 Aug 701,973 1,620,393 2,322,366 51,366 21,298 72,664 39,161 26,193 65,354 792,500 1,667,885 2,460,384 Sep 715,321 l ,664,063 2,379,384 52,976 21,632 74,609 40,837 26,623 67,461 809,135 1,712,319 2,521,453 Oct 840,689 1,627,040 2,467,729 56,360 20,778 77,138 40,142 25,324 65,466 937,192 1,673,141 2,610,333 Nov 713,472 1,610,876 2,324,348 52,225 21,786 74,011 40,679 24,103 64,782 806,376 1,656,765 2,463,141 Dec 719,741 1,611,644 2,331,384 52,049 21,734 73,782 40,298 24,094 64,392 812,087 1,657,471 2,469,558
7.14 FOREIGN CURRENCY POSITIONS
$million
Licensed banks
As at last Net Net day of year/ Spot Forward Spot Forward spot forwar\f Open quarter ended assets purchases liabilities sales position position position
1987 2,237,548 1,672,566 2,258,110 1,640,090 -20,562 +32,476 11,914
1988 2,677,986 2,475,415 2,701,460 2,423,859 -23,474 +51,556 28,082
1989 3,153,946 3,394,186 3,195,704 3,324,480 -41,758 +69,706 27,948
1990 4,100,790 4,532,368 4,152,640 4,469,795 -51,850 +62,573 10,723
1991 4,388,148 4,605,802 4,411,785 4,557,695 -23,637 +48,107 24,470
1992 4,314,170 5,587,328 4,369,941 5,521,614 ' -55,771 +65,714 9,943
1990: Dec 4,100,790 4,532,368 4,152,640 4,469,795 -51,850 +62,573 10,723
1991: Mar 3,916,070 5,197,391 3,890,091 5,126,905 -64,021 +70,486 6,465 Jun 3,798,202 4,573,420 3,872,591 4,492,874 -74,389 +80,546 6,157 Sep 3,961,954 4,836,620 4,003,015 4,779,377 -41,061 +57,243 16,182 Dec 4,388,148 4,605,802 4,411,785 4,557,695 :-23,637 +48,107 24,470
1992: Mar 4,201,251 5,699,705 4,242,162 5,644,796 -40,911 +54,909 13,998 Jun 4,264,890 5,915,601 4,311,248 5;851,595 -46,358 +64,006 17,648 Sep 4,440,887 6,634,842 4,490,210 6,562,762 -49,323 +72,080 22,757 Dec 4,314,170 5,587,328 4,369,941 5,521,614 -55,771 +65,714 9,943
76 Hong Kong Monthly Digest of Statistics January 1993
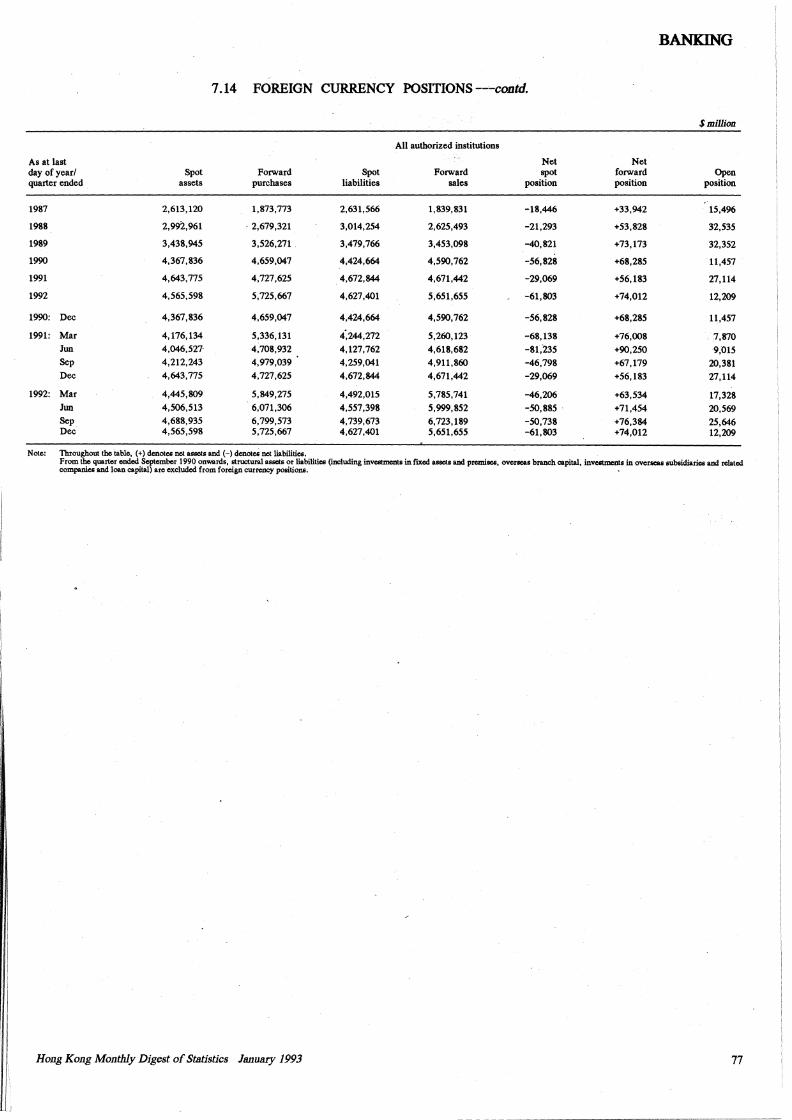
I
I
JtIL
BANKING
7.14 FOREIGN CURRENCY POSITIONS -~-contd.
$million
All authorized institutions
As at last Net Net day of year/ Spot Forward Spot Forward spot forward Open quarter ended assets purchases liabilities sales position position position
1987 2,613,120 1,873,773 2,631,566 1,839,831 -18,446 +33,942 15,496
1938 2,992,961 . 2,679,321 3,014,254 2,625,493 -21,293 +53,828 32,535
1989 3,438,945 3,526,271 3,479,766 3,453,098 -40,821 +73,173 32,352
1990 4,367,836 4,659,047 4,424,664 4,590,762 -56,828 +68,285 11,457
1991 4,643,775 4,727,625 4,672,844 4,671,442 -29,069 +56,183 27,114
1992 4,565,598 5,725,667 4,627,401 5,651,655 -61,803 +74,012 12,209
1990: Dec 4,367,836 4,659,047 4,424,664 4,590,762 -56,828 +68,285 11,457
1991: Mar 4,176,134 5,336,131 4:244,272 5,260,123 -68,138 +76,008 7,870 Jun 4,046,527· 4,708,932 4,127,762 4,618,682 -81,235 +90,250 9,015 Sep 4,212,243 4,979,039 4,259,041 4,911,860 -46,798 +67,179 20,381 Dec 4,643,775 4,727,625 4,672,844 4,671,442 -29,069 +56,183 27,114
1992: Mar 4,445,809 5,849,275 4,492,015 5,785,741 -46,206 +63,534 17,328 Jun 4,506,513 6,071,306 4,557,398 5,999,852 -50,885 . +71,454 20,569 Sep 4,688,935 6,799,573 4,739,673 6,723,189 -50,738 +76,384 25,646 Dec 4,565,598 5,725,667 4,627,401 5,651,655 -61,803 +74,012 12,209
Note: Throughout the table, (+)denotes net assets and(-) denotes net liabilities. From the quarter ended September 1990 onwards, structural assets or liabilities (including investments in fixed assets and premises, overseas branch capital, investments in overseas subsidiaries and related companies and loan capital) are excluded from foreign currency positions.
Hong Kong Monthly Digest of Statistics J8Jluary 1993 77
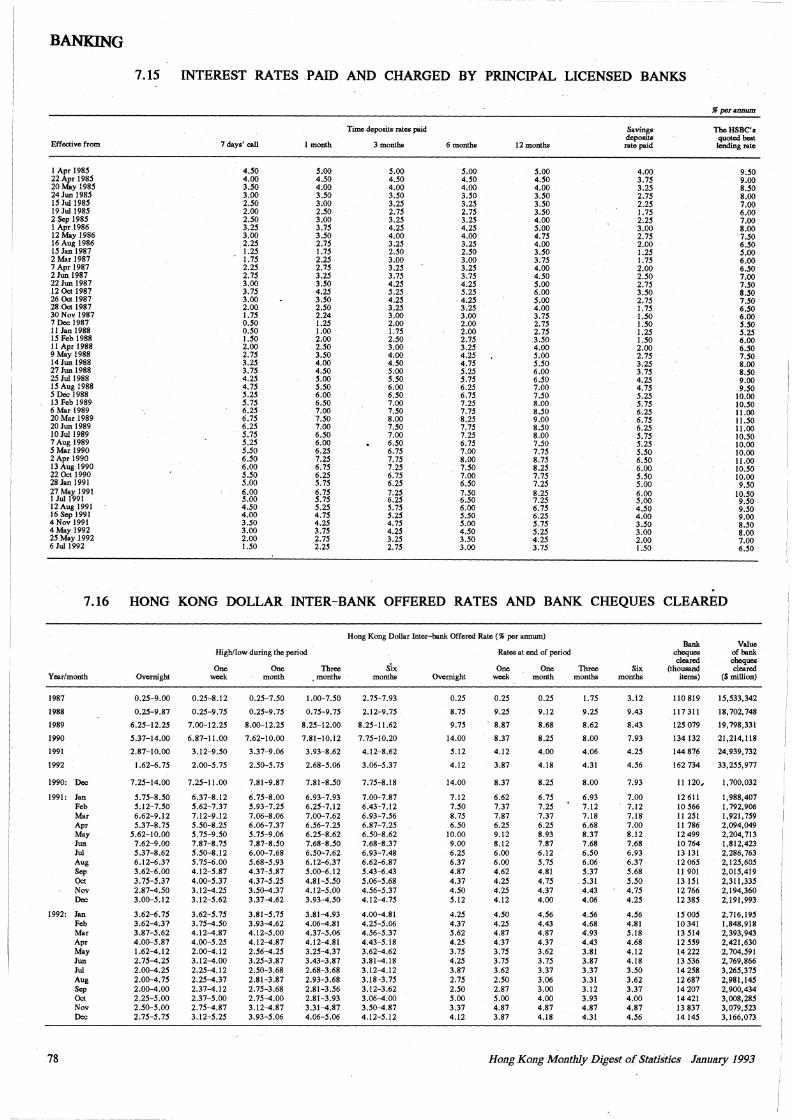
BANKING
7.15 INTEREST RATES PAID AND CHARGED BY PRINCIPAL LICENSED BANKS
% per annum
Time deposits rates paid Savings ThcHSBC's
Effective from 7 days' call !month 3 months deposits quoted best
6 months 12months rate paid lending rate
I Apr 1985 4.50 5.00 5.00 5.00 5.00 4.00 9.50 22Apr 1985 4.00 4.50 4.50 4.50 4.50 3.75 9.00 20 May 1985 3.50 4.00 4.00 4.00 4.00 3.25 8.50 24 Jun 1985 3.00 3.50 3.50 3.50 3.50 2.75 8.00 15 Jui 1985 2.50 3.00 3.25 3.25 3.50 2.25 7.00 19Jui1985 2.00 2.50 2.75 2.75 3..50 1.75 6.00 2 Sep 1985 2.50 3.00 3.25 . 3.25 4.00 2.25 7.00 I Apr 1986 3.25 3.75 4.25 4.25 5.00 3.00 8.00 12 May 1986 3.00 3.50 4.00 4.00 4.75 2.75 ·1.50 16 Aug 1986 2.25 2.75 3.25 3.25 4.00 2.00 6.50 15 Jan 1987 1.25 1.75 2.50 2.50 3.50 1.25 5.00 2Marl987 1.75 2.25 3.00 3.00 3.75 1.75 6.00 7 Apr 1987 2.25 2.75 3.25 3.25 4.00 2.00 6.50 2 Jun 1987 2.75 3.25 3.75 3.75 4.50 2.50 7.00 22 Jun 1987 3.00 3.50 4.25 4.25 5.00 2.75 7.50 12 Oct 1987 3.75 4.25 5.25 5.25 6.00 3.50 8.50 26 Oct 1987 3.00 3.50 4.25 4.25 5.00 2.75 7.50 28Oct1987 2.00 2.50 3.25 3.25 4.00 1.75 6.50 30 Nov 1987 1.75 2.24 3.00 3.00 3.75 1.50 6.00 7 Dec 1987 0.50 1.25 2.00 2.00 2.75 1.50 5.50 11Jan1988 0.50 1.00 1.75 2.00 2.75 1.25 5.25 15 Feb 1988 1.50 2.00 2.50 2.75 3.50 1.50 6.00 11Apr1988 2.00 2.50 3.00 3.25 4.00 2.00 6.50 9 May 1988 2.75 3.50 4.00 4.25 5.00 2.75 7.50 14 Jun 1988 3.25 4.00 4.50 4.75 5.50 3.25 8.00 27 Jun 1988 3.75 4.50 5.00 5.25 6.00 3.75 8.50 25 Jui 1988 4.25 5.00 5.50 5.75 6.50 4.25 9.00 15 Aug 1988 4.75 5.50 6.00 6.25 7.00 4.75 9.50 5Dec1988 5.25 6.00 6.50 6.75 7.50 5.25 10.00 13 Feb 1989 5.75 6.50 7.00 7.25 8.00 5.75 10.50 6 Mar 1989 6.25 7.00 7.50 7.75 8.50 6.25 11.00 20Mar 1989 6.75 7.50 8.00 8.25 9.00 6.75 11.50 20 Jun 1989 6.25 7.00 7.50 7.75 8.50 6.25 11.00 10 Jui 1989 5.75 6.50 7.00 7.25 8.00 5.75 10.50 7 Aug 1989 5.25 6.00 6.50 6.75 7.50 5.25 10.00 5 Mar 1990 5.50 6.25 6.75 7.00 7.75 5.50 10.00 2Apr 1990 6.50 7.25 7.75 8.00 8.75 6.50 11.00 13 Aug 1990 6.00 6.75 7.25 7.50 8.25 6.00 10.50 22 Oct 1990 5.50 6.25 6.75 7.00 7.75 5.50 10.00 28 Jan 1991 5.00 5.75 6.25 6.50 7.25 5.00 9.50 27 May 1991 6.00 6.75 7.25 7.50 8.25 6.00 10.50 I Jui 1991 5.00 5.75 6.25 6.50 7.25 5.00 9.50 12 Aug 1991 4.50 5.25 5.75 6.00 6.75 4.50 9.50 16Sepl991 4.00 4.15 5.25 5.50 6.25 4.00 9.00 4 Nov 1991 3.50 4.25 4.75 5.00 5.15 3.50 8.50 4 May 1992 3.00 3.75 4.25 4.50 5.25 3.00 8.00 25 May 1992 2.00 2.75 3.25 3.50 4.25 2.00 7.00 6 Jui 1992 1.50 2.25 2.75 3.00 3.75 1.50 6.50
7.16 HONG KONG DOLLAR INTER-BANK OFFERED RATES AND BANK CHEQUES CLEARED
Hong Kong Dollar Inter-bank Offered Rate ( % per annum) Bank Value
High/low during the period Rates at end of period cheques of bank
six cleared cheques One One Three One One Three Six (thousand cleared
Year/month .Overnight week month months months Overnight week month months months items) ($million)
1987 0.25-9.00 0.25-8.12 0.25-7.50 1.00-7.50 2.75-7.93 0.25 0.25 0.25 1.75 3.12 110 819 15,533,342
1988 0.25-9.87 0.25-9.15 0.25-9.75 0.75-9.75 2.12-9.75 8.75 9.25 9.12 9.25 9.43 117 311 18,702,748
1989 6.25-12.25 7.00-12.25 8.00-12.25 8.25-12.00 8.25-11.62 9.75 . 8.87 8.68 8.62 8.43 125 079 19,798,331
1990 5.37-14.00 6.87-11.00 7.62-10.00 7.81-10.12 7.75-10.20 14.00 8.37 8.25 8.00 7.93 134132 21,214,118
1991 2.87-10.00 3.12-9.50 3.37-9.06 3.93-8.62 4.12-8.62 5.12 4.12 4.00 4.06 4.25 144 87~ 24,939,732
1992 1.62-6. 75 2.00-5.75 2.50-5.75 2.68-5.06 3.06-5.37 4.12 3.87 4.18 4.31 4.56 162 734 33,255,977
1990: Dec 7.25-14.00 7.25-11.00 7.81-9.87 7.81-8.50 7.75-8.18 14.00 8.37 8.25 8.00 7.93 11120, l,700,032
1991: Jan 5.75-8.50 6.37-8.12 6.75-8.00 6.93-7.93 7.00-7.87 7.12 6.62 6.75 6.93 7.00 12611 1,988,407 Feb 5.12-7.50 5.62-7.37 5.93-7.25 6.25-7.12 6.43-7.12 7.50 7.37 7.25 7.12 7.12 10 566 I, 792,906 Mar 6.62-9.12 7.12-9.12 7.06-8.06 7.00-7.62 6.93-7.56 8.75 7.87 7.37 7.18 7.18 11 251 J,921, 759 Apr 5.37-8.75 5.50-8.25 6.06-7.37 6.56-7.25 6.87-7.25 6.50 6.25 6.25 6.68 7.00 11 786 2,094,049 May 5.62-10.00 5.15-9.50 5.75-9.06 6.25-8.62 6.50-8.62 10.00 9.12 8.93 8.37 8.12 12 499 2,204,713 Jun 7.62-9.00 7.87-8.75 7.87-8.50 7.68-8.50 7.68-8.37 9.00 8.12 7.87 7.68 7.68 10 764 l,812,423 Jui 5.37-8.62 5.50-8.12 6.00-7.68 6.50-7.62 6.93-7.48 6.25 6.00 6.12 6.50 6.93 13 131 2,286, 763 Aug 6.12-6.37 5.75-6.00 5.68-5.93 6.12-6.37 6.62-6.87 6.37 6.00 5.75 6.06 6.37 12 065 2,125,605 Sep 3.62-6.00 4.12-5.87 4.37-5.87 5.00-6.12 5.43-6.43 4.87 4.62 4.81 5.37 5.68 11 901 2,015,419 Oct 3.75-5.37 4.00-5.37 4.37-5.25 4.81-5.50 5.06-5.68 4.37 4.25 4.75 5.31 5.50 13 151 2,311,335 Nov 2.87-4.50 3.12-4.25 3.50-4.37 4.12-5.00 4.56-5.37 4.50 4.25 4.37 4.43 4.75 12 766 2,194,360 Dec 3.00-5.12 3.12-5.62 3.37-4.62 3.93-4.50 4.12-4.75 5.12 4.12 4.00 4.06 4.25 12 385 2,191,993
1992: Jan 3.62-6.75 3.62-5.75 3.81-5.75 3.81-4.93 4.00-4.81 4.25 4.50 4.56 4.56 4.56 15005 2,716,195 Feb 3.62-4.31 3.75-4.50 3.93-4.62 4.06-4.81 4.25-5.06 4.37 4.25 4.43 4.68 4.81 10 341 1,848,918 Mar 3.87-5.62 4.12-4.87 4.12-5.00 4.37-5.06 4.56-5.37 5.62 4.87 4.87 4'.93 5.18 13514 2,393,943 Apr 4.00-5.87 4.00-5.25 4.12-4.87 4.12-4.81 4.43-5.18 4.25 4.37 4.37 4.43 4.68 12 559 2,421,630 May 1.62-4.12 2.00-4.12 2.56-4.25 3.25-4.37 3.62-4.62 3.75 3.75 3.62 3.81 4.12 14 222 2, 704,591 Jun 2.75-4.25 3.12-4.00 3.25-3.87 3.43-3.87 3.81-4.18 4.25 3.75 3.75 3.87 4.18 13 536 2, 769,866 Jui 2.00-4.25 2.25-4.12 2.50-3.68 2.68-3.68 3.12-4.12 3.87 3.62 3.37 3.37 3.50 14258 3,265,375 Aug 2.00-4.75 2.25-4.37 2.81-3.87 2.93-3.68 3.18-3.75 2.75 2.50 3.06 3.31 3.62 12 687 2,981,145 Sep 2.00-4.00 2.37-4.12 2.75-3.68 2.81-3.56 3.12-3.62 2.50 2.87 3.00 3.12 3.37 14207 2,900,434 Oct 2.25-5.00 2.37-5.00 2.75-4.00 2.81-3.93 3.06-4.00 5.00 5.00 4.00 3.93 4.00 14 421 3,008,285 Nov 2.50-5.00 2.75-4.87 3.12-4.87 3.31-4.87 3.50-4.87 3.37 4.87 4.87 4.87 4.87 13 837 3,079,523 Dec 2.75-5.75 3.12-5.25 3.93-5.06 4.06-5.06 4.12-5.12 4.12 3.87 4.18 4.31 4.56 14145 3,166,073
78 Hong Kong Monthly Digest of Statistics January 1993
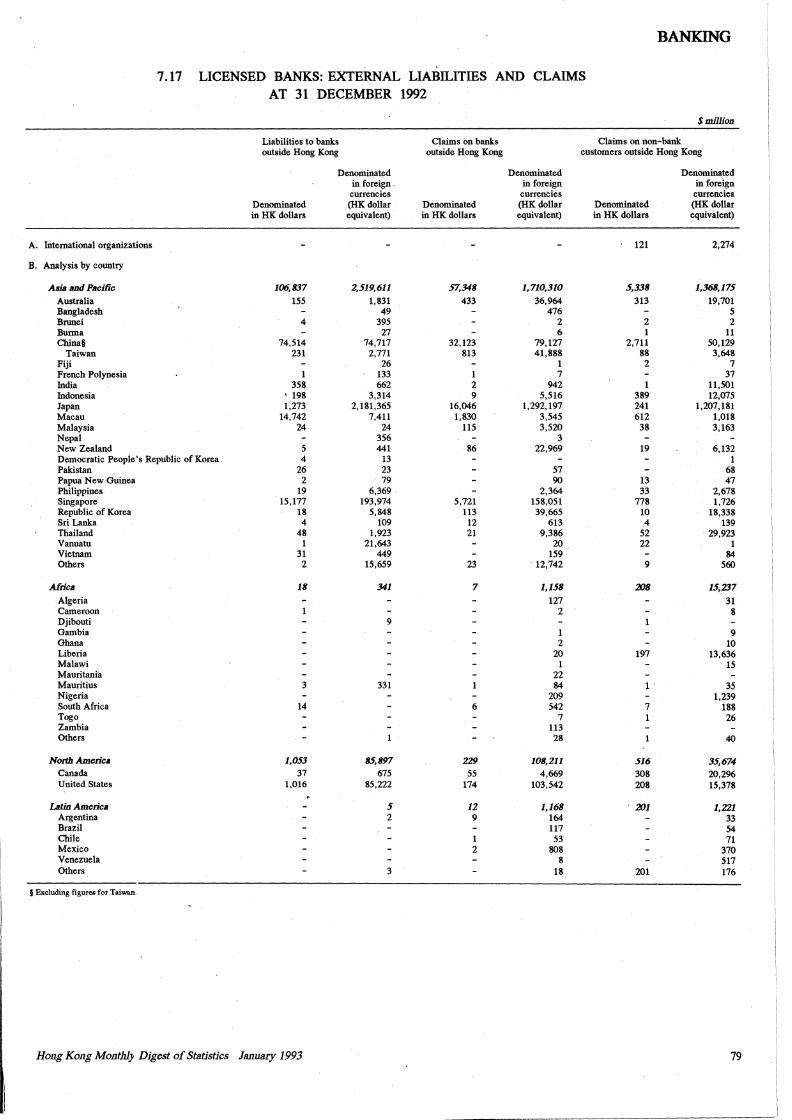
Jm__
BANKING
I
I
Hong Ko11g Mouthl) Digest of St.atistics January 1993 79
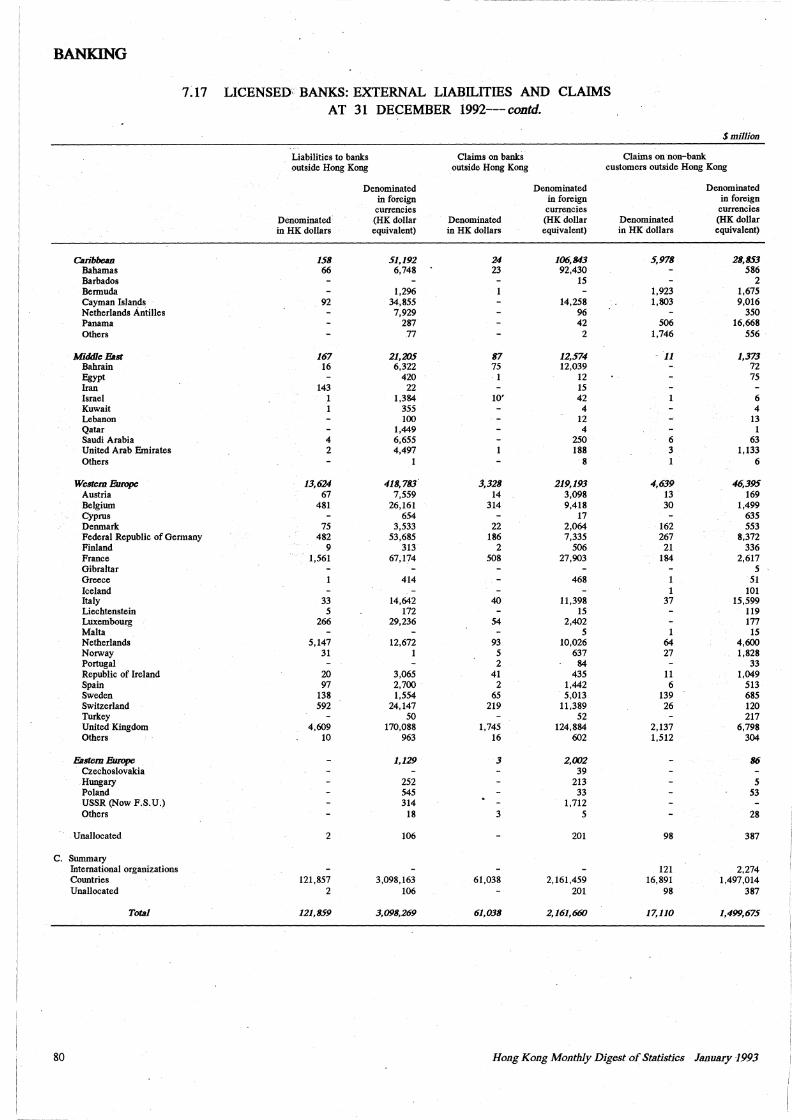
BANKING
1:11 LICENSED BANKS: EXTERNAL LIABILITIES AND CLAIMS AT 31 DECEMBER 1992--- contd.
$million
Liabilities to banks Claims on banks Claims on non-bank outside Hong Kong outside Hong Kong customers outside Hong Kong
Denominated Denominated Denominated in foreign in foreign in foreign
currencies currencies currencies Denominated (HK dollar Denominated (HK dollar Denominated (HK dollar in HK dollars equivalent) in HK dollars equivalent) in HK dollars equivalent)
Caribbean 158 51,192 24 106,843 5,978 28,853 Bahamas 66 6,748 23 92,430 586 Barbados 15 2 Bermuda 1,296 1,923 1,675 Cayman Islands 92 34,855 14,258 1,803 9,016 Netherlands Antilles 7,929 96 350 Panama 287 42 506 16,668 Others 77 2 1,746 556
Middle East 167 21,205 B7 12,574 11 1,373 Bahrain 16 6,322 75 12,039 72 Egypt 420 1 12 75 Iran 143 22 15 Israel 1 1,384 10' 42 6 Kuwait 1 355 4 4 Lebanon 100 12 13 Qatar 1,449 4 1 Saudi Arabia 4 6,655 250 6 63 United Arab Emirates 2 4,497 188 3 1,133 Others 1 8 1 6
Western F.uropc 13,624 418,783 3,328 219,193 4,639 46,395 Austria 67 7,559 14 3,098 13 169 Belgium 481 26,161 314 9,418 30 1,499 Cyprus 654 17 635 Denmark 75 3,533 22 2,064 162 553 Federal Republic of Germany 482 53,685 186 7,335 267 8,372 Finland 9 313 2 506 21 336 France 1,561 67,174 508 27,903 184 2,617 Gibraltar 5 Greece 414 468 1 51 Iceland 1 101 Italy 33 14,642 40 11,398 37 15,599 Liechtenstein 5 172 15 119 Luxembourg 266 29,236 54 2,402 177 Malta 5 1 15 N ether!ands 5,147 12,672 93 10,026 64 4,600 Norway 31 1 5 637 27 1,828 Portugal 2 84 33 Republic of Ireland 20 3,065 41 435 11 1,049 Spain 97 2,700 2 1,442 6 513 Sweden 138 1,554 65 5,013 139 685 Switzerland 592 24,147 219 11,389 26 120 Turkey 50 52 217 United Kingdom 4,609 170,088 1,745 124,884 2,137 6,798 Others 10 963 16 602 1,512 304
Eastern F.uropc 1,129 3 2,002 B6 Czechoslovakia 39 Hungary 252 213 5 Poland 545 33 53 USSR (Now F.S.U.) 314 1,712 Others 18 3 5 28
Unallocated 2 106 201 98 387
c. Summary International organizations 121 2,274 Countries 121,857 3,098,163 61,038 2,161,459 16,891 1,497,014 Unallocated 2 106 201 98 387
Total 121,859 3,098,269 61,038 2,161,660 17,110 1,499,675
80 Hong Kong Mo11thly Digest of Statistics Jruwary 1993
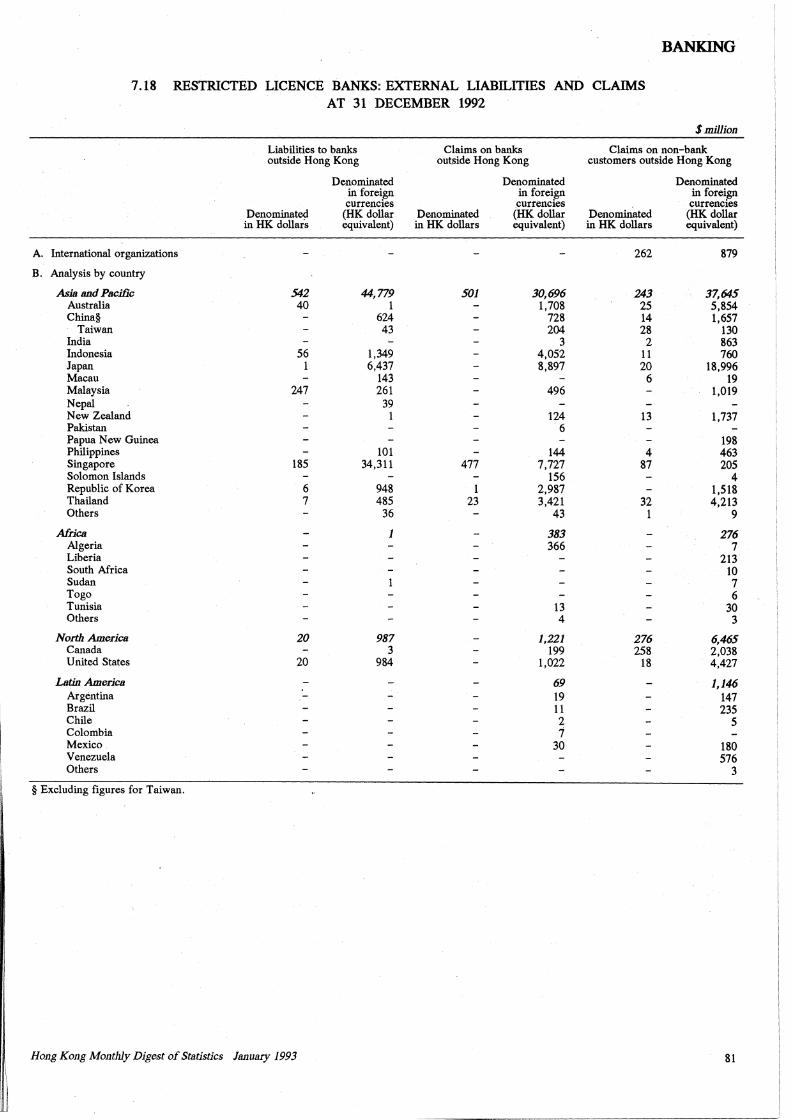
i I I I,
I
'. l
Jllj_ __
BANKING
7 .18 RESTRICTED LICENCE BANKS: EXTERNAL LIABILITIES AND CLAIMS AT 31 DECEMBER 1992
A. International organizations
B. Analysis by country
Asia and Pacific Australia China§
Taiwan India Indonesia Japan Macau Malaysia Nepal New Zealand Pakistan Papua New Guinea Philippines Singapore Solomon Islands Republic of Korea Thailand Others
Africa Algeria Liberia South Africa Sudan Togo Tunisia Others
North America Canada United States
Latin America Argentina Brazil Chile Colombia Mexico Venezuela Others
§ Excluding figures for Taiwan.
Liabilities to banks outside Hong Kong
Claims on banks
Denominated in HK dollar·s
542 40
56 l
247
185
6 7
20
20
outside Hong Kong
Denominated in foreign currencies
(HK dollar Denominated equivalent) in HK dollars
44,779 l
624 43
1,349 6.,437
143 261
39 1
101 34,311
948 485
36
1
987 3
984
501
477
1 23
Denominated in foreign
.currencies (HK dollar equivalent)
30,696 1,708
728 204
3 4,052 8,897
496
124 6
144 7,727
156 2,987 3,421
43
383 366
13 4
1,221 199
1,022
69 19 11 2 7
30
Ho11g Ko11g Mo11tl1ly Digest of Statistics Jwwary 1993
$mfilion
Claims on non-bank customers outside Hong Kong
Denomi.Ilated in HK dollars
262
243 25 14 28 2
11 20 6
13
4 87
32 1
276 258
18
Denominated in foreign currencies
(HK dollar equivalent)
879
37,645 5,854 1,657
130 863 760
18,996 19
1,019
1,737
198 463 205
4 1,518 4,213
9
276 7
213 10 7 6
30 3
6,465 2,038 4,427
1,146 147 235
5
180 576
3
81
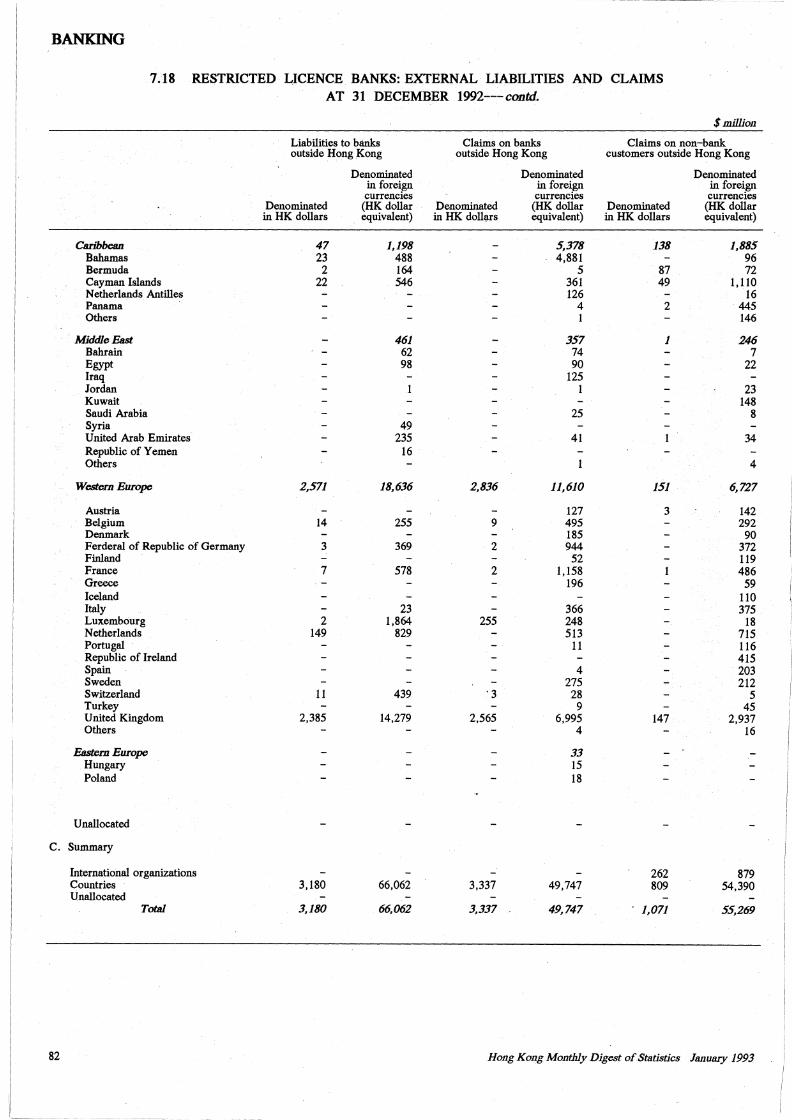
---------
BANKING
7.18 RESTRICTED LICENCE. BANKS: EXTERNAL LIABILITIES AND CLAIMS AT 31 DECEMBER 1992--- contd.
$million
Liabilities to blinks Claims on blinks Claims on non-bank outside Hong Kong outside Hong Kong customers outside Hong Kong
Denominated Denominated Denominated in foreign in foreign in foreiffel currencies currencies currencies
Denominated (HK dollar Denominated (HK dollar Denominated (HK dollar in HK dollars equivalent) in HK dolllµ's equivalent) in HK dollars equivalent)
Caribbean 47 1,198 5,378 138 1,885 Bahamas 23 488 4,881 96 Bermuda 2 164 5 87 72 Cayman Islands 22 546 361 49 1,110 Netherlands Antilles 126 16 Panama 4 2 445 Others 1 146
Middle East 461 357 1 246 Bahrain 62 74 7 Egypt 98 90 22 Iraq 125 Jordan 1 23 Kuwait 148 Saudi Arabia 25 8 Syria 49 United Arab Emirates 235 41 34 Republic of Yemen 16 Others 4
Western Europe 2,571 18,636 2,836 11,610 151 6,727
Austria 127 3 142 Belgium 14 255 9 495 292 Denmark 185 90 Ferderal of Republic of Germany 3 369 2 944 372 Finland 52 119 France 7 578 2 1,158 486 Greece 196 59 Iceland 110 Italy 23 366 375 Luxembourg 2 1,864 255 248 18 Netherlands 149 829 513 715 Portugal 11 116 Republic of Ireland 415 Spain 4 203 Sweden 275 212 Switzerland 11 439 ·3 28 5 Turkey 9 45 United Kingdom 2,385 14,279 2,565 6,995 147 2,937 Others 4 16
Eastem Europe 33 Hungary 15 Poland 18
Unallocated
c. Summary
International organizations 262 879 Countries 3,180 66,062 3,337 49,747 809 54,390 Unallocated
Tot.al 3,180 66,062 3,337 49,747 1,071 55,269
82 Hong Kong Monthly Digest ofStatistics January 1993
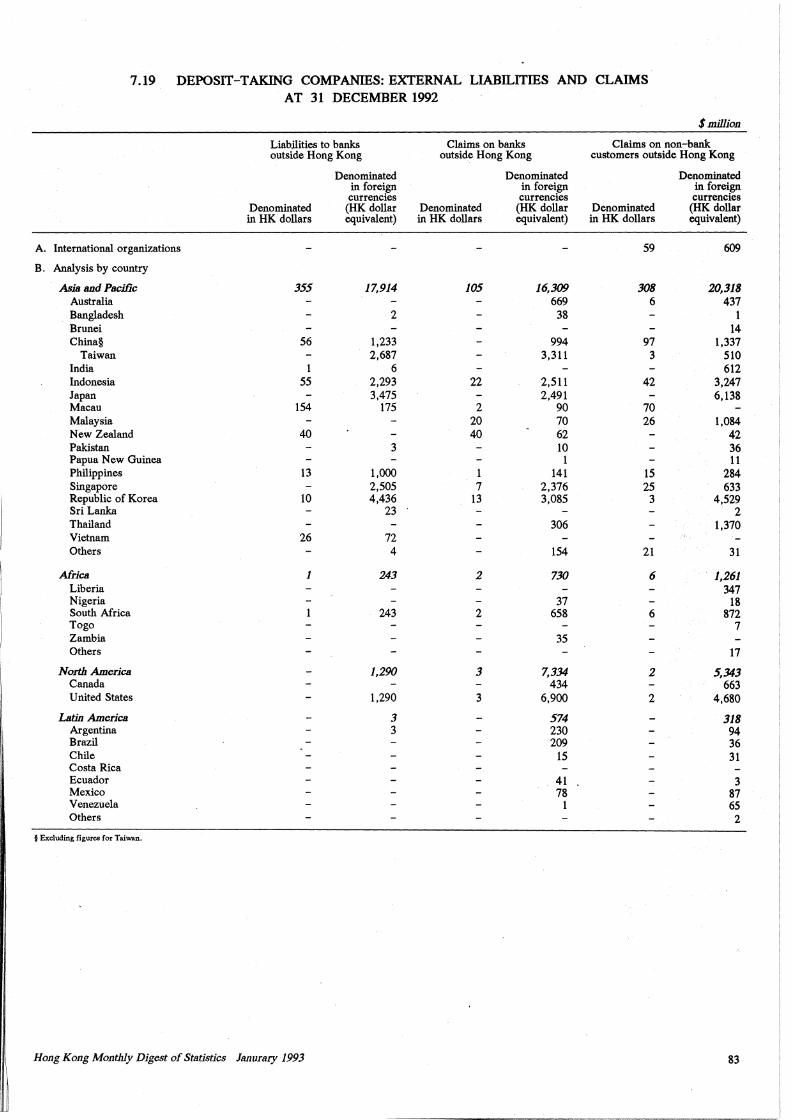
I
I
I
!
I
I
I'
Jlll.LL _______________ _
7.19 DEPOSIT-TAKING COMPANIES: EXTERNAL LIABILITIES AND CLAIMS
A. International organizations
B. Analysis by country
Asia and Pacific Australia Bangladesh Brunei China§
Taiwan India Indonesia Japan Macau Malaysia New Zealand Pakistan Papua New Guinea Philippines Singapore Republic of Korea Sri Lanka Thailand Vietnam Others
Africa Liberia Nigeria South Africa Togo Zambia Others
North America Canada United States
Latin America Argentina Brazil Chile Costa Rica Ecuador Mexico Venezuela Others
§ Excluding figures for Taiwan.
AT 31 DECEMBER 1992
Liabilities to banks outside Hong Kong
Denominated in foreign currencies
Claims on banks outside Hong Kong
Denominated in foreign
Denominated in HK dollars
(HK dollar Denominated currencies
(HK dollar equivalent)
355
56
1 55
154
40
13
10
26
1
equivalent) in HK dollars
17,914
2
1,233 2,687
6 2,293 3,475
175
3
1,000 2,505 4,436
23
72 4
243
243
1,290
1,290
3 3
105
22
2 20 40
1 7
13
2
2
3
3
16,309 669
38
994 3,311
2,511 2,491
90 70 62 10
1 141
2,376 3,085
306
154
730
37 658
35
7,334 434
6,900
574 230 209
15
41 78
1
Ho11g Kong Monthly Digest of Statistics Janurary 1993
$million
Claims on non-bank customers outside Hong Kong
Denominated in HK dollars
59
308 6
97 3
42
70 26
15 25 3
21
6
6
2
2
Denominated in foreign currencies
(HK dollar equivalent)
609
20,318 437
1 14
1,337 510 612
3,247 6,138
1,084 42 36 11
284 633
4,529 2
1,370
31
1,261 347
18 872
7
17
5,343 663
4,680
318 94 36 31
3 87 65 2
83
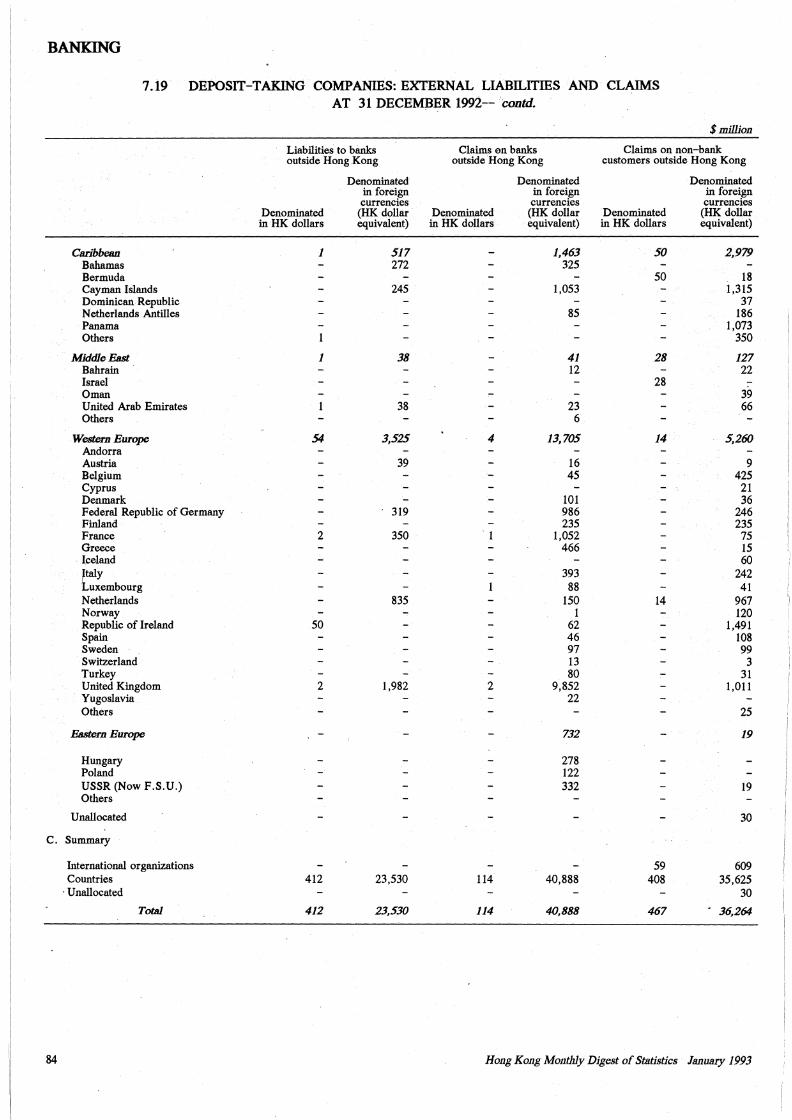
BANKING
7.19 DEPOSIT-TAKING COMPANIES: EXTERNAL LIABILITIES AND CLAIMS AT 31DECEMBER1992-- contd.
$million
Liabilities to banks Claims en banks Claims on non-bank outside Hong Kong outside Hong Kong customers outside Hong Kong
Denominated Denominated Denominated in foreign in forei$fi in forei.gn currencies currencies currencies
Denominated (HK dollar Denominated (HK dollar Denominated (HK dollar in HK dollars equivalent) in HK dollars equivalent) in HK dollars equivalent)
Caribbean 1 517 1,463 50 2,979 Bahamas 272 325 Bermuda 50 18 Cayman Islands 245 1,053 1,315 Dominican Republic 37 Netherlands Antilles 85 186 Panama 1,073 Others 350
Middle East 1 38 41 28 127 Balirain 12 22 Israel 28 -Oman 39 United Arab Emirates 38 23 66 Others 6
Western Europe 54 3,525 4 13,705 14 5,260 Andorra Austria 39 16 9 Belgium 45 425 Cyprus 21 Denmark 101 36 Federal Republic of Germany 319 986 246 Finland 235 235 France 2 350 . 1 1,052 75 Greece 466 15
·Iceland 60 1taly 393 242 Luxembourg 88 41 Netherlands 835 150 14 967 Norway 1 120 Republic of Ireland 50 62 1,491 Spain 46 108 Sweden 97 99 Switzerland 13 3 Turkey 80 31 United Kingdom 2 1,982 2 9,852 1,011 Yugoslavia 22 Others 25
Eastem Europe 732 19
Hungary 278 Poland 122 USSR (Now F.S.U.) 332 19 Others
Unallocated 30
c. Summary
International organizations 59 609 Countries 412 23,530 114 40,888 408 35,625
·Unallocated 30 Tot.al 412 23,530 114 40,888 467 , 36,264
84 Hong Kong Monthly Digest of Statistics January 1993
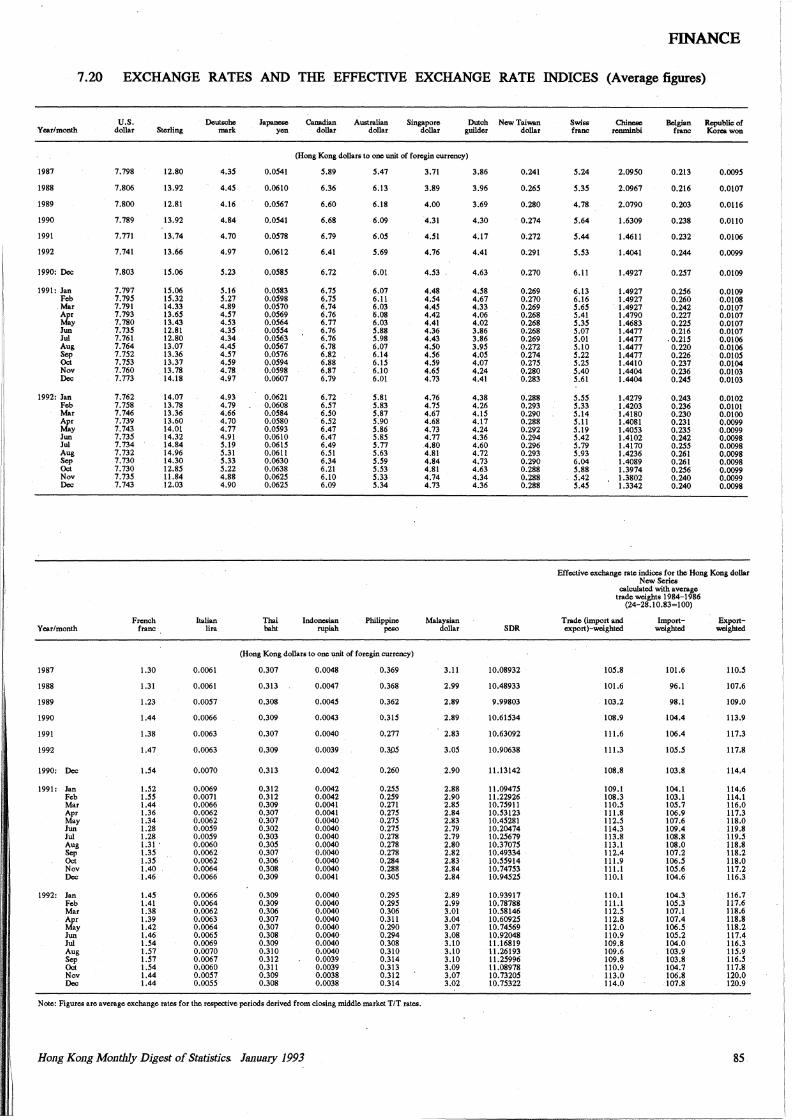
I
I
I
I:
FINANCE
7.20 EXCHANGE RATES AND THE EFFECTNE EXCHANGE RATE INDICES (Average figures)
Year/month U.S.
dollar Sterling Deutsche
mark Japanese
yen Canadian
dollar Australian
dollar Singapore
dollar Dutch New Taiwan
guilder dollar
(Hong Kong dollars to one unit of foregin curre..,y)
1987
1988
1989
1990
1991
1992
1990: Dec
1991: Jan Feb Mar Apr May Jun Ju! Aug Sep Oct Nov Dec
1992: Jan Feb Mar Apr May Jun Ju! Aug Sep Oct Nov Dec
Year/month
1987
1988
1989
1990
1991
1992
1990: Dec
1991: Jan Feb Mar Apr May Jun Ju! Aug Sep Oct Nov Dec
1992: Jan Feb Mar Apr May Jun Ju! Aug Sep Oct Nov Dec
7.798
7.806
7.800
7.789
7.771
7.741
7.803
7.797 7.795 7.791 7.793 7.780 7.735 7.761 7.764 7.752 7.753 7.760 7.773
7.762 7.758 7.746 7.739 7.743 7.735 7.734 7.732 7.730 7.730 7.735 7.743
F=h franc
1.30
1.31
1.23
1.44
1.38
1.47
1.54
1.52 I.SS 1.44 1.36 1.34 1.28 1.28 1.31 . 1.35 1.35 1.40 1.46
1.45 1.41 1.38 1.39 1.42 1.46 1.54 1.57 1.57 1.54 1.44 1.44
12.80
13.92
12.81
13.92
13.74
13.66
15.06
15.06 15.32 14.33 13.65 13.43 12.81 12.80 13.07 13.36 13.37 13.78 14.18
14.07 13.78 13.36 13.60 14.01 14.32 14.84 14.96 14.30 12.85 11.84 12.03
Italian lira
0.0061
0.0061
0.0057
0.0066
0.0063
0.0063
0.0070
0.0069 0.0071 0.0066 0.0062 0.0062 0.0059 0.0059 0.0060 0.0062 0.0062 0.0064 0.0066
0.0066 0.0064 0.0062 0.0063 0.0064 0.0065 0.0069 0.0070 0.0067 0.0060 0.0057 0.0055
4.35
4.45
4.16
4.84
4.70
4.97
5.23
5.16 5.27 4.89 4.57 4.53 4.35 4.34 4.45 4.57 4.59 4.78 4.97
4.93 4.79 4.66 4.70 4.77 4.91 5.19 5.31 5.33 5.22 4.88 4.90
0.0541
0.0610
0.0567
0.0541
0.0578
0.0612
0.0585
0.0583 0.0598 0.0570 0.0569 0.0564 0.0554 0.0563 0.0567 0.0576 0.0594 0.0598 0.0607
0.0621 0.0608 0.0584 0.0580 0.0593 0.0610 0.0615 0.0611 0.0630 0.0638 0.0625 0.0625
Thai bah!
5.89
6.36
6.60
6.68
6.79
6.41
6.72
6.75 6.75 6.74 6.76 6.77 6.76 6.76 6.78 6.82 6.88 6.87 6.79
6.72 6.57 6.50 6.52 6.47 6.47 6.49 6.51 6.34 6.21 6.10 6.09
Indonesian rupiah
5.47
6.13
6.18
6.09
6.05
5.69
6.01
6.07 6.11 6.03 6.08 6.03 5.88 5.98 6.07 6.14 6.15 6.10 6.01
5.81 5.83 5.87 5.90 5.86 5.85 5.77 5.63 5.59 5.53 5.33 5.34
Philippine peso
(Hong Kong dollars to one unit of foregin currency)
0.307
0.313
0.308
0.309
0.307
0.309
0.313
0.312 0.312 0.309 0.307 0.307 0.302 0.303 0.305 0.307 0.306 0.308 0.309
0.309 0.309 0.306 0.307 0.307 0.308 0.309 0.310 0.312 0.311 0.309 0.308
0.0048
0.0047
0.0045
0.0043
0.0040
0.0039
0.0042
0.0042 0.0042 0.0041 0.0041 0.0040 0.0040 0.0040 0.0040 0.0040 0.0040 0.0040 0.0041
0.0040 0.0040 0.0040 0.0040 0.0040 0.0040 0.0040 0.0040 0.0039 0.0039 0.0038 0.0038
0.369
0.368
0.362
0.315
0.277
0.3.05
0.260
0.255 0.259 0.271 0.275 0.275 0.275 0.278 0.278 0.278 0.284 0.288 0.305
0.295 0.295 0.306 0.311 0.290 0.294 0.308 0.310 0.314 0.313 0.312 0.314
Note: Figures are average exchange rates for the respective periods derived from closing middle market TIT rates.
Ho11g Kong Monthly Digest of Statistics January 1993
3.71
3.89
4.00
4.31
4.51
4.76
4.53
4.48 4.54 4.45 4.42 4.41 4.36 4.43 4.50 4.56 4.59 4.65 4.73
4.76 4.75 4.67 4.68 4.73 4.77 4.80 4.81 4.84 4.81 4.74 4.73
Malaysian dollar
3.11
2.99
2.89
2.89
2.83
3.05
2.90
2.88 2.90 2.85 2.84 2.83 2.79 2.79 2.80 2.82 2.83 2.84 2.84
2.89 2.99 3.01 3.04 3.07 3.08 3.10 3.10 3.10 3.09 3.07 3.02
3.86
3.96
3.69
4.30
4.17
4.41
4.63
4.58 4.67 4.33 4.06 4.02 3.86 3.86 3.95 4.05 4.07 4.24 4.41
4.38 4.26 4.15 4.17 4.24 4.36 4.60 4.72 4.73 4.63 4.34 4.36
SDR
10.08932
10.48933
9.99803
10.61534
10.63092
10.90638
11.13142
11.09475 11.22926 10.75911 10.53123 10.45281 10.20474 10.25679 10.37075 10.49334 10.55914 10.74753 10.94525
10.93917 10.78788 10.58146 10.60925 10.74569 10.92048 11.16819 11.26193 11.25996 11.08978 10.73205 10.75322
0.241
0.265
0.280
0.274
0.272
0.291
0.270
0.269 0.270 0.269 0.268 0.268 0.268 0.269 0.272 0.274 0.275 0.280 0.283
0.288 0.293 0.290 0.288 0.292 0.294 0.296 0.293 0.290 0.288 0.288 0.288
Swiss fra""
Chinese renminbi
Belgian Republic of franc Korea won
5.24
5.35
4.78
5.64
5.44
5.53
6.11
6.13 6.16 5.65 5.41 5.35 5.o? 5.01 5.10 5.22 5.25 5.40 5.61
5.55 5.33 5.14 5.11 5.19 5.42 5.79 5.93 6.04 5.88 5.42 5.45
2.0950
2.0967
2.0790
1.6309
1.4611
1.4041
1.4927
1.4927 1.4927 1.4927 1.4790 1.4683 1.4477 1.4477 1.4477 1.4477 1.4410 1.4404 1.4404
1.4279 1.4203 1.4180 1.4081 1.4053 1.4102 1.4170 1.4236 1.4089 1.3974 1.3802 1.3342
0.213
0.216
0.203
0.238
0.232
0.244
0.257
0.256 0.260 0.242 0.227 0.225 0.216
.0.215 0.220 0.226 0.237 0.236 0.245
0.243 0.236 0.230 0.231 0.235 0.242 0.255 0.261 0.261 0.256 0.240 0.240
0.0095
0.0107
0.0116
0.0110
0.0106
0.0099
0.0109
0.0109 0.0108 0.0107 0.0107 0.0107 0.0107 0.0106 0.0106 0.0105 0.0104 0.0103 0.0103
0.0102 0.0101 0.0100 0.0099 0.0099 0.0098 0.0098 0.0098 0.0098 0.0099 0.0099 0.0098
Effective exchange rate indices for the Hong Kong dollar New Series
calculated with average trade weights 1984-1986
(24-28.10.83=100)
Trade (import and export)-weightcd
105.8
101.6
103.2
108.9
111.6
111.3
108.8
109.1 108.3 110.5 111.8 112.5 114.3 113.8 113.1 112.4 111.9 111.1 110.1
110.1 111.1 112.5 112.8 112.0 110.9 109.8 109.6 109.8 110.9 113.0 114.0
Importweightcd
101.6
96.1
98.1
104.4
106.4
105.S
103.8
104.1 103.1 105.7 106.9 107.6 109.4 108.8 108.0 107.2 106.S 105.6 104.6
104.3 105.3 107.1 107.4 106.S 105.2 104.0 103.9 103.8 104.7 106.8 107.8
Exportweightcd
110.5
107.6
109.0
113.9
117.3
117.8
114.4
114.6 114.l 116.0 117.3 118.0 119.8 119.5 118.8 118.2 118.0 117.2 116.3
116.7 117.6 118.6 118.8 118.2 117.4 116.3 115.9 116.5 117.8 120.0 120.9
85
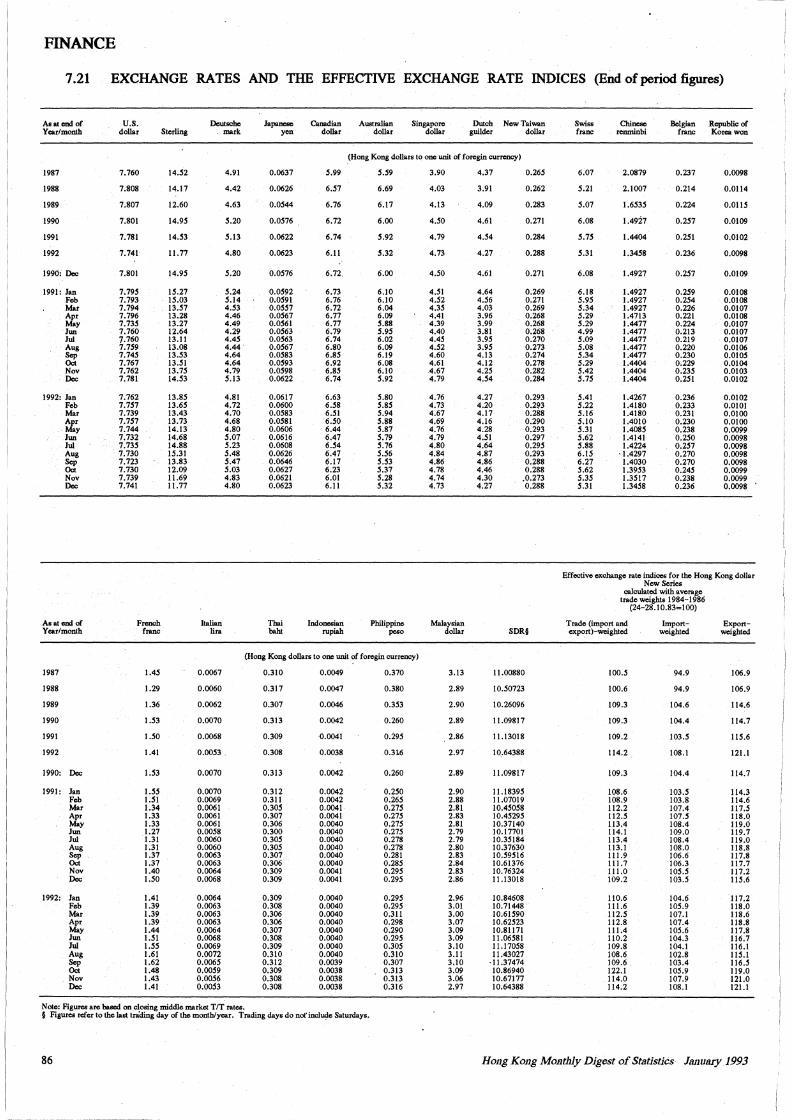
FINANCE
7.21 EXCHANGE RATES AND THE EFFECTIVE EXCHANGE RATE INDICES (End of period figures)
As at end of Yearlmonth
U.S. dollar Sterling
Deutsche . mark
Japanese yen
Canadian dollar
Australian dollar
Singapore dollar
Dutch New Taiwan guilder dollar
Swiss franc
Chinese renminbi
Belgian Republic of franc Korea won
(Hong Kong dollars to one unit of foregin currency)
1987
1988
1989
1990
1991
1992
1990: Dec
1991: Jan Feb Mar Apr May Jun Jui Aug Sep Oct Nov Dec
1992: Jan Feb Mar Apr May Jun Jui Aug Sep Oct Nov Dec
As at end of Ycarlmonth
1987
1988
1989
1990
1991
1992
1990: Dec
1991: Jan Feb Mar Apr May Jun Jui Aug Sep Oct Nov Dec
1992: Jan Feb Mar Apr May Jun Jui Aug Sep Oct Nov Dec
7.760
7.808
7.807
7.801
7.781
7.741
7.801
1.195 7.793 7.794 7.796 1.135 7.760 7.760 1.159 1.145 7.767 7.762 7.781
7.762 7.757 7.739 7.757 7.744 7.732 1.135 7.730 7.723 7.730 7.739 7.741
French franc
l.4S
1.29
1.36
1.53
l.50
1.41
1.53
I.SS 1.51 1.34 1.33 1.33 1.27 1.31 1.31 1.37 1.37 1.40 I.SO
1.41 1.39 1.39 1.39 1.44 I.SI I.SS 1.61 1.62 1.48 1.43 1.41
14.52
14.17
12.60
14.9S
14.53
11.77
14.95
15.27 15.03 13.57 13.28 13.27 12.64 13.11 13.08 13.S3 13.51 13.75 14.S3
13.85 13.65 13.43 13.73 14.13 14.68 14.88 15.31 13.83 12.09 11.69 11.77
Italian lira
0.0067
0.0060
0.0062
0.0070
0.0068
O.OOS3
0.0070
0.0070 0.0069 0.0061 0.0061 0.0061 O.OOS8 0.0060 0.0060 0.0063 0.0063 0.0064 0.0068
0.0064 0.0063 0.0063 0.0063 0.0064 0.0068 0.0069 0.0072 0.0065 0.00S9 O.OOS6 O.OOS3
4.91
4.42
4.63
5.20
5.13
4.80
5.20
5.24 S.14 4.53 4.46 4.49 4.29 4.45 4.44. 4.64 4.64 4.79 5.13
4.81 4.72 4.70 4.68 4.80 5.01 S.23 S.48 5.41 S.03 4.83 4.80
Note: Figures are based on closing middle market TIT rates.
0.0637
0.0626
O.OS44
O.OS76
0.0622
0.0623
0.0516
0.0592 0.0591 O.OS51 O.OS67 O.OS61 O.OS63 0.0563 O.OS67 O.OS83 O.OS93 O.OS98 0.0622
0.0617 0.0600 O.OS83 O.OS81 0.0606 0.0616 0.0608 0.0626 0.0646 0.0627 0.0621 0.0623
Thai baht
5.99
6.51
6.76
6.72
6.74
6.11
6.72.
6.73 6.76 6.72 6.77 6.77 6.79 6.74 6.80 6.8S 6.92 6.85 6.74
6.63 6.S8 6.51 6.50 6.44 6.47 6.54 6.47 6.17 6.23 6.01 6.11
Indonesian rupiah
5.S9
6.69
6.17
6.00
5.92
S.32
6.00
6.10 6.10 6.04 6.09 5.88 S.9S 6.02 6.09 6.19 6.08 6.10 S.92
5.80 5.85 5.94 S.88 5.87 S.79 5.16 5.S6 S.53 5.31 S.28 S.32
Philippine peso
(Hong Kong dollars to one unit of foregin currency)
0.310
0.317
0.307
0.313
0.309
0.308
0.313
0.312 0.311 0.305 0.307 0.306 0.300 0.305 0.30S 0.307 0.306 0.309 0.309
0.309 0.308 0.306 0.306 0.307 0.308 0.309 0.310 0.312 0.309 0.308 0.308
0.0049
0.0047
0.0046
0.0042
0.0041
0.0038
0.0042
0.0042 0.0042 0.0041 0.0041 0.0040 0.0040 0.0040 0.0040 0.0040 0.0040 0.0041 0.0041
0.0040 0.0040 0.0040 0.0040 0.0040 0.0040 0.0040 0.0040 0.0039 0.0038 0.0038 0.0038
0.370
0.380
0.353
0.260
0.29S
0.3L6
0.260
0.250 0.265 0.275 0.275 0.275 0.275 0.278 0.278 0.281 0.285 0.29S 0.295
0.29S 0.29S 0.311 0.298 0.290 0.29S 0.30S 0.310 0.307 0.313 0.313 0.316
§ Figures refer to the last tra'1ing day of the monthlyear. Trading days do nor include Saturdays.
86
3.90
4.03
4.13
4.50
4.79
4.73
4.SO
4.51 4.S2 4.35 4.41 4.39 4.40 4.4S 4.S2 4.60 4.61 4.67 4.79
4.76 4.73 4:67 4.69 4.76 4.79 4.80 4.84 4.86 4.78 4.74 4.73
Malaysian dollar
3.13
2.89
2.90
2.89
2.86
2.97
2.89
2.90 2.88 2.81 2.83 2.81 2.79 2.79 2.80 2.83 2.84 2.83 2.86
2.96 3.01 3.00 3.07 3.09 3.09 3.10 3.11 3.10 3.09 3.06 2.97
4.37
3.91
4.09
4.61
4.S4
4.27
4.61
4.64 4.S6 4.03 3.96 3.99 3.81 3.95 3.95 4.13 4.12 4.2S 4.S4
4.27 4.20 4.17 4.16 4.28 4.Sl 4.64 4.87 4.86 4.46 4.30 4.27
0.265
0.262
0.283
0.271
0.284
0.288
0.271
0.269 0.271 0.269 0.268 0.268 0.268 0.270 0.273 0.274 0.278 0.282 0.284
0.293 0.293 0.288 0.290 0.293 0.297 0.29S 0.293 0.288 0.288
.0.273 0.288
SOR§
11.00880
JO.S0723
10.26096
11.09817
11.13018
10 .. 64388
11.09817
11.18395 11.07019 10.4SOS8 10.45295 10.37140 10.17701 10.35184 10.37630 IO.S9Sl6 10.61376 10.76324 11.13018
10.84608 10.71448 10.61590 10.62523 10.81171 11.06581 11.17058 11.43027
· 11.37474 10.86940 10.67177 10.64388
6.07
S.21
5.01
6.08
5.15
5.31
6.08
6.18 S.95 5.34 5.29 S.29 4.99 S.09 S.08 S.34 5.29 S.42 S.1S
S.41 5.22 5.16 S.10 S.31 S.62 5.88 6.15 6.27 S.62 S.3S S.31
2.0879
2.1007
1.6535
1.4927
1.4404
1.3458
1.4927
1.4927 1.4927 1.4927 1.4713 1.4477 1.4477 1.4477 1.4477 1.4477 1.4404 1.4404 1.4404
1.4267 1.4180 1.4180 1.4010 l.408S 1.4141 1.4224
· 1.4297 1.4030 1.3953 l.3Sl 7 l.34S8
0.237
0.214
0.224
0.257
0.251
0.236
0.2S7
0.259 0.254 0.226 0.221 0.224 0.213 0.219 0.220 0.230 0.229 0.235 0.2Sl
0.236 0.233 0.231 0.230 0.238 0.250 0.257 0.270 0.270 0.245 0.238 0.236
0.0098
0.0114
0.0115
0.0109
0.0102
0.0098
0.0109
0.0108 0.0108 0.0107 0.0108 0.0107 0.0107 0.0107 0.0106 0.0105 0.0104 0.0103 0.0102
0.0102 0.0101 0.0100 0.0100 0.0099 0.0098 0.0098 0.0098 0.0098 0.0099 0.0099 0.0098
Effective exchange rate indices for the Hong Kong dollar New Series
calculated with average trade weights 1984-1986
(24-28.10.83=100)
Trade (import and export)-weighted
100.5
100.6
109.3
109.3
109.2
114.2
109.3
108.6 108.9 112.2 112.5 113.4 114.1 113.4 113.J 111.9 111.7 111.0 109.2
110.6 111.6 112.5 112.8 111.4 110.2 109.8 108.6 109.6 122.1 114.0 114.2
Importweighted
94.9
94.9
104.6
104.4
103.5
108.1
104.4
103.5 103.8 107.4 107.S 108.4 109.0 108.4 108.0 106.6 106.3 IOS.S 103.S
104.6 10S.9 107.J 107.4 !OS.6 104.3 104.1 102.8 103.4 105.9 107.9 108.1
Exportweighted
106.9
106.9
114.6
114.7
115.6
121.1
114.7
114.3 114.6 117.5 118.Q 119.0 119.7 119.0 118.8 117.8 117.7 117.2 l!S.6
117.2 118.0 118.6 118.8 117.8 116.7 116.1 l!S.l 116.S 119.0 121.0 121.1
Ho11g Kong Mo.nthly Digest of Statistics January 1993
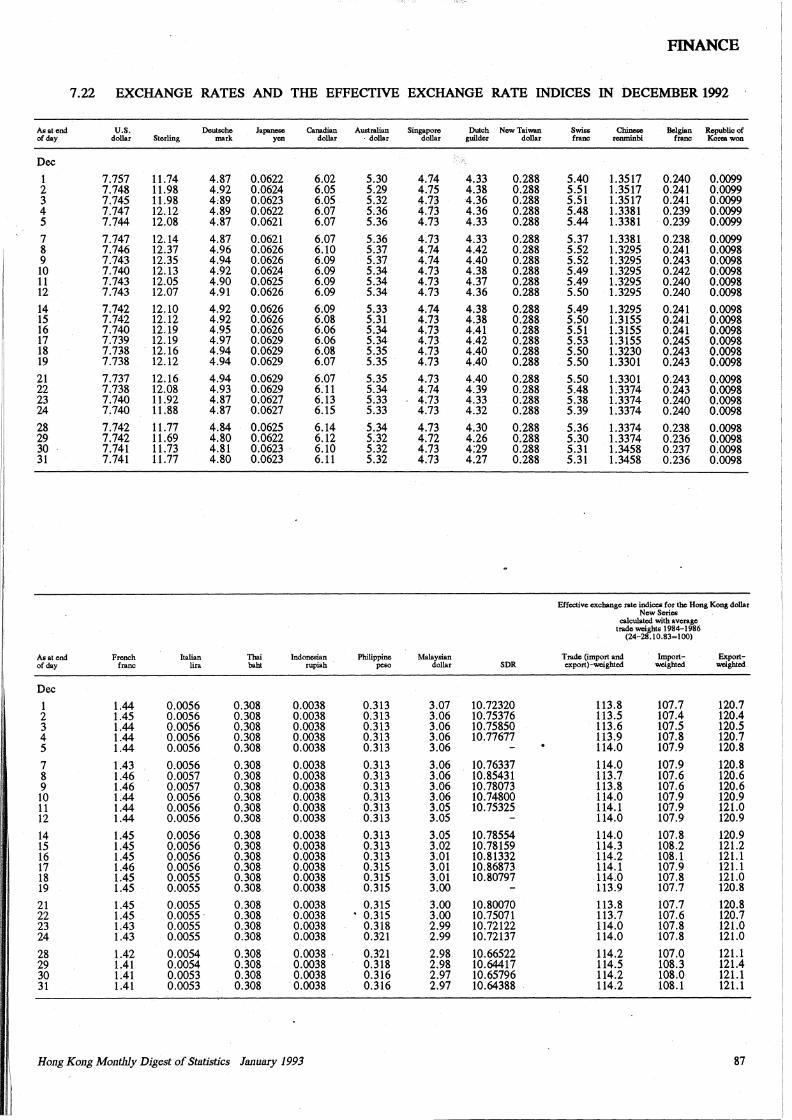
FINANCE
7.22 EXCHANGE RATES AND THE EFFECTIVE EXCHANGE RATE INDICES IN DECEMBER 1992
As at end U.S. Deutsche Japanese Canadian Australian Singapore Dutch New Taiwan Swiss Cbincsc BclgiAn Republic of of day dollar Sterling mark yen dollar · dollar dollar guilder dollar franc renminbi franc Korea won
Dec
1 7.757 11.74 4.87 0.0622 6.02 5.30 4.74 4.33 0.288 5.40 1.3517 0.240 0.0099 2 7.748 11.98 4.92 0.0624 6.05 5.29 4.75 4.38 0.288 5.51 1.3517 0.241 0.0099 3 7.745 11.98 4:89 0.0623 6.05 5.32 4.73 4.36 0.288 5.51 1.3517 0.241 0.0099 4 7.747 12.12 4.89 0.0622 6.07 5.36 4.73 4.36 0.288 5.48 1.3381 0.239 0.0099 5 7.744 12.08 4.87 0.0621 6.07 5.36 4.73 4.33 0.288 5.44 1.3381 0.239 0.0099
7 7.747 12.14 4.87 0.0621 6.07 5.36 4.73 4.33 0.288 5.37 1.3381 0.238 0.0099 8 7.746 12.37 4.96 0.0626 6.10 5.37 4.74 4.42 0.288 5.52 1.3295 0.241 0.0098 9 7.743 12.35 4.94 0.0626 6.09 5.37 4.74 4.40 0.288 5.52 1.3295 0.243 0.0098 10 7.740 12.13 4.92 0.0624 6.09 5.34 4.73 4.38 0.288 5.49 1.3295 0.242 0.0098 11 7.743 12.05 4.90 0.0625 6.09 5.34 4.73 4.37 0.288 5.49 1.3295 0.240 0.0098 12 7.743 12.07 4.91 0.0626 6.09 5.34 4.73 4.36 0.288 5.50 1.3295 0.240 0.0098
14 7.742 12.10 4.92 0.0626 6.09 5.33 4.74 4.38 0.288 5.49 1.3295 0.241 0.0098 15 7.742 12.12 4.92 0.0626 6.08 5.31 4.73 4.38 0.288 5.50 1.3155 0.241 0.0098 16 7.740 12.19 4.95 0.0626 6.06 5.34 4.73 4.41 0.288 5.51 1.3155 0.241 0.0098 17 7.739 12.19 4.97 0.0629 6.06 5.34 4.73 4.42 0.288 5.53 1.3155 0.245 0.0098 18 7.7J8 12.16 4.94 0.0629 6.08 5.35 4.73 4.40 0.288 5.50 1.3230 0.243 0.0098 19 7.738 12.12 4.94 0.0629 6.07 5.35 4.73 4.40 0.288 5.50 1.3301 0.243 0.0098
21 7.737 12.16 4.94 0.0629 6.07 5.35 4.73 4.40 0.288 5.50 1.3301 0.243 0.0098 22 7.738 12.08 4.93 0.0629 6.11 5.34 4.74 4.39 0.288 5.48 1.3374 0.243 0.0098 23 7.740 11.92 4.87 0.0627 6.13 5.33 4.73 4.33 0.288 5.38 1.3374 0.240 0.0098 24 7.740 11.88 4.87 0.0627 6.15 5.33 4.73 4.32 0.288 5.39 1.3374 0.240 0.0098
28 7.742 11.77 4.84 0.0625 6.14 5.34 4.73 4.30 0.288 5.36 1.3374 0.238 0.0098 29 7.742 11.69 4.80 0.0622 6.12 5.32 4.72 4.26 0.288 5.30 1.3374 0.236 0.0098 30 7.741 11.73 4.81 0.0623 6.10 5.32 4.73 4:29 0.288 5.31 1.3458 0.237 0.0098 31 7.741 11.77 4.80 0.0623 6.11 5.32 4.73 4.27 0.288 5.31 1.3458 0.236 0.0098
Effective exchange rate indices for the Hong Kong dollar New Series
calculated with average trade weights 1984-1986
(24-28.10.83~100)
As at end French Italian Thai Indonesian Philippine Malaysian Trade (import and Import- Export-of day franc lira baht rupiah peso dollar SDR export)-weightcd weighted weighted
[, Dec
1 1.44 0.0056 0.308 0.0038 0.313 3.07 10.72320 113.8 107.7 120.7 I! 2 1.45 0.0056 0.308 0.0038 0.313 3.06 10.75376 113.5 107.4 120.4
3 1.44 0.0056 0.308 0.0038 0.313 3.06 10.75850 113.6 107.5 120.5 4 1.44 0.0056 0.308 0.0038 0.313 3.06 10.77677 113.9 107.8 120.7 5 1.44 0.0056 0.308 0.0038 0.313 3.06 114.0 107.9 120.8
7 1.43 0.0056 0.308 0.0038 0.313 3.06 10.76337 114.0 107.9 120.8 8 1.46 0.0057 0.308 0.0038 0.313 3.06 10.85431 113.7 107.6 120.6 9 1.46 0.0057 0.308 0.0038 0.313 3.06 10.78073 113.8 107.6 120.6 10 1.44 0.0056 0.308 0.0038 0.313 3.06 10.74800 114.0 107.9 120.9 11 1.44 0.0056 0.308 0.0038 0.313 3.05 10.75325 114.1 107.9 121.0
I 12 1.44 0.0056 0.308 0.0038 0.313 3.05 114.0 107.9 120.9
14 1.45 0.0056 0.308 0.0038 0.313 3.05 10.78554 114.0 107.8 120.9 15 1.45 0.0056 0.308 0.0038 0.313 3.02 10.78159 114.3 108.2 121.2 16 1.45 0.0056 0.308 0.0038 0.313 3.01 10.81332 114.2 108.1 121.1 17 1.46 0.0056 0.308 0.0038 0.315 3.01 10.86873 114.1 107.9 121.1
I 18 1.45 0.0055 0.308 0.0038 0.315 3.01 10.80797 114.0 107.8 121.0 1· 19 1.45 0.0055 0.308 0.0038 0.315 3.00 113.9 107.7 120.8
21 1.45 0.0055 0.308 0.0038 0.315 3.00 10.80070 113.8 107.7 120.8 22 1.45 0.0055 0.308 0.0038 • 0.315 3.00 10.75071 113.7 107.6 120.7 23 1.43 0.0055 0.308 0.0038 0.318 2.99 10.72122 114.0 107.8 121.0 24 1.43 0.0055 0.308 0.0038 0.321 2.99 10.72137 114.0 107.8 121.0
28 1.42 0.0054 0.308 0.0038 . 0.321 2.98 10.66522 114.2 107.0 121.1 29 1.41 0.0054 0.308 0.0038 0.318 2.98 10.64417 114.5 108.3 121.4 30 1.41 0.0053 0.308 0.0038 0.316 2.97 10.65796 114.2 108.0 121.1 31 1.41 0.0053 0.308 . 0.0038 0.316 2.97 10.64388 114.2 108.1 121.1
I Ho11g Kong Montlily Digest of Statistics January 1993 87
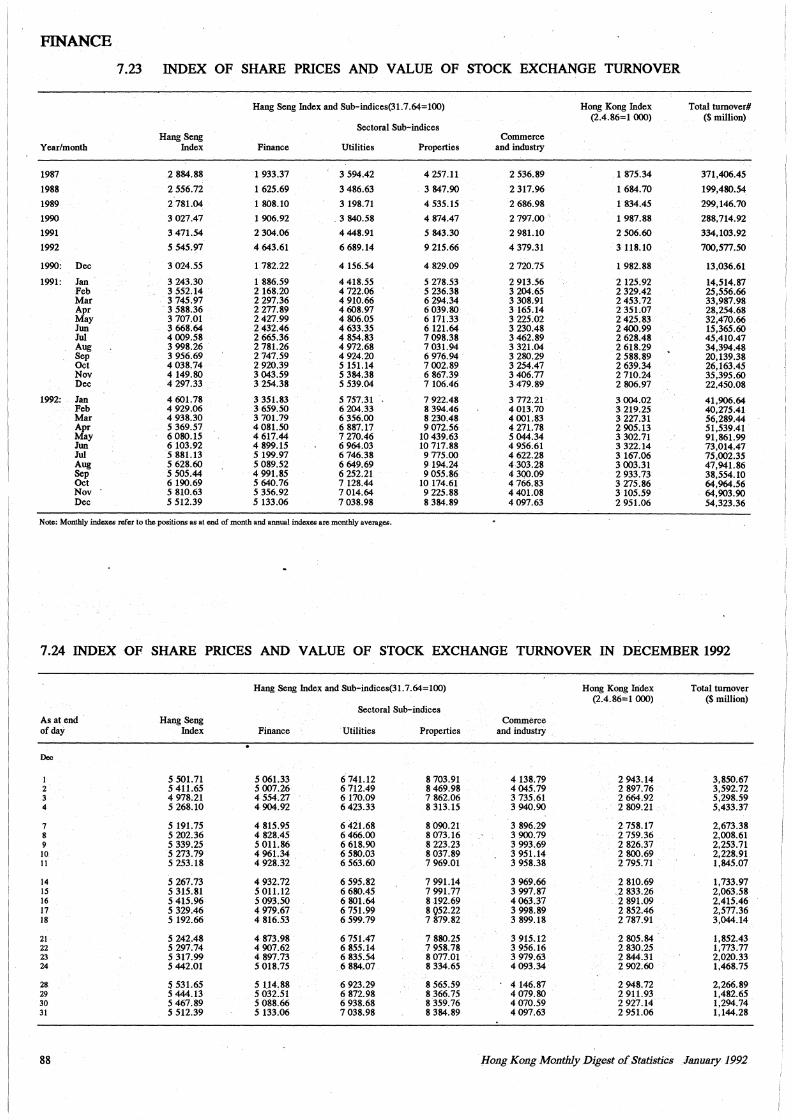
FINANCE
7.23 INDEX OF SHARE PRICES AND VALUE OF STOCK EXCHANGE TURNOVER
Hang Seng Index and Sub-indices(31.7.64=100) Hong Kong Index Total turnover# (2.4.86=1 000) ($million)
Sectoral Sub-indices Hang Seng Commerce
Year/month Index Finance Utilities Properties and industry
1987 2 884.88 1 933.37 3 594.42 4 257.11 2 536.89 1 875.34 371,406.45
1988 2 556.72 1 625.69 3 486.63 3 847.90 2 317.96 1 684.70 199,480.54
1989 2 781.04 1 808.10 3 198.71 4 535.15 2 686.98 1 834.45 299,146.70
1990 3 027.47 1 906.92 3 840.58 4 874.47 2 797.00 1 987.88 288,714.92
1991 3 471.54 2 304.06 4 448.91 5 843.30 2 981.10 2 506.60 334,103.92
1992 5 545.97 4 643.61 6 689.14 9 215.66 4 379.31 3 118.10 700,577.50
1990: Dec 3 024.55 1 782.22 4 156.54 4 829.09 2 720.75 1 982.88 13,036.61
1991: Jan 3 243.30 1 886.59 4 418.55 5 278.53 2 913.56 2 125.92 14,514.87 Feb 3 552.14 2 168.20 4 722.06 5 236.38 3 204.65 2 329.42 25,556.66 Mar 3 745.97 2 297.36 4 910.66 6 294.34 3 308.91 2 453.72 33,987.98 Apr 3 588.36 2 277.89 4 608.97 6039.80 3 165.14 2 351.07 28,254.68 May 3 707.01 2 427.99 4 806.05 6 171.33 3 225.02 2 425.83 32,470.66 Jun 3 668.64 2 432.46 4 633.35 6 121.64 3 230.48 2 400.99 15,365.60 Jui 4 009.58 2 665.36 4 854.83 7 098.38 3 462.89 2 628.48 45,410.47 Aug 3 998.26 2 781.26 4 972.68 7 031.94 3 321.04 2 618.29 34,394.48 Sep 3 956.69 2 747.59 4 924.20 6 976.94 3 280.29 2 588.89 20,139.38 Oct 4 038.74 2 920.39 5 151.14 7 002.89 3 254.47 2 639.34 26,163.45 Nov 4 149.80 3 043.59 5 384.38 6 867.39 3 406.77 2 710.24 35,395.60 Dec 4 297.33 3 254.38 5 539.04 7 106.46 3 479.89 2 806.97 22,450.08
1992: Jan 4 601.78 3 351.83 5 757.31 7 922.48 3 772.21 3 004.02 41,906.64 Feb 4 929.06 3 659.50 6 204.33 8 394.46 4 013.70 3 219.25 40,275.41 Mar 4 938.30 3 701.79 6 356.00 8 230.48 4 001.83 3 227.31 56,289.44 Apr 5 369.57 4 081.50 6 887.17 9072.56 4 271.78 2 905.13 51,539.41 May 6 080.15 4 617.44 7 270.46 10 439.63 5 044.34 3 302.71 91,861.99 Jun 6 103.92 4 899.15 6 964.03 10 717.88 4 956.61 3 322.14 73,014.47 Jui 5 881.13 5 199.97 6 746.38 9 775.00 4 622.28 3 167.06 75,002.35 Aug 5 628.60 5 089.52 6 649.69 9 194.24 4 303.28 3 003.31 47,941.86 Sep 5 505.44 4 991.85 6 252.21 9 055.86 4 3()().09 2 933.73 38,554.10 Oct 6 190.69 5 640.76 7 128.44 10 174.61 4 766.83 3 275.86 64,964.56 Nov 5 810.63 5 356.92 7 014.64 9 225.88 4 401.08 3 105.59 64,903.90 Dec 5 512.39 5 133.06 7 038.98 8 384.89 4 097.63 2 951.06 54,323.36
Note: Monthly indexes refer to the positions as at end of month and annual indexes are monthly averages.
7.24 INDEX OF SHARE PRICES AND VALUE OF STOCK EXCHANGE TURNOVER IN DECEMBER 1992
Hang Seng Index and Sub-indices(31.7.64=100) Hong Kong In:dex Total turnover (2.4. 86= 1 000) ($million)
Sectoral Sub-indices As at end Hang Seng Commerce of day Index Finance Utilities Properties and industry
Dec
I 5 501.71 5 061.33 6 741.12 8 703.91 4 138.79 2 943.14 3,850.67 2 5 411.65 5 007.26 6 712.49 8 469.98 4 045.79 2 897.76 3,592.72 3 4 978.21 4 554.27 6170.09 7 862.06 3 735.61 2 664.92 5,298.59 4 5 268.10 4 904.92 6 423.33 8 313.15 3 940.90 2 809.21 5,433.37
7 5 191.75 4 815.95 6 421.68 8 090.21 3 896.29 2 758.17 2,673.38 8 5 202.36 4 828.45 6 466.00 8 073.16 3 900.79 2 759.36 2,008.61 9 5 339.25 5011.86 6 618.90 8 223.23 3 993.69 2 826.37 2,253.71 10 5 273.79 4 961.34 6 580.03 8 037.89 3 951.14 2 800.69 2,228.91 II 5 253.18 4 928.32 6 563.60 7 969.01 3 958.38 2 795.71 1,845.07
14 5 267.73 4 932.72 6 595.82 7 991.14 3 969.66 2 810.69 1,733.97 IS 5 315.81 5 011.12 6 680.45 7 991.77 3 997.87 ,2 833.26 2,063.58 16 5 415.96 5 093.50 6 801.64 8192.69 4 063.37 2 891.09 2,415.46 17 5 329.46 4 979.67 6 751.99 8 Q52.22 3 998.89 2 852.46 2,577.36 18 5 192.66 4 816.53 6 599.79 7 879.82 3 899.18 2 787.91 3,044.14
21 5 242.48 4 873.98 6 751.47 7 880.25 3 915.12 2 805.84 l,852.43 22 5 297.74 4 907.62 6 855.14 7 958.78 3 956.16 2 830.25 1,773.77 23 5 317.99 4 897.73 6 835.54 8 077.01 3 979.63 2 844.31 2,020.33 24 5 442.01 5 018.75 6 884,.o7 8 334.65 4 093.34 2 902.60 1,468.75
28 5 531.65 5 114.88 6 923.29 8 565.59 4 146.87 2 948.72 2,266.89 29 5 444.13 5 032.51 6 872.98 8 366.75 4 079.80 2 911.93 1,482.65 30 5 467.89 5 088.66 6 938.68 8 359.76 4 070.59 2 927.14 1,294.74 31 5 512.39 5 133.06 7 038.98 8 384.89 4 097.63 2 951.06 1,144.28
88 Hong Kong Monthly Digest of Stiltistics January 1992
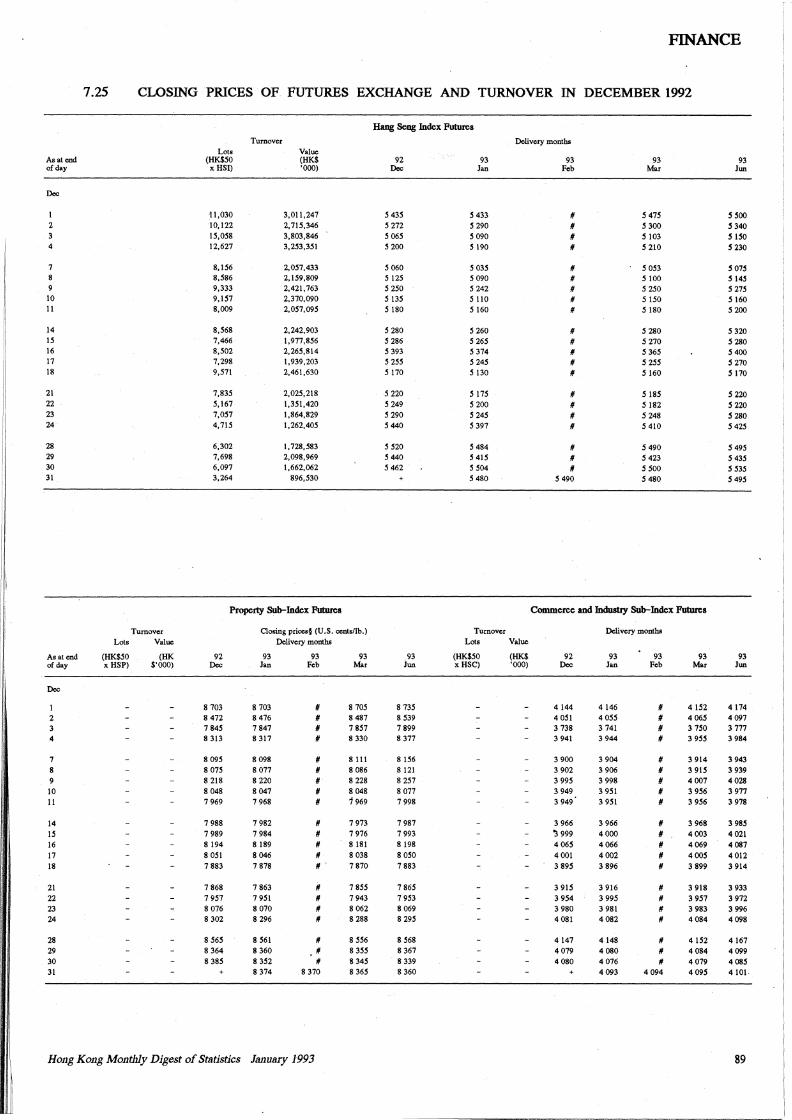
I
I
I
I
I' I
I:
I
I
1,
r' I
I
1:
I,
I
1:
I I I I
FINANCE
7.25 CLOSING PRICES OF FUTURES EXCHANGE AND TURNOVER IN DECEMBER 1992
As at end of day
Dec
2
4
7
9 JO II
14 15 16 17 18
21 22 23 24
28 29 30 31
As at end of day
Dec
2
JO II
14
15 16 17
18
21 22 23 24
28 29 30 31
Tum over
Lots Value
(HK$50 xHSP)
(HK $'000)
Lots (HK$50 xHSI)
11,030 10,122
15,058 12,627
8,156 8,586 9,333 9,157 8,009
8,568 7,466 8,502 7,298
9,571
7,835
5,167 7,057 4,715
6,302 7,698 6,097 3,264
Turnover
Value (HK$ 'OOO)
3,011,247 2,715,346 3,803,846 3,253,351
2,057,433 2, 159,809 2,421,763 2,370,090 2,057,095
2,242,903 l,977,856 2,265,814 1,939,203 2,461,630
2,025,218 1,351,420 l,864,829 l,262,405
l. 728,583 2,098,969 l,662,062
896,530
Property Sub-Index Futures
92 Dec
8 703 8 472 7 845 8 313
8 095 8 075
8 218 8 048 7 969
7 988
7 989 8 194 8 051
7 883
7 868 7 957
8 076 8 302
8 565 8 364
8 385
Closing prices§ (U.S. cents/lb.)
Delivery months
93 Jan
8 703 8 476 7 847 8 317
8 098
8 077 8 220 8 047 7 968
7 982 7 984
8 189 8 046
7 878
7 863
7 951 8070 8 296
8 561 8 360
8 352 8 374
93 Feb
# II # II
II II II II II
II II II II II.
II II II II
# # #
8 370
93 Mar
8 705 8 487 7 857 8 330
8 111 8 086
8 228 8 048 7 969
7 973
7 976 8181
8 038 7 870
7 855 7 943
8062 8 288
8 556 8 355 8 345 8 365
Ho11g Kong Monthly Digest of Statistics Jmwary 1993
Hang Seng Index Futures
92 Dec
5 435 5 272 5 065 5 200
5 060 5 125 5 250 5 135 5 180
5 280 5 286 5 393 5 255 5 170
5 220 5 249
5 290 5 440
5 520 5 440 5 462
93 Jan
5 433 5 290
5 090 5 190
5 035 5 090 5 242 5 110 5 160
5 260 5 265 5 374 5 245 5 130
5 175 5 200 5 245
5 397
5 484 5 415 5 504 5 480
Delivery months
93 Feb
# # # #
# # # # #
# # # # #
II # # #
# II II
5 490
93 Mar
5 475 5 300 5 103 5 210
5 053 5 100 5 250 5 150 5 180
5 280 5 270 5 365 5 255 5 160
5 185 5 182 5 248 5 410
5 490 5 423 5 500 5 480
Commerce and Industry Sub-Index Futures
93 Jun
8 735 8 539 7 899 8 377
8 156 8 121
8 257 8 077 7 998
7 987
7993 8 198
8 050
7 883
7 865 7 953
8 069 8 295
8 568 8 367 8 339
8 360
Turnover
Lots Value
(HK$50 xHSC)
(HK$ 'OOO)
92 Dec
4144 4 051 3 738 3 941
3 900
3 902 3 995 3 949 3 949
3 966 '3 999
4065
4001 3 895
3 915 3 954 3 980 4 081
4147 4 079 4080
Delivery months
93 Jan
4146 4 055 3 741 3 944
3 904
3 906 3 998 3 951 3 951
3 966 4000
4066
4002 3 896
3 916 3 995 3 981 4082
4148 4080 4076 4 093
93 Feb
# # # II
II II # II II
II II # # II
# II II II
II II II
4094
93 Mar
4 152 4065 3 750 3 955
3914 3 915 4007
3 956 3 956
3 968
4 003
4069 4005
3 899
3 918
3 957 3 983 4084
4 152 4 084 4079
4 095
93 Jun
5 500 5340
s 150 s 230
5 075 5 145 5 275 5 160 5 200
5 320 5 280 5 400 5 270 s 170
5 220 5 220
5 280 s 425
5 495 5 435 5 535 5 495
93 Jun
4174 4 097 3 777 3 984
3 943 3 939 4028 3 977 3 978
3 985
4021
4087 4012
3 914
3 933 3 972 3 996 4 098
4167 4099
4 085 4101-
89
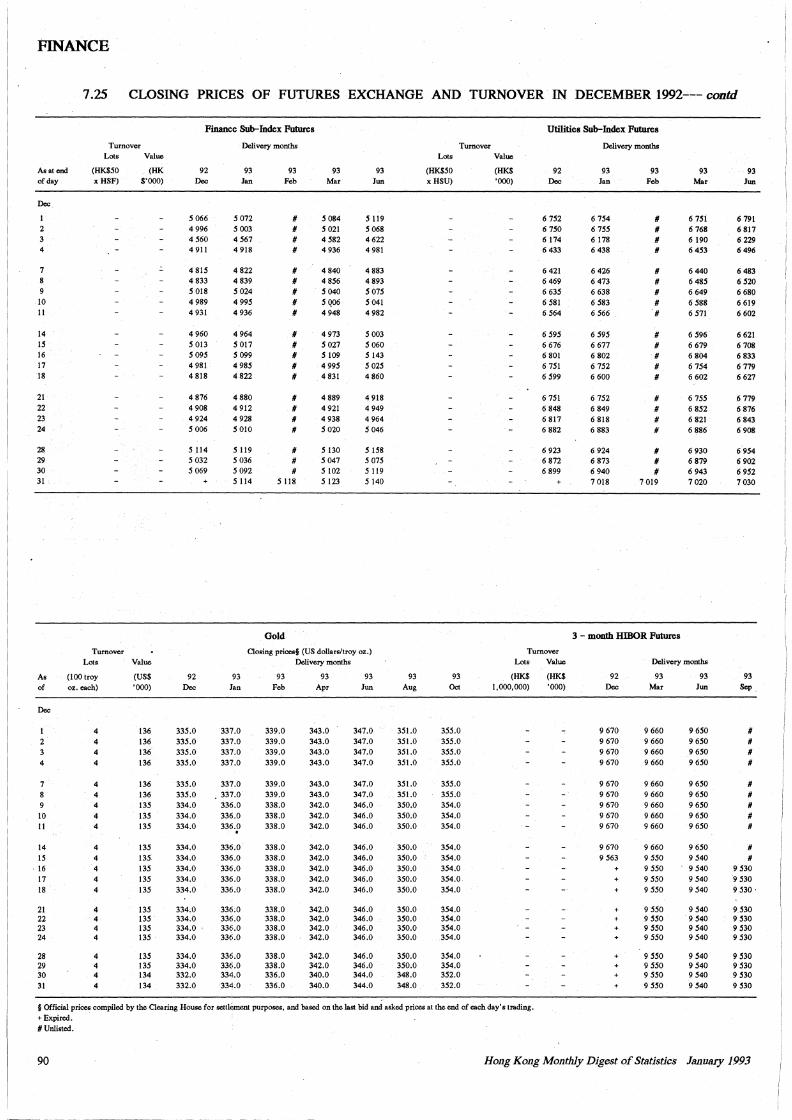
FINANCE
7.25 CLOSING PRICES OF FUTURES EXCHANGE AND TURNOVER IN DECEMBER 1992--- contd
Finance Sub-Index Futures Utilities Sub-Index Futures
As at end of day
Dec
2
4
7
9 10 II
14 15 16 17 18
21 22 23 24
28 29 30 31
Turnover Lots Value
(HK$50 xHSF)
Turnover
(HK $'000)
Lots Value
As of
(100 troy oz. each)
(US$ '000)
Dec
4
9 10 II
14 IS
. 16
17 18
21 22 23 24
28 29 30 31
4 4 4
4 4 4 4 4
4 4
4 4 4 4
4 4 4 4
136 136 136 136
136 136 135 135 135
135 135 135 135 135
135 135 135 135
135 135 134 134
92 Dec
5 066 4 996 4 560 4 911
4815 4 833 5 018 4 989 4 931
4 960 5 013 5 095 4 981 4 818
4 876 4 908 4 924 5 006
5 114 5 032 5 069
92 Dec
335.0
335.0 335.0
335.0
335.0 335.0 334.0 334.0 334.0
334.0 334.0 334.0 334.0 334.0
334.0 334.0 334.0 334.0
334.0 334.0 332.0 332.0
+
Delivery months
93 Jan
5 072 5 003 4 567 4 918
4 822 4839 5 024 4 995 4 936
4 964 5 017 5 099 4 985 4822
4 880 4 912 4 928 5010
5 119 5 036 5 092 5 114
93 Feb
# # # #
# # # # #
# # # # #
# # # #
# # #
5 118
Gold
93 Mar
5 084 5 021 4 582 4 936
4 840 4 856 5040 5 Q06 4948
4 973 5 027 5 109 4 995 4 831
4 889 4 921 4 938 5020
5 130 5 041 5 102 5 123
93 Jun
5 119
5 068 4 622 4 981
4 883 4 893 s 015
5 041 4 982
5 003 5 060 5143 5 025 4 860
4 918 4 949 4 964 5 046
5 158 s 015 s 119
5140
Closing prioes§ (US dollars/troy oz.) Delivery months
93 Jan
337.0 337.0 337.0 337.0
337.0 337.0 336.0 336.0 336.0 . 336.0 336.0 336.0 336.0 336.0
336:0 336.0 336.0 336.0
336.0 336.0 33<1.0 33<1.0
93 Feb
339.0 339.0 339.0 339.0
339.0 339.0 338.0 338.0 338.0
338.0 338.0 338.0 338.0 338.0
338.0 338.0 338.0 338.0
338.0 338.0 336.0 336.0
93 Apr
343.0 343.0 343.0 343.0
343.0 343.0 342.0 342.0 342.0
342.0 342.0 342.0 342.0 342.0
342.0 342.0 342.0 342.0
342.0 342.0 340.0 340.0
93 Jun
347.0 347.0 347.0 347.0
347.0 347.0 346.0 346.0 346.0
346.0 346.0 346.0 346.0 346.0
346.0 346.0 346.0 346.0
346.0 346.0 344.0 344.0
93 Aug
351.0 351.0 351.0 351.0
351.0 351.0 350.0 350.0 350.0
350.0 350.0 350.0 350.0 350.0
350.0 350.0 350.0 350.0
350.0 350.0 348.0 348.0
Turnover Lots Value
(HK$50 xHSU)
93 Oct
355.0 355.0 355.0 355.0
355.0 355.0 354.0 354.0 354.0
354.0 354.0 354.0 354.0 354.0
354.0 354.0 354.0 354.0
354.0 354.0 352.0 352.0
(HK$ 'OOO)
92 Dec
6 752 6 750 6 174 6433
6 421 6 469 6 635 6 581 6 564
6 595 6 676 6 801 6 751 6 599
6 751 6 848 6 817 6 882
6 923 6 872 6 899
+
Turnover Lots Value
(HK$ 1,000,000)
(HK$ '000)
§ Official prices compiled by the Clearing House for settlcrnent purposes, and based on the last bid and asked prices at the end of each day's trading. +Expired. #Unlisted.
Delivery months
93 Jan
6 754 6 755 6 178 6 438
6 426 6 473 6 638 6 583 6 566
6 595 6 677 6 802 6 752 6 600
6 752 6 849 6 818 6 883
6 924 6 873 6 940 7 018
93 Feb
# # # #
# # # # #
# # # # #
# # # #
# # #
7 019
3 - month HIBOR Futures
93 Mar
6 751 6 768 6 190 6 453
6 440 6 485 6 649 6 588 6 571
6 596
6 679 6 804 6 754 6 602
6155 6 852 6 821 6 886
6 930 6 879 6 943 7020
Delivery months
92 Dec
9 670 9 670 9 670 9 670
9 670 9 670 9 670 9 670 9 670
9 670 9 563
+
+
93 Mar
9 660 9 660 9 660 9 660
9 660 9 660 9 660 9 660 9 660
9 660 9 550
9 550 9 550 9 550
9 550 9 550 9 550 9 550
9 550 9 550 9 550
9 550
93 Jun
9 650 9 650 9 650
9 650
9 650 9 650 9 650 9 650 9 650
9 650 9 540 9 540 9 540 9 540
9 540 9 540 9 540 9 540
9 540 9540 9 540
9 540
93 Jun
6 791 6 817 6 229 6 496
6 483 6 520 6 680 6 619 6 602
6 621 6 708 6 833 6 779 6 627
6 779 6 876 6 843 6 908
6 954 6 902 6 952 7030
93 Sep
# # # #
# # # # #
# #
9530 9 530 9 530.
9 530 9 530 9 530 9 530
9 530 9 530 9 530 9 530
90 Ho11g Kong Mondily Digest of Statistics January 1993
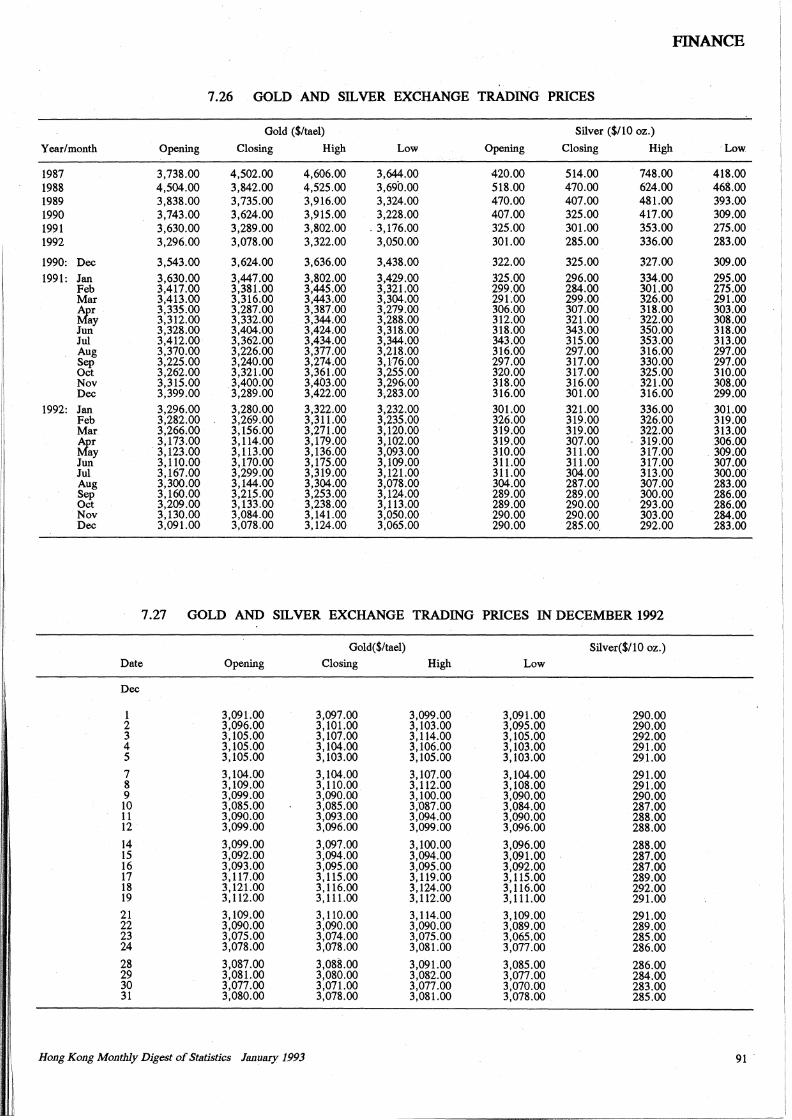
FINANCE
7.26 GOLD AND SIL VER EXCHANGE TRADING PRICES
Gold ($/tael) Silver ($/10 oz.)
Year/month Opening Closing High Low Opening Closing High Low
1987 3,738.00 4,502.00 4,606.00 3,644.00 420.00 514.00 748.00 418.00 1988 4,504.00 3,842.00 4,525.00 3,690.00 518.00 470.00 624.00 468.oo 1989 3,838.00 3,735.00 3,916.00 3,324.00 470.00 407.00 481.00 393.00 1990 3,743.00 3,624.00 3,915.00 3,228.00 407.00 325.00 417.00 309.00 1991 3,630.00 3,289.00 3,802.00 . 3,176.00 325.00 301.00 353.00 275.00 1992 3,296.00 3,078.00 3,322.00 3,050.00 301.00 285.00 336.00 283.00
1990: Dec 3,543.00 3,624.00 3,636.00 3,438.00 322.00 325.00 327.00 309.00
1991: Jan 3,630.00 3,447.00 3,802.00 3,429.00 325.00 296.00 334.00 295.00 Feb 3,417.00 3,381.00 3,445.00 3,321.00 299.00 284.00 301.00 275.00 Mar 3,413.00 3,316.00 3,443.00 3,304.00 291.00 299.00 326.00 291.00 tlr 3,335.00 3,287.00 3,387.00 3,279.00 306.00 307.00 318.00 303.00
ay 3,312.00 3,332.00 3,344.00 3,288.00 312.00 321.00 322.00 308.00 Jun 3,328.00 3,404.00 3,424.00 3,318.00 318.00 343.00 350.00 318.00 Jul 3,412.00 3,362.00 3,434.00 3,344.00 343.00 315.00 353.00 313.00 Aug 3,370.00 3,226.00 3,377.00 3,218.00 316.00 297.00 316.00 297.00 Sep 3,225.00 3,240.00 3,274.00 3,176.00 297.00 317.00 330.00 297.00 Oct 3,262.00 3,321.00 3,361.00 3,255.00 320.00 317.00 325.00 310.00 Nov 3,315.00 3,400.00 3,403.00 3,296..00 318.00 316.00 321.00 308.00 Dec 3,399.00 3,289.00 3,422.00 3,283.00 316.00 301.00 316.00 299.00
1992: Jan 3,296.00 3,280.00 3,322.00 3,232.00 301.00 321.00 336.00 301.00 Feb 3,282.00 3,269.00 3,311.00 3,235.00 326.00 319.00 326.00 319.00 Mar 3,266.00 3,156.00 3,271.00 3,120.00 319.00 319.00 322.00 313.00 tfar 3,173.00 3,114.00 3,179.00 3,102.00 319.00 307.00 319.00 306.00
ay 3,123.00 3,113.00 3, 136.00 3,093.00 310.00 311.00 317.00 309.00 Jun 3,110.00 3,170.00 3,175.00 3,109.00 311.00 311.00 317.00 307.00 Jul 3,167.00 3,299.00 3,319.00 3,121.00 311.00 304.00 313.00 300.00 Aug 3,300.00 3,144.00 3,304.00 3,078.00 304.00 287.00 307.00 283.00 Sep 3,160.00 3,215.00 3,253.00 3,124.00 289.00 289.00 300.00 286.00 Oct 3,209.00 3,133.00 3,238.00 3,113.00 289.00 290.00 293.00 286.00 Nov 3,130.00 3,084.00 3, 141.00 3,050.00 290.00 290.00 303.00 284.00 Dec 3,091.00 3,078.00 3,124.00 3,065.00 290.00 285.00. 292.00 283.00
I
7.27 GOLD AND SIL VER EXCHANGE TRADING PRICES IN DECEMBER 1992
Gold($/tael) Silver($/10 oz.) Date Opening Closing High Low
Dec
1 3,091.00 3,097.00 3,099.00 3,091.00 290.00 2 3,096.00 3, 101.00 3, 103.00 3,095.00 290.00
I 3 3,105.00 3,107.00 3,114.00 3,105.00 292.00 1: 4 3,105.00 3,104.00 3,106.00 3,103.00 291.00
5 3,105.00 3,103.00 3,105.00 3,103.00 291.00 1,', 7 3,104.00 3,104.00 3, 107.00 3,104.00 291.00 1· 8 3,109.00 3, 110.00 3,112.00 3,108.00 291.00
9 3,099.00 3,090.00 3,100.00 3,090.00 290.00 10 3,085.00 3,085.00 3,087.00 3,084.00 287.00
I' 11 3,090.00 3,093.00 3,094.00 3,090.00 288.00 I 12 3,099.00 3,096.00 3,099.00 3,096.00 288.00
14 3,099.00 3,097.00 3,100.00 3,096.00 288.00 15 3,092.00 3,094.00 3,094.00 3,091.00 287.00
1· 16 3,093.00 3,095.00 3,095.00 3,092.00 287.00 17 3,117.00 3,115.00 3,119.00 3,115.00 289.00 18 3,121.00 3,116.00 3,124.00 3,116.00 292.00 19 3,112.00 3,111.00 3, 112.00 3, 111.00 291.00
21 3,109.00 3, 110.00 3, 114.00 3,109.00 291.00 22 3,090.00 3,090.00 3,090.00 3,089.00 289.00 23 3,075.00 3,074.00 3,075.00 3,065.00 285.00 24 3,078.00 3,078.00 3,081.00 3,077.00 286.00
28 3,087.00 3,088.00 3,091.00 3,085.00 286.00
I' 29 3,081.00 3,080.00 3,082.00 3,077.00 284.00 30 3,077.00 3,071.00 3,077.00 3,070.00 283.00 31 3,080.00 3,078.00 3,081.00 3,078.00 285.00
I: Hong Kong Monthly Digest of Statistics January 1993 91
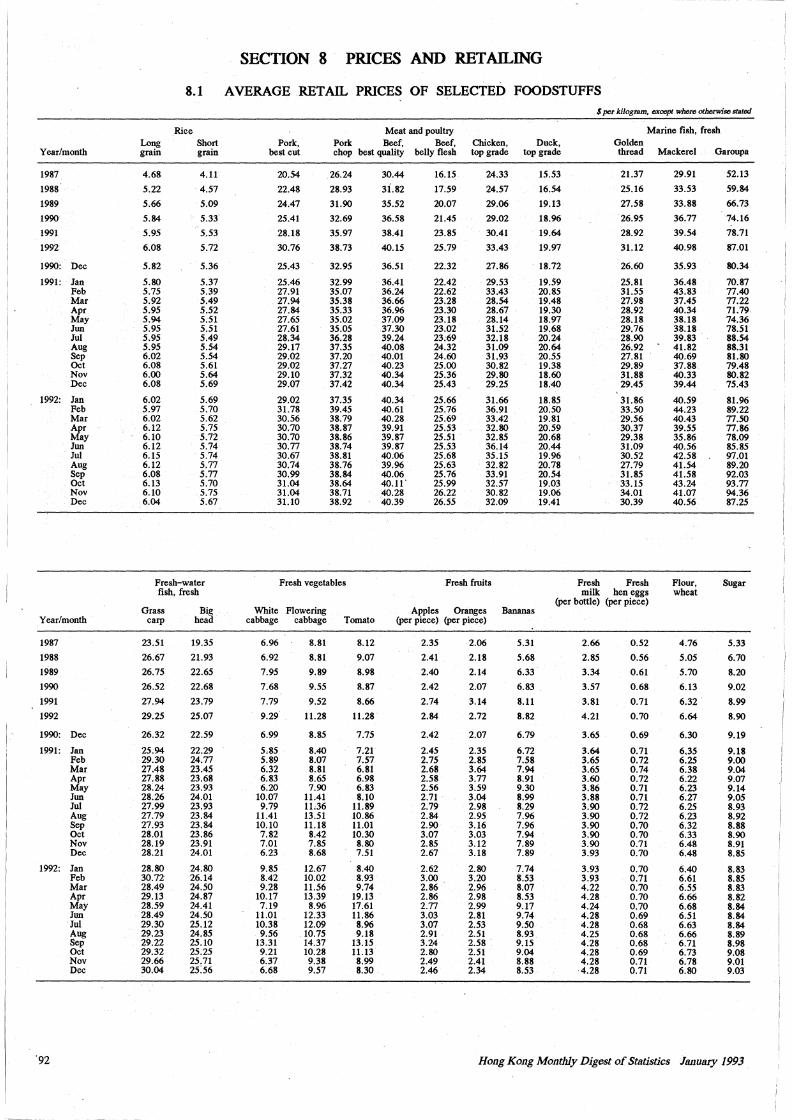
SECTION 8 PRICES AND RETAILING
8.1 AVERAGE RETAIL PRICES OF SELECTED FOODSTUFFS $per kilogram, tm:epl where otberwiGC statod
Rice Meat and poultry Marine fish, fresh Long Short Pork, Pork Beef, Beef, Chicken, Duck, Golden
Year/month grain grain best cut chop best quality belly flesh top grade top grade thread Mackerel Garoupa
1987 4.68 4.11 20.54 26.24 30.44 16.15 24.33 15.53 21.37 29.91 52.13
1988 5.22 4.57 22.48 28.93 3i.82 17.59 24.57 16.54 25.16 33.53 59.84
1989 5.66 5.09 24.47 31.90 35.52 20.07 29.06 19.13 27.58 33.88 66.73
1990 5.84 5.33 25.41 32.69 36.58 21.45 29.02 18.96 26.95 36.77 74.16
1991 5.95 5.53 28.18 35.97 38.41 23.85 30.41 19.64 28.92 39.54 78.71
1992 6.08 5.72 30.76 38.73 40.15 25.79 33.43 19.97 31.12 40.98 87.01
1990: Dec 5.82 5.36 25.43 32.95 36.51 22.32 27.86 18.72 26.60 35.93 80.34
1991: Jan 5.80 5.37 25.46 32.99 36.41 22.42 29.53 19.59 25.81 36.48 70.87 Feb 5.75 5.39 27.91 35.07 36.24 22.62 33.43 20.85 31.55 43.83 77.40 Mar 5.92 5.49 27.94 35.38 36.66 23.28 28.54 19.48 27.98 37.45 77.22 Apr 5.95 5.52 27.84 35.33 36.96 23.30 28.67 19.30 28.92 40.34 71.79 May 5.94 5.51 27.65 35.02 37.09 23.18 28.14 18.97 28.18 38.18 74.36 Jun 5.95 5.51 27.61 35.05 37.30 23.02 31.52 19.68 29.76 38.18 78.51 Jui 5.95 5.49 28.34 36.28 39.24 23:69 32.18 20.24 28.90 39.83 88.54 Aug 5.95 5.54 29.17 37.35 40.08 24.32 31.09 20.64 26.92 41.82 88.31 Sep 6.02 5.54 29.02 37.20 40.01 24.60 31.93 20.55 27.81 40.69 81.80 Oct 6.08 5.61 29.02 37.27 40.23 25.00 30.82 19.38 29.89 37.88 79.48 Nov 6.00 5.64 29.10 37.32 40.34 25.36 29.80 18.60 31.88 40.33 80.82 Dec 6.08 5.69 29.07 37.42 40.34 25.43 29.25 18.40 29.45 39.44 75.43
1992: Jan 6.02 5.69 29.02 37.35 40.34 25.66 31.66 18.85 31.86 40.59 81.96 Feb 5.97 5.70 31.78 39.45 40.61 25.76 36.91 20.50 33.50 44.23 89.22 Mar 6.02 5.62 30.56 38.79 40.28 25.69 33.42 19.81 29.56 40.43 77.50 Apr 6.12 5.75 30.70 38.87 39.91 25.53 32.80 20.59 30.37 39.55 77.86 May 6.10 5.72 30.70 38.86 39.87 25.51 32.85 20.68 29.38 35.86 78.09 Jun 6.12 5.74 30.77 38.74 39.87 25.53 36.14 20.44 31.09 40.56 85.85 Jui 6.15 5.74 30.67 38.81 40.06 25.68 35.15 19.96 30.52 42.58 97.01 Aug 6.12 5.77 30.74 38.76 39.96 25.63 32.82 20.78 27.79 41.54 89.20 Sep 6.08 5.77 30.99 38.84 40.06 25.76 33.91 20.54 31.85 41.58 92.03 Oct 6.13 5.70 31.04 38.64 40.11' 25.99 32.57 19.03 33.15 43.24 93.77 Nov 6.10 5.75 31.04 38.71 40.28 26.22 30.82 19.06 34.01 41.07 94.36 Dec 6.04 5.67 31.10 38.92 40.39 26.55 32.09 19.41 30.39 40.56 87.25
Fresh-water Fresh vegetables Fresh fruits Fresh Fresh Flour, Sugar fish, fresh milk hen eggs wheat
(per bottle) (per piece) Grass Big White Flowering Apples Oranges Bananas
Year/month carp head cabbage cabbage Tomato (per piece) (per piece)
1987 23.51 19.35 6.96 8.81 8.12 2.35 2.06 5.31 2.66 0.52 4.76 5.33
1988 26.67 21.93 6.92 8.81 9.07 2.41 2.18 5.68 2.85 0.56 5.05 6.70
1989 26.75 22.65 7.95 9.89 8.98 2.40 2.14 6.33 3.34 0.61 5.70 8.20
1990 26.52 22.68 7.68 9.55 8.87 2.42 2.07 6.83 3.57 0.68 6.13 9.02
1991 27.94 23.79 7.79 9.52 8.66 2.74 3.14 8.11 3.81 0.71 6.32 8.99
1992 29.25 25.07 9.29 11.28 11.28 2.84 2.72 8.82 4.21 0.70 6.64 8.90
1990: Dec 26.32 22.59 6.99 8.85 7.75 2.42 2.07 6.79 3.65 0.69 6.30 9.19
1991: Jan 25.94 22.29 5.85 8.40 7.21 2.45 2.35 6.72 3.64 0.71 6.35 9.18 Feb 29.30 24.77 5.89 8.07 7.57 2.75 2.85 7.58 3.65 0.72 6.25 9.00 Mar 27.48 23.45 6.32 8.81 6.81 2.68 3.64 7.94 3.65 0.74 6.38 9.04 Apr 27.88 23.68 6.83 8.65 6.98 2.58 3.77 8.91 3.60 0.72 6.22 9.07 May 28.24 23.93 6.20 7.90 6.83 2.56 3.59 9.30 3.86 0.71 6.23 9.14 Jun 28.26 24.01 10.07 11.41 8.10 2.71 3.04 8.99 3.88 0.71 6.27 9.05 Jui 27.99 23.93 9.79 11.36 11.89 2.79 2.98 8.29 3.90 0.72 6.25 8.93 Aug 27.79 23.84 11.41 13.51 10.86 2.84 2.95 7.96 3.90 0.72 6.23 8.92 Sep 27.93 23.84 10.10 11.18 11.01 2.90 3.16 7.96 3.90 0.70 6.32 8.88 Oct 28.01 23.86 7.82 8.42 10.30 3.07 3.03 7.94 3.90 0.70 6.33 8.90 Nov 28.19 23.91 7.01 7.85 8.80 2.85 3.12 7.89 3.90 0.71 6.48 8.91 Dec 28.21 24.01 6.23 8.68 7.51 2.67 3.18 7.89 3.93 0.70 6.48 8.85
1992: Jan 28.80 24.80 9.85 12.67 8.40 2.62 2.80 7.74 3.93 0.70 6.40 8.83 Feb 30.72 26.14 8.42 10.02 8.93 3.00 3.20 8.53 3.93 0.71 6.61 8.85 Mar 28.49 24.50 9.28 11.56 9.74 2.86 2.96 8.07 4.22 0.70 6.55 8.83 Apr 29.13 24.87 10.17 13.39 19.13 2.86 2.98 8.53 4.28 0.70 6.66 8.82 May 28.59 24.41 7.19 8.96 17.61 2.77 2.99 9.17 4.24 0.70 6.68 8.84 Jun 28.49 24.50 11.01 12.33 11.86 3.03 2.81 9.74 4.28 0.69 6:51 8.84 Jui 29.30 25.12 10.38 12.09 8.96 3.07 2.53 9.50 4.28 0.68 6.63 8.84 Aug 29.23 24.85 9.56 10.75 9.18 2.91 2.51 8.93 4.25 0.68 6.66 8.89 Sep 29.22 25.10 13.31 14.37 13.15 3.24 2.58 9.15 4.28 0.68 6.71 8.98 Oct 29.32 25.25 9.21 10.28 11.13 2.80 2.51 9.04 4.28 0.69 6.73 9.08 Nov 29.66 25.71 6.37 9.38 8.99 2.49 2.41 8.88 4.28 0.71 6.78 9.01 Dec 30.04 25:56 6.68 9.57 8.30 2.46 2.34 8.53 4.28 0.71 6.80 9.03
·92 Hong Kong Monthly Digest of Statistics January 1993
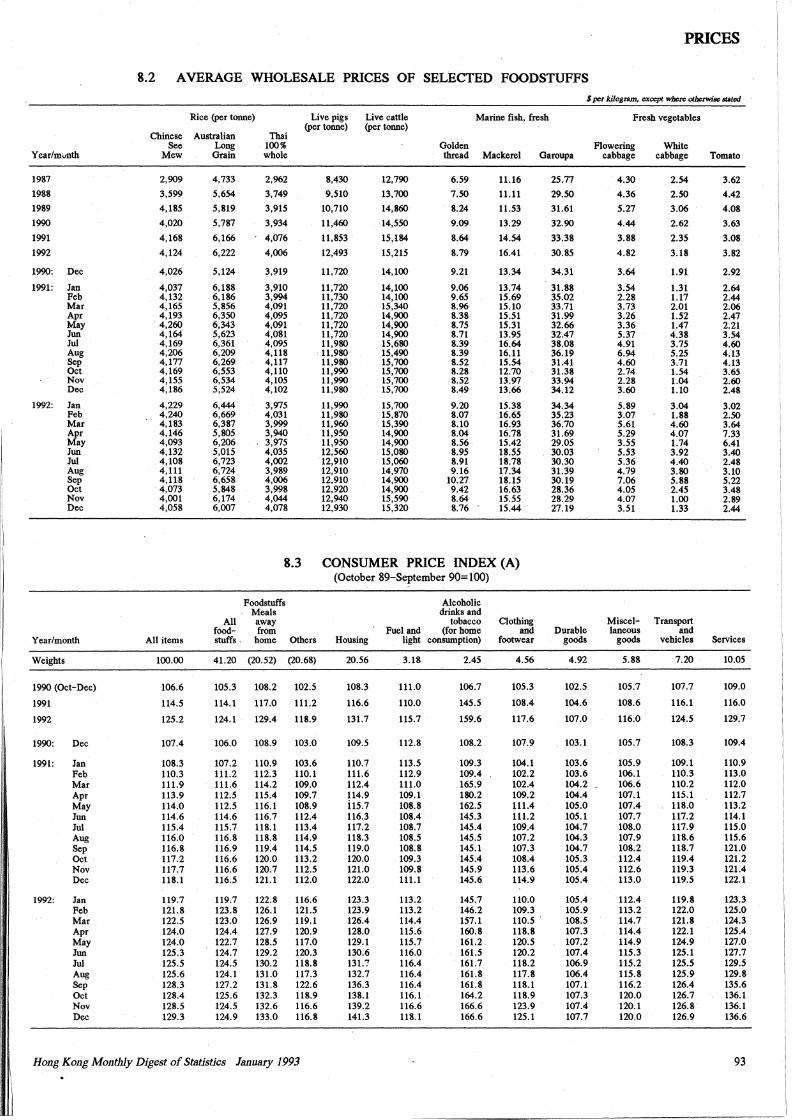
D"llJ[J ____
PRICES
8.2 AVERAGE WHOLESALE PRICES OF SELECTED FOODSTUFFS
$per Aflogram, except wbme otberwi.., stiitod
Rice (per tonne) Live pigs Live cattle Marine fish, fresh Fresh vegetables (per tonne) (per tonne)
Chinese Australian Thai See Long 100% Golden Flowering White
Year/mvnth Mew Grain whole thread Mackerel Garoupa cabbage cabbage Tomato
1987 2,909 4,733 2,962 8,430 12,790 6.59 11.16 25.77 4.30 2.54 3.62
1988 3,599 5,654 3,749 9,510 13,700 7.50 11.11 29.50 4.36 2.50 4.42
1989 4,185 5,819 3,915 10,710 14,860 8.24 11.53 31.61 5.27 3.06 4.08
1990 4,020 5,787 3,934 11,460 14,550 9.09 13.29 32.90 4.44 2.62 3.63
1991 4,168 6,166 4,076 11,853 15,184 8.64 14.54 33.38 3.88 2.35 3.08
1992 4,124 6,222 4,006 12,493 15,215 8.79 16.41 30.85 4.82 3.18 3.82
1990: Dec 4,026 5,124 3,919 11,720 14,100 9.21 13.34 34.31 3.64 1.91 2.92
1991: Jan 4,037 6,188 3,910 11,720 14,100 9.06 13.74 31.88 3.54 1.31 2.64 Feb 4,132 6,186 3,994 11,730 14,100 9.65 15.69 35.02 2.28 1.17 2.44 Mar 4,165 5,856 4,091 11,720 15,340 8.96 15.10 33.71 3.73 2.01 2.06 Apr 4,193 6,350 4,095 11,720 14,900 8.38 15.51 31.99 3.26 1.52 2.47 May 4,260 6,343 4,091 11,720 14,900 8.75 15.31 32.66 3.36 1.47 2.21 Jun 4,164 5,623 4,081 11,720 14,900 8.71 13.95 32.47 5.37 4.38 3.54 Jui 4,169 6,361 4,095 11,980 15,680 8.39 16.64 38.08 4.91 3.75 4.60 Aug 4,206 6,209 4,118 11,980 15,490 8.39 16.11 36.19 6.94 5.25 4.13 Sep 4,177 6,269 4,117 11,980 15,700 8.52 15.54 31.41 4.60 3.71 4.13 Oct 4,169 6,553 4,110 11,990 15,700 8.28 12.70 31.38 2.74 1.54 3.65 Nov 4,155 6,534 4,105 11,990 15,700 8.52 13.97 33.94 2.28 1.04 2.60 Dec 4,186 5,524 4,102 11,980 15,700 8.49 13.66 34.12 3.60 1.10 2.48
1992: Jan 4,229 6,444 3,975 11,990 15,700 9.20 15.38 34.34 5.89 3.04 3.02 Feb 4,240 6,669 4,031 11,980 15,870 8.07 16.65 35.23 3.07 1.88 2.50 Mar 4,183 6,387 3,999 11,960 15,390 8.10 16.93 36.70 5.61 4.60 3.64 Apr 4,146 5,805 3,940 11,950 14,900 8.04 16.78 31.69 5.29 4.07 7.33 May 4,093 6,206 3,975 11,950 14,900 8.56 15.42 29.05 3.55 1.74 6.41 Jun 4,132 5,015 4,035 12,560 15,080 8.95 18.55 30.03 5.53 3.92 3.40 Jui 4,108 6,723 4,002 12,910 15,060 8.91 18.78 30.30 5.36 4.40 2.48 Aug 4,111 6,724 3,989 12,910 14,970 9.16 17.34 31.39 4.79 3.80 3.10 Sep 4,118 6,658 4,006 12,910 14,900 10.27 18.15 30.19 7.06 5.88 5.22 Oct 4,073 5,848 3,998 12,920 14,900 9.42 16.63 28.36 4.05 2.45 3.48 Nov 4,001 6,174 4,044 12,940 15,590 8.64 15.55 28.29 4.07 1.00 2.89 Dec 4,058 6,007 4,078 12,930 15,320 8.76 15.44 27.19 3.51 1.33 2.44
8.3 CONSUMER PRICE INDEX (A) (October 89-September 90=100)
Foodstuffs Alcoholic Meals drinks and
All away tobacco Clothing Miscel- Transport food- from Fuel and (for home and Durable laneous and
Year/month All items stuffs . home Others Housing light consumption) footwear goods goods vehicles Services
Weights 100.00 41.20 (20.52) (20.68) 20.56 3.18 2.45 4.56 4.92 5.88 7.20 10.05
1990 (Oct-Dec) 106.6 105.3 108.2 102.5 108.3 111.0 106.7 105.3 102.5 105.7 107.7 109.0
1991 114.5 114.1 117.0 111.2 116.6 110.0 145.5 108.4 104.6 108.6 116.1 116.0
1992 125.2 124.1 129.4 118.9 131.7 115.7 159.6 117.6 107.0 116.0 124.5 129.7
I' 1990: Dec 107.4 106.0 108.9 103.0 109.5 112.8 108.2 107.9 103.1 105.7 108.3 109.4 ,. 1991: Jan 108.3 107.2 110.9 103.6 110.7 113.5 109.3 104.1 103.6 105.9 109.1 110.9
i. Feb 110.3 111.2 112.3 110.1 111.6 112.9 109.4 102.2 103.6 106.1 110.3 113.0
I" Mar 111.9 111.6 114.2 109.0 112.4 111.0 165.9 102.4 104.2 106.6 110.2 112.0 Apr 113.9 112.5 115.4 109.7 114.9 109.1 180.2 109.2 104.4 107.1 115.1 112.7 May 114.0 112.5 116.1 108.9 i15.7 108.8 162.5 111.4 105.0 107.4 118.0 113.2
1: Jun 114.6 114.6 116.7 112.4 116.3 108.4 145.3 111.2 105.1 107.7 117.2 114.1 Jui 115.4 115.7 118.1 113.4 117.2 108.7 145.4 109.4 104.7 108.0 117.9 115.0 Aug 116.0 116.8 118.8 114.9 118.3 108.5 145.5 107.2 104.3 107.9 118.6 115.6
1:
Sep 116.8 116.9 119.4 114.5 119.0 108.8 145.1 107.3 104.7 108.2 118.7 121.0 Oct 117.2 116.6 120.0 113.2 120.0 109.3 145.4 108.4 105.3 112.4 119.4 121.2 Nov 117.7 116.6 120.7 112.5 121.0 109.8 145.9 113.6 105.4 112.6 119.3 121.4 Dec 118.1 116.5 121.1 112.0 122.0 111.1 145.6 114.9 105.4 113.0 119.5 122.1
1· 1992: Jan 119.7 119.7 122.8 116.6 123.3 113.2 145.7 110.0 105.4 112.4 119.8 123.3
Feb 121.8 123.8 126.1 121.5 123.9 113.2 146.2 109.3 105.9 113.2 122.0 125.0 Mar 122.5 123.0 126.9 119.1 126.4 114.4 157.1 110.5 . 108.5 114.7 121.8 124.3 Apr 124.0 124.4 127.9 120.9 128.0 115.6 160.8 118.8 107.3 114.4 122.1 125.4
1, May 124.0 122.7 128.5 117.0 129.1 115.7 161.2 120.5 107.2 114.9 124.9 127.0 Jun 125.3 124.7 129.2 120.3 130.6 116.0 161.5 120.2 107.4 115.3 125.1 127.7 Jui 125.5 124.5 130.2 118.8 131.7 116.4 161.7 118.2 106.9 115.2 125.5 129.5
I' Aug 125.6 124.1 131.0 117.3 132.7 116.4 161.8 117.8 106.4 115.8 125.9 129.8 Sep 128.3 127.2 131.8 122.6 136.3 116.4 161.8 118.1 107.1 116.2 126.4 135.6
1· Oct 128.4 125.6 132.3 118.9 138.1 116.1 164.2 118.9 107.3 120.0 126.7 136.1 Nov 128.5 124.5 132.6 116.6 139.2 116.6 166.6 123.9 107.4 120.1 126.8 136.1
I: 1·
Dec 129.3 124.9 133.0 116.8 141.3 118.1 166.6 125.1 107.7 120.0 126.9 136.6
I Hong Ko11g Monthly Digest of Statistics January 1993 93
.11 I
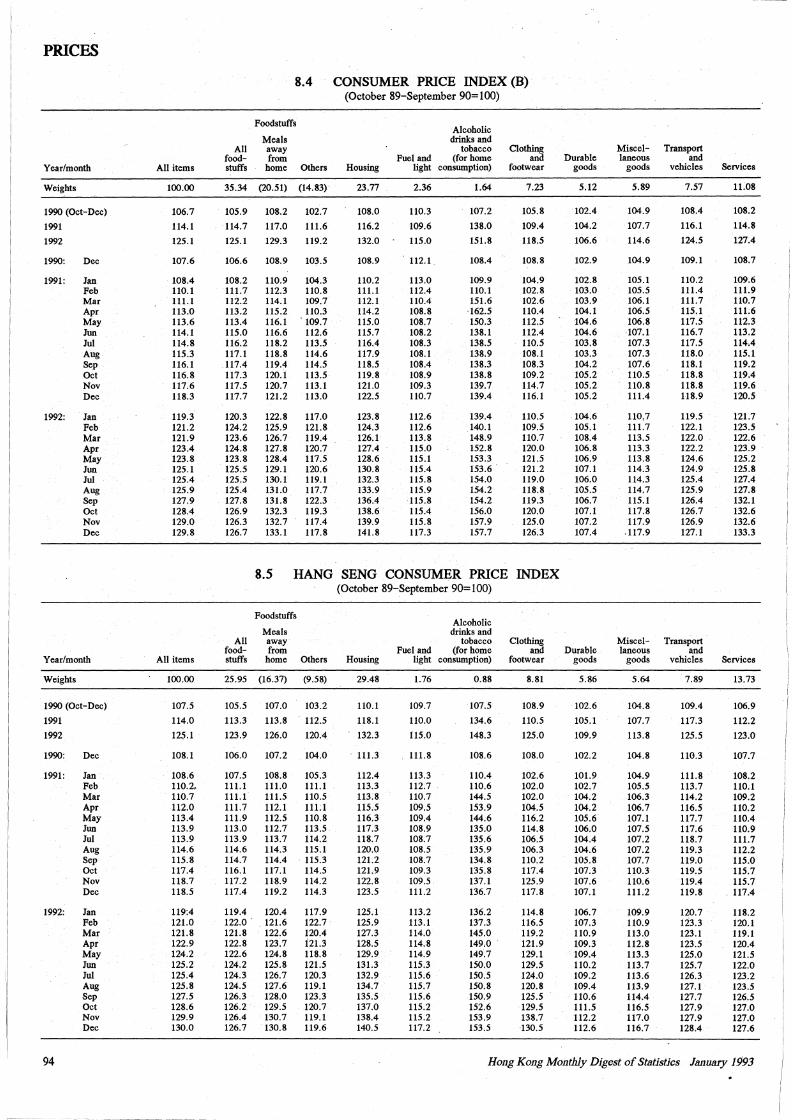
PRICES
8.4 CONSUMER PRICE INDEX (B) (October 89-September 90= 100)
Foodstuffs Alcoholic
Meals drinks and All away tobacco Clothing Miscel- Transport
food- from Fuel and (for home and Durable laneous and Year/month All items stuffs home Others Housing light consumption) footwear goods goods vehicles Services
Weights 100.00 35.34 (20.51) (14.83) 23.77 2.36 1.64 7.23 5.12 5.89 7.57 11.08
1990 (Oct-Dec) 106.7 105.9 108.2 102.7 108.0 110.3 107.2 105.8 102.4 104.9 108.4 108.2
1991 114.1 114.7 117.0 111.6 116.2 109.6 138.0 109.4 104.2 107.7 116.1 114.8
1992 125.1 125.l 129.3 119.2 132.0 115.0 151.8 118.5 106.6 114.6 124.5 127.4
1990: Dec 107.6 106.6 108.9 103.5 108.9 112.1 108.4 108.8 102.9 104.9 109.l 108.7
1991: Jan 108.4 108.2 110.9 104.3 110.2 113.0 109.9 104.9 102.8 105.1 110.2 109.6 Feb 110.1 111.7 112.3 110.8 111.1 112.4 110.l 102.8 103.0 105.5 111.4 111.9 Mar 111.1 112.2 114.l 109.7 112.l 110.4 151.6 102.6 103.9 106.l 111.7 110.7 Apr 113.0 113.2 115.2 110.3 114.2 108.8 ·162.5 110.4 104.1 106.5 115.l 111.6 May 113.6 113.4 116.1 . 109.7 115.0 108.7 150.3 112.5 104.6 106.8 117.5 112.3 Jun 114.1 115.0 116.6 112.6 115.7 108.2 138. l 112.4 104.6 107.1 116.7 113.2 Jui 114.8 116.2 118.2 113.5 116.4 108.3 138.5 110.5 103.8 107.3 117.5 114.4 Aug 115.3 117.l 118.8 114.6 117.9 108.1 138.9 108.l 103.3 107.3 118.0 115.1 Sep 116.1 117.4 119.4 114.5 118.5 108.4 138.3 108.3 104.2 107.6 118.l 119.2 Oct 116.8 117.3 120.1 113.5 119.8 108.9 138.8 109.2 105.2 110.5 118.8 119.4 Nov 117.6 117.5 120.7 113.l 121.0 109.3 139.7 114.7 105.2 110.8 118.8 119.6 Dec 118.3 117.7 121.2 113.0 122.5 110.7 139.4 116.l 105.2 111.4 118.9 120.5
1992: Jan 119.3 120.3 122.8 117.0 123.8 112.6 139.4 110.5 104.6 110,7 119.5 121.7 Feb 121.2 124.2 125.9 121.8 124.3 112.6 140.1 109.5 105.l 111.7 122.1 123.5 Mar 121.9 123.6 126.7 119.4 126.l 113.8 148.9 110.7 108.4 113.5 122.0 122.6 Apr 123.4 124.8 127.8 120.7 127.4 115.0 152.8 120.0 106.8 113.3 122.2 123.9 May 123.8 123.8 128.4 117.5 128.6 115.l 153.3 121.5 106.9 113.8 124.6 125.2 Jun 125.l 125.5 129.l 120.6 130.8 115.4 153.6. 121.2 107.1 114.3 124.9 125.8 Jui 125.4 125.5 130.1 119.l 132.3 115.8 154.0 119.0 106.0 114.3 125.4 127.4 Aug 125.9 125.4 131.0 117.7 133.9 115.9 154.2 118.8 105.5 114.7 125.9 127.8 Sep 127.9 127.8 131.8 122.3 136.4 115.8 154.2 119.3 106.7 115.1 126.4 132.1 Oct 128.4 126.9 132.3 119.3 138.6 115.4 156.0 120.0 107.1 117.8 126.7 132.6 Nov 129.0 126.3 132.7 117.4 139.9 115.8 157.9 125.0 107.2 117.9 126.9 132.6 Dec 129.8 126.7 133.l 117.8 141.8 117.3 157.7 126.3 107.4 .117.9 127.l 133.3
8.5 HANG SENG CONSUMER PRICE INDEX (October 89-September 90=100)
Foodstuffs Alcoholic
Meals drinks and All away tobacco Clothing Miscel- Transport
food- from Fuel and (for home and Durable laneous and Year/month All items stuffs home Others Housing light consumption) footwear goods goods vehicles Services
Weights 100.00 25.95 (16.37) (9.58) 29.48 1.76 0.88 8.81 5.86 5.64 7.89 13.73
1990 (Oct-Dec) 107.5 105.5 107.0 103.2 110.l 109.7 107.5 108.9 102.6 104.8 109.4 106.9
1991 114.0 113.3 113.8 112.5 118.l 110.0 134.6 110.5 105.l 107.7 117.3 112.2
1992 125.l 123.9 126.0 120.4 132.3 115.0 148.3 125.0 109.9 113.8 125.5 123.0
1990: Dec 108.l 106.0 107.2 104.0 111.3 111.8 108.6 108.0 102.2 104.8 110.3 107.7
1991: Jan 108.6 107.5 108.8 105.3 112.4 113.3 110.4 102.6 101.9 104.9 111.8 108.2 Feb 110.2. 111.l 111.0 111.l 113.3 112.7 110.6 102.0 102.7 105.5 113.7 110.1 Mar 110.7 111.1 111.5 110.5 113.8 110.7 144.5 102.0 104.2 106.3 114.2 109.2 Apr 112.0 111.7 112.1 llLl 115.5 109.5 153.9 104.5 104.2 106.7 116.5 110.2 May 113.4 111.9 112.5 110.8 116.3 109.4 144.6 116.2 105.6 107.1 117.7 110.4 Jun 113.9 113.0 112.7 113.5 117.3 108.9 135.0 114.8 106.0 107.5 117.6 110.9 Jui 113.9 113.9 113.7 114.2 118.7 108.7 135.6 106.5 104.4 107.2 118.7 111.7 Aug 114.6 114.6 114.3 115.1 120.0 108.5 135.9 106.3 104.6 107.2 119.3 112.2 Sep 115.8 114.7 114.4 115.3 121.2 108.7 134.8 110.2 105.8 107.7 119.0 115.0 Oct 117.4 116.l 117.1 114.5 121.9 109.3 135.8 117.4 107.3 110.3 119.5 115.7 Nov 118.7 117.2 118.9 114.2 122.8 109.5 137.1 125.9 107.6 110.6 119.4 115.7 Dec 118.5 117.4 119.2 114.3 123.5 111.2 136.7 117.8 107.1 111.2 119.8 117.4
1992: Jan 119:4 119.4 120.4 117.9 125.1 113.2 136.2 114.8 106.7 109.9 120.7 118.2 Feb 121.0 122.0. 121.6 122.7 125.9 113.1 137.3 116.5 107.3 110.9 123.3 120.1 Mar 121.8 121.8 122.6 120.4 127.3 114.0 145.0 119.2 110.9 113.0 123.1 119.1 Apr 122.9 122.8 123.7 i21.3 128.5 114.8 149.0 121.9 109.3 112.8 123.5 120.4 May 124.2 122.6 124.8 118.8 129.9 114.9 149.7 129.l 109.4 113.3 125.0 121.5 Jun 125.2 124.2 125.8 121.5 131.3 115.3 150.0 129.5 110.2 113.7 125.7 122.0 Jui 125.4 124.3 126.7 120.3 132.9 115.6 150.5 124.0 109.2 113.6 126.3 123.2 Aug 125.8 124.5 127.6 119.l 134.7 115.7 150.8 120.8 109.4 113.9 127.l 123.5 Sep 127.5 126.3 128.0 123.3 135.5 115.6 150.9 125.5 110.6 114.4 127.7 126.5 Oct 128.6 126.2 129.5 120.7 137.0 115.2 152.6 129.5 111.5 116.5 127.9 127.0 Nov 129.9 126.4 130.7 119.1 138.4 115.2 153.9 138.7 112.2 117.0 127.9 127.0 Dec 130.0 126.7 130.8 119.6 140.5 117.2 153.5 130.5 112.6 116.7 128.4 127.6
94 Hong Kong Monthly Digest of Statistics Jmwary 1993
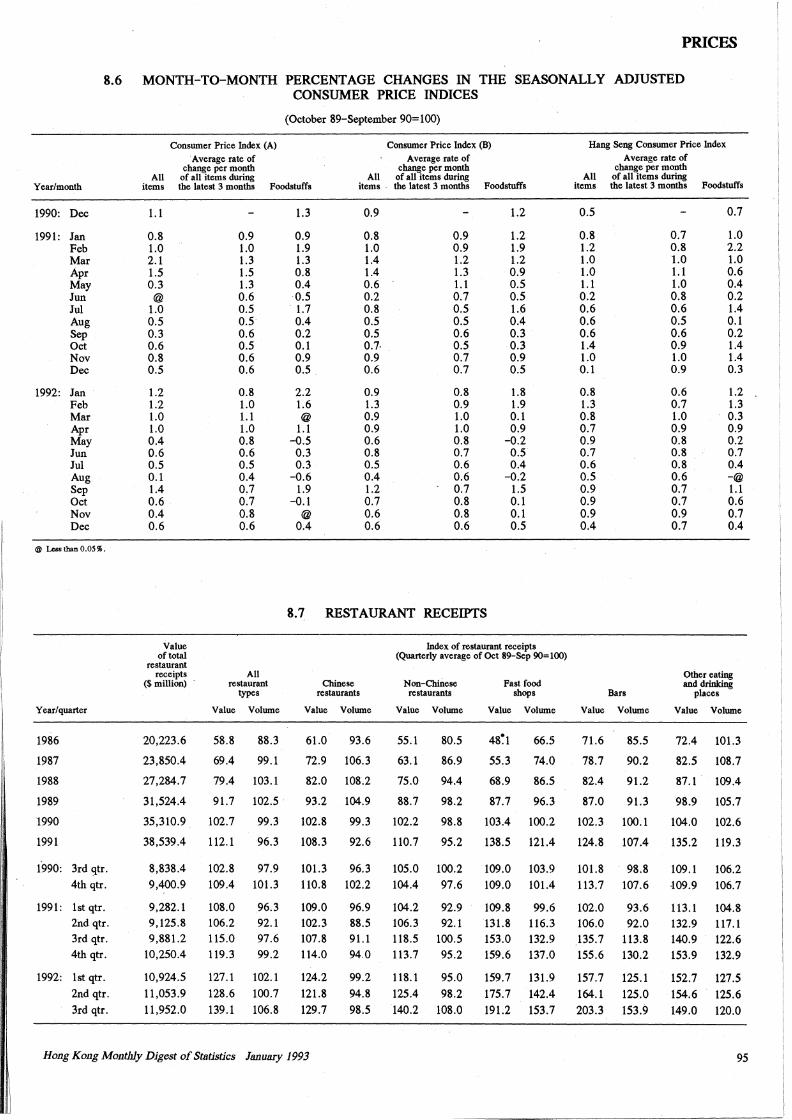
[,
I
I
[,
[,
1' I
omi__ - - -- - --- -- ---- -- - ---- -- -
PRICES
8.6 MONTH-TO-MONTH PERCENTAGE CHANGES IN THE SEASONALLY ADJUSTED
Year/month
1990: Dec
1991: Jan Feb Mar Apr May Jun Jul Aug Sep Oct Nov Dec
1992: Jan Feb Mar Apr May Jun Jul Aug Sep Oct Nov Dec
@ Lcssthan0.05%.
Year/quarter
1986
1987
1988
1989
1990
1991
1990: 3rd qtr. 4tb qtr.
1991: lstqtr. 2nd qtr. 3rd qtr. 4tb qtr.
1992: lstqtr.
2nd qtr.
3rd qtr.
Conswner Price Index (A) Average rate of
change per month All of all items during
CONSUMER PRICE INDICES
(October 89-September 90=100)
Conswner Price Index (B)
Average rate of change per month
All of all items during items the latest 3 months Foodstuffs items the latest 3 months Foodstuffs
1.1
0.8 1.0 2.1 1.5 0.3
@ 1.0 0.5 0.3 0.6 0.8 0.5
1.2 1.2 1.0 1.0 0.4 0.6 0.5 0.1 1.4 0.6 0.4 0.6
Value of total
restaurant receipts
($ million) ·
20,223.6
23,850.4
27,284.7
31,524.4
35,310.9
38,539.4
8,838.4 9,400.9
9,282.1 9,125.8 9,881.2
10,250.4
10,924.5
11,053.9
11,952.0
0.9 1.0 1.3 1.5 1.3 0.6 0.5 0.5 0.6 0.5 0.6 0.6
0.8 1.0 1.1 1.0 0.8 0.6 0.5 0.4 0.7 0.7 0.8 0.6
All restaurant
types
Value Volwne
58.8
69.4
79.4
91.7
102.7
112. l
102.8 109.4
108.0 106.2 115.0 119.3
127.l
128.6
139. l
88.3
99.l
103.l
102.5
99.3
96.3
97.9
101.3
96.3 92.1 97.6 99.2
102.l
100.7
106.8
1.3
0.9 1.9 1.3 0.8 0.4 0.5
. 1.7 0.4 0.2 0.1 0.9 0.5
2.2 1.6 @
1.1 -0.5 0.3 0.3
-0.6 1.9
-0.l @
0.4
0.9
0.8 1.0 1.4 1.4 0.6 0.2 0.8 0.5 0.5 0.7-0.9 0.6
0.9 1.3 0.9 0.9 0.6 0.8 0.5 0.4 1.2 0.7 0.6 0.6
0.9 0.9 1.2 1.3 1.1 0.7 0.5 0.5 0.6 0.5 0.7 0.7
0.8 0.9 1.0 1.0 0.8 0.7 0.6 0.6 0.7 0.8 0.8 0.6
1.2
1.2 1.9 1.2 0.9 0.5 0.5 1.6 0.4 0.3 0.3 0.9 0.5
1.8 1.9 0.1 0.9
-0.2 0.5 0.4
-0.2 1.5 0.1 0.1 0.5
8.7 RESTAURANT RECEIPTS
Chinese restaurants
Value Volwne
61.0 93.6
72.9 106.3
82.0
93.2
102.8
108.3
101.3 110.8
109.0 102.3 107.8 114.0
124.2
121.8
129.7
108.2
104.9
99.3
92.6
96.3 102.2
96.9 88.5 91.1 94.0
99.2 94.8
98.5
Index of restaurant receipts (Quarterly average of Oct 89-Sep 90=100)
Non-Chillese restaurants
Value Volwne
55.1
63. l
75.0
88.7
102.2
110.7
105.0 104.4
104.2 106.3 118.5 113.7
118.1 125.4
140.2
80.5
86.9
94.4
98.2
98.8
95.2
100.2 97.6
92.9 92.1
100.5 95.2
95.0
98.2
108.0
Fast food shops
Value Volwne
48:1
55.3
68.9
87.7
103.4
138.5
109.0 109.0
109.8 131.8 153.0 159.6
159.7
175.7
191.2
66.S
74.0
86.5
96.3
100.2
121.4
103.9 101.4
99.6 116.3 132.9 137.0
131.9
142.4
153.7
Hong Ko11g Monthly Digest of Statistics January 1993
Hang Seng Conswner Price Index
Average rate of change per month
All of all items during items the latest 3 months Foodstuffs
0.5
0.8 1.2 1.0 1.0 1.1 0.2 0.6 0.6 0.6 1.4 1.0 0.1
0.8 1.3 0.8 0.7 0.9 0.7 0.6 0.5 0.9 0.9 0.9 0.4
Bars
Value Volwne
71.6
78.7
82.4
87.0
102.3
124.8
101.8
113.7
102.0 106.0 _135.7 155.6
157.7
164.l
203.3
85.5
90.2
91.2
91.3
100.l
107.4
98.8
107.6
93.6 92.0
113.8 130.2
125.l
125.0
153.9
0.7 0.8 1.0 1.1 1.0 0.8 0.6 0.5 0.6 0.9 1.0 0.9
0.6 0.7 1.0 0.9 0.8 0.8 0.8 0.6 0.7 0.7 0.9 0.7
0.7
1.0 2.2 1.0 0.6 0.4 0.2 1.4 0.1 0.2 1.4 1.4 0.3
1.2 1.3 0.3 0.9 0.2 0.7 0.4 -@ 1.1 0.6 0.7 0.4
Other eating and drinking
places
Value Volwne
72.4 101.3
82.5 108.7
87.l
98.9
104.0
135.2
109.1 109.9
113.l 132.9 140.9 153.9
109.4
105.7
102.6
119.3
106.2 106.7
104.8 117.1 122.6 132.9
152.7 127.5
154.6 125.6
149.0 120.0
95
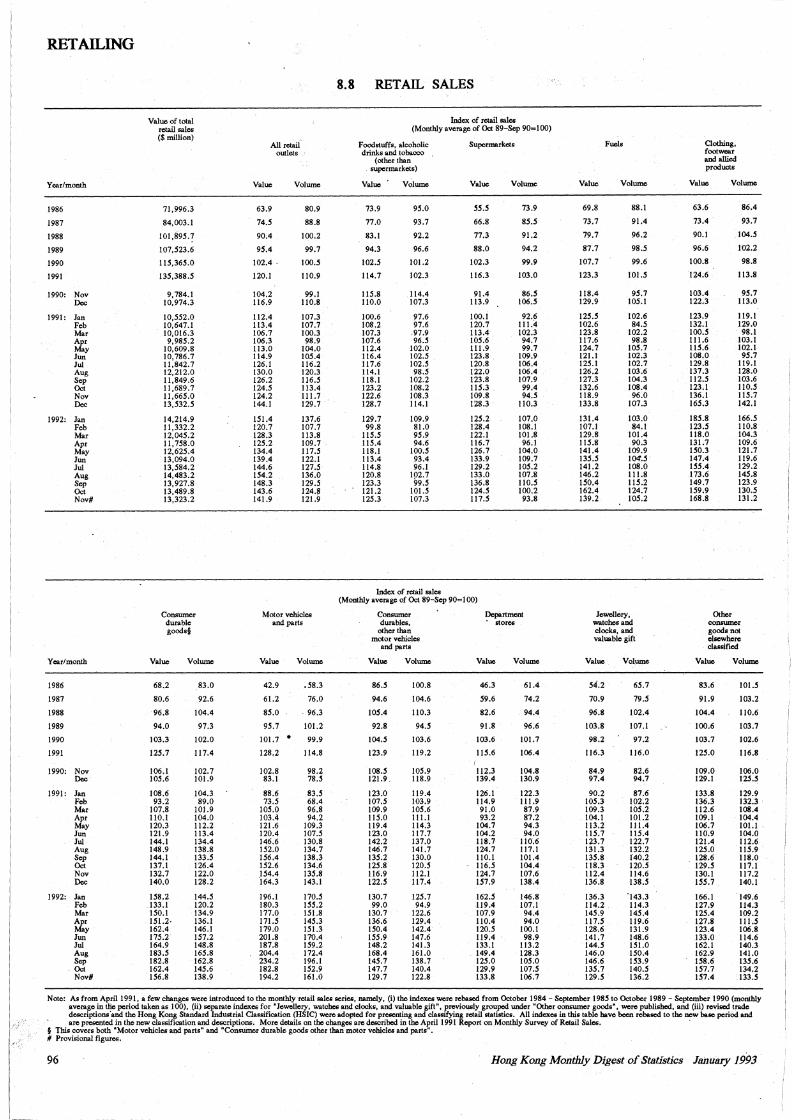
----
RETAILING
8.8 RETAIL SALES
Value of total Index of retail sales retail sales (Monthly average of Oct 89-Sep 90=100) ($million)
Fuels Clothing, All retail Foodstuffs, alcoholic Supermarkets outlets drinks and tobacco footwear
(otherthan and allied supermarkets) products
Year/month Value Volume Value Volume Value Volume Value Volume Value Volume
1986 71,996.3 63.9 80.9 73.9 95.0 55.5 73.9 69.8 88.1 63.6 86.4
1987 84,003.1 74.5 88.8 77.0 93.7 66.8 85.5 73.7 91.4 73.4 93.7
1988 101,895.7 90.4 100.2 83.1 92.2 77.3 91.2 79.7 96.2 90.1 104.5
1989 107,523.6 95.4 99.7 94.3 96.6 88.0 94.2 87.7 98.5 96.6 102.2
1990 115,365.0 102.4. 100.5 102.5 101.2 102.3 99.9 107.7 99.6 100.8 98.8
1991 135,388.5 120.1 110.9 114.7 102.3 116.3 103.0 123.3 101.5 124.6 113.8
1990: Nov 9,784.l 104.2 99.1 115.8 114.4 91.4 86.5 118.4 95.7 103.4 95.7 Dec 10,974.3 116.9 110.8 110.0 107.3 113.9 106.5 129.9 105.1 122.3 113.0
1991: Jan 10,552.0 112.4 107.3 100.6 97.6 100.1 92.6 125.5 102.6 123.9 119.1 Feb 10,647.1 113.4 107.7 108.2 97.6 120.7 111.4 102.6 84.5 132.1 129.0 Mar 10,016.3 106.7 100.3 107.3 .97.9 113.4 102.3 123.8 102.2 100.5 98.1 Apr 9,985.2 106.3 98.9 107.6 96.5 105.6 94.7 117.6 98.8 111.6 103.1 May 10,609.8 113.0 104.0 112.4 102.0 111.9 99.7 124.7 105.7 115.6 102.1 Jun 10,786.7 114.9 105.4 116.4 102.5 123.8 109.9 121.1 102.3 108.0 95.7 Jui 11,842.7 126.1 116.2 117.6 102.5 120.8 106.4 125.l 102.7 129.8 119.l Aug 12,212.0 130.0 120.3 114.1 98.5 122.0 106.4 126.2 103.6 137.3 128.0 Sep 11,849.6 126.2 116.5 118.1 102.2 123.8 107.9 127.3 104.3 112.5 103.6 Oct 11,689.7 124.5 113.4 123.2 108.2 115.3 99.4 132.6 108.4 123.1 110.5 Nov 11,665.0 124.2 111.7 122.6 108.3 109.8 94.5 118.9 96.0 136.1 115.7 Dec 13,532.5 144.l 129.7 128.7 114.1 128.3 110.3 133.8 107.3 165.3 142.1
1992: Jan 14,214.9 151.4 137.6 129.7 109.9 125.2 107.0 131.4 103.0 185.8 166.5 Feb 11,332.2 120.7 107.7 99.8 81.0 128.4 108.1 107.1 84.l 123.5 110.8 Mar 12,045.2 128.3 113.8 115.5 95.9 122.l 101.8 129.8 101.4 118.0 104.3 Apr 11,758.0 125.2 109.7 115.4 94.6 116.7 96.l 115.8 90.3 131.7 109.6 May 12,625.4 134.4 117.5 118.1 100.5 126.7 104.0 141.4 109.9 150.3 121.7 Jun 13,094.0 139.4 122.1 113.4 93.4 133.9 109.7 135.5 104'.5 147.4 119.6 Jui 13,584.2 144.6 127.5 114.8 96.1 129.2 105.2 141.2 108.0 155.4 129.2 Aug 14,483.2 154.2 136.0 120.8 102.7 133.0 107.8 146.2 111.8 173.6 145.8 Sep 13,927.8 148.3 129.5 123.3 99.5 136.8 110.5 150.4 115.2 149.7 123.9 Oct 13,489.8 143.6 124.8 121.2 101.5 124.5 100.2 162.4 124.7 159.9 130.5 Nov# 13,323.2 141.9 121.9 125.3 107.3 117.5 93.8 139.2 105.2 168.8 131.2
Index of retail sales (Monthly average of Oct 89-Sep 90=100)
Consumer Motor vehicles Consumer ~partment Jewellery, Other durable and parts durables, stores watches and consumer goods§ other than clocks, and goods not
motor vehicles valuable gift elsewhere and parts classified
Year/month Value Volume Value Volume Value Volume Value Volume Value Volume Value Volume
1986 68.2 83.0 42.9 .58.3 86.5 100.8 46.3 61.4 54.2 65.7 83.6 101.5
1987 80.6 92.6 61.2 76.0 94.6 104.6 59.6 74.2 70.9 79.5 91.9 103.2
1988 96.8 104.4 85.0 . 96.3 105.4 110.3 82.6 94.4 96.8 102.4 104.4 110.6
1989 94.0 97.3 95.7 101.2 92.8 94.5 91.8 96.6 103.8 107.1 100.6 103.7
1990 103.3 102.0 101.7 . 99.9 104.5 103.6 103.6 101.7 98.2 97.2 103.7 102.6
1991 125.7 117.4 128.2 114.8 123.9 119.2 115.6 106.4 116.3 116.0 125.0 116.8
1990: Nov 106.1 102.7 102.8 98.2 108.5 105.9 112.3 104.8 84.9 82.6 109.0 106.0 Dec 105.6 101.9 83.1 78.5 121.9. 118.9 139.4 130.9 97.4 94.7 129.1 125.5
1991: Jan 108.6 104.3 88.6 83.5 123.0 119.4 126.1 122.3 90.2 87.6 133.8 129.9 Feb 93.2 89.0 73.5 68.4 107.5 103.9 114.9 111.9 105.3 102.2 136.3 132.3 Mar 107.8 101.9 105.0 96.8 109.9 105.6 91.0 87.9 109.3 105.2 112.6 108.4 Apr 110.1 104.0 103.4 94.2 115.0 111.1 93.2 87.2 104.1 101.2 109.1 104.4 May 120.3 112.2 121.6 109.3 119.4 114.3 104.7 94.3 113.2 111.4 106.7 101.1 Jun 121.9 113.4 120.4 107.5 123.0 117.7 104.2 94.0 115.7 115.4 110.9 104.0 Jui 144.1 134.4 146.6 130.8 142.2 137.0 118.7 110.6 123.7 122.7 121.4 112.6 Aug 148.9 138.8 152.0 134.7 146.7 141.7 124.7 117.1 131.3 132.2 125.0 115.9 Sep 144.1 133.5 156.4 138.3 135.2 130.0 110.1 101.4 135.8 140.2 128.6 118.0 Oct 137.1 126.4 152.6 134.6 125.8 120.5 116.5 104.4 118.3 120.5 129.5 117.l Nov 132.7 122.0 154.4 135.8 116.9 112.1 124.7 107.6 112.4 114.6 130.1 117.2 Dec 140.0 128.2 164.3 143.1 122.5 117.4 157.9 138.4 136.8 138.5 155.7 140.1
1992: Jan 158.2 144.5 196.1 170.5 130.7 125.7 162.5 146.8 136.3 0 143.3 166.1 149.6 Feb 133.1 120.2 180.3 155.2 99.0 94.9 119.4 107.1 114.2 114.3 127.9 114.3 Mar 150.1 134.9 177.0 151.8 130.7 122.6 107.9 94.4 145.9 145.4 125.4 109.2 Apr 151.2· 136.1 171.5 145.3 136.6 129.4 110.4 94.0 117.5 119.6 127.8 111.5 May 162.4 146.l 179.0 151.3 150.4 142.4 120.5 100.1 128.6 131.9 123.4 106.8 Jun 175.2 157.2 201.8 170.4 155.9 147.6 119.4 98.9 141.7 148.6 133.0 114.6 Jui 164.9 148.8 187.8 159.2 148.2 141.3 133.l 113.2 144.5 151.0 162.1 140.3 Aug 183.5 165.8 204.4 172.4 168.4 161.0 149.4 128.3 146.0 150.4 162.9 141.0 Sep 182.8 162.8 234.2 196.l 145.7 138.7 125.0 105.0 146.6 153.9 158.6 135.6
. Oct 162.4 145.6 182.8 152.9 147.7 140.4 129.9 107.5 135.7 140.5 157.7 134.2 Nov# 156.8 138.9 194.2 161.0 129.7 122.8 133.8 106.7 129.5 136.2 157.4 133.5
Note: As from April 1991, a few changes were introduced to the monthly retail sales series, namely, (i) the indexes were rebased from October 1984 - September 1985 to October 1989 - September 1990 (monthly average in tlie period taken as 100), (ii) separate indexes for "Jewellery, watches and clocks, and valuable gift", previously grouped under "Other consumer goods", were published, and (iii) revised trade descriptions ·and the Hong Kong Standard Industrial Classification (HSIC) were adopted for presenting and classifying retail statistics. All indexes in this table have been rebascd to the new base periOd and are presented in the new classification and descriptions. More details on the changes are described in the April 1991 Report on Monthly Survey of Retail Sales. ·
§ This covers both "Motor vehicles and parts 11 and "Consuiner durable goods other than motor vehicles and parts". # Provisional figures.
96 Hong Kong Monthly Digest of Statistics January 1993
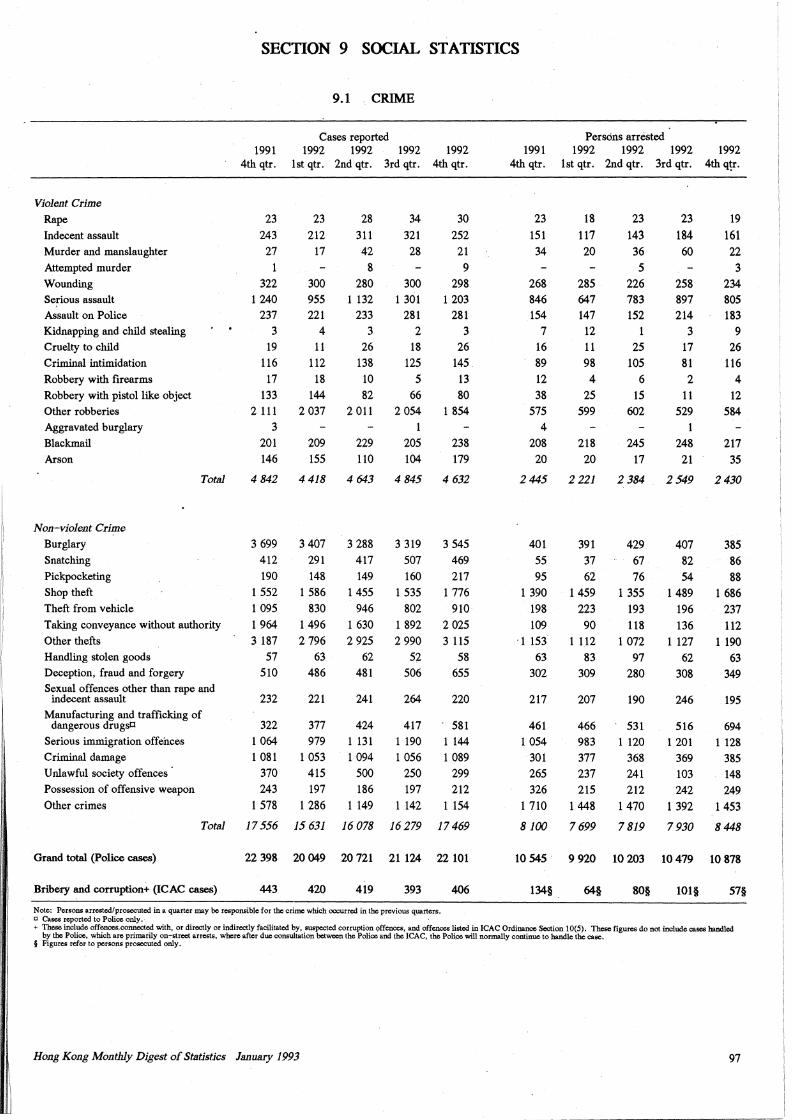
SECTION 9 SOCIAL STATISTICS
Violent Crime Rape
Indecent assault
Murder and manslaughter
J\ttenipted niurder
Wounding
Serious assault
Assault on Police
Kidnapping and child stealing
Cruelty to child
C riniinal intiniidation
Robbery with firearnis
Robbery with pistol like object
Other robberies
Aggravated burglary
Blacktnail
Arson
Non-violent Crime
Burglary
Snatching
Pickpocketing
Shop theft
Theft froni vehicle
To till
Taking conveyance without authority
Other thefts
Handling stolen goods
Deception, fraud and forgery
Sexual offences other than rape and indecent assault
Manufacturing and trafficking of dangerous drugsC
Serious i=igration offences
Criniinal daniage
Unlawful society offences
Possession of offensive weapon
Other crinies
Grand total (Police cases)
Total
Bribery and corruption+ (ICAC cases)
1991 4th qtr.
23
243
27
322
l 240
237
3 19
116
17
133
2 111
3 201
146
4842
3 699
412 190
l SS2
l 09S
1 964
3 187 S7
SlO
232
322
l 064
l 081
370
243
1 S78
17556
22 398
443
9.1 CRIME
Cases reported 1992 1992 1992 1992
lst qtr. 2nd qtr. 3rd qtr. 4th qtr.
23
212
17
300
9SS
221
4 11
112
18
144
2 037
209
lSS
4 418
3 407
291
148
1 S86
830
1496
2 796
63
486
221
377 979
l OS3 41S
197
1 286
15 631
20049
420
28
311
42
8
280
1 132
233
3 26
138
10
82
2 011
229
110
4 Q4.3
3 288
417
149
1 4SS
946
l 630
2 92S
62 481
241
424
1 131
1 094
SOO 186
1 149
16 078
20 721
419
34
321
28
300
l 301
281
2
18
12S
s 66
2 OS4
20S
104
4845
3 319
S07
160
1 S3S
802
1 892
2 990
S2
S06
264
417
l 190
1 OS6 2SO 197
1 142
16279
21 124
393
30
2S2
21
9
298
l 203
281
3 26
14S
13
80
l 8S4
238
179
4 632
3 S4S
469
217
l 776
910
2 02S
3 llS S8
6SS
220
S81 1 144
l 089
299
212
1 1S4
17469
22 101
406
Note: Persons arrested/prosecuted in a quarter may be responsible for the crime which occurred in the previous quarters. a Cases reported to Police only.
1991 4th qtr.
23
lSl
34
268
846
1S4
7 16
89
12
38
S7S
4 208
20
2445
401
SS 9S
1 390
198
109
· 1 1S3
63
302
217
461
1 OS4 301
26S
326
1 710
8100
1054S
134§.
Persons arrested 1992 1992 1992 1992
lst qtr. 2nd qtr. 3rd qtr. 4th q~.
18
117 20
28S
647
147
12
11
98
4 2S
S99
218
20
2221
391
37
62 14S9
223
90
1 112
83
309
207
466
983
377
237
21S
1448
7699
9 920
64§
23
143
36
s 226
783
1S2
2S
lOS 6
lS
602
24S
17
2 384
429
67
76
1 3SS
193
118 1 072
97
280
190
S31
1 120
368
241
212
1470
7 819
10203
80§
23
184 60
2S8
897
214
3 17
81 2
11
S29
248
21
2549
407
82
S4 1489
196
136
1 127
62 308
246
Sl6
l 201
369
103
242
1 392
7930
10479
101§
19
161 22
3
234
80S
183
9
26
116 4
12
S84
217
3S
2430
38S
86 88
1 686
237
112 1 190
63
349
19S
694
1 128
38S
148
249
14S3
8448
10 878
S7§
+ These include offences.connected with, or directly or indirectly facilitated by, suspected corruption offences, and offences listed in ICAC Ordinance Section 10(5). These figures do not include cases handled by the Police, which are primarily on-street arrests, where after due consultation between the Police and the ICAC, the Police will normally continue to handle the case.
§ Figures refer to persons prosecuted only.
Hong Kong Montlily Digest of Statistics January 1993 97
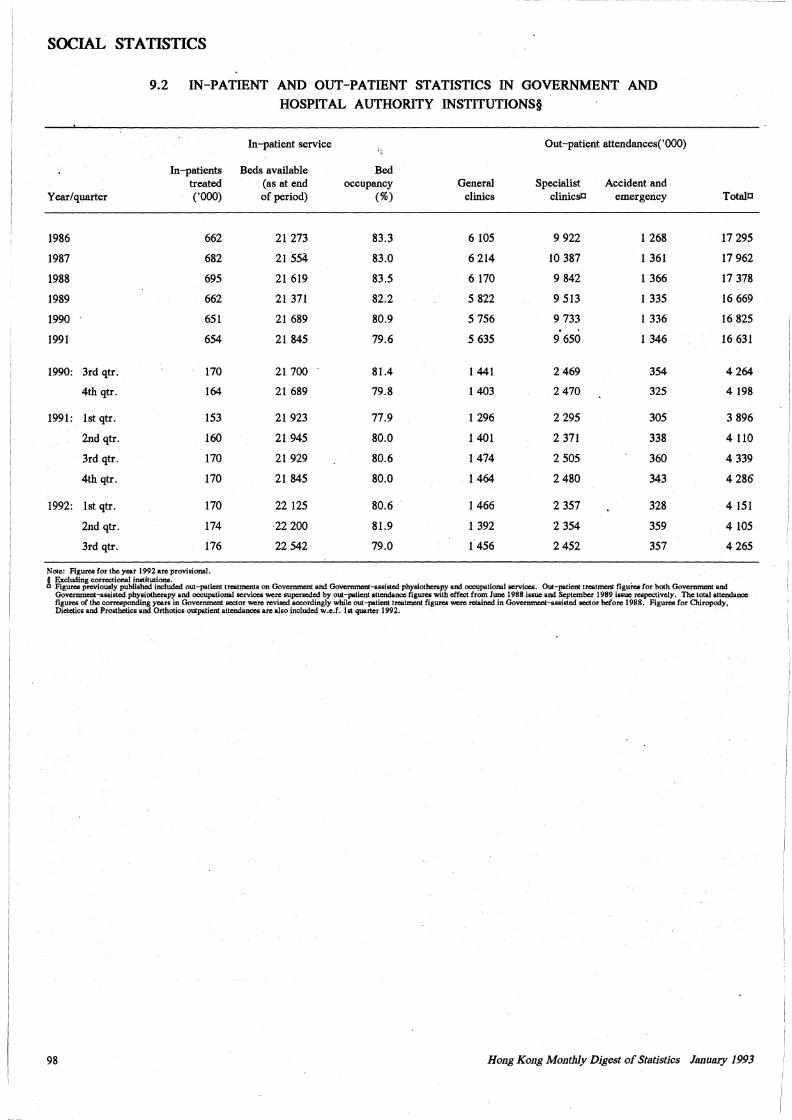
SOCIAL STATISTICS
9.2 IN-PATIENT AND OUT-PATIENT STATISTICS IN GOVERNMENT AND HOSPITAL AUTHORITY INSTITUTIONS§
In-patient service Out-patient attendances('OOO)
In-patients Beds available Bed treated (as at end occupancy General Specialist Accident and
Year/quarter ('OOO) of period) (%) clinics clinicsl'.l emergency Totala
1986 662 21 273 83.3 6 105 9 922 1 268 17 295
1987 682 21 554 83.0 6 214 10 387 l 361 17 962
1988 695 21 619 83.5 6 170 9 842 1 366 17 378
1989 662 21 371 82.2 5 822 9 513 l 335 16 669
1990 651 21 689 80.9 5 756 9 733 1 336 16 825
1991 654 21 845 79.6 5 635 9 650 1 346 16 631
1990: 3rd qtr. 170 21 700 81.4 l 441 2469 354 4 264
4th qtr. 164 21 689 79.8 1403 2 470 325 4 198
1991: lst qtr. 153 21 923 77.9 1 296 2 295 305 3 896
2nd qtr. 160 21 945 80.0 l 401 2 371 338 4 110
3rd qtr. 170 21929 80.6 1474 2505 360 4 339
4th qtr. 170 21 845 80.0 1 464 2 480 343 4 286
1992: lst qtr. 170 22 125 80.6 1466 2 357 328 4 151
2nd qtr. 174 22 200 81.9 l 392 2 354 359 4 105
3rd qtr. 176 22542 79.0 1456 2452 357 4 265
Note: Figures for the year 1992 arc provisional. § Excluding correctional institutions. a Figuru: previously published included out-patient treatments on Government and Government-assisted physiotherapy and ~pational scrviCC6. Out-patient treatment figufes for both Government and
Governmcnt-.assisted physiotherapy and occupational services were superseded by out-patient attendance figures with effect from June 1988 issue and September 1989 issue respectively. The total attendance figures of the corresponding years in Government sector were revised accordingly while out-patient treatment figures were retained in Government-assisted sector before 1988. Figures for Chiropody, Dietetics and Prosthetics and Orthotics outpatient attendances are also included w .e.f. 1 st quarter 1992.
98 Hong Kong Mo11thly Digest of Statistics January 1993
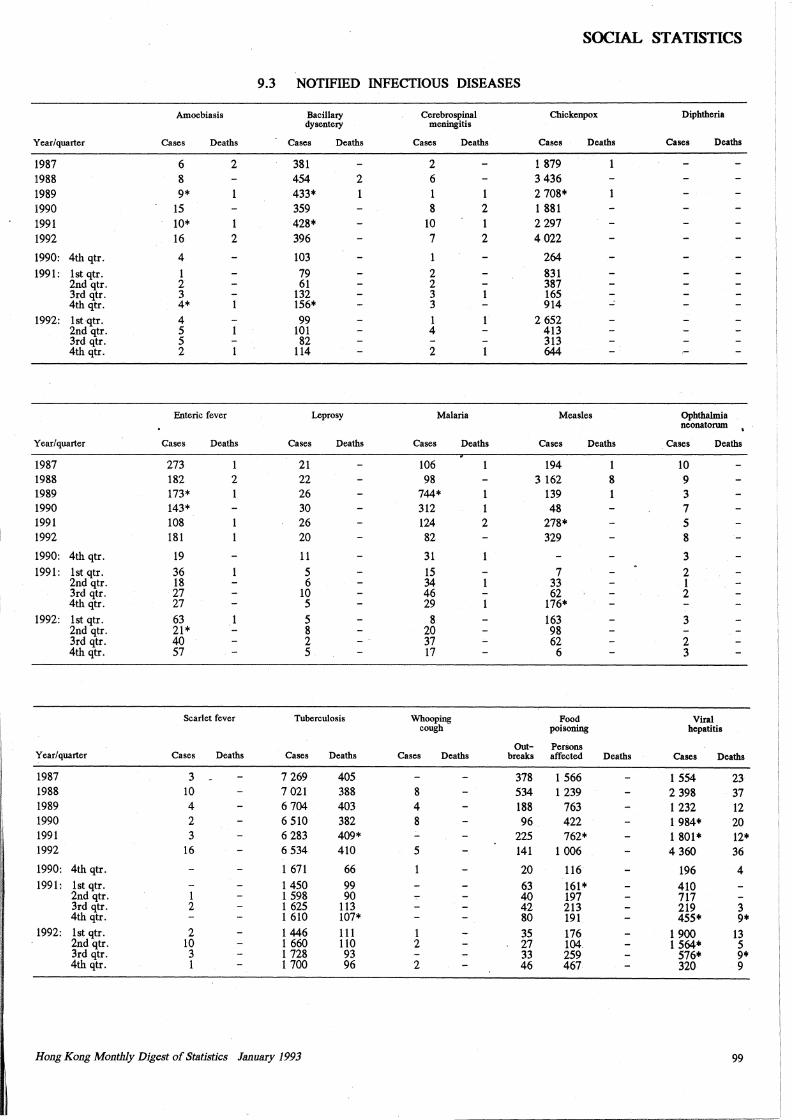
Dl'llJ[L __ -- ·---- ---- ------·----
SOCIAL STATISTICS
9.3 NOTIFIED INFECTIOUS DISEASES
Amoebiasis Bacillary Cerebrospinal Chickenpox Diphtheria dysentery meningitis
Year/quarter Cases Deaths Cases Deaths Cases Deaths Cases Deaths Cases Deaths
1987 6 2 381 2 1 879 1988 8 454 2 6 3 436 1989 9* 433* 1 1 2 708* 1990 15 359 8 2 1 881 1991 10* 1 428* 10 1 2 297 1992 16 2 396 7 2 4 022
1990: 4th qtr. 4 103 264
1991: lst qtr. 1 79 2 831 2nd qtr. 2 61 2 387 3rd qtr. 3 132 3 165 4th qtr. 4* 156* 3 914 ...:.
1992: lst qtr. 4 99 1 2 652 2nd qtr. 5 101 4 413 3rd qtr. 5 82 313 4th qtr. 2 114 2 644
Enteric fever Leprosy Malaria Measles Ophthalmia neonatorum
Year/quarter Cases Deaths Cases Deaths Cases Deaths Cases Deaths Cases Deaths
1987 273 21 106 194 1 10 1988 182 2 22 98 3 162 8 9 1989 173* 26 744* 1 139 3 1990 143* 30 312 1 48 7 1991 108 26 124 2 278* 5 1992 181 20 82 329 8
1990: 4th qtr. 19 11 31 3 1991: lst qtr. 36 5 15 7 2
2nd qtr. 18 6 34 33 1 3rd qtr. 27 10 46 62 2 4th qtr. 27 5 29 176*
1992: lst qtr. 63 5 8 163 3 2nd qtr. 21* 8 20 98 3rd qtr. 40 2 37 62 2 4th qtr. 57 5 17 6 3
Scarlet fever Tuberculosis Whooping Food Viral cough poisoning hepatitis
Out- Persons Year/quarter Cases Deaths Cases Deaths Cases Deaths breaks affected Deaths Cases Deaths
1987 3 7 269 405 378 1 566 1 554 23 1988 10 7 021 388 8 534 1 239 2 398 37 1989 4 6 704 403 4 188 763 1 232 12
I 1990 2 6 510 382 8 96 422 1 984* 20 1991 3 6 283 409* 225 762* 1 801* 12* 1992 16 6 534 410 5 141 1 006 4 360 36
1990: 4th qtr. 1 671 66 20 116 196 4 1991: lst qtr. 1450 99 63 161* 410
2nd qtr. 1 1 598 90 40 197 717 3rd qtr. 2 1 625 113 42 213 219 3 4th qtr. 1 610 107* 80 191 455* 9*
,, 1992: lst qtr. 2 1446 111 1 35 176 1900 13
I, 2nd qtr. 10 1 660 110 2 27 104. 1 564* 5 3rd qtr. 3 1 728 93 33 259 576* 9* 4th qtr. 1 1 700 96 2 46 467 320 9
Ii
[!
I Hong Kong Monthly Digest of Statistics January 1993 99
I
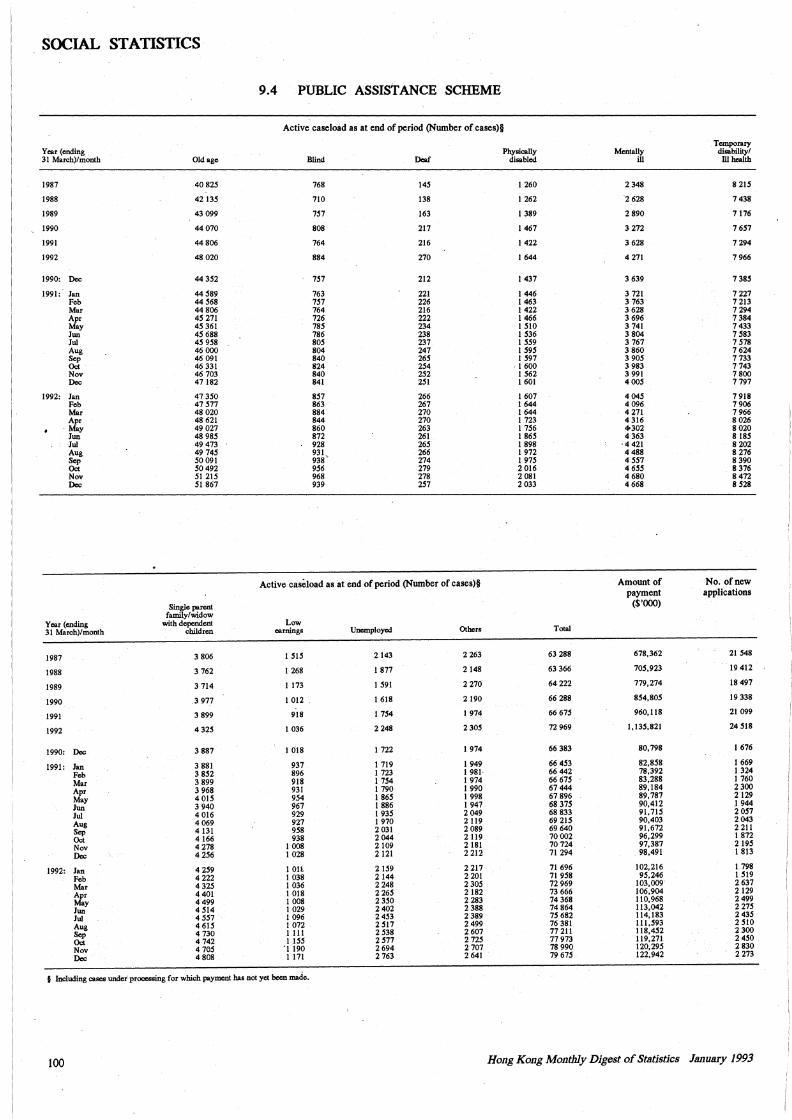
SOCIAL STATISTICS
9.4 PUBLIC ASSISTANCE SCHEME
Active caseload as at end of period (Number of cases)§
Temporary Year (ending Physically Mentally disability/ 31 March)/month Old age Blind Deaf disabled ill Ill health
1987 40 825 768 145 1260 2 348 8 215
1988 42135 710 138 I 262 2628 7438
1989 43 099 757 163 I 389 2 890 7176
1990 44070 808 217 I 467 3 272 7657
1991 44 806 764 216 1422 3 628 7294
1992 48020 884 270 1644 4271 7 966
1990: Dec 44352 757 212 I 437 3 639 7 385
1991: Jan 44 589 763 221 I 446 3 721 7 227 Feb 44 568 757 226 I 463 3 763 7 213 Mar 44 806 764 216 1422 3 628 7 294 Apr 45 271 726 222 I 466 3 696 7 384 May 45 361 785 234 1510 3 741 7 433 Jun 45 688 786 238 I 536 3 804 7 583 Jui 45 958 805 237 I 559 3 767 7 578 Aug 46 OOO 804 247 I 595 3 860 7 624 Sep 46 091 840 265 I 597 3 905 7 733 Oct 46 331 824 254 . 1600 3 983 7 743 Nov 46 703 840 252 I 562 3 991 7800 Dec 47 182 841 251 1601 4005 7 797
1992: Jan 47 350 857 266 I 607 4045 7 918 Feb 47 577 863 267 1644 4 096 7906 Mar 48020 884 270 1644 4 271 7 966 Apr 48 621 844 270 I 723 4 316 8026 May 49 027 860 263 I 756 4'302 8020 Jun 48 985 872 261 1865 4 363 8185 Jui 49 473 928 265 1898 ·4421 8 202 Aug 49 745 931. 266 I 972 4 488 8 276 Sep 50 091 938' 274 I 915 4 557 8390 Oct 50492 956 279 2 016 4 655 8 376 Nov 51 215 968 278 2 081 4 680 8 472 Dec 51 867 939 257 2 033 4 668 8 528
Active caseload as at end of period (Number of cases)§ Amount of No. of new payment applications
Single parent ($'()()()) family/widow
Year (ending with dependent Low 31 March)/month children earnings Unemployed Others Total
1987 3 806 I 515 2143 2 263 63 288 678,362 21 548
1988 3 762 I 268 1877 2148 63 366 705,923 19 412
1989 3 714 I 173 I 591 2 270 64 222 779,274 18497
1990 3 977 I 012 I 618 2 190 66 288 854,805 19 338
1991 3 899 918 I 754 1974 66675 960,118 21 099
1992 4 325 I 036 2248 2 305 72 969 1,135,821 24 518
1990: Dec 3 887 I 018 I 722 I 974 66 383 80,798 I 676
1991: Jan 3 881 937 I 719 I 949 66 453 82,858 I 669
Feb 3 852 896 I 723 1981· 66 442 78,392 1324
Mar 3 899 918 I 754 I 974 66 675 83,288 I 760
Apr 3 968 931 I 790 I 990 67444 89,184 2300
May 4015 954 I 865 I 998 67 896 89, 787 2 129
Jun 3940 967 I 886 I 947 68 375 90,412 I 944
Jui 4 016 929 I 935 2 049 68 833 91, 115 2 057
Aug 4069 927 1970 2 119 69 215 90,403 2 043
Sep 4131 958 2031 2 089 69640 91,672 2 211
Oct 4 166 938 2044 2 119 70002 96,299 I 872
Nov 4278 I 008 2109 2181 70724 97,387 2195
Dec 4 256 I 028 2121 2212 71294 98,491 I 813
1992: Jan 4 259 !OH 2159 2 217 71 696 102,216 I 798
Feb 4222 I 038 2 144 2201 71 958 95,246 I 519
Mar 4 325 I 036 2 248 2305 72969 103,009 2 637
Apr 4 401 I 018 2 265 2182 73 666 106,904 2129
May 4 499 I 008 2 350 2 283 74 368 110,968 2499
Jun 4514 I 029 2402 2 388 74 864 113,042 2 275
Jui 4 551 I 096 2453 2 389 75 682 114,183 2 435
Aug 4 615 I 072 2 517 2 499 76 381 111,593 2510
Sep 4730 1111 2538 2 607 77 211 118,452 2300
Oct 4742 I 155 2577 2 725 77 973 119,271 2450
Nov 4 705 'J 190 2 694 2 707 78 990 120,295 2830
Dec 4 808 1171 2 763 2641 79 675 122,942 2 273
§ Including cases under processing for which payment has not yet been made.
100 Hong Kong Monthly Digest of Statistics January 1993
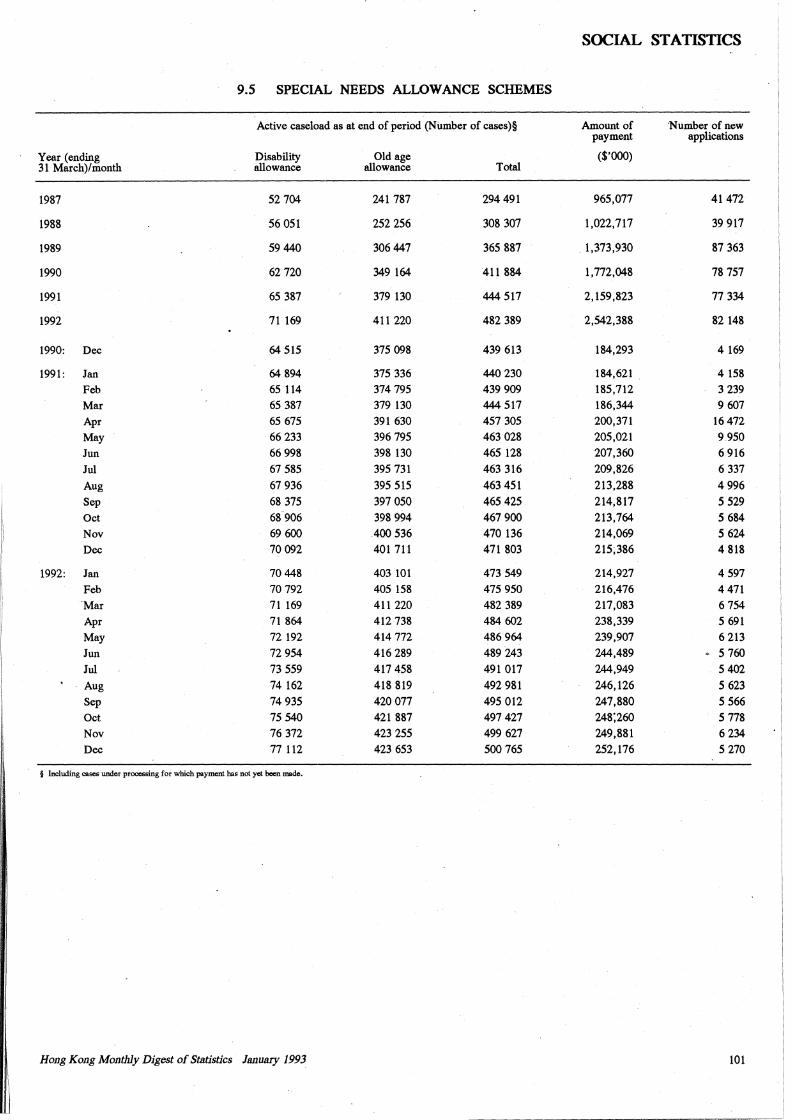
I
I
I!
I
I
1.
1 •
Jnl_ __ -- ------- -------- - -----------·----------
9.5 SPECIAL NEEDS ALLOWANCE SCHEMES
Active caseload as at end of period (Number of cases)§
Year (ending 31 March)/month
Disability allowance
Old age allowance Total
1987 52 704 241 787 294 491
1988 56 051 252 256 308 307
1989 59 440 306 447 365 887
1990 62 720 349 164 411 884
1991 65 387 379 130 444 517
1992 71 169 411 220 482 389
1990: Dec 64 515 375 098 439 613
1991: Jan 64 894 375 336 440 230
Feb 65 114 374 795 439 909
Mar 65 387 379 130 444 517
Apr 65 675 391 630 457 305
May 66 233 396 795 463 028
Jun 66 998 398 130 465 128
Jul 67 585 395 731 463 316
Aug 67 936 395 515 463 451
Sep 68 375 397 050 465 425
Oct 68 906 398 994 467 900
Nov 69 600 400 536 470 136
Dec 70 092 401 711 471 803
1992: Jan 70448 403 101 473 549
Feb 70792 405 158 475 950 ·Mar 71 169 411 220 482 389
Apr 71 864 412 738 484 602
May 72 192 414 772 486 964
Jun 72 954 416 289 489 243
Jul 73 559 417 458 491 017
Aug 74 162 418 819 492 981
Sep 74 935 420 077 495 012
Oct 75 540 421 887 497 427 Nov 76 372 423 255 499 627
Dec 77 112 423 653 SOO 765
§ Including cases under processing for which payment has not yet been made.
Hong Kong Monthly Digest of Statistics January 1993
SOCIAL STATISTICS
Amount of Number of new payment applications
($'000)
965,077 41472
1,022,717 39 917
1,373,930 87 363
1,772,048 78 757
2,159,823 77 334
2,542,388 82 148
184,293 4 169
184,621 4 158 185,712 3 239 186,344 9 607 200,371 16 472 205,021 9.950 207,360 6 916 209,826 6 337
213,288 4 996
214,817 5 529 213,764 5 684 214,069 5 624 215;386 4 818
214,927 4 597 216,476 4 471 217,083 6 754 238,339 5 691 239,907 6 213 244,489 ~ 5 760
244,949 5 402
246,126 5 623 247,880 5 566 248;260 5 778 249,881 6 234 252,176 5 270
101
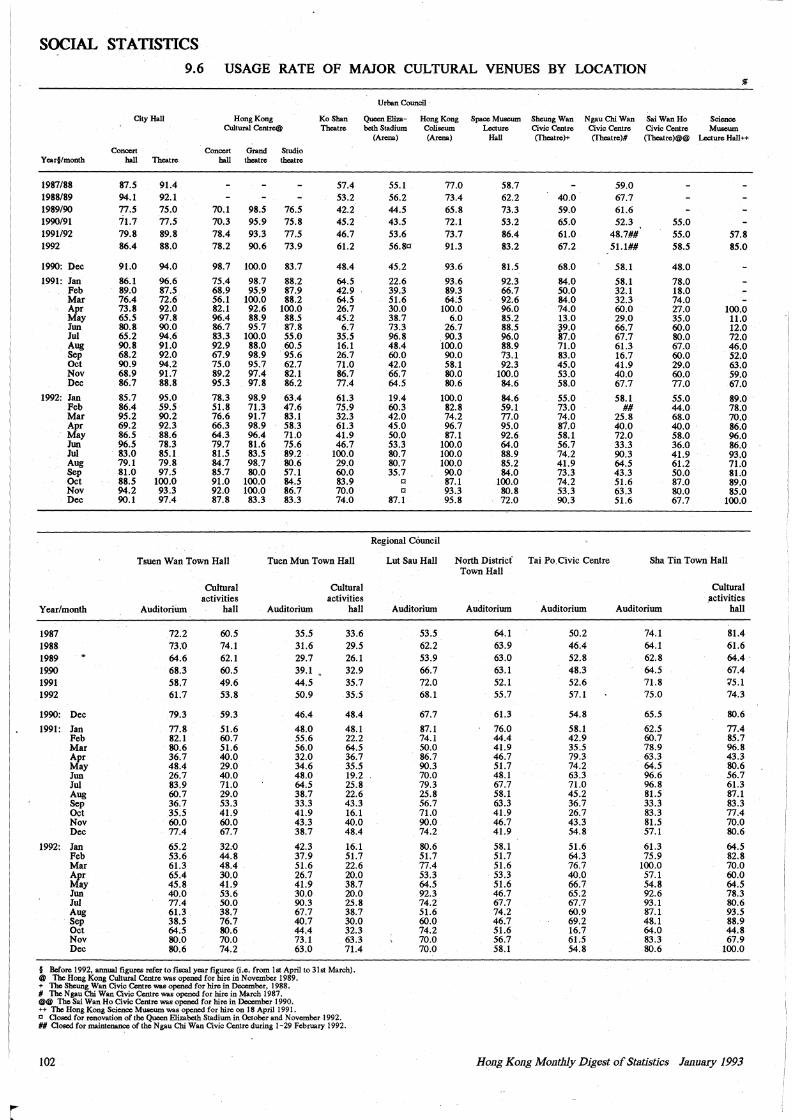
SOCIAL STATISTICS
9.6 USAGE RATE OF MAJOR CULTURAL VENUES BY LOCATION
Urban Council
City Hall Hong Kong Ko Shan Queen Elfa:a- Hong Kong Space Museum Sheung Wan Ngau Chi Wan Sai Wan Ho Science Cultural Centre@ Theatre beth Stadium Coliseum Lecture Civic Centre Civic Centre Civic Centre Museum
(Arena) (Arena) Hall (Theatre)+ (Theatre)# (Theatre)@@ Lecture Hall++
Concert Concert Grand Studio Ycar§/month ball Theatre ball theatre theatre
1987/88 87.5 91.4 57.4 55.1 77.0 58.7 59.0 1988/89 94.1 92.1 53.2 56.2 73.4 62.2 40.0 67.7 1989/90 77.5 75.0 70.1 98.5 76.5 42.2 44.5 65.8 73.3 59.0 61.6 1990/91 71.7 77.5 70.3 95.9 75.8 45.2 43.5 72.1 53.2 65.0 52.3 55.0 1991/92 79.8 89.8 78.4 93.3 77.5 46.7 53.6 73.7 86.4 61.0 48.7## 55.0 57.8 1992 86.4 88.0 78.2 90.6 73.9 61.2 56.80 91.3 83.2 67.2 51.1## 58.5 85.0
1990: Dec 91.0 94.0 98.7 100.0 83.7 48.4 45.2 93.6 81.5 68.0 58.1 48.0
1991: Jan 86.1 96.6 75.4 98.7 88.2 64.5 22.6 93.6 92.3 84.0 58.1 78.0 Feb 89.0 87.5 68.9 95.9 87.9 42.9 39.3 89.3 66.7 50.0 32.1 18.0 Mar 76.4 72.6 56.1 100.0 88.2 64.5 51.6 64:5 92.6 84.0 32.3 74.0 Apr 73.8 92.0 82.1 92.6 100.0 26.7 30.0 100.0 96.0 74.0 60.0 27.0 100.0 May 65.5 97.8 96.4 88.9 88.5 45.2 38.7 6.0 85.2 13.0 29.0 35.0 11.0 Jun 80.8 90.0 86.7 95.7 87.8 6.7 73.3 26.7 88.5 ~9.0 66.7 60.0 12.0 Jui 65.2 94.6 83.3 100.0 55.0 35.5 96.8 . 90.3 96.0 87.0 67.7 80.0 72.0 Aug 90.8 91.0 92.9 88.0 60.5 16.1 48.4 100.0 88.9 71.0 61.3 67.0 46.0 Sep 68.2 92.0 67.9 98.9 95.6 26.7 60.0 90.0 73.1 83.0 16.7 60.0 52.0 Oct 90.9 94.2 75.0 95.7 62.7 71.0 42.0 58.1 92.3 45.0 41.9 29.0 63.0 Nov 68.9 91.7 89.2 97.4 82.1 86.7 66.7 80.0 100.0 53.0 40.0 60.0 59.0 Dec 86.7 88.8 95.3 97.8 86.2 77.4 64.5 80.6 84.6 58.0 67.7 77.0 67.0
1992: Jan 85.7 95.0 78.3 98.9 63.4 61.3 19.4 100.0 84.6 55.0 58.1 55.0 89.0 Feb 86.4 59.5 51.8 71.3 47.6 75.9 60.3 82.8 59.l 73.0 ## 44.0 78.0 Mar 95.2 90.2 76.6 91.7 83.1 32.3 42.0 74.2 77.0 74.0 25.8 68.0 70.0 Apr 69.2 92.3 66.3 98.9 58.3 61.3 45.0 96.7 95.0 81.0 40.0 40.0 86.0 May 86.5 88.6 64.3 96.4 71.0 41.9 50.0 87.1 92.6 58.1 72.0 58.0 96.0 Jun 96.5 78.3 79.7 81.6 75.6 46.7 53.3 100.0 64.0 56.7 33.3 36.0 86.0 Jui 83.0 85.1 81.5 83.5 89.2 100.0 80.7 100.0 88.9 74.2 90.3 41.9 93.0 Aug 79.1 79.8 84.7 98.7 80.6 29.0 80.7 100.0 85.2 41.9 64.5 61.2 71.0 Sep 81.0 97.5 85.7 80.0 57.1 60.0 35.7 90.0 84.0 73.3 43.3 50.0 81.0 Oct 88.5 100.0 91.0 100.0 84.5 83.9 ll 87.1 100.0 74.2 51.6 87.0 89.0 Nov 94.2 93.3 92.0 100.0 86.7 70.0 ll 93.3 80.8 53.3 63.3 80.0 85.0 Dec 90.1 97.4 87.8 83.3 83.3 74.0 87.1 95.8 72.0 90.3 51.6 67.7 100.0
Regional Council
Tsuen Wan Town Hall Tuen Mun Town Hall Lut Sau Hall North Districi Tai Po. Civic Centre Sha Tin Town Hall Town Hall
Cultural Cultural Cultural activities activities .activities
Year/month Auditorium hall Auditorium hall Auditorium Auditorium Auditorium Auditorium hall
1987 72.2 60.5 35.5 33.6 53.5 64.1 50.2 74.1 81.4 1988 73.0 74.1 31.6 29.5 62.2 63.9 46.4 64.1 61.6 1989 64.6 62.1 29.7 26.1 53.9 63.0 52.8 62.8 64.4. 1990 68.3 60.5 39.1 " 32.9 66.7 63.1 48.3 64.5 67.4 1991 58.7 49.6 44.5 35.7 72.0 52.1 52.6 71.8 ;;'5.1 1992 61.7 53.8 50.9 35.5 68.1 55.7 57.1 75.0 74.3
1990: Dec 79.3 59.3 46.4 48.4 67.7 61.3 54.8 65.5 80.6
1991: Jan 77.8 51.6 48.0 48.1 87.1 76.0 58.1 62.5 77.4 Feb 82.1 60.7 55.6 22.2 74.1 44.4 42.9 60.7 85.7 Mar 80.6 51.6 56.0 64.5 50.0 41.9 35.5 78.9 96.8 Apr 36.7 40.0 32.0 36.7 86.7 46.7 79.3 63.3 43.3 May 48.4 29.0 34.6 35.5 90.3 51.7 74.2 64.5 80.6 Jun 26.7 40.0 48.0 19.2 70.0 48.1 63.3 96.6 56.7 Jui 83.9 71.0 64.5 25.8 79.3 67.7 71.0 96.8 61.3 Aug 60.7 29.0 38.7 22.6 25.8 58.1 45.2 81.5 87.1 Sep 36.7 53.3 33.3 43.3 56.7 63.3 36.7 33.3 83.3 Oct 35.5 41.9 41.9 16.1 71.0 41.9 26.7 83.3 77.4 Nov 60.0 60.0 43.3 40.0 90.0 46.7 43.3 81.5 70.0 Dec 77.4 67.7 38.7 48.4 74.2 41.9 54.8 57.1 80.6
1992: Jan 65.2 32.<l 42.3 16.1 80.6 58.1 51.6 61.3 64.5 Feb 53.6 44.8 37.9 51.7 51.7 51.7 64.3 75.9 82.8 Mar 61.3 48.4 51.6 22.6 77.4 51.6 76.7 100.0 70.0 Apr 65.4 30.0 26.7 20.0 53.3 53.3 40.0 57.1 60.0 May 45.8 41.9 41.9 38.7 64.5 51.6 66.7 54.8 64.5 Jun 40.0 53.6 30.0 20.0 92.3 46.7 65.2 92.6 78.3 Jui 77.4 50.0 90.3 25.8 74.2 67.7 67.7 93.1 80.6 Aug 61.3 38.7 67.7 38.7 51.6 74.2 60.9 87.1 93.5 Sep 38.5 76.7 40.7 30.0 60.0 46.7 69.2 48.1 88.9 Oct 64.5 80.6 44.4 32.3 74.2 51.6 16.7 64.0 44.8 Nov 80.0 70.0 73.1 63.3 70.0 56.7 61.5 83.3 67.9 Dec 80.6 74.2 63.0 71.4 70.0 58.1 54.8 80.6 100.0
§ Before 1992, annual figures refer to fiscal year figures (i.e. from lst April to 3lst March). @ The Hong Kong Cultural Centre was opened for hire in November 1989. + The Sheung Wan Civic Centre was opened for hire in December, 1988. # TheNgau Chi Wan Civic Centre was opened for hire in March 1987. @@ The Sai Wan Ho Civic Centre was opened for hire in December 1990. ++ The Hong Kong Science Museum was opened for hire on 18 April 1991. c Closed for renovation of the Queen Elizabeth Stadium in October and November 1992. ## Closed for maintenance of the Ngau Chi Wan Civic Centre during 1-29 February 1992.
102 Hong Kong Mo11thly Digest of Statistics January 1993
r ---------- ----- -
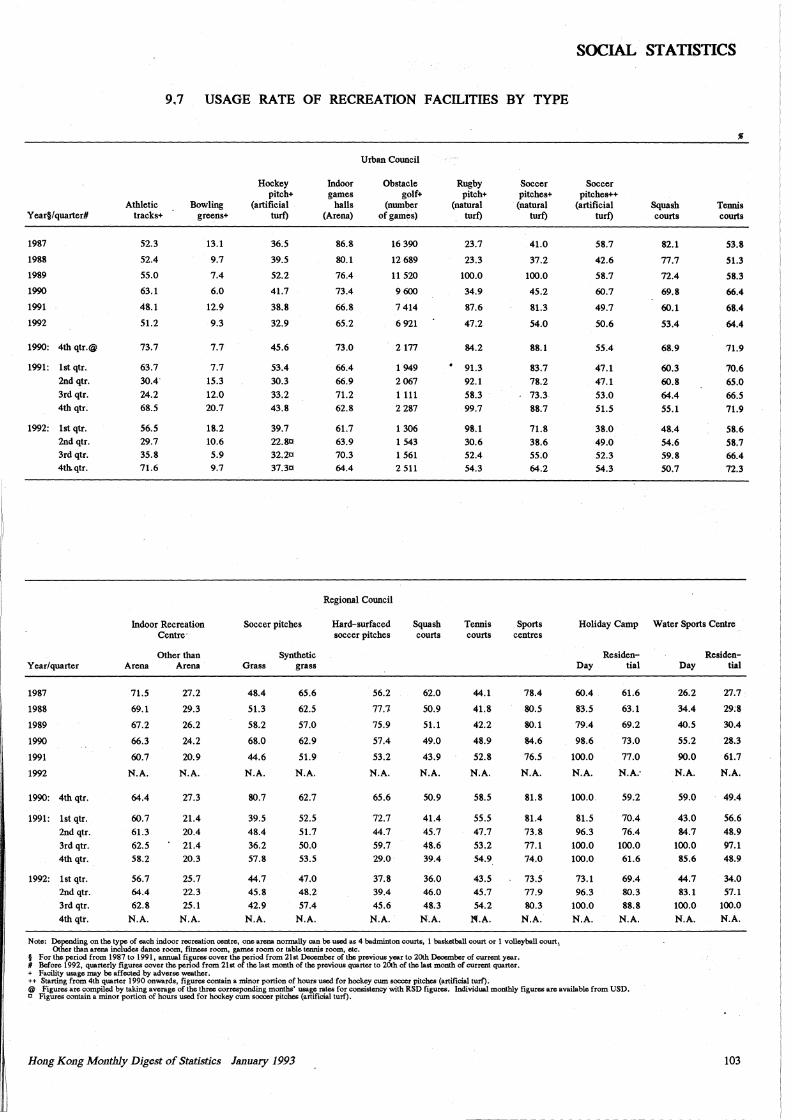
I
I
I
I, I
I
I, I,
I'
J!IIJ -- ----------
9.7 USAGE RATE OF RECREATION FACILITIES BY TYPE
Year§/ quarter#
1987
1988
1989
1990
1991
1992
1990: 4th qtr.@
1991: lst qtr. 2nd qtr.
3rd qtr. 4th qtr.
1992: lst qtr. 2nd qtr. 3rd qtr. 4thqtr.
Year/quarter
1987
1988
1989
1990
1991
1992
1990: 4th qtr.
1991: lst qtr.
2nd qtr. 3rd qtr. 4th qtr.
1992: lst qtr. 2nd qtr. 3rd qtr.
4th qtr.
Athletic tracks+
Bowling greens+
52.3
52.4
55.0
63.1
48.1
51.2
73.7
63.7 30.4'
24.2 68.5
56.5 29.7 35.8 71.6
Indoor Recreation Centre·
Other than Arena Arena
71.5
69.1
67.2
66.3
60.7
N.A.
64.4
60.7 61.3
62.5 58.2
56.7 64.4 62.8
N.A.
27.2
29.3
26.2
24.2
20.9
N.A.
27.3
21.4
20.4 21.4 20.3
25.7 22.3 25.1
N.A.
13.1
9.7
7.4
6.0
12.9
9.3
7.7
7.7 15.3 12.0 20.7
18.2 10.6 5.9 9.7
Hockey pitch+
(artificial turt)
36.5
39.5
52.2
41.7
38.8
32.9
45.6
53.4 30.3
33.2 43.8
39.7 22.80 32.20 37.30
Soccer pitches
Synthetic Grass grass
48.4
51.3
58.2
68.0
44.6
N.A.
80.7
39.5
48.4 36.2 57.8
44.7 45.8 42.9
N.A.
65.6
62.5
57.0
62.9
51.9
N.A.
62.7
52.5
51.7
50.0 53.5
47.0 48.2 57.4
N.A.
Indoor games
halls (Arena)
86.8
80.1
76.4
73.4
66.8
65.2
73.0
66.4 66.9
71.2 62.8
61.7 63.9 70.3 64.4
Urban Council
Obstacle golf+
(nwnber of games)
16 390
12 689
11 520
9 600
7 414
6 921
2177
1 949
2067
1111 2 287
1 306 1 543 1 561 2 511
Regional Council
Hard-surfaced soccer pitches
56.2
77.1
75.9
57.4
53.2
N.A.
65.6
72.7
44.7 59.7 29.0
37.8 39.4 45.6
N.A.
Squash courts
62.0
50.9
51.1
49.0
43.9
N.A.
50.9
41.4
45.7 48.6 39.4
36.0 46.0 48.3
N.A.
Rugby pitch+
(natural turf)
23.7
23.3
100.0
34.9
87.6
47.2
84.2
91.3 92.1
58.3 99.7
98.1 30.6 52.4 54.3
Tennis courts
44.1
41.8
42.2
48.9
52.8
N.A.
58.5
55.5 47.7
53.2 54.9
43.5 45.7 54.2
N.A.
Soccer pitches+
(natural turf)
41.0
37.2
100.0
45.2
81.3
54.0
88.1
83.7 78.2
73.3 88.7
71.8 38.6 55.0 64.2
Sports centres
78.4
80.5
80.1
84.6
76.5
N.A.
81.8
81.4
73.8 77.1 74.0
73.5 77.9 80.3
N.A.
Note: Depending on the type of each indoor recreation centre, one arena normally can be used as 4 badminton courts, 1 basketball court or 1 volleyball court~ Other than arena includes dance room, fitness room, games room or table tennis room, etc.
§ For the period from 1987 to 1991, annual figures cover the period from 21 st December of the previous year to 20th December of current year. # Before 1992, quarterly figures cover the period from 21st of the last month of the previous quarter to 20th of the last month of current quarter. + Facility usage may be affected by adverse weather. ++ Starting from 4th quarter 1990 onv.iards, figures contain a minor portion of hours used for hockey cum soccer pitches (artificial turf).
SOCIAL STATISTICS
Soccer pitches++
(artificial turf)
58.7
42.6
58.7
60.7
49.7
50.6
55.4
47.1
47.1
53.0 51.5
38.0 49.0 52.3 54.3
Squash courts
82.1
77.7
72.4
69.8
60.1
53.4
68.9
60.3 60.8
64.4 55.1
48.4 54.6 59.8 50.7
Tennis courts
53.8
51.3
58.3
66.4
68.4
64.4
71.9
70.6
65.0
66.5 71.9
58.6 58.7 66.4 72.3
Holiday Camp Water Sports Centre
Residen-Day tial
60.4
83.5
79.4
98.6
100.0
N.A.
100.0
81.5
96.3
100.0 100.0
73.1 96.3
100.0
N.A.
61.6
63.1
69.2
73.0
77.0
N.A:
59.2
70.4
76.4
100.0 61.6
69.4 80.3
88.8 N.A.
Residen-Day tial
26.2
34.4
40.5
55.2
90.0
N.A.
59.0
43.0
84.7
100.0 85.6
44.7 83.1
100.0
N.A.
27.7
29:8
30.4
28.3
61.7
N.A.
49.4
56.6
48.9 97.1 48.9
34.0 57.1
100.0 N.A.
@ Figures arc compiled by taking average of the three corresponding months' usage rates for consistency with RSD figures. Individual monthly figures arc available from USD. a Figures contain a minor portion of hours used for hockey cum soccer pitches (artificial turf).
Ho11g Kong Mo11thly Digest of Statistics January 1993 103
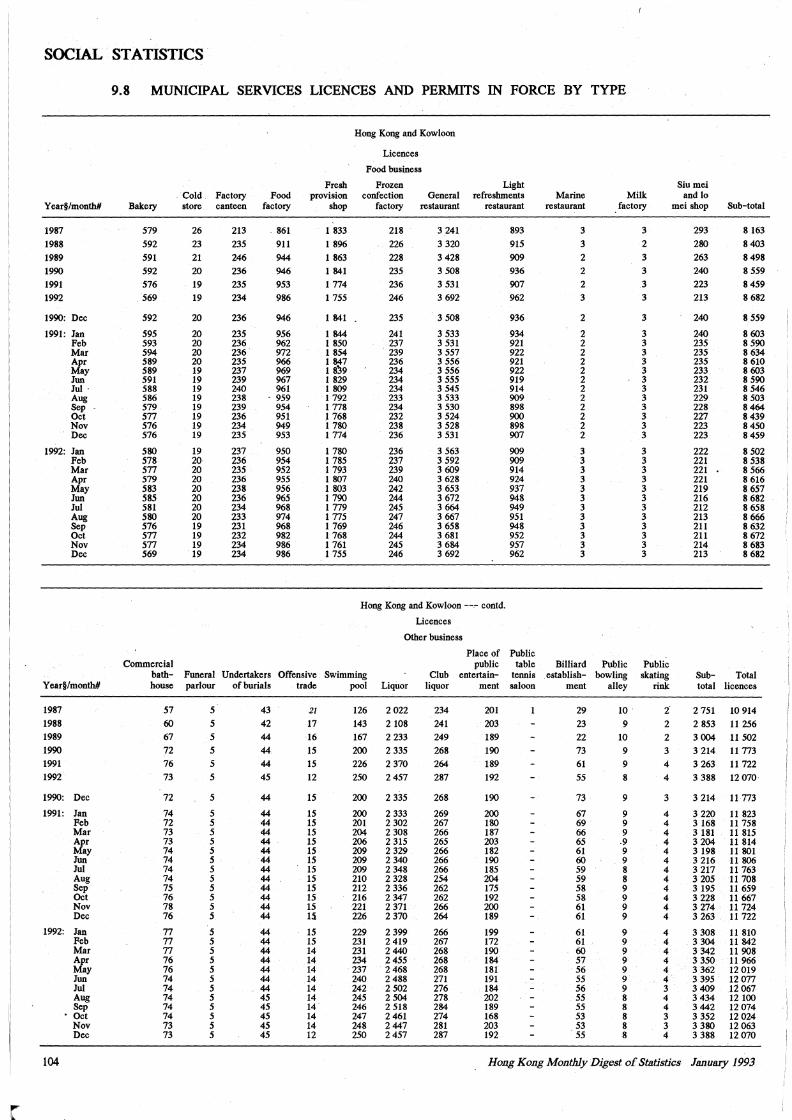
r
SOCIAL STATISTICS
9.8 MUNICIPAL SERVICES LICENCES AND PERMITS IN FORCE BY TYPE
Year§/month#
1987
1988 1989 1990
1991 1992
1990: Dec
1991: Jan Feb Mar Apr May Jun Jui . Aug Sep Oct Nov Dec
1992: Jan Feb Mar Apr May Jun Jui Aug Sep Oct Nov Dec
Year§/month#
1987 1988 1989 1990 1991 1992
1990: Dec
1991: Jan Feb Mar Apr May Jun Jui Aug Sep Oct Nov Dec
1992: Jan Feb Mar Apr May Jun Jui Aug Sep Oct Nov Dec
Bakery
579
592 591 592 576
. 569
592
595 593 594 589 589 591 588 586 579 577 576 576
580 578 577 579 583 585 581 580 576 577 577 569
Commercial
. Cold Factory store canteen
26 213 23 235 21 246 20 236 19 235 19 234
20 236
20 235 20 236 20 236 20 235 19 237 19 239 19 240 19 238 19 239 19 236 19 234 19 235
19 237 20 236 20 235 20 236 20 238 20 236 20 234 20 233 19 231 19 232 19 234 19 234
Food factory
861 911 944
946 953 986
946
956 962 972 966 969 967 961
- 959 954 951 949 953
950 954 952 955 956 965 968 974 968 982 986 986
Fresh provision
shop
1 833 1 896 1 863 1 841 1 774 1 755
1 841
1 844 1 850 1 854 1 847 1 8~9 1 829 1 809 1 792 1 778 1 768 i 780 1 774
1 780 1 785 1 793 1 807 1 803 1 790 1 779 1 775 1 769 1 768 1 761 1 755
Hong Kong and Kowloon
Licences
Food business
Frozen confection
factory
218
226 228 235 236 246
235
241 237 239 236 234 234 234 233 234 232 238 236
236 237 239 240 242 244 245 247 246 244 245 246
Light General refreshments
restaurant restaurant
3 241 893 3 320 915 3 428 909 3 508 936 3 531 907 3 692 962
3 508 936
3 533 934 3 531 921 3 557 922 3 556 921 3 556 922 3 555 919 3 545 914 3 533 909 3 530 898 3 524 900 3 528 898 3 531 907
3 563 909 3 592 909 3 609 914 3 628 924 3 653 937 3 672 948 3 664 949 3 667 951 3 658 948 3 681 952 3 684 957 3 692 962
Hong Kong and Kowloon --,- contd.
Licences
Other business
Place of Public public table
bath- Funeral Undertakers Offensive Swimming house parlour of burials trade pool Liquor
Club entertain- tennis liquor ment saloon
57 60 67
72 76
73
72
74 72 73 73 74 74 74 74 75 76 78 76
77 77 77 76 76 74 74 74 74 74 73 73
5
5
5
5 5
5
5
5 5 5 5 5 5 5 5 5 5 5 5
5 5 5 5 5 5 5 5 5 5 5 5
43 42
44 44 44
45
44
44 44 44 44 44 44 44 44 44 44 44 44
44 44 44 44 44 44 44 45 45 45 45 45
21
17
16 15 15
12
15
15 15 15 15 15 15 15 15 15 15 15 13
15 15 14 14 14 14 14 14 14 14 14 12
126 2 022 143 2 108 167 2 233 200 2 335 226 2 370
250 2 457
200 2 335
200 201 204 206 209 209 209 210 212 216 221 226
229 231 231 234 237 240 242 245 246 247 248 250
2 333 2 302 2 308 2 315 2 329 2 340 2 348 2 328 2 336 2 347 2 371 2 370
2 399 2 419 2440 2 455 2 468 2 488 2 502 2 504 2 518 2 461 2447 2 457
234 241 249 268 264 287
268
269 267 266 265 266 266 266 254 262 262 266 264
266 267 268 268 268 271 276 278 284 274 281 287
201 203 189 190 189
192
190
200 180 187 203 182 190 185 204 175 192 200 189
199 172 190 184 181 191 184 202 189 168 203 192
Marine restaurant
Milk . factory
3 3
2
2 2
3
2
2 2 2 2 2 2 2 2 2 2 2 2
3 3 3 3 3 3 3 3 3 3 3 3
Billiard Public establish- bowling
ment alley
29 23 22 73 61 55
73
67 69 66 65 61 60 59 59 58 58 61 61
61 61 60 57 56 55 56 55 55 53 53 55
10 9
10 9 9
8
9
9 9 9
.9 9 9 8 8 9 9 9 9
9 9 9 9 9 9 9 8 8 8 8 8
3
2
3
3
3
3
3
3 3 3 3 3 3 3 3 3 3 3 3
3 3 3 3 3 3 3 3 3 3 3 3
Public skating
rink
t 2
2
3
4 4
3
4 4 4 4 4 4 4 4 4 4 4 4
4 4 4 4 4 4 3 4 4 3 3 4
Siu mei and lo
mei shop
293 280 263 240 223 213
240
240 235 235 235 233 232 231 229 228 227 223 223
222 221 221 221 219 216 212 213 211 211 214 213
Sub-total
8163 8403 8 498 8 559
8 459 8 682
8 559
8 603 8590 8 634 8 610 8 603 8 590 8 546 8 503 8464 8 439 8450 8 459
8502 8 538 8 566 8 616 8 657 8 682 8 658 8666 8 632 8672 8 683 8 682
Sub- Total total licences
2 751 10 914 2 853 11 256 3 004 11 502 3 214 11 773 3 263 11 722 3 388 12 070
3 214 11 773
3 220 3 168 3 181 3 204 3 198 3 216 3 217 3 205 3 195 3 228 3 274 3 263
3 308 3 304 3 342 3 350 3 362 3 395 3 409 3 434 3 442 3 352 3 380 3 388
11 823 11 758 11 815 11 814 11 801 11 806 11 763 11 708 11 659 11 667 11 724 11 722
11 810 11 842 11908 11 966 12 019 12 077 12 067 12 100 12 074 12024 12 063 12 070
104 Hong Ko11g Monthly Digest of StLJtistics January 1993
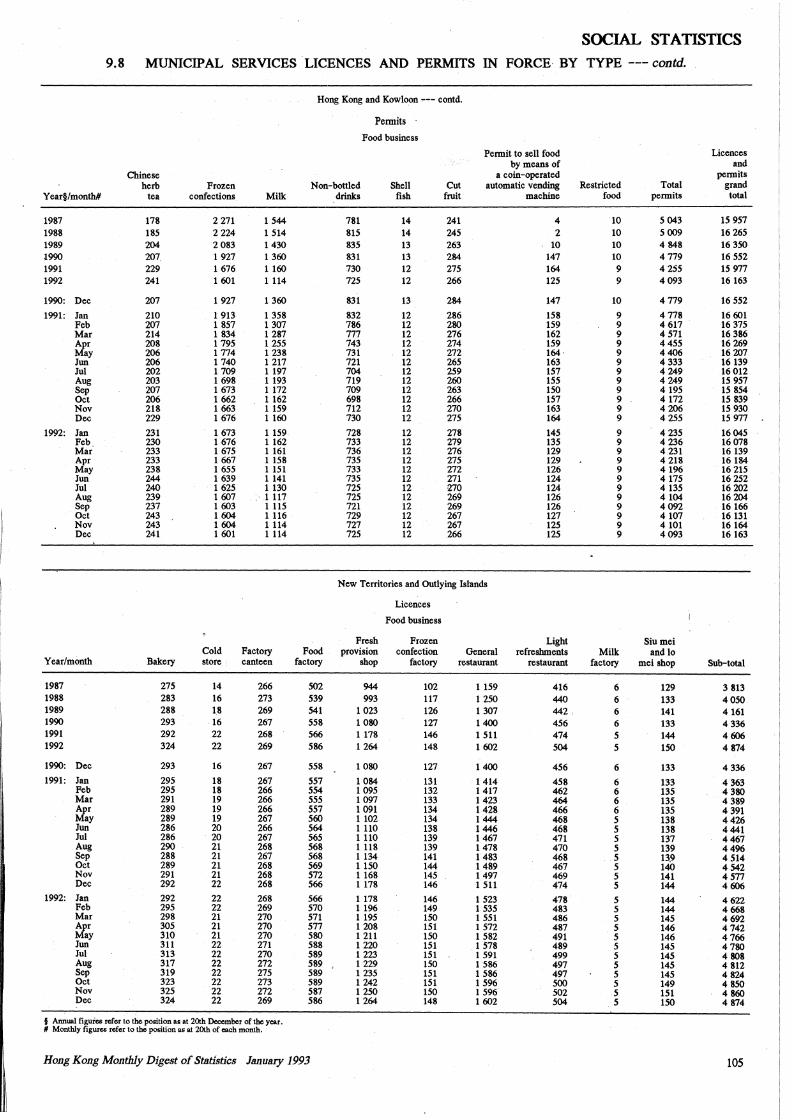
--- --- --- ------------
SOCIAL STATISTICS 9.8 MUNICIPAL SERVICES LICENCES AND PERMITS IN FORCE BY TYPE --- contd.
Hong Kong and Kowloon --- contd.
Pennits
Food business
Pennit to sell food Licences by means of and
Chinese a coin-operated pennits herb Frozen Non-bottled Shell Cut automatic vending Restricted Total grand
Year§/month# tea confections Milk drinks fish fruit machine food permits total
1987 178 2 271 l 544 781 14 241 4 10 5043 15 957 1988 185 2 224 l 514 815 14 245 2 10 5 009 16 265 1989 204 2083 1430 835 13 263 10 10 4 848 16 350 1990 207 l 927 l 360 831 13 284 147 10 4779 16 552 1991 229 l 676 1160 730 12 275 164 9 4 255 15 977 1992 241 l 601 l 114 725 12 266 125 9 4093 16 163
1990: Dec 207 l 927 l 360 831 13 284 147 10 4 779 16 552
1991: Jan 210 1913 l 358 832 12 286 158 9 4778 16 601 Feb 207 l 857 1307 786 12 280 159 9 4 617 16 375 Mar 214 l 834 l 287 777 12 276 162 9 4 571 16 386 Apr 208 l 795 l 255 743 12 274 159 9 4455 16 269 May 206 l 774 l 238 731 12 272 164. 9 4406 16207 Jun 206 1 740 l 217 721 12 265 163 9 4 333 16 139 Jui 202 l 709 1197 704 12 259 157 9 4249 16012 Aug 203 l 698 1193 719 12 260 155 9 4249 15 957 Sep 207 1673 1172 709 12 263 150 9 4195 15 854 Oct 206 l 662 1162 698 12 266 157 9 4 172 15 839 Nov 218 l 663 l 159 712 12 270 163 9 4206 15 930 Dec 229 l 676 1160 730 12 275 164 9 4 255 15 977
1992: Jan 231 l 673 l 159 728 12 278 145 9 4 235 16 045 Feb 230 l 676 l 162 733 12 279 135 9 4 236 16 078 Mar 233 l 675 l 161 736 12 276 129 9 4 231 16139 Apr 233 l 667 l 158 735 12 275 129 9 4 218 16 184 May 238 l 655 l 151 733 12 272 126 9 4 196 16 215 Jun 244 l 639 l 141 735 12 271 124 9 4 175 16 252 Jui 240 l 625 l 130 725 12 270 124 9 4 135 16 202 Aug 239 l 607 . 1117 725 12 269 126 9 4104 16 204 Sep 237 l 603 l 115 721 12 269 126 9 4092 16166 Oct 243 l 604 l 116 729 12 267 127 9 4107 16 131 Nov 243 l 604 1114 727 12 267 125 9 4 101 16164 Dec 241 l 601 1114 725 12 266 125 9 4093 16163
New Territories and Outlying Islands
Licences
Food business
Fresh Frozen Light Siumei Cold Factory Food provision confection General refreshments Milk and lo
Year/month Bakery store canteen factory shop factory restaurant restaurant factory mei shop Sub-total
1987 275 14 266 502 944 102 l 159 416 6 129 3 813 1988 283 16 273 539 993 117 l 250 440 6 133 4050 1989 288 18 269 541 l 023 126 l 307 442' 6 141 4161 1990 293 16 267 558 l 080 127 1400 456 6 133 4 336 1991 292 22 268 566 1178 146 l 511 474 5 144 4606 1992 324 22 269 586 l 264 148 l 602 504 5 150 4 874
1990: Dec 293 16 267 558 l 080 127 1400 456 6 133 4336 1991: Jan 295 18 267 557 1 084 131 1414 458 6 133 4 363
Feb 295 18 266 554 1095 132 1417 462 6 135 4 380 Mar 291 19 266 555 1 097 133 1423 464 6 135 4 389 Apr 289 19 266 557 1091 134 1428 466 6 135 4 391
I· May 289 19 267 560 1102 134 1444 468 5 138 4426 Jun 286 20 266 564 1110 138 1446 468 5 138 4 441 Jui 286 20 267 565 1110 139 1467 471 5 137 4467 Aug 290 21 268 568 1118 139 1478 470 5 139 4496 Sep 288 21 267 568 1134 141 1483 468 5 13,9 4 514 Oct 289 21 268 569 1150 144 1489 467 5 140 4 542 Nov 291 21 268 572 1168 145 1497 469 5 141 4 577 Dec 292 22 268 566 1178 146 1 511 474 5 144 4606
1. 1992: Jan 292 22 268 566 1 178 146 1523 478 5 144 4622
Feb 295 22 269 570 1 196 149 1 535 483 5 144 4 668 Mar 298 21 270 571 1 195 150 1 551 486 5 145 4692 Apr 305 21 270 577 1 208 151 1 572 487 5 146 4 742 May 310 21 270 580 1211 150 l 582 491 5 146 4766 Jun 311 22 271 588 1 220 151 1 578 489 5 145 4780 Jui 313 22 270 589 1 223 151 1 591 499 5 145 4 808 Aug 317 22 272 589 1 229 150 1 586 497 5 145 4 812 Sep 319 22 275 589 1 235 151 1 586 497 5 145 4 824 Oct 323 22 273 589 1 242 151 1596 500 5 149 4 850 Nov 325 22 272 587 1 250 150 1 596 502 5 151 4 860 Dec 324 22 269 586 1 264 148 1 602 504 5 150 4 874
§ Annual figuies refer to the position as at 20th December of the year. # Monthly figures refer to the position as at 20th of each month.
Hong Kong Monthly Digest of Statistics l811uary 1993 105
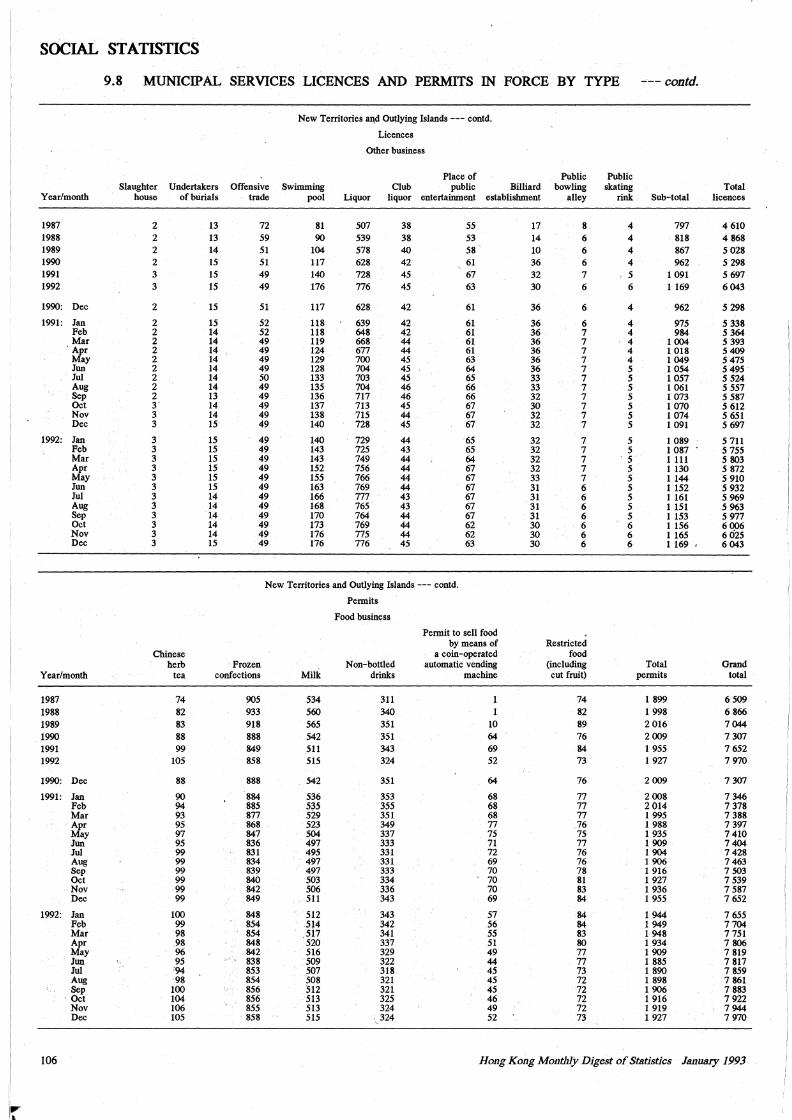
SOCIAL STATISTICS
9.8 MUNICIPAL SERVICES LICENCES AND PERMITS IN FORCE BY TYPE -'--contd.
New Territories 111\d Outlying Islands --- contd.
Licences
Other business
Place of Public Public Slaughter Undertakers Offensive Swimming Club public Billiard bowling skating Total
Year/month house of burials trade pool Liquor liquor entertainment establishment alley rink Sub-total licences
1987 2 13 72 81 507 38 55 17 8 4 797 4 610 1988 2 13 59 90 539 38 53 14 6 4 . 818 4 868 1989 2 14 51 104 578 40 58 10 6 4 867 5 028 1990 2 15 51 117 628 42 61 36 6 4 962 5 298 1991 3 15 49 140 728 45 67 32 7 5 1 091 5 697 1992 3 15 49 176 776 45 63 30 6 6 1169 6043
1990: Dec 2 15 51 117 628 42 61 36 6 4 962 5 298
1991: Jan 2 15 52 118 639 42 61 36 6 4 975 5 338 Feb 2 14 52 118 648 42 61 36 7 4 984 5 364 Mar 2 14 49 119 668 44 61 36 7 4 1004 5 393
. Apr 2 14 49 124 677 44 61 36 7 4 1 018 5 409 May 2 14 49 129 700 45 63 36 7 4 1 049 5 475 Jun 2 14 49 128 704 45 64 36 7 5 1 054 5 495 Jul 2 14 50 133 703 45 65 33 7 5 1 057 5 524 Aug 2 14 49 135 704 46 66 33 7 5 1 061 5 557 Sep 2 13 49 136 717 46 66 32 7 5 1 073 5 587 Oct 3· 14 49 137 713 45 67 30 7 5 1 070 5 612 Nov 3 14 49 138 715 44 67 32 7 5 1 074 5 651 Dec 3 15 49 140 728 45 67 32 7 5 1 091 5 697
1992: Jan 3 15 49 140 729 44 65 32 7 5 1 089 5 711 Feb 3 15 49 143 725 43 65 32 7 5 1 087 5 755 Mar 3 15 49 143 749 44 64 32 7 . 5 1 111 5 803 Apr 3 15 49 152 756 44 67 32 7 5 1130 5 872 May 3 15 49 155 766 44 67 33 7 5 1144 5 910 Jun 3 15 49 163 769 44 67 31 6 5 1152 5 932 Jul 3 14 49 166 777 43 67 31 6 5 1 161 5 969 Aug 3 14 49 168 765 43 67 31 6 5 1 151 5 963 Sep 3 14 49 170 764 44 67 31 6 5 1153 5 977 Oct 3 14 49 173 769 44 62 30 6 6 1 156 6006 Nov 3 14 49 176 775 44 62 30 6 6 1 165 6 025 Dec 3 15 49 176 776 45 63 30 6 6 1169 6 043
New Territories and Outlying Islands --- contd.
Permits
Food business
Permit to sell food <·
by means of Restricted Chinese a coin-operated food
herb Frozen Non-bottled automatic vending (including Total Grand Year/month tea confections Milk drinks machine cut fruit) permits total
1987 74 905 534 311 74 1 899 6 509 1988 82 933 560 340 82 1 998 6 866 1989 83 918 565 351 10 89 2 016 7044 1990 88 888 542 351 64 76 2009 7 307 1991 99 849 511 343 69 84 1 955 7 652 1992 105 858 515 324 52 73 1 927 7970
1990: Dec 88 888 542 35.1 64 76 2009 7 307
1991: Jan 90 884 536 353 68 77 2008 7 346 Feb 94 885 535 355 68 77 2 014 7 378 Mar 93 877 529 351 68 77 1 995 7 388 Apr 95 868 523 349 77 76 1 988 7 397 May 97 847 504 337 75 75 1 935 7410 Jun 95 836 497 333 71 77 1 909 7404 Jui 99 831 495 331 72 76 1 904 7428 Aug 99 834 497 331 69 76 1 906 7 463 Sep 99 839 497 333 70 78 1 916 7 503 Oct 99 840 503 334 70 81 1 927 7 539 Nov 99 842 506 336 70 83 1 936 7 587 Dec 99 849 511 343 69 84 1 955 7 652
1992: Jan 100 848 512 343 57 84 1 944 7 655 Feb 99 854 514 342 56 84 1 949 7704 Mar 98 854 517 341 55 83 1 948 7 751 Apr 98 848 520 337 51 80 1 934 7 806 May 96 842 516 329 49 77 1 909 7 819 Jun 95 838 509 322 44 77 1 885 7 817 Jul '94 853 507 318 45 73 1 890 7 859 Aug 98 854 508 321 45 72 1 898 7 861 Sep 100 856 512 321 45 72 1 906 7 883 Oct 104 856 513 325 46 72 1 916 7 922 Nov 106 855 513 324 49 72 1 919 7 944 Dec 105 858 515 ', 324 52 73 1 927 7 970
106 Hong Kong Mo11thly Digest of Statistics January 1993
I
ir
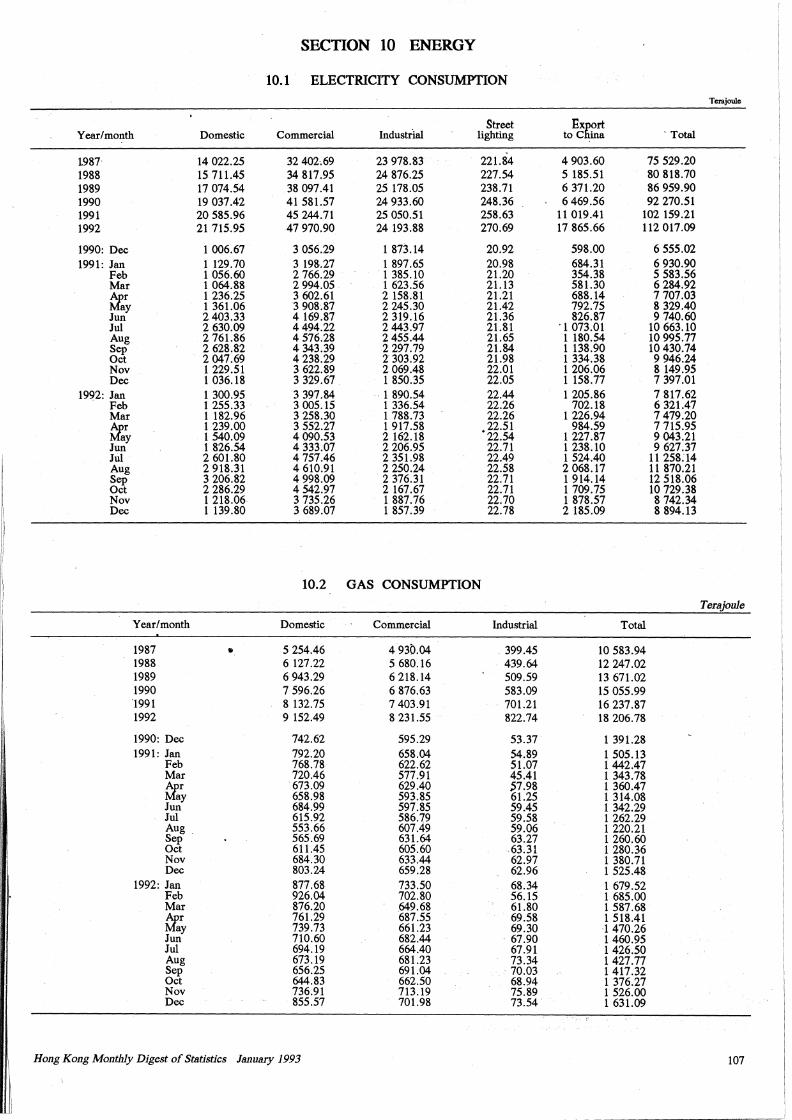
JEI__ ... -----------"-~
SECTION 10 ENERGY
10.l ELECTRICITY CONSUMPTION
Tera joule
Street Ex~rt Year/month Domestic Commercial Industrial lighting toC · a . Total
1987 14 022.25 32 402,69 23 978.83 221.84 4 903.60 75 529.20 1988 15 711.45 34 817.95 24 876.25 227.54 5 185.51 80 818.70 1989 17 074.54 38 097.41 25 178.05 238.71 6 371.20 86 959.90 1990 19 037.42 41 581.57 24 933.60 248.36 6 469.56 92 270.51 1991 20 585.96 45 244.71 25 050.51 258.63 11 019.41 102 159.21 1992 21 715.95 47 970.90 24 193.88 270.69 17 865.66 112 017.09
1990: Dec 1 006.67 3 056.29 1 873.14 20.92 598.00 6 555.02 1991: Jan 1 129.70 3 198.27 1 897.65 20.98 684.31 6 930.90
Feb 1 056.60 2 766.29 1 385.10 21.20 354.38 5 583.56 Mar 1 064.88 2 994.05 1 623.56 21.13 581.30 6 284.92 tJ'ar 1 236.25 3 602.61 2 158.81 21.21 688.14 7 707.03
ay 1 361.06 3 908.87 2 245.30 21.42 792.75 8 329.40 Jun 2 403.33 4 169.87 2 319.16 21.36 826.87 9 740.60 Jul 2 630.09 4 494.22 2 443.97 21.81 · 1 073.01 10 663.10 Aug 2 761.86 4 576.28 2 455.44 21.65 1 180.54 10 995.77 Sep 2 628.82 4 343.39 2 297.79 21.84 1 138.90 10 430.74 Oct 2 047.69 4 238.29 2 303.92 21.98 1 334.38 9 946.24 Nov 1 229.51 3 622.89 2 069.48 22.01 1 206.06 8 149.95 Dec 1 036.18 3 329.67 1 850.35 22.05 1 158.77 7 397.01
1992: Jan 1 300.95 3 397.84 .. 1 890.54 22.44 1 205.86 7 817.62 Feb 1 255.33 3 005.15 1 336.54 22.26 702.18 6 321.47 Mar 1 182.96 3 258.30 1 788.73 22.26 1 226.94 7 479.20 tEr 1 239.00 3 552.27 1 917.58 .22.51 984.59 7 715.95
ay 1 540.09 4 090.53 2 162.18 22.54 1 227.87 9 043.21 Jun 1 826.54 4 333.07 2 206.95 22.71 1 238.10 9 627.37 Jul 2 601.80 4 757.46 2 351.98 22.49 1 524.40 11 258:14 Aug 2 918.31 4 610.91 2 250.24 22.58 2068.17 11 870.21 Sep 3 206.82 4 998.09 2 376.31 22.71 1 914.14 12 518.06 Oct 2 286.29 4 542.97 2 167.67 22.71 1 709.75 10 729.38 Nov 1 218.06 3 735.26 1 887.76 22.70 1 878.57 8 742.34 Dec 1 139.80 3 689.07 1 857.39 22.78 2 185.09 8 894.13
10.2 GAS CONSUMPTION
Tera}oule
Year/month Domestic Commercial Industrial Total
1987 5 254.46 4 930.04 399.45 10 583.94 1988 6 127.22 5 680.16 439.64 12 247.02 1989 6 943.29 6 218.14 509.59 13 671.02 1990 7 596.26 6 876.63 583.09 15 055.99 '1991 8 132.75 7 403.91 701.21 16 237.87 1992 9 152.49 8 231.55 822.74 18 206.78
1990: Dec 742.62 595.29 53.37 1 391.28 1991: Jan 792.20 658.04 54.89 1 505.13
Feb 768.78 622.62 51.07 1 442.47 Mar 720.46 577.91 45.41 1 343.78
! : tEr 673.09 629.40 :;7.98 1 360.47 ay 658.98 593.85 61.25 1 314.08
Jun 684.99 597.85 59.45 1 342.29 Jul 615.92 586.79 59.58 1 262.29 Aug 553.66 607.49 59.06 1 220.21 Sep 565.69 631.64 63.27 1 260.60 Oct 611.45 605.60 63.31 1 280.36 Nov 684.30 633.44 62.97 1 380.71 Dec 803.24 659.28 62.96 1 525.48
1992: Jan 877.68 733.50 68.34 1 679.52 Feb 926.04 702.80 56.15 1 685.00 Mar 876.20 649.68 61.80 1 587.68 ~r 761.29 687.55 69.58 1 518.41
ay 739.73 661.23 69.30 1470.26 Jun 710.60 682.44 67.90 1 460.95 Jul 694.19 664.40 67.91 1426.50 Aug 673.19 681.23 73.34 1 427.77 Sep 656.25 691.04 70.03 1 417.32 Oct 644.83 662.50 68.94 1 376.27 Nov 736.91 713.19 75.89 1 526.00 Dec 855.57 701.98 73.54 1 631.09
i Hong Kong Mo11tlily Digest of Statistics January 1993 107 I
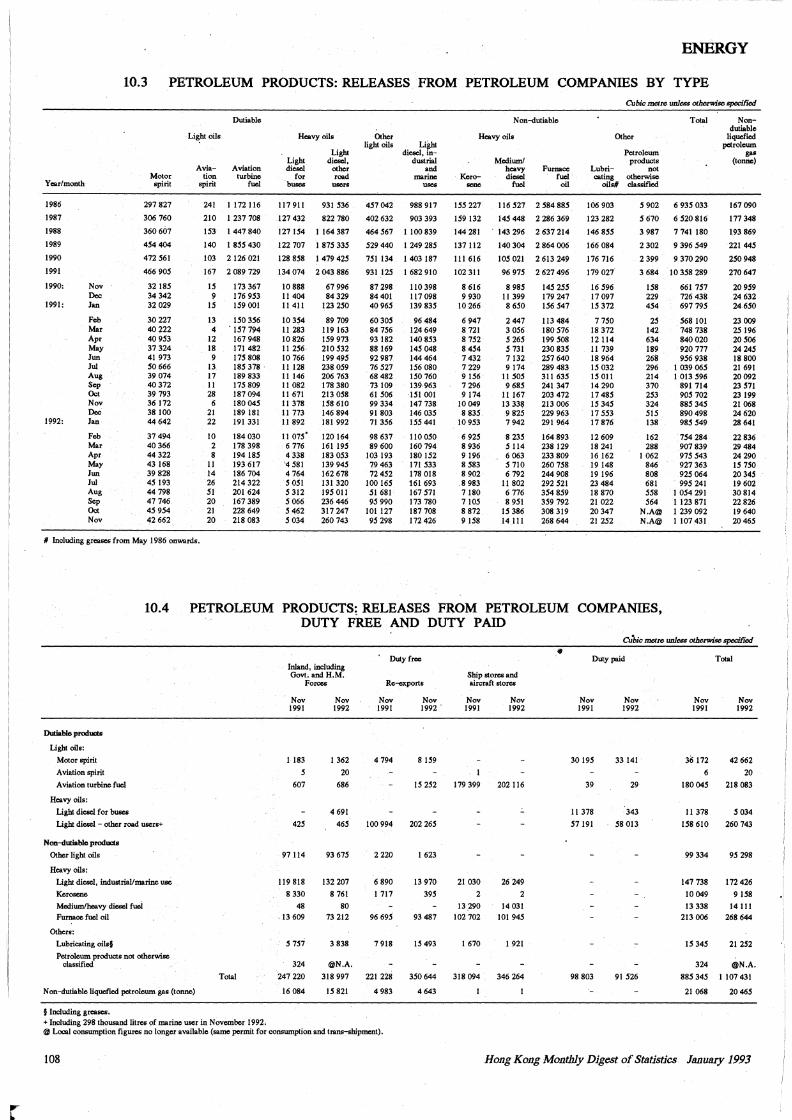
ENERGY
10.3 PETROLEUM PRODUCTS: RELEASES FROM PETROLEUM COMPANIES BY TYPE
Year/month
1986
1987
1988
1989
1990
1991
1990:
1991:
1992:
Nov Dec Jan
Feb Mar Apr May Jun Jui Aug Sep Oct Nov Dec Jan
Feb Mar Apr May Jun Jui Aug Sep Oct Nov
Motor spirit
297 827
306 760
360 607
454 404
472 561
466 905
32 185 34342 32029
30227 40222 40953 37 324 41 973 50 666 39 074 40372 39 793 36 172 38 100 44 642
37 494 40366 44 322 43 168 39 828 45 193 44798 47746 45 954 42 662
Aviation
spirit
Dutiable
Aviation turbine
fuel
241 1172116
210 I 237 708
153 I 447 840
140 I 855 430
103 2 126 021
167 2 089 729
15 173 367 9 176 953
15 159 001
13 150 356 4 . 157 794
12 167 948 18 171 482 9 175 808
13 185 378 17 189833 II 175 809 28 187 094 6 180 045
21 189 181 22 191 331
10 2 8
II 14 26 51 20 21 20
184 030 178 398 194 185 193 617 186 704 214 322 201 624 167 389 228 649 218 083
# Including greases from May 1986 onwards.
Heavy oils
Light Light diesel, diesel other
for road buses users
117911
127 432
931 536
822 780
127 154 I 164 387
122 707 I 875 335
128 858 I 479 425
134 074 2 043 886
10888 II 404 II 411
10 354 II 283 10826 II 256 10 766 11128 II 146 11 082 11 671 11378 11 773 11892
11 075° 6 776 4 338
•4 581 4 764 5 051 5 312 5 066 5 462 5 034
67 996 84329
123 250
89 709 119 163 159 973 210 532 199 495 238 059 206 763 178 380 213 058 158 610 146 894 181 992
120 164 161195 183 053 139 945 162 678 131 320 195 011 236 446 317 247 260 743
Other light oils Light
457 042
402 632
diesel, industrial
and marine
uses
988917
903 393
464 567 I 100 839
529 440 I 249 285
751 134 I 403 187
931 125 1682910
87 298 84 401 40 965
60 305 84 756 93 182 88 169 92 987 76 527 68 482 73109 61506 99 334 91 803 71 356
98 637 89 600
103 193 79 463 72 452
100 165 51 68! 95 990
IOI 127 95 298
110398 117098 139 835
96 484 124649 140 853 145 048 144 464 156 080 150 760 139·963
·151 001 147 738 146 035 155 441
110 050 160 794 180152 171533 178018 161 693 167 571 173 780 187 708 172 426
Non-dutiable
Heavy oils
Medium/ heavy
Kero- diesel Furnace
fuel oil sene fuel
155 227
159 132
144 281
137112
111 616
102 311
8 616 9 930
10266
6 947 8 721 8 752 8 454 7 432 7 229 9 156 7 296 9174
10049 8 835
10 953
6 925 8 936 9 196 8 583 8 9.02
.8 983 7180 7105 8 872 9 158
116 527 2 584 885
145 448 2 286 369
. 143 296 2 637 214
140 304 2 864 006
105 021 2 613 249
96 975 2 627 496
8 985 II 399 8650
2447 3 056 5 265 5 731 7132 9 174
11505 9 685
11167 13 338 9 82.5 7 942
8 235 5114 6 063 5 710 6 792
II 802 6 776 8 951
15386 14111
145 255 179 247 156 547
113 484 180 576 199 508 230 835 257 640 289 483 311 635 241 347 203 472 213 006 229 963 291 964
164 893 238 129 233 809 260 758 244 908 292 521 354 859 359 792 308 319 268 644
Cubic metre unless otherwise specified
Total
Other
Nondutiable
liquefied petroleum
gas (tonne)
Lubricating
oils#
106 903
123 282
146 855
166 084
176 716
179 027'
16 596 17097 15372
7750 18 372 12114 11 739 18 964 15 032 15011 14290 17485 15 345 17 553 17876
12609 18 241 16 162 19 148 19 196 23 484 18 870 21 022 20347 21 252
Petroleum products
not otherwise classified
5 902
5 670
6 935 033
6 520 816
3 987 7 741 180
2 302 9 396 549
2 399 9 370 290
3 684 10 358 289
158 229 454
25 142 634 189 268 296 214 370 253 324 515 138
162 288
1 062 846 808 681 558 564
N.A@ N.A@
661 757 726 438 697 795
568101 748 738 840 020 920 777 956 938
I 039 065 I 013 596
891 714 905 702 885 345 890 498 985 549
754 284 907 839 975 543 927 363 925 064 995 241
I 054 291 I 123 871 I 239 092 1107 431
167 090
177 348
193 869
221 445
250948
270 647
20959 24 632 24 650
23009 25 196 20506 24 245 18 800 21 691 20 092 23 571 23 199 21068 24620 28641
22836 29484 24290 15 750 20345 19 602 30 814 22 826 19 640 20 465
10.4 PETROLEUM PRODUCTS; RELEASES FROM PETROLEUM COMPANIES, DUTY FREE AND DUTY PAID
Dutiable products
Light oils:
Motor spirit
Aviation spirit
Aviation turbine fuel
Heavy oils:
Light diesel for buses
Light diesel - other road users+
Non-dutiable products
Other light oils
Heavy oils:
Light diesel, industrial/marine use
Kerosene Medium/heavy diesel fuei
Furnace fuel oil
Others:
Lubricating oils§
Petroleum products not otherwise classified
Non-dutiable liquefied petroleum gas (tonne)
§ Including greases.
Total
+Including 298 thousaud litres of marine user in November 1992.
Inland, including Govt. and H.M.
Forces
Nov 1991
I 183
5 607
425
97114
119 818
8 330
48 .13609
5 757
Nov 1992
I 362
20
686
4 691
465
93 675
132 207
8 761
80 73 212
3 838
324 @N.A.
Duty free
Re-exports
Nov 1991
4 794
100 994
2220
6 890
I 717
96 695
7918
Nov 1992.
8 159
15 252
202 265
I 623
13 970
395
93 487
15 493
247 220 318 997 221 228 350644
4 643 16 084 15 821 4 983
@Local consumption figures no longer available (same permit for consumption aud !rans-shipment).
108
Ship stores and aircraft stores
Nov 1991
179 399
21 030
2
13.290 102 702
I 670
318 094
Nov 1992
202116
26 249
14 031 101 945
I 921
346 264
Cubic metre unlt:iiG otherwise specified
Duty paid
Nov 1991
30 195
39
II 378
57191
98 803
Nov 1992
33 141
29
'343
58 013
91 526
Nov 1991
36 172
6
180 045
II 378
158610
99 334
147 738
10049
13 338 213 006
15 345
Total
Nov 1992
42 662
20
218 083
5034
260 743
95 298
172 426
9 158
14 111 268 644
21 252
324 @N.A.
885.345 I 107 431
21 068 20465
Hong Kong Monthly Digest of Statistics January 1993
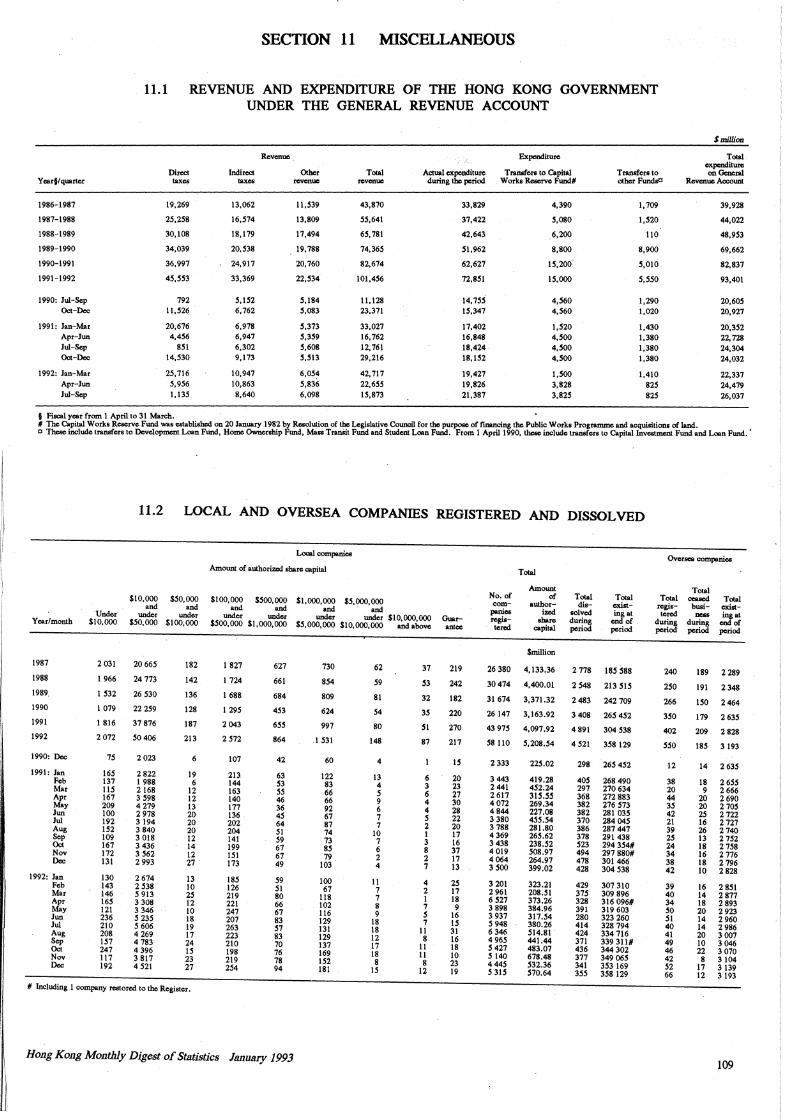
I,
ClnI_ ___ _
Y car§/ quarter
1986-1987
1987-1988
1988-1989
1989-1990
1990-1991
1991-1992
1990: Jui-Sep Oct-Dec
1991: Jan-Mar Apr-Jun Jui-Sep Oct-Dec
1992: Jan-Mar Apr-Jun Jui-Sep
SECTION 11 MISCELLANEOUS
11.1 REVENUE AND EXPENDITURE OF THE HONG KONG GOVERNMENT
11.2
Direct taxes
19,269
2S,2S8
30,108
34,039
36,997
4S,SS3
792 ll,S26
20,676 4,4S6
8Sl 14,S30
2S,116 S,9S6 l,13S
UNDER THE GENERAL REVENUE ACCOUNT
Revenue
Indirect Other taxes revenue
13,062
l6,S74
18,179
20,538
24,917
33,369
S,IS2 6,762
6,978 6,947 6,302 9,173
10,947 10,863 8,640
ll,S39
13,809
17,494
19,788
20,760
22,S34
S,184 S,083
S,373 S,3S9 S,608 S,Sl3
6,0S4 S,836 6,098
Total revenue
43,870
SS,641
6S, 781
14,36S
82,674
101,4S6
ll, 128 23,371
33,027 16,762 12,761 29,216
42,717 22,6SS lS,873
Expenditure
Actual expenditure Transfers to Capital during tJw period Works Reserve Fund#
33,829
37,422
42,643
Sl,962
62,627
72,8Sl
14,1SS !S,347
17,402 16,848 18,424 18,IS2
19,427 19,826 21,387
4,390
5,080
6,200
8,800
lS,200
15,000
4,560 4,S60
l,S20 4,500 4,SOO 4,SOO
1,500 3,828 3,82S
Transfers to other FundsC
1,709
l,S20
110
8,900
S,010
s,sso
1,290 1,020
1,430 l,380 1,380 1,380
1,410 825 82S
LOCAL AND OVERSEA COMPANIES REGISTERED AND DISSOLVED
Smiilion
Total expenditure on General
Revenue Aocount
39,928
44,022
48,9S3
69,662
82,837
93,401
20,60S 20,927
20,3S2 22,728 24,304 24,032
22,337 24,479 26,037
Local companies
Amount of authorized share capital Oversea companies
Year/month
1987
1988
1989.
1990
1991
1992
1990: Dec
1991: Jan Feb Mar Apr May Jun Jui Aug Sep Oct Nov Dec
1992: Jan Feb Mar Apr May Jun Jui Aug Sep Oct Nov Dec
·under $10,000
2031
1966
I S32
l 079
1816
2072
1S
16S 137 115 167 209 100 192 1S2 109 167 172 131
130 143 146 16S 121 236 210 208 157 247 117 192
$10,000 $50,000 and and
under under sso,ooo $100,000
20 66S
24 773
26 S30
22 259
37 876
50 406
2 023
2822 l 988 2168 3 S98 4 279 2 978 3 194 3 840 3 018 3 436 3 S62 2 993
2 674 2 S38 5 913 3 308 3 346 s 23S s 606 4 269 4 783 4 396 3 817 4 s21
182
142
136
128
187
213
6
19 6
12 12 13 20 20 20 12 14 12 27
13 10 2S 12 10 18 19 17 24 15 23 27
# Including l company restored to the Register.
$100,000 $SOO.OOO $1,000,000 $S,OOO,OOO and and and · and
under under under under $10,000,000 $SOO, OOO $1,000,000 $S,000,000 $10,000,000 and above
1827
l 724
I 688
l 29S
2 043
2S72
107
213 144 163 140 177 136 202 204 141 199 ISI 173
18S 126 219 221 247 207 263 223 210 198 219 254
627
661
684
4S3
655
864
42
63 S3 SS 46 36 4S 64 Sl S9 67 67 49
S9 SI 80 66 67 83 S1 83 70 76 78 94
730
854
809
624
997
.I 531
60
122 83 66 66 92 67 87 74 73 8S 79
103
100 67
118 102 116 129 131 129 137 169 1S2 181
62
S9
81
S4
80
148
4
13 4 s 9 6 7 7
10 7 6 2 4
11 7 7 8 9
18 18 12 17 18 8
lS
37
53
32
3S
51
87
6 3 6 4 4 s 2 I 3 8 2 7
4 2 l 7 s 7
11 8
11 11 8
12
Hong Kong Monthly Digest of Statistics January 1993
Guarantee.
219
242
182
220
270
217
IS
20 23 27 30 28 22 20 17 16 37 17 13
25 17 18 9
16 lS 31 16 18 10 23 19
No. of com
panies registered
Total
Amount of
authorized
share capital
$million
26 380 4, 133.36
30 474 4,400.01
31 674 3,371.32
26 147 3,163.92
43 91S 4,097.92
S8 110 5,208.S4
2 333
3 443 2 441 2617 4072 4 844 3 380 3 788 4 369 3 438 4019 4064 3SOO
3 201 2961 6 S21 3 898 3 937 s 948 6 34~ 4 96S s 421 s 140 444S 531S
22S.02
419.28 4S2.24 31S.SS 269.34 227.08 4S5.S4 281.80 26S.62 238.S2 508.97 264.97 399.02
323.21 208.51 373.26 384.96 317.54 380.26 514.81 441.44 483.07 678.48 532.36 570.64
Total dis
solved during period
Total existing at
end of period
2 778 18S 588
2 S48 213 SlS
2 483 242 709
3 408 26S 452
4 891 304 S38
4 S21 3S8 129
298 26S 4S2
40S 268 490 297 270 634 368 272 883 382 276 S73 382 281 035 370 284 04S 386 287 447 378 291 438 S23 294 3S4# 494 297 880# 478 301 466 428 304 S38
429 307 310 315 309 896 328 316 096# 391 319 603 280 323 260 414 328 794 424 334 716 371 339 311# 436 344 302 377 349 065 341 3S3 169 3SS 3S8 129
Total registered
during period
240
250
266
350
402
sso
12
38 20 44 3S 42 21 39 2S 24 34 38 42
39 40 34 so Sl 40 41 49 46 42 52 66
Total ceased business
during period
Total existing at
end of period
189 2 289
191 2348
ISO 2 464
179 2 63S
209 2 828
18S 3 193
14 2 63S
18 2 65S 9 2 666
20 2690 20 2 70S 25 2 722 16 2 727 26 2 740 13 2 752 18 2 758 16 2 776 18 2 796 10 2 828
16 2851 14 2 877 18 2 893 20 2 923 14 2 960 14 2 986 20 3 007 10 3 046 22 3 070 8 3 104
17 3 139 12 3 193
109
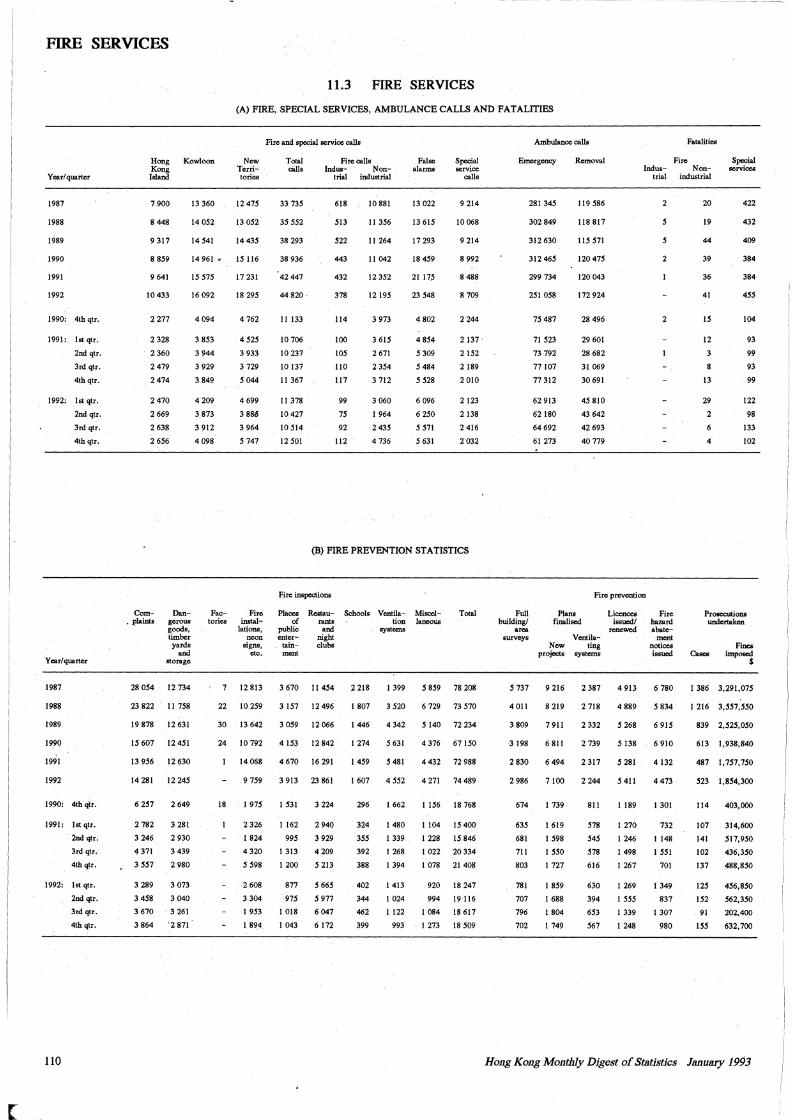
I 1 •
r
FIRE SERVICES
11.3 FIRE SERVICES
(A) FIRE, SPECIAL SERVICES, AMBULANCE CALLS AND FATALITIES
Y f:!iill quarter
1987
1988
1989
1990
1991
1992
1990: 4th qtr.
1991: lstqtr.
2nd qtr.
3rd qtr.
4thqtr.
1992: lst qtr.
2nd qtr.
3rd qtr.
4thqtr.
Y car/ quarter
1987
1988
1989
1990
1991
1992
1990: 4th qlr.
1991: lst qtr.
2nd qtr.
3rd qtr.
4thqtr.
1992: lst qtr.
2nd qtr.
3rd qtr.
4th qtr.
110
Fire and special servioe calls
Hong Kowloon New Territories
Total calls
Fire calls False alarms
Special service
calls Kong Island
7900
8 448
9 317
8 859
9 641
10 433
2 277
2 328
2 360
2 479
2 474
2 470
2 669
2 638
2 656
Com-• plaints
Dangerous goods, timber yards
and storage
28 054 12 734
23 822 11 758
19878 12631
15 607 12 451
13956 12630
14 281 12 245
6 257
2 782
3 246
4 371
3 557
2 649
3 281
2 930
3 439
2980
3 289 3 073
3 458 3 040
3 670 3 261
13 360 12475
14 052 13 052
14541 14435
14 961 " 15 116
15 575 17 231
16092 18295
4 094 4 762
3 853 4 525
3 944 3 933
3 929 3 729
3 849 5 044
4 209 4 699
3 873 3 88-6
3 912 3 964
4 098 5 747
Factories
Fire instal
lations, neon
signs, etc.
33 735
35 552
38 293
38 936
42 447
44 820'
11 133
10 706
10 237
10 137
11 367
11 378
10 427
10 514
12 501
lndus- Non-trial industrial
618
513
522
443
432
378
114
100
105
110
117
99
75
92
112
10 881
11 356
11 264
11 042
12 352
12195
3 973
3 615
2 671
2 354
3 712
3 060
I 964
2 435
4 736
13 022
13 615
17 293
18 459
21 175
23 548
4802
4854
5 309
5484
5 528
6 096
6 250
5 571
5 631
9 214
10068
9 214
8 992
8 488
8 709
2244
2137'
2152
2189
2010
2123
2138
2 416
2032
(B) FIRE PREVENTION STATISTICS
Fire inspwtions
Plaoes of
public enter-_
tainment
Restaurants and
night clubs
Schools Ventilation
systems
Misoellaneous
Total
7 12813 3670 11454 2218 1399 5859 78208
22 10 259 3 157 12 496 I 807 3 520 6 729 73 570
30 13 642 3 059 12 066 1 446 4 342 5 140 72 234
24 10792 4153 12 842 1 274 5 631 4 376 67150
18
14 068
9 759
1 975
2 326
I 824
4 320
5 598
4670 16291
3 913 23 861
I 531 3 224
I 162 2 940
995 3 929
1 313 4 209
1 200 5 213
877 5 665
975 5 977
I 018 6 047
1 459
1 607
296
324
355
392
388
5481
4 552
1 662
1 480
1 339
1 268
1 394
1 413
I 024
1 122
4 432 72 988
4 271 74 489
1156 18 768
1 104 15 400
I 228 15 846
1 022 20 334
I 078 21 408
920 18 247
994 19 116
1 084 18 617
3864 ·2311·
2 608
3 304
I 953
1894 1043 6172
402
344
462
399 993 1 273 18 509
Ambulanoe calls
Emergency
281 345
302 849
312 630
312 465
299 734
251 058
75 487
71523
73 792
77107
77 312
62 913
62 180
64 692
61 273
Removal
119 586
118817
115 571
120 475
120 043
172 924
28 496
29 601
28 682
31 069
30 691
45 810
43 642
42 693
40 779
Fatalities
Fire lndus- Non-
trial industrial
2 20
19
44
39
36
41
15
12
3
8
13
29
2
6
4
Special services
422
432
409
384
384
455
104
93
99
93
99
122
98
133
102
Fire prevention
Full building/
area surveys
Plans Licenoes finalised issued/
Ventila-New ting
projects systems
5 737 9 216
4011 8219
3809 7911
3198 6811
2 830
2 986
674
635
681
711
803
781
707
796
702
6 494
7100
I 739
1619
1 598
1550
1 727
1 859
1 688
1 804
1 749
2 387
2 718
2 332
2 739
2 317
2244
811
578
545
578
616
630
394
653
567
renewed
4 913
4 889
5 268
5 138
5 281
5411
1 189
1 270
1 246
I 498
1 267
1 269
1 555
1 339
1 248
Fire hazard abate
ment notices issued
6 780
5 834
6 915
6 910
4 132
4 473
1301
732
1148
1 551
701
I 349
837
1 307
980
Prosecutions undertaken
Fines Cases imposed
$
1 386 3,291,075
I 216 3,557,550
839 2,525,050
613 1,938,840
487 1,757,750
523 1,854,300
114 403,000
107 314,600
141 517,950
102 436,350
137 488,850
125 456,850
152 562,350
91 202,400
155 632,700
Hong Kong Monthly Digest of Statistics January 1993
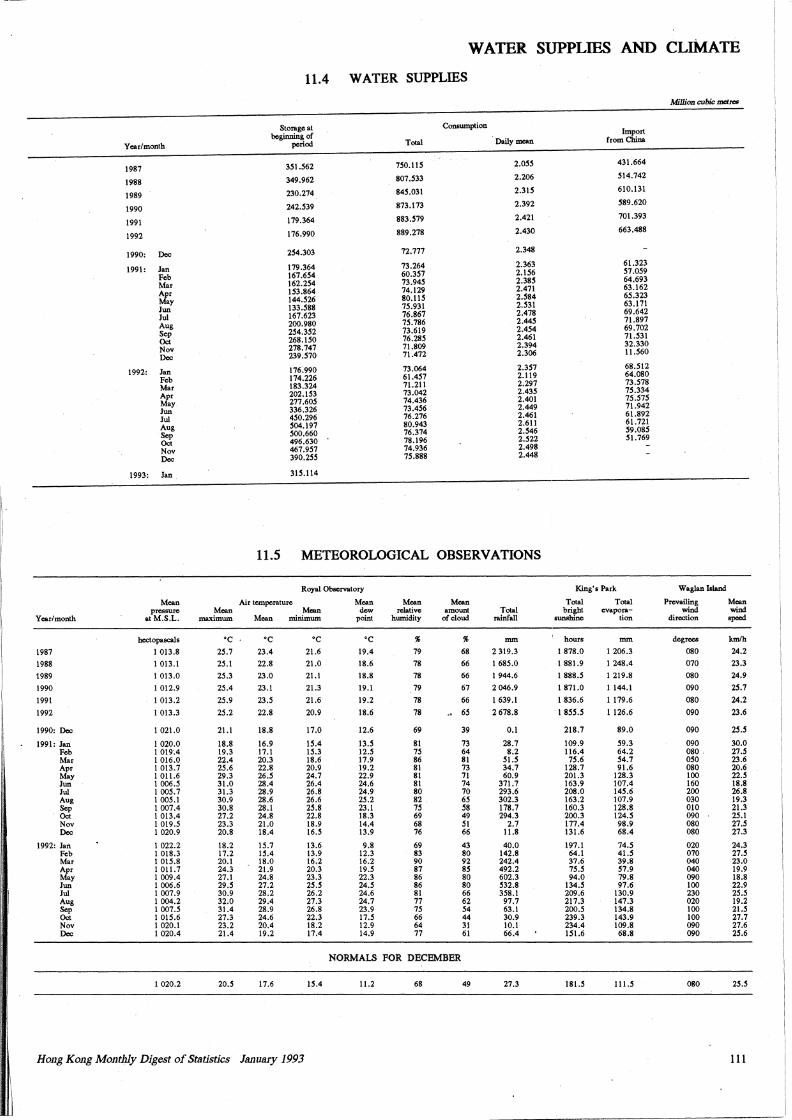
IIllli. - -
WATER. SUPPLIES AND CLIMATE
11.4 WATER SUPPLIES
Millicm cubic mares
Storage at Consumption Import
beginning of Total Daily mean from China
Year/month period
1987 351.562 750.115 2.055 431.664
1988 349.962 807.533 2.206 514.742
1989 230.274 845.031 2.315 610.131
1990 242.539 873.173 2.392 589.620
1991 179.364 883.579 2.421 701.393
1992 176.990 889.278 2.430 663.488
1990: Dec 254.303 72.777 2.348
1991: Jan 179.364 73.264 2.363 61.323
Feb 167.654 60.357 2.156 57.059
Mar 162.254 73.945 2.385 64.693
Apr 153.864 74.129 2.471 63.162
144.526 80.115 2.584 65.323 May
133.588 75.931 2.531 63.171 Jun Jui 167.623 76.867 2.478 69.642
Aug 200.980 75.786 2.445 71.897
Sep 254.352 73.619 2.454 69.702
Oct 268.150 76.285 2.461 71.531
Nov 278.747 71.809 2.394 32.330
Dec 239.570 71.472 2.306 11.560
1992: Jan 176.990 73.064 2.357 68.512
Feb 174.226 61.457 2.119 64.080
Mar 183.324 71.211 2.297 73.578
Apr 202.153 73.042 2.435 75.334
May 277.605 74.436 2.401 75.575
Jun 336.326 73.456 2.449 71.942
Jui 450.296 76.276 2.461 61.892
Aug 504.197 80.943 2.611 61.721
Sep 500.660 76.374 2.546 59.085
Oct 496.630 78.196 2.522 51.769
Nov 467.957 74.936 2.498
Dec 390.255 75.888 2.448
1993: Jan 315.114
11.5 METEOROLOGICAL OBSERVATIONS
Royal Observatory King's Park Waglan Island
Mean Air temperature Mean Mean Mean Total Total Prevailing Mean pressure Mean Mean dew relative amount Total bright evapora- wind wind
Year/month at M.S.L. maximum Mean minimum point humidity of cloud rainfall sunshine tion direction speed
hectopascals •c •c ·c •c % % mm hours mm degrees km/h
1987 1 013.8 25.7 23.4 21.6 19.4 79 68 2 319.3 1 878.0 I 206.3 080 24.2
1988 1 013.1 25.1 22.8 21.0 18.6 78 66 I 685.0 I 881.9 I 248.4 070 23.3
1989 I 013.0 25.3 23.0 21.1 18.8 78 66 I 944.6 I 888.5 I 219.8 080 24.9
1990 1 012.9 25.4 23.1 21.3 19.1 79 67 2 046.9 I 871.0 1144.1 090 25.7
1991 I 013.2 25.9 23.5 21.6 19.2 78 66 1639.1 I 836.6 I 179.6 080 24.2
1992 I 013.3 25.2 22.8 20.9 18.6 78 .. 65 2 678.8 I 855.5 I 126.6 090 23.6
I 1990: Dec I 021.0 21.1 18.8 17.0 12.6 69 39 0.1 218.7 89.0 090 25.5
1991: Jan 1 020.0 18.8 16.9 15.4 13.5 81 73 28.7 109.9 59.3 090 30.0 Feb I 019'.4 19.3 17.1 15.3 12.5 75 64 8.2 116.4 64.2 080 27.5 Mar 1 016.0 22.4 20.3 18.6 17.9 86 81 51.5 75.6 54.7 050 23.6 Apr I 013.7 25.6 22.8 20.9 19.2 81 73 34.7 128.7 91.6 080 20.6
Ii May I 011.6 29.3 26.5 24.7 22.9 81 71 60.9 201.3 128.3 100 22.5 Jun I 006.5 31.0 28.4 26.4 24.6 81 74 371.7 163.9 107.4 160 18.8 Jui 1 005.7 31.3 28.9 26.8 24.9 80 70 293.6 208.0 145.6 200 26.8 Aug I 005.1 30.9 28.6 26.6 25.2 82 65 302.3 163.2 107.9 030 19.3
I
Sep I 007.4 30.8 28.1 25.8 23.I 15 58 178.7 160.3 128.8 010 21.3 Oct 1 013.4 27.2 24.8 22.8 18.3 69 49 294.3 200.3 124.5 090 25.1 Nov I 019.5 23.3 21.0 18.9 14.4 68 51 2.7 177.4 98.9 080 21.5 Dec I 020.9 20.8 18.4 16.5 13.9 76 66 11.8 131.6 68.4 080 27.3
1992: Jan I 022.2 18.2 15.1 13.6 9.8 69 43 40.0 197.1 74.5 020 24.3 Feb I 018.3 17.2 15.4 13.9 12.3 83 80 142.8 64.l 41.5 070 27.5 Mar I 015.8 20.1 18.0 16.2 16.2 90 92 242.4 37.6 39.8 040 23.0 Apr I 011.7 24.3 21.9 20.3 19.5 87 85 492.2 15.5 51.9 040 19.9 May I 009.4 27.1 24.8 23.3 22.3 86 80 602.3 94.0 79.8 090 18.8 Jun I 006.6 29.5 27.2 25.5 24.5 86 80 532.8 134.5 97.6 100 22.9
1· /
Jui I 007.9 30.9 28.2 26.2 24.6 81 66 358.1 209.6 130.9 230 25.5 Aug I 004.2 32.0 29.4 27.3 24.7 77 62 97.7 217.3 147.3 020 19.2 Sep I 001.5 31.4 28.9 26.8 23.9 75 54 63.1 200.5 134.8 100 21.5 Oct I 015.6 27.3 24.6 22.3 11.5 66 44 30.9 239.3 143.9 100 27.7 Nov I 020.1 23.2 20.4 18.2 12.9 64 31 10.1 234.4 109.8 090 27.6
1· Dec I 020.4 21.4 19.2 17.4 14.9 77 61 66.4 151.6 68.8 090 25.6
NORMALS FOR DECEMBER
I I 020.2 20.5 17.6 15.4 11.2 68 49 27.3 181.5 111.5 080 25.5
[,
I Hong Kong Monthly Digest of Statistics January 1993 111

r
•
SPECIAL REVIEW
SALARY STATISTICS OF MIDDLE-LEVEL MANAGERIAL AND PROFESSIONAL EMPLOYEES
This article outlines the survey methodology and the summary findings of the annual Survey of Salaries and Employee Benefits -- Managerial and Professional Employees (Excluding Top Management) which has been conducted since 1984.
Hong Kong Monthly Digest of Statistics January 1993 113
SPECIAL REVIEW
SALARY STATISTICS OF MIDDLE-LEVEL MANAGERIAL AND PROFESSIONAL EMPLOYEES
1. Background
1.1 The Census and Statistics Department conducts a half-yearly Survey of Wages, Salaries and Employee Benefits which covers manual and non-manual workers up to the supervisory level in selected major sectors of the economy.
1.2 In addition, employees at the administrative and professional levels are covered in a separate annual Survey of Salaries and Employee Benefits -- Managerial and Professional Employees (Excluding Top Management) which has been conducted since September 1984. The survey collects information relating to salary rates and fringe benefits of managerial and professional employees. The present article relates to this survey.
2. Objective of the Survey
2.1 The main objective of the annual survey is to compile indices for measuring changes in the salary rates of middle-level managerial and professional employees over time.
2.2 The absolute levels of salary rates are also compiled. Salary rates, however, do not make up the entire pay package, which may include other benefits such as profit-sharing bonus, leave and housing benefits, etc. To put the entire pay package in perspective, statistics are compiled on whether employees are entitled to these different types of benefits.
3. Coverage of the Survey
3.1 Industry coverage The survey covers five major economic sectors, namely the manufacturing/electricity, gas and steam sector, the building and construction and related trades sector, the wholesale, retail and import/export trades sector, the transport, storage and communication sector, and the financial institutions and insurance sector. Only the principal industries within each selected economic sector are included. A total of 22 industry groups are covered.
3.2 Occupational coverage Within each selected major economic sector, common occupations relating to managerial and professional employees within the scope of the survey and having clearly defined duty areas are covered. Occupational classifications and job specifications are defined in advance of the survey. They are based mainly on the International Standard Classification of Occupations (ISCO).
3.3 Employee coverage The survey covers both local and expatriate staff.
3.4 Business unit coverage A company is used as the survey unit in the survey. A company is defined as a business undertaking including establishments in the same economic sector and having the same firs.t 7 digits of the Business Registration Number, i.e. under a single ownership or control. Companies above a certain employment size are surveyed. The minimum size limit varies from industry to industry depending on the nature of business activity.
114 Hong Kong Monthly Digest of Statistics January 1993
I,
1:
I
I I
I I
1'
I' I'
I
[]l'Jlll_ ____ _
i " J
SPECIAL REVIEW
4. Survey method
4.1 Data collected In each round of the survey, information relating to the salary rates of employees for the selected occupations for the reference month of both the current year and the past year is collected. The salary rate is defined to include the following elements: ·
(i) basic salary (including paid holidays and leave); (ii) cost-of-living allowance; (iii) guaranteed year-end bonus; (iv) commission and tips; and (v) other regular and guaranteed bonuses and allowances.
Other items, such as profit-sharing bonus, which may contribute significantly to the total pay package of employees at this level are not included. Fringe benefits and payments in kind are not converted into monetary terms and therefore are also excluded from the definition of salary rate.
4.2
4.3
4.4
In a separate questionnaire, information is collected on employee entitlements to benefits, including:
(i) (ii) (iii) (iv) (v) (vi) (vii) (viii) (ix)
annual leave (in addition to public holidays); housing benefits; provident/retirement fund or pension scheme; insurance scheme (in addition to that required by the Employee's Compensation Legislation); medical benefits; transportation benefits; club membership; profit-sharing bonus; and other benefits.
Data collection m,ethod Data ate collected by the personal interview method.
Survey reference period The reference period is taken as the month of June of each year.
4.5 Sample size and sample design A total of some 200 companies are covered, with an average of about 40 per economic sector. Large companies are fully covered. A panel sample of the· medium-size companies randomly taken from each selected major economic sector is used. Supplementary samples are also drawn each year, to take into account new companies and companies which fall within the scope of the survey for the first time.
5. Statistics compiled and released
5.1 Nominal salary indices Based on the findings of the survey, two nominal salary indices are compiled, viz. Nominal Salary Index (A) and Nominal Salary Index (B). The nominal salary indices are designed to measure pure change in salary rates unaffected by changes in occupational and industrial structures. Base-weighted indices are used, the weights being the total salary bills paid to all employees in the individual occupations. June 1983 is taken as the base period of the indices and the weights are derived from the June 1983 data collected in the 1984 round of the survey_.
5.2 The Nominal Salary Index (A) is compiled by comparing the average of the salary levels of managerial and professional employees for June of the current year with that for June 1983. It reflects changes in salary level resulting from movements across companies and in and out of the occupations, as well as changes in salaries for those who remain in tlie same occupation and the same company in both years.
5.3 On the other hand, the Nominal Salary Index (B) measures changes in salary level only for those who remain in the same occupation and in the same company in both years. It therefore only accounts for changes due to a general increment, meritorious increase and gain in seniority and is useful to personnel managers in making salary adjustments.
Hong Kong Monthly Digest of Statistics January 1993 115
SPECIAL REVIEW
5.4 A Laspeyres base-weighted aggregative index is used. The index formula for a particular occupation . is shown below :-
where
I 0 t = salary index for a given occupation for time period t with reference to the base-period o taken as 100;
R~ J
= total number of employees in the occupation in the r industry in the base-period o;
= average salary rate of employees in the occupation in the ith industry in the current time-period t;
= average salary rate of employees in the occupation in the ith industry in the base-period o.
For computational purpose, the same formula is expressed as :
W· J =
where
LWJ·R ~/ RC! = J J x 100
LW· J
total salary bill paid to all employees in the occupation in the r industry in the base
period o;
salary rate relative for the occupation in the rh industry.
W· Thus the index becomes a weighted average of salary rate relatives, where the weight is __ J_ for the /h industry,
LW· J
r- Wj = and L..J 1 . Ewj
5.5 Real salary indices A Real Salary Index (A) and a Real Salary Index (B) are also compiled by deflating their nominal counterparts by the Hang Seng Consumer Price Index for the reference month. They are designed to measure changes in the purchasing power of salaries.
5.6 Average salary rate To estimate the average monthly salary rate for a particular occupation in a particular sector, it is necessary to estimate the total salary bill (salary rate x number of employees) for that category of employees and the total number of employees in that category. The estimated average salary rate is given by the ratio of the estimated total salary bill to the estimated total number. of employees.
116 Hong Kong Monthly Digest of Statistics January 1993
t-----.-----.~--~
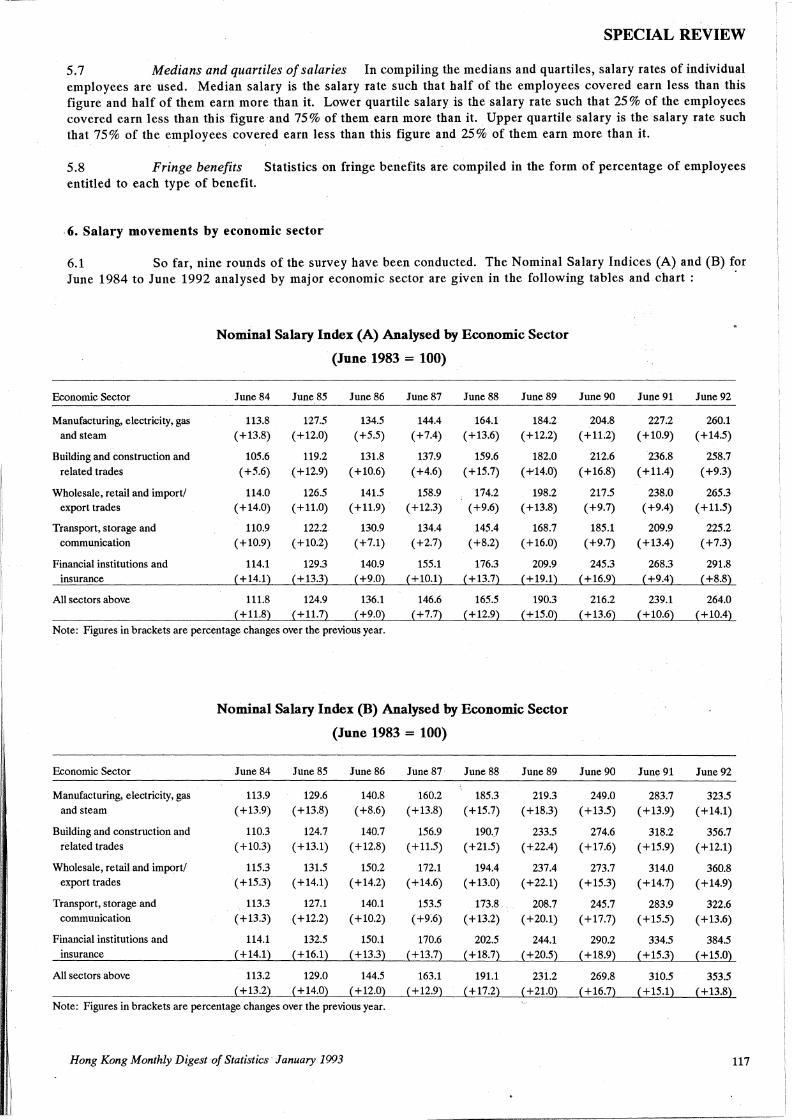
i I
11 ,,
I I.
I I
I I
I'
I:
SPECIAL REVIEW
5.7 Medians and quartiles of salaries In compiling the medians and quartiles, salary rates of individual employees are used. Median salary is the salary rate such that half of the employees covered earn less than this figure and half of them earn more than it. Lower quartile salary is the salary rate such that 25% of the employees covered earn less than this figure and 75% of them earn more than it. Upper quartile salary is the salary rate such that 75% of the employees covered earn less than this figure and 25% of them earn more than it.
5.8 Fringe benefits Statistics on fringe benefits are compiled in the form of percentage of employees entitled to each type of benefit.
. 6. Salary movements by economic sector
6.1 So far, nine rounds of the survey have been conducted. The Nominal Salary Indices (A) and (B) for June 1984 to June 1992 analysed by major economic sector are given in the following tables and chart : ·
Nominal Salary Index (A) Analysed by Economic Sector
(June 1983 = 100)
Economic Sector June 84 June 85 June 86 June 87 June 88 June 89 June 90 June 91 June 92
Manufacturing, electricity, gas 113.8 127.5 134.5 144.4 164.1 184.2 204.8 227.2 260.1 and steam (+13.8) (+12.0) ( +5.5) (+7.4) ( +13.6) (+12.2) ( + 11.2) (+10.9) ( +14.5)
Building and construction and 105.6 119.2 131.8 137.9 159.6 182.0 212.6 236.8 258.7 related trades ( +5.6) ( +12.9) (+10.6) (+4.6) (+15.7) ( +'14.0) ( +16.8) ( +11.4) (+9.3)
Wholesale, retail and import/ 114.0 126.5 141.5 158.9 174.2 198.2 217.5 238.0 265.3 export trades (+14.0) ( +11.0) ( +11.9) (+12.3) ( +9.6) (+13.8) (+9.7) ( +9.4) ( + 11.5)
Transport, storage and 110.9 122.2 130.9 134.4 145.4 168.7 185.1 209.9 225.2 communication ( +10.9) (+10.2) (+7.1) (+2.7) (+8.2) (+16.0) (+9.7) ( +13.4) (+7.3)
Financial institutions and 114.1 129.3 140.9 155.1 176.3 209.9 245.3 268.3 291.8 insurance (+14.1) ( +13.3) ( +9.0) (+10.1) (+13.7) ( +19.1) ( +16.9) ( +9.4) (+8.8)
All sectors above 111.8 124.9 136.1 146.6 165.5 190.3 216.2 239.1 264.0 ( +11.8) ( + 11.7) ( +9.0) (+7.7) (+12.9) (+15.0) ( +13.6) (+10.6) (+10.4)
Note: Figures in brackets are percentage changes over the previous year.
Nominal Salary Index (B) Analysed by Economic Sector
(June 1983 = 100)
Economic Sector June 84 June 85 June 86 June 87 June 88 June 89 June 90 June 91 June 92
Manufacturing, electricity, gas 113.9 129.6 140.8 160.2 185.3 219.3 249.0 283.7 323.5 and steam ( +13.9) ( +13.8) ( +8.6) ( +13.8) ( + 15.7) ( +18.3) ( +13.5) (+13.9) (+14.1)
Building and construction and 110.3 124.7 140.7 156.9 190.7 233.5 274.6 318.2 356.7 related trades ( +10.3) (+13.1) ( +12.8) ( +11.5) ( +21.5) ( +22.4) ( +17.6) (+15.9) (+12.1)
Wholesale, retail and import/ 115.3 131.5 150.2 172.1 194.4 237.4 273.7 314.0 360.8 export trades ( +15.3) (+14.1) (+14.2) (+14.6) (+13.0) (+22.1) ( +15.3) (+14.7) ( +14.9)
Transport, storage and 113.3 127.1 140.1 153.5 173.8 208.7 245.7 283.9 322.6 communication ( +13.3) ( +12.2) (+10.2) ( +9.6) ( +13.2) (+20.1) (+17.7) ( +15.5) (+13.6)
Financial institutions and 114.1 132.5 150.1 170.6 202.5 244.1 290.2 334.5 384.5 insurance ( + 14.1) (+16.1) ( +13.3) ( +13.7) ( + 18.7) ( +20.5) ( +18.9) ( +15.3) (+15.0)
All sectors above 113.2 129.0 144.5 163.1 191.1 231.2 269.8 310.5 353.5 ( +13.2) ( +14.0) ( +12.0) (+12.9) ( +17.2) ( +21.0) (+16.7) ( +15.1) ( +13.8)
Note: Figures in brackets are percentage changes over the previous year.
Hong Kong Monthly Digest of Statistics January 1993 117
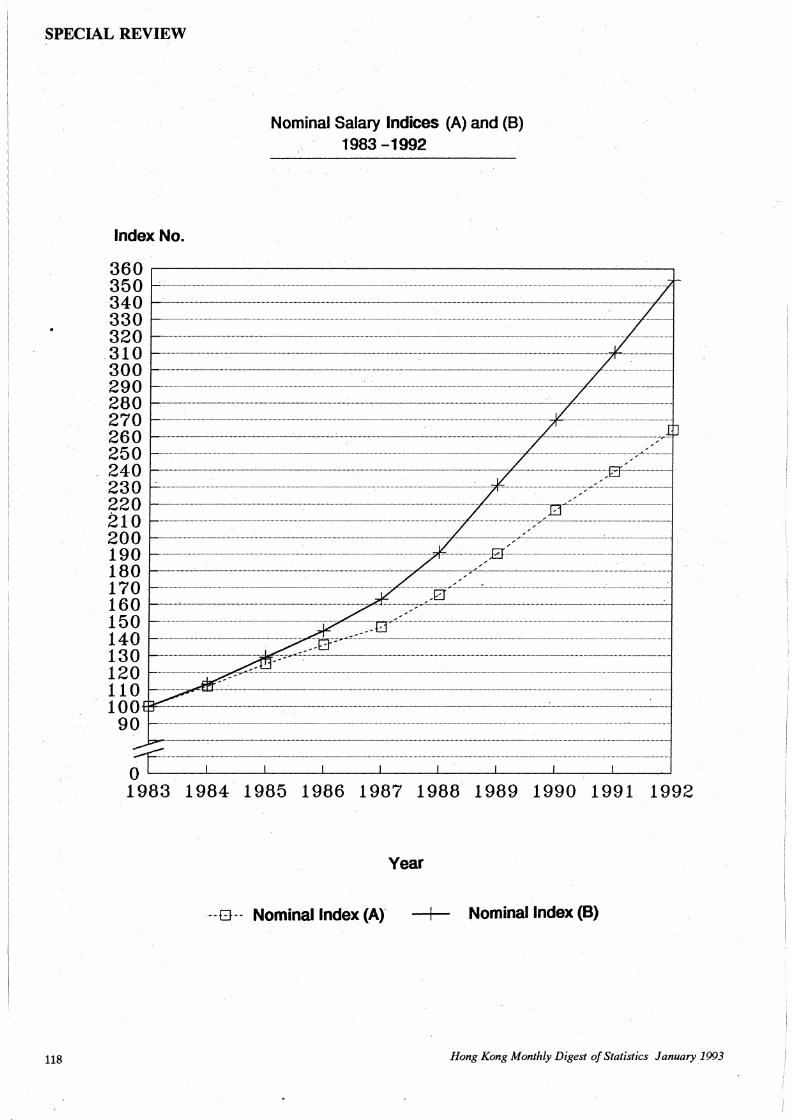
SPECIAL REVIEW
Nominal Salary Indices (A) and (B) 1983 -1992
Index No.
360.--~~~~~~~~~~~~~~~~~~~~
350 ........................... . 340 ............................ . 330 .................................... ----·--·····--· -······ 320 ····························································································-········· .
. 310 300 ..................................... -················································································································································································································· -- .. 290 ..................................................................................................................................... -- ······· 280 ·····--············································································-········ ·············································· 270 260 ................ . --···--········-···························································································································· 250 ................................................................................................................................................................. . 240 .............................................. . .. . 230 .................................................... ....................... ·····························-··················-········ 220 .................................................................................................... ............ .. ................ . 210 ....................................................................................... .. ............................................................................. . ., ...................................................... ,.•.··············································································"····················! 200 . ... ... ...... .... .. ---··· .. 190 ........................................ .................. ---·· 1·80 ············--· ····················································· ... .. 170 ································································································· 160 .................................................................................................................... . 150 140 ........................................ . 130 120 ....... . 110 100 .................................................................................................................................................................. -···· ...... . .. .
90 . . - '
1984 1985 1986 1987 1988 1989 1990 1991 1992
Year
·--G-- Nominal Index (A) -+- Nominal Index (B)
118 Hong Kong Monthly Digest of Statistics January 1993
I··-- .. ··- ---------
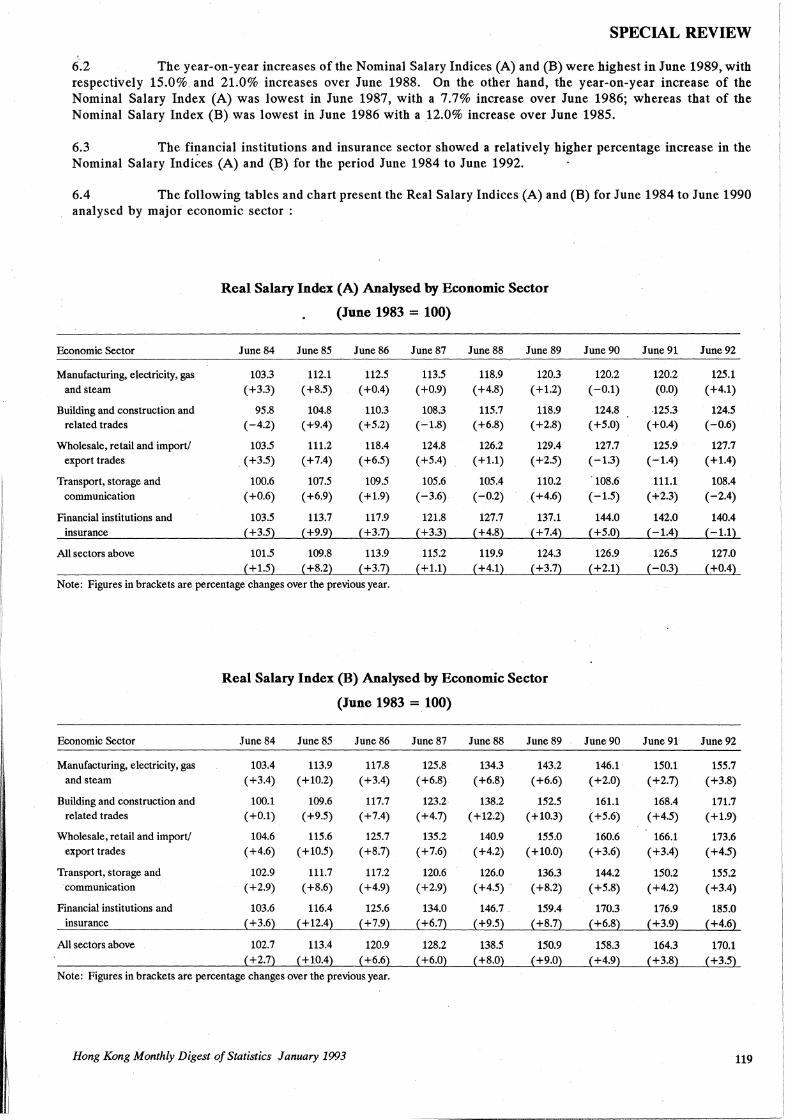
I
I
r·
I
r:
I
1.
-- --------------·------- ---------~------- ----
SPECIAL REVIEW
6.2 The year-on-year increases of the Nominal Salary Indices (A) and (B) were highest in June 1989, with respectively 15.0% and 21.0% increases over June 1988. On the other hand, the year-on-year increase of the Nominal Salary Index (A) was lowest in June 1987, with a 7.7% increase over June 1986; whereas that of the Nominal Salary Index (B) was lowest in June 1986 with a 12.0% increase over June 1985.
6.3 The fi1:1ancial institutions and insurance sector showed a relatively higher percentage increase in the Nominal Salary Indices (A) and (B) for the period June 1984 to June 1992.
6.4 The following tables and chart present the Real Salary Indices (A) and (B) for June 1984 to June 1990 analysed by major economic sector :
Real Salary Index (A) Analysed by Economic Sector
(June 1983 = 100)
Economic Sector June 84 June 85 June 86 June 87 June 88 June 89 June 90 June 91 June 92
Manufacturing, electricity, gas 103.3 112.1 112.5 113.5 118.9 120.3 120.2 120.2 125.1 and steam (+3.3) (+8.5) ( +0.4) (+0.9) (+4.8) (+1.2) (-0.1) (0.0) (+4.1)
Building and construction and 95.8 104.8 110.3 108.3 115.7 118.9 124.8 125.3 124.5 related trades (-4.2) ( +9.4) (+5.2) (-1.8) (+6.8) (+2.8) (+5.0) (+0.4) (-0.6)
Wholesale, retail and import/ 103.5 111.2 118.4 124.8 126.2 129.4 127.7 125.9 127.7 export trades . ( +3.5) ( +7.4) ( +6.5) ( +5.4) ( +1.1) ( +2.5) (-1.3) (-1.4) ( +1.4)
Transport, storage and 100.6 107.5 109.5 105.6 105.4 110.2 · 108.6 111.1 108.4 communication ( +0.6) ( +6.9) ( +1.9) (-3.6) (-0.2) (+4.6) (-1.5) ( +2.3) (-2.4)
Financial institutions and 103.5 113.7 117.9 121.8 127.7 137.1 144.0 142.0 140.4 insurance ( +3.5} (+9.9} ( +3.7} ( +3.3} (+4.8} ( +7.4} (+5.0} (-1.4} (-1.1}
All sectors above 101.5 109.8 113.9 115.2 119.9 124.3 126.9 126.5 127.0 ( +1.52 (+8.22 (+3.7) (+1.1) ( +4.1) (+3.72 ( +2.12 (-0.3) (+0.4}
Note: Figures in brackets are percentage changes over the previous year.
Real Salary Index (B) Analysed by Economic Sector
(June 1983 = 100)
Economic Sector June 84 June 85 June 86 June 87 June 88 June 89 June 90 June 91 June 92
Manufacturing, electricity, gas 103.4 113.9 117.8 125.8 134.3 143.2 146.1 150.1 155.7 and steam ( +3.4) (+10.2) ( +3.4) (+6.8) ( +6.8) (+6.6) (+2.0) (+2.7) (+3.8)
Building and construction and 100.1 109.6 117.7 123.2 138.2 152.5 161.1 168.4 171.7 related trades (+0.1) ( +9.5) ( +7.4) (+4.7) ( +12.2) (+10.3) (+5.6) (+4.5) ( +1.9)
Wholesale, retail and import/ 104.6 115.6 125.7 135.2 140.9 155.0 160.6 166.1 173.6 export trades (+4.6) ( +10.5) (+8.7) ( +7.6) (+4.2) (+10.0) (+3.6) (+3.4) ( +4.5)
Transport, storage and 102.9 111.7 117.2 120.6 126.0 136.3 144.2 150.2 155.2 communication ( +2.9) ( +8.6) (+4.9) (+2.9) ( +4.5) (+8.2) (+5.8) (+4.2) (+3.4)
Financial institutions and 103.6 116.4 125.6 134.0 146.7. 159.4 170.3 176.9 185.0 insurance ( +3.6) ( +12.4} ( +7.9) ( +6.7) ( +9.5) ( +8.7) (+6.8} (+3.9) (+4.62
All sectors above 102.7 113.4 120.9 128.2 138.5 150.9 158.3 164.3 170.1 (+2.7) ( +10.4) (+6.6) (+6.0} (+8.0) ( +9.0} (+4.9) ( +3.8} ( +3.5}
Note: Figures in brackets are percentage changes over the previous year.
Hong Kong Monthly Digest of Statistics January 1993 119
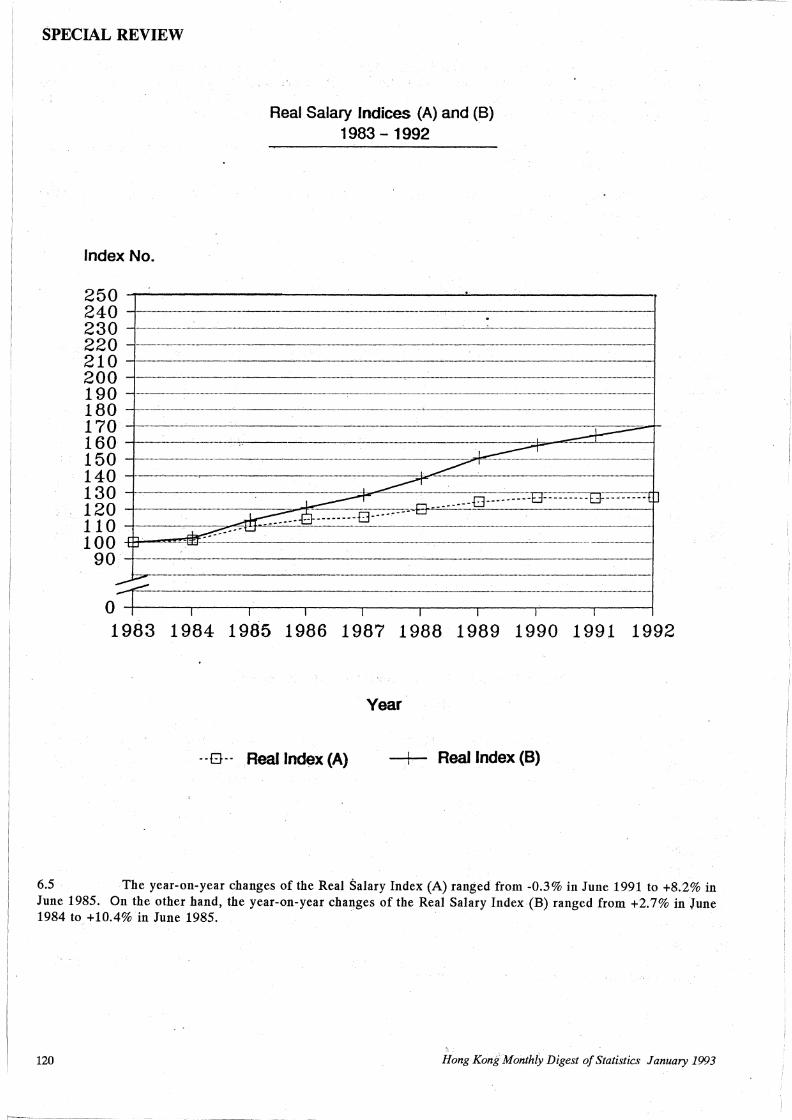
I I .
I I
SPECIAL REVIEW
Index No.
Real Salary Indices (A) and (B) 1983 - 1992
250 ---~~~~~~~~~~~~~~-'-~~~~~~~-, 240 230 220 210 200 190 180 170 160 150 140 130 120 110 1 0 0 ..J:tl.;.._,.,,,,,,~
90
0 -1-~~---.-~~---.-~~-..-~~-,..-~~-..-~~-..-~~---r-~~-.~~-j
1983 1984 1985 1986 1987 1988 1989 1990 1991 1992
Year
--G-- Real Index (A) -+- Real Index (B)
6.5 The year-on-year changes of the Real Salary Index (A) ranged from -0.3% in June 1991 to +8.2% in June 1985. On the other hand, the year-on-year changes of the Real Salary Index (B) ranged from +2. 7% in June 1984 to +10.4% in June 1985.
120 Hong Kong Monthly Digest of Statistics January 1993
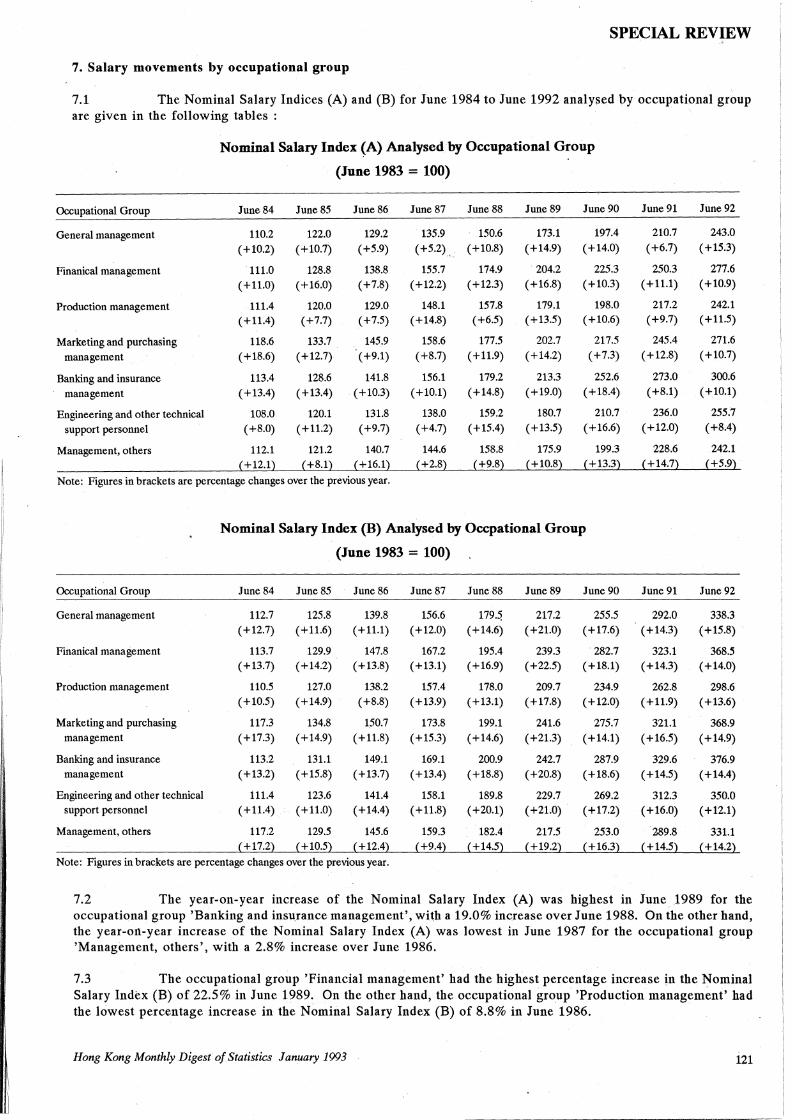
I
I 1,
1·
I;
1:
Ii !
SPECIAL REVIEW
7. Salary movements by occupational group
7.1 The Nominal Salary Indices (A) and (B) for June 1984 to June 1992 analysed by occupational group are given in the following tables :
Occupational Group
General management
Finanical management
Production management
Marketing and purchasing management
Banking and insurance management
Engineering and other technical support personnel
Management, others
Nominal Salary Index (A) Analysed by Occupational ~oup
(June 1983 = 100)
June 84 June 85 June 86 June 87 June 88 June 89 June 90
110.2 122.0 129.2 135.9 150.6 173.1 197.4
(+10.2) (+10.7) ( +5.9) ( +5.2). (+10.8) ( +14.9) (+14.0)
111.0 128.8 138.8 155.7 174.9 204.2 225.3
( +11.0) (+16.0) (+7.8) (+12.2) ( +12.3) ( +16.8) ( + 10.3)
111.4 120.0 129.0 148.1 157.8 179.1 198.0
(+11.4) ( +7.7) (+7.5) (+14.8) ( +6.5) (+13.5) (+10.6)
118.6 133.7 145.9 158.6 177.5 202.7 217.5
( +18.6) (+12.7) ( +9.1) ( +8.7) ( +11.9) ( +14.2) ( +7.3)
113.4 128.6 141.8 156.1 179.2 213.3 252.6
(+13.4) ( +13.4) ( +10.3) ( +10.1) ( +14.8) (+19.0) ( +18.4)
108.0 120.1 131.8 138.0 159.2 180.7 210.7
(+8.0) ( + 11.2) ( +9.7) ( +4.7) ( +15.4) ( +13.5) ( +16.6)
112.1 121.2 140.7 144.6 158.8 175.9 199.3
(+12.1) (+8.1) ( +16.1) (+2.8) (+9.8) (+10.8) ( +13.3)
Note: Figures in brackets are percentage changes over the previous year.
Occupational Group
General management
Finanical management
Production management
Marketing and purchasing management
Banking and insurance management
Engineering and other technical support personnel
Management, others
Nominal Salary Index (B) Analysed by Occpational Group
(June 1983 = 100)
June 84 June 85 June 86 June 87 June 88 June 89 June 90
112.7 125.8 139.8 156.6 179.~ 217.2 255.5 (+12.7) ( +11.6) (+11.1) (+12.0) ( + 14.6) ( +21.0) (+17.6)
113.7 129.9 147.8 167.2 195.4 239.3 282.7 (+13.7) (+14.2) (+13.8) ( +13.1) ( +16.9) ( +22.5) (+18.1)
110.5 127.0 138.2 157.4 178.0 209.7 234.9 (+10.5) (+14.9) (+8.8) ( +13.9) ( +13.1) (+17.8) (+12.0)
117.3 134.8 150.7 173.8 199.1 241.6 275.7 ( +17.3) ( +14.9) ( +11.8) ( + 15.3) ( +14.6) ( +21.3) (+14.1)
113.2 131.1 149.1 169.1 200.9 242.7 287.9 (+13.2) (+15.8) (+13.7) ( +13.4) ( +18.8) (+20.8) (+18.6)
111.4 123.6 141.4 158.1 189.8 229.7 269.2 ( +11.4) ( + 11.0) (+14.4) ( +11.8) (+20.1) ( +21.0) ( + 17.2)
117.2 129.5 145.6 159.3 182.4 217.5 253.0 ( +17.2) ( +10.5) ( +12.4) ( +9.4) (+14.5) (+19.2) ( +16.3)
Note: Figures in brackets are percentage changes over the previous year.
June 91 June92
210.7 243.0 (+6.7) ( +15.3)
250.3 277.6
(+11.1) ( +10.9)
217.2 242.1 (+9.7) ( +11.5)
245.4 271.6 ( +12.8) ( +10.7)
273.0 300.6 ( +8.1) (+10.1)
236.0 255.7 ( +12.0) ( +8.4)
228.6 242.1 (+14.7) ( +5.9)
June 91 June 92
292.0 338.3 ( +14.3) ( +15.8)
323.1 368.5 ( + 14.3) (+14.0)
262.8 298.6 ( +11.9) (+13.6)
321.1 368.9 ( +16.5) ( +14.9)
329.6 376.9 ( + 14.5) ( +14.4)
312.3 350.0 (+16.0) (+12.1)
289.8 331.1 ( +14.5) (+14.2)
7.2 The year-on-year increase of the Nominal Salary Index (A) was highest in June 1989 for the occupational group 'Banking and insurance management', wHh a 19.0% increase over June 1988. On the other hand, the year-on-year increase of the Nominal Salary Index (A) was lowest in June 1987 for the occupational group 'Management, others', with a 2.8% increase over June 1986.
7.3 The occupational group 'Financial management' had the highest percentage increase in the Nominal Salary Index (B) of 22.5% in June 1989. On the other hand, the occupational group 'Production management' had the lowest percentage increase in the Nominal Salary Index (B) of 8.8% in June 1986.
Hong Kong Monthly Digest of Statistics January 1993 121
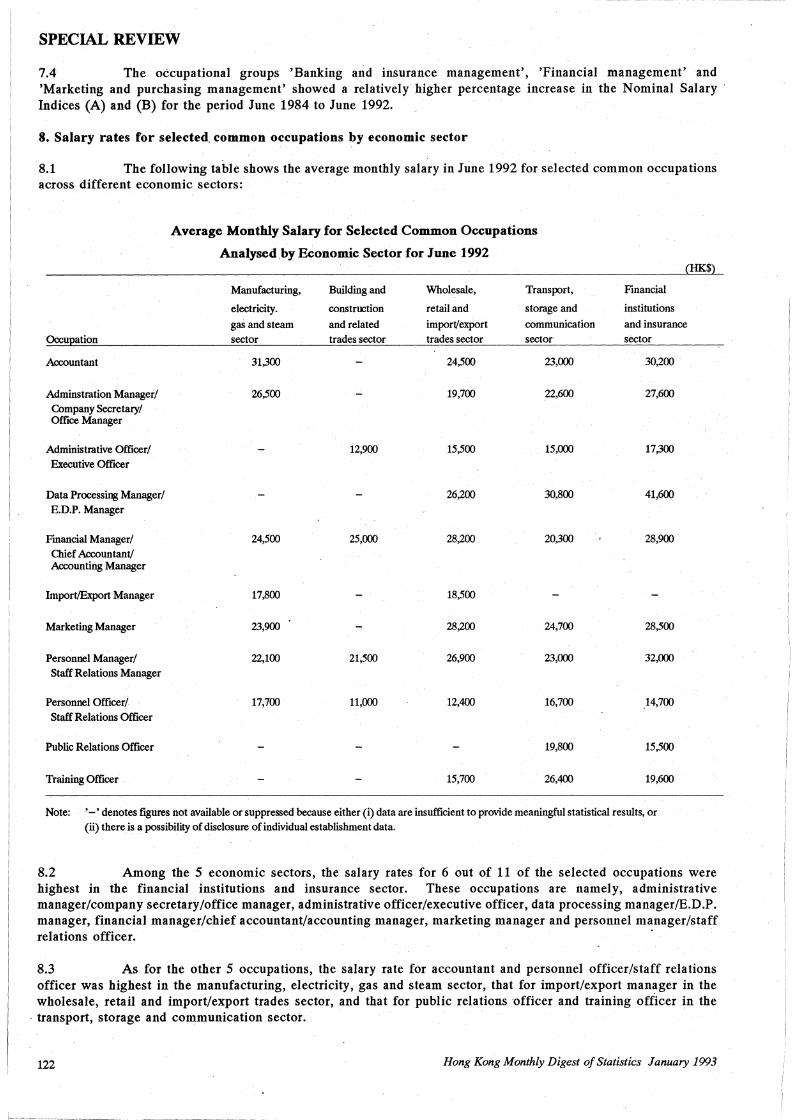
SPECIAL REVIEW
7.4 The occupational groups 'Banking and insurance management', 'Financial management' and 'Marketing and purchasing management' showed a relatively higher percentage increase in the Nominal Salary Indices (A) and (B) for the period June 1984 to June 1992.
8. Salary rates for selected. common occupations by economic sector
8.1 The following table shows the average monthly salary in June 1992 for selected common occupations across different economic sectors:
Average Monthly Salary for Selected Common Occupations
Analysed ,by Economic Sector for June 1992
Manufacturing, Building and Wholesale, Transport, Financial
electricity. construction retail and storage and institutions
gas and steam and related import/export communication and insurance
Occupation sector trades sector trades sector sector sector
Accountant 31,300 24,500 23,000 30,200
Adminstration Manager/ 26,500 19,700 22,600 27,600 Company Secretary/ Office Manager
Administrative Officer/ 12,900 15,500 15,000 17,300 Executive Officer
Data Processing Manager/ 26,200 30,800 41,600
E.D.P. Manager
Financial Manager/ 24,500 25,000 28,200 20,300 28,900 Chief Accountant/ Accounting Manager
Import/Export Manager 17,800 18,500
Marketing Manager 23,900 28,200 24,700 28,500
Personnel Manager/ 22,100 21,500 26,900 23,000 32,000 Staff Relations Manager
Personnel Officer/ 17,700 11,000 12,400 16,700 14,700 Staff Relations Officer
Public Relations Officer 19,800 15,500
Training Officer 15,700 26,400 19,600
Note: '-'denotes figures not available or suppressed because either (i) data are insufficient to provide meaningful statistical results, or (ii) there is a possibility of disclosure of individual establishment data.
HK$
8.2 Among the 5 economic sectors, the salary rates for 6 out of 11 of the selected occupations were highest in the financial institutions and insurance sector. These occupations are namely, administrative manager/company secretary/office manager, administrative officer/executive officer, data processing manager/E.D.P. manager, financial manager/chief accountant/accounting manager, marketing manager and personnel manager/staff relations officer. ·
8.3 As for the other 5 occupations, the salary rate for accountant and personnel officer/staff relations officer was highest in the manufacturing, electricity, gas and steam sector, that for import/export manager in the wholesale, retail and import/export trades sector, and that for public relations officer and training officer in the
· transport, storage and communication sector.
122 Hong Kong Monthly Digest of Statistics January 1993
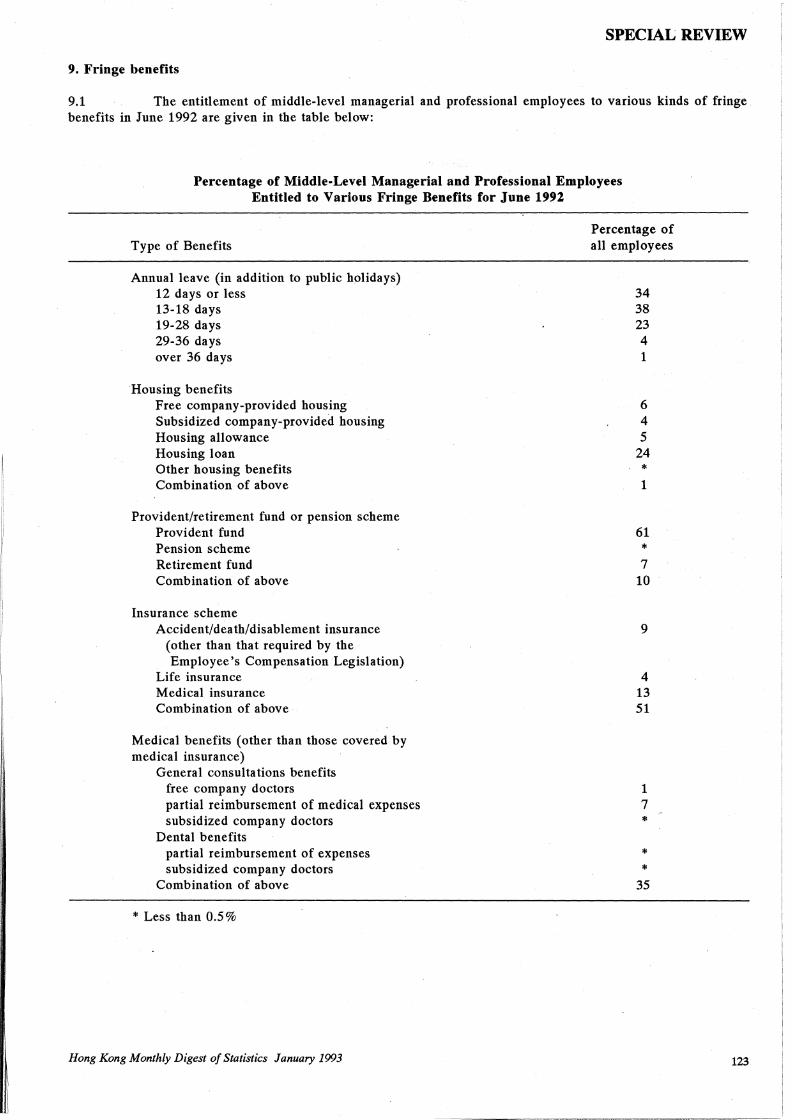
1.
! , ,
I
I,
JlE:I_ __ ----------------
SPECIAL REVIEW
9. Fringe benefits
9.1 The entitlement of middle-level managerial and professional employees to various kinds of fringe benefits in June 1992 are given in the table below:
Percentage of Middle-Level Managerial and Professional Employees Entitled to Various Fringe Benefits for June 1992
Type of Benefits
Annual leave (in addition to public holidays) 12 days or less 13-18 days 19-28 days 29-36 days over 36 days
Housing benefits Free company-provided housing Subsidized company-provided housing Housing allowance Housing loan Other housing benefits Combination of above
Provident/retirement fund or pension scheme Provident fund Pension scheme Retirement fund Combination of above
Insurance scheme Accident/death/ disablement insurance
(other than that required by the Employee's Compensation Legislation)
Life insurance Medical insurance Combination of above
Medical benefits (other than those covered by medical insurance)
General consultations benefits free company doctors partial reimbursement of medical expenses subsidized company doctors
Dental benefits partial reimbursement of expenses subsidized company doctors
Combination of above
* Less than 0.5 %
Hong Kong Monthly Digest of Statistics January 1993
Percentage of all employees
34 38 23 4 1
6 4 5
24 * 1
61 * 7
10
9
4 13 51
1 7
*
* *
35
123
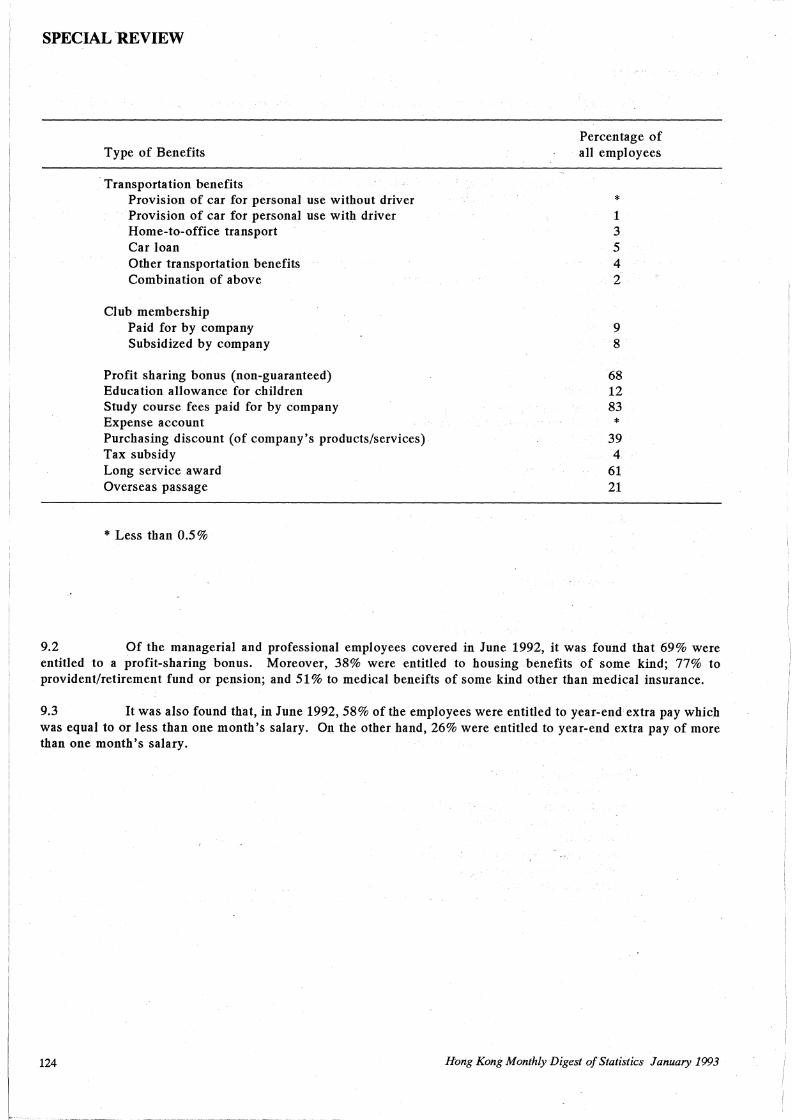
SPECIAL 'REVIEW
Type of Benefits
·Transportation benefits Provision of car for personal use without driver Provision of car for personal use with driver Home-to-office transport Car loan Other transportation benefits Combination of above
Club membership Paid for by company Subsidized by company
Profit sharing bonus (non-guaranteed) Education allowance for children Study course fees paid for by company Expense account Purchasing discount (of company's products/services) Tax subsidy Long service award Overseas passage
* Less than 0.5%
Percentage of all employees
* 1 3 5 4 2
9 8
68 12 83
* 39 4
61 21
9.2 Of the managerial and professional employees covered in June 1992, it was found that 69% were entitled to a profit-sharing bonus. Moreover, 38% were entitled to housing benefits of some kind; 77% to provident/retirement fund or pension; and 51 % to medical beneifts of some kind other than medical insurance.
9.3 It was also found that, in June 1992, 58% of the employees were entitled to year-end extra pay which was equal to or less than one month's salary. On the other hand, 26% were entitled to year-end extra pay of more than one month's salary.
124 Hong Kong Monthly Digest of Statistics January 1993
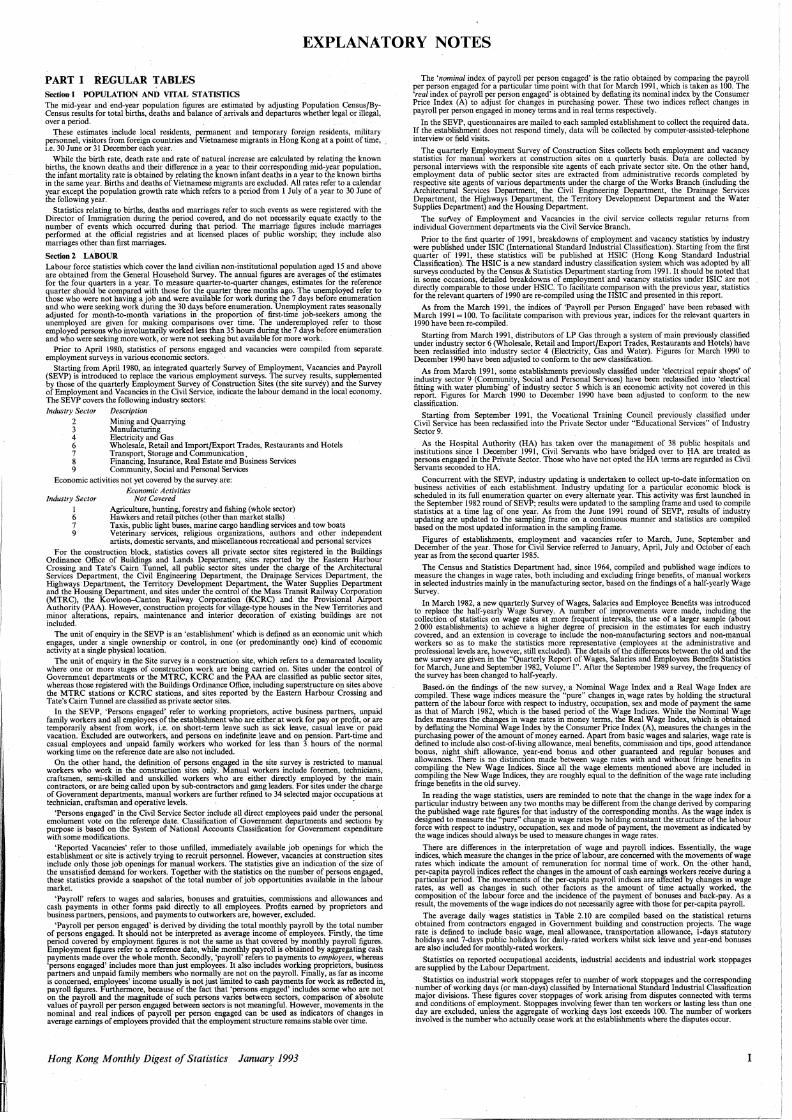
I,
I'
I' I,
J'llL.
EXPLANATORY NOTES
PART I REGULAR TABLES Section I POPULATION AND VITAL STATISTICS The mid-year and end-year population figures are estimated by adjusting Population Census/ByCensus results for total births, deaths and balance of.arrivals and departures whether legal or illegal, over a period.
J:hese estimates include local residents, permanent and temporary foreign residents, military personnel, visitors from foreign countries and Vietnamese migrants in Hong Kong at a point of time, i.e. 30 June or 31 December each year.
While the birth rate, death rate and rate of natural increase are c~lculated by relating the known births, the known deaths and their difference in a year to thei~ corresponding mid-year population, the infant mortality rate is obtained by relating the known infant deaths in a year to the known births in the same year. Births and deaths of Vietnamese migrants are excluded. All rates refer to a calendar year except the population growth rate which refers to a period from 1 July of a year to 30 June of the following year.
Statistics relating to births, deaths and marriages refer to such events as were registered with the Director of Immigration during the period covered, and do not necessarily equate exactly to the number of events which occurred during that period. The marriage figures include marriages performed at the official registries and at licensed places of public worship; they include also marriages other than first marr.iages.
Section 2 LABOUR Labour force statistics which cover the land civilian non-institutional population aged 15 and above are obtained from the General Household Survey. The annual figures are averages of the· estimates for the four quarters in a year. To measure quarter-to-quarter changes, estimates for the reference quarter should be compared with those for the quarter three months ago. The unemployed refer to those who were not having a job and were available for work during the 7 days before enumeration and who were seeking work during the 30 days before enumeration. Unemployment rates seasonally adjusted for month-to-month variations in the proportion of first-time job-seekers among the unemployed are given for making comparisons over time. The underemployed refer to those employed persons who involuntarily worked less than 35 hours during the 7 days before eni.Imeration and who were seeking more work, or were not seeking but available for more work.
Prior to April 1980, statistics of persons engaged and vacancies were compiled from separate employment surveys in various economic sectors. ,
Starting from April 1980, an integrated quarterly Survey of Employment, Vacancies and Payroll (SEyP) is introduced to replace the various employment surveys. The survey results, supplemented by those of the quarterly Employment Survey of Construction Sites (the site survey) and the Survey of Employment and Vacancies in the Civil Service, indicate the labour demand in the local economy. The SEVP covers the following industry sectors: Industry Sector Description
2 Mining and Quarrying 3 Manufacturing 4 Electricity and Gas 6 Wholesale, Retail and Import/Export Trades, Restaurants and Hotels 7 Transport, Storage and Communication. 8 Financing, Insurance, Real Estate and Business Services 9 Community, Social and Personal Services
Economic activities not yet covered by the survey are:
Industry Sector l 6 7 9
Economic Activities Not Covered
Agriculture, hunting, forestry and fishing (whole sector) Hawkers and retail pitches (other than market stalls) Taxis, public light buses, marine cargo handling services and tow boats Veterinary services, religious organizations, authors and other independent artists, domestic servants, and miscellaneous recreational and personal services
For the construction block, statistics covers all private sector sites registered in the Buildings Ordinance Office of Buildings and Lands Department, sites reported by the Eastern Harbour Crossing and Tate's Cairn Tunnel, all public sector sites under the charge of the Architectural Services Department, the Civil Engineering Department, the Drainage Services DepartmenJ, the Highways Department, the Territory Development Department, the Water Supplies Department and the Housing Department, and sites under the control of the Mass Transit Railway Corporation (MTRC), the Kowloon-Canton Railway Corporation (KCRC) and the Provisional Airport Authority (PAA). However, construction projects for village-type houses in the New Territories and minor· alterations, repairs, maintenance and interior decoration of existing buildings are not included.
The unit of enquiry in the SEVP is- an 'establislunent' which is defined as an economic unit which engages, under a single ownership or control, in one (or predominantly one) kind of economic activity at a single physical location.
The unit of enquiry in the Site survey is a construction site, which refers to a demarcated locality where one or more stages of constrµction work are being carried on. Sites under the control of Government departments or the MTRC, KCRC and the PAA are classified as public sector sites, whereas those registered with the Buildings Ordinance Office, including superstructure on sites above the MTRC stations or KCRC stations, and sites reported by the Eastern Harbour Crossing and Tate's Cairn Tunnel are classified as private sector sites.
In the SEVP, 'Persons engaged' refer to working proprietors, active business partners, unpaid family workers and all employees of the establishment who are either at work for pay or profit, or are temporarily absent from work, i.e. on short-term leave such as sick leave, casual leave or paid vacation. Excluded are outworkers, and persons on indefinite leave and on pension. Part-time and casual employees and ·unpaid family workers who worked for less than 3. hours of the normal working time on the reference date are also not included.
On the other hand, the definition of persons engaged in the site survey is restricted to manual workers who work in the construction sites only. Manual workers include foremen, technicians, craftsmen, semi-skilled and unskilled workers who are either directly employed by the main contractors, or are being called upon by sub-contractors and gang leaders. For sites under the charge of G_overnment departments, manual workers are further refined to 34 selected major occupations at technician, craftsman and operative levels. ·
'Persons engaged' in the Civil Service Sector include all direct employees paid under the personal emolument vote on the referen,,ce date. Classification of Government departments and sections by purpose is based on the System of National Accounts Classification for Government expenditure with some modifications. ·
'Reported Vacancies' .refer to those unfilled, immediately available job openings for which the establishment or site is actively trying to recruit personnel. However, vacancies at construction sites include only those job openings for manual workers. The statistics give an indication of the size of the unsatisfied demand for workers. Together with the statistics on the number of persons engaged, these statistics provide a snapshot of the total number of job opportunities available in the labour market.
'Payroll' refers to wages and salaries, bonuses and gratuities, commissions and allowances and cash payments in other forms paid directly to all employees. Profits earned by proprietors and business partners. pensions, and payments to outworkers are, however, excluded.
'Payroll per person engaged' is derived by dividing the total monthly payroll by the total number of persons engaged. It should -not be interpreted as average income of employees. Firstly, the time period covered by employment figures is not the same as that covered by monthly payroll figures. Employment figures refer to a reference date, while monthly payroll is obtained by aggregating cash payments made over the whole month. Secondly, 'payroll' refers to payments to employees, whereas 'persons engaged' includes more than just employees. It also includes working proprietors, business partners and unpaid family members who normally are not on the payroll. Finally, as far as income is concerned, employees' income usually is not just limited to cash payments for work as reflected in, payroll figures. Furthermore, because of the fact that 'persons engaged' includes some who are not on the payroll and the ·magnitude of such persons varies between sectors, comparison of absolute values of payroll per person engaged between sectors is not meaningful. However, movements in the nominal and real indices 9f payroll per person engaged can be used as indicators of changes in average earnings of employees provided that the employment structure remains stable over time.
Hong Kong Monthly Digest of Statistics Januar)l 1993
The 'nominal index of payroll per person engaged' is the ratio obtained by comparing the payroll per person engaged for a particular time point with that for March 1991, which is taken as 100. The 'real index of payroll per person engaged' is obtained by deflating its nominal index by the Consumer Price Index (A) to adjust for changes in purchasing power. These two indices reflect changes in payroll per person engaged in money terms and in real terms respectively.
In the SEVP, questionnaires are mailed to each sampled establishment to collect the required data. If the establishment does not respond timely, data will be collected by computer-assisted-telephone interview or field visits.
The quarterly Employment Survey of Construction Sites collects both employment and vacancy statistics for manual workers at construction sites on a quarterly basis. Data are collected by personal interviews with the responsible site agents of each private sector site. On the other hahd, employment data of public sector sites are extracted from administrative records completed by respective site agents of various departments under the charge of the Works Branch (including the Architectural Services Department, the Civil Engineering Department, the Drainage Services Department, the Highways Department, the Territory Development Department and the Water Supplies Department) and the Housing Department.
The sufVey of Employment and Vacancies in the civil service collects regular returns from individual Government departments via the Civil Service Branch.
Prior t0; the first quarter of 1991, breakdowns of employment and vacancy statistics by industry were published under !SIC (International Standard Industrial Classification). Starting from the first quarter of 1991, these statistics will be published at HSIC (Hong Kong Standard Industrial Classification). The HSIC is a new standard industry classification system which was adopted by all surveys conducted by the Census & Statistics Department starting from 199\. It should be noted that in some occasions, detailed breakdowns of employment· and vacancy statistics under !SIC are not directly comparable to those under HSIC. To facilitate comparison with the previous year, statistics for the relevant quarters of 1990 are re-compiled using 'Uie HSIC and presented in this report.
As from the March 1991, the indices of 'Payroll per Person Engaged' have been rebased with March 1991=100. To facilitate comparison with previous year, indices for the relevant quarters in 1990 have been re-compiled.
Starting fr9m March 1991, distributors of LP Gas through a system of main previously classified under industry sector 6 (Wholesale, Retail and Import/Export Trades, Restaurants and Hotels) have been reclassified into industry sector 4 (Electricity, Gas and Water). Figures for March 1990 to December 1990 have been adjusted to conform to the new classification.
As from March 1991, some establishments previously classified under 'electrical repair shops' of industry sector 9 (Community, Social and Personal Services) have been reclassified irito 'electrical fitting with water plumbing' of industry sector 5 which is an economic activity not covered in this report. Figures for March 1990 to December 1990 have been adjusted to conform to the new classification.
Starting from September 1991, the Vocational Training Council previously classified under Civil Service has been reclassified into the Private Sector under "Educational Services" of Industry Sector 9.
As the Hospital Authority (HA) has taken over the management of 38 public hospitals and institutions since 1 December 1991, Civil Servants who have bridged over to ~A are treated as persons engaged in the Private Sector. Those who have not opted the HA terms are regarded as Civil Servants seconded to HA.
Concurrent with the SEVP, industry updating is undertaken to collect up~to-date information on business activities of each establishment. Industry updating for a particular economic block is scheduled in its full enumeration quarter on every alternate year. This activity was first launched in the September 1982 round ofSEVP; results were updated to the sampling frame and used to compile statistics at a time lag of one year. As from .the June 1991 round of SEVP, results of industry updating are updated to the sampling frame on a continuous manner and statistics are compiled based on the most updated information in the sampling.frame.
Figures of establishments, employment and vacancies refer to March, June, September and December of the year. Those for Civil Service referred to January, April, July and October of each year as from the s.econd quarter 1985.
The Census and Statistics Department had, since 1964, compiled and published wage indices to measure the changes in wage rates, both including and excluding fringe benefits, of manual workers in selected industries mainly in the manufacturing sector, based on the findings of a half-yearly Wage Survey.
In March 1982, a new q11arterly Survey of Wages, Salaries and Employee Benefits was introduced to replace the half-yearly Wage Survey. A number of improvements were made, including the collection of statistics on wage rates at more frequent intervals, the use of a larger sample (about 2 OOO establishments) to achieve a higher degree of. precision in the estimates for each industry covered, and an extension in coverage to include the non-manufacturing sectors and non-manual workers so as .to make the statistics more representative (employees at the administrative and professional levels are, however, still excluded). The details of the differences between the old and the new survey are given in the ''Quarterly Report of Wages, Salaries and Employees Benefits Statistics for March, June and September 1982, Volume!". After the September 1989 survey, the frequency of the survey has been changed to half-yearly.
Based.On the findings of the new survey,;a Nominal Wage Index and a Real Wage Index are compiled. These wage indices measure the "pure" changes in, wage rates by holding the structural pattern of the labour force with respect to industry, occupation, sex and mode of payment the same as that of March 1982, which is the based period of the Wage Indices. While the Nominal Wage Index measures the changes in wage rates in money terms, the Real Wage Index, which is obtained by deflating the Nominal Wage Index by the Consumer Price Index (A), measures the changes in the purchasing power of the amount of money earned. Apart from basic wages and salaries, wage rate is defined to include also cost-of-living allowance, meal benefits, commission and tips, good attendance bonus, night shift allowance, year-end bonus and other guaranteed and regular bonuses and allowances. There is no distinction made between wage rates with and without fringe benefits in compiling the New Wage Indices. Since all the wage elements mentioned above are included in compiling the New Wage Indices, they are roughly equal to the definition of the wage rate including fringe benefits in the old survey.
In reading the wage statistics, users are reminded to note that the change in the w3.ge index for a particular industry between any two months may be different from the change derived by comparing the published wage rate figures for that industry of the corresponding months. As the wage index is designed to measure the "pure" change in wage rates by holding constant the structure of the labour force with respect to industry, occupation, sex and mode of payment, the movement as indicated by the wage indices should always be used to measure changes in wage rates.
There are differences in the interpretation of wage and payroll indices. Essentially, the wage indices, which measure the changes in the price of labour, are concerned with the movements of wage rates which indicate the amount of remuneration for normal time of work. On the other hand, per-capita payroll indices reflect the changes in the amount of cash earnings workers receive during a particular period. The movements of the per-capita payroll indices are affected by changes in wage rates, as well as changes in such other factors as the amount of time actually worked, the composition of the labour force and the incidence of the payment of bonuses and back~pay. As a result, the movements of the wage indices-do not necessarily agree with those for per-capita payroll.
The average daily wages statistics in Table 2.10 are compiled based on the statistical returns obtained from contractors engaged in Government building and construction projects. The wage rate is defined to include basic wage, meal ·allowance, transportation allowance, I-days statutory holidays and 7-days public holidays for daily-rated workers whilst sick leave and year-end bonuses are also included for monthly-rated workers.
Statistics on reported occupational accidents, industrial accidents and industrial work stoppages are supplied by the Labour Department.
Statistics on industrial work stoppages refer to number of work stoppages and the corresponding number of working days (or man-days) classified by International Standard Industrial Classification major divisions. These figures cover stoppages of work arising from disputes connected with. terms and conditions of employment. Stoppages involving fewer than ten workers or lasting less than one day are excluded, unless the aggregate of wor~ing days lost exceeds 100. The number of workers involved is the number who actually cease work at the establishments where the disputes occur.
Reported occupational accidents refer to all accidents reported to the Labour Department which have resulted in the death of an employee or the total or partial incapacity of an employee for more than three days.
Industrial accidents refer to accidents occurred in industrial undertakings and arising out of industrial activities.
Section 3 EXTERNAL TRADE
External trade statistics comprise movements of cargo between Hong Kong and other trading partners, by land, air and water and to a limited extent by post, with the exception of the following classes of goods: I. Transhipment cargo under through bill oflading or through air waybill; 2. Transit cargo; 3. Articles imported or exported by the armed forces of the Crown; 4. Ships' stores, including bunker fuel; aircraft stores, including aviation fuel; 5. Personal baggage and possessions of travell~rs, not including motor vehicles; 6. Advertising materials supplied free ,of charge and samples of no commercial value or valued at
less than One thousand dollars; 7. Marine fish arriving direct from fishing grounds on fishing craft registered or licensed in Hong
Kong; 8. Gifts of a personal nature where no payment has been made by the receiver; 9. Articles temporarily imported and exported solely for exhibition and subsequent retupl; 10. Articles imported or exported under and in accordance with an A.T.A. carnet for the temporary
admission of goods; 11. Circulatory used freight containers and the like; 12. Banknotes after issue into circulation, being legal tender in any country.
The trade accounts relate to movements of merchandise only, and do not include those of bullion and specie.
Imports are c.i.f. values, exports and re-exports are f.o.b. values.
The. monthly figures are subject to adjustment of errors which may arise from various sources, such as mis-classification of-commodity or country of consignment, wrong reporting of values or quantities, and lodgement of more than one declaration for the same consignment. As from 1978, adjustments to these errors for consignments relating to earlier months are made tO the cumulative totals only. It follows that the sums of the monthly figures may differ from the cumulative totals.
The Federal Republic of Germany (FRG) and German Democratic Republic (GDR) came into unification on 3 October 1990. The unified new state is known as FRG. _As from October 1990, statistics on Hong Kong's trade with the FRG refer to those with the unified Germany. Where past data are presented, they are the total figures of the previous FRQ and GDR in order to .ensure comparability with the figures after unification. For separate statistics on Hong Kong's trade with the two independent states prior to October 1990, reference should be made to earlier publications.
As from October 1990, statistics on Hong Kong's trade with "Soviet Union and Eastern Europe" no longer include GDR. The statistics of the unified Germ.any are include in those of "Western Europe". Where past data are presented, the trade values for GDR have been deducted from those for "Soviet Union and Eastern Europe" and added to those for "Western Europe" in order to ensure comparability with the figures after German unification. For trade statistics of these regions prior to October 1990 without making any adjustment for German unification, reference should be made to earlier publications.
Similar approach is also adopted for presenting the quantum index for FRG. For simplicity and since Hong Kong had relatively little trade with the previous GDR, the unit value indexes of previous FRG alone are used for deflating the value index of the two states taken together to obtain the quantum index.
The trade index numbers are compiled from value and quantity data as published in the Hong Kong Trade- Statistics. The unit values for domestic exports and re-exports are on an f.o.b. (free-on-board) basis while those for imports are on a c.i.f. (cost, insurance and freight) b_asis.
The unit value for each commodity classification item is the quotient of the value over its corresponding quantity. As such, the unit value series (as opposed to market prices) are not free of the effect of change, especially improvements, in quality or of change in product mix and markets or sources included within a commodity classification.
Quantum index numbers are derived by dividing the value index numbers by corresponding unit value index numbers; and as a result are derived as a residual and subject to the limitations mentioned above. The unit value index numbers are base-weighted while the quantum index numbers are current-weighted. The monthly value and quantum indexes are derived by comparing trade figures in the current month with the average monthly data of the base year 1981.
As from March 1983, prices of selected imports (c.i.f.) and exports (f.o.b.) were collected and used to compile price indexes. These· price indexes which are based on product specifications, are intended to substitute the unit value indexes where problems exist of changes in quality, product mix, markets and sources, etc.
The terms of trade index, which was up to December 1982 the ratio of the unit value index for domestic exports to that for imports, has been re-defined as the ratio of the unit value index for total exports (i.e. domestic exports and re-exports) to that for imports.
For inclusion in the compilation of the trade index numbers, 737 items out of a total of 1 874 items for domestic· exports, I 518 out of 3 162 for imports and l 039 out of 2 638 for re-exports are selected. In terms of value, the selected items accounted for 69 per cent, 71 per cent and 71 per cent for domestic exports, imports and re-exports respectively in the base year 1981.
Statistics of trade with China of outward processing nature are obtained from the S~ey on Exports to China for Outward ProcesSing and the Survey on Imports from China related to Outward Processing. The surveys cover all merchandise trade except commOOities and transactions not classified according to kind. For the purpose of the surveys, exports to China for outward processing refer to the exportation of raw materials or semi-manufactures from or through Hong Kong to China for processing with a contractual arrangement for subsequent re-importation of the processed goods into Hong Kong. Imports from China relataj to outward processing refer to the importation of proc;essed goods from China of which all or part of their raw materials or semi-manufactures are under contractual arrangement exported from or through Hong Kong to China for processing.
Section 4 PRODUCTION
The Indices of Industrial Production, the purpose of which is to reflect the changes over time of net output at constant prices, are based on results of the Quarterly Survey of Industrial Production. This survey is conducted by the Census and Statistics Department and covers all manufacturing establishments engaging 200 or more persons as well as a sample of the smaller establishments. The production index for an industry is compiled by aggregating the production quantity relatives or deflated value relatives of the primary products or industrial services in respect of the industry, using the values of sales of goods, industrial work and industrial services as weights. Deflated value relatives are adopted for those products that are too heterogeneous for quantity measurement. The production indexes of different industries are then aggregated to form indexes of industry groups, broad industry groups and 'All manufacturing industries', using the value added of different industries as weights which are updated annually based on the results. of the latest. round of the Annual Survey of Industrial Production.
The fodices of Industrial Production in Table 4.1 cover the whole manufacturing industry, including the spinning and weaving industri'es. Statistics for the latter two industries, obtained by enumerating all spinning and weaving establishments engaging 20 or more persons and a random sample of the smaller establishments, are also shown separately in greater detail in the series of Index ofTextil_e Production and Textile Production Statistics in Tables 4.2 and 4.3.
Items 4 to 6 in Table 4.3 exclude contributions from establishments_ engaged mainly in providing supporting services (e.g. yam winding~ yam doubling, texturizing and miscellaneous weaving activities) to the spinning and weaving industries. However, figures for items l to 3 cover these establishments as well.
Statistics of cement production are supplied by the cement manufacturing companies, while statistics of quarry production are supplied by the . Geotechnical Control Office of the Civil Engineering Services D~partment.
Section 5 LAND, HOUSING, BUILDING AND CONSTRUCTION
Permanent living q'uarters Statistics are compiled by the Census and Statistics Department. Before 1985 these statistics were compiled from a manual register of quarters. Since 1985 they are obtained
II
fi'om the computerized frame of quarters. A permanent living quarter is an enclosed space in a building built of permanent materials. And for such a space to be cowited as a living quarter it must (i) be internally connected so that the- occupants can move between rooms/c-Ubicles or from one corner to another without going outside onto a public corridor, a landing or staircase; (ii) have direct access to a street, a corridor or landing without going through someone else' unit; and (iii) be built or used for the purpose ofliving.
Public housing comprises Housing Authority estate block~ and Housing Society buildings. Home Ownership Scheme also includes living quarters built under the Private Sector Participation Scheme and Middle Income Housing. Statistics on Housing Authority blocks and Home Ownership buildings are supplied by the Housing Department; statistics on Housing Society buildings are obtained from the Hong Kong Housing Society and details contained in the monthly returns of the Buildings Ordinance Office of the Buildings and Lands Department. This department also supplies data for the small village-type houses. With regard to all other private building projects as well as Private Sector Participation Scheme and Middle Income Housing, data are compiled from the above mentioned monthly returns.
A bUilding is said to be 'completed' upon the jssuance of an Occupation 'Permit by the Buildings Ordinance Office of the- Buildings and Lands Department in the case of a Housing Society building or a private building (except small village-type houses); and in the case of a small village-type house, a compliance certificate issued by that department; a Housing Authority block is 'completed' when it hii.s been certified as substantially completed by the Chief Architects of the Housing Department.
'Consents' to commence work are issued by the Buildings Ordinance Office of the Buildings and Lands Department for Housing S6ciety. buildings and private buildings exCept smaU village-type houses where 'consents'_ are not necessary. In the case of Housing Authority blocks, 'consents' are not required and the date of award of contracts by the Housing Authority is taken as the consent date.
The 'usable floor afea' of a flat is defined as the total floor area within the flat excluding any staircases, lavatories, water closets, kitchens an4 other common areas of the building.
The 'lettable floor area' and ~saleable floor area' of a flat refer to the total floor area inside the fiat measured to the outside of the external walls and to the centre lines of the party walls, including the balcony, kitchen and water closet inside the fiat. All common areas of the building are excluded.
The 'gross floor area' of a building is defined as 'the aggregate of the areas of the .fioor(s) in a building'.
Building statistics in Tables 5. 7 and 5.8 include only building activities in the private sector and those for Private Sector Participation Scheme and Middle Income Housing .but exclude small village-type houses. 'Commercial buildings' refer to office buildings and mutli-purpose commercial premises. 'Industrial buildings' refer to flatted factories, specialised factory buildings and storage premises. 'Other buildings' refer to hotels and boarding houses, and premises for education, medical and health, social welfare, religion, culture, recreation, etc.
Statistics on price indices in Table 5.9 are based .on an analysis of all transactions scrutinized by the Rating and Valuation Department for stamp duty purposes with an agreement date within the quarter. The rental indices in Table 5.10 are based on rental information recorded in_the_·Rating and Valuation Department for new and fresh lettings effective in the quarter. For non-domestic premises, rentals_negotiated on renewal are also included. Although all rentals are analysed on a net basis, i.e. exclusive of rates, management and other charges, no attempt is made to adjust for other contractual terms.
Information on instruments registered is supplied by the Registrar General. The figures in Table 5.13 up to December 1990 cover only Hong Kong Island, Kowloon and New Kowloon. As from January 1991, figures for New Territories are included. The terms used in Table 5.13 are explained as follows: ·
'Assignment': a deed transferring property from one part to another.
'Lot': a piece. of Government land originally granted by the Government by auction, tender or private treaty grant.
·section' and 'Sub-section': a lot can be carved into a number of smaller parts called sections. The sections may be of varying size and the area of each is clearly defined and labelled accordingly. A section can similarly be furthe~ earved into a number of smaller parts called sub-sections.
'Undivided share': a lot, section or sub-section can be shared jointly by two or more persons, the entitlement of each is called a share of lot or section or sub-section. Unlike a 'section' or 'sub-section~, a share is just a percentage value with no explicit boundary defined as in a 'section' or 'sub-section'. Assignments or discrete flats are included here if the relevant building is located in an undivided lot and/or a particular section or sub-section of a lot.
'Building mortgages/building legal charges' (previously known as Building mortgages): mortgages secured for the purpose of financing building construction.
'Mortgages/legal charges other than building mortgages/building legal charges' (previously known as Mortgages other than building mortgages): highly varied and the mortgagee is not obliged to state the purpose of the mortgage. _Many of these relate to mortgage arrangements for the purchase of residential fiats and other building premises.
'Reassignments/receiptS/discharges/releases and certificates of satisfaction' (previously known as Reassignments and certi_Q.cates- of satisfaction): when a loan is fully repaid and the mortgage redeemed, a 'reassignrn,ent/receipt/discharge/release' or •certificate of satisfaction' will be prepared and registered at the Land Office.
'Agreements for sale and purchase': an agree_ment for future sale or purchase of property. The property may be a building under construction or a completed ~uilding. 'Tenancy agreements': agreement between a lessor and lessee concerning property letting. 'Exclusion orders issued under the Landlord and Tenant Ordinaiice': landlords of pre-. war buildings who wanted to re-develop the property have to apply for an Exclusion Order with respect to Part One of the Landlord and Tenant Ordinance which mainly protects the interests of the existing tenants. 'Miscellaneous': all other types of transaction.
Statistics on the gross value of construction work (GVCW) performed by contractors are based on results obtained from _the· Quarterly Survey of Construction Output conducted by the Census and Statistics Department since 1983, for the purpose of providing prompt indications on the current output levels and trends in the construction sector. The register of construction establishments, which is maintained by the Census and Statistics Department based on information from the Business Registration Office of the Inland Revenue Department, provided the frame for selecting the sample of the Survey. All main contractors at construction sites, irrespective of their employment sizes, and other construction establishments engaging 100 persons or more are folly enumerated in the Survey. As regards the other establishments in the frame, a random sample stratified by trade and effiployment size is selected for enwneration. New construction works and renovation and maintenance include the erection of new buildings and structures and installation of service facilities such as utility fittings and ventilation systems; major alteration and conversion works on existing structures; demolition, site formation, piling and other sub-structure work preceding the actual erection of structures; and the restoration of existing buildings and structures to normal condition. Special trades refer to those contractors that specialize in delineated job areas such as concreting, scaffolding, carpentry, plumbing and gas work. A main contractor is one who enters into a contract directly with a property developer or the client party of a project, as distinct from a sub-contractor who obtains the job from another contractor. Due to the widespread sub-contracting practice in the construction sector, a construction establishment can be a main contractor for one contract but a sub-contractor for another contract simultaneously. The-GVCW performed by main contractors refers to the output of those construction establishments in the projects in which they take the role of a main contractor, and does not include the construction output of projects where they play the role of sub-contractors. However, sub-contractors' contribution to projects should have. been included in the GVCW performed by the main contractors for whom they worked. He_nce statistics on the GVCW performed by main contract.ors are preferred to those on the total GVCW performed by all contractors in assessing the level of construction activity, as the former are free from the effect of double-_counting the construction output of sub-contractors. All figures .on ·the GVCW performed are measured at current prices. The Index ofGVCW performed by main contractors is also computed on the basis of current price level with no adjustment for price changes.
Statistics on disposals of Government land are supplied by the Buildings and Lands Department.
• Letter 'A' and 'B' tender system in the New Territories: when -it is necessary for Government to acquire land for public purposes the Government exercises its power under the Crown Lands Resumption Ordinance. Where land is required within an ar~a embraced by an approved layout plan, the policy is to give the lessee of private land the opportunity of surrendering his land voluntarily in exchange for the right to be granted Government land at some future date. This right is contained in a Letter called Letter 'A' or Letter 'B'.
Hong Kong Monthly Digest of Statistics January 1993
i
I
Ii'
I
i
.The realised premium of land acquired by a land exchange entitlement is calculated by deducting the Government's value of the resumed land from the value of the land to be granted prevailing at the time when the exchange entitlement letter was issued. The realised premium of land acquired through auction or public tender is the auctioned/tendered price of the land.
Land for special low cost housing projects, Home Ownership Schemes, for public utilities, schools, churches, temples, clinics welfare and certain charitable purposes is usually granted by private treaty, and in such cases, the premium charged varies from nothing for non-profit-making purposes up to the full market value for public utilities.
Section 6 TRANSPORT, COMMUNICATIONS AND TOURISM
Statistics on aircraft movements are taken from the reports of the Civil Aviation Department.
Statistics on river vessels and containers are supplied by the Marine Department while those on ocean-going vessels are derived from the Hong Kong Shipping Statistics System set up by the Census and Statistics Department. Ocean-going vessels are classified according to nationality. 'Vessels entered' refers to vessels arriving at Hong Kong whereas 'vessels cleared' refers to vessels leaving Hong Kong.
Statistics on cargoes carried by ocean-going vessels are baced on the Shipping Statistics System set up by the Census and Statistics Department and are estimated from a sample of consignments on ocean cargo manifests. Statistics on cargoes carried by river vessels are supplied by the Marine Department, on airborne cargoes are supplied by the Civil Aviation Department, on cargoes carried by railway by the Kowloon-Canton Railway Corporation and on cargoes transported by road by the Customs and Excise Department. Starting with the February 1986 issue, statistics on international movements of co:r;nmercial cargo by railway in Table 6.4 refer to the actual tonnage of cargo conveyed whereas those published in previous issues represent the loading capacity of wagons used for conveyance.
The total cargo discharged include inward direct shipment (or imports) and inward transhipment, and total cargo loaded include outward direct shipment (or exports, including domestic exports and re-exports) and outward transhipment.
Statistics of passenger journeys on public transport, of motor vehicles registered and of vehicular traffic through toll-charged tunnels and vehicular ferry services are compiled by the Transport Department. The passenger journey figures include estimated passengers in vehicles carried by the Hong Kong & Yaumati Ferry Co. 's vehicular ferry services. A minor ferry service is any ferry service (other than Hongkong & Yaumati Ferry and Star Ferry) operated under a licence granted under the Ferries Ordinance, Cap. 104. Statistics on passenger journeys by 'Cross Harbour Tunnel' include passengers carried by Mass Transit Railway and Harbour tunnel buses.
Statistics on motor vehicles licensed shown in Table 6.7 do not include the 162 tram cars of the Hongkong Tramways Ltd. and the 3 tramcars of the Peak Tram Co. Ltd.
Statistics on traffic ·accidents and casualties are supplied by the Royal Hong Kong Police Force .. The traffic accident figures exclude accidents involving damages only.
Statistics on telephone services are supplfed by the Hong Kong Telephone Company Ltd. and those on te~ecommunication and postal services.by the Post Office.
Statistics on passenger arrivals and departures as well as Hong Kong resident departures are supplied by the Immigration Department. They refer exclusively to international movements of passengers or Hong Kong residents. Particulars on incoming visitors and hotels are supplied by the Hong Kong Tourist Association. From January 1986 onwards figures in Table 6.15 on visitor arrivals by country of residence differ from the 'Visitor Arrival Statistics' published by the Hong Kong Tourist Association since the former include visitors from the People's Republic of China but the latter do not.
Statistics of hotels and number of rooms are obtained -from surveys conducted in June and December each year among Hong Kong. Tourist Association members. These statistics are revised from time to time as information on current situation of hotel indtistry· becomes available: Room 01cupancy rate is based on surveys conducted monthly among HKTA members.
Section 7 MONEY, BANKING AND FINANCE
Statistics on the money supply and on licensed banks, restricted licence banks and deposit-taking companies, in Tables 7.1to7.14 and 7.17 to 7.19, are based on data collected by the Commissioner of Banking on behalf of the Secretary for Monetary Affairs.
The definitions of money supply (Table 7.1 and 7.3) are:
Money supply definition 1 (Total): Notes and coins with the public, plus customers' demand deposits with licensed banks.
Money supply definition 2 (Total): Ml plus customers' savings and time deposits with licensed banks, plus negotiable certificates of deposit issued by licensed banks and held outside the moneta'ry sector.
Money supply definition 3 (Total): M2 plus customers' deposits with restricted licence banks and deposit-taking companies plus negotiable certificates of deposit issued by restricted licence banks and deposit-taking companies held outside the monetary sector.
HK$Ml, HK$M2 and HK$M3 are the Hong Kong dollar components of these definitions.
All authorized institutions are defined here to include licensed banks, restricted licence banks and deposit-taking companies.
'Restricted licence banks' and 'deposit t~king companies' were known as 'licensed deposit-taking companies' and 'registered deposit-taking companies' respectively before 1 February 1990.
The banking statistics (Table 7.3) exclude certificates of indebtedness issued by the Exchange Fund, and the equivalent note issue.
Licensed ·bank's quoted best lending rate, which refers to The Hongkong & Shanghai Banking Corporation Limited and Standard Chartered Bank's quoted best lending rate for general guidance of other licensed banks, as well as interest rates paid to depositors are supplied by the Secretary for Monetary Affairs. Interest rates for deposits over 12 months are determined by agreement between individual depositors and the licensed banks.
The closing Hong Kong Dollar Inter,bank Offered Rates (HIBOR) on or before December 1985 in Table 7.16 are quoted from The Hongkong and Shanghai Banking Corporation Limited and those from January 1986 onwards are quoted from Standard Chartered Bank. Figures of bank cheques cleared are supplied by the Clearing House of The Hong Kong Association of Banks.
Liabilities to and claims on banks outside Hong Kong are analysed by the country of the branch making or accepting the deposit, and not by the country of that branch's head office - e.g. a claim on the London br;inch of a US bank is shown against the United Kingdom, and not against the United States. -
Claims on non-bank customers incorporated outside Hong Kong are analysed by the country of incorporation, while claims on unirn;::orporated customers are analysed by their recorded address. Columns 1 to 4 of Table 7.17-7.18 include liabilities to and claims on the head office (if any) overseas, and on any other br3:nches overseas of the reporting institution in Hong Kong.
The figures for liabilities to banks outside Hong Kong, for claims on banks outside Hong Kong, and for claims on non-bank customers outside Hong Kong in Tables 7.17 to 7.18 do not exaetly correspond with the appropriate items in Tables 7.4 to 7.6 respectively. This results from differences in classification of some accounts. ·
Statistics of exchange rates between the Hong Kong dollar (HKD) and c'Urrencies of selected countries are compiled by the Census and Statistics Department from quotations supplied mainly by the Hang Seng Bank Limited. Figures in Tables 7.19 to 7.21 refer to average closing middle-market telegraphic transfer rates. The currencies are selected for those countries which are major trading partners of Hong Kong. The exchange rates of the SDR are derived by multiplying the U.S. dollar (USD) value of the SDR as published by the !MF by the appropriate exchange rates ofHKD against USD as published in the tables. The effective exchange rate indices (EERI) measure movements in
Hong Kong Monthly Digest of Statistics January 1993
the weighted average of nominal exchange rates of HKD against the currencies of 15 principal trading partners. The principal trading partners are selected on the basis of their merchandise trade with Hong Kong and their relative· importance in world trade. A new series of EERI has been released since 28 September 1987.
The new and the old EERI series have the following differences:
(a) Base period (b) Trade weights
(c) Averagingmethod (d) Frequencies.of
indices ·· ··
(i) (ii) (iii)
New
24-28 Oct. 1983 1975-1980, 1972 weights 1981-Sep. 1983, 1981 weights Oct. 1983 onwards, average of 1984-1986
weights Geometric
1975-1980, annual indices
1981-1986, mont,hly and annual indices
Jan. 1987 onwards, daily and monthly indices
Old
18 Dec. 1971
} 1981
Arithmetic 1975-1980 annual · indices 1981-1982, monthly and annual indices
1983-1987, daily, monthly and annual indices
For more details in the new EERI, see the Special Review in the November 1987 issue of this Digest.
The following table shows the weights attached to the new EERI series:
Weights attached(%)
Trade (import and
Selected export)- Import- Export-trading weighted weighted weighted partners Currrencies index index index
Australia Dollar 2.29 2.13 2.46 Belgium Franc 0.77 0.98 0.55 Canada Dollar 1.78 0.78 2.84 China Renminbi 27.06 28.16 25.90 France Franc 1.47 1.57 1.36 Germany, F.R. Deutsche Mark 4.08 2.74 5.49 Italy Lira 1.32 1.68 0.93 Japan Yen 15.09 24.35 5.30 Netherlands Guilder 1.04 0.63 1.48 Singapore Dollar 4.43 5.28 3.54 South Korea Won 4.01 5.57 2.37 Switzerland Franc 1.62 1.89 1.33 Taiwan Dollar 6.20 9.03 3.19 U.K. Sterling 5.01 4.58 5.46 U.S.A. Dollar 23.83 10.63 37.78
The Hong Kong Index on share prices and value of stock exchange turnover are supplied by The Stock Exchange of Hong Kong Ltd. The Hang Seng Index and Sectoral Sub-indices are compiled by the Hang Seng Bank Ltd. Sectoral sub-indices of the Hang Seng Index have been introduced since 13 January 1984, and closing share prices on that day are used as the basis for calculation. The base value of the sub-indices is 975.47 i.e. the closing Hang Seng Index for that day.
Statistics on futures trading and gold and silver exchange trading are supplied by the Hong Kong Futures Exchange Ltd. and The Chinese Gold and Silver Exchange Society respectively.
Section 8 PRICES AND RETAILING
The average retail prices of the principal foodstuffs are obtaine\!l by price investigators from market stalls and shops throughout Hong Kong during the periods specified.
The average wholesale prices of rice are supplied by the Trade Department, while those of live pigs, live cattle, fresh marine fish and fresh vegetables are supplied by the Agriculture and Fisheries Department.
The expenditure weights of the Consumer Price Indices (CPls) shown in Tables 8.3-8.6 were derived from the results of the Household Expenditure Survey conducted in 1989-90. The expenditure brackets of the three CP!s, i.e. CPI(A), CPI(B) and Hang Seng CPI and the corresponding percentage of households covered by the indices are given as follows:
Index
CPI(A) CPI(B) Hang Seng CPI
Approximate percent of households covered
50 30 JO
Monthly household expenditure·in
1989/90
$ 2,500-$ 9,999 $10,000-$17 ,499 $17,500-$37,499
The remaining 10 percent of households - at top and bottom of the household expenditure scale -are excluded.
Readers interested in infornlation on household expenditure may refer to the report "1989/90 Household Expenditure Survey and the Re basing of the Consumer Price Indices".
A special review article introducing the seasonally adjusted consumer price indices was published in the May 1983 issue of this Digest. Information on the objectives, method and interpretation of the figures can be found in the article.
Statistics on ·retail sales are compiled by the Census and Statistics Department based on data collected from a monthly survey of retail sales. The survey covers some I 200 e_stablishments drawn from all the retail establishments registered with the Business Registration Office (BRO) of the Inland Revenue Department (!RD), and market stalls registered with the Urban Services Department (USD) and the Housing Department (HD), Excluded from the survey are hawkers, street vendors and retail pitches.
Statistics on restaurant receipts are compiled by the Census and Statistics Department based on data collected from a quarterly survey of restaurant receipts and purchases. The survey covers some 750 establishments drawn from all the catering establishments registered with the BRO of the IRD, the USD and the HD. Excluded from the survey are cooked food stalls operated outside the main structure of buildings, canteens attached to organizations open to members only, and catering outlets operated by and situated within hotels.
The value indices measure the changes in value terms, while the volume indices obtained by deflating the value indices by specially constructed price indices measure the changes in real terms.
Section 9 SOCIAL STATISTICS
Statistics of reported crime are supplied by the Royal Hong Kong Police Force and the Independent Commission Against Corruption. If a-person is arrested/prosecuted on two or more occasions he is recorded once on each occasion; and when a person is arrested/prosecuted on the same occasion for two or more offences, one offence is selected for tabulation.
Statistics on in-patient service and out-patient attendances in government and Hospital Authority institutions are supplied by the Department of Health and the Hospital Authority.
Statistics on notified infectious diseases is supplied by the Department of Health.
Statistics on public assistance schemes and special needs allowance schemes are supplied by the Social Welfare Department.
Section 10 ENERGY
Statistics on electricity and gas are supplied by the public utilities companies and those on petroleum products are obtained from the monthly returns submitted by the leading petroleum companies.
III
Section l1 MISCELLANEOUS Government revenue and expenditure statistics are supplied by the Treasury. The analysis of revenue and expenditure by the broad groups as given in Table l l.l is made by the Census and Statistics Department. 'Direct taxes' include earnings and profit ta;x. and estate duty; 'Indirect taxes' include duties, general rates, motor vehicle taxes, taxi concessions, royalties and concessions, taxes on bets and sweeps, entertainment and hotel accommodation, stamp duties and airport departure tax (introduced in 1983/84 only). 'Transfers to other funds' includ-e transfers to Development Loan Fund, Home Ownership Fund, Mass Transit Fund and Stud~ ..:t Loan Fund; 'Actual expenditure during the period' refers to expenditure other than transfers to funds.
Information on companies registered and dissolved is supplied by the Registrar General. The fire services statistics. are supplied by the Fire Services Department and refer to operational
and preventive work. Statistics on water supplies are supplied by the Water Supplies Department <J.nd refer to fresh
water supply only (while salt water for flushing purposes is excluded). The maximfun capacity of the existing 18 storage reservoirs is 577.896 million cubic metres; before storage at the High Island Reservoir (since August 1977) began the maximum capacity was 305.396 million cubic metres. Figures for water imported from China are slightly diffetent from those published in Hong Kong Trade Statistics. They refer to the quantity of water received from 09:00 hours on the first day of the month up to 09:00 hours on the first day of the following month whereas those published in the Hong Kong Trade Statistics represent the quantity of water paid for from the morning on the last day of the previous month to the morning on the last day of the month. ·
Statistics of meteorological observations are taken from the records of the Royal Observatory, King's Park and Waglan Island stations. The monthly normals for the various meteorological elements (except for the total evaporation, prevailing wind direction and mean wind speed) refer to the 30-year period 1951-1980. Due to the lack of data within the same period, normals for ~he prevailing wind . direction and mean wind speed are the averages during the 30-year period 1953-1982. The normal for the total evaporation is obtained from the average for the period 1958-1984 and will be updated every year because the covering period is less than 30 years.
PART II PERIODIC TABLES Section 12 POPULATION AND MORTALITY STATISTICS See explanatory notes in Section 1 for mid-year population estimates in Table 12.1.
Statistics of deaths by cause are supplied by the Department of Health whereas those of life expectancy are compiled by the Census and Statistics Department.
Section 13 EDUCATION Statistics of schools and enrolment are supplied by the Education Department except those for the Universities and Polytechnics, and Technical Institutes which are supplied by the University and Polytechnic Grants Committee and Vocational Training Council respectively. The ·figures for institutes and enrolment by type of education refer to both day and evening classes. Enrolment for the Universities include undergraduates and postgraduates but exclude participants of extra-mural courses.
Section 14 WAGES AND EMPLOYEE BENEFITS A new annual Survey of Salaries and Employee Benefits (Managerial & Professional.EmployeesExcluding Top Management) was conducted fordhe first time in September 1984. It collects information on salaries and fringe benefits of managerial and professional staff who are not covered by the Quarterly Survey of Wages, Salaries and Employee Benefits. The ·survey covers about 200 large and medium-sized companies in five economic sectors, namely the manufacturing/electricity; gas and steam sector; the building and constructit;m and related trades sector; the wholesale/retail and import/export trades sector; the transport, storage and communication sector; and the financial institutions and insurance sector. Details of the survey methodology are given in "Report of Salary and Employee Benefits Statistics, (Managerial and Professional Employees-Excluding Top Management)" published by the Census and Statistics Department.
Based on the findings of the new survey, a Nominal Salary Index (A) and Nominal Salary Index (B) are compiled. These salary indexes are designed to measure changes in salary rates using the occupational and industrial structures of June 1983, which is also taken as the base period of the indexes. Apart from basic salaries, the salary rate is defined to include also cost-of-living allowance, guaranteed year-end bonus, commission and tips and other guaranteed and regular bonuses and allowances. Other items which may contribute significantly to the total pay package of employees at this level such as profit~sharing bonlls and housing allowance are not included in the definition of salary rate. However, statistics on these fringe benefits items are separately compiled and are expressed in terms of percentages of employees included in the survey entitled to such benefits in Table 14.2.
The Salary Index (A) is compiled by comparing the average of the salary levels of managerial and Professional employees in June of the reference year with that in June 1983. It is a comprehensive measure of change in salary levels and it takes into account changes in salary level resulting from movements across companies and in and out of occupations as well as changes in salaries for those who remain in the same occupation and the same company in both years. While the Nominal Salary Index (A) measures the changes in salary rates in money terms, the Real Salary Index (A), which is obtained by deflating the Nominal Salary Index (A) by the Hang Seng Consumer Price Index, measures the changes in salary rates in real terms.
On the other hand, the Salary Index (B) measures the changes in salary levels only for those who remain in the same occupation and in the same company in two consecutive years. It therefore accowits only for changes due to a general increment, meritorious increases and gains in seniority, and should be useful to personnel managers in making salary adjustments. A Real Salary Index (B) is also compiled using the method adopted in deriving the Real Salary Index (A).
Large and medium-sized companies are defined as below:
Selected major economic sectors
.Manufacturing/electricity, gas & steam Building & construction and related trades Wholesale/retail and import/export trades Transport, storage and communication Financial institutions and insurance (excluding holding
and investment companies) Holding and investment companies
Section 15 NATIONAL ACCOUNTS
No. of persons engaged
Larg~ Mediµni-sized compames companies
;;, 2000 200-1 999 ;;, 500 50- 499 ;;, 500 JOO- 499 ;;, 500 100- 499 ;;, 1000 100- 999
;;, 500 20- 499
Gross domestic prOduct (GDP) is an aggregate measure of the total value of net output produced within the domestic boundary- of a country or a territory in a specified period, say a calendar year, before provision for the consumption of fixed capital.
For Hong ~ong, the Census and Statistics Department compiles expenditure-based estimates and the production-based .estimates of the GDP.
Expenditure-based estimates for Hong Kong are compiled at both ~urrent market prices and at constant (1980) market prices. -Current price estimates are valued at current period transaction prices. Constant price estimates are obtained by deflating the cuirent price estimates of different categorie~· of goods and' services by. the appropriate price indexes or by revaluing current period quantities at base year prices.
Production-based estimates for Hong Kong are compiled at' current prices only.
I. Expenditure-based estimates The expenditure-based GDP estimate is the sum ofprivate'cOnsumption expenditure, government
consumption expenditure, gross domestic fixed capitar formation, change in stocks, and exports of goods and services, less imports of goods 3.nd services.
IV
( 1) Private consumption expenditure:
This covers all expenditure by the household sector, including private non-profit bodies, on goods and services for current use. It is the sum of the estimates of conswnption expenditure on goods and services in the domestic market and the expenditure of Hong Kong residents abroad less the expenditure of non-residents in the domestic market.
Data sources for compiling the estimates include trade statistics, administrative statistics from government departments and various organizations, data collected from economic surveys, household surveys and other expenditure surveys cbnducted by , the Census and Statistics Department
(2) Government consumption expenditure:
Government consumption expenditure refers to the current expenditure on goods and services by non-trading government departments and quasi-government non-profi_t bodies. Trading departments are distinguished from non-trading departments in that the former are engaged mainly in the production of goods and services for sale to the public.
Current expenditure on goods and services by non-trading departments and quasi-government bodies is the sum of compensation of employees arid purchases of goods and services less receipts from sales of goods and services. The estimates in respect of non-trading departments are compiled based on an analysis of government accounts and Other supplementary information supplied by government departments. Those for the quasi-government bodies are obtained from special enquiries on the income and expenditure of these bodies. Disbursements which are transfer payments are not included.
( 3) Gross domestic fixed capital formation:
Gross domestic fixed capital .formation covers the gross value (i.e. without deducting allowances for consumption ·of fixed capital) of 'inV-estment on buildings and construction as well as plant, machinery and equipment; 'real estate developers' margin; and transfer costs of land and buildings.
Estimates of investment on buildings and construction, real estate developers' margin, and transfer costs of land and buildings are compiled using data collected from quarterly and annual surveys of construction, the Housing Authority, various other government departments, the Mass Transit Railway Corporation and the Kowloon-Canton Railway Corporation.
Estimates of investment on plant, machinery and equipment are compiled on the basis of the commodity-flow method using data obtained from external trade statistics, government accounts, quarterly and annual surveys on local production, the Mass Transit Railway Corporation and the Kowloon-Cant~n Railway Corporation.
( 4) Change in stocks:
The estimates refer to the value of physical change in the stocks of work-in-progress and stocks of goods held by manufacturers and distributors. The information is based on the opening at:!d closing book values of stocks reported by the establishments in surveys. Change in stocks reflects changes in the physical quantities of stocks. Adjustments have been made for stock appreciation (i.e. the increase/decrease in value of stocks attributed to price changes) by revaluing the opening and closing stocks at the average current prices of the period.
( 5) Exports of goods:
Exports of goods include domestic exports and re-exports of merchandise recorded on an f.o.b. basis, exclusive of monetary gold.
(6) Exports of services:
These are transactions in services provided by Hong Kong residents to the rest of the world. Data are obtained from the Hong Kong Tourist Association, various sources of administrative statistics, .and the Annual Survey of Imports and ExpOrts of Services.
(7) Imports of goods and imports of services:
In the expenditure approach, the items private consumption expenditure, governme;nt consumption expenditure, gross domestic fixed capital formation, change in stocks and exports of goods and of services are adde'd together and the ·values of imports of goods and of services are subtracted from the total. Such deduction has to be made so that the import contents associated with those items are eliminated to leave only the domestic contents. This is done at the.aggregate level as it is impracticable. to eliminate such import contents individually from each commodity or service.
Imports of goods are -valued at c.i.f.,. covering all merchandise imports and a proportion of retained imports of gold which is taken for _industrial use. Imports of services are estimated based on data obtained from various sources of administrative statistics, the Annual Survey of Imports and Exports of Services and the General Household Survey.
II. Production-based estimates
The production-based GDP- estimate is the sum of the net output or 'value added' of productive units, e.g. factories, shops, service organizations. Value added is derived as gross output less intermediate consumption, i.e. the value of production less the value of non-durable goods and services used in production. From an alternative angle, value added can be equated with the sum of factor incomes, i.e. compensation of e~ployees (wages, salaries, bonuses, employee benefits, etc.) and gross operating surj:>lus (the value attributed to non-labour factors of production inclusive Of the provision for consumption of fixed capital). Data sources for compiling the estimates are economic surveys conducted by the Census and Statistics Department, government accounts and other administrative records.
Economic activities covered by the production-based estimates are classified broadly into the following: agriculture and fishing; mining and quarrying; manufacturing; electricity, gas and water; construction; wholesale, retail and import/export trades, restaurants and hotels; transpott, storage and communication; financing, insurance, real estate and business services; community, social and personal services, and ownership of premises.
Ownership of premises is treated as an economic activity in the national accounts. This activity covers (i) rental services which households/persons as owners of premises provide to tenants, the value of which corresponds to rents received, and (ii) rental services which households/persons, government and private non-profit bodies as owners of premises provide to themselves, the value of which is imputed. However, rental services which commercial establishments as owners of premises provide to themselves are not included, since any imputed rent will simultaneously be an expense (intermediate consumption) and a receipt (gross output) for them, thus rendering the value-added unaffected. On the other hand, rental services which conunercial establishments provide to tenants have been included in the gross output of the respective activities in which they are engaged.
.Imputed bank service charge is an adjustment item relating to the financial services provided by the financial intermediaries to economic units in various economic activities, as the value of such financial services have not been fully includ~ in the intermediate consumption estimates of those units. In accordance with the United Nations System of National Accounts, imputed bank service charge is calculated as the net interest receipt (i.e. interest received minus interest paid) of the financial intermediaries.
Further details on the compilation of GDP estimates are contained in the publication 'Estimates of Gross Domestic Product, 1966 to 1990'. Descriptions specific to quarterly GDP estimates are contained in the publication 'Gross Domestic Product: Quarterly Estimates and Revised Annual Estimates' published in August 1991. Since November 1991 the latest quarterly estimates are available in the publication 'Quarterly Estimates of Gross :pomestic Product' published quarterly in February, May, August and November respectively.
Section 16 SUMMARY STATISTICS FROM ANNUAL ECONOMIC SURVEYS From 1990 survey round, the Annual Survey of Building, Construction and Real Estate Sectors
had adopted the Hong Kong Standard Industrial Classification (HS!C) fur publishing the survey results relating to analys~s by industry. Before 1990 round, the statistics were published under the International Standard Industrial Classification (!SIC). The HSIC is a new standard classification system devised with the ISIC as a frame work and with incorporation of the structure of the local economy. The new system will be used for all the economic surveys conducted by the Census.:& Statistics Department, thus comparabiFty between surveys of the Department can be maintained. For details of the HSIC, a special review article published in the September 1991 issue ofth~s series can be referred.
Hong Kong Monthly Digest of Statistics January 1993
[,
I'
JIU_~-· .
Hong Kong Annual Digest of Statistics (1992 Edition) The most comprehensive source of official statistics now available with detailed explanatory notes
The Hong Kong Annual Digest of Statistics, with 300 tables in 20 sections, is the most comprehensive source of official statistics. It contains findings of all major surveys of the Census and Statistics Department, and brings together in one volume statistical information on the social and economic developments of Hong Kong. The 1992 edition covers data from 1982-1991.
Now available at $98 per copy only
• Population & Vital Statistics • Labour & Wages • External Trade • Communications, Transport & Tourism • Food Supplies •Housing •Education • Medical & Health • Social Welfare • Law and Order • Climate & Geography • Gross Domestic Product • Industrial Production • Distributive Trades • Public Finance • Finance & Banking • Building & Construction • Consumer Prices • Culture & Entertainment
Copies can be purchased from the Government Publications Centre, General Post Office Building, Connaught Place, and from the Publications Sales Counter of Census & Statistics Department on 19/F of Wanchai Tower, 12 Harbour Road, Wan Chai, Hong Kong. Mail orders are welcome .
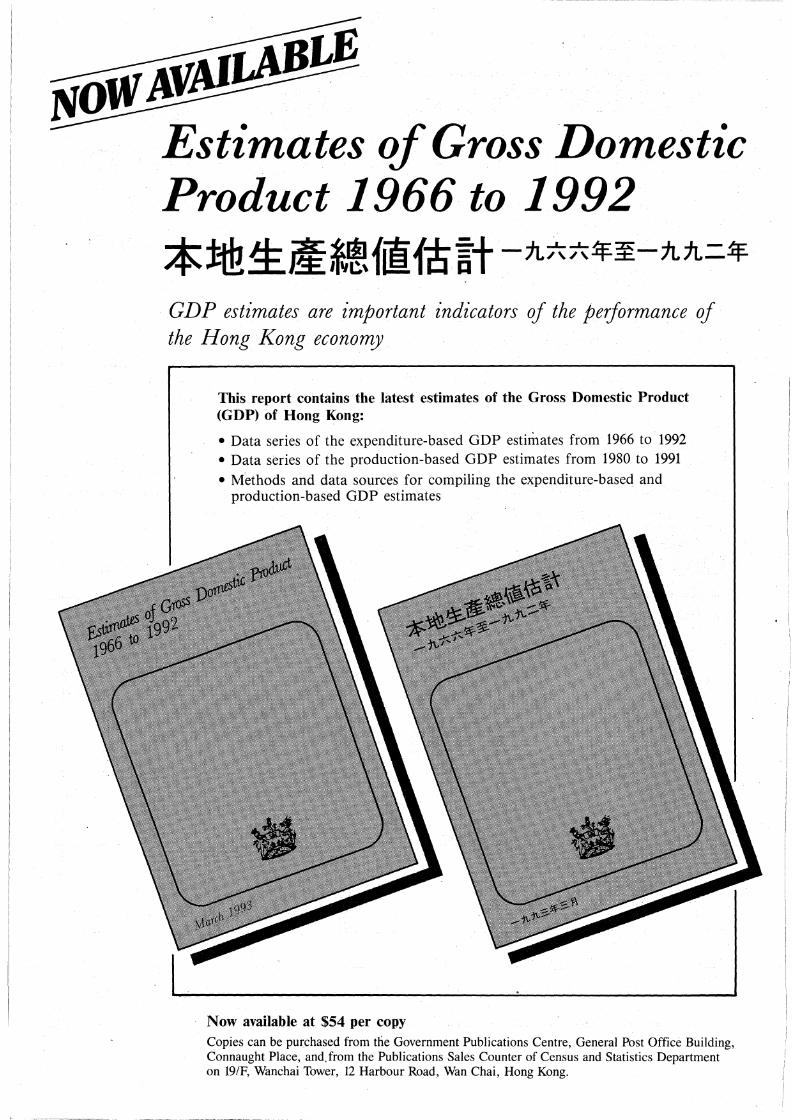
BLE NOW' Afj\JIA .
Estimates of Gross Domestic Product 1966 to 1992
GDP estimates are important indicators of the performance of the Hong Kong economy
This report contains the latest estimates of the Gross Domestic Product (GDP) of Hong Kong:
• Data series of the expenditure-based GDP estimates from 1966 to 1992 • Data series of the production-based GDP estimates from 1980 to 1991 • Methods and data sources for compiling the expenditure-based and
production-based GDP estimates
Now available at $54 per copy Copies can be purchased from the Government Publications Centre, General Post Office Building, Connaught Place, and, from the Publications Sales Counter of Census and Statistics Department on 19/F, Wanchai Tower, 12 Harbour Road, Wan Chai, Hong Kong.
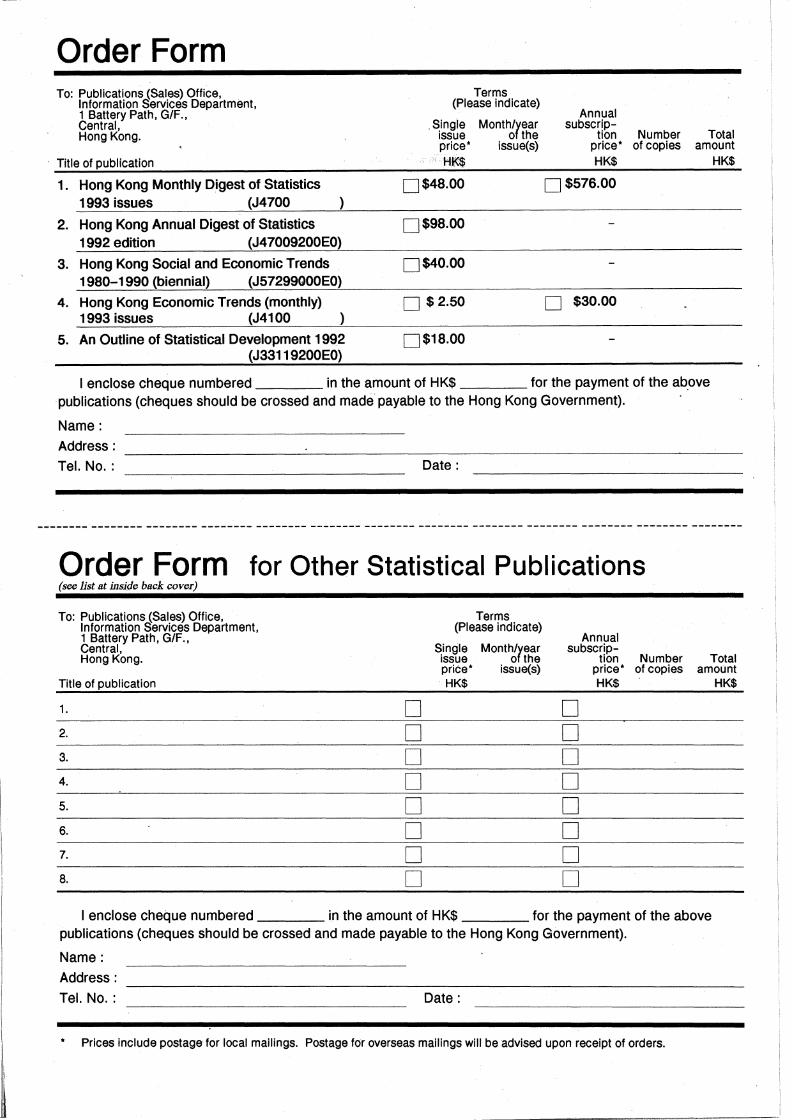
I' ;
Order Form To: Publications (Sales) Office,
Information Services Department, 1 Battery Path, G/F., Central, Hong Kong.
· Title of publication
1. Hong Kong Monthly Digest of Statistics 1993 issues (J4700 )
2. Hong Kong Annual Digest of Statistics 1992 edition (J47009200EO)
3. Hong Kong Social and Economic Trends 1980-1990 (biennial) (J57299QOOEO)
4. Hong Kong Economic Trends (monthly) 1993 issues (J4100 )
5. An Outline of Statistical Development 1992 (J33119200EO)
Terms (Please indicate)
.Single issue price• HK$
0$48.00
0$98.00
0$40.00
o $2.50
0$18.00
Month/year of the
issue(s)
Annual subscrip
tion price• HK$
0$576.00
o $30.00
Number of copies
Total amount
HK$
I enclose cheque numbered in the amount of HK$ for the payment of the ab_ove publications (cheques should be crossed and made payable to the Hong Kong Government).
Name: Address: Tel. No. : Date:
Order Form for Other Statistical Publications (see list at inside back cover)
To: Publications (Sales) Office, Information Services Department, 1 Battery Path, G/F., Central, Hong Kong.
Title of publication
1.
2.
3.
4.
5.
6.
7.
8.
D D D D D D D D
Terms (Please indicate)
Single Month/year issue of the price• issue(s) ·HK$
Annual subscrip-
tion Number price• of copies HK$
D D D D D D D D
Total amount
HK$
I enclose cheque numbered in the amount of HK$ for the payment of the above publications (cheques should be crossed and made payable to the Hong Kong Government).
Name: Address:
~~~~~~~~~~~~~~~~~~~~~~~~~~~~~~~~~~~~
Tel. No. : Date:
Prices include postage for local mailings. Postage for overseas mailings will be advised upon receipt of orders.
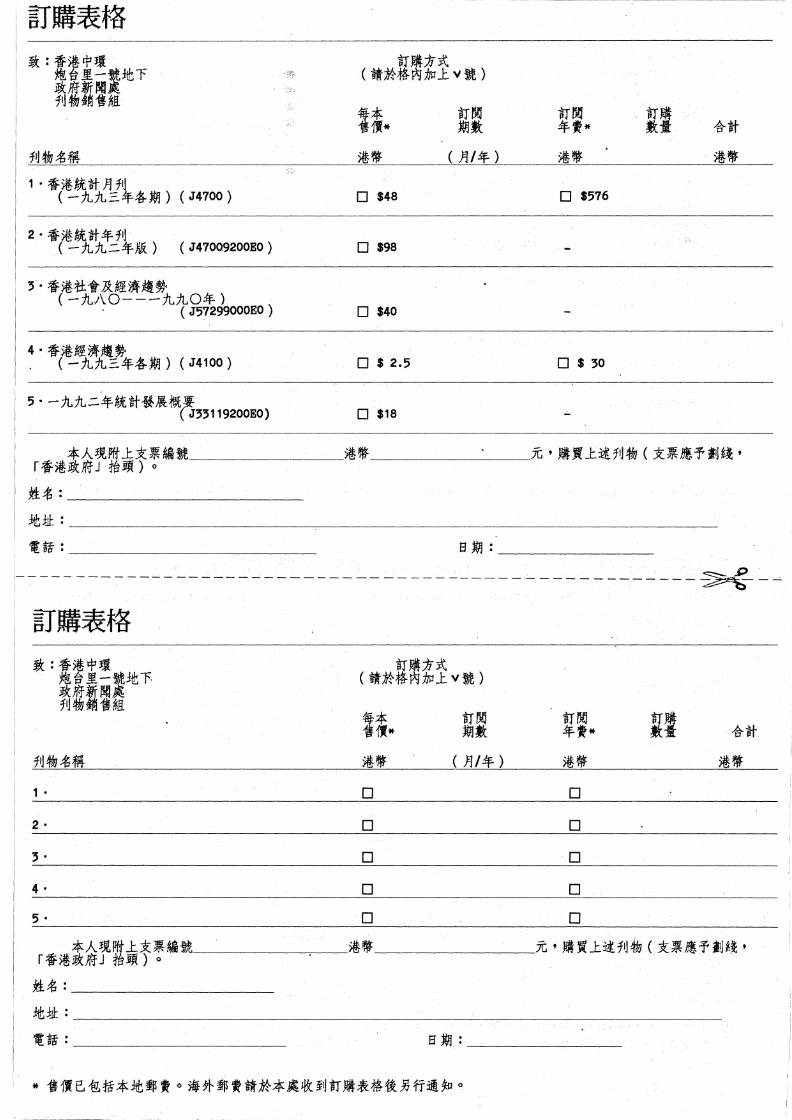
1 • 1"-~~tt }J 71] ( -}L}L.::.-1¥-~Jtll ) ( J4700 ) D $48 D $576
', 2 • *~~ tt .1f-f1J ( - }L }L..::. .1f-~ ) ( J 4 7009200EO ) D $98
l· 1"-~t.l:-t-2U¥~~~ ( -A.AO- - -}L}L0.1f-)
. ( J57299000EO ) D $40
4 • 1"-~#.I~~~ . ( -A.A..::.-1¥-~Jtll) ( J4100) D s 2.5 D s 30
5 . - }L }L..::. .1f-~ tt * Jl ;jg{~ ( J33119200EO) D $18
*-AJJtffl.J::t~~tt----~--~~-------JG • .$.WJ::Jif1Jtw ( :t~~-ffu#.~ • r :t-~ .ifk !ff J tft .BJi ) o
~~=~~~~~~~~~
~~=--------------,-----------------~ ~~: BJtij: -------
;----- ---- ---- ------------------ --------- ---- - - ---- ---~ ---'-
t* ti"M ti"M ~I il• Jtlltk df. t• ..g..tt
~~ ( }J/df.) ~~ ~~
I 1 • D D
D D
D D
4. D D
i 5. D D ---------------------------------
*-AJJtffl J::t~~tt r :t-~iJc!ff J #1 .BJi ) o ______ _ ~~ Jt • • .w J::li 111 ttm < :t~ ~ -t tu~~ •
~~=~~~~~~~-
~~=---------------------------~ ~~= --------- a Jtll : -------
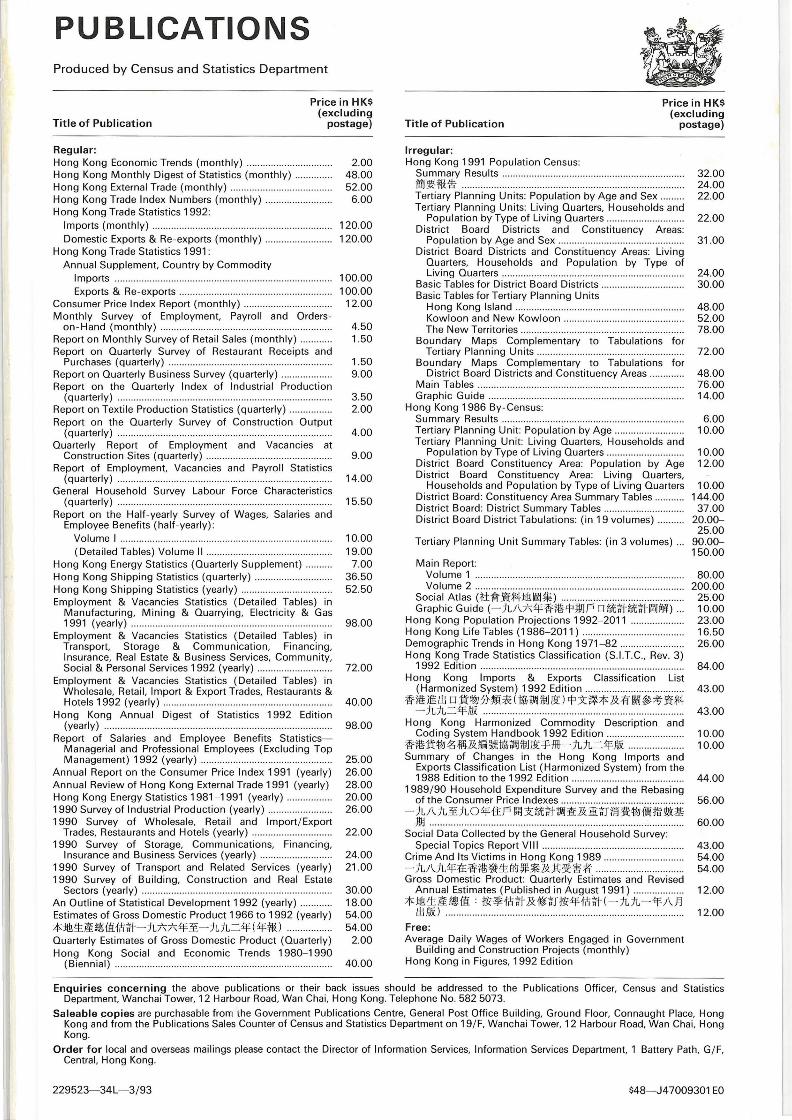
PUBLICATIONS Produced by Census and Statistics Department
T itle of Publ ication
Price in HK$ (excluding
postage)
Regular: Hong Kong Economic Trends (monthly) .. ....... ............ .......... . Hong Kong Monthly Digest of Stat istics (monthly) Hong Kong External Trade (monthly) .. ......... ....... ..... ......... ..... . Hong Kong Trade Index Numbers (month ly) ............... ........ . . Hong Kong Trade Statistics 1992:
Imports (monthly) ..... ............. ....... ....... ....... ...... ..................... . Domestic Exports & Re-exports (monthly) ....... ......... ........ .
Hong Kong Trade Statistics 1991: Annua l Supplement, Country by Commod ity
Imports ....... ..... ....... ....... ...... ..... ......... ......... ................ ....... .. . Exports & Re-exports ........................................................ .
Consumer Price Index Report (month ly) ...... ............... ..... ...... . Monthly Survey ·of Employment, Payrol l and Orders-
on-Hand (monthly) .......... ...... ............... ...... ........ ........ ...... .. .. . Report on Monthly Survey of Retail Sales (monthly) .... ..... .. . Report on Quarterly Survey of Restaurant Receipts and
Purchases (quarterly) .................................... ........ ......... ...... . . Report on Quarterly Business Survey (quarterly) .. ......... ..... .. . Report on the Quarterly Index of Industria l Production
(quarterly) .... ....................................................................... .... . Report on Texti le Production Statistics (quarterly) ............... . Report on the Quarterly Survey of Construction Output
(quarterly) ...... ............ ... ....... .... ... ....... ...... ....... ....... ....... ....... ... . Quarterly Report of Employment and Vacancies at
Construction Sites (quarterly ) ....... ..... ......... ...... ..... ........ ...... . Report of Employment, Vacancies and Payroll Statistics
(quarterly) ....... ....... .............. ....... .... ........ ........... .. ................... . General Household Survey Labour Force Characteristics
(quarterly) ........... ..................... ... ....... ..... ....... ....... ....... ...... ..... . Report on the Half-yearly Survey of Wages, Salari es and
Employee Benefits (half -yearly) : Volume I .. ....... ............. ........... .. ...... ........ ....... .................... .. . (Detailed Tables) Volume II .... ..... .... ............ ..................... .
Hong Kong Energy Statistics (Quarterly Supplement) ......... . Hong Kong Shipping Statistics (quarterly) .......... ..... ............. . Hong Kong Shipping Statistics (yearly) ...... ....... ....... ....... ...... . Employment & Vacancies Statistics (Detailed Tables) in
Manufacturing, Mining & Quarrying, Electricity & Gas 1991 (yearly) ... ...... ...... ..... ......... ....... ..... ....... ............. .. ..... ..... .
Employment & Vacancies Statistics ( Detailed Tables) in Transport, Storage & Communication, Financing, Insurance, Real Estate & Business Services, Community, Socia l & Personal Services 1992 (yearly) .... ................ ....... .
Employment & Vacancies Statistics (Deta iled Tables) in Wholesale, Retail, Import & Export Trades, Restaurants & Hotels 1992 (yearly) .......... ..... ...... ...... ............ ......... ..... ......... .
Hong Kong Annual Digest of Statistics 1992 Edition (yearly) ....................................................... ............................. .
Report of Salaries and Employee Benefits StatisticsManagerial and Professional Employees (Excluding Top Management) 1992 (yearly) ....... ........ ... ........ ...... ...... ......... . .
Annual Report on the Consumer Price Index 1991 (yearly) Annual Review of Hong Kong External Trade 1991 (yearly) Hong Kong Energy Statistics 1981 - 1991 (yearly) ............. ... . 1990 Survey of Industrial Production (yearly) ....... ........ ........ . 1990 Survey of Wholesale, Retail and Import/ Export
Trades, Restaurants and Hotels (yearly) ............................. . 1990 Survey of Storage, Communications, Financing,
Insurance and Business Services (yearly) ..... ..... ........ ........ . 1990 Survey of Transport and Related Services (yearly) 1990 Survey of Building, Construct ion and Real Estate
Sectors (yearly) ....... .... ....... .................................................... . An Outline of Statistica l Development 1992 (yearly) ........... . Estimates of Gross Domest ic Product 1966 to 1992 (yearly) ::4>::111!.~•·-m.1tr tt1·- )Lj\j\:tf.~-;h. .1L=:tf.(:tf.* ) ......... ....... . Quarterly Est imates of Gross Domestic Product (Quarterly ) Hong Kong Social and Economic Trends 1980- 1990
(Biennial) ........ ........ ....... ........................................... ....... ....... .
2.00 48.00 52.00
6.00
120.00 120.00
100.00 100.00
12.00
4.50 1.50
1.50 9.00
3.50 2.00
4.00
9.00
14.00
15.50
10.00 19.00
7.00 36.50 52.50
98.00
72.00
40.00
98.00
25.00 26.00 28.00 20.00 26.00
22.00
24.00 21 .00
30.00 18.00 54.00 54.00
2.00
40.00
Title of Publication
Price in HK$ (excluding
postage)
Irregular: Hong Kong 1991 Population Census:
Summary Results .... ................... ............ ..... ...... ....... ............. . .
MJN*1* ················· ······· ···· ······ ····· ······· ······· ······· ······················· Tertiary Planning Units: Population by Age and Sex ........ . Tertiary Planning Units: Living Quarters, Households and
Popu lation by Type of Living Quarters .... ....... ...... ........... . District Board Districts and Constituency Areas:
Population by Age and Sex .... ......... ................................. . District Board Districts and Constituency Areas: Living
Quarters, Households and Population by Type of Living Quarters ........ ...... ..... ....... ..... ...... ................. ............. .
Basic Tables for District Board Districts ........................ .. .... . Basic Tables for Tertiary Planning Units
Hong Kong Island .... ................. ................. ..... ... ......... ....... . Kowloon and New Kowloon .... ....... ..... ...... ....... ..... ..... ..... . The New Territories .. ..... ...... .. .... .................. ....................... .
Boundary Maps Complementary to Tabulations for Tertiary Plann ing Units ................ ..... ..... .................. ....... ... .
Boundary Maps Complementary to Tabulations for District Board Districts and Constituency Areas ... ....... .. .
Main Tables .... .... ................................... ... ................... ..... ...... . Graphic Gu ide ............. ............... ................ ............ .... ........ .... .
Hong Kong 1986 By-Census: Summary Results ............... .... ........... ... ..... ...... ........... ........ ... . . Tertiary Plann ing Unit: Population by Age .. ..... ....... .... ..... .. . Tertiary Planning Unit Living Quarters, Households and
Population by Type of Living Quarters ............................ . District Board Constituency Area: Popu lation by Age District Board Constituency Area: Living Quarters,
Households and Popu lation by Type of Living Quarters District Board: Constituency Area Summary Tables .... ...... . District Board: District Summary Tables ...... ... .................... . District Board District Tabulations: (i n 19 volumes) ... ...... .
Tertiary Planning Unit Summary Tables: (in 3 volumes) .. .
Main Report Volume 1 ...... ..... ....... ....... ..... ............ .......... ... ...... ....... ......... . Volume 2 .................... .... ....... ....... ..... ...... ..... ......... ..... ..... .... .
Social Atlas ( :ffirjf:t'iJ.:111!./lilll~ ) .... ..... ............. ..... ...... ............ . Graphic Guide (- JLA:i\:tf.'i!f'f!l;i:J=iWJF r::Jt#Cfti·t!tftf-l!IBWO .. .
Hong Kong Population Projections 1992-2011 ........ ........... . Hong Kong Life Tables (1986- 2011) ... ...... ..... ....... ................ . Demographic Trends in Hong Kong 1971 - 82 ...... ..... ............ . Hong Kong Trade Statistics Classification (S .l.T.C., Rev. 3)
1992 Ed ition ........... ..... ........... ...... ....... .................................. . . Hong Kong Imports & Exports Classification List
(Harmonized System) 1992 Edition ....... ...... ...... ................. . 'i!f'f!l;Jil1tl:l r::1 :1'!i:!lm :5HJ'f~ ( 11Wal!l11JIJ!Jr l 9=1Jtillf::4>:.&~IMJ~~jf*Sf
- ;h.J1= :tf.Jt& ···· ········· ··········· ··········· ···································· ···· Hong Kong Harmonized Commodity Description and
Coding System Handbook 1992 Edition ............... ...... .... ... . wm:1'!i:•~wmmi~11Wa11J11J1J&-¥:l!lt-J1J1=:tf.ri& .. ................. . . Summary of Changes in the Hong Kong Imports and
Exports Classificati on List (H armonized System) from the 1988 Edition to the 1992 Editi on ....................... ... ............ ... .
1989/ 90 Household Expenditure Survey and the Rebasing of the Consumer Price Indexes ................. .. ...... ...... ............ .. .
-;h.A ;h.~)LO:tf.QFM~•m-•~.&•Umft•m••~ WJ ...... ...... ..... ................................ ............ ................................. .
Social Data Collected by the General Household Survey: Special Topics Report VI II ...... ....... ....... ...................... ....... ... .
Crime And Its Victims in Hong Kong 1989 .... ..... ....... ......... .... . -;h.A;h.:tf.:(:E'ilf'f!l;~~(:t'gfil~.&;J;J;3t~~ ...... .... ................... ... . Gross Domestic Product Quarterly Est imates and Revised
Annual Estimates (Published in August 1991) ...... ............ . ::4>::111!.~•••=m*~ITT-.&•um•~ITT-( - fLfL- :tf.A~
tl:lri& l ··················· ······ ······ ······· ····· ····· ········ ·························· ····· ·· Free: Average Daily Wages of Workers Engaged in Government
Bu ild ing and Construction Projects (monthly) Hong Kong in Figures, 1992 Edition
32.00 24.00 22.00
22.00
31.00
24.00 30.00
48.00 52.00 78.00
72.00
48.00 76.00 14.00
6.00 10.00
10.00 12.00
10.00 144.00
37.00 20.00-25.00
90.00-150.00
80.00 200.00
25.00 10.00 23.00 16.50 26.00
84.00
43.00
43.00
10.00 10.00
44.00
56 .00
60.00
43.00 54.00 54.00
12.00
12.00
Enquiries concerning the above publ ications or their back issues should be addressed to the Publications Officer, Census and Statistics Department, Wanchai Tower, 12 Harbour Road, Wan Chai, Hong Kong. Telephone No. 582 5073.
Saleable cop ies are purchasable from the Government Publ ications Centre, General Post Office Building, Ground Floor, Connaught Place, Hong Kong and from the Publications Sa les Counter of Census and Statistics Department on 19/ F, Wanchai Tower, 12 Harbour Road, Wan Chai, Hong Kong.
Order for local and overseas mailings please contact the Director of Information Services, Information Services Department, 1 Battery Path, G/ F, Central, Hong Kong.
$48-J47009301EO
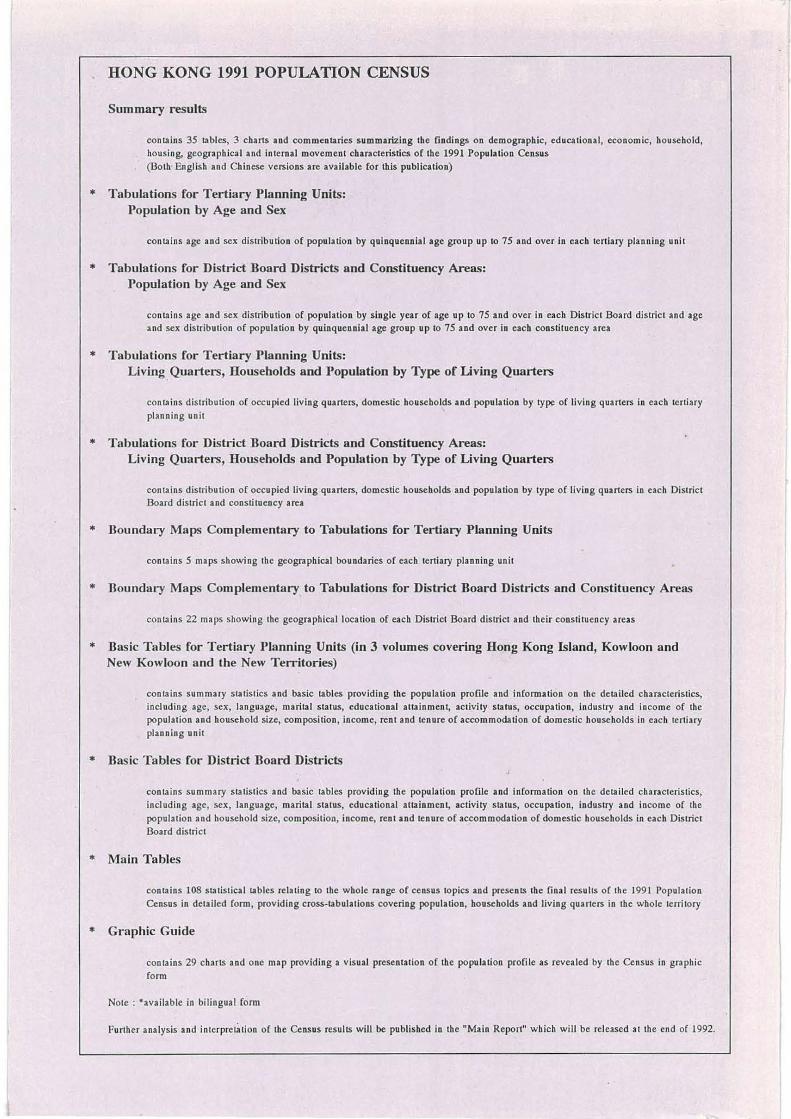
*
*
*
*
*
*
*
HONG KONG 1991 POPULATION CENSUS
Summary results
conlains 35 lables, 3 c harts and commenlaries summarizing the fi ndings on demograph ic, educationa l, economic, ho usehold, housing, geographica l and internal movement characteristics of the 1991 Population Census (Both· Engl ish and Chinese versions a re available for this publication)
Tabulations for Tertiary Planning Units: Population by Age and Sex
conlains age and sex distribution of population by quinquennial age group up to 75 and over in each tertiary planning unit
Tabulations for District Board Districts and Constituency Areas: Population by Age and Sex
contains age and sex distribution of populatio n by single year of age up to 75 and over in each District Board distric l and age and sex dislribution of population by quinquennial age group up to 75 and over in each conslituency area
Tabulations for Tertiary P lanning Units: Living Quarters, Households and Population by Type of Living Quarters
con1ains distribution of occupied living quarters, domestic households and population by type of living quarters in each terliary planning unit
Tabulations for District Board Districts and Constituency Areas: L iving Quarters, Households and Population by Type of Living Quarters
contains dislribution of occupied living quarters, domestic households and population by type of living quarters in each Dislrict Board dis1ric1 and constituency area
Boundary Maps Complementary to Tabulations for Tertiary Planning Units
contains 5 maps showing 1he geographical boundaries of each tertiary planning unit
Boundary Maps Complementary to Tabulations for District Board Districts and Constituency Areas
contains 22 maps showing 1he geographical location of each District Board dis1rict and 1heir constituency areas
Basic Tables for Tertiary Planning Units (in 3 volumes covering Hong Kong Island, Kowloon and New Kowloon and the New Territories)
con1ains summary s1atis1ics a nd basic tables providing the population profile and information on the detailed charac1eris1ies, including age, sex, language, marilal s tatus, educational auainment, activity slatus, occupation, indus1ry and income of the population and household size, composition, income, rent and tenure of accommodation of domestic households in each 1ertiary planning unil
* Basic Tables for District Board Districts
contains summary sta tistics and basic lables providing 1be population profile and information on the dclailcd characteristics, including age, sex, language, mari1al status, educational auainment, activity slatus, occupation, industry and income of 1he
population and household size, composition, income, rent and tenure of accommodation of domestic households in each Districl Board dis1rict
* Main Tables
*
contai ns 108 slatislical lables relating to lhe whole range of census topics and presents the final results of 1he 199 1 Populalion Census in dc1ailed form, providing cross-labulations covering population, households and living quarters in 1he whole 1erritory
Graphic Guide
con1ains 29 charts and o ne map providing a visual presentation of the population profile as revealed by lhe Census in graphic form
Nole : •available in bi lingual form
Furlhcr analysis and inlcrpret.ltion of the Census results will be published in the "Main Report" which will be released al the end o[ 1992.


![CSR Report 2015 [Digest]](https://img.pdfslide.net/doc/110x75/63257519cedd78c2b50c99c4/csr-report-2015-digest.jpg)