Embed Size (px)
Citation preview

Journal of Asian Earth Sciences 88 (2014) 230–245
Contents lists available at ScienceDirect
Journal of Asian Earth Sciences
journal homepage: www.elsevier .com/locate / jseaes
How fast is the denudation of the Taiwan mountain belt? Perspectivesfrom in situ cosmogenic 10Be
http://dx.doi.org/10.1016/j.jseaes.2014.03.0121367-9120/� 2014 Elsevier Ltd. All rights reserved.
⇑ Corresponding author at: Aix-Marseille Université, CNRS-IRD-Collège de France,UM 34 CEREGE, Technopôle de l’Arbois, BP80, 13545 Aix-en-Provence, France andInstitute of Earth Sciences, Academia Sinica, 128 Academia Road Sec. 2, Nankang,Taipei 115, Taiwan. Tel.: +33 442 971 760.
E-mail address: [email protected] (L.L. Siame).
Florence Derrieux a, Lionel L. Siame a,b,f,⇑, Didier L. Bourlès a,f, Rou-Fei Chen c,f, Régis Braucher a,f,Laetitia Léanni a, Jian-Cheng Lee c,f, Hao-Tsu Chu d,f, Timothy B. Byrne e
a Aix-Marseille Université, CNRS-IRD-Collège de France, UM 34 CEREGE, Technopôle de l’Arbois, BP80, 13545 Aix-en-Provence, Franceb Institute of Earth Sciences, Academia Sinica, 128 Academia Road Sec. 2, Nankang, Taipei 115, Taiwanc Department of Geology, Chinese Culture University, 55, Hwa-Kang Road, Yang-Ming-Shan, Taipei, Taiwand Central Geological Survey, Ministry of Economic Affairs, P.O. Box 968, Taipei, Taiwane Center for Integrative Geosciences, University of Connecticut, Storrs, CT 06269, United Statesf LIA (Associated International Laboratory), ADEPT (Active Deformation and Environment Programme for Taiwan), Centre National de la Recherche Scientifique/Institut Nationaldes Sciences de l’Univers (France), National Science Council, Taiwan
a r t i c l e i n f o
Article history:Received 18 September 2013Received in revised form 27 February 2014Accepted 17 March 2014Available online 29 March 2014
Keywords:DenudationCosmogenic nuclides [10Be]Mountain buildingTaiwan
a b s t r a c t
Quantifying denudation rates in a wide range of climatic and tectonic settings at various time and spacescales is a critical step in calibrating and validating landscape evolution models. Focusing on Taiwan, wequantified centennial rates of denudation at the scale of the whole orogen, using in situ 10Be concentra-tions measured in stream sediments collected at the outlets of major rivers. To assess denudation ratesthat are statistically significant, we applied both the mean square weighted deviation approach and thebootstrap technique. For the central segment of the belt, where the collision is considered to be nearmature, the orogen-scale pattern of denudation shows a two-fold pattern: (1) higher denudation valueson the order of 4–5 mm/yr characterize the eastern side of the belt (i.e., retro-wedge), with a slightincrease towards the south and (2) lower denudation values on the order of 1–3 mm/yr on the westernside of the belt (pro-wedge) with a minimum value centered on the main recess of the deformation front.To the north and to the south of the central segment, the denudation rates converge towards lower valueson the order of 2–3 mm/yr. At the scale of the mountain belt, drainage basin metrics such as relief, hyp-sometric index and slope values seem to explain the observed variance in the data population, converselyto the first-order average precipitation pattern, suggesting a strong tectonic control on the regional pat-tern of denudation rates. Applied to the whole orogen, such field-based approach thus provides impor-tant input data to validate and calibrate the parameters to be supplied to landscape evolution models.
� 2014 Elsevier Ltd. All rights reserved.
1. Introduction
Orogenic settings resulting from tectonic evolution along con-vergent margins record connection between deep and surface pro-cesses (Davis et al., 1983; Selzer et al., 2008). Within orogenicwedges, horizontal and vertical tectonic movements indeed createa topographic relief that is in turn progressively destroyed bydenudational processes (Willett, 1999), leading to landmass redis-tributions (Konstantinovskaia and Malavieille, 2005). Nevertheless,the interaction of deep and shallow processes is still poorly
understood and the role these processes play in the exhumationof rocks, in the structural evolution of orogenic wedges, and indefining the relations between tectonics and climate-dependentsurface processes are still debated (Dahlen and Suppe, 1988; Whip-ple and Meade, 2004; Cruz et al., 2010; Konstantinovskaya andMalavieille, 2011). However, as pointed out by Molnar (2009), itmay be more pertinent to quantify independently the processes in-volved in mountain belt evolution rather than trying to study theinteractions among them. As part of this effort, quantification ofdenudation rates in a wide range of climatic and tectonic settingsat various time and space scales is a critical step in providing fun-damental input parameters to feed analog and numerical models oforogenic systems.
The present-day denudational context of Taiwan is controlledby high uplift rates (e.g., Ching et al., 2011), linked to the north-west-directed collision of the north-trending Luzon arc against

F. Derrieux et al. / Journal of Asian Earth Sciences 88 (2014) 230–245 231
the northeast-trending continental margin of Eurasia at a rate ofroughly 82 mm/yr (Yu et al., 1997; Sella et al., 2002). Combinedwith a tropical to sub-tropical climate characterized by mean an-nual precipitations on the order of 2500 mm and an average of fourtyphoons per year hitting the island, this geodynamic situation hasled to a high, deeply incised topography, triggering the evolution ofthe wedge towards a state of quasi-equilibrium in which input andoutput processes are considered to be balanced (e.g., Koons, 1990;Beaumont et al., 2000; Suppe, 1981; Dahlen and Suppe, 1988; Wil-lett et al., 2003; Molnar, 2009).
In Taiwan, denudation is essentially accomplished by runoff onhillslopes and transport by rivers with a strong predominance ofsuspended and bed load fractions (Lee, 1976; Li et al., 2005), andlandslides that break away rock masses and promote rapid outgo-ing sedimentary fluxes by the rivers (Hovius et al., 2000; Chenet al., 2005). In Taiwan, denudation rates have been estimated bymethodological approaches spanning a few decades, using sus-pended load data from major rivers (Lee, 1976; Dadson et al.,2003; Fuller et al., 2003; Li et al., 2005; Siame et al., 2011), to afew millions of years, using data from low-temperature thermo-chronology and associated thermo-mechanical models (Liu, 1982;Liu et al., 2000; 2001; Willett et al., 2003; Fuller et al., 2006; Simoeset al., 2007; Beyssac et al., 2007) or using detrital pyrrhotite min-eral distribution (Horng et al., 2012). The first group of studies in-volves calibrations linking water discharge and river suspendedload (Lee, 1976), coupled with stochastic modeling of the hydro-logical signal temporal variations (Fuller et al., 2006) or with esti-mation of the bed load component (Dadson et al., 2003). Theseapproaches estimated average denudation rates ranging from 2to 8 mm/yr in the Central Range, and on the order of 5 mm/yr forthe whole mountain belt of Taiwan, with local maximum valuesexceeding 30 mm/yr (Dadson et al., 2003). This average value of5 mm/yr is close to that obtained by You et al. (1988) using theconcentration of atmospheric cosmogenic 10Be in river sediments.
The second group of studies relies on fission track data, whichyield long-term rates of exhumation on the order of 3–6 mm/yrfor the Central Range (Liu, 1982; Liu et al., 2000, 2001; Dadsonet al., 2003; Willett et al., 2003). However, recent reassessmentusing fission track data combined with two-dimensional thermo-mechanical models including heat flux calibrations (Fuller et al.,2006; Simoes et al., 2007; Yamato et al., 2009) proposed lowerlong-term rates of denudation throughout the whole orogen rang-ing between 2 and 4 mm/yr for the Taiwan mountain belt. Usingpyrrhotite mineral as a tracer for denudation of the Taiwan orog-eny, Horng et al. (2012) proposed that the exhumation and thedenudation of the belt accelerated since the late Pliocene from lessthan 1 mm/yr to more than 2 mm/yr, that generally agrees withthe onset timing of the arc-collision in Taiwan.
Even if, at the scale of the whole orogen, the denudation ratesestimated from these different techniques roughly converge to-wards values on the order of 3–5 mm/yr, it appears difficult to de-rive a more precise pattern at the regional or more local scale. Onthe one hand, the denudation rates derived from decadal sus-pended loads could be significantly imprinted by the extreme pro-cesses resulting from landslides triggered by typhoons andearthquakes, as well as biased by the poor control on the bed loadcontribution to the sediment out flux (e.g., Dadson et al., 2003; Liet al., 2005; Siame et al., 2011). With values higher than 30 mm/yr in some parts of the Taiwan orogen, such denudation rates canhardly be regarded as representative for longer geological timescales (see Fig. 2a in Dadson et al., 2003). On the other hand, ifthe thermo-chronological models provide insight into behavior ofconceptual orogenic systems, the thermal history of the Taiwancollision may not be a steady process and, therefore, the derivedlong-term rates of denudation should be considered withcaution.
In this study, we investigate the rates at which the topographyof the Taiwan mountain range is being eroded. To achieve thisgoal, we quantified spatially averaged denudation rates deter-mined from in situ-produced cosmogenic 10Be concentrationsmeasured in river-borne quartz grains and conducted a statisticalanalysis to determined the best representative central values fornine major watersheds located on both sides of the Taiwan oro-gen. This analysis allows examining the pattern and magnitudeof denudation rates at the scale of the orogenic system, whichprovides the necessary data for interpreting the denudationalconditions that prevail in the Taiwan mountain belt. Hereafter,we first present the rational for determining denudation ratesfrom measurement of in situ produced 10Be in detrital river sed-iment and its application to Taiwan’s watersheds. We then detailthe data analysis in terms of reliability of the data, identificationof outliers and search of meaningful central values to characterizethe denudation rate prevailing within each studied watershed. Fi-nally, we gauge the cosmogenic-derived denudation rates againstgeomorphic metrics and discuss the regional pattern of denuda-tion rates.
2. Cosmogenic-derived denudation rates
Secondary particles, derived from nuclear reactions producedby cosmic rays within the atmosphere, interact with rocks or soilsexposed at the Earth’s surface, producing 10Be predominantlywithin a few meters below the surface because of the exponentialattenuation of production rates with depth (Lal, 1991; Gosse andPhillips, 2001). In situ-produced cosmogenic 10Be concentrationsmeasured in river-borne sands can be used to document hillslopeexposure history and estimate basin averaged denudation rates(Brown et al., 1995a; Bierman and Steig, 1996; Granger et al.,1996). The cosmogenic build-up records hillslope denudation his-tory while the material is vertically mixed-up through the uppermeters of regolith, and thus integrates both the erosional andweathering processes associated with surface denudation. Sincethe rivers carry and mix the sediment derived from the soil-man-tled hillslopes, they are natural spatial integrators of these pro-cesses. Assuming cosmogenic production steady state andnegligible transport time at the surface, determination of 10Beconcentrations in river-borne quartz allows estimating time-inte-grated rates of denudation at the basin scale (for reviews, see vonBlanckenburg, 2005; Granger and Riebe, 2013; Granger et al.,2013). In landscapes evolving significantly through mass-wastingprocesses such as Taiwan, the changes in sediment fluxes follow-ing landslides make the sediment residence time in the systemmore variable (Yanites et al., 2009). Nevertheless, previous stud-ies using numerical modeling (e.g., Niemi et al., 2005), suggestthat larger catchments are likely to yield a better approximationof long-term denudation rate than smaller catchments and thatsampling multiple, similarly-sized watersheds also have a signif-icant likelihood of yielding consistent cosmogenic-derived denu-dation rates.
In an effort to document the regional pattern and magnitudeof denudation rates throughout the Taiwan mountain belt, ninemain river catchments and some associated sub-basins (withareas larger than 50 km2) have been sampled from north tosouth and on both sides of the orogen (Fig. 1). A total of 33samples, each consisting of �2 kg of stream sand collected inthe active riverbed, were collected. For some sites, quartz peb-bles were also sampled providing the opportunity to comparedenudation rate estimations for two very different grain sizes.In online Supplemental material (hereafter referred as AppendixA), we provide location and field photographs for each sampledwatershed.

Fig. 1. Localization of the studied watersheds. (A) Structural domains of Taiwan: C.P., Coastal Plain; W.F., Western Foothills; H.R., Hsueshan Range; C.R., Central Range; C.R.,Coastal Range; O.T., Okinawa Trough; R.T., Ryukyu Trench; D.F., Deformation Front. Circled numbers refer to the different collision stages: (1: waning; 2: mature; 3: incipientcontinental subduction) after Shyu et al. (2005). (B) Geological map of Taiwan (Chen et al., 2009) locating the studied catchments. Circled numbers refer to the watershedsdisplayed around the map. Inserts show the topography of the studied watersheds with sample locations (elevation in meters above sea level from a 40 m-resolution digitalelevation model). MI, Miocene argilites, slate, phyllite; Ep, Eocene slate, phyllite; PM4, Paleozoic–Mesozoic black schist; PM3, Black schist, greenschist, siliceous schist; PM2,Metamorphosed limestone; PM1, Gneiss and migmatite.
232 F. Derrieux et al. / Journal of Asian Earth Sciences 88 (2014) 230–245
2.1. Sample preparation
Chemical treatments and preparations for Accelerator MassSpectrometry (AMS) measurements were performed at the Labora-toire National des Nucléides Cosmogéniques (LN2C) housed byCEREGE (Aix en Provence, France), following chemical proceduresadapted from Brown et al. (1991) and Merchel and Herpers(1999). After sieving, the 1–0.25 mm fraction was separated intomagnetic and non-magnetic fractions, and the non-magnetic frac-tion was bathed in fluorosilicic and hydrochloric acids to eliminateall mineral phases except quartz. The quartz minerals then under-went a series of selective etchings in hydrofluoric acid to eliminatepotential surface contamination by 10Be produced in the atmo-sphere. The cleaned quartz minerals were then completely dis-solved in hydrofluoric acid after addition in each sample of�100 ll of an in-house carrier solution (3.025 ± 0.009) � 10�3
g 9Be/g solution) prepared from a deep-mined phenakite crystal(Merchel et al., 2008). Hydrofluoric and Perchloric fuming wasused to remove fluorides and both cation and anion exchange chro-matography were used to eliminate iron, aluminum, manganeseand other elements. Beryllium oxide was mixed to 325 mesh nio-bium powder prior to measurements by Accelerator Mass Spec-trometry (AMS), which were performed at ASTER (Accélérateurpour les Sciences de la Terre, Environnement et Risques, Aix-en-Provence) AMS French facility (Arnold et al., 2010). Beryllium-10
data were calibrated directly versus the National Institute of Stan-dards and Technology standard reference material NIST SRM 4325using an assigned 10Be/9Be value of (2.79 ± 0.03) � 10�11 (Nishiiz-umi et al., 2007) and a 10Be half-life of (1.387 ± 0.012) � 106 years(Korschinek et al., 2010; Chmeleff et al., 2010).
2.2. Basin-wide denudation rates
To determine basin averaged production rates, scaling factorsfor latitude and altitude corrections were calculated according toStone (2000), for each pixel of a 40 m-resolution digital elevationmodel (DEM) using the Cronus-Earth Matlab scripts (http://hess.ess.washington.edu/math/). Geomorphic shielding factorswere also calculated for each pixel of the DEM using a 10� azimuthstep following formulations by Dunne et al. (1999). For the easternwatersheds, surfaces corresponding to outcrops of carbonatelithologies have been masked, removing their contribution fromthe total production rate and allowing only for the areas withquartz-bearing rocks (Table 1). For each sampled watersheds, basinaveraged production rates were calculated using a modern 10Beproduction rate at sea level and high latitude of 4.5 ± 0.3 atoms/g-SiO2/yr to account for the reevaluation of absolute calibrationof 10Be AMS standards proposed by Nishiizumi et al. (2007). Sam-ple information as well as 10Be concentrations are presented inTable 1.

Table 1Sampling location, watershed characteristics and Accelerator Mass Spectrometry (AMS) measurements performed at ASTER (Accélérateur pour les Sciences de la Terre,Environnement et Risques, Aix-en-Provence) AMS French facilities (Arnold et al., 2010).
Watershed SampleID
Grainsize
Basin area(km2)a
Meanelevation(m)
Samplelocation(WGS84)
10Be/9Beb [10Be/9Be](103 atoms/g)d
Scalingfactore
Scaled mean productionrates (at./g/yr)f
Total Reduced Lat.(�N)
Lon(�E)
Value(�10�15)
Error(%)
N Chi-squarec
Value Error Shielding Stone’sfactor
Neutrons Slowmuons
Fastmuons
Western sideTajia (1) Ta-1 Sand 964 – 2094 24.16 120.85 4.96 12.8 66 31.57 6.81 1.17 0.95 3.65 15.61 0.03 0.06
Ta-2 Sand 257 – 2467 24.3 121.27 7.25 52.1 4 3.08 – – – – – – –Ta-3A Sand 155 – 2438 24.32 121.28 2.9 19.4 27 10.33 10.91 3.25 0.95 4.39 18.79 0.03 0.06Ta-3B Pebbles 155 – 2438 24.32 121.28 3.92 16.89 43 17.35 3.05 0.71 0.95 4.39 18.79 0.03 0.06Ta-4A Sand 418 – 2444 24.3 121.26 3.75 21.32 22 11.92 11.81 3.33 0.96 4.38 18.85 0.03 0.06Ta-4B Pebbles 418 – 2444 24.3 121.26 3.51 12.5 64 21.58 2.47 0.5 0.96 4.38 18.85 0.03 0.06
Wu (2) Wu-1 Sand 996 – 1073 23.99 120.8 6.11 12.22 67 40.11 9.13 1.4 0.97 1.82 7.92 0.02 0.05Wu-2 Sand 78 – 716 24.05 120.86 6.51 11.79 72 44.28 5.6 0.82 0.98 1.29 5.73 0.02 0.05Wu-3 Sand 435 – 1464 24.05 120.86 3.75 13.02 59 22.64 8.34 1.66 0.95 2.4 10.27 0.02 0.05Wu-4 Sand 420 – 824 24.02 120.84 20.83 5.93 341 237.08 24.49 1.57 0.98 1.43 6.3 0.02 0.05Wu-5 Sand 337 – 1676 24.08 120.98 4.32 12.74 66 27.54 5.2 0.95 0.95 2.71 11.53 0.02 0.05Wu-6 Sand 98 – 1265 23.99 121.01 7.07 22.27 27 15.73 9.48 2.37 0.96 1.96 8.45 0.02 0.05
Choshui (3) Cho-1 Sand 2892 – 1554 23.79 120.63 4.38 12.81 61 27.74 4.13 0.75 0.96 2.64 11.38 0.02 0.05Cho-2 Sand 2196 – 1782 23.81 120.84 5.45 10.84 87 42.72 5.97 0.88 0.95 3 12.85 0.02 0.05Cho-3A Sand 1486 – 1997 23.79 121 2.91 13.25 57 15.39 3.12 0.74 0.95 3.38 14.45 0.03 0.06Cho-3B Pebbles 1486 – 1997 23.79 121 2.45 15.43 42 10.07 1.17 0.34 0.95 3.38 14.45 0.03 0.06Cho-4 Sand 1537 – 1974 23.79 120.93 11.85 9.17 119 91.57 9.39 0.97 0.95 3.34 14.26 0.03 0.06
Laonong (4) Lao-2 Sand 491 – 2216 23.21 120.8 3.09 14.75 46 15.29 4.63 1.12 0.94 3.88 16.35 0.03 0.06Lao-3 Sand 132 – 1630 23.11 120.69 3.92 13.49 55 23.05 3.98 0.79 0.94 2.63 11.14 0.02 0.05
Eastern sideHeping (5) He-1A Sand 532 506 1469 24.33 121.72 2.21 22.42 22 5.93 2.54 0.99 0.95 2.43 10.41 0.02 0.05
He-1B Pebbles 532 506 1469 24.33 121.72 1.7 23 21 3.56 – – – – – – –
Liwu (6) Li-1 Sand 183 – 1894 24.18 121.49 2.36 18.15 32 8.21 1.76 0.58 0.95 3.2 13.66 0.03 0.06Li-2 Sand 433 406 2030 24.18 121.49 3.02 13.61 54 15.97 2.7 0.63 0.94 3.47 14.74 0.03 0.06Li-3 Sand 249 223 2144 24.18 121.49 2.9 17.41 35 11.74 12.14 3.37 0.94 3.69 15.63 0.03 0.06Li-4 Sand 61 27 1320 24.17 121.6 2.99 14.44 48 14.83 3.87 0.95 0.91 2.09 8.52 0.02 0.05Li-5A Sand 497 – 1814 24.16 121.61 7.25 52.1 4 2.37 – – – – – – –Li-5B Pebbles 497 – 1814 24.16 121.61 1.64 22.4 20 3.35 – – – – – – –
Mugua (7) Mu-1 Sand 97 56 1890 23.97 121.46 2.64 18.42 32 9.64 3.36 1.03 0.96 3.17 13.65 0.03 0.06Mu-2A Sand 414 286 2023 23.96 121.49 2.61 17.15 34 10.22 2.48 0.73 0.95 3.48 14.86 0.03 0.06Mu-2B Pebbles 414 286 2023 23.96 121.49 2.98 14.96 46 14.29 1.85 0.46 0.95 3.48 14.86 0.03 0.06
Hsinwulu (8) Hwl-1 Sand 612 586 1910 23.14 121.12 2.37 34.9 9 3.62 – – – – – – –Hwl-2 Sand 59 44 1707 23.14 121.12 4.29 14.59 47 23.07 3.83 0.77 0.96 2.69 11.57 0.02 0.05Hwl-3 Sand 553 542 1956 23.14 121.12 3.07 14.9 47 14.95 2.14 0.52 0.95 3.27 13.96 0.03 0.06Hwl-4 Sand 553 542 1956 23.14 121.12 1.86 20.78 25 4.66 1.29 0.56 0.95 3.27 13.97 0.03 0.06Hwl-5 Sand 254 252 2012 23.14 121.11 2.21 18.96 29 7.01 1.67 0.59 0.95 3.41 14.55 0.03 0.06Hwl-0808 Sand 254 252 2012 23.14 121.11 2.89 16.91 35 12.06 2.16 0.59 0.95 3.41 14.55 0.03 0.06Hwl-6 Sand 298.6 288 1887 3.64 18.66 33 14.07 2.67 0.69 0.95 3.27 13.97 0.03 0.06
Luyeh (9) Lu0808 a Sand 469 457 1566 22.9 121.08 5.5 10.98 83 42.46 3.7 0.55 0.95 2.46 10.54 0.02 0.05Lu0808 b Pebbles 469 457 1566 22.9 121.08 3.69 17.95 36 15.06 2.83 0.71 0.95 2.46 10.54 0.02 0.05Lu0808 c Sand 432 420 1629 22.87 121.04 3.86 14.59 47 20.61 2.73 0.58 0.95 2.55 10.91 0.02 0.05
Process Blanks TWBK7 0.57 70.94 2
a Basin boundaries and areas have been extracted from a digital elevation model (with a resolution of 40 m per pixel) using the Rivertools™ software. Masked areas havebeen determined according to Chen et al. (2000).
b Beryllium-10 data are calibrated directly versus the National Institute of Standards and Technology standard reference material NIST SRM 4325 using an assigned10Be/9Be value of (2.79 ± 0.03) � 10�11 (Nishiizumi et al., 2007) and a 10Be half-life of (1.387 ± 0.012) � 106 yr (Korschinek et al., 2010; Chmeleff et al., 2010). Isotopic ratiouncertainties include statistical error on counted 10Be events (N) and analytical error correction.
c To assess whether the denudation rates derived from the measured in situ-produced 10Be concentrations are reliable or not, the 10Be/9Be isotopic ratios measured withinthe samples have been compared to that of the companion blank sample (TWBK-7) using the statistical chi-square approach described by Ward and Wilson (1978). The chi-square threshold at 95% confidence for one degree of freedom (2 samples) is 3.84 (see text).
d Uncertainties on 10Be concentrations are calculated using the standard error propagation method using the quadratic sum of the relative errors associated to the countingstatistics, AMS internal error (0.5% for ASTER), and error associated to the process blank.
e To determine basin averaged production rates, scaling factors for latitude and altitude corrections were calculated according to Stone (2000), for each cell of the digitalelevation model using the Cronus-Earth Matlab scripts (http://hess.ess.washington.edu/math/). Geomorphic shielding factors were also calculated for each cell of the 40-mresolution digital topography data using a 15� azimuth step following Dunne et al. (1999).
f Averaged 10Be production rates (equal to sum of mean production rates for each particle) have been calculated, using a modern 10Be production rate at sea level and highlatitude of 4.5 ± 0.3 atoms/g-SiO2/yr to account for the reevaluation of absolute calibration of 10Be AMS standards proposed by Nishiizumi et al. (2007) scaling the basinaveraged neutron production rate for altitudinal and latitudinal variability (e.g., Stone, 2000), whereas the basin averaged slow and fast muon production rates have beenscaled for altitudinal variability only (see Braucher et al., 2011 for discussion).
F. Derrieux et al. / Journal of Asian Earth Sciences 88 (2014) 230–245 233

234 F. Derrieux et al. / Journal of Asian Earth Sciences 88 (2014) 230–245
The equation used to determine the denudation rates sums theexponential equations related to the cosmic secondary particlesthat are neutrons, slow and fast muons (Braucher et al., 2011):
Nðx; e; tÞ ¼ Psp � expð�x=LnÞð1� expð�tðe=Lsp þ kÞÞe�qLspþ k
þ Pls � expð�x=LlsÞð1� expð�tðe=Lls þ kÞÞe�qLlpþ k
þ Plf � expð�x=Llf Þð1� expð�tðe=Llf þ kÞÞe�qLlfþ k
ð1Þ
where N(x,e, t) is the nuclide concentration as a function of depth (g/cm2), denudation rate e (g/cm2/yr) and exposure time t (yr). Psp isthe basin averaged spallation production rate, scaled for altitudinaland latitudinal variability (e.g., Stone, 2000), whereas Pls and Plf thebasin averaged slow and fast muon production rates, scaled for alti-tudinal variability only (see Braucher et al., 2011 for discussion).The attenuation lengths of neutrons (Lsp), slow muons (Llslow) andfast muons (Llfast) adopted in this paper are 160, 1500 and4320 g/cm2, respectively (Braucher et al., 2011), and k is the radio-active decay constant of 10Be. Neutrons are very interactive parti-cles and thus not very penetrative compared to negative and fastmuons. To account for the density variability through the regolithcolumn exposed to cosmic rays on the hillslopes of the watersheds,we allowed this parameter to vary between 1.8 g/cm3 (soil) and2.4 g/cm3 (rock).
3. Data analysis
3.1. Reliability of the measured isotopic ratios
To ensure that the denudation rates derived from the measuredin situ-produced 10Be concentrations are reliable, the 10Be/9Be iso-topic ratios measured within the samples have been compared tothat of the companion process blank using the statistical chi-square approach described by Ward and Wilson (1978). Takinginto account the uncertainties associated with AMS measurements(Table 1), this allows determining if the isotopic ratios measured inthe samples are significantly different (from a statistical point ofview) from that determined for the process blank. For river sam-ples in Taiwan, this comparison is crucial because the measuredisotopic ratios are particularly low (on the order of 10�14 to10�15). The chi-square threshold at 95% confidence for one degreeof freedom (2 samples) is 3.8 (Table 1). If the chi-square test valueis higher than this threshold, then the isotopic ratio measured inthe sample is significantly different from that of the blank process.In that case, a reliable in situ-produced 10Be concentration can beobtained and a denudation rate can be derived from Eq. (1)(Table 2). If the chi-square test value is lower than the chi-squarethreshold, then the isotopic ratio measured in the sample is notsignificantly different from that of the blank process within theassociated uncertainties, and the sample should be discarded.Among the samples analyzed for this study, only five did not passthis test, strengthening our confidence in the significance of thedenudation rates presented here (Table 2).
Once ensured that individual cosmogenic-derived denudationrates are significant from a statistical point of view, we need to ad-dress the potential effects of landslides on the 10Be-derived denu-dation rates. Triggered by typhoons and/or earthquakes, landslidesmay deliver sediment in the watersheds that was previously bur-ied on the hillslopes deep enough to yield ‘‘blank’’ cosmogenic con-centrations. Actually, this situation might bias the cosmogenicsignal if samples are taken from immediate downstream of a land-slide area; we have therefore avoided these areas. The smaller thesampled watershed is, the more its cosmogenic signal can be
influenced by such stochastic inputs of previously buried sediment.This is why, following the recommendations published by Niemiet al. (2005), we concentrated on the larger watersheds to diluteof the landslide effect in the cosmogenic signal.
At cosmogenic steady-state, the cosmogenic 10Be in river-bornequartz mineral record a time integrated, spatially averaged denu-dation rates which represents fluvially mixed denudation productsof all the processes occurring in a given watershed (Bierman andSteig, 1996; Granger et al., 1996). This integration occurs overthe time needed to remove one attenuation length (e.g., roughly60 cm; Lal, 1991). This integration time depends on the denudationrates and is typically on the order of several centuries in Taiwan(Table 2). Such long time scales relative to the high-frequencyevents (typhoons and earthquakes) allows integrating the hillslopecosmogenic signal, which makes the cosmogenic-derived denuda-tion rates insensitive to short-term stochastic events that domi-nate sediment flux over several years to decades (Kirchner et al.,2001; Siame et al., 2011). Within this general context, it cannothowever be excluded that part of the variability observed betweenthe samples from a given watershed is due to the stochastic effectof mass-wasting events. Nevertheless, the combination of sam-pling and statistical strategies discussed below ensures a reason-able cosmogenic signal and relevant denudation rates withrespect to their magnitudes and regional patterns.
3.2. Identification of outliers and weighted mean values
Outliers, defined as values very different from the majority ofcases in a population, are important to identify since they can sig-nificantly change the data analysis results. To recognize outliers,we applied the reduced chi-square statistic (e.g., Ward and Wilson,1978) and determined the mean square weighted deviation(MSWD) for each watershed (Table 3). The MSWD is a measureof over-dispersion, or goodness of fit, that takes into account therelative importance of both the internal and external reproducibil-ity. In other words, the MSWD allows comparing the observed var-iability within the data population to the expected variabilitydefined by the uncertainties associated to the data (McIntyreet al., 1966). A MSWD value of 1 indicates that the data populationfit a univariate normal distribution. The MSWD value is lower than1 when the observed scatter is less than that predicted by the ana-lytical uncertainties, indicating either overestimated analytical er-rors or unrecognized error-correlations. The MSWD value is higherthan 1 when the observed scatter exceeds that predicted by theanalytical uncertainties, indicating either underestimated analyti-cal errors, or the presence of non-analytical scatter (i.e., geologicalscatter). The actual MSWD value for which the data scatter can beregarded as due to internal reproducibility alone is not limited tothe unity but actually varies with the number of data (Wendtand Carl, 1991). For example, to be 95% confident that the scatterof the data is due to the analysis when the number of measure-ments is equal to 5, an acceptable MSWD range would be 0.2–2.2(Wendt and Carl, 1991). The numerical results of the MSWD anal-ysis are detailed in Appendix A.
On the western side, the three samples from the Tajia wa-tershed are in good statistical agreement as shown by the uni-modal shape of their associated cumulative probability densitycurve (Fig. 2). All together, the three samples yield a weightedmean of 1.5 ± 0.3 mm/yr with an acceptable MSWD value of 0.53(Appendix A). For the Wu watershed, the samples Wu-4 and Wu-5 show denudation values that are significantly too low and toohigh, respectively, when compared to the rest of the population,as illustrated by a bimodal cumulative probability density curveskewed towards high values of denudation (Fig. 2). Rejecting thesetwo samples gives a weighted mean of 0.8 ± 0.1 mm/yr with anacceptable MSWD value of 0.39 (Appendix A). Similarly, for the

F. Derrieux et al. / Journal of Asian Earth Sciences 88 (2014) 230–245 235
Choshui watershed, the cumulative probability density curve isskewed toward high values because of the sample Cho-3A thatmight also be regarded as an outlier (Fig. 2). Rejecting this partic-ular sample lets the MSWD falling from 2.74 to an acceptable valueof 1.91 associated with a weighted mean of 1.5 ± 0.2 mm/yr(Appendix A).
On the eastern side, the Liwu watershed is the catchment wherethe data are more scattered, as shown by their associated bimodalcumulative probability density curve, which is skewed towardshigh values of denudation (Fig. 3). Actually, the four samples inthe population can apparently be separated into two pairs of sam-ples with the highest (Li-1 and Li-2) and lowest (Li-3 and Li-4) val-ues (Table 2), yielding weighted means of 4.8 ± 1.1 mm/yr and1.3 ± 0.3 mm/yr, respectively (Appendix A). Within the Hsinwuluwatershed, the scattering of the data is also relatively importantas illustrated by their associated bimodal cumulative probabilitydensity curve, which is also skewed towards high values (Fig. 3).In this case, rejecting the lowest value in the distribution (Hwl-2)yields a relatively well-constrained weighted mean of5.2 ± 0.8 mm/yr, resulting in an acceptable MSWD value of 0.46(Appendix A). For the Laonong, Mugua and Luyeh watersheds, onlytwo samples have been collected along the main trunk of each ofthe rivers (Fig. 1). Given the uncertainties associated to the denu-dation rates, the pairs of samples are in good agreement withweighted mean values of 2.5 ± 0.5 mm/yr for the Laonong River,3.8 ± 0.9 mm/yr for the Mugua River, and 2.6 ± 0.4 mm/yr for theLuyeh River (Appendix A). The Heping watershed has only onesample, which yielded a denudation value of 3.4 ± 1.4 mm/yr(Table 2).
3.3. Intra-watershed variability
Although the outlier identification proposed above is solely sta-tistical with the most deviant values being rejected, it appears thatrejection of those samples as outliers is also in good agreementwith geomorphic considerations. For example, within the Wu wa-tershed, sample Wu-4 was taken at the outlet of the Puli Basinwhere several levels of Quaternary fluvial terraces have beendeposited. River-borne sands sampled at the outlet of the Wucatchment are thus likely to have been contaminated by quartzgrains bearing higher 10Be concentrations as a result of their stor-age in the alluvial terrace deposits. This is supported by the factthat the 10Be concentration measured within sample Wu-4 is morethan twice that determined within the sample Wu-6, which wascollected upstream of the Puli basin (Fig. 3). In addition, for boththe Choshui and Wu watersheds, rejected samples Cho-3A andWu-5 yielded lower 10Be concentrations and thus higher denuda-tion values with respect to the rest of the samples in their respec-tive population, which is in good agreement with their upstreampositions in the watershed closer to the Central Range where exhu-mation processes should be stronger.
The watersheds draining the western side of the Central Rangeare particularly influenced by human activity. Since the Taiwanesepopulation is concentrated in the Western Foothills and the CoastalPlain of the island, its vulnerability to natural hazards such asflooding or mass wasting and the use of water for public supply,power generation or irrigation, has resulted in the constructionof large water reservoirs on this side of the mountain range (WaterResources Agency, 2012). The western watersheds are also charac-terized by numerous agricultural facilities along most of their trib-utaries as well as a large number of quarries excavating sedimentand gravel from the riverbeds. However, except for the Wu Rivercatchment, which drains the area around the Puli basin, all thewestern watersheds exhibit cosmogenic-derived denudation ratesthat are very similar to �2 mm/yr, the value determined for theLanyang River (Fig. 1), which is in an area less affected by human
activity (Siame et al., 2011). Similar denudation rates determinedabove and below specific reservoirs also suggest little influenceof human activity. For example, a comparison of the denudationrates determined from samples collected upstream(1.3 ± 0.4 mm/yr) and downstream (1.8 ± 0.4 mm/yr) of the Dejireservoir in the upper-middle reach of the Tajia River shows thatthey are not significantly different (Fig. 2). Such observations con-firm previous studies performed in similar environmental contextsdemonstrating that cosmogenic-derived denudation rates inte-grated over a 102–103 yr-time scales are not impacted by recenthuman activity but rather reflect a natural background denudationvalue (Brown et al., 1998; Hewawasam et al., 2003).
The variability observed in the Liwu watershed is stronglylinked to the anomalously low value determined for the sampleLi-3. Indeed, samples Li-1 and Li-3 correspond to the main sub-ba-sins draining the headwaters of the catchment, whereas sample Li-2 has been collected within the major trunk of the Liwu River justdownstream of the confluence between Li-1 and Li-3 sub-basins(Fig. 3). Li-4 is a small tributary catchment close to the outlet ofthe Liwu River (Fig. 3). Given the denudation values derived forLi-1 and Li-2, one would expect the denudation rate derived fromLi-3 to be on the same order of magnitude. Why the rate of thisparticular sample is much lower respect to its neighbors remainsan open question since the sampling protocol is the same as forthe other samples. Among the four samples, Li-2 appears to bethe more representative for the Liwu catchment since it corre-sponds to a catchment that encompass both Li-1 and Li-3 sub-ba-sins (Fig. 3). However, given the relatively large errors associated tothe denudation values determined for the Liwu watershed, a ratherconservative assumption would be to consider that the denudationranges from 1.3 ± 0.3 to 4.8 ± 1.1 mm/yr.
3.4. Bootstrap analysis
In the previous sections, we discussed the presence of outliersand thus proposed weighted means for the denudation rates with-in each studied watersheds. The mean square weighted deviationapproach assumes that the denudation rates have normal andindependent uncertainties. If all the associated errors were to berandomly distributed, the cumulative probability density curvesderived from the data sets should have a symmetrical, Poisson-likedistribution. However, most of the cumulative probability densitycurves derived for the sample populations are skewed and/or bi-modal in shape (Figs. 2 and 3). To downplay the weight of high out-liers, we applied a non-parametric bootstrap technique, whichallows estimating statistical parameters such as the mean andthe median together with their associated standard deviations.
Bootstrapping is a computer-based statistical method that isparticularly useful for small data sets and/or when probability dis-tributions are non-normal (Efron, 1979; Efron and Tibshirani, 1986,1993; Davison and Hinkley, 1997). Based on resampling withreplacement, this technique assumes that the set of observationsis an adequate model for the studied population and that resam-pling over that observation set on a large enough scale will revealthe population distribution characteristics. For each watershed,data sets of n samples {x1, . . .,xn} were produced using the mini-mum and maximum denudation rate values in order to accountfor all sources of uncertainties. For each data set, B (B = 15,000)bootstrap replicates {x1
* , . . .,xn*}, where xi
* is a random value withreplacement from {x1, . . .,xn}, were obtained without any distribu-tional assumption. Finally, for each bootstrap replicate mean andmedian values were calculated and the distribution of these B esti-mates represents the bootstrap estimates of uncertainty about thetrue values of the considered statistic parameters (Table 3).Accounting for the standard deviations associated to the weightedmean values, assuming that denudation rates have normal and

Table 2Drainage basin metrics, denudation rates and integration times as determined for the studied watersheds.
Watershed Sample ID Centroïda Distanceb
(km)Strahlerorder
Area(km2)
Relief(m)
Hypsometricindex
Elevation (m) Mean Denudation(mm/yr)
Integrationtime (yr)
Lon. (�E) Lat. (�N) Min Max Mean Slope (�) Value Error Value Error
Lanyangchi Siame et al. (2011) 121.4 24.5 288 7 364 3241 0.35 280 3521 1423 30.4 2.0 1.0 381 190
Western sideTajia (1) Ta-1 121.2 24.3 253 7 964 3417 0.48 465 3882 2093 32.9 1.8 0.4 414 96
Ta-3A 121.3 24.4 268 6 155 2356 0.39 1526 3882 2436 33.0 1.4 0.5 558 187Ta-3B 121.3 24.4 268 6 155 2356 0.39 1526 3882 2436 33.0 4.9 1.4 156 43Ta-4A 121.3 24.3 263 7 418 2450 0.41 1432 3882 2444 31.8 1.3 0.4 601 193Ta-4B 121.3 24.3 263 7 418 2450 0.41 1432 3882 2444 31.8 6.1 1.6 126 32
Wu (2) Wu-1 121.0 24.1 223 8 996 3211 0.28 181 3392 1073 26.5 0.7 0.2 1029 224Wu-2 120.9 24.1 224 6 78 1259 0.35 269 1528 716 23.2 0.9 0.2 832 177Wu-3 121.1 24.1 233 6 435 3128 0.38 264 3392 1464 32.2 1.0 0.3 745 188Wu-4 121.0 24.0 214 8 420 2173 0.27 246 2419 823 22.1 0.2 0.0 3378 566Wu-5 121.1 24.1 237 6 337 2958 0.42 434 3392 1677 33.9 1.8 0.4 417 100Wu-6 121.1 24.0 224 6 98 1887 0.39 532 2419 1264 31.4 0.8 0.2 1006 296
Choshui (3) Cho-1 121.0 23.7 191 8 2892 3770 0.39 86 3856 1555 29.3 2.3 0.5 336 80Cho-2 121.0 23.8 196 8 2196 3735 0.44 121 3856 1783 31.6 1.8 0.4 435 93Cho-3A 121.1 23.8 203 8 1486 3362 0.46 442 3804 1997 32.6 3.8 1.1 203 58Cho-3B 121.1 23.8 203 8 1486 3362 0.46 442 3804 1997 32.6 10.0 3.3 76 25Cho-4 121.1 23.8 203 8 1537 3440 0.47 364 3804 1975 32.7 1.2 0.2 621 115
Laonong (4) Lao-2 120.9 23.3 146 7 491 3318 0.48 623 3941 2217 34.3 2.8 0.8 270 77Lao-3 120.8 23.1 121 6 132 2867 0.44 376 3243 1632 32.8 2.3 0.6 330 83
Eastern sideHeping (5) He-1A 121.6 24.4 282 7 532 3591 0.39 43 3634 1455 32.2 3.4 1.4 224 94
Liwu (6) Li-1 121.5 24.3 266 6 183 3279 0.45 429 3708 1894 33.3 6.3 2.3 121 44Li-2 121.4 24.2 258 7 433 3292 0.49 416 3708 2014 34.3 4.4 1.2 173 49Li-3 121.4 24.2 253 6 249 3133 0.53 434 3567 2106 35.1 1.0 0.3 738 234Li-4 121.6 24.2 268 5 61 2565 0.48 84 2649 1312 37.7 1.9 0.5 410 119
Mugua (7) Mu-1 121.4 24.0 231 5 97 3123 0.49 214 3337 1739 33.2 3.3 1.1 231 79Mu-2A 121.4 24.0 237 7 414 3467 0.50 130 3597 1851 34.0 4.8 1.6 158 53Mu-2B 121.4 24.0 237 7 414 3467 0.50 130 3597 1851 34.0 6.5 1.9 118 35
Hsinwulu (8) Hwl-2 121.1 23.2 142 5 59 2630 0.48 375 3005 1625 31.7 2.5 0.6 306 77Hwl-3 121.0 23.2 133 7 553 3300 0.48 362 3662 1940 31.7 5.3 1.5 144 42Hwl-4 121.0 23.2 133 7 553 3297 0.48 365 3662 1940 31.7 8.8 4.0 87 40Hwl-5 121.0 23.2 139 6 254 3275 0.49 387 3662 2006 32.3 7.0 2.7 108 42Hwl-0808 121.0 23.2 139 6 254 3275 0.49 387 3662 2006 32.3 5.4 1.7 140 44Hwl-6 121.0 23.1 128 6 299 2905 0.52 375 3280 1886 31.2 4.1 1.2 186 56
Luyeh (9) Lu0808 a 120.9 22.9 107 7 469 3070 0.46 151 3221 1565 31.3 2.4 0.5 322 69Lu0808 b 120.9 22.9 107 7 469 3070 0.46 151 3221 1565 31.3 3.1 0.9 246 72Lu0808 c 120.93 22.92 106 7 432 2993 0.47 228 3221 1628 31.6 3.3 0.9 230 60
Basin metrics have been extracted from a digital elevation model (with a resolution of 40 m per pixel) using the Rivertools™ software. (c) Averaged basin-wide denudationrates (mm/yr) have been calculated using Eq. (1) (e.g., Braucher et al., 2011), the parameters given in Table 1 and those described in the text. Uncertainties include 10Beconcentration error (Table 1), 6% error on production rate (e.g., Stone, 2000) and 14% error on density (for the exposed material to cosmic rays. we assumed a density of2.1 ± 0.3 g/cm3). (d) Integration times are calculated after Lal (1991) and their uncertainties are calculated propagating those of the denudation rates.
a Watershed centroids have been determined as the center of gravity using the basin boundaries.b Horizontal distances of the watershed centroids with respect to the southern tip of the Hengchun Peninsula have been determined using the Geographical Information
System Mapinfo™.
236 F. Derrieux et al. / Journal of Asian Earth Sciences 88 (2014) 230–245
independent uncertainties, and those estimated for the bootstrapmean and median values, determined without any distributionalassumption, all the estimators for the central tendency are in goodagreement (Table 3 and Fig. 4). However, unlike the mean, themedian is an estimate for the central tendency that offers theadvantage of being insensitive to extreme values and skewed dis-tributions. In addition, for cosmogenic-derived denudation ratesdetermined from river-borne sands sampled in landslide-domi-nated catchments, Niemi et al. (2005) showed that the median va-lue is more representative for the volumetric erosion rates. Giventhese reasons and taking into account that bootstrap estimatorsare statistically law-independent, we decided to use the bootstrapmedian values and their associated standard deviations for furtherdiscussion of the orogen-scale denudation (see Section 4). Thebootstrap-derived mean and median values determined for eachwatershed are presented in form of histogram density plots (Figs. 2and 3) and in Table 3.
3.5. Comparison between amalgamated pebbles and sand samples
For some of the studied watersheds, samples of quartz pebbleswere also collected in the same area as the sand samples. For thesamples of pebbles that passed the chi-square test against theblank process (Table 1), we compared the in situ-produced 10Beconcentrations measured within the companion pebble and sandsamples (Appendix A). Except for the pairs Mu-2A/Mu-2B andLu0808a/Lu0808b where the 10Be concentrations are not statisti-cally different, the 10Be concentrations measured in the amalgam-ated pebbles are roughly 3–5 times lower than those measured inthe sand samples (Table 1). This is the opposite observation thanthat made by Codilean et al. (2014) in the desert setting of Nami-bia. Although more samples would be necessary to delineate withhigher confidence a general trend, a preliminary interpretation isthat amalgamated pebbles are not properly mixed within the reg-olith and thus may not properly spatially integrate the watershed.

Table 3Summary of the denudation rate central values determined for the studied watersheds.
Watershed Statistic Bootstrap
Weighted mean Mean Mean Median
Value 1r Value 1r Value 1r Value 1r
Tajia 1.49 0.25 1.49 0.55 1.49 0.21 1.48 0.31Wu 0.83 0.10 0.86 0.26 0.86 0.09 0.84 0.12Choshui 1.48 0.18 1.75 0.64 1.75 0.24 1.67 0.30Laonong 2.48 0.47 2.57 0.87 2.56 0.37 2.52 0.52Western side 1.63 0.13 1.85 0.73 1.86 0.17 1.75 0.19Liwu – – – – 3.91 1.09 3.63 1.45Mugua 3.80 0.92 4.07 1.83 4.07 0.79 3.97 1.06Hsinwulu 5.20 0.80 5.52 3.17 5.52 0.87 4.71 0.95Luyeh 2.61 0.44 2.85 0.99 2.85 0.43 2.78 0.56Eastern side 4.21 0.43 4.70 2.63 4.70 0.51 4.07 0.47
Whole range 3.62 0.39 2.94 0.4
Weighted means have been determined following the statistical chi-square approach described by Ward and Wilson (1978). Bootstrap mean and median values have beencomputed using XLSTAT™. Values are given in mm/yr.
F. Derrieux et al. / Journal of Asian Earth Sciences 88 (2014) 230–245 237
However, a larger scale comparison would be useful to determinedenudation rates for watersheds where the quartz content withinthe sand fraction is too low to yield satisfactory 10Be concentrationmeasurements. Given the number of samples and the observationthat 10Be concentrations in the quartz pebbles are 3–5 times lowerthan in quartz sands, any derived denudation rates from amalgam-ated quartz pebbles should be corrected accordingly.
3.6. Basin-wide denudation rates
In north-central Taiwan, the Tajia and the Wu watersheds, bothdraining to the west from the Hsüehshan and Central ranges, arecharacterized by denudation rates (bootstrap median values) thatare 1.5 ± 0.3 mm/yr and 0.8 ± 0.1 mm/yr, respectively (Fig. 2). Atthe same latitude, but on the eastern side of the range, the Heping,Liwu and Mugua watersheds show denudation rates of3.4 ± 1.4 mm/yr, 3.9 ± 1.5 mm/yr, and 4.0 ± 1.0 mm/yr, respectively(Fig. 3). In the case of the Heping catchment, where only one sam-ple was measured, we assume that the determined denudation va-lue is representative for the watershed. For the Liwu watershed, weapplied the bootstrap to the range of values determined for thesamples Li-1, Li-2, and Li-3, excluding the sample Li-4, which isnot representative for the watershed. The bootstrapped meanand median values fall between the lower and upper bounds esti-mated from the weighted-means discussed above, that is3.9 ± 1.1 mm/yr and 3.6 ± 1.5 mm/yr, respectively (Table 3). In cen-tral and south-central Taiwan, the Choshui and Laonong water-sheds show denudation rates (bootstrap median values) of1.7 ± 0.3 mm/yr and 2.5 ± 0.5 mm/yr, respectively (Fig. 2). At thesame latitude but on the eastern side of the range, the Hsinwuluand Luyeh watersheds exhibit significantly higher denudationrates (bootstrap median values) of 4.7 ± 0.9 mm/yr and2.8 ± 0.6 mm/yr, respectively (Fig. 3).
3.7. Characteristic denudation rates for the Taiwan belt
In this study, all the watersheds encompass the central part ofthe Taiwan mountain belt, that is the section of the belt wherethe collision is mature (Fig. 1). On both sides of the range, signifi-cant central values can be derived from the cosmogenic-deriveddenudation rates (Fig. 5). For the western side, the skewed cumu-lative probability density curve is also significantly influenced bythe lowest values from the Wu watershed, which should not beconsidered as representative for the characteristic denudation rateon this side of the belt. To derive such a characteristic value, thesamples from the Wu watershed have thus been excluded with
the exception of sample Wu-5, which is located in the upstreamheadwaters of the Wu catchment. The weighted mean derivedfrom the remaining western samples is 1.6 ± 0.1 mm/yr resultingin a chi-square test value of 13.6 that is lower than the chi-squarethreshold of 16.9 for 9 degrees of freedom at 95% confidence level(Appendix A). Bootstrapping this data population allows estimat-ing a mean value of 1.9 ± 0.2 mm/yr and a median value of1.8 ± 0.2 mm/yr (Table 3 and Fig. 5).
For the eastern side of the central part of the Taiwan belt, thecumulative probability density curve is also both influenced bythe lowest values in the data population and skewed toward highvalues of denudation because of the uncertainties associated to thedata. However, removing the lowest values from the Liwu, Hsinw-ulu and Luyeh catchments (Li-4, Hwl-2, and Lu0808a) yields aweighted-mean of 4.2 ± 0.4 mm/yr resulting in a chi-square testvalue of 6.4 that is lower than the chi-square threshold of 18.3for 10 degrees of freedom at 95% confidence level (Appendix A).Bootstrapping the same data population allows estimating a meanvalue of 4.7 ± 0.5 mm/yr and a median value of 4.1 ± 0.5 mm/yr(Table 3 and Fig. 5). Finally, considering both the western and east-ern watersheds and bootstrapping the data populations discussedabove allows estimating a mean value of 3.6 ± 0.4 mm/yr and amedian value of 2.9 ± 0.4 mm/yr (Table 3). This denudation rate,ranging from 2.5 to 4 mm/yr, should be regarded as the character-istic value for the Taiwan Mountains over a centennial time scale.
4. Discussion
The presented data enable us to ask whether or not the patternof cosmogenic-derived denudation rates reflect the processes sup-porting the orogeny-scale topography. Indeed, the narrow, steepand highly denudating eastern side of the mountain belt contrastswith the wider and slowly denudating western side, which maylikely result from the underlying mechanics, that is accretion alongthe western front and underplatting at depth below the CentralRange (Malavieille, 2010). However, keeping in mind these essen-tial regional-scale topographic inputs, do other observables such asdrainage basin metrics (area, relief, and slope) or precipitation pat-terns significantly impact the cosmogenic-derived denudationrates on centennial time-scales?
4.1. Testing cosmogenic-derived denudation rates against watershedmetrics
The lack of relationship between watershed areas and cosmo-genic derived denudation rates (Fig. 6a) is an observation already

Fig. 2. Cosmogenic-derived denudation rates for the studied western watersheds. Left: Cumulative probability density curves of the samples (black thin lines), of the datapopulation (black dashed line), of the sample population included in the weighted-mean (red thick line) and associated box plot displaying the first quartile, median (horizontalline), mean (open square), and third quartile together with both upper and lower limits (whiskers). w.m., weighted mean with MSWD value in parenthesis. Right: Bar histograms ofthe bootstrap resampling showing the density (ratio of the frequency to the size of the interval) of the mean and median denudation rates for each watershed. All numbers aregiven in mm/yr and are reported in Table 3. (For interpretation of the references to color in this figure legend, the reader is referred to the web version of this article.)
238 F. Derrieux et al. / Journal of Asian Earth Sciences 88 (2014) 230–245

Fig. 3. Cosmogenic-derived denudation rates for the studied eastern watersheds. Left: Cumulative probability density curves of the samples (black thin lines), of the datapopulation (black dashed line), of the sample population included in the weighted-mean (red thick line) and associated box plot displaying the first quartile, median (horizontalline), mean (open square), and third quartile together with both upper and lower limits (whiskers). w.m., weighted mean with MSWD value in parenthesis. Right: Bar histograms ofthe bootstrap resampling showing the density (ratio of the frequency to the size of the interval) of the mean and median denudation rates for each watershed. All numbers aregiven in mm/yr and are reported in Table 3. (For interpretation of the references to color in this figure legend, the reader is referred to the web version of this article.)
F. Derrieux et al. / Journal of Asian Earth Sciences 88 (2014) 230–245 239

Fig. 4. Comparison between the weighted means, bootstrap mean and bootstrap median values. The values are reported in Table 3.
240 F. Derrieux et al. / Journal of Asian Earth Sciences 88 (2014) 230–245
reported by Portenga and Bierman (2011), using a global data set.In addition, Portenga and Bierman (2011) highlighted this result asimportant since it reflects that changes in the sediment delivery ra-tio do not affect estimation of denudation rates from a cosmogenicpoint of view. In recent local studies, drainage basin denudation
rates have been shown to correlate well with average basin eleva-tion (Heimsath et al., 2006; Palumbo et al., 2009). As far as our dataset is concerned, this relationship also exists in Taiwan, eventhough some variability is due to data scattering (Fig. 6b). Forexample, considering the main drainage basins together with their

F. Derrieux et al. / Journal of Asian Earth Sciences 88 (2014) 230–245 241
respective bootstrap median values of denudation, the bivariaterelationship is medium (r2 = 0.41). If the western and easternwatersheds are considered separately, the correlation turns outto be slightly better for western drainage basins (r2 = 0.73) thanfor the eastern ones (r2 = 0.63).
The hypsometric index (HI), calculated as the ratio of the meanbasin incision (Emean � Emin) to the basin’s relief (Emax � Emin), is re-lated to the degree of dissection of a given watershed. This geo-morphic index is commonly used to discriminate betweentectonically active and inactive regions (Strahler, 1952). Values lar-ger than 0.5 are generally viewed as indicating youthful or rejuve-nated topographies, dominated by diffusive hillslope processes,
Fig. 5. Cumulative probability density curves (weighted means) and bar histograms of thlegends as for Figs. 2 and 3). All numbers are given in mm/yr and are reported in Table
while lower values indicate more mature topographies and water-sheds dominated by fluvial processes (Strahler, 1952; Willgooseand Hancock, 1998). For the presented data set, the drainage basinsseparate into two distinctive groups with the western watershedshaving HI values ranging from 0.27 to 0.47 and the eastern water-sheds exhibiting HI values ranging from 0.45 to 0.53 (Table 2). Con-sidering the main drainage basins together with their respectivebootstrap median values of denudation, the correlation with theHI values is medium (r2 = 0.42). However, for the western side ofthe belt, this bivariate relationship is much stronger (r2 = 0.73)than for the eastern side (r2 = 0.22). On the eastern side, the poorcorrelation is due to the relatively low denudation value for the
e bootstrap resampling for the western (up) and eastern (down) watersheds (same3.

242 F. Derrieux et al. / Journal of Asian Earth Sciences 88 (2014) 230–245
Luyeh watershed given its characteristic HI value (Fig. 6c). If thisparticular watershed is removed from the relationship, the correla-tion becomes more significant (r2 = 0.73).
Together with relief, basin slope is also related to drainage basindenudation rates, producing significant bivariate relationships onthe global scale (Portenga and Bierman, 2011). For the presenteddataset, this relationship is obscured by the data scattering dueto the large uncertainties associated to the denudation rates deter-mined for the eastern watersheds. However, considering the maindrainage basins, the bivariate relationship between denudationrate (bootstrap) and mean basin slope is medium (r2 = 0.41). Forthe western side of the belt, the bivariate relationship betweendenudation and mean basin slope of the drainage basins is moresignificant (r2 = 0.73) than for the eastern side (r2 = 0.22). On theeastern side the poor correlation is apparently due to the relativelyhigh denudation value for the Hsinwulu watershed given its char-acteristic mean slope value (Fig. 6d). If this particular watershed isremoved from the relationship, the correlation becomes more sig-nificant (r2 = 0.92).
From the geomorphic point of view, it thus appears that the ob-served variance in the denudation rates determined for the centralpart of the Taiwan Mountains can be, to some extent, associated torelief and slope, which are both linked to the tectonic activity. In-deed, when comparing the basin mean slope with the HI values, itappears that the watersheds with the higher denudation rates aregenerally those characterized with the higher mean slope and/orHI values (Fig. 6e). However, for the same mean slope or HI range,the western Tajia and Laonong watersheds exhibit denudation
Fig. 6. Cosmogenic-derived denudation rates to basin metrics relationships. (A) Relationbasin elevation. (C) Relationship of denudation rates to hypsometic index calculated asRelationship of denudation rates to mean basin slope. (E) Relationship of mean basin slomagnitude.
rates that are significantly lower than those from the eastern side.One can argue that this contrast in denudation rates between wes-tern and eastern watersheds reflects the pattern of strong annualprecipitations. Indeed, for the whole island of Taiwan, the averageprecipitation rate determined for the period between 1949 and2009 is 2500 mm/yr (Water Resources Agency, 2014). In northernTaiwan, the average precipitation rate is 2930 mm/yr, contrastingwith that of the southern-southwestern region (2520 mm/yr). Forcentral Taiwan, the western side of the belt is characterized byan average precipitation rate of 2150 mm/yr, which contrasts theprecipitation rate of 2540 mm/yr for the eastern side. However,for the studied watersheds, the average precipitation rate typicallyranges from 2500 to 3000 mm/yr with no significant difference be-tween east and west. It thus seems that, at least for a first orderanalysis, the mean annual precipitation pattern does not explainthat of the denudation rates (Fig. 7a). Portenga and Bierman(2011) also made this observation at a more global scale.
4.2. Along-strike cosmogenic-derived denudation pattern
To illustrate the along-strike denudation pattern for the Taiwanmountain belt, we plotted the horizontal distances measuredbetween the southern tip of the belt (Hengchun Peninsula) andthe watershed centroids against the denudation rates (bootstrapmedians) determined for each watershed (Fig. 7b). For the centralsegment of the belt, the orogen-scale pattern of denudation is two-fold: (1) higher denudation values, on the order of 4–5 mm/yr,characterize the eastern side of the belt (retro-wedge), with a
ship of denudation rates to basin area. (B) Relationship of denudation rates to meanthe mean basin incision (Emean � Emin) divided by the basin relief (Emax � Emin). (D)pe to hypsometric index. The size of the circles is a function of the denudation rate
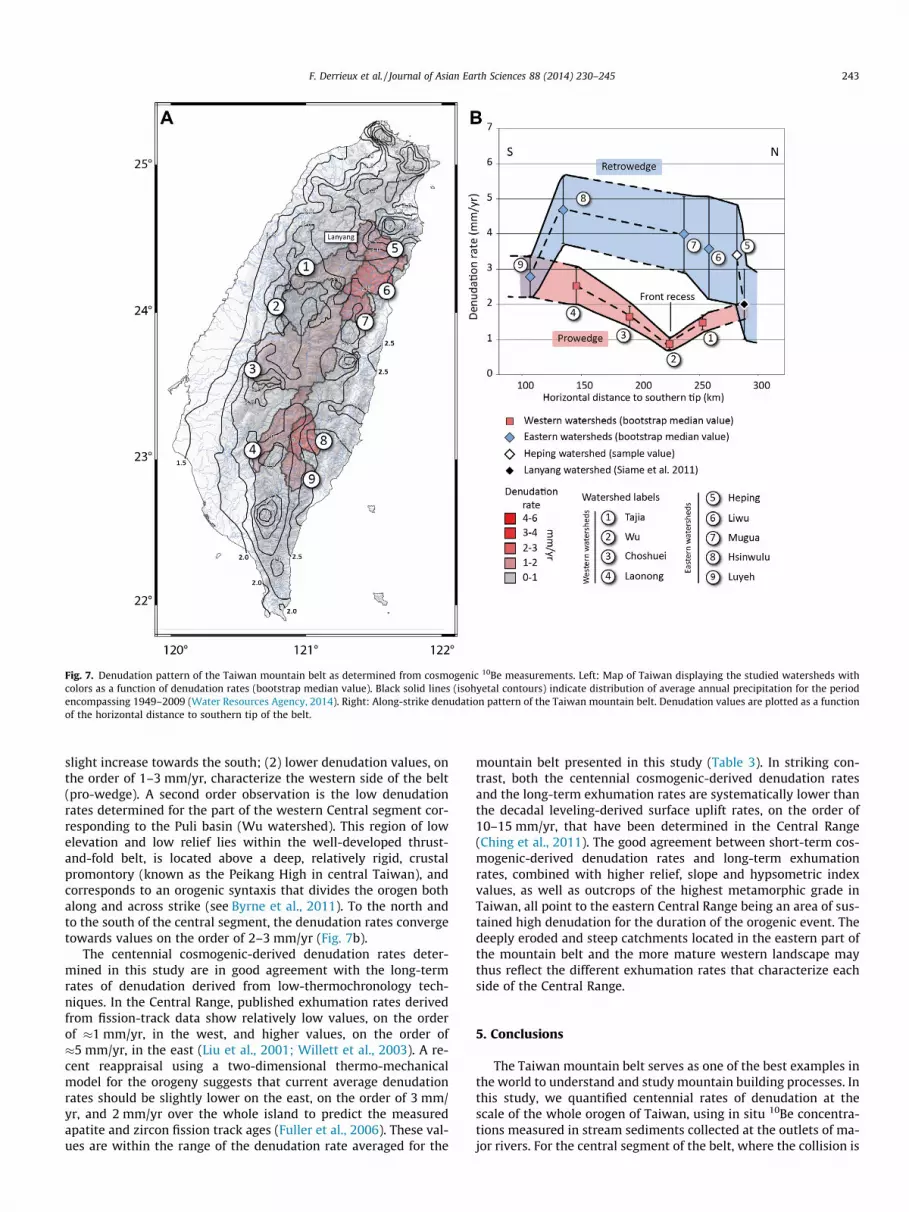
Fig. 7. Denudation pattern of the Taiwan mountain belt as determined from cosmogenic 10Be measurements. Left: Map of Taiwan displaying the studied watersheds withcolors as a function of denudation rates (bootstrap median value). Black solid lines (isohyetal contours) indicate distribution of average annual precipitation for the periodencompassing 1949–2009 (Water Resources Agency, 2014). Right: Along-strike denudation pattern of the Taiwan mountain belt. Denudation values are plotted as a functionof the horizontal distance to southern tip of the belt.
F. Derrieux et al. / Journal of Asian Earth Sciences 88 (2014) 230–245 243
slight increase towards the south; (2) lower denudation values, onthe order of 1–3 mm/yr, characterize the western side of the belt(pro-wedge). A second order observation is the low denudationrates determined for the part of the western Central segment cor-responding to the Puli basin (Wu watershed). This region of lowelevation and low relief lies within the well-developed thrust-and-fold belt, is located above a deep, relatively rigid, crustalpromontory (known as the Peikang High in central Taiwan), andcorresponds to an orogenic syntaxis that divides the orogen bothalong and across strike (see Byrne et al., 2011). To the north andto the south of the central segment, the denudation rates convergetowards values on the order of 2–3 mm/yr (Fig. 7b).
The centennial cosmogenic-derived denudation rates deter-mined in this study are in good agreement with the long-termrates of denudation derived from low-thermochronology tech-niques. In the Central Range, published exhumation rates derivedfrom fission-track data show relatively low values, on the orderof �1 mm/yr, in the west, and higher values, on the order of�5 mm/yr, in the east (Liu et al., 2001; Willett et al., 2003). A re-cent reappraisal using a two-dimensional thermo-mechanicalmodel for the orogeny suggests that current average denudationrates should be slightly lower on the east, on the order of 3 mm/yr, and 2 mm/yr over the whole island to predict the measuredapatite and zircon fission track ages (Fuller et al., 2006). These val-ues are within the range of the denudation rate averaged for the
mountain belt presented in this study (Table 3). In striking con-trast, both the centennial cosmogenic-derived denudation ratesand the long-term exhumation rates are systematically lower thanthe decadal leveling-derived surface uplift rates, on the order of10–15 mm/yr, that have been determined in the Central Range(Ching et al., 2011). The good agreement between short-term cos-mogenic-derived denudation rates and long-term exhumationrates, combined with higher relief, slope and hypsometric indexvalues, as well as outcrops of the highest metamorphic grade inTaiwan, all point to the eastern Central Range being an area of sus-tained high denudation for the duration of the orogenic event. Thedeeply eroded and steep catchments located in the eastern part ofthe mountain belt and the more mature western landscape maythus reflect the different exhumation rates that characterize eachside of the Central Range.
5. Conclusions
The Taiwan mountain belt serves as one of the best examples inthe world to understand and study mountain building processes. Inthis study, we quantified centennial rates of denudation at thescale of the whole orogen of Taiwan, using in situ 10Be concentra-tions measured in stream sediments collected at the outlets of ma-jor rivers. For the central segment of the belt, where the collision is
244 F. Derrieux et al. / Journal of Asian Earth Sciences 88 (2014) 230–245
considered to be near mature, the orogen-scale pattern of denuda-tion shows a two-fold pattern with higher denudation values onthe order of 4–5 mm/yr characterizing the eastern side of the belt(i.e., retro-wedge), with a slight increase towards the south, andlower denudation values on the order of 1–3 mm/yr on the wes-tern side of the belt (pro-wedge) with a minimum value centeredon the main recess of the deformation front. To the north and tothe south of the central segment, the denudation rates converge to-wards lower values on the order of 2–3 mm/yr. At the scale of themountain belt, drainage basin metrics such as relief, hypsometricindex and slope values seem to explain the observed variance inthe data population, conversely to the first-order average precipi-tation pattern, suggesting a strong tectonic control on denudationrates within the segment of the belt where the collision is mature.Further investigations using cosmogenic-derived denudation ratesare needed towards the south and the north of the mountain beltto decipher the regional pattern of denudation rates in connectionwith waning and incipient collision. The results presented here areimportant because they characterize and quantify one of the mainprocesses involved in the evolution of orogenic wedges, denuda-tion. Our results help understanding the evolution of Taiwan –an iconic orogenic system – and provide constraints on inputparameters used in analog and numerical models of orogenicsystems.
Acknowledgments
The French AMS national facility ASTER (CEREGE, Aix-en-Prov-ence) is supported by the INSU/CNRS, the ANR through the ‘‘Projetsthématiques d’excellence’’ program for the ‘‘Equipements d’excel-lence’’ ASTER-CEREGE action, IRD and CEA. We are grateful to Mau-rice Arnold, Georges Aumaître and Karim Keddadouche for theirinvaluable help during the 10Be AMS measurements. We also thankChu-Chun Kung and Fong-Min Chou for their help during field-work. We also acknowledge the BFT (Bureau Français de Taipei)and the BRT (Bureau de Représentation de Taipei en France) fortheir constant help; CNRS-INSU in France, NSC (National ScienceCouncil) in Taiwan and the Office of International Science andTechnology and the Tectonics Program in the US National ScienceFoundation. During 2013 and 2014, Lionel L. Siame has been ap-pointed as Visiting Associate Research Fellow at Institute of EarthSciences, Academia Sinica of Taiwan (NSC 102-2811-M-001) andbenefited from a delegation position at CNRS. This is contributionof the Institute of Earth Sciences, Academia Sinica, IESASxxxx.
Appendix A. Supplementary material
Supplementary data associated with this article can be found, inthe online version, at http://dx.doi.org/10.1016/j.jseaes.2014.03.012.
References
Arnold, M., Merchel, S., Bourlès, D.L., Braucher, R., Benedetti, L., Finkel, R.C.,Aumaître, G., Gottdang, A., Klein, M., 2010. The French accelerator massspectrometry facility ASTER: improved performance and developments. Nucl.Instrum. Methods Phys. Res. Sect. B 268, 1954–1959.
Beaumont, C., Kooi, H., Willett, S., 2000. Coupled tectonic-surface process modelswith applications to rifted margins and collisional orogens. Geomorphol. GlobalTectonics, 29–55.
Beyssac, O., Simoes, M., Avouac, J.P., Farley, K.A., Chen, Y.G., Chan, Y.C., Goffé, B.,2007. Late Cenozoic metamorphic evolution and exhumation of Taiwan.Tectonics 26, TC6001, doi:10.1029/2006TC002064.
Bierman, P., Steig, E.G., 1996. Estimating denudation using cosmogenic isotopeabundances in sediment. Earth Surf. Proc. Land. 21, 125–139.
Braucher, R., Merchel, S., Borgomano, J., Bourlès, D.L., 2011. Production ofcosmogenic radionuclides at great depth: a multi element approach. EarthPlanet. Sci. Lett. 309 (1), 1–9.
Brown, E.T., Edmond, J.M., Raisbeck, G.M., Yiou, F., Kurz, M.D., Brook, E.J., 1991.Examination of surface exposure ages of Antarctic moraines using in situproduced 10Be and 26Al. Geochim. Cosmochim. Acta 55, 2269–2283.
Brown, E.T., Stallard, R.F., Larsen, M.C., Raisbeck, G.M., Yiou, F., 1995. Denudationrates determined from the accumulation of in situ-produced 10Be in theLuquillo Experimental Forest, Puerto Rico. Earth Planet. Sci. Lett. 129, 193–202.
Brown, E.T., Stallard, R.F., Larsen, M.C., Bourles, D.L., Raisbeck, G.M., Yiou, F., 1998.Determination of predevelopment denudation rates of an agriculturalwatershed (Cayaguas River, Puerto Rico) using in-situ-produced 10Be in river-borne quartz. Earth Planet. Sci. Lett. 160, 723–728.
Byrne, T., Chan, Y.C., Rau, R.J., Lu, C.Y., Lee, Y.H., Wang, Y.J., 2011. The arc-continentcollision in Taiwan. In: Brown, D., Ryan, P.D. (Eds.), Arc-Continent Collision.Frontiers in Earth Sciences, pp. 213–245, 10.1007/978-3-540-88558-0_8.
Chen, R.-F., Chan, Y.-C., Angelier, J., Hu, J.-C., Huang, C., Chang, K.-J., Shih, T.-Y., 2005.Large earthquake-triggered landslides and mountain belt erosion: the Tsaolingcase, Taiwan. C. R. Geoscience. 337, 1164–1172.
Chen, C.H., Ho, H.C., Shea, K.S., Lo, W., Lin, W.H., Chang, H.C., Huang, C.H., Lin, C.W.,Chen, G.H., Yang, C.N., Lee, Y.H., 2000. Geologic Map of Taiwan (1/500000):Central Geological Survey. Ministry of Economic Affairs, Taipei, Taiwan.
Ching, K.E., Hsieh, M.L., Johnson, K.J., Chen, K.H., Rau, R.J., Yang, M., 2011. Modernvertical deformation rates and mountain building in Taiwan from preciseleveling and continuous GPS observations, 2000–2008. J. Geophys. Res. 116,B08406.
Chmeleff, J., von Blanckenburg, F., Kossert, K., Jakob, D., 2010. Determination of the10Be half-life by multicollector ICP-MS and liquid scintillation counting. Nucl.Instrum. Methods Phys. Res. Sect. B 268, 192–199.
Codilean, A.T., Fenton, C.R., Fabel, D., Bishop, P., Xu, S., 2014. Discordance betweencosmogenic nuclide concentrations in amalgamated sands and individualfluvial pebbles in an arid zone catchment. Quaternary Geochronology. 19,173–180.
Cruz, L., Malinski, J., Wilson, A., Take, W.A., Hilley, G., 2010. Erosional control of thekinematics and geometry of fold-and-thrust belts imaged in a physical andnumerical sandbox. J. Geophys. Res. 115, B09404. http://dx.doi.org/10.1029/2010JB007472.
Dadson, S.J., Hovius, N., Chen, H., Dade, W.B., Hsieh, M.L., Willett, S.D., Hu, J.C.,Horng, M.J., Chen, M.C., Stark, C.P., Lague, D., Lin, J.C., 2003. Links betweenerosion, runoff variability and seismicity in the Taiwan orogen. Nature 426,648–651.
Dahlen, F.A., Suppe, J., 1988. Mechanics, growth and erosion of mountain belts. In:Clark, S.P., Burchfiel, B.C., Suppe, J. (Eds.), Processes in Continental LithosphericDeformation. Geological Society of America Special Paper 218, pp. 161–178.
Davis, D., Suppe, J., Dahlen, F.A., 1983. Mechanics of fold-and-thrust belts andaccretionary wedges. J. Geophys. Res. 88, 1153–1172.
Davison, A.C., Hinkley, D.V., 1997. Bootstrap Methods and their Applications.Cambridge University Press, p. 582.
Dunne, J., Elmore, D., Muzikar, P., 1999. Scaling factors for the rates of production ofcosmogenic nuclides for geometric shielding and attenuation at depth onsloped surfaces. Geomorphology 27 (1–2), 3–12.
Efron, B., 1979. Bootstrap methods: another look at the Jackknife. Ann. Statis. 7, 1–26.
Efron, B., Tibshirani, 1986. Bootstrap methods for standard errors, confidenceintervals, and other measures of statistical accuracy. Stat. Sci. 1 (1), 54–75.
Efron, B., Tibshirani, R.J., 1993. An Introduction to the Bootstrap. Chapman & Hall/CRC, Boca Raton, FL, 436 p.
Fuller, C.W., Willet, S.D., Hovius, N., Slingerland, R., 2003. Erosion rates for Taiwanmountain basins: new determinations from suspended sediment records and astochastic model of their temporal variation. J. Geol. 111, 71–87.
Fuller, C.W., Willett, S.D., Fisher, D., Lu, C.Y., 2006. A thermomechanical wedgemodel of Taiwan constrained by fission-track thermochronometry.Tectonophysics. 425 (1–4), 1–24.
Gosse, J.C., Phillips, F.M., 2001. Terrestrial in situ cosmogenic nuclides: theory andapplication. Quatern. Sci. Rev. 20, 1475–1560.
Granger, D.E., Riebe, C.S., 2013. Cosmogenic nuclides in weathering and erosion. In:Drever, J.I. (Ed.), Surface and Ground Water, Weathering and Soils: Treatise onGeochemistry, vol. 5, second ed. Elsevier-Pergamon, Oxford, UK, p. 36 p(Chapter 14).
Granger, D.E., Kirchner, J.W., Finkel, R., 1996. Spatially-averaged long-term erosionrates measured from in situ-produced cosmogenic nuclides in alluvialsediment. J. Geol. 104, 249–257.
Granger, D.E., Lifton, N.A., Willenbring, J.K., 2013. A cosmic trip: 25 years ofcosmogenic nuclides in geology. Geol. Soc. Am. Bull. http://dx.doi.org/10.1130/B30774.1.
Heimsath, A.M., Chappel, J., Finkel, R.C., Fifield, K., Alimanovic, A., 2006. Escarpmenterosion and landscape evolution in southeastern Australia. In: Willet, S.D.,Hovius, N., Brandon, M.T., Fisher, D.M. (Eds.), Tectonics, Climate, and LandscapeEvolution. Geological Society of America Special Paper 398, pp. 173–190.
Hewawasam, T.F., von Blanckenburg, F., Schaller, M., Kubick, P.W., 2003. Increase ofhuman over natural erosion rates in tropical highlands constrained bycosmogenic nuclides. Geology 3, 597–600.
Horng, C.S., Huh, C.A., Chen, K.H., Lin, C.H., 2012. Pyrrhotite as a tracer fordenudation of the Taiwan orogeny. Geochem. Geophys. Geosyst. 13 (8), Q08Z47.
Hovius, N., Stark, C.P., Chu, H.-T., Lin, J.-C., 2000. Supply and removal of sediment in alandslide-dominated mountain belt: Central Range, Taiwan. J. Geol. 108, 73–89.
Kirchner, J.W., Finkel, R.C., Riebe, C.S., Granger, D.E., Clayton, J.L., King, J.G., Megahan,W.F., 2001. Mountain erosion over 10 yr, 10 k.y., and 10 m.y. time scales.Geology 29, 591–594.

F. Derrieux et al. / Journal of Asian Earth Sciences 88 (2014) 230–245 245
Konstantinovskaia, E., Malavieille, J., 2005. Erosion and exhumation in accretionaryorogens: experimental and geological approaches. Geochem. Geophys. Geosyst.6, Q02006, doi:10.1029/2004GC000794.
Konstantinovskaya, E., Malavieille, J., 2011. Thrust wedges with décollement levelsand syntectonic erosion: a view from analog models. Tectonophysics 502, 336–350.
Koons, P.O., 1990. 2-Sided orogen-collision and erosion from the sandbox to theSouthern Alps, New-Zealand. Geology 18 (8), 679–682.
Korschinek, G., Bergmaier, A., Faestermann, T., Gerstmann, U.C., Knie, K., Rugel, G.,Wallner, A., Dillmann, I., Dollinger, G., Lierse von Gosstomski, C., Kossert, K.,Maiti, M., Poutivtsev, M., Remmert, A., 2010. A new value for the 10Be half-lifeby heavy-ion elastic recoil detection and liquid scintillation counting. Nucl.Instrum. Methods 268, 187–191.
Lal, D., 1991. Cosmic ray labeling of erosion surfaces: in-situ nuclide productionrates and erosion models. Earth Planet. Sci. Lett. 104, 424–439.
Lee, Y.H., 1976. Denudation of Taiwan Island since the Pleistocene epoch. J. Geol. 4,105–107.
Li, F.C., Angelier, J., Chen, R.F., Hsieh, H.M., Deffontaines, B., Luo, C.R., Wu, T.T., Lin,M.C., 2005. Estimates of present-day erosion based on sediment transport inrivers: a case study in Taiwan. C. R. Geosci. 337, 1131–1139.
Liu, T.-K., 1982. Tectonic implications of fission track ages from the Central Range,Taiwan. Proceedings of the Geol. Soc. China 25, 22–37.
Liu, T.K., Chen, Y.G., Chen, W.S., Jiang, S.H., 2000. Rates of cooling and denudation ofthe Early Penglai Orogeny, Taiwan, as assessed by fission-track constraints.Tectonophysics 320, 69–82.
Liu, T.K., Hsieh, S., Chen, Y.G., Chen, W.S., 2001. Thermo-kinematic evolution of theTaiwan oblique-collision mountain belt as revealed by zircon fission trackdating. Earth Planet. Sci. Lett. 186, 45–56.
Malavieille, J., 2010. Impact of erosion, sedimentation, and structural heritage onthe structure and kinematics of orogenic wedges: analog models and casestudies. Geol. Soc. Am. Acc. GSA Today 20 (1), doi:10.1130/GSATG48A.1.
McIntyre, G.A., Brooks, C., Compston, W., Turek, A., 1966. The statistical assessmentof Rb–Sr isochrons. J. Geophys. Res. 71, 5459–5468.
Merchel, S., Herpers, U., 1999. An update on radiochemical separation techniquesfor the determination of long-lived radionuclides via accelerator massspectrometry. Radiochim. Acta 84, 215–219.
Merchel, S., Arnold, M., Aumaître, G., Benedetti, L., Bourlès, D.L., Braucher, R.,Alfimov, V., Freeman, S.P.H.T., Steier, P., Wallner, A., 2008. Towards more precise10Be and 36Cl data from measurements at the 10–14 level: influence of samplepreparation. Nucl. Instrum. Methods Phys. Res. Sect. B 266 (22), 4921–4926.
Molnar, P., 2009. The state of interactions among tectonics, erosion, and climate: apolemic. GSA Today 19 (7), 44–45.
Niemi, N.A., Oskin, M., Burbank, D.W., Heimsath, A.M., Gabet, E.J., 2005. Effects ofbedrock landslides on cosmogenically determined erosion rates. Earth Planet.Sci. Lett. 237, 480–498.
Nishiizumi, K., Imamura, M., Caffee, M., Southon, J., Finkel, R., McAnich, J., 2007.Absolute calibration of Be-10 AMS standards. Nucl. Instrum. Methods Phys. Res.B 258, 403–413.
Palumbo, L., Hetzel, R., Tao, M., Li, X., 2009. Topographic and lithologic control oncatchment-wide denudation rates derived from cosmogenic 10Be in twomountain ranges at the margin of NE Tibet. Geomorphology 117, 130–142.
Portenga, E.W., Bierman, P.R., 2011. Understanding earth’s eroding surface with10Be. GSA Today 21, 8. http://dx.doi.org/10.1130/G111A.1.
Sella, G.F., Dixon, T.H., Mao, A., 2002. REVEL: a model for recent plate velocities fromspace geodesy. J. Geophys. Res. 107 (B4), doi:10.1029/2000JB000033.
Selzer, C., Buiter, S.J.H., Pfiffner, O.A., 2008. Numerical modeling of frontal and basalaccretion at collisional margins. Tectonics 27, TC3001, doi:10.1029/2007TC002169.
Shyu, J.B.H., Sieh, K., Chen, Y.-G., Liu, C.-S., 2005. Neotectonic architecture of Taiwanand its implications for future large earthquakes. J. Geophys. Res. 110, B08402.
Siame, L.L., Angelier, J., Chen, R.F., Godard, V., Derrieux, F., Bourlès, D.L., Braucher, R.,Chang, K.J., Chu, H.T., Lee, J.C., 2011. Erosion rates in an active orogen (NE-Taiwan): a confrontation of cosmogenic measurements with river suspendedloads. Quat. Geochronol. 6, 246–260.
Simoes, M., Avouac, J.P., Beyssac, O., Goffé, B., Farley, K.A., Chen, Y.G., 2007.Mountain building in Taiwan: a thermokinematic model. J. Geophys. Res. 112,B11405.
Stone, J.O., 2000. Air pressure and cosmogenic isotope production. J. Geophys. Res.105, 23753–23759.
Strahler, A.N., 1952. Hypsometric (area-altitude) analysis of erosional topography.Geol. Soc. Am. Bull. 63, 1117–1142.
Suppe, J., 1981. Mechanics of mountain building and metamorphism in Taiwan.Mem. Geol. Soc. China 4, 67–89.
von Blanckenburg, F., 2005. The control mechanisms of erosion and weathering atbasin scale from cosmogenic nuclides in river sediment. Earth Planet. Sci. Lett.237, 462–479.
Ward, G.K., Wilson, S.R., 1978. Procedures for comparing and combiningradiocarbon age determination: a critique. Archaeometry 20, 19–31.
Water Resources Agency, 2012. Ministry of Economic Affairs. <http://eng.wra.gov.tw/> (July 2012).
Water Resources Agency, 2014. Ministry of Economic Affairs, Precipitations inTaiwan. <http://eng.wra.gov.tw/ct.asp?xItem=48142&CtNode=7674> (January2014).
Wendt, I., Carl, C., 1991. The Statistical Distribution of the Mean Squared WeightedDeviation. Chem. Geol. 86 (4), 275–285.
Whipple, K.X., Meade, B.J., 2004. Controls on the strength of coupling among climate,erosion, and deformation in two-sided, frictional orogenic wedges at steady-state.J. Geophys. Res. 109, F01011. http://dx.doi.org/10.1029/2003JF000019.
Willett, S.D., 1999. Orogeny and orography: the effects of erosion on the structure ofmountain belts. J. Geophys. Res. 104, 28957–28981.
Willett, S.D., Fischer, D., Fuller, C., Yeh, E.C., Lu, C.Y., 2003. Erosion rates andorogenic-wedge kinematics in Taiwan inferred from fission-trackthermochronometry. J. Geol. 31 (11), 945–948.
Willgoose, G., Hancock, G., 1998. Revisiting the hypsometric curve as an indicator ofform and process in transport-limited catchment. Earth Surf. Proc. Land. 23 (7),611–623.
Yamato, P., Mouthereau, F., Burov, E., 2009. Taiwan mountain building: insightsfrom 2D thermo-mechanical modelling of a rheologically-stratified lithosphere.Geophys. J. Int. 176, 307–326.
Yanites, B.J., Tucker, G.E., Anderson, R.S., 2009. Numerical and analytical models ofcosmogenic radionuclide dynamics in landslide-dominated drainage basins. J.Geophys. Res.: Earth Surf. 114, F01007.
You, C.F., Lee, T., Brown, L., She, J.J.S., Chen, J.C., 1988. 10Be study of rapid erosion inTaiwan. Geochim. Cosmochim. Acta 52, 2687–2691.
Yu, S.B., Chen, H.Y., Kuo, L.C., 1997. Velocity field of GPS stations in the Taiwan area.Tectonophysics 274, 41–59.


