Embed Size (px)
Citation preview
How (In)accurate AreDemand Forecasts inPublic Works Projects?
The Case of Transportation
Bent Flyvbjerg, Mette K. Skamris Holm, and Søren L. Buhl
Despite the enormous sums of money being spent on transportationinfrastructure, surprisingly little systematic knowledge exists about thecosts, benefits, and risks involved. The literature lacks statistically valid
answers to the central and self-evident question of whether transportation infra-structure projects perform as forecasted. When a project underperforms, this isoften explained away as an isolated instance of unfortunate circumstance; it istypically not seen as the particular expression of a general pattern of underper-formance in transportation infrastructure projects. Because knowledge is wantingin this area of research, until now it has been impossible to validly refute or con-firm whether underperformance is the exception or the rule.
In three previous articles (Flyvbjerg, Holm, et al., , , ), weanswered the question of project performance as regards costs and cost-relatedrisks. We found that projects do not perform as forecasted in terms of costs:almost out of projects fall victim to significant cost overrun. We also inves-tigated the causes and cures of such inaccurate cost projections (see Flyvbjerg,Bruzelius, et al., ). In this article we focus on the benefit side of investmentsand answer the question of whether projects perform as forecasted in terms ofdemand and revenue risks. We compare forecasted demand with actual demandfor a large number of projects. Knowledge about cost risk, benefit risk, and com-pound risk is crucial to making informed decisions about projects. This is not tosay that costs and benefits are or should be the only basis for deciding whether tobuild. Clearly, forms of rationality other than economic rationality are at workin most infrastructure projects and are balanced in the broader frame of publicdecision making. But the costs and benefits of infrastructure projects often runin the hundreds of millions of dollars, with risks correspondingly high. Withoutknowledge of such risks, decisions are likely to be flawed.
As pointed out by Pickrell () and Richmond (), estimates of thefinancial viability of projects are heavily dependent on the accuracy of trafficdemand forecasts. Such forecasts are also the basis for socioeconomic and envi-ronmental appraisal of transportation infrastructure projects. According to theexperiences gained with the accuracy of demand forecasting in the transportationsector, covering traffic volumes, spatial traffic distribution, and distribution be-tween transportation modes, there is evidence that demand forecasting—like costforecasting, and despite all scientific progress in modeling—is a major source of
This article presents results from the firststatistically significant study of trafficforecasts in transportation infrastructureprojects. The sample used is the largestof its kind, covering projects in nations worth U.S.$ billion. The studyshows with very high statistical signifi-cance that forecasters generally do a poorjob of estimating the demand for trans-portation infrastructure projects. For out of rail projects, passenger forecastsare overestimated; the average overestima-tion is %. For half of all road projects,the difference between actual and fore-casted traffic is more than ±%. Theresult is substantial financial risks, whichare typically ignored or downplayed byplanners and decision makers to the det-riment of social and economic welfare.Our data also show that forecasts have notbecome more accurate over the -yearperiod studied, despite claims to the con-trary by forecasters. The causes of inaccu-racy in forecasts are different for rail androad projects, with political causes playinga larger role for rail than for road. Thecure is transparency, accountability, andnew forecasting methods. The challengeis to change the governance structuresfor forecasting and project development.Our article shows how planners may helpachieve this.
Bent Flyvbjerg is a professor of planningat Aalborg University, Denmark. He isfounder and director of the university’sresearch program on large-scale infra-structure planning. His latest books areMegaprojects and Risk (Cambridge Uni-versity Press, , with Nils Bruzeliusand Werner Rothengatter), Making SocialScience Matter (Cambridge UniversityPress, ), and Rationality and Power(University of Chicago Press, ). MetteK. Skamris Holm is a former assistantprofessor of planning at Aalborg Univer-sity. She now works as a planner withAalborg Municipality. Søren L. Buhlis an associate professor of mathematicsat Aalborg University. He is associatestatistician with the university’s researchprogram on large-scale infrastructureplanning.
Journal of the American Planning Association,
Vol. , No. , Spring .
© American Planning Association, Chicago, IL.
uncertainty and risk in the appraisal of transportationinfrastructure projects.
Traffic forecasts are routinely used to dimension theconstruction of transportation infrastructure projects.Accuracy in such forecasts is a point of considerable im-portance for the effective allocation of scarce funds. Forexample, Bangkok’s U.S.$ billion Skytrain was hugelyoverdimensioned because the passenger forecasts were .times higher than actual traffic. As a result, station plat-forms are too long for the shortened trains that now oper-ate the system, a large number of trains and cars are idlyparked in the train garage because there is no need for them,terminals are too large, etc. The project company has endedup in financial trouble, and even though urban rail is prob-ably a good idea for a congested and air-polluted city likeBangkok, overinvesting in idle capacity is hardly the bestway to use resources, and especially not in a developingnation where capital for investment is scarce. Conversely,a U.K. National Audit Office () study identified a num-ber of road projects that were underdimensioned becausetraffic forecasts were too low. This, too, led to multimillion-dollar inefficiencies, because it is much more expensive toadd capacity to existing, fully used roads than it is to buildthe capacity up front. For these and other reasons, accuracyin traffic forecasts matters.
Nevertheless, rigorous studies of accuracy are rare.Where such studies exist, they are characteristically small-N research; that is, they are single-case studies or theycover a sample of projects too small or too uneven to allowsystematic, statistical analyses (Brooks & Trevelyan, ;Fouracre et al., ; Fullerton & Openshaw, ; Kain,; Mackinder & Evans, ; National Audit Office,, ; Pickrell, ; Richmond, ; Walmsley &Pickett, ; Webber, : World Bank, ). Despitetheir value in other respects, with these and other studies,it has so far been impossible to give statistically satisfyinganswers to questions about how accurate traffic forecastsare for transportation infrastructure projects.
The objective of the present study has been to changethis state of affairs by establishing a sample of transpor-tation infrastructure projects that is sufficiently large topermit statistically valid answers to questions of accuracy.In addition, it has been a practical objective to give plan-ners the tools for carrying out realistic and valid risk assess-ment of projects as regards travel demand. Existing studiesalmost all conclude there is a strong tendency for trafficforecasts to be overestimated (Fouracre et al., , pp. &; Mackinder & Evans, , p. ; National Audit Office,, app. .; Pickrell, , p. x; Thompson, , pp.–; Walmsley & Pickett, , p. ; World Bank, ).We will show that this conclusion is a consequence of the
small samples used in existing studies; it does not hold forthe project population. When we enlarge the sample ofprojects by a factor – to a more representative one, wefind a different picture. Road traffic forecasts are not gen-erally overestimated, although they are often very inaccu-rate, whereas forecasts of rail patronage are generally over-estimated, often dramatically so.
We follow common practice and define the inaccuracyof a traffic forecast as actual minus forecasted traffic in per-centage of forecasted traffic. Traffic is measured as numberof passengers for rail, and number of vehicles for roadsActual traffic is counted for the first year of operations (orthe opening year). Forecasted traffic is the traffic estimatefor the first year of operations (or the opening year) as esti-mated at the time of decision to build the project. Thusthe forecast is the estimate available to decision makerswhen they made the decision to build the project in ques-tion. If no estimate was available at the time of decision tobuild, then the closest available estimate was used, typicallya later estimate, resulting in a conservative bias in ourmeasure for inaccuracy.
We measured inaccuracy of traffic forecasts in a sampleof transportation infrastructure projects with compar-able data for forecasted and actual traffic. The samplecomprises a project portfolio worth approximately U.S.$
billion in actual costs ( prices). The portfolio includes rail projects and road projects completed between and . The project types are urban rail, high-speedrail, conventional rail, bridges, tunnels, highways, and free-ways. The projects are located in countries on conti-nents, including both developed and developing nations:Brazil, Chile, Denmark, Egypt, France, Germany, HongKong, India, Mexico, South Korea, Sweden, Tunisia, theU.K., and the U.S. Projects were selected for the samplebased on the availability and quality of data. As far as weknow, this is the largest sample of transportation infrastruc-ture projects that has been established with comparabledata on forecasted and actual traffic. For a full descriptionof the sample, data, and methods of testing for inaccuracy,please see Flyvbjerg ().
Are Rail or Road Forecasts MoreAccurate?
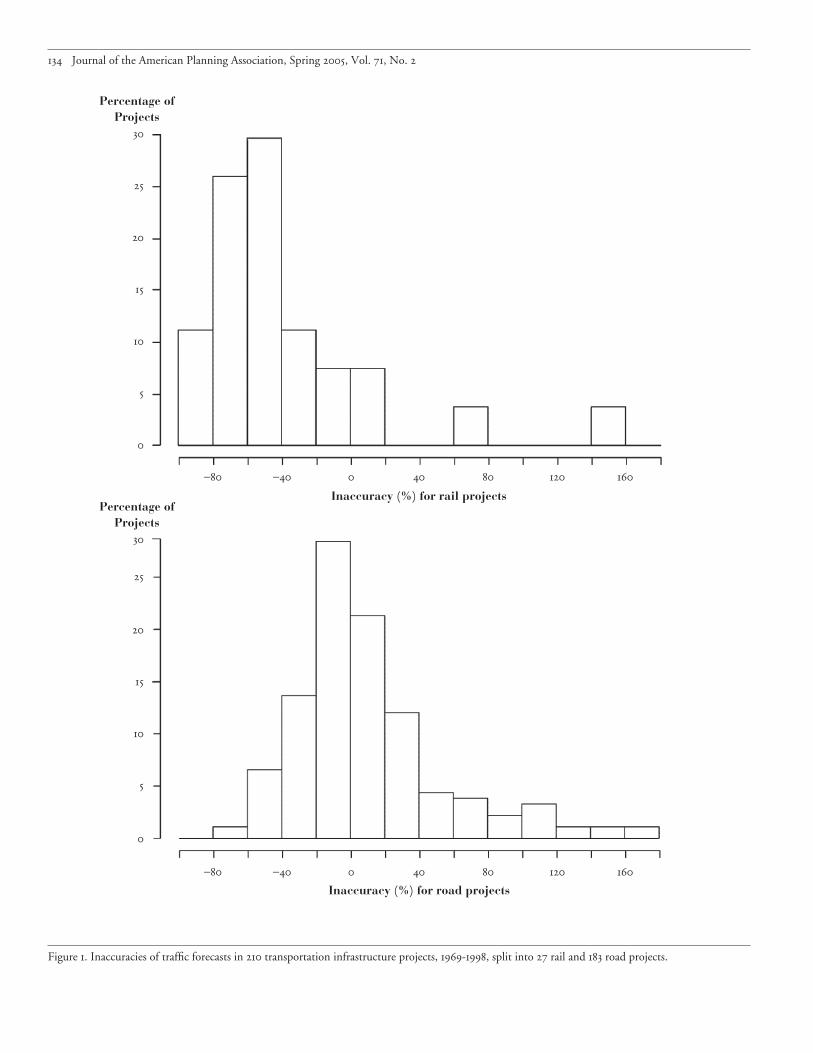
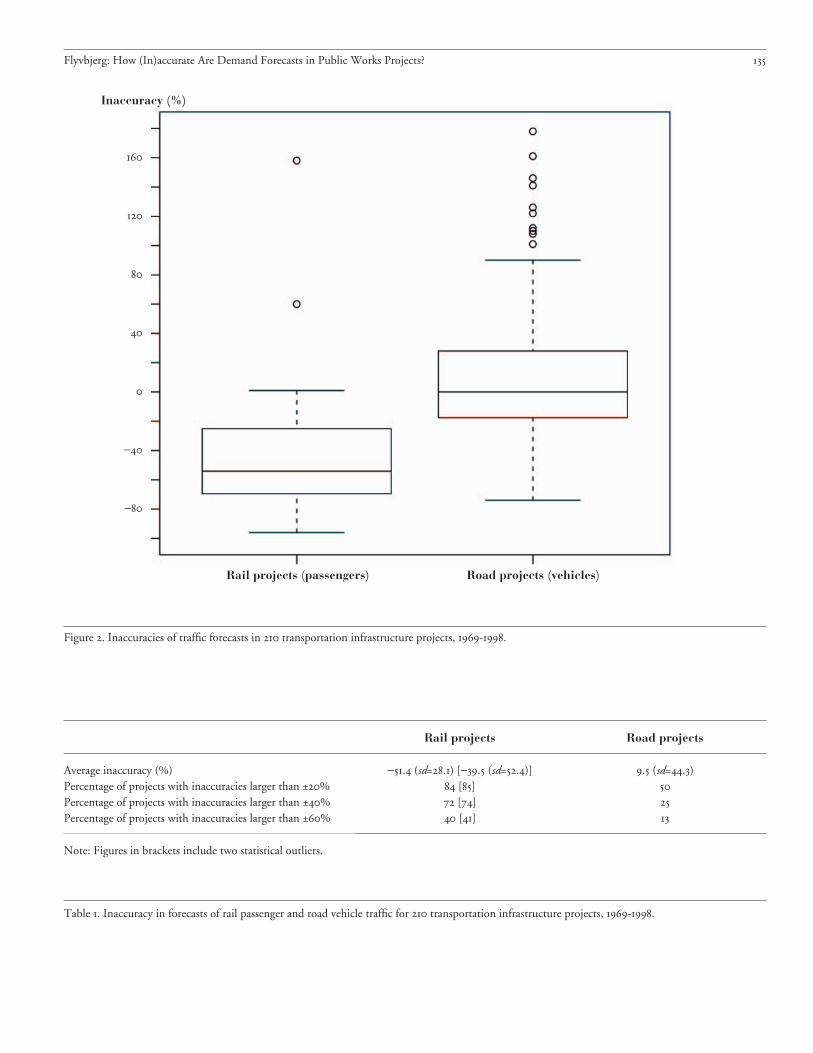
Figures and show the distribution of inaccuracy oftraffic forecasts for the projects in the sample split intorail and road projects. Perfect accuracy is indicated by zero;a negative figure indicates that actual traffic is that manypercent lower than forecasted traffic; a positive figure indi-cates that actual traffic is that many percent higher than
Journal of the American Planning Association, Spring , Vol. , No.
forecasted traffic. The most noticeable attribute of Figures and is the striking difference between rail and roadprojects. Rail passenger forecasts are much more inaccurate(inflated) than are road traffic forecasts.
Tests show that of the rail projects included in thestatistical analyses, two German projects should be consid-ered as statistical outliers. These are the two projects repre-sented by the two rightmost columns in the rail histogramin Figure and the two uppermost plots in the rail box-plot diagram shown in Figure . Excluding statistical out-liers, we find the following results for the remaining railprojects (results including the two statistical outliers aregiven in brackets):
• The data document a massive problem with inflatedrail passenger forecasts. For more than out of railprojects, passenger forecasts are overestimated; for %[%] of all rail projects, passenger forecasts are over-estimated by more than two thirds.
• Rail passenger forecasts were overestimated by an av-erage of .% [.%] (% confidence interval of. to . [. to .]), resulting in actual trafficthat was on average .% [.%] lower than fore-casted traffic (sd=. [.], % confidence intervalof −. to −. [−. to −.]).
• % [%] of the rail projects have actual traffic morethan % below forecasted traffic and none have ac-tual traffic more than % above forecasted traffic.Even if we double the threshold value to %, we findthat a solid % [%] of all rail projects have actualtraffic below that limit.
For road projects, we find with % confidence thatthere is no significant difference (p=.) in terms offorecast inaccuracies between vehicle traffic on highways,bridges, and in tunnels ( highways, bridges, tun-nels). Hence we consider the road projects as an aggre-gate. Our tests show the following (see also Table ):
• % of the road projects have a difference betweenactual and forecasted traffic of more than ±%. If wedouble the threshold value to ±%, we find that %of projects are above this level.
• There is no significant difference between the frequen-cy of inflated versus deflated forecasts for road vehicletraffic (p=., two-sided binominal test); .% ofprojects have inaccuracies below −%, whereas .%of projects have inaccuracies above +%.
• Road traffic forecasts were underestimated by an aver-age of .% (% confidence interval of . to .),resulting in actual traffic that was on average .%
higher than forecasted traffic (sd=., % confidenceinterval of . to .).
Here it would be interesting to compare toll roadswith non-toll roads, but unfortunately the present data donot allow this.
We see that the risk is substantial that road traffic fore-casts are wrong by a large margin, but the risk is more bal-anced than for rail passenger forecasts. Testing the differ-ence between rail and road, we find at a very high level ofstatistical significance that rail passenger forecasts are lessaccurate and more inflated than road vehicle forecasts(p<., Welch two-sample t-test). However, there is noindication of a significant difference between the standarddeviations for rail and road forecasts; both are high, indi-cating a large element of uncertainty and risk for bothtypes of forecasts (p=., two-sided F-test). Excludingthe two statistical outliers for rail, we find the standarddeviation for rail projects to be significantly lower than forroad projects, although still high (p=.).
Any traffic forecast is done in the context of uncer-tainty about many of the key inputs and drivers of the pro-jection—demographics, economic factors, technology, anddifferences between the assumed and actual operating ser-vice plans that are implemented. The same holds for otherimportant aspects of project evaluation and investmentdecision making, including forecasts of costs (Flyvbjerg,Holm, et al., , , ). Simple uncertainty wouldaccount for the type of inaccuracy we find with road trafficforecasts, with a fairly even distribution of high and lowforecasts. Simple uncertainty does not seem to account forthe outcome of rail travel forecasts, however. Such forecastsare overestimated too consistently for an interpretation interms of simple uncertainty to be statistically plausible.
We conclude that the traffic estimates used in decisionmaking for rail infrastructure development are highly, sys-tematically, and significantly misleading (inflated). Theresult is large benefit shortfalls. For road projects the prob-lem of misleading forecasts is less severe and less one sidedthan for rail. But even for roads, for half the projects thedifference between actual and forecasted traffic is morethan ±%. On this background, planners and decisionmakers are well advised to take with a grain of salt any traf-fic forecast that does not explicitly take into account theuncertainty of predicting future traffic. For rail passengerforecasts, a grain of salt may not be enough. The data dem-onstrate to planners that risk assessment and managementregarding travel demand must be an integral part of plan-ning for both rail and road projects. This is especially thecase because prediction errors in the early stages of fore-casting appear to amplify, rather than decrease, in later
Flyvbjerg: How (In)accurate Are Demand Forecasts in Public Works Projects?
Journal of the American Planning Association, Spring , Vol. , No.
Figure . Inaccuracies of traffic forecasts in transportation infrastructure projects, -, split into rail and road projects.
Percentage ofProjects
Percentage ofProjects
Inaccuracy (%) for rail projects
Inaccuracy (%) for road projects
− −
− −
Flyvbjerg: How (In)accurate Are Demand Forecasts in Public Works Projects?
Table . Inaccuracy in forecasts of rail passenger and road vehicle traffic for transportation infrastructure projects, -.
Rail projects Road projects
Average inaccuracy (%)Percentage of projects with inaccuracies larger than ±%Percentage of projects with inaccuracies larger than ±%Percentage of projects with inaccuracies larger than ±%
−. (sd=.) [−. (sd=.)] [] [] []
. (sd=.)
Note: Figures in brackets include two statistical outliers.
Figure . Inaccuracies of traffic forecasts in transportation infrastructure projects, -.
−
−
Rail projects (passengers) Road projects (vehicles)
Inaccuracy (%)
stages (Mierzejewski, ; Zhao & Kockelman, ).The data presented above provide the empirical basis onwhich planners may establish risk assessment and manage-ment, and below we propose methods and procedures fordoing so.
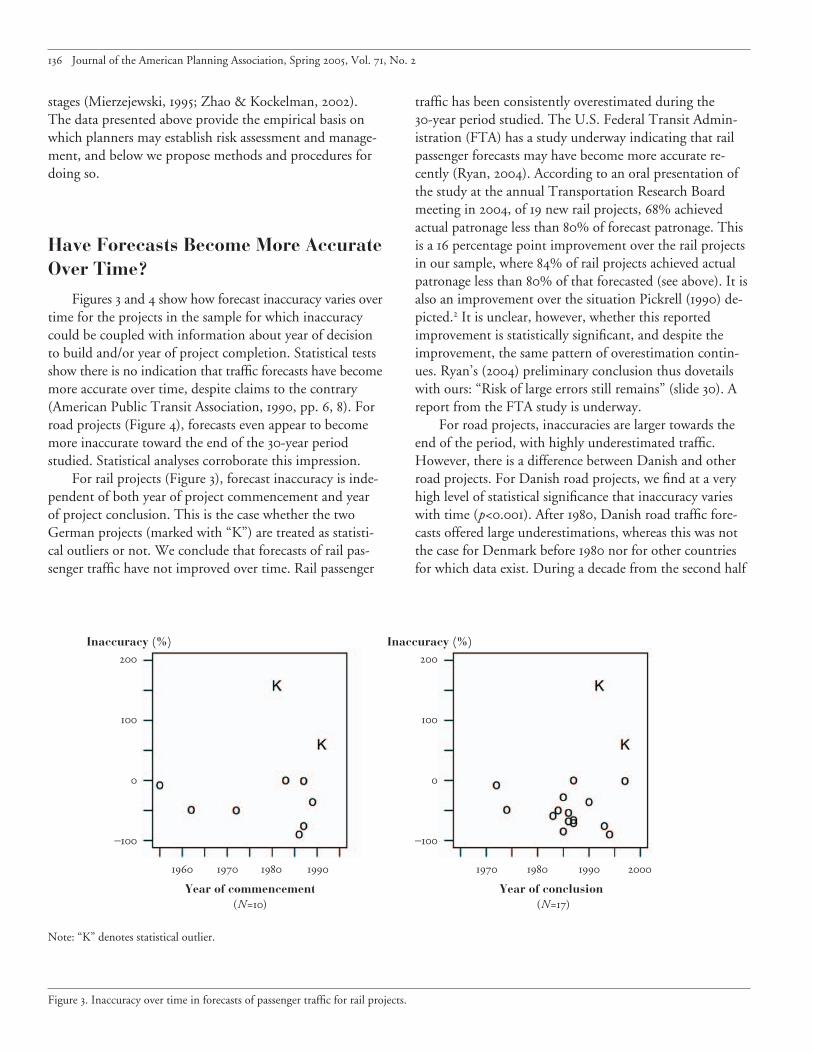
Have Forecasts Become More AccurateOver Time?
Figures and show how forecast inaccuracy varies overtime for the projects in the sample for which inaccuracycould be coupled with information about year of decisionto build and/or year of project completion. Statistical testsshow there is no indication that traffic forecasts have becomemore accurate over time, despite claims to the contrary(American Public Transit Association, , pp. , ). Forroad projects (Figure ), forecasts even appear to becomemore inaccurate toward the end of the -year periodstudied. Statistical analyses corroborate this impression.
For rail projects (Figure ), forecast inaccuracy is inde-pendent of both year of project commencement and yearof project conclusion. This is the case whether the twoGerman projects (marked with “K”) are treated as statisti-cal outliers or not. We conclude that forecasts of rail pas-senger traffic have not improved over time. Rail passenger
traffic has been consistently overestimated during the-year period studied. The U.S. Federal Transit Admin-istration (FTA) has a study underway indicating that railpassenger forecasts may have become more accurate re-cently (Ryan, ). According to an oral presentation ofthe study at the annual Transportation Research Boardmeeting in , of new rail projects, % achievedactual patronage less than % of forecast patronage. Thisis a percentage point improvement over the rail projectsin our sample, where % of rail projects achieved actualpatronage less than % of that forecasted (see above). It isalso an improvement over the situation Pickrell () de-picted. It is unclear, however, whether this reportedimprovement is statistically significant, and despite theimprovement, the same pattern of overestimation contin-ues. Ryan’s () preliminary conclusion thus dovetailswith ours: “Risk of large errors still remains” (slide ). Areport from the FTA study is underway.
For road projects, inaccuracies are larger towards theend of the period, with highly underestimated traffic.However, there is a difference between Danish and otherroad projects. For Danish road projects, we find at a veryhigh level of statistical significance that inaccuracy varieswith time (p<.). After , Danish road traffic fore-casts offered large underestimations, whereas this was notthe case for Denmark before nor for other countriesfor which data exist. During a decade from the second half
Journal of the American Planning Association, Spring , Vol. , No.
Figure . Inaccuracy over time in forecasts of passenger traffic for rail projects.
Year of commencement(N=)
Year of conclusion(N=)
−
−
Note: “K” denotes statistical outlier.
Inaccuracy (%) Inaccuracy (%)
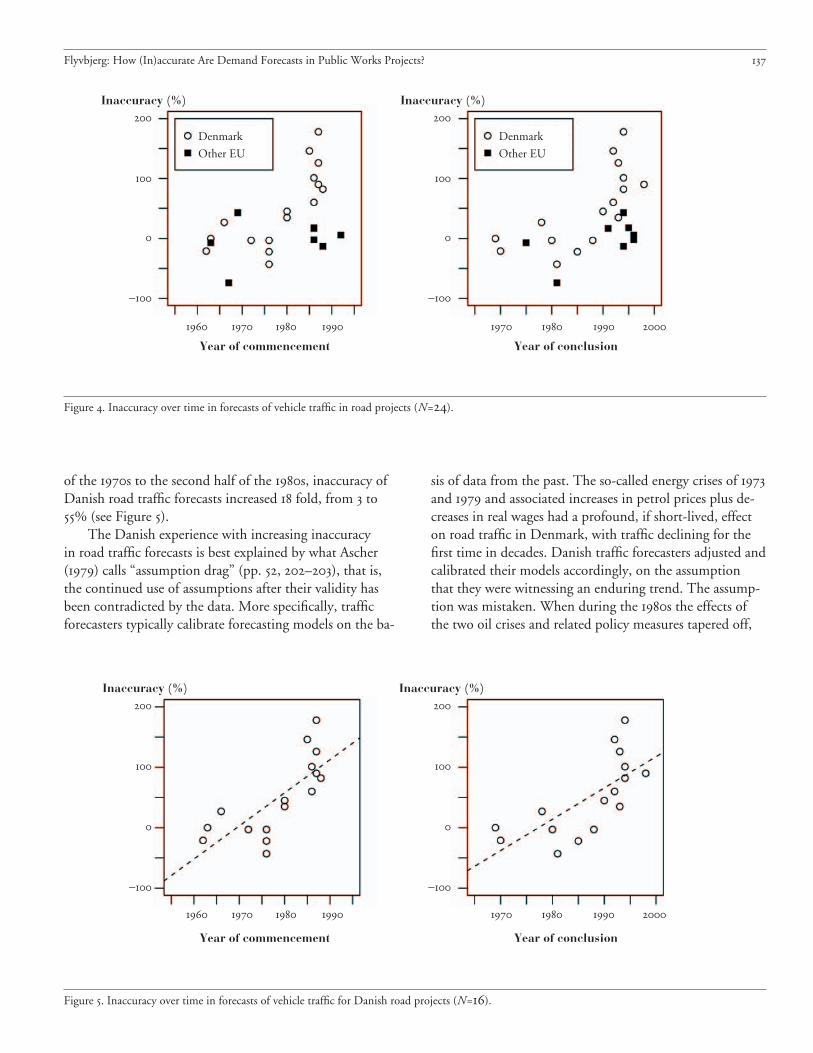
of the s to the second half of the s, inaccuracy ofDanish road traffic forecasts increased fold, from to% (see Figure ).
The Danish experience with increasing inaccuracyin road traffic forecasts is best explained by what Ascher() calls “assumption drag” (pp. , –), that is,the continued use of assumptions after their validity hasbeen contradicted by the data. More specifically, trafficforecasters typically calibrate forecasting models on the ba-
sis of data from the past. The so-called energy crises of
and and associated increases in petrol prices plus de-creases in real wages had a profound, if short-lived, effecton road traffic in Denmark, with traffic declining for thefirst time in decades. Danish traffic forecasters adjusted andcalibrated their models accordingly, on the assumptionthat they were witnessing an enduring trend. The assump-tion was mistaken. When during the s the effects ofthe two oil crises and related policy measures tapered off,
Flyvbjerg: How (In)accurate Are Demand Forecasts in Public Works Projects?
Figure . Inaccuracy over time in forecasts of vehicle traffic in road projects (N=).
−
−
Year of commencement
Year of conclusion
Denmark
Other EU
Denmark
Other EU
Figure . Inaccuracy over time in forecasts of vehicle traffic for Danish road projects (N=).
−
−
Year of commencement
Year of conclusion
Inaccuracy (%) Inaccuracy (%)
Inaccuracy (%) Inaccuracy (%)
traffic boomed again, rendering forecasts made on sassumptions inaccurate.
We conclude that accuracy in traffic forecasting hasnot improved over time. Rail passenger forecasts are asinaccurate—that is, inflated—today as they were yearsago. Road vehicle forecasts even appear to have becomemore inaccurate over time, with large underestimations to-wards the end of the -year period studied. If techniquesand skills for arriving at accurate traffic forecasts have im-proved over time, our data do not show it. This suggeststo planners that the most effective means for improvingforecasting accuracy is probably not improved models but,instead, more realistic assumptions and systematic use ofempirically based assessment of uncertainty and risk. Be-low, in the section on reference class forecasting, we willsee how this may be done. For rail, in particular, the per-sistent existence over time of highly inflated passengerforecasts invites speculation that an equilibrium has beenreached where strong incentives and weak disincentives foroverestimating passenger traffic may have taught projectpromoters that overestimated passenger forecasts pay off:in combination with underestimated costs, such forecastshelp misrepresent rail projects to decision makers in waysthat help get rail projects approved and built (Flyvbjerg,Bruzelius, et al., ). This suggests that improved ac-curacy for rail forecasts will require strong measures oftransparency and accountability to curb strategic misrep-resentation. Such measures form part of what has becomeknown as PPPs—public-private partnerships—and thereis some indication that properly designed PPPs may helpimprove the accuracy of cost forecasts (National AuditOffice, ). As far as we know, no studies exist regardingthe effect of PPPs or similar arrangements on the accuracyof traffic forecasts.
Does Project Size, Length ofImplementation, and GeographyMatter to Accuracy?
Testing for effect on forecasting inaccuracy from size ofproject, we used linear regression analyses measuring size ofproject by estimated costs, estimated number of passengers,and estimated number of vehicles. As the distributions ofthese three estimations are all skewed, the logarithms ofthese have also been used as explanatory variables.
For rail projects, based on cases we found that inac-curacies in passenger forecasts are not significantly depend-ent on costs (p=.), but do have significance dependenton logarithm of costs (p=.), with higher costs leadingto higher inaccuracies. Based on cases, inaccuracies in
passenger forecasts are not significantly dependent on esti-mated number of passengers, neither directly (p=.) nortaking logarithms (p=.).
For road projects, based on cases, inaccuracies invehicle forecast are not significantly dependent on costs,neither directly (p=.) nor logarithmically (p=.).Based on cases, inaccuracies in vehicle forecast are sig-nificantly dependent on estimated number of vehicles,both directly (p=.) and even stronger taking loga-rithms (p<.), with smaller projects tending to have themost inaccurate (underestimated) traffic forecasts.
We know of only one other study that relates inaccu-racy in travel demand forecasting with size of project (Mal-donado, , quoted in Mierzejewski, , p. ). Based ondata from U.S. airports, this study found that inaccuracyin aviation forecasting did not correlate with size of facility.
Additional tests indicate no effect on inaccuracy fromlength of project implementation phase, defined as thetime period from decision to build a project until opera-tions begin. More data are needed in order to study theeffect on inaccuracy from geographic location of projectsand type of ownership. With the available data, there areno significant differences among geographic areas, whichsuggests that until more data are available, planners maypool data from different geographic areas when carryingout risk assessment.
Causes of Inaccuracies and Bias inTraffic Forecasts
The striking difference in forecasting inaccuracy be-tween rail and road projects documented above may pos-sibly be explained by the different procedures that applyto how each type of project is funded. Competition forfunds is typically more pronounced for rail than for road,which creates an incentive for rail promoters to presenttheir project in as favorable a light as possible—that is,with overestimated benefits and underestimated costs(see more in Flyvbjerg, Holm, et al., ). We speculatefurther that rail patronage will be overestimated and roadtraffic underestimated in instances where there is a strongpolitical or ideological desire to see passengers shifted fromroad to rail, for instance for reasons of congestion or pro-tection of the environment. Forecasts here become part ofthe political rhetoric aimed at showing voters that some-thing is being done—or will be done—about the problemsat hand. In such cases it may be difficult for forecasters andplanners to argue for more realistic forecasts, because poli-ticians may use forecasts to show political intent, not themost likely outcome.
Journal of the American Planning Association, Spring , Vol. , No.
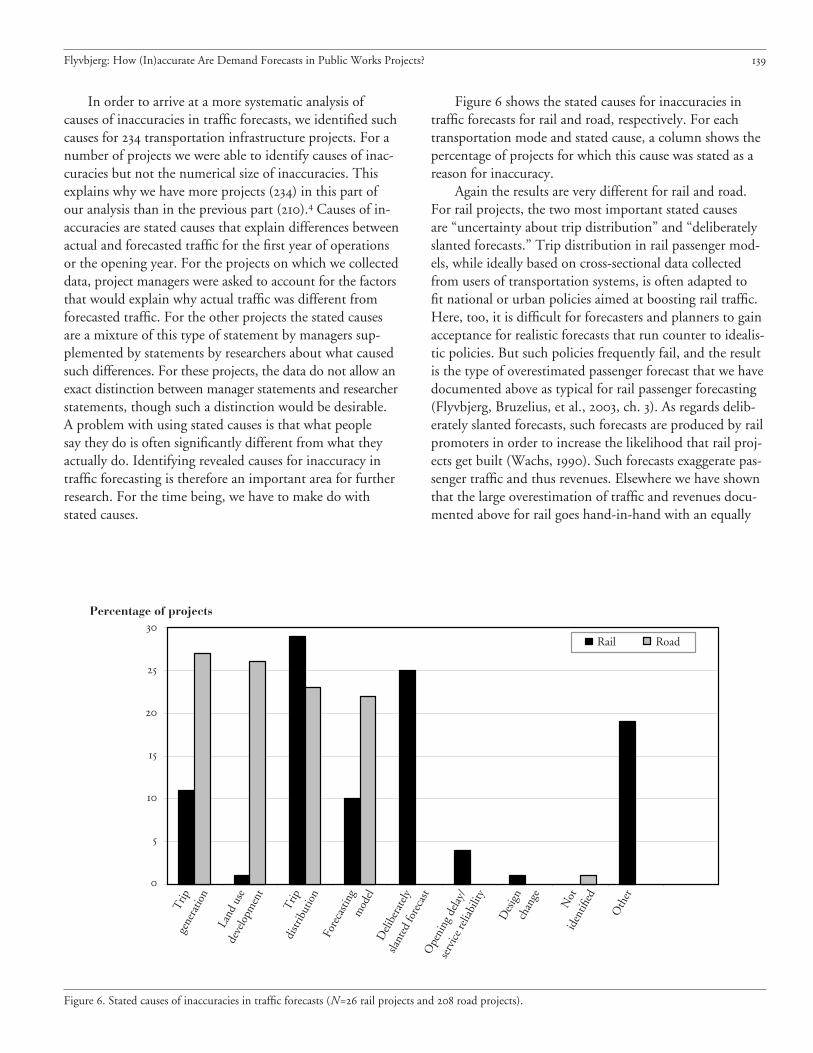
In order to arrive at a more systematic analysis ofcauses of inaccuracies in traffic forecasts, we identified suchcauses for transportation infrastructure projects. For anumber of projects we were able to identify causes of inac-curacies but not the numerical size of inaccuracies. Thisexplains why we have more projects () in this part ofour analysis than in the previous part (). Causes of in-accuracies are stated causes that explain differences betweenactual and forecasted traffic for the first year of operationsor the opening year. For the projects on which we collecteddata, project managers were asked to account for the factorsthat would explain why actual traffic was different fromforecasted traffic. For the other projects the stated causesare a mixture of this type of statement by managers sup-plemented by statements by researchers about what causedsuch differences. For these projects, the data do not allow anexact distinction between manager statements and researcherstatements, though such a distinction would be desirable.A problem with using stated causes is that what peoplesay they do is often significantly different from what theyactually do. Identifying revealed causes for inaccuracy intraffic forecasting is therefore an important area for furtherresearch. For the time being, we have to make do withstated causes.
Figure shows the stated causes for inaccuracies intraffic forecasts for rail and road, respectively. For eachtransportation mode and stated cause, a column shows thepercentage of projects for which this cause was stated as areason for inaccuracy.
Again the results are very different for rail and road.For rail projects, the two most important stated causesare “uncertainty about trip distribution” and “deliberatelyslanted forecasts.” Trip distribution in rail passenger mod-els, while ideally based on cross-sectional data collectedfrom users of transportation systems, is often adapted tofit national or urban policies aimed at boosting rail traffic.Here, too, it is difficult for forecasters and planners to gainacceptance for realistic forecasts that run counter to idealis-tic policies. But such policies frequently fail, and the resultis the type of overestimated passenger forecast that we havedocumented above as typical for rail passenger forecasting(Flyvbjerg, Bruzelius, et al., , ch. ). As regards delib-erately slanted forecasts, such forecasts are produced by railpromoters in order to increase the likelihood that rail proj-ects get built (Wachs, ). Such forecasts exaggerate pas-senger traffic and thus revenues. Elsewhere we have shownthat the large overestimation of traffic and revenues docu-mented above for rail goes hand-in-hand with an equally
Flyvbjerg: How (In)accurate Are Demand Forecasts in Public Works Projects?
Figure . Stated causes of inaccuracies in traffic forecasts (N= rail projects and road projects).
Rail Road
Percentage of projects
Trip
gene
ratio
n
Land
use
deve
lopm
ent
Trip
distr
ibut
ion
Fore
casti
ngm
odel
Deli
bera
tely
slant
ed fo
reca
stO
peni
ng d
elay/
serv
ice r
eliab
ility
Des
ign
chan
ge
Not
iden
tified
Oth
er
large underestimation of costs (Flyvbjerg, Holm, et al.,, ). The result is cost-benefit analyses of rail proj-ects that are inflated, with benefit-cost ratios that are usefulfor getting projects accepted and built.
For road projects, the two most often stated causes forinaccurate traffic forecasts are uncertainties about “trip gen-eration” and “land-use development.” Trip generation isbased on traffic counts and demographic and geographicdata. Such data are often dated and incomplete, and fore-casters quote this as a main source of uncertainty in roadtraffic forecasting. Forecasts of land use development arebased on land use plans. The land use actually implementedis often quite different from what was planned, however.This, again, is a source of uncertainty in forecasting.
The different patterns in stated causes for rail androad, respectively, fit well with the figures for actual fore-cast inaccuracies documented above. Rail forecasts are sys-tematically and significantly overestimated to a degree thatindicates intent and not error on the part of rail forecastersand promoters. The stated causes, with “deliberately slant-ed forecasts” as the second to largest category, corroboratethis interpretation, which corresponds with findings byWachs (); Flyvbjerg, Holm, and Buhl (); and theU.K. Department for Transport (, pp. –). Roadforecasts are also often inaccurate, but they are substan-tially more balanced than rail forecasts, which indicates ahigher degree of fair play in road traffic forecasting. Thisinterpretation is corroborated by the fact that deliberatelyslanted forecasts are not quoted as a main cause of inac-curacy for road traffic forecasts, where they are replacedby more technical factors like trip generation and land usedevelopment. This is not to say that road traffic forecastsare never politically manipulated. It is to say, however, thatthis appears to happen less often and less systematically forroad than for rail projects. It is also not to say that roadprojects generally have a stronger justification than railprojects—just that they have less biased forecasts.
What Planners Can Do to ReduceInaccuracy, Bias, and Risk inForecasting
The results presented above show that it is highly riskyto rely on travel demand forecasts to plan and implementlarge transportation infrastructure investments. Rail pas-senger forecasts are overestimated in out of cases, withan average overestimation above %. Half of all roadtraffic forecasts are wrong by more than ±%. Forecastshave not become more accurate over the past years. Thisstate of affairs points directly to better risk assessment and
management as something planners could and should do toimprove planning and decision making for transportationinfrastructure projects. Today, the benefit risks generatedby inaccurate travel demand forecasts are widely ignored orunderestimated in planning, just as cost risks are neglected(Flyvbjerg, Holm, et al., ).
When contemplating what planners can do to reduceinaccuracy, bias, and risk in forecasting, we need to distin-guish between two fundamentally different situations: ()Planners consider it important to get forecasts right, and() planners do not consider it important to get forecastsright, because optimistic forecasts are seen as a means togetting projects started. We consider the first situation inthis section and the second in the following one.
If planners genuinely consider it important to get fore-casts right, we recommend they use a new forecasting meth-od called “reference class forecasting” to reduce inaccuracyand bias. This method was originally developed to compen-sate for the type of cognitive bias in human forecasting thatPrinceton psychologist Daniel Kahneman found in hisNobel prize-winning work on bias in economic forecasting(Kahneman, ; Kahneman & Tversky, ). Referenceclass forecasting has proven more accurate than convention-al forecasting. For reasons of space, we present here only anoutline of the method, based mainly on Lovallo and Kahne-man () and Flyvbjerg (). In a different context weare currently developing what is, to our knowledge, the firstinstance of practical reference class forecasting in planning(U.K. Department for Transport, ).
Reference class forecasting consists in taking a so-called“outside view” on the particular project being forecast. Theoutside view is established on the basis of information froma class of similar projects. The outside view does not try toforecast the specific uncertain events that will affect theparticular project, but instead places the project in a statis-tical distribution of outcomes from this class of referenceprojects. Reference class forecasting requires the followingthree steps for the individual project:
. Identifying a relevant reference class of past proj-ects. The class must be broad enough to be statis-tically meaningful but narrow enough to be trulycomparable with the specific project.
. Establishing a probability distribution for theselected reference class. This requires access tocredible, empirical data for a sufficient number ofprojects within the reference class to make statis-tically meaningful conclusions.
. Comparing the specific project with the referenceclass distribution in order to establish the mostlikely outcome for the specific project.
Journal of the American Planning Association, Spring , Vol. , No.
Daniel Kahneman relates the following story aboutcurriculum planning to illustrate reference class forecastingin practice (Lovallo & Kahneman, , p. ). We usethis example because similar examples do not exist yet inthe field of city planning. Some years ago, Kahneman wasinvolved in a project to develop a curriculum for a new sub-ject area for high schools in Israel. The project was carriedout by a team of academics and teachers. In time, the teambegan to discuss how long the project would take to com-plete. Everyone on the team was asked to write on a slip ofpaper the number of months needed to finish and reportthe project. The estimates ranged from to months.One of the team members—a distinguished expert incurriculum development—was then posed a challenge byanother team member to recall as many projects similar totheirs as possible and to think of these projects in a stagecomparable to their own. “How long did it take them atthat point to reach completion?” the expert was asked. Aftera while he answered, with some discomfort, that not all thecomparable teams he could think of ever did complete theirtask. About % of them eventually gave up. Of those re-maining, the expert could not think of any that completedtheir task in less than years, nor of any that took morethan . The expert was then asked if he had reason to be-lieve that the present team was more skilled in curriculumdevelopment than the earlier ones had been. The expert saidno, he did not see any relevant factor that distinguishedthis team favorably from the teams he had been thinkingabout. His impression was that the present team was slightlybelow average in terms of resources and potential. The wisedecision at this point would probably have been for theteam to break up, according to Kahneman. Instead, themembers ignored the pessimistic information and pro-ceeded with the project. They finally completed it yearslater, and their efforts were largely wasted—the resultingcurriculum was rarely used.
In this example, the curriculum expert made twoforecasts for the same problem and arrived at very differentanswers. The first forecast was the inside view; the secondwas the outside view, or reference class forecast. The insideview is the one that the expert and the other team mem-bers adopted. They made forecasts by focusing tightly onthe case at hand, considering its objective, the resourcesthey brought to it, and the obstacles to its completion.They constructed in their minds scenarios of their comingprogress and extrapolated current trends into the future.The resulting forecasts, even the most conservative ones,were overly optimistic. The outside view is the one pro-voked by the question to the curriculum expert. It com-pletely ignored the details of the project at hand, and itinvolved no attempt at forecasting the events that would
influence the project’s future course. Instead, it examinedthe experiences of a class of similar projects, laid out arough distribution of outcomes for this reference class, andthen positioned the current project in that distribution.The resulting forecast, as it turned out, was much moreaccurate.
Similarly—to take an example from city planning—planners in a city preparing to build a new subway wouldfirst establish a reference class of comparable projects. Thiscould be the urban rail projects included in the sample forthis article. Through analyses the planners would establishthat the projects included in the reference class were indeedcomparable. Second, if the planners were concerned aboutgetting patronage forecasts right, they would then establishthe distribution of outcomes for the reference class regard-ing the accuracy of patronage forecasts. This distributionwould look something like the rail part of Figure . Third,the planners would compare their subway project to thereference class distribution. This would make it clear tothe planners that unless they had reason to believe they aresubstantially better forecasters and planners than their col-leagues who did the forecasts and planning for projects inthe reference class, they are likely to grossly overestimatepatronage. Finally, planners may then use this knowledgeto adjust their forecasts for more realism.
The contrast between inside and outside views hasbeen confirmed by systematic research (Gilovich et al.,). The research shows that when people are asked sim-ple questions requiring them to take an outside view, theirforecasts become significantly more accurate. However,most individuals and organizations are inclined to adoptthe inside view in planning major initiatives. This is theconventional and intuitive approach. The traditional wayto think about a complex project is to focus on the projectitself and its details, to bring to bear what one knows aboutit, paying special attention to its unique or unusual features,trying to predict the events that will influence its future.The thought of going out and gathering simple statisticsabout related cases seldom enters a planner’s mind. This isthe case in general, according to Lovallo and Kahneman(, pp. –). And it is certainly the case for traveldemand forecasting. Despite the many forecasts we havereviewed, we have not come across a single genuine refer-ence class forecast of travel demand. If our readers haveinformation about such forecasts, we would appreciatetheir feedback for our ongoing work on this issue.
Planners’ preference for the inside view over the out-side view, while understandable, is unfortunate. Whenboth forecasting methods are applied with equal skill, theoutside view is much more likely to produce a realisticestimate. That is because it bypasses cognitive and organ-
Flyvbjerg: How (In)accurate Are Demand Forecasts in Public Works Projects?
izational biases such as appraisal optimism and strategicmisrepresentation and cuts directly to outcomes. In theoutside view, planners and forecasters are not required tomake scenarios, imagine events, or gauge their own andothers’ levels of ability and control, so they cannot get anyof these things wrong. Surely the outside view, being basedon historical precedent, may fail to predict extreme out-comes, that is, those that lie outside all historical prece-dents. But for most projects, the outside view will producemore accurate results. In contrast, a focus on inside detailsis the road to inaccuracy.
The comparative advantage of the outside view is mostpronounced for nonroutine projects, understood as proj-ects that planners and decision makers in a certain localehave never attempted before—like building an urban railsystem in a city for the first time, or a new major bridge ortunnel where none existed before. It is in the planning ofsuch new efforts that the biases toward optimism and stra-tegic misrepresentation are likely to be largest. To be sure,choosing the right reference class of comparative past proj-ects becomes more difficult when planners are forecastinginitiatives for which precedents are not easily found, suchas the introduction of new and unfamiliar technologies.However, most large-scale transportation projects are bothnonroutine locally and use well-known technologies. Suchprojects are, therefore, particularly likely to benefit fromthe outside view and reference class forecasting. The sameholds for concert halls, museums, stadiums, exhibitioncenters, and other local one-off projects.
When Planners Are Part of theProblem, Not the Solution
In the present section, we consider the situation whereplanners and other influential actors do not find it impor-tant to get forecasts right and where planners, therefore, donot help to clarify and mitigate risk but instead generateand exacerbate it. Here planners are part of the problem,not the solution. This situation may need some explica-tion, because it might sound to many like an unlikely stateof affairs. After all, it may be agreed that planners ought tobe interested in being accurate and unbiased in forecasting.It is even stated as an explicit requirement in the AICPCode of Ethics and Professional Conduct that “A plannermust strive to provide full, clear and accurate informationon planning issues to citizens and governmental decision-makers” (American Planning Association, , A.), andwe certainly agree with the Code. The British Royal TownPlanning Institute () has laid down similar obligationsfor its members.
However, the literature is replete with things plannersand planning “must” strive to do, but which they don’t.Planning must be open and communicative, but often it isclosed. Planning must be participatory and democratic, butoften it is an instrument of domination and control. Plan-ning must be about rationality, but often it is about power(Flyvbjerg, ; Watson, ). This is the “dark side” ofplanning and planners identified by Flyvbjerg () andYiftachel (), which is remarkably underexplored byplanning researchers and theorists.
Forecasting, too, has its dark side. It is here that “plan-ners lie with numbers,” as Wachs () has aptly put it.Planners on the dark side are busy not with getting fore-casts right and following the AICP Code of Ethics but withgetting projects funded and built. And accurate forecastsare often not an effective means for achieving this objec-tive. Indeed, accurate forecasts may be counterproductive,whereas biased forecasts may be effective in competing forfunds and securing the go-ahead for construction. “Themost effective planner,” says Wachs (), “is sometimesthe one who can cloak advocacy in the guise of scientific ortechnical rationality” (p. ). Such advocacy would standin direct opposition to AICP’s ruling that “the planner’sprimary obligation [is] to the public interest” (AmericanPlanning Association, , B.). Nevertheless, seeminglyrational forecasts that underestimate costs and overestimatebenefits have long been an established formula for projectapproval (Flyvbjerg, Bruzelius, et al., ). Forecasting ishere mainly another kind of rent-seeking behavior, result-ing in a make-believe world of misrepresentation thatmakes it extremely difficult to decide which projects de-serve undertaking and which do not. The consequence, aseven one of the industry’s own organs, the Oxford-basedMajor Projects Association, acknowledges, is that too manyprojects proceed that should not. We would like to addthat many projects don’t proceed that probably should,had they not lost out to projects with “better” misrepre-sentation (Flyvbjerg, Holm, et al., ).
In this situation, the question is not so much whatplanners can do to reduce inaccuracy and risk in forecast-ing, but what others can do to impose on planners thechecks and balances that would give planners the incentiveto stop producing biased forecasts and begin to work ac-cording to their Code of Ethics. The challenge is to changethe power relations that govern forecasting and projectdevelopment. Better forecasting techniques and appeals toethics won’t do here; institutional change with a focus ontransparency and accountability is necessary.
Two basic types of accountability define liberal democ-racies: () public sector accountability through transparencyand public control, and () private sector accountability via
Journal of the American Planning Association, Spring , Vol. , No.
competition and market control. Both types of accountabil-ity may be effective tools to curb planners’ misrepresenta-tion in forecasting and to promote a culture that acknowl-edges and deals effectively with risk. In order to achieveaccountability through transparency and public control, thefollowing would be required as practices embedded in therelevant institutions:
• National-level government should not offer discre-tionary grants to local infrastructure agencies for thesole purpose of building a specific type of infrastruc-ture, for instance rail. Such grants create perverse in-centives. Instead, national government should simplyoffer “infrastructure grants” or “transportation grants”to local governments and let local political officialsspend the funds however they choose, but ensure thatevery dollar they spend on one type of infrastructurereduces their ability to fund another.
• Forecasts should be made subject to independent peerreview. Where large amounts of taxpayers’ money areat stake, such review may be carried out by national orstate accounting and auditing offices, like the GeneralAccounting Office in the U.S. or the National AuditOffice in the U.K., who have the independence andexpertise to produce such reviews. Other types of inde-pendent review bodies may be established, for instancewithin national departments of finance or with rele-vant professional bodies.
• Forecasts should be benchmarked against comparableforecasts, for instance using reference class forecastingas described in the previous section.
• Forecasts, peer reviews, and benchmarkings should bemade available to the public as they are produced, in-cluding all relevant documentation.
• Public hearings, citizen juries, and the like should beorganized to allow stakeholders and civil society tovoice criticism and support of forecasts. Knowledgegenerated in this way should be integrated in planningand decision making.
• Scientific and professional conferences should beorganized where forecasters would present and defendtheir forecasts in the face of colleagues’ scrutiny andcriticism.
• Projects with inflated benefit-cost ratios should bereconsidered and stopped if recalculated costs andbenefits do not warrant implementation. Projects withrealistic estimates of benefits and costs should berewarded.
• Professional and occasionally even criminal penaltiesshould be enforced for planners and forecasters whoconsistently and foreseeably produce deceptive fore-
casts. An example of a professional penalty would bethe exclusion from one’s professional organization forviolating its code of ethics. An example of a criminalpenalty would be punishment as the result of prosecu-tion before a court or similar legal body, for instancewhere deceptive forecasts have led to substantial mis-management of public funds (Garett & Wachs, ).Malpractice in planning should be taken as seriously asit is in other professions. Failure to do this amounts tonot taking the profession of planning seriously.
In order to achieve accountability in forecasting viacompetition and market control, the following would berequired, again as practices that are both embedded in andenforced by the relevant institutions:
• The decision to go ahead with a project should, whereat all possible, be made contingent on the willingnessof private financiers to participate without a sovereignguarantee for at least one third of the total capitalneeds. This should be required whether projects passthe market test or not; that is, whether projects aresubsidized or not or provided for reasons of socialjustice or not. Private lenders, shareholders, and stockmarket analysts would produce their own forecasts orwould critically monitor existing ones. If they werewrong about the forecasts, they and their organizationswould be hurt. The result would be more realistic fore-casts and reduced risk.
• Full public financing or full financing with a sovereignguarantee should be avoided.
• Forecasters and their organizations must share finan-cial responsibility for covering benefit shortfalls (andcost overruns) resulting from misrepresentation andbias in forecasting.
• The participation of risk capital should not mean thatgovernment gives up or reduces control of the project.On the contrary, it means that government can moreeffectively play the role it should be playing, namely asthe ordinary citizen’s guarantor of safety, environmen-tal quality, risk management, and a proper use ofpublic funds.
If the institutions with responsibility for developingand building major transportation infrastructure projectswould effectively implement, embed, and enforce suchmeasures of accountability, then the misrepresentationin transportation forecasting, which is widespread today,might be mitigated. If this is not done, misrepresentation islikely to continue, and the allocation of funds for transpor-tation investments is likely to be wasteful.
Flyvbjerg: How (In)accurate Are Demand Forecasts in Public Works Projects?
Conclusions
We conclude that the patronage estimates used byplanners of rail infrastructure development are highly, sys-tematically, and significantly misleading (inflated). Thisresults in large benefit shortfalls for rail projects. For roadprojects the problem of misleading forecasts is less severeand less one sided than for rail. But even for roads, for halfthe projects the difference between actual and forecastedtraffic is more than ±%. On this background, plannersand decision makers are well advised to take with a grain ofsalt any traffic forecast that does not explicitly take into ac-count the uncertainty of predicting future traffic. For railpassenger forecasts, a grain of salt may not be enough.
The risks generated from misleading forecasts are typi-cally ignored or downplayed in infrastructure planning, tothe detriment of social and economic welfare. Risks, there-fore, have a doubly negative effect in this particular type ofplanning, since it is one thing to take on a risk that one hascalculated and is prepared to take, much as insurance com-panies and professional investors do, while it is quite an-other matter—one that moves risk-taking to a differentand more problematic level—to ignore risks altogether.This is especially the case when risks are of the magnitudewe have documented here, with many demand forecastsbeing off by more than % on investments that measurein hundreds of millions of dollars. Such behavior is boundto produce losers among those financing infrastructure, bethey tax payers or private investors. If the losers or, for fu-ture projects, potential losers, want to protect themselves,then our study shows that the risk of faulty forecasts, andrelated risk assessment and management, must be placed atthe core of planning and decision making. Our goal withthis article has been to take a first step in this direction bydeveloping the necessary data and approach.
The policy implications of our findings are clear. First,the findings show that a major planning and policy prob-lem—namely misinformation—exists for this highly expen-sive field of public policy. Second, the size and perseveranceover time of the problem of misinformation indicate that itwill not go away by merely pointing out its existence andappealing to the good will of project promoters and plan-ners to make more accurate forecasts. The problem of mis-information is an issue of power and profit and must bedealt with as such, using the mechanisms of transparencyand accountability we commonly use in liberal democraciesto mitigate rent-seeking behavior and the misuse of power.To the extent that planners partake in rent-seeking behaviorand misuse of power, this may be seen as a violation of theircode of ethics—that is, malpractice. Such malpracticeshould be taken seriously by the responsible institutions.
Failing to do so amounts to not taking the profession ofplanning seriously.
AcknowledgmentsThe authors wish to thank Daniel Kahneman, Dan Lovallo, Don Pick-rell, James Ryan, Martin Wachs, the JAPA editors, and four anonymousreferees for their valuable help. Research for the article was supported bythe Danish Transportation Council and Aalborg University, Denmark.
Notes. All projects that we know of for which comparable data on forecastedand actual traffic were obtainable were considered for inclusion in thesample. This was projects, of which were then rejected becauseof unclear or insufficient data quality. More specifically, of the proj-ects rejected, were rejected because inaccuracy had been estimated inways different from and incomparable to the way we decided to estimateinaccuracy; projects were rejected because inaccuracies for these proj-ects had been estimated on the basis of adjusted data for actual trafficinstead of using original, actual count data as we decided to do. Allprojects for which valid and reliable data were available were included inthe sample. This covers both projects for which we ourselves collectedthe data, and projects for which other researchers in other studies didthe data collection. Our own data collection concentrated on largeEuropean projects, because too few data existed for this type of projectto allow comparative studies. We collected primary data on the accuracyof traffic forecasts for projects in Denmark, France, Germany, Swed-en, and the U.K. and were thus able to increase by many times thenumber of large European projects with reliable data for both actual andestimated traffic, allowing for the first time comparative studies for thistype of project where statistical methods can be applied. Other projectswere included in the sample from the following studies: Webber ();Hall (); National Audit Office (, ); Fouracre, Allport, andThomson (); Pickrell (); Walmsley and Pickett (); Skamris(); and Vejdirektoratet (). Statistical tests showed no differencesbetween data collected through our own surveys and data collected fromthe studies carried out by other researchers.. The figures mentioned here should be interpreted with caution. With-out a published report for the FTA study, it is difficult to evaluate theassumptions behind the study and thus the validity and comparability ofits results. When the study report has been published, such evaluationshould be possible.. We find that the estimated quantities are better than the actualquantities as a measure for project size in the evaluation of inaccuracy,because the estimates are what is known about size at the time of deci-sion to build (and the time of making the forecasts), and using actualquantities would result in the mixing of cause and effect.. As in the other parts of our analyses, we include here both projects forwhich we ourselves collected primary data and projects for which otherresearchers did the data collection as part of other studies, which we thenused as secondary sources. Again, our own data collection concentratedon large European projects, because data were particularly wanting forthis project type. By means of a survey questionnaire and meetings withproject managers, we collected primary data on causes of inaccuratetraffic forecasts for projects, while we collected secondary data for
projects from the following studies: Webber (), Hall (), Nation-al Audit Office (), Fouracre et al. (), Pickrell (), Wachs(), Leavitt et al. (), U.K. Department for Transport (),Skamris (), and Vejdirektoratet ().
Journal of the American Planning Association, Spring , Vol. , No.
. The closest we have come to an outside view on travel demandforecasts is Gordon and Wilson’s () use of regression analysis onan international cross section of light-rail projects to forecast patronagein a number of light-rail schemes in North America.. The lower limit of a one-third share of private risk capital for suchcapital to effectively influence accountability is based on practical expe-rience. See more in Flyvbjerg, Bruzelius, and Rothengatter (, pp.–).
ReferencesAmerican Planning Association. (). AICP code of ethics and profes-sional conduct (adopted October , amended October ). RetrievedNovember, , from http://www.planning.org/ethics/conduct.htmlAmerican Public Transit Association. (). Off track: Response of theAmerican Public Transit Association to the UMTA report “Urban railtransit projects: Forecast versus actual ridership and costs.” Washington,DC: Author.Ascher, W. (). Forecasting: An appraisal for policy-makers and plan-ners. Baltimore: Johns Hopkins University Press.Brooks, J. A., & Trevelyan, P. J. (). Before and after studies forinter-urban road schemes. In Planning and Transport Research andComputation Co. Ltd., Highway planning and design: Proceedings ofseminar N held at the PTRC summer annual meeting, University ofWarwick, England from – July (pp. –). London: PTRCEducation and Research Services Ltd.Flyvbjerg, B. (). The dark side of planning: Rationality and Real-rationalität. In S. Mandelbaum, L. Mazza, & R. Burchell (Eds.), Explor-ations in planning theory (pp. –). New Brunswick, NJ: Center forUrban Policy Research Press.Flyvbjerg, B. (). Rationality and power: Democracy in practice.Chicago: University of Chicago Press.Flyvbjerg, B. (, December). Delusions of success: Comment onDan Lovallo and Daniel Kahneman. Harvard Business Review, –.Flyvbjerg, B. (). On measuring the inaccuracy of travel forecasts:Methodological considerations. Manuscript submitted for publication.Flyvbjerg, B., Bruzelius, N., & Rothengatter, W. (). Megaprojectsand risk: An anatomy of ambition. Cambridge, UK: Cambridge Univer-sity Press.Flyvbjerg, B., Holm, M. K. S., & Buhl, S. L. (). Cost underesti-mation in public works projects: Error or lie? Journal of the AmericanPlanning Association, (), –.Flyvbjerg, B., Holm, M. K. S., & Buhl, S. L. (). How common andhow large are cost overruns in transport infrastructure projects? TransportReviews, (), –.Flyvbjerg, B., Holm, M. K. S., & Buhl, S. L. (). What causes costoverrun in transport infrastructure projects? Transport Reviews, (), –.Fouracre, P. R., Allport, R. J., & Thomson, J. M. (). The per-formance and impact of rail mass transit in developing countries (TRRLResearch Report ). Crowthorne, UK: Transportation and RoadResearch Laboratory.Fullerton, B., & Openshaw, S. (). An evaluation of the TynesideMetro. In K. J. Button & D. E. Pitfield (Eds.), International railwayeconomics: Studies in management and efficiency (pp. –). Aldershot,UK: Gower.Garett, M., & Wachs, M. (). Transportation planning on trial: TheClean Air Act and travel forecasting. Thousand Oaks, CA: Sage.Gilovich, T., Griffin, D., & Kahneman, D. (Eds.). (). Heuristicsand biases: The psychology of intuitive judgment. Cambridge, UK: Cam-bridge University Press.
Gordon, P., & Wilson, R. (). The determinants of light-rail transitdemand: An international cross-sectional comparison. TransportationResearch A, A (), –.Hall, P. (). Great planning disasters. Harmondsworth, UK: PenguinBooks.Kahneman, D. (). New challenges to the rationality assumption.Journal of Institutional and Theoretical Economics, , –.Kahneman, D., & Tversky, A. (). Prospect theory: An analysis ofdecisions under risk. Econometrica, , –.Kain, J. F. (). Deception in Dallas: Strategic misrepresentation inrail transit promotion and evaluation. Journal of the American PlanningAssociation, (), –.Leavitt, D., Ennis, S., & McGovern, P. (). The cost escalation of railprojects: Using previous experience to re-evaluate the CalSpeed estimates(Working Paper No. ). Berkeley: University of California, Berkeley,Institute of Urban and Regional Development.Lovallo, D., & Kahneman, D. (, July). Delusions of success: Howoptimism undermines executives’ decisions. Harvard Business Review,–.Mackinder, I. H., & Evans, S. E. (). The predictive accuracy of Brit-ish transportation studies in urban areas (Supplementary Report ).Crowthorne, UK: Transportation and Road Research Laboratory.Maldonado, J. (). Strategic planning: An approach to improving airportplanning under uncertainty. Unpublished master’s thesis, MassachusettsInstitute of Technology, Cambridge, MA.Mierzejewski, E. A. (). A new strategic urban transportation planningprocess. University of South Florida, Center for Urban TransportationResearch.National Audit Office. (). Department of transport: Expenditure onmotorways and trunk roads. London: Author.National Audit Office. (). Department of Transport, Scottish Devel-opment Department and Welsh Office: Road planning. London: HerMajesty’s Stationary Office.National Audit Office. (). Department of Transport: Contracting forroads. London: Author.National Audit Office. (). PFI: Construction performance (Reportby the Comptroller and Auditor General HC Session –).London: Author.Pickrell, D. H. (). Urban rail transit projects: Forecast versus actualridership and cost. Washington, DC: U.S. Department of Transportation.Richmond, J. E. D. (). New rail transit investments: A review.Cambridge, MA: Harvard University, John F. Kennedy School ofGovernment.Royal Town Planning Institute. (). Code of professional conduct.Retrieved November, , from http://www.rtpi.org.uk/about-the-rtpi/codecond.pdfRyan, J. (, January ). Predicted and actual ridership for recent newstarts projects (P–). Presentation at the rd Annual TRB Meeting,Session , Washington, DC.Skamris, M. K. (). Large transportation projects: Forecast versus actualtraffic and costs (Report No. ). Aalborg: Aalborg University, Depart-ment of Development and Planning.Thompson, L. S. (, March–April). Trapped in the forecasts: Aneconomic field of dreams. TR News, .U.K. Department for Transport. (). Comparison of forecast andobserved traffic on trunk road schemes. London: Author.U.K. Department for Transport. (). Procedures for dealing withoptimism bias in transport planning: Guidance document. London:Author. Available at http://www.dft.gov.uk/stellent/groups/dft_localtrans/documents/page/dft_localtrans_.hcsp
Flyvbjerg: How (In)accurate Are Demand Forecasts in Public Works Projects?
Vejdirektoratet. (). Notat om anlægsregnskaber. Copenhagen: DanishRoad Directorate.Wachs, M. (). Technique vs. advocacy in forecasting: A study ofrail rapid transit. Urban Resources, (), –.Wachs, M. (). When planners lie with numbers. Journal of theAmerican Planning Association, (), –.Wachs, M. (). Ethics and advocacy in forecasting for public policy.Business and Professional Ethics Journal, (–), –.Walmsley, D. A., & Pickett, M. W. (). The cost and patronage ofrapid transit systems compared with forecasts (Research Report ).Crowthorne, UK: Transportation and Road Research Laboratory.Watson, V. (). Conflicting rationalities: Implications for planningtheory and ethics. Planning Theory and Practice, (), –.
Webber, M. M. (). The BART experience: What have we learned?(Monograph No. ). Berkeley: University of California, Berkeley,Institute of Transportation Studies.World Bank. (). Urban transportation: A World Bank policy study.Washington, DC: Author.World Bank. (). World development report : Infrastructure fordevelopment. Oxford, UK: Oxford University Press.Yiftachel, O. (). Planning and social control: Exploring the darkside. Journal of Planning Literature, (), –.Zhao, Y., & Kockelman, K. M. (). The propagation of uncertaintythrough travel demand models: An exploratory analysis. Annals of Re-gional Science, (), –.
Journal of the American Planning Association, Spring , Vol. , No.
Environmental Resource Center at the University of Illinois’s School of Public Health
2005 Housing & Urban Development Training ProgramIn the last 10 years, the Great Lakes Center has worked with USEPA and USDHUD to train over 1,500 local government andPublic Housing Authority officials. GLC courses are unique in that they not only offer many expert speakers, but also includeinteractive exercises and field trips. The following courses are being offered this year:
Orientation to Environmental Assessment 4/18–22 & 9/19–23(Chicago), 6/6–10 (LA)Environmental responsibilities under NEPA and other authorities have been delegated to local governments for many HUDprograms, such as Community Development Block Grant, HOME, subsidized and public housing (see 24 CFR 58). Wheneverfederal money is spent, the responsible entity must complete an environmental review. This course uses an interactive simula-tion and problems to teach participants how to conduct an environmental review in accordance with federal law, briefs themon more recent and relevant issues in the environmental field, and raises the awareness and commitment to environmentalissues.
Energy Performance Contracting for PHAs 4/4–8, & 9/26–30 (Chicago)Energy Performance Contacting is one of the few vehicles where public housing agencies can generate revenue for theiroperations, and that is just a side benefit to lowering energy costs and making the dwelling units more comfortable. Thiscourse uses role-playing and a case study approach to give participants the tools to implement EPC in their own PHA.
Brownfield Redevelopment: Nuts & Bolts for Local Govt. 6/20–24 (Chicago) & 8/1–5 (Kansas City)Many urban centers have been left with vacant contaminated land that hinders redevelopment and restoration of a healthylocal economy and tax base. Participants learn how many communities have overcome obstacles and stimulated successfulredevelopment by working in concert with the private sector through a brownfield redevelopment plan to assemble parcels,characterize and clean them up, and attract private redevelopment.
Sustainable Development of Affordable and Public Housing August (Chicago) TBALearn how to incorporate sustainability into the design of affordable housing. Topics include stormwater management, energyefficiency, green materials, transportation, and historic preservation. This course will consist of three parts: case studies ofsustainable projects, talks by experts from the Chicago area, and interactive exercises.
Midwest Summit on the Sustainable Redevelopment of Brownfields 9/14–15 (Quad Cities IA-IL)This 2-day summit includes cutting-edge speakers on sustainable design and resources to overcome the barriers to sustainabil-ity, as well as interactive charettes to apply these principles to site and building design. In 2003 over 100 participants attendedthis highly rated conference.
Anyone interested in registering should contact the Great Lakes Center of the University of Illinois at 312-996-6904, or visittheir website at http:128.248.232.70/glakes/ce (see Housing & Urban Development). Class size is limited. The course agendasmay be viewed by following links from http://www.hud.gov/local/il/working/environtrain.cfm. Questions on the courseshould be referred to Eugene Goldfarb, former Midwest Environmental Officer at HUD, at [email protected] or Steve Vahl,(HUD) Illinois Environmental Officer, at [email protected].


