Embed Size (px)
Citation preview
NA
TIO
NA
LO
CEA
NICAND ATMOSPHERIC
ADM
INIS
TR
AT
IONU
.S. D
EPARTMENT OF COMMERCE
How is yourMPA doing?
A Guidebook of Natural and Social Indicators for Evaluating
Marine Protected Area Management Effectiveness
Robert S. PomeroyJohn E. Parks
Lani M. Watson
IUCNProgramme on
Protected Areas

How is your MPA doing?A Guidebook of
Natural and Social Indicators for Evaluating
Marine Protected Area Management Effectiveness
Robert S. Pomeroy
John E. Parks
Lani M. Watson
IUCN – The World Conservation Union2004
The designation of geographical entities in this book, and the presentation of the material, do not implythe expression of any opinion whatsoever on the part of IUCN, World Wide Fund for Nature (WWF),National Oceanic and Atmospheric Administration (NOAA) National Ocean Service, or other participat-ing organizations concerning the legal status of any country, territory, or area, or of its authorities, orconcerning the delimitation of its frontiers or boundaries.
The views expressed in this publication do not necessarily reflect those of IUCN, WWF, NOAA NationalOcean Service, or other participating organizations.
This publication has been made possible in part by funding from The David and Lucile PackardFoundation, NOAA National Ocean Service, and WWF.
Published by: IUCN, Gland, Switzerland and Cambridge, UK.
Copyright: © 2004 International Union for Conservation of Nature and Natural Resources
Reproduction of this publication for educational or other non-commercial purposes isauthorized without prior written permission from the copyright holder provided thesource is fully acknowledged.
Reproduction of this publication for resale or other commercial purposes is prohibitedwithout prior written permission of the copyright holder.
Citation: Pomeroy, R.S., Parks, J.E. and Watson, L.M. (2004). How is your MPA doing? AGuidebook of Natural and Social Indicators for Evaluating Marine Protected AreaManagement Effectiveness. IUCN, Gland, Switzerland and Cambridge, UK. xvi + 216 pp.
ISBN: 2-8317-0735-8
Designed by: Tony Eckersley
Typeset by: The Botanical Information Co. Ltd, UK
Cover photos: Back (clockwise from top): Toni Parras, David Sheppard/IUCN, John Parks; Front (from top): NOAA Photo Library, © WWF-Canon/Mark Edwards, Toni Parras
Produced by: IUCN Publications Services Unit
Printed by: Thanet Press Ltd, Margate, UK
Available from: IUCN Publications Services Unit219c Huntingdon Road, Cambridge CB3 0DL United KingdomTel: +44 1223 277894, Fax: +44 1223 277175E-mail: [email protected]/bookstore
A catalogue of IUCN publications is also available
The text of this book is printed on Fineblade Smooth 115gsm made from low chlorine pulp.
NA
TIO
NA
LO
CEA
NICAND ATMOSPHERIC
ADM
INIS
TR
AT
IONU
.S. D
EPARTMENT OF COMMERCE
Foreword viiPreface ixIntroduction 1
Purpose of this guidebook 1Why evaluate management effectiveness? 1What is ‘management effectiveness’? 3Things for you to consider when using this guidebook 5How to use this guidebook 7
SECTION 1. THE EVALUATION PROCESS
Chapter 1. Selecting your indicators 151-1 Identify your MPA goals and objectives 151-2 Match relevant indicators to your MPA goals and objectives 171-3 Review and prioritize the indicators identified 171-4 Identify how the selected indicators relate to one another 18
Chapter 2. Planning your evaluation 212-1 Assess resource needs for measuring your indicators 212-2 Determine the audience(s) who will receive the evaluation results 232-3 Identify who should participate in the evaluation 242-4 Develop a timeline and a workplan for the evaluation 26
Chapter 3. Conducting your evaluation 273-1 Implement your evaluation workplan 273-2 Collect data 283-3 Manage collected data 303-4 Analyse collected data 323-5 Encourage peer review and independent evaluation of results 34
Chapter 4. Communicating results and adapting management 374-1 Share results with target audiences 374-2 Use results to adapt management strategies 40
Other considerations 42
References. Works cited in Section 1 and other useful materials 43
SECTION 2. THE MPA MANAGEMENT EFFECTIVENESS INDICATORS
The biophysical indicators 49The socio-economic indicators 113The governance indicators 163
Appendix. The MPA pilot sites 205Glossary 213
v
Contents
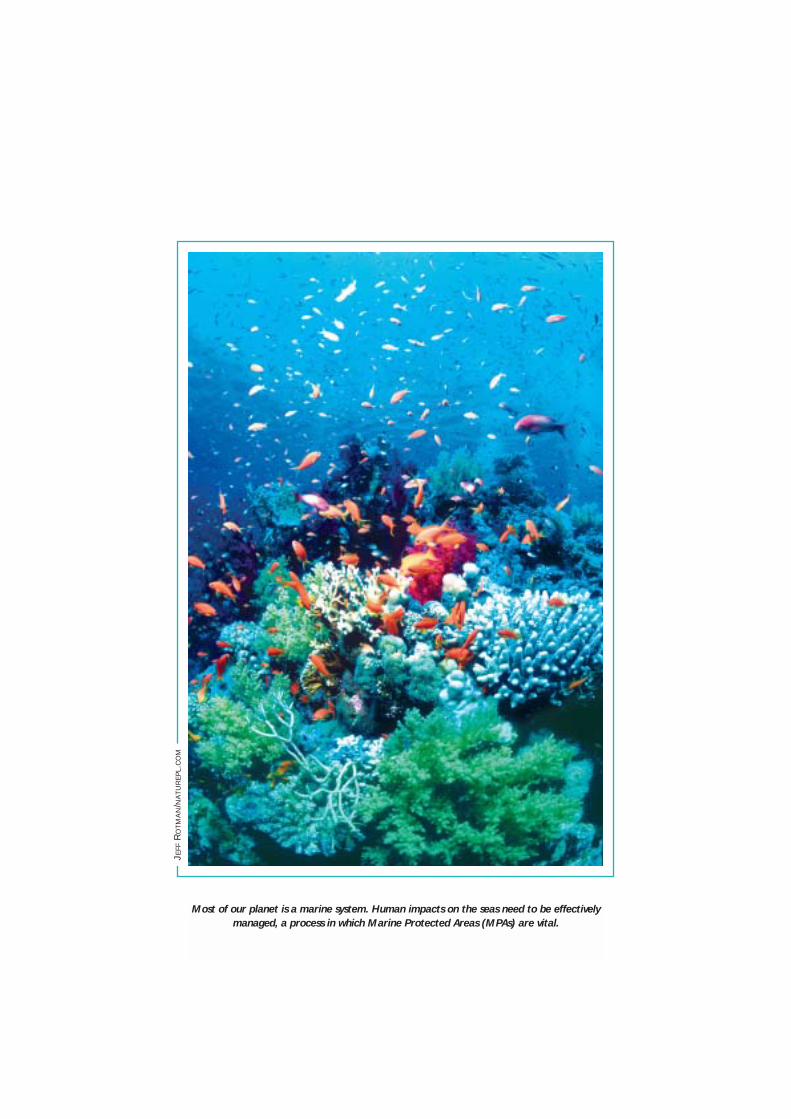
Most of our planet is a marine system. Human impacts on the seas need to be effectively
managed, a process in which Marine Protected Areas (MPAs) are vital.
JEFF
RO
TM
AN
/NA
TU
RE
PL.
CO
M
Management of the world’s ocean resources and habitats is enteringa new phase. A key outcome of the 2002 World Summit onSustainable Development was the commitment to establish
“… marine protected areas consistent with international law and based onscientific information, including representative networks, by 2012”. Thisoutcome translated a long-standing goal of the IUCN World Commission onProtected Areas under its programme for the marine biome (WCPA Marine)into a political imperative. The challenge of establishing a representativesystem of marine protected areas (MPAs) is surpassed by the challenge thatthey are managed effectively over time. There is a long way to go in achievingthis goal, with less than 1% of the world’s ocean declared under marine pro-tected areas and fewer than 10% of marine protected areas that exist todayachieving their management goals and objectives (Kelleher et al., 1995).Ultimately, it is only by assuring their effective management that MPAs cancontribute to the ambitious overarching goals of biodiversity conservation,sustainable use of marine resources, and an improved quality of life for coastalcommunities.
Marine protected areas are established for a wide range of purposes, includingprotecting marine species and habitats, conserving marine biodiversity, restor-ing fisheries stocks, managing tourism activities, and minimizing conflictsamong diverse resource users. To achieve these goals, specific and measurableobjectives must be defined in terms of what outputs and outcomes are beingsought. This in turn requires that well-defined management plans be devel-oped, measures of MPA success be identified, impacts of management actionsbe monitored and evaluated, and that the results of these activities be fed backinto the planning process to revise objectives, plans and outcomes. In otherwords, MPAs need to be adaptively managed. It is only by deliberately inte-grating monitoring and evaluation into the overall MPA managementprocess that such benefits of adaptive management can be fully realized.
Too often in the past, protected area management has been assessed on thebasis of how much money has been spent, how many permits issued, howmany enforcement actions have been taken, or how many laws and regula-tions have been adopted. These ‘input’ measures may or may not necessarilybe indicative of management progress.
Evaluation consists of assessing whether the actions taken have produced thedesired results (outcomes and outputs), however they are defined. It is some-thing that many managers already do where the link between actions andconsequences can be simply observed.
But the link between action and outcome is often not so obvious. Faced withthe daily demands of their jobs, many managers are not able to systematicallymonitor and review the results of their efforts. In the absence of such reviews,however, money and other resources can be wasted on programmes that donot achieve their objectives. In a climate of ever-greater emphasis onperformance and value for money, managers must expect to come undergreater pressure to introduce systems for monitoring and evaluation that will:
❏ Promote and enable an adaptive approach to management wheremanagers learn from their own and others’ successes and failures; and
vii
Foreword
❏ Keep track of the consequent changes in management objectives andpractices so that people can understand how and why management isbeing undertaken in this way.
Governments, funding agencies and stakeholders who are to benefit fromMPAs are increasingly requiring information on management effectivenessthat will allow them to assess whether results are commensurate with theeffort and resources being expended and are in line with policy and manage-ment goals.
Managers are likely to experience greater support and trust when they provideinformation about what they are doing and what they are achieving.Management is therefore seen to be open and accountable.
Managers can also use the results of management effectiveness evaluations todevelop convincing requests for additional resources. Such proposals are morelikely to win support when they can be justified on the basis of evaluationresults.
In practice, evaluation results are usually used in more than one way.Information used by managers to improve their own performance (adaptivemanagement) can also be used for reporting (accountability), or lessonslearned by others can be used to improve future planning.
Regardless of what drives the process, evaluation should be seen primarily asa tool to assist managers in their work, not as a system for punishingmanagers for inadequate performance.
This initiative to improve the evaluation of management performance inmarine protected areas has evolved from the work of a larger IUCN/WCPAcollaboration on the management effectiveness of protected areas in allbiomes. This guidebook is the result of a close and productive partnershipbetween the programme for the marine biome of the IUCN WorldCommission on Protected Areas, the World Wide Fund for Nature, and the USNational Oceanic and Atmospheric Administration.
Charles “Bud” N. Ehler Simon CrippsVice-Chair DirectorWCPA Marine, and Director WWF Endangered NOAA-NOS International Seas ProgramProgram Office
MPA Management Effectiveness Initiative Leads
viii
Greetings. This publication represents over three years of work bydozens of people around the world, many of whom – like you – areMPA managers or practitioners of marine conservation and protec-
tion. It is our hope that you will find this guidebook useful in your challeng-ing position as a manager or conservation practitioner.
How the guidebook was developed
This guidebook was developed to help MPA managers and practitioners betterachieve the goals and objectives for which their MPA was created. The IUCNWorld Commission on Protected Areas under its programme for the marinebiome (WCPA Marine) and the World Wide Fund for Nature (WWF) bothwork throughout the world to support MPAs, their managers and con-stituents. In keeping with their missions, the two organizations jointlyformed the MPA Management Effectiveness Initiative (MPA MEI) in 2000with four main objectives: 1. develop a set of marine-specific natural andsocial indicators to evaluate MPA management effectiveness with expert inputfrom around the world; 2. develop a process for conducting an evaluation inthe form of an easy-to-use guidebook, incorporating insight and experiencefrom international peer review; 3. field-test and ground-truth a draft of theguidebook process and indicator methods at MPA sites operating in diverseconditions around the world; and 4. encourage and support managers andpractitioners to use the revised evaluation methodology and guidebook toadaptively manage their MPAs and increase effectiveness.
To accomplish these objectives a number of activities were conducted between2001 and 2003 to construct a product that was well grounded in both themarine and social sciences and includes real-world expertise and feedback bythose who work closest with MPAs as part of their careers, research or liveli-hood. These activities included:
❏ A survey of MPA goals and objectives from around the world, falling intothree primary categories: biophysical, socio-economic and governance(April–July 2001).
❏ Research on over 130 indicators used to measure various aspects of themarine environment and coastal communities, linking indicators torelevant MPA goals and objectives, and peer review of draft sets of goals,objectives and indicators (August–September 2001).
❏ Holding a workshop of 35 experts from 17 different countries, whoreviewed, evaluated and prioritized each of the potential indicators,resulting in a revised set of 52 indicators and information on eachindicator (Venezuela, October 2001).
❏ Refining and making 44 indicators operational by describing definitions,methods of measurement, and guidance on analysis of the results,followed by two rounds of peer review (November 2001–June 2002).
❏ Identifying and selecting volunteer MPA pilot sites to field-test the guide-book (February–May 2002).
❏ Preparation of the first draft of the book, and distribution to externalexperts and pilot sites for peer review (July–August 2002).
ix
PrefaceJ
OH
NP
AR
KS
❏ Revision of the draft guidebook based on external reviews and prepara-tion of a second draft for the pilot sites (August–September 2002).
❏ Holding of a training workshop with representatives from 20 MPA pilotprojects to learn how to use the guidebook and how to test the indicatorsin the field (Hawaii, September 2002).
❏ Field-testing of the guidebook at pilot sites (November 2002–April 2003).
❏ Revising the guidebook into a third draft and distributing this for finalpeer review (November 2002–March 2003).
❏ Completion of final revisions to the book based on reports from the MPApilot projects (April–July 2003).
❏ Sessions held at the Vth World Parks Congress in Durban, South Africato introduce the guidebook and case studies from field-testing(September 2003).
As you can see with this summary timeline, one of the most important activ-ities in the development of this guidebook was to ground-truth a draft versionby field-testing the evaluation process and indicators at different MPA pilotsites around the world (see the Appendix to learn more about these sites).This effort helped to ensure that the draft guidebook was realistic and appli-cable under real-world MPA conditions, or ‘in-the-water’ so to speak. Testingand revising the draft guidebook was also a way of involving many of thosewho work in MPAs everyday and deal with the daily pressures and demandsof managing these areas. These colleagues provided the necessary experienceand wealth of feedback to make the guidebook practical and as useful as it canbe for as many different types of MPAs as possible. In order to highlight someof this knowledge and experience, we have included actual results and exam-ples from the pilot sites.
Partners and sponsors
The IUCN World Commission on Protected Areas (WCPA) is one of sixCommissions of IUCN – The World Conservation Union and is the world'sleading global network of protected area specialists. It has over 1,200members from 140 countries. It is coordinated by a steering committee andorganized into 16 regions, two biomes (including marine), six theme areas(including management effectiveness) and nine task forces. The WCPA workprogramme is undertaken with the support and partnership of many organi-zations. WCPA’s programme for the marine biome (WCPA Marine) was estab-lished in 1986 with the goal of providing for the protection, restoration, wiseuse, understanding and enjoyment of the marine heritage of the world inperpetuity through the creation of a global, representative system of marineprotected areas and by building the capacity to manage these areas. The activ-ities of the WCPA Marine programme are conducted at national, regional andglobal levels to increase the management capacity of institutions and practi-tioners while building an effective network of globally representative MPAs.
The World Wide Fund For Nature (WWF) is one of the world's largest andmost experienced independent conservation organizations, with five million
x
TO
NY
EC
KE
RS
LEY
supporters and a global network of offices in more than 90 countries world-wide. WWF’s mission is to stop, and eventually reverse, the acceleratingdegradation of our planet’s natural environment, and to help build a future inwhich humans live in harmony with nature. To achieve this ambitious goal,WWF is working to conserve nature and ecological processes by preservinggenetic species and ecosystem diversity; to ensure that the use of renewablenatural resources is sustainable now and in the longer term, for the benefit ofall life on Earth; and to promote actions to reduce to a minimum the pollu-tion and the wasteful exploitation and consumption of resources and energy.WWF-International, based in Gland, Switzerland, leads and coordinates theWWF Network, develops joint policies and standards, fosters global partner-ships, and implements part of WWF’s international conservation programme.
National Ocean Service, National Oceanic and AtmosphericAdministration (NOS/NOAA). The National Ocean Service (NOS) is part ofthe National Oceanic and Atmospheric Administration (NOAA), USDepartment of Commerce (DOC). NOS views its role as the nation’s princi-pal advocate for coastal and ocean stewardship. It works to carry out this rolethrough a combination of scientific research; monitoring, observing andpredicting scientific phenomena; preserving and restoring ocean and coastalareas; establishing and enhancing the capacity of state and local governmentsto manage coastal resources; mapping and charting; and responding to spillsof hazardous substances. The NOS International Program Office (IPO) servesas the focal point for NOS-wide international activities and collaboration withnational and foreign government agencies, non-governmental organizations(NGOs), academic institutions and others. International activities are focusedon integrated coastal management; the management of marine protectedareas (MPAs); mitigation of impacts from climate change; safe, efficient andenvironmentally sound maritime navigation; the reduction of impacts fromnatural disasters; and capacity-building. In addition to IPO, the NOS Office ofCoastal Programs and the NOAA Coral Grants Program sponsored several ofthe pilot sites that field-tested this guidebook.
The David and Lucile Packard Foundation has supported the development ofthe MPA Management Effectiveness Initiative and has made possible thepublication of this guidebook for MPA managers and practitioners around theworld.
The authors
Robert S. Pomeroy is a marine resource economist and an internationallyrecognised expert on coastal and marine resource management and collabora-tive management. He is an Associate Professor in the Department ofAgricultural and Resource Economics and a Fisheries Extension Specialistwith the Connecticut Sea Grant College Program at the University ofConnecticut-Avery Point. He also serves as a Senior Conservation ResearchAssociate with the Community Conservation Network. He has held positionsas faculty at the Department of Applied and Agricultural Economics atClemson University, Senior Scientist at the International Center for LivingAquatic Resources Management, and Senior Coastal and Marine Associate inthe Biological Resources Program of the World Resources Institute.
xi
Pre
face
TO
NY
EC
KE
RS
LEY
Dr. Pomeroy has led numerous international research projects on fisheriesmanagement and aquaculture.
John E. Parks is an applied researcher who works through both the biologicaland behavioural sciences to better understand and improve the practice ofmarine conservation. He is a Research Associate with the CommunityConservation Network in Honolulu, Hawaii and a fellow with theEnvironmental Leadership Program. Previously, John served as a ResearchAssociate with the Biological Resources Program of the World ResourcesInstitute and as a Senior Program Officer with the Biodiversity SupportProgram of the World Wildlife Fund. John focuses principally on the adaptivemanagement of marine protected areas, the testing and appropriate use ofcommunity-led conservation in the Indo-Pacific, and exploring the role ofpsychology in addressing conservation questions.
Lani M. Watson is a marine ecologist and specializes in the management andprotection of the marine environment. She is an International AffairsSpecialist with the National Oceanic and Atmospheric AdministrationNational Ocean Service, where she began as a Knauss Sea Grant Fellow inMarine Policy. She works on domestic and international marine policy,management and protected area issues, and advises on applying managementeffectiveness evaluations and indicators in marine programmes. Lani is theProject Manager for the WCPA-Marine/WWF MPA Management EffectivenessInitiative.
Acknowledgements
This guidebook reflects an enormous group effort. Each of three drafts weredeveloped through collaboration with dozens of experts and practitioners fromnumerous organizations working in the fields of the natural and socialsciences and the science and management of marine protected areas andmarine conservation. The substantial support and contribution made by thesecolleagues greatly assisted in our writing and revising this guidebook. Wewould like to acknowledge the contributions of a number of individuals.
This guidebook is a product of the WCPA Marine/WWF MPA ManagementEffectiveness Initiative that is led by Charles “Bud” Ehler, Director of theInternational Program, NOS/NOAA, and Vice-Chair, WCPA Marine, andSimon Cripps, Director of the Endangered Seas Programme, WWFInternational. In addition to the authors and leads of the Initiative, a coreteam of the following NOAA and WWF staff dedicated significant time andskills to assist in all aspects of the Initiative, including the development ofthis guidebook: Miguel Jorge (WWF) provided guidance in the design anddevelopment of the Initiative and coordinated the WWF pilot sites and tech-nical assistance in field-testing this guidebook; Leah Bunce (NOAA) providedexpertise and reviewed the draft socio-economic indicators, facilitated anexpert group review of them, and assisted in training pilot sites in their use;Gonzalo Cid (NOAA) assisted in the pilot site selection, in the synthesis andanalysis of both external peer reviews and reports from pilot sites, and helpedin generating the guidebook, including lending his artistic and design talentson draft versions of the guidebook; Steve Morrison (NOAA) and Alison
xii
PA
RK
SC
AN
AD
AP
AR
KS
CA
NA
DA
Hammer (NOAA) developed the internet site for the Initiative(http://effectiveMPA.noaa.gov), which included developing profiles of the pilotsites and ensured that the hyperlinks throughout the guidebook are availableonline; Lisa Max (NOAA) assisted with the initial research conducted on thebiophysical goals, objectives and indicators.
As mentioned previously, field-testing was a critical step in making thisguidebook flexible enough for a wide range of MPAs. The people who servedas the project leads and represented the MPA pilot sites and managementteams devoted their enthusiasm, participation, and technical expertise inapplying the process and methods of the draft guidebook at their sites. Theirfindings, feedback and experiences are reflected in this published version. Wewould like to express our deep gratitude to the following pilot site representa-tives for their contributions to this text: Thorne Abbott (Bird Island MarineSanctuary and Sasanhaya Fish Reserve, CNMI), Antonio Araújo (BancD’Arguin National Park, Mauritania), Miguel Alamilla (Hol Chan MarineReserve, Belize), Sylvain Archambault (Saguenay-St. Lawrence Marine Park,Canada), Mohamed Ould Bouceif (Banc D’Arguin National Park, Mauritania),José Campoy (Upper Gulf of California and Colorado River Delta BiosphereReserve, Mexico), Erica Cochrane (Bird Island Marine Sanctuary andSasanhaya Fish Reserve, CNMI), Marco Costantini (Miramare MarineProtected Area, Italy), Nancy Dahl-Tacconi (Bunaken National Park andSebesi Marine Reserve, Indonesia), Marivel Dygico (Tubbataha Reef NationalMarine Park, Philippines), Simon Ellis (Lenger Island Marine Protected Area,Micronesia), Yimnang Golbuu (Ngemelis and Ngerumekaol, Palau), PabloGuerrero (Galapagos Islands Marine Reserve, Ecuador), Jay Gutiérrez (AchangReef Flat Preserve, Piti Bomb Holes Preserve and Tumon Bay Marine Reserve,Guam), Eugene Joseph (Lenger Island Marine Protected Area), SylvestorKazimoto (Mafia Island Marine Park, Tanzania), Rosa Maria Loreto (BancoChinchorro Biosphere Reserve, Mexico), Andrey Malyutin (Far East MarinePreserve, Russia), Jason Rubens (Mafia Island Marine Park, Tanzania), MurrayRudd (Achang Reef Flat Preserve, Piti Bomb Holes Preserve and Tumon BayMarine Reserve, Guam), Ileana Solares-Leal (Sian Ka’an Biosphere Reserve,Mexico), Jorge Torre (Loreto Bay National Park, Mexico), Mark Tupper(Achang Reef Flat Preserve, Piti Bomb Holes Preserve and Tumon Bay MarineReserve, Guam), and Anne Walton (Channel Islands National MarineSantuary, USA).
Much appreciation is extended to those who helped support the pilot projectsin their training and testing of the draft guidebook: Eileen Alicia, BerndCordes, Marcia Cota, Hans Herrman, Will Novy Hildesley, Jonathan Kelsey,Sergio Knaebel, Viveca Solomon May, Lynne Mersfelder-Lewis, WilliamMilhouser, Fatimah Taylor and Tara Wilkinson.
In addition, we have been fortunate to have significant guidance and feedbackfrom a number of international experts. The following individuals substan-tially contributed by participating in the selection and development of theindicators, attending work-sessions to review draft versions, providing criticalthought on each of the three draft versions of this guidebook. We thank thesecolleagues for their time and constructive feedback: Tundi Agardy, ErnestoArias-Gonzales, Sylvain Archambault, Antonio Araujo, Charles V. Barber,
xiii
Pre
face
Matt Brookhart, Leah Bunce, Georgina Bustamante, Ratana Chuenpagdee,Athline Clark, Tom Culliton, Gary Davis, Gerry Davis, Charlotte deFontaubert, José Ramon Delgado, Terry Donaldson, Terry Done, XabierElguezabal, Leanne Fernández, Carlos Garcia-Saez, Peter Graham, TimGoodspeed, Marc Hockings, Janice Hodge, Sylvester Kazimoto, GraemeKelleher, Richard Kenchington, William Kostka, Michael Mascia, DelphineMallert-King, Richard Margoluis, Tyler McAdam, Patrick McConney, ShielaMcKenna, Glenda Medina, Melanie McField, John Munro, John Ogden,Arthur Paterson, John Petterson, Richard Pollnac, Robert Rangely, CheriRecchia, Carlos Rivero Blanco, Jason Rubens, Enric Sala, Rodney Salm, LeonidShabad, Linda Shea Flanders, Vassily Spiridonov, Jack Sobel, Ed Tongson,Mark Tupper, Andre Jon Uychiaco, Carlos Valle, Estrella Villamizar, KuperanViswanathan, John Waugh, Sue Wells, Alan White, Meriwether Wilson andDoug Yurick. We would like to especially thank Terry Done, Michael Mascia,Shiela McKenna and Richard Pollnac who put in significant hours reviewingthe drafts of this guidebook and working with the authors.
The production of this guidebook would not have been possible without theIUCN Publications Services Unit and colleagues, who were a pleasure to workwith. Elaine Shaughnessy provided much guidance on the overall production;Katherine Mann and Tiina Rajamets provided the content edit, and we thankTony Eckersley for the design, which made the guidebook user-friendly.Thanks also to Toni Parras for the use of her beautiful photographs.
The opinions expressed are those of the authors. Any errors or omissionsincluded in the text are the sole responsibility of the authors and should bereported to them accordingly.
A few points to keep in mind
We’d like to ask you to think of this guidebook as a map that is meant to guideyou down the general path of evaluating your MPA, but that does not try topredict every step along the way. We recommend that you use this guidebookalong with other sources and methodologies that offer alternate routes orshort cuts for your particular needs. It is our hope that this guidebook willprovide a complementary resource that helps people reach their final destina-tion: a completed evaluation with results that enable them to adaptivelymanage and improve MPAs.
The aim of this guidebook is to be as practical and applicable as possible, sothat it can be used by many different MPA managers and conservation practi-tioners in varying types of MPAs. Therefore, the methodologies presented inthis guidebook have been chosen to reflect more approachable, rather than themost advanced, scientific methods. As such, the data collection and analysistechniques lean towards simplicity, rather than complexity. We did this delib-erately so that this guidebook would be a starting point in helping MPAmanagers and conservation practitioners measure management effectiveness.Our vision is that someday soon, sufficient management capacity will existglobally to develop more advanced sets of measurement and analytical tech-niques. Until then, we hope that this guidebook strikes a balance for all thosewho apply it to their particular needs and resources.
xiv
JIM
TH
OR
SE
LL/IU
CN
One final, but critical, caveat: this guidebook is not intended to be used as ascorecard to compare one MPA site or groups of MPA sites to each other. Theevaluation process and indicators are intended for use in a positive way to helpmanagers and practitioners improve the management of MPAs by reachingtheir MPA goals and objectives more effectively and efficiently. The indicatorsshould highlight successes, as well as challenges, and the information shouldnot be used against an MPA or to negatively impact the support for any givenMPA.
In closing, we hope that the process described in this guidebook will berewarding for all involved. Although conducting an evaluation can seem likea daunting or mundane task, both others and we have learned that the evalu-ation process can foster much learning and even be fun. The evaluativeprocess can highlight both successes and failures, however the insight andclarity that can be gained are incentives for continuing such important workin marine management and conservation. We wish you a rewarding experi-ence and journey ahead.
Robert S. Pomeroy John E. Parks Lani M. Watson
xv
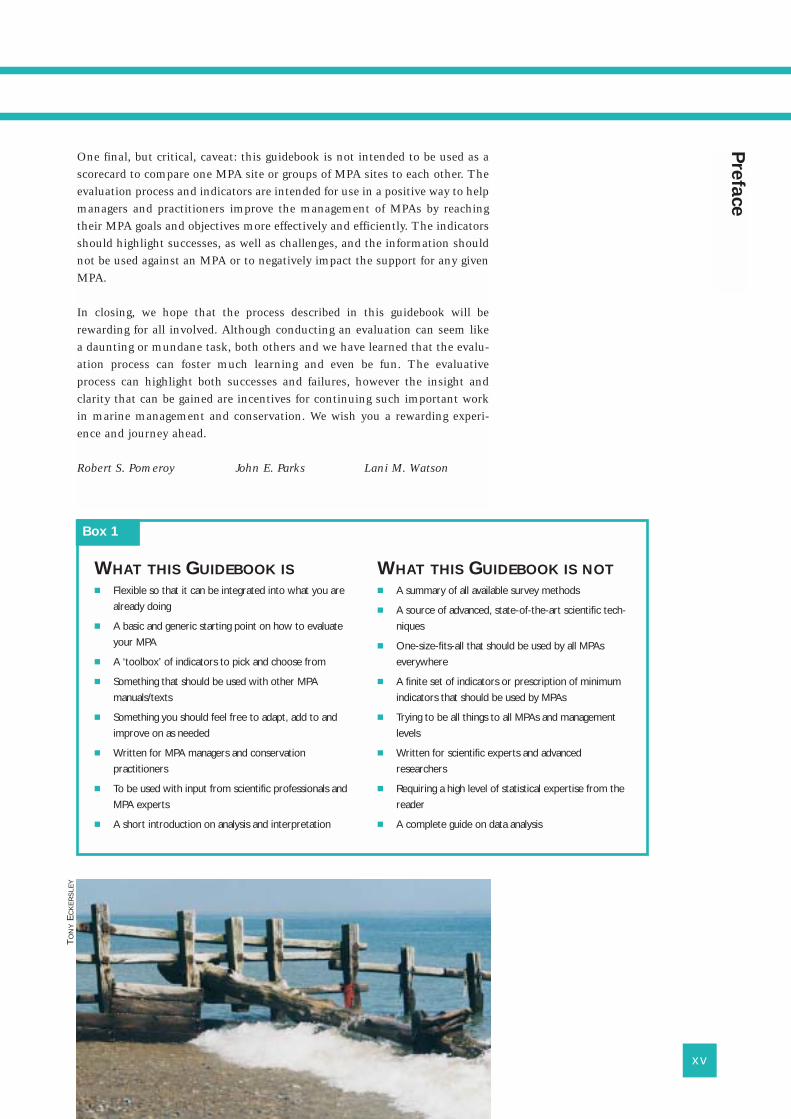
WHAT THIS GUIDEBOOK IS� Flexible so that it can be integrated into what you are
already doing
� A basic and generic starting point on how to evaluate
your MPA
� A ‘toolbox’ of indicators to pick and choose from
� Something that should be used with other MPA
manuals/texts
� Something you should feel free to adapt, add to and
improve on as needed
� Written for MPA managers and conservation
practitioners
� To be used with input from scientific professionals and
MPA experts
� A short introduction on analysis and interpretation
WHAT THIS GUIDEBOOK IS NOT� A summary of all available survey methods
� A source of advanced, state-of-the-art scientific tech-
niques
� One-size-fits-all that should be used by all MPAs
everywhere
� A finite set of indicators or prescription of minimum
indicators that should be used by MPAs
� Trying to be all things to all MPAs and management
levels
� Written for scientific experts and advanced
researchers
� Requiring a high level of statistical expertise from the
reader
� A complete guide on data analysis
Box 1
Pre
face
TO
NY
EC
KE
RS
LEY
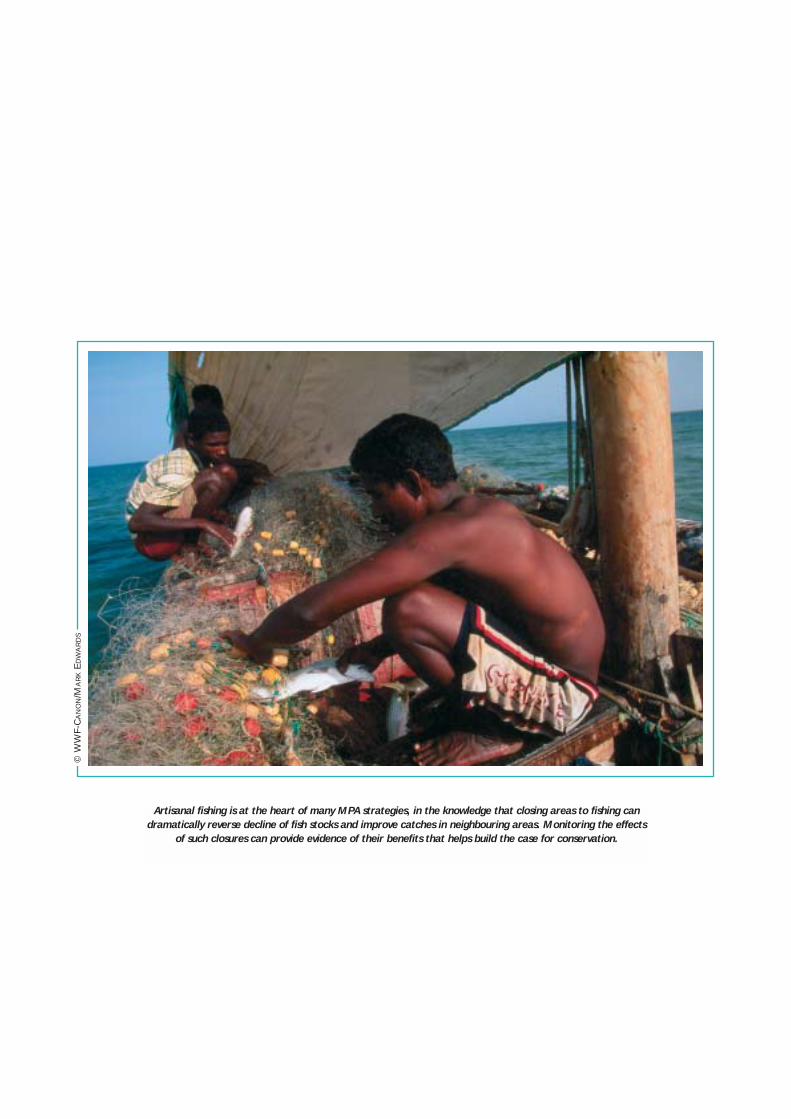
Artisanal fishing is at the heart of many MPA strategies, in the knowledge that closing areas to fishing can
dramatically reverse decline of fish stocks and improve catches in neighbouring areas. Monitoring the effects
of such closures can provide evidence of their benefits that helps build the case for conservation.
© W
WF-
CA
NO
N/M
AR
KE
DW
AR
DS
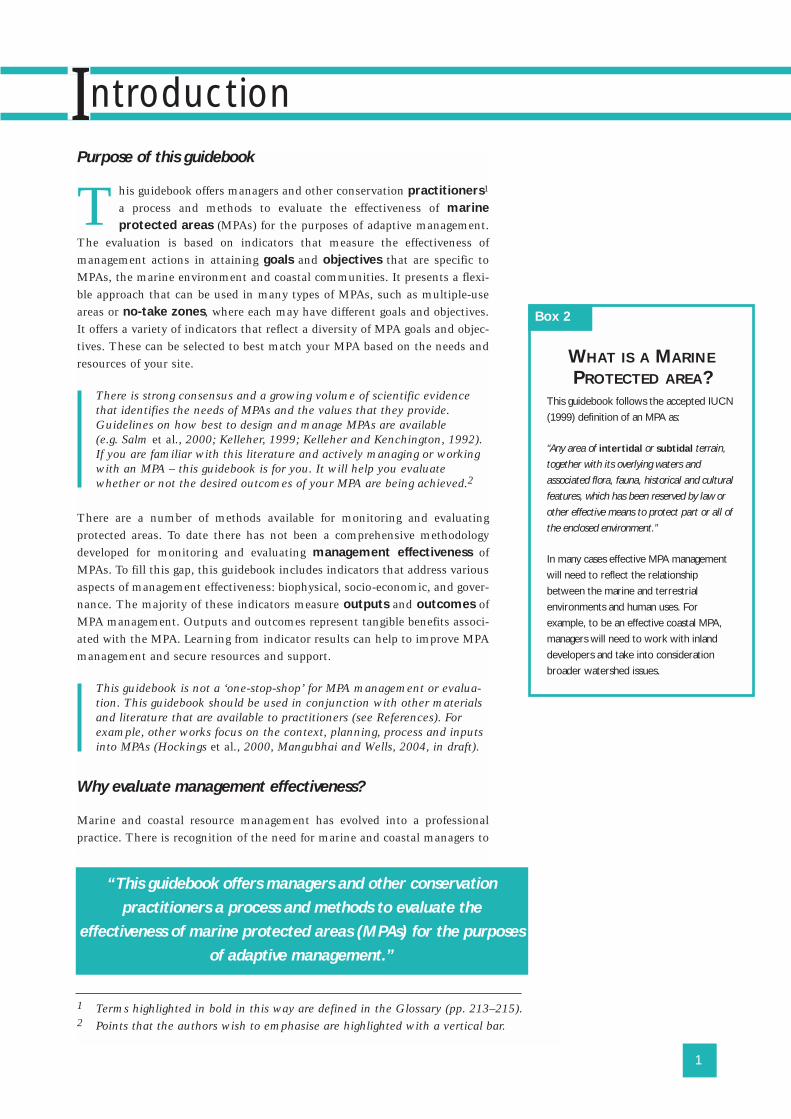
Purpose of this guidebook
This guidebook offers managers and other conservation practitioners1
a process and methods to evaluate the effectiveness of marineprotected areas (MPAs) for the purposes of adaptive management.
The evaluation is based on indicators that measure the effectiveness ofmanagement actions in attaining goals and objectives that are specific toMPAs, the marine environment and coastal communities. It presents a flexi-ble approach that can be used in many types of MPAs, such as multiple-useareas or no-take zones, where each may have different goals and objectives.It offers a variety of indicators that reflect a diversity of MPA goals and objec-tives. These can be selected to best match your MPA based on the needs andresources of your site.
There is strong consensus and a growing volume of scientific evidencethat identifies the needs of MPAs and the values that they provide.Guidelines on how best to design and manage MPAs are available(e.g. Salm et al., 2000; Kelleher, 1999; Kelleher and Kenchington, 1992).If you are familiar with this literature and actively managing or workingwith an MPA – this guidebook is for you. It will help you evaluatewhether or not the desired outcomes of your MPA are being achieved.2
There are a number of methods available for monitoring and evaluatingprotected areas. To date there has not been a comprehensive methodologydeveloped for monitoring and evaluating management effectiveness ofMPAs. To fill this gap, this guidebook includes indicators that address variousaspects of management effectiveness: biophysical, socio-economic, and gover-nance. The majority of these indicators measure outputs and outcomes ofMPA management. Outputs and outcomes represent tangible benefits associ-ated with the MPA. Learning from indicator results can help to improve MPAmanagement and secure resources and support.
This guidebook is not a ‘one-stop-shop’ for MPA management or evalua-tion. This guidebook should be used in conjunction with other materialsand literature that are available to practitioners (see References). Forexample, other works focus on the context, planning, process and inputsinto MPAs (Hockings et al., 2000, Mangubhai and Wells, 2004, in draft).
Why evaluate management effectiveness?
Marine and coastal resource management has evolved into a professionalpractice. There is recognition of the need for marine and coastal managers to
1
“This guidebook offers managers and other conservation
practitioners a process and methods to evaluate the
effectiveness of marine protected areas (MPAs) for the purposes
of adaptive management.”
This guidebook follows the accepted IUCN
(1999) definition of an MPA as:
“Any area of intertidal or subtidal terrain,
together with its overlying waters and
associated flora, fauna, historical and cultural
features, which has been reserved by law or
other effective means to protect part or all of
the enclosed environment.”
In many cases effective MPA management
will need to reflect the relationship
between the marine and terrestrial
environments and human uses. For
example, to be an effective coastal MPA,
managers will need to work with inland
developers and take into consideration
broader watershed issues.
1 Terms highlighted in bold in this way are defined in the Glossary (pp. 213–215).2 Points that the authors wish to emphasise are highlighted with a vertical bar.
Introduction
WHAT IS A MARINE
PROTECTED AREA?
Box 2
be more systematic in using MPAs to improve marine conservation learn-ing and create a set of best management practices. To meet this need, thereis general consensus among conservation practitioners that evaluation ofmanagement effectiveness will improve MPA practice. It is particularlyrelevant now given the focus on implementing MPAs and increasing theirnumber.
Effective management of MPAs requires continuous feedback of informa-tion to achieve objectives. The management process involves planning,design, implementation, monitoring, evaluation, communication andadaptation. Evaluation consists of reviewing the results of actions takenand assessing whether these actions are producing the desired outcomes.Evaluation is a routine part of the management process and is somethingthat most managers already do. The evaluation of management effective-ness builds on this existing routine.
The link between actions and outcomes is often not so obvious. Facedwith the daily demands of their jobs, many managers are not able toregularly and formally step back and reflect on the cumulative results of
their efforts. In the absence of such reflection, resources may be wasted andobjectives may not be achieved. The evaluation of management effectivenessprovides a formal way to learn from successes and failures and help peopleunderstand how and why management practices are being adapted.
Adaptive management is a fundamental concept underlying this guide-book. Adaptive management is the cyclical process of systematically testingassumptions, generating learning by evaluating the results of such testing,and further revising and improving management practices. The result of adap-tive management in a protected area context is improved effectiveness andincreased progress towards the achievement of goals and objectives.
Evaluation is often perceived as a difficult, excessive and overly technicalactivity that requires the involvement of outside ‘specialists’. For some, theword ‘evaluation‘ implies supervision, discipline and potential penalties. It isimportant to clearly communicate the reasons and benefits of doing amanagement effectiveness evaluation to both internal staff and external stake-holders. This will help you to focus on improving conservation success.
2
Key principles
The evaluation process in thisguidebook is founded on five keyprinciples. It must be:
� Useful to managers and stake-holders for improving MPAmanagement.
� Practical in use and cost.
� Balanced to seek and includescientific input and stakeholderparticipation.
� Flexible for use at different sitesand in varying conditions.
� Holistic through a focus onboth natural and humanperspectives.
The use of adaptive management in a conservation context is welldocumented in the literature (see References). An overview of the useof evaluation results for adaptive management of MPAs is included inChapter 4, Communicating results and adapting management.Materials on adaptive management can be found athttp://effectiveMPA.noaa.gov
“Learning from indicator results can help to improve MPA
management and secure resources and support.”
What is ‘management effectiveness’?
This guidebook builds on the IUCN management effectiveness framework(Hockings et al., 2000; see Box 3, The IUCN Management EffectivenessFramework). Management effectiveness is the degree to which managementactions are achieving the goals and objectives of a protected area. This allowsfor the improvement of protected area management through learning, adapta-tion, and the diagnosis of specific issues influencing whether goals and objec-tives have been achieved. It also provides a way to show accountability for themanagement of an MPA.
Evaluating the management effectiveness of protected areas is not an easytask. For example, despite the best management efforts natural disturbancescan radically alter ecosystems regardless of how well a protected area is beingmanaged. The evaluation needs to be appropriate and accurate in assessingthe degree of achievement directly linked to management actions.
In 1997, IUCN’s World Commission on Protected Areas (WCPA) createda task force of experts in protected area management from differentcountries to develop guidelines to measure and evaluate the effectivenessof management and provide tools to better understand and improve themanagement of protected areas worldwide. Following extensive research,work, and testing, the IUCN Task Force created a framework entitled“Evaluating Effectiveness: A Framework for Assessing the Managementof Protected Areas” (Hockings et al., 2000). See Box 3.
“This guidebook offers a variety of indicators that reflect a
diversity of MPA goals and objectives. These can be selected
to best match your MPA based on the needs and resources
of your site.”
Intro
du
ctio
n
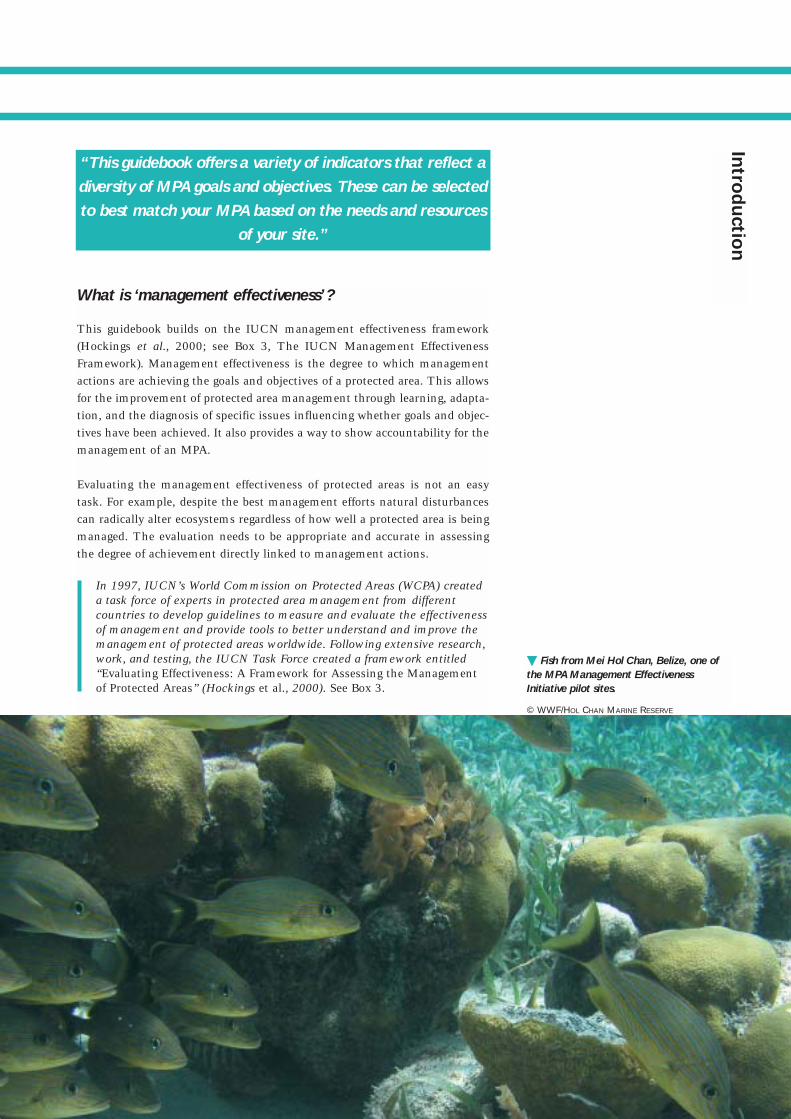
� Fish from Mei Hol Chan, Belize, one of
the MPA Management Effectiveness
Initiative pilot sites.
© WWF/HOL CHAN MARINE RESERVE
4
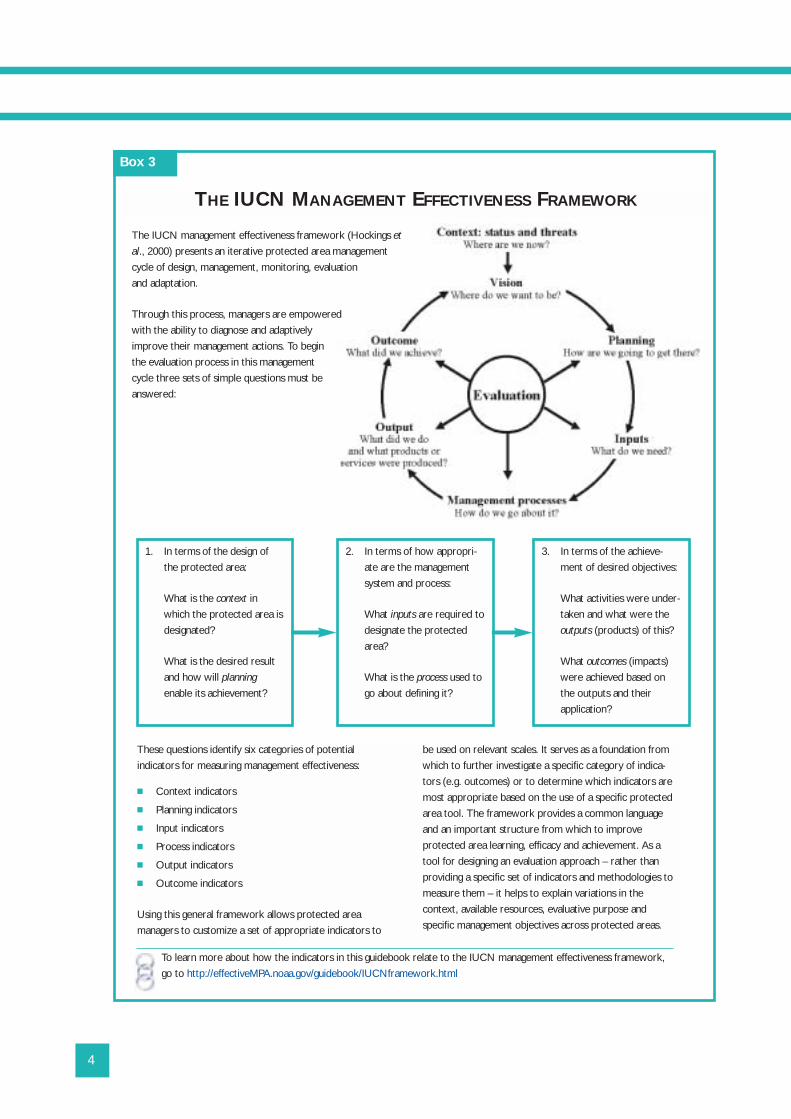
The IUCN management effectiveness framework (Hockings et
al., 2000) presents an iterative protected area management
cycle of design, management, monitoring, evaluation
and adaptation.
Through this process, managers are empowered
with the ability to diagnose and adaptively
improve their management actions. To begin
the evaluation process in this management
cycle three sets of simple questions must be
answered:
1. In terms of the design of
the protected area:
What is the context in
which the protected area is
designated?
What is the desired result
and how will planning
enable its achievement?
2. In terms of how appropri-
ate are the management
system and process:
What inputs are required to
designate the protected
area?
What is the process used to
go about defining it?
3. In terms of the achieve-
ment of desired objectives:
What activities were under-
taken and what were the
outputs (products) of this?
What outcomes (impacts)
were achieved based on
the outputs and their
application?
These questions identify six categories of potential
indicators for measuring management effectiveness:
� Context indicators
� Planning indicators
� Input indicators
� Process indicators
� Output indicators
� Outcome indicators
Using this general framework allows protected area
managers to customize a set of appropriate indicators to
be used on relevant scales. It serves as a foundation from
which to further investigate a specific category of indica-
tors (e.g. outcomes) or to determine which indicators are
most appropriate based on the use of a specific protected
area tool. The framework provides a common language
and an important structure from which to improve
protected area learning, efficacy and achievement. As a
tool for designing an evaluation approach – rather than
providing a specific set of indicators and methodologies to
measure them – it helps to explain variations in the
context, available resources, evaluative purpose and
specific management objectives across protected areas.
THE IUCN MANAGEMENT EFFECTIVENESS FRAMEWORK
Box 3
To learn more about how the indicators in this guidebook relate to the IUCN management effectiveness framework,
go to http://effectiveMPA.noaa.gov/guidebook/IUCNframework.html
Things for you to consider when using this guidebook
To conduct a management effectiveness evaluation, it is recommended thatyour MPA should ideally meet the following minimum requirements:
❏ It exists as a formal (legislated) MPA.
❏ There is an ongoing management planning process.
❏ There is a written management plan including clearly stated goals andobjectives (see Box 4, The Goals and Objectives of an MPA).
❏ It has been in operation for at least two years.
If your MPA does not meet these minimum requirements, it is still possibleto conduct an evaluation if there are stated goals and objectives available.
It is also recommended that you establish an evaluation team made up ofindividuals with the skills to conduct the type and level of evaluation youwant to implement in your MPA. (See Chapter 2, Step 2–3 on forming anevaluation team.)
Finally, it is recommended that your evaluation team should ideally meet thefollowing minimum requirements:
❏ Team members have an education or experience that equals a collegedegree in the natural sciences, social sciences, or related environmentaland natural resource management studies.
❏ Team members are knowledgeable about the fundamentals and standardmethods used in the biological and social sciences.
If you or other MPA staff do not meet these minimum requirements, seekassistance and look through the References.
5
Intro
du
ctio
n
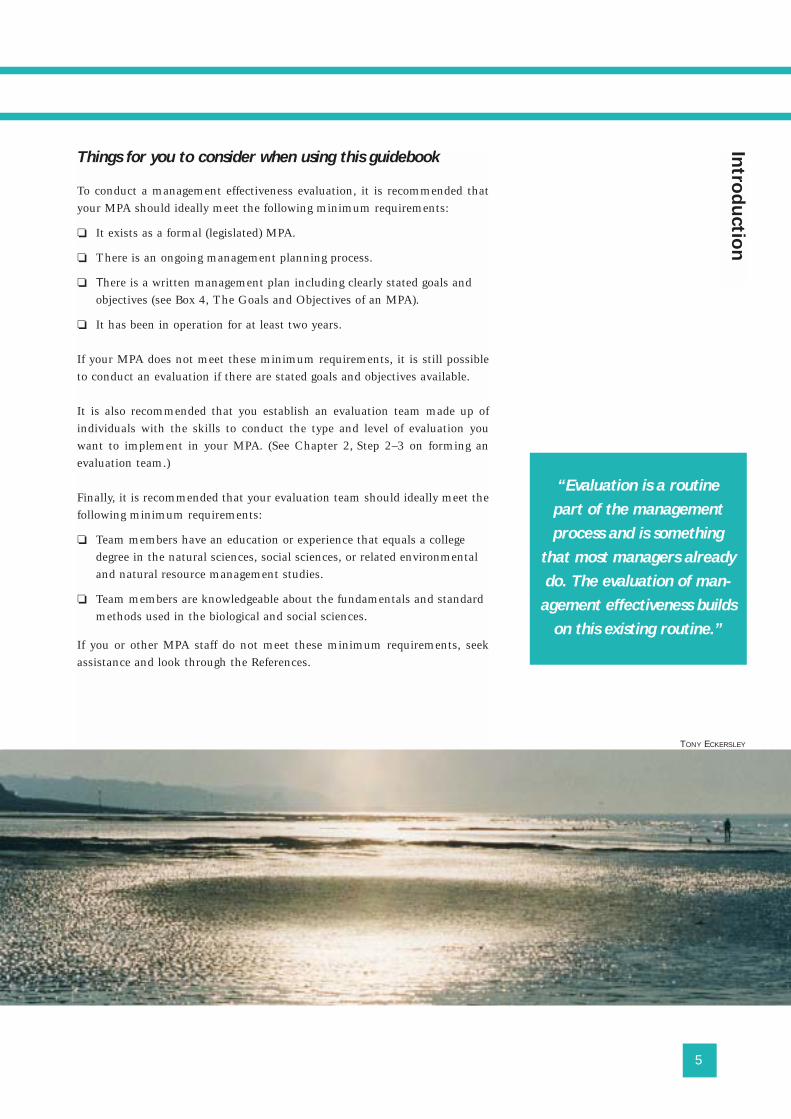
“Evaluation is a routine
part of the management
process and is something
that most managers already
do. The evaluation of man-
agement effectiveness builds
on this existing routine.”
TONY ECKERSLEY
6
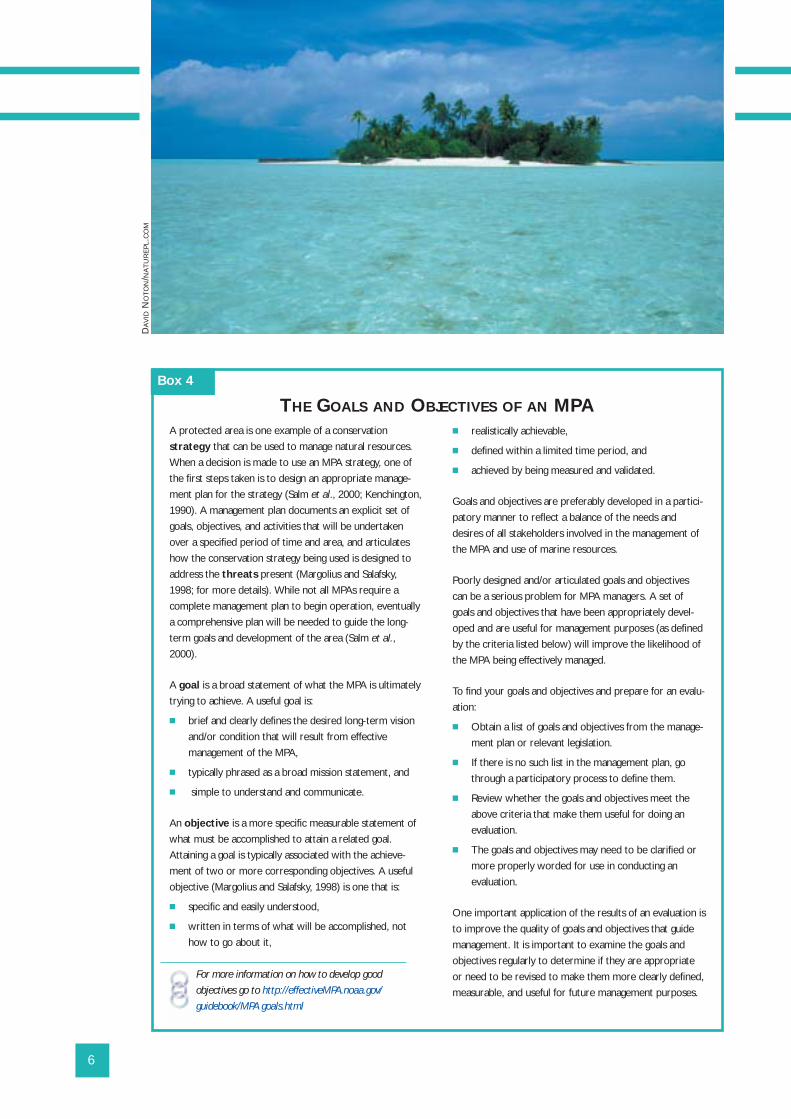
A protected area is one example of a conservation
strategy that can be used to manage natural resources.
When a decision is made to use an MPA strategy, one of
the first steps taken is to design an appropriate manage-
ment plan for the strategy (Salm et al., 2000; Kenchington,
1990). A management plan documents an explicit set of
goals, objectives, and activities that will be undertaken
over a specified period of time and area, and articulates
how the conservation strategy being used is designed to
address the threats present (Margolius and Salafsky,
1998; for more details). While not all MPAs require a
complete management plan to begin operation, eventually
a comprehensive plan will be needed to guide the long-
term goals and development of the area (Salm et al.,
2000).
A goal is a broad statement of what the MPA is ultimately
trying to achieve. A useful goal is:
� brief and clearly defines the desired long-term vision
and/or condition that will result from effective
management of the MPA,
� typically phrased as a broad mission statement, and
� simple to understand and communicate.
An objective is a more specific measurable statement of
what must be accomplished to attain a related goal.
Attaining a goal is typically associated with the achieve-
ment of two or more corresponding objectives. A useful
objective (Margolius and Salafsky, 1998) is one that is:
� specific and easily understood,
� written in terms of what will be accomplished, not
how to go about it,
� realistically achievable,
� defined within a limited time period, and
� achieved by being measured and validated.
Goals and objectives are preferably developed in a partici-
patory manner to reflect a balance of the needs and
desires of all stakeholders involved in the management of
the MPA and use of marine resources.
Poorly designed and/or articulated goals and objectives
can be a serious problem for MPA managers. A set of
goals and objectives that have been appropriately devel-
oped and are useful for management purposes (as defined
by the criteria listed below) will improve the likelihood of
the MPA being effectively managed.
To find your goals and objectives and prepare for an evalu-
ation:
� Obtain a list of goals and objectives from the manage-
ment plan or relevant legislation.
� If there is no such list in the management plan, go
through a participatory process to define them.
� Review whether the goals and objectives meet the
above criteria that make them useful for doing an
evaluation.
� The goals and objectives may need to be clarified or
more properly worded for use in conducting an
evaluation.
One important application of the results of an evaluation is
to improve the quality of goals and objectives that guide
management. It is important to examine the goals and
objectives regularly to determine if they are appropriate
or need to be revised to make them more clearly defined,
measurable, and useful for future management purposes.
Box 4
For more information on how to develop good
objectives go to http://effectiveMPA.noaa.gov/
guidebook/MPA goals.html
DA
VID
NO
TO
N/N
AT
UR
EP
L.C
OM
THE GOALS AND OBJECTIVES OF AN MPA
7
How to use this guidebook
This guidebook consists of two sections: Section 1 outlines the process forconducting an evaluation, and Section 2 describes the indicators that wouldbe measured in an evaluation.
Section 1 is structured around a set of logical steps that you can follow whenyou conduct a management effectiveness evaluation. These steps are set outin four chapters that represent the overall evaluation process:
Chapter 1: Selecting an appropriate set of indicators to measure.
Chapter 2: Planning how to evaluate the indicators selected.
Chapter 3: Implementing the evaluation by collecting and analysing data.
Chapter 4: Communicating results and using the results for adaptivemanagement.
Each chapter includes:
❏ A set of steps to accomplish each stage,
❏ A set of tasks or questions to complete each step, and
❏ Guidance, supplementary information and references to help you workthrough the process.
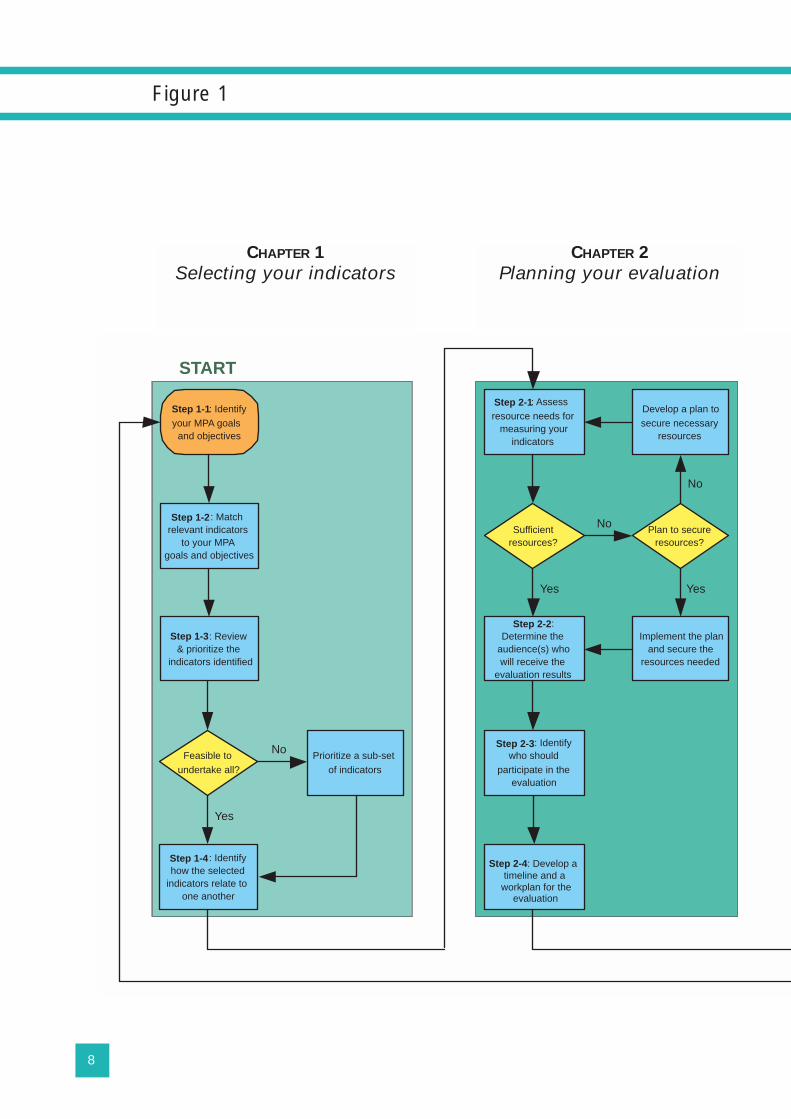
All of this is illustrated in a flowchart (Figure 1) so that you can easily use theguidebook. In addition, there is a worksheet (Worksheet 1) to help you keeptrack of where you are as you progress through the book. It is recommendedthat you go through each chapter in advance to become familiar with it andthat you follow this step-by-step evaluation process.
Section 2 contains:
❏ An introduction to the MPA effectiveness indicators,
❏ Summary tables of goals, objectives and indicators, and
❏ Outlines of the biophysical, socio-economic and governance indicators.
Finally, this process takes time, people and money. Read carefully through theentire guidebook, become familiar with the process and the indicators, andunderstand what will be required to follow this approach.
Intro
du
ctio
nN
OA
A P
HO
TO
LIB
RA
RY
8
Step 1-1 : Identifyyour MPA goals
and objectives
Step 1-4 : Identifyhow the selected
indicators relate toone another
Feasible toundertake all?
START
Step 1-3 : Review& prioritize the
indicators identified
No
Sufficientresources?
Step 2-1: Assessresource needs for
measuring yourindicators
Plan to secureresources?
Implement the planand secure the
resources needed
Step 2-2 :Determine the
audience(s) whowill receive the
evaluation results
Step 2-3 : Identifywho should
participate in theevaluation
Yes
Step 1-2 : Matchrelevant indicators
to your MPAgoals and objectives
Prioritize a sub-setof indicators
Develop a plan tosecure necessary
resources
Step 2-4 : Develop a timeline and a workplan for the
evaluation
Yes
No
Yes
No
Figure 1
CHAPTER 1
Selecting your indicatorsCHAPTER 2
Planning your evaluation
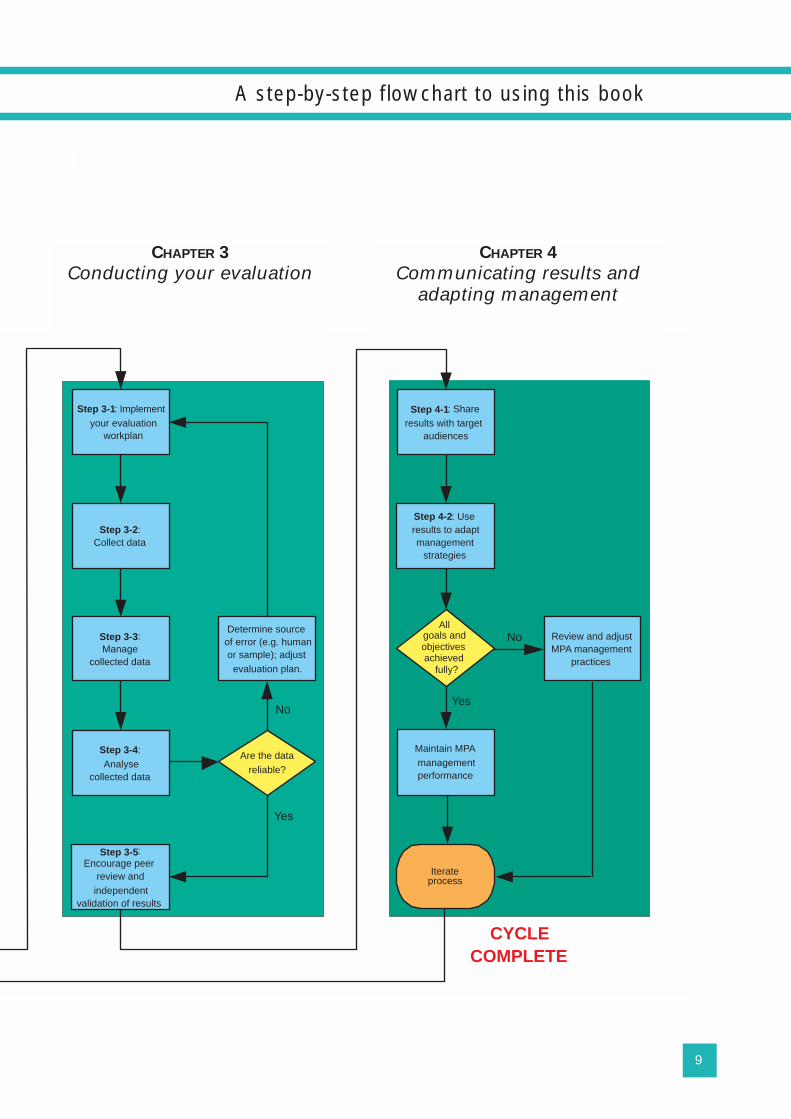
9
Step 3-1: Implementyour evaluation
workplan
Step 4-1: Shareresults with target
audiences
goals and
achieved fully?
Step 4-2: Useresults to adaptmanagement
strategies
Iterateprocess
CYCLECOMPLETE
Step 3-2 :Collect data
Review and adjustMPA management
practices
Step 3-3 :Manage
collected data
Step 3-4 :Analyse
collected data
Are the datareliable?
Yes
No
Determine sourceof error (e.g. humanor sample); adjust
evaluation plan.
Step 3-5:Encourage peer
review andindependent
validation of results
Yes
No
Maintain MPAmanagementperformance
All
objectives
A step-by-step flowchart to using this book
CHAPTER 3
Conducting your evaluationCHAPTER 4
Communicating results andadapting management
10
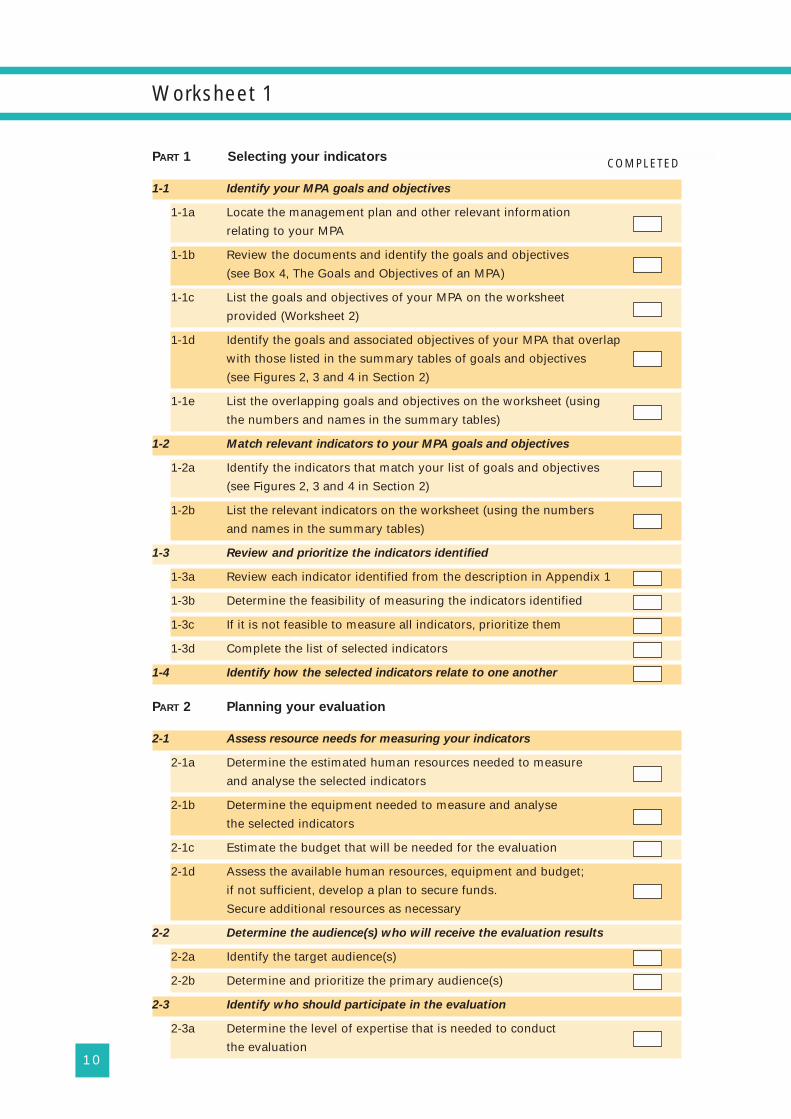
PART 1 Selecting your indicators
1-1 Identify your MPA goals and objectives
1-1a Locate the management plan and other relevant information
relating to your MPA
1-1b Review the documents and identify the goals and objectives
(see Box 4, The Goals and Objectives of an MPA)
1-1c List the goals and objectives of your MPA on the worksheet
provided (Worksheet 2)
1-1d Identify the goals and associated objectives of your MPA that overlap
with those listed in the summary tables of goals and objectives
(see Figures 2, 3 and 4 in Section 2)
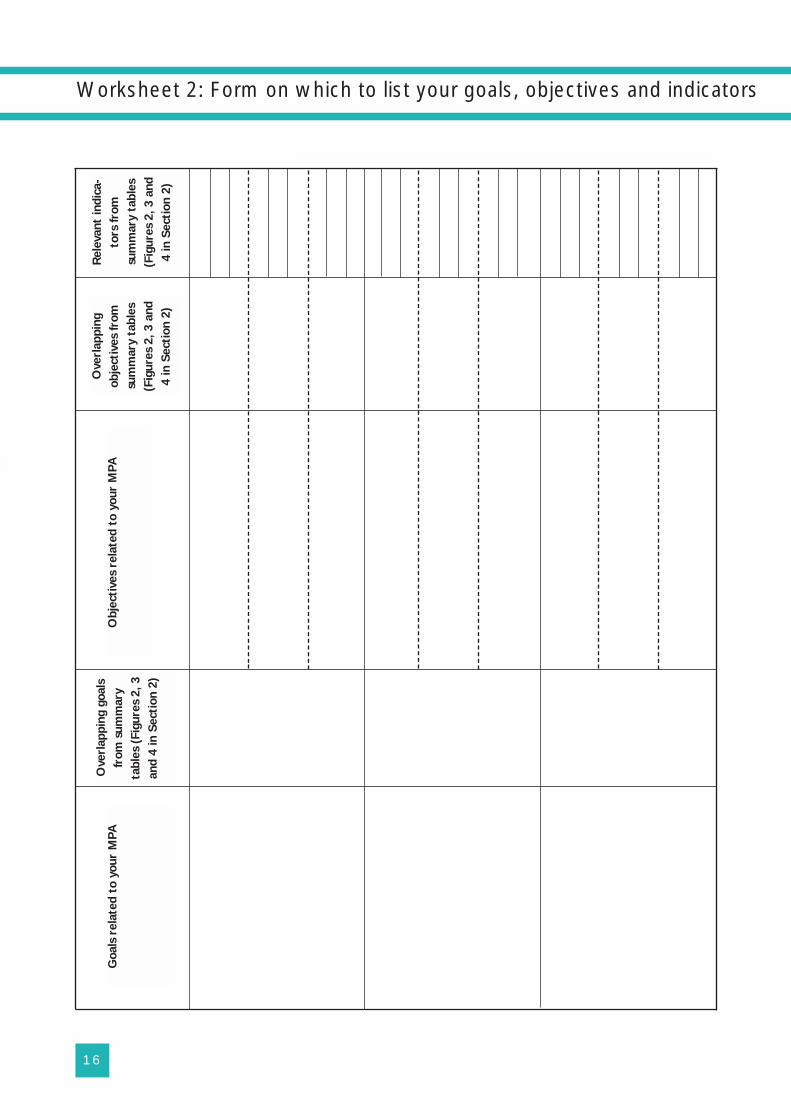
1-1e List the overlapping goals and objectives on the worksheet (using
the numbers and names in the summary tables)
1-2 Match relevant indicators to your MPA goals and objectives
1-2a Identify the indicators that match your list of goals and objectives
(see Figures 2, 3 and 4 in Section 2)
1-2b List the relevant indicators on the worksheet (using the numbers
and names in the summary tables)
1-3 Review and prioritize the indicators identified
1-3a Review each indicator identified from the description in Appendix 1
1-3b Determine the feasibility of measuring the indicators identified
1-3c If it is not feasible to measure all indicators, prioritize them
1-3d Complete the list of selected indicators
1-4 Identify how the selected indicators relate to one another
PART 2 Planning your evaluation
2-1 Assess resource needs for measuring your indicators
2-1a Determine the estimated human resources needed to measure
and analyse the selected indicators
2-1b Determine the equipment needed to measure and analyse
the selected indicators
2-1c Estimate the budget that will be needed for the evaluation
2-1d Assess the available human resources, equipment and budget;
if not sufficient, develop a plan to secure funds.
Secure additional resources as necessary
2-2 Determine the audience(s) who will receive the evaluation results
2-2a Identify the target audience(s)
2-2b Determine and prioritize the primary audience(s)
2-3 Identify who should participate in the evaluation
2-3a Determine the level of expertise that is needed to conduct
the evaluation
Worksheet 1
COMPLETED
11
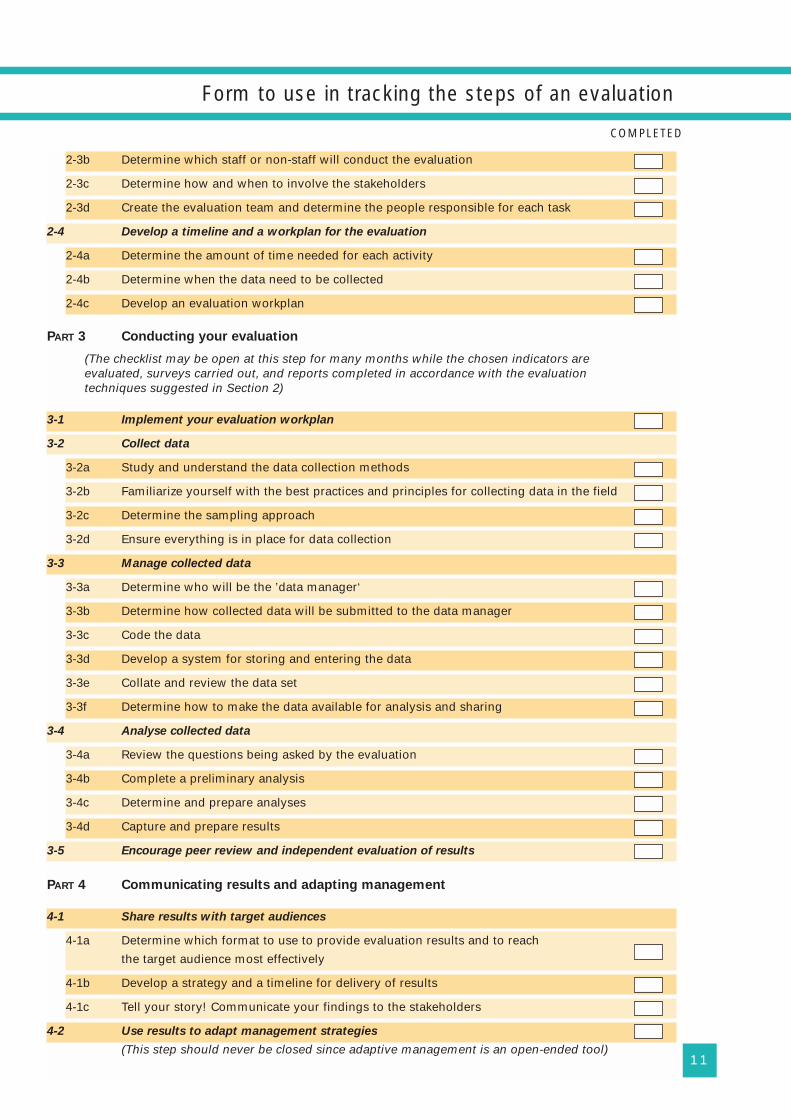
2-3b Determine which staff or non-staff will conduct the evaluation
2-3c Determine how and when to involve the stakeholders
2-3d Create the evaluation team and determine the people responsible for each task
2-4 Develop a timeline and a workplan for the evaluation
2-4a Determine the amount of time needed for each activity
2-4b Determine when the data need to be collected
2-4c Develop an evaluation workplan
PART 3 Conducting your evaluation
(The checklist may be open at this step for many months while the chosen indicators are evaluated, surveys carried out, and reports completed in accordance with the evaluation techniques suggested in Section 2)
3-1 Implement your evaluation workplan
3-2 Collect data
3-2a Study and understand the data collection methods
3-2b Familiarize yourself with the best practices and principles for collecting data in the field
3-2c Determine the sampling approach
3-2d Ensure everything is in place for data collection
3-3 Manage collected data
3-3a Determine who will be the ’data manager‘
3-3b Determine how collected data will be submitted to the data manager
3-3c Code the data
3-3d Develop a system for storing and entering the data
3-3e Collate and review the data set
3-3f Determine how to make the data available for analysis and sharing
3-4 Analyse collected data
3-4a Review the questions being asked by the evaluation
3-4b Complete a preliminary analysis
3-4c Determine and prepare analyses
3-4d Capture and prepare results
3-5 Encourage peer review and independent evaluation of results
PART 4 Communicating results and adapting management
4-1 Share results with target audiences
4-1a Determine which format to use to provide evaluation results and to reach
the target audience most effectively
4-1b Develop a strategy and a timeline for delivery of results
4-1c Tell your story! Communicate your findings to the stakeholders
4-2 Use results to adapt management strategies
(This step should never be closed since adaptive management is an open-ended tool)
Form to use in tracking the steps of an evaluation
COMPLETED


SECTION The Evaluation Process1
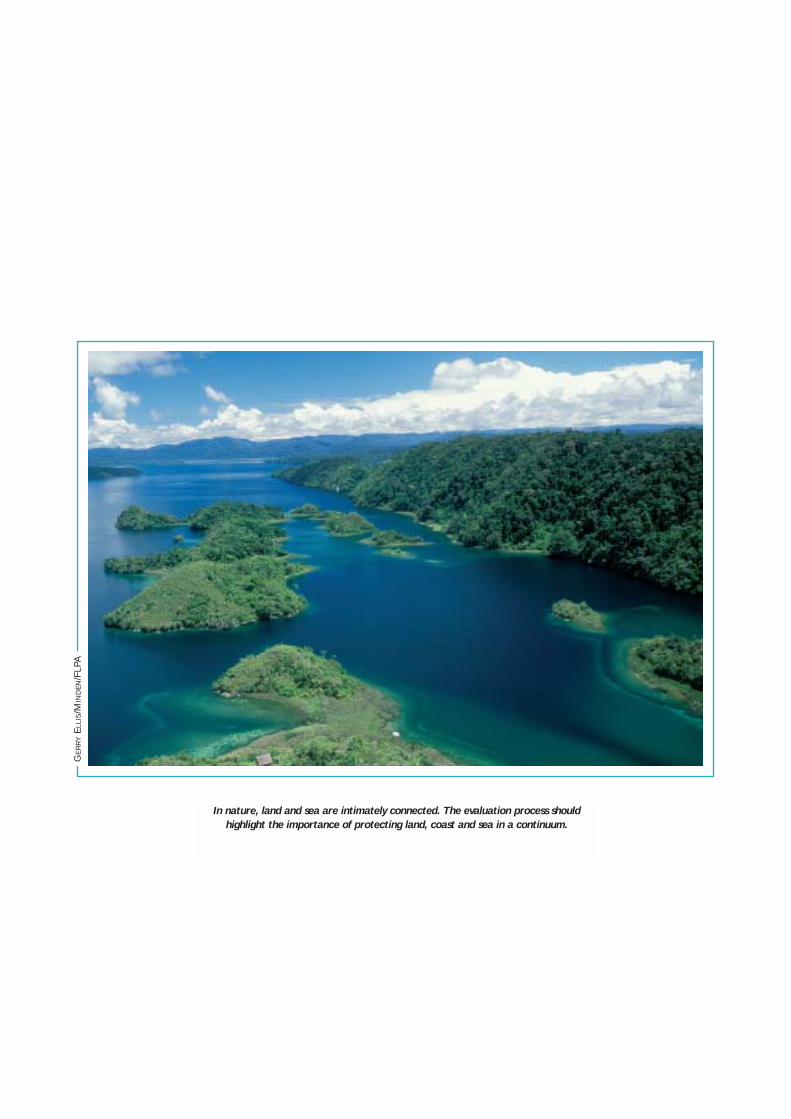
In nature, land and sea are intimately connected. The evaluation process should
highlight the importance of protecting land, coast and sea in a continuum.
GE
RR
YE
LLIS
/MIN
DE
N/F
LPA
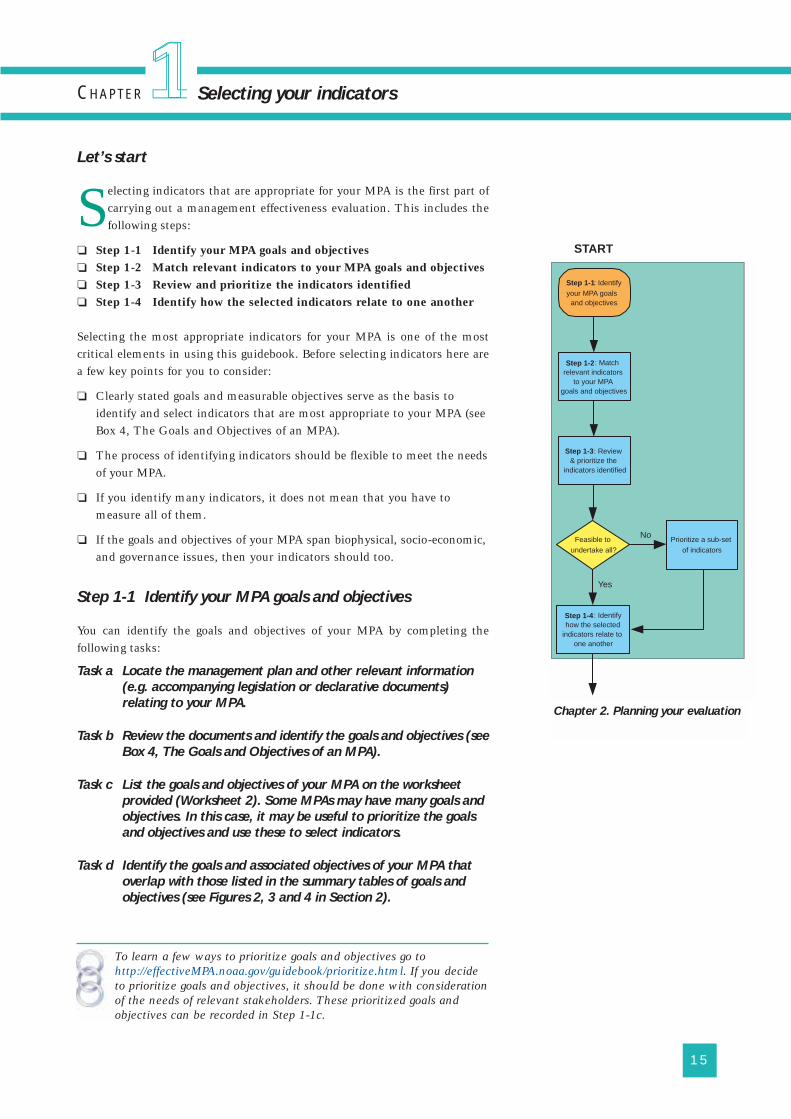
Let’s start
Selecting indicators that are appropriate for your MPA is the first part ofcarrying out a management effectiveness evaluation. This includes thefollowing steps:
❏ Step 1-1 Identify your MPA goals and objectives❏ Step 1-2 Match relevant indicators to your MPA goals and objectives❏ Step 1-3 Review and prioritize the indicators identified❏ Step 1-4 Identify how the selected indicators relate to one another
Selecting the most appropriate indicators for your MPA is one of the mostcritical elements in using this guidebook. Before selecting indicators here area few key points for you to consider:
❏ Clearly stated goals and measurable objectives serve as the basis toidentify and select indicators that are most appropriate to your MPA (seeBox 4, The Goals and Objectives of an MPA).
❏ The process of identifying indicators should be flexible to meet the needsof your MPA.
❏ If you identify many indicators, it does not mean that you have tomeasure all of them.
❏ If the goals and objectives of your MPA span biophysical, socio-economic,and governance issues, then your indicators should too.
Step 1-1 Identify your MPA goals and objectives
You can identify the goals and objectives of your MPA by completing thefollowing tasks:
Task a Locate the management plan and other relevant information
(e.g. accompanying legislation or declarative documents)
relating to your MPA.
Task b Review the documents and identify the goals and objectives (see
Box 4, The Goals and Objectives of an MPA).
Task c List the goals and objectives of your MPA on the worksheet
provided (Worksheet 2). Some MPAs may have many goals and
objectives. In this case, it may be useful to prioritize the goals
and objectives and use these to select indicators.
Task d Identify the goals and associated objectives of your MPA that
overlap with those listed in the summary tables of goals and
objectives (see Figures 2, 3 and 4 in Section 2).
15
CHAPTER Selecting your indicators
Step 1-1 : Identifyyour MPA goals
and objectives
Step 1-4 : Identifyhow the selected
indicators relate toone another
Feasible toundertake all?
Step 1-3 : Review& prioritize the
indicators identified
No
Step 1-2 : Matchrelevant indicators
to your MPAgoals and objectives
Prioritize a sub-setof indicators
Yes
To learn a few ways to prioritize goals and objectives go tohttp://effectiveMPA.noaa.gov/guidebook/prioritize.html. If you decideto prioritize goals and objectives, it should be done with considerationof the needs of relevant stakeholders. These prioritized goals andobjectives can be recorded in Step 1-1c.
Chapter 2. Planning your evaluation
START
1
16
Goa
ls r
elat
ed t
o yo
ur M
PAO
verl
appi
ngob
ject
ives
from
sum
mar
y ta
bles
(Fig
ures
2, 3
and
4 in
Sec
tion
2)
Obj
ecti
ves
rela
ted
to y
our
MPA
Ove
rlap
ping
goa
lsfr
om s
umm
ary
tabl
es (
Figu
res
2, 3
and
4 in
Sec
tion
2)
Rel
evan
t in
dica
-to
rs fr
omsu
mm
ary
tabl
es(F
igur
es 2
, 3 a
nd4
in S
ecti
on 2
)
Worksheet 2: Form on which to list your goals, objectives and indicators
Task e List the overlapping goals and objectives on the worksheet
(using the numbers and names in the summary tables).
17
A range of indicators is presented in Section 2, from which youcan choose an appropriate set for your site (see Box 5,Introducing the Indicators, for a summary of how the indicatorswere developed). Every indicator may not be relevant to your MPA.
The generic goals and objectives in this guidebook are based on realMPA goals and objectives. A survey was done of MPAs from aroundthe world – the list of goals and objectives fell into the threecategories of biophysical, socio-economic, and governance. To learnmore go to http://effectiveMPA.noaa.gov/guidebook/survey.html
Note: Difficulty rankings are provided for each indicator and canbe a helpful guide on how much time and effort it will take tomeasure an indicator.
CH
AP
TER
1S
ele
ctin
g y
ou
r ind
icato
rsT
ON
IPA
RR
AS
TO
NIP
AR
RA
S
Step 1-2 Match relevant indicators to your MPA goals and
objectives
You can identify and match the relevant indicators by completing the follow-ing tasks:
Task a Look at your overlapping list of goals and objectives from
Step 1-1. Identify the indicators that match your list of goals
and objectives(see Figures 2, 3 and 4 in Section 2).
Task b List the relevant indicators on your worksheet (using the
numbers and names in the summary tables).
This guidebook is not intended to be used prescriptively. As each MPA isunique, indicators here are not universally applicable or appropriate to allMPAs. Likewise there is no single set of indicators that must be used.
Step 1-3 Review and prioritize the indicators identified
You can review and prioritize the indicators you identified by doing thefollowing:
Task a Review each indicator identified from the description in
Appendix 1.
Task b Determine the feasibility of measuring the indicators identified.
Task c If it is not feasible to measure all indicators, prioritize them.
Task d Complete the list of selected indicators.
This selection process should not become more complex than necessary. Insome cases, it should be fairly intuitive to identify the appropriate indicatorsgiven the goals and objectives of your MPA.
To learn ways to prioritize indicators go tohttp://effectiveMPA.noaa.gov/guidebook/prioritize.html. Theseprioritized indicators can be recorded in Step 1-3d.
Step 1-4 Identify how the selected indicators relate to one
another
Now that you have selected your indicators, consider how they are related toone another by considering the natural and social conditions of your MPA. Itis helpful to draw these relationships on paper in a diagram.
For example, legislation passed in your MPA may influence the types oflivelihood activities that are allowed in the area. In turn, these livelihoodsinfluence both the degree of fishing effort and the population size of particulartarget species present. The status of these species influences the degree towhich the biophysical goals and objectives of an MPA are met.
In another example, socio-economic factors, such as stakeholder knowledge ofnatural history and the number and nature of markets, are directly related tothe use of marine resources that influence the ecology of your MPA. Likewise,changes to habitat distribution and community composition in the ecosystem
18
What is an indicator and how is it used?
An indicator is a unit of information measured over
time that will allow you to document changes in specific
attributes of your MPA. An indicator allows you to
gauge an aspect that is not directly measurable or is
very difficult to measure – such as effectiveness.
Because ‘effectiveness’ is a multi-dimensional concept,
a range of different indicators should be used to deter-
mine how your MPA is doing. These indicators can
provide evidence of whether or not the goals and
objectives of your MPA are being achieved. Alone, they
are not sufficient proof.
Indicators provide results for several purposes:
� Indicator results feed into the MPA evaluation to
measure and demonstrate management effective-
ness. The indicators in this guidebook are designed
to allow you to regularly diagnose the status of
your MPA.
� Measuring, analysing and communicating indicators
can promote learning, sharing knowledge, and
better understanding of strengths and weaknesses
of MPA management actions.
� MPA managers and practitioners can use indicator
results to highlight the changes needed in manage-
ment plans and practices to adapt and improve the
MPA. If changes are made in management based
on the results of an evaluation, the indicators can
help people to better understand how and why
changes are made.
� The indicators presented here will help you to
learn more about your MPA and the people and
resources that are impacted by it.
Go to the beginning of Section 2 to learn more about
how the indicators were developed and how they
should be used.
INTRODUCING THE INDICATORS
Box 5
19
To learn more about how these indicators are conceptually related toeach other, visit http://effectiveMPA.noaa.gov/conceptualmodel
CH
AP
TER
1S
ele
ctin
g y
ou
r ind
icato
rs
influence household occupational structure and enforcement procedures.Also, local values and beliefs about marine resources may influence the levelof stakeholder participation in the MPA management process and activities.
In testing this guidebook, most (82%) of
the pilot site teams responded that they
found the process of selecting indicators
to be useful. A few found it unnecces-
sary to follow the step-by-step process
and were able to to match indicators as
related to their MPA goals and objectives
based on other priorities or methods
more suited to their situation.
Also, in working through these steps,
several sites reported that their MPAs
did not have goals and objectives or
found existing ones to be unclear and
unmeasurable. They reported that the
process of selecting indictors was partic-
ularly useful to them because it helped
them to identify the need to refine or
strengthen their goals and objectives.
LESSONS FROM FIELD TESTS OF THE PROCESS
Box 6
To learn more about pilot site testing results, go to
http://effectiveMPA.noaa.gov
NO
AA
PH
OT
OL
IBR
AR
Y
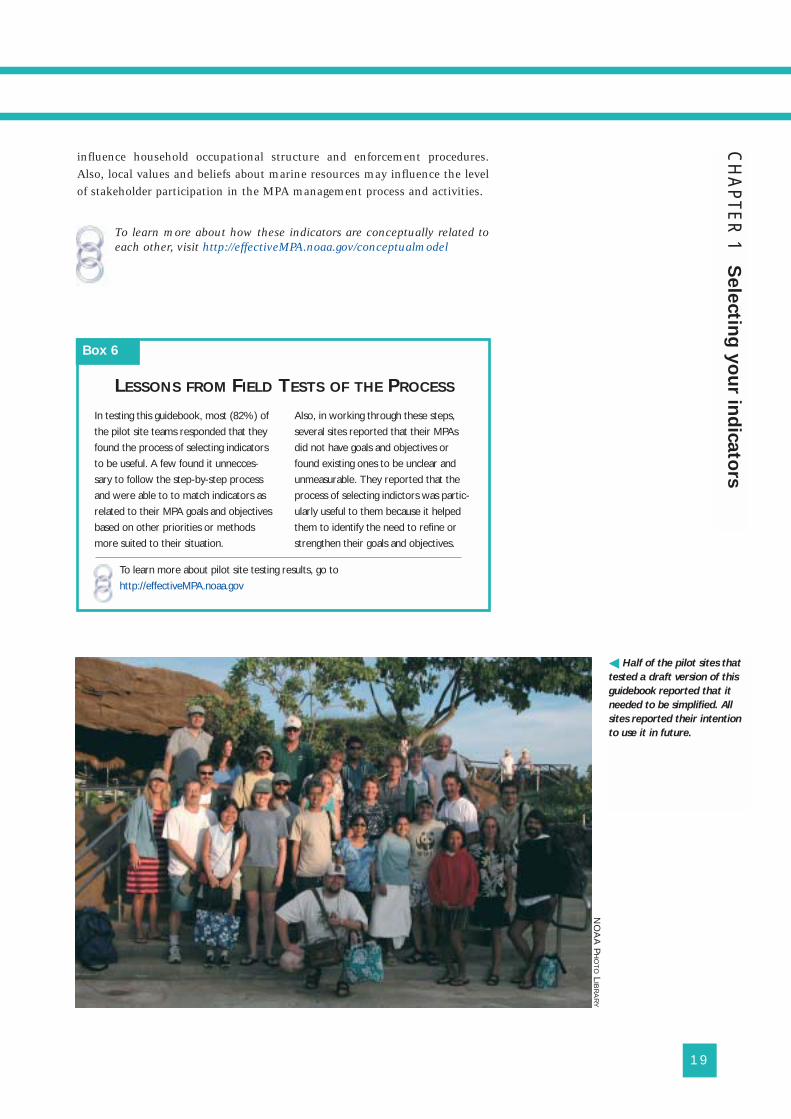
� Half of the pilot sites that
tested a draft version of this
guidebook reported that it
needed to be simplified. All
sites reported their intention
to use it in future.
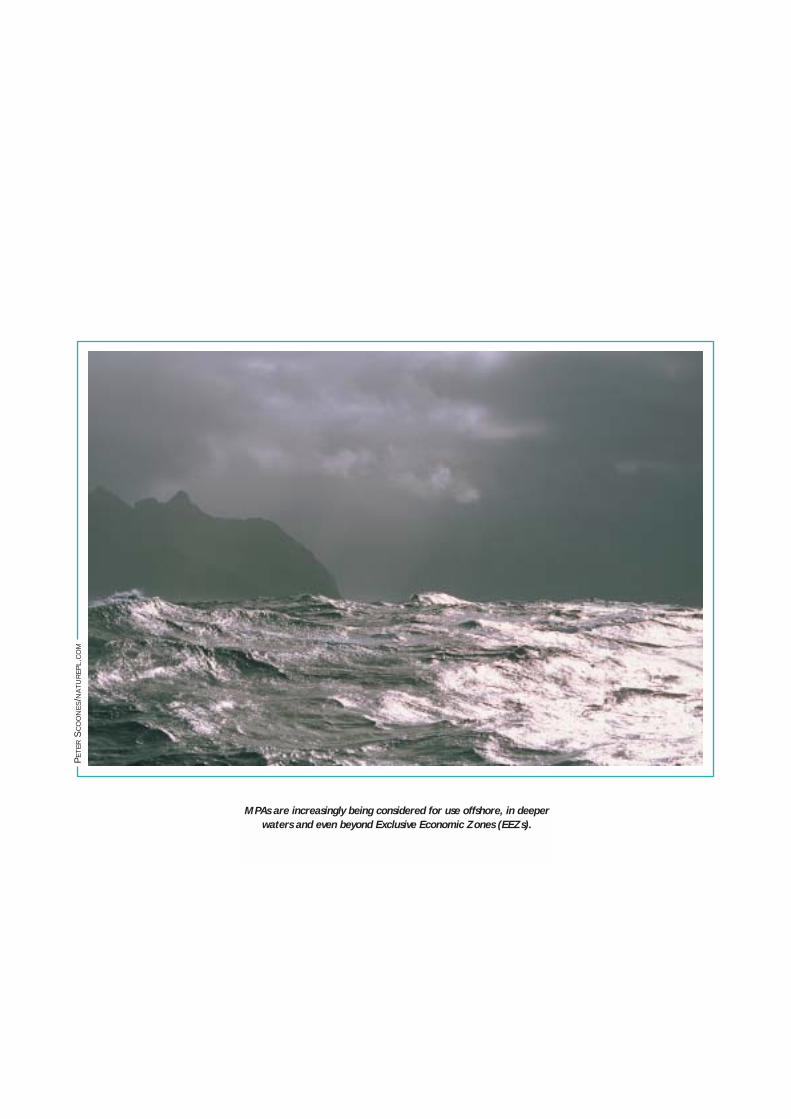
MPAs are increasingly being considered for use offshore, in deeper
waters and even beyond Exclusive Economic Zones (EEZs).
PE
TE
RS
CO
ON
ES/N
AT
UR
EP
L.C
OM
21
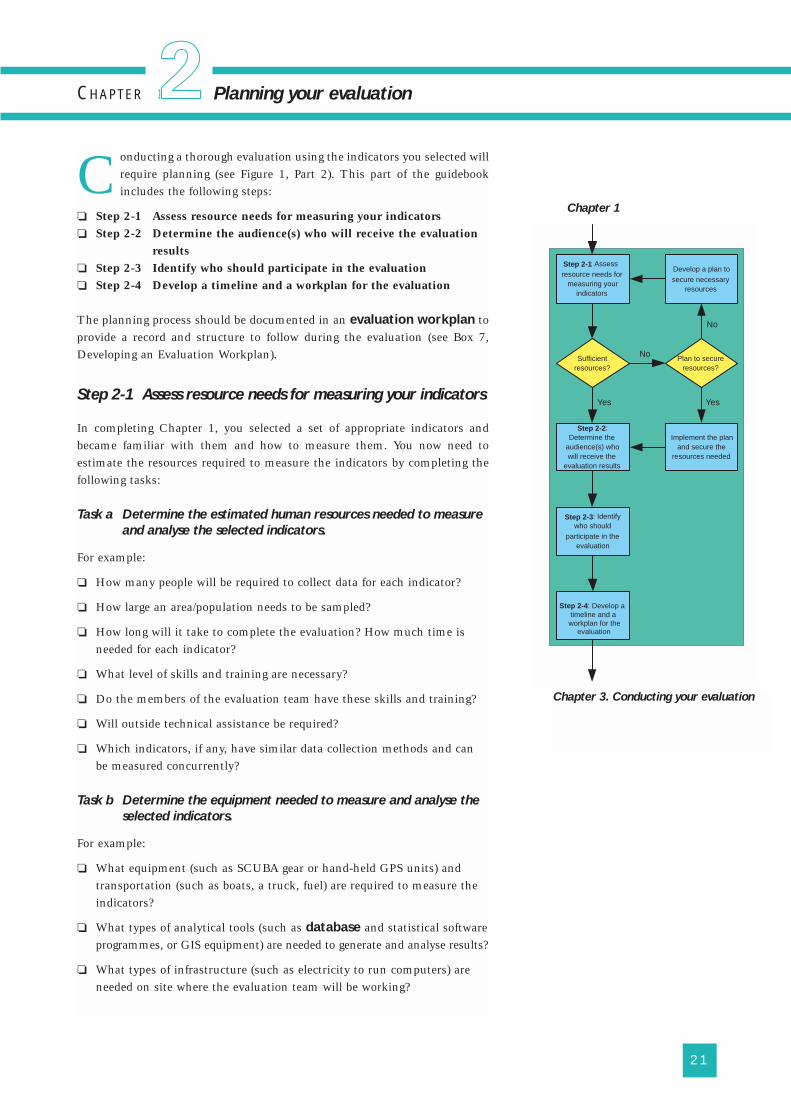
Conducting a thorough evaluation using the indicators you selected willrequire planning (see Figure 1, Part 2). This part of the guidebookincludes the following steps:
❏ Step 2-1 Assess resource needs for measuring your indicators❏ Step 2-2 Determine the audience(s) who will receive the evaluation
results❏ Step 2-3 Identify who should participate in the evaluation❏ Step 2-4 Develop a timeline and a workplan for the evaluation
The planning process should be documented in an evaluation workplan toprovide a record and structure to follow during the evaluation (see Box 7,Developing an Evaluation Workplan).
Step 2-1 Assess resource needs for measuring your indicators
In completing Chapter 1, you selected a set of appropriate indicators andbecame familiar with them and how to measure them. You now need toestimate the resources required to measure the indicators by completing thefollowing tasks:
Task a Determine the estimated human resources needed to measure
and analyse the selected indicators.
For example:
❏ How many people will be required to collect data for each indicator?
❏ How large an area/population needs to be sampled?
❏ How long will it take to complete the evaluation? How much time isneeded for each indicator?
❏ What level of skills and training are necessary?
❏ Do the members of the evaluation team have these skills and training?
❏ Will outside technical assistance be required?
❏ Which indicators, if any, have similar data collection methods and canbe measured concurrently?
Task b Determine the equipment needed to measure and analyse the
selected indicators.
For example:
❏ What equipment (such as SCUBA gear or hand-held GPS units) andtransportation (such as boats, a truck, fuel) are required to measure theindicators?
❏ What types of analytical tools (such as database and statistical softwareprogrammes, or GIS equipment) are needed to generate and analyse results?
❏ What types of infrastructure (such as electricity to run computers) areneeded on site where the evaluation team will be working?
CHAPTER Planning your evaluation
Sufficientresources?
Step 2-1: Assessresource needs for
measuring yourindicators
Plan to secureresources?
Implement the planand secure the
resources needed
Step 2-2:Determine the
audience(s) whowill receive the
evaluation results
Step 2-3: Identifywho should
participate in theevaluation
Yes
Develop a plan tosecure necessary
resources
Step 2-4: Develop a timeline and a workplan for the
evaluation
No
Yes
No
Chapter 1
Chapter 3. Conducting your evaluation
1

22
To help you, each indicator description in Section 2 contains alist of what is required to measure the indicator. In some cases,measuring an indicator is highly technical and resourceintensive. Where appropriate, lower-capacity and costalternatives are provided.
Task c Estimate the budget that will be needed for the evaluation.
For example:
❏ What is the cost of the evaluation team’s time?
❏ How much are the consultant and training costs?
❏ What are the equipment and other capital costs?
Task d Assess the available human resources, equipment and budget; if
not sufficient, develop a plan to secure funds. Secure additional
resources as necessary.
If your MPA has the necessary human and financial resources, and equip-ment, you can move on to the next step.
If your MPA does not have the necessary human and financial resources,determine if there is a plan to secure these resources. If there is a plan, afteryou have implemented and achieved it you can move on to the next step.
If you are not ready to undertake this level of evaluation, you can stilltake steps to work toward adaptive management. Look through theReferences or go to http://effectiveMPA.noaa.gov for additionalreferences and links.
TO
NY
EC
KE
RS
LEY
As you work through the chapters in Section 1, you will
be gathering information on all aspects of conducting an
evaluation. This information will help you to map out what
you will need to do from start to finish.
An evaluation workplan should clearly and concisely
answer eight planning questions:
� Why is the evaluation being done?
� Who is the audience for the evaluation results?
� Who should participate in the evaluation?
� What methods will be used to measure the
indicators?
� What resources (human, financial) are needed to
measure these indicators?
� What is the timeline for carrying out the evaluation?
� How are the data to be managed and analysed?
� How will evaluation results be communicated and
used for decision-making?
The answers to these questions are pulled together into a
single summary workplan document or table. This work-
plan will help the members of your evaluation team to
understand why, how, when, and by whom the evaluation
will proceed. Think of it as a map that will allow your eval-
uation team to get to their final destination – a completed
evaluation of management effectiveness at your MPA.
Be sure to read through all of the guidebook for key
information on planning, such as data collection, data
analysis, and communications.
There are a few things to consider when planning your
evaluation:
� Scale – This guidebook focuses only on conducting
evaluations at the single MPA site level, including the
immediate surrounding area.
� System – Your evaluation will assess the impacts of
your MPA on both the natural environment and
human aspects at the site.
DEVELOPING AN EVALUATION WORKPLANBox 7
23
If you do not have the financial resources or a plan to secure them, you shoulddevelop one and implement it. Once you have the necessary resources, youmay be in a position to come back to this guidebook.
As you estimate what is required to carry out the evaluation, keep the follow-ing in mind:
❏ Resource needs will be different at each site, based on factors such as thenumber of indicators, staff skills, need for outside assistance, and thesize of the area.
❏ Many of the resources will need to be committed to data collection andanalysis.
Step 2-2 Determine the audience(s) who will receive the
evaluation results
Before you begin your evaluation, think carefully about the audience(s) thatyou want to reach and develop a plan for communicating and reporting theresults. In thinking about this, you may find that there are a number ofdifferent audiences.
For example, your primary audience may be whoever requested the evalua-tion, such as a national agency, programme director, or donor. Keep in mindthat there may be others that would find the results useful and that they couldbring benefits to your management efforts.
You can determine the most appropriate audiences to receive the evaluationresults by completing the following tasks:
Task a Identify the target audience(s).
To identify the audience(s) for your evaluation results, answer the followingquestions:
❏ Who are the potential audiences that may benefit from or be interestedin the evaluation results of your MPA?
❏ Which of these audiences are internal stakeholders in the MPA manage-ment? Which of these audiences are external to the MPA management?
❏ For each audience – what level of influence and interest do they haveover the MPA and how it is managed? How important is it for you tostay in communication with each audience?
❏ For each audience – what do you know about their preferred method ofreceiving information? This may be closely related to their technicalcapacity. For example, do they prefer to read information or listen to aradio or television? Are they computer literate and do they use theInternet regularly? Do they gather together periodically at meetings orconferences? If so, when are these meetings scheduled?
❏ What language does each audience speak? What is their average educa-tional level? What style of communications do they prefer – technicaland academic or casual and conversational? Where and how are oralcommunications typically done?
CH
AP
TER
2P
lan
nin
g y
ou
r evalu
atio
nJ
OH
NP
AR
KS
24
❏ What, specifically, do you expect each audience to do withthe results and information you present to them? Whatactions do you want them to take following the delivery ofyour results? How are these expectations linked to thegoals and objectives of the MPA you are working with?
Task b Determine and prioritize the primary audience(s).
You can prioritize primary audiences based on the need to reachthem, and how they will use the results, and the types ofactions they can take.
An audience analysis matrix provides a method foridentifying and prioritizing the audiences who might beinterested in the evaluation results. To learn moreabout this method, visithttp://effectiveMPA.noaa.gov/guidebook/aam.html
Step 2-3 Identify who should participate in the
evaluation
The evaluation team is responsible for planning, implementa-tion and initial analysis. This may or may not include the MPAmanager; however it is recommended to have an indiviual whowill lead the evaluation and evaluation team.
The following tasks will help you identify who should beinvolved in conducting the evaluation:
Task a Determine the level of expertise that is needed to
conduct the evaluation.
The MPA manager and staff, a biologist and a social scientistcan do a simple evaluation. A more complex evaluation willrequire additional people with a diverse set of disciplinary skills,in the fields of marine biology, ecology, oceanography, econom-ics, sociology, anthropology, law and political science.
Task b Determine which staff or non-staff will conduct
the evaluation.
Some MPAs will not have staff with the full range of discipli-nary skills required. As such, external consultants or organiza-tions with the necessary expertise may be required. In this case,determine which parts of the evaluation will be conductedinternally versus externally.
There are benefits and limitations with both external and inter-nal evaluators. Table 1 summarises some aspects to considerwhen deciding who should be involved in the evaluation.
For many MPA managers communicating and report-
ing results is often not given much consideration. The
right time to begin thinking about and planning for
communications is at the beginning of the MPA
evaluation project, not the end of it.
For example, if you understand how your primary
audiences take in information you can communicate
the evaluation results accordingly and make them
more useful. Also, knowing your communications
needs at the start of the evaluation will help you to
budget for the necessary activities, time and
resources.
The steps to develop a communications
plan are discussed in Chapter 4.
Box 8
WHY THINK ABOUT
COMMUNICATIONS AT THE
OUTSET?
Audiences vary widely by MPA site and type.
Commonly identified audiences (that could be
either internal or external audiences, depend-
ing on the site) include:
� Advocacy groups.
� Coastal communities/residents.
� Donors.
� Elected officials.
� Teachers.
� Public.
� Government department heads.
� Native leaders.
� Journalists.
� Fishers.
� Divers and surfers.
� Non-governmental (national, inter-national) organizations.
� Other MPA managers and practitioners.
� Project managers and staff associatedwith the MPA.
� Researchers and scientists.
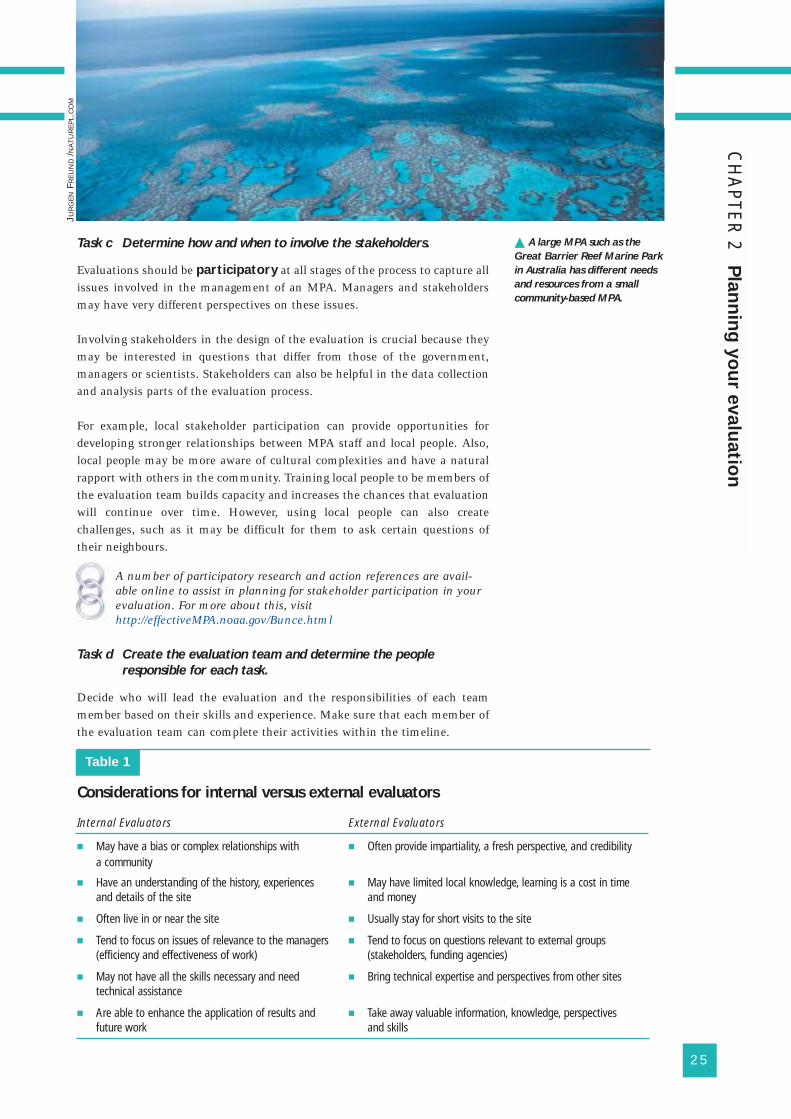
25
Task c Determine how and when to involve the stakeholders.
Evaluations should be participatory at all stages of the process to capture allissues involved in the management of an MPA. Managers and stakeholdersmay have very different perspectives on these issues.
Involving stakeholders in the design of the evaluation is crucial because theymay be interested in questions that differ from those of the government,managers or scientists. Stakeholders can also be helpful in the data collectionand analysis parts of the evaluation process.
For example, local stakeholder participation can provide opportunities fordeveloping stronger relationships between MPA staff and local people. Also,local people may be more aware of cultural complexities and have a naturalrapport with others in the community. Training local people to be members ofthe evaluation team builds capacity and increases the chances that evaluationwill continue over time. However, using local people can also createchallenges, such as it may be difficult for them to ask certain questions oftheir neighbours.
A number of participatory research and action references are avail-able online to assist in planning for stakeholder participation in yourevaluation. For more about this, visithttp://effectiveMPA.noaa.gov/Bunce.html
Task d Create the evaluation team and determine the people
responsible for each task.
Decide who will lead the evaluation and the responsibilities of each teammember based on their skills and experience. Make sure that each member ofthe evaluation team can complete their activities within the timeline.
CH
AP
TER
2P
lan
nin
g y
ou
r evalu
atio
n
Considerations for internal versus external evaluators
Internal Evaluators External Evaluators
� May have a bias or complex relationships with � Often provide impartiality, a fresh perspective, and credibilitya community
� Have an understanding of the history, experiences � May have limited local knowledge, learning is a cost in timeand details of the site and money
� Often live in or near the site � Usually stay for short visits to the site
� Tend to focus on issues of relevance to the managers � Tend to focus on questions relevant to external groups (efficiency and effectiveness of work) (stakeholders, funding agencies)
� May not have all the skills necessary and need � Bring technical expertise and perspectives from other sitestechnical assistance
� Are able to enhance the application of results and � Take away valuable information, knowledge, perspectives future work and skills
� A large MPA such as the
Great Barrier Reef Marine Park
in Australia has different needs
and resources from a small
community-based MPA.
JUR
GE
NFR
EU
ND
/NA
TU
RE
PL.
CO
M
Table 1
26
If the members of the evaluation team are not local, they should bebriefed on local customs, traditions and behaviours, and particularetiquette so that they can understand as much as possible about thelocal culture before starting data collection (seehttp://effectiveMPA.noaa.gov/Bunce.html).
Step 2-4 Develop a timeline and a workplan for the
evaluation
A timeline should be prepared for the evaluation, identifying specific activitiesand time periods for starting and completing those activities. A timeline canalso provide a means to set up targets and milestones to accomplish along theway. MPA managers and staff have many activities and evaluation is a part ofthose activities – consider allocating a minimum of 10% of staff time to eval-uation annually. Answering the following questions will help you develop atimeline:
Task a Determine the amount of time needed for each activity.
This will depend on the number of indicators selected, the size of your MPAand choice of methods. Consider which indicators have similar methodolo-gies, such as a survey that could be used for several indicators. Also, considerwhich of these methods are included in existing monitoring programmes atyour MPA.
To see which indicators have similar collection methods seeBox 11 in Section 2 on how some of the indicators cluster.
Consider the amount of data that needs to be collected. This will partlydepend on internal and external audience needs and on the type of data beingcollected.
Task b Determine when the data need to be collected.
Consider factors such as seasonality and frequency. For example, fishing maybe seasonal as could the supply of fish for consumption and market needs.There may also be times when it is difficult to do household surveys in a givencommunity because people are away or busy. Data should be collected at thesame time of year to ensure comparability over time.
The approach to measuring indicators outlined in this guidebook is onethat requires periodic but ongoing data collection through time. Someindicators may only need to be measured once every few years, whileothers may need to be measured once or even twice a year. In eithercase, planning for the timing of when data are to be collected can beconsidered in advance by reviewing how often selected indicators arerecommended to be measured (see Section 2).
Task c Develop an evaluation workplan.
Pull together all the components into an evaluation workplan (see Box 7,Developing an Evaluation Workplan). Be sure to include planning elementsthat are discussed in Chapters 3 and 4. Distribute the evaluation workplan tothe evaluation team.
TO
NY
EC
KE
RS
LEY
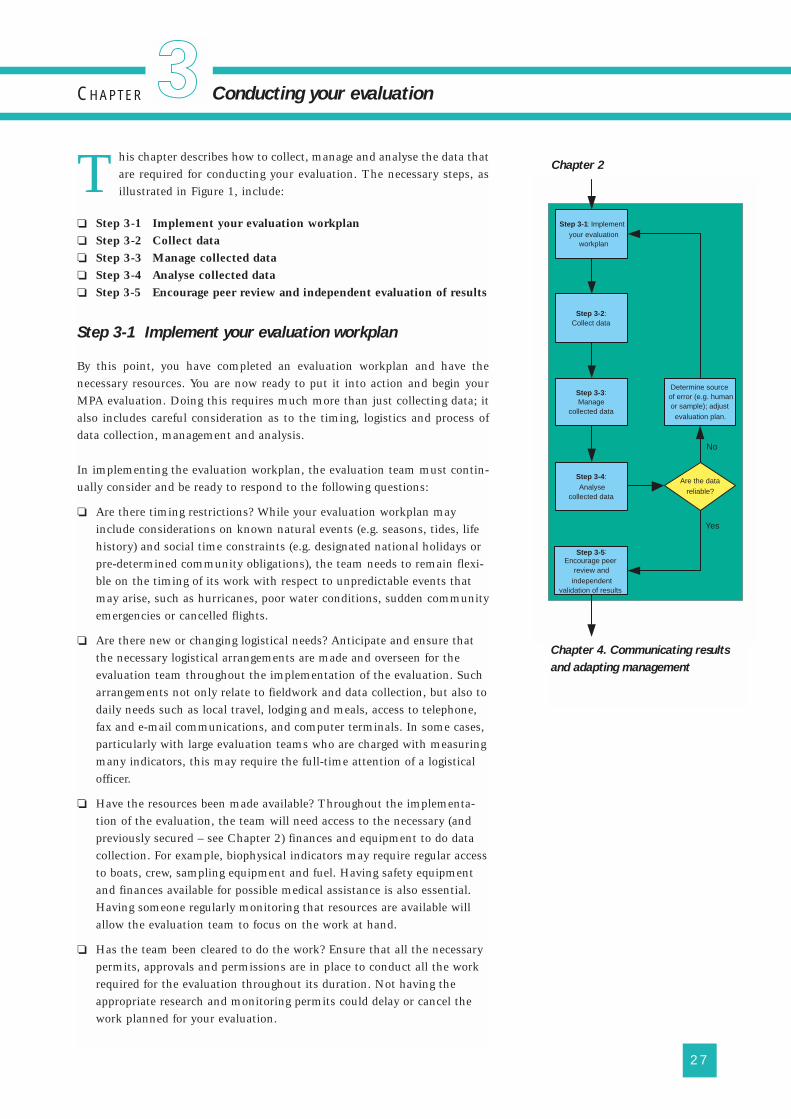
This chapter describes how to collect, manage and analyse the data thatare required for conducting your evaluation. The necessary steps, asillustrated in Figure 1, include:
❏ Step 3-1 Implement your evaluation workplan❏ Step 3-2 Collect data❏ Step 3-3 Manage collected data❏ Step 3-4 Analyse collected data❏ Step 3-5 Encourage peer review and independent evaluation of results
Step 3-1 Implement your evaluation workplan
By this point, you have completed an evaluation workplan and have thenecessary resources. You are now ready to put it into action and begin yourMPA evaluation. Doing this requires much more than just collecting data; italso includes careful consideration as to the timing, logistics and process ofdata collection, management and analysis.
In implementing the evaluation workplan, the evaluation team must contin-ually consider and be ready to respond to the following questions:
❏ Are there timing restrictions? While your evaluation workplan mayinclude considerations on known natural events (e.g. seasons, tides, lifehistory) and social time constraints (e.g. designated national holidays orpre-determined community obligations), the team needs to remain flexi-ble on the timing of its work with respect to unpredictable events thatmay arise, such as hurricanes, poor water conditions, sudden communityemergencies or cancelled flights.
❏ Are there new or changing logistical needs? Anticipate and ensure thatthe necessary logistical arrangements are made and overseen for theevaluation team throughout the implementation of the evaluation. Sucharrangements not only relate to fieldwork and data collection, but also todaily needs such as local travel, lodging and meals, access to telephone,fax and e-mail communications, and computer terminals. In some cases,particularly with large evaluation teams who are charged with measuringmany indicators, this may require the full-time attention of a logisticalofficer.
❏ Have the resources been made available? Throughout the implementa-tion of the evaluation, the team will need access to the necessary (andpreviously secured – see Chapter 2) finances and equipment to do datacollection. For example, biophysical indicators may require regular accessto boats, crew, sampling equipment and fuel. Having safety equipmentand finances available for possible medical assistance is also essential.Having someone regularly monitoring that resources are available willallow the evaluation team to focus on the work at hand.
❏ Has the team been cleared to do the work? Ensure that all the necessarypermits, approvals and permissions are in place to conduct all the workrequired for the evaluation throughout its duration. Not having theappropriate research and monitoring permits could delay or cancel thework planned for your evaluation.
27
Conducting your evaluation
Step 3-1: Implementyour evaluation
workplan
Step 3-2:Collect data
Step 3-3:Manage
collected data
Step 3-4:Analyse
collected data
Are the datareliable?
Yes
No
Determine sourceof error (e.g. humanor sample); adjust
evaluation plan.
Step 3-5:Encourage peer
review andindependent
validation of results
Chapter 2
Chapter 4. Communicating results
and adapting management
1CHAPTER
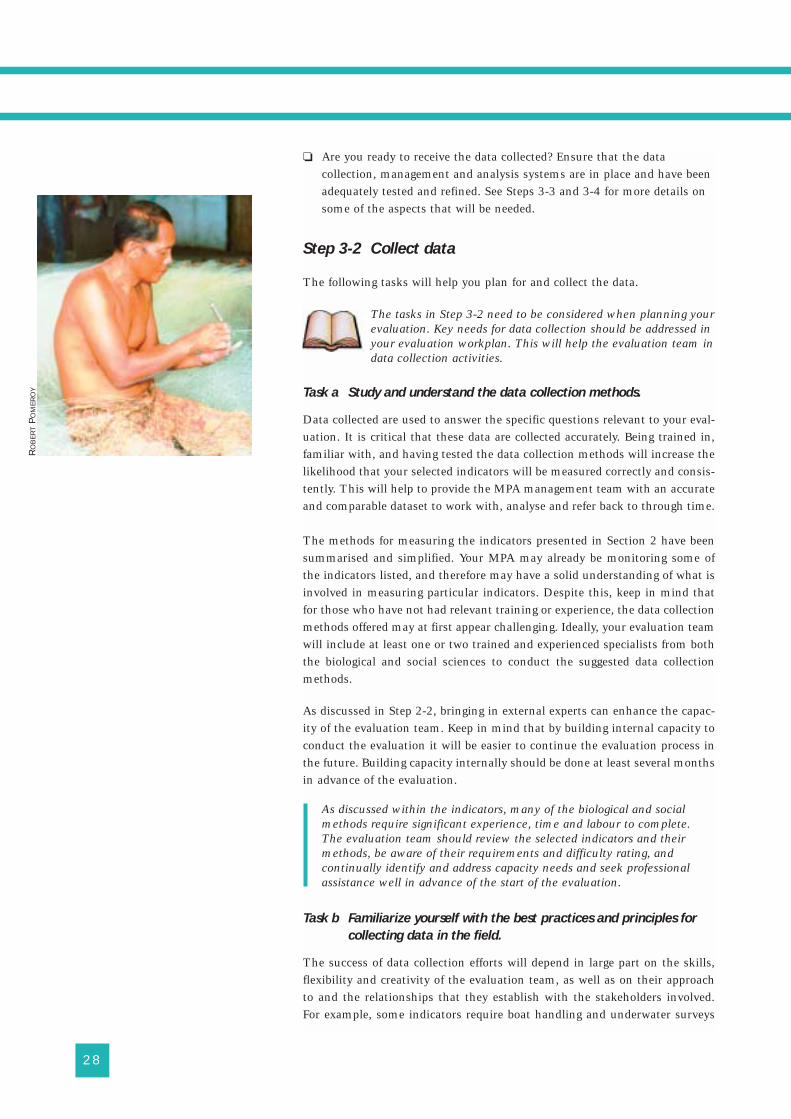
❏ Are you ready to receive the data collected? Ensure that the datacollection, management and analysis systems are in place and have beenadequately tested and refined. See Steps 3-3 and 3-4 for more details onsome of the aspects that will be needed.
Step 3-2 Collect data
The following tasks will help you plan for and collect the data.
The tasks in Step 3-2 need to be considered when planning yourevaluation. Key needs for data collection should be addressed inyour evaluation workplan. This will help the evaluation team indata collection activities.
Task a Study and understand the data collection methods.
Data collected are used to answer the specific questions relevant to your eval-uation. It is critical that these data are collected accurately. Being trained in,familiar with, and having tested the data collection methods will increase thelikelihood that your selected indicators will be measured correctly and consis-tently. This will help to provide the MPA management team with an accurateand comparable dataset to work with, analyse and refer back to through time.
The methods for measuring the indicators presented in Section 2 have beensummarised and simplified. Your MPA may already be monitoring some ofthe indicators listed, and therefore may have a solid understanding of what isinvolved in measuring particular indicators. Despite this, keep in mind thatfor those who have not had relevant training or experience, the data collectionmethods offered may at first appear challenging. Ideally, your evaluation teamwill include at least one or two trained and experienced specialists from boththe biological and social sciences to conduct the suggested data collectionmethods.
As discussed in Step 2-2, bringing in external experts can enhance the capac-ity of the evaluation team. Keep in mind that by building internal capacity toconduct the evaluation it will be easier to continue the evaluation process inthe future. Building capacity internally should be done at least several monthsin advance of the evaluation.
As discussed within the indicators, many of the biological and socialmethods require significant experience, time and labour to complete.The evaluation team should review the selected indicators and theirmethods, be aware of their requirements and difficulty rating, andcontinually identify and address capacity needs and seek professionalassistance well in advance of the start of the evaluation.
Task b Familiarize yourself with the best practices and principles for
collecting data in the field.
The success of data collection efforts will depend in large part on the skills,flexibility and creativity of the evaluation team, as well as on their approachto and the relationships that they establish with the stakeholders involved.For example, some indicators require boat handling and underwater surveys
28
RO
BE
RT
PO
ME
RO
Y
A list of best practices and guiding principles on how to conductsurveys and interviews is available online athttp://effectiveMPA.noaa.gov/guidebook/Bunce.html
requiring the use of compressed air or mixed gas. In such cases internationallyapproved and accredited boating navigation and dive safety standards must befollowed. This may require training or certification by members within theevaluation team prior to data collection.
Task c Determine the sampling approach.
A well-defined sampling approach will ensure that the data collected areaccurate and robust. It can provide your team with greater interpretive powerand a higher degree of confidence for decision-making.
First, the evaluation team should decide on the sampling units for collectingecological and social data. For example, the sampling unit for a socio-economic indicator could be an individual, a household or a stakeholdergroup. Knowing which sampling units are required will help to determine thebest approach to data collection.
The following should be considered when developing a sampling approach:
❏ Define the sampling site(s). This should include a spatial definition ofthe geographic locations within the MPA and nearby local communities,that are being measured. For experimental designs, reference (control)sites outside the MPA or community can be included.
❏ Choose the type of sampling, for example, non-random sampling orrandom sampling.
❏ When conducting biological surveys, ideally sample within at least threerandomly generated replicates at a designated sample site. Maintainsimilar habitat types and stratify samples along consistent depth/contourprofiles. For example, if a biological survey includes two designatedsampling sites within the MPA and two designated sites outside theMPA (total of four sites), a minimum of three replicates of the surveymust be conducted at random locations within each of these designatedsampling sites (12 replicates). The use of replicates is required to mini-mize variability and increase the confidence level of sampled resultsreflecting actual conditions. The need and use of replicates withinbiological surveys is explained further within English et al. (1997).
29
For additional guidance on sampling approaches go online tohttp://effectiveMPA.noaa.gov/guidebook/sampling.html. If you are notfamiliar with sampling or are aiming to conduct statistical analysis on datacollected, consult qualified experts prior to implementation.
CH
AP
TER
3C
on
du
ctin
g y
ou
r evalu
atio
nT
ON
YE
CK
ER
SLE
YT
ON
YE
CK
ER
SLE
Y
Task d Ensure everything is in place for data collection.
❏ Evaluation team is established; each member has clear tasks andtraining.
❏ Evaluation and data collection activities fall within the planned timeline.❏ Logistics, materials and tools are available and ready to use.❏ Sampling unit and area are defined.❏ The measurement methods and techniques (such as interview question-
naires) have been tested.❏ A system to manage, store and analyse information and data is ready for
data entry.
Step 3-3 Manage collected data
Once the selected indicators have been measured the results will need to beprocessed. This process is commonly referred to as data management.This is a critical, and often overlooked, stage of the data collection and analy-sis process.
Each of the steps in Step 3-3 should be included in the evaluation workplan.This will help the evaluation team understand exactly what happens to dataonce they have been collected. If the planning information is detailed and noteasily summarised, you can create a separate ‘data management’ document asan appendix to the workplan.
The following tasks provide an overview of the aspects of data management:
Task a Determine who will be the ‘data manager’.
Identify a member of the evaluation team to be the ‘data manager’ who willreceive all the collected data for each selected indicator. In some cases thismay be the evaluation team leader, or perhaps the same person collecting therelevant information (e.g. the team socio-economist). In other cases there maybe a person who is responsible for receiving and handling information, suchas a data analyst or a computer specialist.
Task b Determine how collected data will be submitted to the data
manager.
This will provide a clear and common understanding for both the personsubmitting data (data collector) and the person receiving the data (datamanager) to know what type and in what form the data will be submitted.This will greatly improve the accuracy and efficiency of the evaluation.
The type of information being collected will depend on the indicator beingmeasured. The types of information include:
❏ Numerical (quantitative), such as a ranking score, the number of timesan organism is observed, a table of numbers, or a total area (km2).
❏ Textual (qualitative), such as a word, a few sentences, or a story.❏ Graphical, such as a map or a photo.
30
TO
NY
EC
KE
RS
LEY
The form in which specific information will be submitted depends on the typeof data.
All numerical data may be given to the data manager in the form of a tablethat the data manager has provided prior to the data collection. Or total areascan be submitted along with the original maps from which the area wascalculated.
Textual data may be submitted in the form of a cassette recording, or as anelectronic transcript (written) of this recording. Or household survey responsescould be original hand-written responses recorded on the data forms or notestaken on notepaper (this would also assume that the data manager has goodhandwriting recognition skills!).
Task c Code the data.
Data coding is the process of translating each datum point to prepare foranalysis. This translation requires a code sheet where the meanings of datacollected and their codes are available to the data manager. Identify a memberof the evaluation team who will code the data.
In some cases, two or three different words collected as a response to an inter-view question may be coded (translated) as a single equivalent number. Forexample, the responses “sometimes”, “frequently”, and “always” equal “1”,whereas “never” equals “0”. In other cases, the original datum point and thecode may be exactly the same. For example, a numerical ranking (“1”, “2”,“3”) or a single word choice from a respondent survey (“yes”, “no”) may be thecode.
As a general rule-of-thumb, collecting data should be done with datacoding in mind so as to lessen the amount of coding for the data managerand reduce data management time. The specific data codes shoulddepend entirely on how the data are to be analysed and used. Coding ofdata should be as simple as possible and, as far as is feasible, it should beconsistent.
Task d Develop a system for storing and entering the data.
As each datum point is coded, it should also be entered. Data entry is the(often lengthy and tedious) process of moving coded data into a permanentstorage location from which to export the data so that it can be analysed. Thispermanent storage location is known as a database.
How data are entered depends on what type of database is being used and theresources, skills and infrastructure available to the evaluation team and datamanager. In most cases the data manager will enter coded data generated fromthe evaluation into a specified, electronic ‘MPA management effectiveness’database, using a computer and software. In such cases, coded quantitativedata are entered into a spreadsheet or database programme, and coded quali-tative and graphic data are entered into a word processing programme. Atsome sites, a sufficient and appropriate database may be a filing system ofpaper and folders or a box of index cards kept in a safe place.
31
CH
AP
TER
3C
on
du
ctin
g y
ou
r evalu
atio
n
TO
NY
EC
KE
RS
LEY
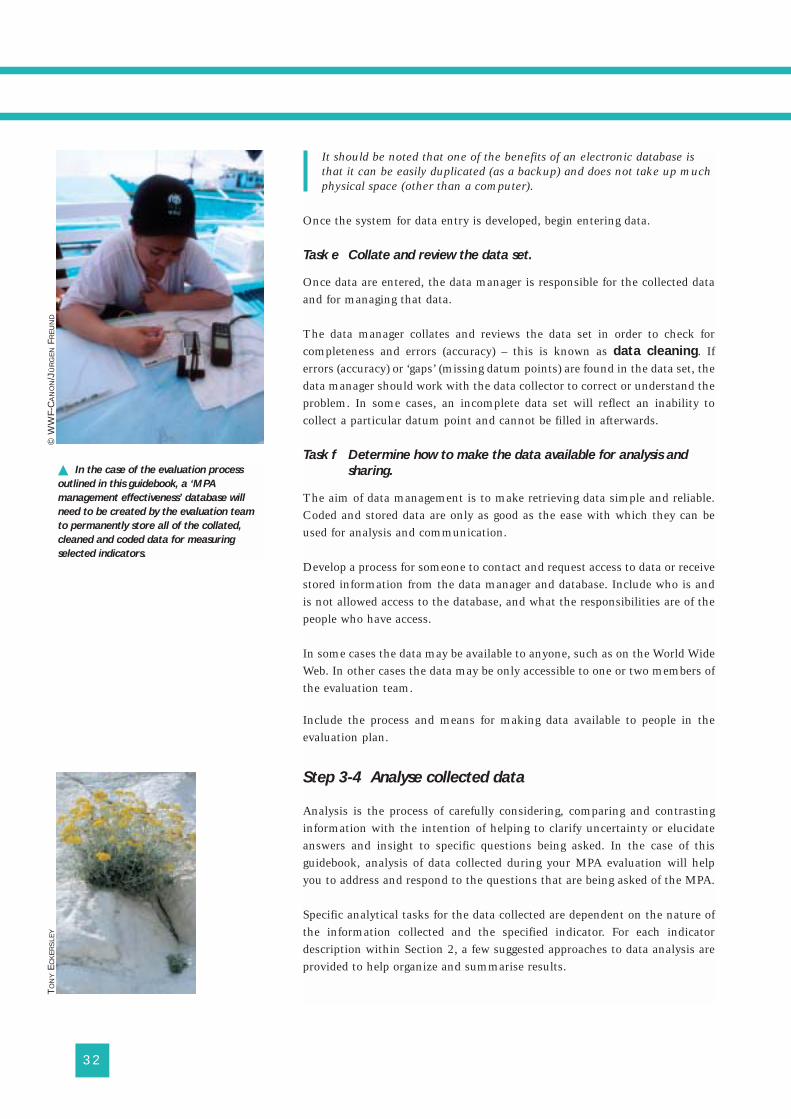
32
It should be noted that one of the benefits of an electronic database isthat it can be easily duplicated (as a backup) and does not take up muchphysical space (other than a computer).
Once the system for data entry is developed, begin entering data.
Task e Collate and review the data set.
Once data are entered, the data manager is responsible for the collected dataand for managing that data.
The data manager collates and reviews the data set in order to check forcompleteness and errors (accuracy) – this is known as data cleaning. Iferrors (accuracy) or ‘gaps’ (missing datum points) are found in the data set, thedata manager should work with the data collector to correct or understand theproblem. In some cases, an incomplete data set will reflect an inability tocollect a particular datum point and cannot be filled in afterwards.
Task f Determine how to make the data available for analysis and
sharing.
The aim of data management is to make retrieving data simple and reliable.Coded and stored data are only as good as the ease with which they can beused for analysis and communication.
Develop a process for someone to contact and request access to data or receivestored information from the data manager and database. Include who is andis not allowed access to the database, and what the responsibilities are of thepeople who have access.
In some cases the data may be available to anyone, such as on the World WideWeb. In other cases the data may be only accessible to one or two members ofthe evaluation team.
Include the process and means for making data available to people in theevaluation plan.
Step 3-4 Analyse collected data
Analysis is the process of carefully considering, comparing and contrastinginformation with the intention of helping to clarify uncertainty or elucidateanswers and insight to specific questions being asked. In the case of thisguidebook, analysis of data collected during your MPA evaluation will helpyou to address and respond to the questions that are being asked of the MPA.
Specific analytical tasks for the data collected are dependent on the nature ofthe information collected and the specified indicator. For each indicatordescription within Section 2, a few suggested approaches to data analysis areprovided to help organize and summarise results.
� In the case of the evaluation process
outlined in this guidebook, a ‘MPA
management effectiveness’ database will
need to be created by the evaluation team
to permanently store all of the collated,
cleaned and coded data for measuring
selected indicators.
TO
NY
EC
KE
RS
LEY
© W
WF-
CA
NO
N/J
ÜR
GE
NFR
EU
ND
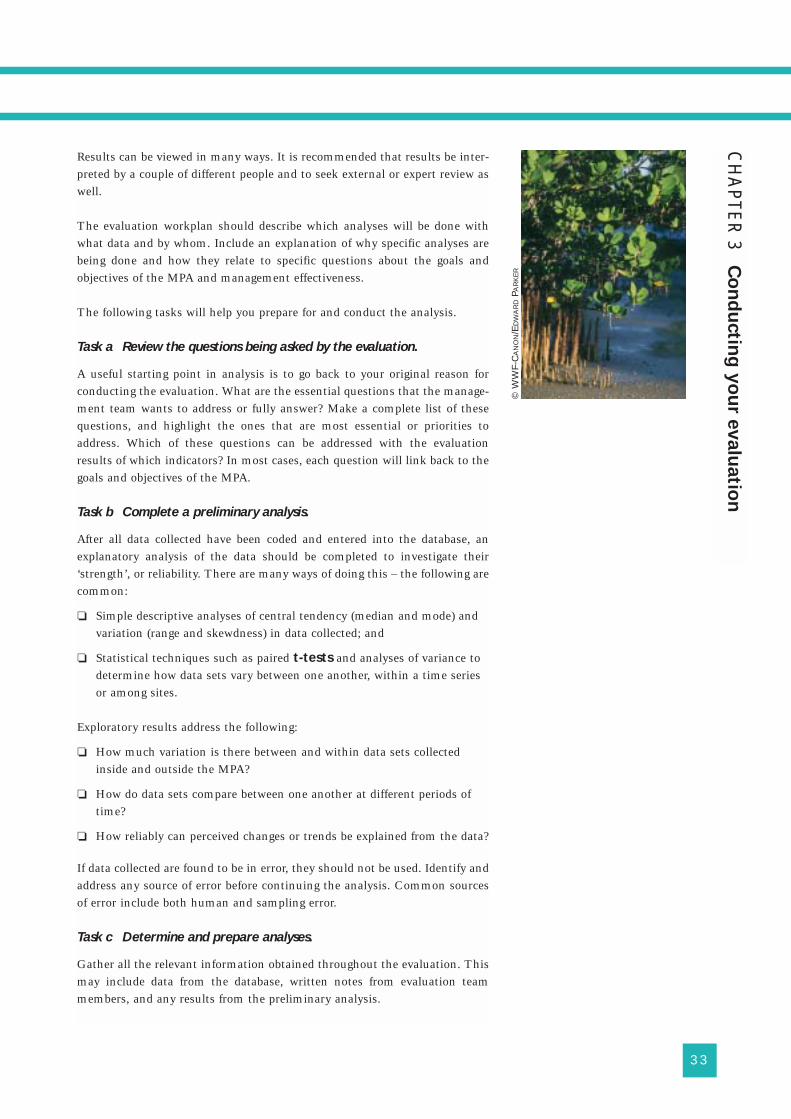
Results can be viewed in many ways. It is recommended that results be inter-preted by a couple of different people and to seek external or expert review aswell.
The evaluation workplan should describe which analyses will be done withwhat data and by whom. Include an explanation of why specific analyses arebeing done and how they relate to specific questions about the goals andobjectives of the MPA and management effectiveness.
The following tasks will help you prepare for and conduct the analysis.
Task a Review the questions being asked by the evaluation.
A useful starting point in analysis is to go back to your original reason forconducting the evaluation. What are the essential questions that the manage-ment team wants to address or fully answer? Make a complete list of thesequestions, and highlight the ones that are most essential or priorities toaddress. Which of these questions can be addressed with the evaluationresults of which indicators? In most cases, each question will link back to thegoals and objectives of the MPA.
Task b Complete a preliminary analysis.
After all data collected have been coded and entered into the database, anexplanatory analysis of the data should be completed to investigate their‘strength’, or reliability. There are many ways of doing this – the following arecommon:
❏ Simple descriptive analyses of central tendency (median and mode) andvariation (range and skewdness) in data collected; and
❏ Statistical techniques such as paired t-tests and analyses of variance todetermine how data sets vary between one another, within a time seriesor among sites.
Exploratory results address the following:
❏ How much variation is there between and within data sets collectedinside and outside the MPA?
❏ How do data sets compare between one another at different periods oftime?
❏ How reliably can perceived changes or trends be explained from the data?
If data collected are found to be in error, they should not be used. Identify andaddress any source of error before continuing the analysis. Common sourcesof error include both human and sampling error.
Task c Determine and prepare analyses.
Gather all the relevant information obtained throughout the evaluation. Thismay include data from the database, written notes from evaluation teammembers, and any results from the preliminary analysis.
33
CH
AP
TER
3C
on
du
ctin
g y
ou
r evalu
atio
n
© W
WF-
CA
NO
N/E
DW
AR
DPA
RK
ER
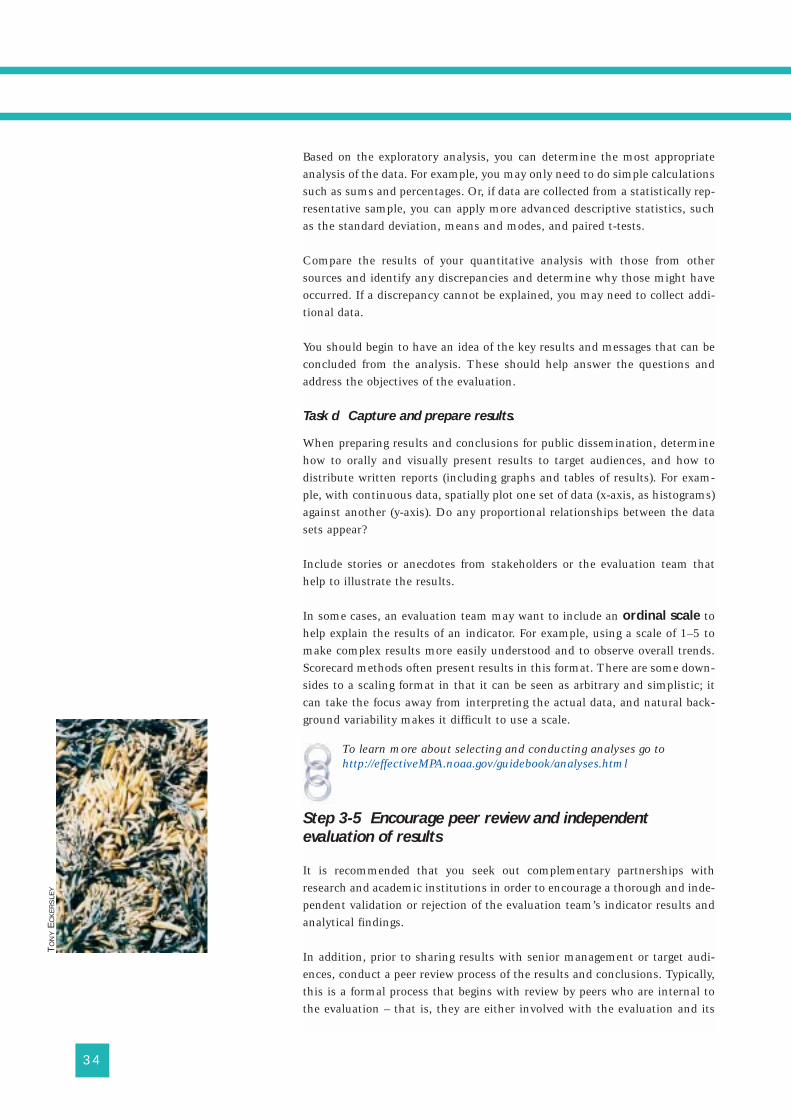
Based on the exploratory analysis, you can determine the most appropriateanalysis of the data. For example, you may only need to do simple calculationssuch as sums and percentages. Or, if data are collected from a statistically rep-resentative sample, you can apply more advanced descriptive statistics, suchas the standard deviation, means and modes, and paired t-tests.
Compare the results of your quantitative analysis with those from othersources and identify any discrepancies and determine why those might haveoccurred. If a discrepancy cannot be explained, you may need to collect addi-tional data.
You should begin to have an idea of the key results and messages that can beconcluded from the analysis. These should help answer the questions andaddress the objectives of the evaluation.
Task d Capture and prepare results.
When preparing results and conclusions for public dissemination, determinehow to orally and visually present results to target audiences, and how todistribute written reports (including graphs and tables of results). For exam-ple, with continuous data, spatially plot one set of data (x-axis, as histograms)against another (y-axis). Do any proportional relationships between the datasets appear?
Include stories or anecdotes from stakeholders or the evaluation team thathelp to illustrate the results.
In some cases, an evaluation team may want to include an ordinal scale tohelp explain the results of an indicator. For example, using a scale of 1–5 tomake complex results more easily understood and to observe overall trends.Scorecard methods often present results in this format. There are some down-sides to a scaling format in that it can be seen as arbitrary and simplistic; itcan take the focus away from interpreting the actual data, and natural back-ground variability makes it difficult to use a scale.
To learn more about selecting and conducting analyses go tohttp://effectiveMPA.noaa.gov/guidebook/analyses.html
Step 3-5 Encourage peer review and independent
evaluation of results
It is recommended that you seek out complementary partnerships withresearch and academic institutions in order to encourage a thorough and inde-pendent validation or rejection of the evaluation team’s indicator results andanalytical findings.
In addition, prior to sharing results with senior management or target audi-ences, conduct a peer review process of the results and conclusions. Typically,this is a formal process that begins with review by peers who are internal tothe evaluation – that is, they are either involved with the evaluation and its
34
TO
NY
EC
KE
RS
LEY
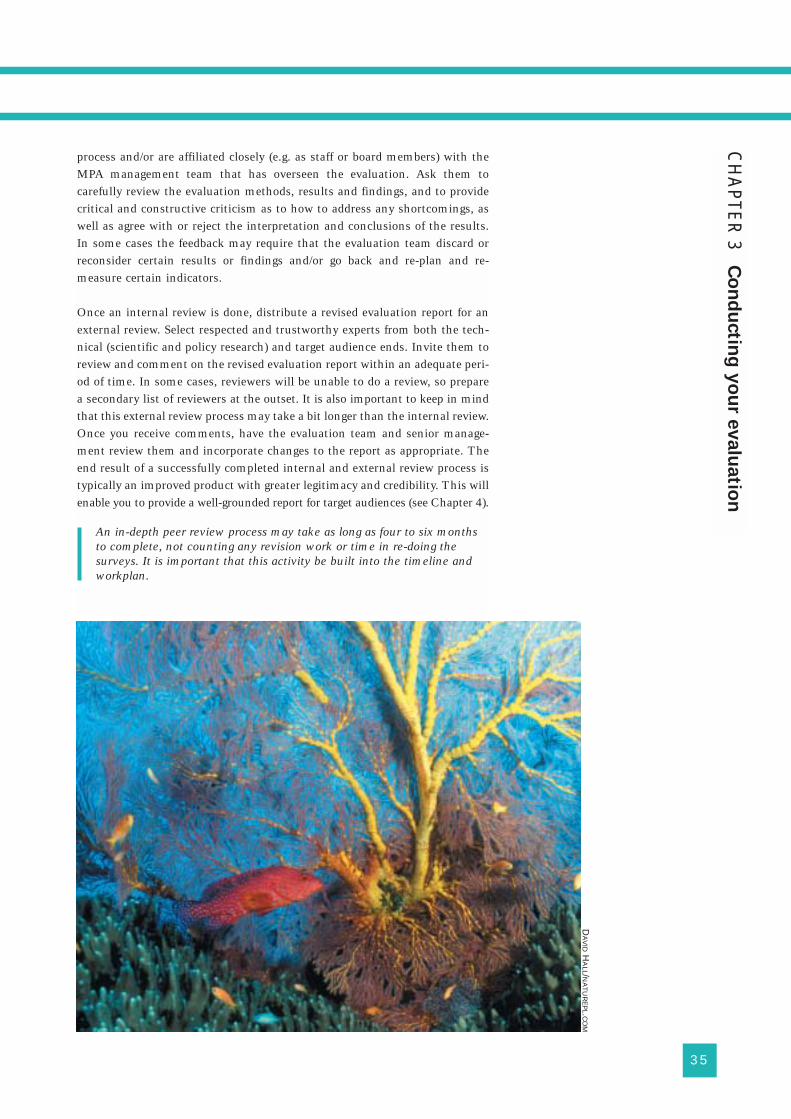
process and/or are affiliated closely (e.g. as staff or board members) with theMPA management team that has overseen the evaluation. Ask them tocarefully review the evaluation methods, results and findings, and to providecritical and constructive criticism as to how to address any shortcomings, aswell as agree with or reject the interpretation and conclusions of the results.In some cases the feedback may require that the evaluation team discard orreconsider certain results or findings and/or go back and re-plan and re-measure certain indicators.
Once an internal review is done, distribute a revised evaluation report for anexternal review. Select respected and trustworthy experts from both the tech-nical (scientific and policy research) and target audience ends. Invite them toreview and comment on the revised evaluation report within an adequate peri-od of time. In some cases, reviewers will be unable to do a review, so preparea secondary list of reviewers at the outset. It is also important to keep in mindthat this external review process may take a bit longer than the internal review.Once you receive comments, have the evaluation team and senior manage-ment review them and incorporate changes to the report as appropriate. Theend result of a successfully completed internal and external review process istypically an improved product with greater legitimacy and credibility. This willenable you to provide a well-grounded report for target audiences (see Chapter 4).
An in-depth peer review process may take as long as four to six monthsto complete, not counting any revision work or time in re-doing thesurveys. It is important that this activity be built into the timeline andworkplan.
35
CH
AP
TER
3C
on
du
ctin
g y
ou
r evalu
atio
n
DA
VID
HA
LL/NA
TU
RE
PL.C
OM
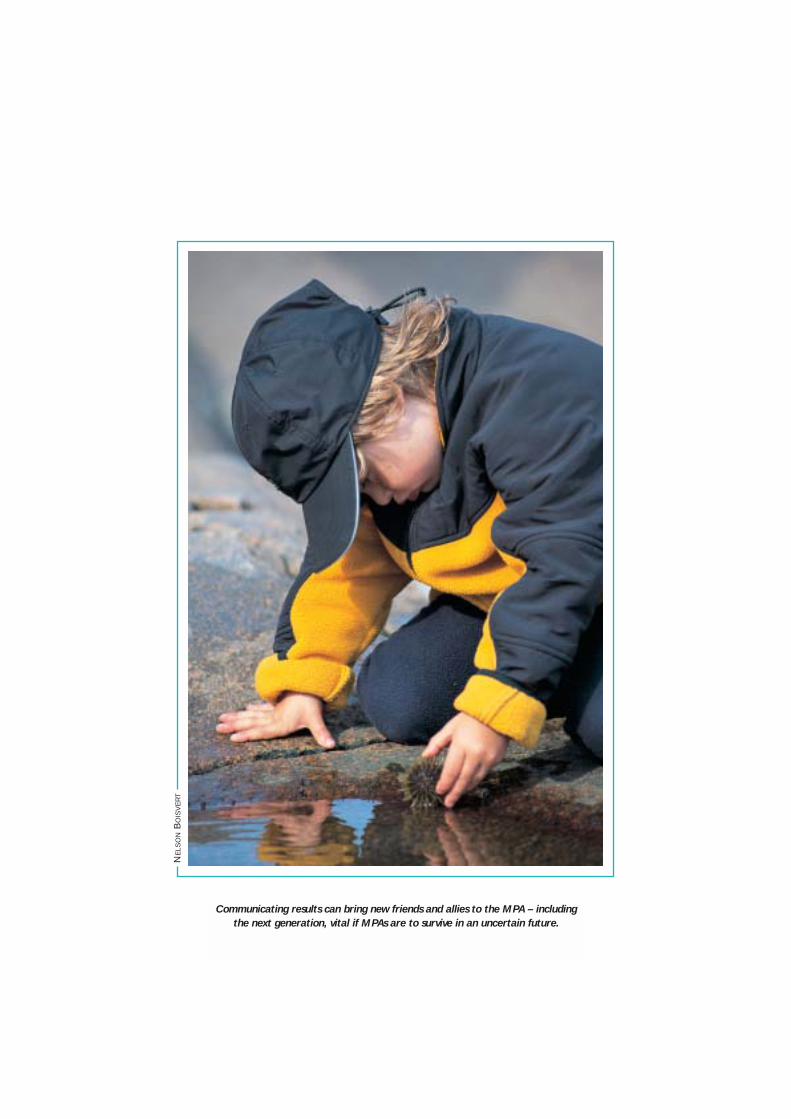
Communicating results can bring new friends and allies to the MPA – including
the next generation, vital if MPAs are to survive in an uncertain future.
NE
LSO
NB
OIS
VE
RT
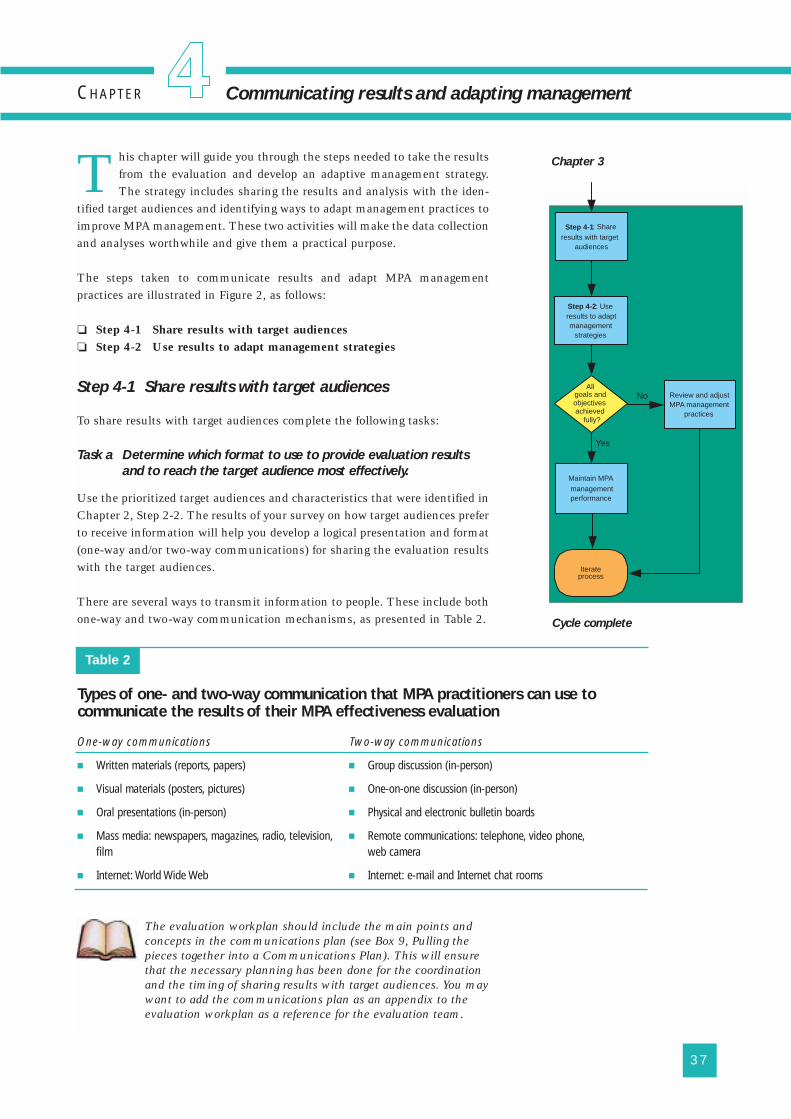
This chapter will guide you through the steps needed to take the resultsfrom the evaluation and develop an adaptive management strategy.The strategy includes sharing the results and analysis with the iden-
tified target audiences and identifying ways to adapt management practices toimprove MPA management. These two activities will make the data collectionand analyses worthwhile and give them a practical purpose.
The steps taken to communicate results and adapt MPA managementpractices are illustrated in Figure 2, as follows:
❏ Step 4-1 Share results with target audiences❏ Step 4-2 Use results to adapt management strategies
Step 4-1 Share results with target audiences
To share results with target audiences complete the following tasks:
Task a Determine which format to use to provide evaluation results
and to reach the target audience most effectively.
Use the prioritized target audiences and characteristics that were identified inChapter 2, Step 2-2. The results of your survey on how target audiences preferto receive information will help you develop a logical presentation and format(one-way and/or two-way communications) for sharing the evaluation resultswith the target audiences.
There are several ways to transmit information to people. These include bothone-way and two-way communication mechanisms, as presented in Table 2.
37
Communicating results and adapting management
The evaluation workplan should include the main points andconcepts in the communications plan (see Box 9, Pulling thepieces together into a Communications Plan). This will ensurethat the necessary planning has been done for the coordinationand the timing of sharing results with target audiences. You maywant to add the communications plan as an appendix to theevaluation workplan as a reference for the evaluation team.
Table 2
Types of one- and two-way communication that MPA practitioners can use tocommunicate the results of their MPA effectiveness evaluation
One-way communications Two-way communications
� Written materials (reports, papers) � Group discussion (in-person)
� Visual materials (posters, pictures) � One-on-one discussion (in-person)
� Oral presentations (in-person) � Physical and electronic bulletin boards
� Mass media: newspapers, magazines, radio, television, � Remote communications: telephone, video phone,film web camera
� Internet: World Wide Web � Internet: e-mail and Internet chat rooms
Step 4-1: Shareresults with target
audiences
goals and
achieved fully?
Step 4-2: Useresults to adaptmanagement
strategies
Iterateprocess
Review and adjustMPA management
practices
Yes
No
Maintain MPAmanagementperformance
All
objectives
Chapter 3
Cycle complete
Table 2
1 CHAPTER
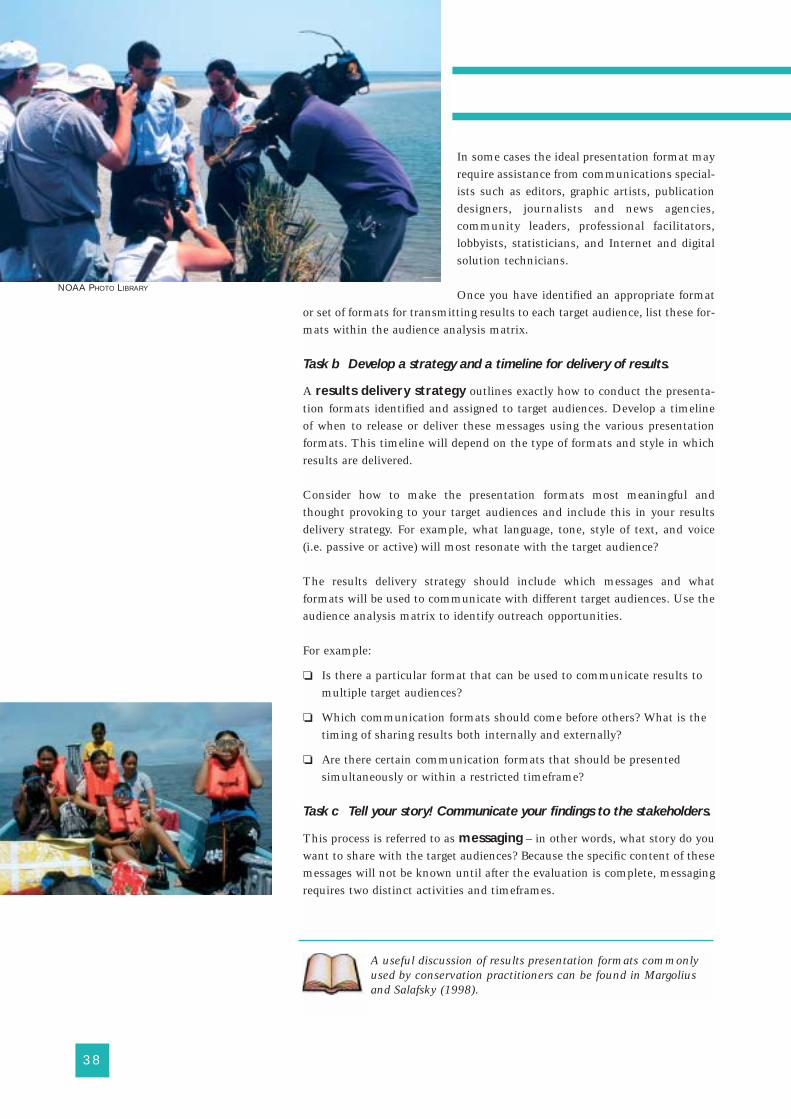
In some cases the ideal presentation format mayrequire assistance from communications special-ists such as editors, graphic artists, publicationdesigners, journalists and news agencies,community leaders, professional facilitators,lobbyists, statisticians, and Internet and digitalsolution technicians.
Once you have identified an appropriate formator set of formats for transmitting results to each target audience, list these for-mats within the audience analysis matrix.
Task b Develop a strategy and a timeline for delivery of results.
A results delivery strategy outlines exactly how to conduct the presenta-tion formats identified and assigned to target audiences. Develop a timelineof when to release or deliver these messages using the various presentationformats. This timeline will depend on the type of formats and style in whichresults are delivered.
Consider how to make the presentation formats most meaningful andthought provoking to your target audiences and include this in your resultsdelivery strategy. For example, what language, tone, style of text, and voice(i.e. passive or active) will most resonate with the target audience?
The results delivery strategy should include which messages and whatformats will be used to communicate with different target audiences. Use theaudience analysis matrix to identify outreach opportunities.
For example:
❏ Is there a particular format that can be used to communicate results tomultiple target audiences?
❏ Which communication formats should come before others? What is thetiming of sharing results both internally and externally?
❏ Are there certain communication formats that should be presentedsimultaneously or within a restricted timeframe?
Task c Tell your story! Communicate your findings to the stakeholders.
This process is referred to as messaging – in other words, what story do youwant to share with the target audiences? Because the specific content of thesemessages will not be known until after the evaluation is complete, messagingrequires two distinct activities and timeframes.
38
A useful discussion of results presentation formats commonlyused by conservation practitioners can be found in Margoliusand Salafsky (1998).
NOAA PHOTO LIBRARY
❏ At the start of the evaluation, prior to obtaining the results – identify thethemes and concepts of the marine environment and how it is managedthat target audiences are both known to listen to and will want to hearabout when results are available. Select the priority messages to sharewith target audiences.
❏ After obtaining the results – identify the results that relate to the prioritymessages (previously identified) and how they address the themes andconcepts that target audiences want to know about.
Messaging allows the evaluation team and MPA managers to keep in mind thecritical pieces of information that target audiences will be looking for duringthe evaluation and as results are generated. For example, look for interestingor illustrative stories that can be used after the evaluation to support orcontradict the results. Also, highlight results with real-world examples,stories, and anecdotes – these can be powerful tools with certain audiences tobuild interest in results and enhance an MPA manager’s ability to communi-cate important messages.
For example, an important message that could be identified and shared witha commercial fishing target audience may be that the MPA is replenishing fishstocks. Having a story of a fishermen saying that he or she is now catchingmore fish in the MPA/near the MPA/since the MPA was established, willsupport the quantitative evidence that there is a three-fold increase in fishpopulations inside the MPA compared to outside. This will make for a muchstronger message than only presenting the numbers.
A strategic approach to messaging is to ensure that key messages arecommunicated in a way that encourages action or behaviour that is desired by
39
The information from the different steps to be undertaken
to communicate results can then be used to create a
communications plan. This will provide a clear process of
how results will be shared and logically and strategically
organized.
Think of a communications plan as a ‘cheat-sheet’ of how
to best share your stories. A complete communications
plan will contain the following elements:
� An audience analysis matrix (see Chapter 2) identifying
the range of possible internal and external audiences,
their characteristics, and a set of priority target
audiences.
� A strategy for how and where results will be
delivered by identifying which one-way and two-way
presentation formats will be used with each or groups
of target audiences, and the approach and style of
delivery to be taken.
� A set of key messages with illustrative examples and
stories that explain the results and that help to focus
the attention of particular target audiences.
� A timeline of when messages and presentation
formats are to be released and delivered to target
audiences.
Once these pieces of the plan are pulled together, it will
be possible to estimate the time, and human and financial
resources needed to complete the plan. Based on this
estimate, sufficient time and budgeted resources can be
allocated. The resources should be available if the
necessary resources were secured at the outset of the
evaluation (see Chapter 2).
Box 9
CH
AP
TER
4C
om
mu
nic
atin
g re
su
lts a
nd
ad
ap
ting
man
ag
em
en
tPULLING THE PIECES TOGETHER INTO A COMMUNICATIONS PLAN
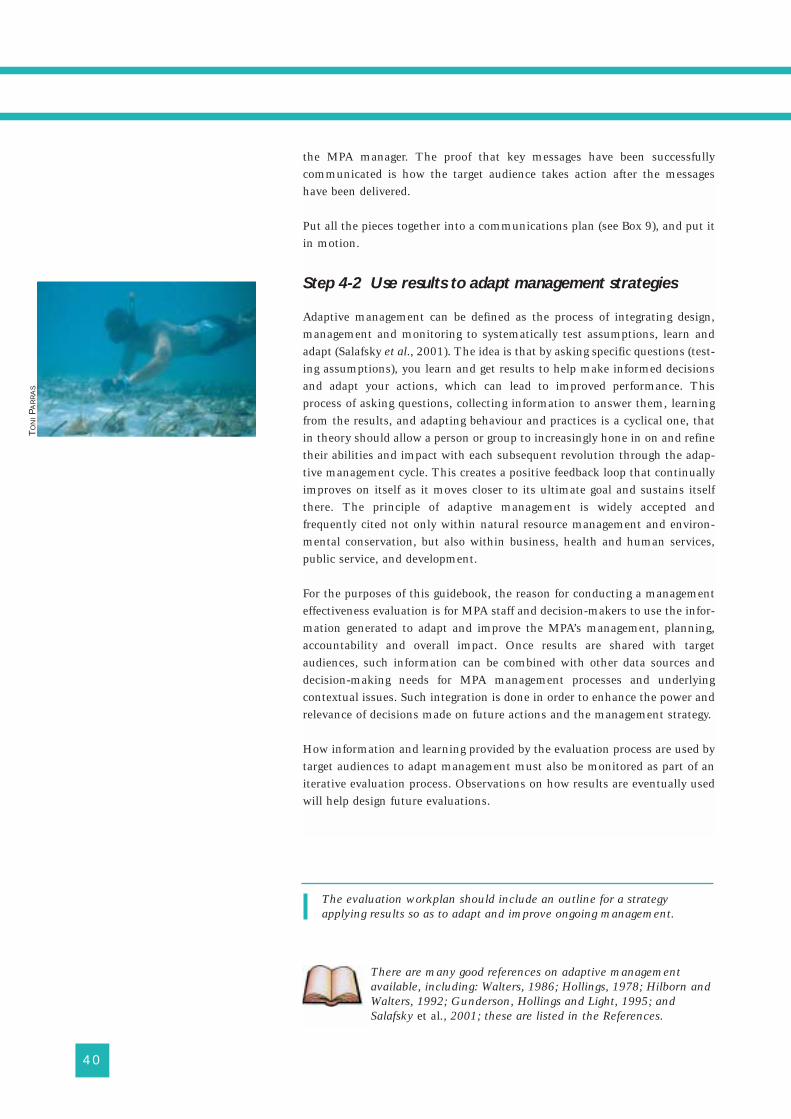
the MPA manager. The proof that key messages have been successfullycommunicated is how the target audience takes action after the messageshave been delivered.
Put all the pieces together into a communications plan (see Box 9), and put itin motion.
Step 4-2 Use results to adapt management strategies
Adaptive management can be defined as the process of integrating design,management and monitoring to systematically test assumptions, learn andadapt (Salafsky et al., 2001). The idea is that by asking specific questions (test-ing assumptions), you learn and get results to help make informed decisionsand adapt your actions, which can lead to improved performance. Thisprocess of asking questions, collecting information to answer them, learningfrom the results, and adapting behaviour and practices is a cyclical one, thatin theory should allow a person or group to increasingly hone in on and refinetheir abilities and impact with each subsequent revolution through the adap-tive management cycle. This creates a positive feedback loop that continuallyimproves on itself as it moves closer to its ultimate goal and sustains itselfthere. The principle of adaptive management is widely accepted andfrequently cited not only within natural resource management and environ-mental conservation, but also within business, health and human services,public service, and development.
For the purposes of this guidebook, the reason for conducting a managementeffectiveness evaluation is for MPA staff and decision-makers to use the infor-mation generated to adapt and improve the MPA’s management, planning,accountability and overall impact. Once results are shared with targetaudiences, such information can be combined with other data sources anddecision-making needs for MPA management processes and underlyingcontextual issues. Such integration is done in order to enhance the power andrelevance of decisions made on future actions and the management strategy.
How information and learning provided by the evaluation process are used bytarget audiences to adapt management must also be monitored as part of aniterative evaluation process. Observations on how results are eventually usedwill help design future evaluations.
40
There are many good references on adaptive managementavailable, including: Walters, 1986; Hollings, 1978; Hilborn andWalters, 1992; Gunderson, Hollings and Light, 1995; andSalafsky et al., 2001; these are listed in the References.
The evaluation workplan should include an outline for a strategyapplying results so as to adapt and improve ongoing management.
TO
NIPA
RR
AS
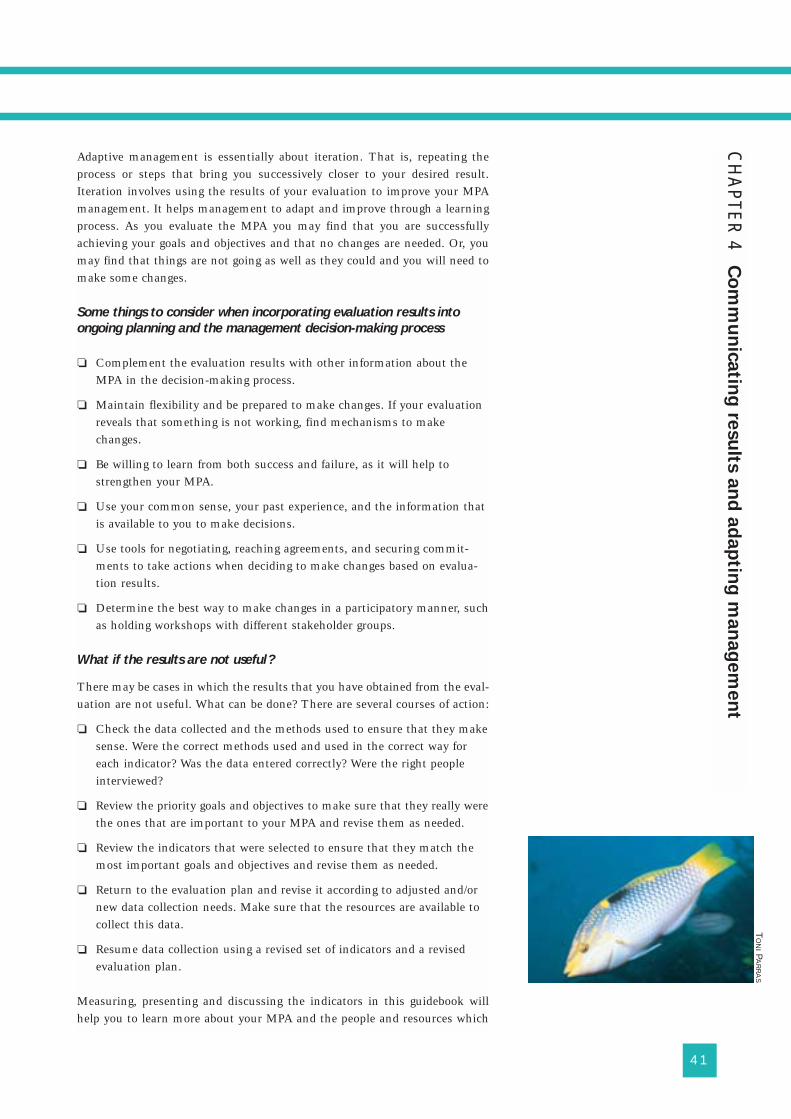
Adaptive management is essentially about iteration. That is, repeating theprocess or steps that bring you successively closer to your desired result.Iteration involves using the results of your evaluation to improve your MPAmanagement. It helps management to adapt and improve through a learningprocess. As you evaluate the MPA you may find that you are successfullyachieving your goals and objectives and that no changes are needed. Or, youmay find that things are not going as well as they could and you will need tomake some changes.
Some things to consider when incorporating evaluation results into
ongoing planning and the management decision-making process
❏ Complement the evaluation results with other information about theMPA in the decision-making process.
❏ Maintain flexibility and be prepared to make changes. If your evaluationreveals that something is not working, find mechanisms to makechanges.
❏ Be willing to learn from both success and failure, as it will help tostrengthen your MPA.
❏ Use your common sense, your past experience, and the information thatis available to you to make decisions.
❏ Use tools for negotiating, reaching agreements, and securing commit-ments to take actions when deciding to make changes based on evalua-tion results.
❏ Determine the best way to make changes in a participatory manner, suchas holding workshops with different stakeholder groups.
What if the results are not useful?
There may be cases in which the results that you have obtained from the eval-uation are not useful. What can be done? There are several courses of action:
❏ Check the data collected and the methods used to ensure that they makesense. Were the correct methods used and used in the correct way foreach indicator? Was the data entered correctly? Were the right peopleinterviewed?
❏ Review the priority goals and objectives to make sure that they really werethe ones that are important to your MPA and revise them as needed.
❏ Review the indicators that were selected to ensure that they match themost important goals and objectives and revise them as needed.
❏ Return to the evaluation plan and revise it according to adjusted and/ornew data collection needs. Make sure that the resources are available tocollect this data.
❏ Resume data collection using a revised set of indicators and a revisedevaluation plan.
Measuring, presenting and discussing the indicators in this guidebook willhelp you to learn more about your MPA and the people and resources which
41
CH
AP
TER
4C
om
mu
nic
atin
g re
su
lts a
nd
ad
ap
ting
man
ag
em
en
t
TO
NIP
AR
RA
S
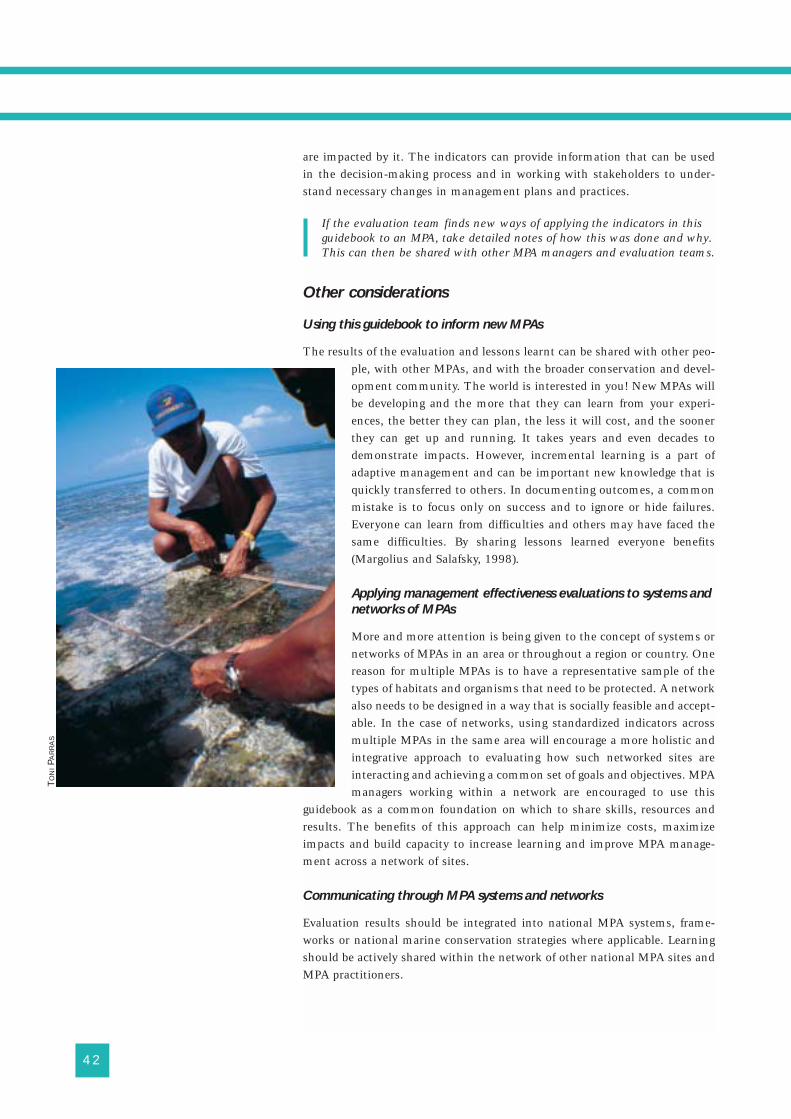
are impacted by it. The indicators can provide information that can be usedin the decision-making process and in working with stakeholders to under-stand necessary changes in management plans and practices.
If the evaluation team finds new ways of applying the indicators in thisguidebook to an MPA, take detailed notes of how this was done and why.This can then be shared with other MPA managers and evaluation teams.
Other considerations
Using this guidebook to inform new MPAs
The results of the evaluation and lessons learnt can be shared with other peo-ple, with other MPAs, and with the broader conservation and devel-opment community. The world is interested in you! New MPAs willbe developing and the more that they can learn from your experi-ences, the better they can plan, the less it will cost, and the soonerthey can get up and running. It takes years and even decades todemonstrate impacts. However, incremental learning is a part ofadaptive management and can be important new knowledge that isquickly transferred to others. In documenting outcomes, a commonmistake is to focus only on success and to ignore or hide failures.Everyone can learn from difficulties and others may have faced thesame difficulties. By sharing lessons learned everyone benefits(Margolius and Salafsky, 1998).
Applying management effectiveness evaluations to systems and
networks of MPAs
More and more attention is being given to the concept of systems ornetworks of MPAs in an area or throughout a region or country. Onereason for multiple MPAs is to have a representative sample of thetypes of habitats and organisms that need to be protected. A networkalso needs to be designed in a way that is socially feasible and accept-able. In the case of networks, using standardized indicators acrossmultiple MPAs in the same area will encourage a more holistic andintegrative approach to evaluating how such networked sites areinteracting and achieving a common set of goals and objectives. MPAmanagers working within a network are encouraged to use this
guidebook as a common foundation on which to share skills, resources andresults. The benefits of this approach can help minimize costs, maximizeimpacts and build capacity to increase learning and improve MPA manage-ment across a network of sites.
Communicating through MPA systems and networks
Evaluation results should be integrated into national MPA systems, frame-works or national marine conservation strategies where applicable. Learningshould be actively shared within the network of other national MPA sites andMPA practitioners.
42
TO
NIPA
RR
AS
43
References. Works cited in Section 1 and other useful materials
Marine Protected Areas (including
management and evaluation)
Alder, J., Zeller, D., Pitcher, T.J. and Sumaila, U.R.(2002). “A method for evaluating marineprotected area management”. CoastalManagement 30(2): 121–131.
Agardy, T. (2000). “Information needs for marineprotected areas: scientific and societal”.Bulletin of Marine Science 66(3): 875–888.
Agardy, T.S. (1997). Marine Protected Areas andOcean Conservation. Academic Press, SanDiego, CA and R. E. Landes Co., Austin, TX,USA.
Agardy, M.T. (1995). The Science of Conservationin the Coastal Zone: new insights on how todesign, implement, and monitor marineprotected areas. IUCN Marine Conservationand Development Report. IUCN, Gland,Switzerland and Cambridge, UK.
Day, J.C. (2002). “Marine Park Management andMonitoring: Lessons for adaptive managementfrom the Great Barrier Reef”. In S. Bondrup-Nielsen, N.W.P. Munro, G. Nelson, J.H. MartinWillison, T.B. Herman and P. Eagles (eds.),Managing Protected Areas in a Changing World.SAMPA IV, Wolfville, Canada.
Kelleher, G. (1999). Guidelines for MarineProtected Areas. IUCN, Gland, Switzerlandand Cambridge, UK.
Kelleher, G., Bleakley, C. and Wells, S. (eds.)(1995). A Global Representative System ofMarine Protected Areas. The Great Barrier ReefMarine Park Authority, The World Bank,IUCN, Washington, DC, USA.
Kelleher, G. and Kenchington, R. (1992).Guidelines for Establishing Marine ProtectedAreas. A Marine Conservation andDevelopment Report. IUCN, Gland, Switzer-land.
Kenchington, R.A. (1990). Managing MarineEnvironments. Taylor and Francis, New York,NY, USA.
Mangubhai, S. and Wells, S. (2004, in draft).Assessing Management Effectiveness of MarineProtected Areas: A workbook for the WesternIndian Ocean. IUCN, Eastern Africa RegionalProgramme.
Roberts, C. and Hawkings J. (2000). A Manual forFully-Protected Areas. World Wide Fund forNature, Gland, Switzerland.
Salm, R.V., Clark, J.R., Siirila, E. (2000). Marineand Coastal Protected Areas: A Guide forPlanners and Managers (3rd Edition). IUCN,Washington, DC, USA.
Sumaila, U.R. (2002). “Marine protected areaperformance in a model of the fishery”.Natural Resource Modeling 15(4): 439–451.
Management Effectiveness
Hockings, M., Stolton, S. and Dudley, N. (2000).Evaluating Effectiveness: A Framework forAssessing the Management of Protected Areas.IUCN, Gland, Switzerland and Cambridge,UK.
Jameson, S.C., Tupper, M. and Ridley J. (2002).“The three screen doors: can marine protectedareas be effective?” Marine Pollution Bulletin44: 1177–1183.
Selecting Environmental Indicators
(Chapter 1)
Dixon, J., Kunte A. and Pagiola S. (1996).Environmental Performance Indicators. WorldBank Environment Department Note. TheWorld Bank, Washington, DC, USA.
Hammond, A., Adriaanse, A., Rodenburg, E.,Bryant, D. and Woodward R. (1995).Environmental Indicators: A SystematicApproach to Measuring and Reporting onEnvironmental Policy Performance in theContext of Sustainable Development. WorldResources Institute, Washington, DC, USA.
Hunsaker, C.T. and Carpenter D.E. (1990).Ecological Indicators for the EnvironmentalMonitoring and Assessment Program. EPA600/3-90/060. United States EnvironmentalProtection Agency, Office of Research andDevelopment, Research Triangle Park, NC,USA.
Thomas, W.A. (ed.) (1972). Indicators of environ-mental quality. Plenum Press, New York, NY,USA.
Tunsdall, D., Hammond, A. and Henniger, N.(1994). Developing Environmental Indicators:A report on the World Resources InstituteWorkshop on Global Environmental Indicators,December 7–8 1992. The World ResourcesInstitute, Washington, DC, USA.
World Bank (1996). Performance MonitoringIndicators: a handbook for task managers. TheWorld Bank, Washington, DC, USA.
Developing Monitoring and Evaluation
Plans (Chapter 2)
Campbell, R.A., Mapstone, B.D. and Smith,A.D.M. (2001). “Evaluating large-scale experi-mental designs for management of coral trouton the Great Barrier Reef”. EcologicalApplications 11(6): 1763–1777.
44
Munn, R.E. (1988). “The design of integratedmonitoring systems to provide early indica-tions of environmental/ecological changes”.Environmental Monitoring and Assessment 11:203–217.
Margolius, R.A. and Salafsky, N. (1998). Measuresof Success: designing, managing, and monitor-ing conservation and development projects.Island Press, Washington, DC, USA.
Data Collection and Analysis
(Chapter 3)
Bunce, L., Townsley, P., Pomeroy, R. and Pollnac,R. (2000). Socioeconomic Manual for CoralReef Management. Australian Institute forMarine Science, Townsville, Queensland,Australia.
Clarke, K.R. and Warwick R.M. (2001). Change inmarine communities: An Approach toStatistical Analysis and Interpretation. 2ndedition. Primer-E, Plymouth, UK.
Elliot J.M. (1977). “Some methods for statisticalanalysis of benthic invertebrates”. Freshw. Biol.Assoc. Sci. Publ., U.K. 25: 1–156.
English, S., Wilkinson, C. and Baker, V. (eds.)(1997). Survey Manual for Tropical MarineResources. 2nd Edition. Australian Institute forMarine Science, Townsville, Queensland,Australia.
Fairweather, P.G. (1991). “Statistical power anddesign requirements for environmentalmonitoring”. Australian Journal of Marine andFreshwater Research 42: 555–567.
Green, R.H. (1979). Sampling Design andStatistical Methods for EnvironmentalScientists. John Wiley and Sons, New York, NY,USA.
Green, R.H. (1989). “Power analysis and practicalstrategies for environmental monitoring”.Environmental Research 50: 195–205.
Hilborn, R. and Walters, C.J. (1992). QuantitativeFisheries Stock Assessment: Choice, dynamics,and uncertainty. Chapman and Hall, NewYork, NY, USA.
Margolius, R.A. and Salafsky, N. (1998). Measuresof Success: designing, managing, and monitor-ing conservation and development projects.Island Press, Washington, DC, USA.
McAllister, M.K. and Petermen, R.M. (1992).“Experimental design in management of fish-eries: a review”. N. Am. J. Fish. Manage 3:586–605.
Schaeffer, D.J., Herricks, E.E. and Kerster, H.W.(1988). “Ecosystem health: measuring
ecosystem health”. Environmental Manage-ment 12: 445–455.
Stewart-Oaten, A.W. (1995). “Problems in theanalysis of environmental monitoring data”. InR.J. Schmitt and C.W. Osenburg, Design ofEcological Impact Assessment Studies:Conceptual Issues and Application in CoastalMarine Habitats. Academic Press, San Diego,USA. pp. 109–132.
Underwood, A.J. (1995). “On beyond BACI:sampling designs that might reliably detectenvironmental disturbances”. In R.J. Schmittand C.W. Osenburg, Design of EcologicalImpact Assessment Studies: Conceptual Issuesand Application in Coastal Marine Habitats.Academic Press, San Diego. pp. 151–178.
Adaptive Management (Chapter 4)
Gunderson, L.H., Hollings, C.S. and Light, S.S.(1995). Barriers and Bridges to the Renewal ofEcosystems. Columbia University Press, NewYork, USA.
Hollings, C.S. (ed.) (1978). Adaptive environmen-tal assessment and management. John Wileyand Sons, New York, NY, USA.
Lee, K. (1993). Compass and Gyroscope: integrat-ing science and politics for the environment.Island Press, Washington, DC, USA.
Lee, K. (1999). “Appraising adaptive manage-ment”. Conservation Ecology 3(2). [OnlineURL:www.consecolo.org/Journal/vol3/iss2/index.html]
Oglethorpe, J. (ed.) (2002). Adaptive Management:From Theory to Practice. SUI Technical Series,Vol. 3. IUCN, Gland, Switzerland.
Salafsky, N., Margolius, R. and Redford, K. (2001).Adaptive Management: a tool for conservationpractitioners. Biodiversity Support Program,Washington, DC, USA.
Walters, C.J. (1986). Adaptive Management ofRenewable Resources. MacMillian PublishingCompany, New York, NY, USA.
Walters, C.J. (1997). “Challenges in adaptive man-agement of riparian and coastal ecosystems.Conservation Ecology 1(2). [Online URL:w w w. c o n s e c o l . o r g / J o u r n a l / v o l 1 / i s s 2 /index.html]
Walters, C. J. and Hilborn, R. (1978). “Ecologicaloptimization and adaptive management”.Annual Review of Ecology and Systematics 9:157–188.
Walters, C. J. and Holling, C.S. (1990). “Large-scale management experiments and learningby doing”. Ecology 71: 2060–2068.

SECTION The MPA management effectiveness indicators1
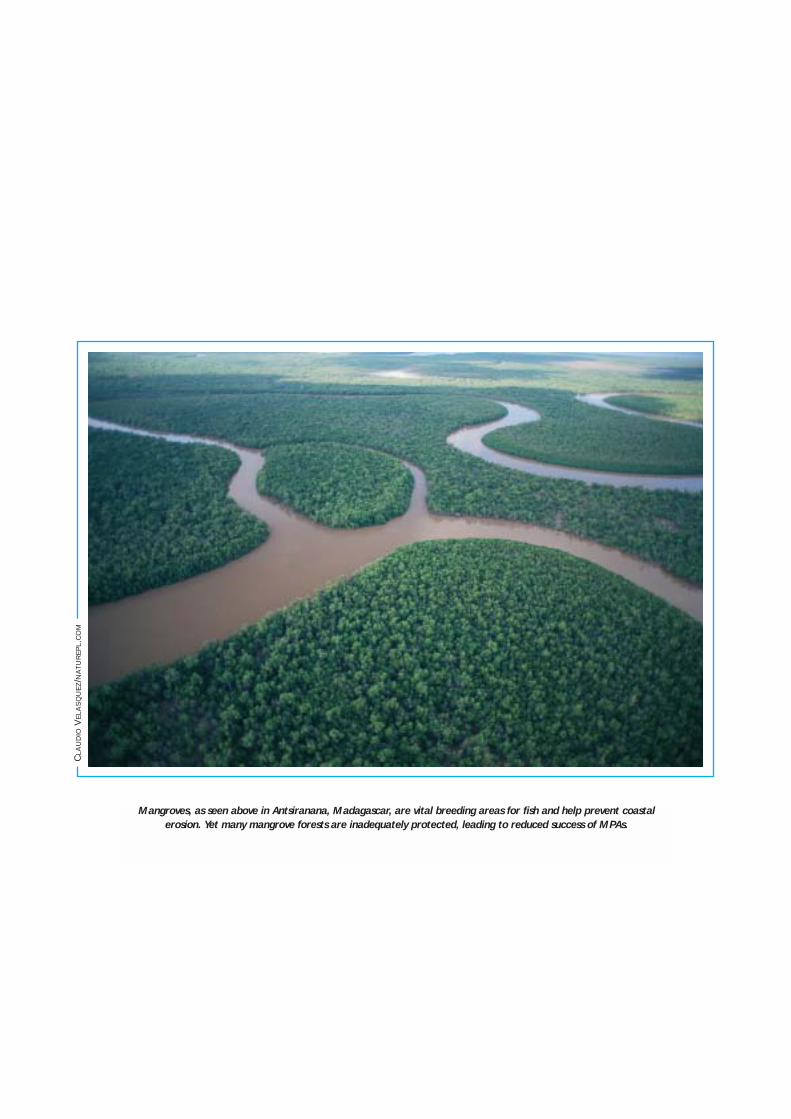
Mangroves, as seen above in Antsiranana, Madagascar, are vital breeding areas for fish and help prevent coastal
erosion. Yet many mangrove forests are inadequately protected, leading to reduced success of MPAs.
CLA
UD
IOV
ELA
SQ
UE
Z/N
AT
UR
EP
L.C
OM
Introduction
There are 42 indicators presented in this Section:10 biophysical, 16 socio-economic and 16governance indicators. To make these indicatorsapplicable to a range of MPA goals and objectives,the indicators were developed through a rigoroustwo-year process of research, expert review andfield-testing, and revision.
To be useful and practical, the indicators weredeveloped to meet several criteria. These criteriacan be used to select the most appropriate indica-tors for your site, especially since a given goal orobjective can have one or multiple indicators.Following best practices, a good indicator meetsfive criteria (see Margolius and Salafsky, 1998):
Measurable: Able to be recorded and analysed inquantitative or qualitative terms.
Precise: Defined the same way by all people.
Consistent: Not changing over time so that italways measures the same thing.
Sensitive: Changing proportionately inresponse to actual changes in theattribute or item being measured.
Simple: Simple indicators are generallypreferred to complex ones.
The difficulty rankings
Each indicator has a difficulty rating. This is tohelp you understand the relative ease with whichthe specified indicator can be measured using themost basic methods recommended (in some cases,more complex methods would reflect another oneor two points in the difficulty ranking). This rank-ing takes into account the time, technical skills,finances and other resources necessary to measurethe indicator.
1 – the indicator is easy to measure2 – the indicator is fairly easy to measure3 – measurement of the indicator requires
moderate effort4 – the indicator is fairly hard to measure5 – the indicator is hard to measure
47
The MPA management effectiveness indicators
2
Heading Meaning
� Name Number and name of the indicator.
� Goal and objective Which goals and objectives this indicator corresponds with (relating to thelarger generic list of MPA goals and objectives developed by the project).
� Difficulty rating A rank of how difficult the indicator is to measure (see above).
� What is “(indicator name)”? Brief description of the indicator.
� Why measure it? The purpose and rationale of the indicator.
� Requirements Resources (people, equipment) needed to collect and analysethe information.
� How to collect the data The method and approach used to collect information on the indicator.
� How to analyse and interpret the results The methods and procedures to analyse the data and suggestions on how to present the results.
� Outputs What are the results and how can they be used by the MPA?
� Strengths and limitations How useful is the indicator overall and what problems may occur in using the indicator?
� Example from the field An example of use of the indicator.
� Useful references and Internet links Suggested sources of information on methods, and further explanation of the indicator.
Box 10
USING THE INDICATORS
To learn more about how the indicatorswere developed (including the process andtimeline) go to http://effectiveMPA.2.gov/guidebook/ background.html
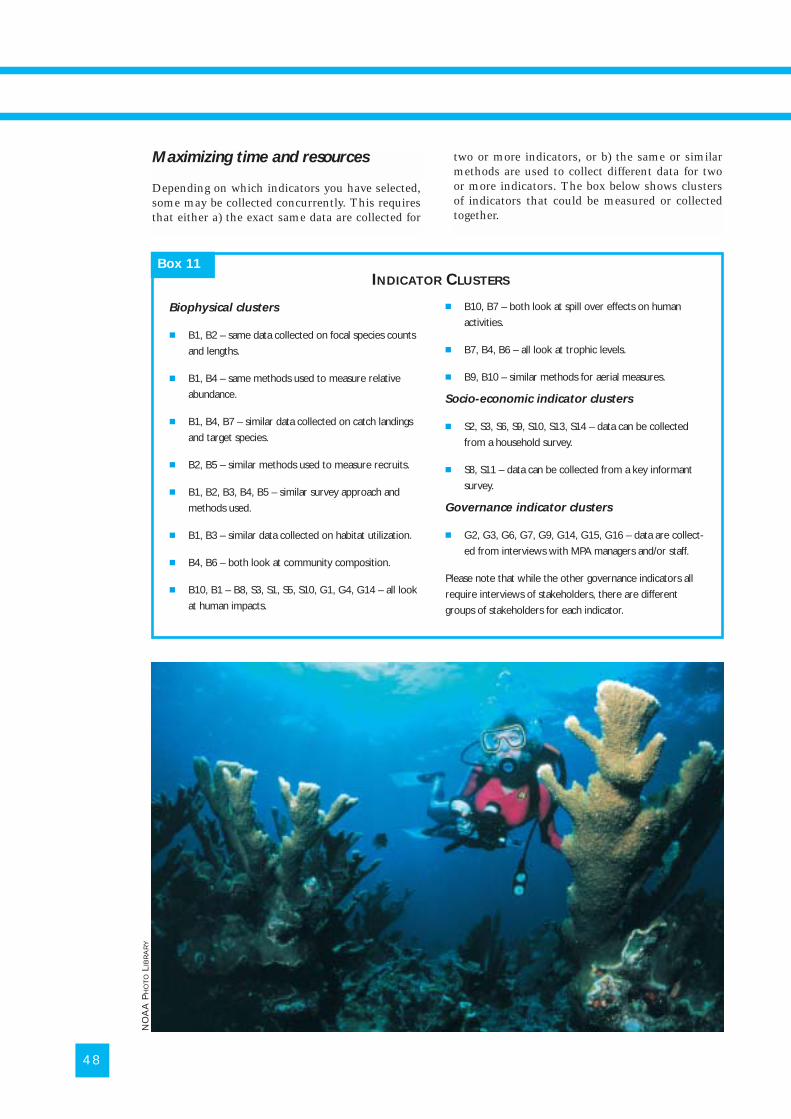
Maximizing time and resources
Depending on which indicators you have selected,some may be collected concurrently. This requiresthat either a) the exact same data are collected for
48
Biophysical clusters
� B1, B2 – same data collected on focal species counts
and lengths.
� B1, B4 – same methods used to measure relative
abundance.
� B1, B4, B7 – similar data collected on catch landings
and target species.
� B2, B5 – similar methods used to measure recruits.
� B1, B2, B3, B4, B5 – similar survey approach and
methods used.
� B1, B3 – similar data collected on habitat utilization.
� B4, B6 – both look at community composition.
� B10, B1 – B8, S3, S1, S5, S10, G1, G4, G14 – all look
at human impacts.
� B10, B7 – both look at spill over effects on human
activities.
� B7, B4, B6 – all look at trophic levels.
� B9, B10 – similar methods for aerial measures.
Socio-economic indicator clusters
� S2, S3, S6, S9, S10, S13, S14 – data can be collected
from a household survey.
� S8, S11 – data can be collected from a key informant
survey.
Governance indicator clusters
� G2, G3, G6, G7, G9, G14, G15, G16 – data are collect-
ed from interviews with MPA managers and/or staff.
Please note that while the other governance indicators all
require interviews of stakeholders, there are different
groups of stakeholders for each indicator.
INDICATOR CLUSTERSBox 11
two or more indicators, or b) the same or similarmethods are used to collect different data for twoor more indicators. The box below shows clustersof indicators that could be measured or collectedtogether.
NO
AA
PH
OT
OLI
BR
AR
Y
ships was critical to the successful design and useof MPAs.
Note that the biotic indicators (esp. B1, B2,and B3) rely heavily upon the comparison ofdata collected from within and outside theMPA. An appropriate approach to sampling inboth areas must therefore be ensured.
B7 is a quasi-biotic indicator that measures thelevel of some of the biological goods that aregenerated from the marine environment (bothinside and outside the MPA). B7 gauges trends infisheries exploitation methods, yield, and effort asa reflection of how productive and healthy theexploited stocks are.
B8 is the only indicator offered in this guidebookthat is used to assess the abiotic conditions of themarine environment.
Finally, B9 and B10 are spatially defined measuresof observed biophysical change. Inclusion of thesetwo ‘aerial’ indicators within the biophysicalcategory was debated at length throughout theirdevelopment and testing. Despite being the mostclosely linked to issues of MPA governance andrequiring the collection of similar data, because thedirect aim of B9 and B10 is to characterize the bio-logical condition of the MPA, they were not movedinto the governance indicator category.
Not all of the indicators will be appropriate for usein every MPA. Some indicators require a higherlevel of skill, labour, financing, and time to meas-ure than others. Where possible, low-cost, basicmethods have been provided for even the mostchallenging indicators, although such measurescan be descriptive, highly subjective, and thereforeless accurate and reliable.
All but two (B6 and B9) of the biophysicalindicators were successfully tested by volun-teer MPA sites. Although many of the eightother sets of measures were challenging, theirresults were nonetheless reported to be of useto the evaluation teams who tested them so asto gauge and report to what degree they weresuccessful in furthering the achievement ofthe stated biophysical objectives of their MPAs.
Note that in some cases, measurement of thebiophysical conditions in and around an MPAmay not necessarily demonstrate manage-ment effectiveness because it may be outsidethe influence of even an ideally-managed MPAand beyond the control of its managers. Insuch cases, these indicators can be used toillustrate this point, allowing managers toopenly communicate with decision-makers,
Introduction
Regardless of their many social benefits and aims,MPAs are ultimately a tool for conserving the bio-physical conditions of our oceans and coasts. Assuch, using indicators to measure these conditionsis typically of primary interest to managers whosejob it is to evaluate the effectiveness of an MPA.
In most cases, the link between the biological stateof the marine environment and the livelihoods,income and food security of the people who useand depend upon the resource is explicit and inti-mate. It then follows that beyond characterizingnatural systems, the measurement of biophysicalindicators can also be useful when viewed in thecontext of the socio-economic and governanceconditions that operate in and around the MPA.For example, the biological goods (such as fish) andecological services (such as nutrient cycling) gener-ated from effectively managed MPAs can bethought of in financial terms, where the MPA is a‘bank account’ that preserves the natural ‘capital’that society depends upon for the future. If thisnatural capital is left alone and allowed to growover time, the ‘income’ generated from this ‘prin-cipal’ may be able to provide ecological goods andservices that are of immediate use to people whilealso offering them future security. Without MPAs,too much of this natural capital may be ‘spent’ bysociety, draining away the ‘principal’ over time. Inthis regard, six of the biophysical indicators (B1,B2, B3, B4, B6, and B8) can be used to measurehow much ‘principal’ is reserved and available,while the other four (B5, B7, B9, and B10) exam-ine the degree of ‘income’ that may be influencedas a result of the MPA.
The 10 biophysical indicators included in thisguidebook fall into one of three groupings: biotic,abiotic and aerial. The first six indicators (B1 – B6)are used to assess the biotic context in and aroundthe MPA. B1 and B2 are used to examine thestatus of populations of species. Measurement ofthese two indicators is moderately difficult,depending on how large the area to be sampled isand how easy it is to observe or catch the organ-isms to be surveyed. B3 to B6 are used to charac-terize ecological conditions, and while important,are among the most challenging of all the indica-tors to measure. In particular, B5 and B6 require alevel of capacity, time and labour that may be outof reach of many MPAs around the world. Therewas much debate and consideration about whetherto eliminate B6 because of its complexity andquestionable ability to demonstrate effectivemanagement in many large, multiple-use MPAs.In the end, consensus was reached to keep B6because managers and experts felt that betterunderstanding and addressing trophic relation-
49
The biophysical indicators
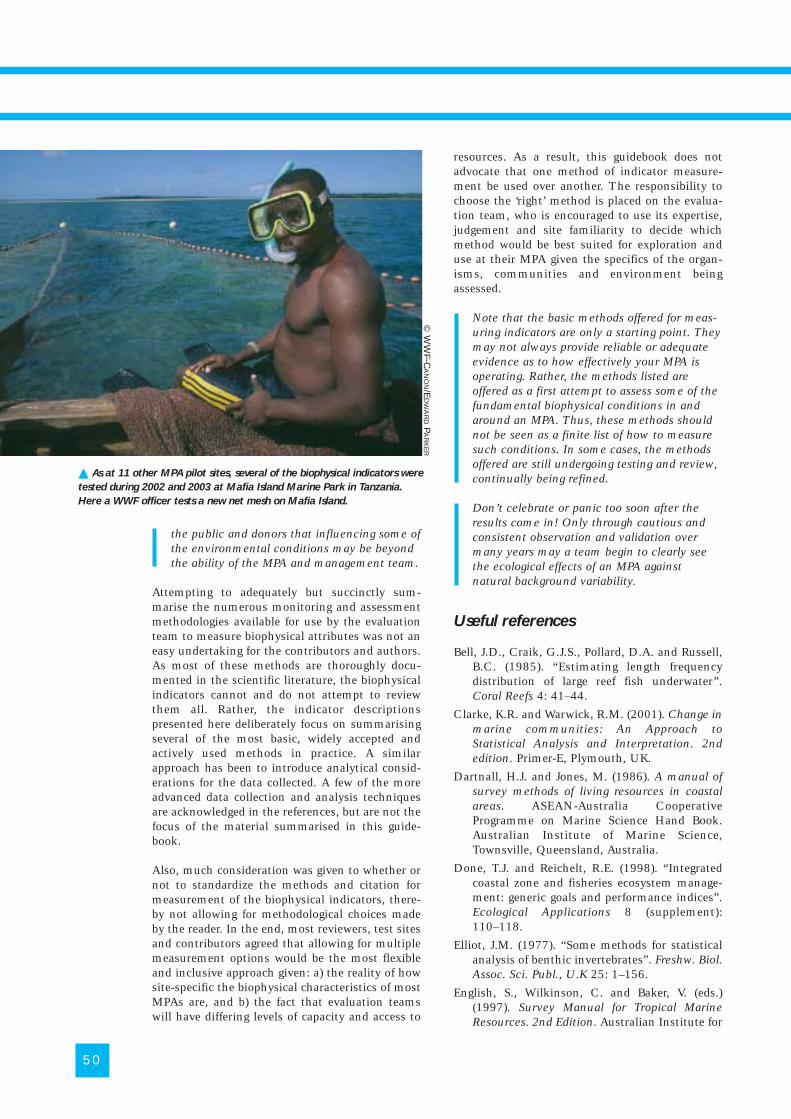
the public and donors that influencing some ofthe environmental conditions may be beyondthe ability of the MPA and management team.
Attempting to adequately but succinctly sum-marise the numerous monitoring and assessmentmethodologies available for use by the evaluationteam to measure biophysical attributes was not aneasy undertaking for the contributors and authors.As most of these methods are thoroughly docu-mented in the scientific literature, the biophysicalindicators cannot and do not attempt to reviewthem all. Rather, the indicator descriptionspresented here deliberately focus on summarisingseveral of the most basic, widely accepted andactively used methods in practice. A similarapproach has been to introduce analytical consid-erations for the data collected. A few of the moreadvanced data collection and analysis techniquesare acknowledged in the references, but are not thefocus of the material summarised in this guide-book.
Also, much consideration was given to whether ornot to standardize the methods and citation formeasurement of the biophysical indicators, there-by not allowing for methodological choices madeby the reader. In the end, most reviewers, test sitesand contributors agreed that allowing for multiplemeasurement options would be the most flexibleand inclusive approach given: a) the reality of howsite-specific the biophysical characteristics of mostMPAs are, and b) the fact that evaluation teamswill have differing levels of capacity and access to
resources. As a result, this guidebook does notadvocate that one method of indicator measure-ment be used over another. The responsibility tochoose the ‘right’ method is placed on the evalua-tion team, who is encouraged to use its expertise,judgement and site familiarity to decide whichmethod would be best suited for exploration anduse at their MPA given the specifics of the organ-isms, communities and environment beingassessed.
Note that the basic methods offered for meas-uring indicators are only a starting point. Theymay not always provide reliable or adequateevidence as to how effectively your MPA isoperating. Rather, the methods listed areoffered as a first attempt to assess some of thefundamental biophysical conditions in andaround an MPA. Thus, these methods shouldnot be seen as a finite list of how to measuresuch conditions. In some cases, the methodsoffered are still undergoing testing and review,continually being refined.
Don’t celebrate or panic too soon after theresults come in! Only through cautious andconsistent observation and validation overmany years may a team begin to clearly seethe ecological effects of an MPA againstnatural background variability.
Useful references
Bell, J.D., Craik, G.J.S., Pollard, D.A. and Russell,B.C. (1985). “Estimating length frequencydistribution of large reef fish underwater”.Coral Reefs 4: 41–44.
Clarke, K.R. and Warwick, R.M. (2001). Change inmarine communities: An Approach toStatistical Analysis and Interpretation. 2ndedition. Primer-E, Plymouth, UK.
Dartnall, H.J. and Jones, M. (1986). A manual ofsurvey methods of living resources in coastalareas. ASEAN-Australia CooperativeProgramme on Marine Science Hand Book.Australian Institute of Marine Science,Townsville, Queensland, Australia.
Done, T.J. and Reichelt, R.E. (1998). “Integratedcoastal zone and fisheries ecosystem manage-ment: generic goals and performance indices”.Ecological Applications 8 (supplement):110–118.
Elliot, J.M. (1977). “Some methods for statisticalanalysis of benthic invertebrates”. Freshw. Biol.Assoc. Sci. Publ., U.K 25: 1–156.
English, S., Wilkinson, C. and Baker, V. (eds.)(1997). Survey Manual for Tropical MarineResources. 2nd Edition. Australian Institute for
50
� As at 11 other MPA pilot sites, several of the biophysical indicators were
tested during 2002 and 2003 at Mafia Island Marine Park in Tanzania.
Here a WWF officer tests a new net mesh on Mafia Island.
© W
WF-C
AN
ON/E
DW
AR
DP
AR
KE
R
Marine Science, Townsville, Queensland,Australia.
Grumbine, R.E. (1994). “What is EcosystemManagement?” Conservation Biology 8(1):2738.
Hilborn, R. and Walters, C.J. (1992). QuantitativeFisheries Stock Assessment: Choice, dynamics,and uncertainty. Chapman and Hall, NewYork, NY, USA.
Lackey, R.T. (1995). “Ecosystem Management:Implications for Fisheries Management.”Renewable Resources Journal 13 (4): 11–13.
Ludwig, D., Hilborn, R. and Walters, C.J. (1993).“Uncertainty, resource exploitation, and con-servation: lessons from history”. Science 260:17–18.
Odum, E.P. (1971). Fundamentals of ecology. W.B.Saunders Co., Philadelphia, PA, USA.
Sale, P.F. (2002). “The science we need to developfor more effective management”. In Sale, P.F.(ed.), Coral Reef Fishes: Dynamics and diversityin a complex ecosystem. Academic Press, SanDiego, USA. pp. 361–376.
Tupper, M. (2002). “Marine reserves and fisheriesmanagement”. Science 295: 1233
51
Th
e b
iop
hysic
al in
dic
ato
rs
CH
RIS
GO
ME
RS
ALL/N
AT
UR
EP
L.CO
M
NO
AA
PH
OT
OLI
BR
AR
Y
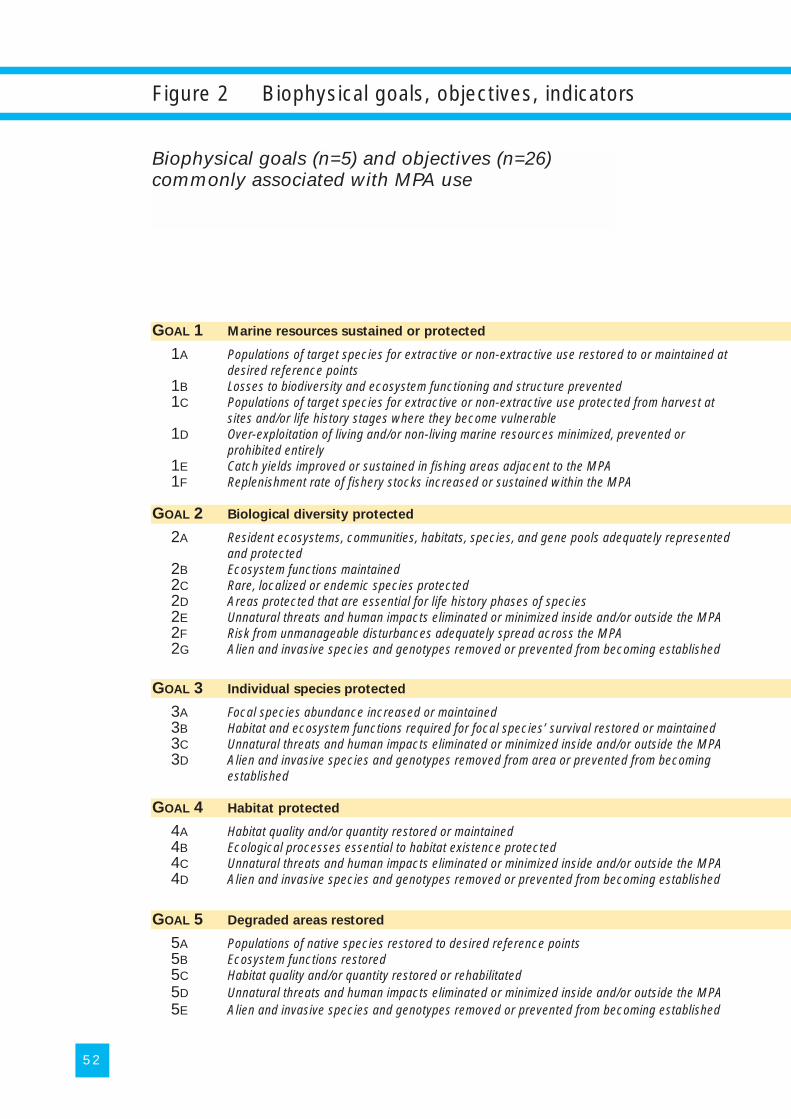
52
GOAL 1 Marine resources sustained or protected
1A Populations of target species for extractive or non-extractive use restored to or maintained atdesired reference points
1B Losses to biodiversity and ecosystem functioning and structure prevented1C Populations of target species for extractive or non-extractive use protected from harvest at
sites and/or life history stages where they become vulnerable1D Over-exploitation of living and/or non-living marine resources minimized, prevented or
prohibited entirely1E Catch yields improved or sustained in fishing areas adjacent to the MPA1F Replenishment rate of fishery stocks increased or sustained within the MPA
GOAL 2 Biological diversity protected
2A Resident ecosystems, communities, habitats, species, and gene pools adequately representedand protected
2B Ecosystem functions maintained2C Rare, localized or endemic species protected2D Areas protected that are essential for life history phases of species2E Unnatural threats and human impacts eliminated or minimized inside and/or outside the MPA2F Risk from unmanageable disturbances adequately spread across the MPA2G Alien and invasive species and genotypes removed or prevented from becoming established
GOAL 3 Individual species protected
3A Focal species abundance increased or maintained3B Habitat and ecosystem functions required for focal species’ survival restored or maintained3C Unnatural threats and human impacts eliminated or minimized inside and/or outside the MPA3D Alien and invasive species and genotypes removed from area or prevented from becoming
established
GOAL 4 Habitat protected
4A Habitat quality and/or quantity restored or maintained4B Ecological processes essential to habitat existence protected4C Unnatural threats and human impacts eliminated or minimized inside and/or outside the MPA4D Alien and invasive species and genotypes removed or prevented from becoming established
GOAL 5 Degraded areas restored
5A Populations of native species restored to desired reference points5B Ecosystem functions restored5C Habitat quality and/or quantity restored or rehabilitated5D Unnatural threats and human impacts eliminated or minimized inside and/or outside the MPA5E Alien and invasive species and genotypes removed or prevented from becoming established
Figure 2 Biophysical goals, objectives, indicators
Biophysical goals (n=5) and objectives (n=26) commonly associated with MPA use
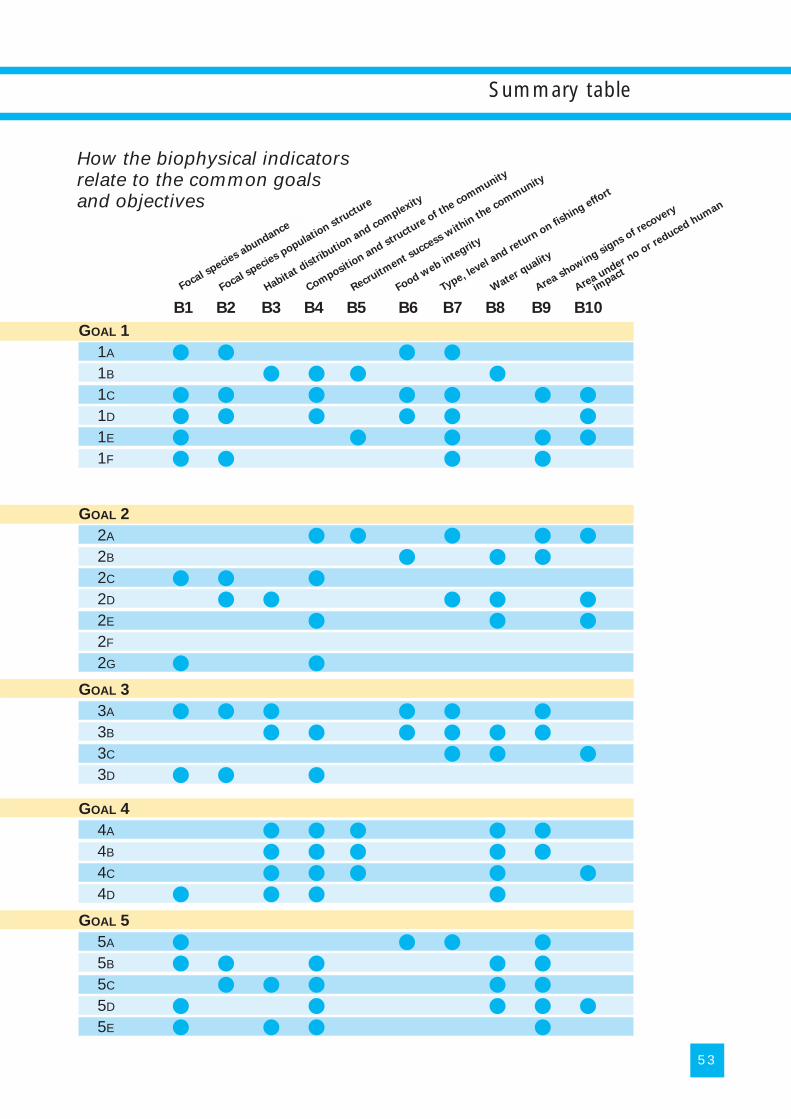
Focal speciesAbundance
Focal species p
opulation stru
cture
Habitat d
istributio
n and complexity
Compositi
on and structu
re o
f the com
munity
Recruitm
ent success w
ithin th
e comm
unity
Food web in
tegrit
y
Type, level a
nd retu
rn o
n fishing effo
rt
Wate
r qualit
y
Area showing signs o
f recovery
Area u
nder no o
r reduced h
uman
impact
GOAL 1
1A � � � �
1B � � � �
1C � � � � � � �
1D � � � � � �
1E � � � � �
1F � � � �
GOAL 2
2A � � � � �
2B � � �
2C � � �
2D � � � � �
2E � � �
2F
2G � �
GOAL 3
3A � � � � � �
3B � � � � � �
3C � � �
3D � � �
GOAL 4
4A � � � � �
4B � � � � �
4C � � � � �
4D � � � �
GOAL 5
5A � � � �
5B � � � � �
5C � � � � �
5D � � � � �
5E � � � �
B1 B2 B3 B4 B5 B6 B7 B8 B9 B10
How the biophysical indicators relate to the common goalsand objectives
Focal species abundance
53
Summary table
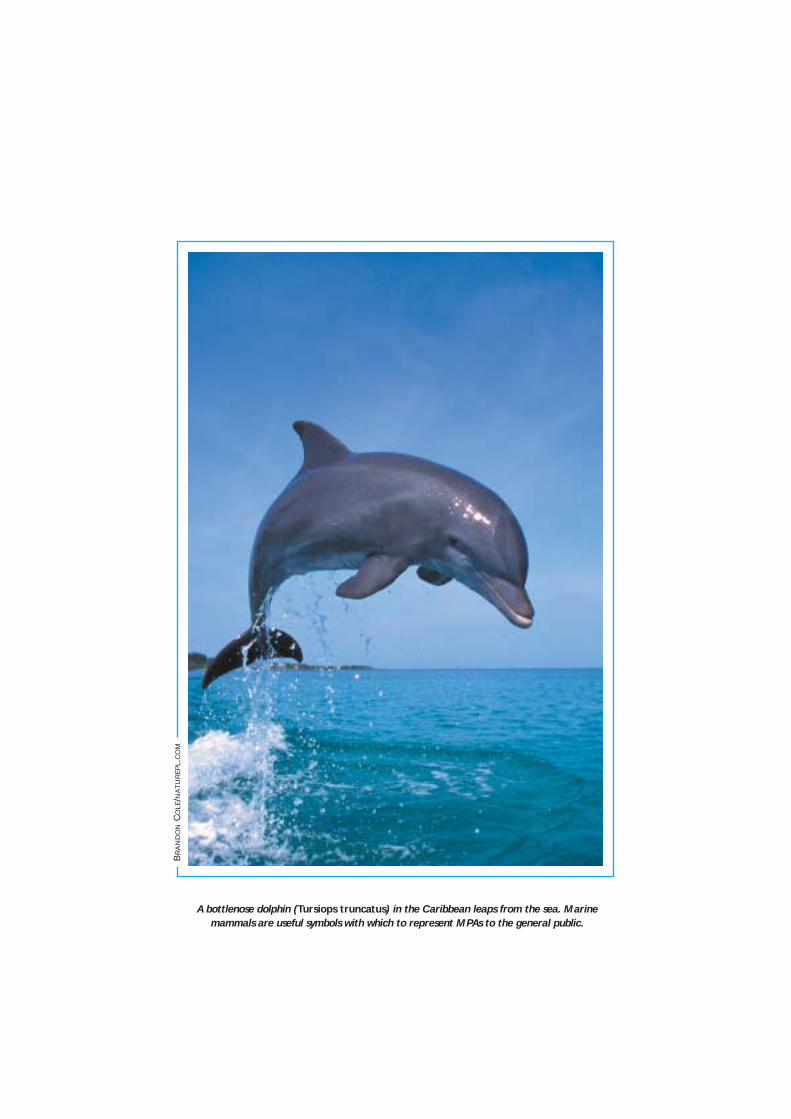
A bottlenose dolphin (Tursiops truncatus) in the Caribbean leaps from the sea. Marine
mammals are useful symbols with which to represent MPAs to the general public.
BR
AN
DO
NC
OLE
/NA
TU
RE
PL.
CO
M
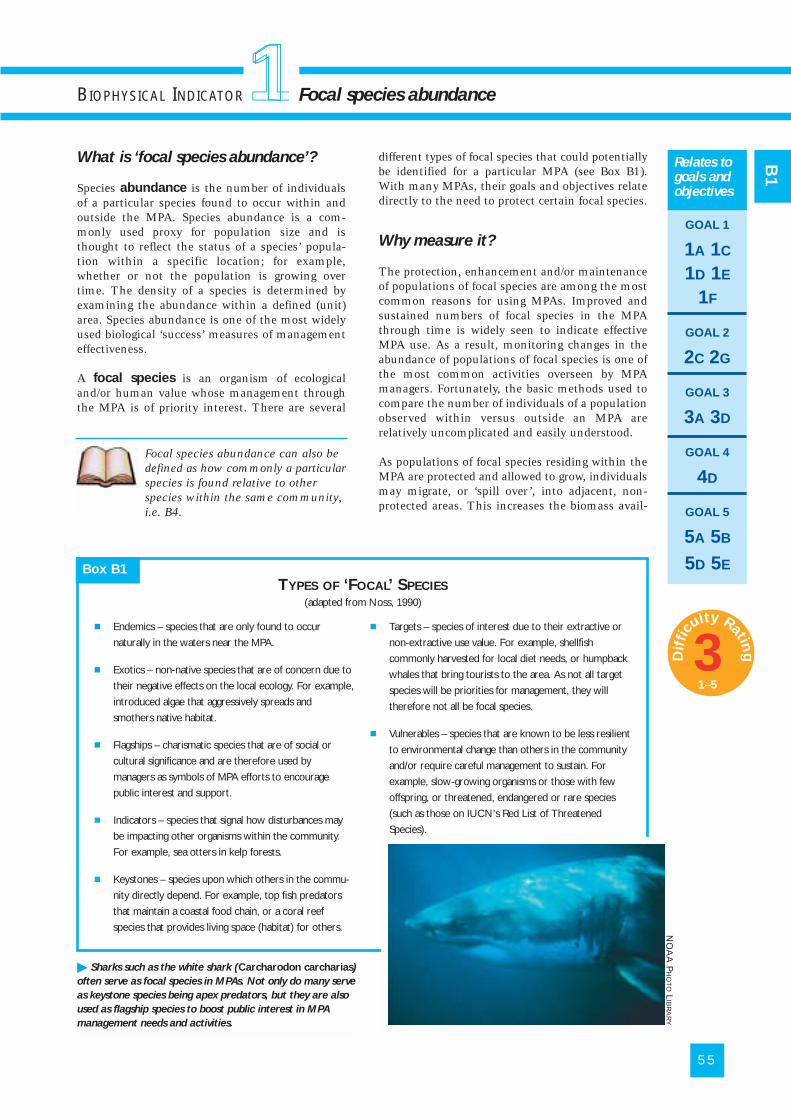
What is ‘focal species abundance’?
Species abundance is the number of individualsof a particular species found to occur within andoutside the MPA. Species abundance is a com-monly used proxy for population size and isthought to reflect the status of a species’ popula-tion within a specific location; for example,whether or not the population is growing overtime. The density of a species is determined byexamining the abundance within a defined (unit)area. Species abundance is one of the most widelyused biological ‘success’ measures of managementeffectiveness.
A focal species is an organism of ecologicaland/or human value whose management throughthe MPA is of priority interest. There are several
different types of focal species that could potentiallybe identified for a particular MPA (see Box B1).With many MPAs, their goals and objectives relatedirectly to the need to protect certain focal species.
Why measure it?
The protection, enhancement and/or maintenanceof populations of focal species are among the mostcommon reasons for using MPAs. Improved andsustained numbers of focal species in the MPAthrough time is widely seen to indicate effectiveMPA use. As a result, monitoring changes in theabundance of populations of focal species is one ofthe most common activities overseen by MPAmanagers. Fortunately, the basic methods used tocompare the number of individuals of a populationobserved within versus outside an MPA arerelatively uncomplicated and easily understood.
As populations of focal species residing within theMPA are protected and allowed to grow, individualsmay migrate, or ‘spill over’, into adjacent, non-protected areas. This increases the biomass avail-
BIOPHYSICAL INDICATOR Focal species abundance
GOAL 1
1A 1C
1D 1E
1F
GOAL 2
2C 2G
GOAL 3
3A 3D
GOAL 4
4D
GOAL 5
5A 5B
5D 5E
Relates togoals andobjectives
� Endemics – species that are only found to occur
naturally in the waters near the MPA.
� Exotics – non-native species that are of concern due to
their negative effects on the local ecology. For example,
introduced algae that aggressively spreads and
smothers native habitat.
� Flagships – charismatic species that are of social or
cultural significance and are therefore used by
managers as symbols of MPA efforts to encourage
public interest and support.
� Indicators – species that signal how disturbances may
be impacting other organisms within the community.
For example, sea otters in kelp forests.
� Keystones – species upon which others in the commu-
nity directly depend. For example, top fish predators
that maintain a coastal food chain, or a coral reef
species that provides living space (habitat) for others.
� Targets – species of interest due to their extractive or
non-extractive use value. For example, shellfish
commonly harvested for local diet needs, or humpback
whales that bring tourists to the area. As not all target
species will be priorities for management, they will
therefore not all be focal species.
� Vulnerables – species that are known to be less resilient
to environmental change than others in the community
and/or require careful management to sustain. For
example, slow-growing organisms or those with few
offspring, or threatened, endangered or rare species
(such as those on IUCN’s Red List of Threatened
Species).
� Sharks such as the white shark (Carcharodon carcharias)
often serve as focal species in MPAs. Not only do many serve
as keystone species being apex predators, but they are also
used as flagship species to boost public interest in MPA
management needs and activities.
B1
TYPES OF ‘FOCAL’ SPECIES(adapted from Noss, 1990)
Box B1
3Dif
ficu
lty Rating
1–5
Focal species abundance can also bedefined as how commonly a particularspecies is found relative to otherspecies within the same community,i.e. B4.
55
1N
OA
A P
HO
TO
LIB
RA
RY
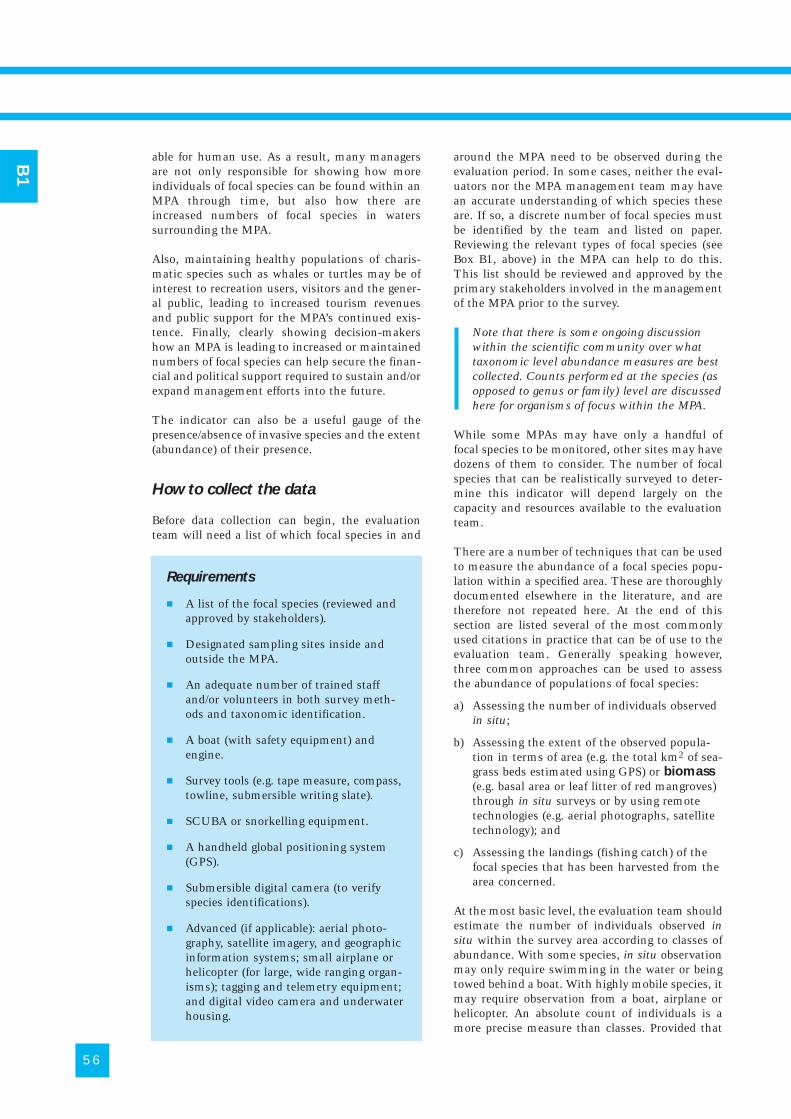
able for human use. As a result, many managersare not only responsible for showing how moreindividuals of focal species can be found within anMPA through time, but also how there areincreased numbers of focal species in waterssurrounding the MPA.
Also, maintaining healthy populations of charis-matic species such as whales or turtles may be ofinterest to recreation users, visitors and the gener-al public, leading to increased tourism revenuesand public support for the MPA’s continued exis-tence. Finally, clearly showing decision-makershow an MPA is leading to increased or maintainednumbers of focal species can help secure the finan-cial and political support required to sustain and/orexpand management efforts into the future.
The indicator can also be a useful gauge of thepresence/absence of invasive species and the extent(abundance) of their presence.
How to collect the data
Before data collection can begin, the evaluationteam will need a list of which focal species in and
around the MPA need to be observed during theevaluation period. In some cases, neither the eval-uators nor the MPA management team may havean accurate understanding of which species theseare. If so, a discrete number of focal species mustbe identified by the team and listed on paper.Reviewing the relevant types of focal species (seeBox B1, above) in the MPA can help to do this.This list should be reviewed and approved by theprimary stakeholders involved in the managementof the MPA prior to the survey.
Note that there is some ongoing discussionwithin the scientific community over whattaxonomic level abundance measures are bestcollected. Counts performed at the species (asopposed to genus or family) level are discussedhere for organisms of focus within the MPA.
While some MPAs may have only a handful offocal species to be monitored, other sites may havedozens of them to consider. The number of focalspecies that can be realistically surveyed to deter-mine this indicator will depend largely on thecapacity and resources available to the evaluationteam.
There are a number of techniques that can be usedto measure the abundance of a focal species popu-lation within a specified area. These are thoroughlydocumented elsewhere in the literature, and aretherefore not repeated here. At the end of thissection are listed several of the most commonlyused citations in practice that can be of use to theevaluation team. Generally speaking however,three common approaches can be used to assessthe abundance of populations of focal species:
a) Assessing the number of individuals observedin situ;
b) Assessing the extent of the observed popula-tion in terms of area (e.g. the total km2 of sea-grass beds estimated using GPS) or biomass(e.g. basal area or leaf litter of red mangroves)through in situ surveys or by using remotetechnologies (e.g. aerial photographs, satellitetechnology); and
c) Assessing the landings (fishing catch) of thefocal species that has been harvested from thearea concerned.
At the most basic level, the evaluation team shouldestimate the number of individuals observed insitu within the survey area according to classes ofabundance. With some species, in situ observationmay only require swimming in the water or beingtowed behind a boat. With highly mobile species, itmay require observation from a boat, airplane orhelicopter. An absolute count of individuals is amore precise measure than classes. Provided that
56
Requirements
� A list of the focal species (reviewed andapproved by stakeholders).
� Designated sampling sites inside andoutside the MPA.
� An adequate number of trained staffand/or volunteers in both survey meth-ods and taxonomic identification.
� A boat (with safety equipment) andengine.
� Survey tools (e.g. tape measure, compass,towline, submersible writing slate).
� SCUBA or snorkelling equipment.
� A handheld global positioning system(GPS).
� Submersible digital camera (to verifyspecies identifications).
� Advanced (if applicable): aerial photo-graphy, satellite imagery, and geographicinformation systems; small airplane orhelicopter (for large, wide ranging organ-isms); tagging and telemetry equipment;and digital video camera and underwaterhousing.
B1
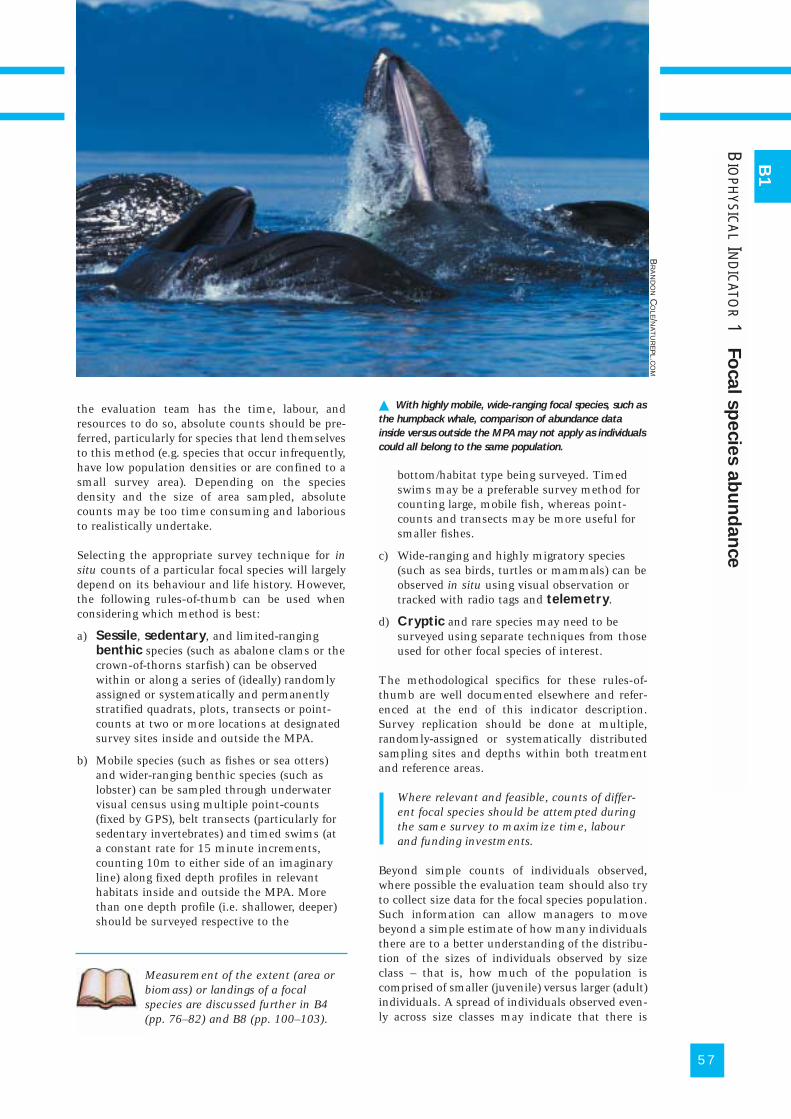
bottom/habitat type being surveyed. Timedswims may be a preferable survey method forcounting large, mobile fish, whereas point-counts and transects may be more useful forsmaller fishes.
c) Wide-ranging and highly migratory species(such as sea birds, turtles or mammals) can beobserved in situ using visual observation ortracked with radio tags and telemetry.
d) Cryptic and rare species may need to besurveyed using separate techniques from thoseused for other focal species of interest.
The methodological specifics for these rules-of-thumb are well documented elsewhere and refer-enced at the end of this indicator description.Survey replication should be done at multiple,randomly-assigned or systematically distributedsampling sites and depths within both treatmentand reference areas.
Where relevant and feasible, counts of differ-ent focal species should be attempted duringthe same survey to maximize time, labourand funding investments.
Beyond simple counts of individuals observed,where possible the evaluation team should also tryto collect size data for the focal species population.Such information can allow managers to movebeyond a simple estimate of how many individualsthere are to a better understanding of the distribu-tion of the sizes of individuals observed by sizeclass – that is, how much of the population iscomprised of smaller (juvenile) versus larger (adult)individuals. A spread of individuals observed even-ly across size classes may indicate that there is
the evaluation team has the time, labour, andresources to do so, absolute counts should be pre-ferred, particularly for species that lend themselvesto this method (e.g. species that occur infrequently,have low population densities or are confined to asmall survey area). Depending on the speciesdensity and the size of area sampled, absolutecounts may be too time consuming and laboriousto realistically undertake.
Selecting the appropriate survey technique for insitu counts of a particular focal species will largelydepend on its behaviour and life history. However,the following rules-of-thumb can be used whenconsidering which method is best:
a) Sessile, sedentary, and limited-rangingbenthic species (such as abalone clams or thecrown-of-thorns starfish) can be observedwithin or along a series of (ideally) randomlyassigned or systematically and permanentlystratified quadrats, plots, transects or point-counts at two or more locations at designatedsurvey sites inside and outside the MPA.
b) Mobile species (such as fishes or sea otters)and wider-ranging benthic species (such aslobster) can be sampled through underwatervisual census using multiple point-counts(fixed by GPS), belt transects (particularly forsedentary invertebrates) and timed swims (ata constant rate for 15 minute increments,counting 10m to either side of an imaginaryline) along fixed depth profiles in relevanthabitats inside and outside the MPA. Morethan one depth profile (i.e. shallower, deeper)should be surveyed respective to the
BIO
PHYSIC
AL
IND
ICATO
R1
Fo
cal s
pecie
s a
bu
nd
an
ce
B1
� With highly mobile, wide-ranging focal species, such as
the humpback whale, comparison of abundance data
inside versus outside the MPA may not apply as individuals
could all belong to the same population.
Measurement of the extent (area orbiomass) or landings of a focalspecies are discussed further in B4(pp. 76–82) and B8 (pp. 100–103).
57
BR
AN
DO
NC
OLE/N
AT
UR
EP
L. CO
M
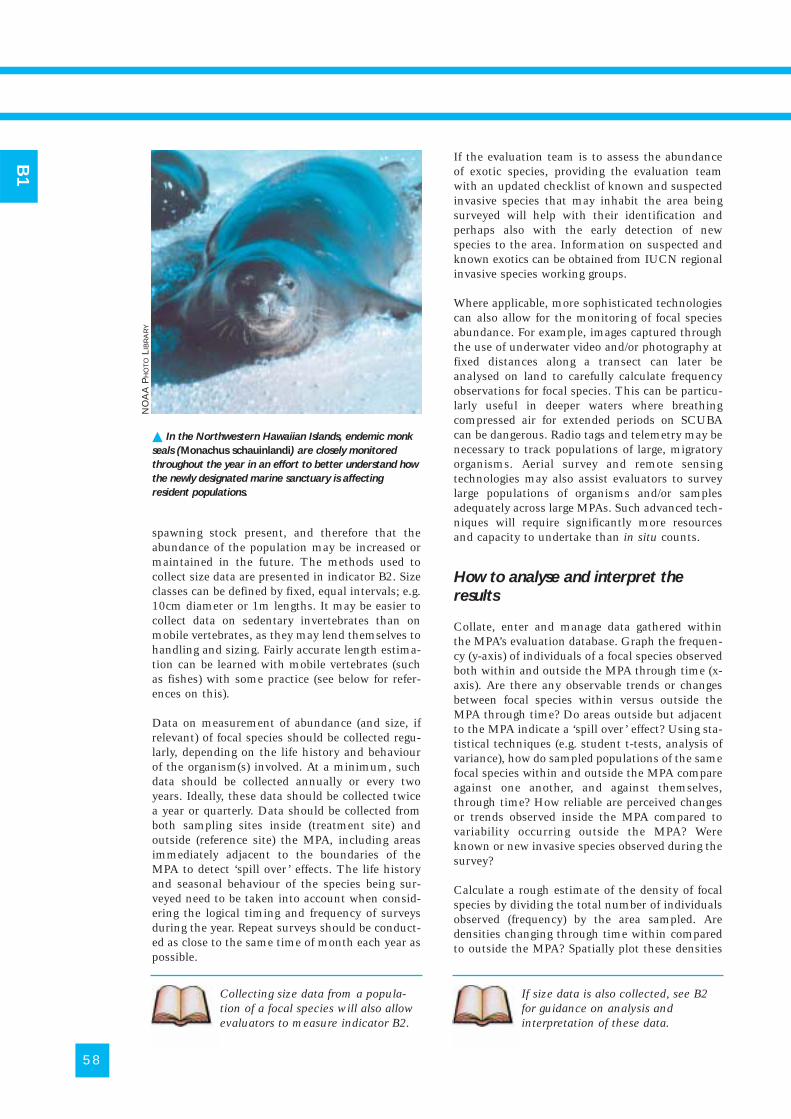
spawning stock present, and therefore that theabundance of the population may be increased ormaintained in the future. The methods used tocollect size data are presented in indicator B2. Sizeclasses can be defined by fixed, equal intervals; e.g.10cm diameter or 1m lengths. It may be easier tocollect data on sedentary invertebrates than onmobile vertebrates, as they may lend themselves tohandling and sizing. Fairly accurate length estima-tion can be learned with mobile vertebrates (suchas fishes) with some practice (see below for refer-ences on this).
Data on measurement of abundance (and size, ifrelevant) of focal species should be collected regu-larly, depending on the life history and behaviourof the organism(s) involved. At a minimum, suchdata should be collected annually or every twoyears. Ideally, these data should be collected twicea year or quarterly. Data should be collected fromboth sampling sites inside (treatment site) andoutside (reference site) the MPA, including areasimmediately adjacent to the boundaries of theMPA to detect ‘spill over’ effects. The life historyand seasonal behaviour of the species being sur-veyed need to be taken into account when consid-ering the logical timing and frequency of surveysduring the year. Repeat surveys should be conduct-ed as close to the same time of month each year aspossible.
If the evaluation team is to assess the abundanceof exotic species, providing the evaluation teamwith an updated checklist of known and suspectedinvasive species that may inhabit the area beingsurveyed will help with their identification andperhaps also with the early detection of newspecies to the area. Information on suspected andknown exotics can be obtained from IUCN regionalinvasive species working groups.
Where applicable, more sophisticated technologiescan also allow for the monitoring of focal speciesabundance. For example, images captured throughthe use of underwater video and/or photography atfixed distances along a transect can later beanalysed on land to carefully calculate frequencyobservations for focal species. This can be particu-larly useful in deeper waters where breathingcompressed air for extended periods on SCUBAcan be dangerous. Radio tags and telemetry may benecessary to track populations of large, migratoryorganisms. Aerial survey and remote sensingtechnologies may also assist evaluators to surveylarge populations of organisms and/or samplesadequately across large MPAs. Such advanced tech-niques will require significantly more resourcesand capacity to undertake than in situ counts.
How to analyse and interpret the
results
Collate, enter and manage data gathered withinthe MPA’s evaluation database. Graph the frequen-cy (y-axis) of individuals of a focal species observedboth within and outside the MPA through time (x-axis). Are there any observable trends or changesbetween focal species within versus outside theMPA through time? Do areas outside but adjacentto the MPA indicate a ‘spill over’ effect? Using sta-tistical techniques (e.g. student t-tests, analysis ofvariance), how do sampled populations of the samefocal species within and outside the MPA compareagainst one another, and against themselves,through time? How reliable are perceived changesor trends observed inside the MPA compared tovariability occurring outside the MPA? Wereknown or new invasive species observed during thesurvey?
Calculate a rough estimate of the density of focalspecies by dividing the total number of individualsobserved (frequency) by the area sampled. Aredensities changing through time within comparedto outside the MPA? Spatially plot these densities
58
� In the Northwestern Hawaiian Islands, endemic monk
seals (Monachus schauinlandi) are closely monitored
throughout the year in an effort to better understand how
the newly designated marine sanctuary is affecting
resident populations.
B1
Collecting size data from a popula-tion of a focal species will also allowevaluators to measure indicator B2.
If size data is also collected, see B2for guidance on analysis andinterpretation of these data.
NO
AA
PH
OT
OLI
BR
AR
Y
against the area surveyed. Look for patterns in theobserved density: are the individuals uniformlydistributed across the areas surveyed or are theyclustered in certain areas sampled?
Plot the abundance (y-axis) of populationsobserved across different focal species (x-axis, ashistograms) relative to one another within thecommunity. Monitor changes in the relative abun-dance of these populations of focal species throughtime. Do any proportional relationships betweenthe relative abundance of populations appear? Arethe relative abundances of various focal speciesobserved within the community changing or beingmaintained through time? Were known or newlyarrived invasive species observed during thesurveys?
Prepare results and conclusions for public dissem-ination. Orally and visually present results withtarget audiences, and distribute written reports(including graphs and tables of results). Encourageindependent validation of findings by partners andoutside parties within the sampled area in order toconfirm or reject results and increase the under-standing of the effects of MPA activities on thearea. Be sure to include any stories or anecdotesthat illustrate the results observed from stakehold-ers.
Strengths and limitations
The approach and general survey methods formeasuring this indicator are relatively uncompli-cated and commonly used. However, the degree ofoverall difficulty in measuring the indicator canrange widely. In some cases, collecting abundancedata can be done rapidly, inexpensively and with aminimum of specialists. In other cases, it mayrequire several months and a large team to com-plete. The amount of time, financing, equipmentand evaluator skill required for measurement in anMPA will depend in part on:
a) The size of the MPA needing to be surveyed;
b) The number of focal species being sampled;
c) The density with which the focal speciesoccurs;
d) The migratory behaviour and home range sizeof the population observed;
e) The conspicuousness and degree to which thespecies is easily observable; and
f) The local/national capacity to conduct thesurvey and level of skill within the evaluationteam.
For example, measuring the abundance of a colour-ful, sessile organism occurring in the shallowwaters of a small MPA will require far less capacityto survey than the measurement of an highlymigratory, pelagic species that is known to infre-quently visit the seas included within and outsidea large MPA.
Abundance observations for a focal species aredifficult to infer beyond the sampled area. Largeareas must be sampled to confidently characterizelarge-sized MPAs and surrounding waters. Also, assome populations may occur with a high level ofspatial and seasonal variability, they may require ahigh level of sampling effort in terms of area andtime to monitor.
At the most basic level, evaluators must have thecapacity to undertake abundance counts or classestimates and be able to correctly identify focalspecies in situ. In some cases, abundance surveysmay require a considerable amount of time andlabour to undertake. More advanced skills will beneeded to do length estimation, biomass estima-tion, and/or catch-landing surveys.
Finally, counts are limited to depths at whichdiving can be safely undertaken. To determine thefocal species abundance of populations in deeperwaters, catch-landing surveys of deep-waterspecies caught should be undertaken.
BIO
PHYSIC
AL
IND
ICATO
R1
Fo
cal s
pecie
s a
bu
nd
an
ce
Outputs (for each focal species
surveyed)
� A profile of the abundance (either asclasses, absolute counts, area orbiomass) inside and outside the MPA.
� Estimated population densities insideand outside the MPA.
� An idea of whether or not the populationsurveyed is clustered or uniformlydistributed throughout the survey area.
Other outputs (if applicable)
� A profile of the abundance of smallerversus larger individuals (via size classes)within the focal species populationinside and outside the MPA.
� The relative abundance of different focalspecies observed across the communitysurveyed.
� Known presence/absence and abundanceof invasive species present in thecommunity.
B1
59
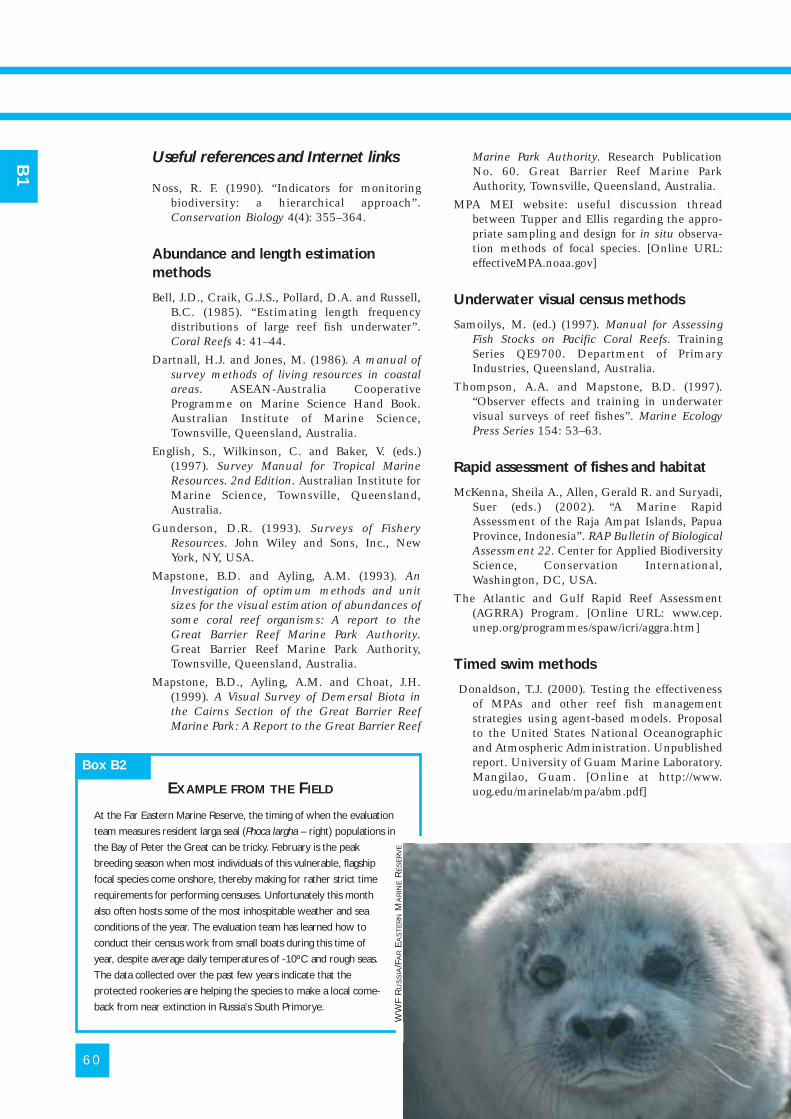
Useful references and Internet links
Noss, R. F. (1990). “Indicators for monitoringbiodiversity: a hierarchical approach”.Conservation Biology 4(4): 355–364.
Abundance and length estimationmethods
Bell, J.D., Craik, G.J.S., Pollard, D.A. and Russell,B.C. (1985). “Estimating length frequencydistributions of large reef fish underwater”.Coral Reefs 4: 41–44.
Dartnall, H.J. and Jones, M. (1986). A manual ofsurvey methods of living resources in coastalareas. ASEAN-Australia CooperativeProgramme on Marine Science Hand Book.Australian Institute of Marine Science,Townsville, Queensland, Australia.
English, S., Wilkinson, C. and Baker, V. (eds.)(1997). Survey Manual for Tropical MarineResources. 2nd Edition. Australian Institute forMarine Science, Townsville, Queensland,Australia.
Gunderson, D.R. (1993). Surveys of FisheryResources. John Wiley and Sons, Inc., NewYork, NY, USA.
Mapstone, B.D. and Ayling, A.M. (1993). AnInvestigation of optimum methods and unitsizes for the visual estimation of abundances ofsome coral reef organisms: A report to theGreat Barrier Reef Marine Park Authority.Great Barrier Reef Marine Park Authority,Townsville, Queensland, Australia.
Mapstone, B.D., Ayling, A.M. and Choat, J.H.(1999). A Visual Survey of Demersal Biota inthe Cairns Section of the Great Barrier ReefMarine Park: A Report to the Great Barrier Reef
Marine Park Authority. Research PublicationNo. 60. Great Barrier Reef Marine ParkAuthority, Townsville, Queensland, Australia.
MPA MEI website: useful discussion threadbetween Tupper and Ellis regarding the appro-priate sampling and design for in situ observa-tion methods of focal species. [Online URL:effectiveMPA.noaa.gov]
Underwater visual census methods
Samoilys, M. (ed.) (1997). Manual for AssessingFish Stocks on Pacific Coral Reefs. TrainingSeries QE9700. Department of PrimaryIndustries, Queensland, Australia.
Thompson, A.A. and Mapstone, B.D. (1997).“Observer effects and training in underwatervisual surveys of reef fishes”. Marine EcologyPress Series 154: 53–63.
Rapid assessment of fishes and habitat
McKenna, Sheila A., Allen, Gerald R. and Suryadi,Suer (eds.) (2002). “A Marine RapidAssessment of the Raja Ampat Islands, PapuaProvince, Indonesia”. RAP Bulletin of BiologicalAssessment 22. Center for Applied BiodiversityScience, Conservation International,Washington, DC, USA.
The Atlantic and Gulf Rapid Reef Assessment(AGRRA) Program. [Online URL: www.cep.unep.org/programmes/spaw/icri/aggra.htm]
Timed swim methods
Donaldson, T.J. (2000). Testing the effectivenessof MPAs and other reef fish managementstrategies using agent-based models. Proposalto the United States National Oceanographicand Atmospheric Administration. Unpublishedreport. University of Guam Marine Laboratory.Mangilao, Guam. [Online at http://www.uog.edu/marinelab/mpa/abm.pdf]
60
At the Far Eastern Marine Reserve, the timing of when the evaluation
team measures resident larga seal (Phoca largha – right) populations in
the Bay of Peter the Great can be tricky. February is the peak
breeding season when most individuals of this vulnerable, flagship
focal species come onshore, thereby making for rather strict time
requirements for performing censuses. Unfortunately this month
also often hosts some of the most inhospitable weather and sea
conditions of the year. The evaluation team has learned how to
conduct their census work from small boats during this time of
year, despite average daily temperatures of -10ºC and rough seas.
The data collected over the past few years indicate that the
protected rookeries are helping the species to make a local come-
back from near extinction in Russia’s South Primorye.
EXAMPLE FROM THE FIELD
Box B2B
1
WW
F R
US
SIA
/FA
RE
AS
TE
RN
MA
RIN
ER
ES
ER
VE
61
BIOPHYSICAL INDICATOR Focal species population structure
GOAL 1
1A 1C
1D 1F
GOAL 2
2C 2D
GOAL 3
3A 3D
GOAL 5
5B 5C
Relates togoals andobjectives
B2
What is ‘population structure’?
Population structure is the probability with whichdifferent sizes and ages of individuals are likely tooccur within a population of a focal species. A pop-ulation experiencing no or reduced human impactsand influenced largely only by natural conditions ismore likely to host the necessary number of repro-ducers in order to replenish and maintain itselfthrough time than one whose individuals are beingremoved for human use.
In measuring this indicator, it is possible to gobeyond simply assessing how much of a focalspecies there is at a single point in time (indicatorB1) by further characterizing how the individualsin the population are structured by size and age,and by assessing the population’s reproductivepotential. In this respect, this indicator can beused by managers both as a ‘snapshot’ at a singlepoint in time of what proportion of the focalspecies population is made up of reproducers, aswell as a ‘crystal ball’ to help managers forecastpopulation growth rates or predict declines thatmay occur within the focal species as a result ofchanges happening in the size/age structure.
Important factors that influence size and agedistribution within a population include the regu-larity of spawning events, the variability in timing,amount and location of larval settlement andrecruitment events, and the degree of juvenilesurvivorship and recruitment in the population.
Why measure it?
For the population of a species to continue to existthrough time, an adequate number of reproductiveadults must be present. A common rationale inusing and supporting MPAs is that they can serveas a safe haven for the breeding stock of a focalspecies. Therefore, an effectively managed MPA is
one that is thought to contain populations of focalspecies whose individuals are adequately distrib-uted from juvenile to adult size classes so as toallow them to replenish themselves and be viable(i.e. persist in the area through time).
Further, by maintaining spawning stock, effectively-managed MPAs are also thought to:
a) Serve as a source of eggs, larvae and juvenilesthat are exported to areas outside the MPA;and
b) Increase the number of reproductive adultsfound in waters outside the MPA as a result of‘spill over’ (migration of individuals).
As a consequence, managers are often entrustednot only with the responsibility of showing howthe populations found in the MPA have the struc-ture and potential to continue to persist throughtime, but also with the job of demonstrating howjuveniles and adults exported into adjacent watersoutside the MPA are helping to stabilize popula-tion structures and viability there as well.
In many places, these phenomena are seen assome of the most important benefits arising fromMPA use. Therefore, in order to secure and sustainlong-term support for MPA efforts, these benefitsmust be clearly shown.
How to collect the data
The presence and reproductive potential of breed-ing stock and future viability of populations of afocal species can be assessed by collecting size, age,reproductive potential, and recruitment data fromsample areas within and outside the MPA. Becausemany coastal species occur in various habitatsthroughout different phases during their lifetime,multiple habitats are likely to require sampling forpopulations of some focal species. In some cases,distinctive markings and coloration in focalspecies may also assist evaluators to clearly distin-guish between juveniles versus reproductiveadults. Also, scientific literature may already existthat shows or suggests the size and/or age of firstreproduction of the focal species concerned.
At the most basic level, information on the size ofindividuals observed within surveyed areas bothwithin and outside the MPA should be collected.Collecting size data on individuals sampled from a
As the number of individuals found ina population is closely related to itssize and age structure, indicators B1and B2 are closely associated and datacan be concurrently collected for both.
Note that a network of multiple MPAs maybe required to adequately sustain somepopulations of focal species that exhibitwide-ranging life history characteristics,such as:
� Lengthy larval stages.
� Large home ranges.
� Aggregation from a wide area to aspecific site for certain life events.
� Simply being highly migratory in nature.
1
4Dif
ficu
lty Rating
1–5
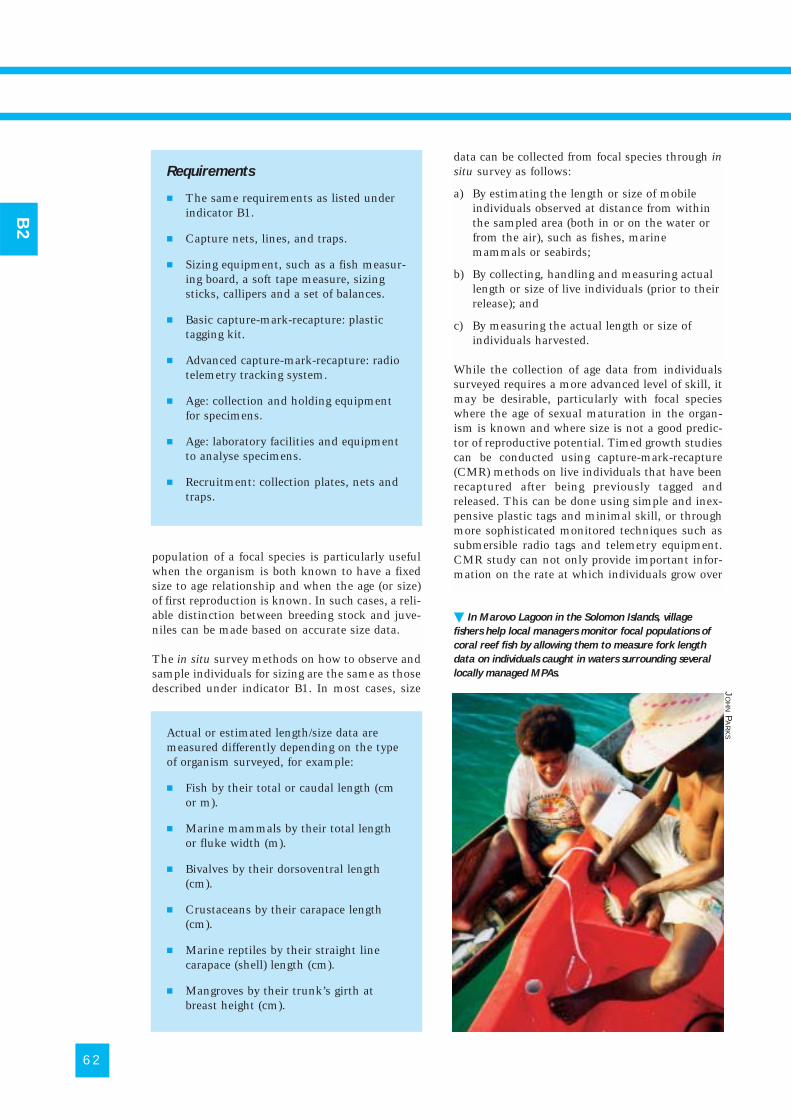
population of a focal species is particularly usefulwhen the organism is both known to have a fixedsize to age relationship and when the age (or size)of first reproduction is known. In such cases, a reli-able distinction between breeding stock and juve-niles can be made based on accurate size data.
The in situ survey methods on how to observe andsample individuals for sizing are the same as thosedescribed under indicator B1. In most cases, size
data can be collected from focal species through insitu survey as follows:
a) By estimating the length or size of mobileindividuals observed at distance from withinthe sampled area (both in or on the water orfrom the air), such as fishes, marinemammals or seabirds;
b) By collecting, handling and measuring actuallength or size of live individuals (prior to theirrelease); and
c) By measuring the actual length or size ofindividuals harvested.
While the collection of age data from individualssurveyed requires a more advanced level of skill, itmay be desirable, particularly with focal specieswhere the age of sexual maturation in the organ-ism is known and where size is not a good predic-tor of reproductive potential. Timed growth studiescan be conducted using capture-mark-recapture(CMR) methods on live individuals that have beenrecaptured after being previously tagged andreleased. This can be done using simple and inex-pensive plastic tags and minimal skill, or throughmore sophisticated monitored techniques such assubmersible radio tags and telemetry equipment.CMR study can not only provide important infor-mation on the rate at which individuals grow over
62
Requirements
� The same requirements as listed underindicator B1.
� Capture nets, lines, and traps.
� Sizing equipment, such as a fish measur-ing board, a soft tape measure, sizingsticks, callipers and a set of balances.
� Basic capture-mark-recapture: plastictagging kit.
� Advanced capture-mark-recapture: radiotelemetry tracking system.
� Age: collection and holding equipmentfor specimens.
� Age: laboratory facilities and equipmentto analyse specimens.
� Recruitment: collection plates, nets andtraps.
Actual or estimated length/size data aremeasured differently depending on the typeof organism surveyed, for example:
� Fish by their total or caudal length (cmor m).
� Marine mammals by their total lengthor fluke width (m).
� Bivalves by their dorsoventral length(cm).
� Crustaceans by their carapace length(cm).
� Marine reptiles by their straight linecarapace (shell) length (cm).
� Mangroves by their trunk’s girth atbreast height (cm).
� In Marovo Lagoon in the Solomon Islands, village
fishers help local managers monitor focal populations of
coral reef fish by allowing them to measure fork length
data on individuals caught in waters surrounding several
locally managed MPAs.
B2
JO
HN
PA
RK
S
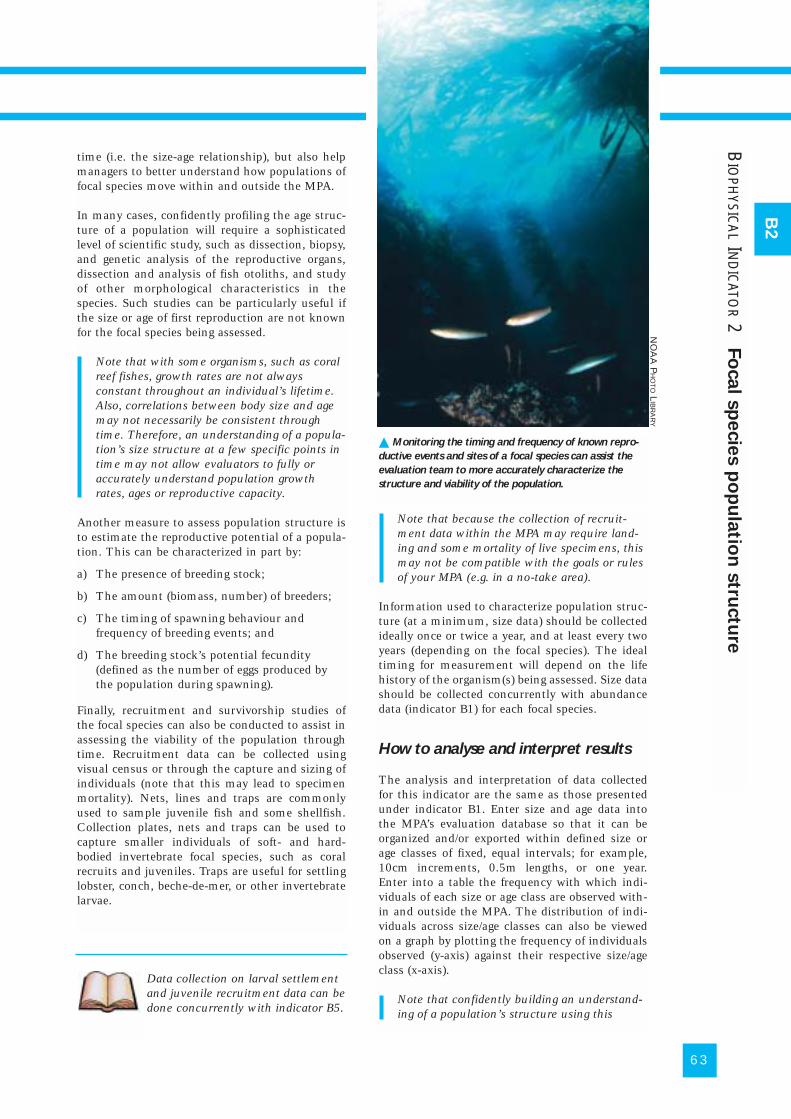
time (i.e. the size-age relationship), but also helpmanagers to better understand how populations offocal species move within and outside the MPA.
In many cases, confidently profiling the age struc-ture of a population will require a sophisticatedlevel of scientific study, such as dissection, biopsy,and genetic analysis of the reproductive organs,dissection and analysis of fish otoliths, and studyof other morphological characteristics in thespecies. Such studies can be particularly useful ifthe size or age of first reproduction are not knownfor the focal species being assessed.
Note that with some organisms, such as coralreef fishes, growth rates are not alwaysconstant throughout an individual’s lifetime.Also, correlations between body size and agemay not necessarily be consistent throughtime. Therefore, an understanding of a popula-tion’s size structure at a few specific points intime may not allow evaluators to fully oraccurately understand population growthrates, ages or reproductive capacity.
Another measure to assess population structure isto estimate the reproductive potential of a popula-tion. This can be characterized in part by:
a) The presence of breeding stock;
b) The amount (biomass, number) of breeders;
c) The timing of spawning behaviour andfrequency of breeding events; and
d) The breeding stock’s potential fecundity(defined as the number of eggs produced bythe population during spawning).
Finally, recruitment and survivorship studies ofthe focal species can also be conducted to assist inassessing the viability of the population throughtime. Recruitment data can be collected usingvisual census or through the capture and sizing ofindividuals (note that this may lead to specimenmortality). Nets, lines and traps are commonlyused to sample juvenile fish and some shellfish.Collection plates, nets and traps can be used tocapture smaller individuals of soft- and hard-bodied invertebrate focal species, such as coralrecruits and juveniles. Traps are useful for settlinglobster, conch, beche-de-mer, or other invertebratelarvae.
Note that because the collection of recruit-ment data within the MPA may require land-ing and some mortality of live specimens, thismay not be compatible with the goals or rulesof your MPA (e.g. in a no-take area).
Information used to characterize population struc-ture (at a minimum, size data) should be collectedideally once or twice a year, and at least every twoyears (depending on the focal species). The idealtiming for measurement will depend on the lifehistory of the organism(s) being assessed. Size datashould be collected concurrently with abundancedata (indicator B1) for each focal species.
How to analyse and interpret results
The analysis and interpretation of data collectedfor this indicator are the same as those presentedunder indicator B1. Enter size and age data intothe MPA’s evaluation database so that it can beorganized and/or exported within defined size orage classes of fixed, equal intervals; for example,10cm increments, 0.5m lengths, or one year.Enter into a table the frequency with which indi-viduals of each size or age class are observed with-in and outside the MPA. The distribution of indi-viduals across size/age classes can also be viewedon a graph by plotting the frequency of individualsobserved (y-axis) against their respective size/ageclass (x-axis).
Note that confidently building an understand-ing of a population’s structure using this
63
Data collection on larval settlementand juvenile recruitment data can bedone concurrently with indicator B5.
B2
BIO
PHYSIC
AL
IND
ICATO
R2
Fo
cal s
pecie
s p
op
ula
tion
stru
ctu
re
� Monitoring the timing and frequency of known repro-
ductive events and sites of a focal species can assist the
evaluation team to more accurately characterize the
structure and viability of the population.
NO
AA
PH
OT
OL
IBR
AR
Y
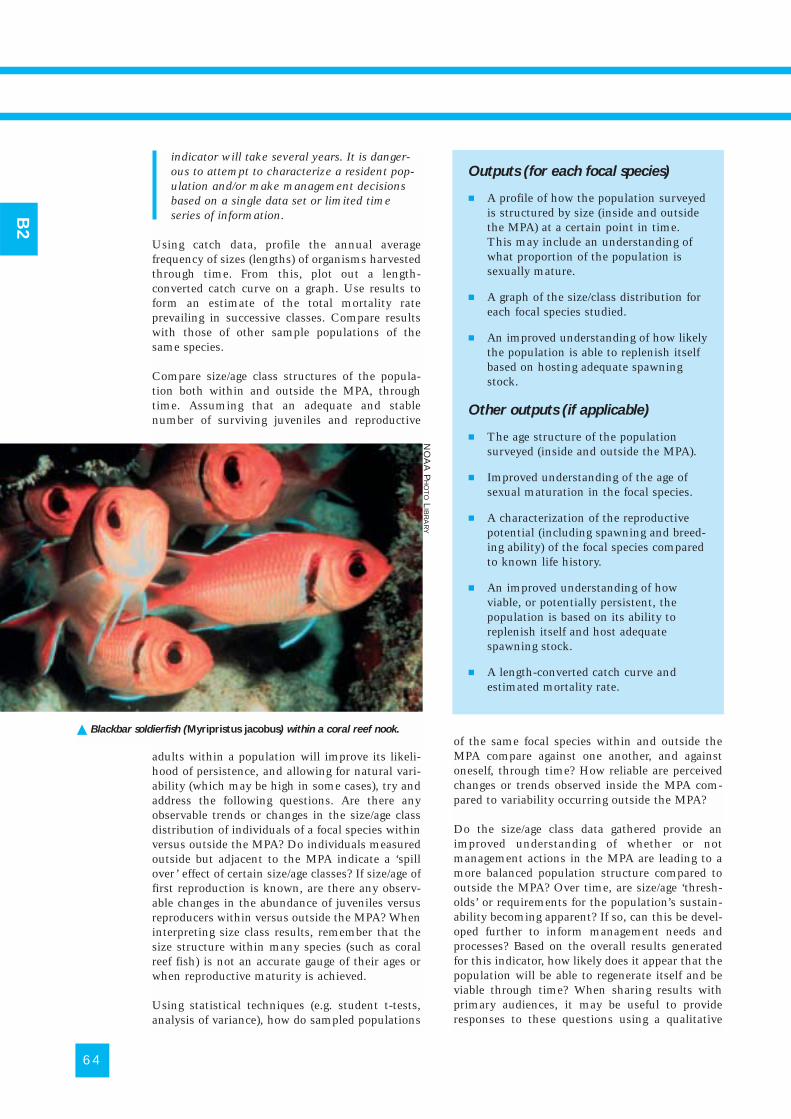
indicator will take several years. It is danger-ous to attempt to characterize a resident pop-ulation and/or make management decisionsbased on a single data set or limited timeseries of information.
Using catch data, profile the annual averagefrequency of sizes (lengths) of organisms harvestedthrough time. From this, plot out a length-converted catch curve on a graph. Use results toform an estimate of the total mortality rateprevailing in successive classes. Compare resultswith those of other sample populations of thesame species.
Compare size/age class structures of the popula-tion both within and outside the MPA, throughtime. Assuming that an adequate and stablenumber of surviving juveniles and reproductive
adults within a population will improve its likeli-hood of persistence, and allowing for natural vari-ability (which may be high in some cases), try andaddress the following questions. Are there anyobservable trends or changes in the size/age classdistribution of individuals of a focal species withinversus outside the MPA? Do individuals measuredoutside but adjacent to the MPA indicate a ‘spillover’ effect of certain size/age classes? If size/age offirst reproduction is known, are there any observ-able changes in the abundance of juveniles versusreproducers within versus outside the MPA? Wheninterpreting size class results, remember that thesize structure within many species (such as coralreef fish) is not an accurate gauge of their ages orwhen reproductive maturity is achieved.
Using statistical techniques (e.g. student t-tests,analysis of variance), how do sampled populations
of the same focal species within and outside theMPA compare against one another, and againstoneself, through time? How reliable are perceivedchanges or trends observed inside the MPA com-pared to variability occurring outside the MPA?
Do the size/age class data gathered provide animproved understanding of whether or notmanagement actions in the MPA are leading to amore balanced population structure compared tooutside the MPA? Over time, are size/age ‘thresh-olds’ or requirements for the population’s sustain-ability becoming apparent? If so, can this be devel-oped further to inform management needs andprocesses? Based on the overall results generatedfor this indicator, how likely does it appear that thepopulation will be able to regenerate itself and beviable through time? When sharing results withprimary audiences, it may be useful to provideresponses to these questions using a qualitative
64
Outputs (for each focal species)
� A profile of how the population surveyedis structured by size (inside and outsidethe MPA) at a certain point in time.This may include an understanding ofwhat proportion of the population issexually mature.
� A graph of the size/class distribution foreach focal species studied.
� An improved understanding of how likelythe population is able to replenish itselfbased on hosting adequate spawningstock.
Other outputs (if applicable)
� The age structure of the populationsurveyed (inside and outside the MPA).
� Improved understanding of the age ofsexual maturation in the focal species.
� A characterization of the reproductivepotential (including spawning and breed-ing ability) of the focal species comparedto known life history.
� An improved understanding of howviable, or potentially persistent, thepopulation is based on its ability toreplenish itself and host adequatespawning stock.
� A length-converted catch curve andestimated mortality rate.
B2
� Blackbar soldierfish (Myripristus jacobus) within a coral reef nook.
NO
AA
PH
OT
OL
IBR
AR
Y
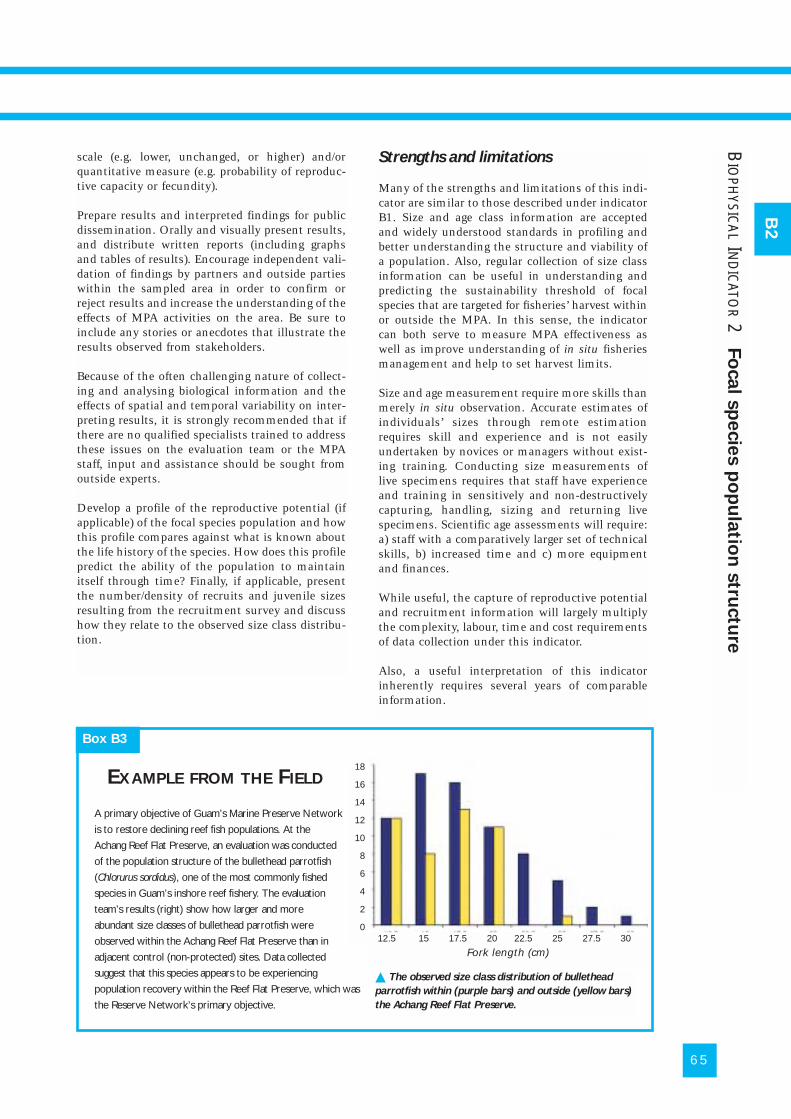
scale (e.g. lower, unchanged, or higher) and/orquantitative measure (e.g. probability of reproduc-tive capacity or fecundity).
Prepare results and interpreted findings for publicdissemination. Orally and visually present results,and distribute written reports (including graphsand tables of results). Encourage independent vali-dation of findings by partners and outside partieswithin the sampled area in order to confirm orreject results and increase the understanding of theeffects of MPA activities on the area. Be sure toinclude any stories or anecdotes that illustrate theresults observed from stakeholders.
Because of the often challenging nature of collect-ing and analysing biological information and theeffects of spatial and temporal variability on inter-preting results, it is strongly recommended that ifthere are no qualified specialists trained to addressthese issues on the evaluation team or the MPAstaff, input and assistance should be sought fromoutside experts.
Develop a profile of the reproductive potential (ifapplicable) of the focal species population and howthis profile compares against what is known aboutthe life history of the species. How does this profilepredict the ability of the population to maintainitself through time? Finally, if applicable, presentthe number/density of recruits and juvenile sizesresulting from the recruitment survey and discusshow they relate to the observed size class distribu-tion.
65
2
A primary objective of Guam’s Marine Preserve Network
is to restore declining reef fish populations. At the
Achang Reef Flat Preserve, an evaluation was conducted
of the population structure of the bullethead parrotfish
(Chlorurus sordidus), one of the most commonly fished
species in Guam’s inshore reef fishery. The evaluation
team’s results (right) show how larger and more
abundant size classes of bullethead parrotfish were
observed within the Achang Reef Flat Preserve than in
adjacent control (non-protected) sites. Data collected
suggest that this species appears to be experiencing
population recovery within the Reef Flat Preserve, which was
the Reserve Network’s primary objective.
Box B3
EXAMPLE FROM THE FIELD
� The observed size class distribution of bullethead
parrotfish within (purple bars) and outside (yellow bars)
the Achang Reef Flat Preserve.
B2
BIO
PHYSIC
AL
IND
ICATO
R2
Fo
cal s
pecie
s p
op
ula
tion
stru
ctu
re
Strengths and limitations
Many of the strengths and limitations of this indi-cator are similar to those described under indicatorB1. Size and age class information are acceptedand widely understood standards in profiling andbetter understanding the structure and viability ofa population. Also, regular collection of size classinformation can be useful in understanding andpredicting the sustainability threshold of focalspecies that are targeted for fisheries’ harvest withinor outside the MPA. In this sense, the indicatorcan both serve to measure MPA effectiveness aswell as improve understanding of in situ fisheriesmanagement and help to set harvest limits.
Size and age measurement require more skills thanmerely in situ observation. Accurate estimates ofindividuals’ sizes through remote estimationrequires skill and experience and is not easilyundertaken by novices or managers without exist-ing training. Conducting size measurements oflive specimens requires that staff have experienceand training in sensitively and non-destructivelycapturing, handling, sizing and returning livespecimens. Scientific age assessments will require:a) staff with a comparatively larger set of technicalskills, b) increased time and c) more equipmentand finances.
While useful, the capture of reproductive potentialand recruitment information will largely multiplythe complexity, labour, time and cost requirementsof data collection under this indicator.
Also, a useful interpretation of this indicatorinherently requires several years of comparableinformation.
12.5 15 17.5 20 22.5 25 27.5 30
Fork length (cm)
18
16
14
12
10
8
6
4
2
0
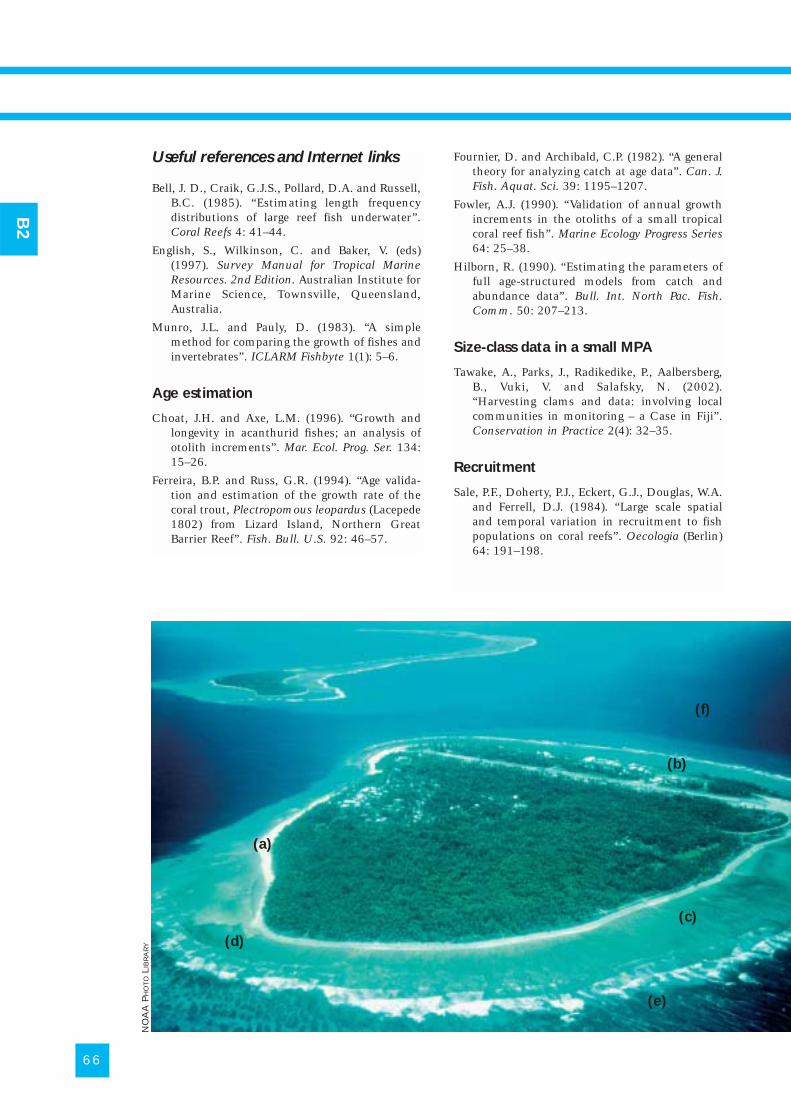
Useful references and Internet links
Bell, J. D., Craik, G.J.S., Pollard, D.A. and Russell,B.C. (1985). “Estimating length frequencydistributions of large reef fish underwater”.Coral Reefs 4: 41–44.
English, S., Wilkinson, C. and Baker, V. (eds)(1997). Survey Manual for Tropical MarineResources. 2nd Edition. Australian Institute forMarine Science, Townsville, Queensland,Australia.
Munro, J.L. and Pauly, D. (1983). “A simplemethod for comparing the growth of fishes andinvertebrates”. ICLARM Fishbyte 1(1): 5–6.
Age estimation
Choat, J.H. and Axe, L.M. (1996). “Growth andlongevity in acanthurid fishes; an analysis ofotolith increments”. Mar. Ecol. Prog. Ser. 134:15–26.
Ferreira, B.P. and Russ, G.R. (1994). “Age valida-tion and estimation of the growth rate of thecoral trout, Plectropomous leopardus (Lacepede1802) from Lizard Island, Northern GreatBarrier Reef”. Fish. Bull. U.S. 92: 46–57.
Fournier, D. and Archibald, C.P. (1982). “A generaltheory for analyzing catch at age data”. Can. J.Fish. Aquat. Sci. 39: 1195–1207.
Fowler, A.J. (1990). “Validation of annual growthincrements in the otoliths of a small tropicalcoral reef fish”. Marine Ecology Progress Series64: 25–38.
Hilborn, R. (1990). “Estimating the parameters offull age-structured models from catch andabundance data”. Bull. Int. North Pac. Fish.Comm. 50: 207–213.
Size-class data in a small MPA
Tawake, A., Parks, J., Radikedike, P., Aalbersberg,B., Vuki, V. and Salafsky, N. (2002).“Harvesting clams and data: involving localcommunities in monitoring – a Case in Fiji”.Conservation in Practice 2(4): 32–35.
Recruitment
Sale, P.F., Doherty, P.J., Eckert, G.J., Douglas, W.A.and Ferrell, D.J. (1984). “Large scale spatialand temporal variation in recruitment to fishpopulations on coral reefs”. Oecologia (Berlin)64: 191–198.
66
B2
NO
AA
PH
OT
OLI
BR
AR
Y
(a)
(b)
(c)
(d)
(e)
(f)
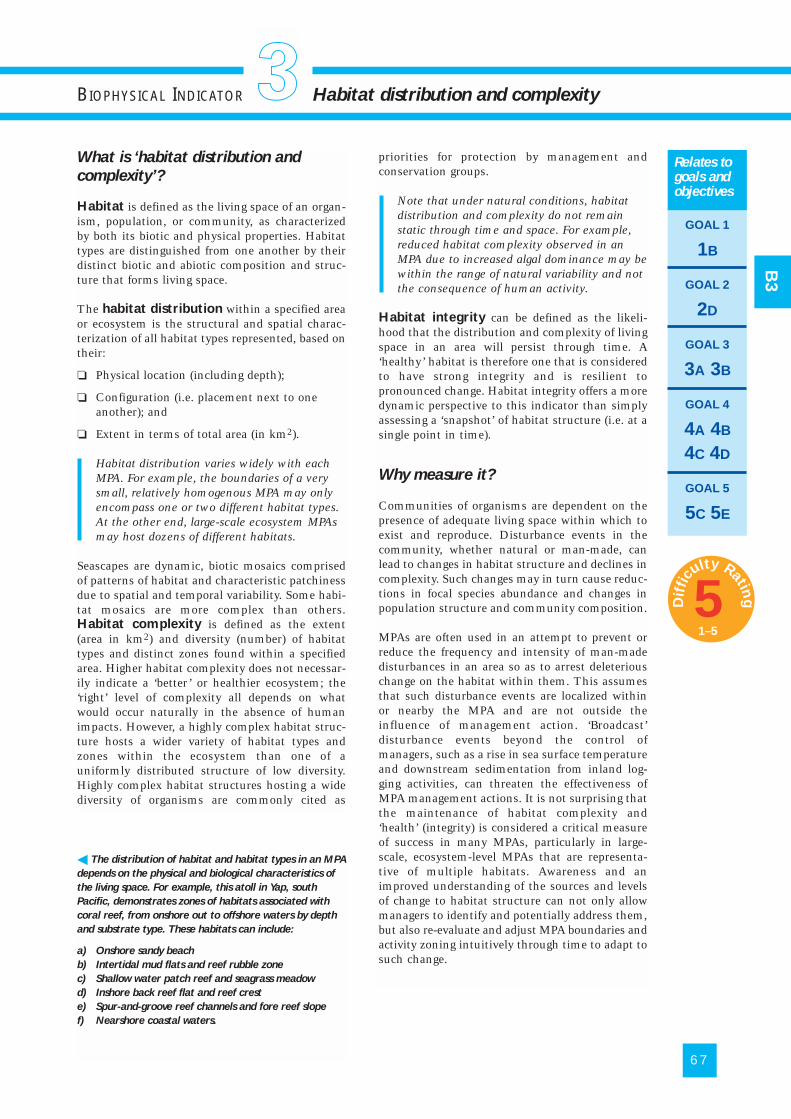
What is ‘habitat distribution and
complexity’?
Habitat is defined as the living space of an organ-ism, population, or community, as characterizedby both its biotic and physical properties. Habitattypes are distinguished from one another by theirdistinct biotic and abiotic composition and struc-ture that forms living space.
The habitat distribution within a specified areaor ecosystem is the structural and spatial charac-terization of all habitat types represented, based ontheir:
❏ Physical location (including depth);
❏ Configuration (i.e. placement next to oneanother); and
❏ Extent in terms of total area (in km2).
Habitat distribution varies widely with eachMPA. For example, the boundaries of a verysmall, relatively homogenous MPA may onlyencompass one or two different habitat types.At the other end, large-scale ecosystem MPAsmay host dozens of different habitats.
Seascapes are dynamic, biotic mosaics comprisedof patterns of habitat and characteristic patchinessdue to spatial and temporal variability. Some habi-tat mosaics are more complex than others.Habitat complexity is defined as the extent(area in km2) and diversity (number) of habitattypes and distinct zones found within a specifiedarea. Higher habitat complexity does not necessar-ily indicate a ‘better’ or healthier ecosystem; the‘right’ level of complexity all depends on whatwould occur naturally in the absence of humanimpacts. However, a highly complex habitat struc-ture hosts a wider variety of habitat types andzones within the ecosystem than one of auniformly distributed structure of low diversity.Highly complex habitat structures hosting a widediversity of organisms are commonly cited as
priorities for protection by management andconservation groups.
Note that under natural conditions, habitatdistribution and complexity do not remainstatic through time and space. For example,reduced habitat complexity observed in anMPA due to increased algal dominance may bewithin the range of natural variability and notthe consequence of human activity.
Habitat integrity can be defined as the likeli-hood that the distribution and complexity of livingspace in an area will persist through time. A‘healthy’ habitat is therefore one that is consideredto have strong integrity and is resilient topronounced change. Habitat integrity offers a moredynamic perspective to this indicator than simplyassessing a ‘snapshot’ of habitat structure (i.e. at asingle point in time).
Why measure it?
Communities of organisms are dependent on thepresence of adequate living space within which toexist and reproduce. Disturbance events in thecommunity, whether natural or man-made, canlead to changes in habitat structure and declines incomplexity. Such changes may in turn cause reduc-tions in focal species abundance and changes inpopulation structure and community composition.
MPAs are often used in an attempt to prevent orreduce the frequency and intensity of man-madedisturbances in an area so as to arrest deleteriouschange on the habitat within them. This assumesthat such disturbance events are localized withinor nearby the MPA and are not outside theinfluence of management action. ‘Broadcast’disturbance events beyond the control ofmanagers, such as a rise in sea surface temperatureand downstream sedimentation from inland log-ging activities, can threaten the effectiveness ofMPA management actions. It is not surprising thatthe maintenance of habitat complexity and‘health’ (integrity) is considered a critical measureof success in many MPAs, particularly in large-scale, ecosystem-level MPAs that are representa-tive of multiple habitats. Awareness and animproved understanding of the sources and levelsof change to habitat structure can not only allowmanagers to identify and potentially address them,but also re-evaluate and adjust MPA boundaries andactivity zoning intuitively through time to adapt tosuch change.
67
BIOPHYSICAL INDICATOR Habitat distribution and complexity
GOAL 1
1B
GOAL 2
2D
GOAL 3
3A 3B
GOAL 4
4A 4B
4C 4D
GOAL 5
5C 5E
Relates togoals andobjectives
B3
� The distribution of habitat and habitat types in an MPA
depends on the physical and biological characteristics of
the living space. For example, this atoll in Yap, south
Pacific, demonstrates zones of habitats associated with
coral reef, from onshore out to offshore waters by depth
and substrate type. These habitats can include:
a) Onshore sandy beach
b) Intertidal mud flats and reef rubble zone
c) Shallow water patch reef and seagrass meadow
d) Inshore back reef flat and reef crest
e) Spur-and-groove reef channels and fore reef slope
f) Nearshore coastal waters.
1
5Dif
ficu
lty Rating
1–5
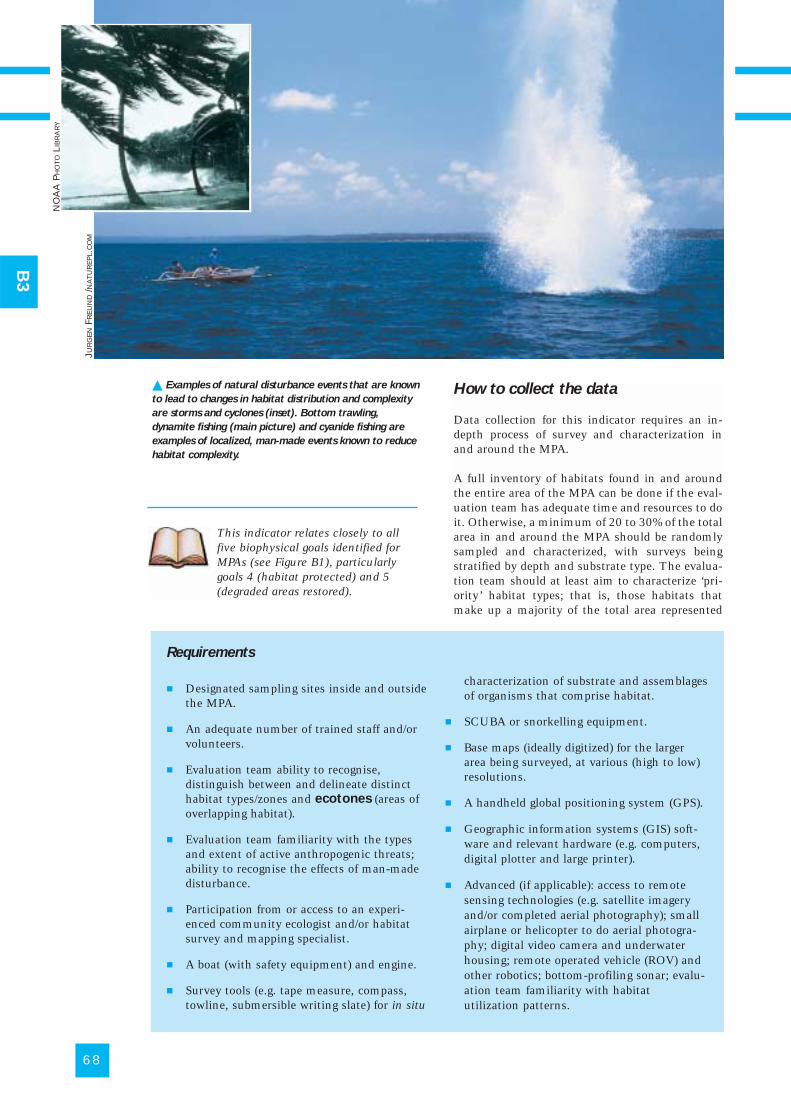
How to collect the data
Data collection for this indicator requires an in-depth process of survey and characterization inand around the MPA.
A full inventory of habitats found in and aroundthe entire area of the MPA can be done if the eval-uation team has adequate time and resources to doit. Otherwise, a minimum of 20 to 30% of the totalarea in and around the MPA should be randomlysampled and characterized, with surveys beingstratified by depth and substrate type. The evalua-tion team should at least aim to characterize ‘pri-ority’ habitat types; that is, those habitats thatmake up a majority of the total area represented
68
B3
Requirements
� Designated sampling sites inside and outsidethe MPA.
� An adequate number of trained staff and/orvolunteers.
� Evaluation team ability to recognise,distinguish between and delineate distincthabitat types/zones and ecotones (areas ofoverlapping habitat).
� Evaluation team familiarity with the typesand extent of active anthropogenic threats;ability to recognise the effects of man-madedisturbance.
� Participation from or access to an experi-enced community ecologist and/or habitatsurvey and mapping specialist.
� A boat (with safety equipment) and engine.
� Survey tools (e.g. tape measure, compass,towline, submersible writing slate) for in situ
characterization of substrate and assemblages of organisms that comprise habitat.
� SCUBA or snorkelling equipment.
� Base maps (ideally digitized) for the largerarea being surveyed, at various (high to low)resolutions.
� A handheld global positioning system (GPS).
� Geographic information systems (GIS) soft-ware and relevant hardware (e.g. computers,digital plotter and large printer).
� Advanced (if applicable): access to remotesensing technologies (e.g. satellite imageryand/or completed aerial photography); smallairplane or helicopter to do aerial photogra-phy; digital video camera and underwaterhousing; remote operated vehicle (ROV) andother robotics; bottom-profiling sonar; evalu-ation team familiarity with habitatutilization patterns.
This indicator relates closely to allfive biophysical goals identified forMPAs (see Figure B1), particularlygoals 4 (habitat protected) and 5(degraded areas restored).
� Examples of natural disturbance events that are known
to lead to changes in habitat distribution and complexity
are storms and cyclones (inset). Bottom trawling,
dynamite fishing (main picture) and cyanide fishing are
examples of localized, man-made events known to reduce
habitat complexity.
JUR
GE
NFR
EU
ND
/NA
TU
RE
PL.
CO
M
NO
AA
PH
OT
OLI
BR
AR
Y
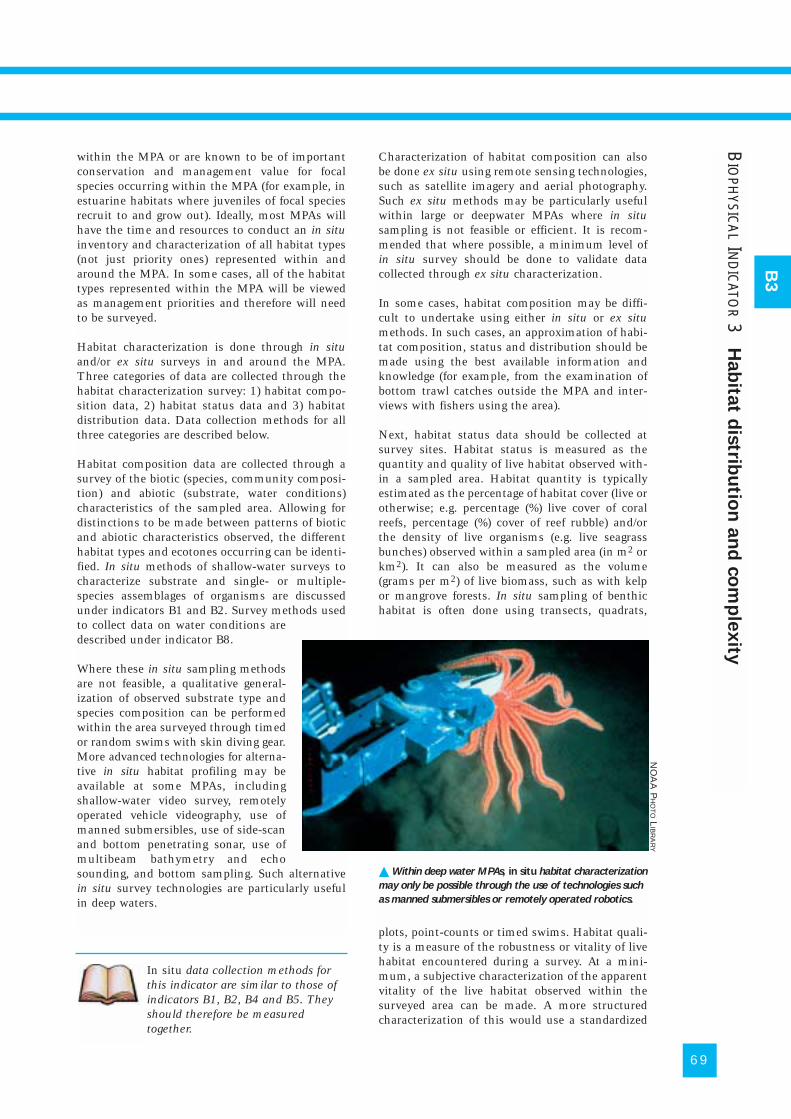
within the MPA or are known to be of importantconservation and management value for focalspecies occurring within the MPA (for example, inestuarine habitats where juveniles of focal speciesrecruit to and grow out). Ideally, most MPAs willhave the time and resources to conduct an in situinventory and characterization of all habitat types(not just priority ones) represented within andaround the MPA. In some cases, all of the habitattypes represented within the MPA will be viewedas management priorities and therefore will needto be surveyed.
Habitat characterization is done through in situand/or ex situ surveys in and around the MPA.Three categories of data are collected through thehabitat characterization survey: 1) habitat compo-sition data, 2) habitat status data and 3) habitatdistribution data. Data collection methods for allthree categories are described below.
Habitat composition data are collected through asurvey of the biotic (species, community composi-tion) and abiotic (substrate, water conditions)characteristics of the sampled area. Allowing fordistinctions to be made between patterns of bioticand abiotic characteristics observed, the differenthabitat types and ecotones occurring can be identi-fied. In situ methods of shallow-water surveys tocharacterize substrate and single- or multiple-species assemblages of organisms are discussedunder indicators B1 and B2. Survey methods usedto collect data on water conditions aredescribed under indicator B8.
Where these in situ sampling methodsare not feasible, a qualitative general-ization of observed substrate type andspecies composition can be performedwithin the area surveyed through timedor random swims with skin diving gear.More advanced technologies for alterna-tive in situ habitat profiling may beavailable at some MPAs, includingshallow-water video survey, remotelyoperated vehicle videography, use ofmanned submersibles, use of side-scanand bottom penetrating sonar, use ofmultibeam bathymetry and echosounding, and bottom sampling. Such alternativein situ survey technologies are particularly usefulin deep waters.
Characterization of habitat composition can alsobe done ex situ using remote sensing technologies,such as satellite imagery and aerial photography.Such ex situ methods may be particularly usefulwithin large or deepwater MPAs where in situsampling is not feasible or efficient. It is recom-mended that where possible, a minimum level ofin situ survey should be done to validate datacollected through ex situ characterization.
In some cases, habitat composition may be diffi-cult to undertake using either in situ or ex situmethods. In such cases, an approximation of habi-tat composition, status and distribution should bemade using the best available information andknowledge (for example, from the examination ofbottom trawl catches outside the MPA and inter-views with fishers using the area).
Next, habitat status data should be collected atsurvey sites. Habitat status is measured as thequantity and quality of live habitat observed with-in a sampled area. Habitat quantity is typicallyestimated as the percentage of habitat cover (live orotherwise; e.g. percentage (%) live cover of coralreefs, percentage (%) cover of reef rubble) and/orthe density of live organisms (e.g. live seagrassbunches) observed within a sampled area (in m2 orkm2). It can also be measured as the volume(grams per m2) of live biomass, such as with kelpor mangrove forests. In situ sampling of benthichabitat is often done using transects, quadrats,
plots, point-counts or timed swims. Habitat quali-ty is a measure of the robustness or vitality of livehabitat encountered during a survey. At a mini-mum, a subjective characterization of the apparentvitality of the live habitat observed within thesurveyed area can be made. A more structuredcharacterization of this would use a standardized
69
B3
In situ data collection methods forthis indicator are similar to those ofindicators B1, B2, B4 and B5. Theyshould therefore be measuredtogether.
� Within deep water MPAs, in situ habitat characterization
may only be possible through the use of technologies such
as manned submersibles or remotely operated robotics.
BIO
PHYSIC
AL
IND
ICATO
R3
Hab
itat d
istrib
utio
n a
nd
co
mp
lexity
NO
AA
PH
OT
OL
IBR
AR
Y
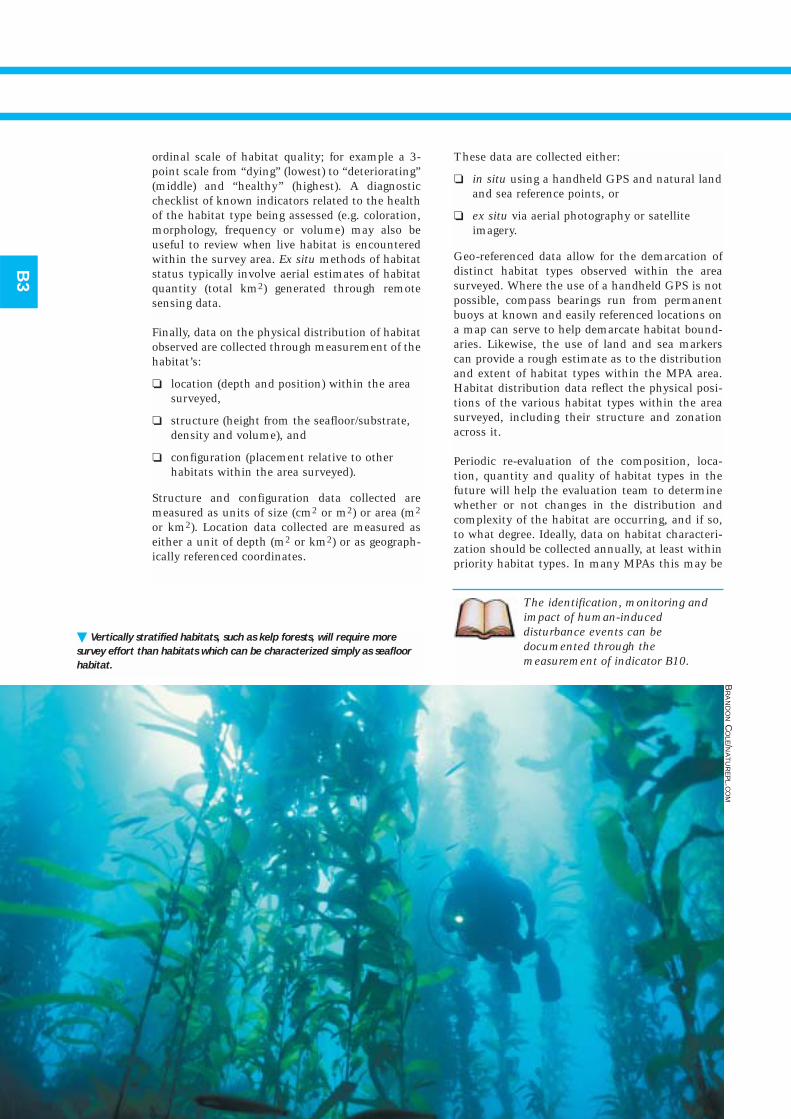
ordinal scale of habitat quality; for example a 3-point scale from “dying” (lowest) to “deteriorating”(middle) and “healthy” (highest). A diagnosticchecklist of known indicators related to the healthof the habitat type being assessed (e.g. coloration,morphology, frequency or volume) may also beuseful to review when live habitat is encounteredwithin the survey area. Ex situ methods of habitatstatus typically involve aerial estimates of habitatquantity (total km2) generated through remotesensing data.
Finally, data on the physical distribution of habitatobserved are collected through measurement of thehabitat’s:
❏ location (depth and position) within the areasurveyed,
❏ structure (height from the seafloor/substrate,density and volume), and
❏ configuration (placement relative to otherhabitats within the area surveyed).
Structure and configuration data collected aremeasured as units of size (cm2 or m2) or area (m2
or km2). Location data collected are measured aseither a unit of depth (m2 or km2) or as geograph-ically referenced coordinates.
These data are collected either:
❏ in situ using a handheld GPS and natural landand sea reference points, or
❏ ex situ via aerial photography or satelliteimagery.
Geo-referenced data allow for the demarcation ofdistinct habitat types observed within the areasurveyed. Where the use of a handheld GPS is notpossible, compass bearings run from permanentbuoys at known and easily referenced locations ona map can serve to help demarcate habitat bound-aries. Likewise, the use of land and sea markerscan provide a rough estimate as to the distributionand extent of habitat types within the MPA area.Habitat distribution data reflect the physical posi-tions of the various habitat types within the areasurveyed, including their structure and zonationacross it.
Periodic re-evaluation of the composition, loca-tion, quantity and quality of habitat types in thefuture will help the evaluation team to determinewhether or not changes in the distribution andcomplexity of the habitat are occurring, and if so,to what degree. Ideally, data on habitat characteri-zation should be collected annually, at least withinpriority habitat types. In many MPAs this may be
B3
The identification, monitoring andimpact of human-induceddisturbance events can bedocumented through themeasurement of indicator B10.
� Vertically stratified habitats, such as kelp forests, will require more
survey effort than habitats which can be characterized simply as seafloor
habitat.
BR
AN
DO
NC
OLE/N
AT
UR
EP
L.CO
M
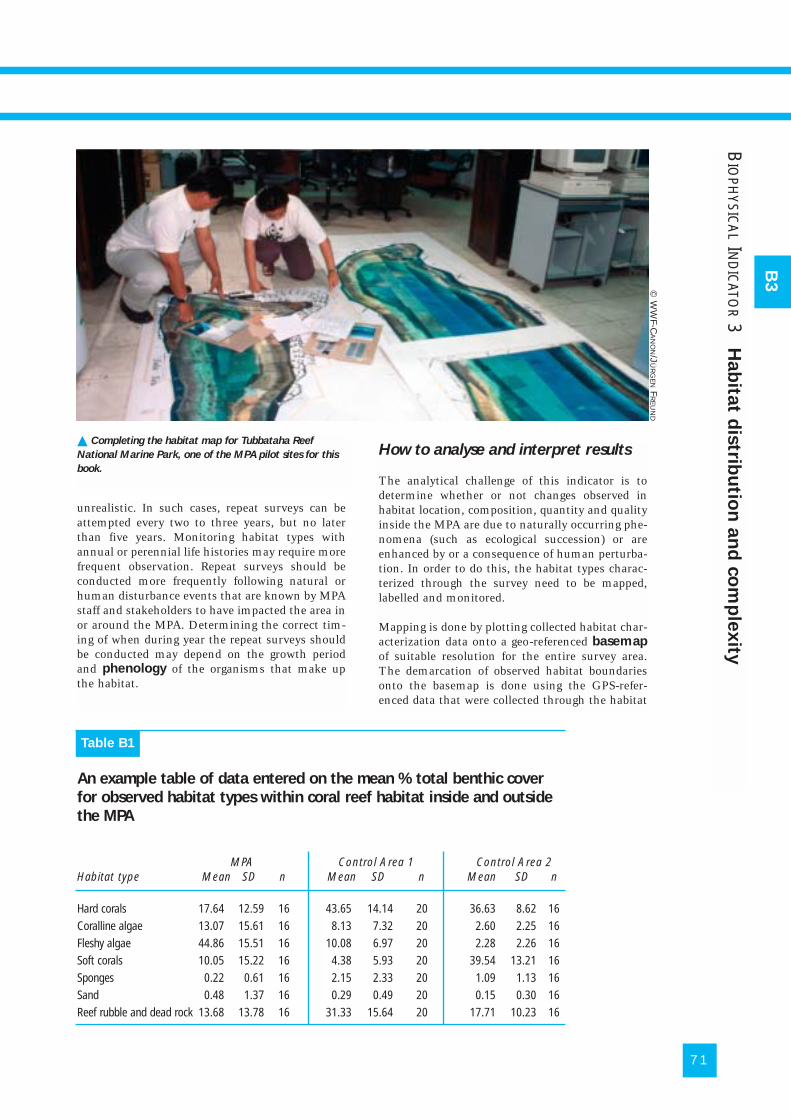
unrealistic. In such cases, repeat surveys can beattempted every two to three years, but no laterthan five years. Monitoring habitat types withannual or perennial life histories may require morefrequent observation. Repeat surveys should beconducted more frequently following natural orhuman disturbance events that are known by MPAstaff and stakeholders to have impacted the area inor around the MPA. Determining the correct tim-ing of when during year the repeat surveys shouldbe conducted may depend on the growth periodand phenology of the organisms that make upthe habitat.
How to analyse and interpret results
The analytical challenge of this indicator is todetermine whether or not changes observed inhabitat location, composition, quantity and qualityinside the MPA are due to naturally occurring phe-nomena (such as ecological succession) or areenhanced by or a consequence of human perturba-tion. In order to do this, the habitat types charac-terized through the survey need to be mapped,labelled and monitored.
Mapping is done by plotting collected habitat char-acterization data onto a geo-referenced basemapof suitable resolution for the entire survey area.The demarcation of observed habitat boundariesonto the basemap is done using the GPS-refer-enced data that were collected through the habitat
71
B3
BIO
PHYSIC
AL
IND
ICATO
R3
Hab
itat d
istrib
utio
n a
nd
co
mp
lexity
An example table of data entered on the mean % total benthic coverfor observed habitat types within coral reef habitat inside and outsidethe MPA
MPA Control Area 1 Control Area 2Habitat type Mean SD n Mean SD n Mean SD n
Hard corals 17.64 12.59 16 43.65 14.14 20 36.63 8.62 16Coralline algae 13.07 15.61 16 8.13 7.32 20 2.60 2.25 16Fleshy algae 44.86 15.51 16 10.08 6.97 20 2.28 2.26 16Soft corals 10.05 15.22 16 4.38 5.93 20 39.54 13.21 16Sponges 0.22 0.61 16 2.15 2.33 20 1.09 1.13 16Sand 0.48 1.37 16 0.29 0.49 20 0.15 0.30 16Reef rubble and dead rock 13.68 13.78 16 31.33 15.64 20 17.71 10.23 16
� Completing the habitat map for Tubbataha Reef
National Marine Park, one of the MPA pilot sites for this
book.
© W
WF-C
AN
ON/J
ÜR
GE
NF
RE
UN
D
Table B1
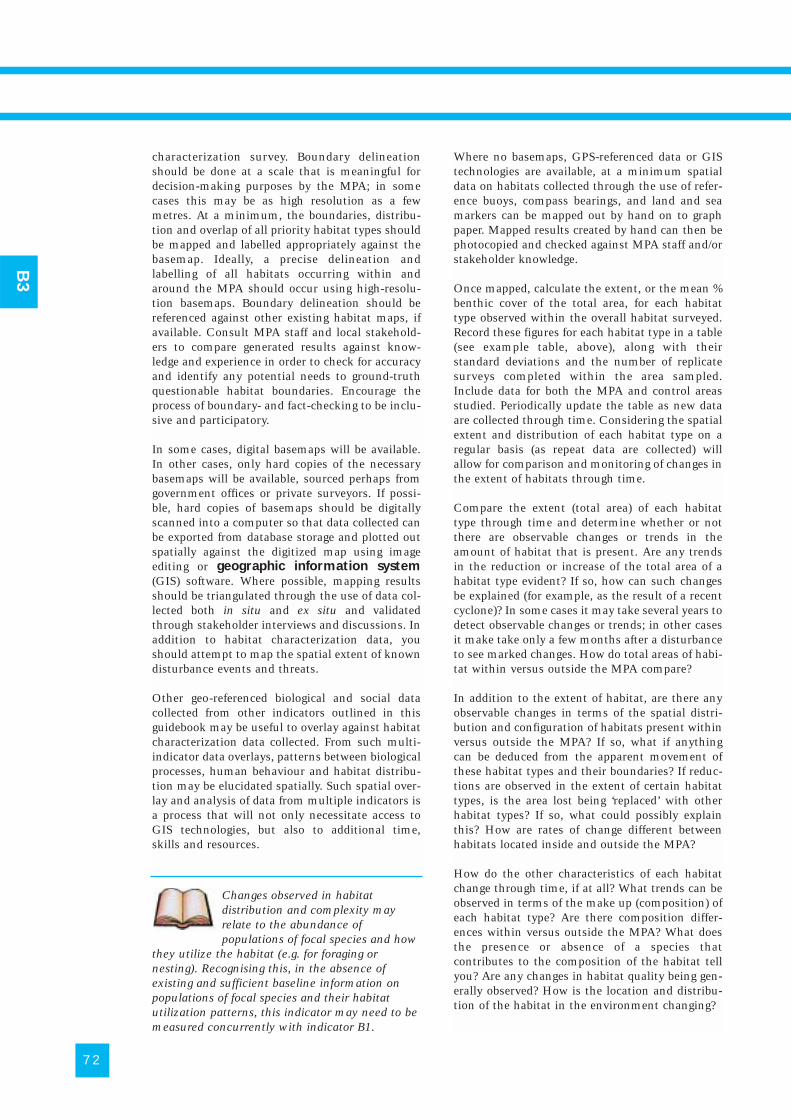
characterization survey. Boundary delineationshould be done at a scale that is meaningful fordecision-making purposes by the MPA; in somecases this may be as high resolution as a fewmetres. At a minimum, the boundaries, distribu-tion and overlap of all priority habitat types shouldbe mapped and labelled appropriately against thebasemap. Ideally, a precise delineation andlabelling of all habitats occurring within andaround the MPA should occur using high-resolu-tion basemaps. Boundary delineation should bereferenced against other existing habitat maps, ifavailable. Consult MPA staff and local stakehold-ers to compare generated results against know-ledge and experience in order to check for accuracyand identify any potential needs to ground-truthquestionable habitat boundaries. Encourage theprocess of boundary- and fact-checking to be inclu-sive and participatory.
In some cases, digital basemaps will be available.In other cases, only hard copies of the necessarybasemaps will be available, sourced perhaps fromgovernment offices or private surveyors. If possi-ble, hard copies of basemaps should be digitallyscanned into a computer so that data collected canbe exported from database storage and plotted outspatially against the digitized map using imageediting or geographic information system(GIS) software. Where possible, mapping resultsshould be triangulated through the use of data col-lected both in situ and ex situ and validatedthrough stakeholder interviews and discussions. Inaddition to habitat characterization data, youshould attempt to map the spatial extent of knowndisturbance events and threats.
Other geo-referenced biological and social datacollected from other indicators outlined in thisguidebook may be useful to overlay against habitatcharacterization data collected. From such multi-indicator data overlays, patterns between biologicalprocesses, human behaviour and habitat distribu-tion may be elucidated spatially. Such spatial over-lay and analysis of data from multiple indicators isa process that will not only necessitate access toGIS technologies, but also to additional time,skills and resources.
Where no basemaps, GPS-referenced data or GIStechnologies are available, at a minimum spatialdata on habitats collected through the use of refer-ence buoys, compass bearings, and land and seamarkers can be mapped out by hand on to graphpaper. Mapped results created by hand can then bephotocopied and checked against MPA staff and/orstakeholder knowledge.
Once mapped, calculate the extent, or the mean %benthic cover of the total area, for each habitattype observed within the overall habitat surveyed.Record these figures for each habitat type in a table(see example table, above), along with theirstandard deviations and the number of replicatesurveys completed within the area sampled.Include data for both the MPA and control areasstudied. Periodically update the table as new dataare collected through time. Considering the spatialextent and distribution of each habitat type on aregular basis (as repeat data are collected) willallow for comparison and monitoring of changes inthe extent of habitats through time.
Compare the extent (total area) of each habitattype through time and determine whether or notthere are observable changes or trends in theamount of habitat that is present. Are any trendsin the reduction or increase of the total area of ahabitat type evident? If so, how can such changesbe explained (for example, as the result of a recentcyclone)? In some cases it may take several years todetect observable changes or trends; in other casesit make take only a few months after a disturbanceto see marked changes. How do total areas of habi-tat within versus outside the MPA compare?
In addition to the extent of habitat, are there anyobservable changes in terms of the spatial distri-bution and configuration of habitats present withinversus outside the MPA? If so, what if anythingcan be deduced from the apparent movement ofthese habitat types and their boundaries? If reduc-tions are observed in the extent of certain habitattypes, is the area lost being ‘replaced’ with otherhabitat types? If so, what could possibly explainthis? How are rates of change different betweenhabitats located inside and outside the MPA?
How do the other characteristics of each habitatchange through time, if at all? What trends can beobserved in terms of the make up (composition) ofeach habitat type? Are there composition differ-ences within versus outside the MPA? What doesthe presence or absence of a species thatcontributes to the composition of the habitat tellyou? Are any changes in habitat quality being gen-erally observed? How is the location and distribu-tion of the habitat in the environment changing?
72
B3
Changes observed in habitatdistribution and complexity mayrelate to the abundance ofpopulations of focal species and how
they utilize the habitat (e.g. for foraging ornesting). Recognising this, in the absence ofexisting and sufficient baseline information onpopulations of focal species and their habitatutilization patterns, this indicator may need to bemeasured concurrently with indicator B1.
In overlaying the estimated spatial extent ofknown threats and disturbance events (see indica-tor B10), how are observed changes in habitatextent and quality related to the location andmovement of such threats? If habitat reductionsobserved are believed to be the result of deleterioushuman activities, based on the nature and locationof such activities, is it realistically within the abil-ity of the management team and the activities ofthe MPA to reduce or halt them? If not, how willsuch deleterious activities be addressed, if at all?
Next, estimate the habitat complexity inside andoutside the MPA by dividing the diversity (number)of habitat types and distinct zones found withinthe surveyed area by the total area (in km2) andsumming the total length of all boundaries divid-ing adjacent or overlapping habitat types. Recordand monitor changes in these two measures ofhabitat complexity through time. In viewing the
spatial distribution of habitat types and groups ofhabitat types, do particular patterns, clusters orzones of habitat appear? Through time, is thepattern and diversity of this mosaic being changedor reduced? Is the physical distribution and overlapamong groups of habitats becoming more uniformor heterogeneous? In analysing composition data,how are the physical (location, height, area andvolume) and biological (composition) dimensionsof each habitat type changing in space and time?Are these dimensions becoming more complex orhomogenous? Do inter-dependencies appearbetween constituent dimensions of each habitattype? If so, is it possible to generalize such inter-dependencies across other habitat types? How dohabitat complexities compare inside and outsidethe MPA?
Directly determining habitat integrity is a highlycomplex process that in most cases would be unre-alistic to expect a team to conduct as part of anMPA evaluation. However, estimating the rate ofchange of habitat extent and complexity within theMPA through time can serve as a proxy for habitatintegrity. To estimate the rate of change, calculatethe percentage of incremental change observed inthe extent, quality (of live cover) and complexity(diversity) between present and last, and presentand baseline measures. Score these values as thedifference from 100 in observed percentage changeand compare them against the rate of averageincremental (yearly) change. Qualitatively describehow likely the habitat type will persist based ontrends in observed change, observed changes in therate of change, and as a description of how faraway observed habitat distribution and complexityis from what had formerly or could likely be foundunder only natural conditions. Low rates of changeor maintenance of the extent and complexity ofhabitat may indicate strong integrity. A sustainedrate of decline observed in habitat distribution andcomplexity over a consecutive number of yearsmay be indicative of recent or ongoing disturbance.Such dynamic observations may help to interpretearly-warning signals that habitat integrity is deteri-orating. On the other hand, documenting onlymarginal changes in habitat structure and com-plexity over time within an MPA in comparison tooutside it may demonstrate effective management.
As further exploration of habitat integrity, explorecorrelating results from indicator B1 against habi-tat quantity and quality results. For example, howdo the abundance data collected on a focal speciesthat is known to be an indicator of habitat qualityand integrity correlate with data collected on thepercentage of live habitat cover observed, if at all?Habitat characterization and mapping resultsgenerated from this indicator should be summa-rized within a habitat inventory report. This report
73
Outputs
� A table with % cover of observed habitattypes.
� A habitat inventory report: a) delineatingthe identified habitat types and zonespresent within and around the MPA(including their location and extent), andb) profiling the biotic and abioticcomposition, structure, and quantity andquality of each.
� A geo-referenced map of all habitatsobserved, their boundaries, and theirdistribution.
� A description of habitat complexity.
� An improved understanding of habitatintegrity.
� For repeat surveys: a spatial analysis ofthe extent of observed change (if anynoticeable) in habitat distribution andcomplexity over time.
Other outputs (if applicable)
� A GIS database of data on the locationand extent of habitat types and zones,their biotic and abiotic composition,their structure, and their quantity andquality.
� A collection of digital maps generated byGIS with varying levels of overlaidindicator data and analysis.
B3
BIO
PHYSIC
AL
IND
ICATO
R3
Hab
itat d
istrib
utio
n a
nd
co
mp
lexity
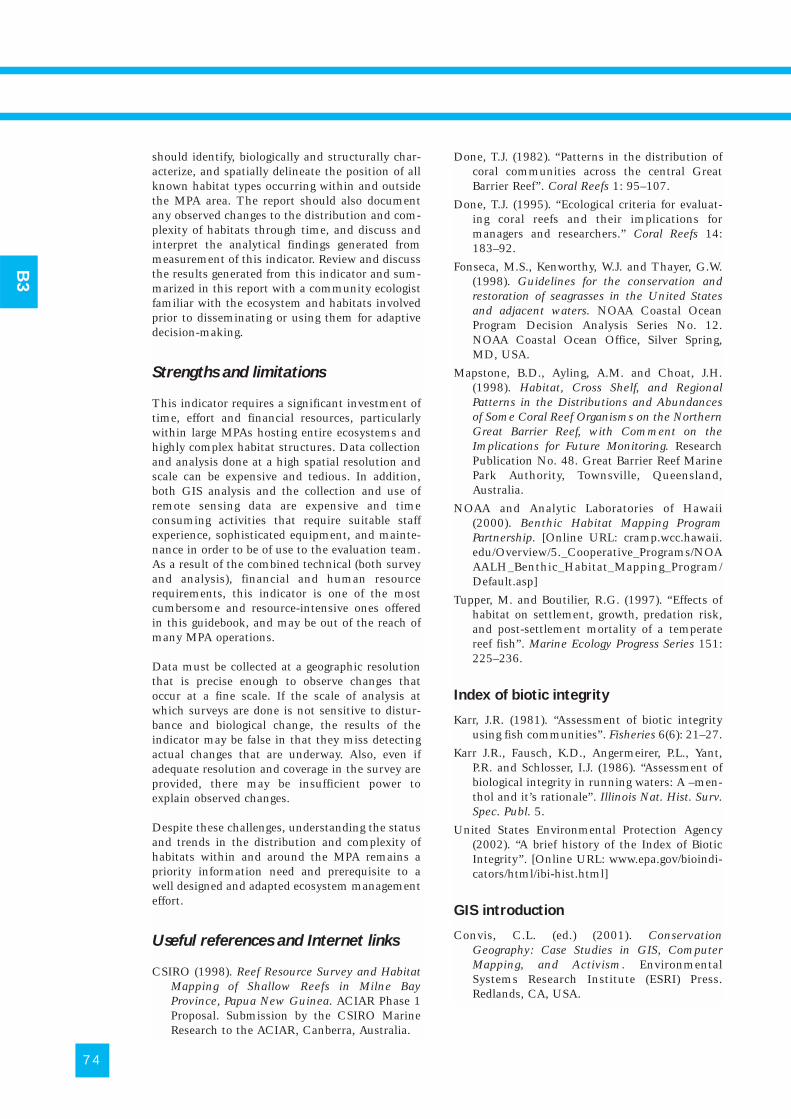
should identify, biologically and structurally char-acterize, and spatially delineate the position of allknown habitat types occurring within and outsidethe MPA area. The report should also documentany observed changes to the distribution and com-plexity of habitats through time, and discuss andinterpret the analytical findings generated frommeasurement of this indicator. Review and discussthe results generated from this indicator and sum-marized in this report with a community ecologistfamiliar with the ecosystem and habitats involvedprior to disseminating or using them for adaptivedecision-making.
Strengths and limitations
This indicator requires a significant investment oftime, effort and financial resources, particularlywithin large MPAs hosting entire ecosystems andhighly complex habitat structures. Data collectionand analysis done at a high spatial resolution andscale can be expensive and tedious. In addition,both GIS analysis and the collection and use ofremote sensing data are expensive and timeconsuming activities that require suitable staffexperience, sophisticated equipment, and mainte-nance in order to be of use to the evaluation team.As a result of the combined technical (both surveyand analysis), financial and human resourcerequirements, this indicator is one of the mostcumbersome and resource-intensive ones offeredin this guidebook, and may be out of the reach ofmany MPA operations.
Data must be collected at a geographic resolutionthat is precise enough to observe changes thatoccur at a fine scale. If the scale of analysis atwhich surveys are done is not sensitive to distur-bance and biological change, the results of theindicator may be false in that they miss detectingactual changes that are underway. Also, even ifadequate resolution and coverage in the survey areprovided, there may be insufficient power toexplain observed changes.
Despite these challenges, understanding the statusand trends in the distribution and complexity ofhabitats within and around the MPA remains apriority information need and prerequisite to awell designed and adapted ecosystem managementeffort.
Useful references and Internet links
CSIRO (1998). Reef Resource Survey and HabitatMapping of Shallow Reefs in Milne BayProvince, Papua New Guinea. ACIAR Phase 1Proposal. Submission by the CSIRO MarineResearch to the ACIAR, Canberra, Australia.
Done, T.J. (1982). “Patterns in the distribution ofcoral communities across the central GreatBarrier Reef”. Coral Reefs 1: 95–107.
Done, T.J. (1995). “Ecological criteria for evaluat-ing coral reefs and their implications formanagers and researchers.” Coral Reefs 14:183–92.
Fonseca, M.S., Kenworthy, W.J. and Thayer, G.W.(1998). Guidelines for the conservation andrestoration of seagrasses in the United Statesand adjacent waters. NOAA Coastal OceanProgram Decision Analysis Series No. 12.NOAA Coastal Ocean Office, Silver Spring,MD, USA.
Mapstone, B.D., Ayling, A.M. and Choat, J.H.(1998). Habitat, Cross Shelf, and RegionalPatterns in the Distributions and Abundancesof Some Coral Reef Organisms on the NorthernGreat Barrier Reef, with Comment on theImplications for Future Monitoring. ResearchPublication No. 48. Great Barrier Reef MarinePark Authority, Townsville, Queensland,Australia.
NOAA and Analytic Laboratories of Hawaii(2000). Benthic Habitat Mapping ProgramPartnership. [Online URL: cramp.wcc.hawaii.edu/Overview/5._Cooperative_Programs/NOAAALH_Benthic_Habitat_Mapping_Program/Default.asp]
Tupper, M. and Boutilier, R.G. (1997). “Effects ofhabitat on settlement, growth, predation risk,and post-settlement mortality of a temperatereef fish”. Marine Ecology Progress Series 151:225–236.
Index of biotic integrity
Karr, J.R. (1981). “Assessment of biotic integrityusing fish communities”. Fisheries 6(6): 21–27.
Karr J.R., Fausch, K.D., Angermeirer, P.L., Yant,P.R. and Schlosser, I.J. (1986). “Assessment ofbiological integrity in running waters: A –men-thol and it’s rationale”. Illinois Nat. Hist. Surv.Spec. Publ. 5.
United States Environmental Protection Agency(2002). “A brief history of the Index of BioticIntegrity”. [Online URL: www.epa.gov/bioindi-cators/html/ibi-hist.html]
GIS introduction
Convis, C.L. (ed.) (2001). ConservationGeography: Case Studies in GIS, ComputerMapping, and Activism. EnvironmentalSystems Research Institute (ESRI) Press.Redlands, CA, USA.
74
B3
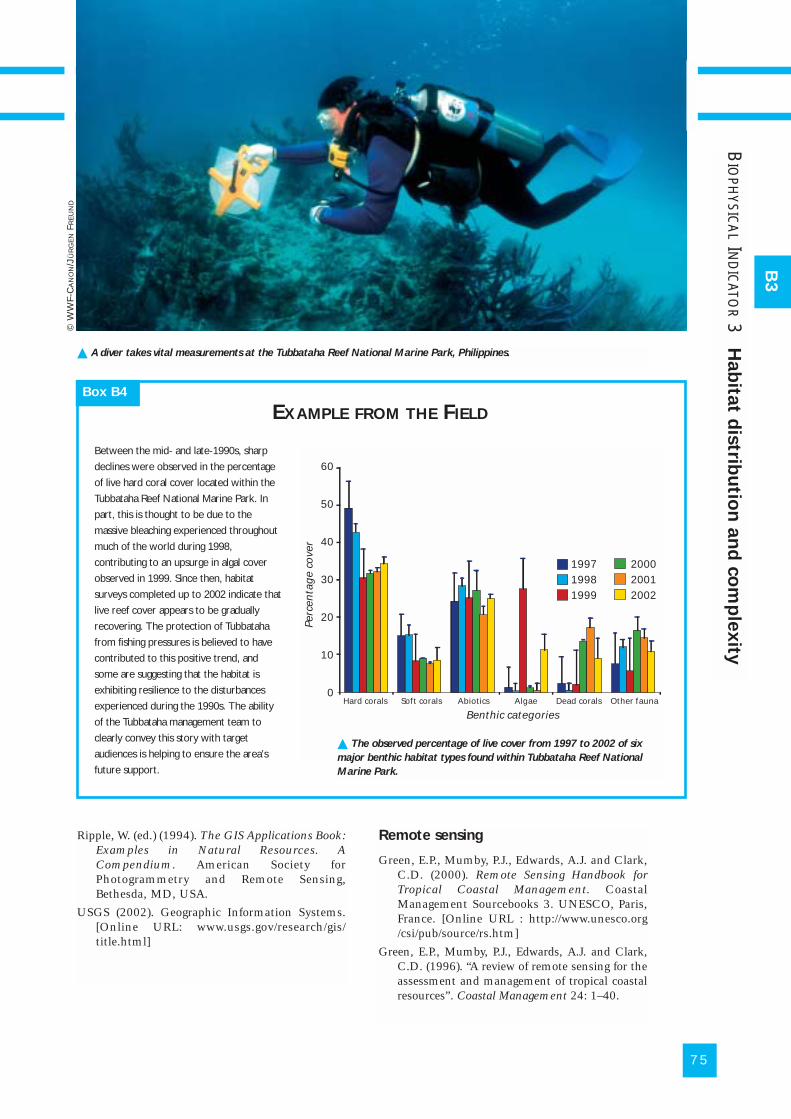
Ripple, W. (ed.) (1994). The GIS Applications Book:Examples in Natural Resources. ACompendium. American Society forPhotogrammetry and Remote Sensing,Bethesda, MD, USA.
USGS (2002). Geographic Information Systems.[Online URL: www.usgs.gov/research/gis/title.html]
75
B3
� A diver takes vital measurements at the Tubbataha Reef National Marine Park, Philippines.
BIO
PHYSIC
AL
IND
ICATO
R3
Hab
itat d
istrib
utio
n a
nd
co
mp
lexity
© W
WF-
CA
NO
N/J
ÜR
GE
NFR
EU
ND
Remote sensing
Green, E.P., Mumby, P.J., Edwards, A.J. and Clark,C.D. (2000). Remote Sensing Handbook forTropical Coastal Management. CoastalManagement Sourcebooks 3. UNESCO, Paris,France. [Online URL : http://www.unesco.org/csi/pub/source/rs.htm]
Green, E.P., Mumby, P.J., Edwards, A.J. and Clark,C.D. (1996). “A review of remote sensing for theassessment and management of tropical coastalresources”. Coastal Management 24: 1–40.
able 2
Between the mid- and late-1990s, sharp
declines were observed in the percentage
of live hard coral cover located within the
Tubbataha Reef National Marine Park. In
part, this is thought to be due to the
massive bleaching experienced throughout
much of the world during 1998,
contributing to an upsurge in algal cover
observed in 1999. Since then, habitat
surveys completed up to 2002 indicate that
live reef cover appears to be gradually
recovering. The protection of Tubbataha
from fishing pressures is believed to have
contributed to this positive trend, and
some are suggesting that the habitat is
exhibiting resilience to the disturbances
experienced during the 1990s. The ability
of the Tubbataha management team to
clearly convey this story with target
audiences is helping to ensure the area’s
future support.
Box B4
Hard corals Soft corals Abiotics Algae Dead corals Other fauna
Benthic categories
Perc
enta
ge
cove
r
60
50
40
30
20
10
0
199719981999
200020012002
� The observed percentage of live cover from 1997 to 2002 of six
major benthic habitat types found within Tubbataha Reef National
Marine Park.
EXAMPLE FROM THE FIELD
76
What is ‘composition and structure of
the community’?
A community is a collection of different andinteracting populations of organisms (biota) foundliving together in a defined geographic area, includ-ing indigenous and exotic organisms. Some MPAswill host multiple communities of organisms. Thisindicator is concerned with the species that bothcomprise habitat types and the organisms residingin them to form the community – i.e. what is inthe community.
Note this indicator is primarily used to collectinformation on multiple populations of species(focal and otherwise) within a communitysampled. It is not expected that the evaluationteam would realistically be able to measure allpopulations of organisms that occur within thecommunity.
Community composition is the diversity andmakeup of all species present within a communityand their relative abundance (respective to oneanother). Species richness, dominance, diversity,and relative abundance are all characteristics ofcommunity composition.
Community structure is a summary description ofhow the numbers and relative abundance ofspecies occur within a community and are foundspatially across the physical environment (form)and habitats in or upon which the members (com-position) of the community live. Communitystructure can therefore be described as the num-bers and relative abundances of all species withinthe community and how they are organized intozones, or strata, of living space. For example, at abasic level the community structure of a coastalecosystem could be considered within intertidal,neritic and benthic zones. Habitat diversity andrelative habitat abundance are both importantdeterminants of community structure. Abioticcharacteristics (e.g. geology and light) also largelyinfluence community structure.
Why measure it?
This is one of the most commonly identified bio-physical indicators of high importance. The main-tenance or restoration of the naturally occurringcomposition and structure of a resident communi-ty is often desired to encourage the ‘integrity’ of anecosystem, including its health, functioning, andresistance to disturbance. Understanding changes– and the extent and sources (both natural andanthropogenic perturbations) of such changes –occurring within the composition and structure ofeach community found within and adjacent to the
MPA are therefore prerequisites for diagnosing andtreating ailing ecosystems. Measurement ofcommunity composition and structure throughtime allows managers to evaluate whether or nottheir management efforts (in this case, the use ofan MPA) are having the desired effects on thetarget ecosystems.
Additionally, understanding what species comprisea community or organisms and how these organ-isms are structured within the natural settingallows managers to prioritize and monitor coastalareas requiring management action. For example,by improving the understanding of which nearshore areas host the highest levels of speciesrichness and diversity, managers can begin toadaptively prioritize their management efforts andallocate resources accordingly as conditionschange. This increases the investment value ofmanagement efforts through time and reduces risk.
BIOPHYSICAL INDICATOR Composition and structure of the community
GOAL 1
1B 1C
1D
GOAL 2
2A 2C
2E 2G
GOAL 3
3B 3D
GOAL 4
4A 4B
4C 4D
GOAL 5
5B 5C
5D 5E
Relates togoals andobjectives
Requirements
� Similar requirements as listed underindicators B1, B2 and B3.
� A representative sample of survey sitesinside and outside the MPA, stratifiedacross known habitat types and zones.
� An adequate number of staff and/orvolunteers (respective to the size of thearea needing to be surveyed) are neededwho are: a) trained in underwatercensus, b) can accurately identify thespecies being surveyed in situ, andc) willing and committed to undertakethe necessary survey work. A minimumteam of four people is recommended.
� The necessary survey equipment (e.g. aboat with safety equipment, survey gearand snorkel, hookah or SCUBA equip-ment) needed to observe the variousspecies and habitats observed within thesampled area (both inside and outsidethe MPA).
� The ecological knowledge and experiencenecessary to interpret changes incommunity composition and structure.This may require consulting the servicesand/or advice of a professional ecologistfamiliar with the study area. This caveatcomes from recognition that there arerarely simple, universal benchmarks thatwill describe such changes everywherethey are encountered.
B4
1
4Dif
ficu
lty Rating
1–5
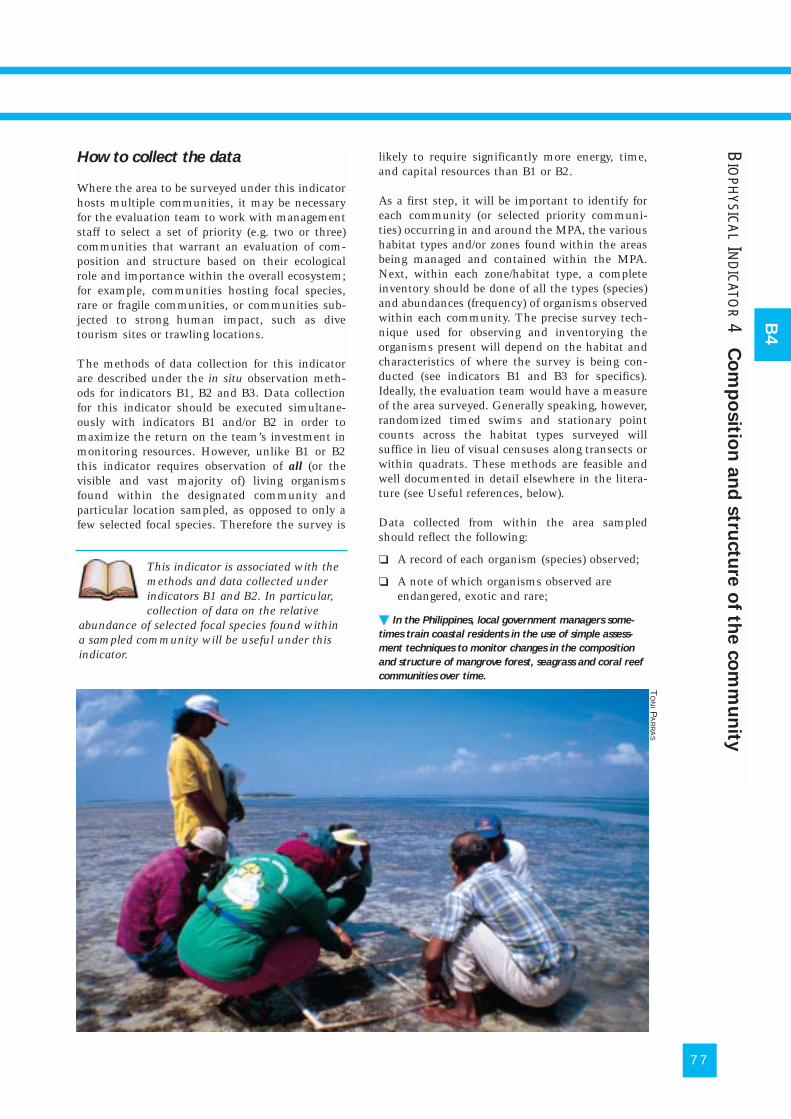
77
B4
How to collect the data
Where the area to be surveyed under this indicatorhosts multiple communities, it may be necessaryfor the evaluation team to work with managementstaff to select a set of priority (e.g. two or three)communities that warrant an evaluation of com-position and structure based on their ecologicalrole and importance within the overall ecosystem;for example, communities hosting focal species,rare or fragile communities, or communities sub-jected to strong human impact, such as divetourism sites or trawling locations.
The methods of data collection for this indicatorare described under the in situ observation meth-ods for indicators B1, B2 and B3. Data collectionfor this indicator should be executed simultane-ously with indicators B1 and/or B2 in order tomaximize the return on the team’s investment inmonitoring resources. However, unlike B1 or B2this indicator requires observation of all (or thevisible and vast majority of) living organismsfound within the designated community andparticular location sampled, as opposed to only afew selected focal species. Therefore the survey is
likely to require significantly more energy, time,and capital resources than B1 or B2.
As a first step, it will be important to identify foreach community (or selected priority communi-ties) occurring in and around the MPA, the varioushabitat types and/or zones found within the areasbeing managed and contained within the MPA.Next, within each zone/habitat type, a completeinventory should be done of all the types (species)and abundances (frequency) of organisms observedwithin each community. The precise survey tech-nique used for observing and inventorying theorganisms present will depend on the habitat andcharacteristics of where the survey is being con-ducted (see indicators B1 and B3 for specifics).Ideally, the evaluation team would have a measureof the area surveyed. Generally speaking, however,randomized timed swims and stationary pointcounts across the habitat types surveyed willsuffice in lieu of visual censuses along transects orwithin quadrats. These methods are feasible andwell documented in detail elsewhere in the litera-ture (see Useful references, below).
Data collected from within the area sampledshould reflect the following:
❏ A record of each organism (species) observed;
❏ A note of which organisms observed areendangered, exotic and rare;
This indicator is associated with themethods and data collected underindicators B1 and B2. In particular,collection of data on the relative
abundance of selected focal species found withina sampled community will be useful under thisindicator.
BIO
PHYSIC
AL
IND
ICATO
R4
Co
mp
ositio
n a
nd
stru
ctu
re o
f the c
om
mu
nity
TO
NIP
AR
RA
S
� In the Philippines, local government managers some-
times train coastal residents in the use of simple assess-
ment techniques to monitor changes in the composition
and structure of mangrove forest, seagrass and coral reef
communities over time.
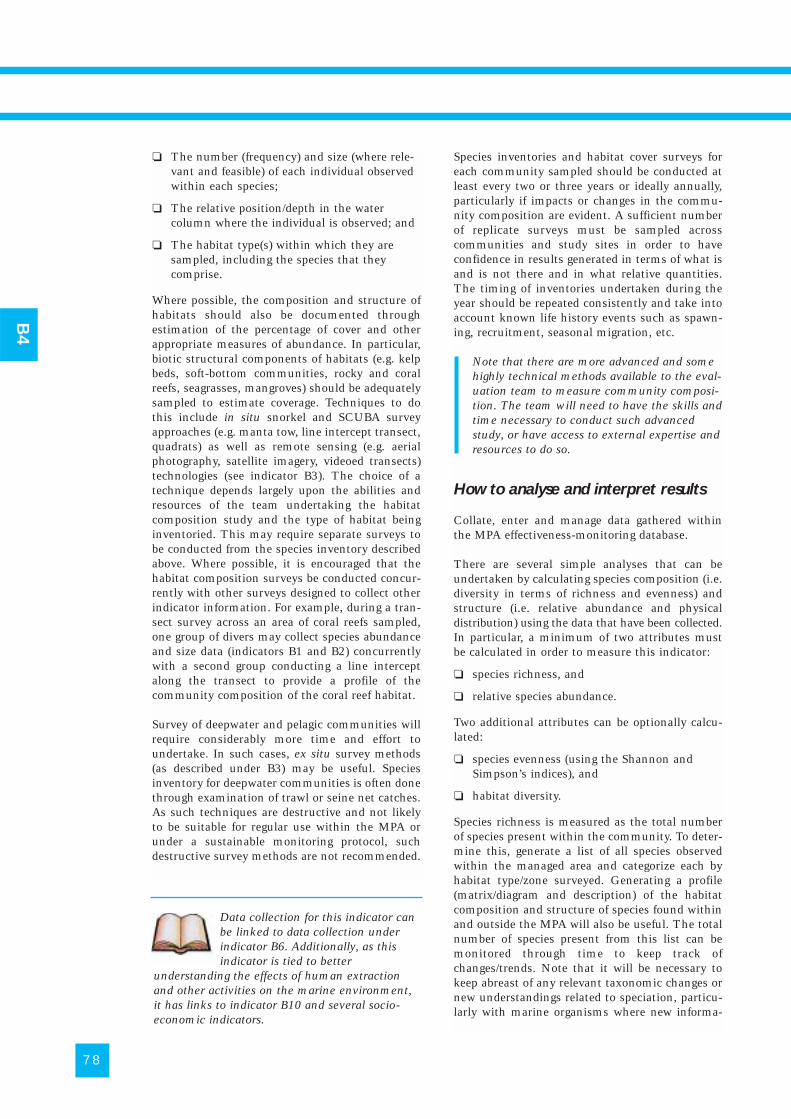
❏ The number (frequency) and size (where rele-vant and feasible) of each individual observedwithin each species;
❏ The relative position/depth in the watercolumn where the individual is observed; and
❏ The habitat type(s) within which they aresampled, including the species that theycomprise.
Where possible, the composition and structure ofhabitats should also be documented throughestimation of the percentage of cover and otherappropriate measures of abundance. In particular,biotic structural components of habitats (e.g. kelpbeds, soft-bottom communities, rocky and coralreefs, seagrasses, mangroves) should be adequatelysampled to estimate coverage. Techniques to dothis include in situ snorkel and SCUBA surveyapproaches (e.g. manta tow, line intercept transect,quadrats) as well as remote sensing (e.g. aerialphotography, satellite imagery, videoed transects)technologies (see indicator B3). The choice of atechnique depends largely upon the abilities andresources of the team undertaking the habitatcomposition study and the type of habitat beinginventoried. This may require separate surveys tobe conducted from the species inventory describedabove. Where possible, it is encouraged that thehabitat composition surveys be conducted concur-rently with other surveys designed to collect otherindicator information. For example, during a tran-sect survey across an area of coral reefs sampled,one group of divers may collect species abundanceand size data (indicators B1 and B2) concurrentlywith a second group conducting a line interceptalong the transect to provide a profile of thecommunity composition of the coral reef habitat.
Survey of deepwater and pelagic communities willrequire considerably more time and effort toundertake. In such cases, ex situ survey methods(as described under B3) may be useful. Speciesinventory for deepwater communities is often donethrough examination of trawl or seine net catches.As such techniques are destructive and not likelyto be suitable for regular use within the MPA orunder a sustainable monitoring protocol, suchdestructive survey methods are not recommended.
Species inventories and habitat cover surveys foreach community sampled should be conducted atleast every two or three years or ideally annually,particularly if impacts or changes in the commu-nity composition are evident. A sufficient numberof replicate surveys must be sampled acrosscommunities and study sites in order to haveconfidence in results generated in terms of what isand is not there and in what relative quantities.The timing of inventories undertaken during theyear should be repeated consistently and take intoaccount known life history events such as spawn-ing, recruitment, seasonal migration, etc.
Note that there are more advanced and somehighly technical methods available to the eval-uation team to measure community composi-tion. The team will need to have the skills andtime necessary to conduct such advancedstudy, or have access to external expertise andresources to do so.
How to analyse and interpret results
Collate, enter and manage data gathered withinthe MPA effectiveness-monitoring database.
There are several simple analyses that can beundertaken by calculating species composition (i.e.diversity in terms of richness and evenness) andstructure (i.e. relative abundance and physicaldistribution) using the data that have been collected.In particular, a minimum of two attributes mustbe calculated in order to measure this indicator:
❏ species richness, and
❏ relative species abundance.
Two additional attributes can be optionally calcu-lated:
❏ species evenness (using the Shannon andSimpson’s indices), and
❏ habitat diversity.
Species richness is measured as the total numberof species present within the community. To deter-mine this, generate a list of all species observedwithin the managed area and categorize each byhabitat type/zone surveyed. Generating a profile(matrix/diagram and description) of the habitatcomposition and structure of species found withinand outside the MPA will also be useful. The totalnumber of species present from this list can bemonitored through time to keep track ofchanges/trends. Note that it will be necessary tokeep abreast of any relevant taxonomic changes ornew understandings related to speciation, particu-larly with marine organisms where new informa-
78
B4
Data collection for this indicator canbe linked to data collection underindicator B6. Additionally, as thisindicator is tied to better
understanding the effects of human extractionand other activities on the marine environment,it has links to indicator B10 and several socio-economic indicators.
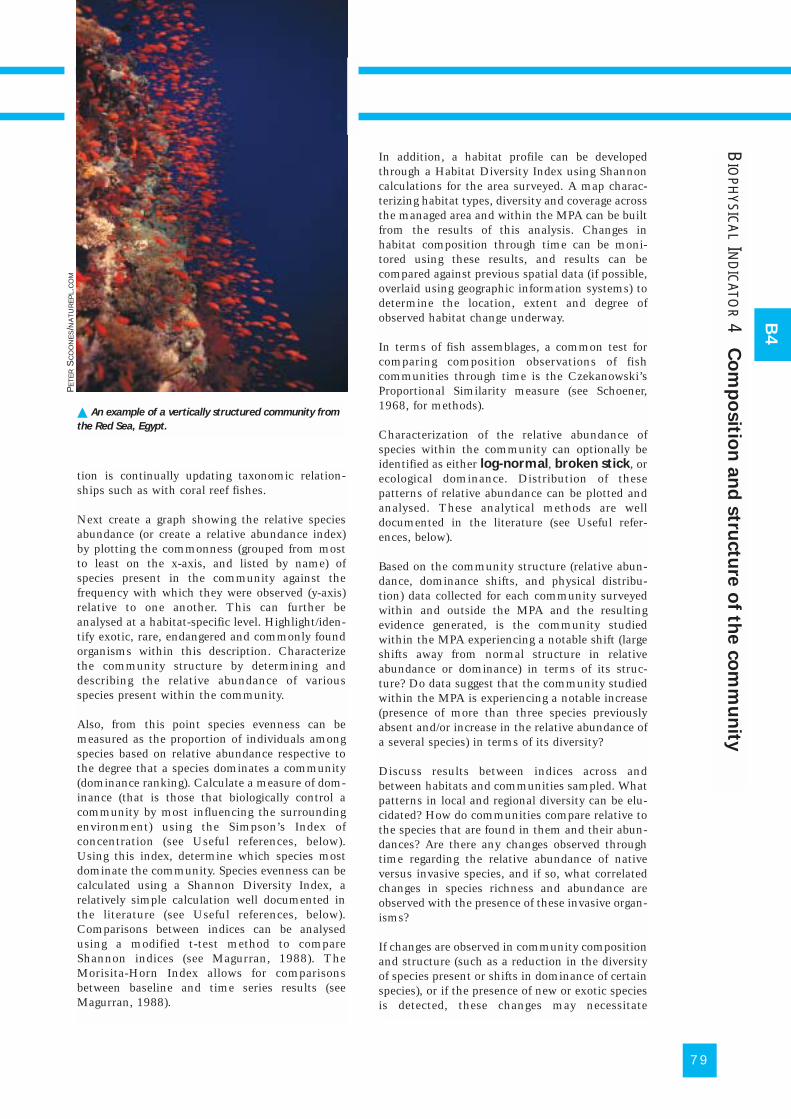
79
BIO
PHYSIC
AL
IND
ICATO
R4
Co
mp
ositio
n a
nd
stru
ctu
re o
f the c
om
mu
nity
B4
tion is continually updating taxonomic relation-ships such as with coral reef fishes.
Next create a graph showing the relative speciesabundance (or create a relative abundance index)by plotting the commonness (grouped from mostto least on the x-axis, and listed by name) ofspecies present in the community against thefrequency with which they were observed (y-axis)relative to one another. This can further beanalysed at a habitat-specific level. Highlight/iden-tify exotic, rare, endangered and commonly foundorganisms within this description. Characterizethe community structure by determining anddescribing the relative abundance of variousspecies present within the community.
Also, from this point species evenness can bemeasured as the proportion of individuals amongspecies based on relative abundance respective tothe degree that a species dominates a community(dominance ranking). Calculate a measure of dom-inance (that is those that biologically control acommunity by most influencing the surroundingenvironment) using the Simpson’s Index ofconcentration (see Useful references, below).Using this index, determine which species mostdominate the community. Species evenness can becalculated using a Shannon Diversity Index, arelatively simple calculation well documented inthe literature (see Useful references, below).Comparisons between indices can be analysedusing a modified t-test method to compareShannon indices (see Magurran, 1988). TheMorisita-Horn Index allows for comparisonsbetween baseline and time series results (seeMagurran, 1988).
In addition, a habitat profile can be developedthrough a Habitat Diversity Index using Shannoncalculations for the area surveyed. A map charac-terizing habitat types, diversity and coverage acrossthe managed area and within the MPA can be builtfrom the results of this analysis. Changes inhabitat composition through time can be moni-tored using these results, and results can becompared against previous spatial data (if possible,overlaid using geographic information systems) todetermine the location, extent and degree ofobserved habitat change underway.
In terms of fish assemblages, a common test forcomparing composition observations of fishcommunities through time is the Czekanowski’sProportional Similarity measure (see Schoener,1968, for methods).
Characterization of the relative abundance ofspecies within the community can optionally beidentified as either log-normal, broken stick, orecological dominance. Distribution of thesepatterns of relative abundance can be plotted andanalysed. These analytical methods are welldocumented in the literature (see Useful refer-ences, below).
Based on the community structure (relative abun-dance, dominance shifts, and physical distribu-tion) data collected for each community surveyedwithin and outside the MPA and the resultingevidence generated, is the community studiedwithin the MPA experiencing a notable shift (largeshifts away from normal structure in relativeabundance or dominance) in terms of its struc-ture? Do data suggest that the community studiedwithin the MPA is experiencing a notable increase(presence of more than three species previouslyabsent and/or increase in the relative abundance ofa several species) in terms of its diversity?
Discuss results between indices across andbetween habitats and communities sampled. Whatpatterns in local and regional diversity can be elu-cidated? How do communities compare relative tothe species that are found in them and their abun-dances? Are there any changes observed throughtime regarding the relative abundance of nativeversus invasive species, and if so, what correlatedchanges in species richness and abundance areobserved with the presence of these invasive organ-isms?
If changes are observed in community compositionand structure (such as a reduction in the diversityof species present or shifts in dominance of certainspecies), or if the presence of new or exotic speciesis detected, these changes may necessitate
� An example of a vertically structured community from
the Red Sea, Egypt.
PE
TE
RS
CO
ON
ES/N
AT
UR
EP
L.C
OM
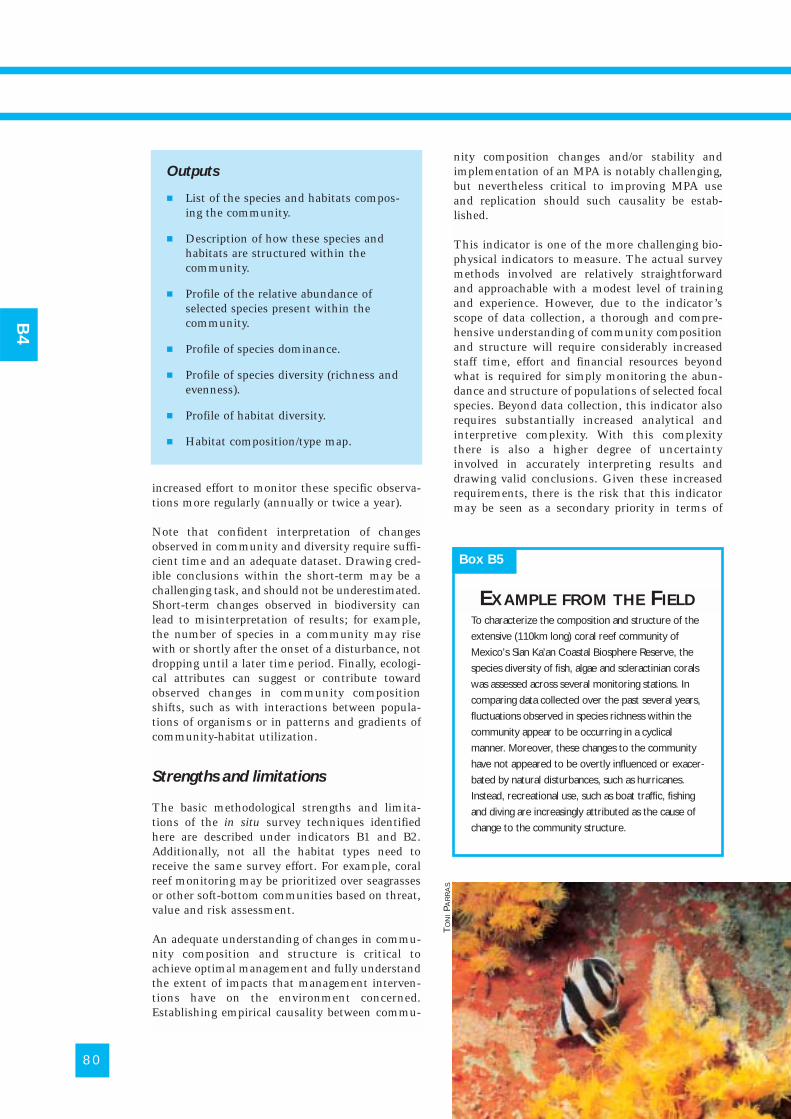
increased effort to monitor these specific observa-tions more regularly (annually or twice a year).
Note that confident interpretation of changesobserved in community and diversity require suffi-cient time and an adequate dataset. Drawing cred-ible conclusions within the short-term may be achallenging task, and should not be underestimated.Short-term changes observed in biodiversity canlead to misinterpretation of results; for example,the number of species in a community may risewith or shortly after the onset of a disturbance, notdropping until a later time period. Finally, ecologi-cal attributes can suggest or contribute towardobserved changes in community compositionshifts, such as with interactions between popula-tions of organisms or in patterns and gradients ofcommunity-habitat utilization.
Strengths and limitations
The basic methodological strengths and limita-tions of the in situ survey techniques identifiedhere are described under indicators B1 and B2.Additionally, not all the habitat types need toreceive the same survey effort. For example, coralreef monitoring may be prioritized over seagrassesor other soft-bottom communities based on threat,value and risk assessment.
An adequate understanding of changes in commu-nity composition and structure is critical toachieve optimal management and fully understandthe extent of impacts that management interven-tions have on the environment concerned.Establishing empirical causality between commu-
nity composition changes and/or stability andimplementation of an MPA is notably challenging,but nevertheless critical to improving MPA useand replication should such causality be estab-lished.
This indicator is one of the more challenging bio-physical indicators to measure. The actual surveymethods involved are relatively straightforwardand approachable with a modest level of trainingand experience. However, due to the indicator’sscope of data collection, a thorough and compre-hensive understanding of community compositionand structure will require considerably increasedstaff time, effort and financial resources beyondwhat is required for simply monitoring the abun-dance and structure of populations of selected focalspecies. Beyond data collection, this indicator alsorequires substantially increased analytical andinterpretive complexity. With this complexitythere is also a higher degree of uncertaintyinvolved in accurately interpreting results anddrawing valid conclusions. Given these increasedrequirements, there is the risk that this indicatormay be seen as a secondary priority in terms of
80
B4
Outputs
� List of the species and habitats compos-ing the community.
� Description of how these species andhabitats are structured within thecommunity.
� Profile of the relative abundance ofselected species present within thecommunity.
� Profile of species dominance.
� Profile of species diversity (richness andevenness).
� Profile of habitat diversity.
� Habitat composition/type map.
To characterize the composition and structure of the
extensive (110km long) coral reef community of
Mexico’s Sian Ka’an Coastal Biosphere Reserve, the
species diversity of fish, algae and scleractinian corals
was assessed across several monitoring stations. In
comparing data collected over the past several years,
fluctuations observed in species richness within the
community appear to be occurring in a cyclical
manner. Moreover, these changes to the community
have not appeared to be overtly influenced or exacer-
bated by natural disturbances, such as hurricanes.
Instead, recreational use, such as boat traffic, fishing
and diving are increasingly attributed as the cause of
change to the community structure.
Box B5
EXAMPLE FROM THE FIELD
TO
NIPA
RR
AS
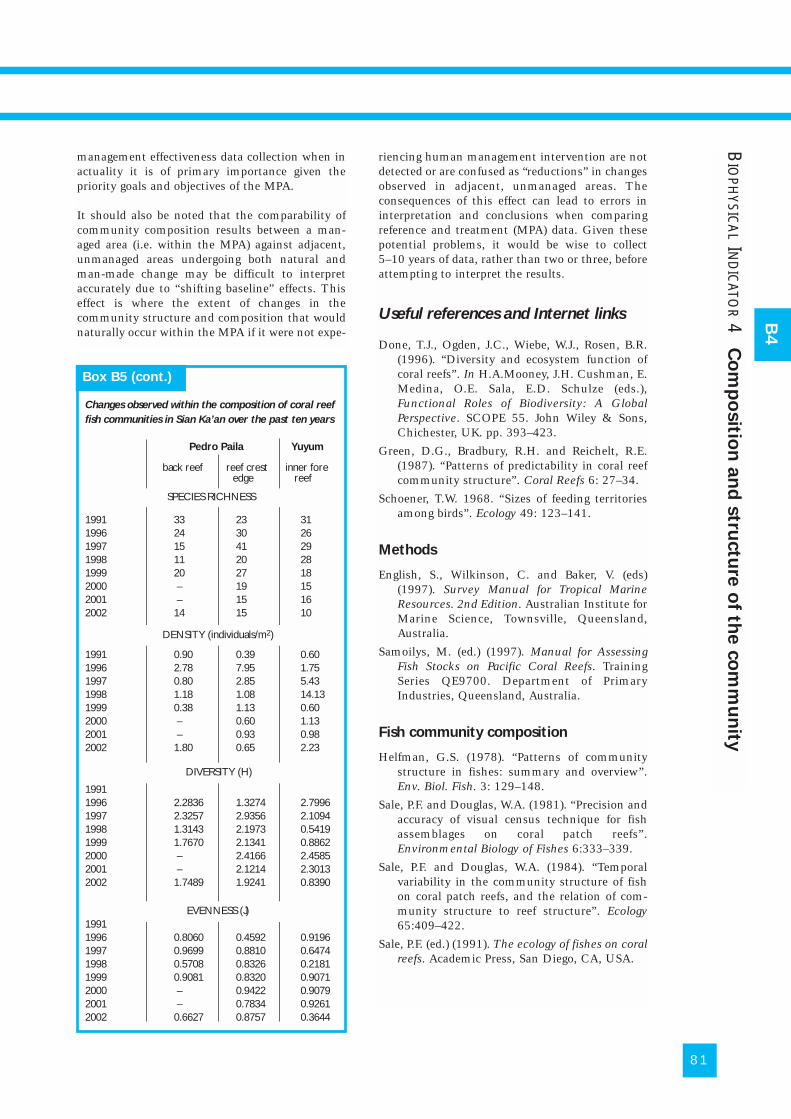
81
BIO
PHYSIC
AL
IND
ICATO
R4
Co
mp
ositio
n a
nd
stru
ctu
re o
f the c
om
mu
nity
B4
management effectiveness data collection when inactuality it is of primary importance given thepriority goals and objectives of the MPA.
It should also be noted that the comparability ofcommunity composition results between a man-aged area (i.e. within the MPA) against adjacent,unmanaged areas undergoing both natural andman-made change may be difficult to interpretaccurately due to “shifting baseline” effects. Thiseffect is where the extent of changes in thecommunity structure and composition that wouldnaturally occur within the MPA if it were not expe-
riencing human management intervention are notdetected or are confused as “reductions” in changesobserved in adjacent, unmanaged areas. Theconsequences of this effect can lead to errors ininterpretation and conclusions when comparingreference and treatment (MPA) data. Given thesepotential problems, it would be wise to collect5–10 years of data, rather than two or three, beforeattempting to interpret the results.
Useful references and Internet links
Done, T.J., Ogden, J.C., Wiebe, W.J., Rosen, B.R.(1996). “Diversity and ecosystem function ofcoral reefs”. In H.A.Mooney, J.H. Cushman, E.Medina, O.E. Sala, E.D. Schulze (eds.),Functional Roles of Biodiversity: A GlobalPerspective. SCOPE 55. John Wiley & Sons,Chichester, UK. pp. 393–423.
Green, D.G., Bradbury, R.H. and Reichelt, R.E.(1987). “Patterns of predictability in coral reefcommunity structure”. Coral Reefs 6: 27–34.
Schoener, T.W. 1968. “Sizes of feeding territoriesamong birds”. Ecology 49: 123–141.
Methods
English, S., Wilkinson, C. and Baker, V. (eds)(1997). Survey Manual for Tropical MarineResources. 2nd Edition. Australian Institute forMarine Science, Townsville, Queensland,Australia.
Samoilys, M. (ed.) (1997). Manual for AssessingFish Stocks on Pacific Coral Reefs. TrainingSeries QE9700. Department of PrimaryIndustries, Queensland, Australia.
Fish community composition
Helfman, G.S. (1978). “Patterns of communitystructure in fishes: summary and overview”.Env. Biol. Fish. 3: 129–148.
Sale, P.F. and Douglas, W.A. (1981). “Precision andaccuracy of visual census technique for fishassemblages on coral patch reefs”.Environmental Biology of Fishes 6:333–339.
Sale, P.F. and Douglas, W.A. (1984). “Temporalvariability in the community structure of fishon coral patch reefs, and the relation of com-munity structure to reef structure”. Ecology65:409–422.
Sale, P.F. (ed.) (1991). The ecology of fishes on coralreefs. Academic Press, San Diego, CA, USA.
Changes observed within the composition of coral reef
fish communities in Sian Ka’an over the past ten years
Pedro Paila Yuyum
back reef reef crest inner foreedge reef
SPECIES RICHNESS
1991 33 23 311996 24 30 261997 15 41 291998 11 20 281999 20 27 182000 – 19 152001 – 15 162002 14 15 10
DENSITY (individuals/m2)
1991 0.90 0.39 0.601996 2.78 7.95 1.751997 0.80 2.85 5.431998 1.18 1.08 14.131999 0.38 1.13 0.602000 – 0.60 1.132001 – 0.93 0.982002 1.80 0.65 2.23
DIVERSITY (H)
19911996 2.2836 1.3274 2.79961997 2.3257 2.9356 2.10941998 1.3143 2.1973 0.54191999 1.7670 2.1341 0.88622000 – 2.4166 2.45852001 – 2.1214 2.30132002 1.7489 1.9241 0.8390
EVENESS (J)
19911996 0.8060 0.4592 0.91961997 0.9699 0.8810 0.64741998 0.5708 0.8326 0.21811999 0.9081 0.8320 0.90712000 – 0.9422 0.90792001 – 0.7834 0.92612002 0.6627 0.8757 0.3644
SPECIES RICHNESS
DENSITY (individuals/m2)
DIVERSITY (H)
EVENNESS (J)
Box B5 (cont.)
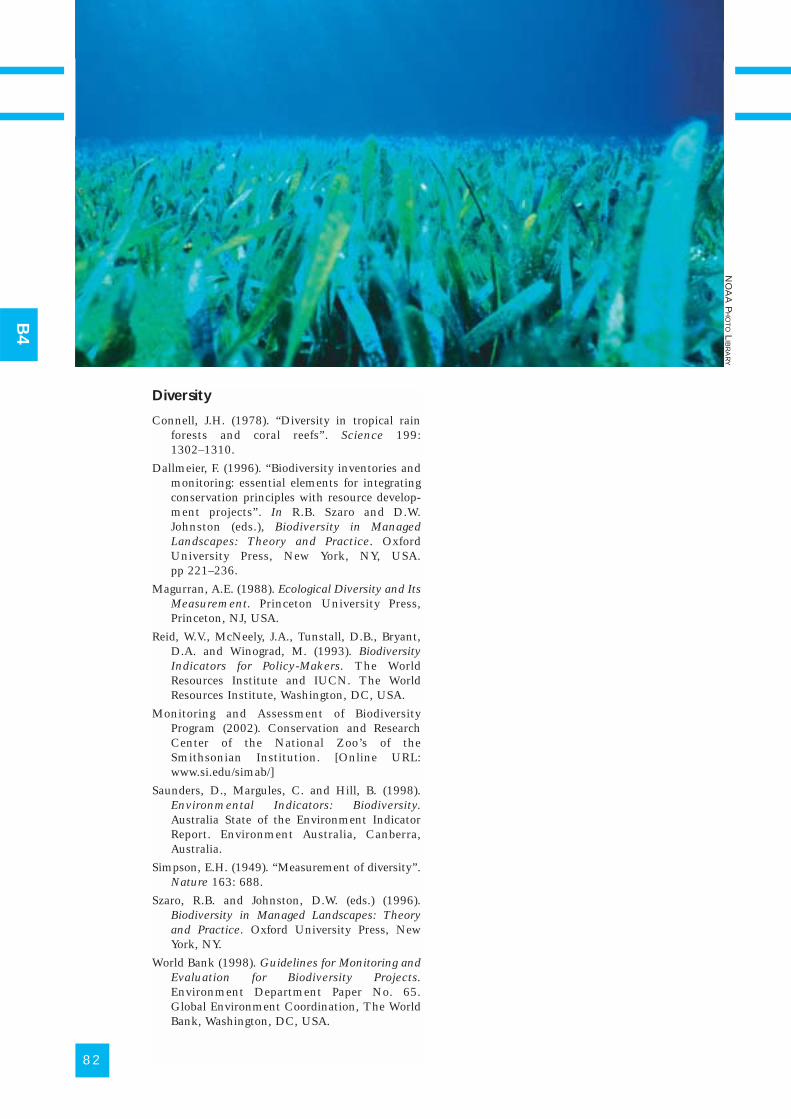
82
B4
Diversity
Connell, J.H. (1978). “Diversity in tropical rainforests and coral reefs”. Science 199:1302–1310.
Dallmeier, F. (1996). “Biodiversity inventories andmonitoring: essential elements for integratingconservation principles with resource develop-ment projects”. In R.B. Szaro and D.W.Johnston (eds.), Biodiversity in ManagedLandscapes: Theory and Practice. OxfordUniversity Press, New York, NY, USA.pp 221–236.
Magurran, A.E. (1988). Ecological Diversity and ItsMeasurement. Princeton University Press,Princeton, NJ, USA.
Reid, W.V., McNeely, J.A., Tunstall, D.B., Bryant,D.A. and Winograd, M. (1993). BiodiversityIndicators for Policy-Makers. The WorldResources Institute and IUCN. The WorldResources Institute, Washington, DC, USA.
Monitoring and Assessment of BiodiversityProgram (2002). Conservation and ResearchCenter of the National Zoo’s of theSmithsonian Institution. [Online URL:www.si.edu/simab/]
Saunders, D., Margules, C. and Hill, B. (1998).Environmental Indicators: Biodiversity.Australia State of the Environment IndicatorReport. Environment Australia, Canberra,Australia.
Simpson, E.H. (1949). “Measurement of diversity”.Nature 163: 688.
Szaro, R.B. and Johnston, D.W. (eds.) (1996).Biodiversity in Managed Landscapes: Theoryand Practice. Oxford University Press, NewYork, NY.
World Bank (1998). Guidelines for Monitoring andEvaluation for Biodiversity Projects.Environment Department Paper No. 65.Global Environment Coordination, The WorldBank, Washington, DC, USA.
NO
AA
PH
OT
OL
IBR
AR
Y
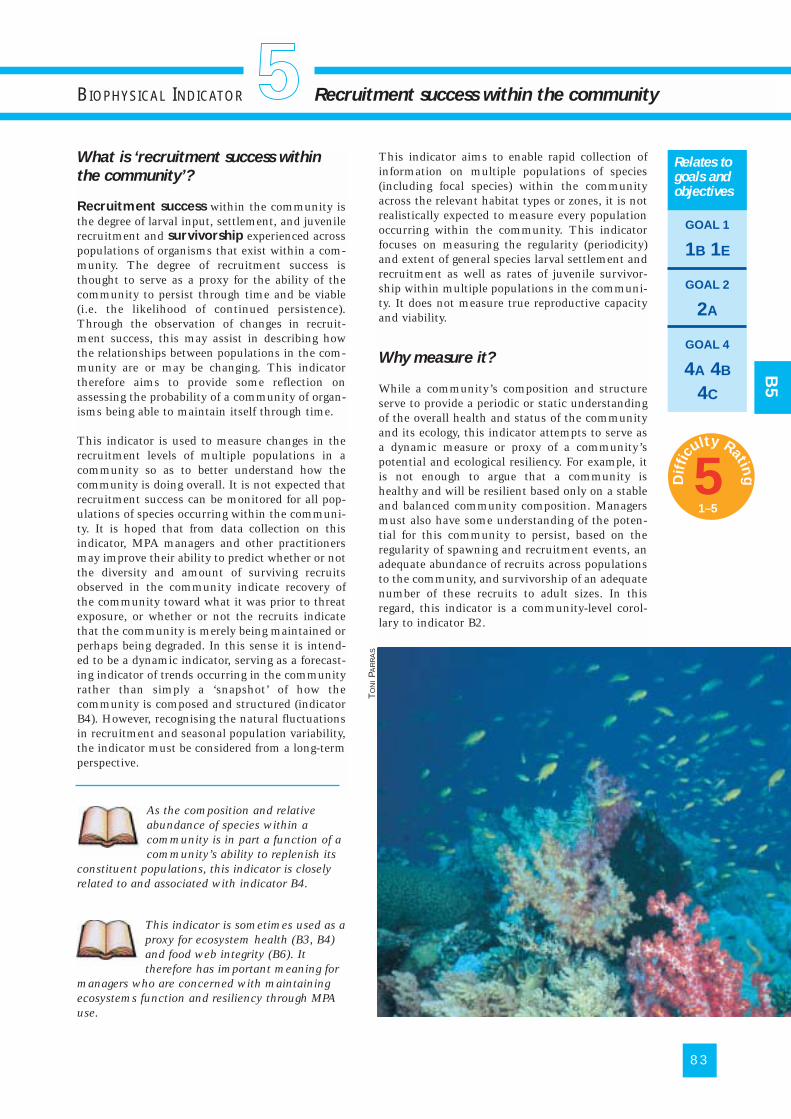
What is ‘recruitment success within
the community’?
Recruitment success within the community isthe degree of larval input, settlement, and juvenilerecruitment and survivorship experienced acrosspopulations of organisms that exist within a com-munity. The degree of recruitment success isthought to serve as a proxy for the ability of thecommunity to persist through time and be viable(i.e. the likelihood of continued persistence).Through the observation of changes in recruit-ment success, this may assist in describing howthe relationships between populations in the com-munity are or may be changing. This indicatortherefore aims to provide some reflection onassessing the probability of a community of organ-isms being able to maintain itself through time.
This indicator is used to measure changes in therecruitment levels of multiple populations in acommunity so as to better understand how thecommunity is doing overall. It is not expected thatrecruitment success can be monitored for all pop-ulations of species occurring within the communi-ty. It is hoped that from data collection on thisindicator, MPA managers and other practitionersmay improve their ability to predict whether or notthe diversity and amount of surviving recruitsobserved in the community indicate recovery ofthe community toward what it was prior to threatexposure, or whether or not the recruits indicatethat the community is merely being maintained orperhaps being degraded. In this sense it is intend-ed to be a dynamic indicator, serving as a forecast-ing indicator of trends occurring in the communityrather than simply a ‘snapshot’ of how thecommunity is composed and structured (indicatorB4). However, recognising the natural fluctuationsin recruitment and seasonal population variability,the indicator must be considered from a long-termperspective.
This indicator aims to enable rapid collection ofinformation on multiple populations of species(including focal species) within the communityacross the relevant habitat types or zones, it is notrealistically expected to measure every populationoccurring within the community. This indicatorfocuses on measuring the regularity (periodicity)and extent of general species larval settlement andrecruitment as well as rates of juvenile survivor-ship within multiple populations in the communi-ty. It does not measure true reproductive capacityand viability.
Why measure it?
While a community’s composition and structureserve to provide a periodic or static understandingof the overall health and status of the communityand its ecology, this indicator attempts to serve asa dynamic measure or proxy of a community’spotential and ecological resiliency. For example, itis not enough to argue that a community ishealthy and will be resilient based only on a stableand balanced community composition. Managersmust also have some understanding of the poten-tial for this community to persist, based on theregularity of spawning and recruitment events, anadequate abundance of recruits across populationsto the community, and survivorship of an adequatenumber of these recruits to adult sizes. In thisregard, this indicator is a community-level corol-lary to indicator B2.
83
BIOPHYSICAL INDICATOR Recruitment success within the community
GOAL 1
1B 1E
GOAL 2
2A
GOAL 4
4A 4B
4C
Relates togoals andobjectives
B5
As the composition and relativeabundance of species within acommunity is in part a function of acommunity’s ability to replenish its
constituent populations, this indicator is closelyrelated to and associated with indicator B4.
This indicator is sometimes used as aproxy for ecosystem health (B3, B4)and food web integrity (B6). Ittherefore has important meaning for
managers who are concerned with maintainingecosystems function and resiliency through MPAuse.
1
TO
NIP A
RR
AS
5Dif
ficu
lty Rating
1–5
How to collect the data
This is one of the most complex and advancedmanagement effectiveness indicators offeredin this guidebook. In addition, there is muchdebate over the use and reliability of recruit-ment data to interpret ecological health due tothe high spatial and temporal variabilityassociated with recruitment. As such,measurement of this indicator should only beconducted by highly qualified individuals andwithin unique biological communities thathost numerous focal species, represent rare or
threatened communities, and/or face an acutelevel of human stressors.
While highly challenging and somewhat controver-sial to attempt, recruitment success can be exam-ined through the following parameters: a) the pres-ence and relative abundance of relevant size class-es (recruits/juveniles and reproductive adults) ofpopulations within the community, b) the breedingor spawning potential and event regularity, and c)the settlement and recruitment potential andevent regularity. Due to the fact that recruitmentsuccess is also a function of larval input anddispersal, this attribute may also need to be takeninto account for a full understanding of recruit-ment potential.
Should it be decided to attempt this indicator, therecommended minimum data collection is thecapture of size class information of focal specieswithin the community surveyed, with a particularfocus on juveniles and recruits. The survey meth-ods used to sample species (relative abundance andsize classes) across the community are the same asthose described for in situ survey under indicatorB2. The collection of age structure data across allspecies within the community is not mandatoryunder this indicator, although such informationcould be collected concurrently under indicator B2.
Ideally, the size class and age structure of manyspecies within the community should be studied.Sampling the community is previously discussedunder B4. The relative abundance and sizes of allspecies’ individuals (juveniles) captured in therecruitment survey should be recorded. Assumingsome basic reproductive biology is known formembers within the community, size class struc-ture results may also serve to calculate the abun-dance of juvenile versus adult individuals acrossspecies within the community and begin to build aprofile through time of survivorship rates ofrecruits and juveniles to adult stages.
Monitoring the regularity and extent of knownspawning and recruitment events should also beconducted under this indicator. Visits to knownspawning locations and estimation surveys ofspawning biomass should be attempted for focalspecies within the community. In addition, valida-tion of the occurrence of these events should bedemonstrated through:
84
B5
Requirements
� Same requirements and equipment aslisted under indicators B2 and B4.
� The necessary equipment to conductnon-specific collection of juveniles andrecruits, including trawls, seines and gillnets.
� A list of all of the species within thecommunity needing to be studied (fromB4).
� Knowledge of the larval settlementstages for the species concerned.
� Knowledge of how to visually identifylarval stages and juveniles for the speciesconcerned.
� Knowledge of the reproductive biologyand recruitment process for the speciesconcerned.
� Knowledge of larval settlement patternswithin the community.
� Knowledge of known recruitment areaslocated within the community.
� Knowledge of larval settlement stagesand recruitment areas for juvenilerepresentatives of the community.
� Knowledge of the breeding event seasons(timing) and spawning locations.
� An understanding of basic oceanographicpatterns and processes as they relate tophysical effects on larval import andexport distribution and patterns.
� Dyes or simple drogues (for monitoringoceanographic patterns).
The data collection of sizeinformation on observed focalspecies recruits and juveniles underthis indicator can be collectedconcurrently with indicator B2.
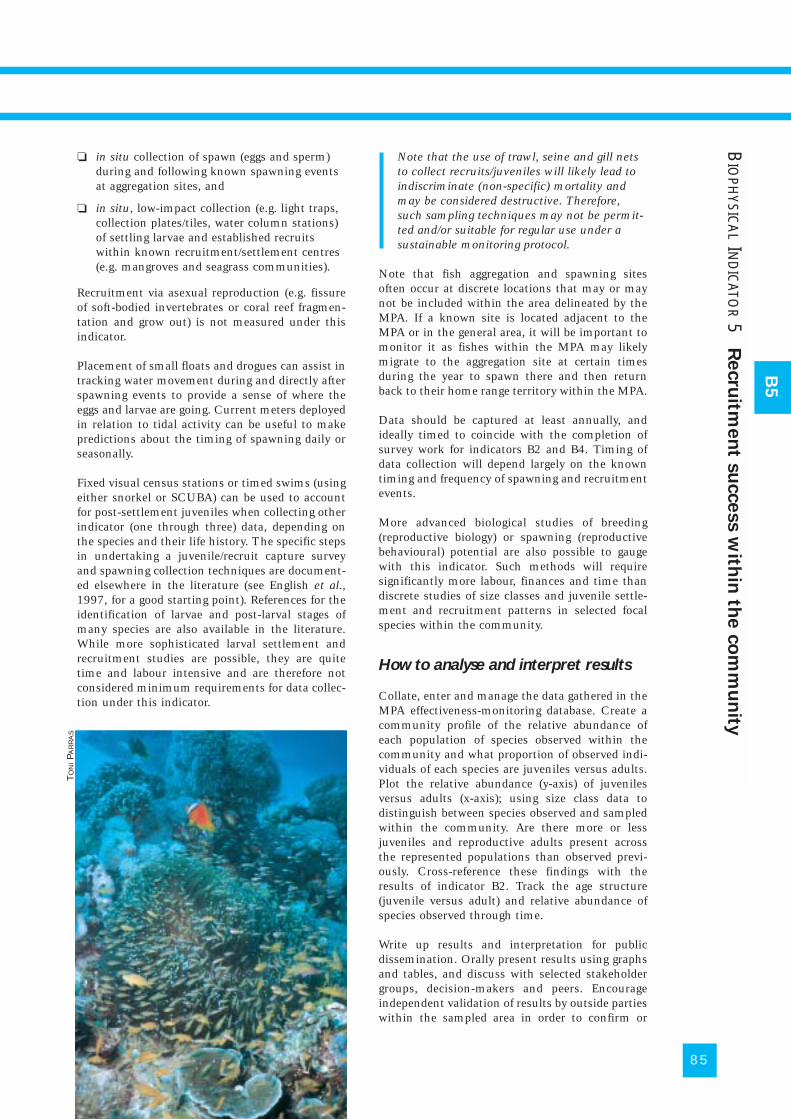
❏ in situ collection of spawn (eggs and sperm)during and following known spawning eventsat aggregation sites, and
❏ in situ, low-impact collection (e.g. light traps,collection plates/tiles, water column stations)of settling larvae and established recruitswithin known recruitment/settlement centres(e.g. mangroves and seagrass communities).
Recruitment via asexual reproduction (e.g. fissureof soft-bodied invertebrates or coral reef fragmen-tation and grow out) is not measured under thisindicator.
Placement of small floats and drogues can assist intracking water movement during and directly afterspawning events to provide a sense of where theeggs and larvae are going. Current meters deployedin relation to tidal activity can be useful to makepredictions about the timing of spawning daily orseasonally.
Fixed visual census stations or timed swims (usingeither snorkel or SCUBA) can be used to accountfor post-settlement juveniles when collecting otherindicator (one through three) data, depending onthe species and their life history. The specific stepsin undertaking a juvenile/recruit capture surveyand spawning collection techniques are document-ed elsewhere in the literature (see English et al.,1997, for a good starting point). References for theidentification of larvae and post-larval stages ofmany species are also available in the literature.While more sophisticated larval settlement andrecruitment studies are possible, they are quitetime and labour intensive and are therefore notconsidered minimum requirements for data collec-tion under this indicator.
Note that the use of trawl, seine and gill netsto collect recruits/juveniles will likely lead toindiscriminate (non-specific) mortality andmay be considered destructive. Therefore,such sampling techniques may not be permit-ted and/or suitable for regular use under asustainable monitoring protocol.
Note that fish aggregation and spawning sitesoften occur at discrete locations that may or maynot be included within the area delineated by theMPA. If a known site is located adjacent to theMPA or in the general area, it will be important tomonitor it as fishes within the MPA may likelymigrate to the aggregation site at certain timesduring the year to spawn there and then returnback to their home range territory within the MPA.
Data should be captured at least annually, andideally timed to coincide with the completion ofsurvey work for indicators B2 and B4. Timing ofdata collection will depend largely on the knowntiming and frequency of spawning and recruitmentevents.
More advanced biological studies of breeding(reproductive biology) or spawning (reproductivebehavioural) potential are also possible to gaugewith this indicator. Such methods will requiresignificantly more labour, finances and time thandiscrete studies of size classes and juvenile settle-ment and recruitment patterns in selected focalspecies within the community.
How to analyse and interpret results
Collate, enter and manage the data gathered in theMPA effectiveness-monitoring database. Create acommunity profile of the relative abundance ofeach population of species observed within thecommunity and what proportion of observed indi-viduals of each species are juveniles versus adults.Plot the relative abundance (y-axis) of juvenilesversus adults (x-axis); using size class data todistinguish between species observed and sampledwithin the community. Are there more or lessjuveniles and reproductive adults present acrossthe represented populations than observed previ-ously. Cross-reference these findings with theresults of indicator B2. Track the age structure(juvenile versus adult) and relative abundance ofspecies observed through time.
Write up results and interpretation for publicdissemination. Orally present results using graphsand tables, and discuss with selected stakeholdergroups, decision-makers and peers. Encourageindependent validation of results by outside partieswithin the sampled area in order to confirm or
85
B5
BIO
PHYSIC
AL
IND
ICATO
R5
Recru
itmen
t su
ccess w
ithin
the c
om
mu
nity
TO
NIPA
RR
AS
reject findings and improve the understanding ofthe effects of management action on the area. Besure to include any stories or anecdotes that illus-trate the results observed from stakeholders.
Generally speaking and holding all things equal,an adequate and stable number of surviving juve-niles and reproductive adults across populationswithin the community will increase the communi-ty’s ability to be viable through time. At what levelare surviving recruits in populations studied with-in the MPA experiencing a decline (reductions inthe number of recruits across a majority of thepopulations studied) in the community? How havethe timing, frequency and output of observedspawning and recruitment events changed?
Describe qualitatively (low, unpredicted or high)and/or quantitatively (probability based on repro-ductive potential across species within community)
whether or not the community appears to be viableinto the future. If not, how can these resultsinform adaptive management decision-making toaddress these concerns?
Finally, present the relative abundance (number/density) results of recruits and juvenile sizesresulting from the recruitment survey and discusshow these figures compare to previous observa-tions.
Strengths and limitations
This is a complex indicator to measure. Collectionof size class and recruitment data across manyspecies within the community (difficulty rating 5)will require considerably more time, skill, equip-ment and financial resources to complete than thestudy of a selected group of focal species within thecommunity (difficulty rating 4). In either case, anappropriately skilled team of evaluators will benecessary. If a suitably qualified team of individu-als is not available from within the MPA manage-ment team, universities and research centres maybe the best positioned to assist in developing apartnership for data collection and training MPAstaff in survey techniques. Such specialists willneed to fully meet the stated knowledge, equip-ment and skill requirements.
Moreover, the value of ‘snapshot’ recruitmentstudies is highly contested, as the data generatedare known to be highly unreliable due to theirinability to take into perspective the notoriouseffects of temporal and spatial variability. Even ifthey are found to be reliable, results of juvenilerecruitment rates and spawning regularity may notbe sufficient to confidently provide for a completeor accurate interpretation of the reproductivepotential within a community of organisms. Manyyears of data collection will be required to drawconclusions about recruitment success with confi-dence.
Recruitment study techniques using nets, seinesand trawls can lead to indiscriminate mortalityand should therefore be avoided, minimized orconducted very carefully so as not to be highlydestructive.
All of this being said, this indicator is sometimesviewed as the closest suggestion of how managerscan encourage a more complete understanding ofthe dynamic nature of community ecology andreproductive potential.
86
B5
Outputs
� A community profile of the relativeabundance of recruits/juveniles to thecommunity following known larval set-tlement and juvenile recruitment events.
� A summary profile of the contribution ofimmature (juvenile) versus mature(reproductive adults) size classes to eachspecies observed within the community.
� A confirmation of the frequency ofknown spawning events and estimate ofspawning biomass.
� An estimate of the reproductive potentialand resiliency of the community in thenear future.
� A profile of the biomass of eggs, spermand larvae released during such events.
Optional outputs may include
� Age class structure (through otolithanalysis) across populations of speciespresent within the community.
� A profile of the reproductive potential(including spawning success andestimate of reproductive output) ofspecies present in the community.
� An improved understanding of the repro-ductive biology and spawning behaviourof species within the community.
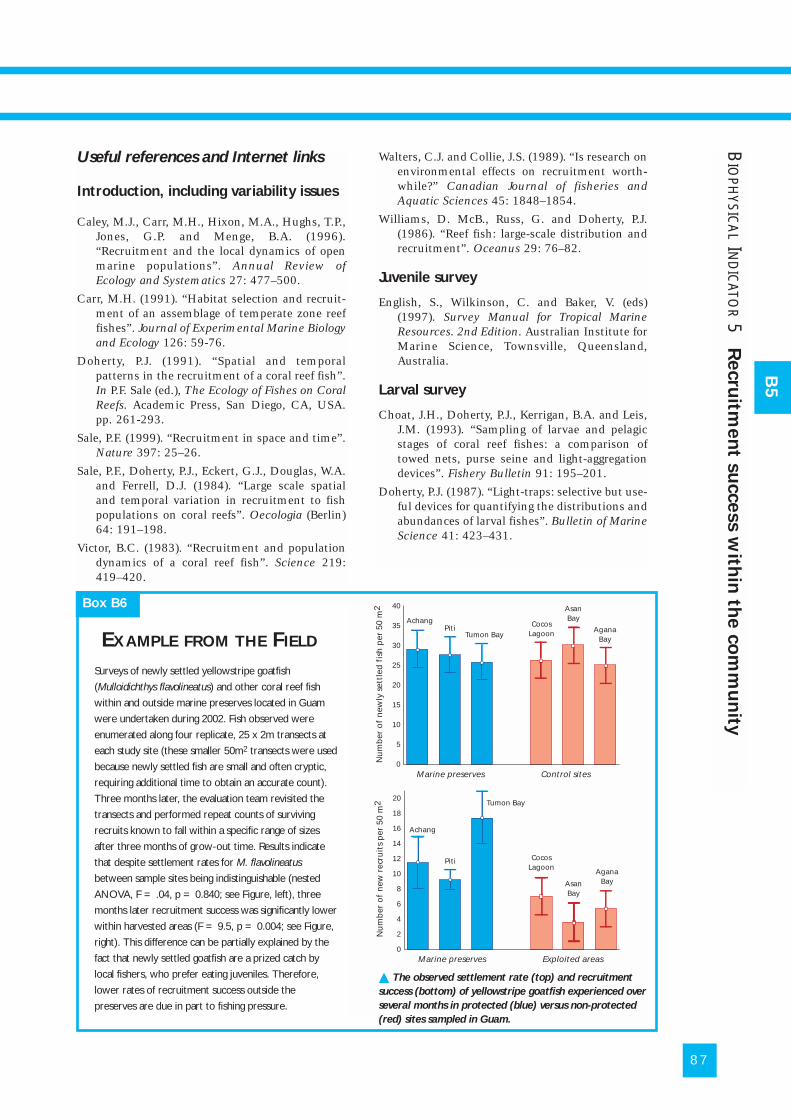
87
Useful references and Internet links
Introduction, including variability issues
Caley, M.J., Carr, M.H., Hixon, M.A., Hughs, T.P.,Jones, G.P. and Menge, B.A. (1996).“Recruitment and the local dynamics of openmarine populations”. Annual Review ofEcology and Systematics 27: 477–500.
Carr, M.H. (1991). “Habitat selection and recruit-ment of an assemblage of temperate zone reeffishes”. Journal of Experimental Marine Biologyand Ecology 126: 59-76.
Doherty, P.J. (1991). “Spatial and temporalpatterns in the recruitment of a coral reef fish”.In P.F. Sale (ed.), The Ecology of Fishes on CoralReefs. Academic Press, San Diego, CA, USA.pp. 261-293.
Sale, P.F. (1999). “Recruitment in space and time”.Nature 397: 25–26.
Sale, P.F., Doherty, P.J., Eckert, G.J., Douglas, W.A.and Ferrell, D.J. (1984). “Large scale spatialand temporal variation in recruitment to fishpopulations on coral reefs”. Oecologia (Berlin)64: 191–198.
Victor, B.C. (1983). “Recruitment and populationdynamics of a coral reef fish”. Science 219:419–420.
Surveys of newly settled yellowstripe goatfish
(Mulloidichthys flavolineatus) and other coral reef fish
within and outside marine preserves located in Guam
were undertaken during 2002. Fish observed were
enumerated along four replicate, 25 x 2m transects at
each study site (these smaller 50m2 transects were used
because newly settled fish are small and often cryptic,
requiring additional time to obtain an accurate count).
Three months later, the evaluation team revisited the
transects and performed repeat counts of surviving
recruits known to fall within a specific range of sizes
after three months of grow-out time. Results indicate
that despite settlement rates for M. flavolineatus
between sample sites being indistinguishable (nested
ANOVA, F = .04, p = 0.840; see Figure, left), three
months later recruitment success was significantly lower
within harvested areas (F = 9.5, p = 0.004; see Figure,
right). This difference can be partially explained by the
fact that newly settled goatfish are a prized catch by
local fishers, who prefer eating juveniles. Therefore,
lower rates of recruitment success outside the
preserves are due in part to fishing pressure.
Box B6
EXAMPLE FROM THE FIELD
BIO
PHYSIC
AL
IND
ICATO
R5
Recru
itmen
t su
ccess w
ithin
the c
om
mu
nity
B5
Walters, C.J. and Collie, J.S. (1989). “Is research onenvironmental effects on recruitment worth-while?” Canadian Journal of fisheries andAquatic Sciences 45: 1848–1854.
Williams, D. McB., Russ, G. and Doherty, P.J.(1986). “Reef fish: large-scale distribution andrecruitment”. Oceanus 29: 76–82.
Juvenile survey
English, S., Wilkinson, C. and Baker, V. (eds)(1997). Survey Manual for Tropical MarineResources. 2nd Edition. Australian Institute forMarine Science, Townsville, Queensland,Australia.
Larval survey
Choat, J.H., Doherty, P.J., Kerrigan, B.A. and Leis,J.M. (1993). “Sampling of larvae and pelagicstages of coral reef fishes: a comparison oftowed nets, purse seine and light-aggregationdevices”. Fishery Bulletin 91: 195–201.
Doherty, P.J. (1987). “Light-traps: selective but use-ful devices for quantifying the distributions andabundances of larval fishes”. Bulletin of MarineScience 41: 423–431.
40
35
30
25
20
15
10
5
0Marine preserves Control sites
AchangPiti
Tumon BayCocos
Lagoon
AsanBay
AganaBay
Nu
mb
er o
f n
ewly
set
tled
fis
h p
er 5
0 m
2
20
18
16
14
12
10
8
6
4
2
0Marine preserves Exploited areas
Achang
Piti
Tumon Bay
CocosLagoon
AsanBay
AganaBay
Nu
mb
er o
f n
ew r
ecru
its
per
50
m2
� The observed settlement rate (top) and recruitment
success (bottom) of yellowstripe goatfish experienced over
several months in protected (blue) versus non-protected
(red) sites sampled in Guam.
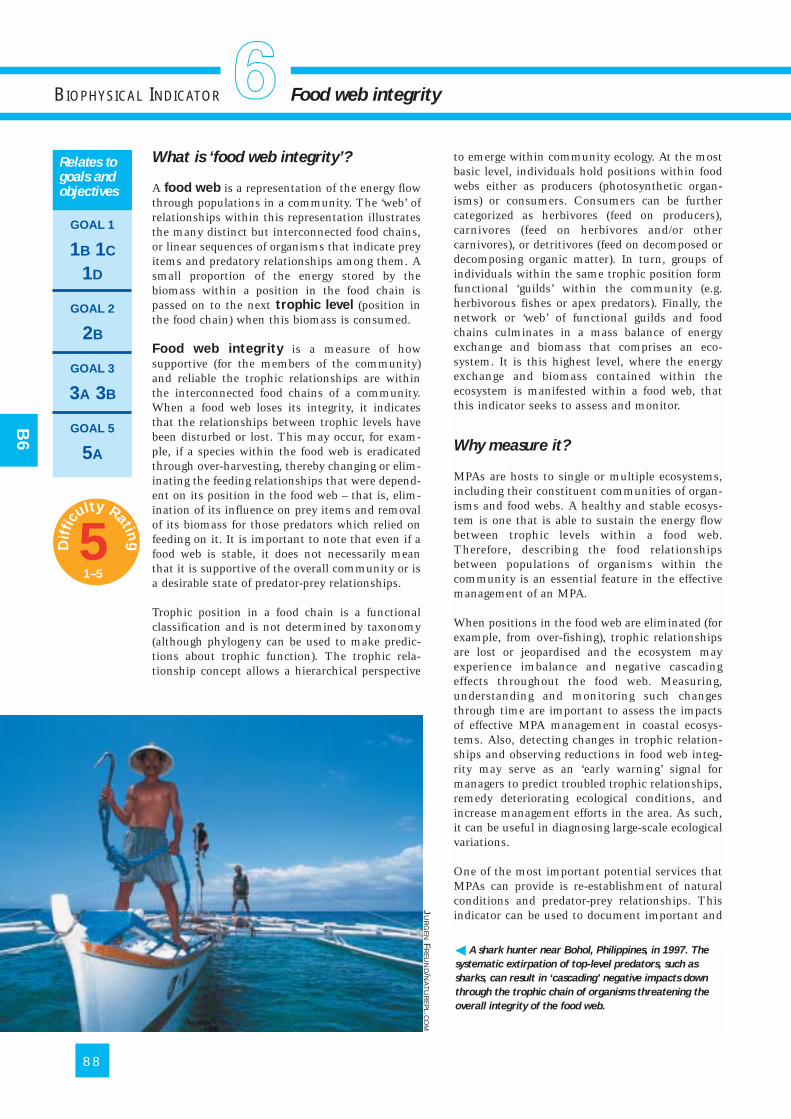
What is ‘food web integrity’?
A food web is a representation of the energy flowthrough populations in a community. The ‘web’ ofrelationships within this representation illustratesthe many distinct but interconnected food chains,or linear sequences of organisms that indicate preyitems and predatory relationships among them. Asmall proportion of the energy stored by thebiomass within a position in the food chain ispassed on to the next trophic level (position inthe food chain) when this biomass is consumed.
Food web integrity is a measure of howsupportive (for the members of the community)and reliable the trophic relationships are withinthe interconnected food chains of a community.When a food web loses its integrity, it indicatesthat the relationships between trophic levels havebeen disturbed or lost. This may occur, for exam-ple, if a species within the food web is eradicatedthrough over-harvesting, thereby changing or elim-inating the feeding relationships that were depend-ent on its position in the food web – that is, elim-ination of its influence on prey items and removalof its biomass for those predators which relied onfeeding on it. It is important to note that even if afood web is stable, it does not necessarily meanthat it is supportive of the overall community or isa desirable state of predator-prey relationships.
Trophic position in a food chain is a functionalclassification and is not determined by taxonomy(although phylogeny can be used to make predic-tions about trophic function). The trophic rela-tionship concept allows a hierarchical perspective
to emerge within community ecology. At the mostbasic level, individuals hold positions within foodwebs either as producers (photosynthetic organ-isms) or consumers. Consumers can be furthercategorized as herbivores (feed on producers),carnivores (feed on herbivores and/or othercarnivores), or detritivores (feed on decomposed ordecomposing organic matter). In turn, groups ofindividuals within the same trophic position formfunctional ‘guilds’ within the community (e.g.herbivorous fishes or apex predators). Finally, thenetwork or ‘web’ of functional guilds and foodchains culminates in a mass balance of energyexchange and biomass that comprises an eco-system. It is this highest level, where the energyexchange and biomass contained within theecosystem is manifested within a food web, thatthis indicator seeks to assess and monitor.
Why measure it?
MPAs are hosts to single or multiple ecosystems,including their constituent communities of organ-isms and food webs. A healthy and stable ecosys-tem is one that is able to sustain the energy flowbetween trophic levels within a food web.Therefore, describing the food relationshipsbetween populations of organisms within thecommunity is an essential feature in the effectivemanagement of an MPA.
When positions in the food web are eliminated (forexample, from over-fishing), trophic relationshipsare lost or jeopardised and the ecosystem mayexperience imbalance and negative cascadingeffects throughout the food web. Measuring,understanding and monitoring such changesthrough time are important to assess the impactsof effective MPA management in coastal ecosys-tems. Also, detecting changes in trophic relation-ships and observing reductions in food web integ-rity may serve as an ‘early warning’ signal formanagers to predict troubled trophic relationships,remedy deteriorating ecological conditions, andincrease management efforts in the area. As such,it can be useful in diagnosing large-scale ecologicalvariations.
One of the most important potential services thatMPAs can provide is re-establishment of naturalconditions and predator-prey relationships. Thisindicator can be used to document important and
88
BIOPHYSICAL INDICATOR Food web integrity
GOAL 1
1B 1C
1D
GOAL 2
2B
GOAL 3
3A 3B
GOAL 5
5A
Relates togoals andobjectives
B6
� A shark hunter near Bohol, Philippines, in 1997. The
systematic extirpation of top-level predators, such as
sharks, can result in ‘cascading’ negative impacts down
through the trophic chain of organisms threatening the
overall integrity of the food web.
1
JU
RG
EN
FR
EU
ND/N
AT
UR
EP
L.CO
M
5Dif
ficu
lty Rating
1–5
complementary evidence of progress towards theachievement of re-establishing such natural condi-tions, and can be a powerful tool for demonstrat-ing and characterizing how these natural feedingrelationships exist where (as is often the case) suchbaseline information is not available. Given thatwe understand only a few food webs in the marineenvironment, the potential for contributed knowl-edge is very important. This indicator thereforealso aims to collect evidence of restored orstrengthened food web relationships, and notmerely detect when food relationships are awry.
Detecting changes in food web relationshipsprovides managers with the opportunity to high-light such changes publicly, investigate theirsource, and determine whether or not they are theresult of activities occurring within or outside theMPA. In the case where changes are within thecontrol or political and legislative influence of theMPA manager, this detection may provide anopportunity to reconcile or address the causes ofchange. In some cases however, food web changesobserved within the MPA may be due to exogenous(outside) influences that are well beyond thecontrol of the MPA managers and/or unrelated tothe MPA goals and objectives. For example,increased predation on threatened focal sea otterpopulations in an MPA by orca may be identifiedas a result of over-fishing using purse seines of orcaprey fish populations hundreds of miles away fromthe MPA. In such instances, the awareness of thechanging feeding relationships due to outsidefactors may:
a) Provide managers with the necessary know-ledge and protection against unjustified criti-cism of MPA performance due to changesobserved within the MPA; and
b) Provide an opportunity to lobby for reconcilia-tion beyond the jurisdiction and goals of theMPA.
In this sense, such outside influences on food rela-tionships can help MPA managers illustrate howexternal, non-MPA related actions have directeffects on MPA management effectiveness. Thiscan help managers identify how to distribute (orre-distribute) human, financial and policyresources toward other external interventions inorder to improve the health of the area beingprotected. This being said, it is important to deter-mine the scale of the evidence collected under thisindicator so that it is used to address only ques-tions/issues relevant to the scale at which they arebeing asked/raised. Therefore, changes in food rela-tionships that are the result of higher scales ofecological change (e.g. global climate change) arebeyond the scope of the MPA or its ability to influ-ence such relationships and should be identified assuch.
Finally, in theory food webs possess characteristicsthat allow them to be considered excellent ecolog-ical descriptors (Winemiller, 1990). As a conse-quence, food web integrity is considered an impor-tant determinant of ecosystem health and func-tionality, both of which are difficult parameters toconcretely demonstrate. Illustrating a functionaland resilient food web therefore may serve as aproxy for a healthy ecosystem.
How to collect the data
Data collection to fully measure this indicator isnot a discrete or easily approachable task.However, as an approachable starting point (or at avery minimum) a descriptive data collectionprocess can be initiated. To do this, the teamshould conduct interviews and hold focus groupdiscussions with knowledgeable individuals (e.g.research scientists, fishers, MPA scientific staff) inorder to map out and characterize (functionally)the known roles and niches organisms occupywithin various trophic levels, including theirmultiple predator-prey relationships and how orwhy these may be changing through time. As partof this process, a focused examination can be madeinto a single ‘chain’ (discrete thread) of particularlyrelevant relationships within the overall food web,from single or specific bottom- through top-leveltrophic occupiers. This relevance may be as aresult of a biological attribute (such as the chainhosting relationships between multiple focalspecies or being of known ecological cornerstone
89
B6
Requirements
� Same requirements listed underindicator B1.
� Set of scales or balances (measurementsin grams).
� Knowledge of the species present withinthe community or ecosystem.
� An understanding of predator-preyrelationships between resident species.
� A calculator.
� Mathematical skills.
� Advanced: mathematical and ecologicalmodelling skills; access to an individualwho can consult with the evaluationteam and is familiar with the measure-ment and analysis techniques used;access to mathematical trophic model-ling software.
BIO
PHYSIC
AL
IND
ICATO
R6
Fo
od
web
inte
grity
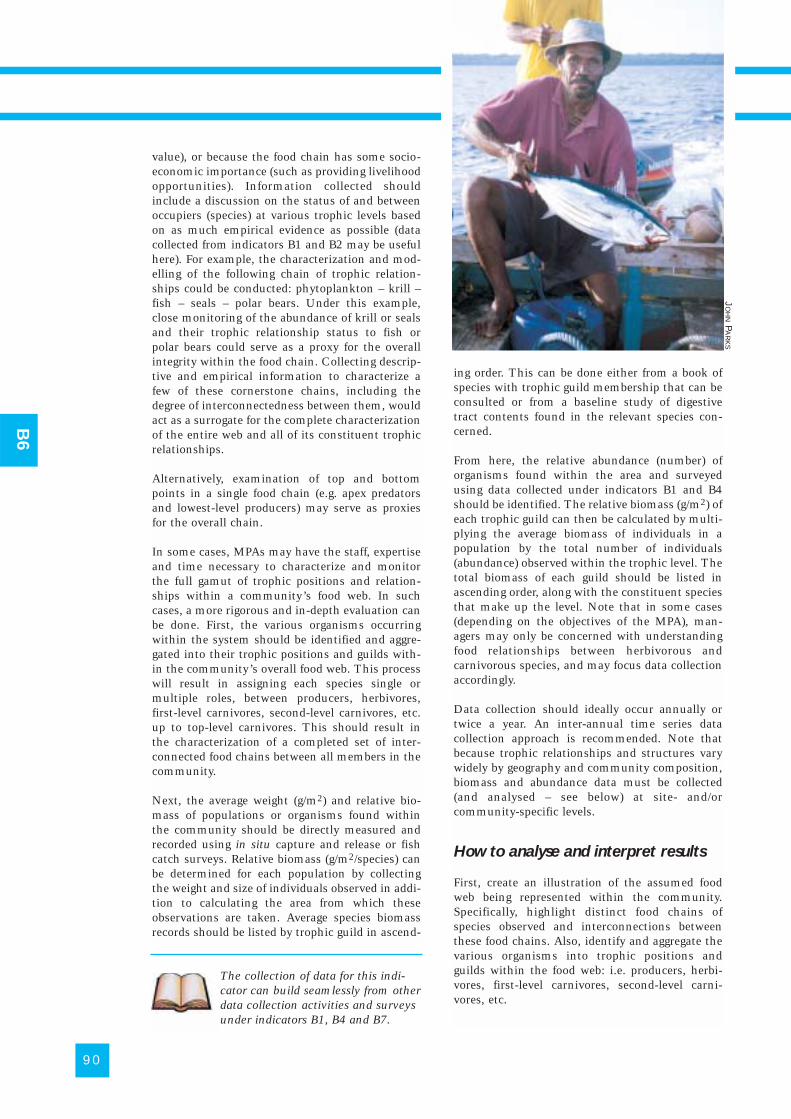
value), or because the food chain has some socio-economic importance (such as providing livelihoodopportunities). Information collected shouldinclude a discussion on the status of and betweenoccupiers (species) at various trophic levels basedon as much empirical evidence as possible (datacollected from indicators B1 and B2 may be usefulhere). For example, the characterization and mod-elling of the following chain of trophic relation-ships could be conducted: phytoplankton – krill –fish – seals – polar bears. Under this example,close monitoring of the abundance of krill or sealsand their trophic relationship status to fish orpolar bears could serve as a proxy for the overallintegrity within the food chain. Collecting descrip-tive and empirical information to characterize afew of these cornerstone chains, including thedegree of interconnectedness between them, wouldact as a surrogate for the complete characterizationof the entire web and all of its constituent trophicrelationships.
Alternatively, examination of top and bottompoints in a single food chain (e.g. apex predatorsand lowest-level producers) may serve as proxiesfor the overall chain.
In some cases, MPAs may have the staff, expertiseand time necessary to characterize and monitorthe full gamut of trophic positions and relation-ships within a community’s food web. In suchcases, a more rigorous and in-depth evaluation canbe done. First, the various organisms occurringwithin the system should be identified and aggre-gated into their trophic positions and guilds with-in the community’s overall food web. This processwill result in assigning each species single ormultiple roles, between producers, herbivores,first-level carnivores, second-level carnivores, etc.up to top-level carnivores. This should result inthe characterization of a completed set of inter-connected food chains between all members in thecommunity.
Next, the average weight (g/m2) and relative bio-mass of populations or organisms found withinthe community should be directly measured andrecorded using in situ capture and release or fishcatch surveys. Relative biomass (g/m2/species) canbe determined for each population by collectingthe weight and size of individuals observed in addi-tion to calculating the area from which theseobservations are taken. Average species biomassrecords should be listed by trophic guild in ascend-
ing order. This can be done either from a book ofspecies with trophic guild membership that can beconsulted or from a baseline study of digestivetract contents found in the relevant species con-cerned.
From here, the relative abundance (number) oforganisms found within the area and surveyedusing data collected under indicators B1 and B4should be identified. The relative biomass (g/m2) ofeach trophic guild can then be calculated by multi-plying the average biomass of individuals in apopulation by the total number of individuals(abundance) observed within the trophic level. Thetotal biomass of each guild should be listed inascending order, along with the constituent speciesthat make up the level. Note that in some cases(depending on the objectives of the MPA), man-agers may only be concerned with understandingfood relationships between herbivorous andcarnivorous species, and may focus data collectionaccordingly.
Data collection should ideally occur annually ortwice a year. An inter-annual time series datacollection approach is recommended. Note thatbecause trophic relationships and structures varywidely by geography and community composition,biomass and abundance data must be collected(and analysed – see below) at site- and/orcommunity-specific levels.
How to analyse and interpret results
First, create an illustration of the assumed foodweb being represented within the community.Specifically, highlight distinct food chains ofspecies observed and interconnections betweenthese food chains. Also, identify and aggregate thevarious organisms into trophic positions andguilds within the food web: i.e. producers, herbi-vores, first-level carnivores, second-level carni-vores, etc.
90
B6
The collection of data for this indi-cator can build seamlessly from otherdata collection activities and surveysunder indicators B1, B4 and B7.
JO
HN
PA
RK
S
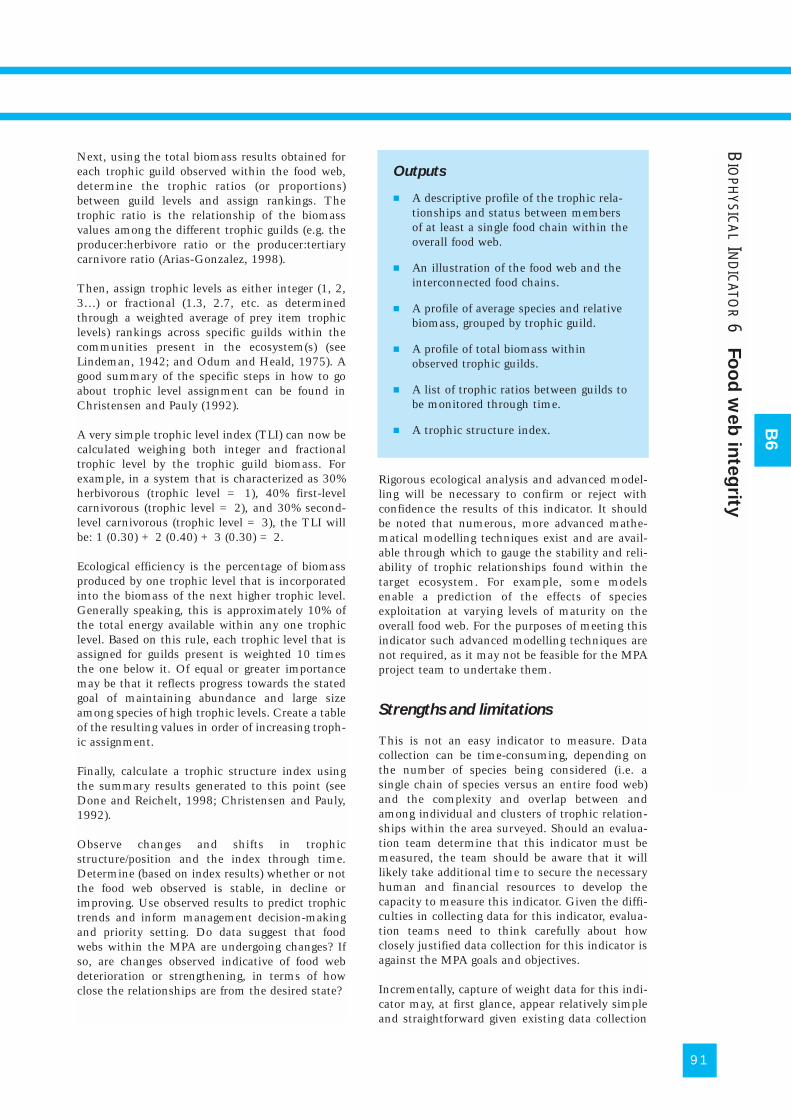
Next, using the total biomass results obtained foreach trophic guild observed within the food web,determine the trophic ratios (or proportions)between guild levels and assign rankings. Thetrophic ratio is the relationship of the biomassvalues among the different trophic guilds (e.g. theproducer:herbivore ratio or the producer:tertiarycarnivore ratio (Arias-Gonzalez, 1998).
Then, assign trophic levels as either integer (1, 2,3…) or fractional (1.3, 2.7, etc. as determinedthrough a weighted average of prey item trophiclevels) rankings across specific guilds within thecommunities present in the ecosystem(s) (seeLindeman, 1942; and Odum and Heald, 1975). Agood summary of the specific steps in how to goabout trophic level assignment can be found inChristensen and Pauly (1992).
A very simple trophic level index (TLI) can now becalculated weighing both integer and fractionaltrophic level by the trophic guild biomass. Forexample, in a system that is characterized as 30%herbivorous (trophic level = 1), 40% first-levelcarnivorous (trophic level = 2), and 30% second-level carnivorous (trophic level = 3), the TLI willbe: 1 (0.30) + 2 (0.40) + 3 (0.30) = 2.
Ecological efficiency is the percentage of biomassproduced by one trophic level that is incorporatedinto the biomass of the next higher trophic level.Generally speaking, this is approximately 10% ofthe total energy available within any one trophiclevel. Based on this rule, each trophic level that isassigned for guilds present is weighted 10 timesthe one below it. Of equal or greater importancemay be that it reflects progress towards the statedgoal of maintaining abundance and large sizeamong species of high trophic levels. Create a tableof the resulting values in order of increasing troph-ic assignment.
Finally, calculate a trophic structure index usingthe summary results generated to this point (seeDone and Reichelt, 1998; Christensen and Pauly,1992).
Observe changes and shifts in trophicstructure/position and the index through time.Determine (based on index results) whether or notthe food web observed is stable, in decline orimproving. Use observed results to predict trophictrends and inform management decision-makingand priority setting. Do data suggest that foodwebs within the MPA are undergoing changes? Ifso, are changes observed indicative of food webdeterioration or strengthening, in terms of howclose the relationships are from the desired state?
Rigorous ecological analysis and advanced model-ling will be necessary to confirm or reject withconfidence the results of this indicator. It shouldbe noted that numerous, more advanced mathe-matical modelling techniques exist and are avail-able through which to gauge the stability and reli-ability of trophic relationships found within thetarget ecosystem. For example, some modelsenable a prediction of the effects of speciesexploitation at varying levels of maturity on theoverall food web. For the purposes of meeting thisindicator such advanced modelling techniques arenot required, as it may not be feasible for the MPAproject team to undertake them.
Strengths and limitations
This is not an easy indicator to measure. Datacollection can be time-consuming, depending onthe number of species being considered (i.e. asingle chain of species versus an entire food web)and the complexity and overlap between andamong individual and clusters of trophic relation-ships within the area surveyed. Should an evalua-tion team determine that this indicator must bemeasured, the team should be aware that it willlikely take additional time to secure the necessaryhuman and financial resources to develop thecapacity to measure this indicator. Given the diffi-culties in collecting data for this indicator, evalua-tion teams need to think carefully about howclosely justified data collection for this indicator isagainst the MPA goals and objectives.
Incrementally, capture of weight data for this indi-cator may, at first glance, appear relatively simpleand straightforward given existing data collection
91
B6
Outputs
� A descriptive profile of the trophic rela-tionships and status between membersof at least a single food chain within theoverall food web.
� An illustration of the food web and theinterconnected food chains.
� A profile of average species and relativebiomass, grouped by trophic guild.
� A profile of total biomass withinobserved trophic guilds.
� A list of trophic ratios between guilds tobe monitored through time.
� A trophic structure index.
BIO
PHYSIC
AL
IND
ICATO
R6
Fo
od
web
inte
grity
investments made under related indicators (e.g. B1or B7). However, such incremental time invest-ments will require more than a minor amount ofadditional time and manpower. Based on real-world experience, even modelling of a single foodchain of relationships can become time consumingand labour intensive. Furthermore, incrementaldata collected (such as weight) are not necessarilyalways easily and quickly obtained. Finally, acomfort level and familiarity with mathematics isrequired.
The full potential of this indicator is theoreticallyachieved through comparison of data collectedfrom food webs within the MPA against thosefound under ‘pristine’ ecosystems. As ‘pristine’conditions and reference data are difficult to comeby, in the absence of such benchmark locationsthis indicator loses some of its analytical power.For example, since a ‘pristine’ food web that wouldbe found to occur naturally under no humanimpacts is not possible to characterize, how canthe restoration of food web integrity to such a levelbe defined? What food webs would be considered‘normal’ given current conditions in the world?
This indicator has limited accuracy and poorinference beyond the sites and communities wheretrophic information is modelled. As the level ofanalysis of food web relationships grows, its accu-racy is decreased significantly. Further, establishingcausality between trophic changes observed in thefood web and use of management interventions (orthe lack thereof) is not possible. The indicator mayfunction as more of an educational and illustrativetool about the state of the community ecologybeing managed, than as a proven measure ofmanagement effectiveness.
Despite the limitations and uncertainties, foodwebs and their role in ecosystem resilience are nowwidely recognised as critical components ofsuccessfully managed marine areas. While themethods for measuring this indicator are stillbeing tested, refined and expanded, the topic offood web integrity was widely accepted by contrib-utors to and reviewers of this guidebook to be ofcritical enough a nature for inclusion. This is par-ticularly relevant given that the indicator is accept-ed as a potential macro-descriptor of changesoccurring within an ecosystem and of its overallhealth.
Useful references and Internet links
Botsford, L.W, Castilla, J.C. and Petersen, C.H.(1997). “The management of fisheries andmarine ecosystems”. Science 277(5325):509–515.
Christensen, V. (2003). “Using Ecopath withEcosim for ecosystem based management offisheries”. In H. Jákupsstovu (ed.), Workshopon Ecosystem Modelling of Faroese Waters,Tórshavn, September 2002, FRS 2003: 73–75.
Christensen, V. and Pauly, D. (1992). “ECOPATHII - A software for balancing steady-statemodels and calculating network characteris-tics”. Ecological Modelling 61: 169–185.
Christensen, V. and Pauly, D. (eds.) (1993). TrophicModels of Aquatic Ecosystems. ICLARMConference Proceedings 26. InternationalCenter for Aquatic Living ResourcesManagement, Manila, Philippines.
Done, T.J. and R.E. Reichelt (1998). “Integratedcoastal zone and fisheries ecosystem manage-ment: generic goals and performance indices.”Ecological Applications 8 (suppl.): 110–118.
Hutchings, J.A. (2000). “Collapse and recovery ofmarine fishes”. Nature 406(6798): 882–885.
Jackson, J.B.C., Kirby, M.X. et al. (2001).“Historical overfishing and the recent collapseof coastal ecosystems”. Science 293(5530):629–638.
Jennings, S., Kaiser, M.J. and Reynolds, J.D.(2001). Marine Fisheries Ecology. BlackwellScience, London, UK.
Lindeman, R.L. (1942). “The trophic-dynamicaspect of ecology”. Ecology 23: 399–418.
Myers, R. A. and Worm, B. (2003). “Rapid world-wide depletion of predatory fish communities”.Nature 423: 280–283.
Odum, W.E. and Heald, E.J. (1975). “The detritus-based food web of an estuarine mangrovecommunity”. In L.E. Cronin (ed.), Estuarineresearch, Vol. 1. Academic Press, New York. pp.265–286.
Pauly, D., Christensen, V., Guénette, S., Pitcher,T.J., Sumaila, U.R., Walters, C.J., Watson, R.and Zeller, D. (2002). “Towards sustainabilityin world fisheries”. Nature 418: 689–695.
Pauly, D., Palomares, M.L., Froese, R., Sa-a, P.,Vakily, M., Preikshot, D. and Wallace, S.(2001). “Fishing down Canadian aquatic foodwebs”. Canadian Journal of Fisheries andAquatic Sciences 58: 51–62.
Sainsbury, K. and Sumaila, U.R. (2003).“Incorporating ecosystem objectives intomanagement of sustainable marine fisheries,including ‘best practice’ reference points anduse of Marine Protected Areas”. In M. Sinclairand G. Valdimarson (eds.), ResponsibleFisheries in the Marine Ecosystem. CABInternational, UK. pp. 343–361.
Winemiller, K.O. (1990). “Spatial and temporalvariation in tropical fish trophic networks”.Ecological Monographs 60(3): 331–367.
92
B6
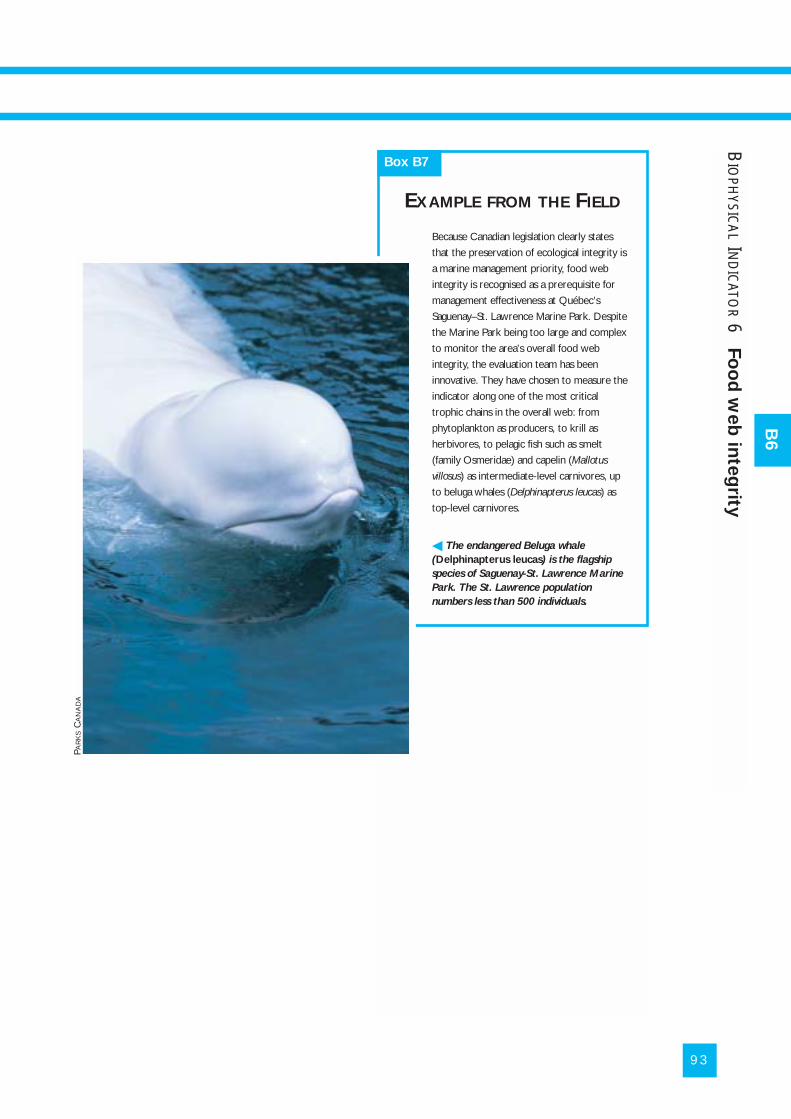
93
2
Because Canadian legislation clearly states
that the preservation of ecological integrity is
a marine management priority, food web
integrity is recognised as a prerequisite for
management effectiveness at Québec’s
Saguenay–St. Lawrence Marine Park. Despite
the Marine Park being too large and complex
to monitor the area’s overall food web
integrity, the evaluation team has been
innovative. They have chosen to measure the
indicator along one of the most critical
trophic chains in the overall web: from
phytoplankton as producers, to krill as
herbivores, to pelagic fish such as smelt
(family Osmeridae) and capelin (Mallotus
villosus) as intermediate-level carnivores, up
to beluga whales (Delphinapterus leucas) as
top-level carnivores.
� The endangered Beluga whale
(Delphinapterus leucas) is the flagship
species of Saguenay-St. Lawrence Marine
Park. The St. Lawrence population
numbers less than 500 individuals.
Box B7
EXAMPLE FROM THE FIELD
BIO
PHYSIC
AL
IND
ICATO
R6
Fo
od
web
inte
grity
B6
PAR
KS
CA
NA
DA
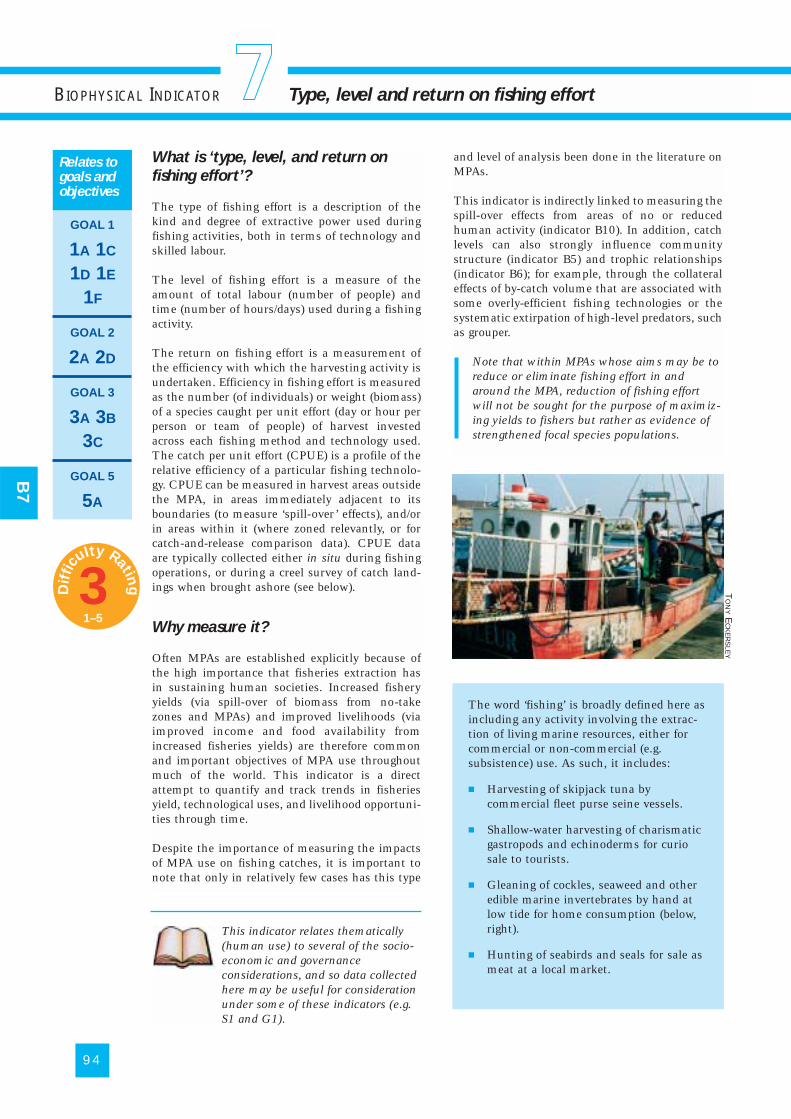
94
What is ‘type, level, and return on
fishing effort’?
The type of fishing effort is a description of thekind and degree of extractive power used duringfishing activities, both in terms of technology andskilled labour.
The level of fishing effort is a measure of theamount of total labour (number of people) andtime (number of hours/days) used during a fishingactivity.
The return on fishing effort is a measurement ofthe efficiency with which the harvesting activity isundertaken. Efficiency in fishing effort is measuredas the number (of individuals) or weight (biomass)of a species caught per unit effort (day or hour perperson or team of people) of harvest investedacross each fishing method and technology used.The catch per unit effort (CPUE) is a profile of therelative efficiency of a particular fishing technolo-gy. CPUE can be measured in harvest areas outsidethe MPA, in areas immediately adjacent to itsboundaries (to measure ‘spill-over’ effects), and/orin areas within it (where zoned relevantly, or forcatch-and-release comparison data). CPUE dataare typically collected either in situ during fishingoperations, or during a creel survey of catch land-ings when brought ashore (see below).
Why measure it?
Often MPAs are established explicitly because ofthe high importance that fisheries extraction hasin sustaining human societies. Increased fisheryyields (via spill-over of biomass from no-takezones and MPAs) and improved livelihoods (viaimproved income and food availability fromincreased fisheries yields) are therefore commonand important objectives of MPA use throughoutmuch of the world. This indicator is a directattempt to quantify and track trends in fisheriesyield, technological uses, and livelihood opportuni-ties through time.
Despite the importance of measuring the impactsof MPA use on fishing catches, it is important tonote that only in relatively few cases has this type
and level of analysis been done in the literature onMPAs.
This indicator is indirectly linked to measuring thespill-over effects from areas of no or reducedhuman activity (indicator B10). In addition, catchlevels can also strongly influence communitystructure (indicator B5) and trophic relationships(indicator B6); for example, through the collateraleffects of by-catch volume that are associated withsome overly-efficient fishing technologies or thesystematic extirpation of high-level predators, suchas grouper.
Note that within MPAs whose aims may be toreduce or eliminate fishing effort in andaround the MPA, reduction of fishing effortwill not be sought for the purpose of maximiz-ing yields to fishers but rather as evidence ofstrengthened focal species populations.
BIOPHYSICAL INDICATOR Type, level and return on fishing effort
GOAL 1
1A 1C
1D 1E
1F
GOAL 2
2A 2D
GOAL 3
3A 3B
3C
GOAL 5
5A
Relates togoals andobjectives
The word ‘fishing’ is broadly defined here asincluding any activity involving the extrac-tion of living marine resources, either forcommercial or non-commercial (e.g.subsistence) use. As such, it includes:
� Harvesting of skipjack tuna bycommercial fleet purse seine vessels.
� Shallow-water harvesting of charismaticgastropods and echinoderms for curiosale to tourists.
� Gleaning of cockles, seaweed and otheredible marine invertebrates by hand atlow tide for home consumption (below,right).
� Hunting of seabirds and seals for sale asmeat at a local market.
This indicator relates thematically(human use) to several of the socio-economic and governanceconsiderations, and so data collectedhere may be useful for considerationunder some of these indicators (e.g.S1 and G1).
B7
1T
ON
YE
CK
ER
SLE
Y
3Dif
ficu
lty Rating
1–5
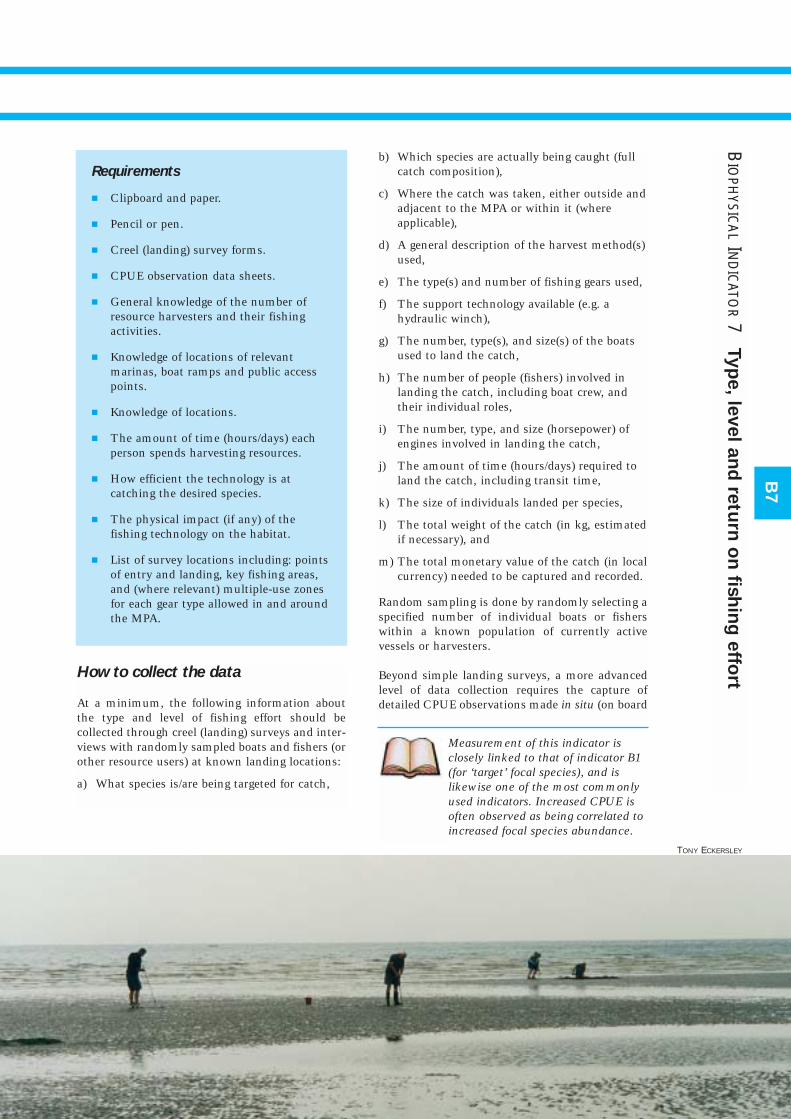
B7
How to collect the data
At a minimum, the following information aboutthe type and level of fishing effort should becollected through creel (landing) surveys and inter-views with randomly sampled boats and fishers (orother resource users) at known landing locations:
a) What species is/are being targeted for catch,
b) Which species are actually being caught (fullcatch composition),
c) Where the catch was taken, either outside andadjacent to the MPA or within it (whereapplicable),
d) A general description of the harvest method(s)used,
e) The type(s) and number of fishing gears used,
f) The support technology available (e.g. ahydraulic winch),
g) The number, type(s), and size(s) of the boatsused to land the catch,
h) The number of people (fishers) involved inlanding the catch, including boat crew, andtheir individual roles,
i) The number, type, and size (horsepower) ofengines involved in landing the catch,
j) The amount of time (hours/days) required toland the catch, including transit time,
k) The size of individuals landed per species,
l) The total weight of the catch (in kg, estimatedif necessary), and
m) The total monetary value of the catch (in localcurrency) needed to be captured and recorded.
Random sampling is done by randomly selecting aspecified number of individual boats or fisherswithin a known population of currently activevessels or harvesters.
Beyond simple landing surveys, a more advancedlevel of data collection requires the capture ofdetailed CPUE observations made in situ (on board
Measurement of this indicator isclosely linked to that of indicator B1(for ‘target’ focal species), and islikewise one of the most commonlyused indicators. Increased CPUE isoften observed as being correlated toincreased focal species abundance.
Requirements
� Clipboard and paper.
� Pencil or pen.
� Creel (landing) survey forms.
� CPUE observation data sheets.
� General knowledge of the number ofresource harvesters and their fishingactivities.
� Knowledge of locations of relevantmarinas, boat ramps and public accesspoints.
� Knowledge of locations.
� The amount of time (hours/days) eachperson spends harvesting resources.
� How efficient the technology is atcatching the desired species.
� The physical impact (if any) of thefishing technology on the habitat.
� List of survey locations including: pointsof entry and landing, key fishing areas,and (where relevant) multiple-use zonesfor each gear type allowed in and aroundthe MPA.
BIO
PHYSIC
AL
IND
ICATO
R7
Typ
e, le
vel a
nd
retu
rn o
n fis
hin
g e
ffort
TONY ECKERSLEY
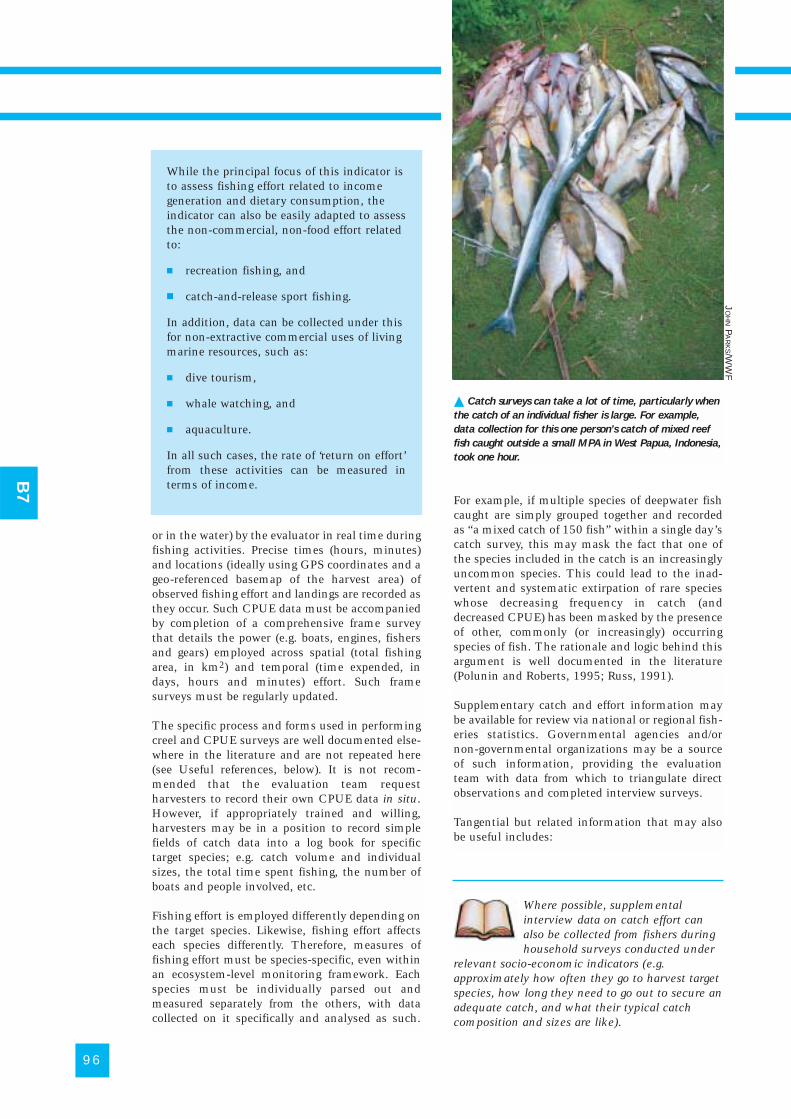
or in the water) by the evaluator in real time duringfishing activities. Precise times (hours, minutes)and locations (ideally using GPS coordinates and ageo-referenced basemap of the harvest area) ofobserved fishing effort and landings are recorded asthey occur. Such CPUE data must be accompaniedby completion of a comprehensive frame surveythat details the power (e.g. boats, engines, fishersand gears) employed across spatial (total fishingarea, in km2) and temporal (time expended, indays, hours and minutes) effort. Such framesurveys must be regularly updated.
The specific process and forms used in performingcreel and CPUE surveys are well documented else-where in the literature and are not repeated here(see Useful references, below). It is not recom-mended that the evaluation team requestharvesters to record their own CPUE data in situ.However, if appropriately trained and willing,harvesters may be in a position to record simplefields of catch data into a log book for specifictarget species; e.g. catch volume and individualsizes, the total time spent fishing, the number ofboats and people involved, etc.
Fishing effort is employed differently depending onthe target species. Likewise, fishing effort affectseach species differently. Therefore, measures offishing effort must be species-specific, even withinan ecosystem-level monitoring framework. Eachspecies must be individually parsed out andmeasured separately from the others, with datacollected on it specifically and analysed as such.
For example, if multiple species of deepwater fishcaught are simply grouped together and recordedas “a mixed catch of 150 fish” within a single day’scatch survey, this may mask the fact that one ofthe species included in the catch is an increasinglyuncommon species. This could lead to the inad-vertent and systematic extirpation of rare specieswhose decreasing frequency in catch (anddecreased CPUE) has been masked by the presenceof other, commonly (or increasingly) occurringspecies of fish. The rationale and logic behind thisargument is well documented in the literature(Polunin and Roberts, 1995; Russ, 1991).
Supplementary catch and effort information maybe available for review via national or regional fish-eries statistics. Governmental agencies and/ornon-governmental organizations may be a sourceof such information, providing the evaluationteam with data from which to triangulate directobservations and completed interview surveys.
Tangential but related information that may alsobe useful includes:
96
Where possible, supplementalinterview data on catch effort canalso be collected from fishers duringhousehold surveys conducted under
relevant socio-economic indicators (e.g.approximately how often they go to harvest targetspecies, how long they need to go out to secure anadequate catch, and what their typical catchcomposition and sizes are like).
B7
While the principal focus of this indicator isto assess fishing effort related to incomegeneration and dietary consumption, theindicator can also be easily adapted to assessthe non-commercial, non-food effort relatedto:
� recreation fishing, and
� catch-and-release sport fishing.
In addition, data can be collected under thisfor non-extractive commercial uses of livingmarine resources, such as:
� dive tourism,
� whale watching, and
� aquaculture.
In all such cases, the rate of ‘return on effort’from these activities can be measured interms of income.
� Catch surveys can take a lot of time, particularly when
the catch of an individual fisher is large. For example,
data collection for this one person’s catch of mixed reef
fish caught outside a small MPA in West Papua, Indonesia,
took one hour.
JO
HN
PA
RK
S/WW
F
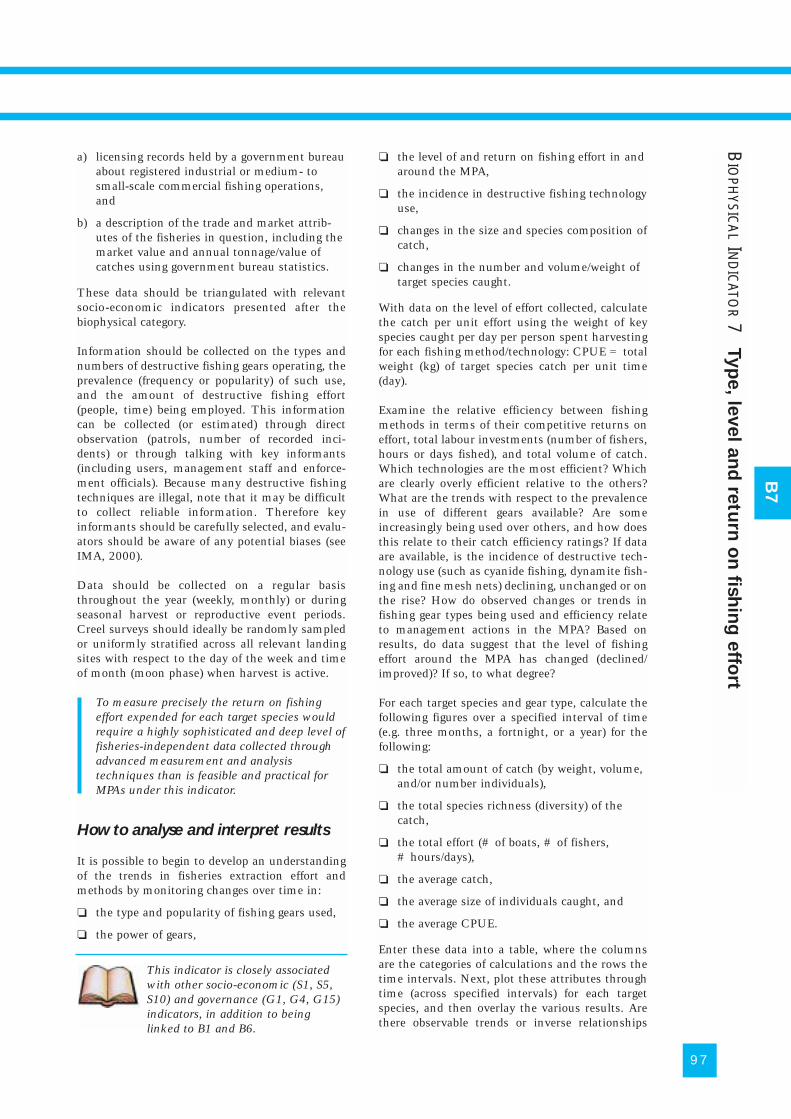
97
B7
BIO
PHYSIC
AL
IND
ICATO
R7
Typ
e, le
vel a
nd
retu
rn o
n fis
hin
g e
ffort
a) licensing records held by a government bureauabout registered industrial or medium- tosmall-scale commercial fishing operations,and
b) a description of the trade and market attrib-utes of the fisheries in question, including themarket value and annual tonnage/value ofcatches using government bureau statistics.
These data should be triangulated with relevantsocio-economic indicators presented after thebiophysical category.
Information should be collected on the types andnumbers of destructive fishing gears operating, theprevalence (frequency or popularity) of such use,and the amount of destructive fishing effort(people, time) being employed. This informationcan be collected (or estimated) through directobservation (patrols, number of recorded inci-dents) or through talking with key informants(including users, management staff and enforce-ment officials). Because many destructive fishingtechniques are illegal, note that it may be difficultto collect reliable information. Therefore keyinformants should be carefully selected, and evalu-ators should be aware of any potential biases (seeIMA, 2000).
Data should be collected on a regular basisthroughout the year (weekly, monthly) or duringseasonal harvest or reproductive event periods.Creel surveys should ideally be randomly sampledor uniformly stratified across all relevant landingsites with respect to the day of the week and timeof month (moon phase) when harvest is active.
To measure precisely the return on fishingeffort expended for each target species wouldrequire a highly sophisticated and deep level offisheries-independent data collected throughadvanced measurement and analysistechniques than is feasible and practical forMPAs under this indicator.
How to analyse and interpret results
It is possible to begin to develop an understandingof the trends in fisheries extraction effort andmethods by monitoring changes over time in:
❏ the type and popularity of fishing gears used,
❏ the power of gears,
❏ the level of and return on fishing effort in andaround the MPA,
❏ the incidence in destructive fishing technologyuse,
❏ changes in the size and species composition ofcatch,
❏ changes in the number and volume/weight oftarget species caught.
With data on the level of effort collected, calculatethe catch per unit effort using the weight of keyspecies caught per day per person spent harvestingfor each fishing method/technology: CPUE = totalweight (kg) of target species catch per unit time(day).
Examine the relative efficiency between fishingmethods in terms of their competitive returns oneffort, total labour investments (number of fishers,hours or days fished), and total volume of catch.Which technologies are the most efficient? Whichare clearly overly efficient relative to the others?What are the trends with respect to the prevalencein use of different gears available? Are someincreasingly being used over others, and how doesthis relate to their catch efficiency ratings? If dataare available, is the incidence of destructive tech-nology use (such as cyanide fishing, dynamite fish-ing and fine mesh nets) declining, unchanged or onthe rise? How do observed changes or trends infishing gear types being used and efficiency relateto management actions in the MPA? Based onresults, do data suggest that the level of fishingeffort around the MPA has changed (declined/improved)? If so, to what degree?
For each target species and gear type, calculate thefollowing figures over a specified interval of time(e.g. three months, a fortnight, or a year) for thefollowing:
❏ the total amount of catch (by weight, volume,and/or number individuals),
❏ the total species richness (diversity) of thecatch,
❏ the total effort (# of boats, # of fishers,# hours/days),
❏ the average catch,
❏ the average size of individuals caught, and
❏ the average CPUE.
Enter these data into a table, where the columnsare the categories of calculations and the rows thetime intervals. Next, plot these attributes throughtime (across specified intervals) for each targetspecies, and then overlay the various results. Arethere observable trends or inverse relationships
This indicator is closely associatedwith other socio-economic (S1, S5,S10) and governance (G1, G4, G15)indicators, in addition to beinglinked to B1 and B6.
between any of these attributes? If so, what doesthis mean? Do increased catch sizes and effortinversely relate to the average size of individualscaught?
One caveat is that differential interpretation ofresults may arise based on the life history of thepopulation being fished and the timing of the catchsurvey done. For example, data may be skewed(false positive) to look as if a tremendous increasein CPUE is observed when in reality this is simplydue to undertaking the landing survey at a timewhen fish migration, aggregation or recruitment isunderway.
Strengths and limitations
Data in this indicator are relatively straightforwardto collect, although it may appear simpler than itreally is and can often be time consuming andlabour intensive. Measurement of this indicator isnot as simple as it may appear, and it is importantto be aware that accurate catch data collection forthe predominant species (those caught most often)and for focal species (those of interest to the MPAand its goals and objectives) will require notableadditional time and man-power. CPUE surveysalso require relatively well-trained staff and mustbe done consistently for at least a full year in orderto acquire an accurate idea of what catch rates are.Furthermore, scientific consultants and staff (whomay need to be hired out and are expensive) will benecessary to develop catch-effort databases andanalyse baseline data.
With sufficient training, CPUE and creel surveyscan be undertaken by project staff and communityvolunteers for relatively little cost or logisticalinvestment. However, technical oversight andscientific review of results by qualified and experi-enced fisheries biologists is important, and so thecollection of CPUE data may not be appropriate orfeasible in every MPA site. Visual or creel/vesselbased surveys are fairly accurate in terms ofestimating return on fishing effort invested.
Changes in the type of fishing gears being used andthe number of boats and fishers may be both moreeasily measured and more useful in terms of iden-tifying fishing pressure issues and increases.Likewise, changes in the size and composition ofcatch are as or more important as how many fishare being caught.
CPUE is not necessarily a good indicator ofecological change and therefore alone is not suffi-cient to identify and prevent imminent collapsesfor all fishery stocks. Also, the long-term, consis-tent monitoring perspective required for CPUE
data makes it very difficult to correlate CPUE withenvironmental change.
The evaluation team should check for accuracy infishing effort and CPUE reporting submitted fromvolunteer fishers and, if possible, check for andfactor in the falsification or misreporting of data.Data accuracy related to submitted catch reportsfrom all fishers should not be assumed.
Useful references and Internet links
Dulvy, N.K., Metcalfe, J.D., Glanville, J., Pawson,M.G. and Reynolds, J.D. (2000). “Fisheriesstability, local extinctions and shifts in com-munity structure of skates”. ConservationBiology 14: 283–293.
Gulland, J.A. (1975). Manual of Methods forFisheries Resources Survey and Appraisal: Part5 - Objectives and Basic Methods. FAOFisheries Technical Paper No. 145. UnitedNations Food and Agriculture Organization,Rome, Italy.
Gulland, J.A. (1983). Fish Stock Assessment: AManual of Basic Methods. Wiley Interscience,Chichester, UK.
Gunderson, D.R. (1993). Surveys of FisheryResources. John Wiley and Sons, Inc., NewYork, NY, USA.
Hilborn, R. and Walters, C.J. (1992). QuantitativeFisheries Stock Assessment: Choice, dynamics,and uncertainty. Chapman and Hall, NewYork, NY, USA.
98
B7
Outputs
� A record of the gear types being used.
� A record of the power being invested.
� A record of the size and composition ofcatches.
� A record of catch-effort efficiency andCPUE calculations for target resourcesremoved by local stakeholders across allgears and technologies used.
� Time series graphs of total catch size,total effort, average sizes of individualslanded, and the CPUE for each species.
� A map of key representative fishing sitesacross habitat types in and outside theMPA and locations of key points of entry(parks, boat ramps) to the MPA.
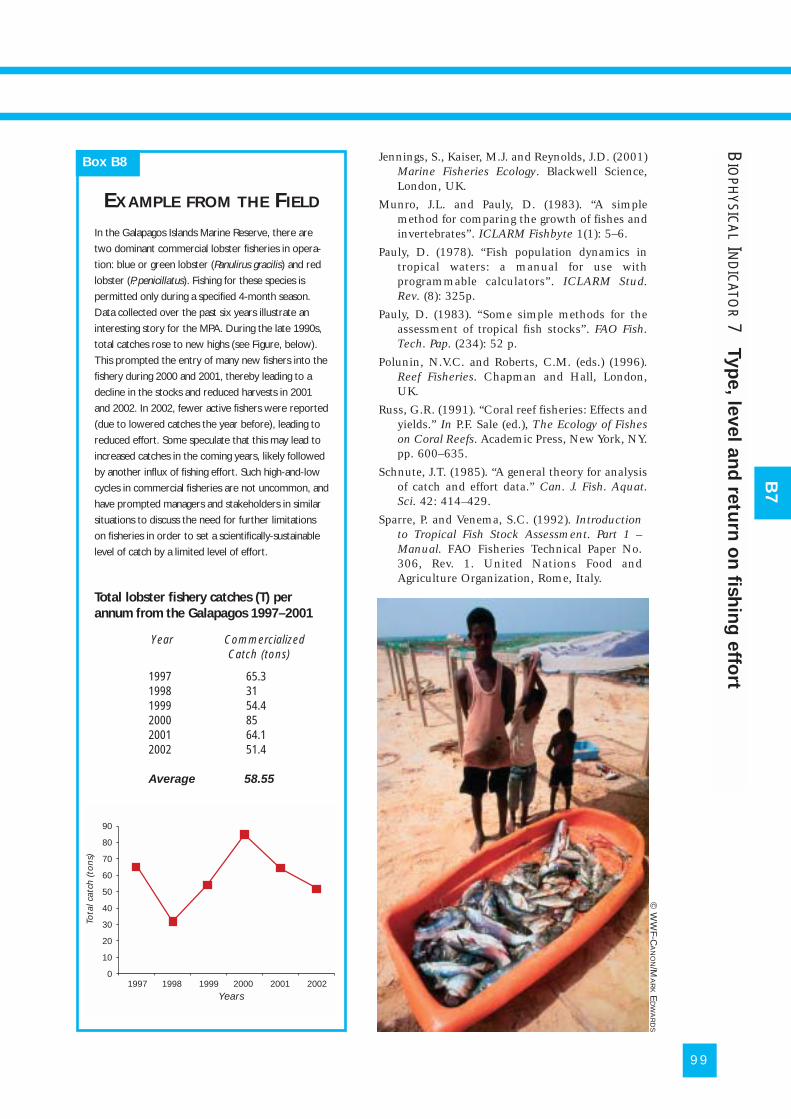
99
B7
In the Galapagos Islands Marine Reserve, there are
two dominant commercial lobster fisheries in opera-
tion: blue or green lobster (Panulirus gracilis) and red
lobster (P. penicillatus). Fishing for these species is
permitted only during a specified 4-month season.
Data collected over the past six years illustrate an
interesting story for the MPA. During the late 1990s,
total catches rose to new highs (see Figure, below).
This prompted the entry of many new fishers into the
fishery during 2000 and 2001, thereby leading to a
decline in the stocks and reduced harvests in 2001
and 2002. In 2002, fewer active fishers were reported
(due to lowered catches the year before), leading to
reduced effort. Some speculate that this may lead to
increased catches in the coming years, likely followed
by another influx of fishing effort. Such high-and-low
cycles in commercial fisheries are not uncommon, and
have prompted managers and stakeholders in similar
situations to discuss the need for further limitations
on fisheries in order to set a scientifically-sustainable
level of catch by a limited level of effort.
Total lobster fishery catches (T) perannum from the Galapagos 1997–2001
Year Commercialized Catch (tons)
1997 65.31998 311999 54.42000 852001 64.12002 51.4
Average 58.55
Box B8
EXAMPLE FROM THE FIELD
BIO
PHYSIC
AL
IND
ICATO
R7
Typ
e, le
vel a
nd
retu
rn o
n fis
hin
g e
ffort
Jennings, S., Kaiser, M.J. and Reynolds, J.D. (2001)Marine Fisheries Ecology. Blackwell Science,London, UK.
Munro, J.L. and Pauly, D. (1983). “A simplemethod for comparing the growth of fishes andinvertebrates”. ICLARM Fishbyte 1(1): 5–6.
Pauly, D. (1978). “Fish population dynamics intropical waters: a manual for use withprogrammable calculators”. ICLARM Stud.Rev. (8): 325p.
Pauly, D. (1983). “Some simple methods for theassessment of tropical fish stocks”. FAO Fish.Tech. Pap. (234): 52 p.
Polunin, N.V.C. and Roberts, C.M. (eds.) (1996).Reef Fisheries. Chapman and Hall, London,UK.
Russ, G.R. (1991). “Coral reef fisheries: Effects andyields.” In P.F. Sale (ed.), The Ecology of Fisheson Coral Reefs. Academic Press, New York, NY.pp. 600–635.
Schnute, J.T. (1985). “A general theory for analysisof catch and effort data.” Can. J. Fish. Aquat.Sci. 42: 414–429.
Sparre, P. and Venema, S.C. (1992). Introductionto Tropical Fish Stock Assessment. Part 1 –Manual. FAO Fisheries Technical Paper No.306, Rev. 1. United Nations Food andAgriculture Organization, Rome, Italy.
1997 1998 1999 2000 2001 2002Years
Tota
l cat
ch (
ton
s)
90
80
70
60
50
40
30
20
10
0
© W
WF-C
AN
ON/M
AR
KE
DW
AR
DS
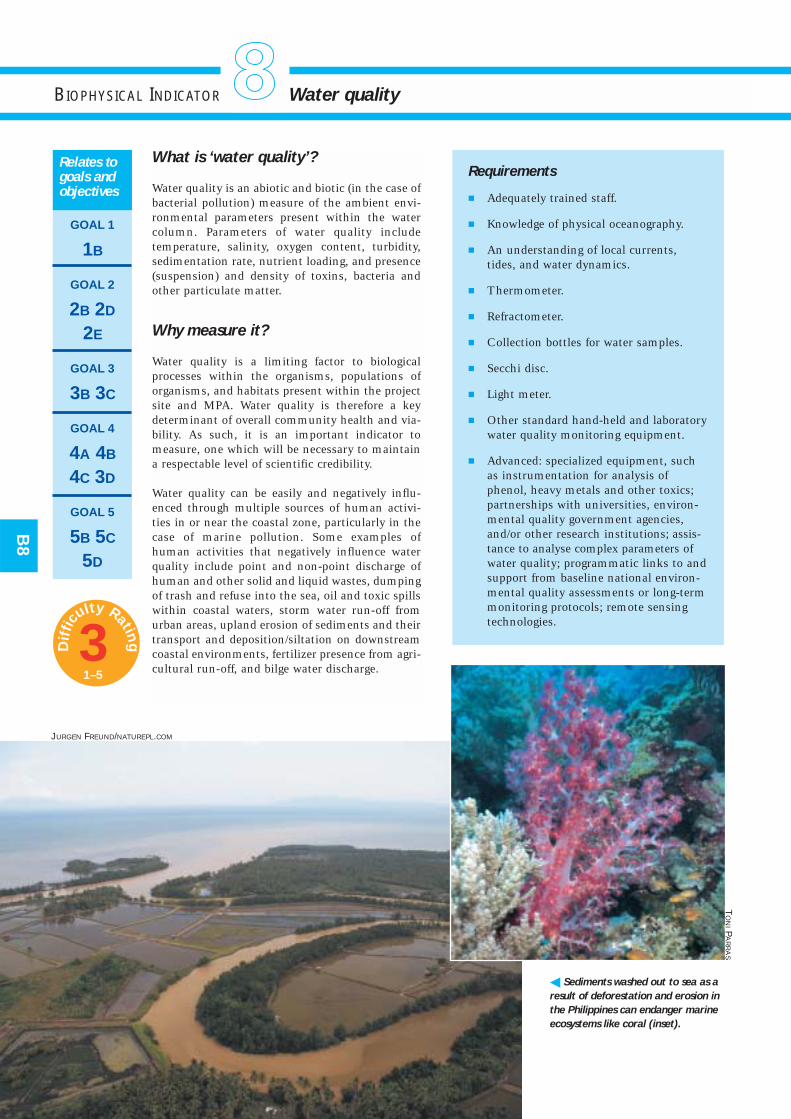
What is ‘water quality’?
Water quality is an abiotic and biotic (in the case ofbacterial pollution) measure of the ambient envi-ronmental parameters present within the watercolumn. Parameters of water quality includetemperature, salinity, oxygen content, turbidity,sedimentation rate, nutrient loading, and presence(suspension) and density of toxins, bacteria andother particulate matter.
Why measure it?
Water quality is a limiting factor to biologicalprocesses within the organisms, populations oforganisms, and habitats present within the projectsite and MPA. Water quality is therefore a keydeterminant of overall community health and via-bility. As such, it is an important indicator tomeasure, one which will be necessary to maintaina respectable level of scientific credibility.
Water quality can be easily and negatively influ-enced through multiple sources of human activi-ties in or near the coastal zone, particularly in thecase of marine pollution. Some examples ofhuman activities that negatively influence waterquality include point and non-point discharge ofhuman and other solid and liquid wastes, dumpingof trash and refuse into the sea, oil and toxic spillswithin coastal waters, storm water run-off fromurban areas, upland erosion of sediments and theirtransport and deposition/siltation on downstreamcoastal environments, fertilizer presence from agri-cultural run-off, and bilge water discharge.
BIOPHYSICAL INDICATOR Water quality
GOAL 1
1B
GOAL 2
2B 2D
2E
GOAL 3
3B 3C
GOAL 4
4A 4B
4C 3D
GOAL 5
5B 5C
5D
Relates togoals andobjectives
B8
Requirements
� Adequately trained staff.
� Knowledge of physical oceanography.
� An understanding of local currents,tides, and water dynamics.
� Thermometer.
� Refractometer.
� Collection bottles for water samples.
� Secchi disc.
� Light meter.
� Other standard hand-held and laboratorywater quality monitoring equipment.
� Advanced: specialized equipment, suchas instrumentation for analysis ofphenol, heavy metals and other toxics;partnerships with universities, environ-mental quality government agencies,and/or other research institutions; assis-tance to analyse complex parameters ofwater quality; programmatic links to andsupport from baseline national environ-mental quality assessments or long-termmonitoring protocols; remote sensingtechnologies.
� Sediments washed out to sea as a
result of deforestation and erosion in
the Philippines can endanger marine
ecosystems like coral (inset).
1T
ON
IPA
RR
AS
JURGEN FREUND/NATUREPL.COM
3Dif
ficu
lty Rating
1–5
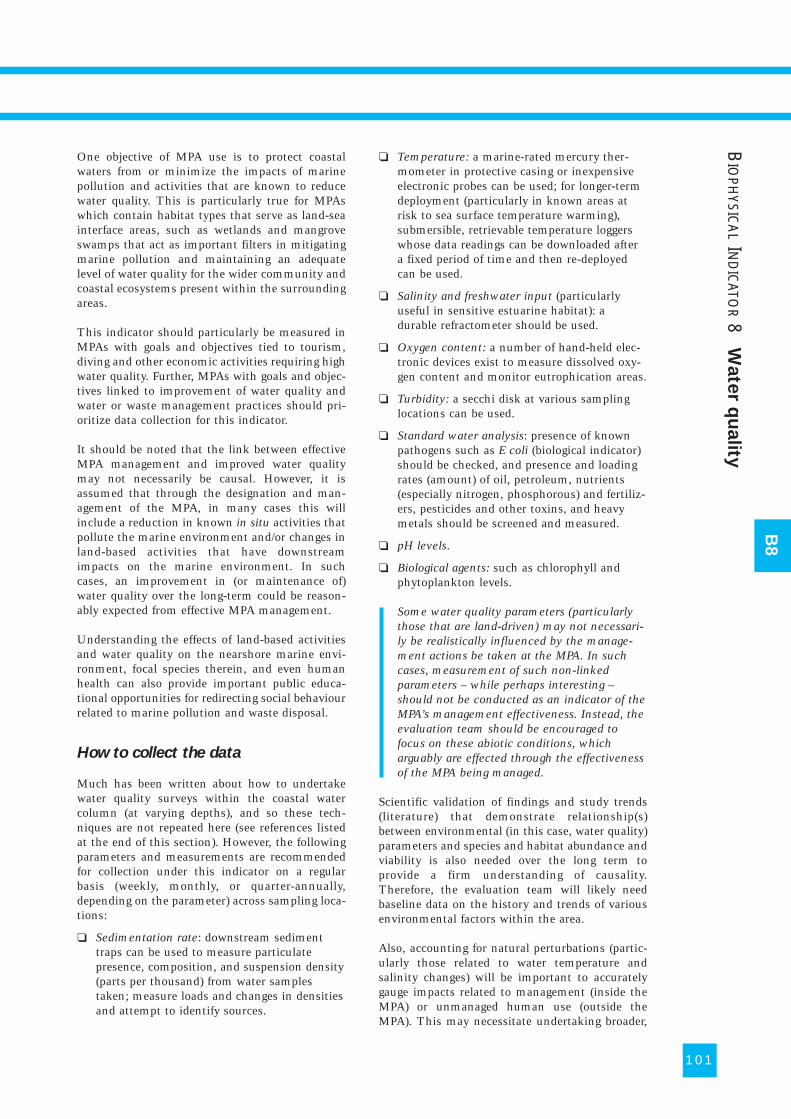
One objective of MPA use is to protect coastalwaters from or minimize the impacts of marinepollution and activities that are known to reducewater quality. This is particularly true for MPAswhich contain habitat types that serve as land-seainterface areas, such as wetlands and mangroveswamps that act as important filters in mitigatingmarine pollution and maintaining an adequatelevel of water quality for the wider community andcoastal ecosystems present within the surroundingareas.
This indicator should particularly be measured inMPAs with goals and objectives tied to tourism,diving and other economic activities requiring highwater quality. Further, MPAs with goals and objec-tives linked to improvement of water quality andwater or waste management practices should pri-oritize data collection for this indicator.
It should be noted that the link between effectiveMPA management and improved water qualitymay not necessarily be causal. However, it isassumed that through the designation and man-agement of the MPA, in many cases this willinclude a reduction in known in situ activities thatpollute the marine environment and/or changes inland-based activities that have downstreamimpacts on the marine environment. In suchcases, an improvement in (or maintenance of)water quality over the long-term could be reason-ably expected from effective MPA management.
Understanding the effects of land-based activitiesand water quality on the nearshore marine envi-ronment, focal species therein, and even humanhealth can also provide important public educa-tional opportunities for redirecting social behaviourrelated to marine pollution and waste disposal.
How to collect the data
Much has been written about how to undertakewater quality surveys within the coastal watercolumn (at varying depths), and so these tech-niques are not repeated here (see references listedat the end of this section). However, the followingparameters and measurements are recommendedfor collection under this indicator on a regularbasis (weekly, monthly, or quarter-annually,depending on the parameter) across sampling loca-tions:
❏ Sedimentation rate: downstream sedimenttraps can be used to measure particulatepresence, composition, and suspension density(parts per thousand) from water samplestaken; measure loads and changes in densitiesand attempt to identify sources.
❏ Temperature: a marine-rated mercury ther-mometer in protective casing or inexpensiveelectronic probes can be used; for longer-termdeployment (particularly in known areas atrisk to sea surface temperature warming),submersible, retrievable temperature loggerswhose data readings can be downloaded aftera fixed period of time and then re-deployedcan be used.
❏ Salinity and freshwater input (particularlyuseful in sensitive estuarine habitat): adurable refractometer should be used.
❏ Oxygen content: a number of hand-held elec-tronic devices exist to measure dissolved oxy-gen content and monitor eutrophication areas.
❏ Turbidity: a secchi disk at various samplinglocations can be used.
❏ Standard water analysis: presence of knownpathogens such as E coli (biological indicator)should be checked, and presence and loadingrates (amount) of oil, petroleum, nutrients(especially nitrogen, phosphorous) and fertiliz-ers, pesticides and other toxins, and heavymetals should be screened and measured.
❏ pH levels.
❏ Biological agents: such as chlorophyll andphytoplankton levels.
Some water quality parameters (particularlythose that are land-driven) may not necessari-ly be realistically influenced by the manage-ment actions be taken at the MPA. In suchcases, measurement of such non-linkedparameters – while perhaps interesting –should not be conducted as an indicator of theMPA’s management effectiveness. Instead, theevaluation team should be encouraged tofocus on these abiotic conditions, whicharguably are effected through the effectivenessof the MPA being managed.
Scientific validation of findings and study trends(literature) that demonstrate relationship(s)between environmental (in this case, water quality)parameters and species and habitat abundance andviability is also needed over the long term toprovide a firm understanding of causality.Therefore, the evaluation team will likely needbaseline data on the history and trends of variousenvironmental factors within the area.
Also, accounting for natural perturbations (partic-ularly those related to water temperature andsalinity changes) will be important to accuratelygauge impacts related to management (inside theMPA) or unmanaged human use (outside theMPA). This may necessitate undertaking broader,
101
B8
BIO
PHYSIC
AL
IND
ICATO
R8
Wate
r qu
ality
long-term monitoring programmes of study withproject partners in the government and academicinstitutions. For example, monitoring upland agri-cultural development impacts including pesti-cide/fertilizer and nutrient loading in the water-shed, estimating runoff volume and sedimentationrates may be necessary to fully understand andpredict upper and lower limits of water qualityparameters during certain times of the year (e.g.during the rainy versus dry seasons).
Note that in MPAs where water movement ishighly dynamic and variable (such as withinhighly fluctuating tidal areas or areas exposedto river currents), the simple water samplingmethods offered here may be insufficient toaccurately characterize the effects of the MPAand its management on water quality levels.
The seasonality of water quality (e.g. rainy seasonsand frequency of river basin flooding) must beaccounted for when considering an appropriatetimeframe within which to collect such informa-tion.
More advanced evaluation of water quality and itslinks to the biotic system may also be useful toevaluation teams that have the necessary skills,time, and resources to undertake them. For exam-ple, remote-sensing technologies may be availableto profile relevant abiotic parameters and how theyrelate to biological events. Or perhaps sampling forthe presence and degree of bioaccumulation(amount) of heavy metals or contamination ofpersistent organic pollutants within the tissues offocal species (such as molluscs or dead seamammals) may be an important activity to under-take in an MPA located downstream of uplandagricultural activities given its goals and objectives.Or perhaps tracing the path and monitoring thelevels of heavy metal bioaccumulation throughvarious trophic levels of the resident food web areimportant to people living near an urban MPA whorely on local fishery spill-over from a no-take areafor food and income.
How to analyse and interpret results
Summarize and disseminate results with resourceusers and stakeholders. Analyse the results gener-ated in terms of two components:
❏ identification of the water quality issues andspecific parameters needing to be addressed,and
❏ assessment of what is causing/sourcing thesechanges.
In this regard, the scale-dependency of the param-eters investigated becomes more evident.
Monitor observed changes and trends in the envi-ronmental parameters measured for water qualityand disseminate findings. Correlate these findingsagainst the results of B1 and B4 to see if any rela-tionships or patterns emerge.
Encourage a community-organized water qualitymonitoring system to take responsibility for regu-lar monitoring and analysis activities. Simplecomputer software packages (e.g. PRIMER ecologi-cal statistics) and the use of friendly, specific pro-cedures to interpret water quality (e.g. the BIOENVprocedure) could also be useful for communityinterpretation of results.
The seasonality of water quality (e.g. rainyseasons and frequency of river basin flooding)must be accounted for when analysing andinterpreting results.
A water and environmental quality specialistshould review results, and ideally, the specialistshould carry out independent spot-checking toconfirm or reject measurements taken.
Do data suggest that the water quality within theMPA is changing? If so, to what degree haveparameters shifted away from the desired waterquality state across the majority of parametersmeasured?
Strengths and limitations
Equipment and training costs for the full suite ofmeasures (outlined below) will require moderate tosignificant financial resources. More technicalequipment and measurements do exist for evaluat-ing water quality, but are in all probability notnecessary to sufficiently profile this indicator.
102
B8
Collection of data for this indicatorcan be linked to the collection ofinformation related to assessment ofindicator B10.
Outputs
� An index of water quality parameters.
� Graphs of parameter results plottedacross time.
� Advanced: scatterplots of parametermeasures correlated against naturalphenomena and biological data.
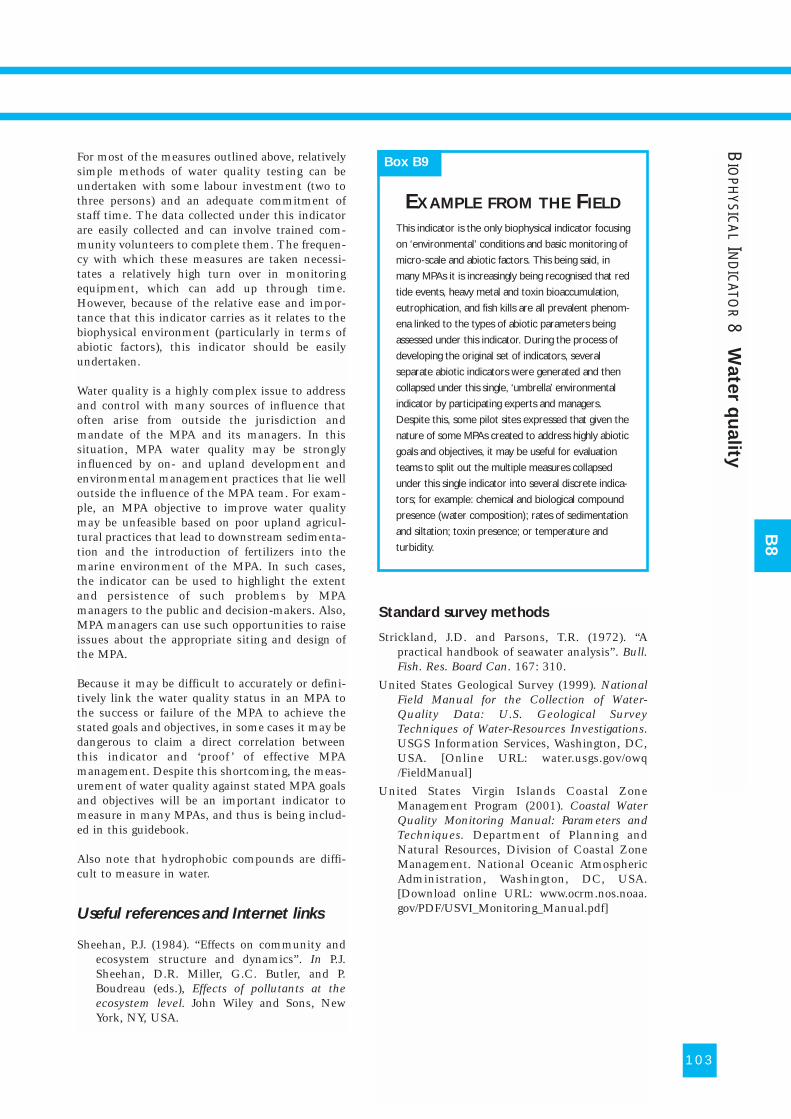
For most of the measures outlined above, relativelysimple methods of water quality testing can beundertaken with some labour investment (two tothree persons) and an adequate commitment ofstaff time. The data collected under this indicatorare easily collected and can involve trained com-munity volunteers to complete them. The frequen-cy with which these measures are taken necessi-tates a relatively high turn over in monitoringequipment, which can add up through time.However, because of the relative ease and impor-tance that this indicator carries as it relates to thebiophysical environment (particularly in terms ofabiotic factors), this indicator should be easilyundertaken.
Water quality is a highly complex issue to addressand control with many sources of influence thatoften arise from outside the jurisdiction andmandate of the MPA and its managers. In thissituation, MPA water quality may be stronglyinfluenced by on- and upland development andenvironmental management practices that lie welloutside the influence of the MPA team. For exam-ple, an MPA objective to improve water qualitymay be unfeasible based on poor upland agricul-tural practices that lead to downstream sedimenta-tion and the introduction of fertilizers into themarine environment of the MPA. In such cases,the indicator can be used to highlight the extentand persistence of such problems by MPAmanagers to the public and decision-makers. Also,MPA managers can use such opportunities to raiseissues about the appropriate siting and design ofthe MPA.
Because it may be difficult to accurately or defini-tively link the water quality status in an MPA tothe success or failure of the MPA to achieve thestated goals and objectives, in some cases it may bedangerous to claim a direct correlation betweenthis indicator and ‘proof ’ of effective MPAmanagement. Despite this shortcoming, the meas-urement of water quality against stated MPA goalsand objectives will be an important indicator tomeasure in many MPAs, and thus is being includ-ed in this guidebook.
Also note that hydrophobic compounds are diffi-cult to measure in water.
Useful references and Internet links
Sheehan, P.J. (1984). “Effects on community andecosystem structure and dynamics”. In P.J.Sheehan, D.R. Miller, G.C. Butler, and P.Boudreau (eds.), Effects of pollutants at theecosystem level. John Wiley and Sons, NewYork, NY, USA.
Standard survey methods
Strickland, J.D. and Parsons, T.R. (1972). “Apractical handbook of seawater analysis”. Bull.Fish. Res. Board Can. 167: 310.
United States Geological Survey (1999). NationalField Manual for the Collection of Water-Quality Data: U.S. Geological SurveyTechniques of Water-Resources Investigations.USGS Information Services, Washington, DC,USA. [Online URL: water.usgs.gov/owq/FieldManual]
United States Virgin Islands Coastal ZoneManagement Program (2001). Coastal WaterQuality Monitoring Manual: Parameters andTechniques. Department of Planning andNatural Resources, Division of Coastal ZoneManagement. National Oceanic AtmosphericAdministration, Washington, DC, USA.[Download online URL: www.ocrm.nos.noaa.gov/PDF/USVI_Monitoring_Manual.pdf]
103
BIO
PHYSIC
AL
IND
ICATO
R8
Wate
r qu
ality
B8
This indicator is the only biophysical indicator focusing
on ‘environmental’ conditions and basic monitoring of
micro-scale and abiotic factors. This being said, in
many MPAs it is increasingly being recognised that red
tide events, heavy metal and toxin bioaccumulation,
eutrophication, and fish kills are all prevalent phenom-
ena linked to the types of abiotic parameters being
assessed under this indicator. During the process of
developing the original set of indicators, several
separate abiotic indicators were generated and then
collapsed under this single, ‘umbrella’ environmental
indicator by participating experts and managers.
Despite this, some pilot sites expressed that given the
nature of some MPAs created to address highly abiotic
goals and objectives, it may be useful for evaluation
teams to split out the multiple measures collapsed
under this single indicator into several discrete indica-
tors; for example: chemical and biological compound
presence (water composition); rates of sedimentation
and siltation; toxin presence; or temperature and
turbidity.
Box B9
EXAMPLE FROM THE FIELD
What is ‘recovery’?
Recovery is measured as the proportion of the totalMPA area (km2, or % of total area) or focal speciespopulation (abundance, biomass, or % of totalpopulation) that has experienced or ‘been restored’to assumed ‘original’ (target) levels of either:
❏ Community composition or habitat distribu-tion deemed representative of ‘ideal’ (i.e. rela-tively undisturbed by human activity) or ‘nat-ural’ conditions (i.e. non-human influenced);or
❏ Viable population levels and stock integrity,such as the return of 60% or more of the orig-inal standing spawning stock that is assumedwould occur in the absence of human impact.
Whether the recovery target requires that the MPAreturn biotic characteristics ‘back’ to some state of‘natural condition’, or if it is simply to achievesome identified level below this state, is dependenton the definition of what ‘recovery’ is. This ‘recov-ery’ target may be defined previously within theMPA’s recovery-related goals and objectives, inwhich case it requires them merely to be adopted.But in some cases, a measurable target for ‘recov-ery’ has not been specified under the aims of theMPA. In this situation, the MPA managementteam may need to think carefully about settingmeasurable aerial restoration targets annually andincrementally through time. From such clearlydefined aerial targets, this indicator can be moreeasily measured. For example, an MPA goal where-by “focal species populations are restored to levelswhere they can replenish themselves through timewithin 40% of state waters” is a more measurabledefinition than one that simply states that “focalspecies are to be restored back to naturally occur-ring levels”.
It should be noted that in some MPA locationsthat frequently experience natural disturbances(e.g. cyclones) which limit/prevent the restorativecapacity of the project, this indicator may not eas-ily be applicable. In such cases, the ‘natural condi-tions’ restoration target may not be realistic andinstead may need to give way to a compromiserestoration level that is sub-natural conditions.
There is room for much subjectivity and biasin creating definitions for ‘natural’ conditionsor ‘restored’ levels. What is more importantthan the words used is the ability for thesewords to be measurably defined, even at theexpense of substantial debate. If it is not possi-ble for the evaluation team to agree on ameasurable definition of what the state of‘recovery’ or ‘natural condition’ is, then thisindicator cannot be measured, nor likely will
progress made toward the associated MPAobjectives be able to be evaluated.
Finally, this indicator may not be relevant at allMPA sites, depending on the extent (or even pres-ence) of restoration targets within the MPA goalsand objectives.
Why measure it?
This indicator is a discrete measure of the amountof area (with constituent biotic and abiotic attrib-utes) that has been returned to target operationalconditions, that is, has been fully restored to natu-ral conditions from some defined level below this.As such, it attempts to act as a concrete successmeasurement of MPA performance against thestated restoration target. It is a universally under-stood indicator of interest to stakeholders, deci-sion-makers, donors and researchers.
Note that this indicator should not be measured byMPAs where the goals and objectives of the area donot include ‘restoration’ (either back to naturalstate or sustainable fishing levels). However, if‘restoration’ is a clearly defined managementobjective in an MPA, this indicator is a directmeasurement of the extent to which this aim isbeing achieved.
The indicator is used to determine and highlightwhether or not a ‘restoration’ objective for an MPAhas been fully achieved. Partial achievement of a
104
BIOPHYSICAL INDICATOR Area showing signs of recovery
GOAL 1
1C 1E
1F
GOAL 2
2A 2B
GOAL 3
3A 3B
GOAL 4
4A 4B
GOAL 5
5A 5B
5C 5D
5E
Relates togoals andobjectives
Note that while both aerialindicators (B9 and B10) may becollecting similar types ofinformation as those data collected
under the enforcement-related governanceindicators (G13 to G16), the distinction is thathere the data collected are used to addressquestions relating to biophysical aims, as opposedto compliance ones.
Requirements
� Same requirements as those listed underB1 to B6, particularly B4 and B5.
� An accurate basemap of the project area,MPA delineation, and habitat types.
� A hand-held GPS unit is needed todelineate areas.
� Clearly defined, measurable definition of‘recovery’.
B9
1
3Dif
ficu
lty Rating
1–5
105
B9
Strengths and limitations
With a clearly defined ‘restoration’ target andsupporting data (from B1 through B6) available foruse, this indicator can be a relatively simple meas-ure to attempt and done with low incrementalinvestment in terms of time and labour.
However, the setting of ‘recovery milestones’ andsustainable population levels is challenging scien-tifically, and often poorly understood or document-ed. As a result, the reliability of results generatedfrom this indicator may be questionable in termsof measuring population recovery thresholds.
defined and measurable restoration objective maybe laudable progress overall, but this incompletesuccess will be reflected clearly within the indic-tor’s measurement.
How to collect the data
To document the recovery of fish or mobile inver-tebrate focal populations, a visual census should beused to estimate and document the threshold levelof population recovery (as a percentage change inpopulation size and structure). Such recoverythresholds may likely have little grounding inscientific literature or fisheries biology, but for thepurposes of the indicator they must serve as a ‘bestguess’ that can be adjusted and refined. For areas(km2) that are closed and fully-protected to allowrecovery of focal fish and invertebrate populations,their recovery in the closed area can be sensiblyexpressed as the proportion of the overall popula-tion in which the local sub-populations haveexceeded the assumed (designated) recoverythresholds.
On the other hand, within an area not fully closedbut under restoration, it is the proportion of thatarea, or the proportion of sample stations in thearea, that have exceeded a ‘recovery milestone’.The ‘recovery milestone’ is defined as the exceed-ing of a known reference point for:
❏ focal species abundance and population struc-ture (B1 and B2),
❏ community composition and structure (B4),
❏ habitat distribution and complexity (B3),
❏ food web integrity (B6), and
❏ recruitment success (B5).
These indicators could be derived based on afrequency analysis of areas exceeding the recoverymilestone or threshold at a large enough numberof samples in the designated area (within and out-side the MPA). A stratified or randomized sampleof observation stations would be made throughoutthe designated area at which ratings or estimatesof these indicators would be captured throughtime. Therefore, the extent of area restored couldbe expressed not only in terms of area (km2), butalso as the proportion (%) of stations at which the
observed index exceeds a pre-defined level (e.g.recovery milestone).
Samples for this indicator could be measuredbetween every two to five years throughout obser-vation stations across the project area. In order tosample an adequate number of stations withinlarger MPAs, this may require investment of moretime.
How to analyse and interpret results
Disseminate results of the proportion or ‘recoverymilestone’ frequency within the total project areaand quantify the total area restored (km2). Keep inmind that such discrete measurements (number ofrecoveries, total area) are effective and popularcommunication tools with stakeholder, public,decision-making, and donor audiences.
In some respects, this indicator canbe thought of as an embodiment orfilter of other relevant biophysicalindicators, most notably B1 to B6. As
such, data collected under these other indicatorsmay be useful in making a ‘case’ toward anarticulated level of ‘recovery’.
Outputs
� Total project area (km2) restored fully(100%) versus partially (as % of changein structure, biomass, density/abundance, or total cover).
� Estimated proportion (% change in popu-lation density, structure, or biomass) ofrecovery within focal species populationagainst specified target.
� Estimated frequency with which‘recovery milestones’ are met across focalspecies populations within the commu-nity.
BIO
PHYSIC
AL
IND
ICATO
R9
Are
a s
ho
win
g s
ign
s o
f reco
very
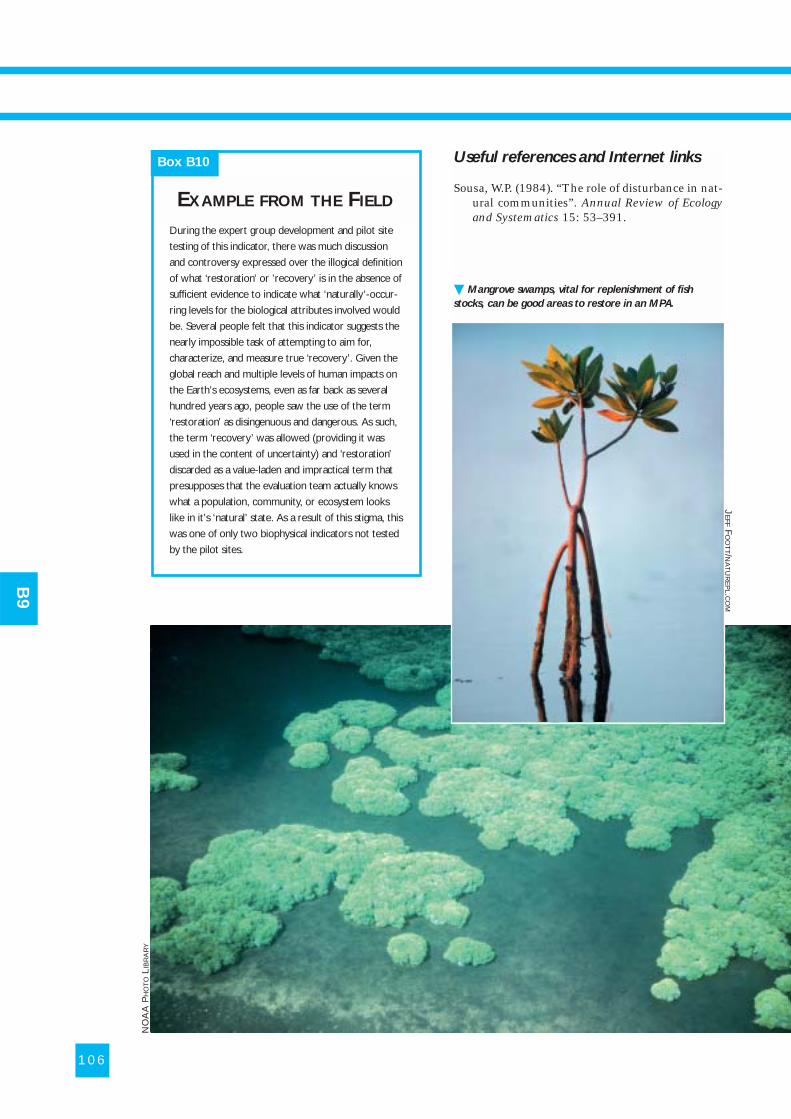
Useful references and Internet links
Sousa, W.P. (1984). “The role of disturbance in nat-ural communities”. Annual Review of Ecologyand Systematics 15: 53–391.
106
B9
During the expert group development and pilot site
testing of this indicator, there was much discussion
and controversy expressed over the illogical definition
of what ‘restoration’ or ’recovery’ is in the absence of
sufficient evidence to indicate what ‘naturally’-occur-
ring levels for the biological attributes involved would
be. Several people felt that this indicator suggests the
nearly impossible task of attempting to aim for,
characterize, and measure true ‘recovery’. Given the
global reach and multiple levels of human impacts on
the Earth’s ecosystems, even as far back as several
hundred years ago, people saw the use of the term
‘restoration’ as disingenuous and dangerous. As such,
the term ‘recovery’ was allowed (providing it was
used in the content of uncertainty) and ‘restoration’
discarded as a value-laden and impractical term that
presupposes that the evaluation team actually knows
what a population, community, or ecosystem looks
like in it’s ‘natural’ state. As a result of this stigma, this
was one of only two biophysical indicators not tested
by the pilot sites.
� Mangrove swamps, vital for replenishment of fish
stocks, can be good areas to restore in an MPA.
EXAMPLE FROM THE FIELD
Box B10
JE
FFF
OO
TT/N
AT
UR
EP
L.CO
M
NO
AA
PH
OT
OLI
BR
AR
Y
107
What is ‘human impact’?
Human impact is defined as the cumulative envi-ronmental effect of all extractive and non-extrac-tive uses of living and non-living marine resourceslocated within a specified area (in this case, withinand outside the MPA). Examples of extractive andnon-extractive human uses within coastal watersinclude fishing, tourism, aquaculture, coastaldevelopment, seabed drilling and mining, trans-portation, and trade. Varying levels of human useof marine resources can result in varying levels ofimpact. For example, the type and number of cer-tain fishing gears (such as bottom trawls, purseseines, and gill nets) are known to have signifi-cantly higher impacts on ecosystems than others(such as pole and line and cast nets). Some extrac-tive uses (such as dynamite fishing) are well docu-mented as having highly destructive impacts asso-ciated with them.
An area under no impact is defined as one that iscompletely free of all extractive or non-extractivehuman uses that contribute impact. Not all MPAsinclude such areas. These areas are commonlyreferred to as ‘reserves’ or ‘fully-protected areas’,and are often delineated as distinct, ‘no-take’ zoneswithin a larger MPA. Some ‘no-take’ zones aretime bound; for example, the seasonal prohibitionof access within known spawning grounds of afocal species. One frequent exception to the prohi-bition of all human activity within ‘no-take’ zonesis the allowance of MPA monitoring and scientificresearch activities.
Note that areas under ‘no’ human impact areassumed to experience broadcast impacts ofhuman activities that occur outside the MPA,such as a rise in sea surface temperature con-tributed by global warming effects. The focuson ‘no’ impact under this indicator is specificto human activities within the MPA.
Why measure it?
Reducing the level of human impact experiencedin an area of waters is a common aim of MPAs. Itis assumed that if an MPA experiences reduced orno human impact, the focal species, habitats, andcommunities therein have a greater probability ofbeing able to replenish and maintain themselvesthrough time than ones outside the MPA that areexperiencing a higher level of human impact. It isalso assumed that the greater the level of restric-tion on extractive uses within an MPA, the lesstotal human impact will occur.
Measuring the scale and pattern of human usesthrough time and their cumulative effect is there-
fore needed to test and legitimise these assump-tions. Understanding the level of and changes tohuman use within and outside the MPA can alsohelp managers to identify and proactively addressthreats (i.e. natural or human activities that do orcould negatively contribute to the overall impactexperienced in the area).
Note that simply having an area declared freefrom human use does not necessarily meanthat the area is effectively free from suchactivity.
How to collect the data
This indicator is measured by: a) characterizingthe presence, level, and impact of various humanactivities and threats through time; and b) quanti-fying the total area under no or reduced humanimpact, as the result of the degree of compliancewith prohibitions or restrictions on user activity.
At the simplest level, a qualitative characterizationof the presence, level, and impact of human activ-
BIOPHYSICAL INDICATOR Area under no or reduced human impact
GOAL 1
1C 1D
1E
GOAL 2
2A 2D
2E
GOAL 3
3C
GOAL 4
4C
GOAL 5
5D
Relates togoals andobjectives
B1
0
Requirements
� Clipboard, paper, and pencil.
� A map of the delineated MPA bound-aries (and fully-protected zones, if appli-cable) and the surrounding waters/area.
� The desired degree to which humanactivities and threats are to be reducedor eliminated within the MPA. Such atarget may be able to be derived based onthe MPA’s goals and objectives. In othercases it may require careful thought bythe management team with regard to set-ting measurable impact reduction targetsannually and incrementally through time.
� Knowledge of the types of extractive andnon-extractive activities and technolo-gies being used within and around theMPA, including threats.
� Stakeholders who are willing to openlyshare their observations, experiences,and beliefs about human activities andthreats.
� Literature and other data sources on thescale and impacts of human activitiesand threats.
� Advanced: a handheld GPS unit; a boatand engine.
11
3Dif
ficu
lty Rating
1–5
ities and threats (both upland and coastal) shouldbe done through manager interview (with support-ing evidence regarding enforcement and compli-ance) and stakeholder triangulation. Key inform-ant interviews with MPA staff and across stake-holder groups can help to initially identify andcharacterize the presence and number of humanuses (both extractive and non-extractive), andwhich of these are or should be considered threatsto the MPA (i.e. activities that are leading or couldlead to increased negative impacts within the area).
The next step is to assess and describe all threatsfound to be operating in and around the MPA.Specifically, for each threat identified, the level ofits impact using the following three parametersneeds to be described: a) the intensity of the threat(i.e. level of operation and degree of overall humaneffort involved), b) the extent of the threat (i.e. thetotal area across which the threat is distributedand active), and c) the urgency of the threat (i.e.the frequency, timing, and acuteness of the threat).These three threat parameters should be quantita-tively assessed along with their descriptions; forexample, the number of users or boats per threatper harvest unit, the frequency of activities, andthe spatial extent (expressed in km2) of the totalarea in which threats are observed. Data for theseparameters can be collected through structuredand semi-structured interviews and focus groupdiscussions of MPA management staff and stake-holder groups. Supplemental information can betaken from secondary data sources and/or directobservation of user activities, levels, and impacts.For example, the intensity (number of fishers), area(in km2), and urgency (trends in frequency of activ-ity) of a particularly threatening extractive activity(such as dynamite fishing) could be collectedthrough harvester interview, and supplementedwith existing studies and survey results from directobservations (such as the number of times blastsare heard in a day).
Characterization of human activities and trendscan also be described in terms of: a) the types andnumbers of extractive gears and technologies thatare used, particularly with regard to the extractiveefficiency of such technologies and their destruc-tive effects, and b) changes in the power of extrac-tive and non-extractive effort, particularly in termsof the number of fishers, number of boats, numberof gears, etc.
During the baseline characterization inside andoutside the MPA, the nature and level of physical,chemical, biological, and other environmentaleffects that are known to occur as a result ofextractive and non-extractive uses should be docu-mented. The uses that are known to have deleteri-ous impacts on species, habitats, and communityecology should be highlighted. The threats (both
human induced and natural) may already be iden-tified and previously prioritized for managementaction (such as with the designation of the MPA)with the aim of eliminating or minimizing thesethreats over time.
An estimation of the physical location (placement)and extent (area) of threats and other human activ-ities observed within and around the MPA shouldalso be made as part of the characterization.
In terms of collection of data on the extent ofdestructive fishing methods used within the man-aged area, it is important to estimate the total areaknown where such technologies are used.Additionally, the percentage of area (km2) withinthe MPA where destructive fishing technologiesand other fishing techniques are prohibited shouldbe calculated. Destructive technologies include theuse of poisons (e.g. potassium and sodium cyanide,bleach, plant toxins), dynamite, bottom trawling,physical destruction with tools etc., and fine meshnets for extraction.
A much more in-depth, time consuming, andaccurate method of characterizing the presence,level, and impact of human activities is to directlyobserve all human activities operating in the areain and around the MPA, measuring the threeparameters of user behaviour and impacts men-tioned above through in situ survey. In addition tothis, additional impact data about threats andother human activities can be further characterizedthrough the measurement of other biophysicalindicators, particularly B1 to B7. In addition to aqualitative discussion of impacts, the results ofthese indicators can provide supporting evidenceas to the nature and extent of environmentalimpacts associated with the human uses operatingwithin the area surveyed.
B10 is not a ‘true’ biophysical indicator in thatit does not assess biotic or abiotic states,trends, or outputs. Rather it is a contextualindicator that assesses activities known toimpact biophysical conditions. However,results collected from the measurement ofindicators B1 to B7 can be used to provide sup-plementary evidence to data collected on B10.
Quantification of the total area under no orreduced human impact requires six steps. First, thetotal area (in km2) bounded by the MPA throughthe use of previously delineated boundaries on abasemap or the in situ collection of GPS data fromwhich to quantify the total area should be calcu-lated. Second, the total area (in km2) of all loca-tions within the MPA that have been designated as‘no-take’ or ‘fully-protected’ zones (i.e. areas freefrom all human activity) must be gauged. If theentire area within an MPA is fully protected, the
108
B1
0
totals will be the same. If an MPA does not containany areas zoned for no human activity, the totalwill be zero. Note that both of these areas mayalready have been delineated and calculated withinexisting documentation, such as in the MPA man-agement plan and/or accompanying legislation. Inthis case, it still may be useful to validate thesetotals through in situ GPS delineation.
Third, it is necessary to subtract the area designat-ed to be free from human activity from the totalMPA area to determine the area within the MPAthat has not been designated to be free from humanactivity. These totals should then be converted intopercentages, and the three areas and percentagesshould be recorded in an annotated table. Fourth,the results of the human activity characterizationand the spatial estimates of the extent (km2) ofthreats operating in the MPA (taken from the threatreduction assessment – TRA) should be revisited.Using these results, it should be possible to esti-mate the total area in the MPA that is not actuallyfree from human activity. If the characterizationresults and TRA suggest that human activities maybe underway in areas designated as ‘fully protected’or ‘no-take’, an attempt should be made to estimatehow much of this designated area is actually beingviolated versus that being respected (in km2 and asa percentage).
Fifth, for each human use occurring in the MPA,the total area (km2) of the MPA that was designat-ed for reduction should be estimated, defined byhow each human use (or groups of uses) are to bemeasurably reduced within the MPA. In somecases, a human use will have been designated to bereduced throughout the entire area of the MPA. Inother cases, this reduction will have been desig-nated to occur only in a specific habitat type orzone. Finally, for each human use, the results ofthe human activity characterization and TRAindex should be reviewed and an estimate carriedout of how much (in km2 and as a percentage) ofthe area is actually under reduction compared tohow it was originally designated for reduction.
Answering the following questions about the des-ignated versus actual area under no or reducedhuman impact may be of interest to the evaluationteam during its investigation: 1) how was the spe-cific delineation of the no-take area defined? Was itdemarcated on the basis of biological parametersor political convenience? 2) How effective is fishercompliance with the no-take area? Are there anyreported/confirmed (or unreported/unconfirmed)violations of extractive activities taking place inthe area? 3) What forms of surveillance andenforcement are being conducted in the area? Howcertain are those who police/enforce the area thatthe area truly is being observed as ‘no-take’ zone?Manager and stakeholder responses to such
questions will assist the evaluation team in deter-mining the degree to which the designated areasunder no or reduced human impact are being effec-tively managed, and the degree to which violations(if any) are occurring in the area (see relevantgovernance indicators).
Data on human activities as well as natural andman-made threats should be collected twice a yearor annually, including all information needed todemarcate the area(s) where they are operating,depending on how active and changing they are.Threat reduction data should be collected twice ayear. Calculations of the total area under no orreduced human impact should be made every year,unless needed sooner (for example, if new threatsarise or if changes to the existing boundaries aremade during the year).
Note that the synergistic and dynamic effectsamong and between threats are not capturedunder the methods outlined here. As a result,observed feedback loops and synergistic impactsresulting from threats operating on one anothershould be documented qualitatively.
How to analyse and interpret results
Theoretically (and ideally in practice), if an MPA issuccessful in reducing human threats – orprohibiting them altogether – then the actual areaunder no or reduced human impact should equalthe area designated as such. In viewing the calcu-lated area results, how closely do designated (onpaper) areas of no and reduced human usecompare to actual (in reality) areas of no or reducedhuman use? Do real-world observations reflect thereduction or prohibition of human activities that,on paper, are supposed to be occurring? How areextractive technology and power (effort) changingthrough time? Have all human activities haltedwithin fully protected areas? To what degree havehuman activities and impact been reduced indesignated areas, across each activity?
One way to analyse an estimated degree and areaof human impact reduction using data collected forthis indictor is through the threat reductionassessment (TRA) index (reference guides on howto use the TRA index are listed at the end of this
109
B1
0
BIO
PHYSIC
AL
IND
ICATO
R10
Are
a u
nd
er n
o o
r red
uced
hu
man
imp
act
Data collected under this indicatorare closely associated with severalother socio-economic (local usepatterns and occupational structure)
and governance (user conflicts, understanding ofrules and regulations, and enforcement)indicators, and should be conducted accordingly.The distinction on B10 is that data collected areused to evaluate biophysical aims of the MPA.
indicator description). Working with managementteam and stakeholder representatives, the relativeprogress to date made in abating each threat iden-tified can be estimated as the percentage of totalthreat reduction in comparison to total threatpotential. While subjective, the TRA is undertakenso that meaningful comparisons can be madeacross different areas as to the degree with whichhuman use impacts have been mitigated over aperiod of time. The logic behind the TRA is that ifthe management team can identify the threats fac-ing their MPA and its surrounding waters, thenthey can also assess their progress through time inachieving no or reduced human impact throughmeasuring the degree to which each of thesethreats is reduced. Threats can also be visually dia-grammed and discussion can take place as to howthey conceptually relate to one another throughcausal relationships. Compare threat reductionscores across all identified threats annually orevery two years. Based on the spatial extent of howhuman activities and threats are operating withinand outside the MPA, are there any observabletrends (increases or decreases) in the area withrespect to the level and scale of these activities andthreats? Are key threats and destructive humanactivities being halted successfully through timewithin the MPA? Are rates of threat reduction ofspecific activities steady or changing?
As there is increasing international attentionand promotion in using fully-protected MPAs(reserves), results generated from such areaswill be of interest to many managers andstakeholders beyond your MPA site.
Results from this indicator will be of most rele-vance and use when linked with other biophysicalassessment results, and when describing the histo-ry and contextual background of threats operatingat the MPA site. Pair results of other biophysicalindicators with results in human impact reduc-tion, do any relationships appear? Are results with-in areas free from all human activity significantlydifferent from results in other reduced but multi-ple human use areas of the MPA? For example, arechanges observed in the same focal species’ abun-dance in the MPA and within relatively adjacentareas significantly different between reserve andnon-reserve waters within the MPA? Throughtime, is a greater or reduced percentage of totalMPA area found under full protection? Finally, isthere an optimum percentage (20%, 50%) ofreserve versus non-reserve waters found withinmultiple-zone MPAs being achieved through time?If so, on what grounds (why) can this be argued?
Disseminate summary results of threats profiledand changes observed in threats with variousstakeholders, managers, and decision-makers. Asdata collected on this indicator can be conducted
in tandem with governance indicators (e.g. surveil-lance and enforcement, number of violations),interpretation of how effectively the area of no orreduced human impact is being policed byenforcers and complied with by fishers may also beof interest to target audiences of results.
Strengths and limitations
This indicator may prove to be useful as a rapid,qualitative assessment tool to guage how thebiophysical environment, or specific attributes,within and outside the MPA may be being impact-ed by human activity and experiencing change.However, due to the highly subjective nature of themethods involved (being based in large part onmanager and stakeholder perceptions), this indica-tor should only be measured in conjunction withother biophysical indicators, as the results generat-ed from this indicator cannot be consideredaccurate on their own or viewed as stand-alone
110
B1
0
Outputs
� A descriptive and quantitative character-ization of the human activities andthreats (both natural and human)present in and around the MPA.
� Total area of the MPA.
� Total area (and percentage) of the MPAdesignated as being under no humanactivity.
� Total area (and percentage) of the MPAactually under no human activity.
� Total area (and percentage) of the MPAdesignated as under reduced humanactivity.
� Total area (and percentage) of the MPAactually under reduced human activity.
� GPS coordinates for these areas.
� Threat assessment profile andprioritization.
� Threat reduction index (score of1–100%).
� Map of threat activity within andoutside the MPA; areas of destructivefishing technology use.
� Map of the boundaries of the MPA at thesite and the reserve area(s) within oroverlapping with it.
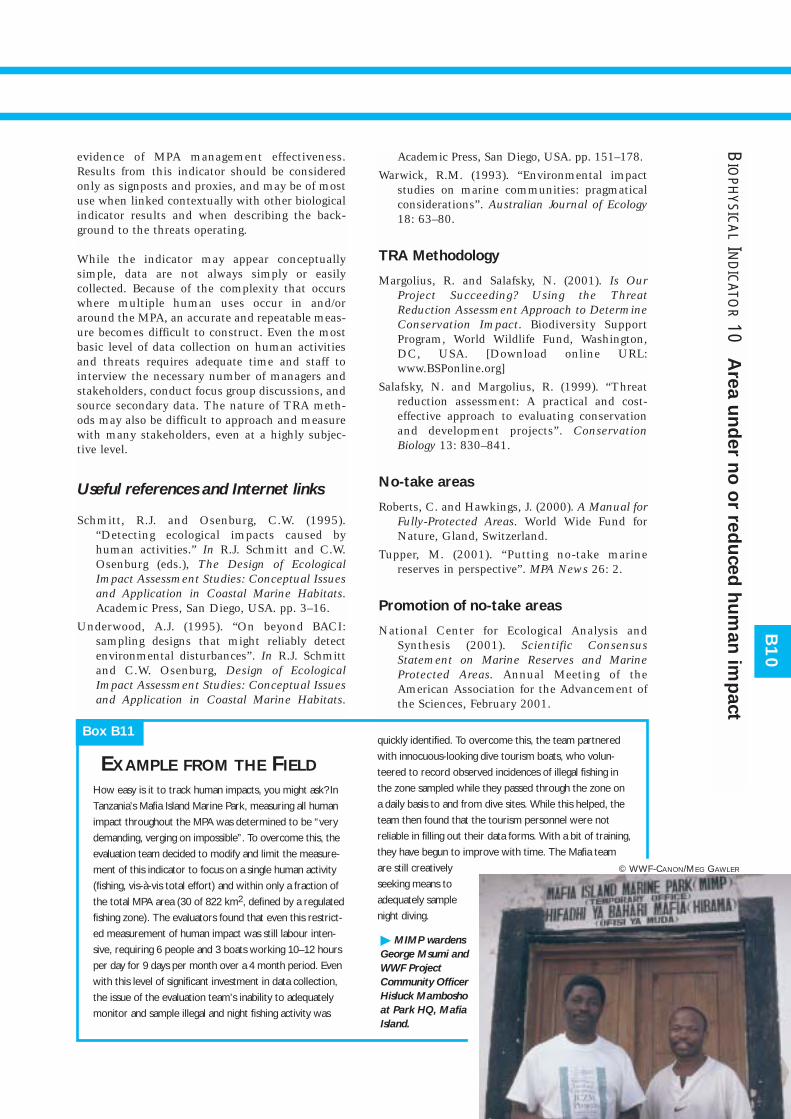
evidence of MPA management effectiveness.Results from this indicator should be consideredonly as signposts and proxies, and may be of mostuse when linked contextually with other biologicalindicator results and when describing the back-ground to the threats operating.
While the indicator may appear conceptuallysimple, data are not always simply or easilycollected. Because of the complexity that occurswhere multiple human uses occur in and/oraround the MPA, an accurate and repeatable meas-ure becomes difficult to construct. Even the mostbasic level of data collection on human activitiesand threats requires adequate time and staff tointerview the necessary number of managers andstakeholders, conduct focus group discussions, andsource secondary data. The nature of TRA meth-ods may also be difficult to approach and measurewith many stakeholders, even at a highly subjec-tive level.
Useful references and Internet links
Schmitt, R.J. and Osenburg, C.W. (1995).“Detecting ecological impacts caused byhuman activities.” In R.J. Schmitt and C.W.Osenburg (eds.), The Design of EcologicalImpact Assessment Studies: Conceptual Issuesand Application in Coastal Marine Habitats.Academic Press, San Diego, USA. pp. 3–16.
Underwood, A.J. (1995). “On beyond BACI:sampling designs that might reliably detectenvironmental disturbances”. In R.J. Schmittand C.W. Osenburg, Design of EcologicalImpact Assessment Studies: Conceptual Issuesand Application in Coastal Marine Habitats.
Academic Press, San Diego, USA. pp. 151–178.
Warwick, R.M. (1993). “Environmental impactstudies on marine communities: pragmaticalconsiderations”. Australian Journal of Ecology18: 63–80.
TRA Methodology
Margolius, R. and Salafsky, N. (2001). Is OurProject Succeeding? Using the ThreatReduction Assessment Approach to DetermineConservation Impact. Biodiversity SupportProgram, World Wildlife Fund, Washington,DC, USA. [Download online URL:www.BSPonline.org]
Salafsky, N. and Margolius, R. (1999). “Threatreduction assessment: A practical and cost-effective approach to evaluating conservationand development projects”. ConservationBiology 13: 830–841.
No-take areas
Roberts, C. and Hawkings, J. (2000). A Manual forFully-Protected Areas. World Wide Fund forNature, Gland, Switzerland.
Tupper, M. (2001). “Putting no-take marinereserves in perspective”. MPA News 26: 2.
Promotion of no-take areas
National Center for Ecological Analysis andSynthesis (2001). Scientific ConsensusStatement on Marine Reserves and MarineProtected Areas. Annual Meeting of theAmerican Association for the Advancement ofthe Sciences, February 2001.
B1
0
BIO
PHYSIC
AL
IND
ICATO
R10
Are
a u
nd
er n
o o
r red
uced
hu
man
imp
act
2
How easy is it to track human impacts, you might ask? In
Tanzania’s Mafia Island Marine Park, measuring all human
impact throughout the MPA was determined to be “very
demanding, verging on impossible”. To overcome this, the
evaluation team decided to modify and limit the measure-
ment of this indicator to focus on a single human activity
(fishing, vis-à-vis total effort) and within only a fraction of
the total MPA area (30 of 822 km2, defined by a regulated
fishing zone). The evaluators found that even this restrict-
ed measurement of human impact was still labour inten-
sive, requiring 6 people and 3 boats working 10–12 hours
per day for 9 days per month over a 4 month period. Even
with this level of significant investment in data collection,
the issue of the evaluation team’s inability to adequately
monitor and sample illegal and night fishing activity was
quickly identified. To overcome this, the team partnered
with innocuous-looking dive tourism boats, who volun-
teered to record observed incidences of illegal fishing in
the zone sampled while they passed through the zone on
a daily basis to and from dive sites. While this helped, the
team then found that the tourism personnel were not
reliable in filling out their data forms. With a bit of training,
they have begun to improve with time. The Mafia team
are still creatively
seeking means to
adequately sample
night diving.
Box B11
EXAMPLE FROM THE FIELD
� MIMP wardens
George Msumi and
WWF Project
Community Officer
Hisluck Mambosho
at Park HQ, Mafia
Island.
© WWF-CANON/MEG GAWLER

In and around most MPAs, locally caught fish find a ready market with buyers and so provide
valuable income to local people – the focus of the socio-economic indicators presented in this book.
© W
WF-
CA
NO
N/E
DW
AR
DPA
RK
ER
113
tor but it was felt that the methods for collectingsuch information were beyond the capability ofmost MPAs. However, several of the indicators canbe used to measure components of total economicvalue such as use and non-use values of the MPA.These include indicators S6 (perceptions of non-market and non-use value), S7 (material style oflife), S8 (quality of human health), S9 (householdincome distribution by source), S10 (occupationalstructure), S11 (community infrastructure andbusiness), and S12 (number and nature ofmarkets). While not direct measures of totaleconomic value, used together, these indicatorscan provide information on benefits and costsassociated with the MPA and can adaptivelyinform MPA managers in their planning andmanagement decision-making.
Collectively, coastal and marine ecosystems pro-vide food, building materials, firewood, recreation-al opportunities, protection and buffering fromcoastal hazards, economic development opportuni-ties, and important life support functions.Valuation of MPAs and their associated naturalresources necessitates the estimation of benefitsand costs of using the natural assets. The totaleconomic value of a natural system is the sum ofall net benefits from all compatible uses, includingnon-use values. Conceptually, it is the amount ofresources, expressed in common units of money,by which society would be worse off if the naturalresource or environmental amenity were lost. Itconsists of 1) use value and 2) non-use value. Usevalues include direct use (fishing, diving), indirectuse (coastal hazard protection), and option value(potential future direct and indirect use of anatural system). Non-use values represent valuesthat are not associated with any use and includeexistence value (the value of knowing that theresource exists in a certain condition), option value(the value of being able to use the resource in thefuture) and bequest value (the value of ensuringthe resource will be available for future genera-tions).
It should be noted that indicator S6 – perceptionsof non-market and non-use value – suggests theuse of scale analysis rather than more advancednon-market and non-use economic valuationmethods. This is due to the complexity of usingthese methods and the need for advanced economicanalysis skills which are usually not found amongMPA staff.
Introduction
Experience shows that social, cultural, economicand political factors, more than biological or phys-ical factors, shape the development, managementand performance of MPAs (Fiske, 1992; Kelleherand Recchia, 1998; Mascia, 2002; Roberts, 2000).MPAs affect and are affected by people. For thisreason, the goals and objectives of many MPAsinclude socio-economic considerations such asfood security, livelihood opportunities, monetaryand non-monetary benefits, equitable distributionof benefits, compatibility with local culture, andenvironmental awareness and knowledge. Under-standing the socio-economic context of stakehold-ers involved with and/or influenced by the MPA(individuals, households, groups, communities,organizations) is essential for assessing, predictingand managing MPAs. The use of socio-economicindicators allows MPA managers to: a) incorporateand monitor stakeholder group concerns and inter-ests into the management process; b) determinethe impacts of management decisions on thestakeholders; and c) demonstrate the value of theMPA to the public and decision-makers.
The socio-economic indicators in this guidebookaddress the overall value of the MPA, in addition tobeing focused on the achievement of social andeconomic goals and objectives. Several of the indi-cators, such as S4, S5 and S6, measure people’sperceptions. People’s perceptions are known tohave an impact on conservation, so while themeasurement of perceptions may be imprecise,their use can be of real value to the MPA manager.Several of the indicators, such as S2, S3, S13, relyon interviewing household members and fishers.Interviews provide access to a wealth of valuableinformation relating to such issues as naturalhistory, resource use and income. With this oppor-tunity in mind, and recognising how busy house-hold members and fishers are, if interviews are tobe conducted, questions from several selectedindicators should be collected at the same time tocapture overlapping information needs moreefficiently. Indicators S2, S3, S13 and S14 areconcerned with aspects of understanding people’svalues and understanding marine resources at thebroader community level.
It should be noted that there is no one indicatorwhich captures the total economic value of theMPA. Consideration was given to such an indica-
The socio-economic indicators
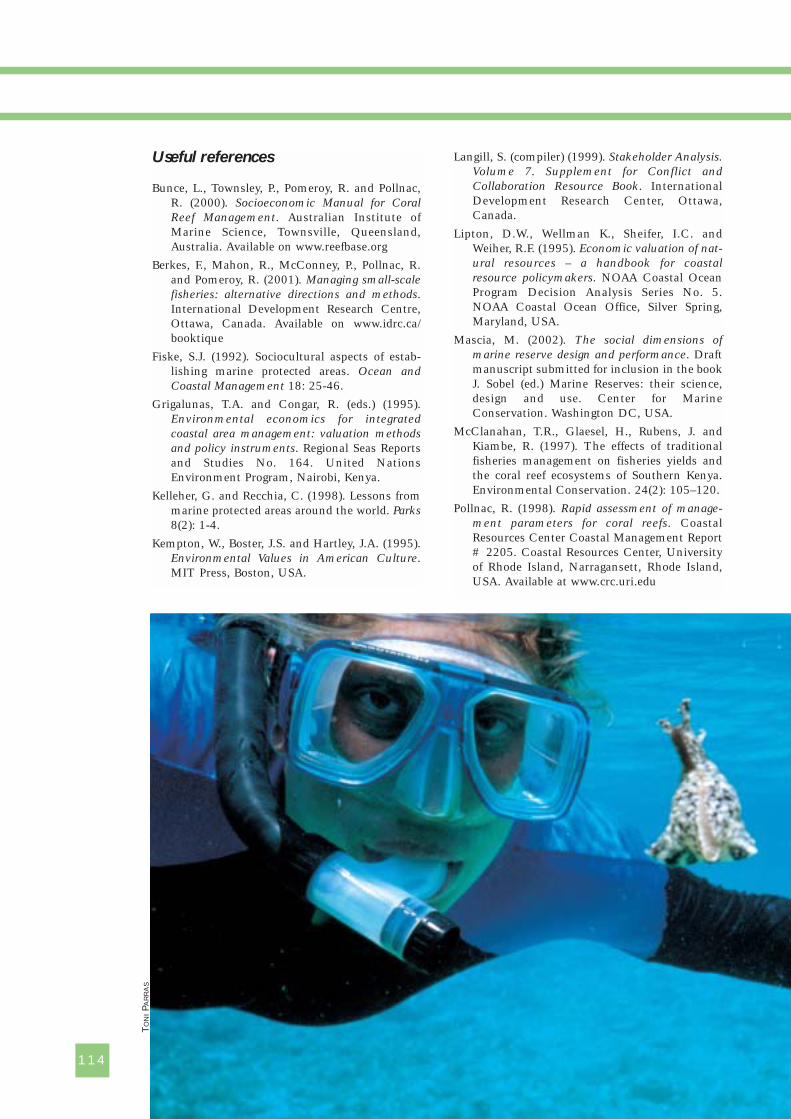
Useful references
Bunce, L., Townsley, P., Pomeroy, R. and Pollnac,R. (2000). Socioeconomic Manual for CoralReef Management. Australian Institute ofMarine Science, Townsville, Queensland,Australia. Available on www.reefbase.org
Berkes, F., Mahon, R., McConney, P., Pollnac, R.and Pomeroy, R. (2001). Managing small-scalefisheries: alternative directions and methods.International Development Research Centre,Ottawa, Canada. Available on www.idrc.ca/booktique
Fiske, S.J. (1992). Sociocultural aspects of estab-lishing marine protected areas. Ocean andCoastal Management 18: 25-46.
Grigalunas, T.A. and Congar, R. (eds.) (1995).Environmental economics for integratedcoastal area management: valuation methodsand policy instruments. Regional Seas Reportsand Studies No. 164. United NationsEnvironment Program, Nairobi, Kenya.
Kelleher, G. and Recchia, C. (1998). Lessons frommarine protected areas around the world. Parks8(2): 1-4.
Kempton, W., Boster, J.S. and Hartley, J.A. (1995).Environmental Values in American Culture.MIT Press, Boston, USA.
Langill, S. (compiler) (1999). Stakeholder Analysis.Volume 7. Supplement for Conflict andCollaboration Resource Book. InternationalDevelopment Research Center, Ottawa,Canada.
Lipton, D.W., Wellman K., Sheifer, I.C. andWeiher, R.F. (1995). Economic valuation of nat-ural resources – a handbook for coastalresource policymakers. NOAA Coastal OceanProgram Decision Analysis Series No. 5.NOAA Coastal Ocean Office, Silver Spring,Maryland, USA.
Mascia, M. (2002). The social dimensions ofmarine reserve design and performance. Draftmanuscript submitted for inclusion in the bookJ. Sobel (ed.) Marine Reserves: their science,design and use. Center for MarineConservation. Washington DC, USA.
McClanahan, T.R., Glaesel, H., Rubens, J. andKiambe, R. (1997). The effects of traditionalfisheries management on fisheries yields andthe coral reef ecosystems of Southern Kenya.Environmental Conservation. 24(2): 105–120.
Pollnac, R. (1998). Rapid assessment of manage-ment parameters for coral reefs. CoastalResources Center Coastal Management Report# 2205. Coastal Resources Center, Universityof Rhode Island, Narragansett, Rhode Island,USA. Available at www.crc.uri.edu
114
TO
NIPA
RR
AS
115
Pollnac, R.B. and Crawford, B.R. (2000). Assessingbehavioral aspects of coastal resource use.Proyek Pesisir Publication Special Report.Coastal Resources Center, CoastalManagement Report #2226. Coastal ResourcesCenter, University of Rhode Island,Narragansett, Rhode Island, USA. Available atwww.crc.uri.edu
Pomeroy, R.S. Economic valuation: availablemethods. In Chua, T.-E. and Scrua, L.F. (eds.)(1992). Integrative framework and methods forcoastal area management. ICLARM Conf.Proc. 37. International Center for LivingAquatic Resources Management, Manila,Philippines.
Pomeroy, R., Pollnac, R., Katon, B. and Predo, C.(1997). Evaluating factors contributing to thesuccess of community-based coastal resourcemanagement: The Central Visayas RegionalProject 1, Philippines. Ocean and CoastalManagement 36 (1–3): 97–120.
Roberts, C.M. (2000). Selecting marine reservelocations: optimality versus opportunism.Bulletin of Marine Science 66(3): 581–592.
Th
e s
ocio
-eco
no
mic
ind
icato
rs
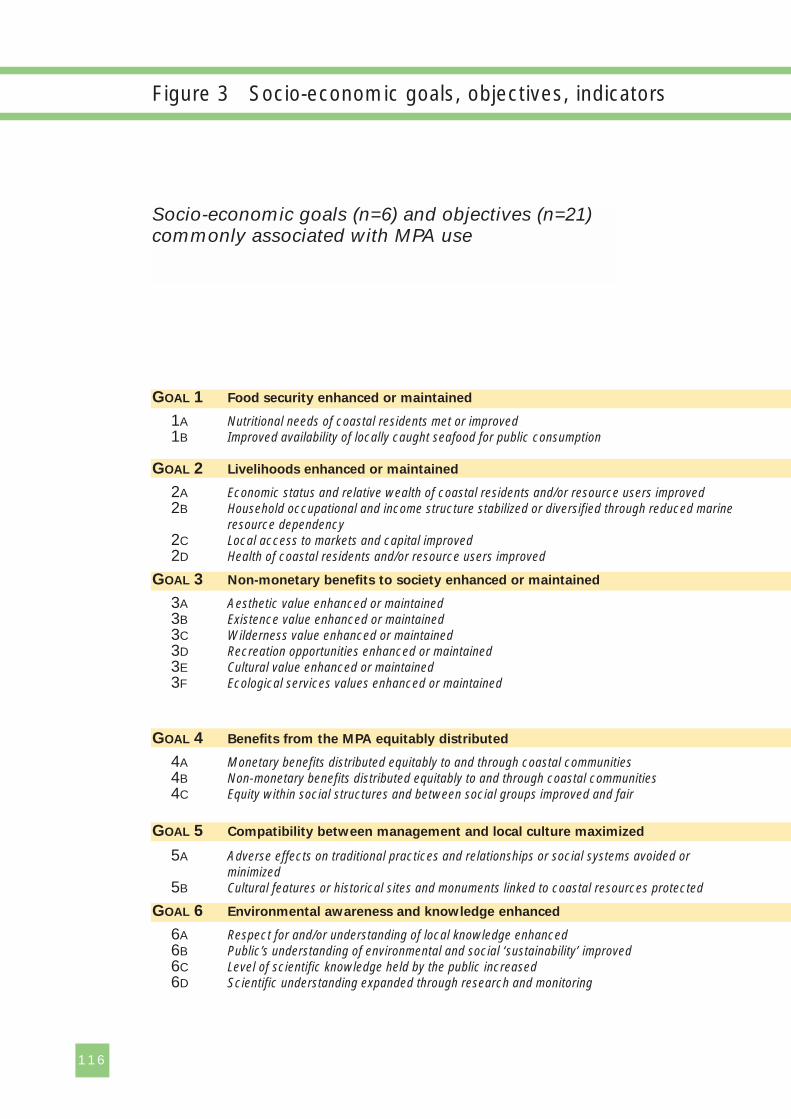
116
Figure 3 Socio-economic goals, objectives, indicators
Socio-economic goals (n=6) and objectives (n=21) commonly associated with MPA use
GOAL 1 Food security enhanced or maintained
1A Nutritional needs of coastal residents met or improved1B Improved availability of locally caught seafood for public consumption
GOAL 2 Livelihoods enhanced or maintained
2A Economic status and relative wealth of coastal residents and/or resource users improved2B Household occupational and income structure stabilized or diversified through reduced marine
resource dependency2C Local access to markets and capital improved2D Health of coastal residents and/or resource users improved
GOAL 3 Non-monetary benefits to society enhanced or maintained
3A Aesthetic value enhanced or maintained3B Existence value enhanced or maintained3C Wilderness value enhanced or maintained3D Recreation opportunities enhanced or maintained3E Cultural value enhanced or maintained3F Ecological services values enhanced or maintained
GOAL 4 Benefits from the MPA equitably distributed
4A Monetary benefits distributed equitably to and through coastal communities4B Non-monetary benefits distributed equitably to and through coastal communities4C Equity within social structures and between social groups improved and fair
GOAL 5 Compatibility between management and local culture maximized
5A Adverse effects on traditional practices and relationships or social systems avoided orminimized
5B Cultural features or historical sites and monuments linked to coastal resources protected
GOAL 6 Environmental awareness and knowledge enhanced
6A Respect for and/or understanding of local knowledge enhanced6B Public’s understanding of environmental and social ‘sustainability’ improved6C Level of scientific knowledge held by the public increased6D Scientific understanding expanded through research and monitoring
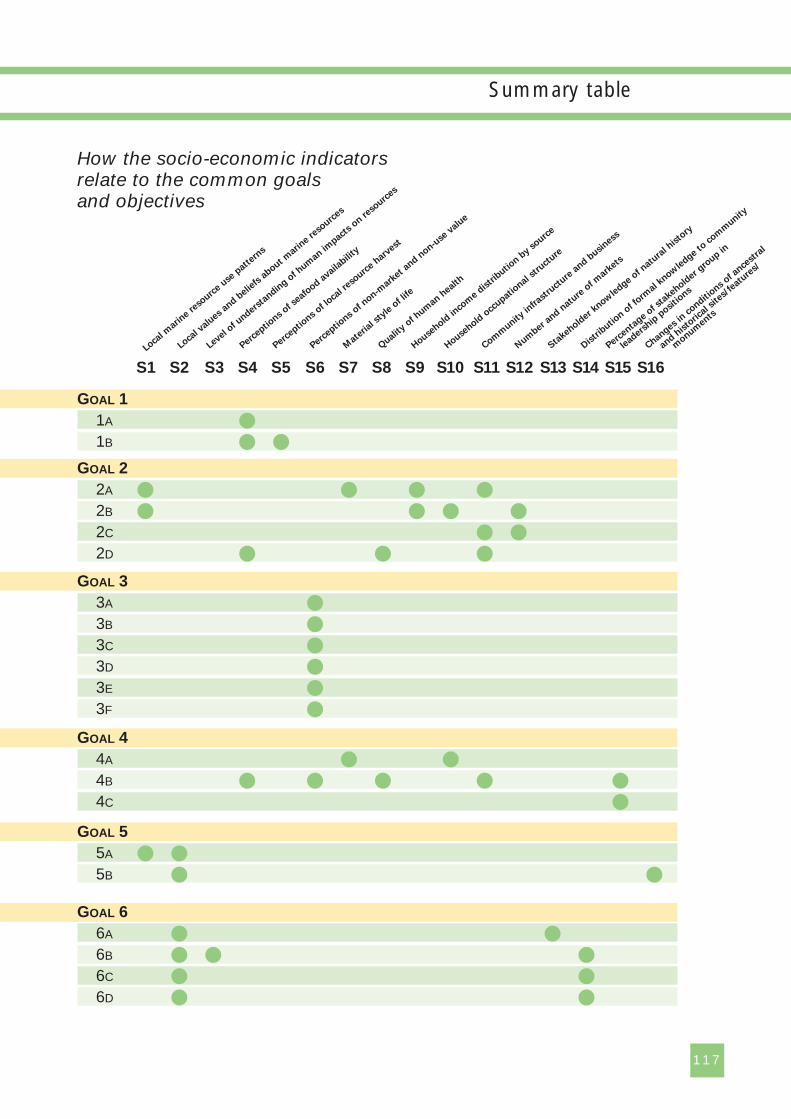
GOAL 1
1A �
1B � �
GOAL 2
2A � � � �
2B � � � �
2C � �
2D � � �
GOAL 3
3A �
3B �
3C �
3D �
3E �
3F �
GOAL 4
4A � �
4B � � � � �
4C �
GOAL 5
5A � �
5B � �
GOAL 6
6A � �
6B � � �
6C � �
6D � �
Local v
alues
and belie
fs a
bout marin
e reso
urces
Level of u
ndersta
nding o
f hum
an impact
s on re
sourc
es
Perceptio
ns of s
eafood a
vailabili
ty
Perceptio
ns of l
ocal r
esourc
e harv
est
Perceptio
ns of n
on-mark
et and n
on-use
valu
e
Mate
rial s
tyle
of l
ife
Qualit
y of h
uman h
ealth
House
hold in
com
e dis
trib
ution b
y sourc
e
House
hold o
ccupatio
nal str
ucture
Comm
unity in
frast
ruct
ure a
nd busi
ness
Num
ber and n
ature
of m
arkets
Stakehold
er know
ledge o
f natu
ral h
isto
ry
Dis
trib
ution o
f form
al know
ledge to
com
munity
Percenta
ge of s
takehold
er gro
up in
leaders
hip p
ositio
ns
Changes in
conditi
ons of a
ncest
ral
and his
toric
al site
s/fe
ature
s/
monum
ents
S1 S2 S3 S4 S5 S6 S7 S8 S9 S10 S11 S12 S13 S14 S15 S16
How the socio-economic indicators relate to the common goalsand objectives
Local m
arine re
sourc
e use
patt
erns
117
Summary table
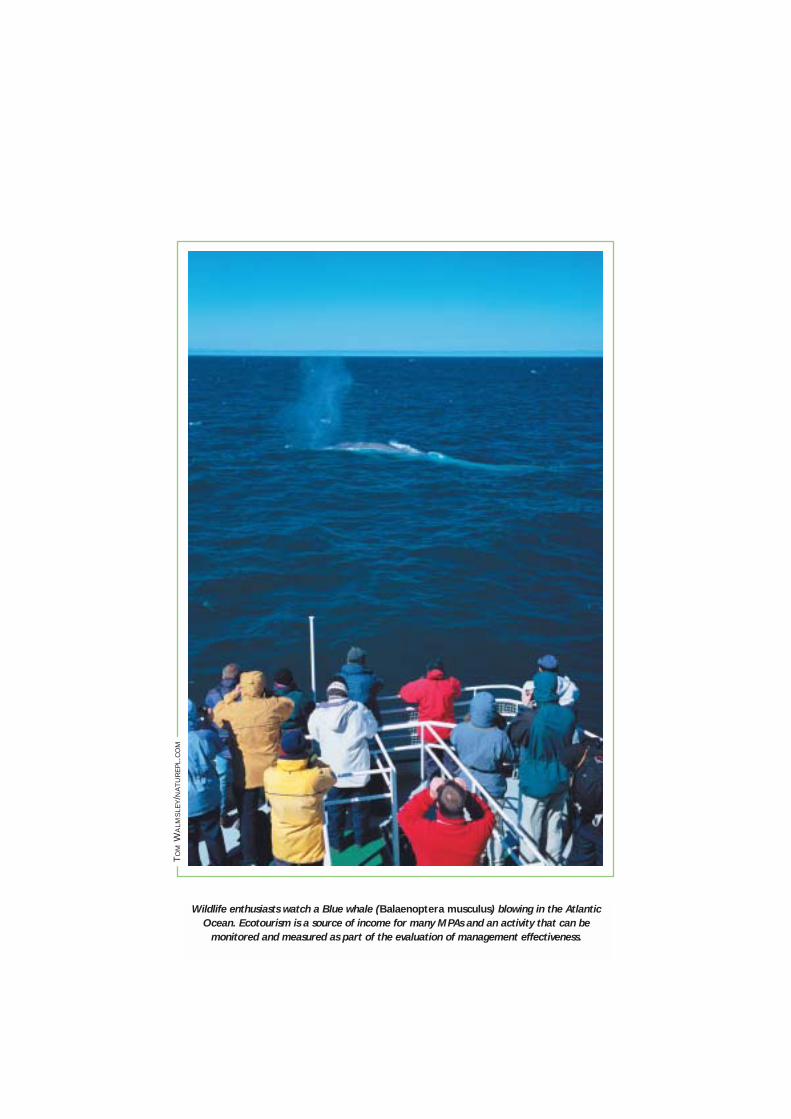
Wildlife enthusiasts watch a Blue whale (Balaenoptera musculus) blowing in the Atlantic
Ocean. Ecotourism is a source of income for many MPAs and an activity that can be
monitored and measured as part of the evaluation of management effectiveness.
TO
MW
ALM
SLE
Y/N
AT
UR
EP
L.C
OM
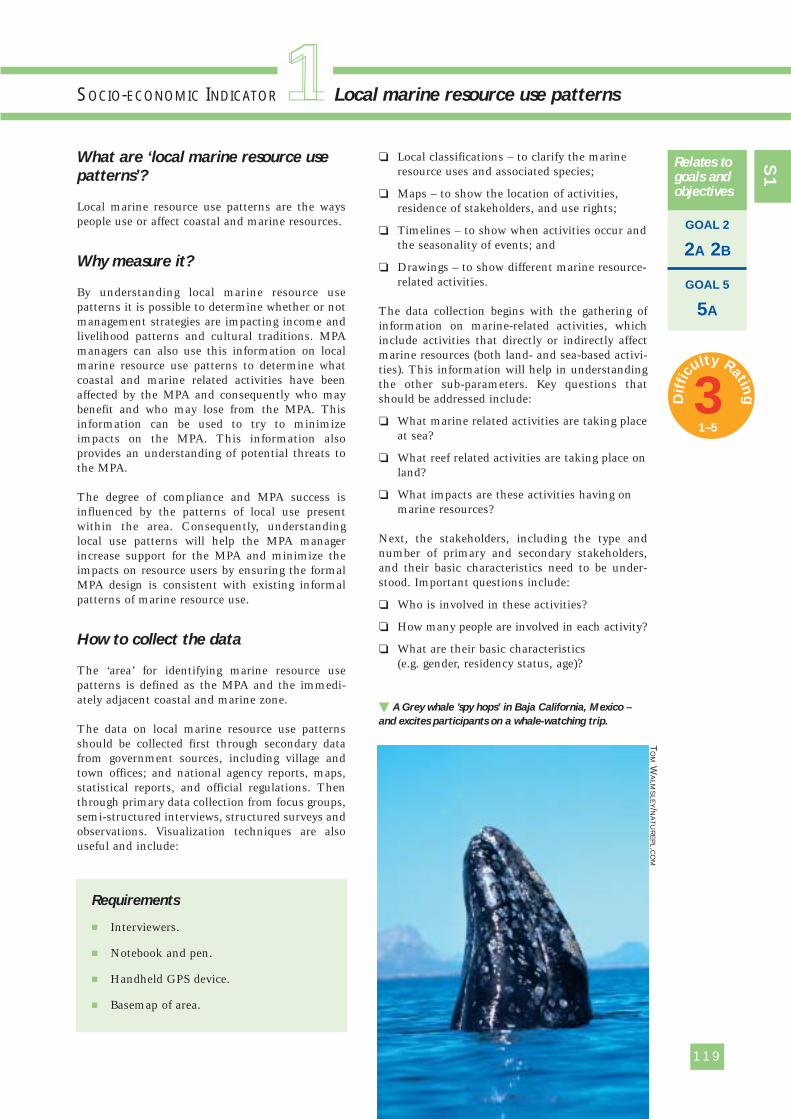
What are ‘local marine resource use
patterns’?
Local marine resource use patterns are the wayspeople use or affect coastal and marine resources.
Why measure it?
By understanding local marine resource usepatterns it is possible to determine whether or notmanagement strategies are impacting income andlivelihood patterns and cultural traditions. MPAmanagers can also use this information on localmarine resource use patterns to determine whatcoastal and marine related activities have beenaffected by the MPA and consequently who maybenefit and who may lose from the MPA. Thisinformation can be used to try to minimizeimpacts on the MPA. This information alsoprovides an understanding of potential threats tothe MPA.
The degree of compliance and MPA success isinfluenced by the patterns of local use presentwithin the area. Consequently, understandinglocal use patterns will help the MPA managerincrease support for the MPA and minimize theimpacts on resource users by ensuring the formalMPA design is consistent with existing informalpatterns of marine resource use.
How to collect the data
The ‘area’ for identifying marine resource usepatterns is defined as the MPA and the immedi-ately adjacent coastal and marine zone.
The data on local marine resource use patternsshould be collected first through secondary datafrom government sources, including village andtown offices; and national agency reports, maps,statistical reports, and official regulations. Thenthrough primary data collection from focus groups,semi-structured interviews, structured surveys andobservations. Visualization techniques are alsouseful and include:
❏ Local classifications – to clarify the marineresource uses and associated species;
❏ Maps – to show the location of activities,residence of stakeholders, and use rights;
❏ Timelines – to show when activities occur andthe seasonality of events; and
❏ Drawings – to show different marine resource-related activities.
The data collection begins with the gathering ofinformation on marine-related activities, whichinclude activities that directly or indirectly affectmarine resources (both land- and sea-based activi-ties). This information will help in understandingthe other sub-parameters. Key questions thatshould be addressed include:
❏ What marine related activities are taking placeat sea?
❏ What reef related activities are taking place onland?
❏ What impacts are these activities having onmarine resources?
Next, the stakeholders, including the type andnumber of primary and secondary stakeholders,and their basic characteristics need to be under-stood. Important questions include:
❏ Who is involved in these activities?
❏ How many people are involved in each activity?
❏ What are their basic characteristics(e.g. gender, residency status, age)?
SOCIO-ECONOMIC INDICATOR Local marine resource use patterns
GOAL 2
2A 2B
GOAL 5
5A
Relates togoals andobjectives
119
Requirements
� Interviewers.
� Notebook and pen.
� Handheld GPS device.
� Basemap of area.
S1
1
� A Grey whale 'spy hops’ in Baja California, Mexico –
and excites participants on a whale-watching trip.
TO
MW
ALM
SLE
Y/NA
TU
RE
PL.C
OM
3Dif
ficu
lty Rating
1–5
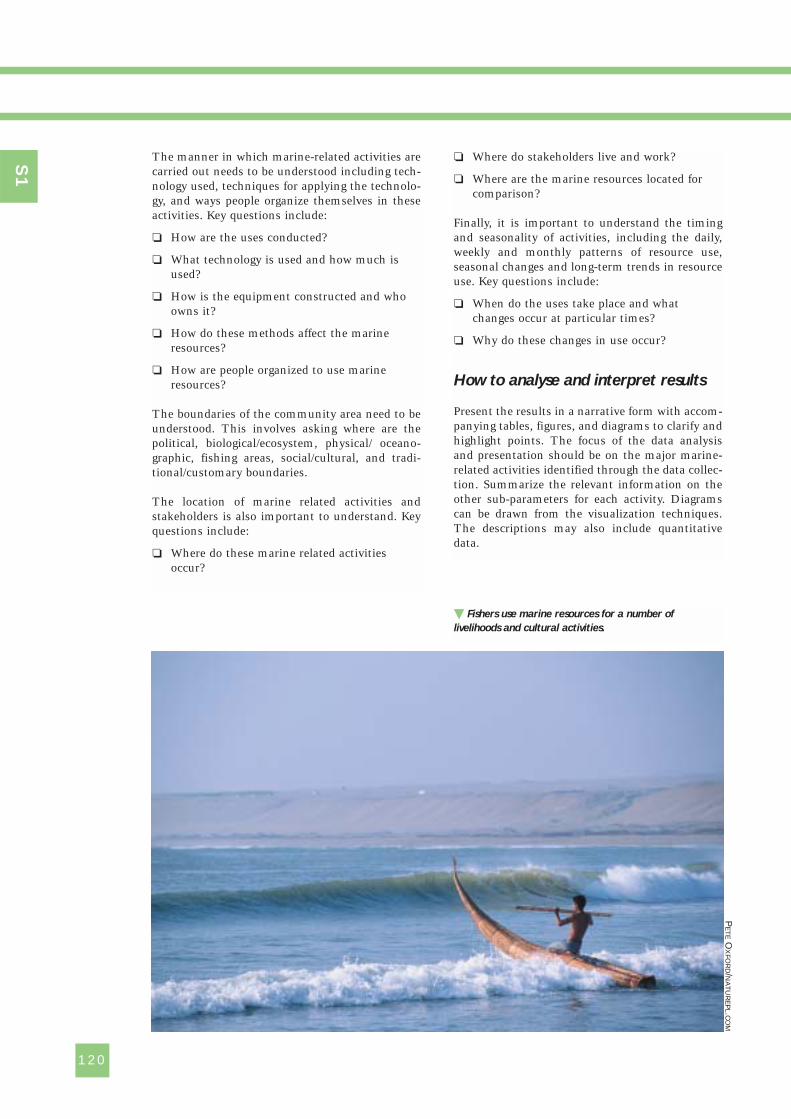
The manner in which marine-related activities arecarried out needs to be understood including tech-nology used, techniques for applying the technolo-gy, and ways people organize themselves in theseactivities. Key questions include:
❏ How are the uses conducted?
❏ What technology is used and how much isused?
❏ How is the equipment constructed and whoowns it?
❏ How do these methods affect the marineresources?
❏ How are people organized to use marineresources?
The boundaries of the community area need to beunderstood. This involves asking where are thepolitical, biological/ecosystem, physical/ oceano-graphic, fishing areas, social/cultural, and tradi-tional/customary boundaries.
The location of marine related activities andstakeholders is also important to understand. Keyquestions include:
❏ Where do these marine related activitiesoccur?
120
❏ Where do stakeholders live and work?
❏ Where are the marine resources located forcomparison?
Finally, it is important to understand the timingand seasonality of activities, including the daily,weekly and monthly patterns of resource use,seasonal changes and long-term trends in resourceuse. Key questions include:
❏ When do the uses take place and whatchanges occur at particular times?
❏ Why do these changes in use occur?
How to analyse and interpret results
Present the results in a narrative form with accom-panying tables, figures, and diagrams to clarify andhighlight points. The focus of the data analysisand presentation should be on the major marine-related activities identified through the data collec-tion. Summarize the relevant information on theother sub-parameters for each activity. Diagramscan be drawn from the visualization techniques.The descriptions may also include quantitativedata.
S1
PE
TE
OX
FOR
D/NA
TU
RE
PL.C
OM
� Fishers use marine resources for a number of
livelihoods and cultural activities.
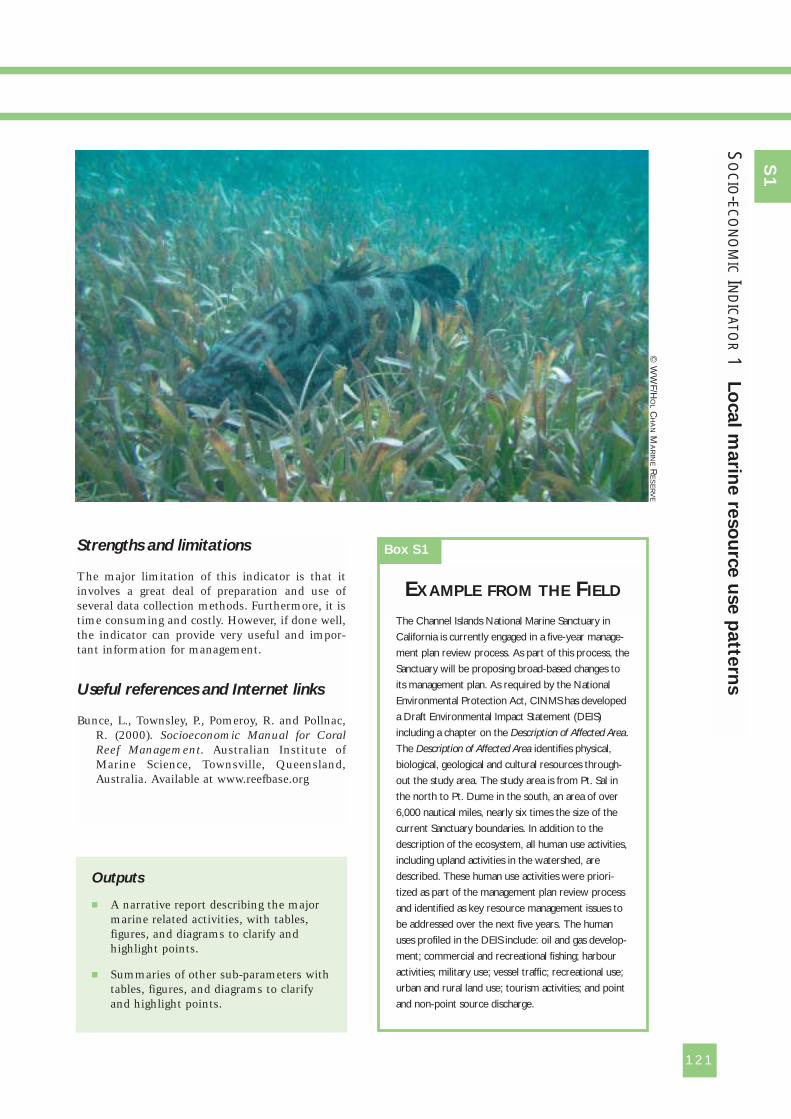
121
Outputs
� A narrative report describing the majormarine related activities, with tables,figures, and diagrams to clarify andhighlight points.
� Summaries of other sub-parameters withtables, figures, and diagrams to clarifyand highlight points.
The Channel Islands National Marine Sanctuary in
California is currently engaged in a five-year manage-
ment plan review process. As part of this process, the
Sanctuary will be proposing broad-based changes to
its management plan. As required by the National
Environmental Protection Act, CINMS has developed
a Draft Environmental Impact Statement (DEIS)
including a chapter on the Description of Affected Area.
The Description of Affected Area identifies physical,
biological, geological and cultural resources through-
out the study area. The study area is from Pt. Sal in
the north to Pt. Dume in the south, an area of over
6,000 nautical miles, nearly six times the size of the
current Sanctuary boundaries. In addition to the
description of the ecosystem, all human use activities,
including upland activities in the watershed, are
described. These human use activities were priori-
tized as part of the management plan review process
and identified as key resource management issues to
be addressed over the next five years. The human
uses profiled in the DEIS include: oil and gas develop-
ment; commercial and recreational fishing; harbour
activities; military use; vessel traffic; recreational use;
urban and rural land use; tourism activities; and point
and non-point source discharge.
EXAMPLE FROM THE FIELD
Box S1
SO
CIO-EC
ON
OM
ICIN
DIC
ATOR
1Lo
cal m
arin
e re
so
urc
e u
se p
atte
rns
S1
Strengths and limitations
The major limitation of this indicator is that itinvolves a great deal of preparation and use ofseveral data collection methods. Furthermore, it istime consuming and costly. However, if done well,the indicator can provide very useful and impor-tant information for management.
Useful references and Internet links
Bunce, L., Townsley, P., Pomeroy, R. and Pollnac,R. (2000). Socioeconomic Manual for CoralReef Management. Australian Institute ofMarine Science, Townsville, Queensland,Australia. Available at www.reefbase.org
© W
WF/H
OL
CH
AN
MA
RIN
ER
ES
ER
VE
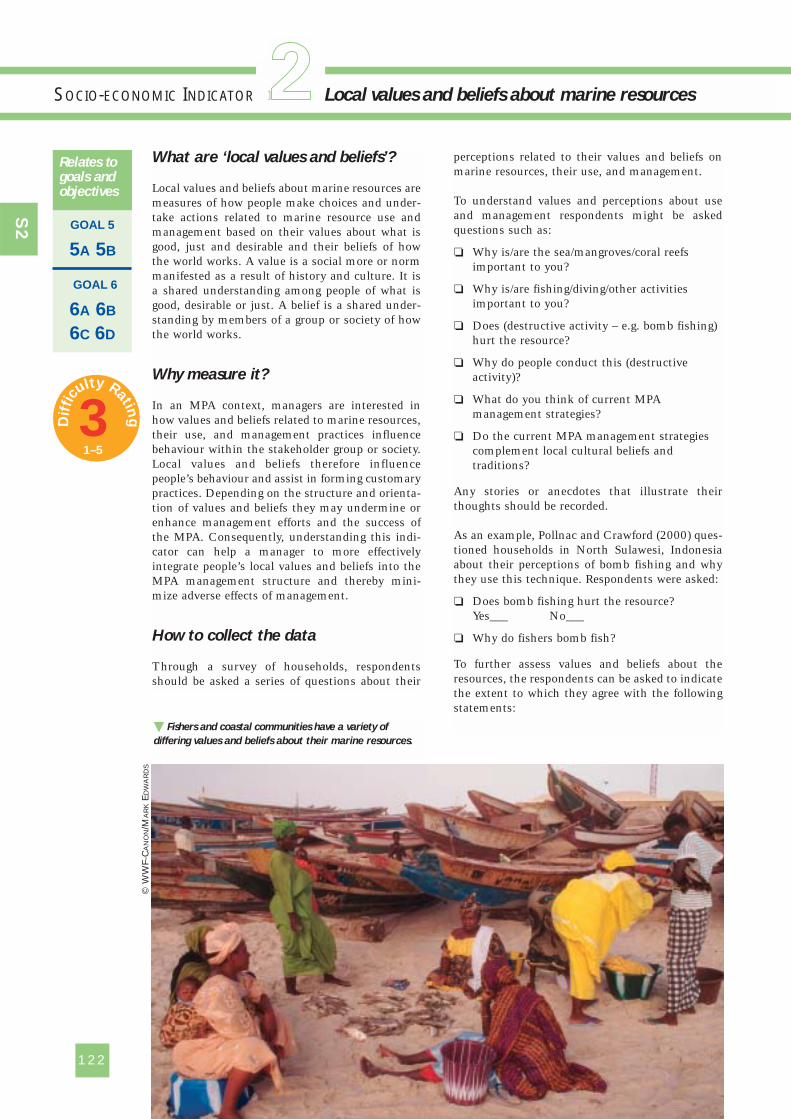
What are ‘local values and beliefs’?
Local values and beliefs about marine resources aremeasures of how people make choices and under-take actions related to marine resource use andmanagement based on their values about what isgood, just and desirable and their beliefs of howthe world works. A value is a social more or normmanifested as a result of history and culture. It isa shared understanding among people of what isgood, desirable or just. A belief is a shared under-standing by members of a group or society of howthe world works.
Why measure it?
In an MPA context, managers are interested inhow values and beliefs related to marine resources,their use, and management practices influencebehaviour within the stakeholder group or society.Local values and beliefs therefore influencepeople’s behaviour and assist in forming customarypractices. Depending on the structure and orienta-tion of values and beliefs they may undermine orenhance management efforts and the success ofthe MPA. Consequently, understanding this indi-cator can help a manager to more effectivelyintegrate people’s local values and beliefs into theMPA management structure and thereby mini-mize adverse effects of management.
How to collect the data
Through a survey of households, respondentsshould be asked a series of questions about their
perceptions related to their values and beliefs onmarine resources, their use, and management.
To understand values and perceptions about useand management respondents might be askedquestions such as:
❏ Why is/are the sea/mangroves/coral reefsimportant to you?
❏ Why is/are fishing/diving/other activitiesimportant to you?
❏ Does (destructive activity – e.g. bomb fishing)hurt the resource?
❏ Why do people conduct this (destructiveactivity)?
❏ What do you think of current MPAmanagement strategies?
❏ Do the current MPA management strategiescomplement local cultural beliefs andtraditions?
Any stories or anecdotes that illustrate theirthoughts should be recorded.
As an example, Pollnac and Crawford (2000) ques-tioned households in North Sulawesi, Indonesiaabout their perceptions of bomb fishing and whythey use this technique. Respondents were asked:
❏ Does bomb fishing hurt the resource? Yes___ No___
❏ Why do fishers bomb fish?
To further assess values and beliefs about theresources, the respondents can be asked to indicatethe extent to which they agree with the followingstatements:
122
SOCIO-ECONOMIC INDICATOR Local values and beliefs about marine resources
GOAL 5
5A 5B
GOAL 6
6A 6B
6C 6D
Relates togoals andobjectives
� Fishers and coastal communities have a variety of
differing values and beliefs about their marine resources.
S2
1©
WW
F-C
AN
ON
/MA
RK
ED
WA
RD
S
3Dif
ficu
lty Rating
1–5
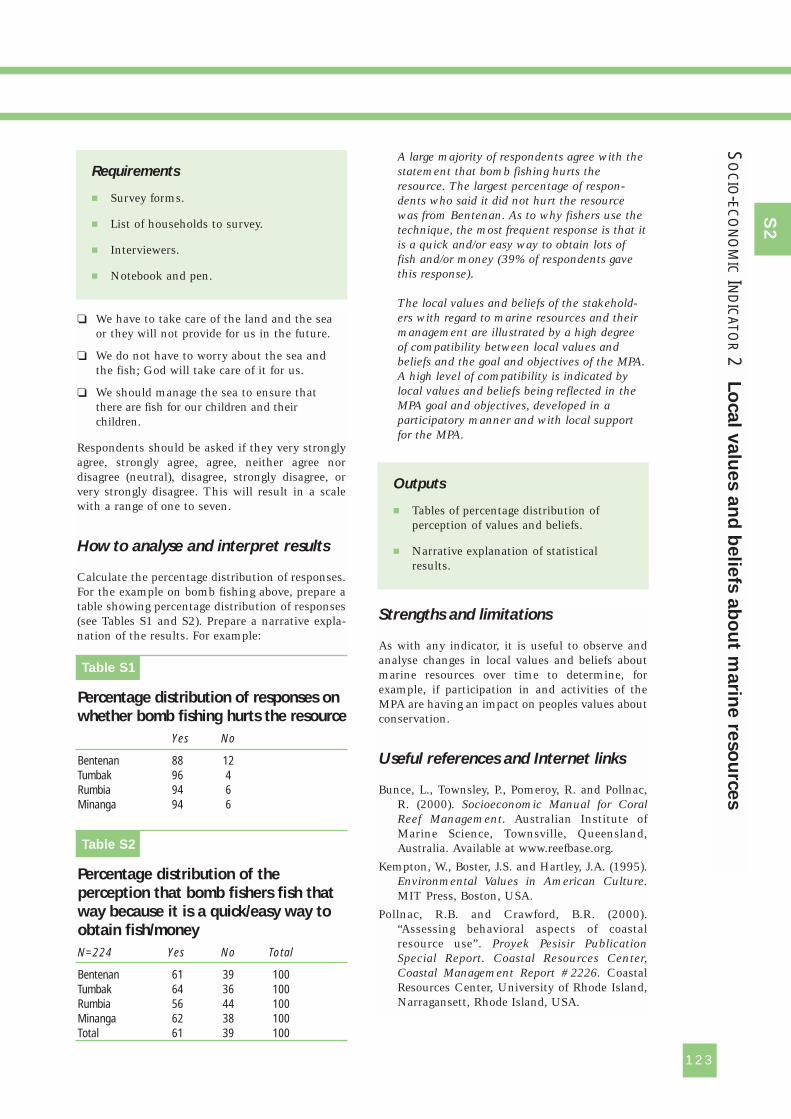
❏ We have to take care of the land and the seaor they will not provide for us in the future.
❏ We do not have to worry about the sea andthe fish; God will take care of it for us.
❏ We should manage the sea to ensure thatthere are fish for our children and theirchildren.
Respondents should be asked if they very stronglyagree, strongly agree, agree, neither agree nordisagree (neutral), disagree, strongly disagree, orvery strongly disagree. This will result in a scalewith a range of one to seven.
How to analyse and interpret results
Calculate the percentage distribution of responses.For the example on bomb fishing above, prepare atable showing percentage distribution of responses(see Tables S1 and S2). Prepare a narrative expla-nation of the results. For example:
A large majority of respondents agree with thestatement that bomb fishing hurts theresource. The largest percentage of respon-dents who said it did not hurt the resourcewas from Bentenan. As to why fishers use thetechnique, the most frequent response is that itis a quick and/or easy way to obtain lots offish and/or money (39% of respondents gavethis response).
The local values and beliefs of the stakehold-ers with regard to marine resources and theirmanagement are illustrated by a high degreeof compatibility between local values andbeliefs and the goal and objectives of the MPA.A high level of compatibility is indicated bylocal values and beliefs being reflected in theMPA goal and objectives, developed in aparticipatory manner and with local supportfor the MPA.
123
SO
CIO-EC
ON
OM
ICIN
DIC
ATOR
2Lo
cal v
alu
es a
nd
belie
fs a
bo
ut m
arin
e re
so
urc
es
Requirements
� Survey forms.
� List of households to survey.
� Interviewers.
� Notebook and pen.
Outputs
� Tables of percentage distribution ofperception of values and beliefs.
� Narrative explanation of statisticalresults.
S2
Table S1
Percentage distribution of responses onwhether bomb fishing hurts the resource
Yes No
Bentenan 88 12Tumbak 96 4Rumbia 94 6Minanga 94 6
Table S2
Percentage distribution of theperception that bomb fishers fish thatway because it is a quick/easy way toobtain fish/moneyN=224 Yes No Total
Bentenan 61 39 100Tumbak 64 36 100Rumbia 56 44 100Minanga 62 38 100Total 61 39 100
Strengths and limitations
As with any indicator, it is useful to observe andanalyse changes in local values and beliefs aboutmarine resources over time to determine, forexample, if participation in and activities of theMPA are having an impact on peoples values aboutconservation.
Useful references and Internet links
Bunce, L., Townsley, P., Pomeroy, R. and Pollnac,R. (2000). Socioeconomic Manual for CoralReef Management. Australian Institute ofMarine Science, Townsville, Queensland,Australia. Available at www.reefbase.org.
Kempton, W., Boster, J.S. and Hartley, J.A. (1995).Environmental Values in American Culture.MIT Press, Boston, USA.
Pollnac, R.B. and Crawford, B.R. (2000).“Assessing behavioral aspects of coastalresource use”. Proyek Pesisir PublicationSpecial Report. Coastal Resources Center,Coastal Management Report #2226. CoastalResources Center, University of Rhode Island,Narragansett, Rhode Island, USA.
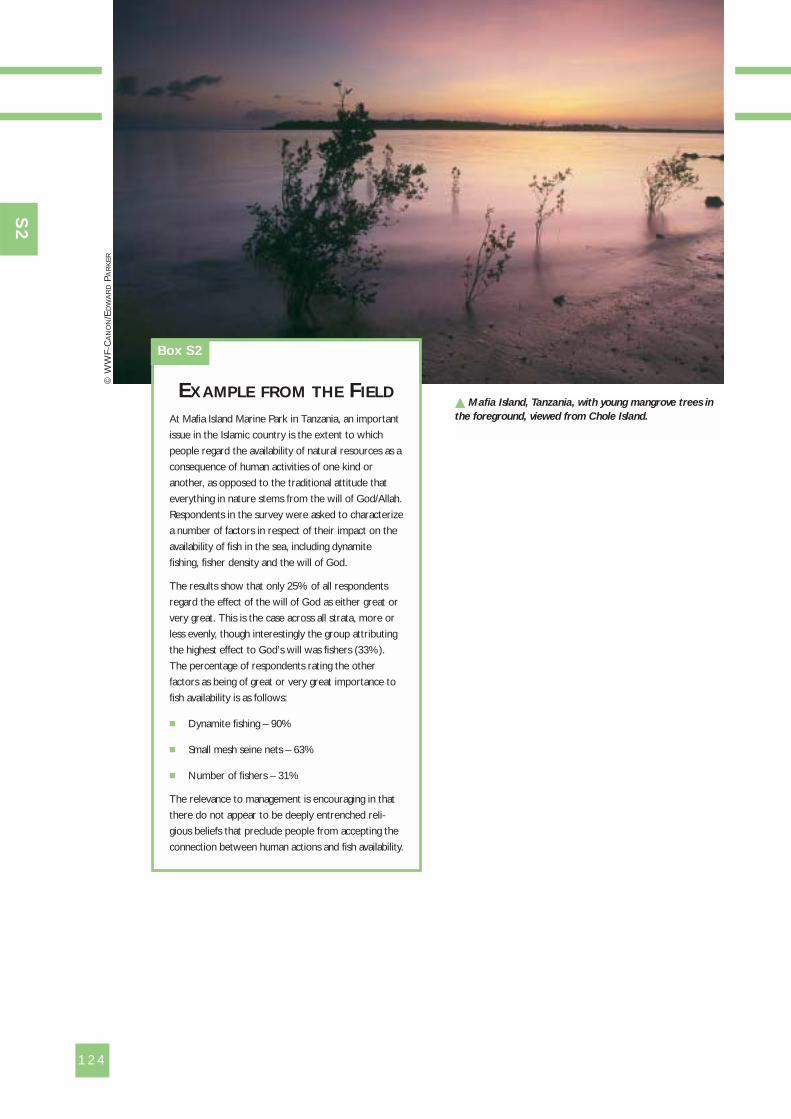
124
� Mafia Island, Tanzania, with young mangrove trees in
the foreground, viewed from Chole Island.
S2
© W
WF-
CA
NO
N/E
DW
AR
DPA
RK
ER
At Mafia Island Marine Park in Tanzania, an important
issue in the Islamic country is the extent to which
people regard the availability of natural resources as a
consequence of human activities of one kind or
another, as opposed to the traditional attitude that
everything in nature stems from the will of God/Allah.
Respondents in the survey were asked to characterize
a number of factors in respect of their impact on the
availability of fish in the sea, including dynamite
fishing, fisher density and the will of God.
The results show that only 25% of all respondents
regard the effect of the will of God as either great or
very great. This is the case across all strata, more or
less evenly, though interestingly the group attributing
the highest effect to God’s will was fishers (33%).
The percentage of respondents rating the other
factors as being of great or very great importance to
fish availability is as follows:
� Dynamite fishing – 90%
� Small mesh seine nets – 63%
� Number of fishers – 31%
The relevance to management is encouraging in that
there do not appear to be deeply entrenched reli-
gious beliefs that preclude people from accepting the
connection between human actions and fish availability.
EXAMPLE FROM THE FIELD
Box S2
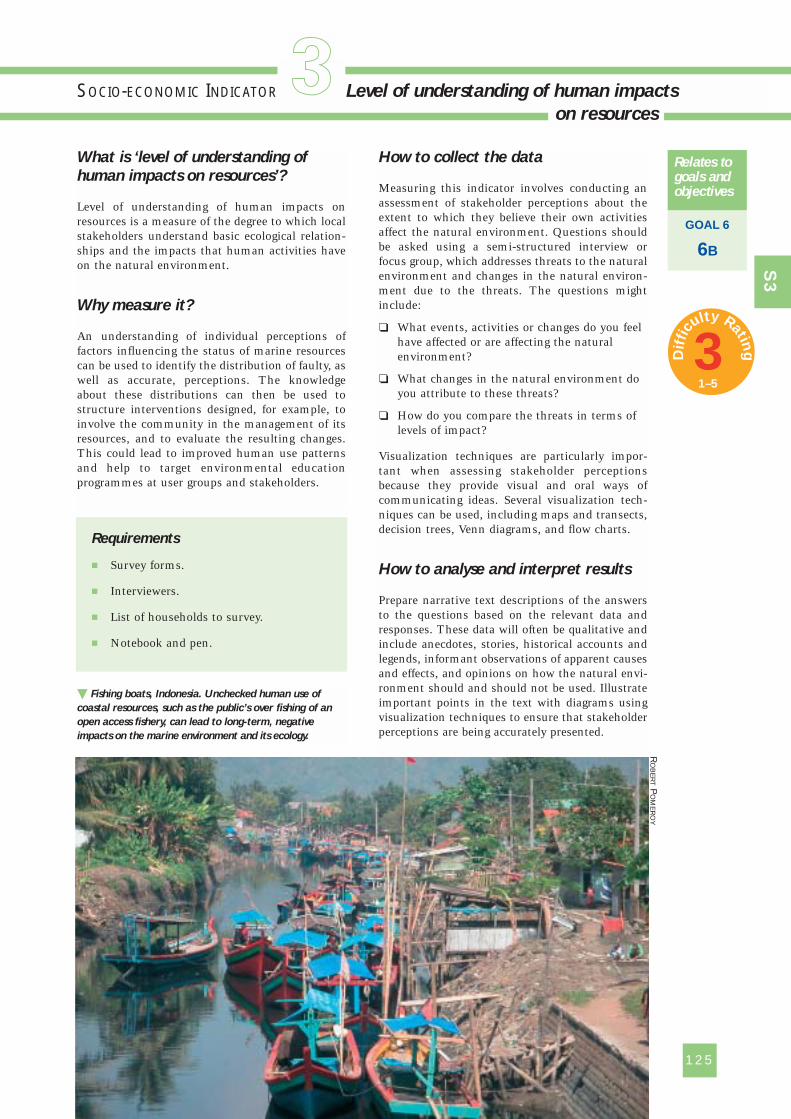
What is ‘level of understanding of
human impacts on resources’?
Level of understanding of human impacts onresources is a measure of the degree to which localstakeholders understand basic ecological relation-ships and the impacts that human activities haveon the natural environment.
Why measure it?
An understanding of individual perceptions offactors influencing the status of marine resourcescan be used to identify the distribution of faulty, aswell as accurate, perceptions. The knowledgeabout these distributions can then be used tostructure interventions designed, for example, toinvolve the community in the management of itsresources, and to evaluate the resulting changes.This could lead to improved human use patternsand help to target environmental educationprogrammes at user groups and stakeholders.
How to collect the data
Measuring this indicator involves conducting anassessment of stakeholder perceptions about theextent to which they believe their own activitiesaffect the natural environment. Questions shouldbe asked using a semi-structured interview orfocus group, which addresses threats to the naturalenvironment and changes in the natural environ-ment due to the threats. The questions mightinclude:
❏ What events, activities or changes do you feelhave affected or are affecting the naturalenvironment?
❏ What changes in the natural environment doyou attribute to these threats?
❏ How do you compare the threats in terms oflevels of impact?
Visualization techniques are particularly impor-tant when assessing stakeholder perceptionsbecause they provide visual and oral ways ofcommunicating ideas. Several visualization tech-niques can be used, including maps and transects,decision trees, Venn diagrams, and flow charts.
How to analyse and interpret results
Prepare narrative text descriptions of the answersto the questions based on the relevant data andresponses. These data will often be qualitative andinclude anecdotes, stories, historical accounts andlegends, informant observations of apparent causesand effects, and opinions on how the natural envi-ronment should and should not be used. Illustrateimportant points in the text with diagrams usingvisualization techniques to ensure that stakeholderperceptions are being accurately presented.
125
SOCIO-ECONOMIC INDICATOR Level of understanding of human impacts
GOAL 6
6B
Relates togoals andobjectives
Requirements
� Survey forms.
� Interviewers.
� List of households to survey.
� Notebook and pen.
� Fishing boats, Indonesia. Unchecked human use of
coastal resources, such as the public’s over fishing of an
open access fishery, can lead to long-term, negative
impacts on the marine environment and its ecology.
S3
1on resources
RO
BE
RT
PO
ME
RO
Y
3Dif
ficu
lty Rating
1–5
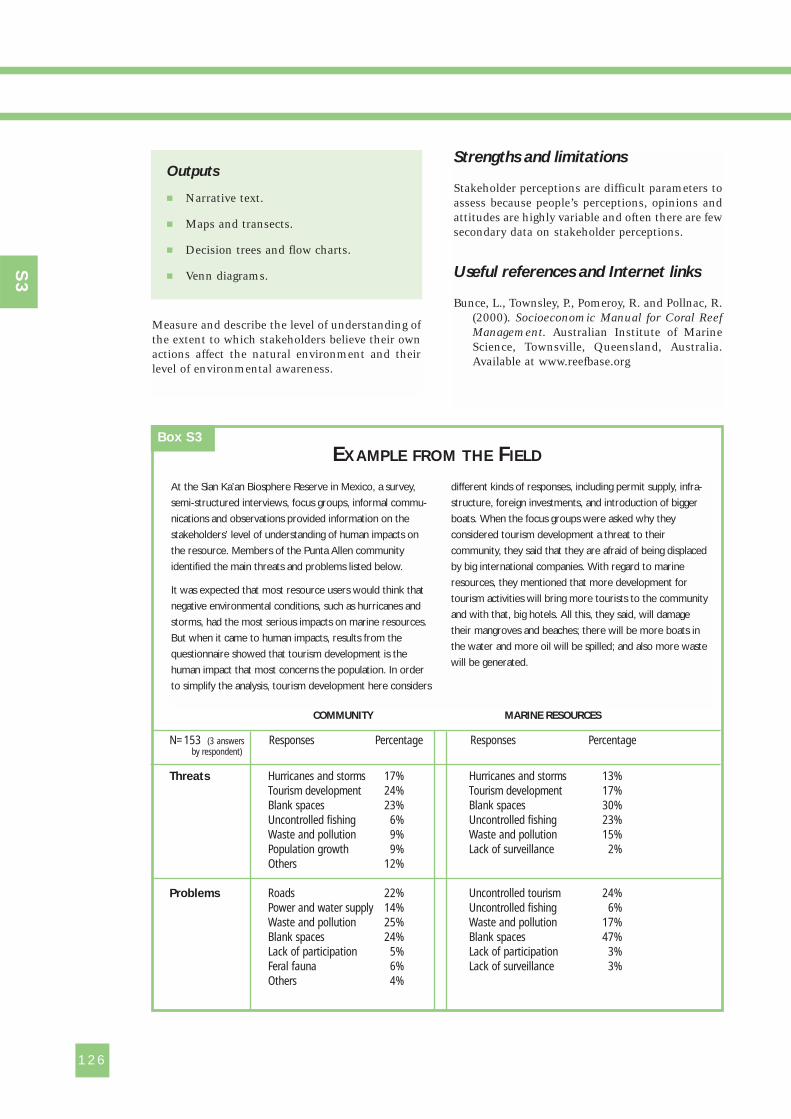
Measure and describe the level of understanding ofthe extent to which stakeholders believe their ownactions affect the natural environment and theirlevel of environmental awareness.
Strengths and limitations
Stakeholder perceptions are difficult parameters toassess because people’s perceptions, opinions andattitudes are highly variable and often there are fewsecondary data on stakeholder perceptions.
Useful references and Internet links
Bunce, L., Townsley, P., Pomeroy, R. and Pollnac, R.(2000). Socioeconomic Manual for Coral ReefManagement. Australian Institute of MarineScience, Townsville, Queensland, Australia.Available at www.reefbase.org
126
Outputs
� Narrative text.
� Maps and transects.
� Decision trees and flow charts.
� Venn diagrams.
COMMUNITY MARINE RESOURCES
N=153 (3 answers Responses Percentage Responses Percentageby respondent)
Threats Hurricanes and storms 17% Hurricanes and storms 13%Tourism development 24% Tourism development 17%Blank spaces 23% Blank spaces 30%Uncontrolled fishing 6% Uncontrolled fishing 23%Waste and pollution 9% Waste and pollution 15%Population growth 9% Lack of surveillance 2%Others 12%
Problems Roads 22% Uncontrolled tourism 24%Power and water supply 14% Uncontrolled fishing 6%Waste and pollution 25% Waste and pollution 17%Blank spaces 24% Blank spaces 47%Lack of participation 5% Lack of participation 3%Feral fauna 6% Lack of surveillance 3%Others 4%
EXAMPLE FROM THE FIELDBox S3
S3
At the Sian Ka’an Biosphere Reserve in Mexico, a survey,
semi-structured interviews, focus groups, informal commu-
nications and observations provided information on the
stakeholders’ level of understanding of human impacts on
the resource. Members of the Punta Allen community
identified the main threats and problems listed below.
It was expected that most resource users would think that
negative environmental conditions, such as hurricanes and
storms, had the most serious impacts on marine resources.
But when it came to human impacts, results from the
questionnaire showed that tourism development is the
human impact that most concerns the population. In order
to simplify the analysis, tourism development here considers
different kinds of responses, including permit supply, infra-
structure, foreign investments, and introduction of bigger
boats. When the focus groups were asked why they
considered tourism development a threat to their
community, they said that they are afraid of being displaced
by big international companies. With regard to marine
resources, they mentioned that more development for
tourism activities will bring more tourists to the community
and with that, big hotels. All this, they said, will damage
their mangroves and beaches; there will be more boats in
the water and more oil will be spilled; and also more waste
will be generated.
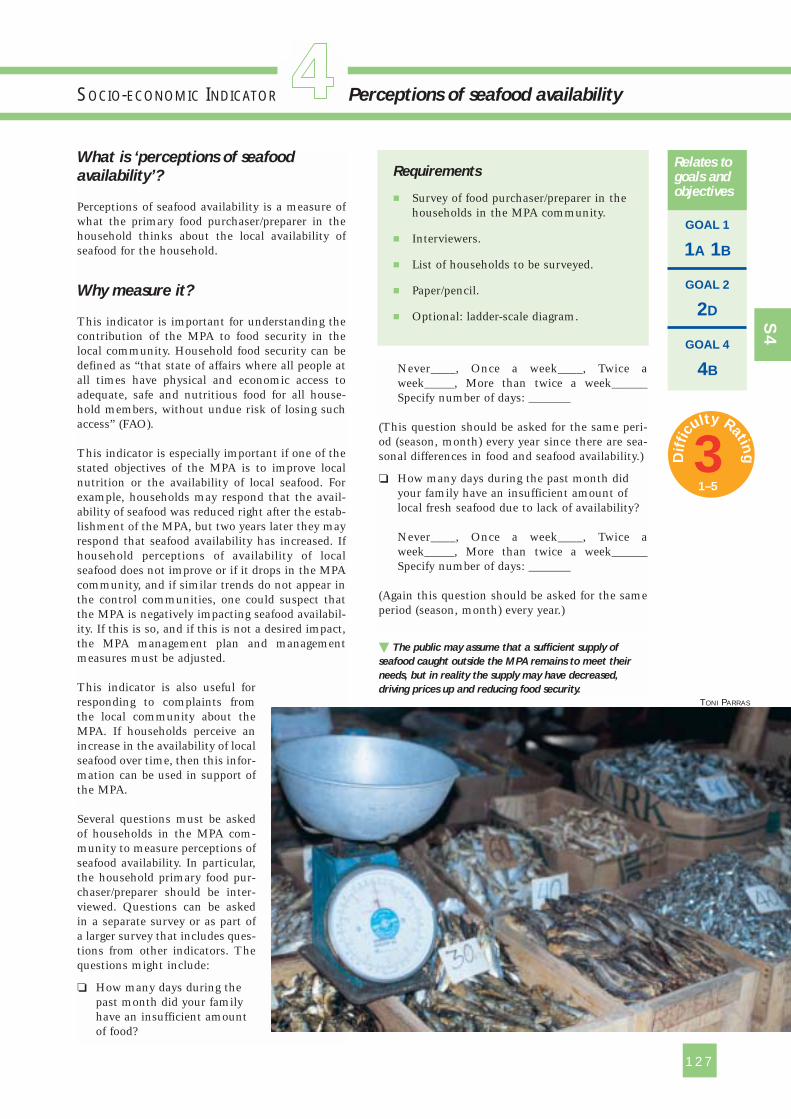
127
What is ‘perceptions of seafood
availability’?
Perceptions of seafood availability is a measure ofwhat the primary food purchaser/preparer in thehousehold thinks about the local availability ofseafood for the household.
Why measure it?
This indicator is important for understanding thecontribution of the MPA to food security in thelocal community. Household food security can bedefined as “that state of affairs where all people atall times have physical and economic access toadequate, safe and nutritious food for all house-hold members, without undue risk of losing suchaccess” (FAO).
This indicator is especially important if one of thestated objectives of the MPA is to improve localnutrition or the availability of local seafood. Forexample, households may respond that the avail-ability of seafood was reduced right after the estab-lishment of the MPA, but two years later they mayrespond that seafood availability has increased. Ifhousehold perceptions of availability of localseafood does not improve or if it drops in the MPAcommunity, and if similar trends do not appear inthe control communities, one could suspect thatthe MPA is negatively impacting seafood availabil-ity. If this is so, and if this is not a desired impact,the MPA management plan and managementmeasures must be adjusted.
This indicator is also useful forresponding to complaints fromthe local community about theMPA. If households perceive anincrease in the availability of localseafood over time, then this infor-mation can be used in support ofthe MPA.
Several questions must be askedof households in the MPA com-munity to measure perceptions ofseafood availability. In particular,the household primary food pur-chaser/preparer should be inter-viewed. Questions can be askedin a separate survey or as part ofa larger survey that includes ques-tions from other indicators. Thequestions might include:
❏ How many days during thepast month did your familyhave an insufficient amountof food?
Never____, Once a week____, Twice aweek_____, More than twice a week______Specify number of days: _______
(This question should be asked for the same peri-od (season, month) every year since there are sea-sonal differences in food and seafood availability.)
❏ How many days during the past month didyour family have an insufficient amount oflocal fresh seafood due to lack of availability?
Never____, Once a week____, Twice aweek_____, More than twice a week______Specify number of days: _______
(Again this question should be asked for the sameperiod (season, month) every year.)
SOCIO-ECONOMIC INDICATOR Perceptions of seafood availability
GOAL 1
1A 1B
GOAL 2
2D
GOAL 4
4B
Relates togoals andobjectives
� The public may assume that a sufficient supply of
seafood caught outside the MPA remains to meet their
needs, but in reality the supply may have decreased,
driving prices up and reducing food security.
Requirements
� Survey of food purchaser/preparer in thehouseholds in the MPA community.
� Interviewers.
� List of households to be surveyed.
� Paper/pencil.
� Optional: ladder-scale diagram. S4
1
TONI PARRAS
3Dif
ficu
lty Rating
1–5
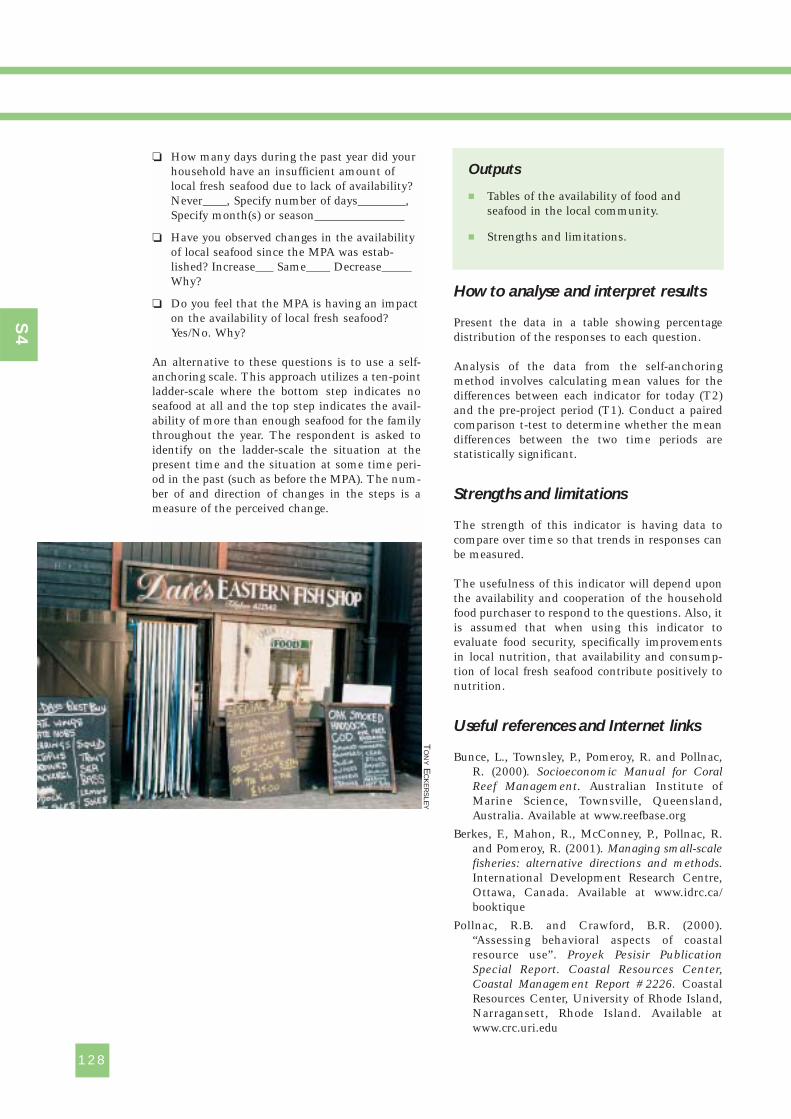
❏ How many days during the past year did yourhousehold have an insufficient amount oflocal fresh seafood due to lack of availability?Never____, Specify number of days________,Specify month(s) or season_______________
❏ Have you observed changes in the availabilityof local seafood since the MPA was estab-lished? Increase___ Same____ Decrease_____Why?
❏ Do you feel that the MPA is having an impacton the availability of local fresh seafood?Yes/No. Why?
An alternative to these questions is to use a self-anchoring scale. This approach utilizes a ten-pointladder-scale where the bottom step indicates noseafood at all and the top step indicates the avail-ability of more than enough seafood for the familythroughout the year. The respondent is asked toidentify on the ladder-scale the situation at thepresent time and the situation at some time peri-od in the past (such as before the MPA). The num-ber of and direction of changes in the steps is ameasure of the perceived change.
How to analyse and interpret results
Present the data in a table showing percentagedistribution of the responses to each question.
Analysis of the data from the self-anchoringmethod involves calculating mean values for thedifferences between each indicator for today (T2)and the pre-project period (T1). Conduct a pairedcomparison t-test to determine whether the meandifferences between the two time periods arestatistically significant.
Strengths and limitations
The strength of this indicator is having data tocompare over time so that trends in responses canbe measured.
The usefulness of this indicator will depend uponthe availability and cooperation of the householdfood purchaser to respond to the questions. Also, itis assumed that when using this indicator toevaluate food security, specifically improvementsin local nutrition, that availability and consump-tion of local fresh seafood contribute positively tonutrition.
Useful references and Internet links
Bunce, L., Townsley, P., Pomeroy, R. and Pollnac,R. (2000). Socioeconomic Manual for CoralReef Management. Australian Institute ofMarine Science, Townsville, Queensland,Australia. Available at www.reefbase.org
Berkes, F., Mahon, R., McConney, P., Pollnac, R.and Pomeroy, R. (2001). Managing small-scalefisheries: alternative directions and methods.International Development Research Centre,Ottawa, Canada. Available at www.idrc.ca/booktique
Pollnac, R.B. and Crawford, B.R. (2000).“Assessing behavioral aspects of coastalresource use”. Proyek Pesisir PublicationSpecial Report. Coastal Resources Center,Coastal Management Report #2226. CoastalResources Center, University of Rhode Island,Narragansett, Rhode Island. Available atwww.crc.uri.edu
128
Outputs
� Tables of the availability of food andseafood in the local community.
� Strengths and limitations.
S4
TO
NY
EC
KE
RS
LEY
129
What is ‘perceptions of local resource
harvest’?
Perceptions of local resource harvest is a measureof what local fishers think about the availability oftarget fish species and changes in the availability offish.
Why measure it?
This indicator provides information on fishers’perceptions of changes in the availability of targetspecies, which is useful for determining if the MPAmanagement is achieving its objective of increas-ing harvests of seafood and consequently the avail-ability of locally caught seafood. If the perceptionsare a positive increase, then the fishers may bemore receptive to MPA management. If theperceptions are negative, then the fishers may beless receptive to MPA management, and changesin MPA management may be necessary. The indi-cator is also a useful measure of fish abundance,availability and size, and species composition.
How to collect the data
Information on this indicator is collected by con-ducting a survey of fishers. They may be asked:
Compared to ten years ago, what is the quanti-ty of available (target species)?
A lot less____ less_____ same_____ more_____a lot more______
The responses produce a five-point scale rangingfrom a lot less to a lot more with same in the mid-dle.
As an alternative, a self-anchoring scale can beused. This approach utilizes a ten-point, ladder-scale where 1 is the worst situation and 10 is the
best situation. The respondent is asked to identifyon the ladder-scale the situation at the presenttime and the situation at some time period in thepast (such as before the MPA or a period of yearsago). The number of and direction of changes inthe steps is a measure of the perceived change. Forthis approach the fisher is provided the followingscenario and question:
Given a scale where 1 indicates a situation wherenone of the target species are available and a 10indicates a situation where there are so many fishthat the fisher can catch as many as he/she wantsin a very short period of time, how would you rankconditions:
Today_______ Before the MPA_________
How to analyse and interpret results
Present the data from the first question dealingwith comparison in a table showing percentagedistribution of the responses to each category (i.e.a lot less, less).
To analyse the data from the self-anchoringmethod, calculate mean values for the differencesbetween each indicator for Today (T2) and the pre-project period (T1). Conduct a paired comparisont-test to determine whether the mean differencesbetween the two time periods are statisticallysignificant.
Indicator T1 T2 T2-T1 P
Availability of 4 6 2 <0.01target species
Strengths and limitations
A limitation of this indicator is that fishers whohave fished on target species in an impacted (tar-get) area over the time period being evaluated mustbe present and willing to respond to the questions.Also, every individual’s baseline for assessing
Outputs
� Table of graded ordinal judgement oflocal fisher perception of fish harvest.
� Strengths and limitations.
Requirements
� Survey form.
� List of fishers to be surveyed.
� Interviewers.
� Paper/pencil.
� Ladder-scale diagram.
SOCIO-ECONOMIC INDICATOR Perceptions of local resource harvest
GOAL 1
1B
Relates togoals andobjectives
S5
1
3Dif
ficu
lty Rating
1–5
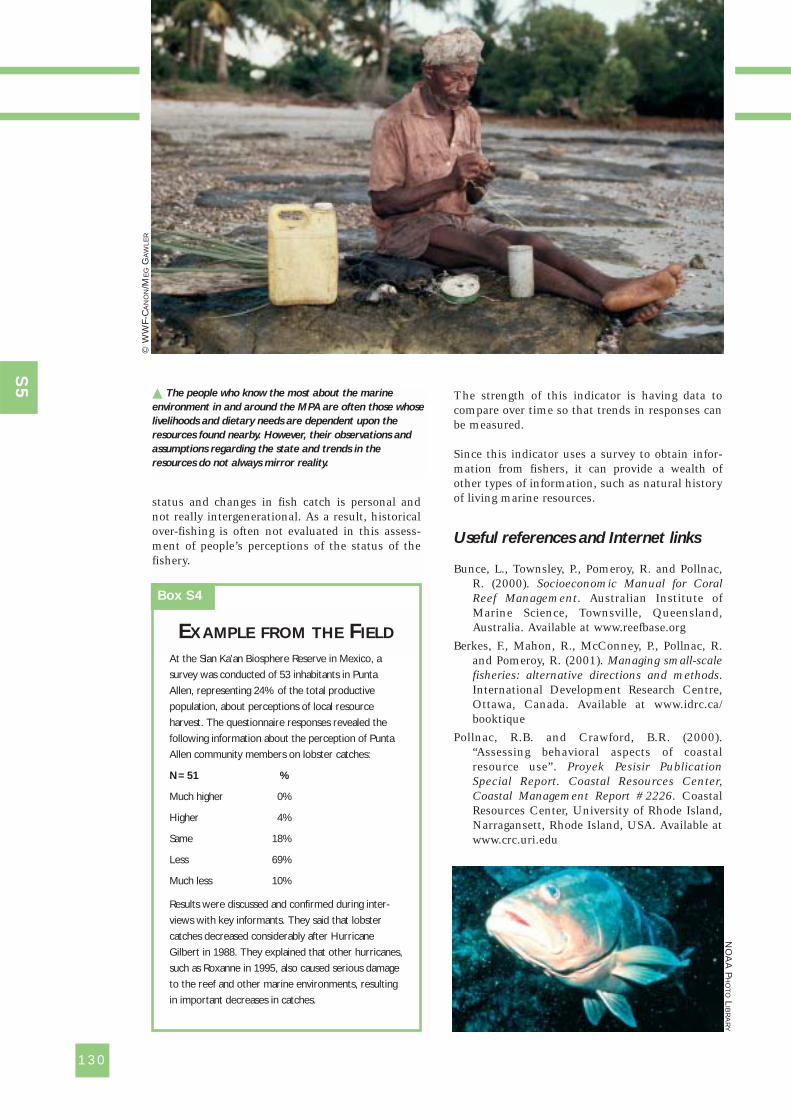
status and changes in fish catch is personal andnot really intergenerational. As a result, historicalover-fishing is often not evaluated in this assess-ment of people’s perceptions of the status of thefishery.
The strength of this indicator is having data tocompare over time so that trends in responses canbe measured.
Since this indicator uses a survey to obtain infor-mation from fishers, it can provide a wealth ofother types of information, such as natural historyof living marine resources.
Useful references and Internet links
Bunce, L., Townsley, P., Pomeroy, R. and Pollnac,R. (2000). Socioeconomic Manual for CoralReef Management. Australian Institute ofMarine Science, Townsville, Queensland,Australia. Available at www.reefbase.org
Berkes, F., Mahon, R., McConney, P., Pollnac, R.and Pomeroy, R. (2001). Managing small-scalefisheries: alternative directions and methods.International Development Research Centre,Ottawa, Canada. Available at www.idrc.ca/booktique
Pollnac, R.B. and Crawford, B.R. (2000).“Assessing behavioral aspects of coastalresource use”. Proyek Pesisir PublicationSpecial Report. Coastal Resources Center,Coastal Management Report #2226. CoastalResources Center, University of Rhode Island,Narragansett, Rhode Island, USA. Available atwww.crc.uri.edu
130
� The people who know the most about the marine
environment in and around the MPA are often those whose
livelihoods and dietary needs are dependent upon the
resources found nearby. However, their observations and
assumptions regarding the state and trends in the
resources do not always mirror reality.
At the Sian Ka’an Biosphere Reserve in Mexico, a
survey was conducted of 53 inhabitants in Punta
Allen, representing 24% of the total productive
population, about perceptions of local resource
harvest. The questionnaire responses revealed the
following information about the perception of Punta
Allen community members on lobster catches:
N=51 %
Much higher 0%
Higher 4%
Same 18%
Less 69%
Much less 10%
Results were discussed and confirmed during inter-
views with key informants. They said that lobster
catches decreased considerably after Hurricane
Gilbert in 1988. They explained that other hurricanes,
such as Roxanne in 1995, also caused serious damage
to the reef and other marine environments, resulting
in important decreases in catches.
EXAMPLE FROM THE FIELD
Box S4
S5
NO
AA
PH
OT
OL
IBR
AR
Y
© W
WF-
CA
NO
N/M
EG
GA
WLE
R
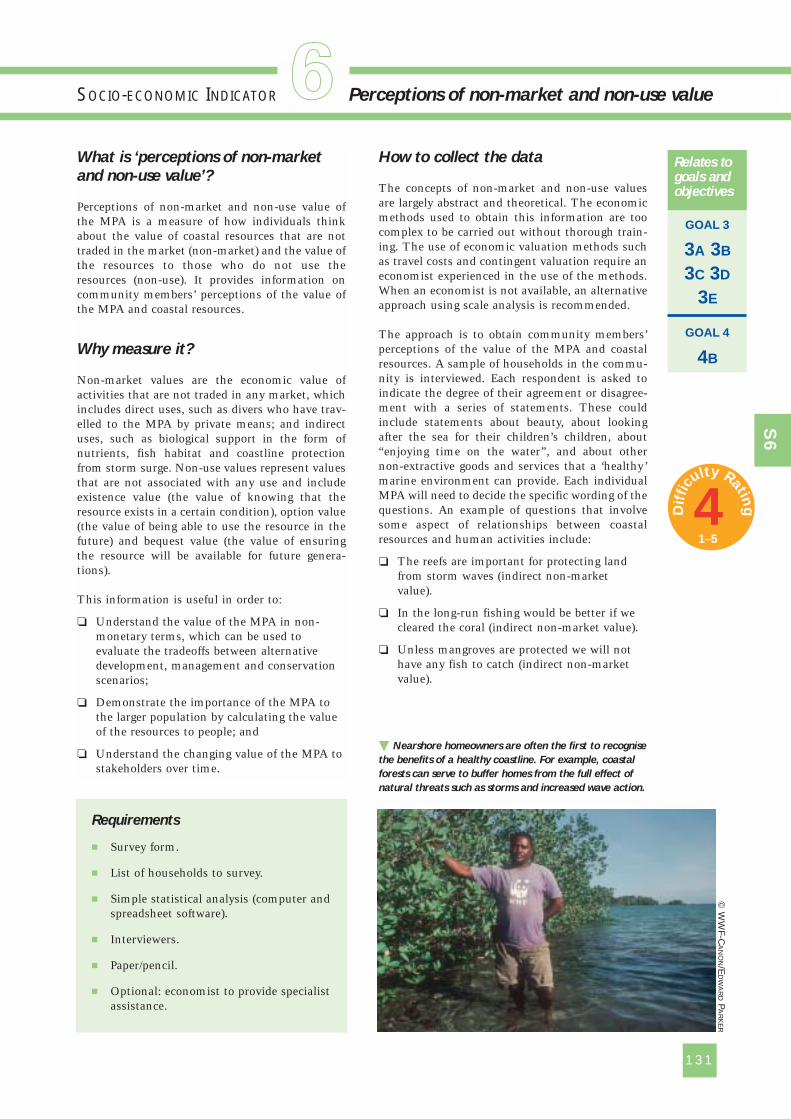
131
What is ‘perceptions of non-market
and non-use value’?
Perceptions of non-market and non-use value ofthe MPA is a measure of how individuals thinkabout the value of coastal resources that are nottraded in the market (non-market) and the value ofthe resources to those who do not use theresources (non-use). It provides information oncommunity members’ perceptions of the value ofthe MPA and coastal resources.
Why measure it?
Non-market values are the economic value ofactivities that are not traded in any market, whichincludes direct uses, such as divers who have trav-elled to the MPA by private means; and indirectuses, such as biological support in the form ofnutrients, fish habitat and coastline protectionfrom storm surge. Non-use values represent valuesthat are not associated with any use and includeexistence value (the value of knowing that theresource exists in a certain condition), option value(the value of being able to use the resource in thefuture) and bequest value (the value of ensuringthe resource will be available for future genera-tions).
This information is useful in order to:
❏ Understand the value of the MPA in non-monetary terms, which can be used toevaluate the tradeoffs between alternativedevelopment, management and conservationscenarios;
❏ Demonstrate the importance of the MPA tothe larger population by calculating the valueof the resources to people; and
❏ Understand the changing value of the MPA tostakeholders over time.
How to collect the data
The concepts of non-market and non-use valuesare largely abstract and theoretical. The economicmethods used to obtain this information are toocomplex to be carried out without thorough train-ing. The use of economic valuation methods suchas travel costs and contingent valuation require aneconomist experienced in the use of the methods.When an economist is not available, an alternativeapproach using scale analysis is recommended.
The approach is to obtain community members’perceptions of the value of the MPA and coastalresources. A sample of households in the commu-nity is interviewed. Each respondent is asked toindicate the degree of their agreement or disagree-ment with a series of statements. These couldinclude statements about beauty, about lookingafter the sea for their children’s children, about“enjoying time on the water”, and about othernon-extractive goods and services that a ‘healthy’marine environment can provide. Each individualMPA will need to decide the specific wording of thequestions. An example of questions that involvesome aspect of relationships between coastalresources and human activities include:
❏ The reefs are important for protecting landfrom storm waves (indirect non-marketvalue).
❏ In the long-run fishing would be better if wecleared the coral (indirect non-market value).
❏ Unless mangroves are protected we will nothave any fish to catch (indirect non-marketvalue).
Requirements
� Survey form.
� List of households to survey.
� Simple statistical analysis (computer andspreadsheet software).
� Interviewers.
� Paper/pencil.
� Optional: economist to provide specialistassistance.
� Nearshore homeowners are often the first to recognise
the benefits of a healthy coastline. For example, coastal
forests can serve to buffer homes from the full effect of
natural threats such as storms and increased wave action.
SOCIO-ECONOMIC INDICATOR Perceptions of non-market and non-use value
GOAL 3
3A 3B
3C 3D
3E
GOAL 4
4B
Relates togoals andobjectives
S6
1©
WW
F-CA
NO
N/ED
WA
RD
PA
RK
ER
4Dif
ficu
lty Rating
1–5
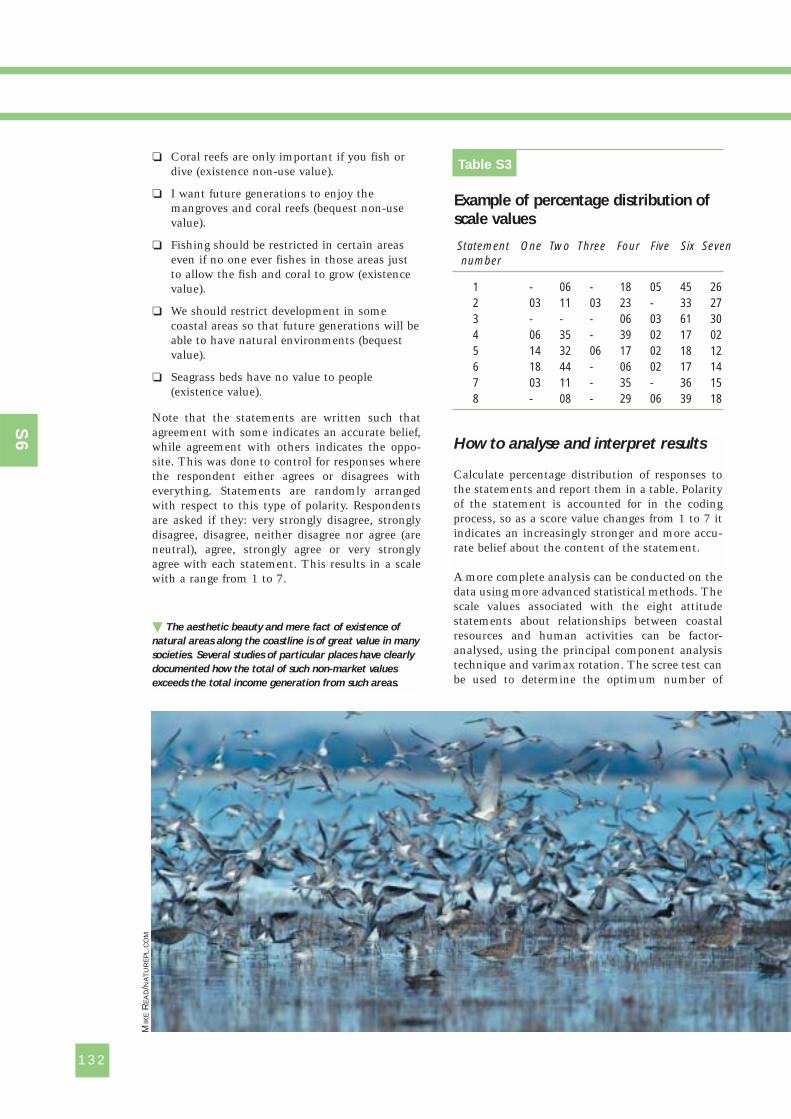
❏ Coral reefs are only important if you fish ordive (existence non-use value).
❏ I want future generations to enjoy themangroves and coral reefs (bequest non-usevalue).
❏ Fishing should be restricted in certain areaseven if no one ever fishes in those areas justto allow the fish and coral to grow (existencevalue).
❏ We should restrict development in somecoastal areas so that future generations will beable to have natural environments (bequestvalue).
❏ Seagrass beds have no value to people(existence value).
Note that the statements are written such thatagreement with some indicates an accurate belief,while agreement with others indicates the oppo-site. This was done to control for responses wherethe respondent either agrees or disagrees witheverything. Statements are randomly arrangedwith respect to this type of polarity. Respondentsare asked if they: very strongly disagree, stronglydisagree, disagree, neither disagree nor agree (areneutral), agree, strongly agree or very stronglyagree with each statement. This results in a scalewith a range from 1 to 7.
How to analyse and interpret results
Calculate percentage distribution of responses tothe statements and report them in a table. Polarityof the statement is accounted for in the codingprocess, so as a score value changes from 1 to 7 itindicates an increasingly stronger and more accu-rate belief about the content of the statement.
A more complete analysis can be conducted on thedata using more advanced statistical methods. Thescale values associated with the eight attitudestatements about relationships between coastalresources and human activities can be factor-analysed, using the principal component analysistechnique and varimax rotation. The scree test canbe used to determine the optimum number of
132
� The aesthetic beauty and mere fact of existence of
natural areas along the coastline is of great value in many
societies. Several studies of particular places have clearly
documented how the total of such non-market values
exceeds the total income generation from such areas.
Table S3
Example of percentage distribution of scale values
Statement One Two Three Four Five Six Sevennumber
1 - 06 - 18 05 45 262 03 11 03 23 - 33 273 - - - 06 03 61 304 06 35 - 39 02 17 025 14 32 06 17 02 18 126 18 44 - 06 02 17 147 03 11 - 35 - 36 158 - 08 - 29 06 39 18
S6
MIK
ER
EA
D/N
AT
UR
EP
L.C
OM
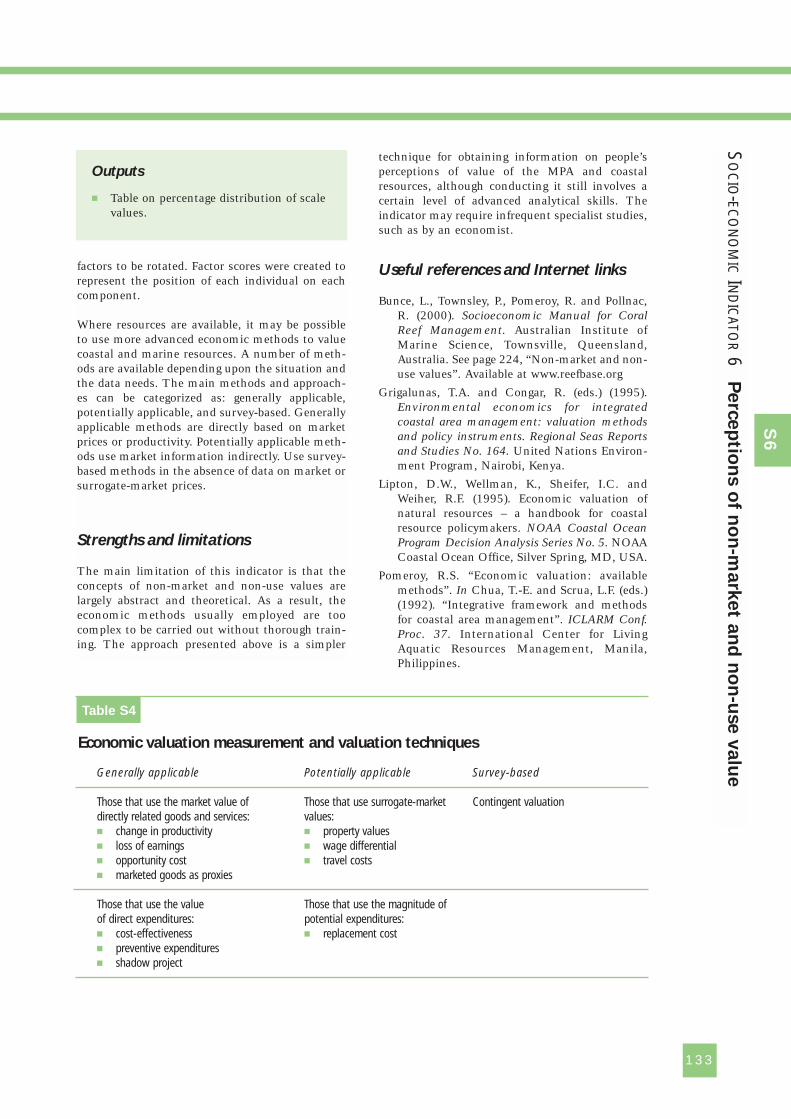
133
SO
CIO-EC
ON
OM
ICIN
DIC
ATOR
6P
erc
ep
tion
s o
f no
n-m
ark
et a
nd
no
n-u
se v
alu
e
factors to be rotated. Factor scores were created torepresent the position of each individual on eachcomponent.
Where resources are available, it may be possibleto use more advanced economic methods to valuecoastal and marine resources. A number of meth-ods are available depending upon the situation andthe data needs. The main methods and approach-es can be categorized as: generally applicable,potentially applicable, and survey-based. Generallyapplicable methods are directly based on marketprices or productivity. Potentially applicable meth-ods use market information indirectly. Use survey-based methods in the absence of data on market orsurrogate-market prices.
Strengths and limitations
The main limitation of this indicator is that theconcepts of non-market and non-use values arelargely abstract and theoretical. As a result, theeconomic methods usually employed are toocomplex to be carried out without thorough train-ing. The approach presented above is a simpler
technique for obtaining information on people’sperceptions of value of the MPA and coastalresources, although conducting it still involves acertain level of advanced analytical skills. Theindicator may require infrequent specialist studies,such as by an economist.
Useful references and Internet links
Bunce, L., Townsley, P., Pomeroy, R. and Pollnac,R. (2000). Socioeconomic Manual for CoralReef Management. Australian Institute ofMarine Science, Townsville, Queensland,Australia. See page 224, “Non-market and non-use values”. Available at www.reefbase.org
Grigalunas, T.A. and Congar, R. (eds.) (1995).Environmental economics for integratedcoastal area management: valuation methodsand policy instruments. Regional Seas Reportsand Studies No. 164. United Nations Environ-ment Program, Nairobi, Kenya.
Lipton, D.W., Wellman, K., Sheifer, I.C. andWeiher, R.F. (1995). Economic valuation ofnatural resources – a handbook for coastalresource policymakers. NOAA Coastal OceanProgram Decision Analysis Series No. 5. NOAACoastal Ocean Office, Silver Spring, MD, USA.
Pomeroy, R.S. “Economic valuation: availablemethods”. In Chua, T.-E. and Scrua, L.F. (eds.)(1992). “Integrative framework and methodsfor coastal area management”. ICLARM Conf.Proc. 37. International Center for LivingAquatic Resources Management, Manila,Philippines.
Table S4
Economic valuation measurement and valuation techniques
Generally applicable Potentially applicable Survey-based
Those that use the market value of Those that use surrogate-market Contingent valuationdirectly related goods and services: values:� change in productivity � property values� loss of earnings � wage differential� opportunity cost � travel costs� marketed goods as proxies
Those that use the value Those that use the magnitude of of direct expenditures: potential expenditures:� cost-effectiveness � replacement cost� preventive expenditures� shadow project
Outputs
� Table on percentage distribution of scalevalues.
S6
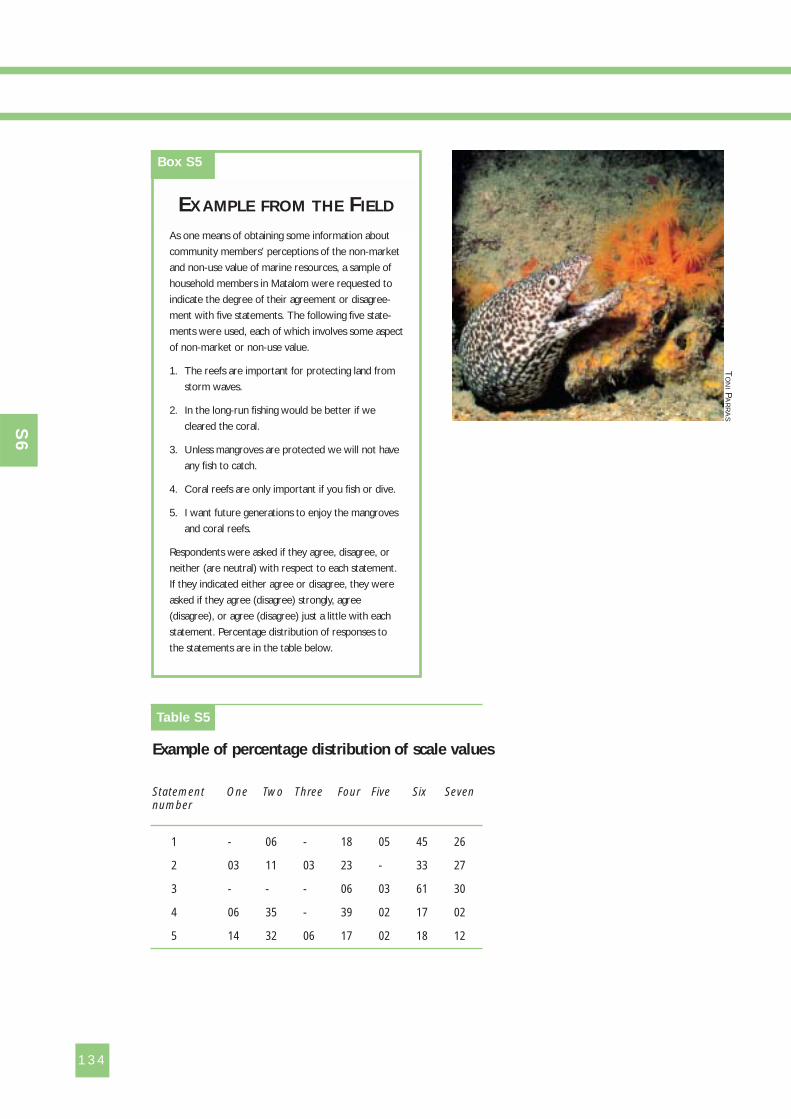
134
Table S5
Example of percentage distribution of scale values
Statement One Two Three Four Five Six Sevennumber
1 - 06 - 18 05 45 26
2 03 11 03 23 - 33 27
3 - - - 06 03 61 30
4 06 35 - 39 02 17 02
5 14 32 06 17 02 18 12
As one means of obtaining some information about
community members’ perceptions of the non-market
and non-use value of marine resources, a sample of
household members in Matalom were requested to
indicate the degree of their agreement or disagree-
ment with five statements. The following five state-
ments were used, each of which involves some aspect
of non-market or non-use value.
1. The reefs are important for protecting land from
storm waves.
2. In the long-run fishing would be better if we
cleared the coral.
3. Unless mangroves are protected we will not have
any fish to catch.
4. Coral reefs are only important if you fish or dive.
5. I want future generations to enjoy the mangroves
and coral reefs.
Respondents were asked if they agree, disagree, or
neither (are neutral) with respect to each statement.
If they indicated either agree or disagree, they were
asked if they agree (disagree) strongly, agree
(disagree), or agree (disagree) just a little with each
statement. Percentage distribution of responses to
the statements are in the table below.
EXAMPLE FROM THE FIELD
Box S5
S6
TO
NIP
AR
RA
S
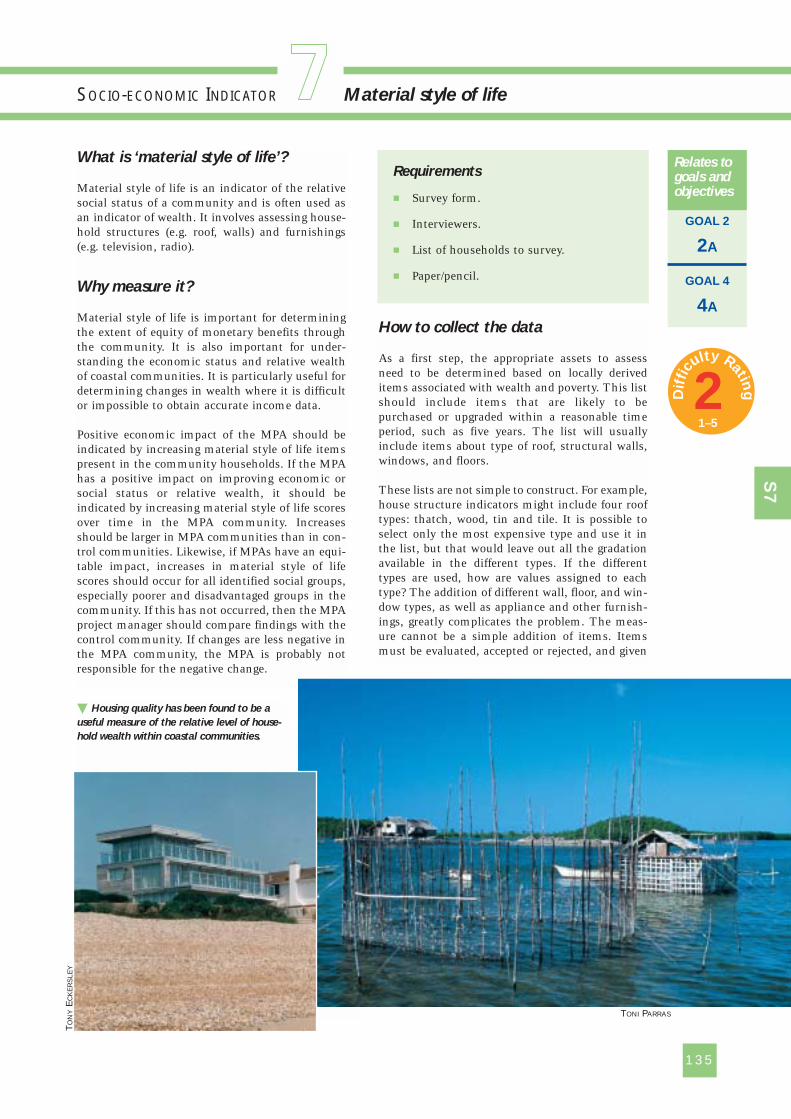
135
What is ‘material style of life’?
Material style of life is an indicator of the relativesocial status of a community and is often used asan indicator of wealth. It involves assessing house-hold structures (e.g. roof, walls) and furnishings(e.g. television, radio).
Why measure it?
Material style of life is important for determiningthe extent of equity of monetary benefits throughthe community. It is also important for under-standing the economic status and relative wealthof coastal communities. It is particularly useful fordetermining changes in wealth where it is difficultor impossible to obtain accurate income data.
Positive economic impact of the MPA should beindicated by increasing material style of life itemspresent in the community households. If the MPAhas a positive impact on improving economic orsocial status or relative wealth, it should beindicated by increasing material style of life scoresover time in the MPA community. Increasesshould be larger in MPA communities than in con-trol communities. Likewise, if MPAs have an equi-table impact, increases in material style of lifescores should occur for all identified social groups,especially poorer and disadvantaged groups in thecommunity. If this has not occurred, then the MPAproject manager should compare findings with thecontrol community. If changes are less negative inthe MPA community, the MPA is probably notresponsible for the negative change.
How to collect the data
As a first step, the appropriate assets to assessneed to be determined based on locally deriveditems associated with wealth and poverty. This listshould include items that are likely to bepurchased or upgraded within a reasonable timeperiod, such as five years. The list will usuallyinclude items about type of roof, structural walls,windows, and floors.
These lists are not simple to construct. For example,house structure indicators might include four rooftypes: thatch, wood, tin and tile. It is possible toselect only the most expensive type and use it inthe list, but that would leave out all the gradationavailable in the different types. If the differenttypes are used, how are values assigned to eachtype? The addition of different wall, floor, and win-dow types, as well as appliance and other furnish-ings, greatly complicates the problem. The meas-ure cannot be a simple addition of items. Itemsmust be evaluated, accepted or rejected, and given
� Housing quality has been found to be a
useful measure of the relative level of house-
hold wealth within coastal communities.
Requirements
� Survey form.
� Interviewers.
� List of households to survey.
� Paper/pencil.
SOCIO-ECONOMIC INDICATOR Material style of life
GOAL 2
2A
GOAL 4
4A
Relates togoals andobjectives
S7
1T
ON
YE
CK
ER
SLE
Y
TONI PARRAS
2Dif
ficu
lty Rating
1–5
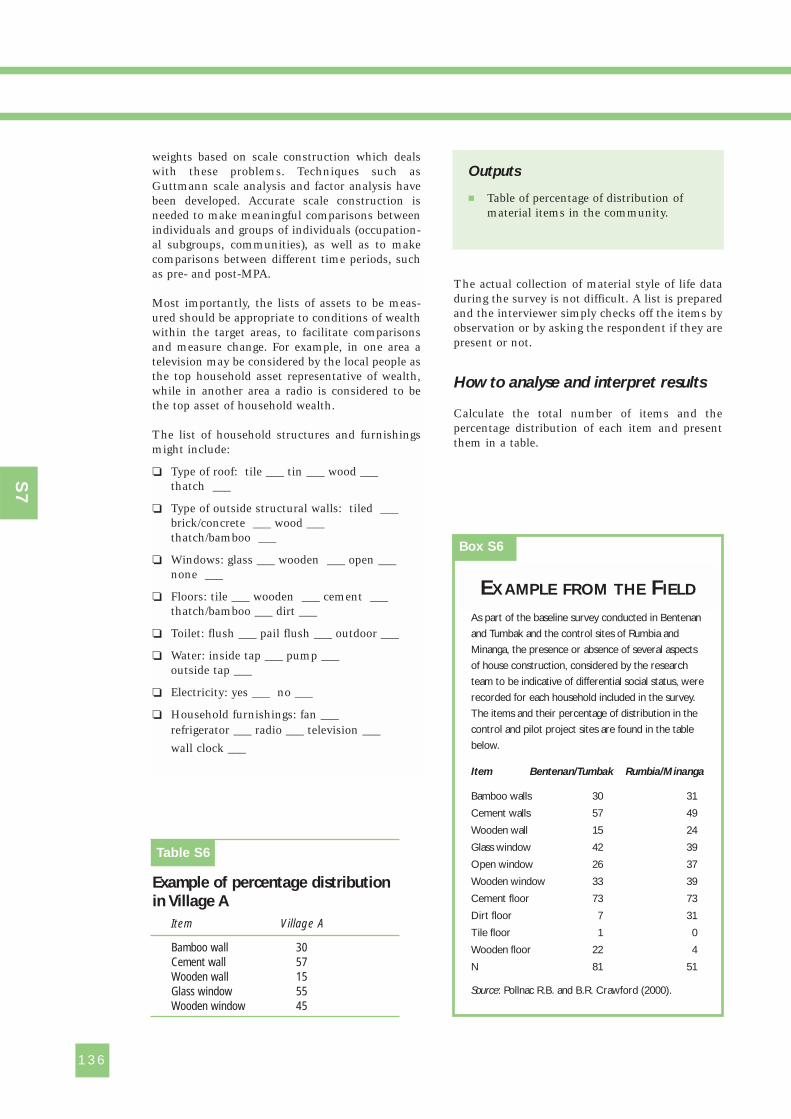
weights based on scale construction which dealswith these problems. Techniques such asGuttmann scale analysis and factor analysis havebeen developed. Accurate scale construction isneeded to make meaningful comparisons betweenindividuals and groups of individuals (occupation-al subgroups, communities), as well as to makecomparisons between different time periods, suchas pre- and post-MPA.
Most importantly, the lists of assets to be meas-ured should be appropriate to conditions of wealthwithin the target areas, to facilitate comparisonsand measure change. For example, in one area atelevision may be considered by the local people asthe top household asset representative of wealth,while in another area a radio is considered to bethe top asset of household wealth.
The list of household structures and furnishingsmight include:
❏ Type of roof: tile ___ tin ___ wood ___ thatch ___
❏ Type of outside structural walls: tiled ___brick/concrete ___ wood ___ thatch/bamboo ___
❏ Windows: glass ___ wooden ___ open ___none ___
❏ Floors: tile ___ wooden ___ cement ___thatch/bamboo ___ dirt ___
❏ Toilet: flush ___ pail flush ___ outdoor ___
❏ Water: inside tap ___ pump ___ outside tap ___
❏ Electricity: yes ___ no ___
❏ Household furnishings: fan ___ refrigerator ___ radio ___ television ___
wall clock ___
The actual collection of material style of life dataduring the survey is not difficult. A list is preparedand the interviewer simply checks off the items byobservation or by asking the respondent if they arepresent or not.
How to analyse and interpret results
Calculate the total number of items and thepercentage distribution of each item and presentthem in a table.
136
Outputs
� Table of percentage of distribution ofmaterial items in the community.
Table S6
Example of percentage distributionin Village A
Item Village A
Bamboo wall 30Cement wall 57Wooden wall 15Glass window 55Wooden window 45
As part of the baseline survey conducted in Bentenan
and Tumbak and the control sites of Rumbia and
Minanga, the presence or absence of several aspects
of house construction, considered by the research
team to be indicative of differential social status, were
recorded for each household included in the survey.
The items and their percentage of distribution in the
control and pilot project sites are found in the table
below.
Item Bentenan/Tumbak Rumbia/Minanga
Bamboo walls 30 31
Cement walls 57 49
Wooden wall 15 24
Glass window 42 39
Open window 26 37
Wooden window 33 39
Cement floor 73 73
Dirt floor 7 31
Tile floor 1 0
Wooden floor 22 4
N 81 51
Source: Pollnac R.B. and B.R. Crawford (2000).
EXAMPLE FROM THE FIELD
Box S6
S7
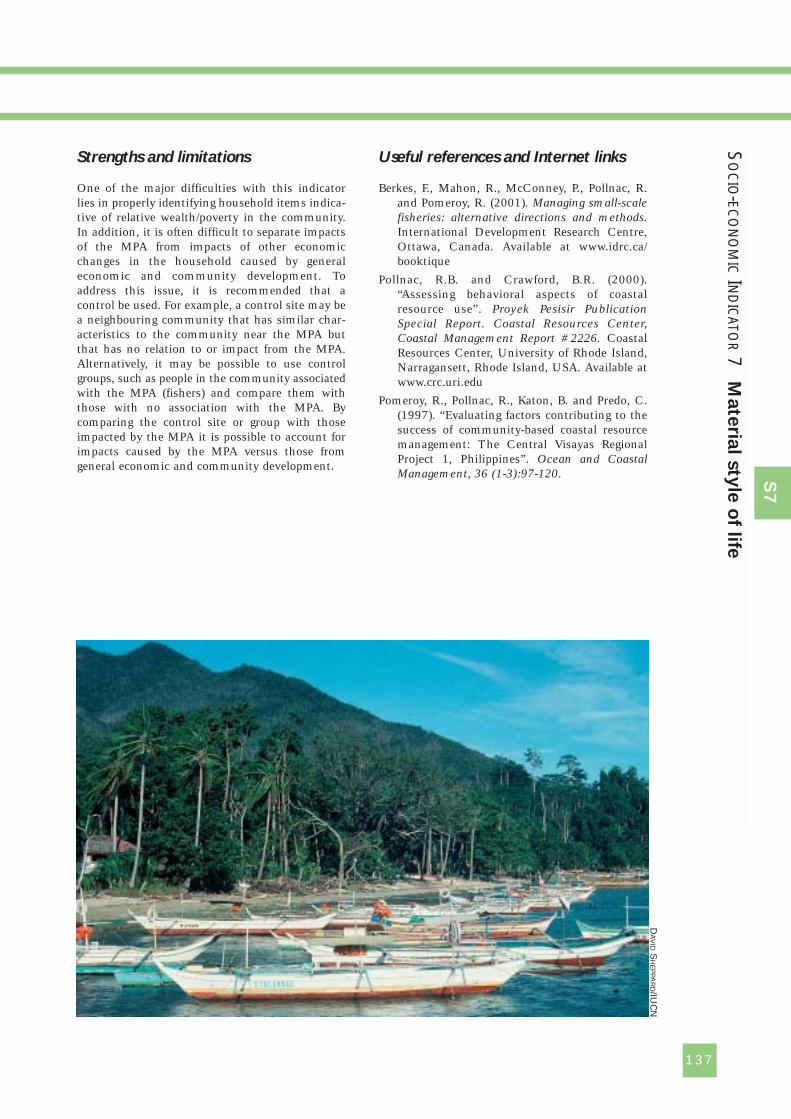
137
SO
CIO-EC
ON
OM
ICIN
DIC
ATOR
7M
ate
rial s
tyle
of life
Strengths and limitations
One of the major difficulties with this indicatorlies in properly identifying household items indica-tive of relative wealth/poverty in the community.In addition, it is often difficult to separate impactsof the MPA from impacts of other economicchanges in the household caused by generaleconomic and community development. Toaddress this issue, it is recommended that acontrol be used. For example, a control site may bea neighbouring community that has similar char-acteristics to the community near the MPA butthat has no relation to or impact from the MPA.Alternatively, it may be possible to use controlgroups, such as people in the community associatedwith the MPA (fishers) and compare them withthose with no association with the MPA. Bycomparing the control site or group with thoseimpacted by the MPA it is possible to account forimpacts caused by the MPA versus those fromgeneral economic and community development.
Useful references and Internet links
Berkes, F., Mahon, R., McConney, P., Pollnac, R.and Pomeroy, R. (2001). Managing small-scalefisheries: alternative directions and methods.International Development Research Centre,Ottawa, Canada. Available at www.idrc.ca/booktique
Pollnac, R.B. and Crawford, B.R. (2000).“Assessing behavioral aspects of coastalresource use”. Proyek Pesisir PublicationSpecial Report. Coastal Resources Center,Coastal Management Report #2226. CoastalResources Center, University of Rhode Island,Narragansett, Rhode Island, USA. Available atwww.crc.uri.edu
Pomeroy, R., Pollnac, R., Katon, B. and Predo, C.(1997). “Evaluating factors contributing to thesuccess of community-based coastal resourcemanagement: The Central Visayas RegionalProject 1, Philippines”. Ocean and CoastalManagement, 36 (1-3):97-120. S
7
DA
VID
SH
EP
PAR
D/IUC
N
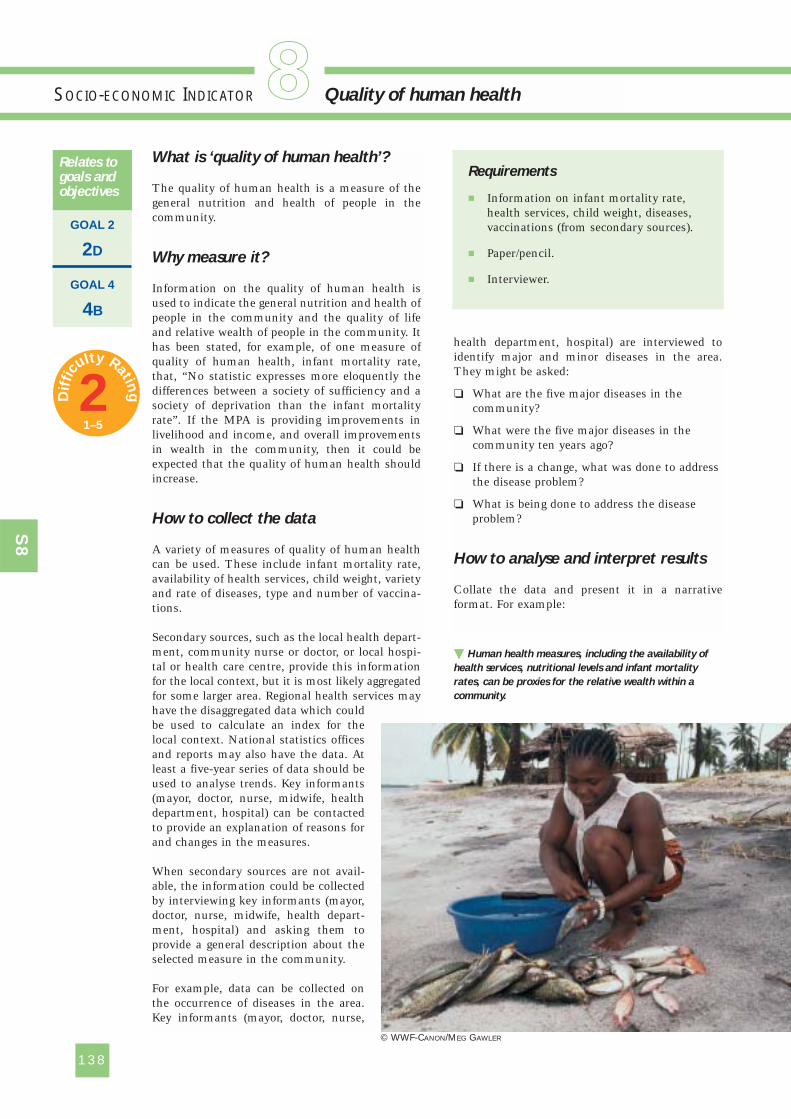
What is ‘quality of human health’?
The quality of human health is a measure of thegeneral nutrition and health of people in thecommunity.
Why measure it?
Information on the quality of human health isused to indicate the general nutrition and health ofpeople in the community and the quality of lifeand relative wealth of people in the community. Ithas been stated, for example, of one measure ofquality of human health, infant mortality rate,that, “No statistic expresses more eloquently thedifferences between a society of sufficiency and asociety of deprivation than the infant mortalityrate”. If the MPA is providing improvements inlivelihood and income, and overall improvementsin wealth in the community, then it could beexpected that the quality of human health shouldincrease.
How to collect the data
A variety of measures of quality of human healthcan be used. These include infant mortality rate,availability of health services, child weight, varietyand rate of diseases, type and number of vaccina-tions.
Secondary sources, such as the local health depart-ment, community nurse or doctor, or local hospi-tal or health care centre, provide this informationfor the local context, but it is most likely aggregatedfor some larger area. Regional health services mayhave the disaggregated data which couldbe used to calculate an index for thelocal context. National statistics officesand reports may also have the data. Atleast a five-year series of data should beused to analyse trends. Key informants(mayor, doctor, nurse, midwife, healthdepartment, hospital) can be contactedto provide an explanation of reasons forand changes in the measures.
When secondary sources are not avail-able, the information could be collectedby interviewing key informants (mayor,doctor, nurse, midwife, health depart-ment, hospital) and asking them toprovide a general description about theselected measure in the community.
For example, data can be collected onthe occurrence of diseases in the area.Key informants (mayor, doctor, nurse,
health department, hospital) are interviewed toidentify major and minor diseases in the area.They might be asked:
❏ What are the five major diseases in thecommunity?
❏ What were the five major diseases in thecommunity ten years ago?
❏ If there is a change, what was done to addressthe disease problem?
❏ What is being done to address the diseaseproblem?
How to analyse and interpret results
Collate the data and present it in a narrativeformat. For example:
138
SOCIO-ECONOMIC INDICATOR Quality of human health
GOAL 2
2D
GOAL 4
4B
Relates togoals andobjectives
Requirements
� Information on infant mortality rate,health services, child weight, diseases,vaccinations (from secondary sources).
� Paper/pencil.
� Interviewer.
� Human health measures, including the availability of
health services, nutritional levels and infant mortality
rates, can be proxies for the relative wealth within a
community.
S8
1
© WWF-CANON/MEG GAWLER
2Dif
ficu
lty Rating
1–5
139
The town of Bontoc had an infant mortalityrate of 10 infant deaths per 1,000 births in2001. Five years ago (1996), the infantmortality rate was 18 infant deaths per 1,000births. In 1999, a health clinic staffed by anurse was established in the community. Thenurse provides minor medical care andmidwife services. A doctor visits the clinic oneday per week. The people of the communitypooled their own time and funds to build thehealth clinic.
Outputs
� Narrative presentation on quality ofhuman health in the community.
The infant mortality rate in Placencia was one in 200
births in 1990. The MPA was implemented in 1994.
As a result of the MPA, new occupations were created
in Placencia such as dive master, fly fishing guide, and
boat guide. These new occupations have raised the
income level of households in the village and a doctor
arrived in the community in 1998. In the 2000 national
census, the infant mortality rate had improved in
Placencia to one in 400 births.
EXAMPLE FROM THE FIELD
Box S7
S8
SO
CIO-EC
ON
OM
ICIN
DIC
ATOR
8Q
uality
of h
um
an
health
Strengths and limitations
It may be difficult to obtain the secondary data ata village/community level as data is often reportedin an aggregated form. The original source of thedata will need to be contacted.
Useful references and Internet links
Bunce, L., Townsley, P., Pomeroy, R. and Pollnac,R. (2000). Socioeconomic Manual for CoralReef Management. Australian Institute ofMarine Science, Townsville, Queensland,Australia. Available at www.reefbase.org
Pollnac, R. (1998). “Rapid assessment of manage-ment parameters for coral reefs”. CoastalResources Center Coastal Management Report# 2205. Coastal Resources Center, Universityof Rhode Island, Narragansett, Rhode Island,USA. Available at www.crc.uri.edu
What is ‘household income distribution
by source’?
Household income distribution by source is ameasure of the principal sources of income forhouseholds in the community.
Why measure it?
An important part of understanding stakeholdercharacteristics are household livelihood andsources of income, which include the way peoplecombine the resources and assets at their disposalto make a living for themselves and their families.An understanding of these livelihood and incomesources will allow the MPA manager to bettermeasure and understand the impacts of the MPAon local households. It will allow the MPA managerto understand who is winning and losing,following shifts in household income sources, as aresult of the MPA. Shifting sources of income mayindicate a positive or negative impact of the MPAon households. Understanding income sourceswill also enable the manager to determine levels ofcommunity dependency on the resources, whichcan be used to make changes in MPA managementto diversify occupational and income structures.For example, if more than 90% of the communityare fishers, then the MPA might offer aquaculturetraining so they are less dependent on one income.
Also, if households perceive a decrease in thesources of household income over time, then thisinformation can be used to make changes in MPAmanagement to ensure that local households areobtaining adequate livelihoods and incomes.Finally, if households perceive an increase in thesources of household income over time, then thisinformation can be used in support of the MPA.
How to collect the data
Secondary data is first collected to determine themain sources of income for households and to sortout a few broad groups of people dependent onparticular income sources, such as fishing, farmingor dive operations. These data may be availablefrom census bureaus and local government offices.The following secondary data are most often avail-able:
❏ Economic status (ownership of key assetssuch as land, fishing boats) and aspects ofsocial status (particularly membership offormal organizations).
❏ Sources of livelihood of community members,which often only cover the principal economicactivity of individuals or households (specific
information on stakeholder households isoften available).
Primary data may need to be collected using asurvey or a semi-structured interview to gatherdata from a sample of households in the commu-nity on different sources of household income anddifferent sources of livelihood for households.Questions might include:
❏ What are the different sources of income inyour household? List all.
❏ What is the relative importance of each sourceof household income in the community?Provide percentages.
❏ What are the different types of livelihood ofthe household? List all.
❏ What is the relative importance of each liveli-hood activity to overall household income?Provide percentages.
This data is collected from a sample of householdsin the community over time to assess shiftingsources of income, especially those related to theMPA, such as fishing, dive operations, andtourism.
How to analyse and interpret results
Prepare tables of percentages showing the differentsources of household income, relative importanceof each source of household income in the com-munity, different types of livelihood of the house-hold, and relative importance of each livelihoodactivity to overall household income. Prepare anarrative text to explain the quantitative results.
140
SOCIO-ECONOMIC INDICATOR Household income distribution by source
GOAL 2
2A 2B
Relates togoals andobjectives
Requirements
� Survey form.
� Sample of community households to besurveyed.
� Interviewers.
� Notebook and pen.
S9
Outputs
� Narrative presentation on quality ofhuman health in the community.
1
3Dif
ficu
lty Rating
1–5
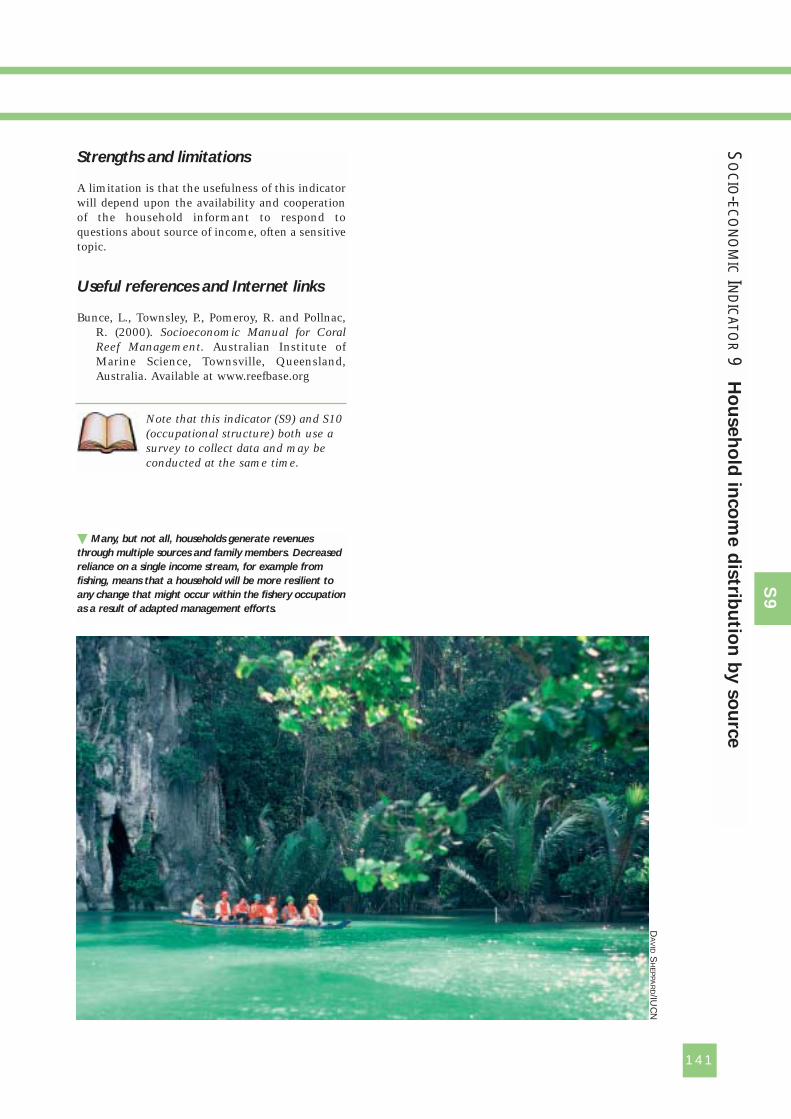
141
� Many, but not all, households generate revenues
through multiple sources and family members. Decreased
reliance on a single income stream, for example from
fishing, means that a household will be more resilient to
any change that might occur within the fishery occupation
as a result of adapted management efforts.
Strengths and limitations
A limitation is that the usefulness of this indicatorwill depend upon the availability and cooperationof the household informant to respond toquestions about source of income, often a sensitivetopic.
Useful references and Internet links
Bunce, L., Townsley, P., Pomeroy, R. and Pollnac,R. (2000). Socioeconomic Manual for CoralReef Management. Australian Institute ofMarine Science, Townsville, Queensland,Australia. Available at www.reefbase.org
Note that this indicator (S9) and S10(occupational structure) both use asurvey to collect data and may beconducted at the same time.
SO
CIO-EC
ON
OM
ICIN
DIC
ATOR
9H
ou
seh
old
inco
me d
istrib
utio
n b
y s
ou
rce
S9
DA
VID
SH
EP
PAR
D/IUC
N
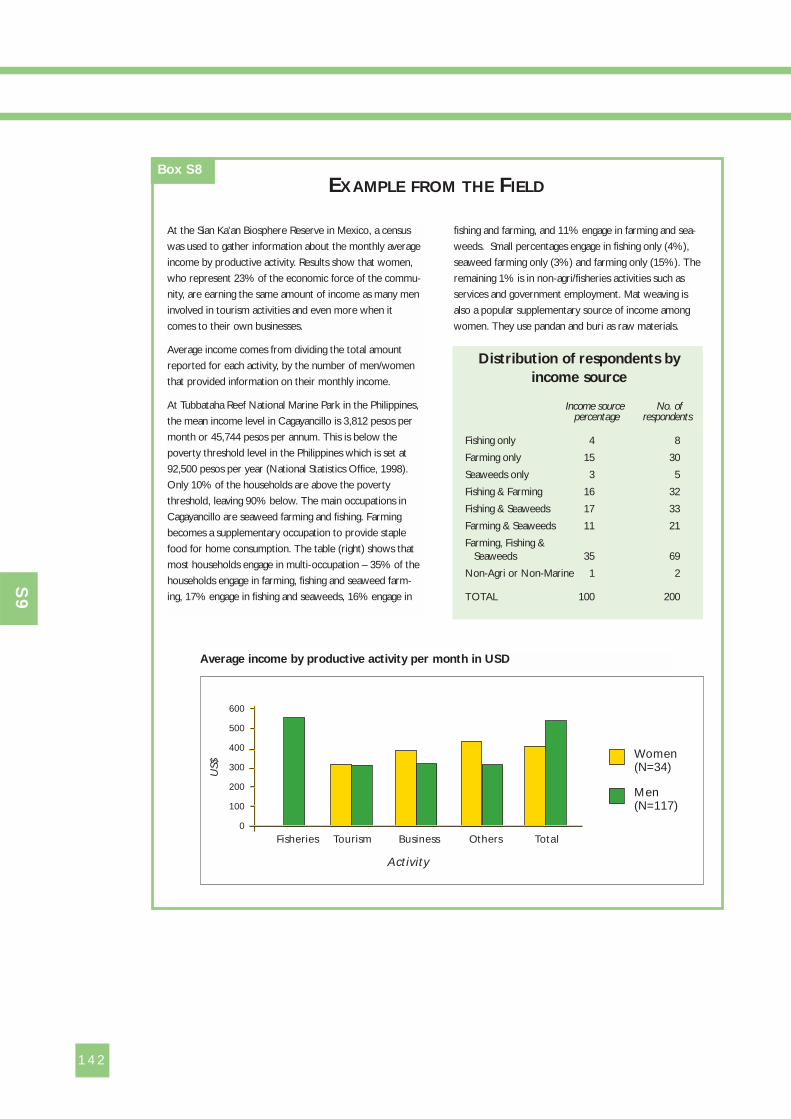
142
S9
At the Sian Ka’an Biosphere Reserve in Mexico, a census
was used to gather information about the monthly average
income by productive activity. Results show that women,
who represent 23% of the economic force of the commu-
nity, are earning the same amount of income as many men
involved in tourism activities and even more when it
comes to their own businesses.
Average income comes from dividing the total amount
reported for each activity, by the number of men/women
that provided information on their monthly income.
At Tubbataha Reef National Marine Park in the Philippines,
the mean income level in Cagayancillo is 3,812 pesos per
month or 45,744 pesos per annum. This is below the
poverty threshold level in the Philippines which is set at
92,500 pesos per year (National Statistics Office, 1998).
Only 10% of the households are above the poverty
threshold, leaving 90% below. The main occupations in
Cagayancillo are seaweed farming and fishing. Farming
becomes a supplementary occupation to provide staple
food for home consumption. The table (right) shows that
most households engage in multi-occupation – 35% of the
households engage in farming, fishing and seaweed farm-
ing, 17% engage in fishing and seaweeds, 16% engage in
fishing and farming, and 11% engage in farming and sea-
weeds. Small percentages engage in fishing only (4%),
seaweed farming only (3%) and farming only (15%). The
remaining 1% is in non-agri/fisheries activities such as
services and government employment. Mat weaving is
also a popular supplementary source of income among
women. They use pandan and buri as raw materials.
Distribution of respondents byincome source
Income source No. ofpercentage respondents
Fishing only 4 8
Farming only 15 30
Seaweeds only 3 5
Fishing & Farming 16 32
Fishing & Seaweeds 17 33
Farming & Seaweeds 11 21
Farming, Fishing & Seaweeds 35 69
Non-Agri or Non-Marine 1 2
TOTAL 100 200
Average income by productive activity per month in USD
Fisheries Tourism Business Others Total
Activity
Women(N=34)
Men(N=117)
600
500
400
300
200
100
0
US$
Box S8
EXAMPLE FROM THE FIELD
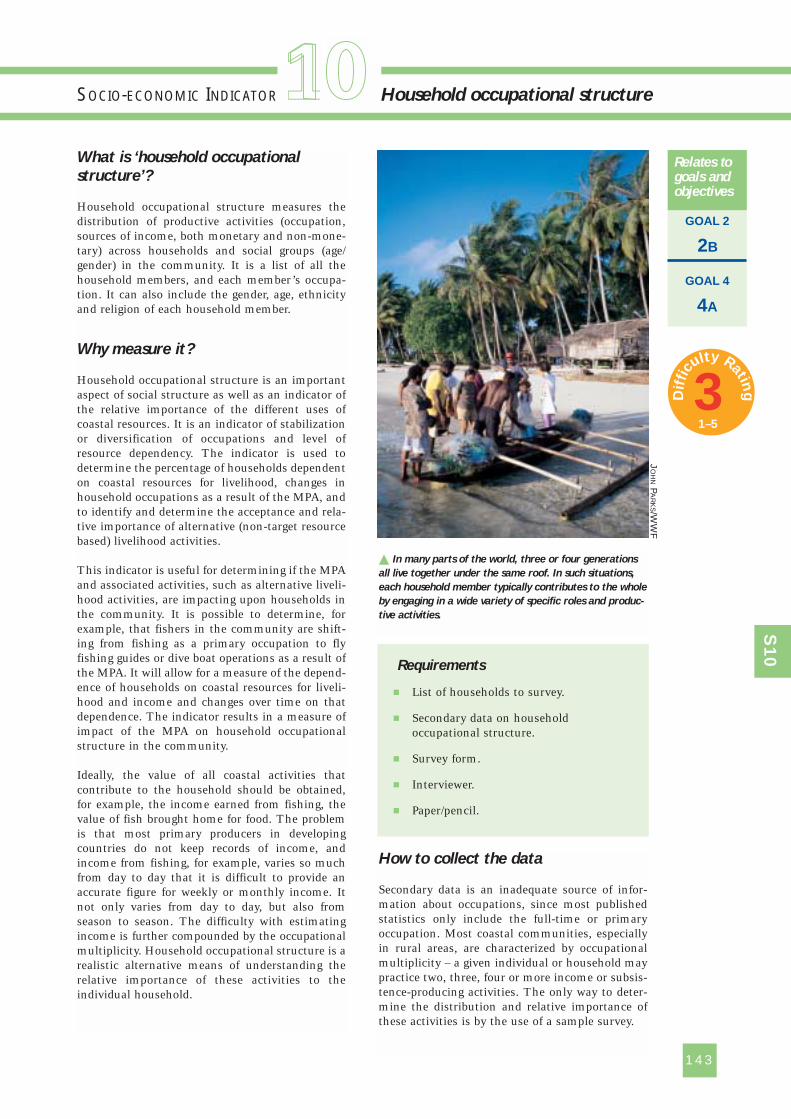
143
SOCIO-ECONOMIC INDICATOR Household occupational structure
GOAL 2
2B
GOAL 4
4A
Relates togoals andobjectives
S10
What is ‘household occupational
structure’?
Household occupational structure measures thedistribution of productive activities (occupation,sources of income, both monetary and non-mone-tary) across households and social groups (age/gender) in the community. It is a list of all thehousehold members, and each member’s occupa-tion. It can also include the gender, age, ethnicityand religion of each household member.
Why measure it?
Household occupational structure is an importantaspect of social structure as well as an indicator ofthe relative importance of the different uses ofcoastal resources. It is an indicator of stabilizationor diversification of occupations and level ofresource dependency. The indicator is used todetermine the percentage of households dependenton coastal resources for livelihood, changes inhousehold occupations as a result of the MPA, andto identify and determine the acceptance and rela-tive importance of alternative (non-target resourcebased) livelihood activities.
This indicator is useful for determining if the MPAand associated activities, such as alternative liveli-hood activities, are impacting upon households inthe community. It is possible to determine, forexample, that fishers in the community are shift-ing from fishing as a primary occupation to flyfishing guides or dive boat operations as a result ofthe MPA. It will allow for a measure of the depend-ence of households on coastal resources for liveli-hood and income and changes over time on thatdependence. The indicator results in a measure ofimpact of the MPA on household occupationalstructure in the community.
Ideally, the value of all coastal activities thatcontribute to the household should be obtained,for example, the income earned from fishing, thevalue of fish brought home for food. The problemis that most primary producers in developingcountries do not keep records of income, andincome from fishing, for example, varies so muchfrom day to day that it is difficult to provide anaccurate figure for weekly or monthly income. Itnot only varies from day to day, but also fromseason to season. The difficulty with estimatingincome is further compounded by the occupationalmultiplicity. Household occupational structure is arealistic alternative means of understanding therelative importance of these activities to theindividual household.
How to collect the data
Secondary data is an inadequate source of infor-mation about occupations, since most publishedstatistics only include the full-time or primaryoccupation. Most coastal communities, especiallyin rural areas, are characterized by occupationalmultiplicity – a given individual or household maypractice two, three, four or more income or subsis-tence-producing activities. The only way to deter-mine the distribution and relative importance ofthese activities is by the use of a sample survey.
Requirements
� List of households to survey.
� Secondary data on householdoccupational structure.
� Survey form.
� Interviewer.
� Paper/pencil.
� In many parts of the world, three or four generations
all live together under the same roof. In such situations,
each household member typically contributes to the whole
by engaging in a wide variety of specific roles and produc-
tive activities.
1 1J
OH
NP
AR
KS/W
WF
3Dif
ficu
lty Rating
1–5
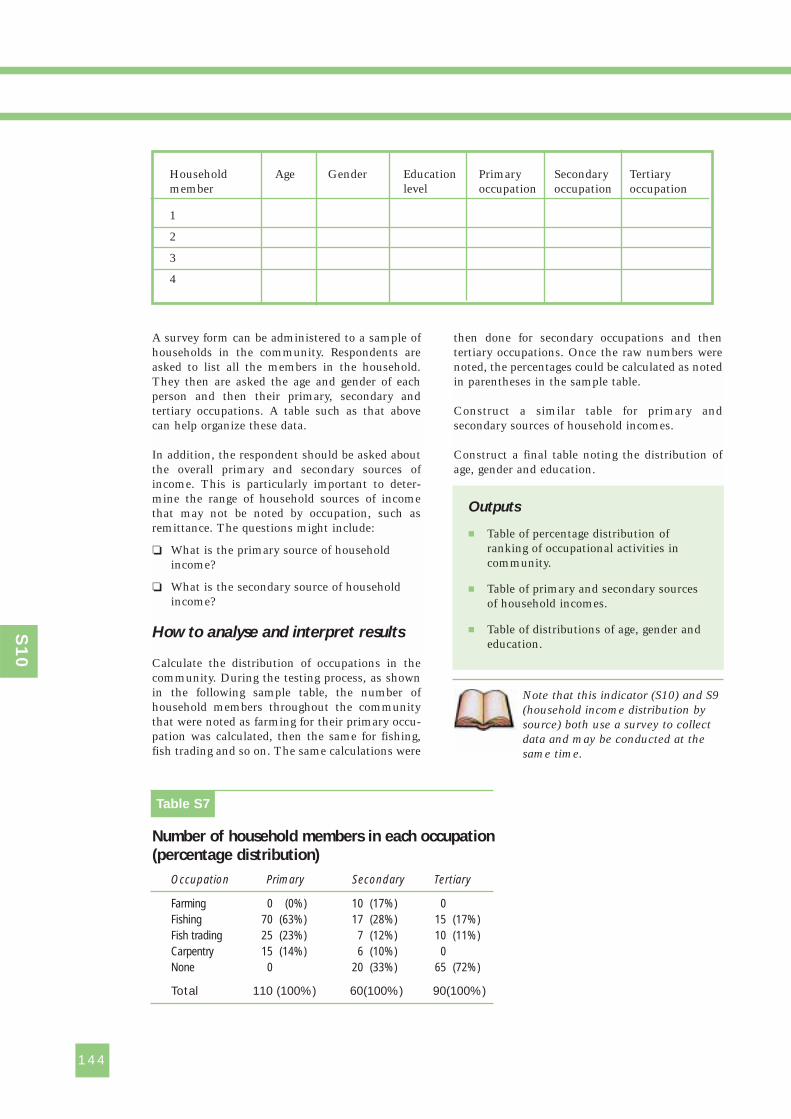
then done for secondary occupations and thentertiary occupations. Once the raw numbers werenoted, the percentages could be calculated as notedin parentheses in the sample table.
Construct a similar table for primary andsecondary sources of household incomes.
Construct a final table noting the distribution ofage, gender and education.
144
S10
Note that this indicator (S10) and S9(household income distribution bysource) both use a survey to collectdata and may be conducted at thesame time.
Household Age Gender Education Primary Secondary Tertiarymember level occupation occupation occupation
1
2
3
4
A survey form can be administered to a sample ofhouseholds in the community. Respondents areasked to list all the members in the household.They then are asked the age and gender of eachperson and then their primary, secondary andtertiary occupations. A table such as that abovecan help organize these data.
In addition, the respondent should be asked aboutthe overall primary and secondary sources ofincome. This is particularly important to deter-mine the range of household sources of incomethat may not be noted by occupation, such asremittance. The questions might include:
❏ What is the primary source of householdincome?
❏ What is the secondary source of householdincome?
How to analyse and interpret results
Calculate the distribution of occupations in thecommunity. During the testing process, as shownin the following sample table, the number ofhousehold members throughout the communitythat were noted as farming for their primary occu-pation was calculated, then the same for fishing,fish trading and so on. The same calculations were
Table S7
Number of household members in each occupation(percentage distribution)
Occupation Primary Secondary Tertiary
Farming 0 (0%) 10 (17%) 0Fishing 70 (63%) 17 (28%) 15 (17%)Fish trading 25 (23%) 7 (12%) 10 (11%)Carpentry 15 (14%) 6 (10%) 0None 0 20 (33%) 65 (72%)
Total 110 (100%) 60(100%) 90(100%)
Outputs
� Table of percentage distribution ofranking of occupational activities incommunity.
� Table of primary and secondary sourcesof household incomes.
� Table of distributions of age, gender andeducation.
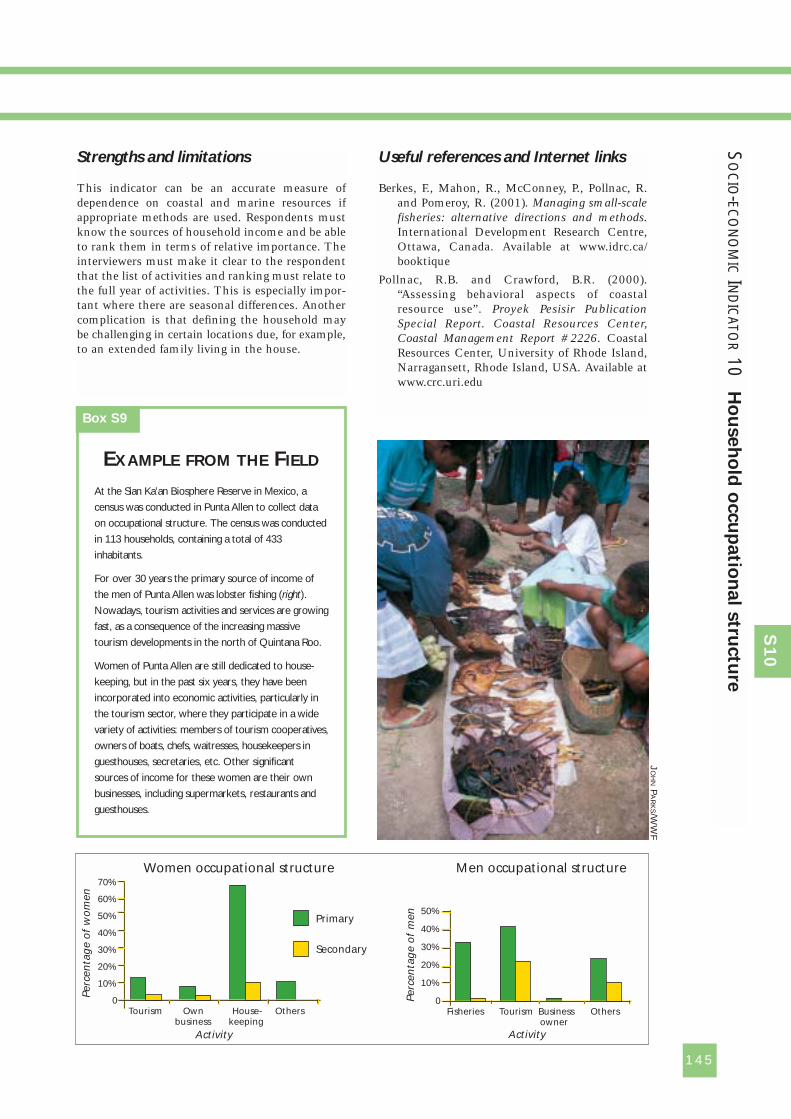
145
SO
CIO-EC
ON
OM
ICIN
DIC
ATOR
10H
ou
seh
old
occu
patio
nal s
tructu
re
S10
At the Sian Ka’an Biosphere Reserve in Mexico, a
census was conducted in Punta Allen to collect data
on occupational structure. The census was conducted
in 113 households, containing a total of 433
inhabitants.
For over 30 years the primary source of income of
the men of Punta Allen was lobster fishing (right).
Nowadays, tourism activities and services are growing
fast, as a consequence of the increasing massive
tourism developments in the north of Quintana Roo.
Women of Punta Allen are still dedicated to house-
keeping, but in the past six years, they have been
incorporated into economic activities, particularly in
the tourism sector, where they participate in a wide
variety of activities: members of tourism cooperatives,
owners of boats, chefs, waitresses, housekeepers in
guesthouses, secretaries, etc. Other significant
sources of income for these women are their own
businesses, including supermarkets, restaurants and
guesthouses.
EXAMPLE FROM THE FIELD
Box S9
Strengths and limitations
This indicator can be an accurate measure ofdependence on coastal and marine resources ifappropriate methods are used. Respondents mustknow the sources of household income and be ableto rank them in terms of relative importance. Theinterviewers must make it clear to the respondentthat the list of activities and ranking must relate tothe full year of activities. This is especially impor-tant where there are seasonal differences. Anothercomplication is that defining the household maybe challenging in certain locations due, for example,to an extended family living in the house.
JO
HN
PA
RK
S/WW
F
Perc
enta
ge
of
men
Perc
enta
ge
of
wo
men
Activity Activity
Fisheries Tourism Business Others owner
Tourism Own House- Others business keeping
70%
60%
50%
40%
30%
20%
10%
0
50%
40%
30%
20%
10%
0
Men occupational structureWomen occupational structure
Primary
Secondary
Useful references and Internet links
Berkes, F., Mahon, R., McConney, P., Pollnac, R.and Pomeroy, R. (2001). Managing small-scalefisheries: alternative directions and methods.International Development Research Centre,Ottawa, Canada. Available at www.idrc.ca/booktique
Pollnac, R.B. and Crawford, B.R. (2000).“Assessing behavioral aspects of coastalresource use”. Proyek Pesisir PublicationSpecial Report. Coastal Resources Center,Coastal Management Report #2226. CoastalResources Center, University of Rhode Island,Narragansett, Rhode Island, USA. Available atwww.crc.uri.edu
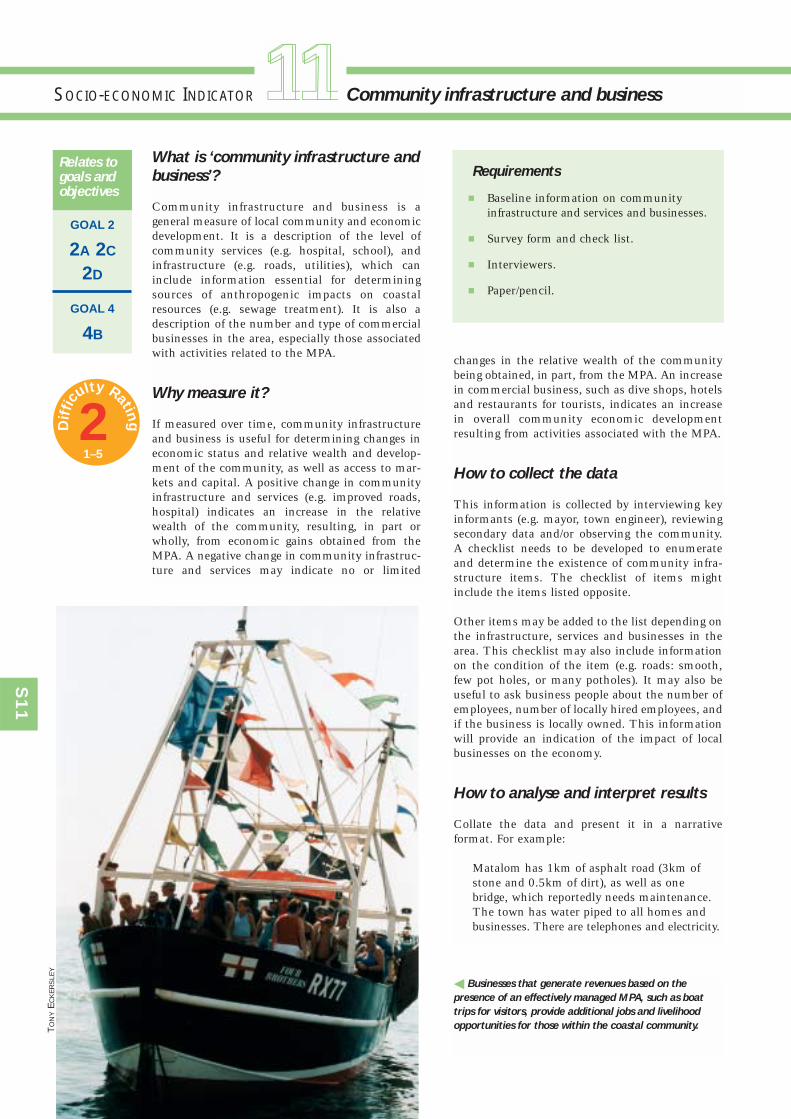
What is ‘community infrastructure and
business’?
Community infrastructure and business is ageneral measure of local community and economicdevelopment. It is a description of the level ofcommunity services (e.g. hospital, school), andinfrastructure (e.g. roads, utilities), which caninclude information essential for determiningsources of anthropogenic impacts on coastalresources (e.g. sewage treatment). It is also adescription of the number and type of commercialbusinesses in the area, especially those associatedwith activities related to the MPA.
Why measure it?
If measured over time, community infrastructureand business is useful for determining changes ineconomic status and relative wealth and develop-ment of the community, as well as access to mar-kets and capital. A positive change in communityinfrastructure and services (e.g. improved roads,hospital) indicates an increase in the relativewealth of the community, resulting, in part orwholly, from economic gains obtained from theMPA. A negative change in community infrastruc-ture and services may indicate no or limited
changes in the relative wealth of the communitybeing obtained, in part, from the MPA. An increasein commercial business, such as dive shops, hotelsand restaurants for tourists, indicates an increasein overall community economic developmentresulting from activities associated with the MPA.
How to collect the data
This information is collected by interviewing keyinformants (e.g. mayor, town engineer), reviewingsecondary data and/or observing the community.A checklist needs to be developed to enumerateand determine the existence of community infra-structure items. The checklist of items mightinclude the items listed opposite.
Other items may be added to the list depending onthe infrastructure, services and businesses in thearea. This checklist may also include informationon the condition of the item (e.g. roads: smooth,few pot holes, or many potholes). It may also beuseful to ask business people about the number ofemployees, number of locally hired employees, andif the business is locally owned. This informationwill provide an indication of the impact of localbusinesses on the economy.
How to analyse and interpret results
Collate the data and present it in a narrativeformat. For example:
Matalom has 1km of asphalt road (3km ofstone and 0.5km of dirt), as well as onebridge, which reportedly needs maintenance.The town has water piped to all homes andbusinesses. There are telephones and electricity.
SOCIO-ECONOMIC INDICATOR Community infrastructure and business
GOAL 2
2A 2C
2D
GOAL 4
4B
Relates togoals andobjectives
Requirements
� Baseline information on communityinfrastructure and services and businesses.
� Survey form and check list.
� Interviewers.
� Paper/pencil.
� Businesses that generate revenues based on the
presence of an effectively managed MPA, such as boat
trips for visitors, provide additional jobs and livelihood
opportunities for those within the coastal community.
S11
11T
ON
YE
CK
ER
SLE
Y
2Dif
ficu
lty Rating
1–5
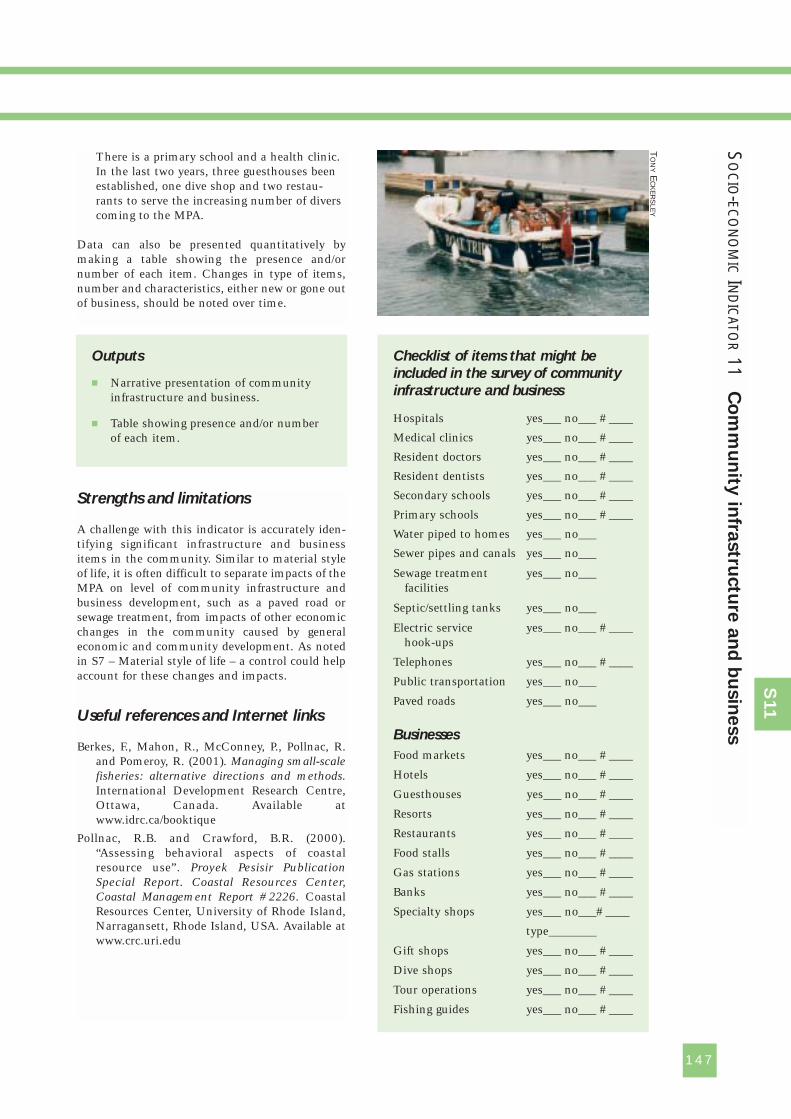
147
S11
There is a primary school and a health clinic.In the last two years, three guesthouses beenestablished, one dive shop and two restau-rants to serve the increasing number of diverscoming to the MPA.
Data can also be presented quantitatively bymaking a table showing the presence and/ornumber of each item. Changes in type of items,number and characteristics, either new or gone outof business, should be noted over time.
Checklist of items that might be
included in the survey of community
infrastructure and business
Hospitals yes___ no___ #____
Medical clinics yes___ no___ #____
Resident doctors yes___ no___ #____
Resident dentists yes___ no___ #____
Secondary schools yes___ no___ #____
Primary schools yes___ no___ #____
Water piped to homes yes___ no___
Sewer pipes and canals yes___ no___
Sewage treatment yes___ no___facilities
Septic/settling tanks yes___ no___
Electric service yes___ no___ #____hook-ups
Telephones yes___ no___ #____
Public transportation yes___ no___
Paved roads yes___ no___
Businesses
Food markets yes___ no___ #____
Hotels yes___ no___ #____
Guesthouses yes___ no___ #____
Resorts yes___ no___ #____
Restaurants yes___ no___ #____
Food stalls yes___ no___ #____
Gas stations yes___ no___ #____
Banks yes___ no___ #____
Specialty shops yes___ no___#____
type________
Gift shops yes___ no___ #____
Dive shops yes___ no___ #____
Tour operations yes___ no___ #____
Fishing guides yes___ no___ #____
Outputs
� Narrative presentation of communityinfrastructure and business.
� Table showing presence and/or numberof each item.
SO
CIO-EC
ON
OM
ICIN
DIC
ATOR
11C
om
mu
nity
infra
stru
ctu
re a
nd
bu
sin
ess
TO
NY
EC
KE
RS
LEY
Strengths and limitations
A challenge with this indicator is accurately iden-tifying significant infrastructure and businessitems in the community. Similar to material styleof life, it is often difficult to separate impacts of theMPA on level of community infrastructure andbusiness development, such as a paved road orsewage treatment, from impacts of other economicchanges in the community caused by generaleconomic and community development. As notedin S7 – Material style of life – a control could helpaccount for these changes and impacts.
Useful references and Internet links
Berkes, F., Mahon, R., McConney, P., Pollnac, R.and Pomeroy, R. (2001). Managing small-scalefisheries: alternative directions and methods.International Development Research Centre,Ottawa, Canada. Available atwww.idrc.ca/booktique
Pollnac, R.B. and Crawford, B.R. (2000).“Assessing behavioral aspects of coastalresource use”. Proyek Pesisir PublicationSpecial Report. Coastal Resources Center,Coastal Management Report #2226. CoastalResources Center, University of Rhode Island,Narragansett, Rhode Island, USA. Available atwww.crc.uri.edu
148
Tumbak has 1km of asphalt road (3km stone and
0.5km dirt), as well as one bridge, which reportedly
needs maintenance. Microlets and boats link the
community to nearby towns. The town nearest to
Tumbak with full services (bank, gas stations, markets,
government offices) is Belang, the seat of the keca-
matan (district government), which is about two
hours and 28km to the south. People and products
can also be transported by the three automobiles,
one motorcycle and 20 bicycles, and numerous boats
recorded in the village statistics. The pipe meant to
deliver fresh water to the community is out of serv-
ice, so residents must travel by boat to the river for
fresh water, which is transported back to the village in
plastic jerry cans. Approximately 8% of the house-
holds have septic or settling tanks and 26% are
officially connected to the national electric company
lines. The survey indicates that 85% of households
have electricity, many of them unofficially connected
to the neighbour’s supply. There are no telephones,
gas stations, markets, restaurants, or accommodation
for visitors. There is one elementary school.
Source: Pollnac, R.B. and Crawford, B.R. (2000).
EXAMPLE FROM THE FIELD
Box S10
S11
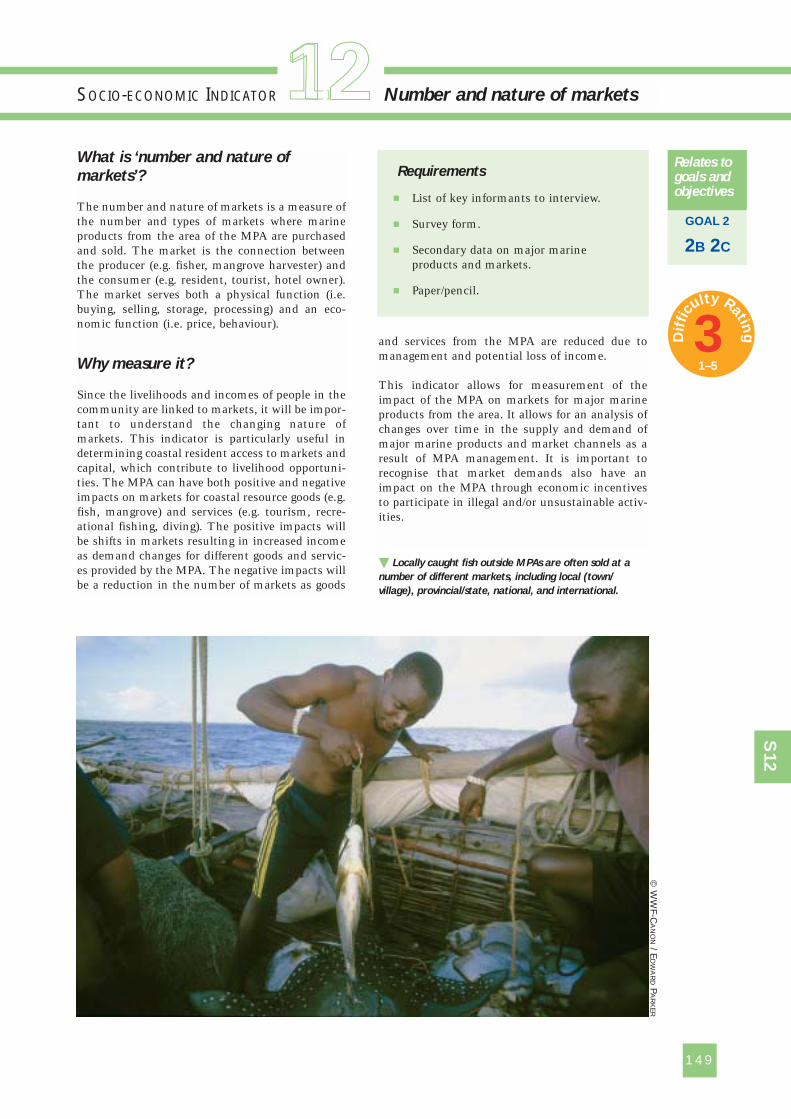
149
S12
What is ‘number and nature of
markets’?
The number and nature of markets is a measure ofthe number and types of markets where marineproducts from the area of the MPA are purchasedand sold. The market is the connection betweenthe producer (e.g. fisher, mangrove harvester) andthe consumer (e.g. resident, tourist, hotel owner).The market serves both a physical function (i.e.buying, selling, storage, processing) and an eco-nomic function (i.e. price, behaviour).
Why measure it?
Since the livelihoods and incomes of people in thecommunity are linked to markets, it will be impor-tant to understand the changing nature ofmarkets. This indicator is particularly useful indetermining coastal resident access to markets andcapital, which contribute to livelihood opportuni-ties. The MPA can have both positive and negativeimpacts on markets for coastal resource goods (e.g.fish, mangrove) and services (e.g. tourism, recre-ational fishing, diving). The positive impacts willbe shifts in markets resulting in increased incomeas demand changes for different goods and servic-es provided by the MPA. The negative impacts willbe a reduction in the number of markets as goods
and services from the MPA are reduced due tomanagement and potential loss of income.
This indicator allows for measurement of theimpact of the MPA on markets for major marineproducts from the area. It allows for an analysis ofchanges over time in the supply and demand ofmajor marine products and market channels as aresult of MPA management. It is important torecognise that market demands also have animpact on the MPA through economic incentivesto participate in illegal and/or unsustainable activ-ities.
SOCIO-ECONOMIC INDICATOR Number and nature of markets
Requirements
� List of key informants to interview.
� Survey form.
� Secondary data on major marineproducts and markets.
� Paper/pencil.
� Locally caught fish outside MPAs are often sold at a
number of different markets, including local (town/
village), provincial/state, national, and international.
GOAL 2
2B 2C
Relates togoals andobjectives
11©
WW
F-CA
NO
N/ E
DW
AR
DP
AR
KE
R
3Dif
ficu
lty Rating
1–5
How to collect the data
The data can be collected through either a keyinformant survey of representative fishers andtraders or through a survey of fishers and traders.Secondary data on these major marine productsmay be available in the MPA management plan,economic studies of the region, and from govern-ment agencies such as fisheries, environment andnatural resources or tourism departments.
Since the market may vary from product toproduct, there is a need to identify each one. Forexample, the market for lobster may be differentfrom that for finfish.
As a first step, the major marine products (i.e. fish,shellfish, crabs, mangrove) in the area of the MPAneed to be identified. The key questions mightinclude:
❏ What are the ten most important vertebratesharvested? Note local and scientific names.
❏ What are the ten most important inverte-brates harvested? Note local and scientificnames.
❏ What are the five most important floraharvested? Note local and scientific names.
The data collection should only focus on the majormarine products as the analysis can get complicatedthe more products that are included.
For each resource, it is important to understandthe harvest patterns, importance and marketing.Important questions to ask might include:
❏ What time of year is the resource harvested(month)?
❏ Where is the resource harvested (inshore, reef,offshore, distant waters)?
❏ What is the importance, in terms of value andquantity, of each resource? Rank from 1 to 10.
❏ What is the resource primarily gathered for?Household consumption, trade/barter, or salein the market.
❏ If the resource is sold, where is the marketlocated (local, regional, national, export)? Andto whom (wholesaler, retailer, transporter,processor)?
To supplement the information collected above, foreach product, the key informants should be askedto rank the degree of demand for the product usingthe following scale:
1 = little or no established market exists forthe product; never sold or traded
2 = limited demand for the product; canoccasionally sell some
3 = some demand for the product; cansometimes sell it
4 = strong demand for the product; canusually sell it
5 = very strong demand for the product; canalways sell it
How to analyse and interpret results
Prepare a written narrative for each productdescribing the harvest patterns, importance andmarketing system. Prepare a summary table thatcompares important market characteristics foreach product. This information can be presentedon a map showing the flow or movement of eachproduct from harvest to consumer along the mar-ket channel.
Strengths and limitations
Ranking the major marine products will be impor-tant as there may be a long list generated by thekey informants.
Useful references and Internet links
Bunce, L., Townsley, P., Pomeroy, R. and Pollnac,R. (2000). Socioeconomic Manual for CoralReef Management. Australian Institute ofMarine Science, Townsville, Queensland,Australia. Available at www.reefbase.org
150
Outputs
� A narrative identifying the major marineproducts in the area and harvest andmarketing for these products.
� Summary table of important marketcharacteristics of each product.
� Map showing market channel flow ormovement of each product.
S12
151
SO
CIO-EC
ON
OM
ICIN
DIC
ATOR
12N
um
ber a
nd
natu
re o
f mark
ets
S12
At Tubbataha Reef National Marine Park in the
Philippines, the market outlets for fishery products,
including dried seaweeds from Cagayancillo, are
either Puerto Princesa City or Iloilo City. There are
wholesale buyers stationed in the islands who deliver
in bulk to outside markets. Prices are dictated by
these buyers who exact patronage by offering
advance sums of money for the producers’ daily con-
sumption of basic goods which they themselves sup-
ply. A foreign operator of live fish products (lapu-lapu)
markets directly to Taiwan through its own network.
Agricultural products are sold locally or consumed by
the producing households. Likewise, mats are sold
locally or through individual contacts who visit the
islands. Products are transported to the markets by 4
boats (10-20 gross tons) that ply the Iloilo and Puerto
Princesa routes. Except for the summer months
(March to May) there is no regularity in the schedule
of these boats. Schedules are highly dependent on
weather. The regular fare for passengers is 350 pesos
going to Puerto Princesa City and 300 pesos going to
Iloilo City. These include food for the entire duration
of the trip. For cargoes, a bag of rice or cement costs
50 pesos each.
EXAMPLE FROM THE FIELD
Box S11
TO
NIP
AR
RA
S
TO
NIP
AR
RA
ST
ON
IPA
RR
AS
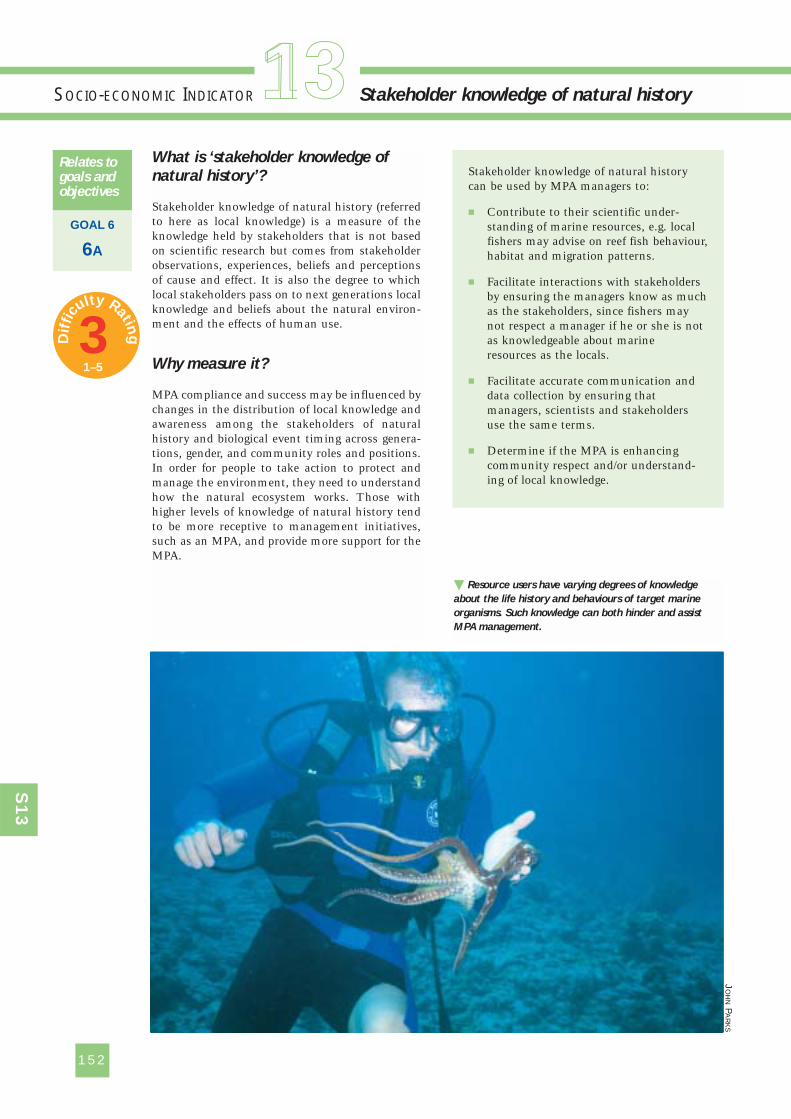
What is ‘stakeholder knowledge of
natural history’?
Stakeholder knowledge of natural history (referredto here as local knowledge) is a measure of theknowledge held by stakeholders that is not basedon scientific research but comes from stakeholderobservations, experiences, beliefs and perceptionsof cause and effect. It is also the degree to whichlocal stakeholders pass on to next generations localknowledge and beliefs about the natural environ-ment and the effects of human use.
Why measure it?
MPA compliance and success may be influenced bychanges in the distribution of local knowledge andawareness among the stakeholders of naturalhistory and biological event timing across genera-tions, gender, and community roles and positions.In order for people to take action to protect andmanage the environment, they need to understandhow the natural ecosystem works. Those withhigher levels of knowledge of natural history tendto be more receptive to management initiatives,such as an MPA, and provide more support for theMPA.
152
SOCIO-ECONOMIC INDICATOR Stakeholder knowledge of natural history
GOAL 6
6A
Relates togoals andobjectives
� Resource users have varying degrees of knowledge
about the life history and behaviours of target marine
organisms. Such knowledge can both hinder and assist
MPA management.
Stakeholder knowledge of natural historycan be used by MPA managers to:
� Contribute to their scientific under-standing of marine resources, e.g. localfishers may advise on reef fish behaviour,habitat and migration patterns.
� Facilitate interactions with stakeholdersby ensuring the managers know as muchas the stakeholders, since fishers maynot respect a manager if he or she is notas knowledgeable about marineresources as the locals.
� Facilitate accurate communication anddata collection by ensuring thatmanagers, scientists and stakeholdersuse the same terms.
� Determine if the MPA is enhancingcommunity respect and/or understand-ing of local knowledge.
S13
1 1J
OH
NP
AR
KS
3Dif
ficu
lty Rating
1–5
153
S13
How to collect the data
The focus of this indicator is folk taxonomy andlocal knowledge of resources. Folk taxonomyinvolves understanding the local names of marineaquatic resources, locations of the resources andrelated activities, particularly significant placessuch as fishing grounds and landing sites, andrelated activities around the resources. Importantquestions to address when assessing local know-ledge may include:
❏ What are the local names of the marineresources?
❏ What are the local names of the places wherethey are located?
❏ What are the local names of particularlysignificant places related to the resources (e.g.spawning sites)?
❏ What are local names of activities related tothe resources?
This involves understanding how these items areclassified, e.g. while scientists may divide faunainto families and species using scientific criteria,stakeholders may use very different groups such asedible/non-edible, species that live in similarenvironments, seasonal availability, etc.
Local knowledge refers to stakeholder understand-ing of the marine aquatic resources including: thelocation of resources, their mobility, quantity,interactions among resources, feeding behaviours,and breeding behaviours and locations. Keyquestions may include:
❏ Where are the resources located?
❏ What is the extent of their mobility?
❏ What is the population size of each resource?
❏ What kinds of interactions are there amongresources?
❏ What are feeding behaviours of the resources?
❏ What are the breeding behaviours and loca-tions?
This knowledge also involves understanding howthese characteristics have changed over time andwhy. Local knowledge may be limited to commer-cially important species, with which stakeholdersare often most familiar.
Variations in local knowledge may occur. Thisrefers to the range of perceptions among differentstakeholders, e.g. fishers may know more aboutchanges in the fish populations because theyharvest these resources; whereas divers may bemore familiar with coral conditions since they seethe corals while diving.
Folk taxonomy should be assessed first because itwill provide important information for localknowledge and variations in knowledge. It willprobably be found that there is little secondarydata on local knowledge, which is often passed onby word of mouth from generation to generation.
A range of data collection methods and visualiza-tion techniques can be used. Semi-structuredinterviews, oral histories, surveys, observationsand focus group interviews are all important forcollecting information. During the data collectionit is particularly important to record who theinformants are and their characteristics (e.g. age,gender), which will be used to assess variationsamong people and stakeholder groups.
Visualization techniques include:
❏ Local classifications to identify local tax-onomies;
❏ Ranking matrices to assess variations amongindividuals and stakeholder groups; and
❏ Ranking matrices and timelines to encouragediscussion and analysis of changes in resourceabundance or other features of local knowl-edge where relative quantities are important.
It is also important to measure through semi-structured interviews with MPA managers:
❏ Their awareness of stakeholder knowledge ofnatural history;
❏ Their use of this knowledge; and
❏ The interaction and consistency of local stake-holder knowledge and scientific knowledge.
How to analyse and interpret results
Summarise the data into descriptive text based onthe qualitative information and quantitative data.Use tables and figures to clarify and illustrate vari-ations and trends, e.g. knowledge of place namesand beliefs about distributions of flora, fauna and
Requirements
� Survey form.
� Interviewer.
� Notebook and pen.
� Map of area.
SO
CIO-EC
ON
OM
ICIN
DIC
ATOR
13S
takeh
old
er k
no
wle
dg
e o
f natu
ral h
isto
ry
minerals can be put on maps; ranking matricesand timelines created by informants during fielddata collection can be included to show stakehold-er knowledge and perceptions of resource condi-tions and changes.
Analysis of variations is unique and involves com-paring responses from informants to determinethe basis of their differences. By comparing theresponses on local taxonomies and local knowl-edge with the informants’ basic characteristics, itwill be possible to determine the socio-economicbasis of their differences, e.g. variation may berelated to area of residence or work experience.
Strengths and limitations
An appreciation of local knowledge by managersand scientists is needed.
It is important to note that local knowledge is vari-able. For example, a spear or hand line fisherusually has greater knowledge than a deck hand ona trawler. While some local resource users mayhave an extensive knowledge of marine organismlife history and behaviour, a lot of local knowledgeis based in (or flavoured by) mythology, religion,etc. and is inaccurate. Local knowledge oftenincludes a lot of spurious reasoning for observedpatterns. While local knowledge is important andcan be very useful, caution must be used and theinformation should be checked with others in thecommunity and with scientific experts.
Useful references and Internet links
Bunce, L., Townsley, P., Pomeroy, R. and Pollnac,R. (2000). Socioeconomic Manual for CoralReef Management. Australian Institute ofMarine Science, Townsville, Queensland,Australia. pp. 202-204 in Chapter 6,“Traditional Knowledge”. Available atwww.reefbase.org
154
Outputs
� A narrative text on each sub-parametersuch as folk taxonomy and localknowledge.
� Summary table of important marketcharacteristics of each product.
� Maps showing location of resources.
� Ranking matrices and timelines showingstakeholder knowledge and perception ofresource conditions and changes.
At the Galapagos Marine Reserve, a survey of 348 individuals in three inhabited islands was conducted to
measure stakeholder knowledge of natural history. The table below provides results of the survey showing
the percentage of stakeholders in the different islands with knowledge of natural history.
Santa Cruz San Cristobal Isabela
Origin of the archipelago 45% 44% 43%
Weather of the archipelago 38% 35% 21%
Marine currents 35% 32% 38%
Evolution of the species 38% 33% 37%
Concept of endemic species 47% 44% 46%
Fisheries resources 18% 16% 20%
Vegetation 21% 16% 20%
Danger of extinction 25% 17% 37%
Alien species 38% 33% 52%
Average 34% 30% 35%
There is a relatively higher degree of stakeholder knowledge of terrestrial natural history than marine due
to a greater effort on environmental education about terrestrial systems. There is a need to improve
stakeholders’ knowledge of marine systems.
S13
EXAMPLE FROM THE FIELDBox S12
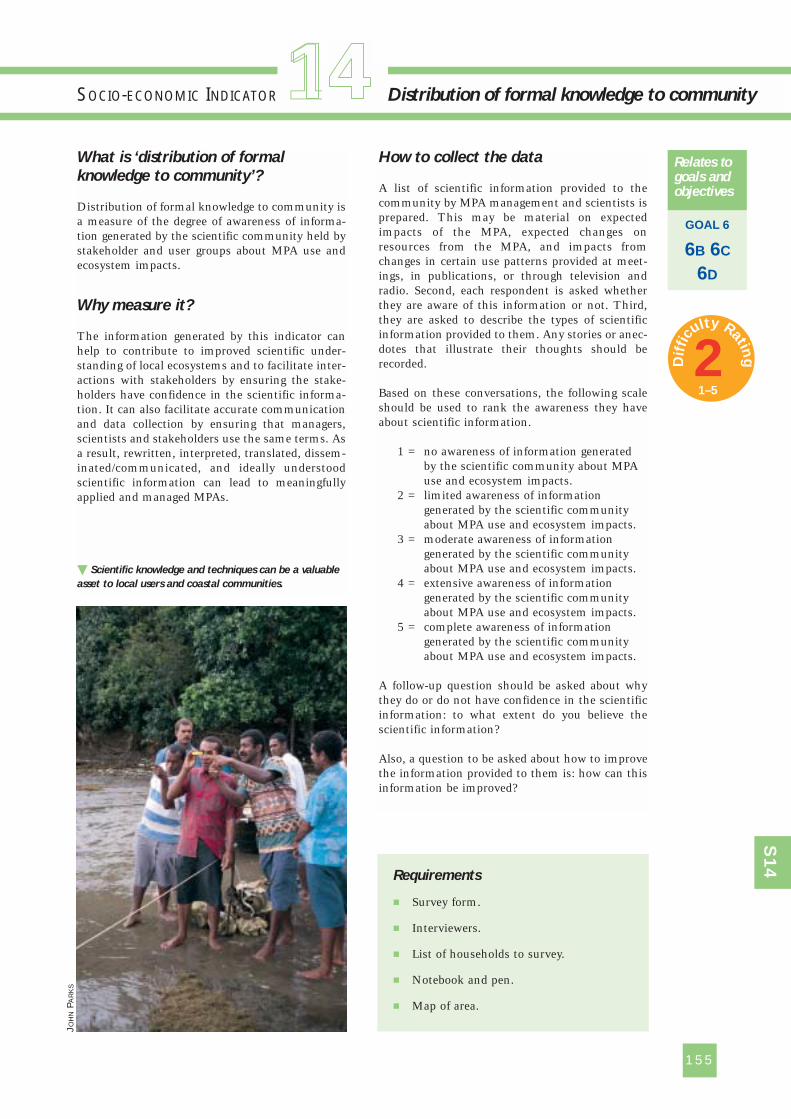
155
S14
SOCIO-ECONOMIC INDICATOR Distribution of formal knowledge to community
GOAL 6
6B 6C
6D
Relates togoals andobjectives
What is ‘distribution of formal
knowledge to community’?
Distribution of formal knowledge to community isa measure of the degree of awareness of informa-tion generated by the scientific community held bystakeholder and user groups about MPA use andecosystem impacts.
Why measure it?
The information generated by this indicator canhelp to contribute to improved scientific under-standing of local ecosystems and to facilitate inter-actions with stakeholders by ensuring the stake-holders have confidence in the scientific informa-tion. It can also facilitate accurate communicationand data collection by ensuring that managers,scientists and stakeholders use the same terms. Asa result, rewritten, interpreted, translated, dissem-inated/communicated, and ideally understoodscientific information can lead to meaningfullyapplied and managed MPAs.
How to collect the data
A list of scientific information provided to thecommunity by MPA management and scientists isprepared. This may be material on expectedimpacts of the MPA, expected changes onresources from the MPA, and impacts fromchanges in certain use patterns provided at meet-ings, in publications, or through television andradio. Second, each respondent is asked whetherthey are aware of this information or not. Third,they are asked to describe the types of scientificinformation provided to them. Any stories or anec-dotes that illustrate their thoughts should berecorded.
Based on these conversations, the following scaleshould be used to rank the awareness they haveabout scientific information.
1 = no awareness of information generatedby the scientific community about MPAuse and ecosystem impacts.
2 = limited awareness of informationgenerated by the scientific communityabout MPA use and ecosystem impacts.
3 = moderate awareness of informationgenerated by the scientific communityabout MPA use and ecosystem impacts.
4 = extensive awareness of informationgenerated by the scientific communityabout MPA use and ecosystem impacts.
5 = complete awareness of informationgenerated by the scientific communityabout MPA use and ecosystem impacts.
A follow-up question should be asked about whythey do or do not have confidence in the scientificinformation: to what extent do you believe thescientific information?
Also, a question to be asked about how to improvethe information provided to them is: how can thisinformation be improved?
Requirements
� Survey form.
� Interviewers.
� List of households to survey.
� Notebook and pen.
� Map of area.
� Scientific knowledge and techniques can be a valuable
asset to local users and coastal communities.
1 1JO
HN
PAR
KS
2Dif
ficu
lty Rating
1–5
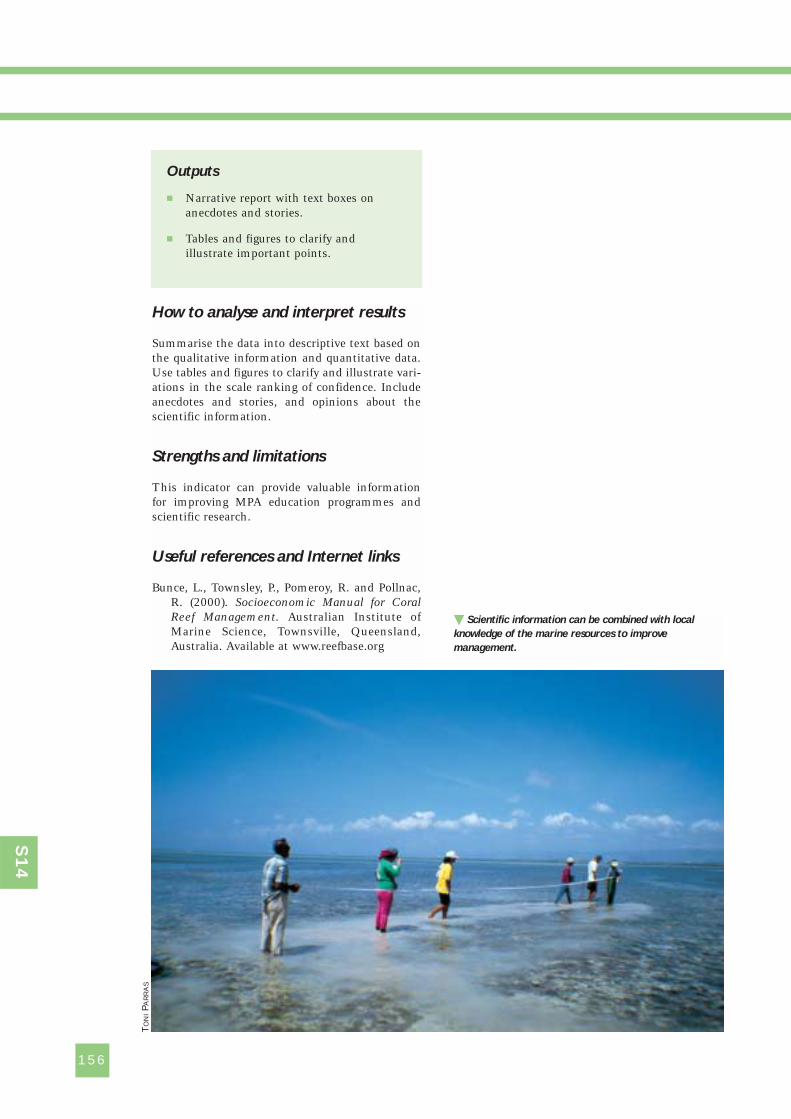
How to analyse and interpret results
Summarise the data into descriptive text based onthe qualitative information and quantitative data.Use tables and figures to clarify and illustrate vari-ations in the scale ranking of confidence. Includeanecdotes and stories, and opinions about thescientific information.
Strengths and limitations
This indicator can provide valuable informationfor improving MPA education programmes andscientific research.
Useful references and Internet links
Bunce, L., Townsley, P., Pomeroy, R. and Pollnac,R. (2000). Socioeconomic Manual for CoralReef Management. Australian Institute ofMarine Science, Townsville, Queensland,Australia. Available at www.reefbase.org
156
S14
Outputs
� Narrative report with text boxes onanecdotes and stories.
� Tables and figures to clarify andillustrate important points.
TO
NIPA
RR
AS
� Scientific information can be combined with local
knowledge of the marine resources to improve
management.
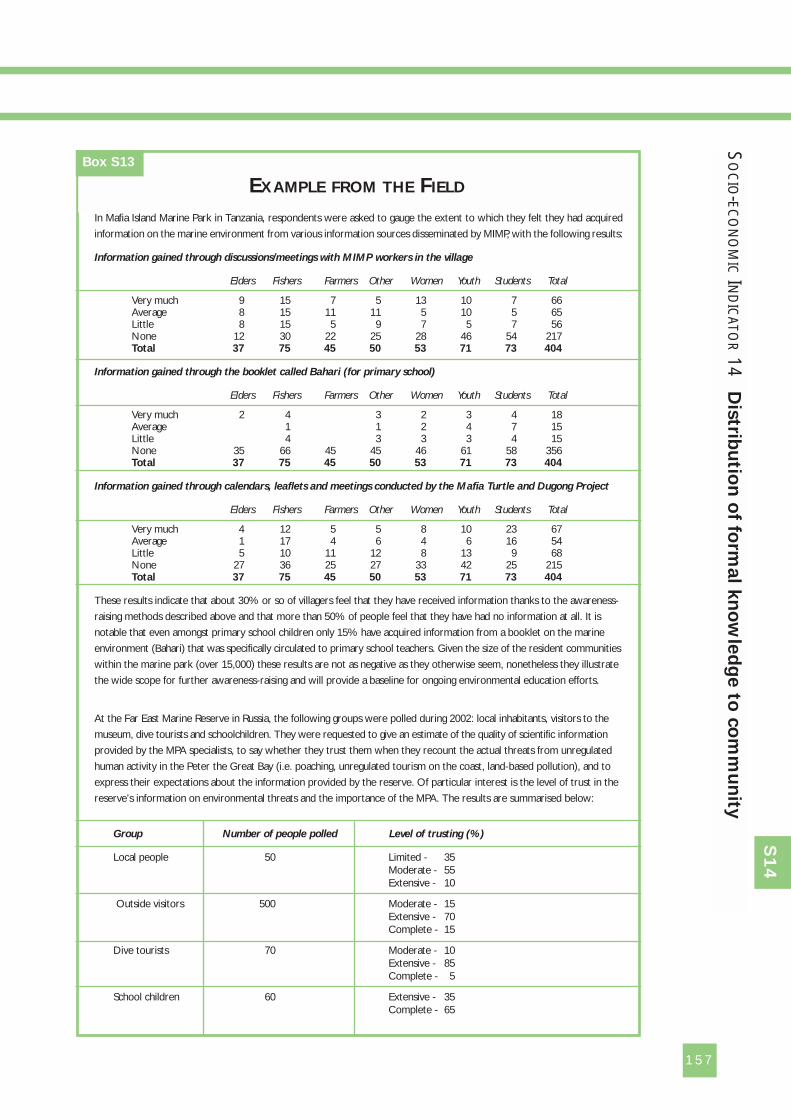
157
S14
SO
CIO-EC
ON
OM
ICIN
DIC
ATOR
14D
istrib
utio
n o
f form
al k
no
wle
dg
e to
co
mm
un
ity
In Mafia Island Marine Park in Tanzania, respondents were asked to gauge the extent to which they felt they had acquired
information on the marine environment from various information sources disseminated by MIMP, with the following results:
Information gained through discussions/meetings with MIMP workers in the village
Elders Fishers Farmers Other Women Youth Students Total
Very much 9 15 7 5 13 10 7 66Average 8 15 11 11 5 10 5 65Little 8 15 5 9 7 5 7 56None 12 30 22 25 28 46 54 217Total 37 75 45 50 53 71 73 404
Information gained through the booklet called Bahari (for primary school)
Elders Fishers Farmers Other Women Youth Students Total
Very much 2 4 3 2 3 4 18Average 1 1 2 4 7 15Little 4 3 3 3 4 15None 35 66 45 45 46 61 58 356Total 37 75 45 50 53 71 73 404
Information gained through calendars, leaflets and meetings conducted by the Mafia Turtle and Dugong Project
Elders Fishers Farmers Other Women Youth Students Total
Very much 4 12 5 5 8 10 23 67Average 1 17 4 6 4 6 16 54Little 5 10 11 12 8 13 9 68None 27 36 25 27 33 42 25 215Total 37 75 45 50 53 71 73 404
These results indicate that about 30% or so of villagers feel that they have received information thanks to the awareness-
raising methods described above and that more than 50% of people feel that they have had no information at all. It is
notable that even amongst primary school children only 15% have acquired information from a booklet on the marine
environment (Bahari) that was specifically circulated to primary school teachers. Given the size of the resident communities
within the marine park (over 15,000) these results are not as negative as they otherwise seem, nonetheless they illustrate
the wide scope for further awareness-raising and will provide a baseline for ongoing environmental education efforts.
At the Far East Marine Reserve in Russia, the following groups were polled during 2002: local inhabitants, visitors to the
museum, dive tourists and schoolchildren. They were requested to give an estimate of the quality of scientific information
provided by the MPA specialists, to say whether they trust them when they recount the actual threats from unregulated
human activity in the Peter the Great Bay (i.e. poaching, unregulated tourism on the coast, land-based pollution), and to
express their expectations about the information provided by the reserve. Of particular interest is the level of trust in the
reserve’s information on environmental threats and the importance of the MPA. The results are summarised below:
Group Number of people polled Level of trusting (%)
Local people 50 Limited - 35Moderate - 55Extensive - 10
Outside visitors 500 Moderate - 15Extensive - 70Complete - 15
Dive tourists 70 Moderate - 10 Extensive - 85Complete - 5
School children 60 Extensive - 35Complete - 65
EXAMPLE FROM THE FIELD
Box S13
What is ‘percentage of stakeholder
group in leadership positions’?
The percentage of stakeholder group in leadershippositions measures the number of individualstakeholders from the various stakeholder groupswho have been or currently are in a leadershipposition related to MPA management.
Why measure it?
This indicator is important to measure because itprovides an understanding of the degree of equityamong social groups associated with the MPA. If arange of stakeholders (especially those from minor-ity groups) are involved in leadership positions inMPA management, a broader representation ofideas and interests is achieved; a more democraticand equitable management structure is in opera-tion; and a greater level of participation in man-agement is achieved. If all stakeholder groups arenot represented, recommendations can be made toinclude non-represented stakeholder groups in aleadership position in MPA management.
How to collect the data
First, a copy of the organizational structure of theMPA management should be obtained andreviewed.
Second, the representative structure of stakeholdergroups from the organizational structure should beidentified.
Next, through a key informant interview of MPAmanagement, the stakeholder groups and therepresentatives of the stakeholder groups to MPAmanagement, both previous and current, shouldbe identified.
Then through key informant interviews of MPAmanagers and known stakeholder groups, a listingof all stakeholder groups associated with the MPAcan be prepared. The list should be cross-checkedwith information provided by the stakeholdergroups to identify leaders and representatives.
Each leader and representative should beinterviewed in order to describe their stakeholdergroup history and the role of their group in MPAmanagement.
Finally, a check should be made to see if all stake-holder groups identified through the stakeholderanalysis are represented in MPA management. If astakeholder group is not represented in MPAmanagement it should be asked why not andwhether there are plans for it to be represented. Itis important to measure this indicator over time asstakeholder groups and representatives maychange.
How to analyse and interpret results
Identify the total number of stakeholder groupsassociated with the MPA and present this in atable. Calculate the total number of stakeholdergroups that have been, or currently are, in leader-ship positions and present these in a table. Preparea narrative report to accompany the tables thatdescribes the history and role of stakeholder grouprepresentation and leadership in MPA manage-ment.
158
S15
SOCIO-ECONOMIC INDICATOR Percentage of stakeholder group in leadership
Relates togoals andobjectives
Requirements
� Survey form.
� Interviewers.
� List of leaders and representatives ofstakeholder groups to survey.
� MPA management plan andorganizational chart.
� Paper/pencil.
Outputs
� Table of total number of stakeholdergroups that have been, or currently are,in a leadership position in MPAmanagement.
� Accompanying narrative describing thehistory and role of stakeholder grouprepresentation and leadership in MPAmanagement.
Note that if you have difficulty inidentifying the stakeholder groupsusing key informant interviews, astakeholder analysis can beconducted using the methodsdescribed under indicator G12.
GOAL 4
4B 4C
positions
1 1
3Dif
ficu
lty Rating
1–5
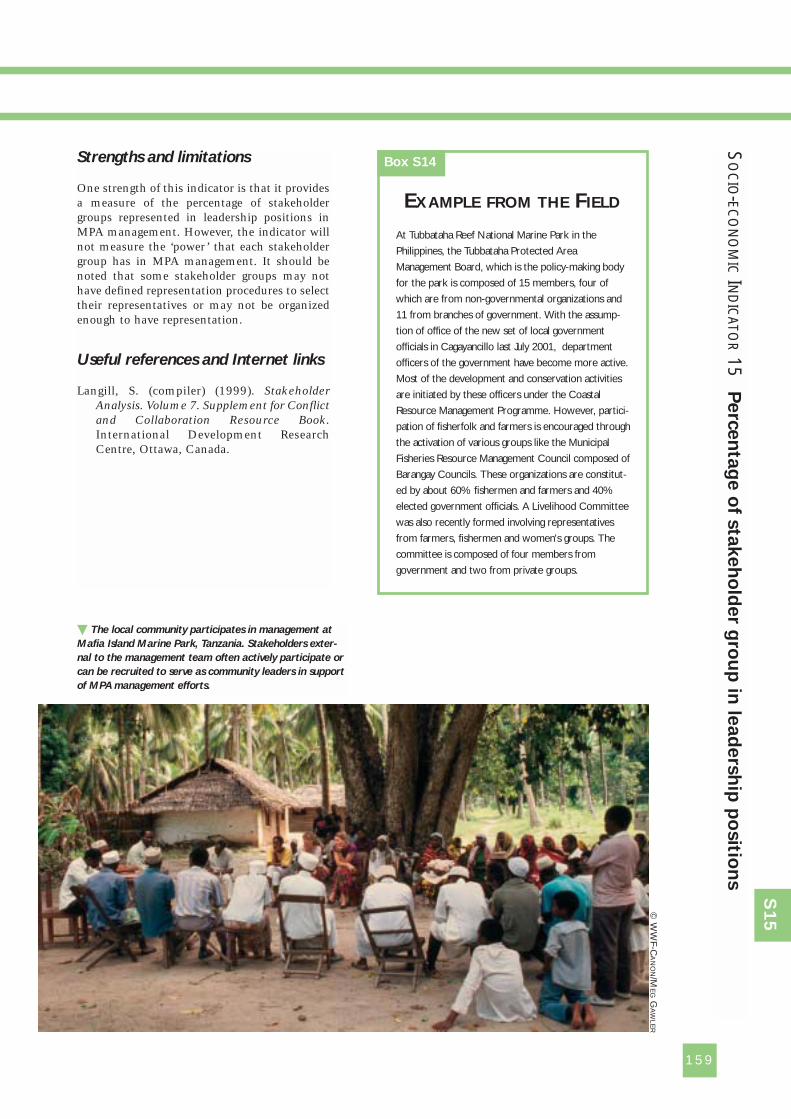
159
S15
SO
CIO-EC
ON
OM
ICI N
DIC
ATOR
15P
erc
en
tag
e o
f sta
keh
old
er g
rou
p in
lead
ers
hip
po
sitio
ns
� The local community participates in management at
Mafia Island Marine Park, Tanzania. Stakeholders exter-
nal to the management team often actively participate or
can be recruited to serve as community leaders in support
of MPA management efforts.
At Tubbataha Reef National Marine Park in the
Philippines, the Tubbataha Protected Area
Management Board, which is the policy-making body
for the park is composed of 15 members, four of
which are from non-governmental organizations and
11 from branches of government. With the assump-
tion of office of the new set of local government
officials in Cagayancillo last July 2001, department
officers of the government have become more active.
Most of the development and conservation activities
are initiated by these officers under the Coastal
Resource Management Programme. However, partici-
pation of fisherfolk and farmers is encouraged through
the activation of various groups like the Municipal
Fisheries Resource Management Council composed of
Barangay Councils. These organizations are constitut-
ed by about 60% fishermen and farmers and 40%
elected government officials. A Livelihood Committee
was also recently formed involving representatives
from farmers, fishermen and women’s groups. The
committee is composed of four members from
government and two from private groups.
EXAMPLE FROM THE FIELD
Box S14
© W
WF-C
AN
ON/M
EG
GA
WLE
R
Strengths and limitations
One strength of this indicator is that it providesa measure of the percentage of stakeholdergroups represented in leadership positions inMPA management. However, the indicator willnot measure the ‘power’ that each stakeholdergroup has in MPA management. It should benoted that some stakeholder groups may nothave defined representation procedures to selecttheir representatives or may not be organizedenough to have representation.
Useful references and Internet links
Langill, S. (compiler) (1999). StakeholderAnalysis. Volume 7. Supplement for Conflictand Collaboration Resource Book.International Development ResearchCentre, Ottawa, Canada.
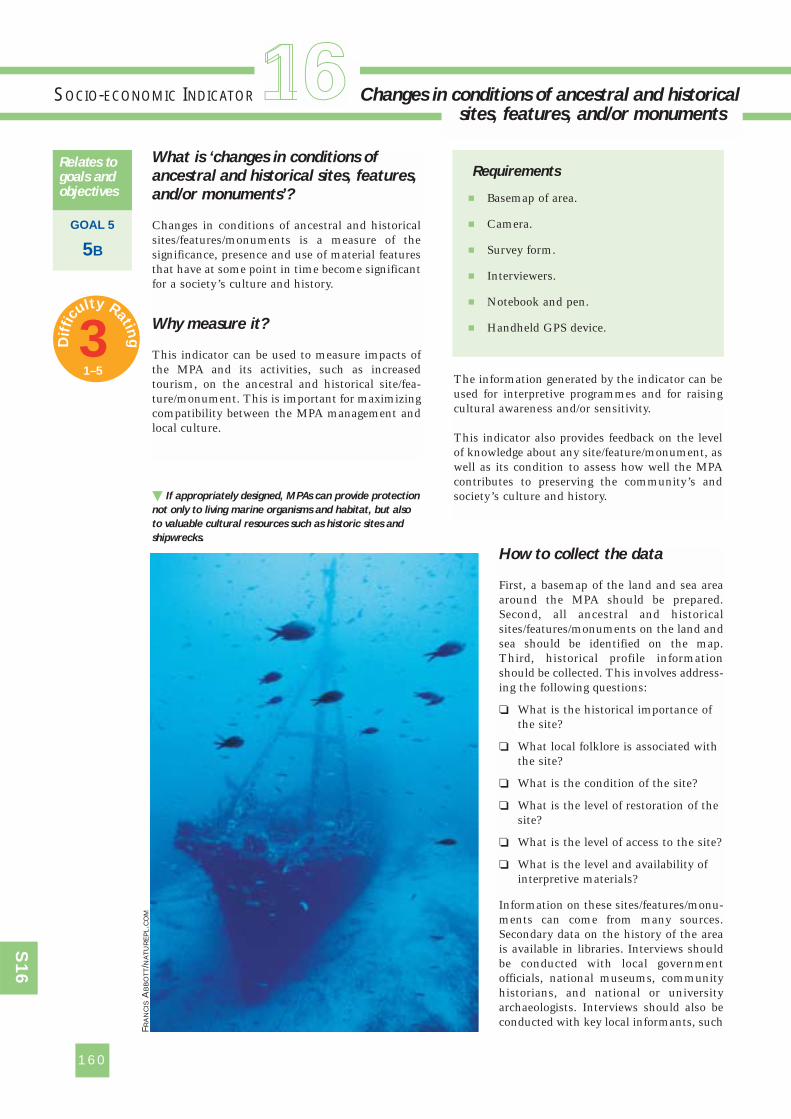
What is ‘changes in conditions of
ancestral and historical sites, features,
and/or monuments’?
Changes in conditions of ancestral and historicalsites/features/monuments is a measure of thesignificance, presence and use of material featuresthat have at some point in time become significantfor a society’s culture and history.
Why measure it?
This indicator can be used to measure impacts ofthe MPA and its activities, such as increasedtourism, on the ancestral and historical site/fea-ture/monument. This is important for maximizingcompatibility between the MPA management andlocal culture.
The information generated by the indicator can beused for interpretive programmes and for raisingcultural awareness and/or sensitivity.
This indicator also provides feedback on the levelof knowledge about any site/feature/monument, aswell as its condition to assess how well the MPAcontributes to preserving the community’s andsociety’s culture and history.
160
S16
GOAL 5
5B
Relates togoals andobjectives
Requirements
� Basemap of area.
� Camera.
� Survey form.
� Interviewers.
� Notebook and pen.
� Handheld GPS device.
� If appropriately designed, MPAs can provide protection
not only to living marine organisms and habitat, but also
to valuable cultural resources such as historic sites and
shipwrecks.
sites, features, and/or monumentsSOCIO-ECONOMIC INDICATOR Changes in conditions of ancestral and historical 1 1
How to collect the data
First, a basemap of the land and sea areaaround the MPA should be prepared.Second, all ancestral and historicalsites/features/monuments on the land andsea should be identified on the map.Third, historical profile informationshould be collected. This involves address-ing the following questions:
❏ What is the historical importance ofthe site?
❏ What local folklore is associated withthe site?
❏ What is the condition of the site?
❏ What is the level of restoration of thesite?
❏ What is the level of access to the site?
❏ What is the level and availability ofinterpretive materials?
Information on these sites/features/monu-ments can come from many sources.Secondary data on the history of the areais available in libraries. Interviews shouldbe conducted with local governmentofficials, national museums, communityhistorians, and national or universityarchaeologists. Interviews should also beconducted with key local informants, such
FRA
NC
ISA
BB
OT
T/N
AT
UR
EP
L.C
OM
3Dif
ficu
lty Rating
1–5
as elders and traditional leaders, to identify thesesites/features/monuments. Local fishers may needto be interviewed to locate sites/features/monu-ments at sea. It should be noted that many tradi-tional sites in the community, such as burialgrounds, will need to be identified.
In addition, photographs should be taken from allangles and sufficiently close to show details ofwear and tear. A scale can be used to rank the con-dition of the site/feature/monument. A scale of 1to 10 can be used where 1 is very poor/deteriorat-ing condition and little knowledge of the site/feature/monument and 10 represents excellentcondition and high knowledge about site/feature/monument.
A survey of the site/feature/monument should beconducted at least every five years unless a majorevent, such as a natural event (hurricane, flood-ing), change in access, or change in culturalattitude, has occurred.
How to analyse and interpret results
Prepare a narrative text describing the sites/features/monuments. It should include location onthe map, detailed photographs, and copies of sig-nificant secondary source publications/documents(e.g. brochures, historic documents).
Strengths and limitations
A limitation to this indicator is that access to thesite may be difficult. Another challenge is identify-ing all the important sites/features/monuments.This may require understanding the local cultureand talking to knowledgeable local residents aboutthese areas. This indicator may have limited appli-cation in many places, but be useful in otherplaces, such as a World Heritage Site, whereculture is a major factor.
It will be important to work with an archaeologistand a historian as much as possible to make surethat all sites are identified. Older members of thecommunity should be identified and interviewedas they may have knowledge of such site/fea-tures/monuments.
Useful references and Internet links
McClanahan, T.R., Glaesel, H., Rubens, J. andKiambe, R. (1997). “The effects of traditionalfisheries management on fisheries yields andthe coral reef ecosystems of Southern Kenya”.Environmental Conservation 24(2): 105–120.
Mascia, M. (2002). “The social dimensions ofmarine reserve design and performance”. Draftmanuscript submitted for inclusion in the bookby J. Sobel (ed.) Marine Reserves: their science,design and use. Center for MarineConservation. Washington, DC, USA.
Fiske, S.J. (1992). “Sociocultural aspects of estab-lishing marine protected areas”. Ocean andCoastal Management 18: 25–46.
Kelleher, G. and Recchia, C. (1998). “Lessons frommarine protected areas around the world”.Parks 8(2): 1–4.
Roberts, C.M. (2000). “Selecting marine reservelocations: optimality versus opportunism”.Bulletin of Marine Science 66(3): 581–592.
161
S1
6
SO
CIO-EC
ON
OM
ICIN
DIC
ATOR
16C
han
ges in
co
nd
ition
s o
f an
cestra
l an
d h
isto
rical s
ites,
featu
res, a
nd
/or m
on
um
en
ts
Outputs
� Narrative text describing the site/feature/monument.
� Basemap with locations of culturalresources and historic sites.
� Photographic documentation.
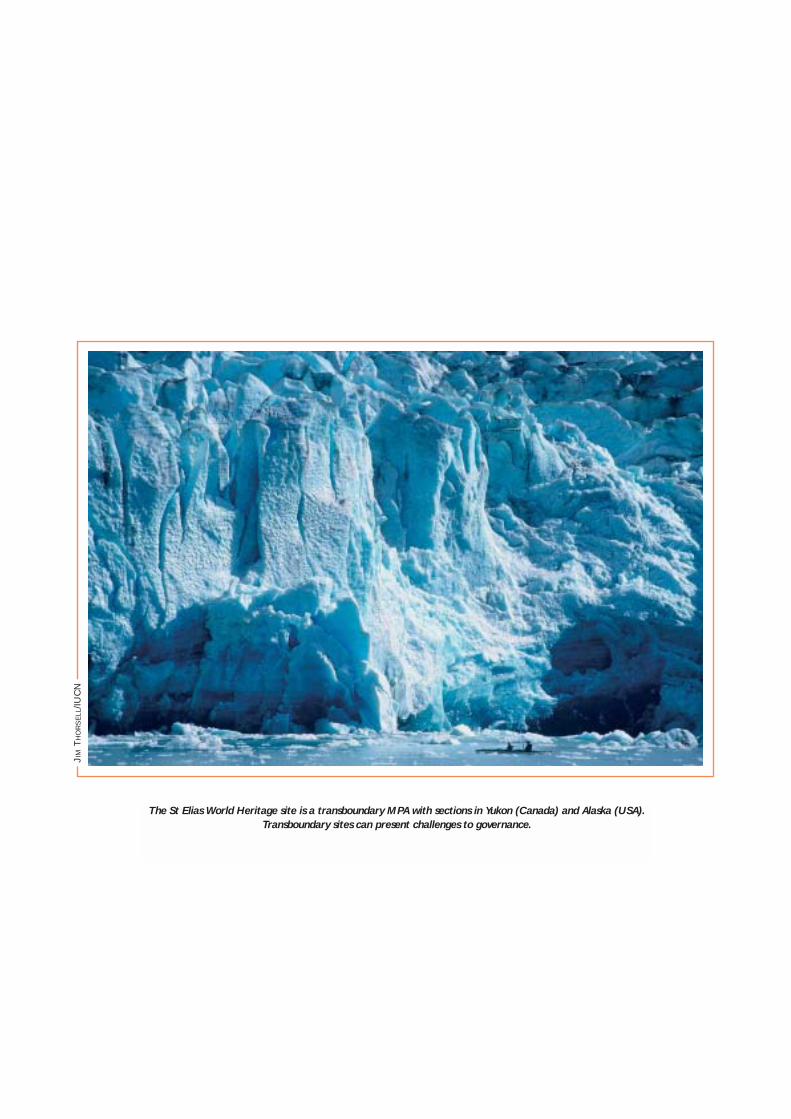
The St Elias World Heritage site is a transboundary MPA with sections in Yukon (Canada) and Alaska (USA).
Transboundary sites can present challenges to governance.
JIM
TH
OR
SE
LL/IU
CN
management, there is greater sense of ownershipby them of the MPA and this leads to stronger andlonger-term conservation success. This is not tosay that all MPAs have or should have a highdegree of stakeholder participation, as manycentrally managed MPAs have also been successful.It is crucial, therefore, to understand the social,economic, political and governance context of theMPA. For this reason, the indicators should beanalysed together so that linkages between thesocio-economic and governance indictors can beidentified and examined. Among the 16 gover-nance indicators, several measure stakeholderparticipation, particularly G9, G11, G12 and G13.Each indicator measures a distinct aspect of stake-holder participation in MPA management.
Most of the governance indicators attempt tomeasure the goals and objectives, and in manycases are true ‘process’ and ‘input’ indicators (e.g.G14 and G15 for enforcement and G10 and G11for training). A few are ‘output’ indicators (e.g. G3for management plan and G12 for stakeholdersatisfaction), but none are ‘outcome’ indicators.
A marine protected area by definition imposes newproperty rights arrangements at the site by restrict-ing or forbidding access. As such, no individualindicator on property rights has been developed.The MPA may cause shifts in property rights inareas surrounding it but it was felt that the meth-ods to identify changes in property rights were toocomplex and beyond the scope of the MPA manager.If necessary, a side research study could beconducted on property rights in the area of theMPA.
Transaction costs, the costs of gaining informationabout the resource and what users are doing withit, the costs of collective decision-making, and thecosts of operation, are integral to the MPAmanagement arrangement. Transaction costs ofMPA management can increase or decrease overtime depending upon the administrative arrange-ments, the functions of management, and theefficiency with which the MPA is managed. Whilean important indicator of management effective-ness, again, no indicator has been developed due tothe complexity of measuring transaction costs.However, as a proxy, shifts and trends in the MPAbudget can be analysed through information fromindicator G6 – Availability and allocation of MPAadministrative resources.
Introduction
By definition, an MPA is a governance tool. It limits,forbids or otherwise controls use patterns andhuman activity through a structure of rights andrules. Resource governance is the way in whichusers and their intentions are managed through aset of rights, rules, and shared social norms andstrategies. This includes enforcement mecha-nisms, such as policing measures and punish-ments, as well as incentives to direct humanbehaviour and use. Resource governance caninclude: a) formal and informal forms of resourceownership; b) use rights and the laws that supportthese rights; and c) the rules, rights and regula-tions that dictate how resources can and cannot beused. Resource governance is defined by formalorganizations and law, traditional bodies, and/oraccepted practice. Resource governance takes placeat four related levels: local, provincial/state,national, and international. In this guidebook, weare particularly interested in the governance of theMPA and marine resources.
MPAs may be managed under a variety of arrange-ments. The three most general arrangements arecentralized, community-based (or locallymanaged), and collaborative (or co-management).The differences between the three primarily relateto the degree of stakeholder participation in theprocess and the location of management authorityand responsibility. Centralized management tendsto involve limited participation by stakeholdersand management authority and responsibility arelocated in a central agency or office of government.Community-based or locally managed tends toinvolve a great deal of local stakeholder participa-tion and management authority and responsibilityare located at the community or local organizationlevel. Co-management is a sharing of authorityand responsibility between government and localstakeholders, which may take many forms, andinvolves a high degree of stakeholder participation.This guidebook has been written to allow for MPAevaluation under any of these three arrangements.
This guidebook has a large focus on participationin MPA management, as experience has shownthat the imposition of an MPA located near humansettlements and without broad stakeholder partic-ipation, consensus and acceptability can lead tofailure. Where local stakeholders have a highdegree of participation in MPA planning and
163
The governance indicators
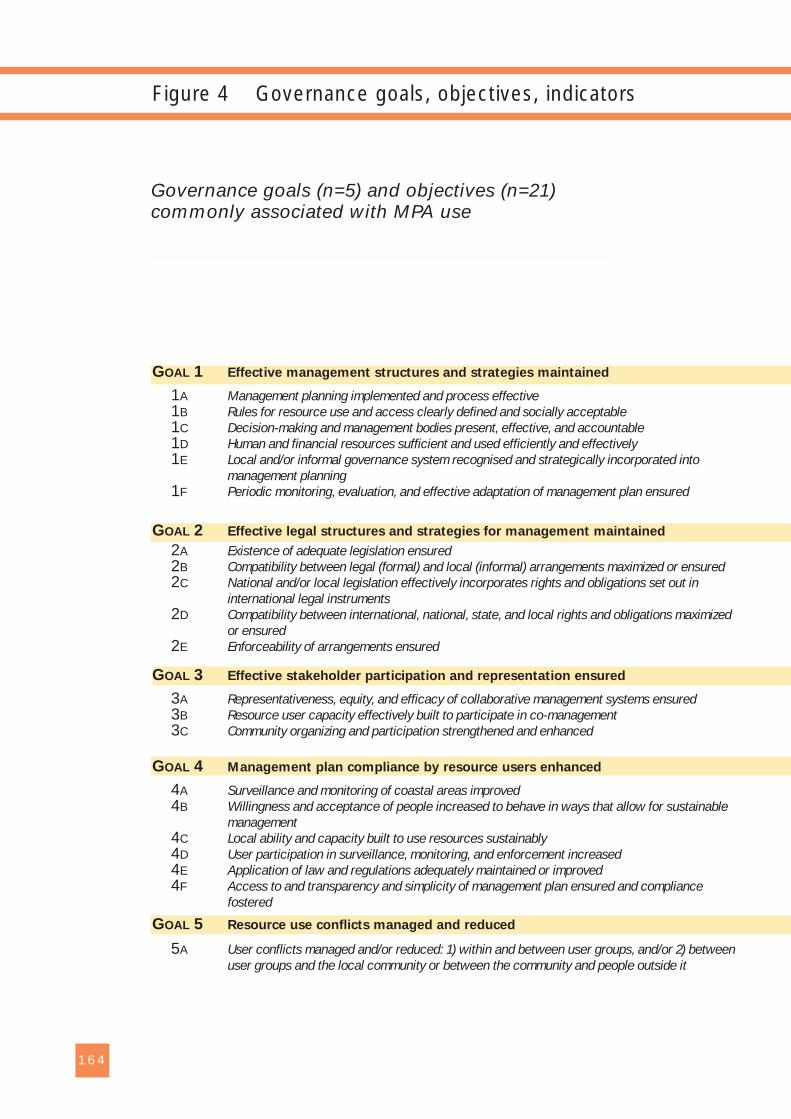
164
Figure 4 Governance goals, objectives, indicators
Governance goals (n=5) and objectives (n=21) commonly associated with MPA use
GOAL 1 Effective management structures and strategies maintained
1A Management planning implemented and process effective1B Rules for resource use and access clearly defined and socially acceptable1C Decision-making and management bodies present, effective, and accountable1D Human and financial resources sufficient and used efficiently and effectively1E Local and/or informal governance system recognised and strategically incorporated into
management planning1F Periodic monitoring, evaluation, and effective adaptation of management plan ensured
GOAL 2 Effective legal structures and strategies for management maintained
2A Existence of adequate legislation ensured2B Compatibility between legal (formal) and local (informal) arrangements maximized or ensured2C National and/or local legislation effectively incorporates rights and obligations set out in
international legal instruments2D Compatibility between international, national, state, and local rights and obligations maximized
or ensured2E Enforceability of arrangements ensured
GOAL 3 Effective stakeholder participation and representation ensured
3A Representativeness, equity, and efficacy of collaborative management systems ensured3B Resource user capacity effectively built to participate in co-management3C Community organizing and participation strengthened and enhanced
GOAL 4 Management plan compliance by resource users enhanced
4A Surveillance and monitoring of coastal areas improved4B Willingness and acceptance of people increased to behave in ways that allow for sustainable
management4C Local ability and capacity built to use resources sustainably4D User participation in surveillance, monitoring, and enforcement increased4E Application of law and regulations adequately maintained or improved4F Access to and transparency and simplicity of management plan ensured and compliance
fostered
GOAL 5 Resource use conflicts managed and reduced
5A User conflicts managed and/or reduced: 1) within and between user groups, and/or 2) betweenuser groups and the local community or between the community and people outside it
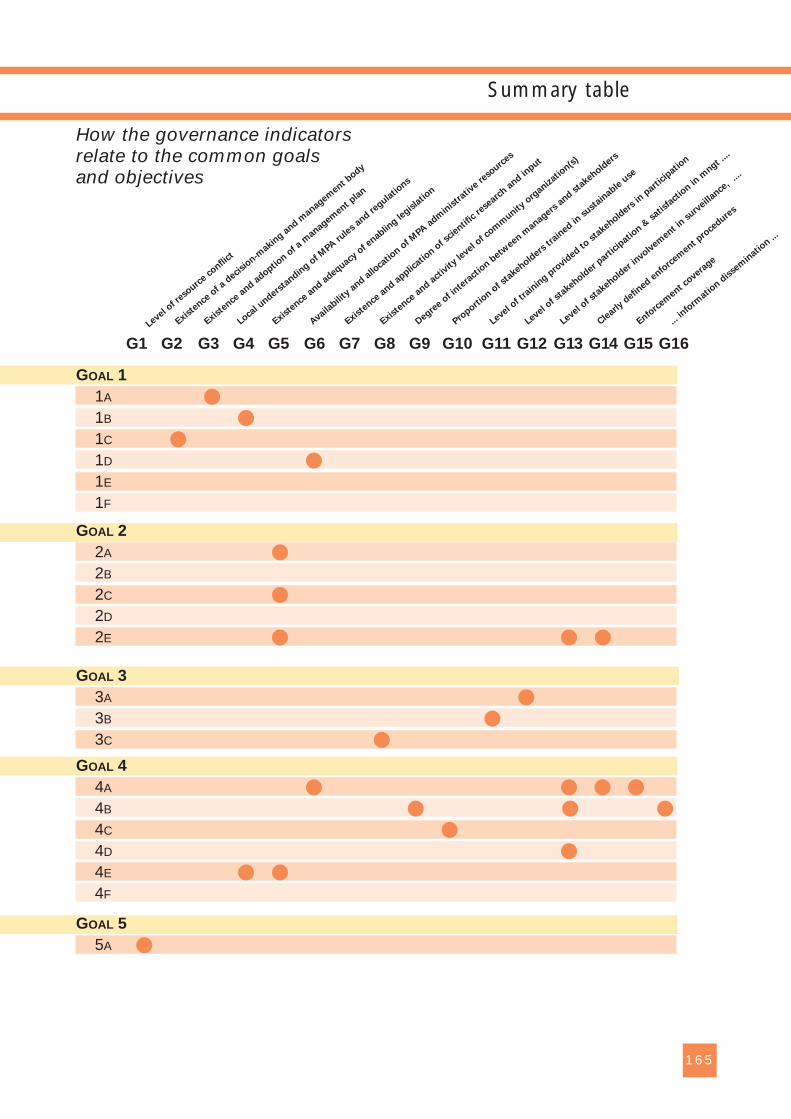
165
GOAL 1
1A �
1B �
1C �
1D �
1E
1F
GOAL 2
2A �
2B
2C �
2D
2E � � �
GOAL 3
3A �
3B �
3C �
GOAL 4
4A � � � �
4B � � �
4C �
4D �
4E � �
4F
GOAL 5
5A �
Existe
nce o
f a d
ecisi
on-makin
g and m
anagement b
ody
Existe
nce a
nd adoptio
n of a
managem
ent pla
n
Local u
ndersta
nding o
f MPA
rule
s and re
gulatio
ns
Existe
nce a
nd adequacy
of e
nabling le
gisla
tion
Availabili
ty a
nd allo
catio
n of M
PA a
dmin
istr
ative re
sourc
es
Existe
nce a
nd applic
ation o
f sci
entific
rese
arch a
nd input
Existe
nce a
nd act
ivity
level o
f com
munity
org
anizatio
n(s)
Degre
e of i
ntera
ctio
n betw
een managers
and s
takehold
ers
Proport
ion o
f sta
keholders
train
ed in s
ustain
able u
se
Level of t
rain
ing p
rovid
ed to s
takehold
ers in
part
icip
ation
Level of s
takehold
er part
icip
ation &
satis
fact
ion in
mngt .
...
Level of s
takehold
er involv
ement i
n surv
eillance
, ...
.
Clearly
defin
ed enfo
rcem
ent pro
cedure
s
Enforc
ement c
overage
... in
form
ation d
isse
min
ation ..
.
G1 G2 G3 G4 G5 G6 G7 G8 G9 G10 G11 G12 G13 G14 G15 G16
How the governance indicators relate to the common goalsand objectives
Level of r
esourc
e confli
ct
Summary table

The colourful life of a coral reef epitomises the diversity and attraction of
marine protected areas.
NO
AA
PH
OT
OLI
BR
AR
Y
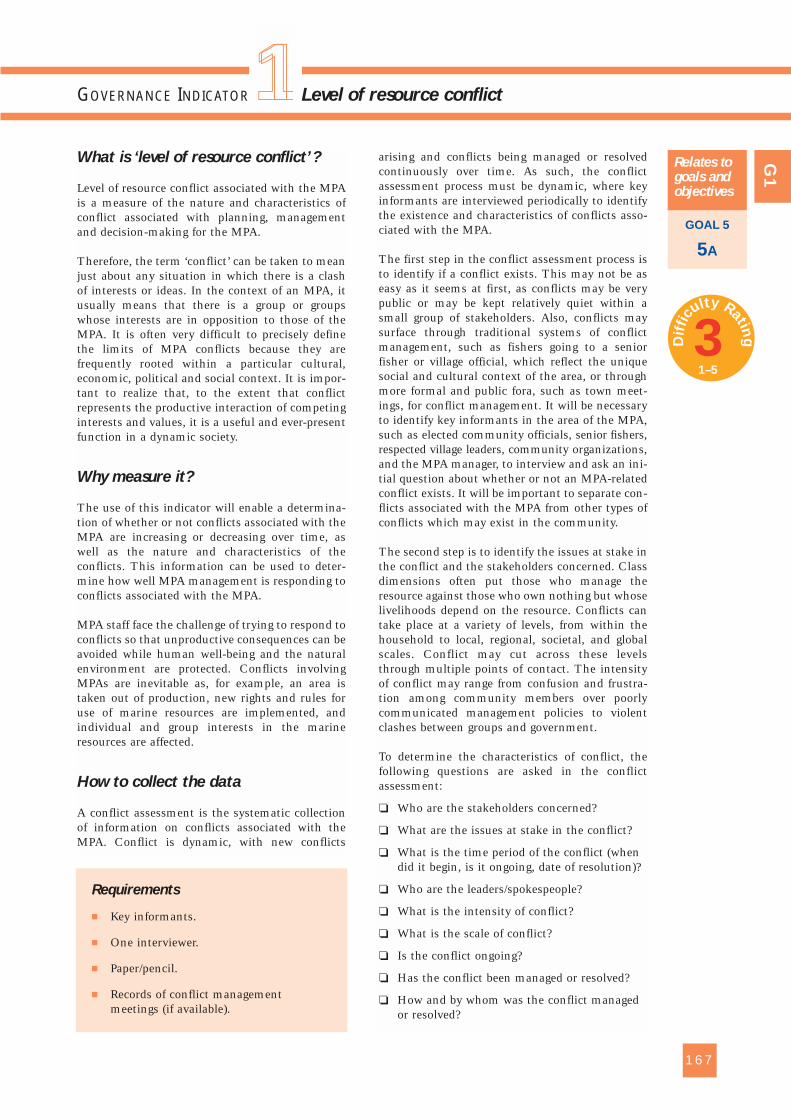
What is ‘level of resource conflict’?
Level of resource conflict associated with the MPAis a measure of the nature and characteristics ofconflict associated with planning, managementand decision-making for the MPA.
Therefore, the term ‘conflict’ can be taken to meanjust about any situation in which there is a clashof interests or ideas. In the context of an MPA, itusually means that there is a group or groupswhose interests are in opposition to those of theMPA. It is often very difficult to precisely definethe limits of MPA conflicts because they arefrequently rooted within a particular cultural,economic, political and social context. It is impor-tant to realize that, to the extent that conflictrepresents the productive interaction of competinginterests and values, it is a useful and ever-presentfunction in a dynamic society.
Why measure it?
The use of this indicator will enable a determina-tion of whether or not conflicts associated with theMPA are increasing or decreasing over time, aswell as the nature and characteristics of theconflicts. This information can be used to deter-mine how well MPA management is responding toconflicts associated with the MPA.
MPA staff face the challenge of trying to respond toconflicts so that unproductive consequences can beavoided while human well-being and the naturalenvironment are protected. Conflicts involvingMPAs are inevitable as, for example, an area istaken out of production, new rights and rules foruse of marine resources are implemented, andindividual and group interests in the marineresources are affected.
How to collect the data
A conflict assessment is the systematic collectionof information on conflicts associated with theMPA. Conflict is dynamic, with new conflicts
arising and conflicts being managed or resolvedcontinuously over time. As such, the conflictassessment process must be dynamic, where keyinformants are interviewed periodically to identifythe existence and characteristics of conflicts asso-ciated with the MPA.
The first step in the conflict assessment process isto identify if a conflict exists. This may not be aseasy as it seems at first, as conflicts may be verypublic or may be kept relatively quiet within asmall group of stakeholders. Also, conflicts maysurface through traditional systems of conflictmanagement, such as fishers going to a seniorfisher or village official, which reflect the uniquesocial and cultural context of the area, or throughmore formal and public fora, such as town meet-ings, for conflict management. It will be necessaryto identify key informants in the area of the MPA,such as elected community officials, senior fishers,respected village leaders, community organizations,and the MPA manager, to interview and ask an ini-tial question about whether or not an MPA-relatedconflict exists. It will be important to separate con-flicts associated with the MPA from other types ofconflicts which may exist in the community.
The second step is to identify the issues at stake inthe conflict and the stakeholders concerned. Classdimensions often put those who manage theresource against those who own nothing but whoselivelihoods depend on the resource. Conflicts cantake place at a variety of levels, from within thehousehold to local, regional, societal, and globalscales. Conflict may cut across these levelsthrough multiple points of contact. The intensityof conflict may range from confusion and frustra-tion among community members over poorlycommunicated management policies to violentclashes between groups and government.
To determine the characteristics of conflict, thefollowing questions are asked in the conflictassessment:
❏ Who are the stakeholders concerned?
❏ What are the issues at stake in the conflict?
❏ What is the time period of the conflict (whendid it begin, is it ongoing, date of resolution)?
❏ Who are the leaders/spokespeople?
❏ What is the intensity of conflict?
❏ What is the scale of conflict?
❏ Is the conflict ongoing?
❏ Has the conflict been managed or resolved?
❏ How and by whom was the conflict managedor resolved?
167
GOVERNANCE INDICATOR Level of resource conflict
GOAL 5
5A
Relates togoals andobjectives
G1
Requirements
� Key informants.
� One interviewer.
� Paper/pencil.
� Records of conflict managementmeetings (if available).
1
3Dif
ficu
lty Rating
1–5
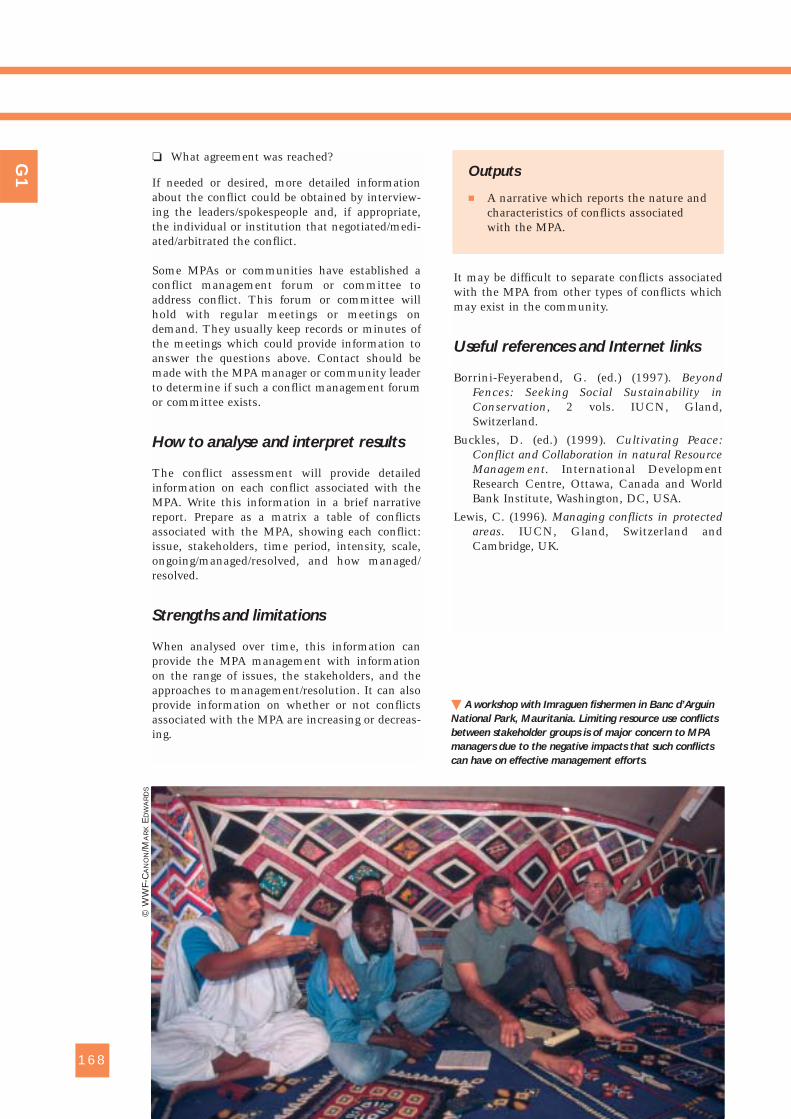
❏ What agreement was reached?
If needed or desired, more detailed informationabout the conflict could be obtained by interview-ing the leaders/spokespeople and, if appropriate,the individual or institution that negotiated/medi-ated/arbitrated the conflict.
Some MPAs or communities have established aconflict management forum or committee toaddress conflict. This forum or committee willhold with regular meetings or meetings ondemand. They usually keep records or minutes ofthe meetings which could provide information toanswer the questions above. Contact should bemade with the MPA manager or community leaderto determine if such a conflict management forumor committee exists.
How to analyse and interpret results
The conflict assessment will provide detailedinformation on each conflict associated with theMPA. Write this information in a brief narrativereport. Prepare as a matrix a table of conflictsassociated with the MPA, showing each conflict:issue, stakeholders, time period, intensity, scale,ongoing/managed/resolved, and how managed/resolved.
Strengths and limitations
When analysed over time, this information canprovide the MPA management with informationon the range of issues, the stakeholders, and theapproaches to management/resolution. It can alsoprovide information on whether or not conflictsassociated with the MPA are increasing or decreas-ing.
It may be difficult to separate conflicts associatedwith the MPA from other types of conflicts whichmay exist in the community.
Useful references and Internet links
Borrini-Feyerabend, G. (ed.) (1997). BeyondFences: Seeking Social Sustainability inConservation, 2 vols. IUCN, Gland,Switzerland.
Buckles, D. (ed.) (1999). Cultivating Peace:Conflict and Collaboration in natural ResourceManagement. International DevelopmentResearch Centre, Ottawa, Canada and WorldBank Institute, Washington, DC, USA.
Lewis, C. (1996). Managing conflicts in protectedareas. IUCN, Gland, Switzerland andCambridge, UK.
168
G1 Outputs
� A narrative which reports the nature andcharacteristics of conflicts associatedwith the MPA.
� A workshop with Imraguen fishermen in Banc d’Arguin
National Park, Mauritania. Limiting resource use conflicts
between stakeholder groups is of major concern to MPA
managers due to the negative impacts that such conflicts
can have on effective management efforts.
© W
WF-
CA
NO
N/M
AR
KE
DW
AR
DS
What is ‘existence of a decision-
making and management body’?
Existence of an MPA decision-making andmanagement body is a measure of the recognitionof an institution that governs how the MPA ismanaged and used and a transparent process formanagement planning, establishing rules andregulations, and enforcing the rules and regulations.
Why measure it?
The existence of a legally mandated MPA decision-making and management body will lead to moreprofessional management of the MPA, thatmanagement will be more effective and account-able, and it will become easier to have a successfulMPA. It should be noted that in some cases themanagement body (the group implementing theMPA management plan) may or may not be thesame as the decision-making body and that thishas implications for the likely effectiveness of theMPA (more effective when both bodies are thesame).
How to collect the data
First, the institution(s) that have some level ofdecision-making and management authority andresponsibility for the MPA (international, national,regional, municipal) must be identified. This infor-mation is typically available in the MPA manage-ment plan. A typical MPA management plan willhave an organization chart showing the lines ofauthority and responsibility for MPA management.If such an organization chart does not exist, onecan be developed through interviews with MPAstaff. The distance (both geographical and
administrative) of the decision-making andmanagement body from the MPA needs to begauged as do the hierarchies of bodies and therelationships between them.
Second, the existence of each body should beconfirmed by identifying a person responsible forits operation. The person should be interviewed tocollect any documents explaining the function andpowers of the body.
Third, the legal and formal or informal authorityof the body should be recorded from papers ofincorporation, plans or other documents.
Fourth, the frequency of meetings to determine thefunctionality of the decision-making body must beidentified. The next stage is to observe theoperation of the body at a meeting to witness thedecision-making process and the roles and respon-sibilities of the different actors.
Optionally, key informants (resource users) in thecommunity can be interviewed to identify anddescribe how and whom they believe has decision-making and management authority and responsi-bility for the MPA.
How to analyse and interpret results
Develop an organization chart for the MPA listingall bodies with decision-making and managementauthority and responsibility. Prepare a narrativedescription of the authority and responsibility ofeach body as well as the mandate (formal/non-formal, legal) of the body.
Strengths and limitations
While this indicator will list and describe eachdecision-making and management body associatedwith the MPA, it will not evaluate the effective-ness, credibility and accountability of the body. Amore complete survey will need to be undertakento collect this information.
169
GOVERNANCE INDICATOR Existence of a decision-making and management body
GOAL 1
1C
Relates togoals andobjectives
G2
Requirements
� MPA management plan.
� Papers of incorporation of an MPAdecision-making and management body.
� Location of MPA decision-making andmanagement body.
� Identification of MPA staff.
� Dates and location of meeting of body.
� One interviewer.
� Paper/pencil.
1
2Dif
ficu
lty Rating
1–5
Outputs
� List and narrative description of thedifferent MPA decision-making andmanagement bodies, including adescription of their mandate to makemanagement decisions.
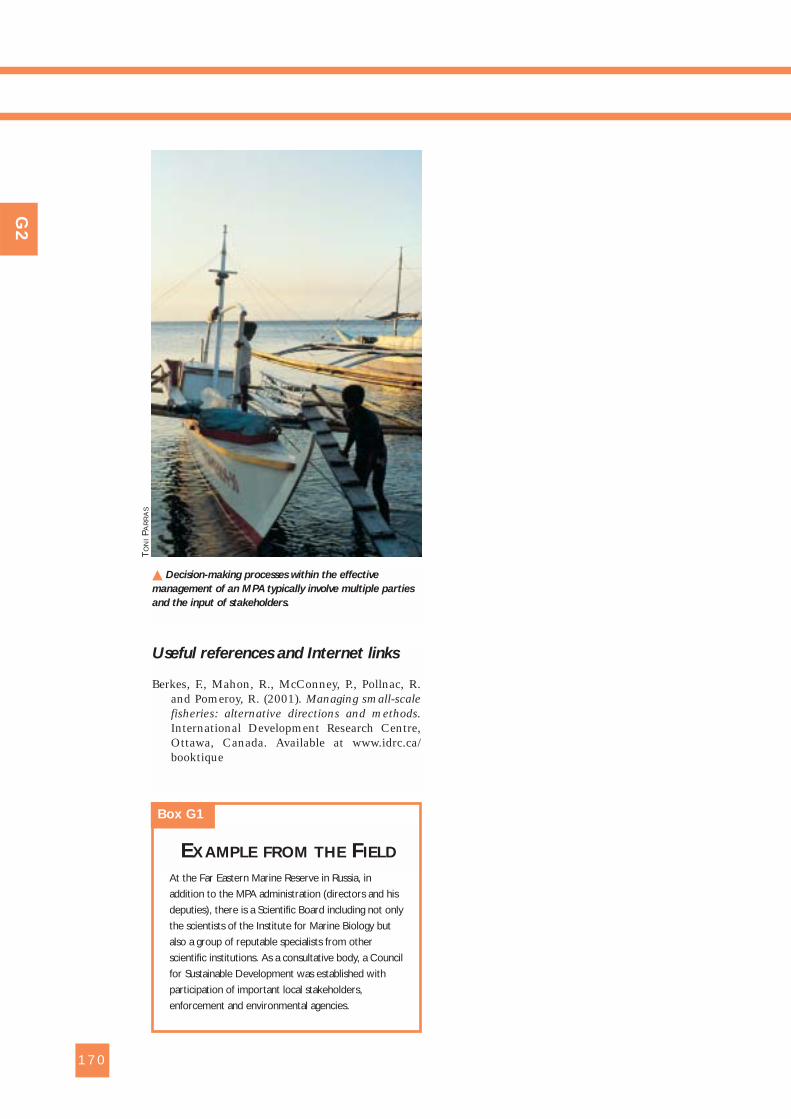
Useful references and Internet links
Berkes, F., Mahon, R., McConney, P., Pollnac, R.and Pomeroy, R. (2001). Managing small-scalefisheries: alternative directions and methods.International Development Research Centre,Ottawa, Canada. Available at www.idrc.ca/booktique
170
At the Far Eastern Marine Reserve in Russia, in
addition to the MPA administration (directors and his
deputies), there is a Scientific Board including not only
the scientists of the Institute for Marine Biology but
also a group of reputable specialists from other
scientific institutions. As a consultative body, a Council
for Sustainable Development was established with
participation of important local stakeholders,
enforcement and environmental agencies.
EXAMPLE FROM THE FIELD
Box G1
G2
� Decision-making processes within the effective
management of an MPA typically involve multiple parties
and the input of stakeholders.
TO
NIPA
RR
AS

What is ‘existence and adoption of a
management plan’?
Existence and adoption of a management plan is ameasure of the existence of a document whichstates the overall MPA goals and objectives to beachieved, the institutional structure of the man-agement system, and a portfolio of managementmeasures and whether the plan is enforceable.
Why measure it?
The MPA management plan sets out the strategicdirections for the MPA management programme.The effective management of the MPA is based onthe achievement of goals and objectives throughthe use of appropriate management measures. Theexistence and adoption of a management planmeans that there are strategic directions andactions for implementation of the MPA. Anenforceable plan means that there is legislativesupport for the plan to be implemented.
How to collect the data
First, the MPA manager should be sought out andasked to provide a copy of the MPA managementplan and legislation in support of the MPA at thenational and/or local level.
Second, a checklist should be prepared with theinformation listed on the right.
How to analyse and interpret results
Using that list, prepare a narrative text describingthe existence of the plan, its adoption,content/characteristics, and the enforceability(legal basis) of the plan.
The existence and adoption of an MPA manage-ment plan informs us that the MPA is guided by
goals and objectives to achieve certain outcomes(for example, conservation, protection, research),that there is a basic strategy to achieve these goalsand objectives, and that the overall plan has a legalmandate for implementation.
In some cases a formal management plan may notexist but there may be informal or goals and objec-tives that have been agreed upon by those associ-ated with the MPA. This should be noted anddescribed in narrative text.
171
GOVERNANCE INDICATOR Existence and adoption of a management plan
GOAL 1
1A
Relates togoals andobjectives
G3
Requirements
� Name and address of the MPA manageror management body.
� Established time and place to meet withMPA manager.
� Management plan.
� Legislation in support of the MPA.
� Paper/pencil.
1
Checklist of items on the existence
and adoption of a management plan
1) The actual existence of the plan inprinted form.
2) The management plan is reviewed todetermine the:a) date of the current plan b) date of any updates c) adoption of pland) date of adoptione) signatories of the plan adoption f) level of plan adoption (international,
national, regional, municipal, local).
3) Completeness of the plan. Does it havesections addressing the following compo-nents:a) goalsb) objectivesc) management strategy
i) advisory committeesii) interagency agreementsiii) boundariesiv) zoning planv) regulationsvi) social, cultural, and resource
studies planvii) resource management planviii) interpretive plan
d) administrationi) staffingii) trainingiii) facilities and equipmentiv) budget and business plans,
finance sourcese) surveillance and enforcementf) monitoring and evaluation of plan
effectiveness.
4. Enforceability of the plan. Is there legis-lation at the national or local level toprovide a legal basis for the plan and tobe able to enforce the managementmeasures?
2Dif
ficu
lty Rating
1–5
Strengths and limitations
While an MPA management plan may exist, thatdoes not guarantee that it is good or that it is beingfollowed or that its legitimacy is recognised by thelocal resource users. A bad or inappropriate planthat is implemented may be worse than no plan.
Note that in the case of a private MPA, the planmay not fit the level of completeness describedabove as this list is oriented toward recognition of
the MPA by a national or locally defined authority.In the case of a private MPA, it is better to definecompleteness via the rights and rules given by theprivate MPA.
Useful references and Internet links
Hockings, M., Stolton, S., Dudley, N. and Parrish,J. (2002). The Enhancing Our Heritage Toolkit,Book 2. pp. 24-30. Available at www.enhancingheritage.net
Salm, R.V., Clark, J.R. and Siirila, E. (2000).Marine and Coastal Protected Areas: A Guidefor Planners and Managers (3rd Edition).Chapter 2. “Site Planning and Management”.IUCN. Washington, DC, USA.
172
G3
Outputs
� Narrative text about the managementplan.
At the Sian Ka’an Coastal Biosphere Reserve in Mexico, the
current Management Plan (MP) is the result of a review
done in 1996. The main purpose of this MP is to be a tool
for the integration, follow-up and evaluation of the protec-
tion and sustainable use of natural resources’ strategies. It is
an instrument for planning and regulation, in which the
activities, actions and basic regulations for the management
and administration of the protected area are established.
The MP contains a description of the physical, socio-cultural
and natural resources’ use characteristics of the MPA. After
listing the major objectives of the Reserve, the MP states
the strategy for the short-, medium- and long-terms, based
on the following goals:
a) Guarantee the physical integrity of the area.
b) Promote reasonable use of the natural resources.
c) Foster social participation and representation in
management and in the sustainable use of natural
resources.
d) Spearhead research and education towards a better
understanding and utilization of the natural resources
of the areas and the environmental benefits that this
would provide for the region.
e) Secure financing for the permanent and continuous
operation of the area.
According to these goals, the MP is divided into five
components with sub-components. Each of them has
specific objectives and implementation strategies. The MP
includes a section describing the basic legal framework and
an annex in which are established Use Regulations and
Zoning inside the limits of the PA – Core Zones, Buffer
Zones and Critical Zones.
The MP is not a legal instrument because it has not been
published in the Official Diary of the Federation. At the
time of its creation, the Sian Ka’an Biosphere Reserve
management was not aware of the importance of its official
publication, and it was just published as a public policy to
guide the management of the protected area. Despite the
fact that the MP has no legal recognition, local resource
users recognise, respect and observe its regulations. This
means that they recognise the authority of the management
body and, in some cases, collaborate with them in order to
succeed in common management goals and objectives.
EXAMPLE FROM THE FIELDBox G2
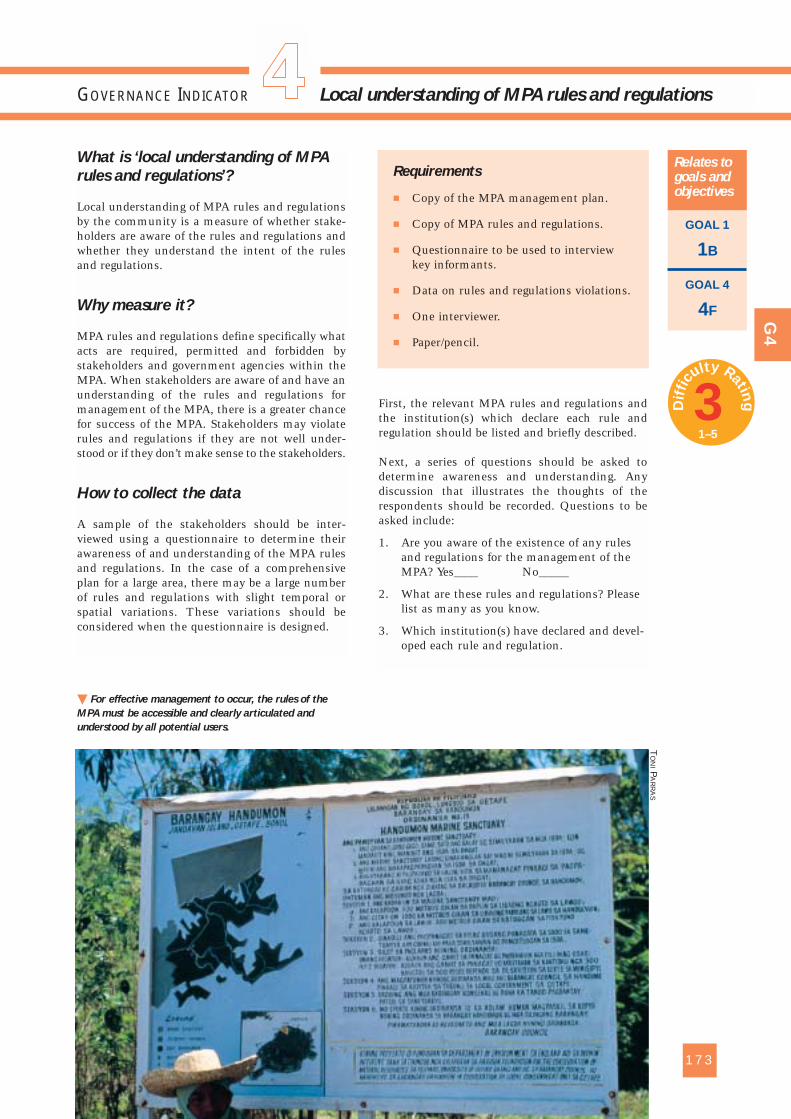
What is ‘local understanding of MPA
rules and regulations’?
Local understanding of MPA rules and regulationsby the community is a measure of whether stake-holders are aware of the rules and regulations andwhether they understand the intent of the rulesand regulations.
Why measure it?
MPA rules and regulations define specifically whatacts are required, permitted and forbidden bystakeholders and government agencies within theMPA. When stakeholders are aware of and have anunderstanding of the rules and regulations formanagement of the MPA, there is a greater chancefor success of the MPA. Stakeholders may violaterules and regulations if they are not well under-stood or if they don’t make sense to the stakeholders.
How to collect the data
A sample of the stakeholders should be inter-viewed using a questionnaire to determine theirawareness of and understanding of the MPA rulesand regulations. In the case of a comprehensiveplan for a large area, there may be a large numberof rules and regulations with slight temporal orspatial variations. These variations should beconsidered when the questionnaire is designed.
First, the relevant MPA rules and regulations andthe institution(s) which declare each rule andregulation should be listed and briefly described.
Next, a series of questions should be asked todetermine awareness and understanding. Anydiscussion that illustrates the thoughts of therespondents should be recorded. Questions to beasked include:
1. Are you aware of the existence of any rulesand regulations for the management of theMPA? Yes____ No_____
2. What are these rules and regulations? Pleaselist as many as you know.
3. Which institution(s) have declared and devel-oped each rule and regulation.
173
GOVERNANCE INDICATOR Local understanding of MPA rules and regulations
GOAL 1
1B
GOAL 4
4F
Relates togoals andobjectives
G4
� For effective management to occur, the rules of the
MPA must be accessible and clearly articulated and
understood by all potential users.
Requirements
� Copy of the MPA management plan.
� Copy of MPA rules and regulations.
� Questionnaire to be used to interviewkey informants.
� Data on rules and regulations violations.
� One interviewer.
� Paper/pencil.
1T
ON
IPA
RR
AS
3Dif
ficu
lty Rating
1–5
4. For each informant, ask whether they regardthe rules and regulations as being simple andclear:
1 = rules and regulations are very complexand difficult to understand
2 = rules are complex and difficult tounderstand
3 = rules are of average complexity4 = rules are simple and easy to understand5 = rules are very simple and easy to
understand
5. Do you feel that the rules and regulationsdesign process was participatory?
6. Do you feel ‘ownership’ of the rules andregulations?
7. Do you feel that the rules and regulations arecredible and appropriate?
8. Do you feel that the rules and regulations aresocially acceptable to the stakeholders?
9. Which rules and regulations do you feel areacceptable or unacceptable?
10. Why?
11. Why were the rules and regulations designedthe way they are?
These data can be collected at the start of theproject and every year thereafter.
How to analyse and interpret results
Tabulate the responses from all the questionnaires.Use simple statistical analysis (median, mode,standard deviation) on the data. Analyse thepercentage of the MPA rules and regulations thatindividuals can name to measure understandingand awareness. Present in narrative format withtables. Record any interesting discussion aboutawareness and understanding of the rules and
regulations that may be useful for supporting orrevising the rules and regulations. The responsesshould be cross-checked against the rules andregulations in the plan.
Strengths and limitations
A limitation of the indicator is that it does notmeasure level of participation of stakeholders increating the rules and regulations and theirperception of fairness of the rules and regulations.It should be noted that in some cases people whodo not like the rules could pretend that they do notknow about them or can provide other misleadingresponses making it difficult to obtain correctinformation.
Useful references and Internet links
ICLARM/IFM (1996). Analysis of fisheries co-management arrangements: a research frame-work. Fisheries Co-management ResearchProject WP 1. ICLARM/.World Fish Center,Penang, Malaysia. www.co-management.org
Ostrom, E. (1990). Governing the Commons: TheEvolution of Institutions for Collective Action.Cambridge University Press, Cambridge, UK.
174
Outputs
� Narrative description of the rules andregulations as understood by thestakeholders.
Based on the number of signs, public outreach efforts,
and media attention, it would be assumed that the
public understand the rules and regulations for the
Bird Island Marine Sanctuary of the Commonwealth
of the Northern Mariana Islands. In contrast, recent
events and violations suggest that the public does not
have a clear understanding of the area’s rules and
regulations. A survey of users of the site, particularly
non-English speaking users such as Japanese SCUBA
divers, may shed additional light on community
understanding (including dive operations). Since the
known violations have all related to the taking of
protected species, it could be reasoned that a more
thorough understanding of the rules and regulations
would enhance management effectiveness there.
EXAMPLE FROM THE FIELD
Box G3
G4
What is ‘existence and adequacy of
enabling legislation’?
Existence and adequacy of legislation to enable theMPA to accomplish its goals and objectives is ameasure of formal legislation in place to providethe MPA with a sound legal foundation so that thegoals and objectives of the MPA can be recognised,explained, respected, accomplished and enforced.In some areas, traditional law may also serve as afoundation for the MPA.
Why measure it?
The establishment of an MPA more often than notrequires the drafting and adoption of appropriatesupportive legislation and in some cases the recog-nition of traditional laws. The purpose of this indi-cator is to ensure that the MPA management planis supported by adequate legislation in order for itssuccessful implementation.
How to collect the data
The form and extent of legislation for MPAs willvary widely from country to country. The legalarrangements for MPAs may depend upon manyelements, including the form of government, avail-able finances, public administrative structures,level of government centralization/decentraliza-tion, lines of jurisdiction and decision-making,existence and legitimacy of traditional laws, andcommonly accepted practice.
The first step is to collect all legal documents ofpertinent laws relative to the MPA. These mayexist at international, national, state/provincialand local levels. The laws may be identified in theMPA management plan. This will require talkingto the MPA manager and reviewing the manage-ment plan and supporting documents. It may alsorequire contacting various government agenciesand offices to collect the documents. It should benoted that in addition to legislation related to the
MPA, the achievement of the MPA goals and objec-tives may require that activities be undertakenoutside of the MPA, such as water quality andintegrated coastal zone management. Legislationrelated to these other associated activities shouldalso be identified.
Second, a legal analysis should be conducted. Itwill involve three steps. First, to determine theexistence of legislation to support the MPA.Second, to compare the MPA management plan(the goals and objectives, rules and regulations,management authority and responsibility, enforce-ment powers) with the existing legislation todetermine compatibility. Third, to assess theappropriateness of the legislation.
To undertake the legal analysis, the questions to beasked include:
❏ What laws (formal and traditional) are inplace (e.g. fisheries, tourism, water quality,integrated coastal zone management, forest)?
❏ What institutions are in place to implementthe laws (governmental, non-governmental,traditional)?
❏ How current are the laws (when were theyapproved (year)?
❏ What is the form and extent of thelegislation?
❏ Is the law at the appropriate level (local,state/province, national) to support the MPA?
❏ Does the legislation support the goals andobjectives of the MPA?
❏ Are there sufficient laws to support the MPA?
❏ Are the laws appropriate to support the MPA?
❏ Are there legal provisions for sufficientpenalties for violators of MPA rules andregulations?
How to analyse and interpret results
Prepare a narrative report that focuses on answer-ing the following three questions:
❏ Does a law exist to support the MPA? Yes/No
❏ Is it compatible with the MPA managementplan? A little/mostly/very much
❏ Is it supportive of the MPA managementactivities and interventions? A little/mostly/very much
175
GOVERNANCE INDICATOR Existence and adequacy of enabling legislation
GOAL 2
2A 2C
2E
GOAL 4
4E
Relates togoals andobjectives
G5
Requirements
� Legal documents of pertinent laws atdifferent levels (international, national,state/provincial, local) for MPAs.
� MPA management plan.
� One interviewer.
� Paper/pencil.
1
2Dif
ficu
lty Rating
1–5
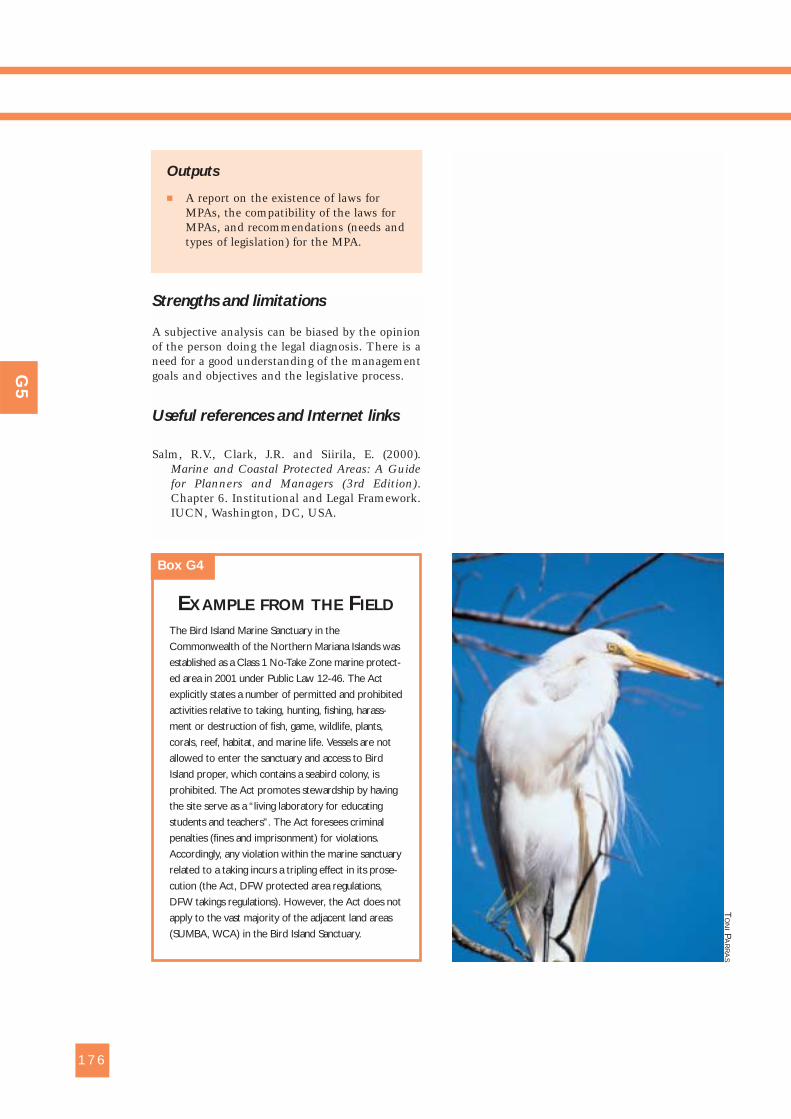
Strengths and limitations
A subjective analysis can be biased by the opinionof the person doing the legal diagnosis. There is aneed for a good understanding of the managementgoals and objectives and the legislative process.
Useful references and Internet links
Salm, R.V., Clark, J.R. and Siirila, E. (2000).Marine and Coastal Protected Areas: A Guidefor Planners and Managers (3rd Edition).Chapter 6. Institutional and Legal Framework.IUCN, Washington, DC, USA.
176
Outputs
� A report on the existence of laws forMPAs, the compatibility of the laws forMPAs, and recommendations (needs andtypes of legislation) for the MPA.
G5
The Bird Island Marine Sanctuary in the
Commonwealth of the Northern Mariana Islands was
established as a Class 1 No-Take Zone marine protect-
ed area in 2001 under Public Law 12-46. The Act
explicitly states a number of permitted and prohibited
activities relative to taking, hunting, fishing, harass-
ment or destruction of fish, game, wildlife, plants,
corals, reef, habitat, and marine life. Vessels are not
allowed to enter the sanctuary and access to Bird
Island proper, which contains a seabird colony, is
prohibited. The Act promotes stewardship by having
the site serve as a “living laboratory for educating
students and teachers”. The Act foresees criminal
penalties (fines and imprisonment) for violations.
Accordingly, any violation within the marine sanctuary
related to a taking incurs a tripling effect in its prose-
cution (the Act, DFW protected area regulations,
DFW takings regulations). However, the Act does not
apply to the vast majority of the adjacent land areas
(SUMBA, WCA) in the Bird Island Sanctuary.
EXAMPLE FROM THE FIELD
Box G4
TO
NIP
AR
RA
S
What is ‘availability and allocation of
MPA administrative resources’?
Availability and allocation of MPA administrativeresources is a measure of the capacity of themanagement team to administer and complete itsvarious MPA activities through time, based on thedegree of access to and level of enabling human,equipment and financial resources.
Why measure it?
The operation of the MPA involves several activi-ties such as surveillance and enforcement, stafftraining, budget and finances, monitoring andevaluation, environmental education, planning,and advisory committees. For example, surveil-lance and monitoring are critical parts of any MPAenforcement programme. The rationale is thatsome degree of illegal activities (for example, fish-ing, boating, pollution) can be anticipated as aresponse to a regulatory framework established forthe MPA. An understanding of the availability ofadequate budget, human resources and equipmentto undertake surveillance and monitoring isimportant because these are the people and associ-ated equipment which will be needed to undertakethis activity. It is assumed that the more budget,human resources and equipment allocated to thisactivity, the greater will be the level of compliancewith rules and regulations.
How to collect the data
First, the various activities undertaken for MPAmanagement such as the monitoring, control,surveillance and enforcement programme;environmental education; monitoring and evalua-tion; advisory committees; staff training etc., needto be identified.
The management plan should include sectionswhich describe the activities. This will provideinformation on programme design for comparisonwith the current structure. The management planshould also provide information on the minimumrequirements for or of ideal requirements for eachactivity. This can be used for a comparison withthe existing resources available for these activities.If no such information exists, an interview shouldbe conducted with the MPA manager to determinea list of activities undertaken by the MPA andminimum requirements or ideal requirements forthe activities.
Next, an interview is conducted with the MPAmanager and the designated staff member for eachactivity to obtain information about the currentavailability and allocation of resources to the activ-ity. The focus of the questions asked should be:
❏ The access to and adequacy of resources toundertake the task.
❏ The appropriateness of operation of the activityto undertake the task.
It should be noted that some MPAs leave certainactivities to other organizations, for example,surveillance may be conducted by nationalagencies, such as the Coast Guard or marinepatrol. In this situation, the questions will need tobe adapted to reflect this arrangement.
Questions to be asked of the MPA manager andthe designated staff member include:
❏ What is the number of MPA staff assigned tothe programme?
❏ What is the number of non-MPA staff(community members, fishers) assigned to theprogramme?
❏ What kind/level of training is provided tomanagement and staff?
❏ What is the experience (type and years) andeducation (level) of each staff member?
❏ What is the budget for the activity?
❏ What equipment is available (boat, guardhouse, radio, GPS, binoculars, uniform, diveequipment, computers) for the activity?
177
GOVERNANCE INDICATOR Availability and allocation of MPA administrative
GOAL 1
1D
GOAL 4
4A
Relates togoals andobjectives
G6
Requirements
� Copy of the MPA management plan.
� List of MPA activities.
� List of MPA staff and associates involvedwith each activity.
� List of equipment available for eachactivity.
� List of minimum requirements or ofideal requirements to effectively under-take each activity from the managementplan.
� MPA budget.
� One interviewer.
� Paper/pencil.
resources
1
2D iffic
ulty Rating
1–5
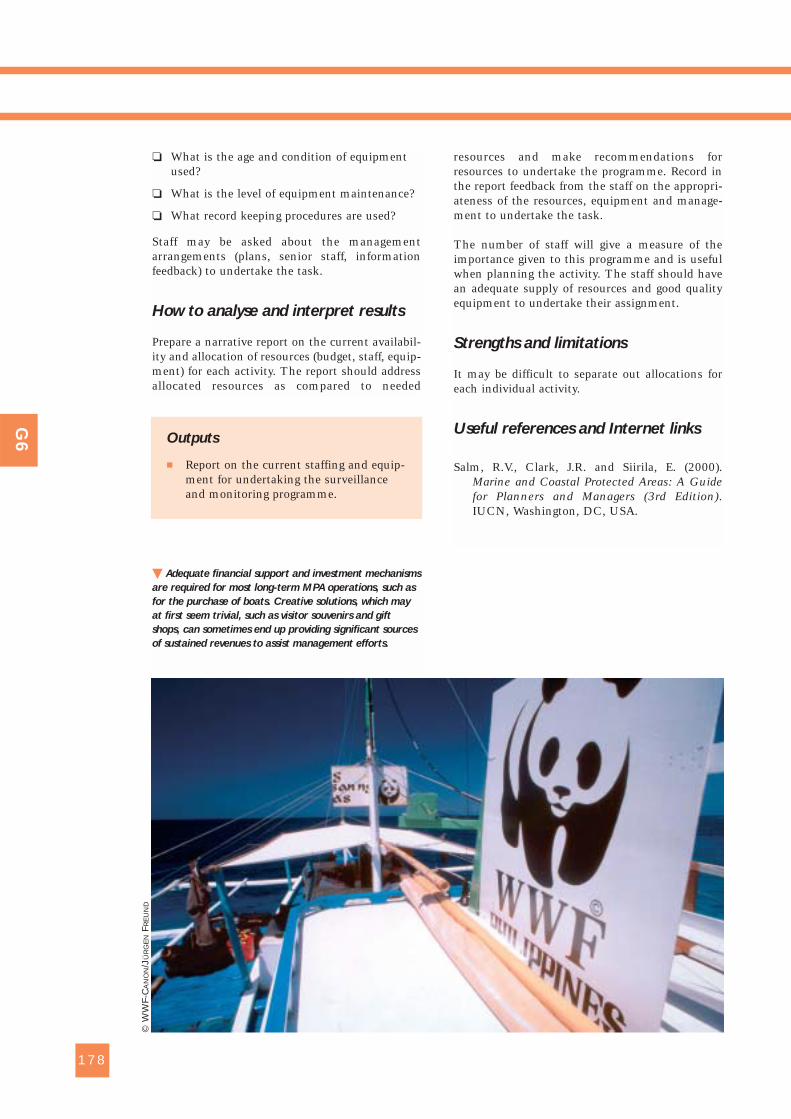
❏ What is the age and condition of equipmentused?
❏ What is the level of equipment maintenance?
❏ What record keeping procedures are used?
Staff may be asked about the managementarrangements (plans, senior staff, informationfeedback) to undertake the task.
How to analyse and interpret results
Prepare a narrative report on the current availabil-ity and allocation of resources (budget, staff, equip-ment) for each activity. The report should addressallocated resources as compared to needed
resources and make recommendations forresources to undertake the programme. Record inthe report feedback from the staff on the appropri-ateness of the resources, equipment and manage-ment to undertake the task.
The number of staff will give a measure of theimportance given to this programme and is usefulwhen planning the activity. The staff should havean adequate supply of resources and good qualityequipment to undertake their assignment.
Strengths and limitations
It may be difficult to separate out allocations foreach individual activity.
Useful references and Internet links
Salm, R.V., Clark, J.R. and Siirila, E. (2000).Marine and Coastal Protected Areas: A Guidefor Planners and Managers (3rd Edition).IUCN, Washington, DC, USA.
178
G6 Outputs
� Report on the current staffing and equip-ment for undertaking the surveillanceand monitoring programme.
� Adequate financial support and investment mechanisms
are required for most long-term MPA operations, such as
for the purchase of boats. Creative solutions, which may
at first seem trivial, such as visitor souvenirs and gift
shops, can sometimes end up providing significant sources
of sustained revenues to assist management efforts.
© W
WF-
CA
NO
N/J
ÜR
GE
NFR
EU
ND
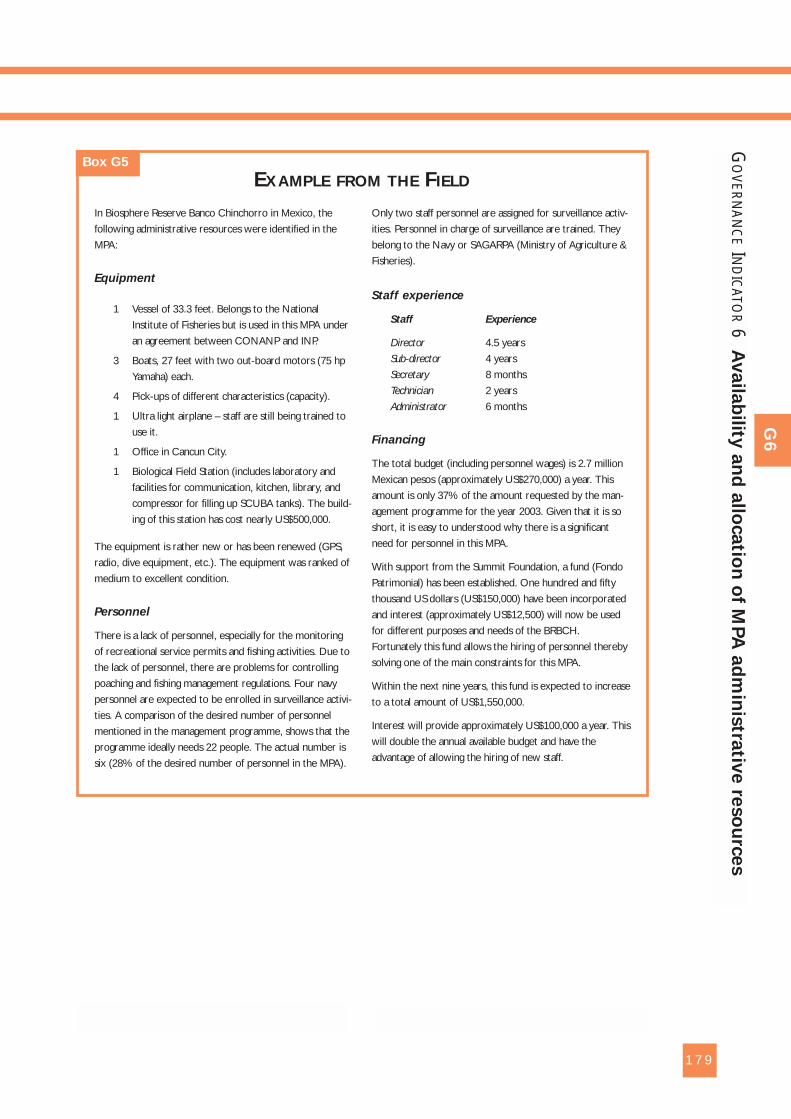
179
In Biosphere Reserve Banco Chinchorro in Mexico, the
following administrative resources were identified in the
MPA:
Equipment
1 Vessel of 33.3 feet. Belongs to the National
Institute of Fisheries but is used in this MPA under
an agreement between CONANP and INP.
3 Boats, 27 feet with two out-board motors (75 hp
Yamaha) each.
4 Pick-ups of different characteristics (capacity).
1 Ultra light airplane – staff are still being trained to
use it.
1 Office in Cancun City.
1 Biological Field Station (includes laboratory and
facilities for communication, kitchen, library, and
compressor for filling up SCUBA tanks). The build-
ing of this station has cost nearly US$500,000.
The equipment is rather new or has been renewed (GPS,
radio, dive equipment, etc.). The equipment was ranked of
medium to excellent condition.
Personnel
There is a lack of personnel, especially for the monitoring
of recreational service permits and fishing activities. Due to
the lack of personnel, there are problems for controlling
poaching and fishing management regulations. Four navy
personnel are expected to be enrolled in surveillance activi-
ties. A comparison of the desired number of personnel
mentioned in the management programme, shows that the
programme ideally needs 22 people. The actual number is
six (28% of the desired number of personnel in the MPA).
Only two staff personnel are assigned for surveillance activ-
ities. Personnel in charge of surveillance are trained. They
belong to the Navy or SAGARPA (Ministry of Agriculture &
Fisheries).
Staff experience
Staff Experience
Director 4.5 years
Sub-director 4 years
Secretary 8 months
Technician 2 years
Administrator 6 months
Financing
The total budget (including personnel wages) is 2.7 million
Mexican pesos (approximately US$270,000) a year. This
amount is only 37% of the amount requested by the man-
agement programme for the year 2003. Given that it is so
short, it is easy to understood why there is a significant
need for personnel in this MPA.
With support from the Summit Foundation, a fund (Fondo
Patrimonial) has been established. One hundred and fifty
thousand US dollars (US$150,000) have been incorporated
and interest (approximately US$12,500) will now be used
for different purposes and needs of the BRBCH.
Fortunately this fund allows the hiring of personnel thereby
solving one of the main constraints for this MPA.
Within the next nine years, this fund is expected to increase
to a total amount of US$1,550,000.
Interest will provide approximately US$100,000 a year. This
will double the annual available budget and have the
advantage of allowing the hiring of new staff.
GO
VERN
AN
CE
IND
ICATO
R6 A
vaila
bility
an
d a
llocatio
n o
f MPA
ad
min
istra
tive re
so
urc
es
G6
EXAMPLE FROM THE FIELDBox G5
What is ‘existence and application of
scientific research and input’?
Existence and application of scientific research andinput is a measure of how research activities andscientific knowledge generated by studies at theMPA feed back into improved management; thatis, the ability of the management team to accessand use science to inform their managementactions.
Why measure it?
The management of complex ecosystems, such asthose in which MPAs are established, is often sub-ject to complex natural processes and significanthuman pressures. Because of this, effective man-agement cannot occur in the absence of science.The natural sciences are vital to understandingecosystem functions and change, and the socialsciences are essential to identifying the sources ofhuman-induced problems, and testing andapplying appropriate solutions. Successful MPAstypically involve collaboration between managersand scientists at all stages, including: 1) in theformulation of MPA management policy and activ-ity planning; 2) in the design and implementationof an MPA; and 3) in conducting, interpreting, and
applying evaluative research to future manage-ment action.
To be useful, scientific information relevant to themarine environment and MPA practice must notmerely exist. It must also be applicable to andactively used by MPA staff for management pur-poses. Scientists play a critical role in this processby bridging the information needs of managers,politicians, and the public as ‘neutral’ brokers.
How to collect the data
There are four phases of data management for thisindicator.
First, the presence and extent of scientific studywill need to be determined. To do this, evaluatorsmust determine whether scientific research isbeing conducted in or around the MPA. This canbe done by checking relevant records and minutesof planning and management meetings for discus-sion and/or coordinating with scientific study.Subsequently, it will be necessary to interviewthose management staff who are in charge of sup-porting and/or coordinating with scientificresearchers to learn about the needs, presence, andextent of current and completed scientific study,and how such work links to the management ofthe MPA. In some cases, there may be a designatedgroup of scientists among MPA staff with whom totalk. There may also be a scientific advisory boardwith which to consult as to the type of researchthat is being undertaken or has been completed.
Second, scientific staff, coordinators, and/or exter-nal researchers need to be interviewed to obtainmore detailed information and characterize theresearch designated activities. Questions to ask(for each study) include:
❏ What scientific study is being done? Haveother similar studies already been completed?
180
GOAL 1
1A 1F
Relates togoals andobjectives
G7
GOVERNANCE INDICATOR Existence and application of scientific research
Common types of scientific study that
can be useful to MPAs
There are many scientific techniques andprocedures that can be useful to managersin their MPA planning and adaptation. Inparticular, these include:
� Environmental impact assessments.
� Marine and costal resource surveys.
� Focal species life history and reproduc-tive biology studies.
� Ecological and population modelling.
� Economic assessment and valuation.
� Hazard and risk assessment.
� Legal and institutional analysis.
� Social and cultural profiling.
� Testing and review of management andcontrol measures.
� Public education engagement.
Requirements
� Access to MPA staff.
� Access to scientific study and results.
� Minutes of management meetings andprocesses.
� One interviewer.
� Paper/pencil.
and input1
2Dif
ficu
lty Rating
1–5
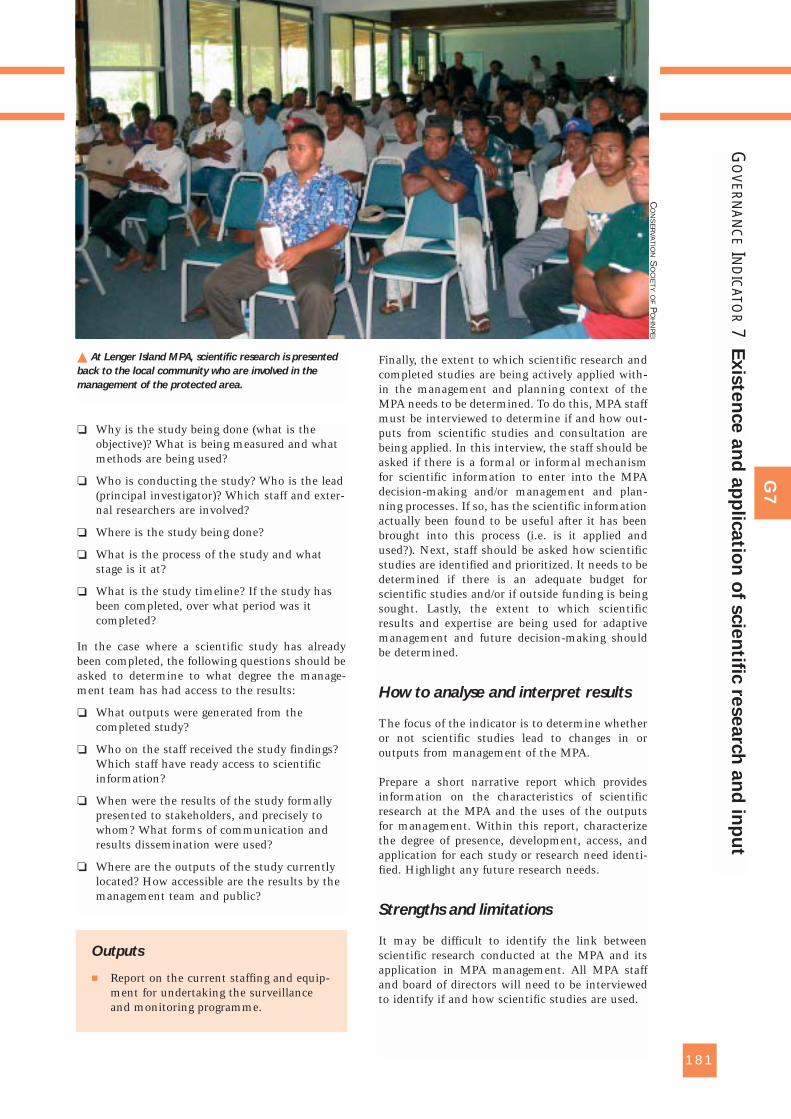
❏ Why is the study being done (what is theobjective)? What is being measured and whatmethods are being used?
❏ Who is conducting the study? Who is the lead(principal investigator)? Which staff and exter-nal researchers are involved?
❏ Where is the study being done?
❏ What is the process of the study and whatstage is it at?
❏ What is the study timeline? If the study hasbeen completed, over what period was itcompleted?
In the case where a scientific study has alreadybeen completed, the following questions should beasked to determine to what degree the manage-ment team has had access to the results:
❏ What outputs were generated from thecompleted study?
❏ Who on the staff received the study findings?Which staff have ready access to scientificinformation?
❏ When were the results of the study formallypresented to stakeholders, and precisely towhom? What forms of communication andresults dissemination were used?
❏ Where are the outputs of the study currentlylocated? How accessible are the results by themanagement team and public?
Finally, the extent to which scientific research andcompleted studies are being actively applied with-in the management and planning context of theMPA needs to be determined. To do this, MPA staffmust be interviewed to determine if and how out-puts from scientific studies and consultation arebeing applied. In this interview, the staff should beasked if there is a formal or informal mechanismfor scientific information to enter into the MPAdecision-making and/or management and plan-ning processes. If so, has the scientific informationactually been found to be useful after it has beenbrought into this process (i.e. is it applied andused?). Next, staff should be asked how scientificstudies are identified and prioritized. It needs to bedetermined if there is an adequate budget forscientific studies and/or if outside funding is beingsought. Lastly, the extent to which scientificresults and expertise are being used for adaptivemanagement and future decision-making shouldbe determined.
How to analyse and interpret results
The focus of the indicator is to determine whetheror not scientific studies lead to changes in oroutputs from management of the MPA.
Prepare a short narrative report which providesinformation on the characteristics of scientificresearch at the MPA and the uses of the outputsfor management. Within this report, characterizethe degree of presence, development, access, andapplication for each study or research need identi-fied. Highlight any future research needs.
Strengths and limitations
It may be difficult to identify the link betweenscientific research conducted at the MPA and itsapplication in MPA management. All MPA staffand board of directors will need to be interviewedto identify if and how scientific studies are used.
181
GO
VERN
AN
CE
IND
ICATO
R7
Exis
ten
ce a
nd
ap
plic
atio
n o
f scie
ntific
researc
h a
nd
inp
ut
G7
� At Lenger Island MPA, scientific research is presented
back to the local community who are involved in the
management of the protected area.
CO
NS
ER
VAT
ION
SO
CIE
TY
OF
PO
HN
PE
I
Outputs
� Report on the current staffing and equip-ment for undertaking the surveillanceand monitoring programme.
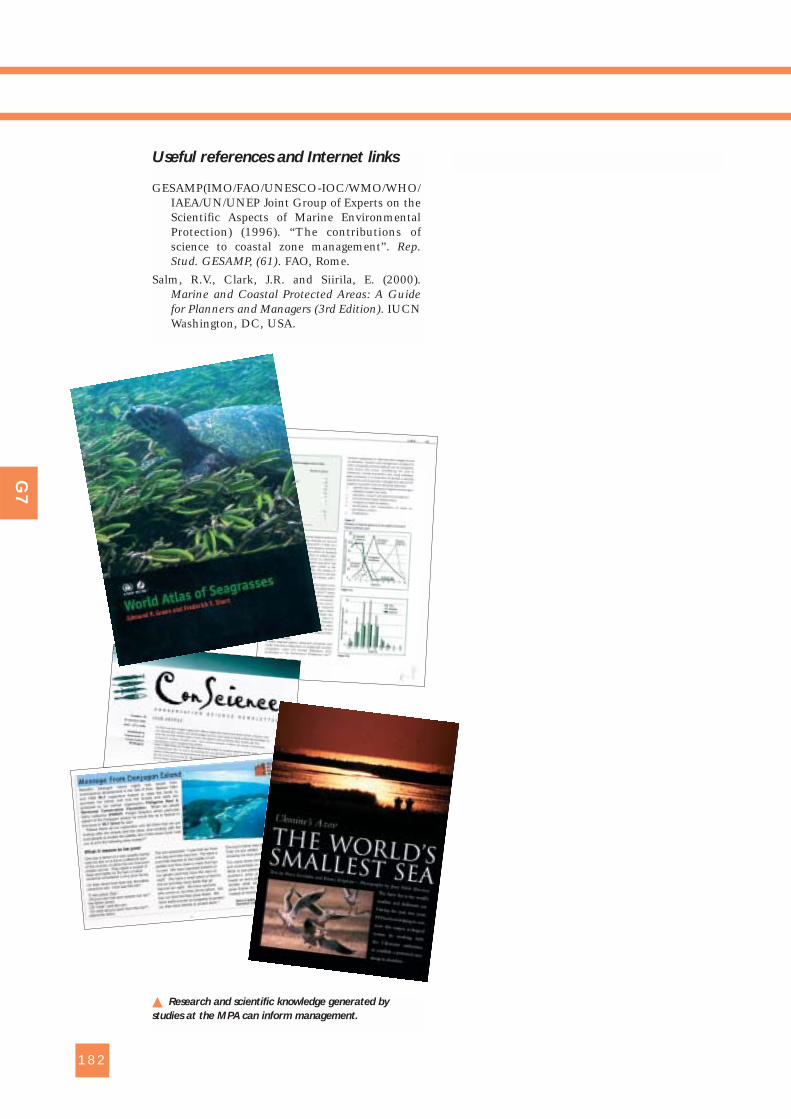
182
G7
� Research and scientific knowledge generated by
studies at the MPA can inform management.
Useful references and Internet links
GESAMP(IMO/FAO/UNESCO-IOC/WMO/WHO/IAEA/UN/UNEP Joint Group of Experts on theScientific Aspects of Marine EnvironmentalProtection) (1996). “The contributions ofscience to coastal zone management”. Rep.Stud. GESAMP, (61). FAO, Rome.
Salm, R.V., Clark, J.R. and Siirila, E. (2000).Marine and Coastal Protected Areas: A Guidefor Planners and Managers (3rd Edition). IUCNWashington, DC, USA.
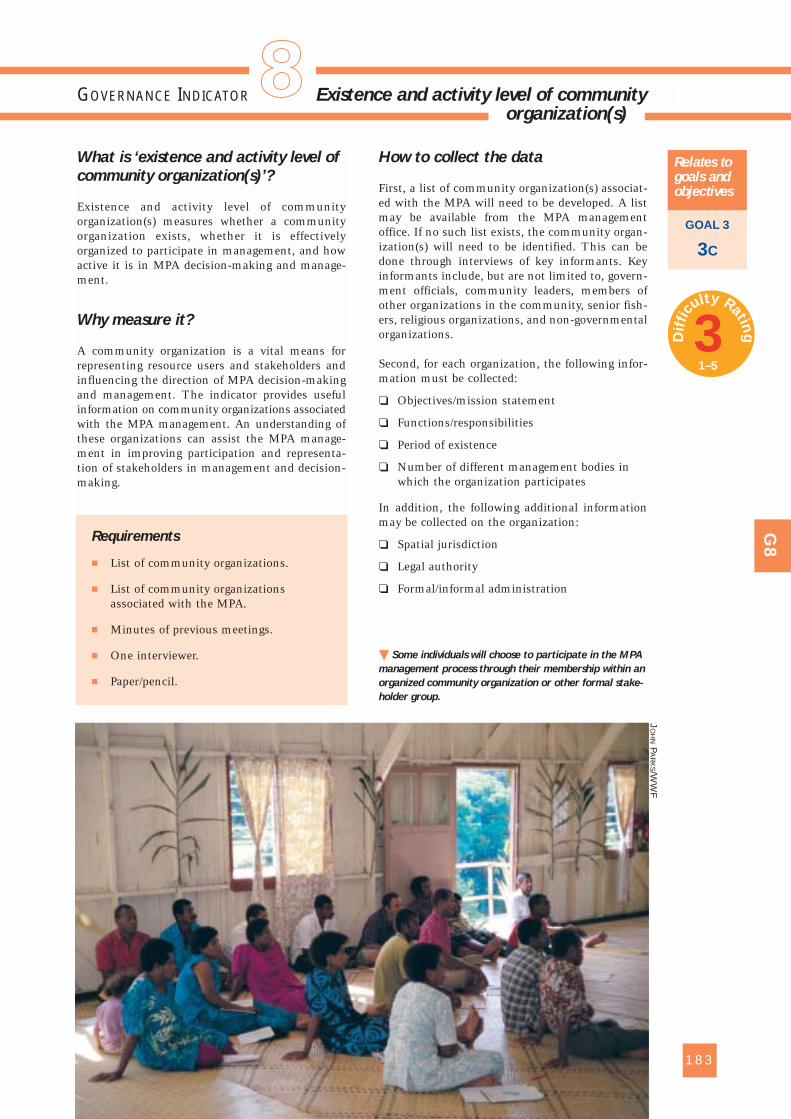
What is ‘existence and activity level of
community organization(s)’?
Existence and activity level of communityorganization(s) measures whether a communityorganization exists, whether it is effectivelyorganized to participate in management, and howactive it is in MPA decision-making and manage-ment.
Why measure it?
A community organization is a vital means forrepresenting resource users and stakeholders andinfluencing the direction of MPA decision-makingand management. The indicator provides usefulinformation on community organizations associatedwith the MPA management. An understanding ofthese organizations can assist the MPA manage-ment in improving participation and representa-tion of stakeholders in management and decision-making.
How to collect the data
First, a list of community organization(s) associat-ed with the MPA will need to be developed. A listmay be available from the MPA managementoffice. If no such list exists, the community organ-ization(s) will need to be identified. This can bedone through interviews of key informants. Keyinformants include, but are not limited to, govern-ment officials, community leaders, members ofother organizations in the community, senior fish-ers, religious organizations, and non-governmentalorganizations.
Second, for each organization, the following infor-mation must be collected:
❏ Objectives/mission statement
❏ Functions/responsibilities
❏ Period of existence
❏ Number of different management bodies inwhich the organization participates
In addition, the following additional informationmay be collected on the organization:
❏ Spatial jurisdiction
❏ Legal authority
❏ Formal/informal administration
183
GOVERNANCE INDICATOR Existence and activity level of community
GOAL 3
3C
Relates togoals andobjectives
G8
� Some individuals will choose to participate in the MPA
management process through their membership within an
organized community organization or other formal stake-
holder group.
organization(s)
1
Requirements
� List of community organizations.
� List of community organizationsassociated with the MPA.
� Minutes of previous meetings.
� One interviewer.
� Paper/pencil.
JO
HN
PA
RK
S/WW
F
3Dif
ficu
lty Rating
1–5
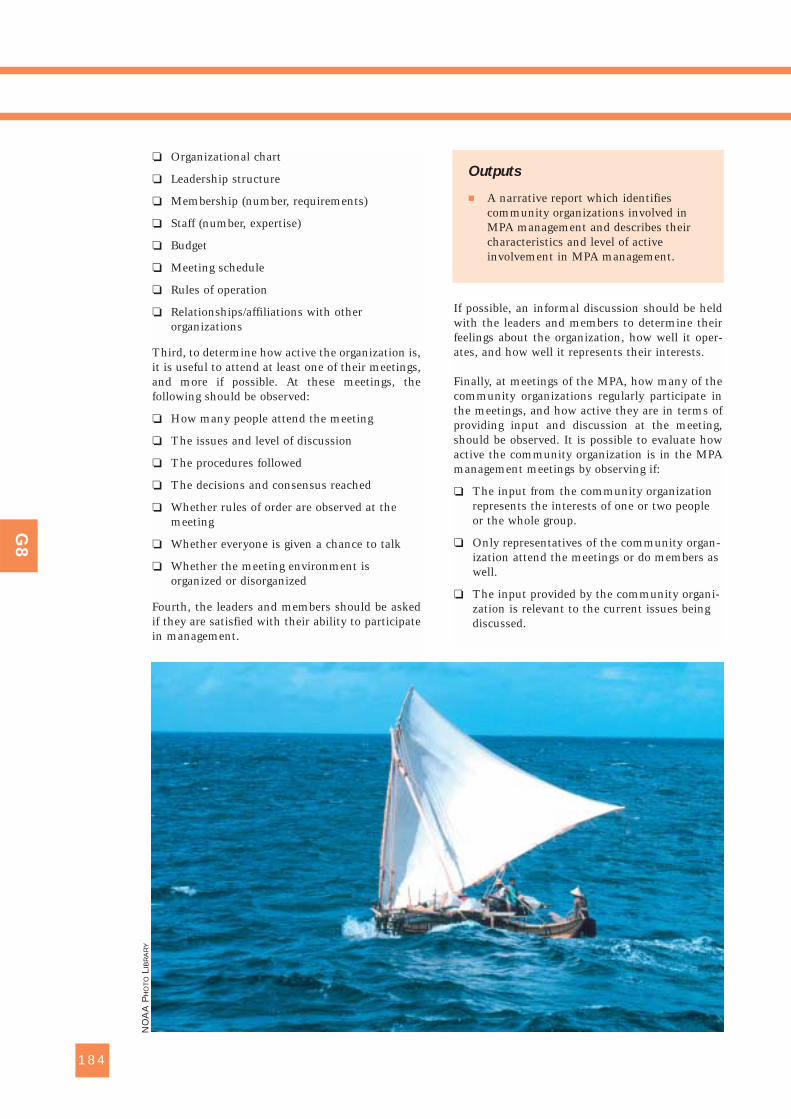
❏ Organizational chart
❏ Leadership structure
❏ Membership (number, requirements)
❏ Staff (number, expertise)
❏ Budget
❏ Meeting schedule
❏ Rules of operation
❏ Relationships/affiliations with otherorganizations
Third, to determine how active the organization is,it is useful to attend at least one of their meetings,and more if possible. At these meetings, thefollowing should be observed:
❏ How many people attend the meeting
❏ The issues and level of discussion
❏ The procedures followed
❏ The decisions and consensus reached
❏ Whether rules of order are observed at themeeting
❏ Whether everyone is given a chance to talk
❏ Whether the meeting environment isorganized or disorganized
Fourth, the leaders and members should be askedif they are satisfied with their ability to participatein management.
If possible, an informal discussion should be heldwith the leaders and members to determine theirfeelings about the organization, how well it oper-ates, and how well it represents their interests.
Finally, at meetings of the MPA, how many of thecommunity organizations regularly participate inthe meetings, and how active they are in terms ofproviding input and discussion at the meeting,should be observed. It is possible to evaluate howactive the community organization is in the MPAmanagement meetings by observing if:
❏ The input from the community organizationrepresents the interests of one or two peopleor the whole group.
❏ Only representatives of the community organ-ization attend the meetings or do members aswell.
❏ The input provided by the community organi-zation is relevant to the current issues beingdiscussed.
184
G8
Outputs
� A narrative report which identifiescommunity organizations involved inMPA management and describes theircharacteristics and level of activeinvolvement in MPA management.
NO
AA
PH
OT
OLI
BR
AR
Y
How to analyse and interpret results
Prepare a narrative report which lists the organiza-tion(s), mandate, organizational structure, periodof existence, membership, resources, and relation-ship/affiliation with other organizations. Thereport should identify, for example, those organiza-tions opposed and supportive of the MPA. Thereport should also include observations on thelevel of activity of each organization.
This indicator will provide information on thenumber of community organizations associatedwith the MPA, the objectives and structure of eachorganization, and how active the group is in termsof providing input to the MPA and in terms ofother activities of its members. The results need tobe interpreted against the background of the levelof community or collective action in the country orlocation, which may be low in some cases.
Strengths and limitations
It should be noted that not all MPAs havecommunity organizations, for example, a high seasMPA or an isolated coral atoll with no one livingon it or an MPA which is managed by a centralizedauthority. In these cases, this indicator is notrelevant.
Useful references and Internet links
Salm, R.V., Clark, J.R. and Siirila, E. (2000).Marine and Coastal Protected Areas: A Guidefor Planners and Managers (3rd Edition).IUCN, Washington, DC, USA.
185
At Tubbataha Reef National Marine Park in the Philippines,
four community organizations in Cagayancillo were assisted
through training and facilitation of organizational processes.
Of the four organizations involved in seaweed production,
law enforcement, communication and training and liveli-
hood fund management, only two remain active:
� Cagayancillo Core of Trainers (CATCO) – organized toprovide training and communication services to thevarious activities of the Coastal Resource ManagementTeam; and
� Cagayancillo Livelihood Committee – organized tomanage a livelihood fund for sustainable resourcemanagement.
The seaweeds group and the law enforcement group had
problems with leadership and are being assisted in possible
re-structuring.
At the Banco Chinchorro Biosphere Reserve in Mexico, the
MPA community is defined as a group of cooperatives and
free fishers who conduct fishing activities within the limits
of the reserve, living in palafitos, or huts (but with resi-
dences elsewhere). Other regular users who might increase
in number are those people providing recreational services.
Community organizations involved in MPA management are
the same as those on the Technical Advisory Committee
(TAC) for the Biosphere Reserve.
G8
GO
VERN
AN
CE
IND
ICATO
R8
Exis
ten
ce a
nd
activ
ity le
vel o
f co
mm
un
ity o
rgan
izatio
n(s
)
EXAMPLE FROM THE FIELDBox G6
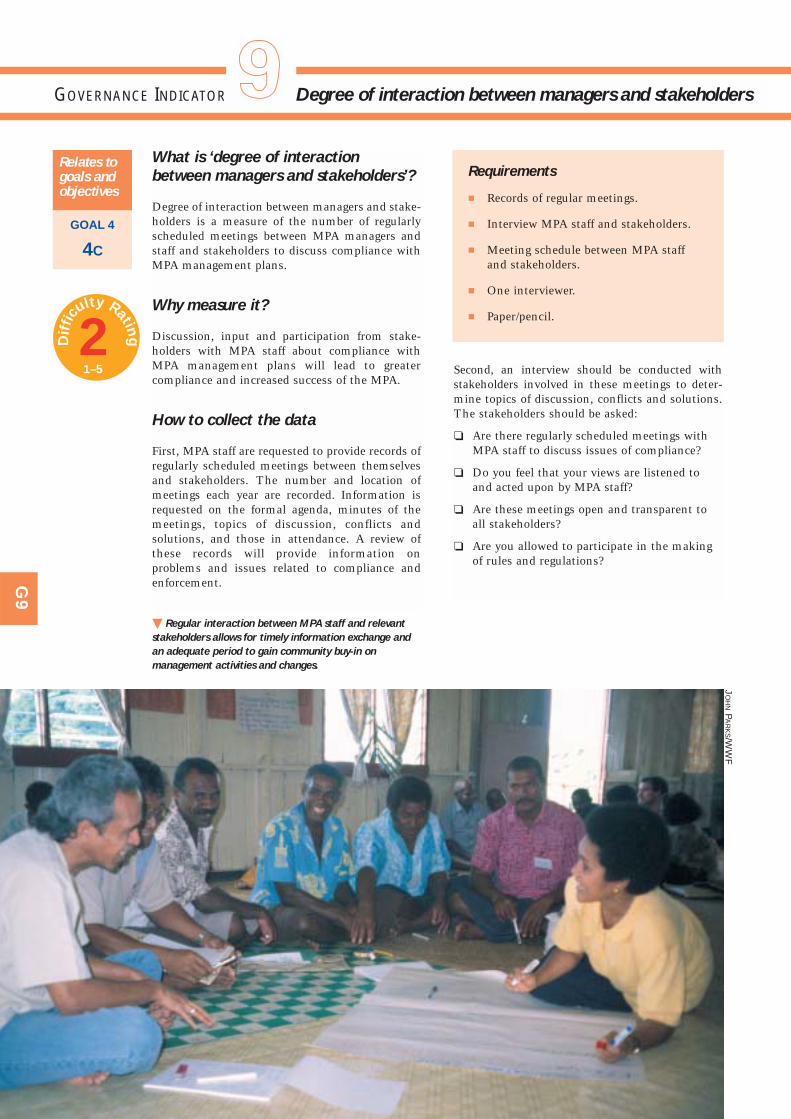
What is ‘degree of interaction
between managers and stakeholders’?
Degree of interaction between managers and stake-holders is a measure of the number of regularlyscheduled meetings between MPA managers andstaff and stakeholders to discuss compliance withMPA management plans.
Why measure it?
Discussion, input and participation from stake-holders with MPA staff about compliance withMPA management plans will lead to greatercompliance and increased success of the MPA.
How to collect the data
First, MPA staff are requested to provide records ofregularly scheduled meetings between themselvesand stakeholders. The number and location ofmeetings each year are recorded. Information isrequested on the formal agenda, minutes of themeetings, topics of discussion, conflicts andsolutions, and those in attendance. A review ofthese records will provide information onproblems and issues related to compliance andenforcement.
Second, an interview should be conducted withstakeholders involved in these meetings to deter-mine topics of discussion, conflicts and solutions.The stakeholders should be asked:
❏ Are there regularly scheduled meetings withMPA staff to discuss issues of compliance?
❏ Do you feel that your views are listened toand acted upon by MPA staff?
❏ Are these meetings open and transparent toall stakeholders?
❏ Are you allowed to participate in the makingof rules and regulations?
� Regular interaction between MPA staff and relevant
stakeholders allows for timely information exchange and
an adequate period to gain community buy-in on
management activities and changes.
GOAL 4
4C
Relates togoals andobjectives
G9
GOVERNANCE INDICATOR Degree of interaction between managers and stakeholders
Requirements
� Records of regular meetings.
� Interview MPA staff and stakeholders.
� Meeting schedule between MPA staffand stakeholders.
� One interviewer.
� Paper/pencil.
1J
OH
NP
AR
KS/W
WF
2Dif
ficu
lty Rating
1–5
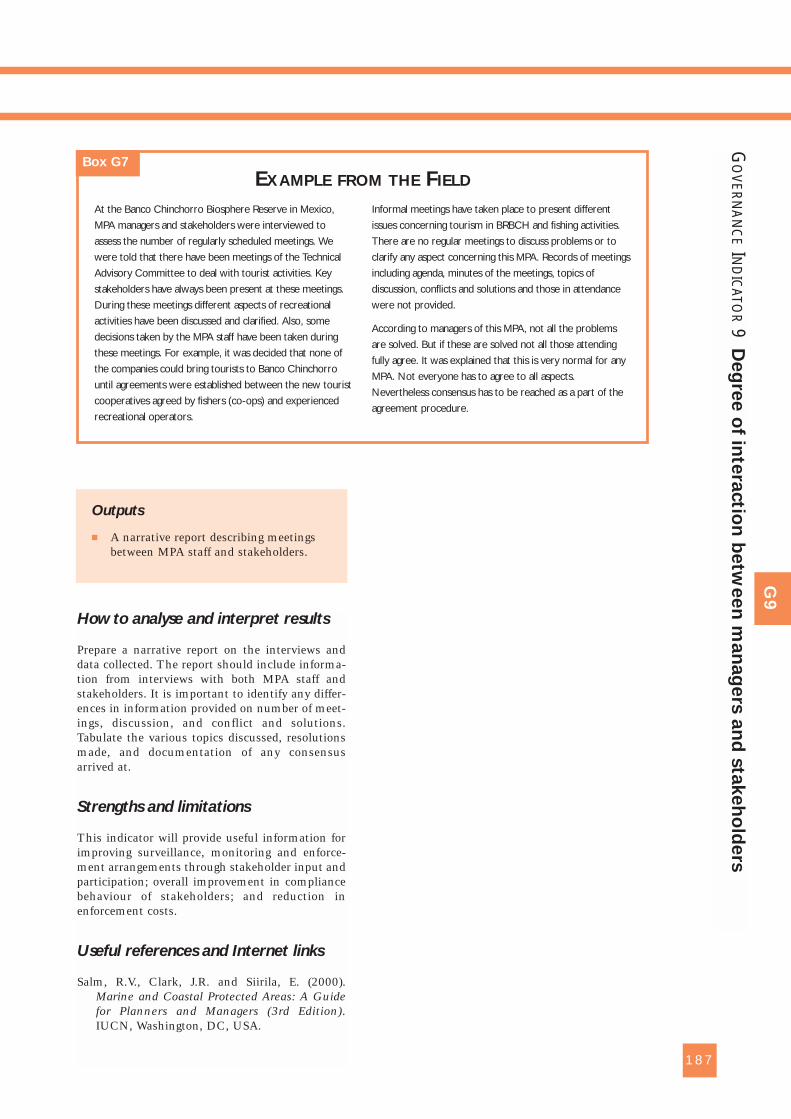
How to analyse and interpret results
Prepare a narrative report on the interviews anddata collected. The report should include informa-tion from interviews with both MPA staff andstakeholders. It is important to identify any differ-ences in information provided on number of meet-ings, discussion, and conflict and solutions.Tabulate the various topics discussed, resolutionsmade, and documentation of any consensusarrived at.
Strengths and limitations
This indicator will provide useful information forimproving surveillance, monitoring and enforce-ment arrangements through stakeholder input andparticipation; overall improvement in compliancebehaviour of stakeholders; and reduction inenforcement costs.
Useful references and Internet links
Salm, R.V., Clark, J.R. and Siirila, E. (2000).Marine and Coastal Protected Areas: A Guidefor Planners and Managers (3rd Edition).IUCN, Washington, DC, USA.
187
Outputs
� A narrative report describing meetingsbetween MPA staff and stakeholders.
G9
GO
VERN
AN
CE
IND
ICATO
R9
Deg
ree o
f inte
ractio
n b
etw
een
man
ag
ers
an
d s
takeh
old
ers
At the Banco Chinchorro Biosphere Reserve in Mexico,
MPA managers and stakeholders were interviewed to
assess the number of regularly scheduled meetings. We
were told that there have been meetings of the Technical
Advisory Committee to deal with tourist activities. Key
stakeholders have always been present at these meetings.
During these meetings different aspects of recreational
activities have been discussed and clarified. Also, some
decisions taken by the MPA staff have been taken during
these meetings. For example, it was decided that none of
the companies could bring tourists to Banco Chinchorro
until agreements were established between the new tourist
cooperatives agreed by fishers (co-ops) and experienced
recreational operators.
Informal meetings have taken place to present different
issues concerning tourism in BRBCH and fishing activities.
There are no regular meetings to discuss problems or to
clarify any aspect concerning this MPA. Records of meetings
including agenda, minutes of the meetings, topics of
discussion, conflicts and solutions and those in attendance
were not provided.
According to managers of this MPA, not all the problems
are solved. But if these are solved not all those attending
fully agree. It was explained that this is very normal for any
MPA. Not everyone has to agree to all aspects.
Nevertheless consensus has to be reached as a part of the
agreement procedure.
EXAMPLE FROM THE FIELDBox G7

What is ‘proportion of stakeholders
trained in sustainable use’?
Proportion of stakeholders trained in sustainableresource use is a measure of the number of stake-holders who participated in training and withknowledge about sustainable resource use.
Why measure it?
This indicator can be used to determine whethercapacity-building efforts are resulting in a shifttowards sustainable use of resources by stakeholdersinside and outside the MPA. The linkage betweentraining and education for stakeholders onsustainable resource use will be shown, as well asoverall improvements in resource managementand resource use. Information can be disaggregatedfor different types of training and broader aware-ness building. The results can be used to improvethe effectiveness of the programme.
How to collect the data
First, the total number of stakeholders and stake-holder organizations associated with the MPAmust be identified.
Second, records should be sought from MPA staffon the number of stakeholders trained and thenumber and types of workshops and training andinformation dissemination on sustainableresource use provided to the stakeholders duringplanning and implementation of the MPA.
Third, MPA management staff must be inter-viewed and asked questions about capacity-build-ing activities including:
❏ How large is the capacity-building budgetcompared to overall MPA budget?
❏ Were capacity-building activities providedduring planning for the MPA to train stake-holders to use resources sustainably?
❏ Were capacity-building activities undertakenduring implementation and are they stillprovided?
❏ Who makes decisions about the number andtypes of capacity-building activities – MPAmanagement, resource users, both?
Next, the stakeholders must be interviewed todetermine their level of knowledge and satisfactionwith capacity-building activities and the quality ofthe activities. A short questionnaire should beused which would include questions such as:
❏ Were workshops and training courses providedto you during the planning of the MPA?
❏ How many and what types were provided?
❏ Were workshops and training courses providedto you during implementation of the MPA?
❏ How many and what types were provided?
❏ Were you satisfied with the workshops andtraining courses? Yes/No
❏ Why?
❏ Were you involved in the selection of theworkshops and training courses?
❏ Have the workshops and training coursesaffected the way that you use resources?Yes/No
❏ Why?
188
GOAL 4
4C
Relates togoals andobjectives
G10
GOVERNANCE INDICATOR Proportion of stakeholders trained in sustainable use
� Training of interested public in the sustainable use of
their marine environment can not only change user
behaviour and increase stakeholder knowledge of their
natural surroundings, but can also help to secure
community support for MPA efforts.
Requirements
� Records of training and workshops.
� Interviews with participants of trainingand workshops.
� Interviews with volunteer groups andcommunity organizations.
� One interviewer.
� Paper/pencil.
11J
OH
NP
AR
KS
3Dif
ficu
lty Rating
1–5
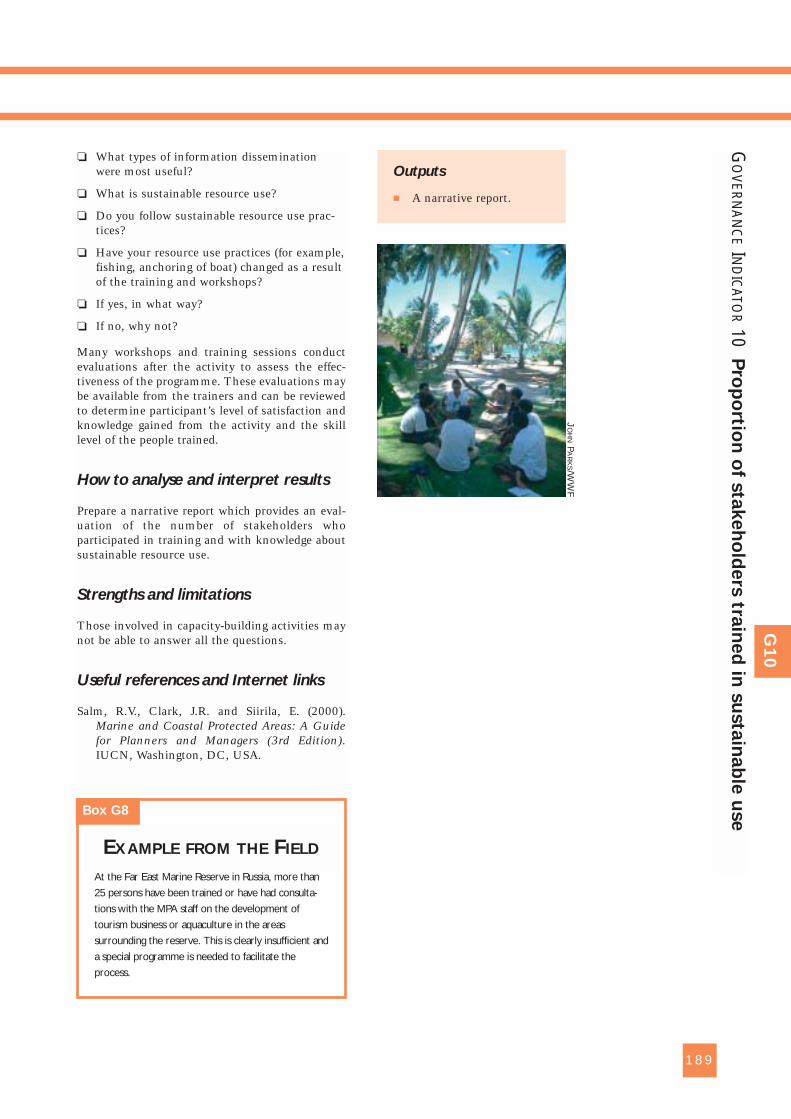
❏ What types of information disseminationwere most useful?
❏ What is sustainable resource use?
❏ Do you follow sustainable resource use prac-tices?
❏ Have your resource use practices (for example,fishing, anchoring of boat) changed as a resultof the training and workshops?
❏ If yes, in what way?
❏ If no, why not?
Many workshops and training sessions conductevaluations after the activity to assess the effec-tiveness of the programme. These evaluations maybe available from the trainers and can be reviewedto determine participant’s level of satisfaction andknowledge gained from the activity and the skilllevel of the people trained.
How to analyse and interpret results
Prepare a narrative report which provides an eval-uation of the number of stakeholders whoparticipated in training and with knowledge aboutsustainable resource use.
Strengths and limitations
Those involved in capacity-building activities maynot be able to answer all the questions.
Useful references and Internet links
Salm, R.V., Clark, J.R. and Siirila, E. (2000).Marine and Coastal Protected Areas: A Guidefor Planners and Managers (3rd Edition).IUCN, Washington, DC, USA.
189
G10
GO
VERN
AN
CE
IND
ICATO
R10
Pro
po
rtion
of s
takeh
old
ers
train
ed
in s
usta
inab
le u
se
Outputs
� A narrative report.
At the Far East Marine Reserve in Russia, more than
25 persons have been trained or have had consulta-
tions with the MPA staff on the development of
tourism business or aquaculture in the areas
surrounding the reserve. This is clearly insufficient and
a special programme is needed to facilitate the
process.
EXAMPLE FROM THE FIELD
Box G8
JO
HN
PA
RK
S/WW
F

What is ‘level of training provided to
stakeholders in participation’?
Level of training provided to stakeholders inparticipation in MPA management is a measure ofthe amount and effectiveness of capacity-buildingefforts to empower stakeholders with knowledge,skills and attitudes to participate in MPA manage-ment.
Why measure it?
To participate effectively in MPA management,stakeholders need to be empowered to have greaterawareness about the needs for and functions of theMPA. Stakeholders need to be equipped withknowledge, skills and attitudes to prepare them tocarry out new tasks and meet future challenges.Capacity-building must address not only technicaland managerial dimensions but also attitudes andbehavioural patterns. Capacity-building may becarried out by the MPA staff or by another organi-zation, such as a non-governmental organization(NGO).
How to collect the data
The first step is to identify if there is an opera-tional training programme in place for stakehold-ers. This information should be available fromMPA staff. Any documents describing the trainingprogramme should be obtained.
Second, the number and types of workshops andtraining courses provided to the stakeholdersduring planning and implementation of the MPAshould be recorded. This information should beavailable from the MPA management office orother organization providing capacity-building.
Third, MPA management staff or other organiza-tions providing training should be interviewed andasked questions about capacity-building activitiesincluding:
❏ How large is the capacity-building budgetcompared to overall MPA budget?
❏ Were capacity-building activities providedduring planning for the MPA to empowerstakeholders to actively participate in theplanning?
❏ Were capacity-building activities undertakenduring implementation and are they stillprovided?
❏ Who makes decisions about the number andtypes of capacity-building activities – MPAmanagement, stakeholders, both?
❏ What are the skills of the staff who providethe training and do they need more training?
❏ Is the capacity-building budget sufficient tocarry out the activities?
❏ Are there evaluation reports from the work-shops/training or follow-up reports?
Fourth, the stakeholders should be interviewed todetermine their satisfaction with capacity-buildingactivities and the quality of the activities. A shortquestionnaire can be prepared; it should includequestions such as:
190
GOAL 3
3B
Relates togoals andobjectives
G11
GOVERNANCE INDICATOR Level of training provided to stakeholders
Requirements
� Copy of MPA capacity-buildingprogramme.
� Access to workshop and training recordsprovided to stakeholders by the MPAmanagement or other organization.
� Interview of stakeholders to assess satis-faction with capacity-building activities.
� Interview of MPA management or otherorganization to assess level of attendanceof stakeholders at capacity-buildingactivities.
� One interviewer.
� Paper/pencil.
� Providing training opportunities for people to become
involved in the management process not only secures
public support for MPA efforts, but can also help to cut
operating costs through the use of volunteers, such as this
women’s group in Fiji.
in participation
11JO
HN
PAR
KS/W
WF
2Dif
ficu
lty Rating
1–5
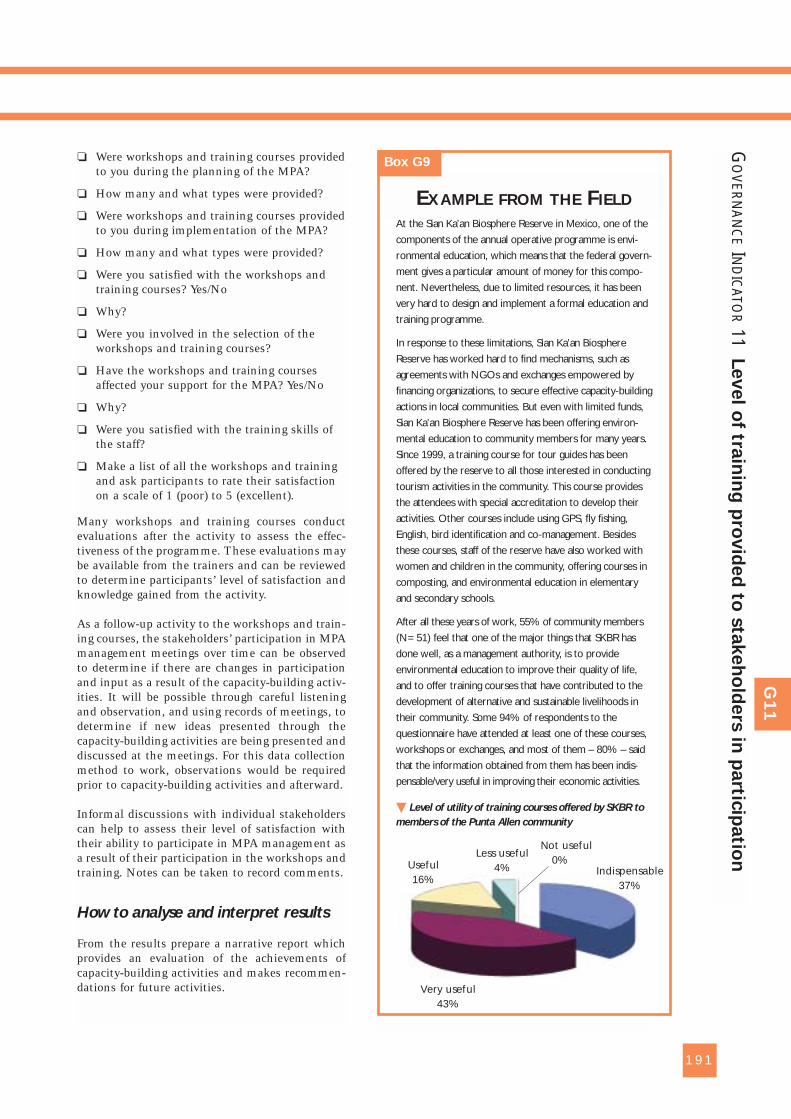
❏ Were workshops and training courses providedto you during the planning of the MPA?
❏ How many and what types were provided?
❏ Were workshops and training courses providedto you during implementation of the MPA?
❏ How many and what types were provided?
❏ Were you satisfied with the workshops andtraining courses? Yes/No
❏ Why?
❏ Were you involved in the selection of theworkshops and training courses?
❏ Have the workshops and training coursesaffected your support for the MPA? Yes/No
❏ Why?
❏ Were you satisfied with the training skills ofthe staff?
❏ Make a list of all the workshops and trainingand ask participants to rate their satisfactionon a scale of 1 (poor) to 5 (excellent).
Many workshops and training courses conductevaluations after the activity to assess the effec-tiveness of the programme. These evaluations maybe available from the trainers and can be reviewedto determine participants’ level of satisfaction andknowledge gained from the activity.
As a follow-up activity to the workshops and train-ing courses, the stakeholders’ participation in MPAmanagement meetings over time can be observedto determine if there are changes in participationand input as a result of the capacity-building activ-ities. It will be possible through careful listeningand observation, and using records of meetings, todetermine if new ideas presented through thecapacity-building activities are being presented anddiscussed at the meetings. For this data collectionmethod to work, observations would be requiredprior to capacity-building activities and afterward.
Informal discussions with individual stakeholderscan help to assess their level of satisfaction withtheir ability to participate in MPA management asa result of their participation in the workshops andtraining. Notes can be taken to record comments.
How to analyse and interpret results
From the results prepare a narrative report whichprovides an evaluation of the achievements ofcapacity-building activities and makes recommen-dations for future activities.
191
G11
GO
VERN
AN
CE
IND
ICATO
R11
Level o
f train
ing
pro
vid
ed
to s
takeh
old
ers
in p
artic
ipatio
n
At the Sian Ka’an Biosphere Reserve in Mexico, one of the
components of the annual operative programme is envi-
ronmental education, which means that the federal govern-
ment gives a particular amount of money for this compo-
nent. Nevertheless, due to limited resources, it has been
very hard to design and implement a formal education and
training programme.
In response to these limitations, Sian Ka’an Biosphere
Reserve has worked hard to find mechanisms, such as
agreements with NGOs and exchanges empowered by
financing organizations, to secure effective capacity-building
actions in local communities. But even with limited funds,
Sian Ka’an Biosphere Reserve has been offering environ-
mental education to community members for many years.
Since 1999, a training course for tour guides has been
offered by the reserve to all those interested in conducting
tourism activities in the community. This course provides
the attendees with special accreditation to develop their
activities. Other courses include using GPS, fly fishing,
English, bird identification and co-management. Besides
these courses, staff of the reserve have also worked with
women and children in the community, offering courses in
composting, and environmental education in elementary
and secondary schools.
After all these years of work, 55% of community members
(N=51) feel that one of the major things that SKBR has
done well, as a management authority, is to provide
environmental education to improve their quality of life,
and to offer training courses that have contributed to the
development of alternative and sustainable livelihoods in
their community. Some 94% of respondents to the
questionnaire have attended at least one of these courses,
workshops or exchanges, and most of them – 80% – said
that the information obtained from them has been indis-
pensable/very useful in improving their economic activities.
� Level of utility of training courses offered by SKBR to
members of the Punta Allen community
EXAMPLE FROM THE FIELD
Box G9
Useful16%
Not useful0%
Indispensable37%
Very useful43%
Less useful4%
Strengths and limitations
Empowerment of stakeholders to participate inMPA management is important for its success.Information is provided for further capacity-build-ing activities and evaluating how well past activi-ties have done in terms of knowledge, skills andattitude development.
Useful references and Internet links
Salm, R.V., Clark, J.R. and Siirila, E. (2000).Marine and Coastal Protected Areas: A Guidefor Planners and Managers (3rd Edition).IUCN, Washington, DC, USA.
192
Outputs
� Narrative report on the achievements ofcapacity-building activities.
G11
TONI PARRAS
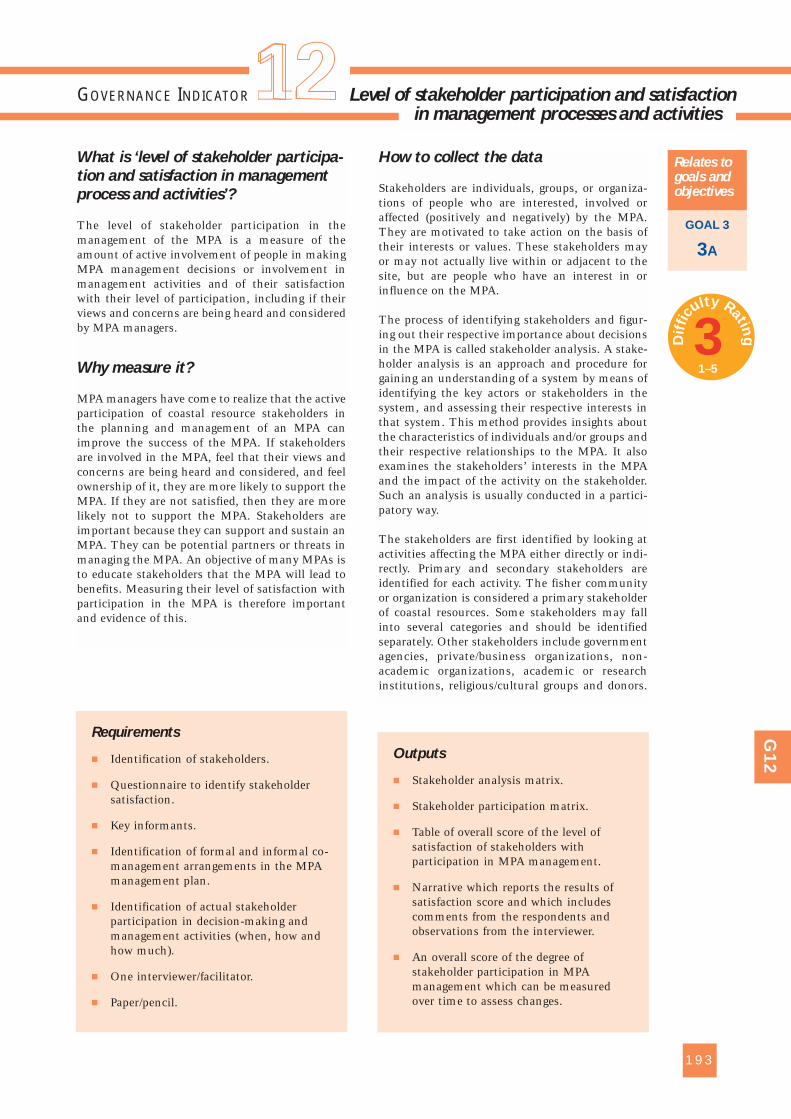
What is ‘level of stakeholder participa-
tion and satisfaction in management
process and activities’?
The level of stakeholder participation in themanagement of the MPA is a measure of theamount of active involvement of people in makingMPA management decisions or involvement inmanagement activities and of their satisfactionwith their level of participation, including if theirviews and concerns are being heard and consideredby MPA managers.
Why measure it?
MPA managers have come to realize that the activeparticipation of coastal resource stakeholders inthe planning and management of an MPA canimprove the success of the MPA. If stakeholdersare involved in the MPA, feel that their views andconcerns are being heard and considered, and feelownership of it, they are more likely to support theMPA. If they are not satisfied, then they are morelikely not to support the MPA. Stakeholders areimportant because they can support and sustain anMPA. They can be potential partners or threats inmanaging the MPA. An objective of many MPAs isto educate stakeholders that the MPA will lead tobenefits. Measuring their level of satisfaction withparticipation in the MPA is therefore importantand evidence of this.
How to collect the data
Stakeholders are individuals, groups, or organiza-tions of people who are interested, involved oraffected (positively and negatively) by the MPA.They are motivated to take action on the basis oftheir interests or values. These stakeholders mayor may not actually live within or adjacent to thesite, but are people who have an interest in orinfluence on the MPA.
The process of identifying stakeholders and figur-ing out their respective importance about decisionsin the MPA is called stakeholder analysis. A stake-holder analysis is an approach and procedure forgaining an understanding of a system by means ofidentifying the key actors or stakeholders in thesystem, and assessing their respective interests inthat system. This method provides insights aboutthe characteristics of individuals and/or groups andtheir respective relationships to the MPA. It alsoexamines the stakeholders’ interests in the MPAand the impact of the activity on the stakeholder.Such an analysis is usually conducted in a partici-patory way.
The stakeholders are first identified by looking atactivities affecting the MPA either directly or indi-rectly. Primary and secondary stakeholders areidentified for each activity. The fisher communityor organization is considered a primary stakeholderof coastal resources. Some stakeholders may fallinto several categories and should be identifiedseparately. Other stakeholders include governmentagencies, private/business organizations, non-academic organizations, academic or researchinstitutions, religious/cultural groups and donors.
193
GOAL 3
3A
Relates togoals andobjectives
G12
Requirements
� Identification of stakeholders.
� Questionnaire to identify stakeholdersatisfaction.
� Key informants.
� Identification of formal and informal co-management arrangements in the MPAmanagement plan.
� Identification of actual stakeholderparticipation in decision-making andmanagement activities (when, how andhow much).
� One interviewer/facilitator.
� Paper/pencil.
in management processes and activities
Outputs
� Stakeholder analysis matrix.
� Stakeholder participation matrix.
� Table of overall score of the level ofsatisfaction of stakeholders withparticipation in MPA management.
� Narrative which reports the results ofsatisfaction score and which includescomments from the respondents andobservations from the interviewer.
� An overall score of the degree ofstakeholder participation in MPAmanagement which can be measuredover time to assess changes.
3Dif
ficu
lty Rating
1–5
GOVERNANCE INDICATOR Level of stakeholder participation and satisfaction11
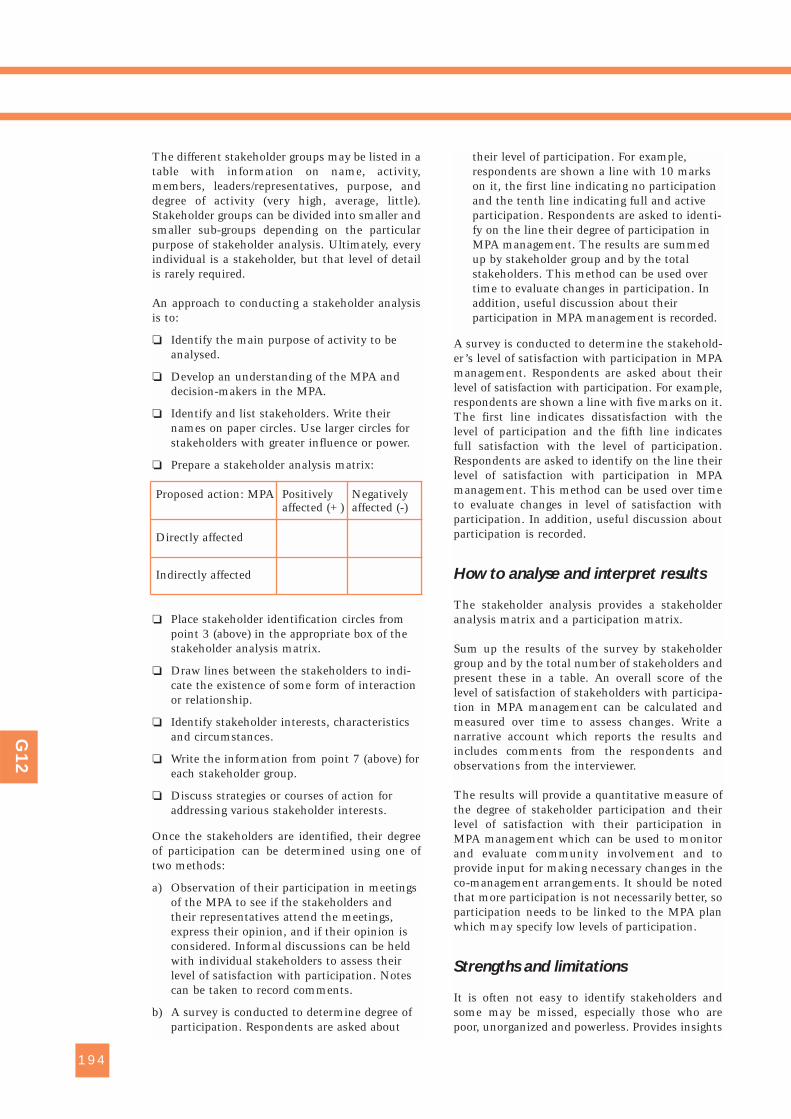
The different stakeholder groups may be listed in atable with information on name, activity,members, leaders/representatives, purpose, anddegree of activity (very high, average, little).Stakeholder groups can be divided into smaller andsmaller sub-groups depending on the particularpurpose of stakeholder analysis. Ultimately, everyindividual is a stakeholder, but that level of detailis rarely required.
An approach to conducting a stakeholder analysisis to:
❏ Identify the main purpose of activity to beanalysed.
❏ Develop an understanding of the MPA anddecision-makers in the MPA.
❏ Identify and list stakeholders. Write theirnames on paper circles. Use larger circles forstakeholders with greater influence or power.
❏ Prepare a stakeholder analysis matrix:
Proposed action: MPA Positively Negativelyaffected (+) affected (-)
Directly affected
Indirectly affected
❏ Place stakeholder identification circles frompoint 3 (above) in the appropriate box of thestakeholder analysis matrix.
❏ Draw lines between the stakeholders to indi-cate the existence of some form of interactionor relationship.
❏ Identify stakeholder interests, characteristicsand circumstances.
❏ Write the information from point 7 (above) foreach stakeholder group.
❏ Discuss strategies or courses of action foraddressing various stakeholder interests.
Once the stakeholders are identified, their degreeof participation can be determined using one oftwo methods:
a) Observation of their participation in meetingsof the MPA to see if the stakeholders andtheir representatives attend the meetings,express their opinion, and if their opinion isconsidered. Informal discussions can be heldwith individual stakeholders to assess theirlevel of satisfaction with participation. Notescan be taken to record comments.
b) A survey is conducted to determine degree ofparticipation. Respondents are asked about
their level of participation. For example,respondents are shown a line with 10 markson it, the first line indicating no participationand the tenth line indicating full and activeparticipation. Respondents are asked to identi-fy on the line their degree of participation inMPA management. The results are summedup by stakeholder group and by the totalstakeholders. This method can be used overtime to evaluate changes in participation. Inaddition, useful discussion about theirparticipation in MPA management is recorded.
A survey is conducted to determine the stakehold-er’s level of satisfaction with participation in MPAmanagement. Respondents are asked about theirlevel of satisfaction with participation. For example,respondents are shown a line with five marks on it.The first line indicates dissatisfaction with thelevel of participation and the fifth line indicatesfull satisfaction with the level of participation.Respondents are asked to identify on the line theirlevel of satisfaction with participation in MPAmanagement. This method can be used over timeto evaluate changes in level of satisfaction withparticipation. In addition, useful discussion aboutparticipation is recorded.
How to analyse and interpret results
The stakeholder analysis provides a stakeholderanalysis matrix and a participation matrix.
Sum up the results of the survey by stakeholdergroup and by the total number of stakeholders andpresent these in a table. An overall score of thelevel of satisfaction of stakeholders with participa-tion in MPA management can be calculated andmeasured over time to assess changes. Write anarrative account which reports the results andincludes comments from the respondents andobservations from the interviewer.
The results will provide a quantitative measure ofthe degree of stakeholder participation and theirlevel of satisfaction with their participation inMPA management which can be used to monitorand evaluate community involvement and toprovide input for making necessary changes in theco-management arrangements. It should be notedthat more participation is not necessarily better, soparticipation needs to be linked to the MPA planwhich may specify low levels of participation.
Strengths and limitations
It is often not easy to identify stakeholders andsome may be missed, especially those who arepoor, unorganized and powerless. Provides insights
194
G12
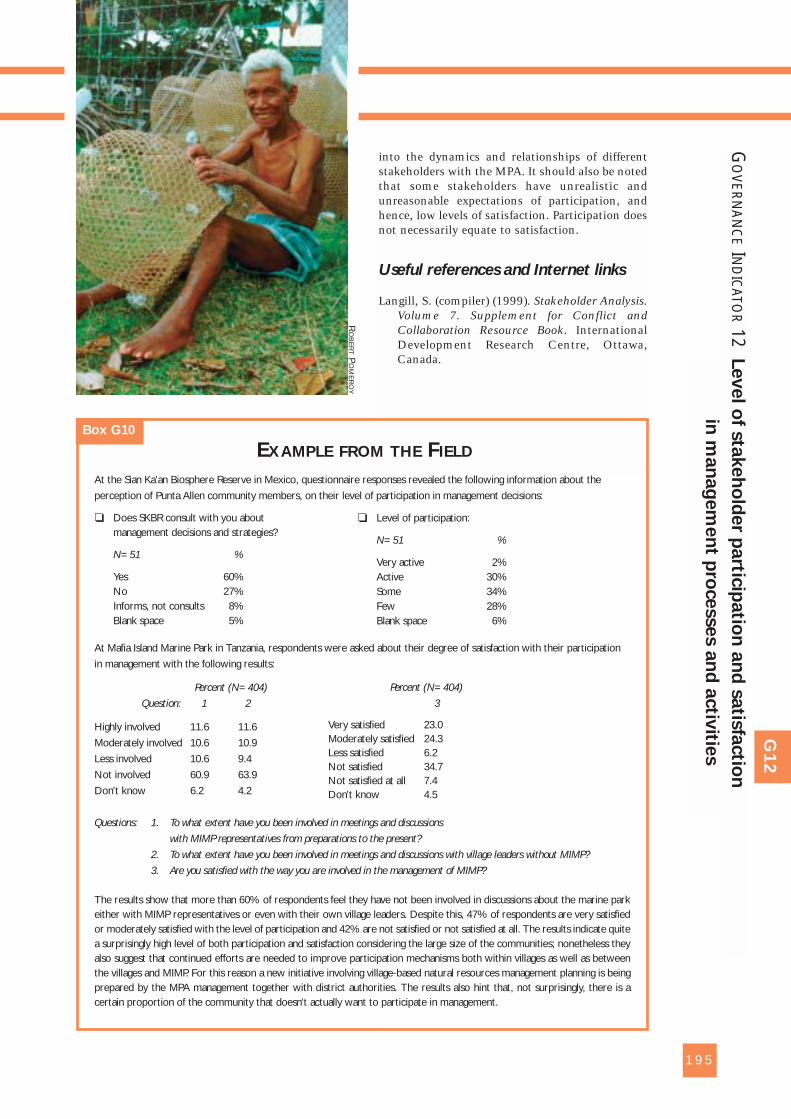
into the dynamics and relationships of differentstakeholders with the MPA. It should also be notedthat some stakeholders have unrealistic andunreasonable expectations of participation, andhence, low levels of satisfaction. Participation doesnot necessarily equate to satisfaction.
Useful references and Internet links
Langill, S. (compiler) (1999). Stakeholder Analysis.Volume 7. Supplement for Conflict andCollaboration Resource Book. InternationalDevelopment Research Centre, Ottawa,Canada.
195
G12
GO
VERN
AN
CE
IND
ICATO
R12
Level o
f sta
keh
old
er p
artic
ipatio
n a
nd
satis
factio
n
in m
an
ag
em
en
t pro
cesses a
nd
activ
ities
At the Sian Ka’an Biosphere Reserve in Mexico, questionnaire responses revealed the following information about the
perception of Punta Allen community members, on their level of participation in management decisions:
❏ Does SKBR consult with you aboutmanagement decisions and strategies?
N=51 %
Yes 60%No 27%Informs, not consults 8%Blank space 5%
At Mafia Island Marine Park in Tanzania, respondents were asked about their degree of satisfaction with their participation
in management with the following results:
Percent (N=404)
Question: 1 2
Highly involved 11.6 11.6
Moderately involved 10.6 10.9
Less involved 10.6 9.4
Not involved 60.9 63.9
Don’t know 6.2 4.2
Questions: 1. To what extent have you been involved in meetings and discussions
with MIMP representatives from preparations to the present?
2. To what extent have you been involved in meetings and discussions with village leaders without MIMP?
3. Are you satisfied with the way you are involved in the management of MIMP?
The results show that more than 60% of respondents feel they have not been involved in discussions about the marine parkeither with MIMP representatives or even with their own village leaders. Despite this, 47% of respondents are very satisfiedor moderately satisfied with the level of participation and 42% are not satisfied or not satisfied at all. The results indicate quitea surprisingly high level of both participation and satisfaction considering the large size of the communities; nonetheless theyalso suggest that continued efforts are needed to improve participation mechanisms both within villages as well as betweenthe villages and MIMP. For this reason a new initiative involving village-based natural resources management planning is beingprepared by the MPA management together with district authorities. The results also hint that, not surprisingly, there is acertain proportion of the community that doesn’t actually want to participate in management.
EXAMPLE FROM THE FIELDBox G10
RO
BE
RT
PO
ME
RO
Y
❏ Level of participation:
N=51 %
Very active 2%Active 30%Some 34%Few 28%Blank space 6%
Percent (N=404)
3
Very satisfied 23.0Moderately satisfied 24.3Less satisfied 6.2Not satisfied 34.7Not satisfied at all 7.4Don’t know 4.5
What is ‘level of stakeholder involve-
ment in surveillance, monitoring and
enforcement’?
Level of stakeholder involvement in surveillance,monitoring and enforcement is a measure of thenumber of stakeholders who have participated inpatrolling or other surveillance and monitoringactivities.
Why measure it?
Sharing surveillance, monitoring and enforcementactivities with local stakeholders can be effective incontrolling non-compliance behaviour throughsocial and peer pressure. Increased participation ofstakeholders provides them with more ownershipover the MPA which should result in an overallimprovement in enforcement and a decrease inviolations. The point of this indicator is to docu-ment those tasks related to active stakeholderinvolvement in enforcement activities. These mayrange from simply stuffing envelopes, to attendingenforcement hearings, to helping put up signposts.
How to collect the data
As mentioned above, the type and level of stake-holder involvement in enforcement activities mayrange from stuffing envelopes containingannouncements of new regulations, to attendingenforcement hearings, to helping MPA staff put upsignposts, to actively patrolling the MPA.
For the latter activity, ideally, all formal patrols arerecorded on an ongoing basis so that this indicatorshould only require a synthesis of the existingpatrol records. Patrol records are reviewed to deter-mine who was involved in the patrols including:
❏ Number of non-MPA staff.
❏ Amount of time of non-MPA staff involved inthe patrol.
❏ Stakeholder group affiliation of non-MPAstaff.
❏ Type and number of activities that non-MPAstaff were engaged in.
If patrols involving stakeholders are not recordedthen this may require interviewing key stakeholderswithin the community who are involved inpatrolling. The number of non-MPA staff involvedin patrols can be compared to some ideal numberof non-MPA staff established in the managementplan to determine management effectiveness.
Stakeholders are interviewed to determine if theyinformally conduct surveillance and monitoringactivities when they are in the area of the MPA.The stakeholders are asked:
❏ How they conduct the activity (e.g. causal orformal observation).
❏ How they report violations that they observe.
❏ Who they report violations to.
❏ What is done with reports of violations (isaction taken)?
❏ Do you feel that compliance by stakeholdershas improved as a result of your involvement?
For the other activities in which stakeholders maybe involved, the MPA manager and staff are inter-viewed to identify what other enforcement activi-ties stakeholders are involved in. As stated above,the number, amount of time and group affiliationof each stakeholder are identified. The names ofthe stakeholders are identified and they are inter-viewed to determine the reasons for their involve-ment, the amount of time involved and who theyreport to on the MPA staff. The stakeholdersshould be asked if they feel that their involvementhas brought any improvement in overall commu-nity compliance and enforcement.
How to analyse and interpret results
Prepare a narrative report which provides an eval-uation of the number of stakeholders involved insurveillance, monitoring and enforcement.
Strengths and limitations
This indicator reports on formal involvement insurveillance, monitoring and enforcement. It ismuch more difficult to obtain information on
196
GOAL 2
2E
GOAL 4
4A 4B
4D
Relates togoals andobjectives
G13
GOVERNANCE INDICATOR Level of stakeholder involvement in surveillance,monitoring and enforcement
Outputs
� Narrative report.
Requirements
� Patrol records.
� Interview stakeholders.
� One interviewer.
� Paper/pencil.
11
2Dif
ficu
lty Rating
1–5
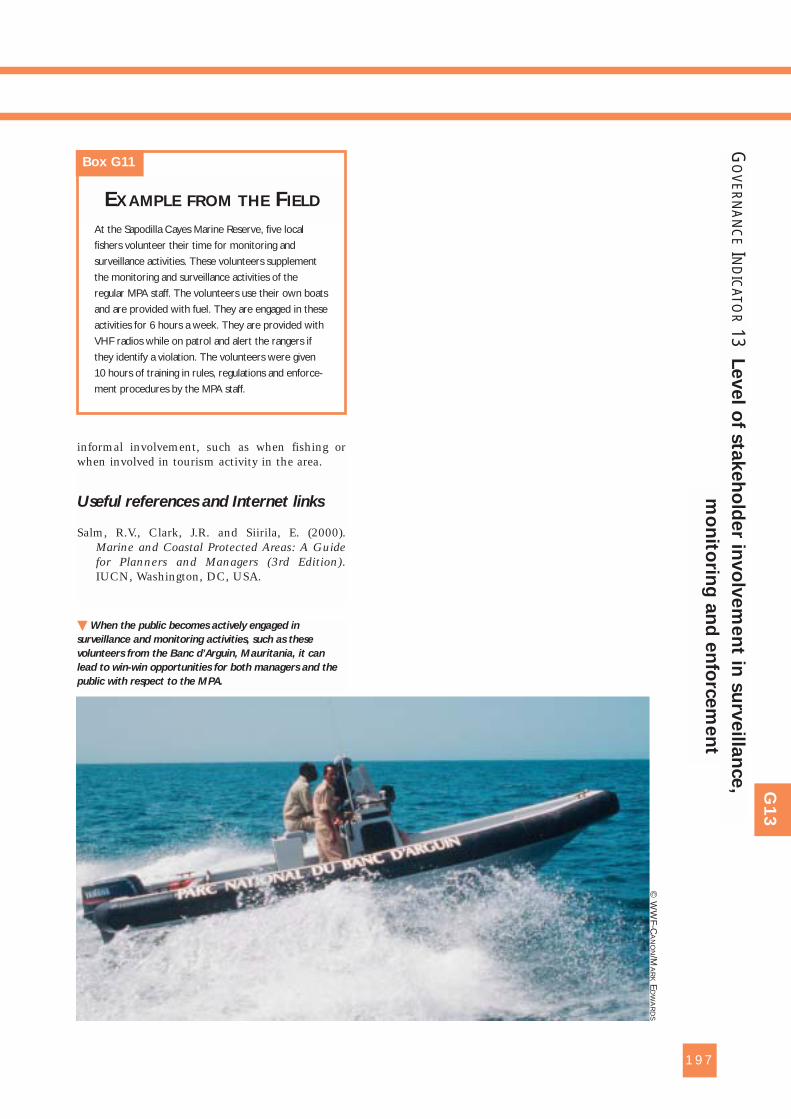
informal involvement, such as when fishing orwhen involved in tourism activity in the area.
Useful references and Internet links
Salm, R.V., Clark, J.R. and Siirila, E. (2000).Marine and Coastal Protected Areas: A Guidefor Planners and Managers (3rd Edition).IUCN, Washington, DC, USA.
197
G13
� When the public becomes actively engaged in
surveillance and monitoring activities, such as these
volunteers from the Banc d’Arguin, Mauritania, it can
lead to win-win opportunities for both managers and the
public with respect to the MPA.
At the Sapodilla Cayes Marine Reserve, five local
fishers volunteer their time for monitoring and
surveillance activities. These volunteers supplement
the monitoring and surveillance activities of the
regular MPA staff. The volunteers use their own boats
and are provided with fuel. They are engaged in these
activities for 6 hours a week. They are provided with
VHF radios while on patrol and alert the rangers if
they identify a violation. The volunteers were given
10 hours of training in rules, regulations and enforce-
ment procedures by the MPA staff.
EXAMPLE FROM THE FIELD
Box G11
GO
VERN
AN
CE
IND
ICATO
R13
Level o
f sta
keh
old
er in
vo
lvem
en
t in s
urv
eilla
nce,
mo
nito
ring
an
d e
nfo
rcem
en
t
© W
WF-C
AN
ON/M
AR
KE
DW
AR
DS
What are ‘clearly defined enforcement
procedures’?
Clearly defined enforcement procedures is a meas-ure of the existence and description of guidelinesand procedures developed for staff charged withenforcement responsibilities and how they are toact depending on the type of offence encountered.
Why measure it?
Enforcement is a crucial step in the MPA manage-ment system. Clearly defined enforcement proce-dures allow MPA enforcement staff to more effec-tively undertake their duties and resource users tobe aware of consequences of non-compliance.
How to collect the data
First, in the management plan, the section whichdescribes the monitoring, control, surveillance andenforcement programme for the MPA is identified.This will provide information on the enforcementprogramme and its structure. If no section onenforcement procedures exists, an interview isconducted with the MPA manager and the enforce-ment staff to identify the monitoring, control,surveillance and enforcement programme.
Second, an interview is conducted with the MPAmanager and the designated enforcement staffmember to obtain information about the enforce-ment guidelines. Questions to be asked include:
❏ Do formal enforcement guidelines andprocedures exist?
❏ Do informal enforcement guidelines andprocedures exist?
❏ Who prepared these guidelines andprocedures?
❏ Describe the guidelines and procedures.
❏ Are they periodically reviewed and updated?
❏ Are staff trained in the guidelines andprocedures?
❏ Is there coordination of the guidelines andprocedures with other enforcement agencies?
❏ Are the enforcement guidelines andprocedures appropriate to the task?
❏ Number of reported violations.
❏ Number of successful prosecutions due toclearly defined enforcement procedures.
❏ Number of attempted prosecutions that faileddue to technicalities due to failure inprocedure.
❏ Accessibility and availability of enforcementguidelines.
How to analyse and interpret results
Prepare a narrative report on the current enforce-ment guidelines and procedures, adequacy and avail-ability of the guidelines, procedures to undertakeenforcement actions, and recommendations forimprovements.
Strengths and limitations
Clearly defined enforcement guidelines and proce-dures will improve monitoring, surveillance andenforcement of the MPA thus benefiting the MPAmanagement; will allow enforcement staff to actprofessionally; and will reduce the possibility oflegal action against the MPA management by rulebreakers. This measure will allow for a review ofenforcement guidelines and procedures to ensurethat they are implemented in a fair and equitablemanner.
If no formal enforcement guidelines and proce-dures exist, information can still be obtained byinterviewing MPA managers and staff and havingthem describe any informal procedures that theyfollow.
198
GOAL 2
2E
GOAL 4
4A
Relates togoals andobjectives
G14
GOVERNANCE INDICATOR Clearly defined enforcement procedures
Requirements
� Copy of the MPA monitoring, control,surveillance and enforcement sectionfrom the management plan.
� Copy of the enforcement guidelines.
� One interviewer.
� Paper/pencil.
Outputs
� Narrative report on the current MPAenforcement guidelines and procedures.
11
2Dif
ficu
lty Rating
1–5
Useful references and Internet links
Salm, R.V., Clark, J.R. and Siirila, E. (2000).Marine and Coastal Protected Areas: A Guidefor Planners and Managers (3rd Edition).IUCN, Washington, DC, USA.
199
In the Bird Island Marine Sanctuary in the
Commonwealth of the Northern Mariana Islands
there is confusion regarding which laws and regula-
tions are to be enforced, and what penalties and/or
prohibitions are applicable to the MPA in both the
public’s mind and the Division of Fish and Wildlife
Enforcement Section. Recently, a number of violations
have been overturned or had penalties substantially
reduced because regulations conflicted with one
another or were not suitably empowered by statute.
In another incident, two non-English speaking non-
resident workers were arrested for fishing in a marine
sanctuary. The two were detained in jail for the
majority of a day but the Department of Public Safety
officers could not determine the appropriate bail to
be set for the release of the alleged perpetrators.
Eventually, the two individuals were released without
any bail requirement.
This lack of clarity results from a historical lack of
adequate focus on policy needs within the Division of
Fish and Wildlife and because the agency’s comments
are frequently not incorporated into newly intro-
duced legislation, amendments, and regulations.
Furthermore, dedicated legal council for the agency
has been lacking and legal council from the Attorney
General’s Office (AGO) is provided inconsistently.
The limited enforcement activity that does occur
tends to impact non-English speaking individuals
disproportionately. This could be because they are
least likely to be informed about Division of Fish and
Wildlife rules and regulations, or because of
perceptions relative to their resource use ethic.
Overall, the lack of clearly defined procedures and
the existence of conflicting laws and regulations
reduce the effectiveness of the Division of Fish and
Wildlife and create a poor public image.
EXAMPLE FROM THE FIELD
Box G12
G14
GO
VERN
AN
CE
IND
ICATO
R14
Cle
arly
defin
ed
en
forc
em
en
t pro
ced
ure
s
What is ‘enforcement coverage?
Enforcement coverage is a measure of the numberof surveillance and monitoring patrols undertakenby MPA staff during a given time period and in aspecified area.
Why measure it?
This information is used to review the consistencyof patrol activities. This information is a necessaryprerequisite for assessing trends in violations ornon-compliance since the latter is generally meas-ured as the number of violations per patrol effort.It is also useful in determining how well the MPAmanagement is meeting the goal of surveillance,monitoring and enforcement.
How to collect the data
First, the management plan and the enforcementprogramme should have a section which describesthe planned patrol schedule and procedures. Thisprovides a base of information for comparison ofactual patrols. If no such information exists, aninterview is conducted with the MPA manager andstaff involved in enforcement to describe the patrolschedule and procedures.
Second, patrol records are reviewed to calculate thepatrol effort in terms of:
❏ Man-hours
❏ Total hours
❏ Number of patrols
❏ Variation in temporal and spatial patterns ofpatrols
❏ Patrol area (km2)
❏ Number and type of infractions per patrol
❏ Number of unauthorized visitors caughtand/or noticed
The above data can be disaggregated for differentparts of the MPA and also different types of patrols(land, sea, MPA staff, community members). Theactions undertaken during each patrol are reviewedto identify problems and needs to improve patrolactivity. A map is prepared which shows patrolareas, number of patrols, and variation in temporaland spatial patterns of patrols.
Third, interviews are held with MPA staff todiscuss patrol records and to learn about howpatrols are undertaken and to identify problemsand needs.
Fourth, interviews are conducted with resourceusers and stakeholders to learn about how patrolsare undertaken, how the patrol officers act duringa patrol, and problems and needs.
How to analyse and interpret results
Prepare a narrative report which includes adiscussion of the man-hours patrolling permonth/year; hours patrolling per month/year;number of patrols/patrol days per month/year;number of patrols per area and type; and numberand type of infractions. Map this information toshow coverage of the MPA. Present in a table thetypes of action taken during each patrol, rankthem and map them to identify trends, patternsand needs.
Strengths and limitations
This indicator can lead to improvements in patroland patrol coverage, in addition to improvementsin overall enforcement of the MPA. Note that anincrease in the number of illegal activities can notonly result from increased patrols (positive trend)but also from increased poaching/violations (nega-tive trend).
The usefulness of the indicator will depend on theaccuracy of the patrol records.
200
GOAL 4
4A
Relates togoals andobjectives
G15
GOVERNANCE INDICATOR Enforcement coverage11Requirements
� Copy of patrol schedule and procedures.
� Patrol records.
� MPA quarterly/annual reports.
� Map of area.
� One interviewer.
� Paper/pencil.
Outputs
� A narrative report
� A map showing distribution of patrolsand types of activities occurring in andaround the MPA
2Dif
ficu
lty Rating
1–5
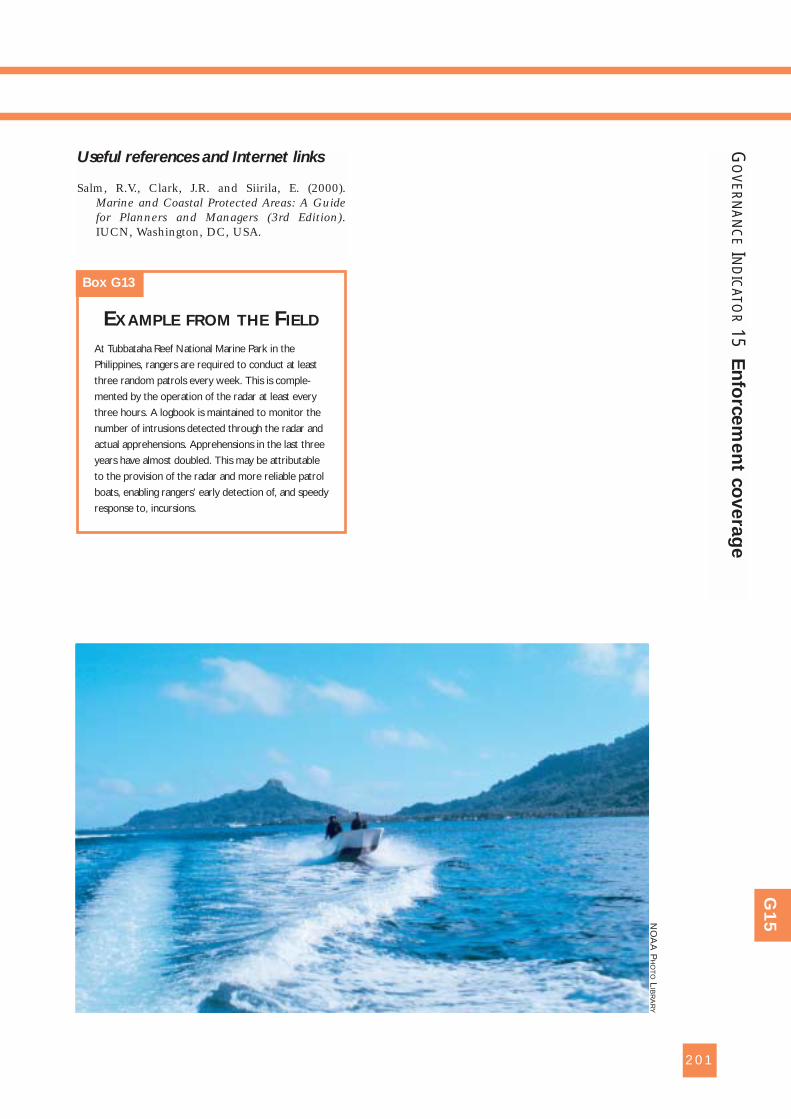
201
G15
GO
VERN
AN
CE
IND
ICATO
R15
En
forc
em
en
t co
vera
ge
At Tubbataha Reef National Marine Park in the
Philippines, rangers are required to conduct at least
three random patrols every week. This is comple-
mented by the operation of the radar at least every
three hours. A logbook is maintained to monitor the
number of intrusions detected through the radar and
actual apprehensions. Apprehensions in the last three
years have almost doubled. This may be attributable
to the provision of the radar and more reliable patrol
boats, enabling rangers’ early detection of, and speedy
response to, incursions.
EXAMPLE FROM THE FIELD
Box G13
NO
AA
PH
OT
OL
IBR
AR
Y
Useful references and Internet links
Salm, R.V., Clark, J.R. and Siirila, E. (2000).Marine and Coastal Protected Areas: A Guidefor Planners and Managers (3rd Edition).IUCN, Washington, DC, USA.
What is ‘degree of information dissem-
ination to encourage stakeholder
compliance’?
Degree of information dissemination to encouragestakeholder compliance is a measure of the numberand effectiveness of capacity-building efforts forstakeholders on the objectives and benefits, rules,regulations and enforcement arrangements of theMPA.
Why measure it?
Training and education will increase stakeholderknowledge about rules, regulations and enforce-ment arrangements for the MPA in order to changebehaviour and attitudes and increase compliance.Improvements in compliance with MPA rules andregulations by stakeholders should result from thetraining and education programme.
How to collect the data
First, the number and types of workshops andtraining courses and information disseminationprovided to the stakeholders during planning andimplementation of the MPA are recorded. Thisinformation should be available from the MPAmanagement office.
Second, MPA management staff are interviewedand asked questions about capacity-building andinformation dissemination activities including:
❏ How large is the capacity-building andinformation dissemination budget comparedto the overall MPA budget?
❏ Were capacity-building activities providedduring planning for the MPA on rules,regulations and enforcement arrangements?
❏ Were capacity-building activities undertakenduring implementation and are they stillprovided?
❏ Who makes decisions about the number andtypes of capacity-building activities – MPAmanagement, stakeholders, both?
❏ What types of information disseminationefforts were undertaken?
Third, the stakeholders are interviewed to deter-mine their satisfaction with capacity-building andinformation dissemination activities and thequality of the activities. Stakeholders differ, theyrange from local fishers to foreign tourists. Severalquestionnaires may need to be developed fordifferent stakeholder groups. A short questionnaireis prepared, including questions such as:
❏ Were workshops and training courses providedto you during the planning of the MPA?
❏ How many and what types were provided?
❏ Were workshops and training courses providedto you during implementation of the MPA?
❏ How many and what types were provided?
❏ Were you satisfied with the workshops andtraining courses? Yes/No
❏ Why?
❏ Were you involved in the selection of theworkshops and training courses?
❏ What types of information disseminationwere provided?
❏ Which were most effective for you?
❏ Why?
❏ Have the workshops and training coursesaffected your compliance behaviour? Yes/No
❏ Why?
❏ Do you have a better understanding of therules, regulations and enforcementarrangements as a result of the workshops?Yes/No
❏ Do you have a better understanding of thepurpose of the MPA as a result of theworkshops? Yes/No
❏ Do you have a better understanding of coastaland marine ecosystems as a result of theinformation provided to you? Yes/No
202
GOAL 4
4B
Relates togoals andobjectives
G16
11encourage stakeholder compliance
GOVERNANCE INDICATOR Degree of information dissemination to
Requirements
� Copy of MPA capacity-buildingprogramme.
� Access to workshop and training recordsprovided to stakeholders by the MPAmanagement.
� Interview of stakeholders to assess satis-faction with capacity-building activities(education, training).
� Enforcement records.
� Records and output of informationdissemination (mailings, media,publications, web, signs, etc.).
� One interviewer.
� Paper/pencil.
3Dif
ficu
lty Rating
1–5
Many workshops and training courses conductevaluations after the activity to assess theeffectiveness of the programme. These evaluationsmay be available from the trainers and can bereviewed to determine participants’ levels ofsatisfaction and knowledge gained from the training.
Enforcement records kept by the MPA are reviewedto assess changes in the number of violations bystakeholders who have attended the training.Names of stakeholders who have attended thetraining should be available from the participantslist.
How to analyse and interpret results
Prepare a narrative report describing the capacity-building efforts for stakeholders to enhance andsupport compliance with MPA rules and regula-tions. Develop a table showing correlation betweencapacity-building and information disseminationprogrammes and enforcement compliance records.
Measure effectiveness by comparing what activi-ties have been undertaken with the different
approaches to capacity-building and informationdissemination presented in the management plan.The indicator will measure linkages between train-ing and education and information disseminationfor stakeholders on objectives and benefits, rules,regulations and enforcement arrangements andoverall improvements in compliance. If the stake-holders were not involved in the development ofthe rules and regulations, compliance has beenshown to be lower than if they did participate.
Strengths and limitations
Interviewers need to be aware that stakeholderresponses may be biased depending upon theirindividual or group agenda.
Useful references and Internet links
Salm, R.V., Clark, J.R. and Siirila, E. (2000).Marine and Coastal Protected Areas: A Guidefor Planners and Managers (3rd Edition).IUCN, Washington, DC, USA.
203
G16
GO
VERN
AN
CE
IND
ICATO
R16
Deg
ree o
f info
rmatio
n d
issem
inatio
n to
en
co
ura
ge s
takeh
old
er c
om
plia
nce
Outputs
� A narrative report describing the capacity-building efforts for stakeholders toenhance and support compliance withMPA rules and regulations.
� A table showing correlation betweencapacity-building and information dis-semination programmes and enforce-ment compliance records is developed.
The Hung Thac Marine Protected Area has provided
fishers with four training courses on rules, regulations
and enforcement arrangements for the MPA since it
was established two years ago. In addition, comic
books have been prepared and handed out to fishers
to explain the rules, regulations and enforcement
arrangements. Rangers meet informally with fishers
on a regular basis and they have given a number of
presentations at the local fisher organization meet-
ings. Evaluations done at the four training sessions
found that participants were well informed about the
rules, regulations and enforcement arrangements for
the MPA. In the second year of the MPA operation,
violations were reduced by 80% from the first year.
This is attributed to the training and education pro-
gramme and to greater knowledge among the fishers.
EXAMPLE FROM THE FIELD
Box G14
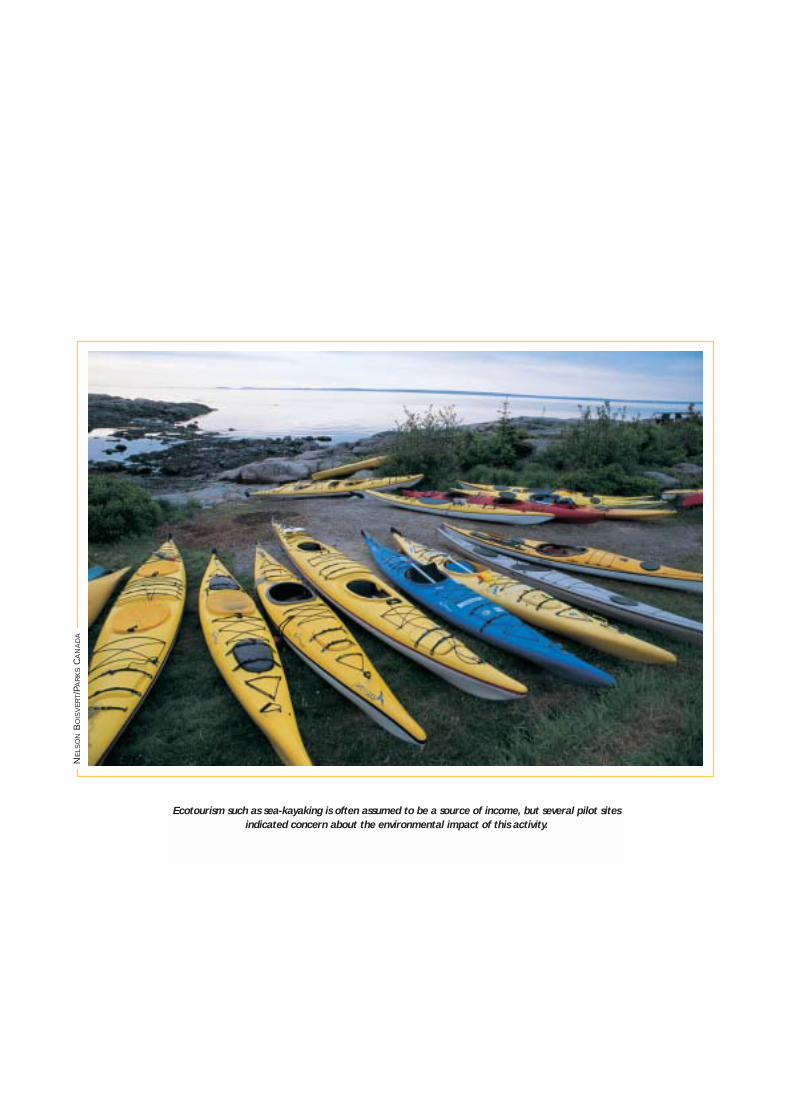
Ecotourism such as sea-kayaking is often assumed to be a source of income, but several pilot sites
indicated concern about the environmental impact of this activity.
NE
LSO
NB
OIS
VE
RT/P
AR
KS
CA
NA
DA
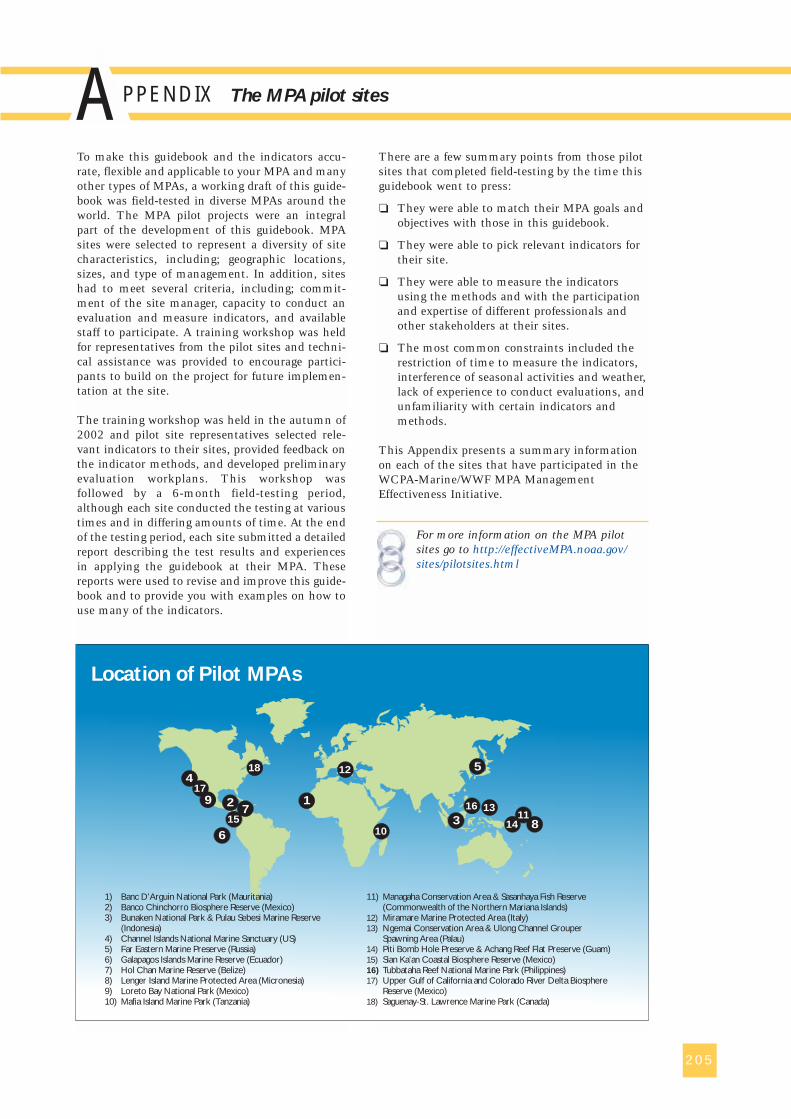
205
PPENDIX The MPA pilot sites
To make this guidebook and the indicators accu-rate, flexible and applicable to your MPA and manyother types of MPAs, a working draft of this guide-book was field-tested in diverse MPAs around theworld. The MPA pilot projects were an integralpart of the development of this guidebook. MPAsites were selected to represent a diversity of sitecharacteristics, including; geographic locations,sizes, and type of management. In addition, siteshad to meet several criteria, including; commit-ment of the site manager, capacity to conduct anevaluation and measure indicators, and availablestaff to participate. A training workshop was heldfor representatives from the pilot sites and techni-cal assistance was provided to encourage partici-pants to build on the project for future implemen-tation at the site.
The training workshop was held in the autumn of2002 and pilot site representatives selected rele-vant indicators to their sites, provided feedback onthe indicator methods, and developed preliminaryevaluation workplans. This workshop wasfollowed by a 6-month field-testing period,although each site conducted the testing at varioustimes and in differing amounts of time. At the endof the testing period, each site submitted a detailedreport describing the test results and experiencesin applying the guidebook at their MPA. Thesereports were used to revise and improve this guide-book and to provide you with examples on how touse many of the indicators.
There are a few summary points from those pilotsites that completed field-testing by the time thisguidebook went to press:
❏ They were able to match their MPA goals andobjectives with those in this guidebook.
❏ They were able to pick relevant indicators fortheir site.
❏ They were able to measure the indicatorsusing the methods and with the participationand expertise of different professionals andother stakeholders at their sites.
❏ The most common constraints included therestriction of time to measure the indicators,interference of seasonal activities and weather,lack of experience to conduct evaluations, andunfamiliarity with certain indicators andmethods.
This Appendix presents a summary informationon each of the sites that have participated in theWCPA-Marine/WWF MPA ManagementEffectiveness Initiative.
For more information on the MPA pilotsites go to http://effectiveMPA.noaa.gov/sites/pilotsites.html
1112
3
45
6
78
9
12
16
17
13
18
1015 14
Location of Pilot MPAs
1) Banc D’Arguin National Park (Mauritania)2) Banco Chinchorro Biosphere Reserve (Mexico)3) Bunaken National Park & Pulau Sebesi Marine Reserve
(Indonesia)4) Channel Islands National Marine Sanctuary (US)5) Far Eastern Marine Preserve (Russia)6) Galapagos Islands Marine Reserve (Ecuador)7) Hol Chan Marine Reserve (Belize)8) Lenger Island Marine Protected Area (Micronesia)9) Loreto Bay National Park (Mexico)10) Mafia Island Marine Park (Tanzania)
11) Managaha Conservation Area & Sasanhaya Fish Reserve (Commonwealth of the Northern Mariana Islands)
12) Miramare Marine Protected Area (Italy)13) Ngemai Conservation Area & Ulong Channel Grouper
Spawning Area (Palau)14) Piti Bomb Hole Preserve & Achang Reef Flat Preserve (Guam)15) Sian Ka’an Coastal Biosphere Reserve (Mexico)16) Tubbataha Reef National Marine Park (Philippines)17) Upper Gulf of California and Colorado River Delta Biosphere
Reserve (Mexico)18) Saguenay-St. Lawrence Marine Park (Canada)
A
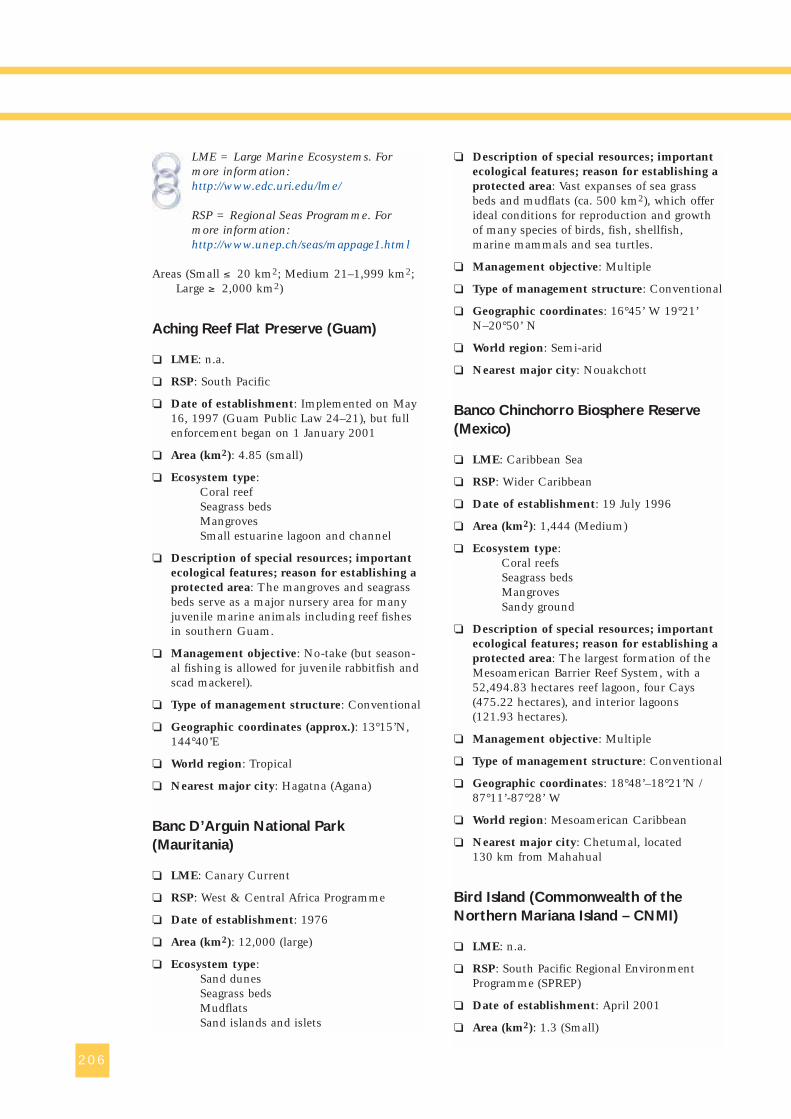
LME = Large Marine Ecosystems. Formore information:http://www.edc.uri.edu/lme/
RSP = Regional Seas Programme. Formore information:http://www.unep.ch/seas/mappage1.html
Areas (Small ≤ 20 km2; Medium 21–1,999 km2;Large ≥ 2,000 km2)
Aching Reef Flat Preserve (Guam)
❏ LME: n.a.
❏ RSP: South Pacific
❏ Date of establishment: Implemented on May16, 1997 (Guam Public Law 24–21), but fullenforcement began on 1 January 2001
❏ Area (km2): 4.85 (small)
❏ Ecosystem type: Coral reef Seagrass beds Mangroves Small estuarine lagoon and channel
❏ Description of special resources; importantecological features; reason for establishing aprotected area: The mangroves and seagrassbeds serve as a major nursery area for manyjuvenile marine animals including reef fishesin southern Guam.
❏ Management objective: No-take (but season-al fishing is allowed for juvenile rabbitfish andscad mackerel).
❏ Type of management structure: Conventional
❏ Geographic coordinates (approx.): 13°15’N,144°40’E
❏ World region: Tropical
❏ Nearest major city: Hagatna (Agana)
Banc D’Arguin National Park(Mauritania)
❏ LME: Canary Current
❏ RSP: West & Central Africa Programme
❏ Date of establishment: 1976
❏ Area (km2): 12,000 (large)
❏ Ecosystem type: Sand dunes Seagrass beds Mudflats Sand islands and islets
❏ Description of special resources; importantecological features; reason for establishing aprotected area: Vast expanses of sea grassbeds and mudflats (ca. 500 km2), which offerideal conditions for reproduction and growthof many species of birds, fish, shellfish,marine mammals and sea turtles.
❏ Management objective: Multiple
❏ Type of management structure: Conventional
❏ Geographic coordinates: 16°45’ W 19°21’N–20°50’ N
❏ World region: Semi-arid
❏ Nearest major city: Nouakchott
Banco Chinchorro Biosphere Reserve(Mexico)
❏ LME: Caribbean Sea
❏ RSP: Wider Caribbean
❏ Date of establishment: 19 July 1996
❏ Area (km2): 1,444 (Medium)
❏ Ecosystem type: Coral reefs Seagrass beds Mangroves Sandy ground
❏ Description of special resources; importantecological features; reason for establishing aprotected area: The largest formation of theMesoamerican Barrier Reef System, with a52,494.83 hectares reef lagoon, four Cays(475.22 hectares), and interior lagoons(121.93 hectares).
❏ Management objective: Multiple
❏ Type of management structure: Conventional
❏ Geographic coordinates: 18°48’–18°21’N /87°11’-87°28’ W
❏ World region: Mesoamerican Caribbean
❏ Nearest major city: Chetumal, located130 km from Mahahual
Bird Island (Commonwealth of theNorthern Mariana Island – CNMI)
❏ LME: n.a.
❏ RSP: South Pacific Regional EnvironmentProgramme (SPREP)
❏ Date of establishment: April 2001
❏ Area (km2): 1.3 (Small)
206
❏ Ecosystem type: Native limestone Fringing coral reef Forest
❏ Description of special resources; importantecological features; reason for establishing aprotected area: Fringing coral reef, blowholeused as popular swim hole and dive entranceto underwater tunnels, caves and fringingreefs, and rock island just off shore containinga seabird nesting colony.
❏ Management objective: No-take
❏ Type of management structure: Conventional
❏ Geographic coordinates: 145°48’ E & 15°15’N. Boundaries: 1000ft seaward of low tidemark and 500ft inland
❏ World region: Tropical
❏ Nearest major city: San Roque, Saipan
Bunaken National Park (Indonesia)
❏ LME: Indonesian Sea
❏ RSP: East Asian Seas
❏ Date of establishment: 1991
❏ Area (km2): 790 (Medium)
❏ Ecosystem type: Coral reefMangroveSeagrass Deep coastal seawall & trenches
❏ Description of special resources; importantecological features; reason for establishing aprotected area: Diverse corals and coral reeffish communities, diversity and abundance ofmangroves extensive seagrass beds supportingdugong and sea turtle populations, and newlydiscovered group of resident coelacanths.
❏ Management objective: Multiple
❏ Type of management structure: Co-manage-ment
❏ Geographic coordinates: 1°35’N; 124°44’E
❏ World region: Tropical
❏ Nearest major city: Manado, North Sulawesi
Channel Islands National MarineSanctuary (USA)
❏ LME: California Current
❏ RSP: North-East Pacific
❏ Date of establishment: 1980
❏ Area (km2): 4,349 (Large)
❏ Ecosystem type: Kelp ForestRocky Intertidal
❏ Description of special resources; importantecological features; reason for establishing aprotected area: n.a.
❏ Management objective: n.a.
❏ Type of management structure: Co-manage-ment
❏ Geographic coordinates: 34°N, 120°W
❏ World region: Temperate Pacific
❏ Nearest major city: Santa Barbara, CA
Far Eastern Federal Marine Preserve(Russian Federation)
❏ LME: Sea of Japan
❏ RSP: Northwest Pacific
❏ Date of establishment: 24 March 1978
❏ Area (km2): 0.64 (Small)
❏ Ecosystem type: Rocky Shore
❏ Description of special resources; importantecological features; reason for establishing aprotected area: Coastal marine and islandenvironment of Peter The Great Bay contain-ing more than 2,700 marine species (manyunder international protection).
❏ Management objective: Multiple
❏ Type of management structure: Conventional
❏ Geographic coordinates (approx.): 42.5°N,131.5°E
❏ World region: Temperate and subtropical
❏ Nearest major city: Vladivostok
Galapagos Islands Marine Reserve(Ecuador)
❏ LME: n.a.
❏ RSP: Southeast Pacific
❏ Date of establishment: 1998
❏ Area (km2): 135,000 (Large)
❏ Ecosystem type: Upwelling Volcanic Substrate
207
AP
PE
ND
IXT
he M
PA
pilo
t site
s
❏ Description of special resources; importantecological features; reason for establishing aprotected area: The highly productive coastalwaters support a rich food chain that extentsnot only from plankton to sharks and whales,but also to land plants, insects and birds.Galapagos sits on the equator but also lies inthe path of cool nutrient rich currents, a com-bination that separates it apart from all othermajor island groups. Here corals, manta raysand other plants and animals typical of tropi-cal seas share islands with penguins, fur sealsand cool water species
❏ Management objective: Multiple
❏ Type of management structure: Co-manage-ment
❏ Geographic coordinates: 2°S/2°N, 89°/92°W
❏ World region: Tropical/arid
❏ Nearest major city: Guayaquil
Hol Chan Marine Reserve (Belize)
❏ LME: Caribbean Sea
❏ RSP: Wider Caribbean
❏ Date of establishment: 2 May 1997
❏ Area (km2): 8 (Small)
❏ Ecosystem type: Coral ReefSeagrassMangrove
❏ Description of special resources; importantecological features; reason for establishing aprotected area: Reserve status was called bythe community and by international organiza-tions due to the unique formation of thechannel, the abundant fishery resources(including conch and lobster) and the feasibili-ty of including an interlinked system of coralreef, seagrass and mangrove habitats in thisarea.
❏ Management objective: Multiple
❏ Type of management structure: Co-manage-ment (semi-governmental)
❏ Geographic coordinates (approx.): 17.7°N,87.7°W
❏ World region: Mesoamerican Caribbean
❏ Nearest major city: San Pedro Town, CayeCaulker
Lenger Island Marine Protected Area(Pohnpei Island, Federated States ofMicronesia)
❏ LME: n.a.
❏ RSP: South Pacific Regional EnvironmentProgramme (SPREP)
❏ Date of establishment: February 2001
❏ Area (km2): 2 (Small)
❏ Ecosystem type: Coral Reef
❏ Description of special resources; importantecological features; reason for establishing aprotected area: Siganidae spawning and aggre-gation site; Turtle hatchery; Diverse inverte-brate species; and WWII Base.
❏ Management objective: No-take
❏ Type of management structure: Community-based
❏ Geographic coordinates: 7°N, 158°13’E
❏ World region: Tropical
❏ Nearest major city: Kolonia
Loreto Bay National Park (Mexico)
❏ LME: Gulf of California
❏ RSP: Northeast Pacific
❏ Date of establishment: 19 July 1996
❏ Area (km2): 2,065 (Large)
❏ Ecosystem type: Dune vegetation Desert scrub Mangrove Rocky reef, sand and mud flats Rodolites
❏ Description of special resources; importantecological features; reason for establishing aprotected area: Fish fauna of least 260species. Five sea turtles in the Gulf ofCalifornia are present in the park, all of themunder protection. 90 terrestrial and 110aquatic birds compose the bird fauna. 30species of marine mammals out of 35 speciesreported in the Gulf of California (nine ofthem under protection).
❏ Management objective: Multiple
❏ Type of management structure: Conventional
❏ Geographic coordinates: 25°35’-26°07’N,110°45’-111°21’W
❏ World region: Semi-arid
208
❏ Nearest major city: Loreto and La Paz, BajaCalifornia Sur
Mafia Island Marine Park (Tanzania)
❏ LME: Agulhas Current
❏ RSP: Eastern Africa
❏ Date of establishment: 1995
❏ Area (km2): 822 (Medium)
❏ Ecosystem type: Mangroves Seagrass beds Coral reefs Intertidal reef flats Lagoon Coastal forest
❏ Description of special resources; importantecological features; reason for establishing aprotected area: The archipelago is formed of anumber of very large islands and small-unin-habited coral atolls. Due to its position along-side the barrier, the island is the meetingplace of large oceanic fish and the vast varietyof fish common to the Indian Ocean coralreefs. There are over 400 species of fish in thepark.
❏ Management objective: Multiple
❏ Type of management structure: Conventionalwith Co-management
❏ Geographic coordinates: 7°45’-8°9’S, 39°54’-39°30’E
❏ World region: Tropical
❏ Nearest major city: Dar es-Salaam
Miramare Marine Protected Area (Italy)
❏ LME: Mediterranean
❏ RSP: Mediterranean
❏ Date of establishment: 1986
❏ Area (km2): 1.2 (Small)
❏ Ecosystem type: Tidal area Rocky shore Soft bottom
❏ Description of special resources; importantecological features; reason for establishing aprotected area: Miramare focuses on issuesrelated to education activities, scientificresearch, related to the reproductive biology offish species and water quality.
❏ Management objective: No-take
❏ Type of management structure: Co-manage-ment
❏ Geographic coordinates: 45°42’N, 13°42’E
❏ World region: Mediterranean Sea
❏ Nearest major city: Trieste
Ngemelis (Palau)
❏ LME: n.a.
❏ RSP: South Pacific
❏ Date of establishment: 1995
❏ Area (km2): 30 (Medium)
❏ Ecosystem type: Coral Reef
❏ Description of special resources; importantecological features; reason for establishing aprotected area: Highly diverse reef wall.
❏ Management objective: No-take
❏ Type of management structure: Conventional
❏ Geographic coordinates (approx.): 7.2°N,134.6°E
❏ World region: Tropical Pacific
❏ Nearest major city: Koror
Piti Bomb Holes Preserve (Guam)
❏ LME: n.a.
❏ RSP: South Pacific
❏ Date of establishment: 16 May 1997
❏ Area (km2): 3.36 (Small)
❏ Ecosystem type: Coral Reef Sparse seagrass beds
❏ Description of special resources; importantecological features; reason for establishing aprotected area: Extensive patch reefs inunique dissolution holes within Piti reef flat.Site includes various habitats needed for thelife cycle of marine animals.
❏ Management objective: No-take
❏ Type of management structure: Conventional
❏ Geographic coordinates (approx.): 13°27’N,144°42’E
❏ World region: Tropical Pacific
❏ Nearest major city: Hagatna (Agana)
209
AP
PE
ND
IXT
he M
PA
pilo
t site
s
Saguenay-St. Lawrence Marine Park(Canada)
❏ LME: Newfoundland-Labrador Shelf
❏ RSP: n.a.
❏ Date of establishment: 8 June 1998
❏ Area (km2): 1,138 (Medium)
❏ Ecosystem type: Cold-water estuary Tidal mud flats Underwater cliffs Nutrient rich cold-water upwellings Fjord Marshes
❏ Description of special resources; importantecological features; reason for establishing aprotected area: Established for the protectionof a severely depleted and endangered popula-tion of beluga whales. The area is a majorsummer feeding ground for a host of visitingwhales species migrating from the NorthernAtlantic. Fin, minke, blue, and humpbackwhales all converge on this area to feast onthe high concentrations of krill found in thenutrient-rich waters.
❏ Management objective: Multiple use
❏ Type of management structure: Conventional(federal and provincial governments)
❏ Geographic coordinates (approx.): 47°39’ -48°23’ N, 69°17’ - 70°42’ W
❏ World region: Cold temperate
❏ Nearest major city: Saguenay and Rivière-du-Loup (within 15 km)
Sasanhaya Fish Reserve (CNMI)
❏ LME: n.a
❏ RSP: South Pacific
❏ Date of establishment: October 1994
❏ Area (km2): 0.8 (Small)
❏ Ecosystem type: Fringing coral reef Fish reserves
❏ Description of special resources; importantecological features; reason for establishing aprotected area: Unique coral features; populardive site; fringing coral reef; historic WWIIwrecks
❏ Management objective: No-take
❏ Type of management structure: Conventional
❏ Geographic coordinates (approx.): 14°07’05”N, 145°10’ E,
❏ World region: Tropical Pacific
❏ Nearest major city: Song Song, Rota
Sian Ka’an Biosphere Reserve (Mexico)
❏ LME: Caribbean Sea
❏ RSP: Wider Caribbean
❏ Date of establishment: 20 January 1986
❏ Area (km2): 6,000 (Large)
❏ Ecosystem type: Coral Reef Coastal Lagoon MangroveTropical forest
❏ Description of special resources; importantecological features; reason for establishing aprotected area: Coral reef and platform with alength of 120 km and depth of 60 m towardsthe Caribbean Sea, it is part of the secondlargest coral reef in the world.
❏ Management objective: Multiple
❏ Type of management structure: Conventional
❏ Geographic coordinates (approx.): 19°05’ –20°06’N, 87°30’ – 87°58’W
❏ World region: Mesoamerican Caribbean
❏ Nearest major city: Cancun and CarrilloPuerto
Tubbataha Reef National Marine Park(Philippines)
❏ LME: Sulu-Celebes Sea
❏ RSP: East Asian Seas
❏ Date of establishment: 11 August 1998
❏ Area (km2): 332 (Medium)
❏ Ecosystem type: AtollCoral Reef
❏ Description of special resources; importantecological features; reason for establishing aprotected area: An atoll reef with a very highdensity of marine species; the North Isletserving as a nesting site for birds and marineturtles. A pristine coral reef with a 100 mperpendicular wall, extensive lagoons and twocoral islands.
210
❏ Management objective: No-take
❏ Type of management structure: Co-manage-ment
❏ Geographic coordinates: 8°45’-9°00’N,119°45’-120°04’E
❏ World region: Tropical
❏ Nearest major city: Puerto Princesa City,Palawan
Upper Gulf of California and ColoradoRiver Delta Biosphere Reserve (Mexico)
❏ LME: Gulf of California
❏ RSP: Northeast Pacific
❏ Date of establishment: 10 June 1993
❏ Area (km2): 9,340 (Large)
❏ Ecosystem type: Wetlands Shallow coastal marine Delta Estuary
❏ Description of special resources; importantecological features; reason for establishing aprotected area: Marine/coastal habitats:Shallow marine-coastal semi-open waters,soft-bottom and sandy/muddy coastline, rockyareas (coquina formation), delta floodplain(intertidal and brackish wetlands, saltflats).Terrestrial habitats: Gran Desierto sanddunes, San Felipe desert (Sonora Desert)
❏ Management objective: Multiple
❏ Type of management structure: Conventional
❏ Geographic coordinates: 21°-22.5°N; 113°-116°W
❏ World region: Sub-tropical
❏ Nearest major city: San Diego, CA, andMexicali, Mexico
211
AP
PE
ND
IXT
he M
PA
pilo
t site
s

213
LOSSARY
Abiotic: Factors that are non-biological but playan important role in an organism’s environment(e.g. substrate, temperature, currents, pH).
Abundance (of species): The number of indi-viduals of a particular species occurring within adefined area.
Accountability: For this guidebook, this termimplies the state of being accountable, subject tothe obligation to report, explain or justify theestablishment of an MPA, its achievements andfailures, and the resources (material, financial, andhuman) spent for its functioning.
Adaptive management: The cyclical process ofsystematically testing assumptions, generatinglearning by evaluating the results of such testing,and further revising and improving managementpractices. The result of adaptive management in aprotected area context is improved effectivenessand increased progress towards the achievement ofgoals and objectives.
Allocation of resources: The process ofdistributing resources among the various stake-holders or interested parties.
Assessment: See Evaluation. For the purpose ofthis guidebook, assessment and evaluation areused interchangeably, although we recognise thatthis term can be defined as the act of determiningthe importance, size or value of an object orprocess.
Audience: The participating, reading, viewing orlistening public (the MPA stakeholders or group ofinterests).
Basemap: A map containing geographic featuresused for locational reference.
Benthic (species): An organism that lives and/orreproduces in the Benthic Zone.
Benthic (zone): A primary subdivision of theoceans that includes the entire sea bottom.
Biomass: The quantity of living matter (livingorganisms) expressed as unit of weight per unitarea or unit volume.
Biota: The number of organisms that occupy anecosystem.
Broken stick: A statistical model of randomdistribution of resources among species. It is as ifa stick was broken into several pieces with nounderlying relationships determining the size ofeach piece.
Code sheet: The translation of meaning of datacollected and their codes.
Co-management: A partnership in which gov-ernment and stakeholders share the authority andresponsibility for making decisions about manage-
ment of the resource. It may take many forms andinvolves a high degree of stakeholder participation.
Community (biophysical definition): Acollection of different and interacting populationsof organisms (biota) found living together in adefined geographic area, including indigenous andexotic organisms.
Community (human/social definition): Agroup of people with common interests (possiblyliving in a particular local area).
Community composition: The diversity andmakeup of all species present within a communityand their relative abundance (respective to oneanother). Species richness, dominance, diversityand relative abundance are all characteristics ofcommunity composition.
Community-based management: People-focused and community-focused managementwith a great deal of local stakeholder participation.
Control groups: A set of people used as a stan-dard of comparison to the experimental group. Thepeople in the control group have characteristicssimilar to those in the experimental group and areselected at random.
Cryptic (species): Species that for their charac-teristics (life-cycle, environmental requirements,feeding patterns, etc.) are hard to find, or can beconsidered rare.
Database: The storage location of a data entry. Acollection of data organized especially for rapidsearch and retrieval.
Data cleaning: Reviews of the data set in order tocheck for completeness and errors.
Data coding: The process of translating eachdatum point to prepare for analysis.
Data entry: The (often lengthy and tedious)process of moving cleaned, coded data into apermanent storage location from which to exportthe data so that it can be analysed.
Data management: The act, process or meansby which data is managed. This may include thecompilation, storage, safe-guarding, listing, organ-ization, extraction, retrieval, manipulation anddissemination of data (Lake and Water WordGlossary – http://www.nalms.org/glossary/glossary.htm).
Ecotone: A transition area between two distincthabitats, where the ranges of the organisms ineach bordering habitat overlap, and where there areorganisms unique to the transition area.
Environmental Impact Assessment: Theassessment of the environmental impacts likely toarise from a major action (i.e. legislation, a policy,
G
214
a programme or project, etc.) significantly affectingthe environment.
Evaluation: The judgement or assessment ofachievement against some predetermined criteria;in this case the objectives for which the protectedareas were established. Information on which suchassessments can be based could come from manysources, but monitoring has a particularly impor-tant contribution to make in providing the basicdata that should underpin the evaluation(Hockings et al., 2000).
Evaluation workplan: A scheme of action, amethod of proceeding planned in advance toperform an effectiveness evaluation (see Box 6).
Focal species: An organism of ecological and/orhuman value that is of priority interest for man-agement through the MPA.
Food web: A representation of the energy flowthrough populations in a community.
Food web integrity: A measure of howsupportive (for the members of the community)and reliable the trophic relationships are withinthe interconnected food chains of a community.
Formal knowledge: The degree of awareness ofinformation generated by the scientific communi-ty and held by stakeholder and user groups aboutMPA use and ecosystem impacts.
Geographic Information System (GIS): Anorganized collection of computer hardware, soft-ware, geographic data, and personnel designed toefficiently capture, store, update, manipulate,analyse and display all forms of geographicallyreferenced information that can be drawn fromdifferent sources, both statistical and mapped (EPATerminology Reference System).
Goal: A broad statement of what the MPA isultimately trying to achieve.
Habitat: The living space of an organism, popu-lation, or community, as characterized by both itsbiotic and physical properties. Habitat types aredistinguished from one another by their distinctbiotic and abiotic composition and structure thatforms living space.
Habitat complexity: The extent (area in km2)and diversity (number) of habitat types anddistinct zones found within a specified area.
Habitat distribution: The structure and spatialcharacterization of all habitat types represented.
Habitat integrity: The extent to which thedistribution and complexity of living space in anarea will persist over time.
Indicator: A unit of information measured overtime that allows you to document changes in
specific attributes of your MPA. It helps you tounderstand where you are, where you are goingand how far you are from the goal (adapted fromHockings et al., 2000).
Intertidal (zone): Area located between theelevation of the lowest yearly tide and the elevationof the highest yearly tide.
Key informant: People with rank, experience orknowledge who can provide extensive insight infor-mation on a specific issue or situation (adaptedfrom Bunce et al., 2000).
Log-normal: A statistical model of distributionof resources among species determined by a num-ber of interacting factors. This leads to a log-normal distribution in abundance classes, whichmeans that the number of species falling withineach class are plotted against the log value of theclass category.
Management body: An institution (board ofdirectors, executive committee, advisory board)that governs how the MPA is managed and used.
Management effectiveness: The degree towhich management actions achieve the goals andobjectives of a protected area.
Marine Protected Area (MPA): Any area ofintertidal or subtidal terrain, together with itsoverlying waters and associated flora, fauna,historical and cultural features, which has beenreserved by law or other effective means to protectpart or all of the enclosed environment (IUCN).
Messaging: A process for sharing evaluationresults with a target audience. It should considerwhich messages and what formats will be used tocommunicate the results.
Neritic (zone): The shallow regions of a lake orocean that border the land. The term is also usedto identify the biota that inhabits the water alongthe shore of a lake or ocean.
Non-market value: The economic value ofactivities that are not traded in any market, whichincludes direct uses, such as divers who have trav-elled to the MPA by private means; and indirectuses, such as biological support in the form ofnutrients, fish habitat and coastline protectionfrom storm surge.
Non-use value: Values that are not associatedwith any use and include existence value (the valueof knowing that the resource exists in a certaincondition), option value (the value of being able touse the resource in the future), and bequest value(the value of ensuring the resource will be availablefor future generations).
No-take zone: An area that is completely (orseasonally) free of all extractive or non-extractive
215
GLO
SS
AR
Y
TONY ECKERSLEY
human uses that contribute impact (some excep-tions are permitted for scientific/research activities).Also called a “reserve” or “fully protected area”.
Objective: A specific statement of what must beaccomplished to attain a related goal.
Ordinal scale: A measurement that represents aranking of a variable's values to observe overalltrends. The ranking provides an indication ofwhether one value is “greater than” or “less than”other values.
Outcomes: The consequences, effects or realimpacts of management actions. Outputs assessthe extent to which the management objectives arebeing achieved.
Outputs: Resulting products and/or services, orachievements of a planned work programme thatarise from a management activity.
Participatory (Participation): A processinvolving/providing the opportunity for an individ-ual person (every relevant stakeholder) to partici-pate in management.
Phenology: Relations between environmentalconditions (e.g. climate or temperature) and peri-odic biological events (e.g. reproduction).
Practitioner: Someone experienced in the tech-nical skills and practice of conservation.
Qualitative (data): Non-numerical data, oftenin the form of categorical data (e.g. preference,opinion, attitudes, etc.)
Quantitative (data): Numerical data obtainedby measuring objects or events.
Recruitment success: The degree of juvenilerecruitment and survivorship experienced acrosspopulations of organisms that exist within acommunity.
Results delivery strategy: A method thatoutlines how to communicate the presentationformats identified and assigned to target audi-ences.
Sedentary (species): An organism that lives ina fixed location, as with most plants, tunicates,sponges, etc.
Semi-structured interviews: An interviewbased on the use of a guide (e.g. notes or a ques-tionnaire), but that has the freedom of an openconversation. It is recommended when there isonly one chance to interview someone.
Sessile (species): Describes an animal that isunable to move, or does not move very much.Examples include coral, sponges, barnacles and seasquirts.
Stakeholder: An individual, group or organiza-tion that influences or is otherwise interested,involved or affected by a particular MPA manage-ment strategy.
Strategy: The way you will move forward withyour conservation and management efforts; whatit is that you will actually do.
Subtidal: Area below the low-tide level.
Survivorship: The survival rate (probability)from a (recruitment) process or event.
Telemetry: The use of radio waves, telephonelines, etc., to transmit the readings of measuringinstruments to a device on which the readings canbe indicated or recorded.
Threats: Those factors that immediately impactbiodiversity, food security, and livelihood.
Trophic level: The stage in a food chain or webleading from primary producers through herbi-vores to primary and secondary consumers.
t-test: A statistical parametric test assuming anormal distribution. The t-test is appropriatewhen you have a single interval dependent and adichotomous independent, and want to test thedifference of means of a criterion variable for twoindependent samples or for two dependentsamples (for more information see, for example,A. Agresti and B. Finlay, Statistical Methods for theSocial Sciences. 3rd edition, 1997).
Guidelines for Marine Protected Areas
Edited and coordinated by Graeme KelleherSeries editor: Adrian Phillips
Creation and effective management of Marine Protected Areas (MPAs) have lagged behindthose of protected areas on land, but they are just as important. The world urgently needs acomprehensive system of MPAs to conserve biodiversity and to help rebuild the productivity ofthe oceans. The aim of these Guidelines is to help countries establish systems of MPAs as a keycomponent of integrated management of coastal and marine areas and as part of their sustain-able development. The various actions to make an effective MPA are set out, from early plan-ning stages to implementation. These Guidelines aim to help policy-makers, planners and fieldmanagers, whether working on conservation of nature or sustainable use of marine resources.
Best Practice Protected Area Guidelines Series No. 3ISBN 2-8317-0505-3, 1999 295 x 210mm, xxiv + 107pp., colour maps£16.50, US$24.75 Order no. B542
Marine and Coastal Protected Areas: A guide for planners and managers
Rodney Salm, John Clark and Erkki Siirila, 3rd Edition
This is a new edition of the classic textbook on marine protected area (MPA) management inthe tropics, originally produced as an output of the Bali World Parks Congress in 1982.
Approaches to planning and managing MPAs have evolved considerably. Major advances includeinnovative financing mechanisms, partnerships with the private sector and NGOs, and collabo-rative management between government and coastal communities. These advances havebrought new approaches for MPA establishment and management that are more participatory,involving communities through interaction and collaboration rather than prescription. With newcase studies and illustrations, the guide comes in a water-resistant cover for field use. It isintended for those who plan individual and/or national MPA systems and gives philosophicalcontext for MPAs along with some basic principles and approaches.
ISBN 2-8317-0540-1, 2000 260 x 155mm, 387pp., b/w photos £20.50, US$30.75 Order no. B563
Dolphins, Whales and Porpoises
2002–2010 Conservation Action Plan for the World's Cetaceans Compiled by Randall Reeves, Brian D. Smith, Enrique A. Crespo and Giuseppe Notarbartolo diSciara and the IUCN/SSC Cetacean Specialist Group
Consistent evaluation and new recommendations for action are required of protective meas-ures to address threats that were unrecognised or non-existent until recently. Global warming,noise pollution and reduced availability of prey are now of great concern.The all too familiar threats of accidental killing in fishing gear and exposure to toxic chemicalsremain almost intractable. This Action Plan reviews threats and offers possible solutions. It alsocontains a thorough review of the status of species and a list of 57 recommended research proj-ects and education initiatives.
ISBN 2-8317-0656-4, 2003 280 x 215mm, xi + 139pp., tables, b/w photos £15.00, US$22.50 Order no. B1157
Other marine conservation books from IUCN
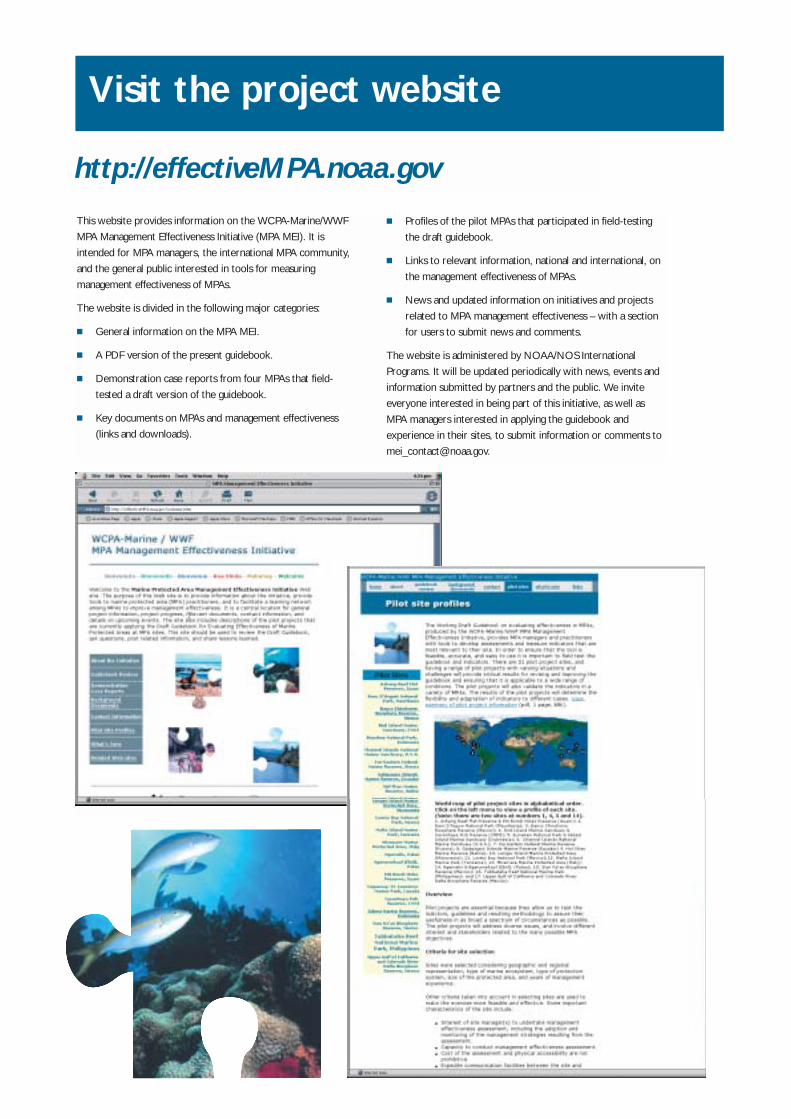
Visit the project website
This website provides information on the WCPA-Marine/WWF
MPA Management Effectiveness Initiative (MPA MEI). It is
intended for MPA managers, the international MPA community,
and the general public interested in tools for measuring
management effectiveness of MPAs.
The website is divided in the following major categories:
� General information on the MPA MEI.
� A PDF version of the present guidebook.
� Demonstration case reports from four MPAs that field-
tested a draft version of the guidebook.
� Key documents on MPAs and management effectiveness
(links and downloads).
� Profiles of the pilot MPAs that participated in field-testing
the draft guidebook.
� Links to relevant information, national and international, on
the management effectiveness of MPAs.
� News and updated information on initiatives and projects
related to MPA management effectiveness – with a section
for users to submit news and comments.
The website is administered by NOAA/NOS International
Programs. It will be updated periodically with news, events and
information submitted by partners and the public. We invite
everyone interested in being part of this initiative, as well as
MPA managers interested in applying the guidebook and
experience in their sites, to submit information or comments to
http://effectiveMPA.noaa.gov
IUCN Programme on Protected AreasRue Mauverney 28CH-1196 Gland, SwitzerlandTel: +41 22 999 00 00Fax: +41 22 999 00 15E-mail: [email protected]
IUCN Publications Services Unit219c Huntingdon RoadCambridge, CB3 0DL, UKTel: +44 1223 277894Fax: +44 1223 277175E-mail: [email protected]/bookstore
IUCN – The World Conservation Union
Founded in 1948, The World Conservation Union bringstogether States, government agencies and a diverse range ofnon-governmental organizations in a unique world partnership:over 1000 members in all, spread across some 140 countries.
As a Union, IUCN seeks to influence, encourage and assistsocieties throughout the world to conserve the integrity anddiversity of nature and to ensure that any use of naturalresources is equitable and ecologically sustainable.
The World Conservation Union builds on the strengths of itsmembers, networks and partners to enhance their capacityand to support global alliances to safeguard natural resourcesat local, regional and global levels.
NA
TIO
NA
LO
CEA
NICAND ATMOSPHERIC
ADM
INIS
TR
AT
IONU
.S. D
EPARTMENT OF COMMERCE


