Embed Size (px)
Citation preview
5MWp/10MWp
SolarPVModule
ProductionUnit– Total Business Model
A complete analysis & assessment have been done which can be utilised as bankable DPR.
The whole process of setting up a solar PV Module Production Unit and the required
business model have discussed in detail. Also The Market Analysis, Financial aspects,
Marketing strategies can be found in this article.
1
Acknowledgement
Right now solar PV market is booming – thanks to our Govt. support
which is constantly coming up with new & attractive energy policies.
In india, a lot of new companies are starting as system integrator,
EPC service providers. But, compared to these service providers, the
number of Solar PV Panel producing companies is very few. So in this
paper, I’ll discuss about the technology & financial aspect of setting
up a Solar PV Module production unit in detail. The reader can find
about the detailed overview of machineries involved, total
investment required, how to deploy the marketing team, details of
production team HR structure and benefits related to the products
and a layout to setup the production unit.
This paper/project report will be adequate to prepare a bankable
DPR also. The most important thing is how to do the marketing and
the related scope. Keeping this in mind, the report enlightens this
particular topic with more detail.
2
Table of Contents Market Analysis ....................................................................................................................................... 3
Solar PV Project Scenario .................................................................................................................... 3
Indian Market Overview ..................................................................................................................... 6
Technical Details – Overview, Instruments, Raw Materials, Layout ....................................................... 8
Required Materials & their specification: ........................................................................................... 9
Technical Details of the Manufacturing Instruments ....................................................................... 11
Plant setup: ....................................................................................................................................... 19
Production Unit Layout/Floor Plan ............................................................................................... 19
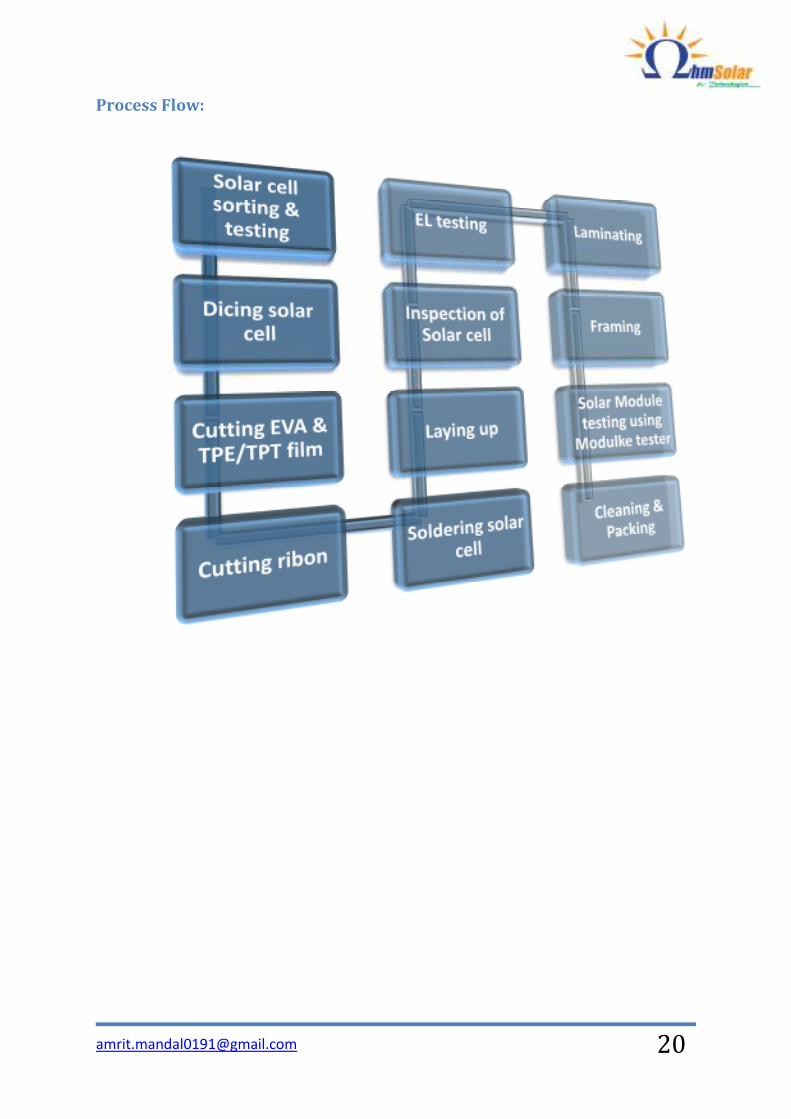
Process Flow: .................................................................................................................................... 20
Financial Analysis – Investment, Payback, Break Even & more…. ........................................................ 21
Mode1 – For 5MWp yearly PV Module Production Capacity ............................................................ 21
Payback Analysis ........................................................................................................................... 22
Return of Investment Analysis ...................................................................................................... 23
Break Even Analysis ....................................................................................................................... 24
Mode2 – For 10MWp SPV Module Production Capacity .................................................................. 26
Investment & related: ................................................................................................................... 26
Cash Flow & Net Profit .................................................................................................................. 26
Investment Payback Analysis – For 10MWp production unit .............................................. 27
ROI Analysis: .................................................................................................................................. 28
Break Even Analysis ....................................................................................................................... 29
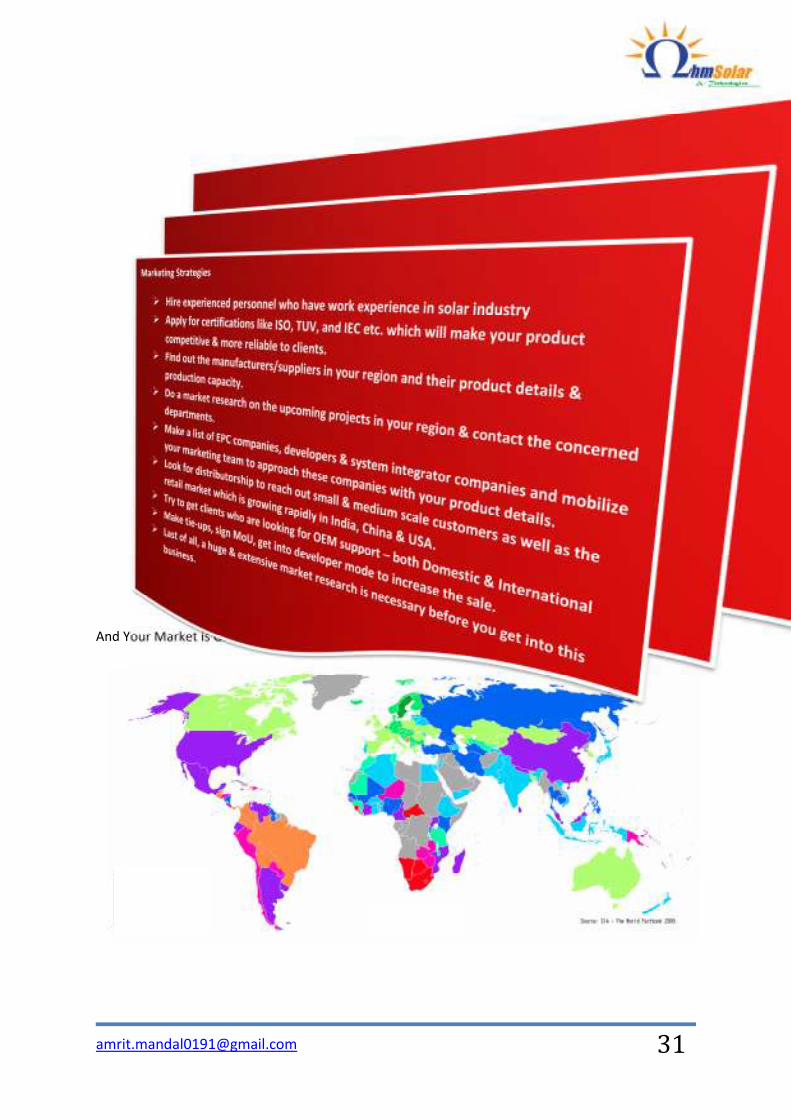
Marketing Strategies ............................................................................................................................. 31
About Me: ............................................................................................................................................. 32
3
Market Analysis
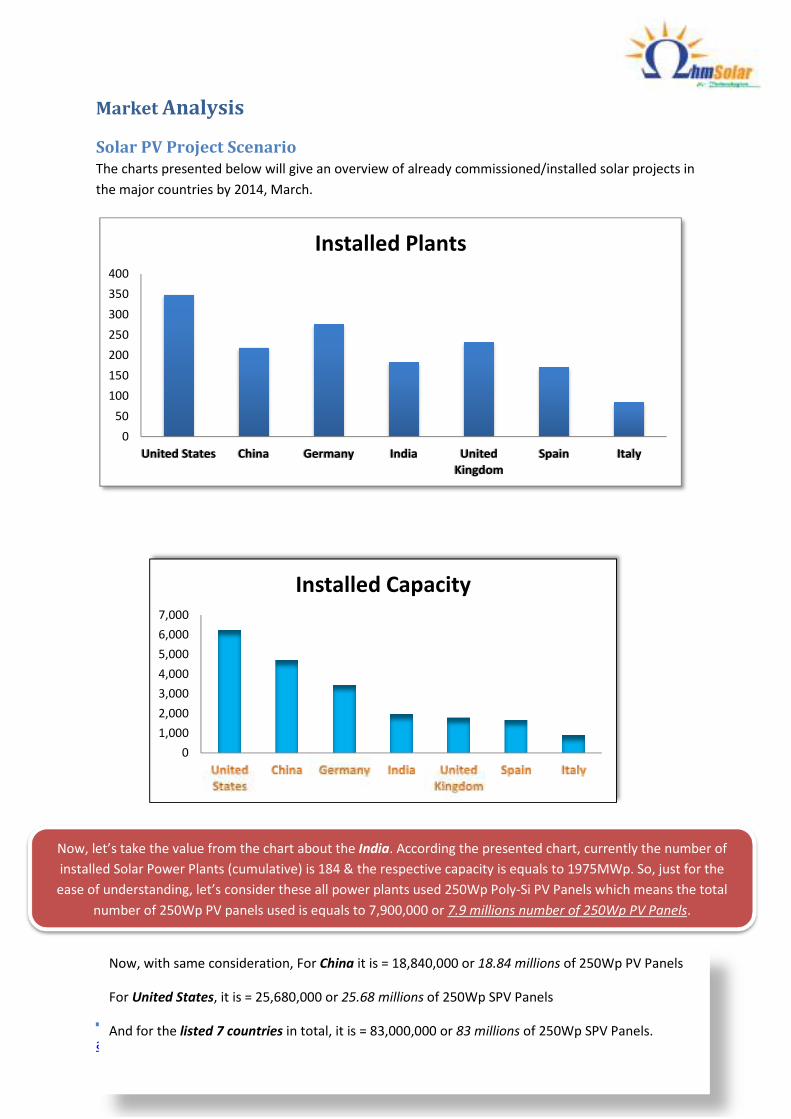
Solar PV Project Scenario
The charts presented below will give an overview of already commissioned/installed solar projects in
the major countries by 2014, March.
0
50
100
150
200
250
300
350
400
United States China Germany India United
Kingdom
Spain Italy
Installed Plants
0
1,000
2,000
3,000
4,000
5,000
6,000
7,000
Installed Capacity
Now, with same consideration, For China it is = 18,840,000 or 18.84 millions of 250Wp PV Panels
For United States, it is = 25,680,000 or 25.68 millions of 250Wp SPV Panels
And for the listed 7 countries in total, it is = 83,000,000 or 83 millions of 250Wp SPV Panels.
Now, let’s take the value from the chart about the India. According the presented chart, currently the number of
installed Solar Power Plants (cumulative) is 184 & the respective capacity is equals to 1975MWp. So, just for the
ease of understanding, let’s consider these all power plants used 250Wp Poly-Si PV Panels which means the total
number of 250Wp PV panels used is equals to 7,900,000 or 7.9 millions number of 250Wp PV Panels.
4
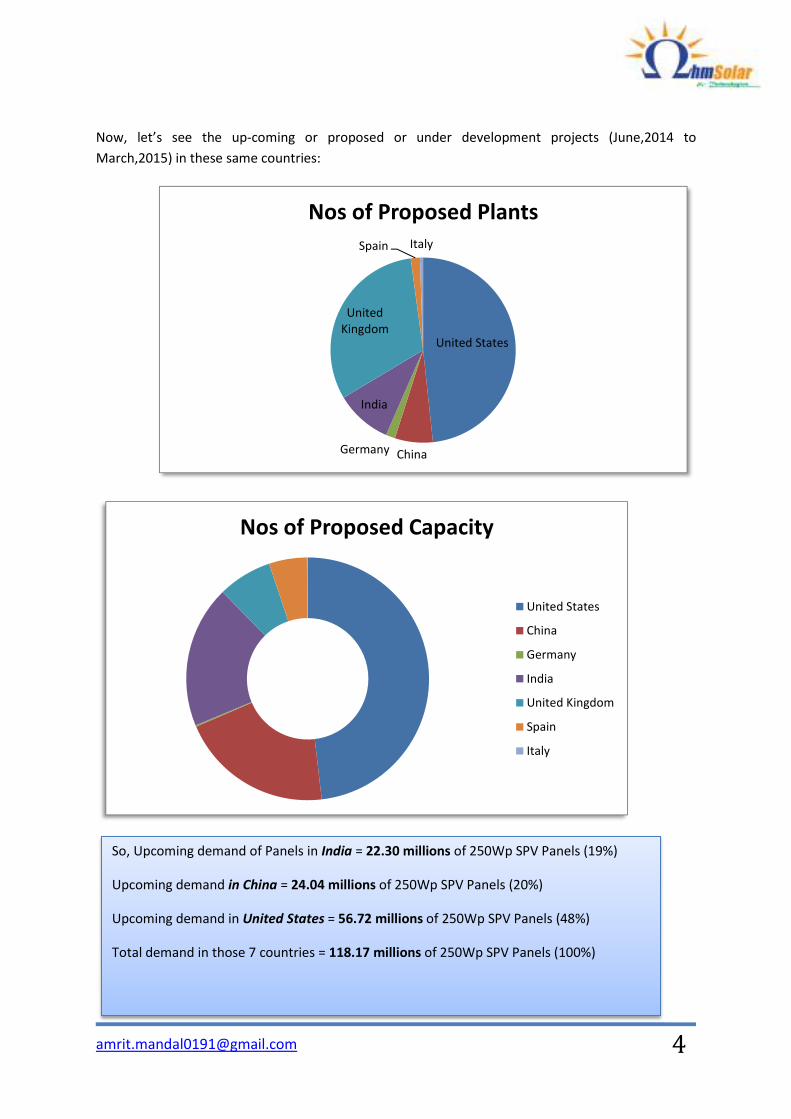
Now, let’s see the up-coming or proposed or under development projects (June,2014 to
March,2015) in these same countries:
United States
China Germany
India
United
Kingdom
Spain Italy
Nos of Proposed Plants
Nos of Proposed Capacity
United States
China
Germany
India
United Kingdom
Spain
Italy
So, Upcoming demand of Panels in India = 22.30 millions of 250Wp SPV Panels (19%)
Upcoming demand in China = 24.04 millions of 250Wp SPV Panels (20%)
Upcoming demand in United States = 56.72 millions of 250Wp SPV Panels (48%)
Total demand in those 7 countries = 118.17 millions of 250Wp SPV Panels (100%)
5
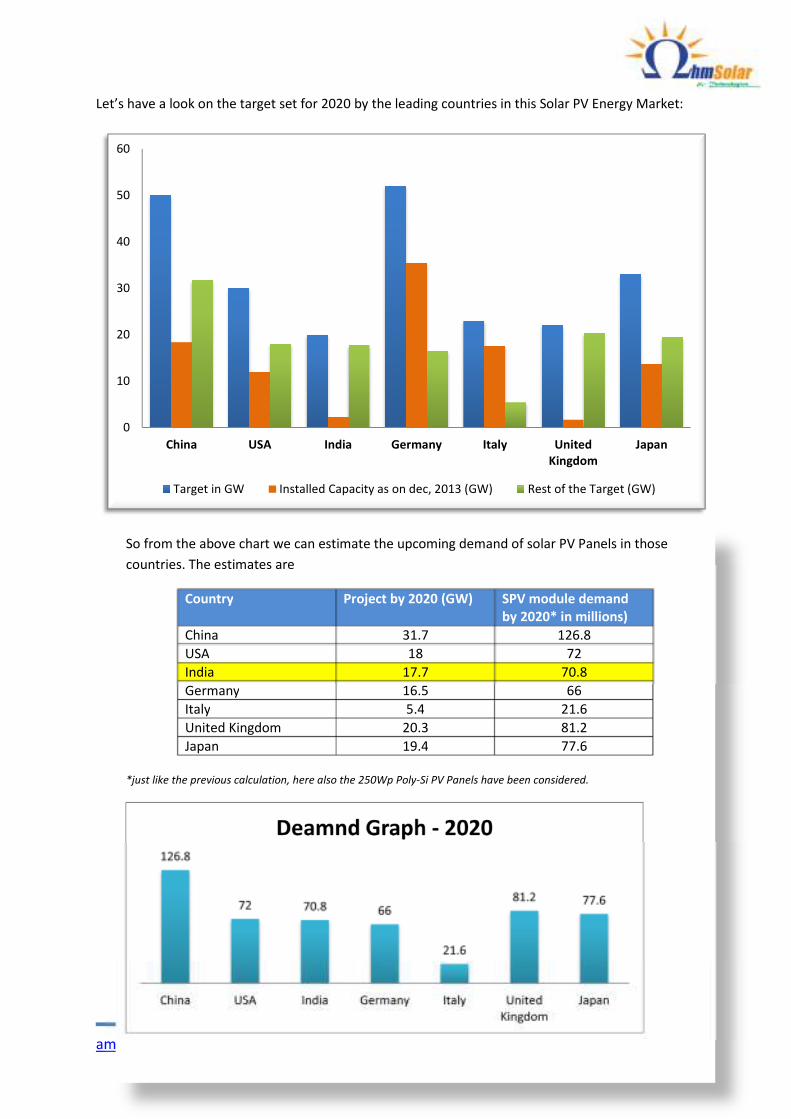
Let’s have a look on the target set for 2020 by the leading countries in this Solar PV Energy Market:
0
10
20
30
40
50
60
China USA India Germany Italy United
Kingdom
Japan
Target in GW Installed Capacity as on dec, 2013 (GW) Rest of the Target (GW)
So from the above chart we can estimate the upcoming demand of solar PV Panels in those
countries. The estimates are
Country Project by 2020 (GW) SPV module demand
by 2020* in millions)
China 31.7 126.8
USA 18 72
India 17.7 70.8
Germany 16.5 66
Italy 5.4 21.6
United Kingdom 20.3 81.2
Japan 19.4 77.6
*just like the previous calculation, here also the 250Wp Poly-Si PV Panels have been considered.
6
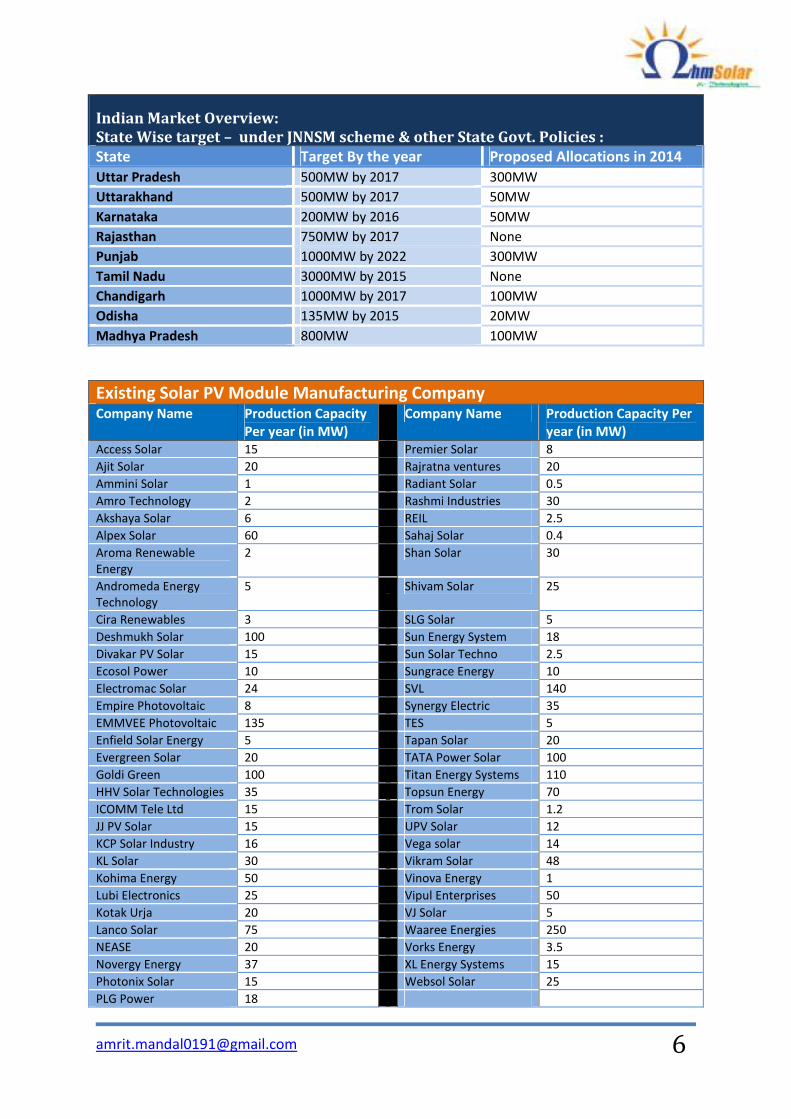
Indian Market Overview:
State Wise target – under JNNSM scheme & other State Govt. Policies :
State Target By the year Proposed Allocations in 2014
Uttar Pradesh 500MW by 2017 300MW
Uttarakhand 500MW by 2017 50MW
Karnataka 200MW by 2016 50MW
Rajasthan 750MW by 2017 None
Punjab 1000MW by 2022 300MW
Tamil Nadu 3000MW by 2015 None
Chandigarh 1000MW by 2017 100MW
Odisha 135MW by 2015 20MW
Madhya Pradesh 800MW 100MW
Existing Solar PV Module Manufacturing Company Company Name Production Capacity
Per year (in MW)
Company Name Production Capacity Per
year (in MW)
Access Solar 15 Premier Solar 8
Ajit Solar 20 Rajratna ventures 20
Ammini Solar 1 Radiant Solar 0.5
Amro Technology 2 Rashmi Industries 30
Akshaya Solar 6 REIL 2.5
Alpex Solar 60 Sahaj Solar 0.4
Aroma Renewable
Energy
2 Shan Solar 30
Andromeda Energy
Technology
5 Shivam Solar 25
Cira Renewables 3 SLG Solar 5
Deshmukh Solar 100 Sun Energy System 18
Divakar PV Solar 15 Sun Solar Techno 2.5
Ecosol Power 10 Sungrace Energy 10
Electromac Solar 24 SVL 140
Empire Photovoltaic 8 Synergy Electric 35
EMMVEE Photovoltaic 135 TES 5
Enfield Solar Energy 5 Tapan Solar 20
Evergreen Solar 20 TATA Power Solar 100
Goldi Green 100 Titan Energy Systems 110
HHV Solar Technologies 35 Topsun Energy 70
ICOMM Tele Ltd 15 Trom Solar 1.2
JJ PV Solar 15 UPV Solar 12
KCP Solar Industry 16 Vega solar 14
KL Solar 30 Vikram Solar 48
Kohima Energy 50 Vinova Energy 1
Lubi Electronics 25 Vipul Enterprises 50
Kotak Urja 20 VJ Solar 5
Lanco Solar 75 Waaree Energies 250
NEASE 20 Vorks Energy 3.5
Novergy Energy 37 XL Energy Systems 15
Photonix Solar 15 Websol Solar 25
PLG Power 18
7
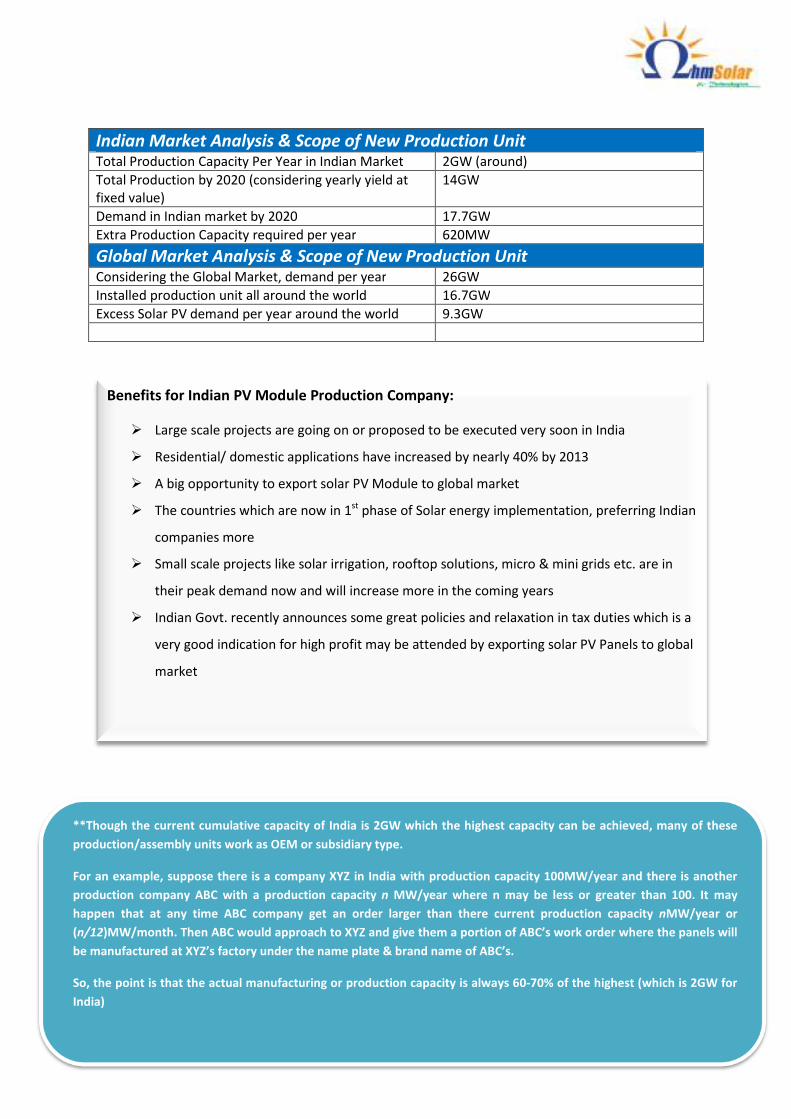
Indian Market Analysis & Scope of New Production Unit Total Production Capacity Per Year in Indian Market 2GW (around)
Total Production by 2020 (considering yearly yield at
fixed value)
14GW
Demand in Indian market by 2020 17.7GW
Extra Production Capacity required per year 620MW
Global Market Analysis & Scope of New Production Unit Considering the Global Market, demand per year 26GW
Installed production unit all around the world 16.7GW
Excess Solar PV demand per year around the world 9.3GW
Benefits for Indian PV Module Production Company:
� Large scale projects are going on or proposed to be executed very soon in India
� Residential/ domestic applications have increased by nearly 40% by 2013
� A big opportunity to export solar PV Module to global market
� The countries which are now in 1st phase of Solar energy implementation, preferring Indian
companies more
� Small scale projects like solar irrigation, rooftop solutions, micro & mini grids etc. are in
their peak demand now and will increase more in the coming years
� Indian Govt. recently announces some great policies and relaxation in tax duties which is a
very good indication for high profit may be attended by exporting solar PV Panels to global
market
**Though the current cumulative capacity of India is 2GW which the highest capacity can be achieved, many of these
production/assembly units work as OEM or subsidiary type.
For an example, suppose there is a company XYZ in India with production capacity 100MW/year and there is another
production company ABC with a production capacity n MW/year where n may be less or greater than 100. It may
happen that at any time ABC company get an order larger than there current production capacity nMW/year or
(n/12)MW/month. Then ABC would approach to XYZ and give them a portion of ABC’s work order where the panels will
be manufactured at XYZ’s factory under the name plate & brand name of ABC’s.
So, the point is that the actual manufacturing or production capacity is always 60-70% of the highest (which is 2GW for
India)
8
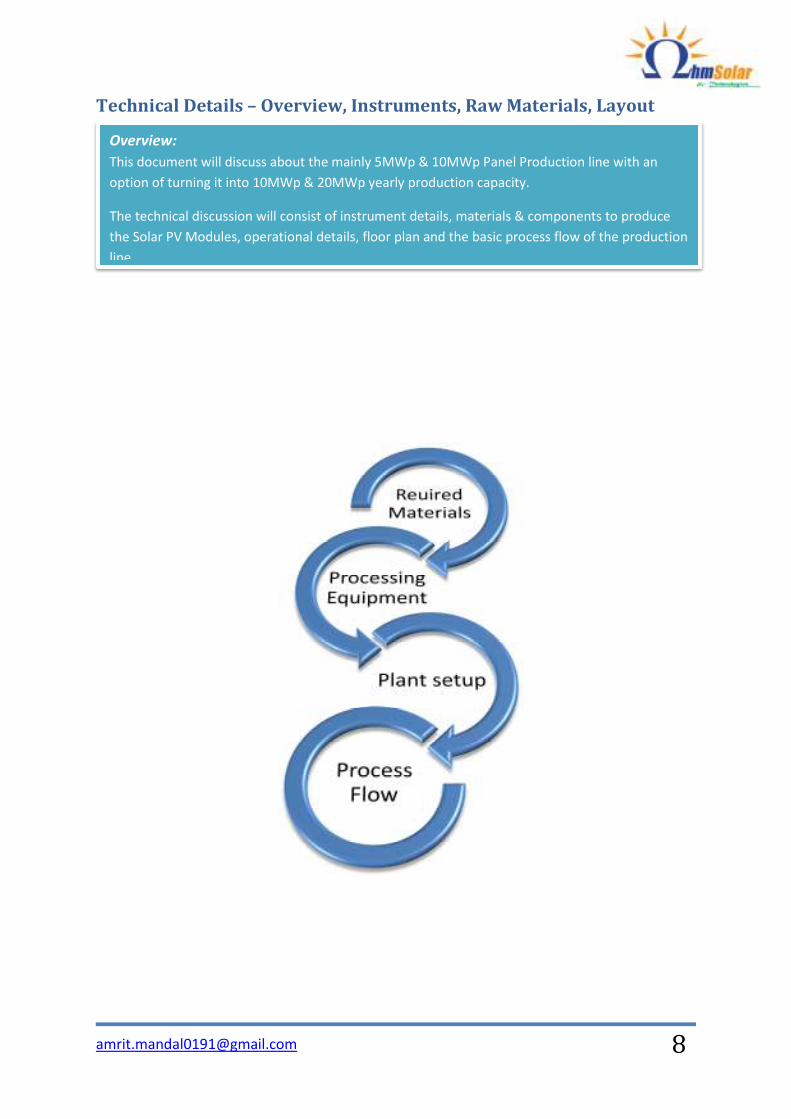
Technical Details – Overview, Instruments, Raw Materials, Layout
Overview:
This document will discuss about the mainly 5MWp & 10MWp Panel Production line with an
option of turning it into 10MWp & 20MWp yearly production capacity.
The technical discussion will consist of instrument details, materials & components to produce
the Solar PV Modules, operational details, floor plan and the basic process flow of the production
line.
9
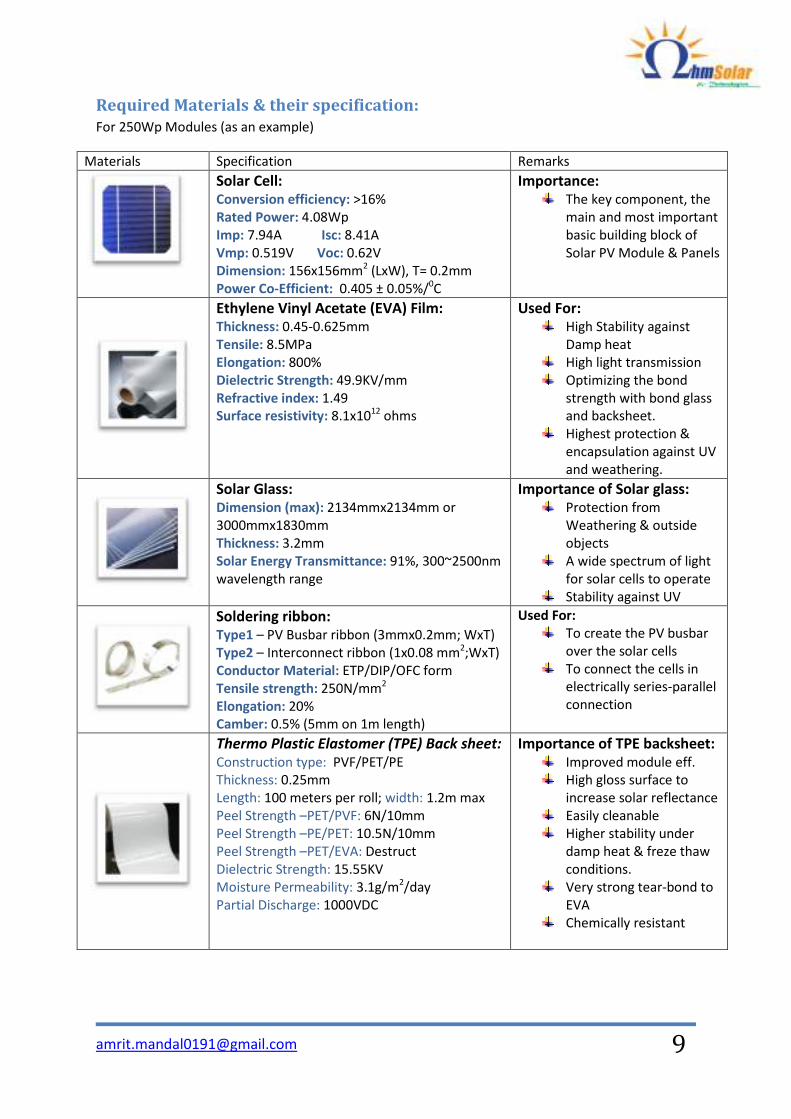
Required Materials & their specification:
For 250Wp Modules (as an example)
Materials Specification Remarks
Solar Cell: Conversion efficiency: >16%
Rated Power: 4.08Wp
Imp: 7.94A Isc: 8.41A
Vmp: 0.519V Voc: 0.62V
Dimension: 156x156mm2 (LxW), T= 0.2mm
Power Co-Efficient: 0.405 ± 0.05%/0C
Importance: The key component, the
main and most important
basic building block of
Solar PV Module & Panels
Ethylene Vinyl Acetate (EVA) Film: Thickness: 0.45-0.625mm
Tensile: 8.5MPa
Elongation: 800%
Dielectric Strength: 49.9KV/mm
Refractive index: 1.49
Surface resistivity: 8.1x10¹² ohms
Used For: High Stability against
Damp heat
High light transmission
Optimizing the bond
strength with bond glass
and backsheet.
Highest protection &
encapsulation against UV
and weathering.
Solar Glass: Dimension (max): 2134mmx2134mm or
3000mmx1830mm
Thickness: 3.2mm
Solar Energy Transmittance: 91%, 300~2500nm
wavelength range
Importance of Solar glass: Protection from
Weathering & outside
objects
A wide spectrum of light
for solar cells to operate
Stability against UV
Soldering ribbon: Type1 – PV Busbar ribbon (3mmx0.2mm; WxT)
Type2 – Interconnect ribbon (1x0.08 mm2;WxT)
Conductor Material: ETP/DIP/OFC form
Tensile strength: 250N/mm2
Elongation: 20%
Camber: 0.5% (5mm on 1m length)
Used For:
To create the PV busbar
over the solar cells
To connect the cells in
electrically series-parallel
connection
Thermo Plastic Elastomer (TPE) Back sheet:
Construction type: PVF/PET/PE
Thickness: 0.25mm
Length: 100 meters per roll; width: 1.2m max
Peel Strength –PET/PVF: 6N/10mm
Peel Strength –PE/PET: 10.5N/10mm
Peel Strength –PET/EVA: Destruct
Dielectric Strength: 15.55KV
Moisture Permeability: 3.1g/m2/day
Partial Discharge: 1000VDC
Importance of TPE backsheet:
Improved module eff.
High gloss surface to
increase solar reflectance
Easily cleanable
Higher stability under
damp heat & freze thaw
conditions.
Very strong tear-bond to
EVA
Chemically resistant
10
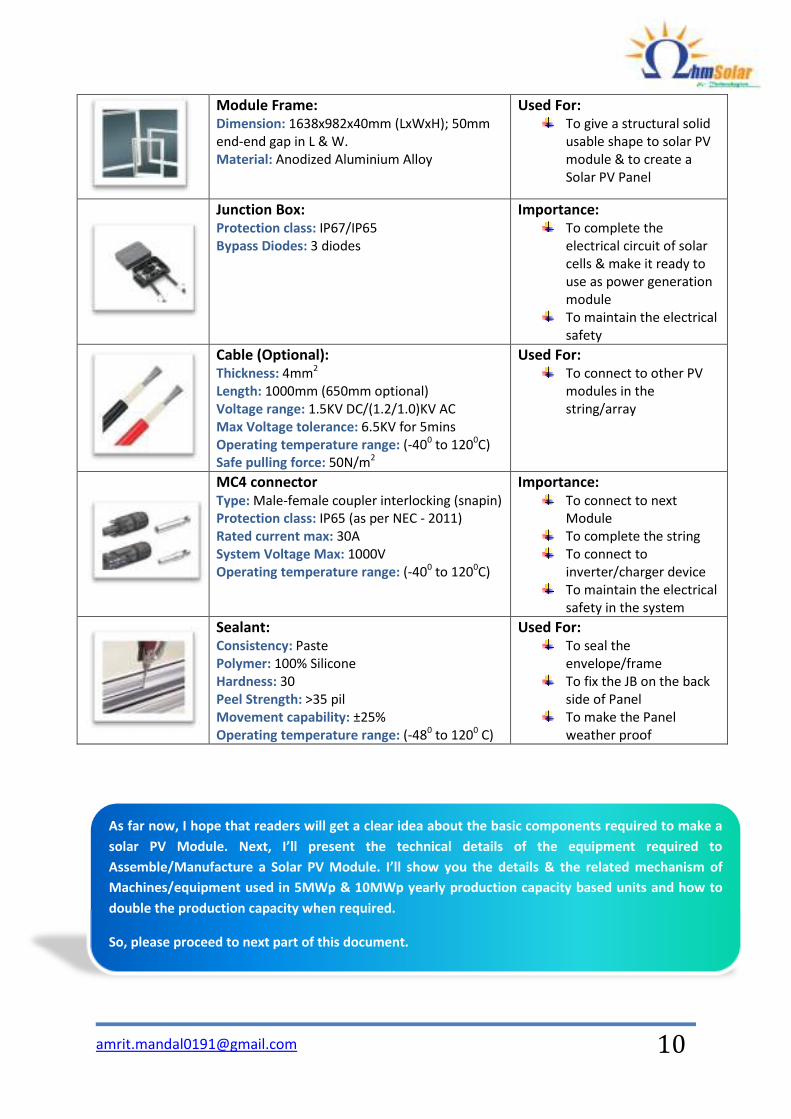
Module Frame: Dimension: 1638x982x40mm (LxWxH); 50mm
end-end gap in L & W.
Material: Anodized Aluminium Alloy
Used For: To give a structural solid
usable shape to solar PV
module & to create a
Solar PV Panel
Junction Box: Protection class: IP67/IP65
Bypass Diodes: 3 diodes
Importance: To complete the
electrical circuit of solar
cells & make it ready to
use as power generation
module
To maintain the electrical
safety
Cable (Optional): Thickness: 4mm2
Length: 1000mm (650mm optional)
Voltage range: 1.5KV DC/(1.2/1.0)KV AC
Max Voltage tolerance: 6.5KV for 5mins
Operating temperature range: (-400 to 1200C)
Safe pulling force: 50N/m2
Used For: To connect to other PV
modules in the
string/array
MC4 connector
Type: Male-female coupler interlocking (snapin)
Protection class: IP65 (as per NEC - 2011)
Rated current max: 30A
System Voltage Max: 1000V
Operating temperature range: (-400 to 1200C)
Importance:
To connect to next
Module
To complete the string
To connect to
inverter/charger device
To maintain the electrical
safety in the system
Sealant: Consistency: Paste
Polymer: 100% Silicone
Hardness: 30
Peel Strength: >35 pil
Movement capability: ±25%
Operating temperature range: (-480 to 1200 C)
Used For: To seal the
envelope/frame
To fix the JB on the back
side of Panel
To make the Panel
weather proof
As far now, I hope that readers will get a clear idea about the basic components required to make a
solar PV Module. Next, I’ll present the technical details of the equipment required to
Assemble/Manufacture a Solar PV Module. I’ll show you the details & the related mechanism of
Machines/equipment used in 5MWp & 10MWp yearly production capacity based units and how to
double the production capacity when required.
So, please proceed to next part of this document.
11
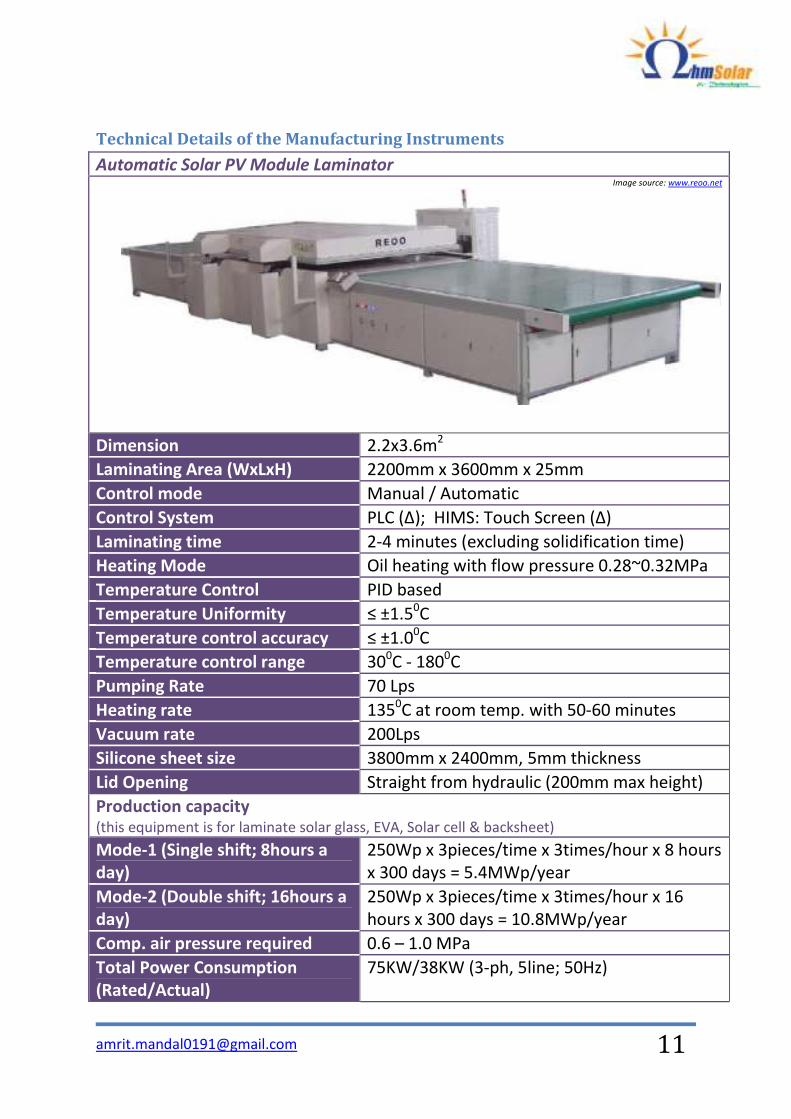
Technical Details of the Manufacturing Instruments
Automatic Solar PV Module Laminator Image source: www.reoo.net
Dimension 2.2x3.6m2
Laminating Area (WxLxH) 2200mm x 3600mm x 25mm
Control mode Manual / Automatic
Control System PLC (Δ); HIMS: Touch Screen (Δ)
Laminating time 2-4 minutes (excluding solidification time)
Heating Mode Oil heating with flow pressure 0.28~0.32MPa
Temperature Control PID based
Temperature Uniformity ≤ ±1.50C
Temperature control accuracy ≤ ±1.00C
Temperature control range 300C - 180
0C
Pumping Rate 70 Lps
Heating rate 1350C at room temp. with 50-60 minutes
Vacuum rate 200Lps
Silicone sheet size 3800mm x 2400mm, 5mm thickness
Lid Opening Straight from hydraulic (200mm max height)
Production capacity (this equipment is for laminate solar glass, EVA, Solar cell & backsheet)
Mode-1 (Single shift; 8hours a
day)
250Wp x 3pieces/time x 3times/hour x 8 hours
x 300 days = 5.4MWp/year
Mode-2 (Double shift; 16hours a
day)
250Wp x 3pieces/time x 3times/hour x 16
hours x 300 days = 10.8MWp/year
Comp. air pressure required 0.6 – 1.0 MPa
Total Power Consumption
(Rated/Actual)
75KW/38KW (3-ph, 5line; 50Hz)
12
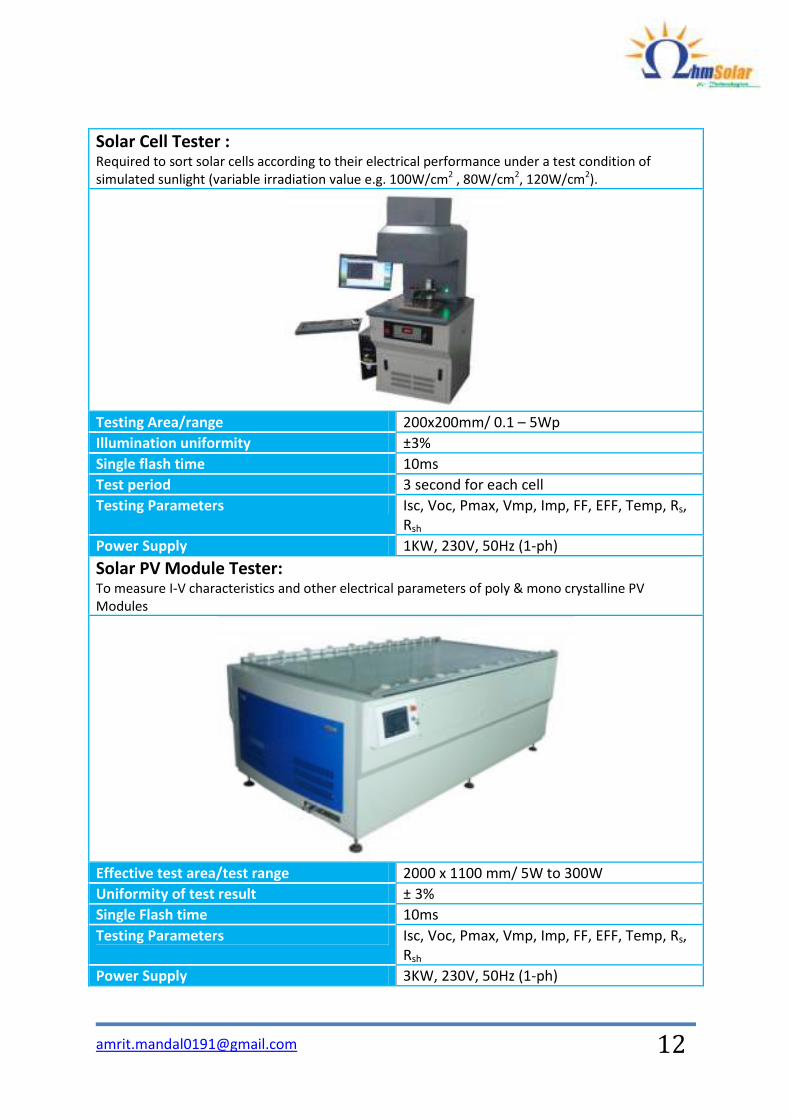
Solar Cell Tester : Required to sort solar cells according to their electrical performance under a test condition of
simulated sunlight (variable irradiation value e.g. 100W/cm2 , 80W/cm2, 120W/cm2).
Testing Area/range 200x200mm/ 0.1 – 5Wp
Illumination uniformity ±3%
Single flash time 10ms
Test period 3 second for each cell
Testing Parameters Isc, Voc, Pmax, Vmp, Imp, FF, EFF, Temp, Rs,
Rsh
Power Supply 1KW, 230V, 50Hz (1-ph)
Solar PV Module Tester: To measure I-V characteristics and other electrical parameters of poly & mono crystalline PV
Modules
Effective test area/test range 2000 x 1100 mm/ 5W to 300W
Uniformity of test result ± 3%
Single Flash time 10ms
Testing Parameters Isc, Voc, Pmax, Vmp, Imp, FF, EFF, Temp, Rs,
Rsh
Power Supply 3KW, 230V, 50Hz (1-ph)
13
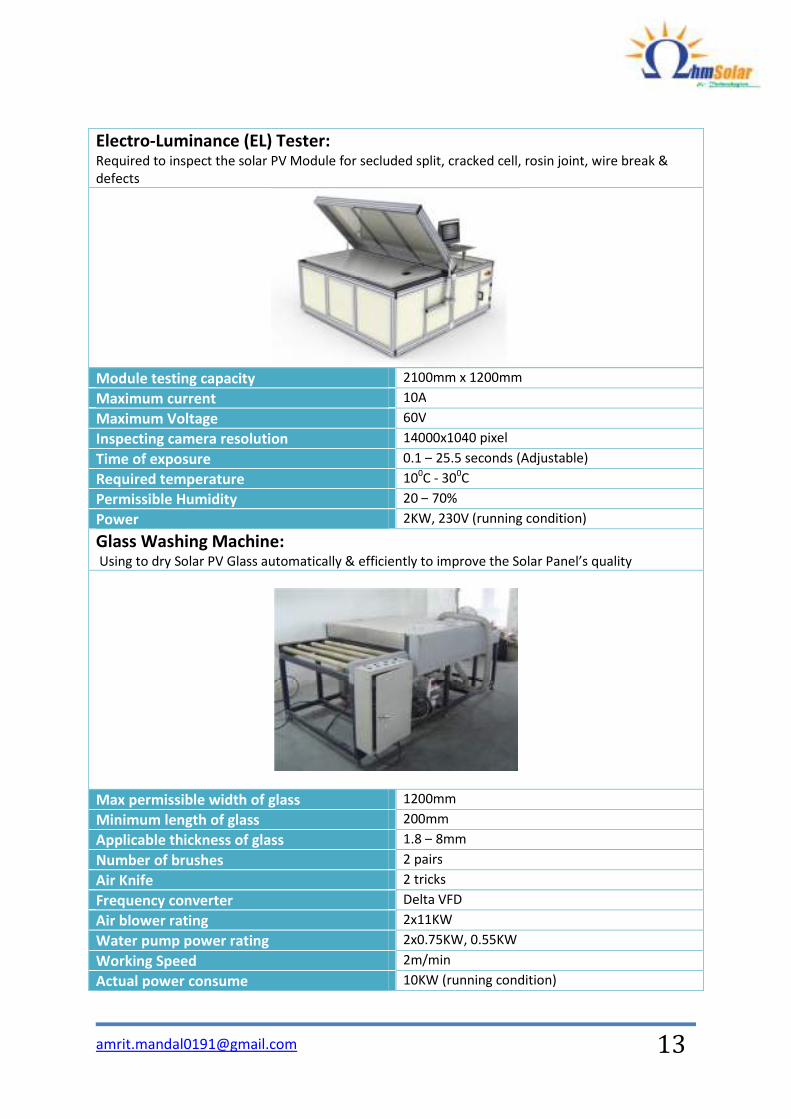
Electro-Luminance (EL) Tester: Required to inspect the solar PV Module for secluded split, cracked cell, rosin joint, wire break &
defects
Module testing capacity 2100mm x 1200mm
Maximum current 10A
Maximum Voltage 60V
Inspecting camera resolution 14000x1040 pixel
Time of exposure 0.1 – 25.5 seconds (Adjustable)
Required temperature 100C - 300C
Permissible Humidity 20 – 70%
Power 2KW, 230V (running condition)
Glass Washing Machine: Using to dry Solar PV Glass automatically & efficiently to improve the Solar Panel’s quality
Max permissible width of glass 1200mm
Minimum length of glass 200mm
Applicable thickness of glass 1.8 – 8mm
Number of brushes 2 pairs
Air Knife 2 tricks
Frequency converter Delta VFD
Air blower rating 2x11KW
Water pump power rating 2x0.75KW, 0.55KW
Working Speed 2m/min
Actual power consume 10KW (running condition)
14
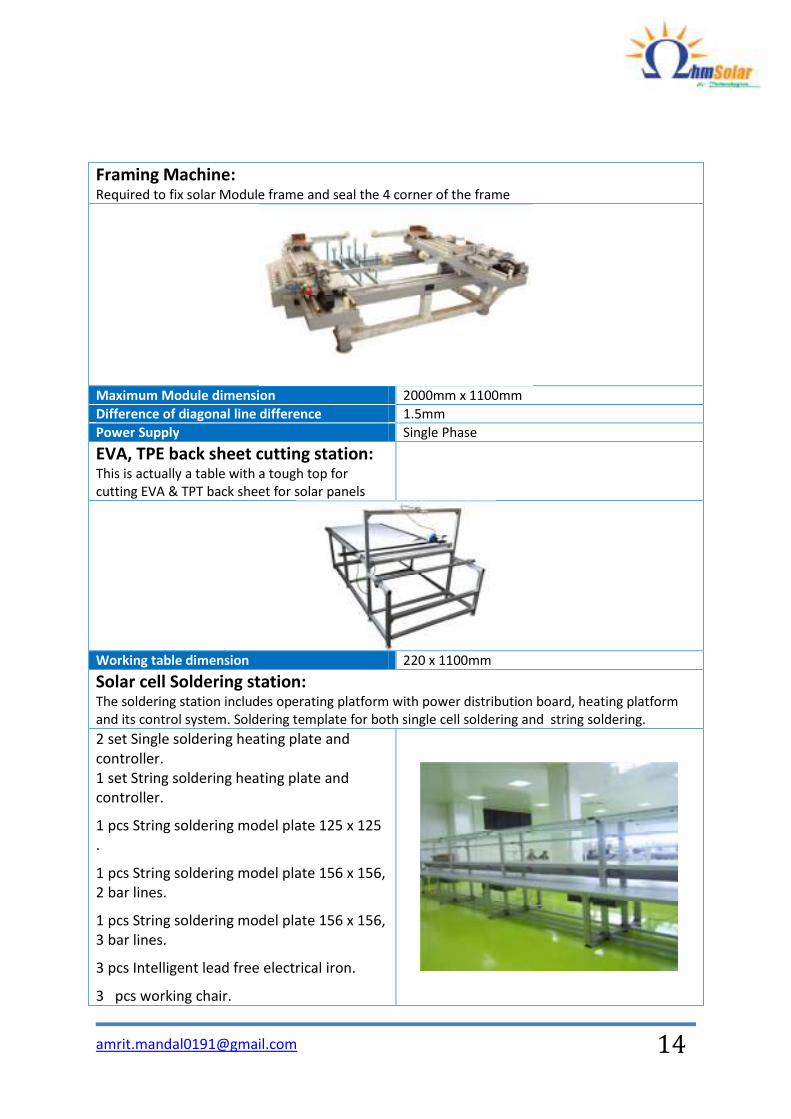
Framing Machine: Required to fix solar Module frame and seal the 4 corner of the frame
Maximum Module dimension 2000mm x 1100mm
Difference of diagonal line difference 1.5mm
Power Supply Single Phase
EVA, TPE back sheet cutting station: This is actually a table with a tough top for
cutting EVA & TPT back sheet for solar panels
Working table dimension 220 x 1100mm
Solar cell Soldering station: The soldering station includes operating platform with power distribution board, heating platform
and its control system. Soldering template for both single cell soldering and string soldering.
2 set Single soldering heating plate and
controller.
1 set String soldering heating plate and
controller. 1 pcs String soldering model plate 125 x 125
. 1 pcs String soldering model plate 156 x 156,
2 bar lines. 1 pcs String soldering model plate 156 x 156,
3 bar lines. 3 pcs Intelligent lead free electrical iron. 3 pcs working chair.
15
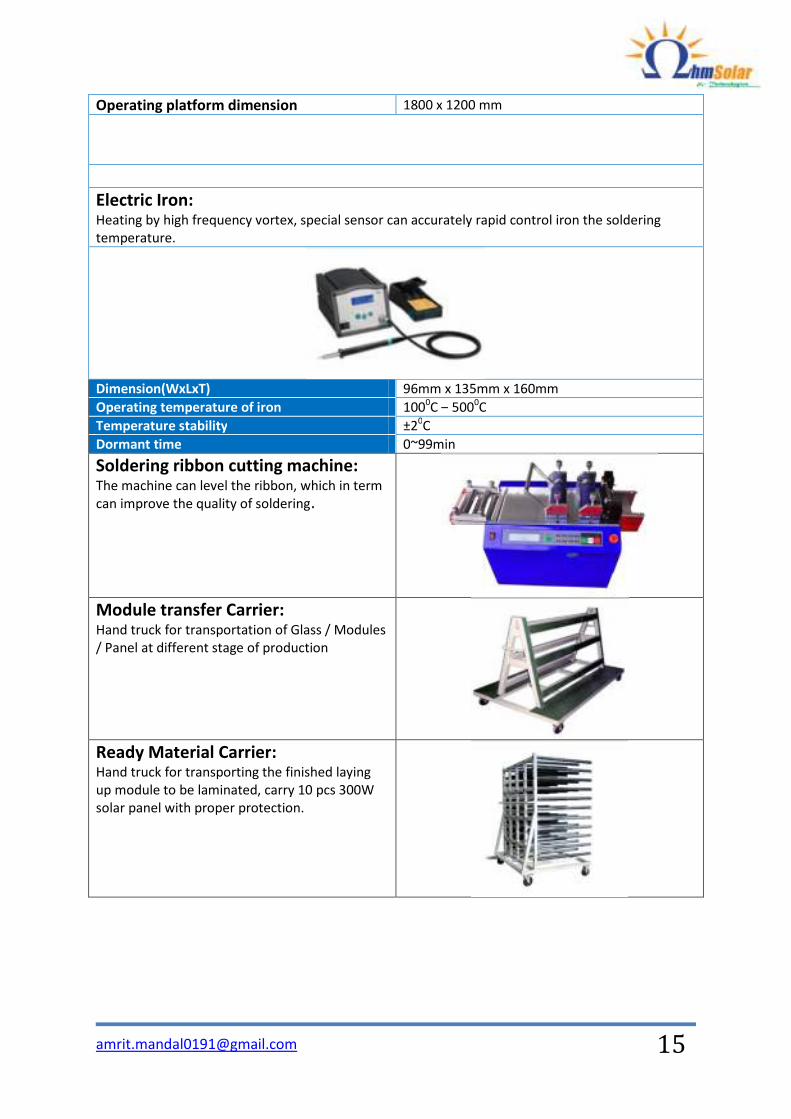
Operating platform dimension 1800 x 1200 mm
Electric Iron: Heating by high frequency vortex, special sensor can accurately rapid control iron the soldering
temperature.
Dimension(WxLxT) 96mm x 135mm x 160mm
Operating temperature of iron 1000C – 5000C
Temperature stability ±20C
Dormant time 0~99min
Soldering ribbon cutting machine: The machine can level the ribbon, which in term
can improve the quality of soldering.
Module transfer Carrier: Hand truck for transportation of Glass / Modules
/ Panel at different stage of production
Ready Material Carrier: Hand truck for transporting the finished laying
up module to be laminated, carry 10 pcs 300W
solar panel with proper protection.
16
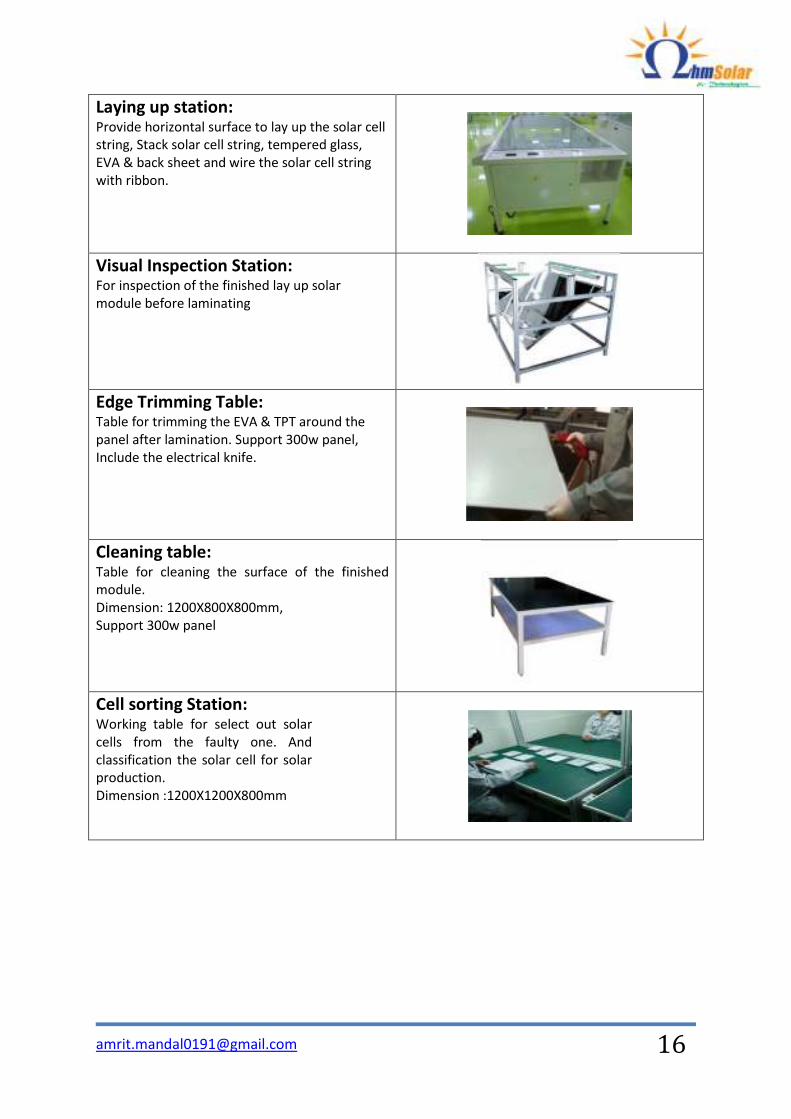
Laying up station: Provide horizontal surface to lay up the solar cell
string, Stack solar cell string, tempered glass,
EVA & back sheet and wire the solar cell string
with ribbon.
Visual Inspection Station: For inspection of the finished lay up solar
module before laminating
Edge Trimming Table: Table for trimming the EVA & TPT around the
panel after lamination. Support 300w panel,
Include the electrical knife.
Cleaning table: Table for cleaning the surface of the finished
module.
Dimension: 1200X800X800mm,
Support 300w panel
Cell sorting Station: Working table for select out solar
cells from the faulty one. And
classification the solar cell for solar
production.
Dimension :1200X1200X800mm
17
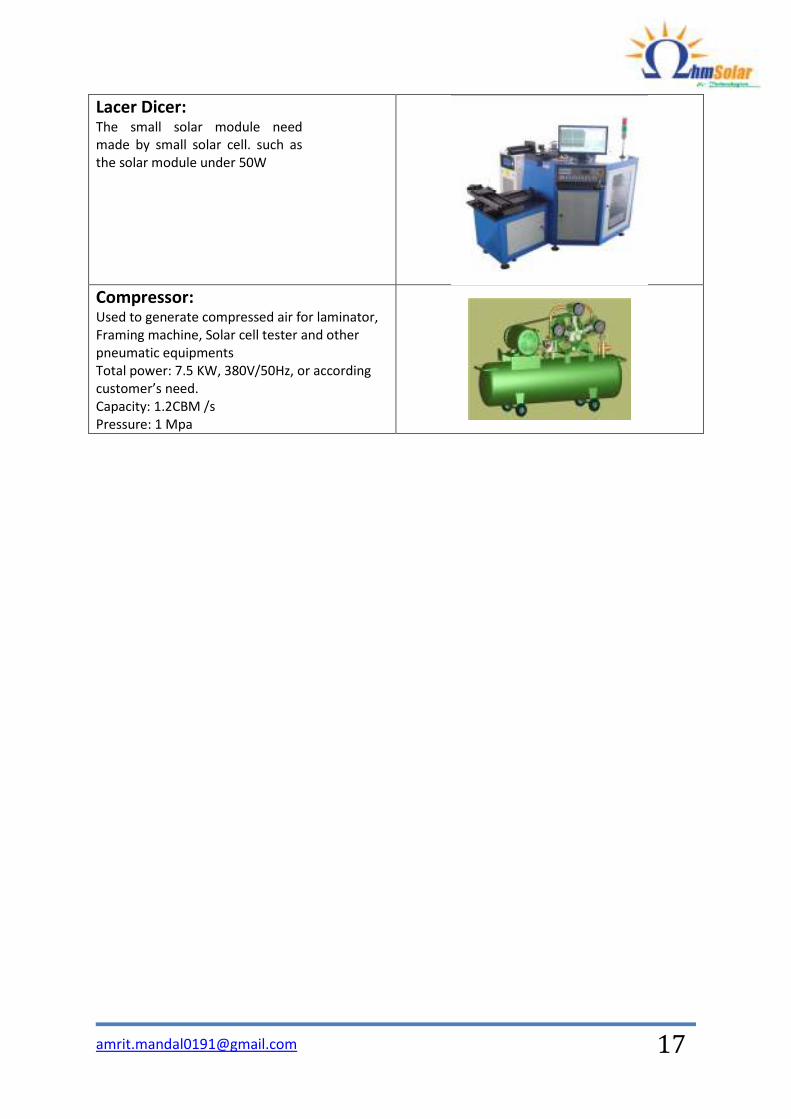
Lacer Dicer: The small solar module need
made by small solar cell. such as
the solar module under 50W
Compressor: Used to generate compressed air for laminator,
Framing machine, Solar cell tester and other
pneumatic equipments
Total power: 7.5 KW, 380V/50Hz, or according
customer’s need.
Capacity: 1.2CBM /s
Pressure: 1 Mpa
19
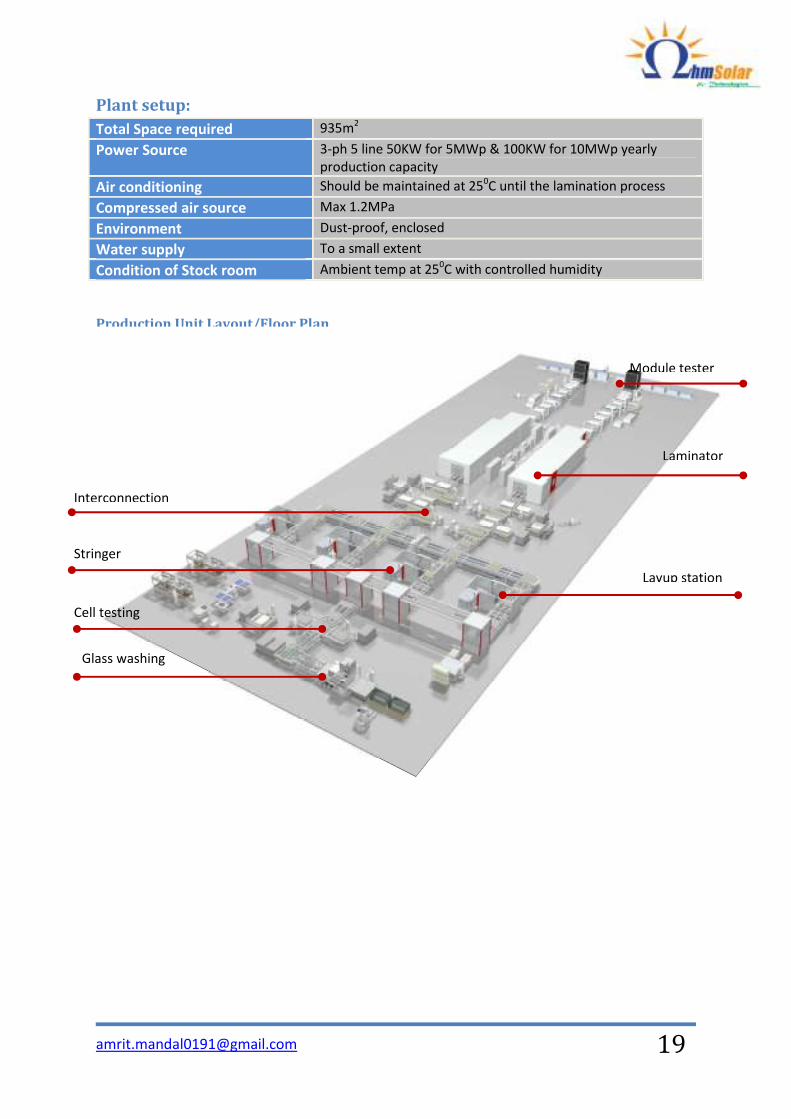
Plant setup:
Total Space required 935m2
Power Source 3-ph 5 line 50KW for 5MWp & 100KW for 10MWp yearly
production capacity
Air conditioning Should be maintained at 250C until the lamination process
Compressed air source Max 1.2MPa
Environment Dust-proof, enclosed
Water supply To a small extent
Condition of Stock room Ambient temp at 250C with controlled humidity
Production Unit Layout/Floor Plan
Interconnection
Module tester
Stringer
Laminator
Layup station
Cell testing
Glass washing
21
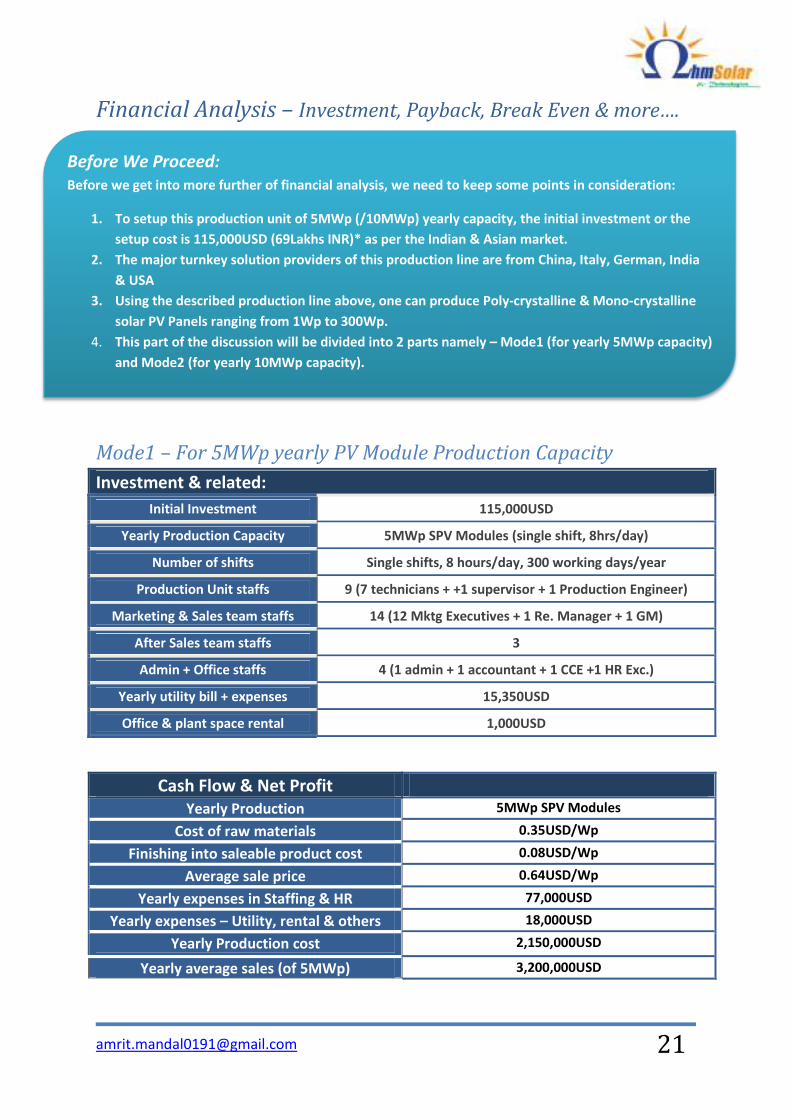
Financial Analysis – Investment, Payback, Break Even & more….
Mode1 – For 5MWp yearly PV Module Production Capacity
Investment & related:
Initial Investment 115,000USD
Yearly Production Capacity 5MWp SPV Modules (single shift, 8hrs/day)
Number of shifts Single shifts, 8 hours/day, 300 working days/year
Production Unit staffs 9 (7 technicians + +1 supervisor + 1 Production Engineer)
Marketing & Sales team staffs 14 (12 Mktg Executives + 1 Re. Manager + 1 GM)
After Sales team staffs 3
Admin + Office staffs 4 (1 admin + 1 accountant + 1 CCE +1 HR Exc.)
Yearly utility bill + expenses 15,350USD
Office & plant space rental 1,000USD
Cash Flow & Net Profit
Yearly Production 5MWp SPV Modules
Cost of raw materials 0.35USD/Wp
Finishing into saleable product cost 0.08USD/Wp
Average sale price 0.64USD/Wp
Yearly expenses in Staffing & HR 77,000USD
Yearly expenses – Utility, rental & others 18,000USD
Yearly Production cost 2,150,000USD
Yearly average sales (of 5MWp) 3,200,000USD
Before We Proceed:
Before we get into more further of financial analysis, we need to keep some points in consideration:
1. To setup this production unit of 5MWp (/10MWp) yearly capacity, the initial investment or the
setup cost is 115,000USD (69Lakhs INR)* as per the Indian & Asian market.
2. The major turnkey solution providers of this production line are from China, Italy, German, India
& USA
3. Using the described production line above, one can produce Poly-crystalline & Mono-crystalline
solar PV Panels ranging from 1Wp to 300Wp.
4. This part of the discussion will be divided into 2 parts namely – Mode1 (for yearly 5MWp capacity)
and Mode2 (for yearly 10MWp capacity).
22
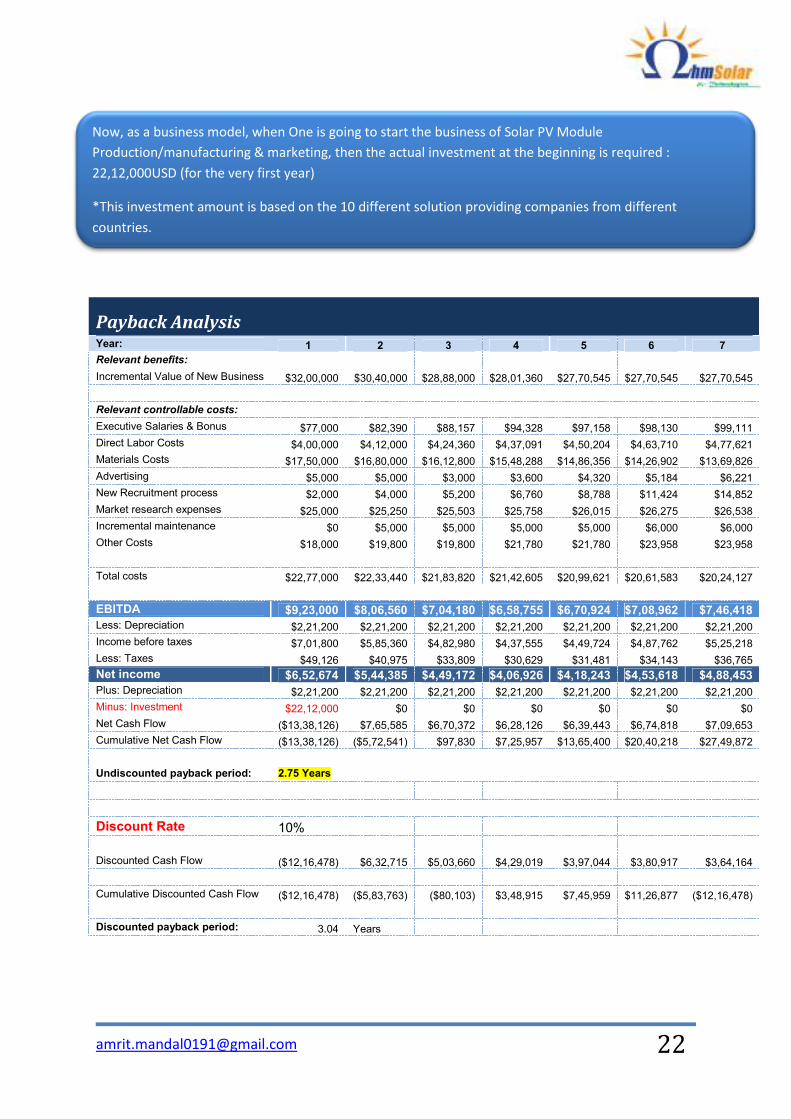
Payback Analysis Year: 1 2 3 4 5 6 7
Relevant benefits:
Incremental Value of New Business $32,00,000 $30,40,000 $28,88,000 $28,01,360 $27,70,545 $27,70,545 $27,70,545
Relevant controllable costs:
Executive Salaries & Bonus $77,000 $82,390 $88,157 $94,328 $97,158 $98,130 $99,111
Direct Labor Costs $4,00,000 $4,12,000 $4,24,360 $4,37,091 $4,50,204 $4,63,710 $4,77,621
Materials Costs $17,50,000 $16,80,000 $16,12,800 $15,48,288 $14,86,356 $14,26,902 $13,69,826
Advertising $5,000 $5,000 $3,000 $3,600 $4,320 $5,184 $6,221
New Recruitment process $2,000 $4,000 $5,200 $6,760 $8,788 $11,424 $14,852
Market research expenses $25,000 $25,250 $25,503 $25,758 $26,015 $26,275 $26,538
Incremental maintenance $0 $5,000 $5,000 $5,000 $5,000 $6,000 $6,000
Other Costs $18,000 $19,800 $19,800 $21,780 $21,780 $23,958 $23,958
Total costs $22,77,000 $22,33,440 $21,83,820 $21,42,605 $20,99,621 $20,61,583 $20,24,127
EBITDA $9,23,000 $8,06,560 $7,04,180 $6,58,755 $6,70,924 $7,08,962 $7,46,418 Less: Depreciation $2,21,200 $2,21,200 $2,21,200 $2,21,200 $2,21,200 $2,21,200 $2,21,200
Income before taxes $7,01,800 $5,85,360 $4,82,980 $4,37,555 $4,49,724 $4,87,762 $5,25,218
Less: Taxes $49,126 $40,975 $33,809 $30,629 $31,481 $34,143 $36,765
Net income $6,52,674 $5,44,385 $4,49,172 $4,06,926 $4,18,243 $4,53,618 $4,88,453 Plus: Depreciation $2,21,200 $2,21,200 $2,21,200 $2,21,200 $2,21,200 $2,21,200 $2,21,200
Minus: Investment $22,12,000 $0 $0 $0 $0 $0 $0
Net Cash Flow ($13,38,126) $7,65,585 $6,70,372 $6,28,126 $6,39,443 $6,74,818 $7,09,653
Cumulative Net Cash Flow ($13,38,126) ($5,72,541) $97,830 $7,25,957 $13,65,400 $20,40,218 $27,49,872
Undiscounted payback period: 2.75 Years
Discount Rate 10%
Discounted Cash Flow ($12,16,478) $6,32,715 $5,03,660 $4,29,019 $3,97,044 $3,80,917 $3,64,164
Cumulative Discounted Cash Flow ($12,16,478) ($5,83,763) ($80,103) $3,48,915 $7,45,959 $11,26,877 ($12,16,478)
Discounted payback period: 3.04 Years
Now, as a business model, when One is going to start the business of Solar PV Module
Production/manufacturing & marketing, then the actual investment at the beginning is required :
22,12,000USD (for the very first year)
*This investment amount is based on the 10 different solution providing companies from different
countries.
23
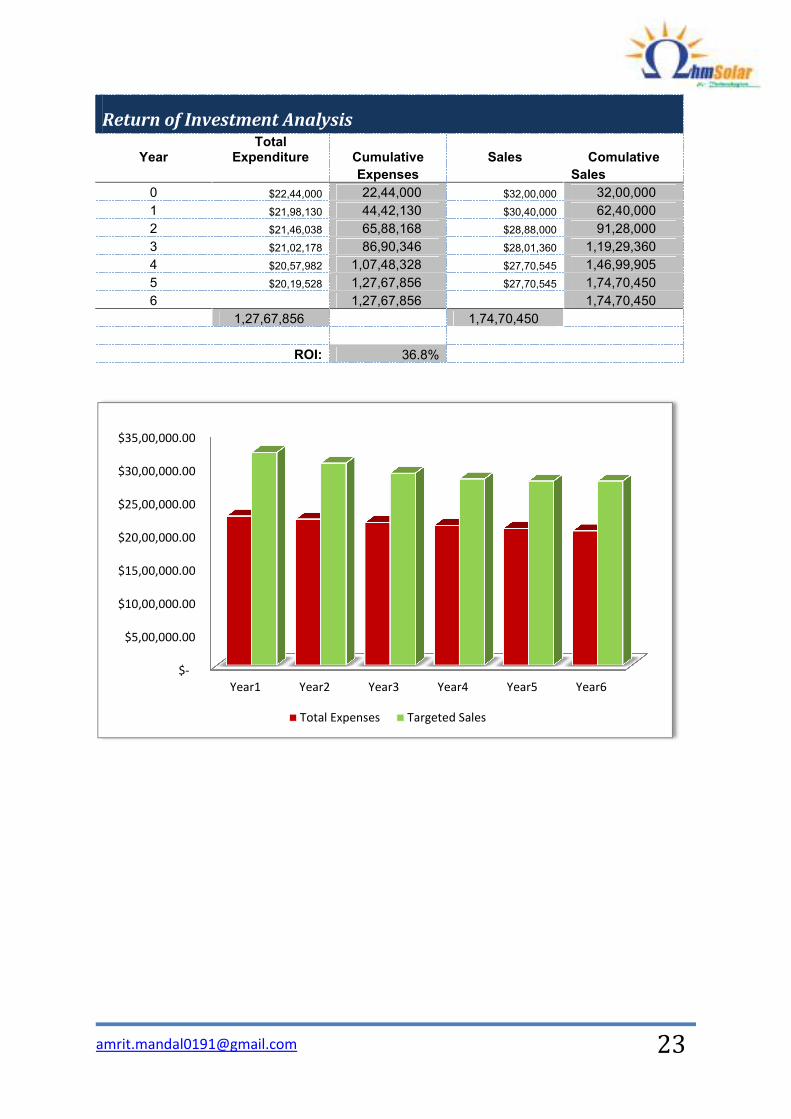
Return of Investment Analysis
Year Total
Expenditure Cumulative Sales Comulative
Expenses Sales
0 $22,44,000 22,44,000 $32,00,000 32,00,000
1 $21,98,130 44,42,130 $30,40,000 62,40,000
2 $21,46,038 65,88,168 $28,88,000 91,28,000
3 $21,02,178 86,90,346 $28,01,360 1,19,29,360
4 $20,57,982 1,07,48,328 $27,70,545 1,46,99,905
5 $20,19,528 1,27,67,856 $27,70,545 1,74,70,450
6 1,27,67,856 1,74,70,450
1,27,67,856 1,74,70,450
ROI: 36.8%
$-
$5,00,000.00
$10,00,000.00
$15,00,000.00
$20,00,000.00
$25,00,000.00
$30,00,000.00
$35,00,000.00
Year1 Year2 Year3 Year4 Year5 Year6
Total Expenses Targeted Sales
24
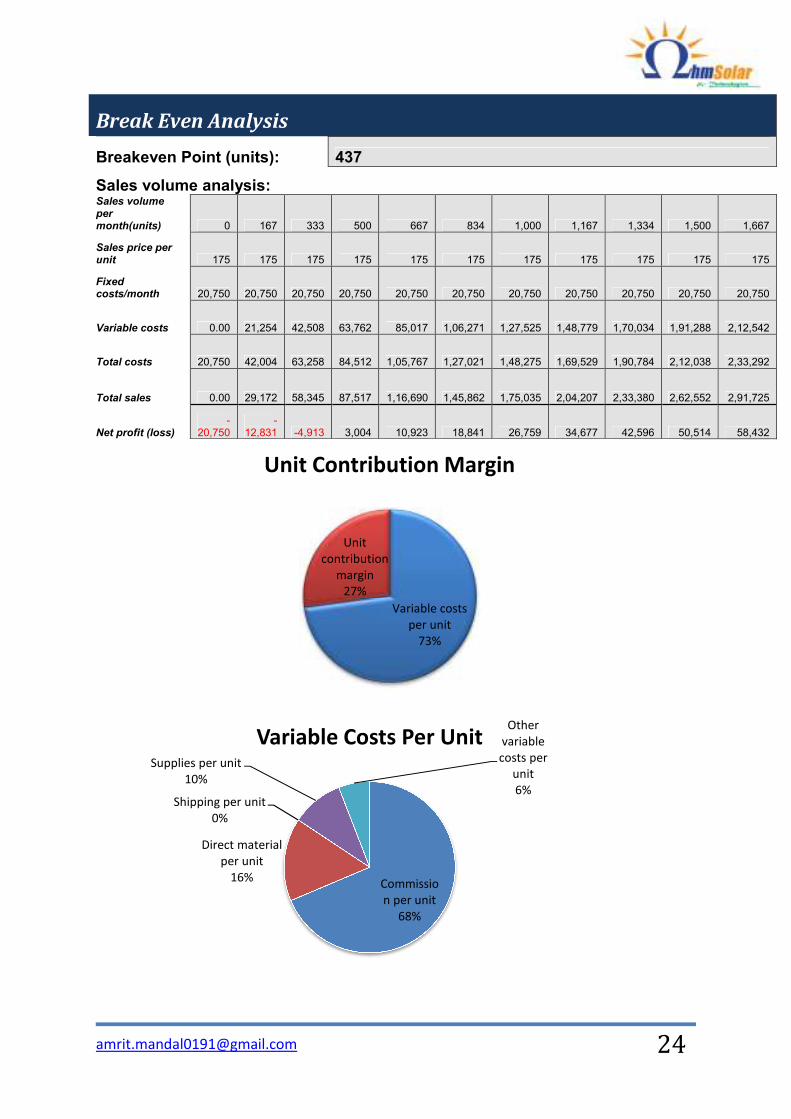
Break Even Analysis
Breakeven Point (units): 437
Sales volume analysis: Sales volume per month(units) 0 167 333 500 667 834 1,000 1,167 1,334 1,500 1,667
Sales price per unit 175 175 175 175 175 175 175 175 175 175 175
Fixed costs/month 20,750 20,750 20,750 20,750 20,750 20,750 20,750 20,750 20,750 20,750 20,750
Variable costs 0.00 21,254 42,508 63,762 85,017 1,06,271 1,27,525 1,48,779 1,70,034 1,91,288 2,12,542
Total costs 20,750 42,004 63,258 84,512 1,05,767 1,27,021 1,48,275 1,69,529 1,90,784 2,12,038 2,33,292
Total sales 0.00 29,172 58,345 87,517 1,16,690 1,45,862 1,75,035 2,04,207 2,33,380 2,62,552 2,91,725
Net profit (loss) -
20,750 -
12,831 -4,913 3,004 10,923 18,841 26,759 34,677 42,596 50,514 58,432
Variable costs
per unit
73%
Unit
contribution
margin
27%
Unit Contribution Margin
Commissio
n per unit
68%
Direct material
per unit
16%
Shipping per unit
0%
Supplies per unit
10%
Other
variable
costs per
unit
6%
Variable Costs Per Unit
25
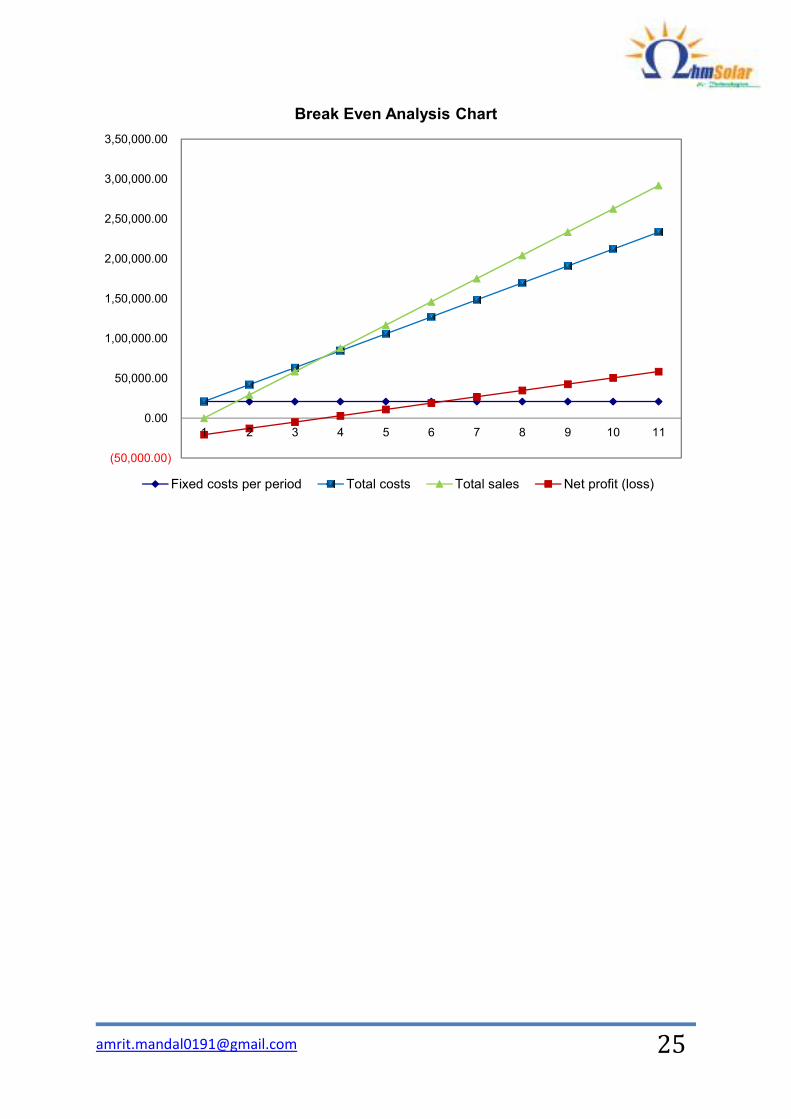
(50,000.00)
0.00
50,000.00
1,00,000.00
1,50,000.00
2,00,000.00
2,50,000.00
3,00,000.00
3,50,000.00
1 2 3 4 5 6 7 8 9 10 11
Break Even Analysis Chart
Fixed costs per period Total costs Total sales Net profit (loss)
26
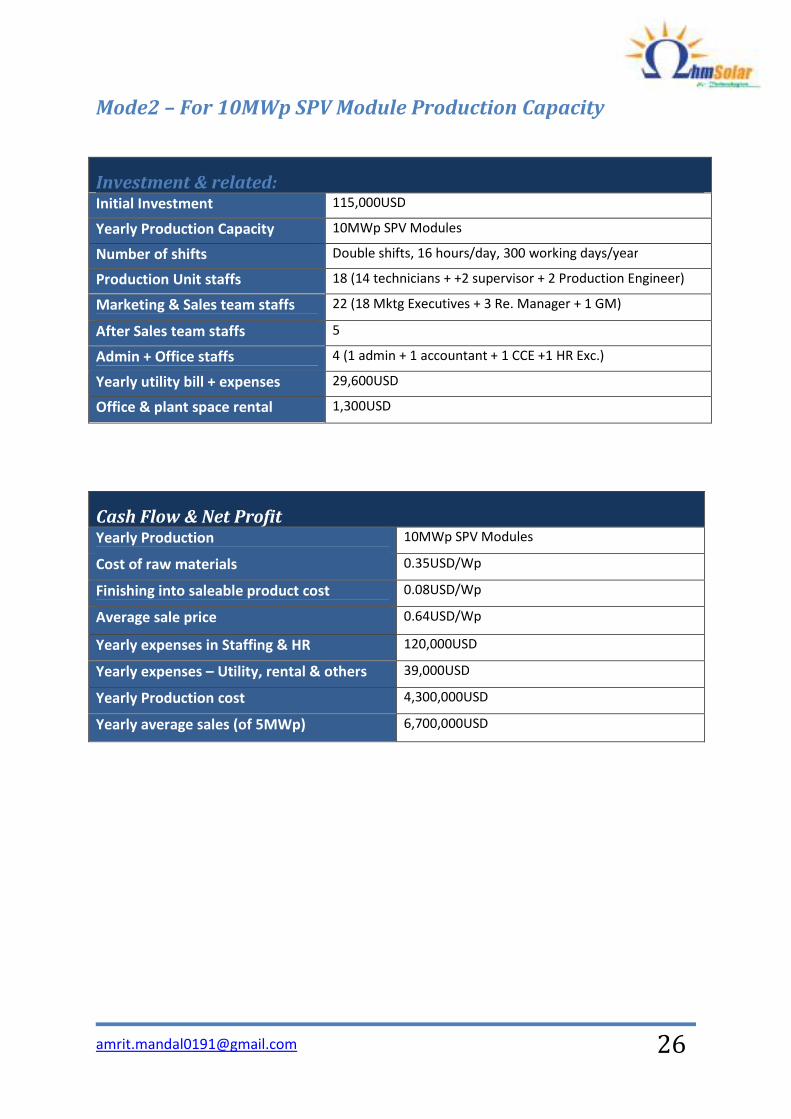
Mode2 – For 10MWp SPV Module Production Capacity
Investment & related: Initial Investment 115,000USD
Yearly Production Capacity 10MWp SPV Modules
Number of shifts Double shifts, 16 hours/day, 300 working days/year
Production Unit staffs 18 (14 technicians + +2 supervisor + 2 Production Engineer)
Marketing & Sales team staffs 22 (18 Mktg Executives + 3 Re. Manager + 1 GM)
After Sales team staffs 5
Admin + Office staffs 4 (1 admin + 1 accountant + 1 CCE +1 HR Exc.)
Yearly utility bill + expenses 29,600USD
Office & plant space rental 1,300USD
Cash Flow & Net Profit Yearly Production 10MWp SPV Modules
Cost of raw materials 0.35USD/Wp
Finishing into saleable product cost 0.08USD/Wp
Average sale price 0.64USD/Wp
Yearly expenses in Staffing & HR 120,000USD
Yearly expenses – Utility, rental & others 39,000USD
Yearly Production cost 4,300,000USD
Yearly average sales (of 5MWp) 6,700,000USD
27
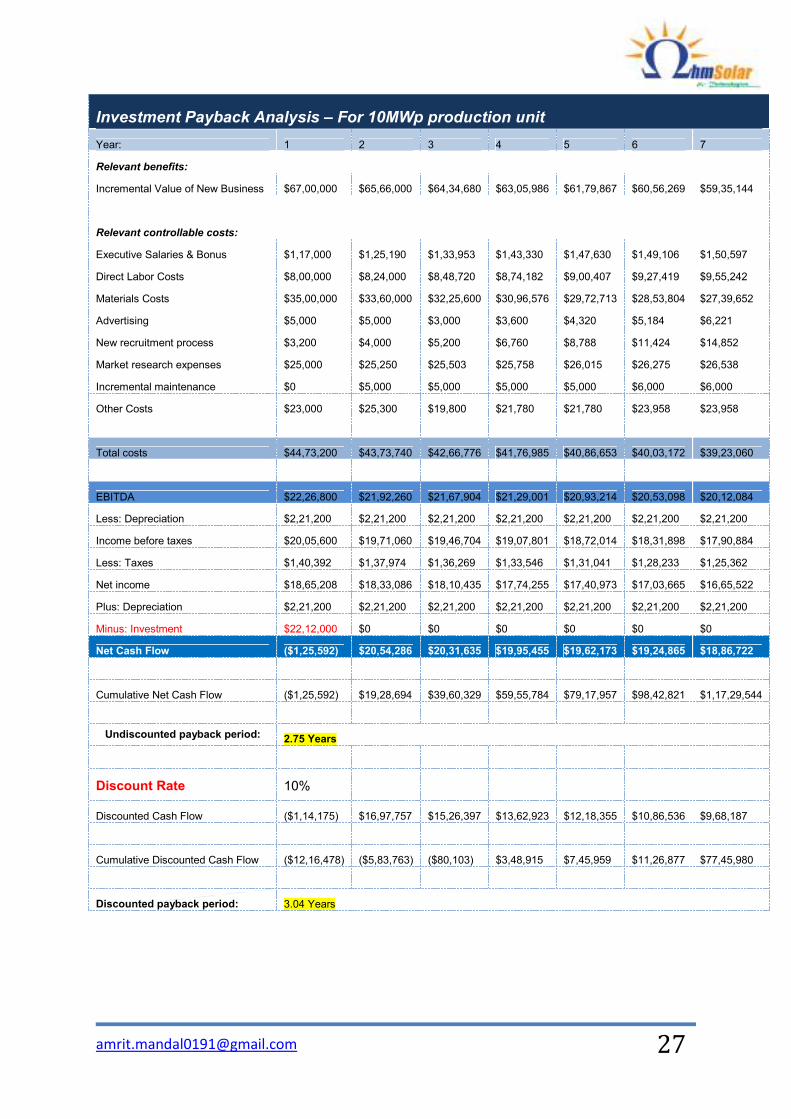
Investment Payback Analysis – For 10MWp production unit
Year: 1 2 3 4 5 6 7
Relevant benefits:
Incremental Value of New Business $67,00,000 $65,66,000 $64,34,680 $63,05,986 $61,79,867 $60,56,269 $59,35,144
Relevant controllable costs:
Executive Salaries & Bonus $1,17,000 $1,25,190 $1,33,953 $1,43,330 $1,47,630 $1,49,106 $1,50,597
Direct Labor Costs $8,00,000 $8,24,000 $8,48,720 $8,74,182 $9,00,407 $9,27,419 $9,55,242
Materials Costs $35,00,000 $33,60,000 $32,25,600 $30,96,576 $29,72,713 $28,53,804 $27,39,652
Advertising $5,000 $5,000 $3,000 $3,600 $4,320 $5,184 $6,221
New recruitment process $3,200 $4,000 $5,200 $6,760 $8,788 $11,424 $14,852
Market research expenses $25,000 $25,250 $25,503 $25,758 $26,015 $26,275 $26,538
Incremental maintenance $0 $5,000 $5,000 $5,000 $5,000 $6,000 $6,000
Other Costs $23,000 $25,300 $19,800 $21,780 $21,780 $23,958 $23,958
Total costs $44,73,200 $43,73,740 $42,66,776 $41,76,985 $40,86,653 $40,03,172 $39,23,060
EBITDA $22,26,800 $21,92,260 $21,67,904 $21,29,001 $20,93,214 $20,53,098 $20,12,084
Less: Depreciation $2,21,200 $2,21,200 $2,21,200 $2,21,200 $2,21,200 $2,21,200 $2,21,200
Income before taxes $20,05,600 $19,71,060 $19,46,704 $19,07,801 $18,72,014 $18,31,898 $17,90,884
Less: Taxes $1,40,392 $1,37,974 $1,36,269 $1,33,546 $1,31,041 $1,28,233 $1,25,362
Net income $18,65,208 $18,33,086 $18,10,435 $17,74,255 $17,40,973 $17,03,665 $16,65,522
Plus: Depreciation $2,21,200 $2,21,200 $2,21,200 $2,21,200 $2,21,200 $2,21,200 $2,21,200
Minus: Investment $22,12,000 $0 $0 $0 $0 $0 $0
Net Cash Flow ($1,25,592) $20,54,286 $20,31,635 $19,95,455 $19,62,173 $19,24,865 $18,86,722
Cumulative Net Cash Flow ($1,25,592) $19,28,694 $39,60,329 $59,55,784 $79,17,957 $98,42,821 $1,17,29,544
Undiscounted payback period: 2.75 Years
Discount Rate 10%
Discounted Cash Flow ($1,14,175) $16,97,757 $15,26,397 $13,62,923 $12,18,355 $10,86,536 $9,68,187
Cumulative Discounted Cash Flow ($12,16,478) ($5,83,763) ($80,103) $3,48,915 $7,45,959 $11,26,877 $77,45,980
Discounted payback period: 3.04 Years
28
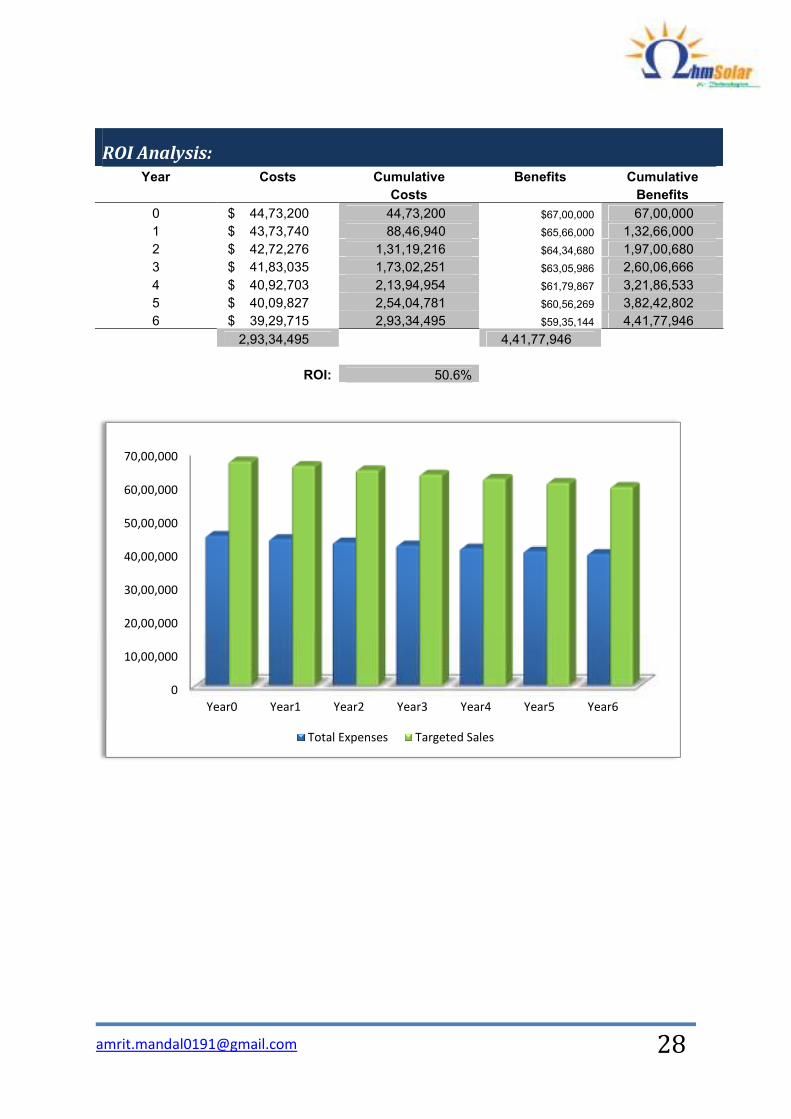
ROI Analysis:
Year Costs Cumulative Benefits Cumulative
Costs Benefits
0 $ 44,73,200 44,73,200 $67,00,000 67,00,000
1 $ 43,73,740 88,46,940 $65,66,000 1,32,66,000
2 $ 42,72,276 1,31,19,216 $64,34,680 1,97,00,680
3 $ 41,83,035 1,73,02,251 $63,05,986 2,60,06,666
4 $ 40,92,703 2,13,94,954 $61,79,867 3,21,86,533
5 $ 40,09,827 2,54,04,781 $60,56,269 3,82,42,802
6 $ 39,29,715 2,93,34,495 $59,35,144 4,41,77,946
2,93,34,495 4,41,77,946
ROI: 50.6%
0
10,00,000
20,00,000
30,00,000
40,00,000
50,00,000
60,00,000
70,00,000
Year0 Year1 Year2 Year3 Year4 Year5 Year6
Total Expenses Targeted Sales
29
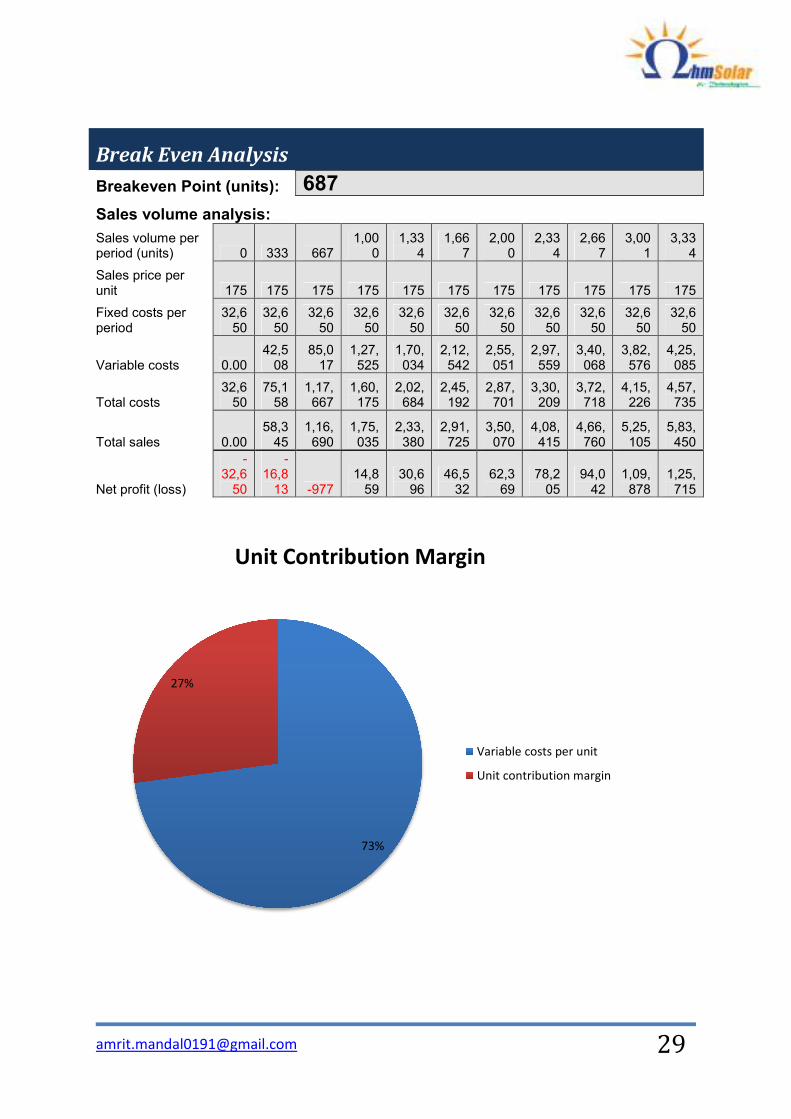
Break Even Analysis
Breakeven Point (units): 687
Sales volume analysis:
Sales volume per period (units) 0 333 667
1,000
1,334
1,667
2,000
2,334
2,667
3,001
3,334
Sales price per unit 175 175 175 175 175 175 175 175 175 175 175
Fixed costs per period
32,650
32,650
32,650
32,650
32,650
32,650
32,650
32,650
32,650
32,650
32,650
Variable costs 0.00 42,508
85,017
1,27,525
1,70,034
2,12,542
2,55,051
2,97,559
3,40,068
3,82,576
4,25,085
Total costs 32,650
75,158
1,17,667
1,60,175
2,02,684
2,45,192
2,87,701
3,30,209
3,72,718
4,15,226
4,57,735
Total sales 0.00 58,345
1,16,690
1,75,035
2,33,380
2,91,725
3,50,070
4,08,415
4,66,760
5,25,105
5,83,450
Net profit (loss)
-32,650
-16,813 -977
14,859
30,696
46,532
62,369
78,205
94,042
1,09,878
1,25,715
73%
27%
Unit Contribution Margin
Variable costs per unit
Unit contribution margin
30
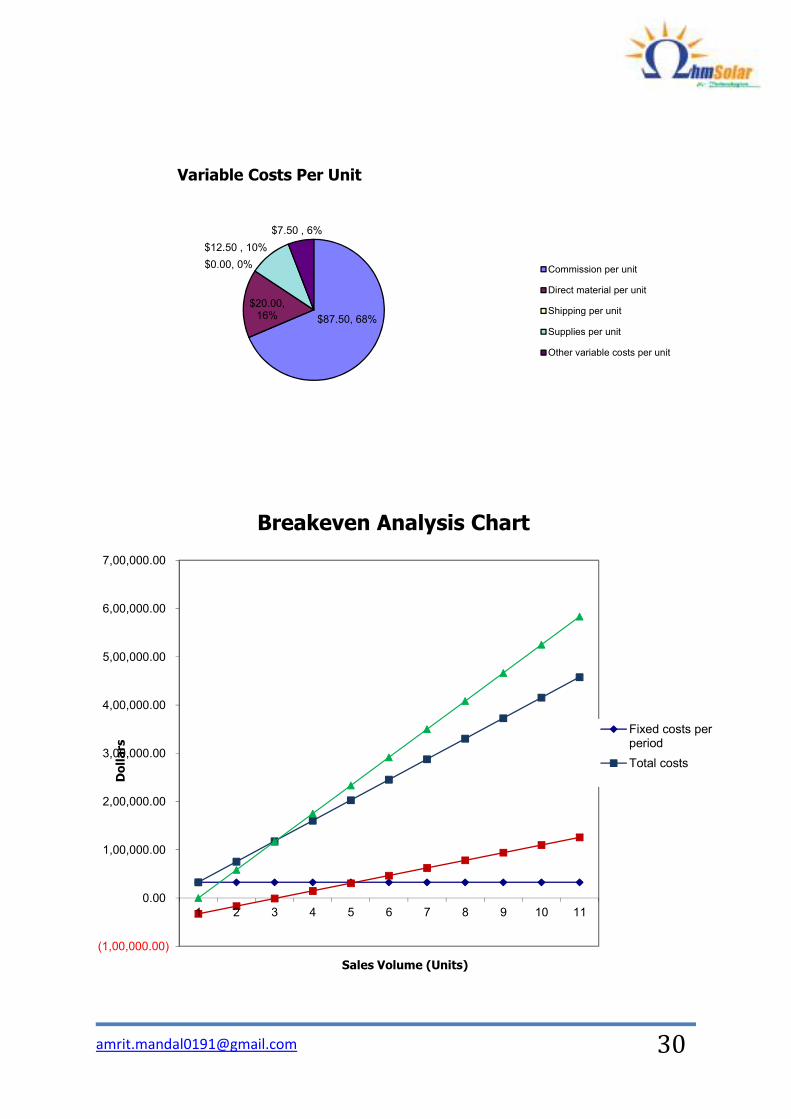
$87.50, 68%
$20.00, 16%
$0.00, 0%
$12.50 , 10%
$7.50 , 6%
Variable Costs Per Unit
Commission per unit
Direct material per unit
Shipping per unit
Supplies per unit
Other variable costs per unit
(1,00,000.00)
0.00
1,00,000.00
2,00,000.00
3,00,000.00
4,00,000.00
5,00,000.00
6,00,000.00
7,00,000.00
1 2 3 4 5 6 7 8 9 10 11
Dollars
Sales Volume (Units)
Breakeven Analysis Chart
Fixed costs perperiod
Total costs
32
About Me: Hello! Myself Amrit Mandal, Executive Director (Technical) of OhmSolar & Technologies. In my
professional career, till now I have consulted & executed quite a number of MW scale Solar PV
projects in India and abroad.
We operate from West Bengal, India & provide services related to solar PV through the world.
For any queries Contact us: [email protected]
Please feel free to contact me to clear any doubt regarding Solar work at my personal e-mail id:
Personal Profile Company Page
Amrit Mandal – LinkedIn OS&T – LinkedIn
Amrit Mandal - Facebook OS&T – Facebook
Amrit Mandal – Google+ OS&T - GoogleDrive
As a company we provide:
� Total Project consultancy for Solar Projects (Single window Solution)
� Sourcing Management services to Solar companies - for both the developer & PV
manufacturers
� Pre-feasibility studies of PV projects
� Market research for PV projects, production units and upcoming & existing PV
companies
� Owner’s engineering services for PV production line & projects
� O&M services for Large scale PV Projects