Embed Size (px)
Citation preview

LETTERS
HP1-b mobilization promotes chromatin changes thatinitiate the DNA damage responseNabieh Ayoub1, Anand D. Jeyasekharan1, Juan A. Bernal1 & Ashok R. Venkitaraman1
Minutes after DNA damage, the variant histone H2AX is phos-phorylated by protein kinases of the phosphoinositide kinasefamily, including ATM, ATR or DNA-PK1. Phosphorylated (c)-H2AX—which recruits molecules that sense or signal the presenceof DNA breaks, activating the response that leads to repair2,3—isthe earliest known marker of chromosomal DNA breakage. Herewe identify a dynamic change in chromatin that promotes H2AXphosphorylation in mammalian cells. DNA breaks swiftly mobi-lize heterochromatin protein 1 (HP1)-b (also called CBX1), a chro-matin factor bound to histone H3 methylated on lysine 9(H3K9me). Local changes in histone-tail modifications are notapparent. Instead, phosphorylation of HP1-b on amino acidThr 51 accompanies mobilization, releasing HP1-b from chro-matin by disrupting hydrogen bonds that fold its chromodomainaround H3K9me. Inhibition of casein kinase 2 (CK2), an enzymeimplicated in DNA damage sensing and repair4–6, suppressesThr 51 phosphorylation and HP1-b mobilization in living cells.CK2 inhibition, or a constitutively chromatin-bound HP1-bmutant, diminishes H2AX phosphorylation. Our findings revealan unrecognized signalling cascade that helps to initiate the DNAdamage response, altering chromatin by modifying a histone-codemediator protein, HP1, but not the code itself.
We used an enhanced green fluorescent protein (EGFP)–HP1-bfusion protein7–9 to monitor changes in the dynamic behaviour ofHP1-b after DNA breakage. In undamaged cells, fluorescence reco-very after photobleaching (FRAP), using a range of laser-light inten-sities (Supplementary Fig. 1a–d), showed that EGFP–HP1-b exhibitsdistinct molecular mobilities in euchromatin compared with hetero-chromatin7,8. Exposure of cells to ionizing radiation alters thedynamics of EGFP–HP1-b FRAP in a statistically significant manner(Fig. 1a). Recovery in both euchromatin and heterochromatin occursmore swiftly, as demonstrated by a change in the association constant,K, calculated from a single component exponential fit for the FRAPcurves (Supplementary Fig. 1e). Similar changes are induced by theclastogenic drug etoposide (data not shown). Therefore, HP1-bmobilization is not solely a response to ionizing radiation.
EGFP–HP1-b mobilization after DNA damage in euchromatin, aswell as heterochromatin, is evident using fluorescence loss in photo-bleaching (FLIP), which measures the exchange of fluorescent mole-cules between distinct regions within a cell (Supplementary Fig. 1f),and thus, their relative diffusional mobility, provided that imagingand bleaching parameters are held constant10. The changes in FLIPdynamics of EGFP–HP1-b after exposure to ionizing radiation areequivalent in euchromatin and heterochromatin, with the best-fit
1The Medical Research Council Cancer Cell Unit, Hutchison/MRC Research Centre, Hills Road, Cambridge CB2 0XZ, UK.
a
0 1 2 3 4 5 6 7 8 9 100
20406080
100
Undamaged nuclei (EC)Damaged nuclei (EC)
Damaged nuclei (HC)Undamaged nuclei (HC)
b
dTime (s)
Rel
ativ
e flu
ores
cenc
e
0 20 40 60 80 1005060708090
100110
0 20 40 60 80 1005060708090
100110
20 40 60 120 240
Time (s) after damage
0
0 4 8 12 160
0.20.40.60.81.0
HCDamaged (HC)
e
Pre-damage
DNA (live cell)
After damage
DNA (live cell) HP1-β (fixed)
fc
Time (s) Time (s)
Time (s)
Undamagednuclei (HC)Damaged nuclei (HC)
Undamagednuclei (EC)Damaged nuclei (EC)
Rel
ativ
e flu
ores
cenc
e
Rel
ativ
e flu
ores
cenc
e
5
60
90
EG
FP–H
P1-
β
Time(min)after
damage
Rel
ativ
e flu
ores
cenc
e
Figure 1 | Alterations in HP1-b dynamics and localization accompany itsmobilization after DNA damage. a, Representation of the FRAP recoverycurves (n 5 7) of EGFP–HP1-b in euchromatin/nucleoplasm (EC) orheterochromatin (HC), before and after DNA damage by 10 Gy ionizingradiation, fitted (solid lines) to a single component exponential (dotted linesshow 95% confidence intervals). Relative fluorescence intensity is plotted (yaxis) against time (x axis). b, c, FLIP decay curves (n 5 7) for euchromatinand heterochromatin before and after DNA damage, defining theacceleration in mobility of the EGFP–HP1-b protein after damage. The solidlines represent a single order polynomial fit of the data. d, Changes in theabundance and distribution of EGFP–HP1-b immediately after the
induction of laser-induced DNA damage in a single heterochromatin focus(white circle). The area bounded by the orange square is enlarged below eachpanel. e, FRAP curves for EGFP–HP1-b in heterochromatin before and afterDNA damage (n 5 10). f, Changes in endogenous HP1-b at defined timepoints (rows) after the induction of DNA damage to a heterochromatinfocus. Hoechst staining of a live cell immediately before, and after, laserdamage is shown in the first two columns. The third column shows the samecell after fixation and immunostaining for HP1-b. The area marked by theyellow arrow has been enlarged at the upper left corner of each frame. Allresults are typical of .3 independent experiments. Where shown, error barsrepresent s.e.m.
Vol 453 | 29 May 2008 | doi:10.1038/nature06875
682Nature Publishing Group©2008

decay constant increasing from 0.4 6 0.01 (s.e.m.) to 0.55 6 0.01 ineach (P , 0.05, n 5 7, t-test), confirming exchange between the twocompartments and suggesting that a similar mechanism causesmobilization in both (Fig. 1b, c).
We precisely targeted DNA double-strand breaks (DSBs), markedby c-H2AX formation and 53BP1 recruitment, to specific living cells
or discrete regions within a single nucleus (Supplementary Fig. 2a–c),using a 405-nm laser11. Damage to a single heterochromatin focus(Fig. 1d, circled white) swiftly disperses EGFP–HP1-b, inciting localrearrangement and spreading within 20 s (Fig. 1d and SupplementaryMovies 1 and 2), but with little overall variation in DNA staining(Supplementary Fig. 2d), distinct from reported changes in GFP-tagged histone H2B12. The FRAP dynamics of EGFP–HP1-b changeslocally at damage sites (Fig. 1e). Endogenous HP1-b visualized byimmunofluorescence is also rearranged and dispersed from adamaged heterochromatin focus within 5 min after DNA damage,to re-accumulate gradually over 90 min (Fig. 1f), consistent with aphysiological response to DNA breakage and repair.
HP1-b localizes to chromatin via its direct interaction withH3K9me (Supplementary Fig. 3a). Unexpectedly, neither the distri-bution nor abundance of H3K9me3 staining is altered after DNAdamage. This is also true for trimethylation of histone H3 on lysine4 (H3K4me3) (Supplementary Fig. 3b), and acetylation of histoneH3 on lysines 14 or 18 (ref. 13) or acetylation of histone H4 on lysine16 (Supplementary Fig. 3c). Thus, it seems unlikely that alterations inthe histone code mobilize HP1-b after DNA damage. Instead, mobili-zation may result from changes in HP1-b itself, akin to previousreports14,15.
Substitution of eight putative phosphorylation sites in HP1-baffected neither the localization nor the damage-induced dispersalof EGFP–HP1-b from heterochromatic foci (Supplementary Fig. 4).By contrast, alteration of Thr 51 in the HP1-b chromodomain eitherto Ala or to Glu (respectively expected to preclude, or mimic, phos-phorylation) suffices to distribute mutant EGFP–HP1-b diffuselythroughout the nucleus (Fig. 2a) and to confer rapid dynamics inFRAP (Fig. 2b). Similarly, replacement of the corresponding residue,Thr 50, in human HP1-a (Supplementary Fig. 5a) excludes HP1-afrom heterochromatin (Supplementary Fig. 5b).
Thr 51 is evolutionarily conserved (Supplementary Fig. 6a). Thestructure of the HP1-b chromodomain (Fig. 2c), modelled from aDrosophila melanogaster HP1–H3K9me complex16, reveals that thehydroxyl moiety in the Thr 51 side chain participates in a hydrogen-bond network essential for complex formation. Phosphorylation orreplacement of Thr 51 is expected to disrupt this hydrogen-bondnetwork (Fig. 2c), diminishing the capacity of HP1-b to bind tochromatin via H3K9me3. Indeed, whereas His-tagged HP1-b (His–HP1-b) effectively pulls down the four core histones from cellextracts (Fig. 2d), mutant His–HP1-b(T51A) does not. Moreover,His–HP1-b and its Ser70Ala mutant both bind efficiently to histoneH3K9me3 from chromatin, although mutant His–HP1-b(T51A)does not (Fig. 2e). Thus, Thr 51 modification suffices to releaseHP1-b from chromatin, although additional, DNA-damage-inducedchanges could also assist.
In human HP1-b, Thr 51 lies within an atypical phospho-acceptorsite for CK2 (Supplementary Fig. 6b)17, divergent from the consensusSer/Thr-X-X-Asp/Glu. Indeed, recombinant (r) CK2 can phospho-rylate the wild-type HP1-b chromodomain (but not its T51A mutantform), confirming that this residue is a specific target (Supple-mentary Fig. 6c–e). An antibody specific to the phosphopeptideSDEDN(pThr)WEPEEC reacts in vitro with recombinant HP1-bwild-type protein solely after exposure to rCK2, but not with theT51A mutant (Supplementary Fig. 6f). In vivo, the antibody reactswith the wild-type but not the mutant protein (Supplementary Fig.7a). This reactivity increases after etoposide-induced DNA damage,with kinetics parallel to c-H2AX formation.
Phosphorylation of the HP1 chromodomain on Thr 51 by rCK2releases it from binding to a fluorescein-tagged H3K9me2 peptide(Fig. 2f). The fluorescent peptide is pulled down by the HP1 chro-modomain, but not by its T51A mutant. Thr 51 phosphorylation byrCK2 (Fig. 2g) diminishes binding of the fluorescent H3K9me2 pep-tide to background levels.
In cells treated with isoform-specific short interfering (si)RNAstargeting HP1-b, diminished HP1-b expression corresponds with
bDNA EGFP–HP1-β Merge
0 5 10 150
0.2
0.4
0.6
0.8
1.0
HP1-β(T51A)
EC
Thr51
Glu53
Trp42
Ala51Glu53
Trp42
Glu51
Glu53
Trp42Wild type
T51A mutant
T51E mutant
K9me2
K9me2
K9me2
c
a
Time (s)
d His–HP1-β WT His–HP1-β(T51A)
10
1520
(kD
a)
Corehistones
His pull down
25His–HP1-β WTCy NuNu ChChCy
HP1-βH3
H3K9me3
His–HP1-β
His pull downeHP1-β WT S70A T51A
f
HP1-β-C
D
WTT51A
WT
0 0.2 0.4 0.6 0.8 1.0
FITC–H3K
9me2
–
WT
+++++
–––
++
–––
+–
rCK2
ATP
Normalized fluorescence intensity
grCK2ATP
HP1-β-CD
Anti-HP1-β(T51P)
WT T51A WT WT+++ +FITC–H3K9me2
++–––– – +
Coomassie
Rel
ativ
e flu
ores
cenc
e
T51A
T51E
WT
Figure 2 | Thr 51 substitution or phosphorylation alter the localization anddynamics of HP1-b by disrupting a hydrogen-bond network essential for theHP1–H3K9me interaction. a, Localization of wild-type (WT) EGFP–HP1-b(top panel) or mutant forms in which Thr 51 in the chromodomain has beenreplaced with alanine (T51A, middle panel) or glutamic acid (T51E, bottompanel). b, The dynamic behaviour of EGFP–HP1-b(T51A) measured byFRAP is similar to the high mobility of EGFP–HP1-b in euchromatin regions.Fluorescence recovery (relative fluorescence intensity, y axis) afterphotobleaching is shown over time (n 5 10). Error bars represent s.d. c, Amodel for the interaction of the wild-type human HP1-b chromodomainbound to methylated K9 of histone H3 (K9me2), based on the PDBcoordinates 1KNA, compared with its T51A and T51E mutants. A network ofhydrogen bonds between the side chains of Glu 53, Thr 51 and Trp 42 of thehuman HP1-b chromodomain, marked as yellow dashed lines, is disrupted inthe T51A and T51E mutants. d, Cytoplasmic (Cy), nuclear soluble (Nu) orchromatin-bound (Ch) proteins pulled down with His-tagged HP1-b wild-type or T51A mutant proteins in a Coomassie-stained 12% SDS–PAGE gel.The identity of the four core histones, pulled down by the wild-type but notthe T51A mutant protein, was confirmed by mass spectrometry (data notshown). e, Western blot analysis of proteins pulled down with His-taggedHP1-b wild-type, S70A or T51A mutant proteins in nuclear extracts. Blotswere probed with antibodies against HP1-b (top row), histone H3 (middlerow) or histone H3K9me3 (bottom row). The S70A mutant, whoselocalization and dispersal after DNA damage are indistinguishable from thewild-type protein, serves as a control. All three variants equally pull downendogenous HP1-b. f, g, Interaction of the HP1-b chromodomain withmethylated H3K9 is disrupted by CK2 phosphorylation on Thr 51.f, Fluorescence intensities (x axis) of a fixed volume of glutathione beads usedto pull down a FITC–H3K9me2 peptide incubated with the differentGST–HP1-b chromodomain fusion proteins listed (n 5 3, error barsrepresent s.e.m.). Decreased peptide binding (that is, fluorescence intensity)occurs when the GST–HP1-b chromodomain is phosphorylated on Thr 51, asdemonstrated in g by probing protein eluted from the glutathione beads withanti-HP1-b(T51P). Equal loading of GST–HP1-b chromodomain in eachtrack is shown by Coomassie staining.
NATURE | Vol 453 | 29 May 2008 LETTERS
683Nature Publishing Group©2008
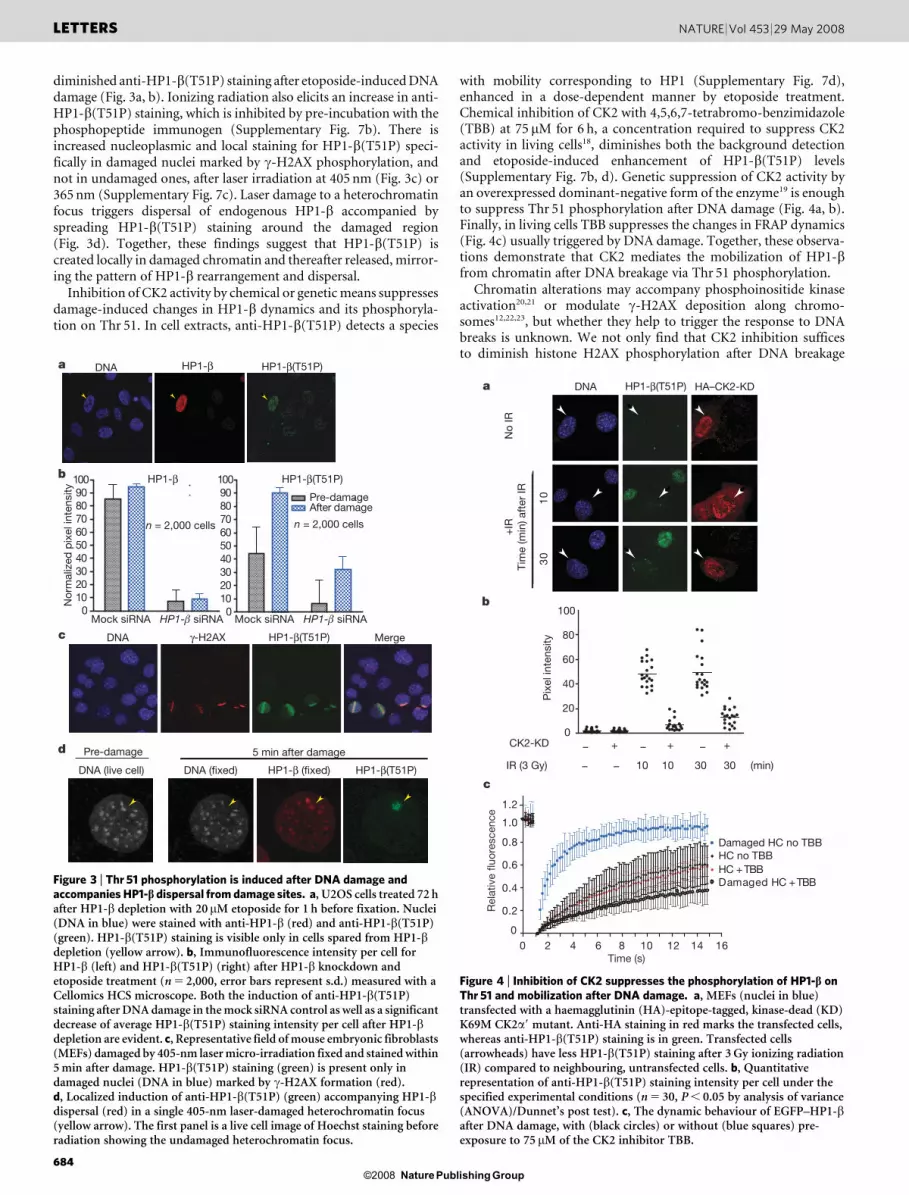
diminished anti-HP1-b(T51P) staining after etoposide-induced DNAdamage (Fig. 3a, b). Ionizing radiation also elicits an increase in anti-HP1-b(T51P) staining, which is inhibited by pre-incubation with thephosphopeptide immunogen (Supplementary Fig. 7b). There isincreased nucleoplasmic and local staining for HP1-b(T51P) speci-fically in damaged nuclei marked by c-H2AX phosphorylation, andnot in undamaged ones, after laser irradiation at 405 nm (Fig. 3c) or365 nm (Supplementary Fig. 7c). Laser damage to a heterochromatinfocus triggers dispersal of endogenous HP1-b accompanied byspreading HP1-b(T51P) staining around the damaged region(Fig. 3d). Together, these findings suggest that HP1-b(T51P) iscreated locally in damaged chromatin and thereafter released, mirror-ing the pattern of HP1-b rearrangement and dispersal.
Inhibition of CK2 activity by chemical or genetic means suppressesdamage-induced changes in HP1-b dynamics and its phosphoryla-tion on Thr 51. In cell extracts, anti-HP1-b(T51P) detects a species
with mobility corresponding to HP1 (Supplementary Fig. 7d),enhanced in a dose-dependent manner by etoposide treatment.Chemical inhibition of CK2 with 4,5,6,7-tetrabromo-benzimidazole(TBB) at 75 mM for 6 h, a concentration required to suppress CK2activity in living cells18, diminishes both the background detectionand etoposide-induced enhancement of HP1-b(T51P) levels(Supplementary Fig. 7b, d). Genetic suppression of CK2 activity byan overexpressed dominant-negative form of the enzyme19 is enoughto suppress Thr 51 phosphorylation after DNA damage (Fig. 4a, b).Finally, in living cells TBB suppresses the changes in FRAP dynamics(Fig. 4c) usually triggered by DNA damage. Together, these observa-tions demonstrate that CK2 mediates the mobilization of HP1-bfrom chromatin after DNA breakage via Thr 51 phosphorylation.
Chromatin alterations may accompany phosphoinositide kinaseactivation20,21 or modulate c-H2AX deposition along chromo-somes12,22,23, but whether they help to trigger the response to DNAbreaks is unknown. We not only find that CK2 inhibition sufficesto diminish histone H2AX phosphorylation after DNA breakage
HP1-β(T51P)HP1-βDNAa
0102030405060708090100
0102030405060708090100
Pre-damageAfter damage
HP1-β HP1-β(T51P)
Mock siRNA HP1-b siRNA Mock siRNA HP1-b siRNA
Nor
mal
ized
pix
el in
tens
ity
n = 2,000 cells n = 2,000 cells
b
Pre-damage
DNA (live cell)
5 min after damage
DNA (fixed) HP1-β (fixed) HP1-β(T51P)
DNA γ-H2AX MergeHP1-β(T51P)c
d
Figure 3 | Thr 51 phosphorylation is induced after DNA damage andaccompanies HP1-b dispersal from damage sites. a, U2OS cells treated 72 hafter HP1-b depletion with 20mM etoposide for 1 h before fixation. Nuclei(DNA in blue) were stained with anti-HP1-b (red) and anti-HP1-b(T51P)(green). HP1-b(T51P) staining is visible only in cells spared from HP1-bdepletion (yellow arrow). b, Immunofluorescence intensity per cell forHP1-b (left) and HP1-b(T51P) (right) after HP1-b knockdown andetoposide treatment (n 5 2,000, error bars represent s.d.) measured with aCellomics HCS microscope. Both the induction of anti-HP1-b(T51P)staining after DNA damage in the mock siRNA control as well as a significantdecrease of average HP1-b(T51P) staining intensity per cell after HP1-bdepletion are evident. c, Representative field of mouse embryonic fibroblasts(MEFs) damaged by 405-nm laser micro-irradiation fixed and stained within5 min after damage. HP1-b(T51P) staining (green) is present only indamaged nuclei (DNA in blue) marked by c-H2AX formation (red).d, Localized induction of anti-HP1-b(T51P) (green) accompanying HP1-bdispersal (red) in a single 405-nm laser-damaged heterochromatin focus(yellow arrow). The first panel is a live cell image of Hoechst staining beforeradiation showing the undamaged heterochromatin focus.
Time (s)
Rel
ativ
e flu
ores
cenc
e
0 2 4 6 8 10 12 14 160
0.2
0.4
0.6
0.8
1.0
1.2
Damaged HC no TBB
HC +TBBDamaged HC +TBB
HC no TBB
c
DNA HA–CK2-KD
01
03
HP1-β(T51P)a
N
o IR
+IR
Tim
e (m
in) a
fter
IR
Pix
el in
tens
ity
b
0
20
40
60
80
100
CK2-KD
IR (3 Gy)
–
––
––+ ++
10 10 30 (min)30
Figure 4 | Inhibition of CK2 suppresses the phosphorylation of HP1-b onThr 51 and mobilization after DNA damage. a, MEFs (nuclei in blue)transfected with a haemagglutinin (HA)-epitope-tagged, kinase-dead (KD)K69M CK2a9 mutant. Anti-HA staining in red marks the transfected cells,whereas anti-HP1-b(T51P) staining is in green. Transfected cells(arrowheads) have less HP1-b(T51P) staining after 3 Gy ionizing radiation(IR) compared to neighbouring, untransfected cells. b, Quantitativerepresentation of anti-HP1-b(T51P) staining intensity per cell under thespecified experimental conditions (n 5 30, P , 0.05 by analysis of variance(ANOVA)/Dunnet’s post test). c, The dynamic behaviour of EGFP–HP1-bafter DNA damage, with (black circles) or without (blue squares) pre-exposure to 75 mM of the CK2 inhibitor TBB.
LETTERS NATURE | Vol 453 | 29 May 2008
684Nature Publishing Group©2008

(Fig. 5a, b and Supplementary Fig. 8a, b), but also that immobili-zation of HP1-b on chromatin suppresses c-H2AX formation. Wefused EGFP–HP1-b to the histone H2B in a strategy previously usedto render proteins constitutively chromatin-bound10 whether beforeor after DNA damage (Supplementary Fig. 9). The intensity ofc-H2AX staining after DNA damage is inhibited in cells expressingthe immobilized H2B–EGFP–HP1-b fusion protein (Fig. 5c, d).Neither EGFP–HP1-b nor H2B–EGFP (Fig. 5c, d) expression to simi-lar levels affects c-H2AX staining, ruling out that this effect is merelythe result of HP1-b overexpression or high levels of chromatin-bound H2B. Instead, our findings collectively show that mobilizationof HP1-b from chromatin facilitates H2AX phosphorylation afterDNA damage. We propose on this basis that dynamic alterationsin chromatin structure triggered by HP1-b mobilization promoteH2AX phosphorylation, so far the earliest known event in the res-ponse to chromosomal breakage.
How CK2 can be activated locally within seconds at damage sitesis not understood. Intriguingly, although neither HP1-b nor CK2seems to be a direct substrate of phosphoinositide-kinase-familykinases24, chemical inhibition of these enzymes decreases but doesnot prevent HP1-b phosphorylation (Supplementary Fig. 10),
suggestive of crosstalk with the damage-activated CK2 signallingcascade.
Notably, HP1-b mobilization after DNA damage provides anunusual example of a mechanism that alters chromatin organizationby targeting a histone-binding protein, rather than the histone codeitself25. Such a mechanism could facilitate both the rapid remodellingof chromatin after DNA damage, as well as its efficient reversal byHP1-b dephosphorylation.
METHODS SUMMARYTransfection. We used established protocols for Lipofectamine 2000
(Invitrogen).
Microscopy and laser-induced DNA damage. DNA damage by laser-irradiation
was by pre-sensitization with Hoescht 33342, followed by exposure to a 405-nm
diode laser, or a pulsed 365-nm micropoint laser beam. DNA breakage was
confirmed using staining for c-H2AX and 53BP1. Dispersal of EGFP-tagged
proteins was followed by live-cell sequential imaging every 0.3 s. Alternatively,
dispersed proteins were detected by fixation and immunostaining. Dynamic
exchange was studied by photobleaching EGFP-tagged proteins, and measuring
fluorescence recovery in the bleached area (FRAP), or its loss from a distant area
during repetitive bleach cycles (FLIP). All imaging of EGFP-tagged proteins was
with an argon 488 laser line (attenuated to 1%) on a Zeiss LSM 510-META
Confocor2. Average per-cell fluorescence intensity measurements were analysed
with the Zeiss LSM software, from images acquired using identical acquisition
parameters. Where indicated, immunofluorescence experiments were per-
formed in 96-well plates and analysed using a Cellomics HCS automated micro-
scope and associated software.
Biochemical assays. His-, glutathione S-transferase (GST)-, or antibody-
mediated pull downs were performed using modifications of standard methods.
Binding of a fluorescent methylated Lys 9 (K9me) peptide to GST–HP1 was
quantified on a Fusion plate-reader.
Western blotting. Modifications to standard methods are described in the
Methods section. Signal intensities were quantified by integrated density mea-
surements on ImageJ software.
Statistical analysis. This was performed using GraphPad Prism 4.0.
Full Methods and any associated references are available in the online version ofthe paper at www.nature.com/nature.
Received 14 November 2007; accepted 28 February 2008.Published online 27 April 2008.
1. Rogakou, E. P., Pilch, D. R., Orr, A. H., Ivanova, V. S. & Bonner, W. M. DNA double-stranded breaks induce histone H2AX phosphorylation on serine 139. J. Biol.Chem. 273, 5858–5868 (1998).
2. Fernandez-Capetillo, O., Lee, A., Nussenzweig, M. & Nussenzweig, A. H2AX: thehistone guardian of the genome. DNA Repair (Amst.) 3, 959–967 (2004).
3. Lowndes, N. F. & Toh, G. W. DNA repair: the importance of phosphorylatinghistone H2AX. Curr. Biol. 15, R99–R102 (2005).
4. Allende-Vega, N., Dias, S., Milne, D. & Meek, D. Phosphorylation of the acidicdomain of Mdm2 by protein kinase CK2. Mol. Cell. Biochem. 274, 85–90 (2005).
5. Cheung, W. L. et al. Phosphorylation of histone H4 serine 1 during DNA damagerequires casein kinase II in S. cerevisiae. Curr. Biol. 15, 656–660 (2005).
6. Loizou, J. I. et al. The protein kinase CK2 facilitates repair of chromosomal DNAsingle-strand breaks. Cell 117, 17–28 (2004).
7. Festenstein, R. et al. Modulation of heterochromatin protein 1 dynamics in primaryMammalian cells. Science 299, 719–721 (2003).
8. Cheutin, T. et al. Maintenance of stable heterochromatin domains by dynamic HP1binding. Science 299, 721–725 (2003).
9. Schmiedeberg, L., Weisshart, K., Diekmann, S., Meyer Zu Hoerste, G. &Hemmerich, P. High- and low-mobility populations of HP1 in heterochromatin ofmammalian cells. Mol. Biol. Cell 15, 2819–2833 (2004).
10. Lukas, C., Falck, J., Bartkova, J., Bartek, J. & Lukas, J. Distinct spatiotemporaldynamics of mammalian checkpoint regulators induced by DNA damage. NatureCell Biol. 5, 255–260 (2003).
11. Rogakou, E. P., Boon, C., Redon, C. & Bonner, W. M. Megabase chromatin domainsinvolved in DNA double-strand breaks in vivo. J. Cell Biol. 146, 905–916 (1999).
12. Kruhlak, M. J. et al. Changes in chromatin structure and mobility in living cells atsites of DNA double-strand breaks. J. Cell Biol. 172, 823–834 (2006).
13. Kuo, M. H. et al. Transcription-linked acetylation by Gcn5p of histones H3 and H4at specific lysines. Nature 383, 269–272 (1996).
14. Zhao, T. & Eissenberg, J. C. Phosphorylation of heterochromatin protein 1 bycasein kinase II is required for efficient heterochromatin binding in Drosophila.J. Biol. Chem. 274, 15095–15100 (1999).
15. Zhao, T., Heyduk, T. & Eissenberg, J. C. Phosphorylation site mutations inheterochromatin protein 1 (HP1) reduce or eliminate silencing activity. J. Biol.Chem. 276, 9512–9518 (2001).
a
Pixel intensity Pixel intensity
DNA γ-H2AX
–IR
no
TBB
+IR
no
TBB
+IR
+TB
B
–IR
+TB
B
40
DNA γ-H2AXEGFP fusionH2B
b
Untransfected
EGFP–HP1-β
EGFP–H2B
EGFP–H2B–HP1-β
c
0 20 40 60 80 100 0 20 40 60 80 100
d
IR (3
Gy)
TBB (µ
M)
+
++
––
40
20
–
–
H2B
HP1-β
H2B–HP1-β
H2B–HP1-β
Figure 5 | HP1-b mobilization by CK2 promotes H2AX phosphorylation.a, Pre-exposure of MEFs to 75mM TBB suppresses c-H2AX foci formation at5 min after 3 Gy ionizing radiation. DNA is stained blue; c-H2AX is green.The top two rows show undamaged cells without (2IR no TBB) or with(2IR 1TBB) pre-exposure; the bottom two rows represent ionizing-radiation-damaged cells without (1IR no TBB) or with TBB pre-exposure(1IR 1TBB). b, Dot-plot showing that the pixel intensity of c-H2AXstaining after damage under identical imaging conditions is reduced in adose-dependent manner by TBB pre-exposure (n 5 20 per sample, P , 0.01,independent t-tests). c, An H2B–EGFP–HP1-b fusion protein constitutivelyimmobilized on chromatin suppresses c-H2AX foci formation at 5 min after3 Gy ionizing radiation. DNA is stained blue, the different EGFP fusionproteins are stained green, and c-H2AX is red. The top two rows show MEFstransfected with constructs encoding EGFP–HP1-b or H2B–EGFP, whereasthe bottom two rows both show H2B–EGFP–HP1-b. Untransfected cellswithin the same field provide an internal control. d, Dot-plot representingthe pixel intensities of c-H2AX signal per cell under identical imagingconditions for cells with and without the transfected constructs (n 5 20,P , 0.05 with t-test/ANOVA for multi-group comparison).
NATURE | Vol 453 | 29 May 2008 LETTERS
685Nature Publishing Group©2008

16. Jacobs, S. A. & Khorasanizadeh, S. Structure of HP1 chromodomain bound to alysine 9-methylated histone H3 tail. Science 295, 2080–2083 (2002).
17. Formby, B. & Stern, R. Phosphorylation stabilizes alternatively spliced CD44mRNA transcripts in breast cancer cells: inhibition by antisense complementaryto casein kinase II mRNA. Mol. Cell. Biochem. 187, 23–31 (1998).
18. Ruzzene, M., Penzo, D. & Pinna, L. A. Protein kinase CK2 inhibitor 4,5,6,7-tetrabromobenzotriazole (TBB) induces apoptosis and caspase-dependentdegradation of haematopoietic lineage cell-specific protein 1 (HS1) in Jurkat cells.Biochem. J. 364, 41–47 (2002).
19. Canton, D. A., Zhang, C. & Litchfield, D. W. Assembly of protein kinase CK2:investigation of complex formation between catalytic and regulatory subunitsusing a zinc-finger-deficient mutant of CK2b. Biochem. J. 358, 87–94 (2001).
20. Bakkenist, C. J. & Kastan, M. B. DNA damage activates ATM through intermolecularautophosphorylation and dimer dissociation. Nature 421, 499–506 (2003).
21. Ziv, Y. et al. Chromatin relaxation in response to DNA double-strand breaks ismodulated by a novel ATM- and KAP-1 dependent pathway. Nature Cell Biol. 8,870–876 (2006).
22. Kim, J.-A., Kruhlak, M., Dotiwala, F., Nussenzweig, A. & Haber, J. E.Heterochromatin is refractory to cH2AX modification in yeast and mammals.J. Cell Biol. 178, 209–218 (2007).
23. Cowell, I. G. et al. cH2AX foci form preferentially in euchromatin after ionising-radiation. PLoS ONE 2, e1057 (2007).
24. Matsuoka, S. et al. ATM and ATR substrate analysis reveals extensive proteinnetworks responsive to DNA damage. Science 316, 1160–1166 (2007).
25. Lomberk, G., Bensi, D., Fernandez-Zapico, M. E. & Urrutia, R. Evidence for theexistence of an HP1-mediated subcode within the histone code. Nature Cell Biol. 8,407–415 (2006).
Supplementary Information is linked to the online version of the paper atwww.nature.com/nature.
Acknowledgements We thank L. Pellegrini for modelling the HP1–H3K9me2structure; M. Daniels, S. Y. Peak-Chew, M. Lee, R. Kulkarni and P. Rowling fortechnical assistance; and T. Misteli, T. Jenuwein and D. Litchfield for gifts ofmaterial. N.A. acknowledges a fellowship from the International Agency forResearch on Cancer, Lyon, France, J.A.B. a long-term fellowship from EMBO,Heidelberg, Germany, and A.D.J. a scholarship from the Gates Cambridge Trust.The UK Medical Research Council supports work in A.R.V.’s laboratory.
Author Contributions N.A. performed the experiments reported here, except thatA.D.J. determined EGFP–HP1-b mobilization by FRAP and FLIP, demonstrated therelease of Thr 51-phosphorylated HP1 from H3K9me, and performed thequantification of immunofluorescence, whereas J.A.B. helped to identify HP1-bphosphorylation sites, and measured the rCK2 kinetics. A.R.V. planned the project,helped to interpret the data and wrote the paper.
Author Information Reprints and permissions information is available atwww.nature.com/reprints. Correspondence and requests for materials should beaddressed to A.R.V. ([email protected]).
LETTERS NATURE | Vol 453 | 29 May 2008
686Nature Publishing Group©2008

METHODSFRAP and FLIP assays. MEFs were seeded in 2-well Lab-Tek chambers (Nunc)
after transfection with the EGFP–HP1-b construct. Before imaging, growth
medium was replaced with phenol-red free L15 imaging medium. Live cell
imaging and photobleaching experiments were performed using a 340 1.2 NA
water immersion lens on a Zeiss LSM 510 Meta confocal microscope (using a
heating chamber to maintain the cells at 37 uC) with the 488-nm line of an argon
laser operating at 6.1 A.
FRAP analysis was performed by a method previously established in our
laboratory26. For low-bleach FRAP (see Supplementary Fig. 1), selected regionsof heterochromatin and euchromatin were simultaneously bleached in a
diffraction-limited spot with a pulse of two iterations at 100% of the 15-mW
488-nm argon laser. Post-bleach images were acquired at a lower frequency of an
image every 400 ms. Image bleach was corrected separately for euchromatin and
heterochromatin regions using a nearby unbleached cell. For high-bleach FRAP
experiments, photobleaching was carried out with 35 iterations at the same laser
output, and images were collected every 290 ms. The normalized curves were
plotted in GraphPad Prism, and recovery curves were fitted to a single order
exponential equation Y 5 Ymax(12exp(2KX)) to yield a recovery constant K,
shown to be different among groups by the sum of squares f-test at P , 0.05.
Transfected cells for analysis were chosen under epifluorescence. Transfection
levels were controlled by using cells of similar nuclear size, that were visible but
not saturated, at a fixed imaging intensity (1% transmission at maximal scan
speed and fixed photomultiplier tube gain at an optical slice of 1.5mm). An
integrative time-bleach series was set up to take 5 initial images, then bleach a
2 3 2 mm square with 30 iterations of 100% laser intensity in an euchromatin
region every 4 images, for a total of 200 images. The cells were imaged with a fixed
37 zoom and fixed bleach region of interest (ROI) size in a 512 3 512 pixelimage window to keep the time between images constant for different cells to
allow comparison. Circular regions of heterochromatin and euchromatin of
similar size (1-mm radius) equidistant at 10 mm from the site of bleaching were
then chosen, and the pixel intensities during the FLIP procedure recorded. The
procedure was performed on control and irradiated cells (10 min after ionizing
radiation to allow temperature equilibration and decreased drift during scan-
ning), with control cells also kept at room temperature for 20 min to compensate
for the irradiation process. Nearby imaged—but unbleached—cells were used to
correct for the effect of imaging during the FLIP procedure. For the data analysis,
the raw pixel intensities were transferred into GraphPad Prism and converted
into relative intensities as a percentage of the mean of the first three values. These
intensities were plotted across time to generate the FLIP decay curves with
standard errors being calculated from multiple measurements (n 5 7, in
repeated experiments, limited to avoid discrepancies from changes in time after
irradiation). The curves were fit to a single order polynomial equation y 5 a 1 bx
and the decay constant b shown to be statistically different for different groups at
P , 0.05 using the f-test.
Laser micro-irradiation. Laser micro-irradiation was used to induce DNAdamage by modifying a previously described method27. Briefly, cells were grown
on chambered, 1-thickness borosilicate-glass cover slides (Nunc), incubated
with 10 mg ml21 Hoechst dye 33342 for 5 min at 37 uC, washed twice with
Leibovitz’s L-15 medium (Gibco), and further incubated in this medium.
Cells were imaged using a Zeiss LSM 510 Meta inverted confocal microscope
fitted with a heated stage unit for live-cell imaging (heating insert P, Zeiss).
Heterochromatin or euchromatin regions, selected based on EGFP–HP1-blocalization, were damaged by applying 200 iterations of 100% power from a
405-nm diode laser. To monitor changes, serial time-lapse images were taken at
256 3 256 pixel 8-bit resolution with a scan speed of 293 ms, using the 488-nm
line from the argon laser at 1% power. For some experiments, cells were fixed at
the indicated times for staining and immunofluorescence.
A pulsed N2 laser system with a 365-nm dye cell (Micropoint; Photonics
systems) coupled to the epifluorescence path of a Zeiss 510 LSM Confocor2
was also used for DNA damage experiments to induce localized damage in a
large number of cells. The cycling time was set at approximately 10 Hz and the
power used to excite Hoechst for DNA damage (calibrated by c-H2AX staining)
was set at maximal attenuation of laser output through the supplied gradient
neutral density filter (approximately 75%). Cells visualized under phase
contrast were moved by manual operation of the motorized stage through a
fixed point of laser illumination to induce stripes of DNA damage across several
nuclei. Typically, 100–200 cells were damaged per experiment, and then fixed for
immunofluorescence.
Immunofluorescence. Cell staining and immunofluorescence analyses were
carried out as described previously2. Briefly, transfected and untransfected cells
were grown on coverslips and subjected to different treatments as indicated in
the text before fixation. Cells were fixed using 4% formaldehyde for 10–15 min,
followed by solubilization and blocking with 3% BSA in PBS, 0.05% Tween-20,
0.05% Triton. Imaging was performed on a Zeiss LSM 510 Meta confocal micro-
scope, using a 340 objective with fixed optical slice, laser power and detector/
amplifier settings for all samples across each individual experiment to allow
comparison. Quantitative analysis for HP1-b(T51P) and c-H2AX staining was
performed using mean per-nucleus intensity to avoid any discrepancy in the
definition or counting of foci. This was performed on identically stained and
imaged samples by estimation of raw pixel intensity values for a defined number
of cells, specified for each experiment, through the Zeiss LSM software, and
comparison of the different groups by one-way ANOVA and Dunnet’s post test.
High-content microscopy was also used for certain experiments; 96-well plates
(Nunc) with cells seeded at 3,000 per well were treated with specified DNA-
damaging agents, pre-treatments/siRNA, then fixed and immunostained. The
plates were imaged and analysed using a Cellomics high-content screening
microscope, using a 340 non-immersion objective. Hoechst staining was used
for object identification and the average intensity of fluorescent signal per
nucleus was estimated using the target activation Cellomics bio-application.
Five-hundred cells were analysed per well, and standard errors were calculated
from an average of the means of eight wells.
Expression and purification of HP1-b. Full-length human HP1-b or its chro-
modomain were expressed in Escherichia coli BL21 (Stratagene) as carboxy-
terminal fusions to GST using the pGEX4T3 vector (Pharmacia). Bacteria
expressing the fusion protein were lysed in PBS supplemented with 5 mM
dithiothreitol, 0.5% NP-40 and protease inhibitors, and the soluble fraction
was applied onto glutathione–Sepharose 4B beads (Amersham). After extensive
washing, full-length HP1-b and the chromodomain fragment were cleaved
from the GST moiety using thrombin protease (Amersham) in PBS at 22 uCfor 16 h. Thrombin was removed from the sample by chromatography with
benzamidine–Sepharose 4B (Amersham).
Peptide synthesis and binding assay. A peptide (FITC–H3K9me2) encoding
residues 1–15 of the H3 tail dimethylated on Lys 9 and amino-terminally labelled
with fluorescein was synthesized by Pepceuticals Limited. Ten micrograms of
purified GST–HP1 chromodomain (or its T51A mutant form), 3 nmol of FITC–
H3K9me2 peptide (representing a tenfold molar excess over HP1) and 20 ml of
50% GST bead slurry were added to a PBS-based binding buffer containing 0.2%
NP-40 and 0.1% BSA, and incubated at room temperature for 1 h. For phos-
phorylation experiments, 25 ml of a kinase reaction containing 10mg GST–HP1
chromodomain protein, 5,000 units rCK2, in CK2 buffer containing 50 mM ATP,
replaced the unmodified GST–HP1 chromodomain. After binding, the mixture
was centrifuged at 5,000g for 3 min and all supernatant removed by gentle
aspiration. The beads were re-suspended in 50 ml binding buffer, transferred to
assigned wells of a 96-well plate, and fluorescein fluorescence intensity read using
a Fusion microplate reader (PerkinElmer). A mixture of FITC–H3K9me2 and
beads alone was used to calibrate background binding, to which the rest of the
data were normalized before export to GraphPad Prism to calculate mean inten-
sities and standard errors from different runs (n 5 3). Changes in binding were
shown to be significant using a student’s t-test.
26. Daniels, M. J., Marson, A. & Venkitaraman, A. R. PML bodies control the nucleardynamics and function of the CHFR mitotic checkpoint protein. Nature Struct. Mol.Biol. 11, 1114–1121 (2004).
27. Rogakou, E. P., Boon, C., Redon, C. & Bonner, W. M. Megabase chromatin domainsinvolved in DNA double-strand breaks in vivo. J. Cell Biol. 146, 905–916 (1999).
doi:10.1038/nature06875
Nature Publishing Group©2008


